Attached files
| file | filename |
|---|---|
| EX-31.2 - EXHIBIT 31.2 - Support.com, Inc. | ex31_2.htm |
| EX-32.1 - EXHIBIT 32.1(1) - Support.com, Inc. | ex32_1.htm |
| EX-23.1 - EXHIBIT 23.1 - Support.com, Inc. | ex23_1.htm |
| EX-32.2 - EXHIBIT 32.2(1) - Support.com, Inc. | ex32_2.htm |
| EX-31.1 - EXHIBIT 31.1 - Support.com, Inc. | ex31_1.htm |
| EX-10.8 - EXHIBIT 10.8 - Support.com, Inc. | ex10_8.htm |
| EX-21.1 - EXHIBIT 21.1 - Support.com, Inc. | ex21_1.htm |
| EX-10.23 - EXHIBIT 10.23 - Support.com, Inc. | ex10_23.htm |
| EX-10.13 - EXHIBIT 10.13 - Support.com, Inc. | ex10_13.htm |
| EX-21.21 - EXHIBIT 21 - Support.com, Inc. | ex10_21.htm |
UNITED STATES
SECURITIES AND EXCHANGE COMMISSION
Washington, D.C. 20549
FORM 10-K
|
(Mark One)
|
|
|
x
|
ANNUAL REPORT PURSUANT TO SECTION 13 OR 15(d) OF THE SECURITIES EXCHANGE ACT OF 1934
|
|
For the Fiscal Year Ended December 31, 2010
|
|
|
OR
|
|
|
o
|
TRANSITION REPORT PURSUANT TO SECTION 13 OR 15(d) OF THE SECURITIES EXCHANGE ACT OF 1934
|
|
For the Transition Period from to
|
|
Commission File No. 000-30901
SUPPORT.COM, INC.
(Exact Name of Registrant as Specified in Its Charter)
| Delaware | 94-3282005 |
|
(State or Other Jurisdiction of Incorporation or Organization)
|
(I.R.S. Employer Identification No.)
|
|
1900 Seaport Boulevard, 3rd Floor, Redwood City, CA
|
94063
|
|
(Address of Registrant’s Principal Executive Offices)
|
(Zip Code)
|
Registrant’s telephone number including area code: (650) 556-9440
Securities registered pursuant to Section 12(b) of the Act:
|
Title of each class
|
Name of each exchange on which registered
|
|
Common Stock, $.0001 par value
|
The NASDAQ Global Select Market
|
Securities registered pursuant to Section 12(g) of the Act: NONE
Indicate by check mark if registrant is a well-known seasoned issuer, as defined in Rule 405 of the Securities Act. Yes o No x
Indicate by check mark if the registrant is not required to file reports pursuant to Section 13 or Section 15(d) of the Act. Yes o No x
Indicate by check mark whether the registrant: (1) has filed all reports required to be filed by Section 13 or 15(d) of the Securities Exchange Act of 1934 during the preceding 12 months (or for such shorter period that the registrant was required to file such reports), and (2) has been subject to such filing requirements for the past 90 days. Yes x No o
Indicate by check mark if disclosure of delinquent filers pursuant to Item 405 of Regulation S-K is not contained herein, and will not be contained, to the best of registrant’s knowledge, in definitive proxy or information statements incorporated by reference in Part III of this Form 10-K or any amendment to this Form 10-K. x
Indicate by check mark whether the registrant is a large accelerated filer, an accelerated filer, a non-accelerated filer, or a smaller reporting company. See definitions of “large accelerated filer,” “accelerated filer,” and “smaller reporting company” in Rule 12b-2 of the Exchange Act. (Check one):
|
Large accelerated filer o
|
Accelerated filer x
|
Non-accelerated filer o
(Do not check if a smaller reporting
company)
|
Smaller reporting company o
|
Indicate by check mark whether the registrant is a shell company (as defined in Rule 12b-2 of the Exchange Act). Yes o No x
Indicate by check mark whether the registrant has submitted electronically and posted on its corporate Web site, if any, every Interactive Data File required to be submitted and posted pursuant to Rule 405 of Regulation S-T (§232.405 of this chapter) during the preceding 12 months (or for such shorter period that the registrant was required to submit and post such files).Yes o No o
The aggregate market value of the registrant’s common stock, $.0001 par value, held by non-affiliates of the registrant was approximately $194,471,081 based upon the closing price of $4.16 per share as of June 30, 2010. Shares of common stock held by each executive officer, director, and stockholders known by the registrant to own 10% or more of the outstanding stock based on Schedule 13G filings and other information known to us, have been excluded since such persons may be deemed affiliates. This determination of affiliate status is not necessarily a conclusive determination for other purposes.
As of February 28, 2011, there were 48,194,269 shares of the registrant’s common stock outstanding.
DOCUMENTS INCORPORATED BY REFERENCE
Part III, Items 10 (as to directors, section 16(a) beneficial ownership and audit committee and audit committee financial expert), 11, 12 (as to beneficial ownership), 13 and 14 incorporate by reference information from the registrant’s definitive proxy statement (the “Proxy Statement”) to be mailed to stockholders in connection with the solicitations of proxies for its 2011 annual meeting of stockholders. Except as expressly incorporated by reference, the registrant’s Proxy Statement shall not be deemed to be part of this report.
SUPPORT.COM, INC.
FORM 10-K
FOR FISCAL YEAR ENDED DECEMBER 31, 2010
TABLE OF CONTENTS
|
Page
|
||
|
PART I
|
||
|
ITEM 1.
|
3
|
|
|
ITEM 1A.
|
8
|
|
|
ITEM 1B.
|
17
|
|
|
ITEM 2.
|
17
|
|
|
ITEM 3.
|
17
|
|
|
ITEM 4.
|
18
|
|
|
PART II
|
18
|
|
|
ITEM 5.
|
18
|
|
|
ITEM 6.
|
21
|
|
|
ITEM 7.
|
23
|
|
|
ITEM 7A.
|
32
|
|
|
ITEM 8.
|
33
|
|
|
34
|
||
|
ITEM 9.
|
63
|
|
|
ITEM 9A.
|
63
|
|
|
64
|
||
|
65
|
||
|
ITEM 9B.
|
66
|
|
|
PART III
|
66
|
|
|
ITEM 10.
|
66
|
|
|
ITEM 11.
|
66
|
|
|
ITEM 12.
|
66
|
|
|
ITEM 13.
|
67
|
|
|
ITEM 14.
|
67
|
|
|
PART IV
|
68
|
|
|
ITEM 15.
|
68
|
|
|
70
|
||
FORWARD LOOKING STATEMENTS AND PRESENTATION OF FINANCIAL AND OTHER INFORMATION
This Annual Report on Form 10-K (the “Form 10-K”) contains forward-looking statements that involve risks and uncertainties. Please see the section entitled “Forward-Looking Statements and Risk Factors” in Item 1A of this Report for important information to consider when evaluating these statements.
In this Form 10-K, unless the context indicates otherwise, the terms “we,” “us,” “Support.com,” “the Company” and “our” refer to Support.com, Inc., a Delaware corporation, and its subsidiaries. References to “$” are to United States dollars.
We have compiled the market size and growth data in this Form 10-K using statistics and other information obtained from several third-party sources. Some market data and statistical information are also based on our good faith estimates, which are derived from our review of internal surveys, as well as the independent sources referred to. This information may prove to be inaccurate because of the method by which we obtain some of our data for our estimates or because this information cannot always be verified with complete certainty due to the limits on the availability and reliability of raw data, the voluntary nature of the data gathering process and other limitations and uncertainties. As a result, although we believe these sources are reliable, we have not independently verified the information and cannot guarantee its accuracy and completeness.
Various amounts and percentages used in this Form 10-K have been rounded and, accordingly, they may not total 100%.
We own or otherwise have rights to the trademarks and trade names, including those mentioned in this Form 10-K, used in conjunction with the marketing and sale of our products.
PART I
|
ITEM 1.
|
Overview
Support.com is a leading independent provider of online care for the digital home and small business.
Our technology services and software products help install, set up, connect, secure, repair and optimize personal computers (PCs), tablets, printers, routers, home gateways, smart phones, gaming devices, digital cameras, music players and other devices that are essential to our customers’ digital lives. We offer one-time and subscription services, and licenses of our software products.
Our Personal Technology Experts® generally deliver our services to customers online and by telephone, leveraging our patented market-leading proprietary technology platform. They generally work from their homes rather than in brick and mortar facilities. Our software products include award-winning tools designed to address some of the most common technology device problem areas, including Windows registry errors, hard disk management and computer memory optimization.
We market our services through channel partners and directly to consumers. Our channel partners include leading retail, internet service provider, software and PC/consumer electronics (CE) brands. We market our software products directly and through channel partners using “free trial” versions to encourage customers to experience the products before buying. Our sales and marketing efforts principally target North American consumers and small businesses.
Support.com was founded in 1997 under the name SupportSoft, Inc. as an enterprise software provider focused on technical support organizations. In 2007 we launched our consumer services business, and in 2008 began reporting two operating segments, Enterprise and Consumer. We used this segment reporting structure for all of our publicly filed financial statements beginning January 1, 2008. In June 2009 we sold our Enterprise business, changed our name to Support.com, Inc. and focused our efforts purely on the consumer and small business market. We added the Sammsoft family of software products to our Consumer business in December 2009 through our acquisition of substantially all of the assets of Xeriton, Inc.
As a result of the sale of the Enterprise business, our audited consolidated financial statements, accompanying notes and other information provided in this Form 10-K reflect the Enterprise business as a discontinued operation for all periods presented. After reclassifying the Enterprise business to discontinued operations, our continuing operations consist solely of our remaining segment, the Consumer business, which includes our online support services as well as our consumer software products.
Industry Background
Technology has become an essential feature of the modern home and office. Devices such as personal computers, tablets, printers, routers, home gateways, smart phones, gaming devices, digital cameras, music players and other devices have become ubiquitous. Each year, these devices become more feature-rich, offering many new capabilities. Increasingly, consumers and small businesses depend on such technology for “must-have” information, communication and entertainment.
In addition to changes in individual devices, technology has become increasingly connected, with networks becoming commonplace in the home as well as the office and online social networking platforms such as Facebook and LinkedIn achieving increasing prominence. At the same time, technology has become increasingly mobile, with anytime, anywhere access to voice, data, video and applications becoming the standard.
While these advances offer many benefits, consumers and small businesses face an increasingly complex challenge in managing ever-changing products, connections and applications. Each new wave of functionality can cause new problems, and each use of the Internet can expose consumers to the rapidly growing universe of malware and other security threats. Taken together, these developments create increasing challenges in successfully using technology.
Many consumers and small businesses lack the technical skill or time to overcome these challenges. While suppliers offer support for their products, this support is typically limited to the device in question, and often fails to address connections between devices or malfunctions caused by the user’s environment or usage. As a result, the market for premium technology services (non-warranty services paid for separately from the products themselves) is growing rapidly. Parks Associates, a research firm focused on the digital home, estimates that the market for premium support for the digital home will grow from $2.8 billion in 2010 to $5.8 billion by 2014. Subscription services are expected to grow, with research from IDC estimating a 340% increase in premium technology subscriptions from $0.25 billion to $1.1 billion in 2014.
Within the premium technology services market, online or remote support is becoming increasingly prevalent. Online support involves a technician using specialized software to take control of a user’s computer over the internet, avoiding the delay and cost associated with traditional onsite support. Online support has been possible for some time, but the widespread availability of high speed internet connections and remote control software has caused growth in this segment of the market to accelerate.
In addition to assisted services, there is an established and growing market for software tools used to manage personal computers and home networks. According to Parks Associates, “roughly one-half of consumers are self-defined ‘do-it-yourselfers’ with technical support, such as preventative maintenance activities and computer troubleshooting.”
Our Growth Strategy
Our objective is to become the leading independent provider of online care for the digital home and small business markets. From a financial perspective, our goals are to continue to grow and diversify revenue, increase gross margins, and achieve profitability. Our strategies for achieving our objectives include extending our technology leadership in cloud-based (hosted) support, enhancing service delivery, expanding our customer presence, broadening our service offerings and increasing the reach of our consumer software products.
|
|
•
|
To extend our technology leadership, we plan to continue to invest in research and development activities that increase the efficiency of our Personal Technology Experts, extend our cloud-based service delivery platform and deliver value to online care customers;
|
|
|
•
|
To enhance service delivery, we intend to continue to increase automation through proprietary technology, improve process with Six Sigma methodologies, extend the capabilities of our delivery organization to new devices and platforms and expand the breadth and flexibility of our staffing model;
|
|
|
•
|
To expand our customer presence, we plan to enhance existing programs, add new channel partners and grow our direct-to-consumer business by achieving synergies between our services and software offerings;
|
|
|
•
|
To expand our service offerings, we intend to introduce services for a wide range of devices beyond the computer and offer services tailored for small businesses; and
|
|
|
•
|
To increase the reach of our consumer software products, we plan to broaden distribution channels, enhance marketing campaigns and introduce new products.
|
We intend to execute our growth strategy organically and through acquisitions of complementary businesses where appropriate.
Our Online Care Services
Our online care services include one-time services (or “incidents”) and subscriptions. These services are available on demand, and also through the purchase of service cards and gift cards. We offer a money-back guarantee in the event we are unable to resolve the consumer’s problem subject to the terms of our end user agreements.
Our principal online care services include:
Install & Setup. We offer a variety of installation and setup services. Our New Computer Setup and Configure services complete the basic setup and configuration steps for new computers in a highly automated fashion. We help consumers create new user accounts, configure automatic system updates and remove unnecessary trial software that clutters many new computers. An advanced version of this service also optimizes operating system and internet browsing settings. Our Protection and Performance services install, update and configure anti-malware software and operating system settings to enhance digital security. An advanced version of this service also installs and configures parental controls and creates a user profile that restricts internet and application access, as specified by the consumers. Other installation and setup services help customers install, set up and use certain digital devices connected to their computer. For example, we help customers install and set up their printer, share it across a home network and keep it updated with the latest drivers.
Connect and Secure. Our Connect and Secure services help customers to set up a secure wireless network. In this service, we configure, connect and establish secure connections between the computer, the wireless network and supported devices. In addition, we diagnose and repair problems customers have with existing wireless home networks.
Diagnose and Repair. Our Diagnose and Repair services assist consumers with a wide range of computer-related problems. We use our proprietary technology and processes and third-party tools to identify, diagnose and repair technical problems, including the removal of viruses, spyware, and other forms of malware.
Tune-Up. Our Tune-Up services enhance the performance of computers through optimization of key systems settings for faster start-up and shut-down, loading of programs and internet browsing as well as increased available memory and storage space.
Mobile Devices. Our Mobile Device services help customers to setup and get the most from their mobile devices including Android and Apple iOS tablets and phones. We help customers connect devices to the cloud to access the web or their own data, configure email and show them how to find and install applications. Additionally we show customers how to synchronize data between their computer and mobile device, and train them on the capabilities of their mobile devices.
Cloud Data Access with Online Data Backup. Our Online Data Backup offering provides continuous backup to the cloud for documents, pictures, video and other key personal or business data. Once in the cloud one can access that data from any other web-connected personal computer (Mac or PC) or from over 800 mobile devices including standard mobile phones, smart phones or tablets. Our offering includes licensed software that provides the ability to share and stream data to social or business network in real-time from any of these web-connected devices.
We deliver our services to customers using our Personal Technology Experts®, leveraging our patented market-leading proprietary technology platform. Our PTEs generally work from their homes rather than in brick and mortar facilities. They are recruited, tested, hired and trained on a virtual basis using proprietary methods and remote technology. We strive to continually enhance service delivery through increased automation, process improvement using Six Sigma methodologies, extending the capabilities of our delivery organization to new devices and platforms and expanding the breadth and flexibility of our staffing model.
Our Software Products
Our products are designed to maintain, optimize and secure personal computers. These software tools can enable personal computers to run faster, more reliably and more securely. Our principal software products include products designed for:
Registry Repair and Optimization. Our Advanced Registry Optimizer™ software is designed to identify and repair errors in the registry database on personal computers running Microsoft Windows. Repairing these errors can improve performance and stability of a user’s PC.
Hard Drive Maintenance. Our Hard Disk Tune-Up™ software is a rapid disk maintenance program. It helps improve the performance of a computer by defragmenting programs and data stored on the hard drive, which speeds access to stored information.
Memory Management and Optimization. Our MemTurbo™ performance utility can increase available memory and improve computer performance by freeing up unused application memory and managing how applications request and subsequently return memory to the operating system.
Sales and Marketing
Services. We sell our services through channel partners and directly to consumers. To date, a substantial majority of our services revenue has come through channel partners. Our channel partners include leading retail, internet service provider, software and PC/CE brands.
Channel partnerships typically begin with a pilot phase and, if successful, progress to broader roll-outs. Programs for channel partners can take several months to more than a year to progress from a pilot stage to a broader roll-out. Given the current significance of our retail channel partnerships, seasonality of consumer electronics retail sales can affect our revenues. The structure of our channel partnerships varies. In many cases, we wholesale services to our partners on a per incident or per period basis and our partners resell the services to consumers and small businesses at prices our partners determine. In these partnerships, the services are generally sold under the partners’ brand, and in certain cases we receive co-branding. In addition to service delivery, in certain cases, we sell the services on our partners’ behalf (and receive commissions for such activity).
We acquire channel partners through our business development organization and support channel partners through our program management organization. In addition to program management, we design and implement marketing campaigns for our channel partners.
To a lesser degree, we offer our services directly to consumers and small businesses through our website www.support.com and our toll free number 1-800-PCSUPPORT. We attract these customers through advertising in online and offline media, public relations, affiliate and referral programs and social media. We also attract service customers via offers to customers who have purchased our software products
Software. We sell our software directly to customers and through channel partners. To date a substantial majority of our software revenue has come through direct sales to customers under our brand. Online advertising allows customers to click-through immediately to our software offerings where they can order and download our products on demand. In addition to full-featured software products available for a license fee, customers may also download “free-trial” demonstration versions with limited functionality before making a purchase decision. The marketing costs for customer acquisition in this highly competitive market can be substantial, and a majority of our direct software license revenue for this business currently is the result of advertising placements.
We also offer our software products to customers through our channel partners who rebrand and distribute such products to their customers.
We plan to leverage the synergies between our services offerings and our software products. In particular, our goal is to increase the breadth of our channel partnerships by introducing software products into services programs and to grow our direct services business by marketing our services to customers who buy software products from us.
Research and Development
Technology is at the core of our business model, and as a result our investment in research and development is substantial. We believe our continuing investment in research and development creates significant competitive advantage in the quality and cost of our service offerings, in our ability to meet the rigorous requirements of channel partners and in the new software products we plan to introduce. We maintain dedicated research and development teams in Redwood City, California, and in Bangalore, India. Research and development expense in our continuing operations was $5.2 million in 2010, $5.8 million in 2009 and $7.0 million in 2008.
We have developed, currently maintain, and continue to improve proprietary, market-leading technologies key to our services business. Our technologies are architected to be cloud-based (hosted). We focus our investment in R&D across the following five major areas: service delivery efficiency; ongoing subscriber care; demand generation; data analytics and new software products.
Service delivery efficiency has been a key investment area. Our proprietary Analyst Workspace application integrates customer relationship management (“CRM”), ticketing, ordering, means of payment, remote screen sharing, and telephony into one highly ergonomic and efficient .NET application for our Personal Technology Experts. This application leverages our patented Nexus® technology to enable many technically challenging and valuable aspects of remote services via the cloud and across firewalls, proxies and other network boundaries. In addition, we deploy our Solutions Toolkit™ application on the customer's machine to ensure that our Personal Technology Experts follow a predesigned “best practice” workflow. The Solutions Toolkit also automates time-consuming steps such as tool downloads, system diagnostics, performance optimizations and software checks. For partner programs, we leverage our Service Delivery Management System (“SDMS”) to simplify and orchestrate the ordering and workflow of services across multiple parties, ensuring that the right delivery party takes the right next step at the right time. To accomplish this, the SDMS utilizes a built-in workflow engine and a set of standardized web services integrations to our partners’ billing, point-of-sale, customer care and third-party provider systems. SDMS also includes an online portal for customers and partners, thus promoting a seamless experience and a high level of visibility throughout the service delivery process.
In the area of ongoing subscriber care, our EasySupport™ desktop agent software resides on the customer's computer and provides one-click access to a service agent, automated computer optimization and subscription management functions. With one click, the subscriber can request live assistance such that a Personal Technology Expert is immediately presented with the customer’s account information, subscription entitlements and service history. EasySupport also scans and optimizes the customer’s computer on a periodic basis, thus adding ongoing value to the subscription that extends beyond live interactions. In addition, EasySupport provides direct visibility into the subscriber’s account information and notifies them proactively of potential issues such as the upcoming expiration of their credit card or their subscription term.
For demand generation, EasySupport’s flexible “recommendations map” can be configured to promote partner-specific add-on products or services in a context-sensitive manner, based on specific problems and conditions that EasySupport detects on the customer’s computer during periodic scans. Separately, we offer a downloadable one-time scanner tool, PC Health Check™, which checks performance, security and system characteristics. Both EasySupport and PC Health Check are designed to make credible, personalized product and service recommendations that generate additional sales opportunities.
In the area of data analytics, we build and maintain a data warehouse that securely aggregates and restructures data from all of our software applications to create a comprehensive view of the service delivery lifecycle. This rich data set provides visibility into sales conversion effectiveness, service delivery efficiency, service level performance, subscription utilization, partner program performance and many other aspects of running and optimizing our business. Our partners also receive reports and analytic information from the warehouse for their programs on a regular basis via secure data feeds.
In December 2009 we acquired a family of software products through our acquisition of substantially all of the assets of Xeriton, Inc. Xeriton, Inc. developed certain of these products itself and licensed others from a third party, with whom we continue to partner on certain products. We anticipate introducing a number of new software products that will be developed internally and by third parties.
Intellectual Property
We own the registered trademarks SUPPORT.COM® and PERSONAL TECHNOLOGY EXPERTS® in the United States for specified software and support services, and we have registrations and common law rights for several related trademarks in the U.S. and certain other countries. We own the domain name www.support.com and other domain names, and have rights to the phone number 1-800-PCSUPPORT. We have exclusive distribution rights to the Sammsoft line of consumer software products, and non-exclusive rights to distribute certain other products.
We own two U.S. patents related to our business and have a number of pending patent applications covering certain advanced technology. Our issued patents include U.S. Patent No. 6,754,707 (“Secure Computer Support System”) and U.S. Patent No. 6,167,358 (“System and Method for Remotely Monitoring a Plurality of Computer-Based Systems”). We do not know if our current patent applications or any future patent application will result in a patent being issued with the scope of the claims we seek, if at all. Also, we do not know whether any patents we have or may receive will be challenged or invalidated. It is difficult to monitor unauthorized use of technology, particularly in foreign countries where the laws may not protect our proprietary rights as fully as they do in the United States, and our competitors may develop technology that competes with ours but nevertheless does not infringe our intellectual property rights.
We rely on a combination of copyright, trade secret, trademark and contractual protection to establish and protect our proprietary rights that are not protected by patents. We also enter into confidentiality agreements with our employees and consultants involved in product development. We generally require our employees, customers and potential business partners to enter into confidentiality agreements before we will disclose any sensitive aspects of our business. Also, we generally require employees and contractors to agree to assign and surrender to us any proprietary information, inventions or other intellectual property they generate while working for us in the scope of employment. These precautions, and our efforts to register and protect our intellectual property, may not prevent misappropriation or infringement of our intellectual property.
Competition
We are active in markets that are highly competitive and subject to rapid change. Although we do not believe there is one principal competitor for all aspects of our offerings, we do compete with a number of other vendors.
With respect to channel partnerships for our services, our competitors include privately-held companies focused on premium technology services, providers of electronics warranties, call centers focused on technical support and broad-based services providers offering technical support. With respect to sales of services directly to consumers and small businesses, our competitors include local computer repair shops and service providers, electronics retailers and technology and communications companies offering technical support directly to consumers. We believe the principal competitive factors in our services market include: breadth and depth of service offerings; quality of the consumer experience; proprietary technology; pricing; brand recognition; scale; and financial resources.
In the market for our software products, we face direct competition from numerous suppliers of software utilities that perform the same or similar functions as our products. We also face indirect or potential competition from application providers, operating system providers, network equipment manufacturers, and other original equipment manufacturers (“OEMs”), who may provide various solutions and functions in their products, and from individuals and groups who offer “free” and open source utilities online. We believe that the principal competitive factors in the market for our consumer software products include: product features and ease of use; price; convenience of purchase; brand recognition; financial resources; and customer support.
The competitors in our markets for services and software can have some or all of the following competitive advantages: longer operating histories; greater economies of scale; greater financial resources; greater engineering and technical resources; greater sales and marketing resources; stronger strategic alliances and distribution channels; products with different functions and feature sets; and greater brand recognition than we have. We expect new competitors to continue to enter our services market given its relatively early stage, and we expect our markets to remain competitive.
For additional information related to competition, see Item 1A, Risk Factors.
Environmental Regulation
The majority of our employees are technicians who work from their own homes and use our advanced proprietary technology to deliver services from remote locations. As a result we believe that on a per-employee basis, our operations contribute significantly to efforts to reduce pollutants by eliminating fossil fuel-based commutes for the majority of our workers. In addition, the nature of our service delivery also helps many customers avoid on-site services, resulting in additional reduction in pollutants caused by automobile transportation for such services. Finally, our principal delivery method for our software products is by electronic download, which produces no packaging-related waste, and eliminates the need for production of physical media and transportation except for a small percentage of consumers who affirmatively request and pay for delivery of products by CD. We are not aware at this time of any material effects that compliance with Federal, State and local provisions which have been enacted or adopted regulating the discharge of materials into the environment, or otherwise relating to the protection of the environment, may have on our business. Our assessment could change if and when any new regulations of such sort are enacted or adopted.
Employees
As of December 31, 2010, we had 761 employees, of whom 618 were Personal Technology Experts and supervisors. None of our employees is covered by collective bargaining agreements.
SEC Filings and Other Available Information
We were incorporated in Delaware in December, 1997. We file reports with the Securities and Exchange Commission (SEC), including without limitation annual reports on Form 10-K, quarterly reports on Form 10-Q and current reports on Form 8-K filed or furnished pursuant to Section 13(a) or 15(d) of the Securities Exchange Act of 1934 (which we refer to herein as the Exchange Act). The public may read and copy any materials we file with the SEC at the SEC’s Public Reference Room at 100 F Street, N.E., Washington, DC 20549. The public may obtain information on the operation of the Public Reference Room by calling the SEC at (202) 551-8090. In addition, we are an electronic filer. The SEC maintains an internet site that contains reports, proxy and information statements, and other information regarding issuers, including us, that file electronically with the SEC at the website address located at www.sec.gov.
Our telephone number is 650-556-9440 and our website address is www.support.com. The information contained on our website does not form any part of this Annual Report on Form 10-K. However, we make available free of charge through our website our Annual Report on Form 10-K, our quarterly reports on Form 10-Q, our current reports on Form 8-K filed or furnished pursuant to Section 13(a) or 15(d) of the Securities Exchange Act of 1934 as soon as reasonably practicable after we electronically file this material with, or furnish it to, the SEC. In addition, we also make available on http://www.support.com/Company/ir_corporate_governance our Code of Ethics and Business Conduct for Employees, Officers and Directors. This Code is also available in print without charge to any person who requests it by writing to:
Support.com, Inc.
Investor Relations
1900 Seaport Boulevard, 3rd Floor
Redwood City, CA 94063
|
ITEM 1A.
|
RISK FACTORS
|
This report contains forward-looking statements regarding our business and expected future performance as well as assumptions underlying or relating to such statements of expectation, all of which are “forward looking statements” within the meaning of Section 27A of the Securities Act of 1933 and Section 21E of the Securities Exchange Act of 1934. We are subject to many risks and uncertainties that may materially affect our business and future performance and cause those forward-looking statements to be inaccurate. Words such as “expects,” “anticipates,” “intends,” “plans,” “believes,” “forecasts,” “estimates,” “seeks,” “may result in,” “focused on,” “continue to,” and similar expressions often identify forward-looking statements. In this report, forward-looking statements include, without limitation, the following:
8
|
|
•
|
Our expectations and beliefs regarding future financial results, conduct and growth of our business;
|
|
|
•
|
Our expectations regarding channel partners and the anticipated timing and magnitude of revenue from these partners;
|
|
|
•
|
Our expectations regarding sales of our software products, our ability to source, develop and distribute additional software products and our efforts to market services to buyers of our software products;
|
|
|
•
|
Our expectations regarding our ability to deliver premium technology services efficiently and through arrangements that are profitable;
|
|
|
•
|
Our ability to offer subscriptions to our services in a profitable manner;
|
|
|
•
|
Our ability to hire, train, manage and retain Personal Technology Experts in a home-based model and to expand the breadth and flexibility of our staffing model;
|
|
|
•
|
Our ability to match staffing levels with service volume in a cost-effective manner;
|
|
|
•
|
Our beliefs and expectations regarding the introduction of new services and products, including additional software products, service offerings for devices beyond the computer and small business services;
|
|
|
•
|
Our beliefs and expectations regarding new business opportunities and renewals of existing relationships;
|
|
|
•
|
Our expectations regarding revenues, cash flows and expenses, including cost of goods sold, sales and marketing, research and development efforts, and administrative expenses;
|
|
|
•
|
Our assessment of seasonality, mix of revenue, and other trends for our business;
|
|
|
•
|
Our expectations regarding the costs and other effects of acquisition and disposition transactions;
|
|
|
•
|
Our expectations regarding unit volumes, pricing and other factors in the market for computers and other devices, and the effects of such factors on our business;
|
|
|
•
|
The assumptions underlying our Critical Accounting Policies and Estimates, including our assumptions regarding revenue recognition; assumptions used to estimate the fair value of share-based compensation; assumptions regarding the impairment of goodwill and intangible assets; and expected accounting for income taxes; and
|
|
|
•
|
The expected effects of the adoption of new accounting standards.
|
An investment in our stock involves risk, and we caution investors that forward-looking statements are only predictions based on our current expectations about future events and are not guarantees of future performance. We encourage you to read carefully all information provided in this report and in our other filings with the SEC before deciding to invest in our stock or to maintain or change your investment. Forward-looking statements are based on information as of the filing date of this report, and we undertake no obligation to publicly revise or update any forward-looking statement for any reason.
Because forward-looking statements involve risks and uncertainties, there are important factors that may cause actual results to differ materially from our stated expectations. These factors are described below. This list does not include all risks that could affect our business, and if these or any other risks or uncertainties materialize, or if our underlying assumptions prove to be inaccurate, actual results could differ materially from past results and from our expected future results.
Our business has not been profitable and may not achieve profitability in future periods.
We have not been profitable since 2005. We intend to make significant investments in support of our business, and may continue to sustain losses in the future notwithstanding our efforts to achieve profitability. If we fail to achieve revenue growth as a result of our additional investments or if such revenue growth does not result in our achieving profitability, the market price of our common stock will likely decline. We expect to continue to consume cash until we achieve profitability on a non-GAAP basis. A sustained period of losses would result in an increased usage of cash to fund our operating activities and a corresponding reduction in our cash balance.
Our business has a limited operating history and is based on a relatively new business model.
Our technology-enabled services business launched in 2007 to provide services and software that help consumers and small businesses with their technology needs. Prior to 2007, we operated an enterprise software business focused on technical support, which we sold in the second quarter of 2009. We are executing a plan to grow our business by providing premium technology services and software to customers both through channel partners and directly. We may not be able to offer these services and software products successfully. Our Personal Technology Experts are generally home-based, which requires a high degree of coordination and quality control of employees working from diverse and remote locations. We are currently experiencing financial losses in our business and we may to continue to use cash and incur costs to support our growth initiatives. Our investments, which typically are made in advance of revenue, may not yield increased revenue to offset these expenses. As a result of these factors, the future revenue and income potential of our business is uncertain. Any evaluation of our business and our prospects must be considered in light of these factors and the risks and uncertainties often encountered by companies in our early stage of development. Some of these risks and uncertainties relate to our ability to do the following:
|
|
•
|
Maintain our current relationships, and develop new relationships, with channel partners on acceptable terms or at all;
|
|
|
•
|
Reach consumers and small businesses directly in a cost-effective fashion;
|
|
|
•
|
Hire, train, manage and retain our home-based Personal Technology Experts and expand the breadth and flexibility of our staffing model;
|
|
|
•
|
Meet anticipated growth targets;
|
|
|
•
|
Manage our business to provide services on an efficient basis in order to achieve profitability;
|
|
|
•
|
Offer subscriptions to our services in a profitable manner;
|
|
|
•
|
Successfully introduce new, and adapt our existing, services and products for consumers and small businesses;
|
|
|
•
|
Respond effectively to competition;
|
|
|
•
|
Adapt to industry consolidation;
|
|
|
•
|
Respond to government regulations relating to our business;
|
|
|
•
|
Attract and retain qualified management and employees; and
|
|
|
•
|
Manage our expanding operations and implement and improve our operational, financial and management controls.
|
If we are unable to address these risks, our business, results of operations and prospects could suffer.
Our quarterly results have in the past, and may in the future, fluctuate significantly.
Our quarterly revenue and operating results have in the past and may in the future fluctuate from quarter to quarter. As a result, we believe that quarter-to-quarter and year-to-year comparisons of our revenue and operating results may not be accurate indicators of future performance.
Several factors that have contributed or may in the future contribute to fluctuations in our operating results include:
|
|
•
|
Demand for our services and products;
|
|
|
•
|
Our ability to increase the efficiency and capacity of our service delivery organization;
|
|
|
•
|
The performance of our channel partners;
|
|
|
•
|
Our ability to effectively match staffing levels with service volumes on a cost-effective basis, particularly with newer partners using models, such as subscriptions, without adequate or comparable historical data for forecasting purposes;
|
|
|
•
|
Our reliance on a relatively small number of channel partners for a substantial portion of our revenue;
|
|
|
•
|
Our ability to attract and retain customers and channel partners;
|
|
|
•
|
Our ability to reach customers directly in a cost effective manner;
|
|
|
•
|
The rate of expansion of our offerings and our investments therein;
|
|
|
•
|
The price and mix of products and services we or our competitors offer;
|
|
|
•
|
Usage rates on the subscriptions we offer;
|
|
|
•
|
Changes in the PC/CE markets relating to unit volume, pricing and other factors and the effects of such changes on our business;
|
|
|
•
|
Continued instability in the global macroeconomic climate and its effect on our and our channel partners’ operations;
|
|
|
•
|
Our ability to adapt to our customers’ needs in a market space defined by frequent technological change;
|
|
|
•
|
Seasonal trends resulting from consumer spending patterns;
|
|
|
•
|
The amount and timing of operating costs and capital expenditures in our business;
|
|
|
•
|
Diversion of management’s attention from other business concerns and disruption of our ongoing business as a result of acquisitions or divestitures by us;
|
|
|
•
|
Potential losses on investments, or other losses from financial instruments we may hold that are exposed to market risk; and
|
|
|
•
|
The exercise of judgment by our management in making accounting decisions in accordance with our accounting policies.
|
Our inability to meet future financial performance targets that we announce or that are published by research analysts could cause the market price of our common stock to decline.
From time-to-time, we provide guidance related to our future financial performance. In addition, financial analysts may publish their own expectations of our future financial performance. Because our quarterly revenue and our operating results fluctuate and are difficult to predict, future financial performance is difficult to predict. In the past, including without limitation in the second quarter of 2010, we have failed to meet our guidance and our stock price has declined. Generally, the market prices of technology companies have been extremely volatile. Stock prices of many technology companies have often fluctuated in a manner unrelated or disproportionate to the operating performance of such companies. In the past, following periods of market volatility, stockholders have often initiated securities class action litigation relating to the stock trading and price volatility of the technology company in question. Any securities litigation we may become involved in could result in our incurring substantial defense costs and diverting resources and the attention of management from our business.
Because a small number of customers and channel partners have historically accounted for and may in future periods account for the substantial majority of our revenue, delays of specific programs or losses of certain customers could decrease our revenue substantially.
In 2009, one customer, Office Depot, accounted for the substantial majority of our total revenue after giving effect to the sale of our Enterprise business. Over the course of 2009 and 2010, the percentage of revenue attributable to Office Depot has decreased each quarter. We expect the percent of revenue attributable to Office Depot to decline further in 2011 as we continue to expand our service channel partnerships and grow our software business. Our renewed agreement with Office Depot has resulted in lower wholesale prices. It also has a limited term through March 2012, and provides for a renewal period if agreed to by the parties. This agreement might not be renewed on acceptable terms or at all. Even if the agreement continues to be renewed, however, it does not require Office Depot to conduct any minimum amount of business with us, and therefore Office Depot could decide at any time to reduce or eliminate its use of our services. Our revenue from Office Depot is expected to decline in 2011 as a result of the lower wholesale prices in the renewed agreement, unless the program expands. Our services revenue could decline significantly because of the loss or decline in activity of Office Depot or the delay or loss of a significant program by other channel partners. In 2011, we expect certain other channel partners’ revenue streams to become increasingly significant to us and the failure of those partners to achieve their targets could adversely affect our business. Additionally, we may not obtain new channel partners or customers. The failure to obtain significant new channel partners or the loss or decline of any significant channel partner would have a material adverse effect on our operating results. Further risks associated with the loss or decline in a significant channel partner are detailed in “Our failure to establish and expand successful partnerships to sell our services and products would harm our operating results” below.
Our failure to establish and expand successful partnerships to sell our services and products would harm our operating results.
Our current business model requires us to establish and maintain relationships with third parties who market and sell our services and products. Failure to establish or maintain third-party relationships in our business, particularly with firms that sell our services and products, could materially and adversely affect the success of our business. We sell to numerous consumers through each of these channel partners, and therefore a delay in the launch or rollout of our services with even one of these channel partners could cause us to miss revenue or other financial targets. The process of establishing a relationship with a channel partner can be complex and time consuming, and we must pass multiple levels of review in order to be selected. If we are unable to establish a sufficient number of new channel partners on a timely basis our sales will suffer. There is also the risk that, once established, our programs with these channel partners may take longer than we expect to produce revenue or may not produce revenue at all, and the revenue produced may not be profitable if the costs of performing under the program are greater than anticipated or the program terminates early before up-front investments can be recouped. One or more of our key channel partners may also discontinue selling our services, offer them only on a limited basis or devote insufficient time and attention to promoting them to their customers. Some of our partners may prefer not to work with us if we also partner with their competitors. If any of these key channel partners merge with a competitor, all of these risks could be exacerbated. Each of these risks could reduce our sales and significantly harm our operating results.
If we fail to attract, train and manage our service delivery employees in a manner that provides an adequate level of support for our customers, our reputation and financial performance could be harmed.
Our business depends in part on our ability to attract, manage and retain our Personal Technology Experts and other support personnel in order to satisfy fluctuating day-by-day demand for our services than can be materially affected by growth, seasonality, the impact of channel partner promotions and other factors. If we are unable to attract, train and manage in a cost-effective manner adequate numbers of competent Personal Technology Experts and other support personnel to be available as service volumes vary, particularly as we seek to expand the breadth and flexibility of our staffing model, our service levels could decline, which could harm our reputation, result in financial losses under contract, cause us to lose customers and channel partners, and otherwise adversely affect our financial performance. Although our service delivery and communications infrastructure enables us to monitor and manage Personal Technology Experts remotely, because they are typically home-based and geographically dispersed we could experience difficulties meeting services levels and effectively managing the costs, performance and compliance of these Personal Technology Experts and other support personnel. Any problems we encounter in effectively attracting, managing and retaining our Personal Technology Experts and other support personnel could seriously jeopardize our service delivery operations and our financial results.
From time to time, we enter into relationships with third parties to provide on-site and other services for certain channel partners and customers. We may be less able to manage the quality of services provided by third-party service providers as directly as we would our own employees. In addition, providing these services may be more costly. We also face the risk that disruptions or delays in these third parties’ communications and information technology infrastructure could cause lengthy interruptions in the availability of our services. Any of these risks could harm our operating results.
Disruptions in our information technology and service delivery infrastructure and operations, including interruptions or delays in service from our third-party web hosting provider, could impair the delivery of our services and harm our business.
We depend on the continuing operation of our information technology and communication systems and those of our external service providers. Any damage to or failure of those systems could result in interruptions in our service, which could reduce our revenues and damage our reputation. The technology we use to serve customers is hosted at a third-party facility located in the United States, and we use a separate, independent third-party facility in the United States for emergency back-up and failover services in support of the hosted site. These two facilities are operated by unrelated publicly held companies specializing in operating such facilities, and we do not control the operation of these facilities. These facilities may experience unplanned outages and other technical difficulties in the future, and are vulnerable to damage or interruption from fires, floods, earthquakes, telecommunications and connectivity failures, power failures, and similar events. These facilities are also subject to risks from vandalism, break-ins, intrusion, and other malicious attacks. Despite substantial precautions taken, such as disaster recovery planning and back-up procedures, a natural disaster, act of terrorism or other unanticipated problem could cause a loss of information and data and lengthy interruptions in the availability of our services and hosted solutions offerings, as our backup systems may not be able to meet our needs for an extended period of time. We rely on hosted systems maintained by third-party providers to deliver technology services to consumers, including taking customer orders, handling telecommunications for customer calls, and tracking sales and service delivery. Any interruption or failure of our internal or external systems could prevent us or our service providers from accepting orders and delivering services, or cause company and consumer data to be unintentionally disclosed. Our continuing efforts to upgrade and enhance the security and reliability of our information technology and communications infrastructure could be very costly, and we may have to expend significant resources to remedy problems such as a security breach or service interruption. Interruptions in our services resulting from labor disputes, telephone or internet failures, power or service outages, natural disasters or other events, or a security breach could reduce our revenue, increase our costs, cause customers and channel partners to fail to renew or to terminate their use of our offerings, and harm our reputation and our ability to attract new customers.
Our software revenues are dependent on online traffic patterns and the availability and cost of online advertising in certain key placements.
Most of our software revenue stream is highly dependent on obtaining advertising placements in a cost-effective manner in certain key online media placements. Periodically a disruptive trend will impact the online media space, decreasing traffic and/or significantly increasing the cost of online advertising and therefore compromising our ability to purchase a desired volume and placement of advertisements at profitable rates. If such a trend were to occur, we might be unable to attract desired amounts of traffic, our costs for advertising may increase beyond our forecasts and/or our software revenues could decrease. As a result, our operating results would be negatively impacted.
We must compete successfully in the markets in which we operate or our business will suffer.
We compete in markets that are highly competitive, subject to rapid change and significantly affected by new service introductions and other market activities of industry participants. We compete with a number of companies in the market for online technology services and software products. In addition, our channel partners may develop similar offerings internally.
The markets for our services and software products are still rapidly evolving, and we may not be able to compete successfully against current and potential competitors. Our ability to expand our business will depend on our ability to maintain our technological advantage, introduce timely enhanced products to meet growing support needs, deliver on-going value to our customers and scale our business. Competition in our markets could reduce our market share or require us to reduce the price of products and services, which could harm our business, financial condition and operating results.
The competitors in our markets for services and software can have some or all of the following comparative advantages: longer operating histories; greater economies of scale; greater financial resources; greater engineering and technical resources; greater sales and marketing resources; stronger strategic alliances and distribution channels; lower labor costs; products with different functions and feature sets; and greater brand recognition than we have. We expect new competitors to continue to enter our services market given its relatively early stage, and we expect our software market to remain competitive.
Our future service and product offerings may not achieve market acceptance.
If we fail to develop new and enhanced versions of our services and products in a timely manner or to provide services and products that achieve rapid and broad market acceptance, we may not maintain or expand our market share. We may fail to identify new service and product opportunities for our current market or new markets that we enter in the future. In addition, our existing services and products may become obsolete if we fail to introduce new services and products that meet new customer demands or support new standards. While we are developing new services and products, there can be no assurance that they will be timely released or ever be completed, and if they are, that they will gain market acceptance or generate material revenue for us. We have limited control over factors that affect market acceptance of our services and products, including the willingness of channel partners to offer our services and products and customer preferences for competitors’ services, products and delivery models. We rely in part on a third party to develop certain of our software products. If our relationship with that third party were to deteriorate, or if the third party were unable to develop innovative and saleable products, we could be forced to identify a new developer and our future revenue could suffer.
We may make acquisitions that may not prove successful.
We have made acquisitions in the past and may make additional acquisitions in the future. We may not be able to identify suitable acquisition candidates at prices we consider appropriate. If we do identify an appropriate acquisition candidate, we may not be able to successfully negotiate the terms of the acquisition. Our management may not be able to effectively implement our acquisition program and internal growth strategy simultaneously. The integration of acquisitions involves a number of risks and presents financial, managerial and operational challenges. We may have difficulty, and may incur unanticipated expenses related to, integrating management and personnel from these acquired entities with our management and personnel. Our failure to identify, consummate or integrate suitable acquisitions could adversely affect our business and results of operations. We cannot readily predict the timing, size or success of our future acquisitions. Even successful acquisitions could have the effect of reducing our cash balances. Acquisitions could involve a number of other potential risks to our business, including the following, any of which could harm our business results:
|
|
•
|
Unanticipated costs and liabilities and unforeseen accounting charges or fluctuations;
|
|
|
•
|
Delays and difficulties in delivery of services and products;
|
|
|
•
|
Failure to effectively integrate or separate management information systems, personnel, research and development, marketing, sales and support operations;
|
|
|
•
|
Loss of key employees;
|
|
|
•
|
Economic dilution to gross and operating profit;
|
|
|
•
|
Diversion of management’s attention from other business concerns and disruption of our ongoing business;
|
|
|
•
|
Difficulty in maintaining controls and procedures;
|
|
|
•
|
Uncertainty on the part of our existing customers about our ability to operate after a transaction;
|
|
|
•
|
Loss of customers;
|
|
|
•
|
Loss of partnerships;
|
|
|
•
|
Declines in revenue and increases in losses;
|
|
|
•
|
Failure to realize the potential financial or strategic benefits of the acquisition or divestiture; and
|
|
|
•
|
Failure to successfully further develop the combined or remaining technology, resulting in the impairment of amounts recorded as goodwill or other intangible assets.
|
Our systems collect, access, use, and store personal customer information and enable customer transactions, which poses security risks, requires us to invest significant resources to prevent or correct problems caused by security breaches, and may harm our business.
A fundamental requirement for online communications, transactions and support is the secure collection, storage and transmission of confidential information. Our systems collect and store confidential and/or personal information of our individual customers as well as our channel partners and their customers’ users, including credit card information, and our employees and contractors may access and use that information in the course of providing services. In addition, we collect and retain personal information of our employees in the ordinary course of our business. We and our third-party contractors use commercially available technologies to secure this information. Despite these measures, third parties may attempt to breach the security of our data or that of our customers. In addition, errors in the storage or transmission of data could breach the security of that information. We may be liable to our customers for any breach in security and any breach could subject us to governmental or administrative proceedings or monetary penalties, damage our relationships with channel partners and harm our business and reputation. Also, computers are vulnerable to computer viruses, physical or electronic break-ins and similar disruptions, which could lead to interruptions, delays or loss of data. We may be required to expend significant capital and other resources to comply with mandatory privacy and security standards required by law, industry standard, or contract, and to further protect against security breaches or to correct problems caused by any security breach.
We are exposed to risks associated with credit card and payment fraud and with credit card processing.
Certain of our customers use credit cards to pay for our services and products. We may suffer losses as a result of orders placed with fraudulent credit cards or other payment data. Our failure to detect or control payment fraud could have an adverse effect on our results of operations. We are also subject to payment card association operating standards and requirements, as in effect from time to time. Compliance with those standards requires us to invest in network and systems infrastructure and processes. Failure to comply with these rules or requirements may subject us to fines, potential contractual liabilities, and other costs, resulting in harm to our business and results of operations.
Privacy concerns and laws or other domestic or foreign regulations may require us to incur significant costs and may reduce the effectiveness of our solutions, and our failure to comply with those laws or regulations may harm our business and cause us to lose customers.
Our software contains features that allow our Personal Technology Experts to access, control, monitor and collect information from computers running our software. Federal, state and foreign government bodies and agencies, however, have adopted or are considering adopting laws and regulations restricting or otherwise regulating the collection, use and disclosure of personal information obtained from consumers and individuals. Those regulations could require costly compliance measures, could reduce the efficiency of our operations, or could require us to modify or cease to provide our systems or services. Liability for violation of, costs of compliance with, and other burdens imposed by such laws and regulations may limit the use and adoption of our services and reduce overall demand for them. Even the perception of privacy concerns, whether or not valid, may harm our reputation and inhibit adoption of our solutions by current and future customers. In addition, we may face claims about invasion of privacy or inappropriate disclosure, use, storage, or loss of information obtained from our customers. Any imposition of liability could harm our reputation, cause us to lose customers and cause our operating results to suffer.
We rely on third-party technologies in providing certain of our services and software. Our inability to use, retain or integrate third-party technologies and relationships could delay service or software development and could harm our business.
We license technologies from third parties which are integrated into our services and software. We rely on a third party to develop certain of our software products. Our use of technologies licensed on a non-exclusive basis from third parties, including the developer of certain of our software products, poses certain risks. Some of the third-party technologies we license may be provided under “open source” licenses, which may have terms that require us to make generally available our modifications or derivative works based on such open source code. Our inability to obtain or integrate third-party technologies with our own technology could delay service development until equivalent compatible technology can be identified, licensed and integrated. These third-party technologies may not continue to be available to us on commercially reasonable terms or at all. If our relationship with third parties were to deteriorate, or if such third parties were unable to develop innovative and saleable products, we could be forced to identify a new developer and our future revenue could suffer. We may fail to successfully integrate any licensed technology into our services or software, or maintain it through our own development work, which would harm our business and operating results. Third-party licenses also expose us to increased risks that include:
|
|
•
|
Risks of product malfunction after new technology is integrated;
|
|
|
•
|
Risks that we may be unable to obtain or continue to obtain support, maintenance and updates from the technology supplier;
|
|
|
•
|
The diversion of resources from the development of our own proprietary technology; and
|
|
|
•
|
Our inability to generate revenue from new technology sufficient to offset associated acquisition and maintenance costs.
|
We rely upon intellectual property laws to protect our proprietary rights, and if these rights are not sufficiently protected or we are not able to obtain sufficient protection for our technology, it could harm our ability to compete and to generate revenue.
We rely on a combination of laws, such as those applicable to patents, copyrights, trademarks and trade secrets, and contractual restrictions, such as confidentiality agreements and licenses, to establish and protect our proprietary rights. Our ability to compete and grow our business could suffer if these rights are not adequately protected. Our proprietary rights may not be adequately protected because:
|
|
•
|
Laws and contractual restrictions may not adequately prevent infringement of our proprietary rights and misappropriation of our technologies or deter others from developing similar technologies; and
|
|
|
•
|
Policing infringement of our patents, trademarks and copyrights, misappropriation of our trade secrets, and unauthorized use of our products is difficult, expensive and time-consuming, and we may be unable to determine the existence or extent of this infringement or unauthorized use.
|
Intellectual property litigation is expensive and time-consuming and could divert management’s attention from our business. The outcome of any litigation is uncertain and could significantly impact our financial results. Also, the laws of other countries in which we market our products may offer little or no protection of our proprietary technologies. Reverse engineering, unauthorized copying or other misappropriation of our proprietary technologies could enable third parties to benefit from our technologies without paying us for them, which would harm our competitive position and market share.
Our success and ability to compete depend to a significant degree upon the protection of our solutions and other proprietary technology. It is possible that:
|
|
•
|
We may not be issued patents we may seek to protect our technology;
|
|
|
•
|
Competitors may independently develop similar technologies or design around any of our patents;
|
|
|
•
|
Patents issued to us may not be broad enough to protect our proprietary rights; and
|
|
|
•
|
Our issued patents could be successfully challenged.
|
We may face intellectual property infringement claims that could be costly to defend and result in our loss of significant rights.
Our business relies upon the use and licensing of technology. Other parties may assert intellectual property infringement claims against us or our customers, and our products may infringe the intellectual property rights of third parties. For example, our products may infringe patents issued to third parties. In addition, as is increasingly common in the technology sector, we may be confronted with the aggressive enforcement of patents by companies whose primary business activity is to acquire patents for the purpose of offensively asserting them against other companies. From time to time, we have received allegations of intellectual property infringement, and we may receive more claims in the future. We may also be required to pursue litigation to protect our intellectual property rights. Intellectual property litigation is expensive and time-consuming and could divert management’s attention from our business. The outcome of any litigation is uncertain and could significantly impact our financial results. If there is a successful claim of infringement, we may be required to develop non-infringing technology or enter into royalty or license agreements, which may not be available on acceptable terms, if at all. Our failure to develop non-infringing technologies or license proprietary rights on a timely basis would harm our business.
Changes in the market for computers and other consumer electronics could adversely affect our business.
Reductions in unit volumes of sales for computers and other devices we support, or in the prices of such equipment, could adversely affect our business. We offer both services that are attached to the sales of new computers and other devices, and services designed to fix existing computers and other devices. Declines in the unit volumes sold of these devices or declines in the pricing of such devices could adversely affect demand for our services and/or our revenue mix, either of which would harm our operating results. Further, we do not support all types of computers and devices, meaning that we must select and focus on certain operating systems and technology standards for computers, smart phones, and other devices. We may not be successful in supporting popular equipment and platforms; consumers and small businesses may trend toward use of equipment we do not support, and the process of migration away from platforms we support may decrease the market for our services and products. Any of these risks could harm our operating results.
We have recorded long-lived assets, and our results of operations would be adversely affected if their value becomes impaired.
Goodwill and identifiable intangible assets were recorded in part due to our acquisition of substantially all of the assets and liabilities of YourTechOnline.com in May 2008 and our acquisition of substantially all of the assets of Xeriton in December 2009. We also have certain intangible assets with indefinite lives. We assess the impairment of goodwill and indefinite lived intangible assets annually or more often if events or changes in circumstances indicate that the carrying value may not be recoverable. We assess the impairment of acquired product rights and other finite lived intangible assets whenever events or changes in circumstances indicate that its carrying amount may not be recoverable. Our results of operations would be adversely affected if impairment of our goodwill or intangible assets occurred.
|
ITEM 1B.
|
Not applicable.
|
ITEM 2.
|
Our corporate headquarters lease covers approximately 37,449 square feet at 1900 Seaport Boulevard, 3rd Floor, Redwood City, California. During the third quarter of 2009, we ceased using approximately 17,048 square feet in order to align our facilities usage with our current size. This lease expires in July, 2012. We lease an office of approximately 1,947 square feet at Sammamish, Washington for our software operations. This lease expires on December 31, 2011. In addition, we have an office in India with 6,838 square feet. This lease expires on August 31, 2012. We believe our facilities are adequate to meet our current business requirements.
|
ITEM 3.
|
Legal Contingencies
In November 2001, a class action lawsuit was filed against us, two of our former officers and certain underwriters in the United States District Court for the Southern District of New York. Similar complaints have been filed against 55 underwriters and more than 300 other companies and other individual officers and directors of those companies; the consolidated case is In re Initial Public Offering Securities Litigation, No. 21 MC 92 (SAS) (S.D.N.Y.). The lawsuit, which sought unspecified damages, fees and costs, alleged that our registration statement and prospectus dated July 18, 2000 for the issuance and initial public offering of 4,250,000 shares of our common stock contained material misrepresentations and/or omissions related to alleged inflated commissions received by the underwriters of the offering. On April 1, 2009, all parties entered into a Stipulation and Agreement of Settlement that would resolve all claims and dismiss the case against us and our former officers, without any payment by us or our former officers. On October 5, 2009, the court issued an order approving the settlement. Certain other parties have appealed the settlement and the appeal is pending.
We are also subject to other routine legal proceedings, as well as demands, claims and threatened litigation, that arise in the normal course of our business, potentially including assertions that we may be infringing patents or other intellectual property rights of others. We accrue for legal contingencies if we can estimate the potential liability and if we believe it is more likely than not that the case will be ruled against us. If a legal claim for which we did not accrue is resolved against us, we would record the expense in the period in which the ruling was made. We currently do not believe that the ultimate amount of liability, if any, for any pending claims of any type (alone or combined) will materially affect our financial position, results of operations or cash flows. The ultimate outcome of any litigation is uncertain, however, and unfavorable outcomes could have a material negative impact on our financial condition and operating results. Regardless of outcome, litigation can have an adverse impact on us because of defense costs, negative publicity, diversion of management resources and other factors.
Tax Contingencies
We are required to make periodic filings in the jurisdictions where we are deemed to have a presence for tax purposes. We have undergone audits in the past and have paid assessments arising from these audits. During the fourth quarters of 2008 and 2009, our India entity was issued notices of income tax assessment pertaining to the 2004-2005 and 2005-2006 fiscal years. The notices claimed that the transfer price used in our inter-company agreements with our India entity was too low, and that the rate should be increased. We believe our current transfer pricing position is more likely than not to be sustained. We believe that this will be resolved through the normal judicial appeal process used in India, and have submitted our case to the court. If we do not win our case we may incur additional expense, potentially up to $126,000.
We may be subject to other income tax assessments in the future. We evaluate estimated losses that could arise from those assessments in accordance with ASC 740. We consider such factors as the degree of probability of an unfavorable outcome and the ability to make a reasonable estimate on the amount of loss. We record the estimated liability amount for those assessments that we consider to be more likely than not in our balance sheet.
Guarantees
We have identified guarantees in accordance with ASC 450. The guidance stipulates that an entity must recognize an initial liability for the fair value, or market value, of the obligation it assumes under the guarantee at the time it issues such a guarantee, and must disclose that information in its interim and annual financial statements. We have entered into various service level agreements with our channel partners, in which we may guarantee the maintenance of certain service level thresholds. Under some circumstances, if we do not meet these thresholds, we may be liable for certain financial costs. We evaluate costs for such guarantees under the statement for accounting for contingencies, as interpreted by the guidance for guarantor’s accounting and disclosure requirements for guarantees. We consider such factors as the degree of probability that we would be required to satisfy the liability associated with the guarantee and the ability to make a reasonable estimate of the resulting cost. To date, we have not incurred material costs as a result of any such obligations and have not accrued any liabilities related to such obligations in its financial statements.
PART II
|
ITEM 5.
|
MARKET FOR THE REGISTRANT’S COMMON EQUITY, RELATED STOCKHOLDER MATTERS AND ISSUER PURCHASES OF EQUITY SECURITIES.
|
Market of Common Stock
Our common stock has been traded publicly on the Nasdaq Global Select Market under the symbol “SPRT” since July 19, 2000. Before July 19, 2000, there was no public market for our common stock. The following table sets forth the highest and lowest sale price of our common stock for the quarters indicated:
|
Low
|
High
|
|||||||
|
Fiscal Year 2009:
|
||||||||
|
First Quarter
|
$ | 1.55 | $ | 2.24 | ||||
|
Second Quarter
|
$ | 1.87 | $ | 2.49 | ||||
|
Third Quarter
|
$ | 2.07 | $ | 2.72 | ||||
|
Fourth Quarter
|
$ | 2.20 | $ | 2.80 | ||||
|
Fiscal Year 2010:
|
||||||||
|
First Quarter
|
$ | 2.43 | $ | 3.43 | ||||
|
Second Quarter
|
$ | 3.26 | $ | 4.66 | ||||
|
Third Quarter
|
$ | 3.54 | $ | 5.08 | ||||
|
Fourth Quarter
|
$ | 4.40 | $ | 7.15 | ||||
Holders of Record
As of February 28, 2011, there were approximately 143 holders of record of our common stock (not including beneficial holders of stock held in street name).
Dividend Policy
We have not declared or paid any cash dividends on our capital stock since our inception and do not expect to do so in the foreseeable future. We currently anticipate that all future earnings, if any, generated from operations will be retained by us to develop and expand our business. Any future determination with respect to the payment of dividends will be at the discretion of the Board of Directors and will depend upon, among other things, our operating results, financial condition and capital requirements, the terms of then-existing indebtedness, general business conditions and such other factors as the Board of Directors deems relevant.
Securities Authorized for Issuance Under Equity Compensation Plans
Information regarding the securities authorized for issuance under our equity compensation plans can be found under Item 12 of Part III of this Report.
Stock Price Performance Graph
The following graph illustrates a comparison of the cumulative total stockholder return (change in stock price plus reinvested dividends) of the Company’s Common Stock and the CRSP Total Return Index for the Nasdaq U.S. Stocks (the “Nasdaq Composite Index”) and Nasdaq Computer and Data Processing Services Index from December 31, 2005 through December 31, 2010. The graph assumes that $100 was invested on December 31, 2005 in us, the Nasdaq Composite Index and the Nasdaq Computer and Data Processing Services Index and that all dividends were reinvested. No cash dividends have been declared or paid on our common stock. Our common stock has been traded on the Nasdaq Global Select Market since July 19, 2000. The comparisons in the table are required by the Securities and Exchange Commission and are not intended to forecast or be indicative of possible future performance of our common stock.
COMPARISON OF CUMULATIVE TOTAL RETURN AMONG
SUPPORT.COM, INC.,
THE NASDAQ COMPOSITE INDEX, AND
THE NASDAQ COMPUTER INDEX
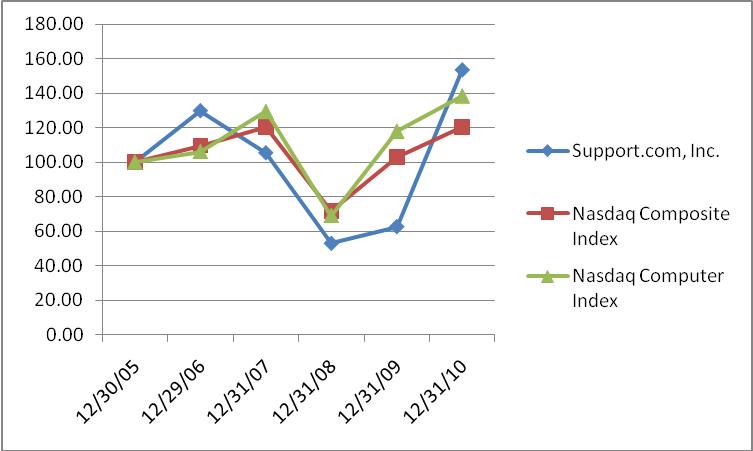
CUMULATIVE TOTAL RETURN AT PERIOD END
|
12/31/05
|
12/31/06
|
12/31/07
|
12/31/08
|
12/30/09
|
12/31/10
|
|||||||||||||||||||
|
Support.com, Inc.
|
$ | 100.00 | $ | 129.86 | $ | 105.45 | $ | 52.84 | $ | 62.56 | $ | 153.55 | ||||||||||||
|
Nasdaq Composite Index
|
$ | 100.00 | $ | 109.52 | $ | 120.27 | $ | 71.51 | $ | 102.89 | $ | 120.29 | ||||||||||||
|
Nasdaq Computer Index
|
$ | 100.00 | $ | 106.15 | $ | 129.35 | $ | 68.96 | $ | 117.79 | $ | 138.34 | ||||||||||||
The information presented above in the stock performance graph shall not be deemed to be “soliciting material” or to be “filed” with the Securities and Exchange Commission or subject to Regulation 14A or 14C, except to the extent that we subsequently specifically request that such information be treated as soliciting material or specifically incorporate it by reference into a filing under the Securities Act of 1933 or Exchange Act.
|
ITEM 6.
|
Support.com was founded in 1997 under the name SupportSoft, Inc. as an enterprise software provider focused on technical support organizations. In 2007 we launched our consumer services business, and in 2008 began reporting two operating segments, Enterprise and Consumer. In June, 2009 we sold our Enterprise business to Consona Corporation (“Consona”), changed our name to Support.com, Inc. and focused our efforts purely on the consumer and small business market. We added the Sammsoft family of software products to our Consumer business in December, 2009 through the acquisition of substantially all of the assets of Xeriton, Inc. As the Company has irrevocably sold the Enterprise business to Consona, the operations and cash flows of the disposed business have been completely eliminated from the ongoing operations of Support.com. Therefore, our audited consolidated financial statements, accompanying notes and other information provided in this Form 10-K reflect the Enterprise business as a discontinued operation for all periods presented in accordance with ASC 360, Accounting for the Impairment or Disposal of Long-Lived Assets. After reclassifying the Enterprise business to discontinued operations, our continuing operations consist solely of our remaining segment, the Consumer business, which includes our online support services as well as our consumer software products.
The information set forth below is not necessarily indicative of results of future operations and should be read in conjunction with “Management’s Discussion and Analysis of Financial Condition and Results of Operations” and the consolidated financial statements and related notes included in Items 7 and 8 of Part II of this Report.
|
Years Ended December 31,
|
||||||||||||||||||||
|
2010
|
2009
|
2008
|
2007
|
2006
|
||||||||||||||||
|
(in thousands, except per share data)
|
||||||||||||||||||||
|
Consolidated Statements of Operations Data:
|
||||||||||||||||||||
|
Revenue:
|
||||||||||||||||||||
|
Services
|
$ | 32,276 | $ | 16,770 | $ | 6,468 | $ | 994 | $ | — | ||||||||||
|
Software and other
|
11,901 | 725 | 343 | 56 | — | |||||||||||||||
|
Total revenue
|
44,177 | 17,495 | 6,811 | 1,050 | — | |||||||||||||||
|
Cost of revenue:
|
||||||||||||||||||||
|
Cost of services
|
26,737 | 16,620 | 10,037 | 4,415 | — | |||||||||||||||
|
Cost of software and other
|
1,358 | 59 | — | — | — | |||||||||||||||
|
Total cost of revenue
|
28,095 | 16,679 | 10,307 | 4,415 | — | |||||||||||||||
|
Gross profit (loss)
|
16,082 | 816 | (3,496 | ) | (3,365 | ) | — | |||||||||||||
|
Operating expenses:
|
||||||||||||||||||||
|
Research and development
|
5,214 | 5,795 | 6,694 | 5,070 | ||||||||||||||||
|
Sales and marketing
|
18,091 | 7,675 | 9,073 | 5,087 | ||||||||||||||||
|
General and administrative
|
10,963 | 14,119 | 14,559 | 13,891 | — | |||||||||||||||
|
Amortization of intangible assets
|
364 | 177 | 112 | — | — | |||||||||||||||
|
Total operating expenses
|
34,632 | 27,766 | 30,738 | 24,048 | — | |||||||||||||||
|
Loss from operations
|
(18,550 | ) | (26,950 | ) | (34,234 | ) | (27,413 | ) | — | |||||||||||
|
Interest income and other, net
|
540 | 428 | 2,506 | 6,527 | — | |||||||||||||||
|
Loss from continuing operations, before income taxes
|
(18,010 | ) | (26,522 | ) | (31,728 | ) | (20,886 | ) | — | |||||||||||
|
Income tax (benefit)
|
88 | (4,941 | ) | (18 | ) | — | — | |||||||||||||
|
Loss from continuing operations
|
(18,098 | ) | (21,581 | ) | (31,710 | ) | (20,886 | ) | — | |||||||||||
|
Income (loss) from discontinued operations, after income taxes
|
31 | 7,004 | 12,604 | (483 | ) | (8,235 | ) | |||||||||||||
|
Net loss
|
$ | (18,067 | ) | $ | (14,577 | ) | $ | (19,106 | ) | $ | (21,369 | ) | $ | (8,235 | ) | |||||
|
Basic earnings per share:
|
||||||||||||||||||||
|
Income (loss) from continuing operations
|
$ | (0.39 | ) | $ | (0.47 | ) | $ | (0.69 | ) | $ | (0.46 | ) | $ | — | ||||||
|
Income (loss) from discontinued operations
|
0.00 | 0.16 | 0.28 | (0.01 | ) | (0.19 | ) | |||||||||||||
|
Basic net loss per share
|
$ | (0.39 | ) | $ | (0.31 | ) | $ | (0.41 | ) | $ | (0.47 | ) | $ | (0.19 | ) | |||||
|
Diluted earnings per share:
|
||||||||||||||||||||
|
Income (loss) from continuing operations
|
$ | (0.39 | ) | $ | (0.47 | ) | $ | (0.69 | ) | $ | (0.46 | ) | $ | — | ||||||
|
Income (loss) from discontinued operations
|
0.00 | 0.16 | 0.28 | (0.01 | ) | (0.19 | ) | |||||||||||||
|
Diluted net loss per share
|
$ | (0.39 | ) | $ | (0.31 | ) | $ | (0.41 | ) | $ | (0.47 | ) | $ | (0.19 | ) | |||||
|
Shares used in computing basic net loss per share
|
46,818 | 46,378 | 46,098 | 45,610 | 44,113 | |||||||||||||||
|
Shares used in computing diluted net loss per share
|
46,818 | 46,378 | 46,098 | 45,610 | 44,113 | |||||||||||||||
|
December 31,
|
||||||||||||||||||||
|
2010
|
2009
|
2008
|
2007
|
2006
|
||||||||||||||||
|
(in thousands)
|
||||||||||||||||||||
|
Consolidated Balance Sheet Data:
|
||||||||||||||||||||
|
Cash, cash equivalents and investments
|
$ | 74,235 | $ | 83,479 | $ | 87,856 | $ | 112,940 | $ | 119,891 | ||||||||||
|
Auction-rate security put option
|
— | 1,289 | 7,148 | — | — | |||||||||||||||
|
Working capital
|
71,385 | 81,151 | 68,429 | 109,280 | 118,238 | |||||||||||||||
|
Total assets
|
93,739 | 101,959 | 123,586 | 138,458 | 152,605 | |||||||||||||||
|
Long-term obligations
|
749 | 992 | 2,453 | 1,318 | 411 | |||||||||||||||
|
Accumulated deficit
|
(142,309 | ) | (124,242 | ) | (109,665 | ) | (90,559 | ) | (69,190 | ) | ||||||||||
|
Total stockholders’ equity
|
86,057 | 96,352 | 105,446 | 120,862 | 132,503 | |||||||||||||||
|
ITEM 7.
|
MANAGEMENT’S DISCUSSION AND ANALYSIS OF FINANCIAL CONDITION AND RESULTS OF OPERATIONS.
|
The following discussion of our financial condition and results of operations should be read in conjunction with our consolidated financial statements and the related notes included elsewhere in this Form 10-K. The following discussion includes forward-looking statements. Please see the section entitled “Forward-Looking Statements and Risk Factors” in Item 1A of this Report for important information to consider when evaluating these statements.
Overview
Support.com is a leading independent provider of online care for the digital home and small business.
Our technology services and software products help install, set up, connect, secure, repair and optimize personal computers (PCs), tablets, printers, routers, home gateways, smart phones, gaming devices, digital cameras, music players and other devices that are essential to our customers’ digital lives. We offer one-time and subscription services, and licenses of our software products.
Our Personal Technology Experts® generally deliver our services to customers online and by telephone, leveraging our patented market-leading proprietary technology platform. They generally work from their homes rather than in brick and mortar facilities. Our software products include award-winning tools designed to address some of the most common technology device problem areas, including Windows registry errors, hard disk management and computer memory optimization.
We market our services through channel partners and directly to consumers. Our channel partners include leading retail, internet service provider, software and PC/consumer electronics (CE) brands. We market our software products directly and through channel partners using “free trial” versions to encourage customers to experience the products before buying. Our sales and marketing efforts principally target North American consumers and small businesses.
Support.com was founded in 1997 under the name SupportSoft, Inc. as an enterprise software provider focused on technical support organizations. In 2007 we launched our consumer services business, and in 2008 began reporting two operating segments, Enterprise and Consumer. We used this segment reporting structure for all of our publicly filed financial statements beginning January 1, 2008. In June 2009 we sold our Enterprise business, changed our name to Support.com, Inc. and focused our efforts purely on the consumer and small business market. We added the Sammsoft family of software products to our Consumer business in December 2009 through our acquisition of substantially all of the assets of Xeriton, Inc.
As a result of the sale of the Enterprise business, our audited consolidated financial statements, accompanying notes and other information provided in this Form 10-K reflect the Enterprise business as a discontinued operation for all periods presented. After reclassifying the Enterprise business to discontinued operations, our continuing operations consist solely of our remaining segment, the Consumer business, which includes our online support services as well as our consumer software products.
In 2010, we grew and diversified revenue, improved service efficiency, demonstrated technology innovation, and expanded our product offerings. Our revenue growth of 153% over the prior-year was driven by expansion of existing programs as well as the addition of new diversified channel partners in verticals beyond retail. Our service efficiency, measured in average handle time for our largest programs, improved as a result of our ongoing investments in service delivery technology and process. Our technology innovation included extension of our workflow management system capabilities, enhancement of the diagnosis and repair capabilities contained in our agent toolkit, and deepening of the functionality of the desktop client used by our subscription customers. Our expanded products included new services and software, such as support for non-PC and mobile platforms and data backup offerings.
Our key initiatives for 2011 include growing channel revenue by augmenting established programs, executing roll-outs of recently announced programs, and winning new programs; expanding our direct business by introducing new software products and leveraging synergies between software and services; increasing the breadth of our offerings with mobile device and small business services; and achieving gross margin targets through technology enablement and process improvements.
We intend the following discussion of our financial condition and results of operations to provide information that will assist in understanding our financial statements, the changes in certain key items in those financial statements from year to year, and the primary factors that accounted for those changes, as well as how certain accounting principles, policies and estimates affect our financial statements.
Critical Accounting Policies and Estimates
In preparing our consolidated financial statements in conformity with accounting principles generally accepted in the United States, we make assumptions, judgments and estimates that can have a significant impact on our net revenue, and operating results, as well as on the value of certain assets and liabilities on our consolidated balance sheet. We base our assumptions, judgments and estimates on historical experience and various other factors that we believe to be reasonable under the circumstances. Actual results could differ materially from these estimates under different assumptions or conditions. On a regular basis we evaluate our assumptions, judgments and estimates and make changes accordingly. We believe that the assumptions, judgments and estimates involved in the accounting for revenue recognition, fair value measurements, fair value estimates – auction rate securities (“ARS”) put option, business combinations – purchase accounting, accounting for goodwill and other intangible assets, stock-based compensation and accounting for income taxes have the greatest potential impact on our consolidated financial statements, so we consider these to be our critical accounting policies. We discuss below the critical accounting estimates associated with these policies. For further information on the critical accounting policies, see Note 1 of our Notes to Consolidated Financial Statements.
Revenue Recognition
Our revenue recognition policy is one of our critical accounting policies because revenue is a key component of our results of operations and revenue recognition is based on complex rules which require us to make judgments. In applying our revenue recognition policy we must determine whether revenue is to be recognized on a gross or net basis in accordance with the provisions of ASC 605, Revenue Recognition, which portions of our revenue are to be recognized in the current period, and which portions must be deferred and recognized in subsequent periods. We also recognize services breakage on non-subscription deferred revenue balances, and we use judgment in evaluating the historical redemption patterns used to estimate services breakage. We do not record revenue on sales transactions when the collection of cash is in doubt at the time of sale, and we use management judgment in determining collectability. From time to time, we may enter into agreements which involve us making payments to our channel partners. We use judgment in evaluating the treatment of such payments and in determining which portions of the consideration paid to customers should be recorded as contra-revenue and which should be recorded as an expense. We generally provide a refund period on services and software, and we employ judgment in determining whether a customer is eligible for a refund based on that customer’s specific facts and circumstances. If our estimates and judgments on any of the foregoing are incorrect, our revenue for one or more periods may be incorrectly recorded. Please see Note 1 in Notes to Consolidated Financial Statements for further discussion of our revenue recognition policies.
Fair Value Measurements
ASC 820, Fair Value Measurements and Disclosures defines fair value, establishes a framework for measuring fair value under generally accepted accounting principles and enhances disclosures about fair value measurements. Fair value is defined as the exchange price that would be received for an asset or paid to transfer a liability in the principal or most advantageous market for the asset or liability in an orderly transaction between market participants on the measurement date. Valuation techniques used to measure fair value must maximize the use of observable inputs and minimize the use of unobservable inputs. The standard describes a fair value hierarchy based on three levels of inputs, of which the first two are considered observable and the last unobservable, that may be used to measure fair value, which are the following:
|
|
•
|
Level 1 - Quoted prices in active markets for identical assets or liabilities. Therefore, determining fair value for Level 1 instruments generally does not require significant management judgment, and the estimation is not difficult.
|
|
|
•
|
Level 2 - Inputs other than Level 1 that are observable, either directly or indirectly, such as quoted prices for similar assets or liabilities; quoted prices in markets that are not active; or other inputs that are observable or can be corroborated by observable market data for substantially the full term of the assets or liabilities.
|
|
|
•
|
Level 3 - Unobservable inputs that are supported by little or no market activity and that are significant to the fair value of the assets or liabilities. The determination of fair value for Level 3 instruments requires the most management judgment and subjectivity.
|
Our Level 2 securities are priced using quoted market prices for similar instruments, nonbinding market prices that are corroborated by observable market data, or discounted cash flow techniques. There have been no transfers between Level 1 and Level 2 measurements during the year of 2010.
Our Level 3 assets consist of ARS with various state student loan authorities, and an ARS put option with UBS (as described below). Beginning February 2008, all auctions for the ARS have failed. Based on the continued failure of these auctions and the underlying maturities of the securities, we continue to classify our non-UBS holdings as long-term assets. On June 30, 2010, we exercised our rights under the Rights Agreement with UBS and we sold the underlying investments for cash on June 30, 2010 and July 1, 2010. The fair value of our ARS holdings was estimated by management using assumptions regarding market volatility and discount rates. If any of these estimates change, the value of Level 3 assets could change in future periods.
Fair Value Estimates-ARS Put Option
In November 2008, we signed a Rights Agreement with UBS concerning the disposition of its ARS. The UBS agreement gave us the right to sell our ARS holdings back to UBS, at par value, beginning June 30, 2010 through July 2, 2012. On June 30, 2010, we exercised our rights under the Rights Agreement with UBS. This right represented a freestanding financial instrument for accounting purposes. We elected to value this put option at fair value. We recognized the value of the repurchase right as an asset with corresponding gain/loss recorded in earnings. Fair value was determined using a “with and without” approach, based on a discounted cash flow valuation comparing the value of the auction rate securities with the put option and without it. We took into account the same factors as those used to value the auction rate securities noted above. The value of the rights offer was recorded in interest income (expense), net on our consolidated statement of operations.
We previously made certain estimates in calculating the fair value of the ARS put option for our UBS securities, including estimates for the weighted average remaining term (WART) of the underlying securities in which actual WART from servicing reports was unavailable, the expected return, and the discount rate. Since our rights under the Rights Agreement were exercised on June 30, 2010, the value of the ARS Put Option was written down to zero as of June 30, 2010.
Business Combinations – Purchase Accounting
Under the purchase method of accounting, we allocate the purchase price of acquired companies to the tangible and intangible assets acquired and liabilities assumed based on their estimated fair values. We record the excess of purchase price over the aggregate fair values as goodwill. We engage third-party appraisal firms to assist us in determining the fair values of assets acquired and liabilities assumed. These valuations require us to make significant estimates and assumptions, especially with respect to intangible assets. Such estimates include assumptions regarding future revenue streams, market performance, customer base, and various vendor relationships. We estimate the economic lives of certain acquired assets and these lives are used to calculate depreciation and amortization expenses. We estimate the future cash flows to be derived from such assets, and these estimates are used to determine the fair value of the assets. If any of these estimates change, depreciation or amortization expenses could be accelerated and the value of our intangible assets could be impaired.
Accounting for Goodwill and Other Intangible Assets
We assess the impairment of goodwill annually or more often if events or changes in circumstances indicate that the carrying value may not be recoverable. Consistent with our determination that we have only one reporting segment, we have determined that there is only one reporting unit and goodwill is evaluated for impairment at the entity level. We test goodwill using the two-step process required by ASC 350, Intangibles – Goodwill and Other. In the first step, we compare the carrying amount of the reporting unit to the fair value based on quoted market prices of our common stock. If the carrying value of the reporting unit exceeds the fair value, goodwill is potentially impaired and the second step of the impairment test must be performed. In the second step, if such comparison reflects potential impairment, we would compare the implied fair value of the goodwill, as defined by ASC 350, to its carrying amount to determine the amounts of impairment loss, if any. We performed our annual goodwill impairment tests September 30, 2010, 2009, and 2008 and concluded that there was no impairment.
We assess the impairment of identifiable intangible assets whenever events or changes in circumstances indicate that the carrying amount may not be recoverable. An impairment loss would be recognized when the sum of the future net cash flows expected to result from the use of the asset and its eventual disposition is less than its carrying amount. If our estimates regarding future cash flows derived from such assets were to change, we may record an impairment to the value of these assets. Such impairment loss would be measured as the difference between the carrying amount of the asset and its fair value.
Stock-Based Compensation
We account for stock-based compensation in accordance with the provisions of ASC 718, Compensation – Stock Compensation. Under the fair value recognition provisions of ASC 718, stock-based compensation cost is estimated at the grant date based on the fair value of the award and is recognized as expense ratably over the requisite service period of the award. We estimate the fair value of stock-based awards on the grant date using the Black-Scholes-Merton option-pricing model. Determining the appropriate fair value model and calculating the fair value of stock-based awards requires judgment, including estimating stock price volatility, forfeiture rates and expected life. If any of these assumptions used in the option-pricing models change, our stock-based compensation expense could change on our consolidated financial statements.
Accounting for Income Taxes
We are required to estimate our income taxes in each of the tax jurisdictions in which we operate. This process involves management’s estimation of our current tax exposures together with an assessment of temporary differences determined based on the difference between the financial statement and tax basis of certain items. These differences result in net deferred tax assets and liabilities, which are included in our consolidated balance sheet. We must assess the likelihood that we will be able to recover our deferred tax assets. If recovery is not likely, we must increase our provision for taxes by recording a valuation allowance against the deferred tax assets that we estimate will not ultimately be recoverable. We currently have provided a full valuation allowance on our U.S deferred tax assets and a full valuation allowance on certain foreign deferred tax assets. If any of our estimates change, we may change the likelihood of recovery and our tax expense as well as the value of our deferred tax assets would change.
Our income tax calculations are based on application of the respective U.S. federal, state or foreign tax law. Support.com’s tax filings, however, are subject to audit by the respective tax authorities. Accordingly, we recognize tax liabilities based upon our estimate of whether, and the extent to which, additional taxes will be due when such estimates are more-likely-than-not to be sustained. An uncertain income tax position will not be recognized if it has less than a 50% likelihood of being sustained. To the extent the final tax liabilities are different than the amounts originally accrued, the increases or decreases are recorded as income tax expense or benefit in the consolidated statements of operations.
Results of Operations
The following table presents certain Consolidated Statements of Operations data for the periods indicated as a percentage of total revenue:
|
Years Ended December 31,
|
||||||||||||
|
2010
|
2009
|
2008
|
||||||||||
|
Revenue:
|
||||||||||||
|
Services
|
73 | % | 96 | % | 95 | % | ||||||
|
Software and other
|
27 | 4 | 5 | |||||||||
|
Total revenue
|
100 | 100 | 100 | |||||||||
|
Cost of revenue:
|
||||||||||||
|
Cost of services
|
61 | 95 | 151 | |||||||||
|
Cost of software and other
|
3 | — | — | |||||||||
|
Total cost of revenue
|
64 | 95 | 151 | |||||||||
|
Gross profit (loss)
|
36 | 5 | (51 | ) | ||||||||
|
Operating expenses:
|
||||||||||||
|
Research and development
|
12 | 33 | 103 | |||||||||
|
Sales and marketing
|
41 | 44 | 133 | |||||||||
|
General and administrative
|
24 | 81 | 214 | |||||||||
|
Amortization of intangible assets
|
1 | 1 | 2 | |||||||||
|
Total operating expenses
|
78 | 159 | 452 | |||||||||
|
Loss from operations
|
(42 | ) | (154 | ) | (503 | ) | ||||||
|
Interest income and other, net
|
1 | 2 | 37 | |||||||||
|
Loss from continuing operations, before income taxes
|
(41 | ) | (152 | ) | (466 | ) | ||||||
|
Income taxes (benefit)
|
0 | (28 | ) | — | ||||||||
|
Loss from continuing operations, after income taxes
|
(41 | ) | (124 | ) | (466 | ) | ||||||
|
Income from discontinued operations, after income taxes
|
0 | 40 | 185 | |||||||||
|
Net loss
|
(41 | )% | (84 | )% | (281 | )% | ||||||
Years Ended December 31, 2010, 2009, and 2008
Revenue
|
($ in thousands)
|
2010
|
% Change
2009 to 2010
|
2009
|
% Change
2008 to 2009
|
2008
|
|||||||||||||||
|
Services
|
$ | 32,276 | 92 | % | $ | 16,770 | 159 | % | $ | 6,468 | ||||||||||
|
Software and other
|
11,901 | 1,542 | % | 725 | 111 | % | 343 | |||||||||||||
|
Total revenue
|
$ | 44,177 | 153 | % | $ | 17,495 | 157 | % | $ | 6,811 | ||||||||||
Services revenue consists primarily of fees for technology services provided either through our channel partners or directly via our website www.support.com. Service revenue was $32.3 million for the year ended December 31, 2010 compared to $16.8 million for the same period of 2009. The increase was primarily driven by growth in certain channel partnerships. Services revenue was $16.8 million for the year ended December 31, 2009 compared to $6.5 million for the year ended December 31, 2008. The significant increase in revenue in 2009 over 2008 reflects increased demand for our services from our channel partners. We expect services revenue to continue to grow in 2011 as a result of expansion of recently-signed programs, addition of new services to established programs, development of new partnerships with additional channel partners, and growth of our direct business.
Software and other revenue was comprised primarily of fees for software products provided through direct customer downloads and, to a lesser extent, through the sale of this software via channel partners. Software and other revenue was $11.9 million for the year ended December 31, 2010, $725,000 for the year ended December 31, 2009 and $343,000 for the year ended December 31, 2008. The year-over-year growth in software and other revenue from 2009 to 2010 reflects full-year results of selling the products acquired in our purchase of substantially all of the assets of Xeriton, Inc. in December of 2009 and increases on the sales of such products under our ownership relative to their run rate when acquired. The year-over-year growth in software and other revenue from 2009 to 2008 reflects one month of selling the acquired products in 2009. We expect our software and other revenue to continue to grow in 2011 as we release new products into the marketplace and continue leveraging our software products with service channel partners.
Revenue Mix
The components of revenue by type, expressed as a percentage of total revenue were:
|
Year Ended
December 31,
|
||||||||||||
|
2010
|
2009
|
2008
|
||||||||||
|
Services
|
73 | % | 96 | % | 95 | % | ||||||
|
Software and other
|
27 | 4 | 5 | |||||||||
|
Total revenue
|
100 | % | 100 | % | 100 | % | ||||||
We expect that services revenue will continue to comprise a majority of our total revenue but that software and other revenue will represent a material percentage of our total revenue over the next year.
For the year ended December 31, 2010, Customer A and Customer B accounted for 43% and 17% of our total revenue, respectively. No other customers accounted for 10% or more of total revenue. For the years ended December 31, 2009 and 2008, one customer, Customer A, accounted for 82% and 81% of our total revenue, respectively. No other customers accounted for 10% or more of our total revenue in either of these years. The percentage of revenue attributable to Customer A has decreased year-over-year as expected as we have expanded our service partnerships and grown our software business. Revenue from customers outside the United States accounted for approximately 1%, 2% and 8% of our total revenue in 2010, 2009 and 2008, respectively.
Cost of Revenue
|
($ in thousands)
|
2010
|
% Change
2009 to 2010
|
2009
|
% Change
2008 to 2009
|
2008
|
|||||||||||||||
|
Cost of services
|
$ | 26,737 | 61 | % | $ | 16,620 | 61 | % | $ | 10,307 | ||||||||||
|
Cost of software and other
|
1,358 | 2,202 | % | 59 | 100 | % | — | |||||||||||||
|
Total cost of revenues
|
$ | 28,095 | 68 | % | $ | 16,679 | 62 | % | $ | 10,307 | ||||||||||
Cost of services. Cost of services consists primarily of salary and related expenses for our Personal Technology Experts, technology and telecommunication expenses related to the delivery of services and other employee-related expenses for our service delivery organization. The increase in 2010 as compared to 2009 was due to increases in salary and related overhead expense as a result of growing our workforce of Personal Technology Experts, as well as a corresponding increase in direct technology costs to support this growing workforce. The increase in 2009 as compared to 2008 reflects the increase in salary and related overhead expense as a result of growing our workforce of Personal Technology Experts in anticipation of increased demand for services for our growing partner programs. In 2011, we expect cost of services to continue to increase as we add Personal Technology Experts to support higher anticipated service volumes, but we are seeking to drive increased efficiencies through technology in order to produce improved gross margins over time.
Cost of software and other. Cost of software and other fees consists primarily of third-party royalty fees for the software products we acquired in December 2009. Certain of these products were developed using third-party research and development resources. This third party receives royalty payments sales of products it developed. The significant increase for 2010 as compared to 2009 was primarily driven by an increase in royalty payments as a result of a full year of product sales for our software products. The increase in cost of software for 2009 compared to 2008 is likewise explained by the acquisition of our consumer software products in December 2009, and the initiation of royalty obligations in that month. No such third-party royalty arrangements existed for software products in 2008. In 2011, we expect cost of software and other to continue to increase as we grow our software revenue.
Operating expenses
|
($ in thousands)
|
2010
|
% Change
2009 to 2010
|
2009
|
% Change
2008 to 2009
|
2008
|
|||||||||||||||
|
Research and development
|
$ | 5,214 | (10 | )% | $ | 5,795 | (17 | )% | $ | 6,994 | ||||||||||
|
Sales and marketing
|
18,091 | 136 | % | 7,675 | (15 | )% | 9,073 | |||||||||||||
|
General and administrative
|
10,963 | (22 | )% | 14,119 | (3 | )% | 14,559 | |||||||||||||
|
Total operating expenses
|
$ | 34,268 | 24 | % | $ | 27,589 | (10 | )% | $ | 30,626 | ||||||||||
Research and development. Research and development expense consists primarily of compensation costs, third-party consulting expenses and related overhead costs for research and development personnel. Research and development costs are expensed as incurred. The year-over-year decrease for 2010, 2009 and 2008 resulted from lower salary and related expenses due to fewer research and development personnel and lower office expenses primarily due to lower facility costs for an office outside the United States. In 2011, we expect research and development spending to increase modestly as we continue our investment in our technology tools and platform.
Sales and marketing. Sales and marketing expense consists primarily of compensation costs, including salaries and sales commissions, business development and marketing personnel expenses for lead generation activities and promotional expenses, including public relations, advertising and marketing events. The significant increase for 2010 as compared to 2009 resulted primarily from higher marketing expense to drive sales of software acquired in 2009 and to a lesser extent from increased sales and marketing personnel staffing and related costs. The decrease for 2009 as compared to 2008 resulted primarily from lower salary and related expenses due to lower headcount, as well as lower advertising expense, partially offset by increase in channel partner referral fees. In 2011, we expect an increase in sales and marketing costs due to increased marketing activities associated with our software business and our direct services business, as well as increased headcount in sales, marketing and account management.
General and administrative. General and administrative expense consists primarily of compensation costs and related overhead costs for administrative personnel and professional fees for legal, accounting and other professional services. The decrease for 2010 as compared to 2009 resulted primarily from a full year of lower salary and related expense due to fewer personnel following the sale of our Enterprise business, as well as lower facilities and professional services costs. The decrease for 2009 as compared to 2008 resulted primarily from lower salary and related expenses due to lower headcount, lower depreciation expenses as a result of less equipment needed for a smaller workforce and lower office costs following the sale of our Enterprise business, off-set by facility impairment charges. In 2011, we expect general and administrative spending to increase modestly in order to support our growing business.
Restructuring and impairment charges. Restructuring and impairment charges consist of charges related to reductions in our work force and related facilities costs. There were no restructuring and impairment charges recorded in 2010. For the year ended December 31, 2009, we recorded restructuring charges of $1.7 million including $62,000 for cost of service, $196,000 for research and development, $295,000 for sales and marketing and $1.1 million for general and administrative. Restructuring expenses were $1.2 million in 2008 including $43,000 for cost of service, $89,000 for research and development, $538,000 for sales and marketing and $525,000 for general and administrative. We expect to pay the remaining balance of $661,000 through 2012. The details of our restructuring charges are presented in Note 7 to the Consolidated Financial Statements.
Amortization of intangible assets
|
($ in thousands)
|
2010
|
% Change
2009 to 2010
|
2009
|
% Change
2008 to 2009
|
2008
|
|||||||||||||||
|
Amortization of intangible assets
|
$ | 364 | 106 | % | $ | 177 | 58 | % | $ | 112 | ||||||||||
Amortization of intangible assets. Amortization of intangible assets in 2010, 2009 and 2008 was $364,000, 177,000 and $112,000, respectively. The increase in amortization of intangible assets in 2010 was due to the full-year amortization of intangible assets acquired from YTO, as well as the acquisition of substantially all of the assets of Xeriton, Inc. in December 2009.
Interest income and other, net
|
($ in thousands)
|
2010
|
% Change
2009 to 2010
|
2009
|
% Change
2008 to 2009
|
2008
|
|||||||||||||||
|
Interest income and other, net
|
$ | 540 | 26 | % | $ | 428 | (83 | )% | $ | 2,506 | ||||||||||
Interest income and other, net. Interest and other income consist primarily of interest income on our cash, cash equivalents and investments. The increase in interest income and other, net in 2010 as compared to 2009 was a result of realized foreign currency losses of $189,000 related to the Enterprise business in the first quarter of 2009 that did not recur in 2010. The significant decrease in interest income and other, net from 2008 to 2009, resulted primarily from lower interest rates, lower average investment balances and lower interest income on our marketable securities as we shifted more of our investments into relatively safer but lower-yielding money market instruments in order to reduce our credit risk. For the years ended December 31, 2010, 2009 and 2008, the change in value of our ARS put option fully offset the change in value of our UBS ARS.
Provision for income taxes
|
($ in thousands)
|
2010
|
2009
|
2008
|
|||||||||
|
Provision (benefit) for income taxes
|
$ | 88 | $ | (4,941 | ) | $ | (18 | ) | ||||
Provision for income taxes. Income tax amounts represent taxes related to the gain on the sale of our Enterprise business and state income taxes. Generally, the amount of tax expense or benefit allocated to continuing operations is determined without regard to the tax effects of other categories of income or loss, such as income from discontinued operations. However, an exception is provided in ASC 740 when there is a pre-tax loss from continuing operations and pre-tax income from other categories in the current year. As a result, the Company recorded a tax expense of $58,000 in continuing operations related to the gain on sale of the Enterprise business, and recorded an off-setting tax benefit of $58,000 in discontinued operations during the current year. For period ending December 31, 2009, the income tax benefit of $4.9 million was primarily comprised of the utilization of continuing operations tax attributes arising from the offset by the tax on the gain on sale from discontinued operations. The income tax benefit of $18,000 for period ending December 31, 2008 was related to the federal refundable research and development tax credit.
As a result of the sale of our Enterprise business (see Note 2 to the Consolidated Financial Statements), we are reporting all historical financial activity for that segment – including revenues, direct expenses, gain on sale of discontinued operations, and the tax impact of the gain on the sale and the related tax impact of discontinued operations – as discontinued operations. For details on the tax impact on our discontinued operations, see Note 2. For details on the tax impact on our continuing operations, see Note 9.
Liquidity and Capital Resources
Total cash, cash equivalents, investments and the auction-rate securities put option at December 31, 2010 and 2009 were $74.2 million and $84.8 million, respectively. In 2010, our main sources of liquidity consisted of cash from customers and proceeds from issuances of common stock upon the exercise of stock options. The decrease in cash, cash equivalents and investments in fiscal year 2010 was primarily due to $13.4 million of cash used in operating activities, purchase of investments of $65.5 million offset with investment sales and maturities of $69.8 million, and proceeds from issuances of common stock of $4.5 million.
Operating Activities
Net cash used in operating activities was $13.4 million for the year ended December 31, 2010, $24.0 million for the year ended December 31, 2009, and $12.3 million for the year ended December 31, 2008. Amounts included in net loss, which do not require the use of cash, primarily include stock-based compensation expenses, realized gain/loss on our ARS and corresponding gain/loss on the ARS put option. The sum of these items totaled $5.2 million, $5.2 million, and $6.2 million in 2010, 2009 and 2008, respectively. Net cash used in operating activities during 2010 was the result of the net loss of $18.1 million, a reduction in accounts receivable, net of $1.9 million, partially offset by non-cash items of $5.2 million. Net cash used in operating activities during 2009 was the result of the net loss of $14.6 million, a reduction in other accrued liabilities of $10.0 million, a reduction in deferred revenue for discontinued operations of $1.1 million and a gain on the sale of the Enterprise business of $4.2 million, partially offset by non-cash items of $5.2 million. Net cash used in operating activities during 2008 was primarily the result of the net loss of $19.1 million, an increase in accounts receivable of $252,000, a gain on the ARS put option of $7.1 million primarily offset by a corresponding loss on our ARS of $7.2 million and a decrease in deferred revenue of $454,000.
Investing Activities
Net cash provided by (used in) investing activities was $3.8 million for the year ended December 31, 2010, $(17.3) million for the year ended December 31, 2009, and $63.4 million for the year ended December 31, 2008. Net cash provided by investing activities in 2010 was primarily due to sales and maturities of $69.8 million in marketable securities offset by the purchase of $65.5 million in marketable securities and $498,000 in property and equipment purchases. The amount of net cash used in investing activities for the year ended December 31, 2009 resulted primarily from the net proceeds we received from the sale of the Enterprise business of $20.5 million and sales and maturities of $15.7 million in marketable securities offset by the purchase of $44.9 million in marketable securities, and $7.9 million used for the acquisition of substantially all of the assets of Xeriton, Inc. and expenditures of $584,000 for property and equipment and developed technology. Net cash provided by investing activities in 2008 was primarily due to sales and maturities of $109.4 million of marketable securities largely offset by the purchase of $41.3 million of marketable securities, the purchase of $1.4 million of technology, $2.8 million used for the acquisition of YourTechOnline, Inc. and expenditures of $566,000 for property and equipment.
Financing Activities
Net cash generated by financing activities was $4.5 million for the year ended December 31, 2010, $485,000 for the year ended December 31, 2009, and $381,000 for the year ended December 31, 2008. In 2010, cash generated by financing activities was primarily attributable to the exercise of employee stock options. In 2009 and 2008, cash generated by financing activities was primarily attributable to the exercise of employee stock options and the purchase of common stock under the employee stock purchase plan.
Working Capital and Capital Expenditure Requirements
At December 31, 2010, we had stockholders’ equity of $86.1 million and working capital of $71.4 million. We believe that our existing cash balances will be sufficient to meet our working capital requirements for at least the next 12 months. In 2011, we expect our capital expenditures to remain relatively consistent with 2010.
If we require additional capital resources to grow our business internally or to acquire complementary technologies and businesses at any time in the future, we may seek to sell additional equity or debt securities. The sale of additional equity could result in more dilution to our stockholders.
We plan to continue to make investments in our business during 2011. We believe these investments are essential to creating sustainable growth in our business in the future. Because these investments will likely precede any associated revenues, we expect our working capital to decrease in the near term. Additionally, we may choose to acquire other businesses or complimentary technologies to enhance our product capabilities and such acquisitions would likely require the use of cash.
Contractual Obligations
The following summarizes our contractual obligations at December 31, 2010 and the effect these contractual obligations are expected to have on our liquidity and cash flows in future periods (in thousands).
|
Payments Due By Period
|
||||||||||||||||
|
Total
|
1 Year
or Less
|
1 - 3
Years
|
After
3 Years
|
|||||||||||||
|
Operating leases
|
$ | 1,606 | $ | 1,049 | $ | 557 | $ | - | ||||||||
These obligations are for noncancelable operating leases including our headquarters office and offices to carry out sales, marketing and research and development, and services operations globally. These obligations also include the Company’s outstanding liabilities for payment of leases for facilities that have been impaired.
Due to the uncertainty with respect to the timing of future cash flows associated with our unrecognized tax benefits at December 31, 2010, we are unable to make reasonably reliable estimates of the period of cash settlement with the respective taxing authority. Therefore, $0.8 million of unrecognized tax benefits have been excluded from the contractual obligations table. See Note 9 to the Consolidated Financial Statements for a discussion on income taxes.
Off-Balance Sheet Arrangements
At December 31, 2010, we did not have any significant off-balance sheet arrangements, as defined in Item 303(a)(4)(ii) of Regulation S-K.
Recent Accounting Pronouncements
In September 2009, the FASB issued Accounting Standards Update No. 2009-13, “Multiple-Deliverable Revenue Arrangements—a consensus of the FASB Emerging Issues Task Force” (ASU 2009-13) which updates the existing multiple-element revenue arrangements guidance currently included under ASC 605, which originated primarily from the guidance in EITF Issue No. 00-21, “Revenue Arrangements with Multiple Deliverables” (EITF 00-21). The revised guidance primarily makes two significant changes: (1) it eliminates the need for objective and reliable evidence of the fair value for the undelivered element in order for a delivered item to be treated as a separate unit of accounting, and (2) it eliminates the residual method to allocate the arrangement consideration. In addition, the guidance also expands the disclosure requirements for revenue recognition. ASU 2009-13 will be effective for us as of January 1, 2011. This update has no significant impact on our financial position.
In January 2010 the FASB issued ASU No. 2010-06, “Fair Value Measurements and Disclosures (Topic 820) — Improving Disclosures about Fair Value Measurements.” This update amends the disclosure requirements about fair value measurements in ASC Topic 820, “Fair Value Measurements and Disclosures.” ASU 2010-06 requires more robust disclosures about the different classes of assets and liabilities measured at fair value, the valuation techniques and inputs used, the activity in Level 3 fair value measurements, and the transfers between Levels 1, 2, and 3. ASU 2010-06 is effective for interim and annual reporting periods beginning after December 15, 2009. This update has had no significant impact on our financial position, results of operations or cash flows.
|
ITEM 7A.
|
Interest Rate and Market Risk
There has been significant deterioration and instability in the financial markets since 2008. This extraordinary disruption and readjustment in the financial markets exposes us to additional investment risk. The value and liquidity of the securities in which we invest could deteriorate rapidly and the issuers of such securities could be subject to credit rating downgrades. In light of the current market conditions and these additional risks, we actively monitor market conditions and developments specific to the securities and security classes in which we invest. While we believe we take prudent measures to mitigate investment related risks, such risks cannot be fully eliminated, as there are circumstances outside of our control.
The primary objective of our investment activities is to preserve principal while at the same time maximizing the income we receive from our investments without significantly increasing risk. To achieve this objective, we invest our excess cash in a variety of securities, including U.S government agency securities, corporate notes and bonds, commercial paper, money market funds meeting certain criteria, and ARS. These securities are classified as available-for-sale. Consequently, our available-for-sale securities are recorded on the balance sheet at fair value with unrealized gains or losses reported as a separate component of accumulated other comprehensive income (loss). Our holdings of the securities of any one issuer, except government agencies, do not exceed 10% of our portfolio. We do not utilize derivative financial instruments to manage our interest rate risks.
As of December 31, 2010 and December 31, 2009, we held $55.7 million and $59.9 million in investments (excluding cash and cash equivalents), which consisted primarily of government debt securities, corporate notes and bonds, commercial paper, and ARS. The weighted average interest rate, including the impact of amortization/accretion of discounts of our portfolio was approximately 0.64% at December 31, 2010 and 2.46% at December 31, 2009. A decline in interest rates over time would reduce our interest income from our investments. A decrease in interest rates of 100 basis points would cause a corresponding decrease in our annual interest income of approximately $557,000.
At December 31, 2010 and December 31, 2009 we had investments in AAA-rated ARS with various state student loan authorities with estimated fair values of $2.7 million and $22.7 million, respectively. The student loans made by these authorities are substantially guaranteed by the federal government through the Federal Family Education Loan Program (FFELP). ARS are long-term floating rate bonds tied to short-term interest rates. After the initial issuance of the securities, the interest rate on the securities is reset periodically, at intervals established at the time of issuance (e.g., every seven days, twenty-eight days, thirty-five days, or every six months), based on market demand, if the auctions are successful. ARS are bought and sold in the marketplace through a competitive bidding process often referred to as a “Dutch auction.” If there is insufficient interest in the securities at the time of an auction, the auction may not be completed and the ARS then pays a default interest rate. Following such a failed auction, we cannot access our funds that are invested in the corresponding ARS until a future auction of these investments is successful, new buyers express interest in purchasing these securities in between reset dates, issuers establish a different form of financing to replace these securities or final payments become due according to contractual maturities. Commencing in February 2008, conditions in the global credit markets resulted in failed auctions for all of the ARS we held. In October 2008, UBS extended an offer to us to sell our eligible ARS at par value back to UBS beginning June 30, 2010 through July 2, 2012. On June 30, 2010, we exercised our rights under the Rights Agreement with UBS. Of the $20.2 million at par we held immediately prior to exercising the put, $11.1 million was settled on June 30, 2010 and the remaining $9.1 million was settled on July 1, 2010. In the near term, our ability to liquidate our remaining investments in ARS or fully recover the carrying values may be limited or not exist.
The fair value of our remaining $2.7 million of ARS, classified as available-for-sale, was based on a discounted cash flow valuation that takes into account a number of factors including the WART of the underlying securities, the expected return, and the discount rate. The actual WART from servicing reports was used where available. For securities where the actual WART was not available an estimate based on other securities held was used. The expected return was calculated based on the last twelve months average for the 91 day U.S. treasury bill plus a spread. This rate is the typical default rate for ARS held by us. The discount rate was calculated using the 3-month LIBOR rate plus adjustments for the security type. Changes in any of the above estimates, especially the WART or the discount rate, could result in a material change to the fair value. At December 31, 2010, all ARS were classified as Level 3 assets. Presently we have determined the decline in value for the available-for-sale ARS to be temporary because i) we have no current intent to sell the security, and we believe that we will not be required to sell the security before the recovery of its amortized cost due to our large cash reserves; ii) through December 31, 2010 all of the securities have maintained AAA credit ratings; and iii) loans made by the issuers are backed by the federal government. We also conclude that we do not intend to sell an impaired available-for-sale security and will not be required to sell such a security before the recovery of our amortized cost basis due to its large cash reserves.
However, if circumstances change, we may be required to record an other-than-temporary impairment charge on the available-for-sale ARS. We may similarly be required to record other-than-temporary impairment charges if the ratings on any of these securities are reduced or if any of the issuers default on their obligations. In addition to impairment charges, any of these events could cause us to lose part or all of our investment in these securities. As of December 31, 2010, we had investments in ARS with estimated fair values of $2.7 million. Any of these events could materially affect our results of operations and our financial condition. We currently believe these securities are not significantly impaired for the reasons described above; however, it could take until the final maturity of the underlying notes (up to 30 years) to realize our investments’ recorded value.
Impact of Foreign Currency Rate Changes
The functional currencies of our international operating subsidiaries are the local currencies. We translate the assets and liabilities of our foreign subsidiaries at the exchange rates in effect on the balance sheet date. We translate their income and expenses at the average rates of exchange in effect during the period. We include translation gains and losses in the stockholders’ equity section of our balance sheet. We include net gains and losses resulting from foreign exchange transactions in interest income and other in our statements of operations. Since we translate foreign currencies (primarily Canadian dollars, British Pound Sterling, and Indian rupees) into U.S. dollars for financial reporting purposes, currency fluctuations may have a material impact on our financial results. We have both revenue and expenses that are denominated in foreign currencies. Foreign currency expenses are generally larger than foreign currency revenue. A weaker U.S. dollar environment would generally have an immaterial negative impact on our statement of operations, while a stronger U.S. dollar environment would have an immaterial positive impact on our statement of operations. The historical impact of currency fluctuations has generally been immaterial. As of December 31, 2010 we did not engage in foreign currency hedging activities.
|
ITEM 8.
|
SUPPORT.COM, INC.
INDEX TO CONSOLIDATED FINANCIAL STATEMENTS
|
Page
|
|
|
Report of Independent Registered Public Accounting Firm
|
34
|
|
Consolidated Balance Sheets
|
35
|
|
Consolidated Statements of Operations
|
36
|
|
Consolidated Statements of Stockholders’ Equity
|
37
|
|
Consolidated Statements of Cash Flows
|
38
|
|
Notes to Consolidated Financial Statements
|
39
|
REPORT OF INDEPENDENT REGISTERED PUBLIC ACCOUNTING FIRM
The Board of Directors and Stockholders of
Support.com, Inc.
We have audited the accompanying consolidated balance sheets of Support.com, Inc. as of December 31, 2010 and 2009, and the related consolidated statements of operations, stockholders’ equity, and cash flows for each of the three years in the period ended December 31, 2010. These financial statements are the responsibility of the Company’s management. Our responsibility is to express an opinion on these financial statements based on our audits.
We conducted our audits in accordance with the standards of the Public Company Accounting Oversight Board (United States). Those standards require that we plan and perform the audit to obtain reasonable assurance about whether the financial statements are free of material misstatement. An audit includes examining, on a test basis, evidence supporting the amounts and disclosures in the financial statements. An audit also includes assessing the accounting principles used and significant estimates made by management, as well as evaluating the overall financial statement presentation. We believe that our audits provide a reasonable basis for our opinion.
In our opinion, the financial statements referred to above present fairly, in all material respects, the consolidated financial position of Support.com, Inc. at December 31, 2010 and 2009, and the consolidated results of its operations and its cash flows for each of the three years in the period ended December 31, 2010, in conformity with U.S. generally accepted accounting principles.
We also have audited, in accordance with the standards of the Public Company Accounting Oversight Board (United States), Support.com, Inc.’s internal control over financial reporting as of December 31, 2010, based on criteria established in Internal Control—Integrated Framework issued by the Committee of Sponsoring Organizations of the Treadway Commission and our report dated March 11, 2011 expressed an unqualified opinion thereon.
|
/s/ Ernst & Young LLP
|
|
|
Palo Alto, California
March 11, 2011
|
SUPPORT.COM, INC.
CONSOLIDATED BALANCE SHEETS
(in thousands except share and per share data)
|
December 31,
|
||||||||
|
2010
|
2009
|
|||||||
|
ASSETS
|
||||||||
|
Current assets:
|
||||||||
|
Cash and cash equivalents
|
$ | 18,561 | $ | 23,547 | ||||
|
Short-term investments
|
53,007 | 56,488 | ||||||
|
Auction-rate securities put option
|
— | 1,289 | ||||||
|
Accounts receivable, less allowance of $43 and $9 at December 31, 2010 and 2009, respectively
|
5,133 | 3,190 | ||||||
|
Prepaid expenses and other current assets
|
1,617 | 1,252 | ||||||
|
Total current assets
|
78,318 | 85,766 | ||||||
|
Long-term investments
|
2,667 | 3,444 | ||||||
|
Property and equipment, net
|
623 | 447 | ||||||
|
Purchased technology, net
|
226 | 309 | ||||||
|
Goodwill
|
10,181 | 10,171 | ||||||
|
Intangible assets, net
|
1,076 | 1,450 | ||||||
|
Other assets
|
648 | 372 | ||||||
|
Total assets
|
$ | 93,739 | $ | 101,959 | ||||
|
LIABILITIES AND STOCKHOLDERS’ EQUITY
|
||||||||
|
Current liabilities:
|
||||||||
|
Accounts payable
|
$ | 536 | $ | 99 | ||||
|
Accrued compensation
|
1,248 | 745 | ||||||
|
Other accrued liabilities
|
3,575 | 3,045 | ||||||
|
Deferred revenue
|
1,574 | 726 | ||||||
|
Total current liabilities
|
6,933 | 4,615 | ||||||
|
Other long-term liabilities
|
749 | 992 | ||||||
|
Total liabilities
|
7,682 | 5,607 | ||||||
|
Commitments and contingencies
|
||||||||
|
Stockholders’ equity:
|
||||||||
|
Common stock; par value $0.0001, 150,000,000 shares authorized; 48,142,145 issued and outstanding at December 31, 2010 and 46,460,554 issued and outstanding at December 31, 2009
|
5 | 5 | ||||||
|
Additional paid-in capital
|
229,692 | 221,822 | ||||||
|
Accumulated other comprehensive loss
|
(1,331 | ) | (1,233 | ) | ||||
|
Accumulated deficit
|
(142,309 | ) | (124,242 | ) | ||||
|
Total stockholders’ equity
|
86,057 | 96,352 | ||||||
|
Total liabilities and stockholders’ equity
|
$ | 93,739 | $ | 101,959 | ||||
See accompanying notes.
SUPPORT.COM, INC.
CONSOLIDATED STATEMENTS OF OPERATIONS
(in thousands except per share data)
|
Year Ended December 31,
|
||||||||||||
|
2010
|
2009
|
2008
|
||||||||||
|
Revenue:
|
||||||||||||
|
Services
|
$ | 32,276 | $ | 16,770 | $ | 6,468 | ||||||
|
Software and other
|
11,901 | 725 | 343 | |||||||||
|
Total revenue
|
44,177 | 17,495 | 6,811 | |||||||||
|
Costs of revenue:
|
||||||||||||
|
Cost of services
|
26,737 | 16,620 | 10,307 | |||||||||
|
Cost of software and other
|
1,358 | 59 | — | |||||||||
|
Total cost of revenue
|
28,095 | 16,679 | 10,307 | |||||||||
|
Gross profit (loss)
|
16,082 | 816 | (3,496 | ) | ||||||||
|
Operating expenses:
|
||||||||||||
|
Research and development
|
5,214 | 5,795 | 6,994 | |||||||||
|
Sales and marketing
|
18,091 | 7,675 | 9,073 | |||||||||
|
General and administrative
|
10,963 | 14,119 | 14,559 | |||||||||
|
Amortization of intangible assets
|
364 | 177 | 112 | |||||||||
|
Total operating expenses
|
34,632 | 27,766 | 30,738 | |||||||||
|
Loss from operations
|
(18,550 | ) | (26,950 | ) | (34,234 | ) | ||||||
|
Interest income and other, net
|
540 | 428 | 2,506 | |||||||||
|
Loss from continuing operations, before income taxes
|
(18,010 | ) | (26,522 | ) | (31,728 | ) | ||||||
|
Income tax provision (benefit)
|
88 | (4,941 | ) | (18 | ) | |||||||
|
Loss from continuing operations, after income taxes
|
(18,098 | ) | (21,581 | ) | (31,710 | ) | ||||||
|
Income from discontinued operations, after income taxes
|
31 | 7,004 | 12,604 | |||||||||
|
Net loss
|
$ | (18,067 | ) | $ | (14,577 | ) | $ | (19,106 | ) | |||
|
Basic and diluted earnings per share:
|
||||||||||||
|
Loss from continuing operations
|
$ | (0.39 | ) | $ | (0.47 | ) | $ | (0.69 | ) | |||
|
Income from discontinued operations
|
0.00 | 0.16 | 0.28 | |||||||||
|
Basic and diluted net loss per share
|
$ | (0.39 | ) | $ | (0.31 | ) | $ | (0.41 | ) | |||
|
Shares used in computing basic and diluted net loss per share
|
46,818 | 46,378 | 46,098 | |||||||||
See accompanying notes.
SUPPORT.COM, INC.
CONSOLIDATED STATEMENTS OF STOCKHOLDERS’ EQUITY
(in thousands except share data)
|
Common Stock
|
Additional
|
Accumulated Other Comprehensive
|
Accumulated
|
Total Stockholders’
|
||||||||||||||||||||
|
Shares
|
Amount
|
Paid-In Capital
|
Income (Loss)
|
Deficit
|
Equity
|
|||||||||||||||||||
|
Balances at December 31, 2007
|
46,012,109 | $ | 5 | $ | 212,188 | $ | (772 | ) | $ | (90,559 | ) | $ | 120,862 | |||||||||||
|
Components of comprehensive loss:
|
||||||||||||||||||||||||
|
Net loss
|
— | — | (19,106 | ) | (19,106 | ) | ||||||||||||||||||
|
Unrealized loss on investments
|
— | — | — | (1,600 | ) | — | (1,600 | ) | ||||||||||||||||
|
Foreign currency translation adjustment
|
— | — | — | (169 | ) | — | (169 | ) | ||||||||||||||||
|
Comprehensive loss
|
(20,875 | ) | ||||||||||||||||||||||
|
Stock-based compensation expense
|
— | — | 5,078 | — | — | 5,078 | ||||||||||||||||||
|
Issuance of common stock upon exercise of stock options for cash
|
2,333 | — | 1 | — | — | 1 | ||||||||||||||||||
|
Issuance of common stock under employee stock purchase plan
|
127,301 | — | 380 | — | — | 380 | ||||||||||||||||||
|
Balances at December 31, 2008
|
46,141,743 | 5 | 217,647 | (2,541 | ) | (109,665 | ) | 105,446 | ||||||||||||||||
|
Components of comprehensive loss:
|
||||||||||||||||||||||||
|
Net loss
|
— | — | (14,577 | ) | (14,577 | ) | ||||||||||||||||||
|
Unrealized gain on investments
|
— | — | — | 1,518 | — | 1,518 | ||||||||||||||||||
|
Foreign currency translation adjustment
|
— | — | — | (210 | ) | — | (210 | ) | ||||||||||||||||
|
Comprehensive loss
|
(13,269 | ) | ||||||||||||||||||||||
|
Stock-based compensation expense
|
— | — | 3,690 | — | — | 3,690 | ||||||||||||||||||
|
Issuance of common stock upon exercise of stock options for cash
|
244,770 | — | 358 | — | — | 358 | ||||||||||||||||||
|
Issuance of common stock under employee stock purchase plan
|
74,041 | — | 127 | — | — | 127 | ||||||||||||||||||
|
Balances at December 31, 2009
|
46,460,554 | 5 | 221,822 | (1,233 | ) | (124,242 | ) | 96,352 | ||||||||||||||||
|
Components of comprehensive income:
|
||||||||||||||||||||||||
|
Net loss
|
— | — | (18,067 | ) | (18,067 | ) | ||||||||||||||||||
|
Unrealized loss on investments
|
— | — | — | (66 | ) | — | (66 | ) | ||||||||||||||||
|
Foreign currency translation adjustment
|
— | — | — | (32 | ) | — | (32 | ) | ||||||||||||||||
|
Comprehensive loss
|
(18,165 | ) | ||||||||||||||||||||||
|
Stock-based compensation expense
|
— | — | 3,331 | — | — | 3,331 | ||||||||||||||||||
|
Issuance of common stock upon exercise of stock options for cash
|
1,681,591 | — | 4,539 | — | — | 4,539 | ||||||||||||||||||
|
Balances at December 31, 2010
|
48,142,145 | $ | 5 | $ | 229,692 | $ | (1,331 | ) | $ | (142,309 | ) | $ | 86,057 | |||||||||||
See accompanying notes.
SUPPORT.COM, INC.
CONSOLIDATED STATEMENTS OF CASH FLOWS
(in thousands)
|
Year Ended December 31,
|
||||||||||||
|
2010
|
2009
|
2008
|
||||||||||
|
Operating activities:
|
||||||||||||
|
Net loss
|
$ | (18,067 | ) | $ | (14,577 | ) | $ | (19,106 | ) | |||
|
Adjustments to reconcile net income (loss) to net cash provided by (used in) operating activities:
|
||||||||||||
|
Gain on the sale of discontinued operations, net of tax ………………...
|
— | (4,190 | ) | — | ||||||||
|
Depreciation
|
323 | 613 | 1,194 | |||||||||
|
Write-off of fixed assets
|
— | 323 | 105 | |||||||||
|
Stock-based compensation expense
|
3,331 | 3,690 | 5,078 | |||||||||
|
Amortization of premiums and discounts on marketable securities
|
1,149 | 249 | (509 | ) | ||||||||
|
Amortization of intangible assets
|
364 | 177 | 202 | |||||||||
|
Amortization of purchased technology
|
83 | 172 | 57 | |||||||||
|
Realized (gain)/loss on investments
|
(1,299 | ) | (5,859 | ) | 7,221 | |||||||
|
(Gain)/loss on auction-rate security put option
|
1,289 | 5,859 | (7,148 | ) | ||||||||
|
Changes in assets and liabilities:
|
||||||||||||
|
Accounts receivable, net
|
(1,943 | ) | 2,494 | (252 | ) | |||||||
|
Prepaid expenses and other current assets
|
(371 | ) | 103 | 892 | ||||||||
|
Other assets
|
(318 | ) | 132 | (213 | ) | |||||||
|
Accounts payable
|
436 | (843 | ) | 431 | ||||||||
|
Accrued compensation
|
491 | (970 | ) | (186 | ) | |||||||
|
Other accrued liabilities
|
510 | (9,981 | ) | (203 | ) | |||||||
|
Other long-term liabilities
|
(214 | ) | (294 | ) | 569 | |||||||
|
Deferred revenue
|
848 | (1,068 | ) | (454 | ) | |||||||
|
Net cash used in operating activities
|
(13,388 | ) | (23,970 | ) | (12,322 | ) | ||||||
|
Investing activities:
|
||||||||||||
|
Proceeds from sale of discontinued operations
|
— | 20,475 | — | |||||||||
|
Purchases of property and equipment
|
(498 | ) | (234 | ) | (566 | ) | ||||||
|
Purchase of developed technology
|
— | (350 | ) | (1,375 | ) | |||||||
|
Acquisition of business, net of cash acquired
|
— | (7,942 | ) | (2,778 | ) | |||||||
|
Purchases of investments
|
(65,464 | ) | (44,932 | ) | (41,256 | ) | ||||||
|
Sales of investments
|
33,073 | 2,630 | 39,941 | |||||||||
|
Maturities of investments
|
36,733 | 13,050 | 69,467 | |||||||||
|
Net cash provided by (used in) investing activities
|
3,844 | (17,303 | ) | 63,433 | ||||||||
|
Financing activities:
|
||||||||||||
|
Proceeds from issuances of common stock
|
4,539 | 485 | 381 | |||||||||
|
Net cash provided by financing activities
|
4,539 | 485 | 381 | |||||||||
|
Net increase (decrease) in cash and cash equivalents
|
(5,005 | ) | (40,788 | ) | 51,492 | |||||||
|
Effect of exchange rate changes on cash and cash equivalents
|
19 | 29 | (112 | ) | ||||||||
|
Cash and cash equivalents at beginning of period
|
23,547 | 64,306 | 12,926 | |||||||||
|
Cash and cash equivalents at end of period
|
$ | 18,561 | $ | 23,547 | $ | 64,306 | ||||||
|
Supplemental schedule of cash flow information:
|
||||||||||||
|
Cash paid for income taxes
|
$ | 89 | $ | 311 | $ | 402 | ||||||
See accompanying notes.
SUPPORT.COM, INC
NOTES TO CONSOLIDATED FINANCIAL STATEMENTS
Note 1. Organization and Summary of Significant Accounting Policies
Nature of Operations
Support.com, Inc. (“Support.com,” “the Company,” “We” or “Our”), was incorporated in the state of Delaware on December 3, 1997. We changed our name from SupportSoft, Inc. to Support.com, Inc. on June 22, 2009. Our common stock trades on the NASDAQ Global Select Market under the symbol “SPRT.”
We are a leading independent provider of online care for the digital home and small business.
Our premium services and software products install, set-up, connect, repair and protect personal computers and related devices that are essential to our customers. We offer one-time services and subscriptions, and we also license software products to consumers who prefer do-it-yourself solutions.
Basis of Presentation
Support.com was founded in 1997 under the name SupportSoft, Inc. as an enterprise software provider focused on technical support organizations. In 2007 we launched our consumer services business, and in 2008 began reporting two operating segments, Enterprise and Consumer. In June, 2009 we sold our Enterprise business and focused our efforts purely on the consumer market. In December 2009 through the acquisition of substantially all of the assets of Xeriton, Inc., we added software tools marketed under the Sammsoft brand to our Consumer business.
As a result of the sale of the Enterprise business, our audited consolidated financial statements, accompanying notes and other information provided in this Form 10-K reflect the Enterprise business as a discontinued operation for all periods presented. After reclassifying the Enterprise business to discontinued operations, our continuing operations consist solely of our remaining segment, the Consumer business, which includes our online support services as well as our consumer software products.
The Consolidated Financial Statements include the accounts of Support.com and its wholly owned subsidiaries. All significant intercompany transactions and balances have been eliminated.
Foreign Currency Translation
The functional currency of our foreign subsidiaries is generally the local currency. Assets and liabilities of our wholly owned foreign subsidiaries are translated from their respective functional currencies at exchange rates in effect at the balance sheet date, and revenues and expenses are translated at average exchange rates prevailing during the year. Any material resulting translation adjustments are reflected as a separate component of stockholders’ equity in accumulated other comprehensive income or loss. Realized foreign currency transaction gains and losses were not material during the years ending December 31, 2010, 2009, and 2008.
Use of Estimates
The preparation of financial statements in conformity with accounting principles generally accepted in the United States requires management to make estimates and assumptions that affect the amounts reported in the consolidated financial statements and accompanying notes. The accounting estimates that require management’s most significant, difficult and subjective judgments include the valuation and recognition of investments, the assessment of recoverability of intangible assets and their estimated useful lives, the valuations and recognition of stock-based compensation and the recognition and measurement of current and deferred income tax assets and liabilities. Actual results could differ materially from these estimates.
Reclassifications
Certain amounts in the Consolidated Financial Statements and Notes to Consolidated Financial Statements for prior years have been reclassified to conform to current year’s presentation. On June 23, 2009 we completed the sale of the Enterprise business. As a result, certain costs historically allocated to our previously reported operating segments, i.e., the Enterprise and Consumer operating segments, have been reclassified to general and administrative operating costs of the continuing operations. On December 7, 2009, we acquired substantially all of the assets of Xeriton, Inc. and began to report software and other revenues and cost of revenues on our consolidated financial statements. Following this change in presentation, certain royalty revenues previously reported in the services line have been reclassified to software and other. Net operating results have not been affected by these reclassifications.
Concentrations of Credit Risk
Financial instruments that potentially subject us to concentrations of credit risk consist principally of cash equivalents, investments and trade accounts receivable. Our investment portfolio consists of investment grade securities. Except for obligations of the United States government and securities issued by agencies of the United States government, we diversify our investments by limiting our holdings with any individual issuer. We are exposed to credit risks in the event of default by the issuers to the extent of the amount recorded on the balance sheet. The credit risk in our trade accounts receivable is substantially mitigated by our credit evaluation process and reasonably short payment terms.
Trade Accounts Receivable and Allowance for Doubtful Accounts
Trade accounts receivable are recorded at the invoiced amount. We perform evaluations of our customers’ financial condition and generally do not require collateral. We make judgments as to our ability to collect outstanding receivables and provide allowances for a portion of receivables when collection becomes doubtful. Provisions are made based upon a specific review of all significant outstanding invoices. For those invoices not specifically provided for, provisions are recorded at differing rates, based upon the age of the receivable. In determining these percentages, we analyze our historical collection experience and current payment trends. The determination of past-due accounts is based on contractual terms.
The following table summarizes the allowance for doubtful accounts as of December 31, 2010 and 2009 (in thousands):
|
Balance at Beginning of Period
|
Charged/
(Recovery) to
Costs and
Expenses
|
Write-
offs
|
Balance at
End of
Period
|
|||||||||||||
|
Allowance for doubtful accounts:
|
||||||||||||||||
|
Year ended December 31, 2009
|
$ | — | $ | 9 | $ | — | $ | 9 | ||||||||
|
Year ended December 31, 2010
|
$ | 9 | $ | 34 | $ | — | $ | 43 | ||||||||
As of December 31, 2010, Customer A, Customer B and Customer C accounted for 57%, 21% and 12%, of our total accounts receivable, net, and no other customers represented greater than 10% of our total accounts receivable, net. Customer A represented 80% and 95% of our total accounts receivable, net, as of December 31, 2009 and 2008, respectively and no other customers represented greater than 10% of our total account receivable, net.
Cash, Cash Equivalents and Investments
All liquid instruments with an original maturity at the date of purchase of ninety days or less are classified as cash equivalents. Cash equivalents and short-term investments consist primarily of money market funds, commercial paper, corporate and municipal bonds and auction-rate securities (ARS) held by UBS. Our interest income on cash, cash equivalents and investments is recorded monthly and reported as interest income and other in our consolidated statements of operations.
On June 30, 2010, we exercised our rights under the Rights Agreement with UBS and settled the ARS for cash on June 30 and July 1, 2010. As of December 31, 2010, there were no ARS held by UBS as a result of this exercise. Long-term investments consist of other ARS positions not held with UBS. Other than the ARS held by UBS, our cash equivalents and short-term and long-term investments are classified as available-for-sale, and are reported at fair value with unrealized gains(losses) (when deemed to be temporary) included in accumulated other comprehensive income within stockholders’ equity on the consolidated balance sheets. Prior to their sale the ARS held by UBS were classified as trading securities and were reported at fair value with realized gains(losses) included in interest income(expense) and other, net in the consolidated statements of operations. For the twelve months ended December 31, 2010, we recorded a realized loss of $1.3 million on re-valuation of the ARS put option, offset with a realized gain of $1.3 million on the ARS held by UBS, for a net realized gain(loss) of zero. For the year ended December 31, 2009, we recorded realized losses of $5.9 million on the ARS put option re-valuation, which was offset by realized gains of $5.9 million on the UBS ARS. This was due to the put option re-valuation fully offsetting the UBS ARS re-valuation.
We monitor our investments for impairment on a quarterly basis and determine whether a decline in fair value is other-than-temporary by considering factors such as current economic and market conditions, the credit rating of the security’s issuer, the length of time an investment’s fair value has been below our carrying value, the Company’s intent to sell the security and the Company’s belief that it will not be required to sell the security before the recovery of its amortized cost. If an investment’s decline in fair value is deemed to be other-than-temporary, we reduce its carrying value to its estimated fair value, as determined based on quoted market prices or liquidation values. Declines in value judged to be other-than-temporary, if any, are recorded in operations as incurred. At December 31, 2010, the Company evaluated its unrealized gains(losses) on available-for-sale securities and determined them to be temporary. The ARS investments have been in a continuous unrealized loss position for more than 12 months. In accordance with ASC 320 2, Investments-Debt and Equity Securities, the Company concluded that it does not intend to sell a security with an unrealized loss and it will not be required to sell the security before the recovery of its amortized cost basis.
At December 31, 2010 and 2009, the fair value of cash, cash equivalents, investments and the ARS put option was $74.2 million and $84.8 million, respectively. The following is a summary of cash, cash equivalents and investments at December 31, 2009 (in thousands):
|
For the Year Ended December 31, 2010
|
||||||||||||||||
|
Amortized Cost
|
Gross Unrealized Gains
|
Gross Unrealized Losses
|
Fair Value
|
|||||||||||||
|
Cash
|
$ | 2,340 | $ | — | $ | — | $ | 2,340 | ||||||||
|
Money market fund
|
14,221 | — | — | 14,221 | ||||||||||||
|
Commercial paper
|
6,992 | — | (2 | ) | 6,990 | |||||||||||
|
Corporate bonds
|
22,013 | 19 | (20 | ) | 22,012 | |||||||||||
|
Corporate Notes
|
20,997 | 25 | (14 | ) | 21,008 | |||||||||||
|
Treasuries
|
4,999 | — | (2 | ) | 4,997 | |||||||||||
|
Auction-rate securities
|
2,800 | — | (133 | ) | 2,667 | |||||||||||
| $ | 74,362 | $ | 44 | $ | (171 | ) | $ | 74,235 | ||||||||
|
Classified as:
|
||||||||||||||||
|
Cash and cash equivalents
|
$ | 18,561 | $ | — | $ | — | $ | 18,561 | ||||||||
|
Short-term investments
|
53,001 | 44 | (38 | ) | 53,007 | |||||||||||
|
Long-term investments
|
2,800 | — | (133 | ) | 2,667 | |||||||||||
| $ | 74,362 | $ | 44 | $ | (171 | ) | $ | 74,235 | ||||||||
|
For the Year Ended December 31, 2009
|
||||||||||||||||||||
|
Amortized Cost
|
Gross Unrealized Gains
|
Gross Unrealized Losses
|
Gross Realized Losses
|
Fair Value
|
||||||||||||||||
|
Cash
|
$ | 3,429 | $ | — | $ | — | $ | — | $ | 3,429 | ||||||||||
|
Money market fund
|
20,118 | — | — | — | 20,118 | |||||||||||||||
|
Certificates of deposit
|
1,200 | — | — | — | 1,200 | |||||||||||||||
|
Agency bonds
|
3,500 | 2 | (1 | ) | — | 3,501 | ||||||||||||||
|
Commercial paper
|
7,895 | 1 | (0 | ) | — | 7,896 | ||||||||||||||
|
Corporate bonds
|
12,384 | 27 | (7 | ) | — | 12,404 | ||||||||||||||
|
Corporate notes
|
8,203 | 73 | — | — | 8,276 | |||||||||||||||
|
U.S. government agency securities
|
4,000 | 0 | — | — | 4,000 | |||||||||||||||
|
Auction-rate securities(1)
|
24,100 | — | (156 | ) | (1,289 | ) | 22,655 | (1) | ||||||||||||
| $ | 84,829 | $ | 103 | $ | (164 | ) | (1,289 | ) | $ | 83,479 | (1) | |||||||||
|
Classified as:
|
||||||||||||||||||||
|
Cash and cash equivalents
|
$ | 23,547 | $ | — | $ | — | $ | — | $ | 23,547 | ||||||||||
|
Short-term investments
|
57,682 | 103 | (8 | ) | (1,289 | ) | 56,488 | |||||||||||||
|
Long-term investments
|
3,600 | — | (156 | ) | — | 3,444 | ||||||||||||||
| $ | 84,829 | $ | 103 | $ | (164 | ) | $ | (1,289 | ) | $ | 83,479 | (1) | ||||||||
(1) In addition to the fair value of our auction-rate securities holdings, we hold the auction-rate security put option, which is classified as a short-term asset valued at $1.3 million as of December 31, 2009. At December 31, 2009, the fair value of cash, cash equivalents, investments and the auction-rate security put option was $84.8 million.
The following table summarizes the estimated fair value of our available-for-sale and trading debt securities classified by the stated maturity date of the security (in thousands):
|
December 31,
|
||||||||
|
2010
|
2009
|
|||||||
|
Due within one year
|
$ | 50,350 | $ | 33,591 | ||||
|
Due within two years
|
4,657 | $ | 3,686 | |||||
|
Due after three years
|
2,667 | $ | 22,655 | |||||
| $ | 57,674 | $ | 59,932 | |||||
We determined that the gross unrealized losses on our available-for-sale investments as of December 31, 2010 are temporary in nature. The fair value of our available-for-sale securities at December 31, 2010 and 2009 reflects a net unrealized loss of $127,000 and $61,000, respectively. We recognized realized gains related to available-for-sale securities of $10,000 and $2,000 for the years ended December 31, 2010 and 2009, respectively. There were no realized losses on available-for-sale securities in the year ended December 31, 20010 and 2009, respectively.
At December 31, 2010 and 2009 we had investments in AAA-rated ARS with various state student loan authorities with estimated fair values of $2.7 million and $22.7 million, respectively. The student loans made by these authorities are substantially guaranteed by the federal government through the Federal Family Education Loan Program (FFELP). ARS are long-term floating rate bonds tied to short-term interest rates. After the initial issuance of the securities, the interest rate on the securities is reset periodically, at intervals established at the time of issuance (e.g., every seven days, twenty-eight days, thirty-five days, or every six months), based on market demand, if the auctions are successful. ARS are bought and sold in the marketplace through a competitive bidding process often referred to as a “Dutch auction.” If there is insufficient interest in the securities at the time of an auction, the auction may not be completed and the ARS then pays a default interest rate. Following such a failed auction, we cannot access our funds that are invested in the corresponding ARS until a future auction of these investments is successful, new buyers express interest in purchasing these securities in between reset dates, issuers establish a different form of financing to replace these securities or final payments become due according to contractual maturities. Commencing in February 2008, conditions in the global credit markets resulted in failed auctions for all of our ARS. In the near term, our ability to liquidate our investments or fully recover the carrying values may be limited or not exist.
In October 2008, UBS extended an offer of rights to us to sell our eligible ARS at par value back to UBS beginning June 30, 2010 through July 2, 2012. All of the UBS ARS qualified as “eligible” for purposes of the rights offer. In November 2008, we elected to accept the offer of rights from UBS, which gave us the option to sell to UBS a total of $20.2 million at par value at any time beginning June 30, 2010 through July 2, 2012. Upon acceptance of the UBS rights offer, we elected to value the ARS put option at fair value as allowed under ASC 825 (formerly, SFAS No. 159, “The Fair Value Option for Financial Assets and Financial Liabilities).” Refer to the Auction-Rate Securities Put Option section below for further discussion. Given the UBS rights offer, we elected a one-time transfer of our UBS ARS from available-for-sale to trading securities in accordance with ASC 320 (formerly FASB Statement No. 115, “Accounting for Certain Investments in Debt and Equity Securities” (SFAS 115)). The transfer to trading securities reflected management’s intent to exercise its ARS put option during the period June 30, 2010 to July 2, 2012. On June 30, 2010, we exercised our rights under the Rights Agreement with UBS. Of the $20.2 million par value we held immediately prior to exercising the put, $11.1 million was settled on June 30, 2010 and the remaining $9.1 million was settled on July 1, 2010.
We determined that the gross unrealized losses on our available-for-sale investments as of December 31, 2010 are temporary in nature. The fair value of our ARS at December 31, 2010 reflects an unrealized loss of $127,000, entirely related to securities classified as available-for-sale.
Fair value for non-UBS ARS, classified as available-for sale, was based on a discounted cash flow valuation that takes into account a number of factors including the weighted average remaining term (WART) of the underlying securities, the expected return, and the discount rate. The actual WART from servicing reports was used where available. For securities where the actual WART was not available an estimate based on other securities held was used. The expected return was calculated based on the last twelve months’ average for the 91 day T-bill plus a spread. This rate is the typical default rate for ARS held by us. The discount rate was calculated using the 3-month LIBOR rate plus adjustments for the security type. Changes in any of the above estimates, especially the weighted average remaining term or the discount rate, could result in a material change to the fair value. Presently we have determined the decline in value for the available-for-sale ARS to be temporary because i) we have no intent to sell the security, and we believe that we will not be required to sell the security before the recovery of its amortized cost due to our cash reserves; ii) through December 31, 2010 all of the securities have maintained AAA credit ratings; and iii) loans made by the issuers are backed by the federal government. In accordance with ASC 320, we also conclude that we do not intend to sell an impaired available-for-sale security and will not be required to sell such a security before the recovery of our amortized cost.
However, if circumstances change, we may be required to record an other-than-temporary impairment charge on the available-for-sale ARS. We may similarly be required to record other-than-temporary impairment charges if the ratings on any of these securities are reduced or if any of the issuers default on their obligations. In addition to impairment charges, any of these events could cause us to lose part or all of our investment in these securities. Any of these events could materially affect our results of operations and our financial condition. We currently believe these securities are not significantly impaired for the reasons described above; however, it could take until the final maturity of the underlying notes (initially up to 30 years) to realize our investments’ recorded value.
The following table sets forth the unrealized losses for the Company’s available-for-sale investments as of December 31, 2010 and 2009 (in thousands):
|
As of December 31, 2010
|
In Loss Position
Less Than 12 Months
|
In Loss Position
More Than 12 Months
|
Total In Loss Position
|
|||||||||||||||||||||
|
Description
|
Fair Value
|
Unrealized Losses
|
Fair Value
|
Unrealized Losses
|
Fair Value
|
Unrealized Losses
|
||||||||||||||||||
|
Commercial Paper
|
$ | 6,990 | $ | (2 | ) | $ | — | $ | — | $ | 6,990 | $ | (2 | ) | ||||||||||
|
Corporate Bonds
|
15,813 | (21 | ) | — | — | 15,813 | (21 | ) | ||||||||||||||||
|
Corporate Notes
|
11,664 | (14 | ) | — | — | 11,664 | (14 | ) | ||||||||||||||||
|
Treasuries
|
4,998 | (1 | ) | — | — | 4,998 | (1 | ) | ||||||||||||||||
|
Auction-rate securities
|
— | — | 2,667 | (133 | ) | 2,667 | (133 | ) | ||||||||||||||||
|
Total
|
$ | 39,465 | $ | (38 | ) | $ | 2,667 | $ | (133 | ) | $ | 42,132 | $ | (171 | ) | |||||||||
|
As of December 31, 2009
|
In Loss Position
Less Than 12 Months
|
In Loss Position
More Than 12 Months
|
Total In Loss Position
|
|||||||||||||||||||||
|
Description
|
Fair Value
|
Unrealized Losses
|
Fair Value
|
Unrealized Losses
|
Fair Value
|
Unrealized Losses
|
||||||||||||||||||
|
Agency bond
|
$ | 1,501 | $ | (1 | ) | $ | — | $ | — | $ | 1,501 | $ | (1 | ) | ||||||||||
|
Commercial paper
|
1,999 | (0 | ) | — | — | 1,999 | (0 | ) | ||||||||||||||||
|
Corporate bonds
|
3,929 | (7 | ) | — | — | 3,929 | (7 | ) | ||||||||||||||||
|
Auction-rate securities
|
— | — | 3,444 | (156 | ) | 3,444 | (156 | ) | ||||||||||||||||
|
Total
|
$ | 7,429 | $ | (8 | ) | $ | 3,444 | $ | (156 | ) | $ | 10,873 | $ | (164 | ) | |||||||||
Auction-Rate Security Put Option
In November 2008, we signed a Rights Agreement with UBS concerning the disposition of our ARS. The UBS agreement gave us the right to sell our ARS back to UBS, at par value, beginning June 30, 2010 through July 2, 2012. The rights represent a freestanding financial instrument for accounting purposes. As noted above, we elected to value this “put” option at fair value as allowed under ASC 825, Financial Instruments. As such, we recognized the value of the repurchase right as an asset with the corresponding gain recorded in earnings. Fair value was determined using a “with and without” approach based on a discounted cash flow valuation comparing the value of the auction rate securities with the put option and without it. We took into account the same factors as those used to value the auction rate securities noted above, adjusted to account for differences in cash flow timing and UBS credit risk. The value of the rights offer was recorded in interest income and expense, net. On June 30, 2010, we exercised our rights under the Rights Agreement with UBS. The value of the ARS put option at December 31, 2010 and December 31, 2009 was zero and $1.3 million, respectively. At December 31, 2010 the ARS put option fully offset the realized loss recorded on the related ARS in our consolidated statement of operations. During the year ended December 31, 2009, we recorded a gain of $5.9 million to adjust the value of the UBS ARS to fair value offset by a recorded loss of $5.9 million to reflect a corresponding decrease in the fair value of the ARS put option.
Property and Equipment
Property and equipment is stated at cost, less accumulated depreciation which is determined using the straight-line method over the estimated useful lives of 2 years for computer equipment and software, 3 years for furniture and fixtures, and the shorter of the estimated useful lives or the lease term for leasehold improvements. Repairs and maintenance costs are expensed as incurred.
Goodwill
Goodwill of $2.9 million resulted from our acquisition of YourTechOnline.com (“YTO”) on May 2, 2008 and goodwill of $7.3 million resulted from our acquisition of substantially all of the assets of Xeriton on December 7, 2009.
We assess the impairment of goodwill annually or more often if events or changes in circumstances indicate that the carrying value may not be recoverable. Consistent with our determination that we have only one reporting segment, we have determined that there is only one reporting unit and goodwill is evaluated for impairment oat the entity level. We test goodwill using the two-step process required by ASC 350, Intangibles – Goodwill and Other. In the first step, we compare the carrying amount of the reporting unit to the fair value based on quoted market prices of our common stock. If the carrying value of the reporting unit exceeds the fair value, goodwill is potentially impaired and the second step of the impairment test must be performed. In the second step, if such comparison reflects potential impairment, we would compare the implied fair value of the goodwill, as defined by ASC 350, to its carrying amount to determine the amounts of impairment loss, if any. We performed our annual goodwill impairment tests September 30, 2010, 2009, and 2008 and concluded that there was no impairment.
We conduct our annual evaluation for impairment of goodwill on September 30. No goodwill impairment charges have been recorded through December 31, 2010.
Intangible Assets
We record purchased intangible assets at fair value. Useful life is estimated as the period over which the assets are expected to contribute directly or indirectly to the future cash flows of the Company. As we do not believe that we can reliably determine a pattern by which the economic benefits of these assets will be consumed, management adopted straight-line amortization in accordance with ASC 350, Goodwill and Other Intangible Assets. The original cost is amortized on a straight-line basis over the estimated useful life of each asset.
We assess the impairment of intangible assets whenever events or changes in circumstances indicate that the carrying amount may not be recoverable. The review considers facts and circumstances, either internal or external, which indicate that the carrying value of the asset cannot be recovered. If and when indicators of impairment exist, we assess the need to record an impairment loss, by comparing the undiscounted net cash flows associated with related assets or group of assets over their remaining lives against their respective carrying amounts. Impairment, if any, is based on the excess of the carrying amount over the fair value of those assets.
Revenue Recognition
For all transactions, we recognize revenue only when all of the following criteria are met:
|
|
•
|
Persuasive evidence of an arrangement exists;
|
|
|
•
|
Delivery has occurred;
|
|
|
•
|
Collection is considered probable; and
|
|
|
•
|
The fees are fixed or determinable.
|
We consider all arrangements with payment terms longer than 90 days not to be fixed or determinable. If the fee is determined not to be fixed or determinable, revenue is recognized as payment becomes due from the customer.
Services Revenue
Services revenues are comprised primarily of fees for technology support services, including the set-up, protection, optimization and repair of new and existing computers as well as other technology devices. We provide these services remotely, using work-from-home Personal Technology Experts who utilize our proprietary technology to deliver the services.
We provide services to consumers and small business, either through our channel partners (which include brick and mortar and online retailers, anti-virus providers, PC/consumer electronics (“PC/CE”) manufacturers, internet service providers (“ISP’s”), and others) or directly via our website (www.support.com). We transact with customers via reseller programs, referral programs and direct transactions. In reseller programs, the channel partner generally executes the financial transactions with the consumer and pays a fee to us which we recognize as revenue when the service is provided. In referral programs, we transact with the consumer directly and pay a referral fee to the referring party. Referral fees are expensed in the period in which the customer was acquired. In such instances, since we are the transacting party and bear substantially all risks associated with the transaction, we record the gross amount of revenue. In direct-to-consumer transactions, we sell directly to the consumer at the retail price.
Our services are of three types for revenue recognition purposes:
• Incident-Based Services—Customers purchase a discrete, one-time service. Revenue recognition occurs at the time of service delivery. Fees paid for services sold but not yet delivered are recorded as deferred revenue and recognized at the time of service delivery.
• Subscriptions—Customers purchase subscriptions or “service plans” under which certain services are provided over a fixed subscription period. Revenues for subscriptions are recognized ratably using the daily convention over the respective subscription periods.
• Service Cards / Gift Cards—Customers purchase a service card and/or a gift card, which entitles the cardholder to redeem a certain service at a time of their choosing. For these sales, revenue is deferred until the card has been redeemed and the service has been provided.
For certain direct and channel partnerships, we are paid for services that are sold but not yet delivered. We initially record such balances as deferred revenue, and recognize revenue when the service has been provided or, on the non-subscription portion of these balances, when the likelihood of the service being redeemed by the customer is remote (“services breakage”). Based upon our historical redemption patterns for these relationships, we believe that the likelihood of a service being delivered more than 90 days after sale is remote. Beginning in 2010, we therefore recognize non-subscription deferred revenue balances older than 90 days as services revenue. For the year ending December 31, 2010, services breakage revenue was immaterial, and accounted for less than one percent of revenue.
Channel partners are generally invoiced monthly. Fees from consumers via referral programs and direct transactions are generally paid with a credit card at the time of sale. Revenue is recognized net of any applicable sales tax.
We generally provide a refund period on services, during which refunds may be granted to consumers under certain circumstances, including inability to resolve certain support issues. For our channel sales, the refund period varies by partner, but is generally between 5 and 10 days. For referral programs and direct transactions, the refund period is generally 5 days. For all channels, we recognize revenue net of refunds and cancellations during the period. Refunds and cancellations have not been material.
Software and Other Revenue
Software and other revenue is comprised primarily of fees for software products provided through direct consumer downloads and, to a lesser extent, through the sale of this software via channel partners. Our software is sold to consumers as a perpetual license. We act as the primary obligor and generally control fulfillment, pricing, product requirements, and collection risk and therefore we recognize revenues using the gross method in the period in which the software products were sold. We provide a limited amount of free technical support assistance to customers. We therefore do not defer the recognition of any revenue associated with sales of these products, since the cost of providing this free technical support is insignificant. The technical support is generally provided within one year after the associated revenue is recognized and free product enhancements are minimal and infrequent. Other revenue consists primarily of revenue generated through partners advertising to our customer base in various forms, including toolbar advertising, email marketing, and free trial offers. We recognize other revenue as it is earned.
Research and Development
Research and development expenditures are charged to operations as incurred. Based on our product development process, technological feasibility is established upon the completion of a working model. Costs incurred by us between the completion of the working model and the point at which the product is ready for general release have been insignificant. Accordingly, we have charged all such costs to research and development expense in the period in which they were incurred in the accompanying statements of operations.
Purchased Technology and Internal Use Software
We capitalize costs related to software that we license and incorporate into our product and service offerings or develop for internal use. In 2009, we acquired purchased technology for $350,000 and recorded amortization expense related to this technology of $83,000 and $41,000 in 2010 and 2009. There were no costs capitalized in 2008. In addition, in 2010, we accumulated $69,000 related to software developed for internal use and will amortize over the useful life of this software once it is placed into service.
Advertising Costs
Advertising costs are recorded as sales and marketing expense in the period in which they are incurred. Advertising expense was $10.6 million, $1.9 million, and $1.1 million for the years ended December 31, 2010, 2009, and 2008, respectively.
Net Loss Per Share
Basic net loss per share is computed using our net loss and the weighted average number of common shares outstanding during the reporting period. Diluted net loss per share is computed using our net loss and the weighted average number of common shares outstanding, including the effect from the potential issuance of common stock such as stock issuable pursuant to the exercise of stock options using the treasury stock method when dilutive.
The following table sets forth the computation of basic and diluted net loss per share (in thousands, except per share amounts):
|
Year Ended December 31,
|
||||||||||||
|
2010
|
2009
|
2008
|
||||||||||
|
Net loss
|
$ | (18,067 | ) | $ | (14,577 | ) | $ | (19,106 | ) | |||
|
Basic:
|
||||||||||||
|
Weighted-average shares of common stock outstanding
|
46,818 | 46,378 | 46,098 | |||||||||
|
Shares used in computing basic net loss per share
|
46,818 | 46,378 | 46,098 | |||||||||
|
Basic net loss per share
|
$ | (0.39 | ) | $ | (0.31 | ) | $ | (0.41 | ) | |||
|
Diluted:
|
||||||||||||
|
Weighted-average shares of common stock outstanding
|
46,818 | 46,378 | 46,098 | |||||||||
|
Add: Common equivalent shares outstanding
|
— | — | — | |||||||||
|
Shares used in computing diluted net loss per share
|
46,818 | 46,378 | 46,098 | |||||||||
|
Diluted net loss per share
|
$ | (0.39 | ) | $ | (0.31 | ) | $ | (0.41 | ) | |||
For the years ended December 31, 2010, 2009 and 2008, 941,000, 11.4 million and 12.7 million outstanding options were excluded from the computation of diluted net loss per share since their effect would have been anti-dilutive.
Accumulated Other Comprehensive Loss
The components of accumulated other comprehensive loss relate entirely to accumulated foreign currency translation losses and unrealized gains and losses on investments. Accumulated currency translation losses, net of tax effects, were $1.2 million and $1.2 million as of December 31, 2010 and 2009, respectively, and accumulated unrealized gains (losses) on investments, net of tax effect, were $(0.1) million and $0.1 million as of December 31, 2010 and 2009, respectively.
Comprehensive Loss
Comprehensive net income/loss includes the impact of foreign currency translation adjustments and changes in the fair value of available-for-sale securities. The following are the components of comprehensive loss (in thousands):
|
For the years ended December 31,
|
||||||||||||
|
2010
|
2009
|
2008
|
||||||||||
|
Net loss
|
$ | (18,067 | ) | $ | (14,577 | ) | $ | (19,106 | ) | |||
|
Net unrealized gain/(loss) on available-for-sale securities
|
(66 | ) | 1,518 | (1,600 | ) | |||||||
|
Foreign currency translation loss
|
(32 | ) | (210 | ) | (169 | ) | ||||||
|
Total comprehensive loss
|
$ | (18,165 | ) | $ | (13,269 | ) | $ | (20,875 | ) | |||
|
Income tax provision netted against unrealized gain (loss) on available-for-sale securities
|
$ | — | $ | — | $ | — | ||||||
The amounts noted in the table above are shown before taking into account the related income tax impact. The income tax effect allocated to each component of other comprehensive income for each of the periods presented is not significant.
Stock-Based Compensation
We apply the provisions of ASC 718, Stock Compensation, which requires the measurement and recognition of compensation expense for all stock-based payment awards, including grants of stock and options to purchase stock, made to employees and directors based on estimated fair values.
Determining Fair Value of Share Based Payments
Valuation and Attribution Method: We estimate the fair value of stock options granted using the Black-Scholes-Merton option pricing model. Stock options vest on a graded schedule; however we recognize the expense on a straight-line basis over the requisite service period of the entire award, net of estimated forfeitures and subject to the minimum expense requirements of ASC 718. These limitations require that on any date the compensation cost recognized is at least equal to the portion of the grant-date fair value of the award that is vested at that date.
Risk-free Interest Rate: We base our risk-free interest rate upon the yield currently available on US Treasury zero coupon issues for the expected term of the employee stock options.
Expected Term: Our expected term represents the period that our stock options are expected to be outstanding and is determined based on historical experience of similar stock options considering the contractual terms of the stock options, vesting schedules and expectations of future employee behavior.
Expected Volatility: Our expected volatility represents the amount by which the stock price is expected to fluctuate throughout the period that the stock option is outstanding. Historically, we have based our expected volatility on historical company data. However, given the focus and overall nature of our business changed upon the sale of our Enterprise business, we no longer believe our historical volatility to be reflective of our expected volatility going forward. Therefore, in 2010 we adopted a methodology which combines available Company-specific volatility for the period following the sale of our Enterprise business with the volatility of a peer group. The relative weight given to Company-specific volatility increases each reporting period, while the relative weighting for our peer group’s volatility decreases. Given the expected life of our stock grants, we expect company-specific volatility to wholly account for our volatility estimates beginning in 2013.
Expected Dividend: We use a dividend yield of zero, as we have never paid cash dividends and do not expect to pay dividends in the future.
The fair value of our stock-based awards was estimated using the following assumptions for the years ended December 31, 2010, 2009 and 2008:
|
Stock Option Plan
|
Employee Stock Purchase Plan
|
|||||||||||||||||||||||
|
2010
|
2009
|
2008
|
2010
|
2009
|
2008
|
|||||||||||||||||||
|
Risk-free interest rate
|
1.7 | % | 2.0 | % | 2.0 | % | n/a | n/a | 1.5 | % | ||||||||||||||
|
Expected term (in years)
|
3.6 | 3.6 | 4.3 | n/a | n/a | 0.5 | ||||||||||||||||||
|
Volatility
|
66.6 | % | 63.1 | % | 53.2 | % | n/a | n/a | 53.1 | % | ||||||||||||||
|
Expected dividend
|
0 | % | 0 | % | 0 | % | n/a | n/a | 0 | % | ||||||||||||||
|
Weighted average fair value
|
$ | 1.71 | $ | 1.12 | $ | 1.33 | n/a | n/a | $ | 1.08 | ||||||||||||||
In the second quarter of 2009 we sold our Enterprise business to Consona. This sale qualified as the sale of “substantially all the assets of the business,” and according to the terms of our ESPP plan document, such a sale automatically terminated the ESPP. In the first quarter of 2009, prior to the sale of the Enterprise business, there was a purchase made through the Purchase Plan and the related stock compensation expense for the year ended December 31, 2009 was insignificant.
We recorded the following stock-based compensation expense for the fiscal years ended December 31, 2010, 2009 and 2008, (in thousands).
|
For the Year Ended December 31,
|
||||||||||||
|
2010
|
2009
|
2008
|
||||||||||
|
Stock option compensation expense recognized in:
|
||||||||||||
|
Cost of service
|
$ | 168 | $ | 130 | $ | 110 | ||||||
|
Cost of software and others
|
1 | — | — | |||||||||
|
Research and development
|
588 | 465 | 432 | |||||||||
|
Sales and marketing
|
693 | 575 | 901 | |||||||||
|
General and administrative
|
1,881 | 1,763 | 1,772 | |||||||||
| 3,331 | 2,933 | 3,215 | ||||||||||
|
ESPP compensation expense recognized in:
|
||||||||||||
|
Cost of service
|
— | 3 | 28 | |||||||||
|
Research and development
|
— | 2 | 18 | |||||||||
|
Sales and marketing
|
— | 2 | 10 | |||||||||
|
General and administrative
|
— | 2 | 18 | |||||||||
| — | 9 | 74 | ||||||||||
|
Stock-based compensation expense included in total costs and expenses
|
$ | 3,331 | $ | 2,942 | $ | 3,289 | ||||||
Net cash proceeds from the exercise of stock options were $4.5 million, $358,000 and $233 for the years ended December 31, 2010, 2009 and 2008, respectively. No income tax benefit was realized from stock option exercises during the year ended December 31, 2010. In accordance with ASC 718, we present excess tax benefits from the exercise of stock options, if any, as net cash generated in financing activities.
Income Taxes
Income taxes are accounted for under the asset and liability method. Under this method, deferred tax assets and liabilities are recognized for the estimated future tax consequences attributable to differences between the financial statement carrying amounts of existing assets and liabilities and their respective tax bases, and operating losses and tax credit carryforwards. Deferred tax assets and liabilities are measured using enacted tax rates in effect for the year in which those temporary differences are expected to be reversed or settled. The effect on deferred tax assets and liabilities of a change in tax rates is recognized in the consolidated statements of operations in the period that includes the enactment date. A valuation allowance is recorded to reduce the carrying amounts of deferred tax assets, if it is more likely than not, that such assets will not be realized.
Warranties and Indemnifications
We generally provide a refund period on sales, during which refunds may be granted to consumers under certain circumstances, including our inability to resolve certain support issues. For our channel sales, the refund period varies by channel partner, but is generally between 5-10 days. For referral programs and direct transactions, the refund period is generally 5 days. For all sales channels, we recognize revenue net of refunds and cancellations during the period. Refunds and cancellations have not been material.
We generally agree to indemnify our customers against legal claims that our software products infringe certain third-party intellectual property rights. As of December 31, 2010 and 2009, we have not been required to make any payment resulting from infringement claims asserted against our customers and have not recorded any related accruals.
Fair Value Measurements
ASC 820, Fair Value Measurements and Disclosures defines fair value, establishes a framework for measuring fair value under generally accepted accounting principles and enhances disclosures about fair value measurements. Fair value is defined under ASC 820 as the exchange price that would be received for an asset or paid to transfer a liability (an exit price) in the principal or most advantageous market for the asset or liability in an orderly transaction between market participants on the measurement date. Valuation techniques used to measure fair value ASC 820 must maximize the use of observable inputs and minimize the use of unobservable inputs. The standard describes a fair value hierarchy based on three levels of inputs, of which the first two are considered observable and the last unobservable, that may be used to measure fair value, which are the following:
|
|
•
|
Level 1 - Quoted prices in active markets for identical assets or liabilities.
|
|
|
•
|
Level 2 - Inputs other than Level 1 that are observable, either directly or indirectly, such as quoted prices for similar assets or liabilities; quoted prices in markets that are not active; or other inputs that are observable or can be corroborated by observable market data for substantially the full term of the assets or liabilities.
|
|
|
•
|
Level 3 - Unobservable inputs that are supported by little or no market activity and that are significant to the fair value of the assets or liabilities.
|
In accordance with ASC 820, the following table represents our fair value hierarchy for our financial assets (cash equivalents and investments) and the UBS put contract measured at fair value on a recurring basis as of December 31, 2010 and 2009 (in thousands):
|
As of December 31, 2010
|
Level 1
|
Level 2
|
Level 3
|
Total
|
||||||||||||
|
Money market funds
|
$ | 14,221 | $ | — | $ | — | $ | 14,221 | ||||||||
|
Commercial paper
|
— | 6,990 | — | 6,990 | ||||||||||||
|
Corporate bonds
|
— | 22,012 | — | 22,012 | ||||||||||||
|
Corporate notes
|
— | 21,008 | — | 21,008 | ||||||||||||
|
Treasuries
|
— | 4,997 | — | 4,997 | ||||||||||||
|
Auction-rate securities
|
— | — | 2,667 | 2,667 | ||||||||||||
|
Total
|
$ | 14,221 | $ | 55,007 | $ | 2,667 | $ | 71,895 | ||||||||
|
As of December 31, 2009
|
Level 1
|
Level 2
|
Level 3
|
Total
|
||||||||||||
|
Money market funds
|
$ | 21,318 | $ | — | $ | — | $ | 21,318 | ||||||||
|
Agency bonds
|
— | 3,501 | 3,501 | |||||||||||||
|
Commercial paper
|
— | 7,896 | — | 7,896 | ||||||||||||
|
Corporate bonds
|
— | 12,404 | — | 12,404 | ||||||||||||
|
Corporate notes
|
— | 8,276 | — | 8,276 | ||||||||||||
|
U.S. Government Agency Securities
|
— | 4,000 | — | 4,000 | ||||||||||||
|
Auction-rate securities
|
— | — | 22,655 | 22,655 | ||||||||||||
|
Auction-rate securities put option
|
— | — | 1,289 | 1,289 | ||||||||||||
|
Total
|
$ | 21,318 | $ | 36,077 | $ | 23,944 | $ | 81,339 | ||||||||
Level 3 assets consist of ARS with various state student loan authorities and the ARS put option. Beginning in February 2008, all auctions for the ARS have failed. Based on the continued failure of these auctions and the underlying maturities of the securities, we continue to classify our non-UBS holdings as long-term assets. The fair value of the auction-rate securities as of December 31, 2010 and 2009 was estimated by management.
The following table provides a summary of changes in fair value of our Level 3 financial assets as of December 31, 2010 and 2009 (in thousands):
|
Year Ended
December 31, 2010
|
||||||||
|
Auction-Rate
Securities
|
Auction Rate Security
Put Option
|
|||||||
|
Beginning balance
|
$ | 22,655 | $ | 1,289 | ||||
|
Transfer into Level 3
|
— | — | ||||||
|
Sales
|
(21,300 | ) | — | |||||
|
Total gains/(losses):
|
||||||||
|
Included in earnings
|
1,289 | (1,289 | ) | |||||
|
Included in other comprehensive income
|
23 | — | ||||||
|
Ending balance
|
$ | 2,667 | $ | — | ||||
|
Year Ended
December 31, 2009
|
||||||||
|
Auction-Rate
Securities
|
Auction Rate Security
Put Option
|
|||||||
|
Beginning balance
|
$ | 15,766 | $ | 7,148 | ||||
|
Transfer into Level 3
|
— | — | ||||||
|
Sales
|
(400 | ) | — | |||||
|
Total gains/(losses):
|
||||||||
|
Included in interest income (expense) and other, net
|
5,859 | (5,859 | ) | |||||
|
Included in other comprehensive income
|
1,430 | |||||||
|
Ending balance
|
$ | 22,655 | $ | 1,289 | ||||
There were no transfers between Level 1 and Level 2 financial assets in 2010 and 2009.
Segment Information
During the second quarter of 2009, we sold our Enterprise business to Consona. After reclassifying the Enterprise segment to discontinued operations, our continuing operations consist solely of our remaining segment, the Consumer Business. Revenue from customers located outside the United States was approximately $302,000, $274,000, and $579,000 for the years ended December 31, 2010, 2009, and 2008 respectively.
Sales to customers in different geographic areas, expressed as a percentage of revenue, for the periods ended were:
| Year Ended December 31, | ||||||||||||
|
2010
|
2009
|
2008
|
||||||||||
|
Americas
|
99
|
%
|
98
|
%
|
92
|
%
|
||||||
|
Europe and Asia Pacific
|
1
|
2
|
8
|
|||||||||
|
Total
|
100
|
%
|
100
|
%
|
100
|
%
|
||||||
Customer A and Customer B accounted for 43% and 17% of our total revenue, respectively for the years ended December 31, 2010. No other customers accounted for more than 10% of our total revenue in year ended December 31, 2010. One Customer, Customer A accounted for 82% and 81% of our total revenue for the years ended December 31, 2009 and 2008, respectively. No other customers accounted for more than 10% of our total revenue in year ended December 31, 2009 and 2008.
Long-lived assets are attributed to the geographic location in which they are located. We include in long-lived assets all tangible assets. Long lived assets regarding geographic areas are as follows (in thousands):
|
December 31,
|
||||||||
|
2010
|
2009
|
|||||||
|
United States
|
$
|
562
|
$
|
408
|
||||
|
India
|
61
|
39
|
||||||
|
Total
|
$
|
623
|
$
|
447
|
||||
Recent Accounting Pronouncements
In September 2009, the FASB issued Accounting Standards Update No. 2009-13, “Multiple-Deliverable Revenue Arrangements—a consensus of the FASB Emerging Issues Task Force” (ASU 2009-13) which updates the existing multiple-element revenue arrangements guidance currently included under ASC 605, which originated primarily from the guidance in EITF Issue No. 00-21, “Revenue Arrangements with Multiple Deliverables” (EITF 00-21). The revised guidance primarily makes two significant changes: (1) it eliminates the need for objective and reliable evidence of the fair value for the undelivered element in order for a delivered item to be treated as a separate unit of accounting, and (2) it eliminates the residual method to allocate the arrangement consideration. In addition, the guidance also expands the disclosure requirements for revenue recognition. ASU 2009-13 will be effective for us as of January 1, 2011. This update has no significant impact on our financial position.
In January 2010 the FASB issued ASU No. 2010-06, “Fair Value Measurements and Disclosures (Topic 820) — Improving Disclosures about Fair Value Measurements.” This update amends the disclosure requirements about fair value measurements in ASC Topic 820, “Fair Value Measurements and Disclosures.” ASU 2010-06 requires more robust disclosures about the different classes of assets and liabilities measured at fair value, the valuation techniques and inputs used, the activity in Level 3 fair value measurements, and the transfers between Levels 1, 2, and 3. ASU 2010-06 is effective for interim and annual reporting periods beginning after December 15, 2009. This update has no significant impact on our financial position, results of operations or cash flows.
Note 2. Discontinued Operations
Support.com, Inc., formerly SupportSoft, Inc., was founded as an enterprise software provider. In 2007, we launched a premium technology services business focused on consumers and, in 2008, reported two operating segments. The two segments were the Enterprise business (comprised of the enterprise software and related services businesses) and the Consumer business (comprised of the consumer services business).
During the second quarter of 2009, pursuant to an Asset Purchase Agreement dated April 5, 2009, we sold substantially all of the assets and transferred certain of the liabilities of our Enterprise business to Consona Corporation. We have retained all assets and liabilities associated with our Consumer business and intend to continue operations in this segment. As we have irrevocably sold the Enterprise business to Consona, the operations and cash flows of the disposed business have been completely eliminated from the ongoing operations of Support.com. We have no continuing involvement in the operations of the disposed business. Therefore, we are reporting the Enterprise business as a discontinued operation as of June 23, 2009, and for all periods presented in accordance with ASC 360, Accounting for the Impairment or Disposal of Long-Lived Assets.
Operating results for the discontinued operation are listed below for the years ended December 31, 2009 and 2008, respectively (in thousands):
|
2009
|
2008
|
|||||||
|
Revenue:
|
||||||||
|
License
|
$ | 1,238 | $ | 11,814 | ||||
|
Maintenance
|
6,783 | 15,881 | ||||||
|
Services
|
4,658 | 14,365 | ||||||
|
Total revenue
|
12,679 | 42,060 | ||||||
|
Costs and expenses:
|
||||||||
|
Costs of license
|
215 | 337 | ||||||
|
Cost of maintenance
|
730 | 1,743 | ||||||
|
Cost of services
|
4,117 | 12,072 | ||||||
|
Amortization of intangible assets
|
— | 90 | ||||||
|
Research and development
|
865 | 2,848 | ||||||
|
Sales and marketing
|
4,067 | 11,808 | ||||||
|
Total costs and expenses
|
9,994 | 28,898 | ||||||
|
Income from discontinued operations, before income taxes
|
$ | 2,685 | $ | 13,162 | ||||
Summary results from discontinued operations, including gain on sale and tax impact, are summarized as follows:
|
2009
|
2008
|
|||||||
|
Income from discontinued operations, before income taxes
|
$ | 2,685 | $ | 13,162 | ||||
|
Gain on sale of discontinued operations
|
9,130 | — | ||||||
|
Taxes on discontinued operations
|
(4,811 | ) | (558 | ) | ||||
|
Income from discontinued operations, after income taxes
|
$ | 7,004 | $ | 12,604 | ||||
Income from discontinued operations, before income taxes, represents the Enterprise Business’ historic segment reporting, including all directly attributable revenues (license, maintenance and professional services) and costs (cost of goods sold, research and development and sales and marketing). These revenues and costs are consistent with prior reporting methodologies, but exclude all corporate costs, primarily facilities and information technology, which were previously allocated to the segment.
Tax expenses have been attributed to discontinued operations or continuing operations based on specific analysis for federal, state and international amounts. We recorded approximately $31,000 of income tax benefit related to our discontinued operations for the year ended December 31, 2010. This tax benefit is a result of additional foreign interest build netted against releases of previously booked tax reserves, foreign tax return to provision true-ups, and federal tax true-up on the Enterprise business sold to Consona Corporation.
Note 3. Business Combination
Xeriton, Inc.
On December 7, 2009, we signed an Asset Purchase Agreement (“APA”) to acquire substantially all of the assets of privately-held consumer software provider Xeriton, Inc. (“Xeriton”) (the “Acquisition”). No stock was acquired as part of the transaction. Xeriton provides consumer software products designed to improve and optimize the performance and security of users’ computers (such as Advanced Registry Optimizer, Hard Disk Tune Up, MemTurbo, and a number of computer security products). We paid a total cash-only consideration of $8.5 million for the acquired assets and liabilities. In addition, we paid deal-related expenditures of approximately $542,000 which are included in general and administrative expense.
We engaged an independent third-party appraisal firm to assist in determining the fair value of assets acquired and liabilities assumed. Such a valuation requires management to make significant estimates, especially with respect to intangible assets. These estimates are based on historical experience and information obtained from the management of the acquired company. The purchase price for Xeriton exceeded the fair value of the net tangible and intangible assets acquired. As a result, we have recorded goodwill in connection with this transaction. The goodwill is not expected to be deductible for tax purposes.
The operating results of the business acquired from Xeriton are included in our accompanying consolidated statements of operations from December 7, 2009, the date of acquisition.
The tangible and identifiable intangible assets and liabilities acquired are summarized as follows. The financial information presented includes purchase accounting adjustments to the tangible and intangible assets (in thousands):
|
Amounts
|
Amortization Period
|
||||
|
Cash
|
$ | 557 | |||
|
Accounts receivable
|
270 | ||||
|
Other current assets
|
22 | ||||
|
Fixed assets
|
26 | ||||
|
Accrued liabilities
|
(729 | ) | |||
|
Deferred revenue
|
(174 | ) | |||
|
Net liabilities assumed
|
(28 | ) | |||
|
Identifiable intangible assets:
|
|||||
|
Technology/Technology Rights
|
420 |
48 months
|
|||
|
Tradenames
|
450 |
48 months
|
|||
|
Non-Compete
|
140 |
36 months
|
|||
|
Ask Jeeves/IAC Partner Relationship
|
120 |
36 months
|
|||
|
Blue Phone Customer Base
|
30 |
36 months
|
|||
|
Email List
|
40 |
12 months
|
|||
|
Goodwill
|
7,328 | ||||
|
Total estimated purchase price
|
$ | 8,500 | |||
YourTechOnline.com
On May 2, 2008, we acquired all of the stock of YourTechOnline.com (“YTO”), a provider of remote technology services based in Kelowna, British Columbia. YTO’s service delivery methodology involves technical support agents who view and control a computer screen remotely. We acquired YTO to bolster our remote service delivery capabilities utilizing work-from-home agents.
When we acquired the business, we engaged an independent third-party appraisal firm to assist in determining the fair values of assets acquired and liabilities assumed. Such a valuation requires management to make significant estimates, especially with respect to intangible assets. These estimates are based on historical experience and information obtained from the management of the acquired company. The total purchase price was approximately $2.8 million, including cash consideration of $2.7 million and direct transaction costs of $0.1 million. Of the cash paid at closing, approximately $0.5 million was held in an escrow account for specified indemnity obligations. The purchase price for YTO exceeded the fair value of YTO net tangible and intangible assets acquired. As a result, we have recorded goodwill in connection with this transaction. The goodwill is not expected to be deductible for tax purposes.
The operating results of YTO are included in our accompanying consolidated statements of operations from May 2, 2008, the date of the Acquisition.
To get the full benefits of YTO’s service delivery methodology, we deemed it important to retain certain key YTO employees in our Consumer business segment. These key employees signed non-compete agreements restricting their ability to attain competing employment outside Support.com for two years after the Acquisition. In addition, we placed value on YTO’s referral partner relationships and existing customer relationships.
The tangible and identifiable intangible assets and liabilities acquired are summarized below. The financial information presented includes purchase accounting adjustments to the tangible and intangible assets:
|
Amount
(in thousands)
|
Amortization
Period
|
||||
|
Cash
|
$ | 48 | |||
|
Accounts receivable, net
|
45 | ||||
|
Accrued liabilities
|
(401 | ) | |||
|
Net liabilities assumed
|
(308 | ) | |||
|
Identifiable intangible assets:
|
|||||
|
Non-compete agreements
|
224 |
18 months
|
|||
|
Referral partner relationships
|
25 |
36 months
|
|||
|
Customer relationships
|
31 |
36 months
|
|||
|
Goodwill
|
2,854 | ||||
|
Total estimated purchase price
|
$ | 2,826 | |||
Note 4. Property and Equipment
Property and equipment are stated at cost and consist of the following (in thousands):
|
December 31,
|
||||||||
|
2010
|
2009
|
|||||||
|
Computer equipment and software
|
$ | 3,797 | $ | 3,327 | ||||
|
Furniture and office equipment
|
337 | 316 | ||||||
|
Leasehold improvements
|
399 | 396 | ||||||
|
Construction in progress
|
69 | 62 | ||||||
| 4,602 | 4,101 | |||||||
|
Accumulated depreciation
|
(3,979 | ) | (3,654 | ) | ||||
| $ | 623 | $ | 447 | |||||
Depreciation expense was $323,000, $580,000, and $1.1 million, for the years ended December 31, 2010, 2009, and 2008, respectively.
Note 5. Intangible assets
Amortization expense related to intangible assets was $364,000 in 2010, including amortization from the YTO acquisition of $18,000 and amortization from the Xeriton acquisition of $346,000. Amortization expense related to intangible assets was $177,000 in 2009, including amortization from the YTO acquisition of $143,000 and amortization from the Xeriton acquisition of $34,000.
In December 2006, we acquired the use of a toll-free telephone number for cash consideration of $250,000. This asset has an indefinite useful life. The intangible asset is tested for impairment annually or more often if events or changes in circumstances indicate that the carrying value may not be recoverable.
The following table summarizes the components of intangible assets (in thousands):
|
Non-compete
|
Partner
Relationships
|
Customer Base
|
Technology
Rights
|
Tradenames
|
Indefinite Life Intangibles
|
Total
|
||||||||||||||||||||||
|
As of December 31, 2010
|
||||||||||||||||||||||||||||
|
Gross carrying value
|
$ | 364 | $ | 145 | $ | 100 | $ | 420 | $ | 450 | $ | 250 | $ | 1,729 | ||||||||||||||
|
Accumulated amortization
|
(274 | ) | (65 | ) | (78 | ) | (114 | ) | (122 | ) | — | (653 | ) | |||||||||||||||
|
Net carrying value
|
$ | 90 | $ | 80 | $ | 22 | $ | 306 | $ | 328 | $ | 250 | $ | 1,076 | ||||||||||||||
|
As of December 31, 2009
|
||||||||||||||||||||||||||||
|
Gross carrying value
|
$ | 364 | $ | 145 | $ | 100 | $ | 430 | $ | 450 | $ | 250 | $ | 1,739 | ||||||||||||||
|
Accumulated amortization
|
(227 | ) | (17 | ) | (22 | ) | (14 | ) | (9 | ) | — | (289 | ) | |||||||||||||||
|
Net carrying value
|
$ | 137 | $ | 128 | $ | 78 | $ | 416 | $ | 441 | $ | 250 | $ | 1,450 | ||||||||||||||
The estimated future amortization expense of intangible assets, with the exception of the indefinite-life intangible assets as of December 31, 2010 is as follows (in thousands):
|
Fiscal Year
|
Amount
|
|||
|
2011
|
$ | 319 | ||
|
2012
|
307 | |||
|
2013
|
200 | |||
|
Total
|
$ | 826 | ||
|
Weighted average remaining useful life
|
2.7 years
|
|||
The following table summarizes the components of purchased technology (in thousands):
|
As of December 31,
2010
|
As of December 31,
2009
|
|||||||
|
Purchased technology
|
$ | 350 | $ | 350 | ||||
|
Accumulated amortization
|
(124 | ) | (41 | ) | ||||
|
Total purchased technology, net
|
$ | 226 | $ | 309 | ||||
The estimated future amortization expense of purchased technology as of December 31, 2010 is as follows (in thousands):
|
Fiscal Year
|
Amount
|
|||
|
2011
|
$ | 82 | ||
|
2012
|
82 | |||
|
2013
|
62 | |||
|
Total
|
$ | 226 | ||
|
Remaining useful life
|
2.8 years
|
|||
Note 6. Commitments and Contingencies
Headquarters office lease. In November 2006, we entered into a noncancelable lease agreement for its new headquarters office facility located in Redwood City, California. The lease commenced on January 1, 2007 and ends on July 31, 2012. The annual fixed rents are $805,000 and $483,000 for the years ended December 31, 2011 and 2012, respectively, as long as we are not in default under the term of the lease. We issued an unsecured irrevocable standby letter of credit of $100,000 to the landlord as a security deposit under the lease on February 1, 2011.
Other facility leases. We lease our facilities under noncancelable operating lease agreements, which expire at various dates through 2011.
Total facility rent expense pursuant to all operating lease agreements was approximately $599,000, $947,000, and $1.3 million for the years ended December 31, 2010, 2009, and 2008, respectively.
As of December 31, 2010, minimum payments due under all noncancelable lease agreements (including for offices that have been impaired) were as follows (in thousands):
|
Years ending December 31,
|
Operating Leases
|
|||
|
2011
|
$ | 1,049 | ||
|
2012
|
557 | |||
|
Total minimum lease and principal payments
|
$ | 1,606 | ||
Tax contingencies
We are required to make periodic filings in the jurisdictions where we are deemed to have a presence for tax purposes. We have undergone audits in the past and have paid assessments arising from these audits. During the fourth quarters of 2008 and 2009, our India entity was issued notices of income tax assessment pertaining to the 2004-2005 and 2005-2006 fiscal years. The notices claimed that the transfer price used in our inter-company agreements with our India entity was too low, and that the rate should be increased. We believe our current transfer pricing position is more likely than not to be sustained. We believe that this will be resolved through the normal judicial appeal process used in India, and have submitted our case to the court.
We may be subject to other income tax assessments in the future. We evaluate estimated losses that could arise from those assessments in accordance with ASC 740. We consider such factors as the degree of probability of an unfavorable outcome and the ability to make a reasonable estimate on the amount of loss. We record the estimated liability amount for those assessments that we consider to be more likely than not in our balance sheet.
Legal contingencies
In November 2001, a class action lawsuit was filed against us, two of our former officers and certain underwriters in the United States District Court for the Southern District of New York. Similar complaints have been filed against 55 underwriters and more than 300 other companies and other individual officers and directors of those companies; the consolidated case is In re Initial Public Offering Securities Litigation, No. 21 MC 92 (SAS) (S.D.N.Y.). The lawsuit, which sought unspecified damages, fees and costs, alleged that our registration statement and prospectus dated July 18, 2000 for the issuance and initial public offering of 4,250,000 shares of our common stock contained material misrepresentations and/or omissions related to alleged inflated commissions received by the underwriters of the offering. On April 1, 2009, all parties entered into a Stipulation and Agreement of Settlement that would resolve all claims and dismiss the case against us and our former officers, without any payment by us or our former officers. On October 5, 2009, the court issued an order approving the settlement. Certain other parties have appealed the settlement and the appeal is pending.
We are also subject to other routine legal proceedings, as well as demands, claims and threatened litigation, that arise in the normal course of our business, potentially including assertions that we may be infringing patents or other intellectual property rights of others. We accrue for legal contingencies if we can estimate the potential liability and if we believe it is more likely than not that the case will be ruled against us. If a legal claim for which we did not accrue is resolved against us, we would record the expense in the period in which the ruling was made. We currently do not believe that the ultimate amount of liability, if any, for any pending claims of any type (alone or combined) will materially affect our financial position, results of operations or cash flows. The ultimate outcome of any litigation is uncertain, however, and unfavorable outcomes could have a material negative impact on our financial condition and operating results. Regardless of outcome, litigation can have an adverse impact on us because of defense costs, negative publicity, diversion of management resources and other factors.
Guarantees
The Company has identified guarantees in accordance with ASC 450. The guidance stipulates that an entity must recognize an initial liability for the fair value, or market value, of the obligation it assumes under the guarantee at the time it issues such a guarantee, and must disclose that information in its interim and annual financial statements. The Company has entered into various service level agreements with its channel partners, in which the Company may guarantee the maintenance of certain service level thresholds. Under some circumstances, if the Company does not meet these thresholds, the Company may be liable for certain financial costs. The Company evaluates costs for such guarantees under the statement for accounting for contingencies, as interpreted by the guidance for guarantor’s accounting and disclosure requirements for guarantees. The Company considers such factors as the degree of probability that the Company would be required to satisfy the liability associated with the guarantee and the ability to make a reasonable estimate of the resulting cost. To date, the Company has not incurred material costs as a result of any such obligations and has not accrued any liabilities related to such obligations in its financial statements.
Note 7. Restructuring Obligations and Other Charges
In the fourth quarter of 2008, we reduced our workforce by 33 employees, or approximately 10% of our non-agent workforce at that time, and closed certain facilities to reduce our ongoing cost structure. As a result, we recorded a restructuring and impairment charge of $1.9 million in 2008. All of the affected employees were terminated as of December 31, 2008. The restructuring charge was primarily comprised of employee termination costs, professional services costs and facilities impairment costs. Restructuring and impairment expenses included in the consolidated statement of operations for the year ended December 31, 2008 totaled $690,000 in discontinued operations and $1.2 million in continuing operations, including $43,000 for cost of services, $89,000 for research and development, $538,000 for sales and marketing and $525,000 for general and administration. As of December 31, 2009, there was no remaining balance related to this restructuring obligation.
In the first quarter of 2009, we implemented a reduction in our workforce and closed certain facilities worldwide in order to reduce our ongoing cost structure. We reduced our workforce by 17 employees, or approximately 6% of our non-agent headcount. All of the affected employees were terminated as of March 31, 2009. As a result, we recorded a restructuring charge of $896,000 in 2009. The restructuring charge was primarily comprised of employee termination costs, professional services costs and facilities impairment costs. Restructuring and impairment expenses included in the consolidated statement of operations totaled $821,000 in discontinued operations and $75,000 in continuing operations, including $6,000 for sales and marketing and $69,000 for general and administrative. As of December 31, 2010, the remaining balance of the restructuring obligation was $111,000, related to one facility in the United Kingdom, which we expect to pay through 2011.
In the second quarter of 2009, we implemented a reduction in our workforce in order to align our ongoing cost structure with the scale of our revenue following the sale of our Enterprise business. We reduced our workforce by 23 employees, or approximately 19% of our non-technology support agent workforce. All of the affected employees were terminated as of June 30, 2009. In addition, we terminated the lease for our Canadian facility, which we had previously impaired as of December 31, 2008. We reversed the remaining impairment balance accrued for this facility’s lease payments, in the amount of $219,000. As a result of these actions, we recorded a restructuring charge of approximately $345,000 in the second quarter of 2009. The restructuring charge was primarily comprised of employee terminations costs and professional services costs. Restructuring expenses included in the consolidated statement of operations were $62,000 for cost of service, $187,000 for research and development, $315,000 for sales and marketing and $(219,000) for general and administrative due to the reversal of the Canadian facility lease accrual. As of December 31, 2009, there was no remaining balance related to this restructuring obligation.
In the third quarter of 2009, we ceased using a portion of our headquarters office in order to align our facilities usage with our current size. As a result, we impaired approximately 46% of our Redwood City facility. We recorded a restructuring charge of approximately $1.3 million, which related to the facility impairment and is included in our general and administrative expenses in our consolidated statement of operations. As of December 31, 2010, the remaining balance on this restructuring obligation was $550,000, which we expect to pay through 2012.
The following table summarizes activity associated with the restructuring and related expenses incurred for the years ended December 31, 2010 and 2009 (in thousands):
|
Severance(1)
|
Facilities(2)
|
Impairment(3)
|
Total
|
|||||||||||||
|
Restructuring costs incurred
|
$ | 731 | $ | 360 | $ | 105 | $ | 1,196 | ||||||||
|
Cash payments
|
(111 | ) | (28 | ) | — | (139 | ) | |||||||||
|
Non-cash charges
|
— | — | (105 | ) | (105 | ) | ||||||||||
|
Restructuring obligations, December 31, 2008
|
620 | 332 | — | 952 | ||||||||||||
|
Restructuring costs incurred
|
640 | 1,299 | 259 | 2,198 | ||||||||||||
|
Cash payments
|
(1,260 | ) | (389 | ) | — | (1,649 | ) | |||||||||
|
Non-cash charges
|
— | — | (259 | ) | (259 | ) | ||||||||||
|
Restructuring obligations, December 31, 2009
|
— | 1,242 | — | 1,242 | ||||||||||||
|
Cash payments
|
— | (581 | ) | — | (581 | ) | ||||||||||
|
Restructuring obligations, December 31, 2010
|
$ | — | $ | 661 | $ | — | $ | 661 | ||||||||
______________________
|
(1)
|
Severance costs include those expenses related to severance pay and related employee benefit obligations.
|
|
(2)
|
Facilities costs include obligations under non-cancelable leases for facilities that we will no longer occupy, as well as penalties associated with early terminations of leases and disposal of fixed assets. No sublease income has been included.
|
|
(3)
|
As part of the restructuring costs included in the table above, the Company wrote-off fixed assets related to the facilities that it will no longer occupy. This is a non-cash charge.
|
Note 8. Stockholders’ Equity
Stock Option Plans
We adopted the 1998 Stock Option Plan (the “1998 Plan”). Under this Plan, up to 9,424,434 shares of our common stock may be granted as options or sold to eligible participants. Under the 1998 Plan, options to purchase common stock may be granted at no less than 85% of the fair value on the date of the grant (110% of fair value in certain instances), as determined by the Board of Directors. Options under the 1998 Plan can be immediately exercisable at the Board of Directors’ discretion; however, shares issued are subject to our right to repurchase such shares at the original issuance price, which lapses in a series of installments measured from the vesting commencement date of the option. In December 2009, this Plan was expired and left zero shares available for grant.
We also adopted the 2000 Omnibus Equity Incentive Plan (the “2000 Plan”). A total of 4,000,000 shares of common stock were initially reserved for issuance to eligible participants under the 2000 Plan. On January 1 of each year, the number of shares reserved may be increased by the lesser of 2,000,000 shares, 5% of outstanding shares, or an amount determined by the Board of Directors. On January 1, 2010, there were no shares reserved under the 2000 Plan. In February 2010, this Plan was cancelled and left zero shares available for grant.
On July 27, 2009, we announced a tender offer (the “Exchange Offer”) in which we extended to our employees the opportunity to exchange outstanding options to purchase shares of our common stock granted under our 2000 Plan, as amended that were outstanding as of July 27, 2009 and that had exercise prices per share greater than $2.32, the last reported sale price per share of our common stock on The Nasdaq Global Select Market on August 21, 2009 (“Eligible Options”). We made this offer on the terms and subject to the conditions set forth in the Exchange Offer documentation filed with the SEC, including a new three-year vesting schedule for the new options granted in the exchange. Eligible Options were exchanged for an equivalent number of new nonqualified stock options (“New Options”) that we granted under the 2000 Plan, as amended. In exchange for tendered options, we granted options to purchase approximately 4.1 million shares of common stock to Eligible Option holders on August 21, 2009, with an exercise price for the New Options equal to $2.32. We conducted a valuation of exchanged options immediately before and immediately after the exchange in order to calculate the incremental stock compensation expense related to the exchange. The total incremental expense of approximately $1.2 million is recognized ratably over the 3-year vesting term of the exchanged options.
We have adopted the 2010 Equity and Performance Incentive Plan (the “2010 Plan”), effective as of February 8, 2010. Under this Plan, the number of shares of Common Stock that may be issued will not exceed in the aggregate 5,000,000 shares of Common Stock plus the number of shares of Common Stock relating to the prior awards under the 2000 Plan that expire, are forfeited or cancelled after the adoption of the Plan. No grants will be made under this Plan after the tenth anniversary of the effective date. As of December 31, 2010, options to purchase approximately 9.6 million shares were outstanding and an aggregate of approximately 4.9 million shares remain available for grant under the 2010 Plan.
The following table represents stock option activity for the years ended December 31, 2008, 2009, and 2010:
|
Number of
Shares
|
Weighted
Average
Exercise Price
|
Weighted
Average
Remaining
Contractual
Term
|
Aggregate
Intrinsic Value
(in ‘000’s)
|
|||||||||||||
|
Outstanding options at December 31, 2007
|
12,738,765 | $ | 4.98 | 5.82 | $ | 3,377 | ||||||||||
|
Granted
|
4,100,988 | $ | 3.02 | |||||||||||||
|
Exercised
|
(2,333 | ) | $ | 0.10 | ||||||||||||
|
Forfeited
|
(3,203,840 | ) | $ | 4.87 | ||||||||||||
|
Outstanding options at December 31, 2008
|
13,633,580 | $ | 4.41 | 4.54 | $ | 243 | ||||||||||
|
Granted
|
8,301,338 | $ | 2.36 | |||||||||||||
|
Exercised
|
(244,770 | ) | $ | 1.47 | ||||||||||||
|
Forfeited
|
(11,011,091 | ) | $ | 4.60 | ||||||||||||
|
Outstanding options at December 31, 2009
|
10,679,057 | $ | 2.70 | 5.08 | $ | 2,559 | ||||||||||
|
Granted
|
1,471,900 | $ | 3.53 | |||||||||||||
|
Exercised
|
(1,681,591 | ) | $ | 2.70 | ||||||||||||
|
Forfeited
|
(883,002 | ) | $ | 2.67 | ||||||||||||
|
Outstanding options at December 31, 2010
|
9,586,364 | $ | 2.83 | 4.48 | $ | 35,074 | ||||||||||
|
Options vested and expected to vest
|
9,522,027 | $ | 2.83 | 4.48 | $ | 34,951 | ||||||||||
|
Exercisable at December 31, 2010
|
3,704,976 | $ | 3.13 | 3.68 | $ | 12,450 | ||||||||||
The aggregate intrinsic value in the table above represents the total pre-tax intrinsic value that would have been received by the option holders had they all exercised their options on December 31, 2010, 2009, and 2008. This amount will change based on the fair market value of our stock. The total aggregate intrinsic value of options exercised under our stock option plans was $5.0 million, $561,000 and $8,000 for the years ended December 31, 2010, 2009 and 2008, respectively. The total fair value of options vested during 2010, 2009 and 2008 was $3.0 million, $3.8 million and $4.9 million, respectively.
At December 31, 2010, there was $6.4 million of unrecognized compensation cost related to existing options outstanding which is expected to be recognized over a weighted average period of 2.4 years.
Employee Stock Purchase Plan
In the second quarter of 2009 we sold our Enterprise business to Consona. A sale of this nature qualified as the sale of “substantially all the assets of the business,” and according to the terms of the ESPP plan document such a sale automatically terminated the ESPP. As a result of the automatic termination of the ESPP, we reversed all ESPP expenses related to the purchase period as of the time of the termination and refunded all amounts to the employees.
In the first quarter of 2009, prior to the sale of the Enterprise business, there was a purchase made and 74,041 shares were issued through the Purchase Plan. For the year ended December 31, 2008, there were 127,301shares issued through the Purchase Plan.
Stock Repurchase Program
On April 27, 2005, our Board of Directors authorized the repurchase of up to 2,000,000 outstanding shares of our common stock. As of December 31, 2010 the maximum number of shares remaining that can be repurchased under this program was 1,807,402.
Note 9. Income Taxes
The components of our loss before income taxes are as follows (in thousands):
|
Years Ended December 31,
|
||||||||||||
|
2010
|
2009
|
2008
|
||||||||||
|
United States
|
$ | (17,794 | ) | $ | (5,292 | ) | $ | (19,324 | ) | |||
|
Foreign
|
(158 | ) | (9,415 | ) | 758 | |||||||
|
Total
|
$ | (17,952 | ) | $ | (14,707 | ) | $ | (18,566 | ) | |||
|
Income(loss) from discontinued operations, before income taxes
|
$ | 58 | $ | 11,815 | $ | 13,162 | ||||||
|
Income (loss) from continuing operations, before income taxes
|
$ | (18,010 | ) | $ | (26,522 | ) | $ | (31,728 | ) | |||
The provision for income taxes from continuing operations consisted of the following (in thousands):
|
Years Ended December 31,
|
||||||||||||
|
2010
|
2009
|
2008
|
||||||||||
|
Current:
|
||||||||||||
|
Federal
|
$ | 58 | $ | (4,534 | ) | $ | (19 | ) | ||||
|
State
|
30 | (407 | ) | — | ||||||||
|
Foreign
|
48 | 29 | 27 | |||||||||
|
Total current
|
136 | (4,912 | ) | 8 | ||||||||
|
Deferred:
|
||||||||||||
|
Foreign
|
(48 | ) | (29 | ) | (26 | ) | ||||||
|
Total provision for income taxes
|
$ | 88 | $ | (4,941 | ) | $ | (18 | ) | ||||
The reconciliation of the federal statutory income tax rate to our effective income tax rate is as follows (in thousands):
|
Years Ended December 31,
|
||||||||||||
|
2010
|
2009
|
2008
|
||||||||||
|
Provision at federal statutory rate
|
$ | (6,283 | ) | $ | (9,283 | ) | $ | (11,104 | ) | |||
|
State taxes
|
30 | (407 | ) | — | ||||||||
|
Permanent differences/other
|
254 | 207 | 50 | |||||||||
|
Stock-based compensation
|
(1 | ) | 105 | 192 | ||||||||
|
Federal valuation allowance provided
|
6,030 | 693 | 6,963 | |||||||||
|
Impact of discontinued operations
|
58 | 3,744 | 3,881 | |||||||||
|
Provision for income taxes
|
$ | 88 | $ | (4,941 | ) | $ | (18 | ) | ||||
Deferred income taxes reflect the net tax effects of temporary differences between the carrying amounts of assets and liabilities for financial reporting purposes and the amounts used for income tax purposes. The Company’s India based subsidiary was granted a tax holiday related to its research and development activities, which is expected to expire on March 31, 2011. The cumulative effect of the tax holiday was $187,000, yielding a per share effect of zero. Significant components of our deferred tax assets and liabilities are as follows (in thousands):
|
December 31,
|
||||||||
|
2010
|
2009
|
|||||||
|
Deferred tax assets:
|
||||||||
|
Accruals and reserves
|
$ | 4,358 | $ | 3,637 | ||||
|
Capitalized research and development
|
— | 10 | ||||||
|
Net operating loss carryforwards
|
41,966 | 36,304 | ||||||
|
Research and development tax credits
|
4,392 | 4,401 | ||||||
|
Other credits
|
196 | 147 | ||||||
|
Intangible assets
|
86 | 266 | ||||||
|
Fixed assets
|
372 | 395 | ||||||
|
Gross deferred tax assets
|
51,370 | 45,160 | ||||||
|
Valuation allowance
|
(51,043 | ) | (45,013 | ) | ||||
|
Total deferred tax assets
|
327 | 147 | ||||||
|
Total deferred tax liabilities
|
— | — | ||||||
|
Net deferred tax assets(liabilities)
|
$ | 327 | $ | 147 | ||||
ASC 740 provides for the recognition of deferred tax assets if realization of such assets is more likely than not to occur. Based upon management’s review of both the positive and negative evidence, which includes our historical operating performance, reported cumulative net losses since inception and difficulty in accurately forecasting its results, the Company has concluded that it is not more likely than not that the Company will be able to realize all of the U.S. and Canadian deferred tax assets. Therefore, the Company has provided a full valuation allowance against our U.S. and Canadian deferred tax assets. There is no valuation allowance against the Company’s India deferred tax assets primarily relating to Minimum Alternative Tax (MAT). The Company reassesses the need for its valuation allowance on a quarterly basis.
Based upon management’s review discussed above, the realization of deferred tax assets is dependent on improvements over present levels of consolidated pre-tax income. In the case that the Company reaches profitability that exceeds a taxable loss, the Company will realize its deferred tax assets. The federal taxable income level that will utilize gross net operating losses deferred tax assets is approximately $100.5 million. When the Company reaches federal taxable income, the Company will be subject to alternative minimum tax.
The net valuation allowance increased by approximately $6.0 million, and $0.7 million, during the years ended December 31, 2010, and 2009, respectively. The increase in the Company’s net operating losses for the year ended December 31, 2010 is primarily due to the addition of federal net operating losses of $5.8 million.
As of December 31, 2010, the Company had federal and state net operating loss carryforwards of approximately $100.5 million and $71.9 million, respectively. The Company also had federal and state research and development credit carryforwards of approximately $2.5 million and $1.5 million, respectively. Of these amounts, approximately $8.9 million of federal net operating loss carryforwards are related to stock option deductions which, if utilized, will be accounted for as an addition to equity rather than as a reduction of the provision for income taxes. The federal net operating loss and credit carryforwards will expire at various dates beginning in 2018 through 2030, if not utilized. The state net operating loss carryforwards will expire at various dates beginning in 2012 through 2030, if not utilized. The state research and development credit carryforwards do not have an expiration date.
Utilization of net operating loss carryforwards and credits may be subject to substantial annual limitation due to the ownership change limitations provided by the Internal Revenue Code of 1986, as amended, and similar state provisions. The annual limitation may result in the expiration of net operating losses and credits before utilization.
Generally, the amount of tax expense or benefit allocated to continuing operations is determined without regard to the tax effects of other categories of income or loss, such as income from discontinued operations. However, an exception is provided in ASC 740 when there is a pre-tax loss from continuing operations and pre-tax income from other categories in the current year. As a result, for the year ended December 31, 2009, the Company recorded a tax expense of $4.9 million in discontinued operations related to the gain on sale of the Enterprise business, and recorded an off-setting tax benefit of $4.9 million in continuing operations. For the year ended December 31, 2010, the Company recorded a tax benefit of $58,000 in discontinuing operations and recorded an off-setting tax expense of $58,000 in continuing operations.
ASC 740 clarifies the accounting for uncertainties in income taxes by prescribing guidance for the recognition, de-recognition and measurement in financial statements of income tax positions taken in previously filed tax returns or tax positions expected to be taken in tax returns, including a decision whether to file or not to file in a particular jurisdiction. ASC 740 requires that any liability created for unrecognized tax benefits be disclosed. The application of ASC 740 may also affect the tax bases of assets and liabilities and therefore may change or create deferred tax liabilities or assets.
A reconciliation of the beginning and ending amount of unrecognized tax benefits is as follows (in thousands):
|
Years Ended December 31,
|
||||||||||||
|
2010
|
2009
|
2008
|
||||||||||
|
Balance at beginning of year
|
$ | 3,706 | $ | 2,361 | $ | 2,005 | ||||||
|
Increase related to prior year tax positions
|
226 | 1,331 | — | |||||||||
|
Decrease related to prior year tax positions
|
(5 | ) | — | — | ||||||||
|
Increase related to current year tax positions
|
63 | 211 | 369 | |||||||||
|
Settlements with tax authorities
|
— | (90 | ) | — | ||||||||
|
Decrease related to lapse of statute of limitations
|
(214 | ) | (107 | ) | (13 | ) | ||||||
|
Balance at end of year
|
$ | 3,776 | $ | 3,706 | $ | 2,361 | ||||||
The Company’s total amounts of unrecognized tax benefits that, if recognized, would affect its effective tax rate are $0.8 million and $0.8 million as of December 31, 2010 and 2009, respectively.
Upon adoption of ASC 740-10 (FIN 48), the Company’s policy to include interest and penalties related to unrecognized tax benefits within its provision for (benefit from) income taxes did not change. The Company had $117,000 accrued for payment of interest and penalties related to unrecognized tax benefit as of December 31, 2010. The company had $121,000 and $59,000 accrued for payment of interest and penalties related to unrecognized tax benefit as of December 31, 2009 and 2008, respectively. The Company recognized $40,000 of interest and penalties related to unrecognized tax benefits income taxes during the year ended December 31, 2010.
As of December 31, 2010, the amount of recognized tax benefit where it is reasonably possible that a significant change may occur in the next 12 months is approximately $134,000. The change would result from expiration of a statute of limitations in a foreign jurisdiction.
The tax years 1997 to 2010 remain open in several jurisdictions, none of which has individual significance.
Note 10. Quarterly Financial Information (Unaudited)
Selected quarterly financial information for 2010 and 2009 is as follows:
|
Fiscal Year 2010 Quarter Ended
|
||||||||||||||||
|
Mar. 31,
2010
|
Jun. 30,
2010
|
Sept. 30,
2010
|
Dec. 31,
2010
|
|||||||||||||
|
(in thousands, except per share data)
|
||||||||||||||||
|
Statements of Operations Data:
|
||||||||||||||||
|
Revenue:
|
||||||||||||||||
|
Services
|
$ | 6,730 | $ | 6,882 | $ | 9,280 | $ | 9,384 | ||||||||
|
Software and other
|
3,129 | 3,004 | 2,898 | 2,870 | ||||||||||||
|
Total revenue
|
9,859 | 9,886 | 12,178 | 12,254 | ||||||||||||
|
Cost of revenue:
|
||||||||||||||||
|
Cost of services
|
5,484 | 7,346 | 6,927 | 6,980 | ||||||||||||
|
Cost of software and other
|
348 | 335 | 294 | 381 | ||||||||||||
|
Total cost of revenue
|
5,832 | 7,681 | 7,221 | 7,361 | ||||||||||||
|
Gross profit
|
4,027 | 2,205 | 4,957 | 4,893 | ||||||||||||
|
Operating expenses:
|
||||||||||||||||
|
Research and development
|
1,343 | 1,281 | 1,274 | 1,316 | ||||||||||||
|
Sales and marketing
|
3,971 | 4,320 | 4,889 | 4,911 | ||||||||||||
|
General and administrative
|
2,952 | 2,887 | 2,499 | 2,625 | ||||||||||||
|
Amortization of intangible assets
|
88 | 93 | 93 | 90 | ||||||||||||
|
Total operating expenses
|
8,354 | 8,581 | 8,755 | 8,942 | ||||||||||||
|
Loss from operations
|
(4,327 | ) | (6,376 | ) | (3,798 | ) | (4,049 | ) | ||||||||
|
Interest income and other, net
|
186 | 149 | 101 | 104 | ||||||||||||
|
Loss from continuing operations, before income taxes
|
(4,141 | ) | (6,227 | ) | (3,697 | ) | (3,945 | ) | ||||||||
|
Income tax provision
|
12 | 10 | 56 | 10 | ||||||||||||
|
Loss from continuing operations, after income taxes
|
(4,153 | ) | (6,237 | ) | (3,753 | ) | (3,955 | ) | ||||||||
|
Income (loss) from discontinued operations, after income taxes
|
(5 | ) | 2 | 30 | 4 | |||||||||||
|
Net loss
|
$ | (4,158 | ) | $ | (6,235 | ) | $ | (3,723 | ) | $ | (3,951 | ) | ||||
|
Basic and diluted earnings per share:
|
||||||||||||||||
|
Loss from continuing operations
|
$ | (0.09 | ) | $ | (0.13 | ) | $ | (0.08 | ) | $ | (0.08 | ) | ||||
|
Income (loss) from discontinued operations
|
(0.00 | ) | 0.0 | 0.00 | 0.00 | |||||||||||
|
Basic and diluted net loss per share
|
$ | (0.09 | ) | $ | (0.13 | ) | $ | (0.08 | ) | $ | (0.08 | ) | ||||
|
Fiscal Year 2009 Quarter Ended
|
||||||||||||||||
|
Mar. 31,
2009
|
Jun. 30,
2009
|
Sept. 30,
2009
|
Dec. 31,
2009
|
|||||||||||||
|
(in thousands, except per share data)
|
||||||||||||||||
|
Statements of Operations Data:
|
||||||||||||||||
|
Revenue:
|
||||||||||||||||
|
Services
|
$ | 3,552 | $ | 3,374 | $ | 4,542 | $ | 5,302 | ||||||||
|
Software and other
|
62 | 59 | 58 | 546 | ||||||||||||
|
Total revenue
|
3,614 | 3,433 | 4,600 | 5,848 | ||||||||||||
|
Cost of revenue:
|
||||||||||||||||
|
Cost of services
|
4,373 | 4,283 | 3,887 | 4,077 | ||||||||||||
|
Cost of software and other
|
— | — | — | 59 | ||||||||||||
|
Total cost of revenue
|
4,373 | 4,283 | 3,887 | 4,136 | ||||||||||||
|
Gross profit (loss)
|
(759 | ) | (850 | ) | 713 | 1,712 | ||||||||||
|
Operating expenses:
|
||||||||||||||||
|
Research and development
|
1,698 | 1,605 | 1,306 | 1,186 | ||||||||||||
|
Sales and marketing
|
2,051 | 2,007 | 1,604 | 2,013 | ||||||||||||
|
General and administrative
|
3,598 | 2,980 | 4,265 | 3,276 | ||||||||||||
|
Amortization of intangible assets
|
42 | 42 | 42 | 51 | ||||||||||||
|
Total operating expenses
|
7,389 | 6,634 | 7,217 | 6,526 | ||||||||||||
|
Loss from operations
|
(8,148 | ) | (7,484 | ) | (6,504 | ) | (4,814 | ) | ||||||||
|
Interest income and other, net
|
(302 | ) | 422 | 117 | 191 | |||||||||||
|
Loss from continuing operations, before income taxes
|
(8,450 | ) | (7,062 | ) | (6,387 | ) | (4,623 | ) | ||||||||
|
Income tax provision (benefit)
|
4 | (2,841 | ) | (918 | ) | (1,186 | ) | |||||||||
|
Loss from continuing operations, after income taxes
|
(8,454 | ) | (4,221 | ) | (5,469 | ) | (3,437 | ) | ||||||||
|
Income (loss) from discontinued operations, after income taxes
|
1,058 | 6,460 | (298 | ) | (216 | ) | ||||||||||
|
Net income (loss)
|
$ | (7,396 | ) | $ | 2,239 | $ | (5,767 | ) | $ | (3,653 | ) | |||||
|
Basic and diluted earnings per share:
|
||||||||||||||||
|
Loss from continuing operations
|
$ | (0.18 | ) | $ | (0.09 | ) | $ | (0.12 | ) | $ | (0.07 | ) | ||||
|
Income (loss) from discontinued operations
|
0.02 | 0.14 | 0.00 | (0.01 | ) | |||||||||||
|
Basic and diluted net loss per share
|
$ | (0.16 | ) | $ | 0.05 | $ | (0.12 | ) | $ | (0.08 | ) | |||||
Note 11. Warrants
On October 25, 2010, Support.com, Inc. entered into a Support Services Agreement (the “Customer Agreement”) with Comcast Cable Communications Management, LLC (“Comcast”), under which Support.com will provide technology support services to customers of Comcast in exchange for fees. In connection with the Customer Agreement, Support.com and Comcast entered into a Warrant Agreement, under which Support.com agreed to issue to Comcast warrants to purchase up to 975,000 shares of Support.com common stock in the future in the event that Comcast meets specified sales milestones under the Customer Agreement. Each warrant, if issued, will have an exercise price per share of $4.9498 and a term of three years from issuance. As of December 31, 2010, none of the performance milestones had been met, and therefore no warrants had been issued. Consequently, the Company has not recorded any warrant-related charges against our revenue for the period ending December 31, 2010. The warrants will be valued as they are earned, and the resulting value will be recorded as a charge against revenue in the period in which the performance milestone is met and the warrant is earned.
Note 12. Subsequent Events
On February 11, 2011, we registered 5 million shares of common stock, under the 2010 Equity and Performance Incentive Plan.
None.
|
ITEM 9A.
|
Disclosure controls and procedures.
We maintain “disclosure controls and procedures,” as such term is defined in Rule 13a-15(e) under the Securities Exchange Act of 1934 (the “Exchange Act”), that are designed to ensure that information required to be disclosed by us in reports that we file or submit under the Exchange Act are recorded, processed, summarized, and reported within the time periods specified in Securities and Exchange Commission rules and forms, and that such information is accumulated and communicated to our management, including our chief executive officer and chief financial officer, as appropriate, to allow timely decisions regarding required disclosure. In designing and evaluating our disclosure controls and procedures, management recognized that disclosure controls and procedures, no matter how well conceived and operated, can provide only reasonable, not absolute, assurance that the objectives of the disclosure controls and procedures are met. Our disclosure controls and procedures have been designed to meet reasonable assurance standards. Additionally, in designing disclosure controls and procedures, our management necessarily was required to apply its judgment in evaluating the cost-benefit relationship of possible disclosure controls and procedures. The design of any disclosure controls and procedures also is based in part upon certain assumptions about the likelihood of future events, and there can be no assurance that any design will succeed in achieving its stated goals under all potential future conditions. Based upon an evaluation of the effectiveness of disclosure controls and procedures, our Chief Executive Officer (CEO) and Chief Financial Officer (CFO) have concluded that as of the end of the period covered by this Annual Report on Form 10-K our disclosure controls and procedures as defined under Exchange Act Rules 13a-15(e) and 15d-15(e) were effective to provide reasonable assurance that information required to be disclosed in our Exchange Act reports is recorded, processed, summarized and reported within the time periods specified by the Securities and Exchange Commission and is accumulated and communicated to management, including the CEO and CFO, as appropriate to allow timely decisions regarding required disclosure.
Changes in Internal Control over Financial Reporting
There have been no changes in our internal control over financial reporting during the fourth quarter of 2010 that have materially affected, or are reasonably likely to materially affect, our internal control over financial reporting.
Report of Management on Internal Control over Financial Reporting.
Our management is responsible for establishing and maintaining adequate internal control over financial reporting, as such term is defined in Exchange Act Rules 13a-15(f). Our internal control system is designed to provide reasonable assurance to our management and Board of Directors regarding the preparation and fair presentation of published financial statements. All internal control systems, no matter how well designed, have inherent limitations. Therefore, even those systems determined to be effective can provide only reasonable assurance with respect to financial statement preparation and presentation.
Under the supervision and with the participation of our management, including our chief executive officer and chief financial officer, we conducted an evaluation of the effectiveness of our internal control over financial reporting based on the framework in Internal Control—Integrated Framework issued by the Committee of Sponsoring Organizations of the Treadway Commission. As part of this evaluation, management established an internal control project team, engaged outside consultants and adopted a project work plan to document and assess the adequacy of our internal control over financial reporting, address any control deficiencies that were identified, and to validate through testing that the controls are functioning as documented. Based on the results of this evaluation, our management has concluded that our internal control over financial reporting was effective as of December 31, 2010 to provide reasonable assurance regarding the reliability of financial reporting and the preparation of financial statements for external reporting purposes in accordance with generally accepted accounting principles. We reviewed the results of management’s assessment with the Audit Committee of Support.com’s Board of Directors.
The effectiveness of our internal control over financial report as of December 31, 2010 has been audited by Ernst & Young LLP, an independent registered public accounting firm, as stated in their report, which is included herein.
|
/s/ Joshua Pickus
|
|
|
Joshua Pickus
Chief Executive Officer and President
|
|
|
/s/ Shelly Schaffer
|
|
|
Shelly Schaffer
Chief Financial Officer and
Executive Vice President of Finance and Administration
|
Report of Independent Registered Public Accounting Firm
on Internal Control over Financial Reporting
The Board of Directors and Stockholders of
Support.com, Inc.
We have audited Support.com, Inc.’s internal control over financial reporting as of December 31, 2010, based on criteria established in Internal Control—Integrated Framework issued by the Committee of Sponsoring Organizations of the Treadway Commission (the COSO criteria). Support.com, Inc.’s management is responsible for maintaining effective internal control over financial reporting, and for its assessment of the effectiveness of internal control over financial reporting included in the accompanying Report of Management on Internal Control over Financial Reporting. Our responsibility is to express an opinion on the company’s internal control over financial reporting based on our audit.
We conducted our audit in accordance with the standards of the Public Company Accounting Oversight Board (United States). Those standards require that we plan and perform the audit to obtain reasonable assurance about whether effective internal control over financial reporting was maintained in all material respects. Our audit included obtaining an understanding of internal control over financial reporting, assessing the risk that a material weakness exists, testing and evaluating the design and operating effectiveness of internal control based on the assessed risk, and performing such other procedures as we considered necessary in the circumstances. We believe that our audit provides a reasonable basis for our opinion.
A company’s internal control over financial reporting is a process designed to provide reasonable assurance regarding the reliability of financial reporting and the preparation of financial statements for external purposes in accordance with generally accepted accounting principles. A company’s internal control over financial reporting includes those policies and procedures that (1) pertain to the maintenance of records that, in reasonable detail, accurately and fairly reflect the transactions and dispositions of the assets of the company; (2) provide reasonable assurance that transactions are recorded as necessary to permit preparation of financial statements in accordance with generally accepted accounting principles, and that receipts and expenditures of the company are being made only in accordance with authorizations of management and directors of the company; and (3) provide reasonable assurance regarding prevention or timely detection of unauthorized acquisition, use, or disposition of the company’s assets that could have a material effect on the financial statements.
Because of its inherent limitations, internal control over financial reporting may not prevent or detect misstatements. Also, projections of any evaluation of effectiveness to future periods are subject to the risk that controls may become inadequate because of changes in conditions, or that the degree of compliance with the policies or procedures may deteriorate.
In our opinion, Support.com, Inc. maintained, in all material respects, effective internal control over financial reporting as of December 31, 2010, based on the COSO criteria.
We also have audited, in accordance with the standards of the Public Company Accounting Oversight Board (United States), the consolidated balance sheets of Support.com, Inc. as of December 31, 2010 and 2009, and the related consolidated statements of operations, stockholders’ equity, and cash flows for each of the three years in the period ended December 31, 2010, and our report dated March 11, 2011, expressed an unqualified opinion thereon.
/s/ Ernst & Young LLP
Palo Alto, California
March 11, 2011
|
ITEM 9B.
|
None.
PART III
|
ITEM 10.
|
The information required by Item 10 of Form 10-K with respect to Item 401 of Regulation S-K regarding our directors is incorporated herein by reference from the information contained in the section entitled “Directors and Nominees” in our definitive Proxy Statement for the 2010 Annual Meeting of Stockholders (the “Proxy Statement”), a copy of which will be filed with the Securities and Exchange Commission.
The information required by Item 10 of Form 10-K with respect to Item 401 of Regulation S-K regarding our executive officers is incorporated herein by reference from the information contained in the section entitled “Executive Compensation and Related Information” in our definitive Proxy Statement.
The information required by Item 10 of Form 10-K with respect to Item 405 of Regulation S-K regarding section 16(a) beneficial ownership compliance is incorporated by reference from the information contained in the section entitled “Section 16(a) Beneficial Ownership Compliance” in our Proxy Statement.
We have adopted a Code of Ethics and Business Conduct for Employees, Officers and Directors which is applicable to all of our directors, executive officers and employees, including our Chief Executive Officer and Chief Financial Officer (our principal executive officer and principal financial and accounting officer, respectively). The Code of Ethics and Business Conduct for Employees, Officers and Directors is available on our web site at http://www.support.com/Company/ir_corporate_governance.html. A copy of the Code of Ethics and Business Conduct for Employees, Officers and Directors will be provided without charge to any person who requests it by writing to the address or telephoning the number indicated under “SEC Filings and other Available Information” on page 8. We will disclose on our web site amendments to or waivers from our Code of Ethics and Business Conduct applicable to our directors or executive officers, including our Chairman and Chief Executive Officer and our Chief Financial Officer, in accordance with all applicable laws and regulations.
The information required by Item 10 of Form 10-K with respect to Items 407(c)(3), 407(d)(4) and 407(d)(5) of Regulation S-K is incorporated by reference from the information contained in the sections entitled “Director Nominations,” “Corporate Governance” and “Committees of the Board of Directors” in our Proxy Statement.
|
ITEM 11.
|
The information required by Item 11 of Form 10-K is incorporated herein by reference from the information contained in the sections entitled “Executive Compensation and Related Information,” “Director Compensation,” “Compensation Committee Report” and “Compensation Committee Interlocks and Insider Participation” in our Proxy Statement.
|
ITEM 12.
|
The information required by Item 12 of Form 10-K with respect to Item 403 of Regulation S-K regarding security ownership of certain beneficial owners and management is incorporated herein by reference from the information contained in the section entitled “Security Ownership of Certain Beneficial Owners and Management” in the Proxy Statement.
Securities Authorized for Issuance Under Equity Compensation Plans
Equity Compensation Plan Information
As of December 31, 2010
|
Plan Category
|
Number of securities to be issued upon exercise of outstanding options, warrants, and rights
(a)
|
Weighted-average exercise price of outstanding options, warrants, and rights
(b)
|
Number of securities remaining available for future issuance under equity compensation plans (excluding securities reflected in column (a))
(c)
|
|||||||||
|
Equity Compensation Plans approved by security holders(1)
|
9,586,364 | $ | 2.83 | 4,885,245 | ||||||||
|
Equity Compensation Plans not approved by security holders(2)
|
— | — | — | |||||||||
|
Total
|
9,586,364 | $ | 2.83 | 4,885,245 | (3) | |||||||
____________________________
|
(1)
|
This is the 2010 Equity and Performance Incentive Plan. Stock options, restricted stock, restricted stock units or stock appreciation rights may be awarded under the 2000 Omnibus Equity Incentive Plan.
|
|
(2)
|
None.
|
|
(3)
|
The number of shares reserved for issuance under the 2010 Equity and Performance Incentive Plan is subject to increase as follows:
|
|
|
The number of shares of Common Stock that may be issued will not exceed in the aggregate 5,000,000 shares of Common Stock plus the number of shares of Common Stock relating to the prior awards under the 2000 Omnibus Equity Incentive Plan that expire, are forfeited or cancelled after the adoption of the 2010 Equity and Performance Incentive Plan.
|
|
ITEM 13.
|
The information required by Item 13 of Form 10-K is incorporated herein by reference from the information contained in the sections entitled “Certain Relationships and Related Transactions,” “Compensation Committee Interlocks and Insider Participation” and “Director Independence” in our Proxy Statement.
|
ITEM 14.
|
The information required by Item 14 of Form 10-K is incorporated herein by reference from the information contained in the sections entitled “Principal Accountant Fees and Services” and “Audit Committee Pre-Approval Policies and Procedures” in our Proxy Statement.
PART IV
|
ITEM 15.
|
|
|
(a)
|
The following documents are filed as part of this report:
|
|
|
(1)
|
Financial Statements—See Index to the Consolidated Financial Statements and Supplementary Data in Item 8 of this report.
|
|
|
(2)
|
Financial Statement Schedules.
|
Schedule II—Valuation and qualifying accounts was omitted as the required disclosures are included in Note 1 to the Consolidated Financial Statements.
All other schedules are omitted since the information required is not applicable or is shown in the Consolidated Financial Statements or notes thereto.
|
|
(3)
|
Exhibits—See in Item 15(b) of this report.
|
|
|
(b)
|
Exhibits.
|
|
Exhibit
|
Description of Document
|
|
|
3.1
|
Restated Certificate of Incorporation, as amended (incorporated by reference to Exhibit 3.1 of Support.com’s annual report on Form 10-K for the year ended December 31, 2001).
|
|
|
3.2
|
Certificate of Amendment to the Company’s Amended and Restated Certificate of Incorporation (incorporated by reference to Exhibit 3.1 of Support.com’s current report on Form 8-K filed on June 23, 2009.
|
|
|
3.3
|
Amended and Restated Bylaws (incorporated by reference to Exhibit 3.2 of Support.com’s current report on Form 8-K filed on July 29, 2010).
|
|
|
4.1
|
Form of Common Stock Certificate (incorporated by reference to Exhibit 4.1 of Support.com’s quarterly report on Form 10-Q for the quarter ended June 30, 2002).
|
|
|
10.1*
|
Registrant’s 2000 Omnibus Equity Incentive Plan (incorporated by reference to Exhibit 10.2 of Amendment No. 8 to Support.com’s registration statement on Form S-1 (File No. 333-30674) filed on July 13, 2000).
|
|
|
10.2*
|
Registrant’s 2010 Equity and Incentive Compensation Plan (Incorporated by reference to Exhibit 4.1 to the Registrant’s Current Report on Form 8-K filed with the Commission on May 21, 2010).
|
|
|
10.3*
|
Form of Directors’ and Officers’ Indemnification Agreement (incorporated by reference to Exhibit 10.4 registration statement on Form S-1 (File No. 333-30674) filed on February 18, 2000).
|
|
|
10.4*
|
Amended and Restated Employment Agreement, dated December 23, 2008, by and between the registrant and Josh Pickus, as amended on July 30, 2009 (incorporated by reference to Exhibit 10.2 of Support.com’s current report filed on Form 8-K on July 31, 2009).
|
|
|
10.5*
|
Employment Offer Letter dated as of January 29, 2008, as amended on July 30, 2009, by and between the Registrant and Shelly Schaffer (incorporated by reference to Exhibit 10.3 of Support.com’s current report on Form 8-K filed on July 31, 2009).
|
|
|
10.6*
|
Amended and Restated Employment Offer Letter dated as of October 6, 2008, by and between the Registrant and Anthony Rodio (incorporated by reference to Exhibit 10.8 of Support.com’s annual report on Form 10-K filed on March 11, 2009).
|
|
|
10.7*
|
Amended and Restated Employment Offer Letter dated as of September 23, 2008, by and between the Registrant and Richard Mandeberg (incorporated by reference to Exhibit 10.9 of Support.com’s annual report on Form 10-K filed on March 11, 2009).
|
|
|
10.8*
|
Employment Offer Letter dated as of April 20, 2010, by and between the Registrant and Timothy Krozek.
|
|
|
10.9*
|
Support.com, Inc. Executive Incentive Compensation Incentive Plan (incorporated by reference to Exhibit 10.2 of Support.com’s current report on Form 8-K filed on February 4, 2008).
|
|
|
10.10*
|
Support.com, Inc. Amended and Restated Executive Incentive Compensation Incentive Plan (incorporated by reference to Exhibit 10.2 of Support.com’s current report on Form 8-K filed on August 1, 2008).
|
|
|
10.11*
|
Support.com, Inc. Amended and Restated Executive Incentive Compensation Incentive Plan (incorporated by reference to Exhibit 10.2 of Support.com’s current report on Form 8-K filed on February 11, 2009).
|
|
|
10.12*
|
Support.com, Inc. Amended and Restated Executive Incentive Compensation Incentive Plan (incorporated by reference to Exhibit 10.2 of Support.com’s current report on Form 8-K filed on July 31, 2009).
|
|
10.13*
|
Support.com, Inc. Amended and Restated Executive Incentive Compensation Plan, as approved by the Board of Directors on February 8, 2010.
|
|
|
10.14
|
Sublease Agreement with Nuance Communications, Inc. dated November 9, 2006 (incorporated by reference to Exhibit 10.1 of Support.com’s current report on form 8-K filed on November 15, 2006).
|
|
|
10.15
|
Professional Services Agreement between Office Depot and Support.com dated July 26, 2007 (incorporated by reference to Exhibit 10.1 of Support.com’s quarterly report on Form 10-Q filed on August 10, 2009).(1)
|
|
|
10.16
|
Change Order Number 1 to Office Depot Remote Service Program Description between Support.com and Office Depot effective as of October 8, 2008 (incorporated by reference to Exhibit 10.1(a) of Support.com’s quarterly report on Form 10-Q filed on August 10, 2009). (1)
|
|
|
10.17
|
Amendment No. 1 to the Professional Services Agreement between Office Depot and Support.com dated October 1, 2008 (incorporated by reference to Exhibit 10.1(b) of Support.com’s quarterly report on Form 10-Q filed on August 10, 2009). (1)
|
|
|
10.18
|
Amendment No. 2 to the Professional Services Agreement between Office Depot and Support.com effective as of June 3, 2009 (incorporated by reference to Exhibit 10.1(c) of Support.com’s quarterly report on Form 10-Q filed on August 10, 2009). (1)
|
|
|
10.19
|
Amendment No. 3 to the Professional Services Agreement between Office Depot and Support.com effective as of July 8, 2009 (incorporated by reference to Exhibit 10.1(d) of Support.com’s quarterly report on Form 10-Q filed on August 10, 2009). (1)
|
|
|
10.20
|
Amendment No. 4 to the Professional Services Agreement between Office Depot and Support.com effective as of August 27, 2009 (incorporated by reference to Exhibit 10.1 of Support.com’s quarterly report on Form 10-Q filed on November 5, 2009). (1)
|
|
|
10.21
|
Amendment No. 5 to the Professional Services Agreement between Office Depot and Support.com effective as of June 22, 2010. (1)
|
|
|
10.22
|
Amendment No. 6 to the Professional Services Agreement between Office Depot and Support.com effective as of September 3, 2010 (incorporated by reference to Exhibit 2.1 of Support.com’s current report on Form 8-K filed on September 20, 2010). (1)
|
|
|
10.23*
|
Form of Stock Option Grant Notification for Officers and Employees.
|
|
|
21.1
|
Subsidiaries of Support.com, Inc.
|
|
|
23.1
|
Consent of Independent Registered Public Accounting Firm
|
|
|
24.1
|
Power of Attorney (see the signature page of this Form 10-K)
|
|
|
31.1
|
Chief Executive Officer Section 302 Certification.
|
|
|
31.2
|
Chief Financial Officer Section 302 Certification.
|
|
|
32.1
|
Statement of the Chief Executive Officer under 18 U.S.C. § 1350(2)
|
|
|
32.2
|
Statement of the Chief Financial Officer under 18 U.S.C. § 1350(2)
|
|
*
|
Denotes an executive or director compensation plan or arrangement.
|
|
(1)
|
Confidential treatment has been requested for portions of this exhibit.
|
|
(2)
|
The material contained in Exhibit 32.1 and 32.2 shall not be deemed “filed” with the SEC and is not to be incorporated by reference into any filing of the Company under the Securities Act of 1933 or the Securities Exchange Act of 1934, whether made before or after the date hereof irrespective of any general incorporation language contained in such filing, except to the extent that the registrant specifically incorporates it by reference.
|
|
|
(c)
|
Financial Statement Schedules.
|
No schedules have been filed because the information required to be set forth therein is not applicable or is shown in the financial statements or related notes included as part of this report.
Pursuant to the requirements of the Section 13 or 15(d) of the Securities Exchange Act of 1934, the Registrant has duly caused this report to be signed on its behalf by the undersigned, thereunto duly authorized, on this 11th day of March, 2011.
|
SUPPORT.COM, INC.
|
||
|
By:
|
/s/ Joshua Pickus
|
|
|
Joshua Pickus
Chief Executive Officer and President
|
||
POWER OF ATTORNEY
KNOW ALL PERSONS BY THESE PRESENTS, that each person whose signature appears below constitutes and appoints Joshua Pickus and Shelly Schaffer, and each of them individually, as his or her attorney-in-fact, each with full power of substitution, for him or her in any and all capacities, to sign any and all amendments to this Report on Form 10-K, and to file the same, with exhibits thereto and other documents in connection therewith, with the Securities and Exchange Commission, hereby ratifying and confirming all that said attorney-in-fact, or his or her substitute, may do or cause to be done by virtue hereof.
Pursuant to the requirements of the Securities Exchange Act of 1934, this report has been signed below by the following persons on behalf of the registrant in the capacities and on the dates indicated:
|
Signature
|
Title
|
Date
|
||
|
/s/ Joshua Pickus
|
Chief Executive Officer and President
|
March 11, 2011
|
||
|
Joshua Pickus
|
(Principal Executive Officer)
|
|||
|
/s/ Shelly Schaffer
|
Chief Financial Officer and Executive Vice
|
March 11, 2011
|
||
|
Shelly Schaffer
|
President of Finance and Administration
(Principal Financial and Accounting Officer) |
|||
|
/s/ Jim Stephens
|
Chairman of the Board of Directors
|
March 11, 2011
|
||
|
Jim Stephens
|
||||
|
/s/ Shawn Farshchi
|
Director
|
March 11, 2011
|
||
|
Shawn Farshchi
|
||||
|
/s/ Mark Fries
|
Director
|
March 11, 2011
|
||
|
Mark Fries
|
||||
|
/s/ Michael Linton
|
Director
|
March 11, 2011
|
||
|
Michael Linton
|
||||
|
/s/ J. Martin O’Malley
|
Director
|
March 11, 2011
|
||
|
J. Martin O’Malley
|
||||
|
/s/ Toni J. Portmann
|
Director
|
March 11, 2011
|
||
|
Toni J. Portmann
|
EXHIBIT INDEX
|
Exhibit
|
Description of Document
|
||
|
3.1
|
Restated Certificate of Incorporation, as amended (incorporated by reference to Exhibit 3.1 of Support.com’s annual report on Form 10-K for the year ended December 31, 2001).
|
||
|
3.2
|
Certificate of Amendment to the Company’s Amended and Restated Certificate of Incorporation (incorporated by reference to Exhibit 3.1 of Support.com’s current report on Form 8-K filed on June 23, 2009.
|
||
|
3.3
|
Amended and Restated Bylaws (incorporated by reference to Exhibit 3.2 of Support.com’s current report on Form 8-K filed on July 29, 2010).
|
||
|
4.1
|
Form of Common Stock Certificate (incorporated by reference to Exhibit 4.1 of Support.com’s quarterly report on Form 10-Q for the quarter ended June 30, 2002).
|
||
|
10.1*
|
Registrant’s 2000 Omnibus Equity Incentive Plan (incorporated by reference to Exhibit 10.2 of Amendment No. 8 to Support.com’s registration statement on Form S-1 (File No. 333-30674) filed on July 13, 2000).
|
||
|
10.2*
|
Registrant’s 2010 Equity and Incentive Compensation Plan (Incorporated by reference to Exhibit 4.1 to the Registrant’s Current Report on Form 8-K filed with the Commission on May 21, 2010).
|
||
|
10.3*
|
Form of Directors’ and Officers’ Indemnification Agreement (incorporated by reference to Exhibit 10.4 registration statement on Form S-1 (File No. 333-30674) filed on February 18, 2000).
|
||
|
10.4*
|
Amended and Restated Employment Agreement, dated December 23, 2008, by and between the registrant and Josh Pickus, as amended on July 30, 2009 (incorporated by reference to Exhibit 10.2 of Support.com’s current report filed on Form 8-K on July 31, 2009).
|
||
|
10.5*
|
Employment Offer Letter dated as of January 29, 2008, as amended on July 30, 2009, by and between the Registrant and Shelly Schaffer (incorporated by reference to Exhibit 10.3 of Support.com’s current report on Form 8-K filed on July 31, 2009).
|
||
|
10.6*
|
Amended and Restated Employment Offer Letter dated as of October 6, 2008, by and between the Registrant and Anthony Rodio (incorporated by reference to Exhibit 10.8 of Support.com’s annual report on Form 10-K filed on March 11, 2009).
|
||
|
10.7*
|
Amended and Restated Employment Offer Letter dated as of September 23, 2008, by and between the Registrant and Richard Mandeberg (incorporated by reference to Exhibit 10.9 of Support.com’s annual report on Form 10-K filed on March 11, 2009).
|
||
|
Employment Offer Letter dated as of April 20, 2010, by and between the Registrant and Timothy Krozek.
|
|||
|
10.9*
|
Support.com, Inc. Executive Incentive Compensation Incentive Plan (incorporated by reference to Exhibit 10.2 of Support.com’s current report on Form 8-K filed on February 4, 2008).
|
||
|
10.10*
|
Support.com, Inc. Amended and Restated Executive Incentive Compensation Incentive Plan (incorporated by reference to Exhibit 10.2 of Support.com’s current report on Form 8-K filed on August 1, 2008).
|
||
|
10.11*
|
Support.com, Inc. Amended and Restated Executive Incentive Compensation Incentive Plan (incorporated by reference to Exhibit 10.2 of Support.com’s current report on Form 8-K filed on February 11, 2009).
|
||
|
10.12*
|
Support.com, Inc. Amended and Restated Executive Incentive Compensation Incentive Plan (incorporated by reference to Exhibit 10.2 of Support.com’s current report on Form 8-K filed on July 31, 2009).
|
||
|
Support.com, Inc. Amended and Restated Executive Incentive Compensation Plan, as approved by the Board of Directors on February 8, 2010.
|
|||
|
10.14
|
Sublease Agreement with Nuance Communications, Inc. dated November 9, 2006 (incorporated by reference to Exhibit 10.1 of Support.com’s current report on form 8-K filed on November 15, 2006).
|
||
|
10.15
|
Professional Services Agreement between Office Depot and Support.com dated July 26, 2007 (incorporated by reference to Exhibit 10.1 of Support.com’s quarterly report on Form 10-Q filed on August 10, 2009).(1)
|
||
|
10.16
|
Change Order Number 1 to Office Depot Remote Service Program Description between Support.com and Office Depot effective as of October 8, 2008 (incorporated by reference to Exhibit 10.1(a) of Support.com’s quarterly report on Form 10-Q filed on August 10, 2009). (1)
|
||
|
10.17
|
Amendment No. 1 to the Professional Services Agreement between Office Depot and Support.com dated October 1, 2008 (incorporated by reference to Exhibit 10.1(b) of Support.com’s quarterly report on Form 10-Q filed on August 10, 2009). (1)
|
||
|
10.18
|
Amendment No. 2 to the Professional Services Agreement between Office Depot and Support.com effective as of June 3, 2009 (incorporated by reference to Exhibit 10.1(c) of Support.com’s quarterly report on Form 10-Q filed on August 10, 2009). (1)
|
||
|
10.19
|
Amendment No. 3 to the Professional Services Agreement between Office Depot and Support.com effective as of July 8, 2009 (incorporated by reference to Exhibit 10.1(d) of Support.com’s quarterly report on Form 10-Q filed on August 10, 2009). (1)
|
|
10.20
|
Amendment No. 4 to the Professional Services Agreement between Office Depot and Support.com effective as of August 27, 2009 (incorporated by reference to Exhibit 10.1 of Support.com’s quarterly report on Form 10-Q filed on November 5, 2009). (1)
|
||
|
Amendment No. 5 to the Professional Services Agreement between Office Depot and Support.com effective as of June 22, 2010. (1)
|
|||
|
10.22
|
Amendment No. 6 to the Professional Services Agreement between Office Depot and Support.com effective as of September 3, 2010 (incorporated by reference to Exhibit 2.1 of Support.com’s current report on Form 8-K filed on September 20, 2010). (1)
|
||
|
Form of Stock Option Grant Notification for Officers and Employees.
|
|||
|
Subsidiaries of Support.com, Inc.
|
|||
|
Consent of Independent Registered Public Accounting Firm
|
|||
|
24.1
|
Power of Attorney (see the signature page of this Form 10-K)
|
||
|
Chief Executive Officer Section 302 Certification.
|
|||
|
Chief Financial Officer Section 302 Certification.
|
|||
|
Statement of the Chief Executive Officer under 18 U.S.C. § 1350(2)
|
|||
|
Statement of the Chief Financial Officer under 18 U.S.C. § 1350(2)
|
|
*
|
Denotes an executive or director compensation plan or arrangement.
|
|
(1)
|
Confidential treatment has been requested for portions of this exhibit.
|
|
(2)
|
The material contained in Exhibit 32.1 and 32.2 shall not be deemed “filed” with the SEC and is not to be incorporated by reference into any filing of the Company under the Securities Act of 1933 or the Securities Exchange Act of 1934, whether made before or after the date hereof irrespective of any general incorporation language contained in such filing, except to the extent that the registrant specifically incorporates it by reference.
|
|
|
(c)
|
Financial Statement Schedules.
|
No schedules have been filed because the information required to be set forth therein is not applicable or is shown in the financial statements or related notes included as part of this report.
72