Attached files
| file | filename |
|---|---|
| EX-32.1 - CEO SOX CERTIFICATION - PHYSICIANS FORMULA HOLDINGS, INC. | exhibit32_1.htm |
| EX-31.2 - CFO CERTIFICATION - PHYSICIANS FORMULA HOLDINGS, INC. | exhibit31_2.htm |
| EX-32.2 - CFO SOX CERTIFICATION - PHYSICIANS FORMULA HOLDINGS, INC. | exhibit32_2.htm |
| EX-23.1 - AUDITOR CONSENT - PHYSICIANS FORMULA HOLDINGS, INC. | exhibit23_1.htm |
| EX-31.1 - CEO CERTIFICATION - PHYSICIANS FORMULA HOLDINGS, INC. | exhibit31_1.htm |
| EX-10.56 - AMENDMENT TO WF LOC - PHYSICIANS FORMULA HOLDINGS, INC. | exhibit10_56.htm |
UNITED STATES SECURITIES AND EXCHANGE COMMISSION
Washington, DC 20549
FORM 10-K
|
|
x
|
ANNUAL REPORT PURSUANT TO SECTION 13 OR 15(d) OF THE SECURITIES EXCHANGE ACT OF 1934
|
for the fiscal year ended December 31, 2010
OR
|
|
o
|
TRANSITION REPORT PURSUANT TO SECTION 13 OR 15(d) OF THE SECURITIES EXCHANGE ACT OF 1934
|
for the transition period from to .
COMMISSION FILE NUMBER: 001-33142
Physicians Formula Holdings, Inc.
(Exact name of registrant as specified in its charter)
|
Delaware
|
20-0340099
|
|
|
(State or other jurisdiction of incorporation or organization)
|
(I.R.S. Employer Identification No.)
|
|
|
1055 West 8th Street
|
||
|
Azusa, California 91702
|
(626) 334-3395
|
|
|
(Address of Principal Executive Offices, including Zip Code)
|
(Registrant’s Telephone Number, Including Area Code)
|
Securities registered pursuant to Section 12(b) of the Act:
|
Title of each class
|
Name of exchange on which registered
|
|
|
Common Stock, par value $0.01 per share
|
The Nasdaq Global Select Market
|
Securities registered pursuant to Section 12(g) of the Act: None.
Indicate by check mark if the registrant is a well-known seasoned issuer, as defined in Rule 405 of the Securities Act. Yes o No x
Indicate by check mark if the registrant is not required to file reports pursuant to Section 13 or Section 15(d) of the Act. Yes o No x
Indicate by check mark whether the registrant (1) has filed all reports required to be filed by Section 13 or 15(d) of the Securities Exchange Act of 1934 during the preceding 12 months (or for such shorter period that the registrant was required to file such reports), and (2) has been subject to such filing requirements for the past 90 days. Yes x No o
Indicate by check mark whether the registrant has submitted electronically and posted on its corporate website, if any, every Interactive Data File required to be submitted and posted pursuant to Rule 405 of Regulation S-T (§ 232.405 of this chapter) during the preceding 12 months (or for such shorter period that the registrant was required to submit and post such files). Yes o No o
Indicate by check mark if disclosure of delinquent filers pursuant to Item 405 of Regulation S-K is not contained herein, and will not be contained, to the best of the registrant’s knowledge, in definitive proxy or information statements incorporated by reference in Part III of this Form 10-K or any amendment to this Form 10-K. x
Indicate by check mark whether the registrant is a large accelerated filer, an accelerated filer, a non-accelerated filer, or a smaller reporting company. See the definitions of “large accelerated filer,” “accelerated filer” and “smaller reporting company” in Rule 12b-2 of the Exchange Act.:
|
Large accelerated filer o
|
Accelerated filer o
|
|
|
Non-accelerated filer o
|
Smaller reporting company x
|
Indicate by check mark whether the registrant is a shell company (as defined in Rule 12b-2 of the Exchange Act). Yes o No x
As of June 30, 2010, the aggregate market value of the registrant’s common stock, par value $0.01 per share, held by non-affiliates of the registrant was approximately $44,302,318 (based upon the closing sale price of the common stock on that date on The Nasdaq Global Select Market).
The number of shares of the registrant’s common stock outstanding as of March 9, 2011 was 13,589,668.
DOCUMENTS INCORPORATED BY REFERENCE
Portions of the Physicians Formula Holdings, Inc. definitive Proxy Statement for its 2011 Annual Meeting of Stockholders to be filed with the Securities and Exchange Commission pursuant to Regulation 14A not later than 120 days after December 31, 2010 are incorporated by reference in Part III of this Form 10-K.
|
PART I
|
1
|
||
|
Item 1.
|
Business
|
1
|
|
|
Item 1A.
|
Risk Factors
|
8
|
|
|
Item 1B.
|
Unresolved Staff Comments
|
18
|
|
|
Item 2.
|
Properties
|
18
|
|
|
Item 3.
|
Legal Proceedings
|
18
|
|
|
Item 4.
|
Reserved
|
18
|
|
|
PART II
|
19
|
||
|
Item 5.
|
Market for Registrant’s Common Equity, Related Stockholder Matters and Issuer Purchases of Equity Securities
|
19
|
|
|
Item 6.
|
Selected Financial Data
|
21
|
|
|
Item 7.
|
Management’s Discussion and Analysis of Financial Condition and Results of Operations
|
22
|
|
|
Item 7A.
|
Quantitative and Qualitative Disclosures About Market Risk
|
36
|
|
|
Item 8.
|
Financial Statements and Supplementary Data
|
36
|
|
|
Item 9.
|
Changes in and Disagreements with Accountants on Accounting and Financial Disclosure
|
36
|
|
|
Item 9A.
|
Controls and Procedures
|
37
|
|
|
Item 9B.
|
Other Information
|
38
|
|
|
PART III
|
39
|
||
|
Item 10.
|
Directors, Executive Officers and Corporate Governance
|
39
|
|
|
Item 11.
|
Executive Compensation
|
39
|
|
|
Item 12.
|
Security Ownership Of Certain Beneficial Owners and Management and Related Stockholder Matters
|
39
|
|
|
Item 13.
|
Certain Relationships and Related Transactions, and Director Independence
|
39
|
|
|
Item 14.
|
Principal Accounting Fees and Services
|
39
|
|
|
PART IV
|
39
|
||
|
Item 15.
|
Exhibits, Financial Statement Schedules
|
39
|
|
|
EXHIBIT INDEX
|
E-1
|
||
PART I
ITEM 1. BUSINESS
Our Company
The Physicians Formula brand was created in 1937 and we were formed in 2003 as a Delaware corporation. We are one of the ten largest cosmetics companies in the U.S. mass market channel by retail sales based on ACNielsen data for the 52 weeks ended January 22, 2011. We specialize in developing and marketing innovative, premium-priced products for the mass market channel. Our products focus on addressing skin imperfections through a problem-solution approach, rather than focusing on changing fashion trends. Our products address specific, everyday cosmetics needs and include face powders, bronzers, concealers, blushes, foundations, eye shadows, eye liners, brow makeup and mascaras.
We sell our products in the mass market channel to retailers such as Wal-Mart, CVS, Target and Rite Aid. Our products provide above-average profitability for retailers due to their higher price points and sales per linear foot. Our products are currently being sold in approximately 25,700 of the 45,500 stores in which we estimate our masstige competitors’ products are also sold. We seek to be first-to-market with new products within this channel, and we are able to take new products from concept development to shipment in less than 12 months. New products are a very important part of our business and have contributed, on average, approximately 36.1% of our gross sales from 2008 to 2010.
We position ourselves as a mass market prestige, or “masstige” brand, within the U.S. mass market channel of the cosmetics industry. Our primary product categories are face and eye makeup. Based on ACNielsen data, our share of the masstige market at food, drug and mass volume retailers other than Wal-Mart (which does not supply data to ACNielsen) was 5.8% for the 52 weeks ended January 22, 2011.
Our goal is to continue to profitably expand our presence in the mass market channel in the U.S. and abroad. We intend to grow by introducing new and innovative products, expanding our U.S. distribution, entering new categories, expanding into new channels and geographic markets and by improving our operating margin.
Our Competitive Strengths
Differentiated Products with Broad Consumer Appeal. We market a broad selection of functional cosmetics that address everyday skin imperfections, in contrast to traditional cosmetics that primarily address changing fashion trends. One of our core areas of expertise is color correction, which involves the use of opposite colors to neutralize skin imperfections, such as under-eye circles, red blemishes, scars or other skin discolorations. We appeal to a broad consumer base by selling products offering similar quality and benefits as those sold in department stores and high-end specialty retailers at more affordable prices.
Product Innovation. We consider ourselves a leading product innovator. We have a history of successfully developing new and innovative products and quickly introducing them to the mass market channel. In 1997, we introduced multi-colored face powder to the mass market channel with the launch of Powder Palette®, which continues to be one of our top-selling products today. Other examples of innovative product launches include Covertoxten50™ wrinkle therapy face powder and foundation, Bronze Booster bronzers and Magic Mosaic® face powders. Our Mineral Wear® face powder, which we launched in 2005, was the first pressed and multi-colored mineral face powder sold in the mass market channel. In 2008, we introduced the first 100% natural origin makeup line formulated with certified organic ingredients with the launch of our Organic Wear® product line. In 2010, we introduced Healthy Wear™, the first makeup line with SPF 50. Over the last three years, we have introduced an average of 77 new products each year. Our top three retailer customers stocked, on average, over 89.1% of our new product launches in 2010.
Strong Quality Perception and Market Positions. We are a leading cosmetics brand in the mass market channel, with a loyal consumer base. In a 2007 study commissioned by us, respondents who purchased our brand were asked to rank their perception of the quality of various masstige cosmetic. We received the highest perceived brand quality among masstige cosmetics brands by our consumers. We support our brand with national advertising in leading women’s magazines, continuous product innovation and attractive point-of-purchase merchandising. Please refer to “—Market Share” for a more detailed discussion.
Compelling Proposition to Retailers. Our innovative, high-quality products sell at premium price points and generate above-average return on investment for retailers. Our brand enjoys broad consumer appeal across different age groups and ethnicities and attracts consumers who tend to be affluent. We believe consumer demand for our products has motivated our continuing retailer customers to increase the number of stores in which they sell our products and to increase our assigned shelf space within their stores. In August 2008, we were awarded the Front End Supplier of the Year by the Rite Aid drugstore chain.
Flexible, Low-Cost Business Model. We maintain a flexible, low-cost business model that allows us to rapidly change production schedules, adopt new technologies and switch to lower-cost suppliers. We manufacture or assemble substantially all of our products. We do not have long-term contracts with our suppliers, but instead purchase components and semi-finished goods from third-party suppliers on an as-needed basis. Our flexible supply chain and assembly capabilities increase our speed-to-market for new product launches and allow us to provide high levels of service to retailers.
Experienced Management Team. Our senior management team has considerable experience and expertise, with an average of 16 years of experience in the cosmetics industry. Ingrid Jackel, our Chief Executive Officer, Jeffrey P. Rogers, our President, and Jeff M. Berry, our Chief Financial Officer, have been with Physicians Formula since 1995, 1991 and 2007, respectively.
-1-
Our Growth Strategy
We intend to increase our market share and to grow our business by pursuing the following strategies:
Continue to Develop and Introduce New Products. Over the last three years, we have introduced an average of 77 new products each year. For 2010, however, we introduced only 46 new products. We launched fewer new products in 2010 than in years past as a result of our business model redefinition initiative, which is designed, in part, to mitigate the risk of product returns. Product returns are driven, in part, by new products which do not meet retailer criteria after a period of time in market and are therefore sent back to us.
Even though there are fewer new products in 2010, we believe the amount of innovation we are bringing to the market is similar to prior years, as we launched a similar number of new product platforms as prior years, the driver of customer and consumer perception of innovation, but with fewer products per platform than in years past. The lower number of new products per innovation platform is the driver of the fewer new product count launched in 2010.
Our product development team employs a 12-month product development process that incorporates technological advances as well as our core industry knowledge and awareness of global trends. Building on our face and eye makeup expertise, we continue to target under-developed categories to offer consumers innovative and visually appealing products for specific yet common cosmetic needs. We believe our problem-solution approach creates an opportunity to extend new product appeal beyond the life cycles of traditional color cosmetics.
Further Penetrate Existing Retailers and Channels of Distribution. We believe there are many opportunities to grow our sales to existing retailer customers and to expand our customer base by:
| ● | expanding retail selling space at stores that currently sell our products; | |
| ● | increasing the number of stores in which our existing retailer customers sell our products; and | |
| ● | attracting new retailer customers such as food and club stores. |
The following table sets forth our estimates of our total distribution, measured by stores multiplied by stock keeping units, or “SKUs,” as of December 31 for each of the years presented below:
|
2010
|
2009
|
2008
|
2007
|
2006
|
||||||||||||||||
|
Total stores
|
25,700 | 29,500 | (1) | 29,500 | 27,000 | 24,000 | ||||||||||||||
|
Average SKUs per store
|
143 | 153 | 156 | 145 | 134 | |||||||||||||||
|
Total distribution (SKUs times stores) (in millions)
|
3.7 | 4.5 | 4.6 | 3.9 | 3.2 | |||||||||||||||
________________________
|
(1)
|
Amount includes 5,800 stores related to one of our largest retailer customers that discontinued selling our products subsequent to December 31, 2009, which stores were removed from our total store count on a prospective basis. In April 2009, this customer notified us of its decision to discontinue selling our products in 2010 and began to reduce its inventory levels of our products during the second quarter of 2009. We did not have any sales to this customer subsequent to the second quarter of 2009. |
We have increased the number of stores in which we sell our products by 7.1% from 2006 to 2010 and we have increased our total distribution by over 15.6% during the same period. Despite these increases, we believe there are significant opportunities for future growth, as our largest competitors currently sell their products in significantly more stores and have significantly more selling space per store than we do.
Expand into Adjacent Categories with Innovative Products. We believe our reputation for developing innovative, problem-solution products creates opportunities for us to expand into cosmetics categories in which we do not currently have a significant presence. Our current product lines address only approximately half of the cosmetics categories. We plan to capitalize on our goodwill with retailers and our innovation expertise to expand not only in our current product categories, but also into adjacent cosmetics categories, such as lip and skin care. In conjunction with our expansion into adjacent categories, we intend to use cost-effective and integrated marketing strategies in advertising, public relations, promotions, packaging and pricing.
Expand into New Channels and Increase International Presence. We are seeking to expand into new sales channels in order to reach a broader market. We also intend to expand our presence in our existing foreign markets and in foreign markets not currently served by Physicians Formula.
Continue to Identify Opportunities for Operating Margin Improvement. We continue to work on improving our low-cost structure by pursuing cost-saving opportunities through product assembly automation and direct sourcing of components.
Market, Ranking and Other Data
We position ourselves as a “mass market prestige” or “masstige” brand within the U.S. mass market channel of the cosmetics industry. The term “masstige” describes a retail category that includes products that are priced below the high-end prestige segment and above the low-end mass segment and that are distributed through the mass market channel. We define the masstige market as products sold in the mass market channel under the following premium-priced brands: Physicians Formula, Almay, L’Oréal, Max Factor, Neutrogena, Revlon, OPI, Borghese and Iman. According to ACNielsen data, these brands were the only mass-distributed brands whose products had average retail prices 12% or more above the average price for similar products in “food, drug and mass volume retailers other than Wal-Mart” for the 52 weeks ended January 22, 2011 and whose retail sales in the mass market channel were over $2 million during the same period, except Max Factor which exited the U.S. market in 2010. We have excluded brands that generated less than $2 million during the period or whose average retail prices were not at least 12% above the average price for similar products within “food, drug and mass volume retailers other than Wal-Mart” because we do not view them as our principal competitors, other than Max Factor.
-2-
The data included in this Annual Report on Form 10-K regarding markets and rankings, including the size of product markets and our relative position and the position of our competitors within these markets, is based on independent industry publications, including ACNielsen, and other published industry sources, as well as management estimates. ACNielsen data does not include Wal-Mart, which is our largest customer.
In addition, ACNielsen data is based on sampling methodology, and extrapolation from those samples, which means that estimates based on that data may not be precise. Our estimates have been based on information obtained from our customers, trade and business organizations and other contacts in the market in which we operate, as well as management’s knowledge and experience in the markets in which we operate. We believe these estimates to be accurate as of the date of this Annual Report on Form 10-K, unless a prior date is indicated or we refer to historical data. However, this information may prove to be inaccurate because of the method by which we obtained some of the data for our estimates or because this information cannot always be verified with complete certainty due to limits on the availability and reliability of raw data, the voluntary nature of the data gathering process and other limitations and uncertainties inherent in a survey of market size. In addition, consumption patterns and consumer preferences can and do change. As a result, you should be aware that market, ranking and other similar data included in this Annual Report on Form 10-K, and estimates and beliefs based on that data, may not be accurate.
Products
We develop, manufacture and market a broad selection of products in various cosmetics categories. The following table sets forth the core categories in which we compete and selected examples of products we manufacture within those categories:
|
Category
|
Product Lines
|
Representative Products
|
||||
|
Face Makeup
|
·
|
Face Powders
|
·
|
Mineral Wear®, Organic Wear®, Powder Palette®
|
||
|
·
|
Bronzers
|
·
|
Magic Mosaic®, Powder Palette®, Shimmer Strips, Bronze Booster, Mineral Wear®, Organic Wear®, Summer Eclipse®, Pearls of Perfection®, Bamboo Wear™
|
|||
|
·
|
Concealers
|
·
|
Gentle Cover® Concealer, Circle Rx™, Conceal Rx™, Mineral Wear®, Concealer Twins®, Concealer 101
|
|||
|
·
|
Blushes
|
·
|
Powder Palette®, Mineral Wear®, Shimmer Strips
|
|||
|
·
|
Foundation/Tinted Moisturizers
|
·
|
Mineral Wear®, Organic Wear®, Healthy Wear™
|
|||
|
Eye Makeup
|
·
|
Eye Shadows
|
·
|
Shimmer Strips, Baked Collection®, Eyebrightener®
|
||
|
·
|
Eyeliners
|
·
|
Eye Definer Felt-Tip Eye Marker, Shimmer Strips
|
|||
|
·
|
Mascara |
·
|
Organic Wear®, Shimmer Strips, Plump Potion®
|
|||
|
·
|
Brow Makeup
|
·
|
Brow Definer
|
|||
Face makeup. The face makeup category is our largest category, accounting for approximately 75.7% of our net sales in 2010. We divide this category into face powders, bronzers, concealers, face color (blush) and foundation/tinted moisturizers. Our face powders and bronzers typically enhance skin tone and provide a finishing touch to the skin. Our concealers and neutralizers use color correction to address more significant imperfections, such as dark under-eye circles, blemishes, scars, birthmarks and post-cosmetic surgery discolorations. Our compact and liquid foundations and tinted moisturizers address uneven skin tone and provide skin protection.
Face powders can be used over foundation or alone, to minimize shine, discolorations and imperfections, creating a smoother, more even skin tone. Based on ACNielsen data for the 52 weeks ended January 22, 2011, we are a leader in the face powders category with an approximate 32.2% dollar share in the masstige market, as we define it, compared to 41.3% in the prior-year period. We also currently market one of the best selling face powder franchises in the masstige market. Our face powder products include Powder Palette®, a multi-colored face powder designed to provide the most natural finish on the skin, Mineral Wear®, a pressed and loose talc-free mineral face powder developed for sensitive and breakout-prone skin, and Organic Wear®, the first 100% natural origin face powder made with certified organic ingredients.
Bronzers enhance skin tone to provide a “sunkissed” look without the damaging effects of the sun. In 1997, we introduced bronzers, a product formerly offered primarily by department stores for the summer season, to the mass market channel, and have since expanded our product offering to include a full, year-round bronzer selection. Based on ACNielsen data for the 52 weeks ended January 22, 2011, we are a leader in the bronzers category with an approximate 81.9% dollar market share in the masstige market, as we define it, compared to 85.8% in the prior-year period. Our bronzers include Magic Mosaic®, a multi-colored bronzer that lets you customize your shade from dark to light, Shimmer Strips, a multi-colored shimmering bronzer for a custom glamorous tan glow, and Bronze Booster, a glow boosting bronzer that provides an instant and lasting bronze glow.
We introduced our concealing correction tools to the mass market channel in 1993, and have continued to introduce new concealing correction products. Our concealer products include Gentle Cover® Concealer, Concealer Twins® and Conceal Rx™. We currently have a broad range of yellow, green and flesh tone concealers aimed at covering and correcting skin imperfections, from dark under-eye circles to red blemishes, scars, birthmarks or post-cosmetic surgery discolorations. Based on ACNielsen data for the 52 weeks ended January 22, 2011, we had an approximate 10.2% dollar share of concealers in the masstige market, as we define it, compared to 12.8% in the prior-year period.
We offer powder blushes that contour the face and accentuate cheekbones with soft color. In 2001, we introduced Planet Blush® and have since expanded in this category with products such as Powder Palette® Blush, Mineral Wear® Blush and Magic Mosaic® Blush. Based on ACNielsen data for the 52 weeks ended January 22, 2011, we had an approximate 12.0% dollar share of blush in the masstige market, as we define it, compared to 15.6% in the prior-year period.
-3-
Foundations, with face powders or alone, provide all over coverage and minimize uneven skin tone. Two examples of our foundation and tinted moisturizer products are Mineral Wear®, a foundation designed to help reduce skin irritation and breakouts, and Organic Wear® 100% Natural Origin Tinted Moisturizer, which hydrates and evens out skin tone with sheer coverage. We intend to expand our foundation product offerings, because foundation is one of the largest cosmetics categories. Based on ACNielsen data for the 52 weeks ended January 22, 2011, we had an approximate 1.9% dollar share of foundations in the masstige market, as we define it, compared to 2.2% in the prior-year period.
Eye makeup. The eye makeup category is our second largest category, accounting for approximately 21.4% of our net sales in 2010. The category consists of four categories: eye shadows, eyeliners, brow makeup and mascara. Our eye makeup includes Shimmer Strips Custom Eye Enhancing Shadow and Liner, nine shades coordinated to enhance each eye color, Baked Collection®, a wet/dry eye shadow trio, Shimmer Strips Eye Enhancing Gel Creamliners, Eye Definer Felt-Tip Eye Marker, Organic Wear® 100% Natural Origin Mascara, Plump Potion® Lash Stimulating and Plumping Mascara, and Brow Definer. Based on ACNielsen data for the 52 weeks ended January 22, 2011, we had an approximate 2.8% dollar share of the masstige market, as we define it, in the eye makeup category, compared to 3.7% in the prior-year period. We intend to offer additional eye makeup products.
Other. We introduced Plump Potion® Needle-Free Lip Plumping Cocktail in 2006 and Organic Wear® 100% Natural Origin Superfruit Lip Gloss in 2009. All other categories accounted for approximately 2.9% of our net sales in 2010.
Market Share
The following table sets forth the market position and approximate dollar share, based on retail sales, of our products in selected categories within the masstige market, as we define it, based on ACNielsen data for the 52 weeks ended January 22, 2011:
|
|
52 Weeks Ended
January 22, 2011
|
||||
|
Masstige
Ranking (2)
|
Masstige
Share (3)
|
||||
|
Face
|
|||||
|
Face Powders
|
2
|
32.2
|
%
|
||
|
Bronzers (1)
|
1
|
81.9
|
|
||
|
Concealers
|
5
|
10.2
|
|
||
|
Blush
|
4
|
12.0
|
|
||
|
Foundation
|
5
|
1.9
|
|
||
|
Eye
|
|||||
|
Eye Shadows
|
4
|
7.3
|
|
||
|
Eyeliners
|
5
|
2.2
|
|
||
|
Brow Makeup
|
4
|
0.4
|
|
||
|
Mascara
|
5
|
1.5
|
|
||
________________________
| (1) | Bronzers are a subcategory of face powders. |
|
(2)
|
We define the masstige market as products sold in the mass market channel under the following premium-priced brands: Physicians Formula, Almay, L’Oréal, Max Factor, Neutrogena, Revlon, OPI, Borghese and Iman. According to ACNielsen data, these brands, other than Max Factor, were the only-mass distributed brands whose product had average retail prices 12% or more above the average price for similar products in food, drug and mass volume retailers other than Wal-Mart for the 52 weeks ended January 22, 2011 and whose average retail sales in the mass market channel were over $2 million during the same period. We have excluded brands that generated less than $2 million during the period or whose average retail prices were not at least 12% above the average price for similar products within food, drug and mass volume retailers other than Wal-Mart because we do not view them as our principal competitors. Please refer to "Market, Ranking and Other Data" on page 2 for a more detailed discussion.
|
|
(3)
|
ACNielsen data does not include Wal-Mart, our largest customer and accordingly, this market share data does not take into account sales to Wal-Mart. Because we are currently in a smaller percentage of Wal-Mart stores and because we have less shelf space at Wal-Mart stores than we do at our other customers, we believe our share of the masstige market at Wal-Mart is lower than the percentages reflected in this table and could affect our rankings. |
Competition
The cosmetics industry is highly competitive. We compete on the basis of brand awareness, product functionality, design, quality, pricing, marketing, order fulfillment and delivery. Our competitors include a number of multinational manufacturers, some of which are larger and have substantially greater resources than we do, and which may therefore have the ability to spend more aggressively on advertising and promotion and have more flexibility to respond to changing business and economic conditions. Our products also compete with similar products sold in prestige channels such as department stores, high-end specialty retailers, door-to-door, through television and infomercials or through mail-order or telemarketing by representatives of direct sales companies. Our principal competitors in the masstige market, as we define it, include L’Oréal S.A. (L’Oréal), Revlon, Inc. (Revlon and Almay) and Johnson & Johnson (Neutrogena).
-4-
Distribution Channels and Retailer Customers
We currently sell our products in approximately 25,700 stores in over 70 different retailers in the food retail, drug chain, mass volume, specialty retail and wholesale channels. Our top ten U.S. customers represented approximately 88.0% of our gross sales in 2010. Sales to Wal-Mart, CVS and Target accounted for an aggregate of 62.6% of our gross sales in 2010, with sales to each of these customers accounting for greater than 10% of our gross sales in 2010. In April 2009, one of our largest retailer customers informed us of its decision to completely discontinue selling our products in 2010. This customer began to reduce its inventory levels of our products to prepare for the 2010 discontinuation during the second quarter of 2009, which had a material negative impact on our net sales and results of operations. This customer accounted for 4.8% and 15.8% of our gross sales in 2009 and 2008, respectively. We did not have any sales to this customer during the year ended December 31, 2010, but have been re-introduced to their online business in 2011.
We do not enter into long-term or exclusive contracts with our customers. Sales to our customers are generally made pursuant to purchase orders. We seek to enhance our customer relationships by regularly updating our product offering, delivering our products on time and providing consistent marketing support, category management services and customized trade allowance programs. Our customers expect quick response times on standard orders, and we generally do not have a material order backlog. We did not have any backlog orders as of December 31, 2010.
We entered the Australian market in 1994, the Canadian market in 1998 and the South Africa market in 2010. Australia, Canada and South Africa represented approximately 14.0% of our net sales in 2010. See Note 13 to the consolidated financial statements included in this Annual Report on Form 10-K.
New Product Development
Historically, we have introduced a significant number of products each year. For 2010, however, we introduced only 46 new products. We launched fewer new products in 2010 than in years past as a result of our business model redefinition initiative, which is designed, in part, to mitigate the risk of product returns while enhancing the productivity potential of our new items.
Even though there are fewer new products in 2010, we believe the amount of innovation we are bringing to the market is similar to prior years, as we launched a similar number of new product platforms as prior years, the driver of customer and consumer perception of innovation, but with fewer products per platform than in years past. The lower number of new products per innovation platform is the driver of the fewer new product count launched in 2010.
We seek to be first-to-market in the mass market channel with many of our products. Our new product development team consists of marketing, research and development, packaging, engineering and global sourcing professionals. Our team employs a 12-month product development process that incorporates our core industry knowledge, awareness of global trends and technological advances and sensitivity to retail needs. Members of our new product development team attend the principal industry trade shows in the U.S., Europe and Asia. We spent $699,000, $765,000 and $775,000 on research and development in 2010, 2009 and 2008, respectively.
We believe we are broadly recognized as a leading innovator in the masstige market. Our products have received numerous awards and editorial recognition, including the Real Beauty Gold Star Award for "Best New Eyeliner" in December 2010, "Best Eye Makeup Remover" by Allure Magazine in October 2010, O Oprah Magazine's "Most Ingenious Green Packaging Award" in April 2010, "MVP Award" from Redbook in May 2010, "America's Healthiest Powder Foundation" in Health Magazine in June 2010, 2010 Beauty Award in Fitness Magazine for "Best Eyeliner", the Cosmetic Executive Women (CEW) Beauty Award - 2009 “Best Face Makeup” Finalist, 2009 Health and Beauty America (HBA) International Design “Green Award”, Good Housekeeping Seal of Approval 2009 and Good Housekeeping Green Seal, “2009 Best Bronzer/Blush” by Shape magazine, “2009 Best Blush” by Fitness magazine, “Best of Beauty - Best Natural Wonder Mascara” by Allure magazine in 2009, “Best Eco Mascara” by Self magazine in May 2009, “Best Mascara, Green Beauty Award” by Cosmopolitan magazine in April 2009, “Best Lash (and Earth-Friendly) Mascara” by O, The Oprah Magazine in April 2009, “America's Healthiest Beauty Award - Bronzer” by Health magazine in June 2008, “Best Highlighter” by SELF magazine in May 2008, “Best Lip Plumper” by Star magazine in May 2008 and "Best Problem-Solver Concealer" by O Oprah Magazine in April 2008.
Marketing and Sales
We position ourselves as a masstige cosmetics company and market our products to consumers in the U.S. mass market channel and other channels outside the U.S. Our consumer marketing includes national print and digital advertising, as well as point-of-sale merchandising, including displays and promotions.
Our advertising strategy includes print in major beauty, lifestyle and women service publications in the U.S. and Canada, digital advertising in key websites and social media, non-traditional advertising and free standing inserts in Sunday newspapers. We strive to feature fresh, modern, vibrant imagery in our marketing campaigns to provide a “real woman” quality to which our consumers can relate.
We take a proactive approach with our retailer customers. Members of our sales team maintain constant communication with their accounts and visit our customers frequently to discuss recent point-of-sale data and trends. In addition, the sales team regularly reviews recent performance, new product initiatives and opportunities for additional space and distribution. Our sales team provides the marketing department with market information and customer feedback, works closely with our marketing department in developing customized advertising and promotional programs and reviews estimates of demand for the production planning process.
We maintain three web sites, www.physiciansformula.com, www.mypfbeauty.com and www.organicwearmakeup.com in addition to a Facebook and Twitter page, all of which feature current product and promotional information to educate and inform consumers about our products. Our web sites, Facebook and Twitter pages are updated regularly to stay current with our new product offerings and continually engage and excite consumers regarding the brand.
Packaging and Merchandising
We design our retail selling space layout and provide retailers with permanent fixtures and point-of-purchase displays to emphasize a strong, consistent message to consumers. We also design most of our primary and secondary packaging. Primary packaging includes compacts, jars, tubes and pencils and secondary packaging includes boxes, blister packaging and clam-shell packaging in which our products are sold. We believe our uniquely designed product displays and packaging provide an immediate visual impact while serving as an important merchandising, communication and education tool.
-5-
Raw Materials and Suppliers
We purchase raw materials, components, such as plastic compact containers, plastic tubes or brushes, and semi-finished goods, such as plastic compact containers or plastic tubes filled with product, from foreign and U.S. suppliers. Eleven of our top fifteen suppliers are located in Europe or Asia. These eleven foreign suppliers represented approximately 60.3% of our purchases of raw materials, semi-finished goods and components in 2010. We purchase a significant portion of our powders from suppliers in Italy, U.S. and Japan and our components from suppliers in China. Our suppliers range from small family-owned businesses to large multinational corporations. We maintain relationships with a broad base of manufacturers in an effort to utilize those with the latest technologies and highest quality standards and to benefit from their knowledge of the newest manufacturing techniques. We have implemented a strategy that enables us to source components directly from Asian manufacturers, thereby eliminating a broker mark-up.
We generally do not have long-term or exclusive agreements with our suppliers. We purchase raw materials, components and semi-finished goods from third-party suppliers on an as-needed basis. We maintain our supplier relationships on arms-length terms. We have not experienced any difficulty obtaining raw materials, components or semi-finished goods and we believe we currently have adequate sources for our anticipated future production needs. We believe we have good relationships with our suppliers and that there are alternative sources in the event that raw materials, components and semi-finished goods from one or more of these suppliers is unavailable. We continually review our needs against the capacity of our suppliers to ensure that we are able to meet our production goals, manage costs and operate efficiently.
Manufacturing
We manufacture our products at two facilities located in City of Industry, California and one facility located in Covina, California, which are approximately 20 miles east of Los Angeles. The adjoining facilities in City of Industry are approximately 25,000 and 20,000 square feet, respectively, and are both leased under a two-year contract that expires in December 2012. The Covina facility is approximately 72,500 square feet and is leased under a two year term lease expiring in December 2012. Our manufacturing consists of compounding, filling and assembly. Currently, our compounding process is manual and requires highly skilled labor for weighing materials and compounding materials. We rely on four to seven manual assembly lines, one automated assembly line and eleven primary filling lines in our manufacturing facilities. We are in the final stages of completing an upgrade to the automated assembly line, which has reduced labor cost per unit and increased capacity.
Distribution
We distribute our products from a 62,000 square foot distribution facility in Azusa, California, which is 24 miles east of Los Angeles. This facility is leased under a two-year contract that expires in December 2012.
At our distribution center we:
| ● | store finished goods; | |
| ● | pick and pack for all domestic and most international customer orders; | |
| ● | conduct quality control for manufactured and assembled products; | |
| ● | process and store returns; and | |
| ● | assemble promotional displays. |
We have also negotiated the use of space at third-party warehousing companies to handle our international customer orders and certain domestic customer orders and fluctuations in our inventory levels, which are significantly greater during the first and fourth quarters of each year. During peak periods, we rely on third-party logistics providers to ship some of our products to our retailer customers.
Patents and Trademarks
The major trademark used in our business is Physicians Formula, with many of our products sold under this brand. We have registered or applied to register many of our product trademarks in the U.S. We have also registered the Physicians Formula trademark in over 40 foreign countries. We consider the protection of our trademarks and trade name to be an important element of our business. We have filed with the Trademark Trial and Appeal Board of the U.S. Patent and Trademark Office a petition for cancellation of the registered trademark Physicians Complex issued to Cosmed, Inc. for cosmetics products sold primarily on the Internet. As of December 31, 2010, we had approximately 176 registered U.S. and foreign trademarks that we intend to maintain, and we had approximately 28 trademark applications pending. Our registered trademark rights exist for as long as the trademark is used for the identified goods or services and we continue to renew the registered trademark.
We also protect some of our packaging and component concepts through design patents. We consider proprietary technology and patent protection to be an important element of our business. As of December 31, 2010, we had approximately 60 design patents issued. Our design patents expire between 2015 and 2022.
We are involved in various intellectual property claims and legal actions arising in the ordinary course of business. While the effect of the final resolutions of these matters is not known, we believe that they will not have a material adverse effect on our results of operations, liquidity or financial condition.
-6-
Management Information System
We use information technology systems to manage financial and administrative functions, including general ledger, accounts receivable, accounts payable, personnel, payroll and tax management. The majority of our customer orders and shipments are handled through electronic data interchange systems to enable electronic exchange of order, status, invoice and financial information with our customers.
We utilize an IBM iSeries 520 computer located at our Azusa facility and seventeen IBM servers. The IBM iSeries 520 is used to run our enterprise resource planning applications. The servers are used for office document processing, electronic mail, security, virus protection and electronic interchange transactions. As a safeguard against a catastrophic event, we duplicate our files at the end of each day and transport those back-up files the following day to our City of Industry location. We have entered into an agreement with IBM to provide iSeries 520 disaster recovery services in case of a catastrophic event.
Seasonality
Our business, similar to others in the cosmetic industry, is subject to seasonal variation due to the annual “sell-in” period when retailers decide how much retail space will be allotted to each supplier and the number of new and existing products to be offered in their stores. For us, this period has historically been from December through April. Sales during these months are typically greater due to the shipments required to fill the inventory at retail stores and retailers’ warehouses. Retailers typically reset their retail selling space during these months to accommodate changes in space allocation to each supplier and to incorporate the addition of new products and the deletion of slow-selling items. Please see “Management’s Discussion and Analysis of Financial Condition and Results of Operations—Factors Affecting Comparability—Seasonality.”
Employees
As of December 31, 2010, we employed approximately 147 full-time and 8 part-time employees. In addition, we subcontracted for approximately 253 workers through a temporary staffing agency. During the course of the year, we typically utilize between 100 and 250 subcontracted workers depending on seasonal fluctuations in demand for our products.
As of December 31, 2010, none of our employees were covered by collective bargaining agreements. We believe that our employee relations are satisfactory.
Regulation
We and our products are subject to regulation by the U.S. Food and Drug Administration, or the “FDA,” the U.S. Federal Trade Commission, or the “FTC,” as well as various other Federal, state, local and foreign regulatory authorities. These regulations principally relate to the safety of our ingredients and to the proper packaging, labeling, marketing, and advertising of our products. We believe that we are in substantial compliance with these regulations. Our manufacturing facilities in California are registered with the FDA as drug manufacturing establishments, permitting the manufacture of cosmetics that contain over-the-counter drug ingredients such as sunscreen.
Under the Federal Food, Drug and Cosmetic Act, or the “FDCA,” cosmetics are defined as articles or components of articles that are applied to the human body and intended to cleanse, beautify or alter its appearance, with the exception of soap. Cosmetics are not subject to pre-market approval by the FDA, but the products and their ingredients must be tested to assure safety. If safety has not been adequately substantiated, a specific label warning is required. The labeling of cosmetic products is also subject to FDCA and FDA regulations, as well as the Fair Packaging and Labeling Act, the Poison Prevention Packaging Act, and FTC statutory and regulatory requirements.
The FDA utilizes an “intended use” doctrine to determine whether a product is a drug or cosmetic by the labeling claims made for the product. If a cosmetic product is intended to treat a disease condition or to affect the structure or function of the human body, the FDA will regulate the product both as a drug and as a cosmetic. The product will then also be subject to all drug requirements under the FDCA, possibly including pre-approval by the FDA of the product before future marketing. The labeling of cosmetic products is subject to the requirements of the FDCA, Fair Packaging and Labeling Act, Poison Prevention Packaging Act and other FDA regulations. If the FDA considers label claims for our cosmetic products to be claims affecting the structure or function of the human body, our products may be regulated as drugs. If our products were regulated as drugs by the FDA, we would be required to conduct clinical trials to demonstrate safety and efficacy of our products in order to continue marketing those products. However, we may not have sufficient resources to conduct any required clinical studies and because clinical trial outcomes are uncertain we may not be able to demonstrate sufficient efficacy or safety data to resume future marketing of those products. The FDA may change the regulations as to any product category, including our sunscreen drug products, requiring a change in labeling, product formulation or analytical testing. However, we may not have sufficient resources to conduct any required analytical testing, reformulate the product or make required label changes, possibly resulting in an inability to resume marketing these products. Any inquiries or investigations from the FDA, FTC or other foreign regulatory authorities into the regulatory status of our cosmetic products and any subsequent interruption in the marketing and sale of those products could severely damage our brands and company reputation in the marketplace.
-7-
Environmental
We are subject to a broad range of frequently changing federal, state and local environmental, health and safety laws and regulations, including those governing discharges to air, soil and water, the handling and disposal of, and exposure to, hazardous substances and the investigation and remediation of any contamination resulting from the release of any hazardous substances. We believe that our business, operations and facilities are in material compliance with all applicable environmental, health and safety laws and regulations, and future expenditures will be necessary in order to maintain such compliance.
The shallow soils and groundwater below our City of Industry facilities were contaminated by the former operator of the property. The former operator performed onsite cleanup and we anticipate that we will receive written confirmation from the State of California that no further onsite cleanup is necessary. Such confirmation would not rule out potential liability for regional groundwater contamination or alleged potable water supply contamination discussed below. If further onsite cleanup is required, we believe the cost, which we are not able to estimate, would be indemnified, without contest or material limitation, by companies that have fulfilled similar indemnity obligations to us in the past, and that we believe remain financially able to do so.
The facilities are located within an area of regional groundwater contamination known as the Puente Valley “operable unit” (“PVOU”) of the San Gabriel Valley Superfund Site. We, along with many others, were named by the U.S. Environmental Protection Agency (“EPA”) a potentially responsible party (“PRP”) for the regional contamination. We entered into a settlement with another PVOU PRP, pursuant to which, in return for a payment we have already made and had been fully indemnified for by a third party, the other PRP indemnified us against most claims for PVOU contamination. A court approved and entered a consent decree among the other PRP, us and the EPA that resolves our liability for cleanup of regional groundwater contamination without any payment by us to the EPA. Depending on the scope and duration of the cleanup, we may be required to make further payments to the other PRP for regional groundwater remediation costs. We estimate the amount of such additional payments, if any, would not exceed approximately $130,000. The estimate is based on component estimates for two distinct contaminants that may require remediation. Those estimates in turn are based on a number of assumptions concerning the likelihood that remediation will be required, the cost of remediation if required and other matters. Uncertainty in predicting these matters limits the reliability and precision of the estimates. We expect any such additional payments by us to be covered by indemnities given to us by the other companies. Those companies may contest their indemnity obligation for these payments. We believe the companies are financially able to pay the liability. Because we believe it is not probable that we will be held liable for any of these expenses, we have not recorded a liability for such potential claims.
Our liability for these contamination matters is substantially covered by third-party indemnities and resolved by prior agreements and settlements, and borne by prior operators of the facilities, their successors and their insurers. We are attempting to recoup approximately $760,000 in defense costs from one of these indemnitors. These costs have been expensed as paid by us and are not recorded in our consolidated balance sheets.
Available Information
We maintain a website on the Internet at www.physiciansformula.com. We make available free of charge through our website, by way of a hyperlink to a third-party Securities Exchange Commission (the "SEC") filing website, our Annual Reports on Form 10-K, Quarterly Reports on Form 10-Q, Current Reports on Form 8-K and amendments to those reports electronically filed or furnished pursuant to Section 13(a) or 15(d) of the Exchange Act of 1934. Such information is available as soon as such reports are filed with the SEC. In addition, our Code of Ethics may be accessed in the Investor Relations section of our website. Information found on our website is not part of this Annual Report on Form 10-K or any other report filed with the SEC.
ITEM 1A. RISK FACTORS
Investing in our common stock involves a high degree of risk. You should carefully consider the following risk factors and all other information contained in this Annual Report on Form 10-K before making a decision to invest in our common stock. If any of the following risks occur, our business, results of operations and financial condition may be materially and adversely affected. In that event, the trading price of our common stock could decline, and you could lose all or part of your investment.
Risks Related to Our Business and Industry
We depend on a limited number of retailer customers for a majority of our sales and the loss of one or more of these customers would reduce our sales and harm our market share and our business.
We depend on a small number of core retailer customers for a majority of our sales, including Wal-Mart, CVS and Target. Sales to these three retailer customers accounted for an aggregate of 62.6% of our gross sales in 2010. None of our customers is under an obligation to continue purchasing products from us in the future. The fact that we do not have long-term contracts with our customers means that we have no recourse in the event a customer no longer wants to purchase products from us. In the future, retailers in the mass market channel may undergo restructurings or reorganizations, realign their affiliations, close stores or otherwise suffer losses, any of which could decrease their orders for our products. The loss of one or more of our customers that, individually or in the aggregate, accounts for a significant portion of our sales, any significant decrease in sales to those customers, any significant decrease in our retail selling space in any of those customers’ stores, an interruption or decline of our customers’ business or a successful demand by those customers that we decrease our prices would reduce our sales and harm our business. In the first quarter of 2009, one of our largest retailer customers informed us that as a result of a change in strategy, the customer intends to reduce the space allocated to the entire color cosmetics category in its stores in 2010. In April 2009, this customer informed us of its decision to discontinue selling Physicians Formula products. This change had a material negative impact on our net sales beginning in the second quarter of 2009 as the customer reduced its inventory levels of our products. This change eliminated our distribution in approximately 5,800 stores. This customer accounted for 4.8% and 15.8% of our gross sales for the years ended December 31, 2009 and 2008, respectively. We did not have any sales to this customer during the year ended December 31, 2010, but have been re-introduced to their online business in 2011.
-8-
Fluctuations in buying decisions of our retailer customers, the trend toward retail consolidation and changing policies and requests of our customers could harm our business.
We currently sell our products primarily in the mass market channel. Consequently, our sales are affected by fluctuations in the buying patterns of our retailer customers and consumers who shop in the mass market channel. These fluctuations may result from economic conditions or other factors. In addition, with the growing trend towards retail consolidation, we are increasingly dependent upon a few leading retailers, such as Wal-Mart, CVS, Target and Rite Aid, whose bargaining strength continues to grow due to their size. These customers have requested, and may continue to request, increased service and order accommodations. Our customers have also requested assistance with installation of new retail permanent fixtures and resets of our wall displays, which typically requires us to hire a third-party vendor to provide these services. Our customers could also request incremental trade allowance investments such as cash discounts, markdown allowances, in-store retailer advertising, coupon expense and other miscellaneous retailer allowances, and could require us to invest in radio frequency identification, an automatic data capture technology that uses “smart tags” attached to inventory for purposes of inventory control, or source tagging, a security tag attached to inventory. Our customers could also request price decreases that would negatively impact our margins, or reduce the number of SKUs in their stores. As a result, we may face substantially increased expenses to meet these requests, which would reduce our margins. We also may be negatively affected by changes in the policies and requests of our retail customers relating to service levels, inventory de-stocking or limitations on access to wall display space.
Our business and results of operations have been adversely impacted by the severe downturn in the U.S. economy and will continue to be impacted by general economic conditions.
Our operations and financial performance are directly impacted by changes in the U.S. economy. The recent significant downturn in the U.S. economy has significantly lowered consumer discretionary spending, which has in turn lowered the demand for our products. Reduced consumer discretionary spending may cause us to lower prices, increase our trade spending or suffer significant product returns from our retailer customers, any of which would have a negative impact in our gross margins. Additionally, a continued weakened consumer environment may create additional declines in our market capitalization relative to our net book value resulting in a potential impairment of intangible assets, including trade names.
Current economic conditions could also have a negative impact on the financial stability of our retailer customers. A small number of our customers account for a large percentage of our net sales and accounts receivable. If any of our significant retailer customers were unable to finance purchases of our products or defaults on amounts owed to us, it would have an adverse impact on our results of operations and financial condition, including our liquidity. Although we have seen recent signs of improvement in our business, it is uncertain if economic conditions or consumer confidence will stabilize or will deteriorate further, or when economic conditions or consumer confidence will improve. If there is a prolonged recession, reduced consumer spending could have a material and adverse effect on our business, results of operations or financial condition, including recognizing an additional impairment charge of the Physicians Formula trade name. Additionally, if these adverse impacts to our results of operations lead to the generation of pre-tax losses in the future, this could also result in recognizing a valuation allowance against our deferred income tax assets.
If we are unable to comply with the financial covenants in our new senior credit agreement and senior subordinated note, our business, results of operations and liquidity could be materially and adversely affected.
We are operating in a challenging economic environment and our ability to comply with the financial maintenance covenants in the new senior credit agreement and senior subordinated note may be affected by future economic or business conditions beyond our control. We were in compliance with these financial covenants as of and for the 12 months ended December 31, 2010, and, based on our internal projections, we believe that we will continue to be in compliance with the minimum book net worth covenant. However, our Adjusted EBITDA covenant involves more uncertainty, and continued worsening in the economic environment could impact our ability to meet this covenant. A failure to maintain the financial covenants in our new senior credit agreement and senior subordinated note, if we are not able to obtain an amendment or waiver in the future, would be an event of default under our new senior credit agreement and senior subordinated note. If there is an event of default under our new senior credit agreement and senior subordinated note, we would be precluded from borrowing under our revolving credit facility and the indebtedness under our new senior credit agreement and senior subordinated note could be declared immediately due and payable, which would have a material adverse effect on our business, financial condition and liquidity. There is no assurance that we would receive waivers should we not meet our financial covenants. Even if we are able to obtain a waiver, in connection with negotiating a waiver we may be required to agree to other changes in the new senior credit agreement and senior subordinated note, including increased interest rates, tighter covenants or lower availability thresholds; we may also be required to pay a fee for such waiver. If we are not able to comply with the financial covenants in the new senior credit agreement and senior subordinated note and we are unable to obtain waivers, we would need to obtain additional sources of liquidity; however, given the unprecedented instability in worldwide credit markets, there can be no assurance that we will be able to obtain additional sources of liquidity and, if we can obtain financing, that we will be able to do so on terms acceptable to us. See Item 7 under the caption "Credit Facilities" and Note 6 to the consolidated financial statements.
-9-
The high level of competition in our industry could harm our business, financial performance, market share and profitability. Many of our competitors have substantially greater resources than we do.
The business of selling cosmetics is highly competitive. This market includes numerous manufacturers, distributors, marketers and retailers that actively compete for consumers both in the U.S. and abroad. The cosmetics market is highly sensitive to the introduction of new products, which may rapidly capture a significant share of the market. In addition, our products may be, or are at the risk of becoming, obsolete due to new product introductions or new technologies. Our competitors may foresee the course of market development more accurately than we do, develop products and technologies that are superior to ours, produce similar products at a lower cost than we can or adapt more quickly to consumer preferences. Any of these developments would harm our operating results.
We compete in select product categories against a number of multinational manufacturers, many of which are larger and have substantially greater resources than we do. Therefore, these larger competitors have the ability to spend more aggressively on advertising, trade spending, marketing and research and to grow more quickly through acquisitions. Our largest competitors currently sell their products in significantly more stores and have significantly more selling space per store than we do. In addition, our current product lines compete in only approximately half of the cosmetics categories and we may not be able to compete successfully with companies with broader product offerings.
Our competitors may attempt to gain market share by offering products at prices at or below the prices at which our products are typically offered. Competitive pricing may require us to reduce our prices, which would decrease our profitability or result in lost sales. Our competitors, many of whom have greater resources than we do, may be better able to withstand these price reductions and lost sales. We cannot assure you that future price or product changes by our competitors will not adversely affect our net sales or that we will be able to react with price or product changes of our own to maintain our current market position.
If our products do not appeal to a broad range of consumers, our sales and our business would be harmed.
Our success depends on our products’ appeal to a broad range of consumers whose preferences cannot be predicted with certainty and are subject to change. If our current products do not meet consumer demands, our sales will decline. In addition, our growth depends upon our ability to develop new products through new product lines, product line extensions and product improvements, which involve numerous risks. New product launches are essential to our continued growth. New products have contributed, on average, approximately 36.1% of our gross sales for the last three years and approximately 31.9% of our gross sales in 2010. As we grow, our reliance on new products may increase. We may not be able to accurately identify consumer preferences, translate our knowledge into consumer-accepted products or successfully integrate new products with our existing product platform or operations. We may also experience increased expenses incurred in connection with product development or marketing and advertising that are not subsequently supported by a sufficient level of sales, which would negatively affect our operating results. Unsuccessful product launches could also result in increased inventory write-downs. Furthermore, product development may divert management’s attention from other business concerns, which could cause sales of our existing products to suffer. We may not be able to successfully develop new products in the future, and our newly developed products may not contribute favorably to our operating results.
We are a small company that relies on a few key employees to ensure that our business operates efficiently. If we were to lose the services of any of these key employees, we would experience difficulty in replacing them, which would affect our business operations and harm our business and results of operations.
Our success depends to a significant degree upon the business expertise and continued contributions of our senior management team of only three individuals, any one of whom would be difficult to replace. As a result, our future results will depend significantly upon the efforts and retention of key employees, such as Ingrid Jackel, our Chief Executive Officer, who is also responsible for marketing, research and development, operations and human resources, Jeffrey P. Rogers, our President, who is also currently and has historically been responsible for sales, and Jeff M. Berry, our Chief Financial Officer, who is also responsible for accounting and finance, information technology and legal functions. We rely on this group of three individuals, who have an average of 16 years of cosmetics industry experience, for managing our company, developing our business strategy and maintaining our strategic relationships with our key retailer customers. Because we are a small company, we believe that the loss of key personnel would be more disruptive to us than it would be to a large, multinational manufacturer. Any of these employees could, with little or no prior notice, voluntarily terminate their employment with us at any time. We only maintain a life insurance policy on Ingrid Jackel. The loss of service of any of these key employees would harm our business and results of operations.
In addition, our senior management team may not be able to successfully manage our company as it grows larger. If they are unable to handle these increased responsibilities and we are unable to identify, hire and integrate new personnel, our business, results of operations and financial condition would suffer. Even if we are able to identify new personnel, the integration of new personnel into our business will inevitably occur over an extended period of time. During that time, the lack of sufficient senior management personnel would cause our results of operations to suffer.
-10-
Our initiatives to expand into new product categories may not be successful and any failure to expand into new product categories would harm our business, results of operations, financial condition and future growth potential.
In order to expand our business, we plan to further develop products in cosmetics subcategories such as foundation, mascara and lip products. We currently offer products in only approximately half of the cosmetics categories, and expansion into new cosmetics categories is a critical component of our growth strategy. However, we may not be successful in our expansion efforts in these areas. Each of these product initiatives involves significant risks, as well as the possibility of unexpected consequences, including:
| ● | sales of the new products to our retailer customers may not be as high as we anticipate; | |
| ● | the rate of purchases by consumers may not be as high as we or our retailer customers anticipate; | |
| ● | returns of new products by retailer customers may exceed our expectations; | |
| ● | our marketing strategies and merchandising efforts may be ineffective and fail to reach the targeted consumer base or engender the desired consumption; | |
| ● | we may incur unexpected costs as a result of the continued development and launch of new products; | |
| ● | our pricing strategies may not be accepted by our retailer customers and/or their consumers; | |
| ● | we may experience a decrease in sales of our existing products as a result of introducing new products; | |
|
●
|
there may be delays or other difficulties impacting our ability, or the ability of our third-party manufacturers and suppliers, to timely manufacture, distribute and ship products in connection with launching new products; and | |
|
●
|
attempting to accomplish all of the elements of expansion in multiple product categories simultaneously may prove to be an operational and financial burden on us and we may be unable to successfully accomplish all of the elements of the expansion simultaneously, if at all. |
Each of the risks referred to above could delay or impede our ability to successfully expand into new product categories, which would harm our business, results of operations, financial condition and future growth potential.
We may be unable to increase our sales through new and existing distribution channels which would limit our growth and harm our business, results of operations and financial condition.
The mass market channel is currently the only significant distribution channel for our products. Products similar to ours are sold in department stores, door-to-door, on the Internet, through home shopping television shows, by mail-order and through telemarketing by representatives of direct sales companies. Any failure to successfully enter new distribution channels could limit our growth. In addition, consumers could choose to increasingly purchase cosmetics at department stores, high-end specialty retailers or in other distribution channels in which we do not participate. Our ability to continue to grow and achieve similar profit margins is dependent on our continued expansion in the mass market channel. Our failure to successfully expand in the mass market channel would harm our business, results of operations and financial condition.
Many of our competitors currently sell to the same retailer customers that we do, but their products are sold in more of those retailers’ stores and they are allocated more shelf space in those stores. Our growth strategy includes increasing store count with these retailers and expanding the space within the existing stores that currently sell our products. If we fail to increase the number of stores or the amount of space within those stores in which we sell our products, it would harm our business, results of operations and financial condition.
If we are unable to successfully execute any material part of our growth strategy, our future growth and ability to make profitable investments in our business would be harmed.
Our ability to succeed depends on our ability to grow our business while maintaining profitability. Introducing new products and expanding our distribution have contributed significantly to our recent results, but we must continue to develop new and innovative products and expand our distribution in order to maintain our growth and profitability. We are heavily dependent on new products, which have contributed, on average, approximately 36.1% of our gross sales in the last three years and approximately 31.9% of our gross sales in 2010. We may not be able to sustain our growth or profitability on a quarterly or annual basis in future periods. Our future growth and profitability will depend upon a number of factors, including, without limitation:
| ● | the level of competition in the cosmetics industry; | |
| ● | our ability to continuously offer new products; | |
| ● | our ability to maintain efficient, timely and cost-effective production and delivery of our products; | |
| ● | our ability to obtain sufficient production capacity for our products; | |
| ● | the efficiency and effectiveness of our sales and marketing efforts in building product and brand awareness; | |
| ● | our ability to identify and respond successfully to emerging trends in the beauty industry; | |
| ● | the level of consumer acceptance of our products; and | |
|
●
|
general economic conditions and consumer confidence. |
We may not be successful in executing our growth strategy, and even if we achieve targeted growth, we may not be able to sustain profitability. Failure to successfully execute any material part of our growth strategy would significantly impair our future growth and our ability to make profitable investments in our business.
-11-
We may be unable to manage our growth effectively, which would harm our business, results of operations and financial condition.
Our growth has placed, and will continue to place, a strain on our management team, information systems, labor, assembly and distribution capacity and other resources. We are currently running two shifts at our Covina facility. We expect to use some outsourced manufacturing in the fourth quarter of 2011 and first quarter of 2012 to meet anticipated demand. Outsourcing manufacturing could impact our ability to maintain our quality standards, which could harm our reputation. We could also be forced to extend the second shift or add a third shift in the fourth quarter of 2011 and first quarter of 2012, which would be more expensive and would negatively affect our operating margins. We may experience additional constraints on capacity in the future. If we are unable to effectively address our capacity constraints or manage our future growth, our failure to do so would harm our business, results of operations and financial condition.
Our growth also makes it difficult for us to adequately predict the expenditures we will need to make in the future. If we do not make, or are unable to make, the necessary overhead expenditures to accommodate our future growth, we may not be successful in executing our growth strategy, and our prospects and results of operations would suffer. In addition, if retailer customer demand exceeds forecasts, we could, from time to time, have an inadequate supply of products to meet customer demands.
If we are unable to protect our intellectual property our ability to compete would be negatively impacted.
We attempt to protect our intellectual property under the patent and trademark laws. The market for our products depends to a significant extent upon the goodwill associated with our trademarks and trade names. We own the material trademarks and trade name rights used in connection with the packaging, marketing and sale of our products. Therefore, trademark and trade name protection is important to our business. Although we have registered or applied to register many of our trademarks in the U.S. and in certain foreign countries, we cannot assure you that all of our trademark applications will be approved.
We also own design patents that relate to some of our products. The design patents we own could be challenged, invalidated or circumvented by others and may not be of sufficient scope or strength to provide us with any meaningful protection or commercial advantage. Although we have registered or applied to register additional design patents in the U.S. and in certain foreign countries, we cannot assure you that any of our design patent applications will be approved. In addition, we do not own any formula patents. Our suppliers or other third parties hold certain formula patents for the manufacture of our products. If our relationships with our suppliers were interrupted or terminated, or if we are unable to use formulas covered by third-party patents, our business could be harmed and it would negatively impact our results of operations.
Third parties may also oppose our trademark and design patent applications, or otherwise challenge our use of our trademarks or design patents. We cannot assure you that competitors will not infringe our trademarks or our design patents, or that we will have adequate time and resources to enforce our trademarks and design patents and to protect our rights through litigation or otherwise, or that we will be successful in doing so.
We also face the risk of claims that we have infringed third parties’ intellectual property rights. Any claims of intellectual property infringement, even those without merit, could expose us to the following risks, among others:
| ● | we may be required to defend against infringement claims which are expensive and time consuming; | |
| ● | we may be required to cease making, licensing or using products that incorporate the challenged intellectual property; | |
| ● | we may be required to re-design, re-engineer or re-brand our products or packaging; or | |
| ● | we may be required to enter into royalty or licensing agreements in order to obtain the right to use a third party's intellectual property. |
Any of these outcomes would negatively impact our business, results of operations and financial condition.
We will require a significant amount of cash, and any failure to generate and raise sufficient cash would impair our ability to support our future growth or operating requirements, which would harm our business.
Our ability to fund working capital needs and planned capital expenditures depends on our ability to generate cash flow in the future. We estimate that our net working capital requirements will increase to $29.5 million in 2011 from $27.2 million in 2010. We have budgeted capital expenditures of $3.6 million for 2011, compared to $5.1 million in 2010, which consists of $1.3 million of property, plant and equipment expenditures and $2.3 million of retail permanent fixture expenditures.
Our ability to generate future cash flow is subject to general economic, financial, competitive, legislative, regulatory and other factors that are beyond our control. We cannot assure you that our business will continue to generate cash flow from operations at current levels or that our cash needs will not increase beyond what we currently anticipate our cash needs to be. If we had to raise additional capital, equity or debt financing may not be available at all or may be available only on terms that are not favorable to us. If we cannot obtain adequate capital on favorable terms or at all, we may be unable to support future growth or operating requirements and, accordingly, our business, financial condition or results of operations would suffer.
-12-
Any variation in the quality of our products or delay in our ability to fill orders would harm our relationships with our retailer customers.
Our success depends upon our quality control and on our ability to deliver products in a timely manner. If our products are not delivered according to retailer customers’ delivery deadlines or are found to be defective or not to specification, our relationships with our customers would suffer, our brands’ reputation would be harmed and we could lose our market share. We could also experience increased return rates or become subject to liability claims. These negative results would have a harmful effect on our business, results of operations and financial condition.
We may not be able to successfully implement efficiency improvements or realize cost savings, which would harm our business.
The automation of our remaining manual assembly lines and any other efficiency improvements we may undertake could involve substantial investments and are subject to significant business, economic and competitive uncertainties and contingencies, many of which are beyond our control. We expect to experience some capacity constraints at our product assembly and distribution facilities in the fourth quarter of 2011 and first quarter of 2012, and our failure to successfully implement efficiency improvements and capacity expansion could result in additional capacity constraints in the future. Failure to implement this efficiency improvement would result in increased costs which would reduce our margins and harm our business.
We purchase components and semi-finished goods from a limited number of third-party suppliers, which reduces our control over the manufacturing process and may cause variations in quality or delays in our ability to fill orders.
We purchase components, such as plastic compact containers or plastic tubes, and semi-finished goods, such as plastic compact containers or plastic tubes filled with product, from foreign and U.S. suppliers. We depend on these suppliers to deliver products that are free from defects, that comply with our specifications, that meet our delivery requirements and that are competitive in cost. If our suppliers deliver products that are defective or that otherwise do not meet our specifications, our product failure and return rates may increase, and the reputation of our products and the Physicians Formula brand may suffer. In addition, if our suppliers do not meet our delivery requirements or cease doing business with us for any reason, we might miss our retailer customers’ delivery deadlines, which could in turn cause our customers to cancel or reduce orders, refuse to accept deliveries or demand reduced prices. Even if acceptable alternative suppliers are found, the process of locating and securing such alternatives is likely to disrupt our business, and we cannot assure you that we will be able to secure alternative suppliers on acceptable terms that provide the same quality product or comply with all applicable laws. Extended unavailability of necessary components or finished goods would cause us to be unable to market one or more of our products for a period of time. Any of these events would cause our business, results of operations and financial condition to suffer.
Further increases in the California or Federal minimum wage would increase our operating costs and harm our profitability.
We pay the 100 to 250 workers provided to us by a third-party staffing service the California minimum wage, which increased to $8.00 per hour on January 1, 2008. Further increases in the minimum wage may lead to an increase in wages to our hourly employees who are currently paid above minimum wage.
The Federal minimum wage is currently lower than the California minimum wage. If the Federal minimum wage were increased to an amount greater than the California minimum wage, we would be required to pay the Federal minimum wage. Further increases in the California minimum wage, or increases in the Federal minimum wage to an amount higher than the California minimum wage, would increase our operating costs and harm our profitability.
All of our facility leases expire in December 2012. If we are unable to renew these leases on favorable terms or move to new facilities, our costs could increase, which would harm our business, results of operations and financial condition.
The leases for our facilities in Azusa, City of Industry and Covina, California expire in December 2012. Whether we lease new facilities or remain in those facilities, we could be subject to increased rental rates. If we lease new corporate and manufacturing facilities, the costs associated with moving from our Azusa, City of Industry and Covina facilities could be substantial. In addition, any move would be costly and could disrupt our operations and ability to meet our obligations to our retailer customers.
Catastrophic loss, delays in deliveries or other disruptions at any of our facilities would negatively impact our business.
Substantially all of our products are assembled at our two adjacent manufacturing facilities in City of Industry, California and our third facility in Covina, California. Significant unscheduled downtime at these facilities due to equipment breakdowns, fires, power failures, earthquakes and other natural disasters, severe weather conditions or other disruptions would adversely affect our ability to provide products to our retailer customers in a timely manner. Although we maintain insurance coverage for our facilities, we cannot assure you that our insurance coverage will be adequate to cover all of our losses in the event of a catastrophic loss. In the future, insurance could become more expensive and difficult to maintain and may not be available on commercially reasonable terms or at all.
We operate a facility in Azusa, California, which serves as our main distribution facility and our corporate headquarters. If operational complications arise with our Azusa facility or if our Azusa facility is severely damaged or destroyed, it would not be able to support our distribution needs. Any disruptions at our Azusa facility would adversely affect our ability to deliver products to our retailer customers on a timely basis. If we miss our retailers’ delivery deadlines or if our products fail to meet their specifications, our relationships with our customers would suffer and our business could be harmed.
All of our facilities are located within 15 miles of each other in Southern California. We do not have other facilities in other regions from which to operate in the event of catastrophic loss, delays in deliveries, other disruptions or natural disasters.
-13-
Regulations governing our industry could have a significant negative effect on our business, results of operations and financial condition.
Our business is subject to numerous laws and regulations. The formulation, manufacturing, packaging, labeling, registration, advertising, distribution, importation, storage and sale of our cosmetic products are subject to extensive regulation by various Federal agencies, including the U.S. Food and Drug Administration, or the “FDA,” the U.S. Federal Trade Commission, or the “FTC,” the “EPA,” and by various agencies of the states, localities and foreign countries in which our products are manufactured, distributed and sold. Our facilities in City of Industry and Covina, California are registered with the FDA as drug manufacturing and repackaging establishments, respectively, permitting the manufacture of cosmetics that contain over-the-counter drug ingredients such as sunscreen. Failure by us or our third-party suppliers to comply with those laws and regulations could lead to an enforcement action and the imposition of significant penalties or claims, resulting in significant loss of sales, and could have a negative effect on our business, results of operations and financial condition. If we fail to comply with Federal, state or foreign laws and regulations, we could be required to suspend manufacturing operations, change product formulations, suspend the sale of certain products, initiate product recalls, change product labeling, packaging or advertising or take other corrective actions. Any of these actions could harm our business, financial condition and results of operations. In addition, the adoption of new laws or regulations or changes in the interpretations of existing laws or regulations may result in significant compliance costs or discontinuation of products. Our failure to comply with FDA, FTC, EPA or state laws and regulations, or with laws and regulations in foreign markets, that cover our advertising, including direct claims and advertising by us, may result in enforcement actions and imposition of penalties or otherwise materially adversely affect the distribution and sale of our products and our business.
The FDA monitors compliance with the Federal Food, Drug and Cosmetic Act, or the “FDCA,” through random inspection of cosmetic manufacturers and distributors to ensure that the products neither contain false or misleading labeling nor are manufactured under unsanitary conditions. FDA inspections also may occur following receipt of consumer or competitor complaints. In the event the FDA does find false or misleading labeling, unsanitary manufacturing conditions, or other instances of noncompliance with FDA requirements, our distribution channel may be affected, possibly by a product recall or by an insufficient supply of product in the marketplace, thereby resulting in reduced product sales and revenue to us and in increased costs to our operations.
We also are subject to a variety of other laws and regulations in Canada and Australia. Our failure to comply, or assertions that we have failed to comply, with these laws and regulations could have a material adverse effect on our business in a particular market or in general. To the extent we decide to commence or expand operations in additional countries, laws and regulations in those countries, or the cost of complying with such laws and regulations, may prevent or delay entry into or expansion of operations in those markets or could have a negative effect on our operating margins for products sold in those countries. Regulatory requirements can vary widely from country to country and could further delay the introduction of our products into those countries. We may not be able to enter into acceptable agreements to market and commercialize our products in international markets.
Our ability to sustain satisfactory levels of sales in our markets is dependent in significant part on our ability to introduce additional products into those markets. Government laws and regulations in both our domestic and international markets can delay or prevent the introduction, or require the reformulation or withdrawal, of our products.
Inability to obtain regulatory approval for our manufacturing facility or the need to open new facilities may delay or disrupt our commercialization efforts.
Our facilities in City of Industry and Covina, California are registered with the FDA as drug manufacturing establishments, thereby permitting the manufacture of cosmetics that contain over-the-counter, or “OTC”, drug ingredients such as sunscreen. Our manufacturing facilities therefore are subject to routine and/or unannounced inspection by the FDA. All processes, methods and equipment must be compliant with current Good Manufacturing Practices, or “cGMPs,” which also requires extensive audits of vendors, contract laboratories and suppliers. The cGMPs govern quality control of the manufacturing process, documentation policies and procedures. In complying with cGMPs, we are obligated to expend time, money and effort in production, record keeping and quality control to ensure that the product meets applicable specifications and other requirements. If we fail to comply with these requirements, we could experience product liability claims from consumers purchasing our products and we could be subject to possible regulatory action. If an inspection by the FDA or state or other foreign regulatory authority indicates that there are deficiencies, we would be required to take remedial actions or our facility may be closed, and we may be subject to additional enforcement activity.
We may need to develop additional manufacturing facilities based on expanded product development, FDA regulatory requirements or other unforeseen market pressures. Preparing a facility for commercial manufacturing may involve unanticipated delays, and the costs of building a facility in compliance with state, local and FDA regulations may be higher than we anticipated.
-14-
The regulatory status of our products could change, and we may be required to conduct clinical trials to establish efficacy and safety or cease to market some or all of our products, which would require significant time and resources.
Under the FDCA, there is no pre-market approval requirement for cosmetics, and we believe we are permitted to manufacture and market our cosmetics without submitting safety or efficacy data to the FDA. However, if the FDA in the future were to conclude that our cosmetics or the ingredients included in our cosmetics should be regulated as drugs or biologics, rather than cosmetics, we may be required to conduct clinical trials to demonstrate the safety and efficacy of these products in order to continue to market and sell them. In such an event, we may not have sufficient resources to conduct the required clinical trial or may not be able to establish efficacy or safety of those products to the FDA’s satisfaction. Furthermore, the clinical trials may be subject to unanticipated delays due to their time-consuming nature, and the outcome of any clinical trial is uncertain. Any inquiries by the FDA or any foreign regulatory authorities into the regulatory status of our cosmetics and any related interruption in the marketing and sale of these products could severely damage our brand reputation and image in the marketplace, as well as our relationships with retailer customers, which would harm our business, results of operations and financial condition.
Some of our foundations and concealers are considered over-the-counter, or “OTC,” drug products by the FDA. The FDA regulates the formulation, manufacturing, packaging, labeling and distribution of OTC drug products pursuant to a monograph system that specifies active drug ingredients and acceptable product claims that are generally recognized as safe and effective for particular uses. If any of these products that are OTC drugs are not in compliance with the applicable FDA monograph, we would be required to (i) reformulate such product, (ii) cease to make certain use claims relating to such product or (iii) cease to sell such product until we receive further FDA approval. If more stringent regulations are promulgated, we may not be able to comply with such statutes or regulations without incurring substantial expense. In addition, OTC drug products must be manufactured in accordance with pharmaceutical good manufacturing practice regulations. Our OTC drug manufacturers are subject to ongoing periodic unannounced inspection by the FDA as well as regular and ongoing inspections. In addition, inspections may be commenced as a result of consumer or competitor complaints related to our products. Corresponding state agencies may also inspect our facility to ensure strict compliance with drug good manufacturing practices and other government regulations and corresponding foreign standards. We have minimal control over third-party manufacturers’ compliance with these regulations and standards. If the FDA finds a violation of drug good manufacturing practices, it may enjoin the manufacturer’s operations, seize products, or criminally prosecute the manufacturer, any of which could require us to find alternative manufacturers, resulting in additional time and expense.
Our products may cause unexpected and undesirable side effects that would limit their use, require their removal from the market or prevent their further development. Product liability claims resulting from these undesirable side effects would hurt our business. In addition, we are vulnerable to claims that our products are not as effective as we claim them to be.
Unexpected and undesirable side effects caused by our products for which we have not provided sufficient label warnings could result in the recall or discontinuance of sales of some or all of our products. Unexpected and undesirable side effects could prevent us from achieving or maintaining market acceptance of the affected products or could substantially increase the costs and expenses in marketing new products. We have been, and may in the future be, subject to various product liability claims resulting from those undesirable side effects caused by our products. Product liability claims may result in negative publicity regarding our company, brand or products that may harm our reputation and sales. In addition, if one of our products is found to be defective we may be required to recall it, which may result in substantial expense, adverse publicity and loss of sales, which would substantially harm our brand. Although we maintain product liability insurance coverage, potential product liability claims may exceed the amount of our insurance coverage or potential product liability claims may be excluded under the terms of our policy, which would cause our financial condition to suffer. In addition, we may be required to pay higher premiums and accept higher deductibles in order to secure adequate insurance coverage in the future.
In addition, consumer or industry analysts may assert claims that our products are not as effective as we claim them to be. We are particularly susceptible to these risks because our marketing heavily relies on the assertions that our products adhere to our founder’s commitment to product purity and quality, are hypoallergenic and are ideal for women who have skin conditions that can be exacerbated by traditional cosmetics. Unexpected and undesirable side effects associated with our products or assertions that our products are not as effective as we claim them to be also could cause negative publicity regarding our company, brand or products, which could in turn harm our reputation and our business.
Our business may be subject to environmental investigation, remediation and compliance costs, which could adversely affect our business, results of operations and financial condition.
Our operations are subject to a range of Federal, state and local environmental, health and safety laws and regulations, including those governing discharges to air, soil and water, the handling and disposal of, and exposure to, hazardous substances and the investigation and remediation of contamination resulting from the release of hazardous substances. We believe that our business, operations and facilities are in material compliance with all applicable environmental, health and safety laws and regulations.
Our City of Industry facility was contaminated, and subsequently remediated, by the former operator of the property. In addition, the facility is located within an area of regional groundwater contamination known as the Puente Valley “operable unit” of the San Gabriel Valley Superfund Site. We, along with many others, were named a potentially responsible party for the regional contamination by the EPA. To date, our liability for this matter has been substantially covered by indemnities and resolved by prior settlements, and borne by prior operators of the facility and the business, one of their successors and one of their insurers. We are, however, attempting to recoup approximately $760,000 in defense costs from one of our indemnitors. These costs have been expensed as paid by us and are not recorded in our consolidated balance sheets. We may be subject to additional claims resulting from the historical site contamination and regional contamination. We have not established a reserve for additional claims, as we believe that it is not probable that we will be held liable for any of these claims. Failure by one or more of the responsible parties and/or our indemnitors to honor their obligations could cause us to incur liability which could be material.
-15-
We rely heavily on a staffing service to provide us with workers and could face significant employment claims that could harm our reputation, business, results of operations or financial condition.
We have contracted with a staffing service to supply us with workers. The number of workers supplied by the staffing service varies between a minimum of approximately 100 and 250, based on seasonal demands for our products. Actions taken by these workers or the agency that provides them to us could subject us to significant liability. An inherent risk of using workers supplied by a third party is that we may face possible claims of employment of undocumented workers, claims of violations of the National Labor Relations Act, discrimination or harassment, claims under health and safety regulations and other related claims. We may also be subject to claims that these workers should be deemed our employees for ERISA, federal taxation or other purposes. Any of these claims could require us to pay substantial fines and monetary damages. In addition, we could face negative publicity that would harm our brand. Any of these negative consequences would harm our reputation, business, results of operations or financial condition.
Our computer and communications hardware and software systems are vulnerable to damage and interruption, which could harm our business.
Our ability to receive and fulfill orders on a timely basis is critical to our success and largely depends upon the efficient and uninterrupted operation of our computer and communications hardware and software systems. Our primary computer systems and operations are located at our Azusa facility and are vulnerable to damage or interruption from power outages, computer and telecommunications failures, computer viruses, security breaches, catastrophic events and errors in usage by our employees and retailer customers. Systems integration is complex, time-consuming and expensive. Since we do not currently have adequate offsite backup systems, if a catastrophic event occurred at our City of Industry, Azusa or Covina facilities, we would be required to purchase back-up computer and communications hardware and software systems, and integrate them with our existing systems, at a significant cost. During the period in which these new systems are being integrated, our business, results of operations and financial condition could be harmed.
Significant increases in fuel prices would adversely affect our financial results.
Our freight cost is impacted by changes in fuel prices through surcharges and price increases. Fuel prices and surcharges affect freight cost both on inbound shipments from our suppliers to our assembly and distribution facilities and on outbound freight from our distribution center to our retailer customers. Increases in fuel prices and surcharges and other factors may increase freight costs and thereby increase our cost of sales and selling, general and administrative expenses.
We are subject to a variety of social, political and economic risks associated with doing business outside of the United States.
For the year ended December 31, 2010, approximately 14.0% of our net sales were attributable to our business in Canada, Australia and South Africa. In addition, eleven of our top fifteen suppliers, which include U.S. brokers that purchase raw materials, semi-finished goods and components on our behalf, are located in Europe or Asia. These eleven foreign suppliers represented approximately 60.3% of our purchases of raw materials, semi-finished goods and components in 2010. In particular, we purchase significant portions of our powders from suppliers in Italy and our components from suppliers in China. We may encounter risks of doing business outside of the U.S. including:
| ● | unexpected changes in, or impositions of, laws or regulatory requirements; | |
|
●
|
fluctuations in foreign exchange rates, which could cause fluctuations in the price of our products in foreign markets or in the cost of certain raw materials purchased by us; | |
|
●
|
delays resulting from difficulty in obtaining export licenses, tariffs and other barriers and restrictions, potentially longer payment cycles, greater difficulty in accounts receivable collection and potentially adverse tax treatment; | |
| ● | potential trade restrictions and exchange controls; | |
| ● | differences in protection of our intellectual property rights; and | |
| ● | the burden of complying with a variety of foreign laws and regulations. |
In addition, as we grow, we will be increasingly subject to general geopolitical risks in foreign countries where we sell our products and purchase our raw materials, such as political and economic instability and changes in diplomatic and trade relationships, which could affect, among other things, retailer customers’ inventory levels and consumer purchasing, and which would cause our results to fluctuate. These risks are compounded by the fact that we purchase the majority of our raw materials, semi-finished goods and components from only two countries, Italy and China. Changes within these countries could impair our business, results of operations and financial condition.
-16-
Risks Related to Our Common Stock
The price of our common stock may continue to be highly volatile and subject to wide fluctuations or decrease over time.
Broad market and industry factors may adversely affect the market price of our common stock, regardless of our actual operating performance. The market price for shares of our common stock has declined substantially in recent months and could decline further if our future operating results fail to meet or exceed the expectations of market analysts and investors or current economic or market conditions persist or worsen. Factors that could cause fluctuations in our future stock price may include, among other things:
| ● | introductions of new products or new pricing policies by us or by our competitors; | |
| ● | the gain or loss of significant customers or product orders; | |
| ● | actual or anticipated variations in our quarterly results; | |
| ● | the announcement of acquisitions or strategic alliances by us or by our competitors; | |
| ● | recruitment or departure of key personnel; | |
| ● | failure to comply with covenants in our debt agreements; | |
| ● | the level and quality of securities research analyst coverage for our common stock; | |
| ● | changes in the estimates of our operating performance or changes in recommendations by us or any research analysts that follow our common stock or any failure to meet the estimates made by research analysts; and | |
| ● | market conditions in our industry and the economy as a whole. |
In addition, public announcements by our competitors concerning, among other things, their performance, strategy, accounting practices, or legal problems could cause the market price of our common stock to decline regardless of our actual operating performance.
Shares of our common stock are thinly-traded, meaning that the number of persons interested in purchasing our common shares at or near ask prices at any given time may be relatively small or non-existent.
Low volume of trading activity of our stock may make it difficult for investors to resell their common stock when they want at prices they find attractive. Our stock price can fluctuate significantly in response to a variety of factors and the volume of shares traded can be influenced by:
| ● | limited research analysis performed on our corporation; | |
| ● | operating results and stock price performance of other companies that investors deem comparable to us; | |
| ● | news reports relating to trends, concerns and other issues in the cosmetics industry; | |
| ● | perceptions in the marketplace regarding us and/or our competitors; and | |
| ● | changes in government regulations. |
As a result of the thin trading market or "float" for our stock, the market price for our common stock may fluctuate significantly more than the stock market as a whole. Without a large float, our common stock is less liquid than the stock of companies with broader public ownership and, as a result, the trading prices of our common stock may be more volatile. In the absence of an active public trading market, an investor may be unable to liquidate his investment in our common stock. Trading of a relatively small volume of our common stock may have a greater impact on the trading price for our stock than would be the case if our public float were larger. We cannot predict the prices at which our common stock will trade in the future.
We do not intend to pay dividends on our common stock for the foreseeable future.
Since becoming a public company in 2006, we have not paid dividends and we do not expect to pay dividends on our common stock for the foreseeable future. Instead, we anticipate that all of our earnings, if any, in the foreseeable future will be used for the operation and growth of our business. Any future determination to pay dividends will be at the discretion of our board of directors and will depend upon, among other factors, our results of operations, financial condition, capital requirements and contractual restrictions. We are a holding company and have no direct operations. Our ability to pay dividends in the future depends on the ability of Physicians Formula, Inc. to pay dividends to us. Under the terms of our new senior credit agreement and senior subordinated note, our principal subsidiary, Physicians Formula, Inc., is generally prohibited from paying dividends to us, except in an amount up to $100,000 and $110,000, respectively, to allow us to pay ordinary course expenses. As a result, your only opportunity to achieve a return on your investment in us will be if the price of our common stock increases and if you are able to sell your shares at a profit. You may not be able to sell shares of our common stock at a price that exceeds the price that you paid.
-17-
Anti-takeover provisions in our amended and restated certificate of incorporation and by-laws and under the laws of the State of Delaware could impede an attempt to replace or remove our directors or otherwise effect a change of control of our company, which could diminish the value of our common stock.
Our amended and restated certificate of incorporation and by-laws contain provisions that may make it more difficult for stockholders to replace directors even if the stockholders consider it beneficial to do so. In addition, these provisions could delay or prevent a change of control that a stockholder might consider favorable. For example, these provisions may prevent a stockholder from receiving the benefit from any premium over the market price of our common stock offered by a bidder in a potential takeover. Even in the absence of an attempt to effect a change in management or a takeover attempt, these provisions may adversely affect the prevailing market price of our common stock if they are viewed as discouraging takeover attempts in the future. In addition, Section 203 of the Delaware General Corporation Law may limit the ability of an “interested stockholder” to engage in business combinations with us. An interested stockholder is defined to include persons owning 15% or more of any class of our outstanding voting stock.
Our amended and restated certificate of incorporation and by-laws contain the following provisions that could have an anti-takeover effect:
| ● | stockholders have limited ability to call stockholder meetings and to bring business before a meeting of stockholders; | |
| ● | stockholders may not act by written consent; | |
| ● | directors may only be removed from office for cause and by the affirmative vote of the holders of at least 66 2/3% of the total votes eligible to be cast in the election of directors; and | |
| ● | our board of directors may authorize the issuance of preferred stock with such rights, powers and privileges as the board deems appropriate. |
These provisions may make it difficult for stockholders to replace management and could have the effect of discouraging a future takeover attempt, which is not approved by our board of directors, but which individual stockholders might consider favorable.
ITEM 1B. UNRESOLVED STAFF COMMENTS
None.
ITEM 2. PROPERTIES
The following table sets forth our principal facilities as of December 31, 2010. All of these facilities are leased under two year lease contracts that expire in December 2012.
|
Location
|
Use
|
Approximate
Square
Footage
|
Ownership
Interest
|
|||
|
Azusa, California
|
Corporate office, distribution
|
82,000
|
Lease
|
|||
|
City of Industry, California
|
Manufacturing
|
20,000
|
Lease
|
|||
|
City of Industry, California
|
Manufacturing, office
|
25,000
|
Lease
|
|||
|
Covina, California
|
Manufacturing
|
72,500
|
Lease
|
The facilities in the City of Industry and Covina each have renewal options for at least an additional 60 months when the contracts expire in December 2012. The facility in Azusa has a renewal option for an additional 12 months when the contract expires in December 2012.
We believe that these facilities are adequate for our current needs and we will be able to identify and secure additional space to support our future growth on acceptable terms.
ITEM 3. LEGAL PROCEEDINGS
As discussed in Item 1 under "Environmental" (the contents of which are incorporated by reference in this Item 3), we are a party to various proceedings concerning environmental regulations. In addition, we have been named in various lawsuits in the ordinary course of business. In management's opinion, the ultimate resolution of these matters will not result in a material impact to our consolidated financial statements.
ITEM 4. RESERVED
-18-
PART II
ITEM 5. MARKET FOR REGISTRANT'S COMMON EQUITY, RELATED STOCKHOLDER MATTERS AND ISSUER PURCHASES OF EQUITY SECURITIES
Market Information
Our common stock is traded on The Nasdaq Global Select Market under the symbol "FACE." The following table sets forth the high and low sale prices for our common stock for the periods indicated as regularly reported by The Nasdaq Global Select Market:
|
High
|
Low
|
|||||||
|
Year ended December 31, 2010
|
||||||||
|
Fourth quarter
|
$ | 4.02 | $ | 3.16 | ||||
|
Third quarter
|
$ | 3.92 | $ | 2.93 | ||||
|
Second quarter
|
$ | 4.00 | $ | 2.43 | ||||
|
First quarter
|
$ | 2.46 | $ | 1.90 | ||||
|
Year ended December 31, 2009
|
||||||||
|
Fourth quarter
|
$ | 2.79 | $ | 1.78 | ||||
|
Third quarter
|
$ | 2.80 | $ | 1.86 | ||||
|
Second quarter
|
$ | 3.54 | $ | 1.24 | ||||
|
First quarter
|
$ | 3.94 | $ | 1.00 | ||||
As of March 3, 2011, there were 32 holders of record of our outstanding common stock.
Dividends
Since becoming a public company in 2006, we have not paid dividends and we do not expect to pay dividends on our common stock for the foreseeable future. Instead, we anticipate that all of our earnings, if any, in the foreseeable future will be used for the operation and growth of our business. Any future determination to pay dividends will be at the discretion of our board of directors and will depend upon, among other factors, our results of operations, financial condition, capital requirements and contractual restrictions. We are a holding company and have no direct operations. Our ability to pay dividends in the future depends on the ability of our subsidiaries to pay dividends to us. Under the terms of the new senior credit agreement and senior subordinated note, our principal subsidiary, Physicians Formula, Inc., is generally prohibited from paying dividends to us, except in an amount up to $100,000 and $110,000, respectively, to allow us to pay ordinary course expenses.
-19-
Performance Graph
The following graph compares our cumulative total stockholder return since the date our common stock began trading on The Nasdaq Global Select Market (November 9, 2006) with the Nasdaq Global Select Index and the Dow Jones U.S. Personal Products Index. The graph assumes that the value of the investment in our common stock and each index was $100 on November 9, 2006, and the reinvestment of all dividends.
Comparison of 12-Month Cumulative Total Return
Among Physicians Formula Holdings, Inc., the
Nasdaq Global Select Index and the Dow Jones
U.S. Personal Products Index
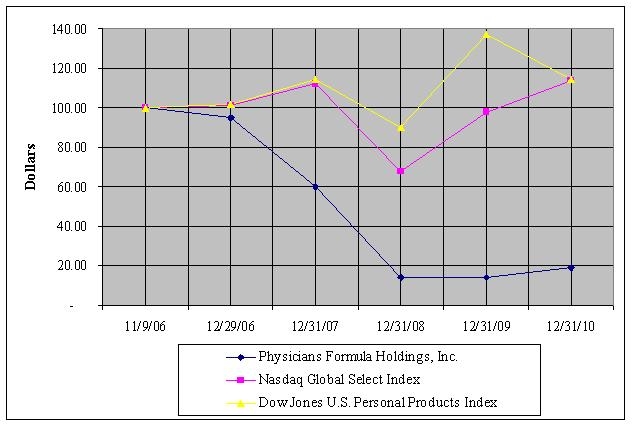
|
Cumulative Total Return
|
||||||||||||
|
Physicians Formula Holdings, Inc.
|
Nasdaq Global Select Index
|
Dow Jones U.S. Personal Products Index
|
||||||||||
|
November 9, 2006
|
$ | 100.00 | $ | 100.00 | $ | 100.00 | ||||||
|
December 29, 2006
|
94.78 | 101.37 | 101.65 | |||||||||
|
December 31, 2007
|
60.24 | 112.37 | 114.48 | |||||||||
|
December 31, 2008
|
14.15 | 67.92 | 90.02 | |||||||||
| December 31, 2009 | 13.95 | 97.76 | 137.16 | |||||||||
| December 31, 2010 | 19.07 | 114.16 | 114.36 | |||||||||
The information in the graph and table above is not "soliciting material," is not deemed "filed" with the Securities and Exchange Commission and is not to be incorporated by reference in any of our filings under the Securities Act of 1933, as amended, or the Securities Exchange Act of 1934, as amended, whether made before or after the date of this annual report, except to the extent that we specifically incorporate such information by reference.
Purchases of Equity Securities by the Issuer
We did not repurchase any of our common stock during the fourth quarter of 2010.
-20-
ITEM 6. SELECTED FINANCIAL DATA
You should read the selected historical financial data presented below in conjunction with our consolidated financial statements and the related notes and other information included elsewhere in this Annual Report on Form 10-K.
The selected historical financial data presented below under the heading “Statement of Operations Data” for the years ended December 31, 2010, 2009 and 2008 and the selected historical financial data presented below under the heading “Balance Sheet Data” as of December 31, 2010 and 2009 have been derived from, and are qualified by reference to, the audited consolidated financial statements included elsewhere in this Annual Report on Form 10-K. The selected historical financial data presented below under the heading “Statement of Operations Data” for the years ended December 31, 2007 and 2006 and the selected historical financial data presented below under the heading “Balance Sheet Data” as of December 31, 2008, 2007 and 2006 have been derived from, and are qualified by reference to, our audited consolidated financial statements which are not included in this Annual Report on Form 10-K.
|
Years Ended December 31,
|
||||||||||||||||||||
|
2010
|
2009
|
2008
|
2007
|
2006
|
||||||||||||||||
|
(In thousands, except share data)
|
||||||||||||||||||||
|
Statement of Operations Data:
|
||||||||||||||||||||
|
Net sales
|
$ | 78,523 | $ | 77,796 | $ | 114,032 | $ | 111,521 | $ | 95,405 | ||||||||||
|
Cost of sales
|
42,904 | 43,342 | 55,593 | 50,283 | 41,943 | |||||||||||||||
|
Gross profit
|
35,619 | 34,454 | 58,439 | 61,238 | 53,462 | |||||||||||||||
|
Selling, general and administrative expenses
|
33,359 | 37,994 | 48,936 | 45,200 | 45,191 | |||||||||||||||
| Goodwill and intangible asset impairment | - | 1,100 | 32,661 | - | - | |||||||||||||||
|
Income (loss) from operations
|
2,260 | (4,640 | ) | (23,158 | ) | 16,038 | 8,271 | |||||||||||||
|
Interest expense, net
|
2,440 | 1,907 | 925 | 1,511 | 7,633 | |||||||||||||||
|
Other (income) expense, net
|
(35 | ) | (27 | ) | 380 | (53 | ) | (39 | ) | |||||||||||
|
(Loss) income before (benefit) provision for income taxes
|
(145 | ) | (6,520 | ) | (24,463 | ) | 14,580 | 677 | ||||||||||||
|
(Benefit) provision for income taxes
|
(703 | ) | (2,617 | ) | (4,694 | ) | 5,831 | 71 | ||||||||||||
|
Net income (loss)
|
$ | 558 | $ | (3,903 | ) | $ | (19,769 | ) | $ | 8,749 | $ | 606 | ||||||||
|
Net income (loss) per common share:
|
||||||||||||||||||||
|
Basic
|
$ | 0.04 | $ | (0.29 | ) | $ | (1.41 | ) | $ | 0.63 | $ | 0.06 | ||||||||
|
Diluted
|
$ | 0.04 | $ | (0.29 | ) | $ | (1.41 | ) | $ | 0.60 | $ | 0.05 | ||||||||
|
Weighted-average common shares outstanding:
|
||||||||||||||||||||
|
Basic
|
13,589,668 | 13,583,685 | 13,973,360 | 13,975,550 | 10,900,919 | |||||||||||||||
|
Diluted
|
14,478,641 | 13,583,685 | 13,973,360 | 14,565,056 | 11,387,033 | |||||||||||||||
|
Balance Sheet Data:
|
||||||||||||||||||||
|
Cash and cash equivalents
|
$ | 110 | $ | 3,797 | $ | 620 | $ | - | $ | 26 | ||||||||||
|
Working capital
|
27,157 | 24,288 | 20,201 | 27,347 | 19,599 | |||||||||||||||
|
Total assets
|
98,773 | 106,680 | 114,096 | 151,467 | 134,314 | |||||||||||||||
|
Revolving credit facility
|
1,406 | 9,926 | 7,935 | 10,168 | 7,522 | |||||||||||||||
|
Long-term debt, including current portion
|
7,525 | 8,000 | 10,500 | 13,500 | 15,000 | |||||||||||||||
|
Total stockholders' equity
|
51,178 | 48,770 | 51,561 | 72,450 | 61,572 | |||||||||||||||
-21-
ITEM 7. MANAGEMENT'S DISCUSSION AND ANALYSIS OF FINANCIAL CONDITION AND RESULTS OF OPERATIONS
You should read the following discussion and analysis of our financial condition and results of operations in conjunction with the information set forth under Item 6. “Selected Financial Data” and our consolidated financial statements and the notes to those statements included elsewhere in this Annual Report on Form 10-K. The statements in this discussion regarding industry outlook, our expectations regarding our future performance, liquidity and capital resources and other non-historical statements in this discussion are forward-looking statements. These forward-looking statements are subject to numerous risks and uncertainties, including, but not limited to, those described under Item 1A. “Risk Factors,” and elsewhere in this Annual Report on Form 10-K. Our actual results could differ materially from the results described in or implied by the forward-looking statements contained in the following discussion and analysis.
Company Overview
We specialize in developing and marketing innovative, premium-priced products for the mass market channel. Our products focus on addressing skin imperfections through a problem-solution approach, unlike competitors whose products focus primarily on changing fashion trends. Our products address specific, everyday cosmetics needs and include face powders, bronzers, concealers, blushes, foundations, eye shadows, eyeliners, brow makeup and mascaras.
We sell our products to mass market retailers such as Wal-Mart, CVS, Target and Rite Aid. Our products provide above-average profitability for retailers due to their higher price points and sales per linear foot. Our products are currently sold in approximately 25,700 of the 45,500 stores in which we estimate our masstige competitors’ products are sold. We seek to be first-to-market with new products within this channel, and are able to take new products from concept development to shipment in less than 12 months. New products are a very important part of our business and have contributed, on average, approximately 36.1% of our gross sales from 2008 to 2010.
Factors Affecting Our Operating Results
Our net sales are impacted by advertising, discounts and promotions, merchandising, packaging, the availability of wall display space at our retailer customers, inventory management at retailers and the timing of new product launches and line extensions, all of which have a significant impact on consumers’ buying decisions. Continued growth of our net sales and profitability will depend substantially on the continued popularity of our new and existing products, our ability to effectively manage our sales and distribution networks and our ability to maintain sufficient product supply to meet expected growth in demand. From 2004 to 2007, we experienced rapid revenue growth and increased demand for our premium-priced products. This pattern changed in 2008. As a result of deteriorating economic conditions, we experienced lessened demand for our products and tightening of inventory levels with our retail customers. Our net sales moderated in the second half of 2008 and declined 31.8% during the year ended December 31, 2009 compared to the year ended December 31, 2008, which was attributable in large part to the loss of a major customer, deteriorating global economic conditions and tightening of inventory levels with our retail customers. The strong performance of our 2010 new product launches and improved product return rates contributed to the modest increase in net sales of 0.9% during the year ended December 31, 2010 as compared to the year ended December 31, 2009, which was partially offset by a decrease in U.S. sales as retailers worked down their inventory levels in response to soft consumer demand and the loss of a major customer, as discussed below.
Late in the first quarter of 2009, one of our largest retail customers informed us that, as a result of a change in strategy, the customer intended to reduce its space allotted to the entire color cosmetics category in its stores in 2010. In April 2009, this customer informed management of its decision to completely discontinue selling our products in 2010 rather than implementing only a reduction in the number of our products sold in the stores. This customer began to reduce its inventory levels of our products to prepare for the 2010 discontinuation during the second quarter of 2009, which had a material negative impact on our net sales. This change eliminated our distribution in approximately 5,800 stores. This customer accounted for 4.8% and 15.8% of our gross sales for the years ended December 31, 2009 and 2008, respectively. We did not have any sales to this customer during the year ended December 31, 2010, but have been re-introduced on their online business in 2011. While this is a positive contributor to 2011, we do not expect the sales growth from this development to be material next year unless it leads to a brick-and-mortar distribution with this retailer.
Our cost of sales includes our costs to manufacture products in our own facilities, including raw material and labor costs and all overhead expenses related to production and quality control, as well as the cost to purchase components, such as plastic compact containers or plastic tubes, and semi-finished goods, such as plastic compact containers or plastic tubes filled with product, from third-party manufacturers and inbound freight. We primarily purchase plastic component parts from manufacturers in China, rather than purchasing them through brokers. The automation of an assembly line and our use of components and semi-finished goods as well as our own manufacturing facilities have allowed us to maintain significant production flexibility.
Our selling, general and administrative expenses include all warehouse and outbound freight expenses, selling, marketing, research and development costs, finance, information technology, depreciation, amortization of intangibles, professional fees, non-cash charges for stock-based compensation for certain employees and administrative and distribution facility expenses.
Our goodwill and indefinite-lived intangible assets are tested for impairment during the second quarter of each fiscal year and when events or circumstances occur that potentially indicate that the carrying amounts of these assets may not be recoverable. Due to the significant downturn in the economy and the deterioration of the market price of our common stock during the fourth quarter of 2008, we tested goodwill and indefinite-lived intangible assets for impairment as of December 31, 2008. Based on this analysis, we recorded a non-cash impairment charge of $16.8 million representing the entire amount of our previously recorded goodwill and a $15.9 million non-cash impairment charge to write down the carrying value of the trade names to their fair value. During the six months ended June 30, 2009, the downturn in the economy continued which significantly lowered consumer discretionary spending. Additionally, the market capitalization of the Company continued to decline. As a result of our annual impairment testing of the trade names as of June 30, 2009, trade names with a carrying amount of $13.6 million were written down to their fair value of $12.5 million, resulting in an impairment charge of $1.1 million for the year ended December 31, 2009. We tested trade names for impairment as of June 30, 2010, and based on the analysis, an impairment charge was not recorded as the fair value of the trade names exceed their carrying value.
-22-
Factors Affecting Comparability
Seasonality
Our business, similar to others in the cosmetic industry, is subject to seasonal variation due to the annual “sell-in” period when retailers decide how much retail space will be allotted to each supplier and the number of new and existing products to be offered in their stores. For us, this period has historically been from December through April. Sales during these months are typically greater due to the shipments required to fill the inventory at retail stores and retailers’ warehouses. Retailers typically reset their retail selling space during these months to accommodate changes in space allocation to each supplier and to incorporate the addition of new products and the deletion of slow-selling items. Our net sales for the three months ended December 31, 2010 were higher than our net sales for the three months ended September 30, 2010, as a result of this seasonality. Our quarterly results of operations may fluctuate as a result of a variety of reasons, including the timing of new product introductions, general economic conditions or consumer buyer behavior. In addition, results for any one quarter may not be indicative of results for the same quarter in subsequent years.
|
Three Months Ended
|
||||||||||||||||
|
March 31
|
June 30
|
September 30
|
December 31
|
|||||||||||||
|
2010
|
||||||||||||||||
|
Net sales
|
$ | 22,966 | $ | 20,761 | $ | 14,335 | $ | 20,461 | ||||||||
|
Income (loss) from operations
|
$ | 1,348 | $ | 2,332 | $ | (117 | ) | $ | (1,303 | ) | ||||||
|
Net income (loss)
|
$ | 520 | $ | 1,366 | $ | (420 | ) | $ | (908 | ) | ||||||
|
2009
|
||||||||||||||||
|
Net sales
|
$ | 20,174 | $ | 21,051 | $ | 14,230 | $ | 22,341 | ||||||||
|
(Loss) income from operations
|
$ | (3,031 | ) | $ | 1,857 | $ | (157 | ) | $ | (3,309 | ) | |||||
|
Net (loss) income
|
$ | (1,714 | ) | $ | 591 | $ | (302 | ) | $ | (2,478 | ) | |||||
|
2008
|
||||||||||||||||
|
Net sales
|
$ | 42,661 | $ | 22,876 | $ | 20,254 | $ | 28,241 | ||||||||
|
Income (loss) from operations
|
$ | 8,839 | $ | (3,069 | ) | $ | 1,945 | $ | (30,873 | ) | ||||||
|
Net income (loss)
|
$ | 5,019 | $ | (1,983 | ) | $ | 1,686 | $ | (24,491 | ) | ||||||
Results of Operations
The table below sets forth certain operating data expressed as a percentage of net sales for the periods indicated:
|
Years Ended December 31,
|
||||||||||||
|
2010
|
2009
|
2008
|
||||||||||
|
Net sales
|
100.0 | % | 100.0 | % | 100.0 | % | ||||||
|
Cost of sales
|
54.6 | 55.7 | 48.8 | |||||||||
|
Gross profit
|
45.4 | 44.3 | 51.2 | |||||||||
|
Selling, general and administrative expenses
|
42.5 | 48.8 | 42.9 | |||||||||
| Goodwill and intangible asset impairment | - | 1.4 | 28.6 | |||||||||
|
Income (loss) from operations
|
2.9 | (5.9 | ) | (20.3 | ) | |||||||
|
Interest expense, net
|
3.1 | 2.5 | 0.8 | |||||||||
|
Other (income) expense, net
|
- | - | 0.3 | |||||||||
|
Loss before benefit for income taxes
|
(0.2 | ) | (8.4 | ) | (21.4 | ) | ||||||
|
Benefit for income taxes
|
(0.9 | ) | (3.4 | ) | (4.1 | ) | ||||||
|
Net income (loss)
|
0.7 | % | (5.0 | )% | (17.3 | )% | ||||||
-23-
Year Ended December 31, 2010 Compared to Year Ended December 31, 2009
Net Sales. Net sales increased $727,000, or 0.9%, to $78.5 million for the year ended December 31, 2010 from $77.8 million for the year ended December 31, 2009. The increase was primarily attributable to a decrease in our provision for returns, a decrease in trade spending, an increase in net sales of our 2010 new products compared to our 2009 new products, partially offset by a decrease in gross sales driven by the lack of sales in 2010 to the major customer that discontinued the sale of our products in the second quarter of 2009. Because of this discontinuation, we had no sales to this customer during the year ended December 31, 2010, but during the year ended December 31, 2009, net sales to this customer were $3.4 million.
Our provision for returns decreased $4.2 million, or 18.2% to $19.0 million for the year ended December 31, 2010 from $23.2 million for the year ended December 31, 2009 due to a decline in expected returns from retailers. The drivers of the lower expected returns from our retailers are the lack of sales to the customer which discontinued our products in 2009 and had a historically higher product return rate, and the absence of returns of higher-priced promotional kits which are no longer being sold but which were returned in large volumes in 2009. Provision for returns as a percentage of net sales was 24.1% for the year ended December 31, 2010 compared to 29.8% for the year ended December 31, 2009. The decrease in the provision for returns as a percentage of net sales was due to the factors mentioned above.
Trade spending with retailers decreased $923,000, or 3.9%, to $22.5 million for the year ended December 31, 2010 from $23.5 million for the year ended December 31, 2009, which included a decrease in markdowns of $1.6 million, a decrease in coupon expense of $1.5 million, a decrease in cash discounts and miscellaneous allowances of $245,000, partially offset by an increase in retail marketing of $1.6 million and an increase in cooperative advertising of $796,000.
During the year ended December 31, 2010, our results included net sales of $10.9 million to our international customers compared to $9.1 million for the year ended December 31, 2009. The increase in sales to international customers resulted primarily from our Canadian business.
Cost of Sales. Cost of sales decreased $438,000, or 1.0%, to $42.9 million for the year ended December 31, 2010 from $43.3 million for the year ended December 31, 2009. The decrease in cost of sales resulted primarily from a lower provision for obsolete and slow moving inventory, driven in part from the benefits of the SKU rationalization implemented at the end of 2009, which was partially offset by lower than anticipated recoveries of returns driven by lower actual return levels compared to the prior year and the deterioration of product mix due to the increased sale of lower margin eye products.
Cost of sales as a percentage of net sales was 54.6% for the year ended December 31, 2010 compared to 55.7% for the year ended December 31, 2009. The decrease in cost of sales as a percentage of net sales was due to the factors mentioned above.
Selling, General and Administrative Expenses. Selling, general and administrative expenses decreased $4.6 million, or 12.2%, to $33.4 million for the year ended December 31, 2010 from $38.0 million for the year ended December 31, 2009. The decrease was primarily due to a $3.8 million decrease in marketing expenses which resulted primarily from a change in retailer program. Also contributing to the decrease was a $880,000 decrease in distribution costs, a $389,000 decrease in bad debt expense, a $202,000 decrease in freight and warehouse costs, which were partially offset by a $365,000 increase in sales force and sales administrative expenses, a $137,000 decrease in realized and unrealized foreign currency exchange gains and a $131,000 increase in corporate administrative costs.
Goodwill and Intangible Asset Impairment. During the year ended December 31, 2009, we recorded a non-cash charge of $1.1 million for the impairment of our trade names. We evaluate our indefinite-lived intangible asset for impairment in the second quarter of each fiscal year and when events or circumstances occur that potentially indicate that the carrying amount of the asset may not be recoverable. This non-cash impairment charge does not impact our overall business operations. No such impairment charge was recorded during 2010 based on our impairment analysis.
Interest Expense, Net. Interest expense, net increased $533,000, or 27.9%, to $2.4 million for the year ended December 31, 2010 from $1.9 million for the year ended December 31, 2009. The increase was primarily due to the issuance of the Senior Subordinated Note in November 2009.
Other Income, Net. Other income, net was $35,000 and $27,000 for the years ended December 31, 2010 and 2009, respectively, which consisted primarily of unrealized gains related to investments held as part of our non-qualified deferred compensation plans.
Benefit for Income Taxes. The benefit for income taxes represents federal, state and local income taxes. For the year ended December 31, 2010, the benefit for income taxes was $703,000, representing an effective income tax rate of 484.8%. The effective tax rate differed from the statutory rate for the year ended December 31, 2010, primarily due to the impact of a New York state audit refund, the graduated federal tax rates, charitable contributions and other fluctuations in permanent differences between book and taxable income such as research and development credits. For the year ended December 31, 2009, the benefit for income taxes was $2.6 million, representing an effective income tax rate of 40.1%. The effective tax rate differed from the statutory rate for the year ended December 31, 2009, primarily due to permanent differences between book and taxable income such as stock option cancellations and research and development credits.
-24-
Year Ended December 31, 2009 Compared to Year Ended December 31, 2008
Net Sales. Net sales decreased $36.2 million, or 31.8%, to $77.8 million for the year ended December 31, 2009 from $114.0 million for the year ended December 31, 2008. The decrease was primarily attributable to a decrease in sales of our makeup products offset by a decrease in our provision for returns and a decrease in trade spending. The decrease in sales of our makeup products was primarily due to the loss of a major customer, which accounted for $20.7 million of the decrease, lower Canadian sales of approximately $6.0 million during the year ended December 31, 2009 compared to December 31, 2008, reduction of sales of higher-priced promotional kits that were only featured in 2008 and tight inventory control by retailers leading to destocking, which reduced the pipeline orders for new products during the year ended December 31, 2009 when compared to the year ended December 31, 2008.
Our provision for returns decreased $5.6 million, or 19.4%, to $23.2 million for the year ended December 31, 2009 from $28.8 million for the year ended December 31, 2008 due to a decline in expected returns from our retailers. Our provision for returns decreased for the year ended December 31, 2009 because we expect lower returns as a result of the loss of a major customer, from which we no longer expect to receive returns and no longer have any ongoing sales to such customer. As a result of excluding this customer from our returns provision during 2009, our 2009 returns provision decreased by approximately $790,000. In addition, at the end of 2008, we discontinued the higher-priced promotional kits that were sold in 2008, that had a significantly higher return rate than our other products. As a result of excluding the higher priced promotional kits from our returns provision during 2009, our 2009 returns provision decreased by approximately $1.2 million. The remaining decrease in our returns provision was due to the overall decrease in sales. Provision for returns as a percentage of net sales was 29.8% for the year ended December 31, 2009 compared to 25.3% for the year ended December 31, 2008. The increase in the provision for returns as a percentage of net sales was due primarily to net sales decreasing at a greater rate than returns.
Trade spending with retailers decreased by $3.0 million for the year ended December 31, 2009 compared to the year ended December 31, 2008, which includes a decrease in our provision for cooperative advertising of $4.2 million and a decrease in our provision for cash discounts and miscellaneous allowance of $703,000, partially offset by an increase in our provision for coupons of $1.3 million and an increase in our provision for markdowns of $646,000. During the year ended December 31, 2009, our results included net sales of $9.1 million from our international customers, compared to $15.4 million for the year ended December 31, 2008. The decrease in sales to international customers was primarily due to our Canadian business, which has experienced softness due to the poor economy. Other factors contributing to the decrease in Canadian sales were lower prepack sales and timing of promotional programs.
Cost of Sales. Cost of sales decreased $12.3 million, or 22.0%, to $43.3 million for the year ended December 31, 2009 from $55.6 million for the year ended December 31, 2008. The decrease in cost of sales resulted primarily from a decrease in product costs of $19.4 million due to a decrease in sales of our makeup products, offset in part by an increase in the provision for obsolete and slow moving inventory of $4.9 million and an increase in actual and estimated inventory recoveries from retailers (inventory returns by customers deemed to be resalable) of $2.2 million. The increase in our provision for obsolete and slow moving inventory for the year ended December 31, 2009 as compared to the year ended December 31, 2008 was primarily due to a higher number of product discontinuances in the fourth quarter of 2009 in connection with our retailers' annual store resets, the overall decline in sales and the introduction of a significant amount of new products in 2009. In addition, the implementation of a SKU rationalization initiative designed to discontinue slower-selling products contributed to the increase in our provision for obsolete and slow moving inventory. This initiative, which was concluded in late December after 2010 plan-o-grams were finalized with our retail partners, resulted in the discontinuation of approximately 28.9% of our products as of December 31, 2009. Cost of sales as a percentage of net sales was 55.7% for the year ended December 31, 2009 compared to 48.8% for the year ended December 31, 2008. The increase in cost of sales as a percentage of net sales includes an increase in product costs of 5.3%. The increase in product costs was primarily due to higher in-bound freight costs charged by our outside carriers to meet customer demands.
Selling, General and Administrative Expenses. Selling, general and administrative expenses decreased $10.9 million, or 22.4%, to $38.0 million for the year ended December 31, 2009 from $48.9 million for the year ended December 31, 2008. The decrease was primarily due to a $2.5 million decrease in marketing spending, a $2.4 million decrease in corporate administrative costs, a $1.9 million decrease in freight and warehouse costs, a $1.2 million decrease in stock-based compensation expense, a $1.2 million decrease in realized and unrealized foreign currency exchange losses, a $934,000 decrease in sales force and sales administrative expenses, a $530,000 decrease in distribution costs and a $100,000 decrease in bad debt expense.
Goodwill and Intangible Asset Impairment. We evaluate our indefinite-lived intangible assets for impairment in the second quarter of each fiscal year and all of our intangible assets whenever events or circumstances occur that potentially indicate that the carrying amounts of these assets may not be recoverable. Due to the significant downturn in the economy and the deterioration of the market price of our common stock during the fourth quarter of 2008, we tested goodwill and indefinite-lived intangible assets for impairment as of December 31, 2008. Based on this analysis, we recorded a non-cash impairment charge of $16.8 million, representing the entire amount of our previously recorded goodwill and a $15.9 million non-cash impairment charge to write down the carrying value of the trade names to their fair value. During the six months ended June 30, 2009, the downturn in the economy continued which significantly lowered consumer discretionary spending. Additionally, the market capitalization of the Company continued to decline. As a result of our annual impairment testing of the trade names as of June 30, 2009, trade names with a carrying amount of $13.6 million were written down to their fair value of $12.5 million, resulting in an impairment charge of $1.1 million for the year ended December 31, 2009.
Interest Expense, Net. Interest expense, net increased $982,000, or 106.2%, to $1.9 million for the year ended December 31, 2009 from $925,000 for the year ended December 31, 2008. The increase in interest expense was due primarily to an increase in the amortization of debt issuance costs of $604,000. The remaining increase was primarily due to an increase in the average borrowings outstanding under our credit facility and an increase in interest rates for the year ended December 31, 2009 when compared to the year ended December 31, 2008.
Other (Income) Expense, Net. Other income, net for the year ended December 31, 2009 was $27,000 compared to other expense, net of $380,000 for the year ended December 31, 2008, which consisted primarily of unrealized gains and losses related to investments held as part of our non-qualified deferred compensation plans.
-25-
Liquidity and Capital Resources
Cash Flows
As of December 31, 2010, we had $110,000 in cash and cash equivalents compared to $3.8 million in cash and cash equivalents as of December 31, 2009. The decrease in cash and cash equivalents was due primarily to payments made on our line of credit and purchases of retail permanent fixtures, partially offset by cash provided by our operating activities. As of December 31, 2010, we had $1.4 million outstanding and $15.8 million of availability under our revolving credit facility. The significant components of our working capital are accounts receivable, inventories, deferred tax assets, net, accounts payable, trade allowances, sales returns reserve and line of credit borrowings.
Operating Activities. Cash provided by operating activities decreased $3.3 million, or 35.0%, to $6.1 million for the year ended December 31, 2010 from $9.4 million for the year ended December 31, 2009. The net decrease in cash provided by operating activities resulted primarily from unfavorable changes in net working capital, offset in part by higher net non-cash activities impacting income. Cash provided by operating activities decreased $3.1 million, or 24.6%, to $9.4 million for the year ended December 31, 2009 from $12.4 million for the year ended December 31, 2008. The net decrease in cash provided by operating activities resulted primarily from lower net non-cash activities impacting net loss, offset in part by favorable changes in net working capital. In 2010, net income of $558,000 and non-cash charges of $6.4 million were partially offset by a net decrease in working capital needs of $873,000. In 2009, the net loss of $3.9 million was offset by non-cash charges of $5.9 million (including an intangible asset impairment charge of $1.1 million) and a net decrease in working capital needs of $7.4 million. In 2008, the net loss of $19.8 million was offset by non-cash charges of $27.9 million (including goodwill and intangible asset impairment charges of $32.7 million) and a net decrease in working capital needs of $4.3 million.
Days sales outstanding ("DSO"), as calculated on a trailing 4-month basis, decreased 1.6 days, to 71.2 days at December 31, 2010 from 72.8 days at December 31, 2009. DSO increased 5.0 days, to 72.8 days at December 31, 2009 from 67.8 days at December 31, 2008. DSO decreased from 2009 to 2010 primarily because of our increased collection efforts in 2010. DSO increased from 2008 to 2009 because of the economic downturn and tightening of credit in the financial markets had, in some cases, adversely impacted our customers' ability to make timely payments to us. In addition, for certain selected customers who we deemed to be creditworthy based upon their prior payment history, and for certain promotional items, we extended our standard payment terms from net 30 days to net 60 days or net 90 days.
We regularly reevaluate our customers' ability to satisfy their credit obligations and record a provision for doubtful accounts based on such evaluations. In addition, we implemented a customer credit watch in the fourth quarter of 2008, requiring management approval for all orders from customers that have been identified as a potential credit risk. As of December 31, 2010, we had $24.4 million of accounts receivable, net, of which $6.2 million had not been collected as of February 28, 2011. As of December 31, 2009, we had $25.2 million of accounts receivable, net, of which $1.7 million and $5.6 million had not been collected as of February 28, 2011 and 2010, respectively.
For the fiscal year ended December 31, 2010, our inventory turnover rate was 1.6 times, which is relatively consistent with our inventory turnover rate for the year ended December 31, 2009 of 1.8 times.
We categorize our inventories into three groups: salable inventory, excess (slow moving) inventory and obsolete inventory. Salable inventory are products that remain in distribution and for which we have less than twelve months of forecasted sales of inventory on hand. Slow moving inventory are products that also remain in distribution, but for which we have more than twelve months of forecasted sales of inventory on hand. Obsolete inventory are products that no longer are in distribution with our retailer customers.
We assess and reserve for salable, slow moving and obsolete inventory throughout the year based on our historical experience in conjunction with an analysis of our current slow moving and obsolete inventory levels, forecasted plans and sales trends and planned product discontinuances. Our assessment includes discussions with our retailer customers about products to include in future retail store shelf layouts and if a product loses distribution across all retail partners, it will be deemed obsolete. Our retailer customers typically decide upon changes to their shelf layouts annually and these decisions usually occur in the fourth quarter in anticipation of the new calendar year. Our planned product discontinuances were significant in 2009 compared to historical periods due to the overall decline in sales to our retailer customers resulting in a reduction of individual products offered (based on individual product performance metrics) coupled with the introduction of new products.
Based on the above process, our provision for slow moving and obsolete inventory was $3.3 million, $8.2 million and $4.1 million for the years ended December 31, 2010, 2009 and 2008, respectively. The decrease in our provision for slow moving and obsolete inventory for the year ended December 31, 2010 as compared to the year ended December 31, 2009 was primarily due to the benefits of our 2009 year-end SKU rationalization and the introduction of fewer new products in 2010. The increase in our provision for slow moving and obsolete inventory for the year ended December 31, 2009 as compared to the year ended December 31, 2008 was primarily due to a higher number of product discontinuances in the fourth quarter of 2009 in connection with our retailers' annual store resets, the overall decline in sales and the introduction of a significant amount of new products in 2009.
Based on the factors identified above, we anticipate that we will be able to fully realize the value of our net inventory. However, our reserve for slow moving and obsolete inventory requires management to make assumptions and to apply judgment regarding forecasted consumer demand and sales trends. If estimates regarding consumer demand are inaccurate, we may need to increase our provision for slow moving and obsolete inventory which could adversely affect our operating results and liquidity.
-26-
Investing Activities. Cash used in investing activities for the year ended December 31, 2010 was $747,000, which was primarily related to investments in retail permanent fixtures and capital expenditures for improvements to our manufacturing and distribution equipment and information technology infrastructure. Cash used in investing activities for the year ended December 31, 2009 was $3.6 million, which was primarily related to investments in retail permanent fixtures and capital expenditures for the replacement of machinery and equipment and improvements to our warehouse distribution systems. Cash used in investing activities for the year ended December 31, 2008 was $3.1 million, which was primarily related to capital expenditures for the replacement of machinery and equipment, the automation of an assembly line to accommodate future growth, improvements to our warehouse distribution systems and investments in retail permanent fixtures.
Financing Activities. Cash used in financing activities was $9.0 million for the year ended December 31, 2010 compared to $2.7 million for the year ended December 31, 2009. The increase in cash used in financing activities was primarily due to net repayments of our line of credit from Wells Fargo, proceeds received in 2009 from the issuance of the senior subordinated note, offset in part by lower payments for debt issuance costs. Cash used in financing activities was $2.7 million for the year ended December 31, 2009 compared to $8.8 million for the year ended December 31, 2008. The decrease in cash used in financing activities was primarily due to proceeds received in 2009 from the issuance of the senior subordinated note and stock repurchases, which only occurred in 2008, offset in part by higher net payments on our revolving credit facility and payments for debt issuance costs.
Future Liquidity and Capital Needs. Our net working capital increased $2.9 million, or 11.9%, to $27.2 million as of December 31, 2010 from $24.3 million as of December 31, 2009. Working capital requirements typically increase during the fourth quarter, when we experience higher inventory levels as we produce new products for shipment in the first quarter of the following year.
We budgeted capital expenditures of $5.1 million for 2010 for several key projects, including $3.6 million in investments in retail permanent fixtures, $800,000 in improvements to other manufacturing and distribution equipment, $623,000 in improvements to our information technology infrastructure, $50,000 to upgrade a product assembly line and $17,000 in improvements to our research and development equipment. We expected capital requirements related to fixture infrastructure to total $7.7 million for the period from September 2008 (inception of the project) to December 2010, of which $5.6 million was incurred as of December 31, 2010. We incurred $775,000 for capital expenditures and $1.5 million for investments in retail permanent fixtures for the year ended December 31, 2010.
We estimate that our net working capital requirements will increase to $29.5 million in 2011 from $27.2 million in 2010. We have budgeted capital expenditures of $3.6 million for 2011, compared to $5.1 million in 2010, which consists of $1.3 million of property and equipment expenditures and $2.3 million of retail permanent fixture expenditures. We believe that our cash flows from operations and funds from our financing arrangements entered into during November 2009 will provide adequate funds for our working capital needs and planned capital expenditures for at least the next twelve months. No assurance can be given, however, that this will be the case.
Credit Facilities
On November 6, 2009, Physicians terminated its senior credit agreement with Union Bank, N.A. ("Union Bank") and replaced it with a new asset-based revolving credit facility with Wells Fargo Bank, N.A. ("Wells Fargo") and repaid a $4.2 million bridge loan from Mill Road Capital, L.P. ("Mill Road") using proceeds from the issuance of a new senior subordinated note to Mill Road. For a description of the senior credit agreement with Union Bank and the bridge loan from Mill Road, see Note 6 to the consolidated financial statements included in this Annual Report on Form 10-K.
New Senior Credit Agreement. On November 6, 2009, pursuant to a new senior credit agreement (the “New Senior Credit Agreement”) between Physicians and Wells Fargo, Physicians entered into a new asset-based revolving credit facility (the “new revolving credit facility”) and terminated its previous asset-based revolving credit facility (the “old revolving credit facility”) with Union Bank. Approximately $9.3 million of the proceeds of the new revolving credit facility were used to repay outstanding borrowings under Physicians’ old revolving credit facility. The new revolving credit facility is scheduled to mature on November 6, 2012.
The maximum amount available for borrowing under the new revolving credit facility is equal to the lesser of $25.0 million and a borrowing base formula equal to: (i) 65% or such lesser percentage of eligible accounts receivable as Wells Fargo in its discretion as an asset-based lender may deem appropriate; plus (ii) the least of (1) $14.0 million and (2) the sum of specified percentages (or such lesser percentages as Wells Fargo in its discretion as an asset-based lender may deem appropriate) of each of the following items of eligible inventory (as defined in the New Senior Credit Agreement): (A) eligible inventory consisting of finished goods that are fully packaged, labeled and ready for shipping, not to exceed 65% of such eligible inventory, (B) eligible inventory consisting of semi-finished goods which are ready for packaging and shipping, not to exceed $4.0 million, (C) eligible inventory consisting of raw materials, not to exceed $1.5 million, (D) eligible inventory consisting of blank components, not to exceed $1.0 million and (E) eligible inventory consisting of returned items, not to exceed $0.75 million; plus (iii) the cash balance in a certain Canadian concentration account; less (iv) a working capital reserve of $1.0 million as such amount may be adjusted by Wells Fargo from time to time and a borrowing base reserve that Wells Fargo establishes from time to time in its discretion as a secured asset-based lender; less (v) indebtedness owed to Wells Fargo other than indebtedness outstanding under the new revolving credit facility. Availability under the new revolving credit facility is reduced by outstanding letters of credit.
Floating rate borrowings under the new revolving credit facility accrue interest at a daily rate equal to the three-month LIBOR plus 3.5% and fixed rate borrowings accrue interest at a fixed rate equal to the three-month LIBOR plus 3.5% on the date of borrowing. Interest on floating rate borrowings is payable monthly in arrears and interest on fixed rate borrowings are payable upon the expiration of the fixed rate term, subject to minimum monthly interest payments in the amount of $25,000. Under the New Senior Credit Agreement, Physicians is required to pay to Wells Fargo an unused credit line fee equal to 0.5% per annum and various other fees associated with cash management and other related services. Physicians may reduce the maximum amount available for borrowing or terminate the facility prior to the scheduled maturity date at any time by paying breakage fees equal to 3% of the maximum amount of the new revolving credit facility or amount of the reduction in the credit facility, as applicable, decreasing to 1.5% after November 6, 2010 and decreasing to 0.5% after November 6, 2011.
-27-
Under the New Senior Credit Agreement, all payments to Physicians and its subsidiaries are required to be deposited into a lockbox account provided by Wells Fargo, except that payments in connection with our Canadian operations may be deposited into a lockbox account with Royal Bank of Canada. Any amounts deposited into a lockbox account with Wells Fargo will be swept to a collection account to be applied to repay the outstanding borrowings under the new revolving credit facility. If the balance in Physicians’ Canadian account exceeds Canadian $2.0 million at any time, Physicians must within 10 days after such occurrence transfer the excess amount to the collection account to repay borrowings under the new revolving credit facility. In addition, at any time, Physicians may transfer amounts out of the Canadian accounts to repay borrowings under the revolving credit facility or so long as no event of default exists, pay costs and expenses incurred in connection with the Company’s Canadian operations from its Canadian operating account.
The New Senior Credit Agreement requires us to comply with a monthly minimum book net worth covenant and a quarterly minimum Adjusted EBITDA (as defined below) covenant. In addition, we are required to comply with certain negative covenants, including limitations on its ability to: incur other indebtedness and liens; make certain investments, loans or advances; guaranty indebtedness; pay cash dividends from Physicians, except in an amount up to $100,000 to allow us to pay ordinary course expenses; sell assets; suspend operations; consolidate or merge with another entity; enter into sale-leaseback arrangements; or enter into unrelated lines of business or acquire assets not related to our business; and make capital expenditures in excess of $5.5 million for the year ending December 31, 2010 (subject to up to a $600,000 carryforward from the prior year). As of December 31, 2010, we held no assets aside from the investment in Physicians. We were required, no later than April 30, 2010, to negotiate with Wells Fargo and establish our financial covenants that would apply to periods after December 31, 2010. On December 21, 2010, Physicians entered into an amendment to the New Senior Credit Agreement with Wells Fargo which extended the deadline for negotiating and establishing these future financial covenants to February 28, 2011. The New Senior Credit Agreement also contains customary events of default, including a change of control of Physicians. As of December 31, 2010, we were in compliance with the covenants contained in the New Senior Credit Agreement (see further details below).
The New Senior Credit Agreement defines “book net worth” as our stockholders’ equity, determined in accordance with GAAP and calculated without regard to any change in the valuation of goodwill and intangible assets made in accordance with ASC 350, Intangibles-Goodwill and Other (“ASC 350”). The New Senior Credit Agreement requires that we have a minimum book net worth of $46.5 million as of December 31, 2010. As of December 31, 2010, we were in compliance with such covenant. The New Senior Credit Agreement defines “Adjusted EBITDA” as our consolidated net income, calculated before (i) interest expense, (ii) provision (benefit) for income taxes, (iii) depreciation and amortization expense, (iv) gains arising from the write-up of assets, (v) any extraordinary gains, (vi) stock-based compensation expenses, (vii) changes resulting from the valuation of goodwill and intangible assets made in accordance with ASC 350, and (viii) changes resulting from foreign exchange adjustments arising from a revaluation of assets subject to foreign currency revaluation, and (ix) provisions arising from adjustments to our inventory reserves for obsolete, excess, or slow moving inventory. On June 29, 2010, Physicians entered into the First Amendment to the New Senior Credit Agreement (the "First Amendment") with Wells Fargo which reduced the minimum Adjusted EBITDA covenant for the 12 months ended June 30, 2010 by $850,000 to $11.0 million from $11.85 million. All other covenants, including the book net worth covenant, the maximum capital expenditure covenant and the other 2010 minimum Adjusted EBITDA covenants were not modified. In connection with the First Amendment, the Company paid Wells Fargo a fee of $10,000 and related expenses. The New Senior Credit Agreement requires that we have a minimum Adjusted EBITDA of $8.95 million for the 12 months ended December 31, 2010. As of December 31, 2010, we were in compliance with such covenant.
On February 28, 2011, Physicians entered into the Second Amendment to the New Senior Credit Agreement (the "Second Amendment") with Wells Fargo to establish financial covenants that will apply to periods after December 31, 2010, including our minimum book net worth covenant, minimum Adjusted EBITDA covenant and maximum capital expenditures covenant. In addition, commencing with the quarter ending March 31, 2011, we are required to comply with a quarterly minimum Adjusted EBITDA covenant calculated on a 6-month period basis. The Second Amendment also requires us to negotiate with Wells Fargo and establish, no later than April 30, 2012, our financial covenants that will apply to future periods not covered by this amendment.
The New Senior Credit Agreement and the Note Agreement with respect to our Senior Subordinated Note (discussed below under “New Senior Subordinated Note”) contain provisions that could result in the acceleration of maturity of the indebtedness and entitle the lenders to exercise remedies upon an event of default, including a default of the financial covenants. There is no assurance that we would receive waivers should it not meet its financial covenant requirements. Even if we are able to obtain a waiver, in connection with negotiating a waiver, it may be required to agree to other changes in the senior credit agreement including increased interest rates, tighter covenants or lower availability thresholds or pay a fee for such waiver. If we are not able to comply with the new financial covenants in the senior credit agreement and it is unable to obtain waivers, we would need to obtain additional sources of liquidity; however, given the current state of the worldwide credit markets, there can be no assurance that we will be able to obtain additional sources of liquidity on terms acceptable to it, or at all.
Borrowings under the new revolving credit facility are guaranteed by us and the domestic subsidiaries of Physicians and are secured by a pledge of the capital stock of Physicians and its subsidiaries and substantially all of the assets of Physicians Formula Holdings, Inc. and its subsidiaries.
Physicians paid a closing fee to Wells Fargo equal to $250,000 and paid all expenses incurred by Wells Fargo in connection with the new revolving credit facility.
As of December 31, 2010 and 2009, there was $1.4 million and $9.9 million outstanding under the new revolving credit facility, respectively, at an interest rate of 3.80% and 3.75%, respectively. As of December 31, 2010 and 2009, there were no outstanding letters of credit and $15.8 million and $12.2 million available under the new revolving credit facility, respectively. The new revolving credit facility contains a lock-box feature, whereby remittances made by customers to the lock-box repays the outstanding obligation under the new revolving credit facility. As such, in accordance with Accounting Standards Codification 470-10-45 (“ASC 470-10-45”), we classified the above outstanding amount under the new revolving credit facility as a current liability in the accompanying consolidated balance sheets.
-28-
New Senior Subordinated Note. On November 6, 2009, pursuant to a Senior Subordinated Note Purchase and Security Agreement between Physicians, the guarantors named therein and Mill Road (the “Note Agreement” or "Senior Subordinated Note"), reported as Related Party Long-Term Debt on the accompanying consolidated balance sheets, Physicians issued a new Senior Subordinated Note to Mill Road in an aggregate principal amount equal to $8.0 million. Physicians used $4.3 million of the proceeds to repay in full the principal of $4.2 million and interest of $107,000 outstanding under its Bridge Loan from Mill Road. We used the remaining proceeds for capital expenditures and general corporate purposes. Prior to an amendment entered into during April 2010 as described below, the Senior Subordinated Note was scheduled to mature on May 6, 2013 and accrue interest at 19% per annum, with 15% per annum payable in cash monthly in arrears on the first day of each calendar month and 4% payable in kind with quarterly compounding on the first day of each calendar quarter.
Subject to the terms of the new revolving credit facility, the Senior Subordinated Note may be redeemed in whole or in part prior to November 6, 2010 at an amount equal to 105% of the aggregate principal amount of the outstanding Senior Subordinated Note, decreasing to 104% if redeemed on or after November 6, 2010 and prior to November 6, 2011, decreasing to 102% if redeemed on or after November 6, 2011 and prior to November 6, 2012, and decreasing to 101% if redeemed on or after November 6, 2012. In addition, Physicians must make an offer to redeem the Senior Subordinated Notes upon a change of control of Physicians at the then applicable redemption price. We are required to comply with substantially the same covenants under the Note Agreement that it is required to comply with under the New Senior Credit Agreement. In addition, the events of default under the Note Agreement are substantially the same as the events of default under the New Senior Credit Agreement. The Senior Subordinated Note is guaranteed by us and our subsidiaries and is secured by a first lien on certain intellectual property and a second lien on substantially all of our other assets and those of our subsidiaries and our pledges of the stock and those of our subsidiaries. The value of the collateral subject to these liens is limited to the lesser of 10% of the value of the assets of Physicians Formula Holdings, Inc. and its subsidiaries and 10% of the value of all outstanding common stock of Physicians Formula Holdings, Inc. as of November 6, 2009 (the “10% Cap”). Pursuant to an intercreditor agreement entered into between Physicians, Mill Road and Wells Fargo in connection with the New Senior Credit Agreement and Note Agreement (the "New Intercreditor Agreement"), the Senior Subordinated Note is subordinate in right of payment to the prior paying of all obligations under the New Senior Credit Agreement and the liens securing the obligations under the Note Agreement are junior and subordinate to the liens securing the obligations under the New Senior Credit Agreement (except for first liens on certain intellectual property). In addition, the New Intercreditor Agreement prohibits certain amendments to the Note Agreement without the consent of Wells Fargo and prohibits certain amendments to the New Senior Credit Agreement without the consent of Mill Road.
In connection with the issuance of the Senior Subordinated note, Mill Road agreed that, until September 30, 2012, it would not acquire more than 35% of the our common stock or seek to elect any directors to the Board (other than the one director it is entitled to nominate while the Senior Subordinated Note is outstanding), in each case, without obtaining the prior written consent of the Board. These restrictions will be released if we receives a bid for the acquisition of the Company (other than from Mill Road or its affiliates).
As required under the Note Agreement, we sought stockholder approval in order to comply with the Nasdaq shareholder approval requirements and to satisfy certain sections of the Delaware General Corporation Law, because Mill Road is an “interested stockholder” for purposes of the statute. Because Mill Road is an interested stockholder, we were required to obtain the vote of 66 2/3% of the outstanding common stock not owned by Mill Road to approve the transactions. At the special meeting of the stockholders held on April 28, 2010, the stockholders approved, by the requisite margin, a Second Amendment to the Senior Subordinated Note (the "Second Amendment") and the issuance of warrants to Mill Road.
On April 30, 2010, we, our subsidiaries and Mill Road entered into the Second Amendment. Under the Second Amendment, Mill Road agreed to reduce the interest rate on the Senior Subordinated Note from 19% per annum (15% payable in cash monthly and 4% payable in kind with quarterly compounding) to 14% per annum (10% payable in cash monthly and 4% payable in kind with annual compounding), and to extend the maturity of the Senior Subordinated Note by 18 months to November 6, 2014. The prepayment premium for an optional redemption was also amended so that if the Senior Subordinated Note is redeemed on or after November 6, 2011 and prior to November 6, 2012, the prepayment premium would be 102%, decreasing to 101% if redeemed on or after November 6, 2012 and prior to November 6, 2013, and decreasing to 100% if redeemed on or after November 6, 2013. In addition, the existing limit on the amount of collateral securing the Senior Subordinated Note was removed.
In addition, as required by the Note Purchase Agreement and as consideration for the reduction in interest payments, on April 30, 2010, we entered into a Common Stock Purchase Warrant agreement with Mill Road pursuant to which warrants have been issued entitling Mill Road to purchase 650,000 shares of our common stock. The warrants have an exercise price equal to $0.25 per share and expire on April 30, 2017. Upon issuance of the warrants, Mill Road beneficially owned 2,516,943 shares of our common stock and warrants to purchase 650,000 shares of common stock, representing aggregate beneficial ownership of 3,166,943 shares (approximately 22%) of our common stock.
On June 3, 2010, we, our subsidiaries and Mill Road entered into a Third Amendment to the Senior Subordinated Note (the "Third Amendment"). Pursuant to the Third Amendment, Mill Road has the right to nominate one individual to serve as a member of our board of directors (the “Board”) so long as (A) the outstanding principal amount under the Senior Subordinated Note is no less than $2.0 million and Mill Road owns shares of, or securities convertible into, or exercisable for, our capital stock, or (B) Mill Road owns no less than 5% of our issued and outstanding capital stock (on a fully diluted basis) and any part of the Senior Subordinated Note is outstanding. In addition, in the Third Amendment, we agree to (i) increase the size of the Board and appoint Mill Road's nominee to the Board, and (ii) recommend to our stockholders that Mill Road's nominee to the Board be elected to the Board at the annual meetings of stockholders (clauses (i) and (ii) together, the "Company Obligations"), in each case so long as the conditions in clauses (A) or (B) of the immediately preceding sentence are met. Prior to the Third Amendment, Mill Road had the right to nominate one individual to serve as a member of the Board and we had an obligation to perform the Company Obligations, in each case so long as the Senior Subordinated Note was outstanding.
On February 28, 2011, we, our subsidiaries and Mill Road entered into the Fourth Amendment to the Senior Subordinated Note (the "Fourth Amendment"). The Fourth Amendment establishes our financial covenants that will apply to periods after December 31, 2010, including our minimum book net worth covenant, minimum Adjusted EBITDA covenant and maximum capital expenditures covenant. In addition, commencing with the quarter ending March 31, 2011, we are required to comply with a quarterly minimum Adjusted EBITDA covenant calculated on a 6-month period basis. Our financial covenants with Mill Road reflect an approximate 20% cushion from those of Wells Fargo. The Fourth Amendment also required us to negotiate with Mill Road, no later than April 30, 2012, our financial covenants that will apply to future periods not covered by this amendment.
In connection with the new revolving credit facility and Senior Subordinated Note, and the amendments thereto, we incurred total costs of $2.3 million associated with these agreements, which included $250,000 and $222,000 of closing fees paid to Wells Fargo and Mill Road, respectively.
-29-
The issuance of the warrants and reduction in interest payments has been accounted for as a partial conversion of the required payments under the Note Purchase Agreement for equity interests under ASC 470-20, Debt with Conversion and Other Options (“ASC 470-20”). ASC 470-20 requires the issuer of convertible debt instruments to separately account for the liability and equity components of the convertible debt instrument in a manner that reflects the issuers borrowing rate at the date of issuance for a similar debt instrument without the conversion feature. ASC 470-20 requires bifurcation of a component of the convertible debt instrument, classification of that component in equity and the accretion of the resulting discount on the debt to be recognized as interest expense.
The equity component of the Senior Subordinated Note was $940,000 at the time of issuance and was applied as debt discount and as additional paid-in capital. Additionally, during 2010, we recorded the income tax effect of the debt discount of $332,000 to additional paid-in-capital, as a reduction of the $940,000 recorded above, and established a corresponding deferred income tax liability. The unamortized discount for the Senior Subordinated Note will be amortized through the debt maturity date of November 6, 2014. The effective interest rate on the liability component of the Senior Subordinated Note is 17.5%. Interest expense related to the contractual coupon rate was $1.3 million for the year ended December 31, 2010. Interest expense related to amortization of the debt discount was $86,000 for the year ended December 31, 2010.
Long-term debt and the equity component of the Senior Subordinated Note as of December 31, 2010 is as follows (in thousands):
|
Senior Subordinated Note
|
$ | 8,130 | ||
|
Unamortized discount
|
(854 | ) | ||
| Accrued payable in kind interest | 249 | |||
|
Net carrying value of Senior Subordinated Note
|
$ | 7,525 | ||
|
Equity component of Senior Subordinated Note
|
$ | 940 |
The estimated fair value of the Senior Subordinated Note, based on publicly traded debt of comparable companies with similar features, was approximately $8.2 million compared to its carrying value of $7.5 million at December 31, 2010.
Contractual Obligations
The following table reflects our contractual obligations as of December 31, 2010 (in thousands):
|
Payments Due By Period
|
||||||||||||||||||||
|
Less than
|
1 - 3 | 3 - 5 |
More than
|
|||||||||||||||||
|
Total
|
1 Year
|
Years
|
Years
|
5 Years
|
||||||||||||||||
|
Revolving credit facility
|
$ | 1,406 | $ | 1,406 | $ | - | $ | - | $ | - | ||||||||||
|
Long-term debt
|
8,130 | - | - | 8,130 | - | |||||||||||||||
|
Interest payments on long-term debt obligation
|
5,102 | 1,189 | 2,526 | 1,387 | - | |||||||||||||||
|
Operating lease obligations
|
2,423 | 1,210 | 1,213 | - | - | |||||||||||||||
|
Other long-term liabilities (1)
|
1,045 | 769 | - | - | 276 | |||||||||||||||
|
Total
|
$ | 18,106 | $ | 4,574 | $ | 3,739 | $ | 9,517 | $ | 276 | ||||||||||
________________________
|
(1)
|
Other long-term liabilities consist of insurance financing and deferred compensation and exclude obligations for uncertain tax positions of $228,000, as the timing of payment cannot be reasonably estimated.
|
|
Off-Balance Sheet Arrangements
We do not have any relationships with unconsolidated entities or financial partnerships, such as entities often referred to as structured finance or special purpose entities, which would have been established for the purpose of facilitating off-balance sheet arrangements or other contractually narrow or limited purposes. In addition, we do not engage in trading activities involving non-exchange traded contracts that rely on estimation techniques to calculate fair value. As such, we are not exposed to any financing, liquidity, market or credit risk that could arise if we had engaged in such relationships.
-30-
Critical Accounting Policies and Estimates
Our consolidated financial statements have been prepared in accordance with accounting principles generally accepted in the U.S., which require us to make estimates and judgments that affect the reported amounts of assets, liabilities, revenues and expenses and related disclosure as of the date of our financial statements. On an ongoing basis, we evaluate our estimates and judgments, including those related to revenue, returns, trade allowances, inventories, goodwill and other intangible assets, share-based compensation and income taxes. We base our estimates and judgments on historical experience and on various other factors that we believe to be reasonable under the circumstances, the results of which form the basis of our judgments about the carrying values of assets and liabilities that are not readily apparent from other sources. Actual results or changes in the estimates or other judgments of matters inherently uncertain that are included within these accounting policies could result in a significant change to the information presented in the consolidated financial statements. We believe that the estimates and assumptions are among those most important to an understanding of our consolidated financial statements contained in this Annual Report on Form 10-K.
We consider certain accounting policies related to revenue recognition, inventory valuation, goodwill and other intangible assets, share-based compensation and income taxes to be critical policies due to the estimates and judgments involved in each.
Revenue Recognition
Our revenues are derived principally from direct sales to retailers and wholesalers. Our standard arrangement for our customers includes a valid purchase order or contract with no customer acceptance provisions. We recognize revenues from sales of products when:
| ● | we enter into a legally binding arrangement with a customer; | |
| ● | products are shipped and the customer takes title and assumes risk of loss; | |
| ● | customer payment is deemed fixed or determinable and free of contingencies or significant uncertainties; and | |
| ● | collection is reasonably assured. |
Sales are reported on a net sales basis, which is computed by deducting from gross sales a reserve for product returns, which includes actual returns to date and an amount established for anticipated product returns, as well as trade allowances. Our practice is to accept product returns from retailers only if properly requested, authorized and approved. In accepting returns, we typically provide a credit to the retailer against accounts receivable from that retailer.
Allowances for estimated returns are provided for when the related sales are recorded. We continually review and revise our sales returns estimates based on actual product returns and recoverability, planned product discontinuances and promotional sales. In the past, returns provisions have been adjusted higher or lower during the course of a fiscal year depending on actual results to date and anticipated returns for the remainder of a year. Experience has shown a relationship between gross sales and sales returns in the subsequent period, as well as a consistent pattern of returns due to the seasonal nature of our business. In addition, as necessary, specific accruals may be established for known or anticipated events that we have considered, and will continue to consider, including the solvency of our customers, store closings by retailers, changes in the retail environment and decisions regarding new and existing products.
Actual returns in any future period are inherently uncertain and thus may differ from our estimates. If actual returns exceed reserves, we would need to reduce our net sales at the time of such determination. We have not experienced any material differences between the allowances for estimated returns and actual returns. Our provision for returns was $19.0 million, $23.2 million and $28.8 million for the years ended December 31, 2010, 2009 and 2008, respectively. Our provision for 2010 decreased compared to 2009 due to a decline in expected returns from our retailers resulting from the loss of a major customer, from which we no longer expect to receive returns, the discontinuance of higher-priced promotional kits that were sold in 2008, that had a significantly higher return rate than our other products, and the overall decline in gross sales. Our provision for 2009 decreased compared to 2008 due to a decline in expected returns from our retailers resulting from the loss of a major customer, from which we no longer expect to receive returns, the discontinuance of higher-priced promotional kits that were sold in 2008, that had a significantly higher return rate than our other products, and the overall decline in gross sales.
We offer trade allowances such as rebates, price protection, coupons and other incentives to customers in the normal course of business. We also have arrangements with customers pursuant to our trade terms to reimburse them for a portion of their advertising costs, which provide advertising benefits to us or incentivize our retail customers or the end consumer. These arrangements include cash discounts, markdown allowances, cooperative advertising, retail marketing, coupons, warehouse allowances and miscellaneous allowances (collectively, "trade allowances"). In addition, from time to time, we may pay fees to customers in order to place products on end-caps or expand or maintain space for its products. Trade allowances are provided for based on estimates, including anticipated deductions to be taken by our customers for the trade allowance programs provided to them, and historical experience. Trade allowances and end-cap placement and shelf placement costs, if any, are recorded as incurred as an offset against sales in our consolidated statements of operations. We also record certain non-cash consideration given to customers for trade allowance programs to cost of sales in our consolidated statements of operations. We have not experienced any material differences between the trade allowance accruals and actual trade allowances.
-31-
Inventory Valuation
Inventories are stated at the lower of average cost or market. Cost is determined by the first-in, first-out method.
We make ongoing estimates relating to the net realizable value of inventories, based on our assumptions about future demand and market conditions. Slow moving and obsolete inventories are identified based on historical trends, sales projections and future known or anticipated events, including planned discontinuance of products. When inventory is identified as slow moving or obsolete, we record an inventory write-down equal to the difference between the cost of the inventory and its estimated market value. Estimated market value is determined based on the amounts we expect to recover from third parties, including our arrangement with a third-party liquidator. This write-down is recorded as a charge to cost of sales. We have not experienced any material differences between write-downs and actual results.
Goodwill and Other Intangible Assets
Goodwill. Goodwill represented the excess of the purchase price over the fair value assigned to the net tangible and specific intangible assets acquired in business combinations. In accordance with ASC 350, goodwill was not amortized and was tested for impairment annually as of June 30, or whenever events or indicators of impairment occur between annual impairment tests. To apply ASC 350, a company is divided into separate “reporting units,” each representing groups of activities that are separately managed. For this purpose, we have one reporting unit. In addition to the annual impairment test, we assessed whether events or circumstances occurred that potentially indicated that the carrying amounts of these assets may not be recoverable.
The first step of the goodwill impairment test compares the fair value of a reporting unit with its carrying amount, including goodwill. The fair value of goodwill is determined using a discounted cash flow analysis, corroborated by a comparative market approach based on recent share prices and includes a control premium based on recent transactions that have occurred in our industry. The principal factors used in the discounted cash flow analysis requiring judgment are the projected results of operations, weighted average cost of capital (WACC) and terminal value assumptions. The WACC takes into account the relative weights of each component of the company’s consolidated capital structure (equity and debt) and represents the expected cost of new capital adjusted as appropriate to consider lower risk profiles associated with longer term contracts and barriers to market entry. The terminal value assumptions are applied to the final year of the discounted cash flow model. If the carrying amount of a reporting unit exceeds its fair value, the second step of the goodwill impairment test is performed to measure the amount of impairment loss, if any. The second step of the impairment test involves preparing an allocation of the fair value of our reporting unit to the tangible and intangible assets (other than goodwill) as if the reporting unit had been acquired in a business combination. Given that the continued downturn in the U.S. economy during the fourth quarter of 2008 significantly lowered consumer discretionary spending, which lowered the demand for our products, along with the continued deterioration of our market capitalization, we tested goodwill and other intangible assets as of December 31, 2008 for impairment. As a result, we recorded a non-cash impairment charge of $16.8 million representing the entire amount of our previously recorded goodwill.
Other indefinite-lived intangible assets. Other indefinite-lived intangible assets consist exclusively of trade names. The Physicians Formula trade name has been used since 1937 and is a recognized brand within the cosmetics industry. It is management’s intent to leverage the trade names indefinitely into the future. Trade names are tested for impairment annually as of June 30, or whenever events or indicators of impairment occur between annual impairment tests. The fair value of the trade names is determined using a discounted cash flow analysis based on the relief-from-royalty approach. The relief-from-royalty approach is an income approach that utilizes certain market information by reference to the amount of royalty income we could generate if the trade names were licensed, in an arm's length transaction, to a third party. Based on a comparison of our trade names to the guideline transactions, including an assessment of industry conditions, the age of the trademark/trade name, degree of consumer recognition and life cycle of the brand, a reasonable royalty rate is estimated for the trade names. The principal factors used in the discounted cash flow analysis requiring judgment are the projected net sales, discount rate, royalty rate and terminal value assumptions (Level 3 inputs).
If our net sales or other estimated factors are not achieved at or above the forecasted level, this may adversely affect the estimated fair value of the trade names and the carrying value may prove unrecoverable and we may incur additional impairment charges in the future. The critical assumptions that affect projected net sales and the discount rate assumptions are: i) the number of retail stores in which we have distribution, which, in turn, could be affected by the loss or gain of a customer(s), in whole or in part; ii) the number of products we sell on average in each of our retail customer's stores; iii) the sales price of our products to our customers, which can be affected by general consumer confidence, competitive dynamics and the degree of innovation in our products relative to that of our competition; and iv) the rate of returns that we expect to receive from sales to our customers, which are offsets to our gross sales. Customers evaluate whether to keep our products in distribution using a variety of factors, the most meaningful of which include the rate of sales of our products in their stores, the margin our customers generate from the sales of our products, and the amount of cooperative advertising and trade allowance programs that we invest in to support the sales of our products in their stores (and such programs are offsets to our gross sales). Typically, products that are returned relate to either special promotions that did not sell through at our retail customers or products which our retail customers are not including in their planned annual plan-o-gram reset for the upcoming year. The discount rate is affected by the Company's, and selected guideline public companies, capital structure (ratio of debt and equity financing) and the related cost of debt and equity financing, and both can be significantly affected by changes in the capital markets (e.g. general availability of debt and equity for companies with our risk profile) and the degree of risk and stability analysts, investors, potential investors, and other market participants perceive in our cash flow performance.
As a result of the conditions identified above under "Goodwill," we conducted an impairment test as of December 31, 2008, which resulted in a $15.9 million non-cash impairment charge to write down the carrying value of the trade names to their fair value of $13.6 million. As a result of our annual impairment testing of the trade names as of June 30, 2009, trade names with a carrying amount of $13.6 million were written down to their fair value of $12.5 million, resulting in an impairment charge of $1.1 million, which was included in the operating results for the year ended December 31, 2009. No such impairment charge was recorded during 2010 based on our impairment analysis performed as of June 30, 2010.
-32-
Definite-lived intangible assets. Other intangible assets consist primarily of patents and distributor relationships (we use the terms distributor and customer interchangeably, thus such distributor relationships represented of our entire customer base of retailer customers at the time of the management buyout and stock purchase transaction in 2003). Patents and distributor relationships are amortized over their estimated useful lives of 15 and 20 years, respectively. Intangible assets related to patents and distributor relationships are reviewed for impairment whenever events or changes in circumstances indicate that the carrying value of an asset may not be recoverable. Management estimated the useful life of the patents on the base technology that has been in existence for many years and is expected to continue through the estimated useful life. The useful life of the distributor relationships is based on our historical attrition analysis, which was used to calculate the rate of drop-off or loss of customer sales over time, for all of our customers/distributors at the time of the 2003 management buyout and stock purchase transaction. We used our aggregate sales for these customers over a historical period of time to calculate an implied average annual customer attrition rate, which converted into the 20 year estimated useful life of the distributor/customer relationships.
We evaluate the remaining useful life of our distributor relationships intangible asset in accordance with ASC 350-30-35-9. In connection with the loss of one of our largest retailer customers, we updated our attrition analysis based on historical information through June 30, 2009 and adjusted the analysis for the loss of such customer. From the date of the management buyout and stock purchase transaction in 2003 through June 30, 2009, we have been able to significantly increase our sales by expanding our total distribution among our then existing customers through increases in the number of retail stores in which our customers sell our product and through increases in the total number of products sold at each of our customers' stores. Based upon our updated attrition analysis, we noted that the loss of one of our largest retailer customers was offset by the growth in our sales to our then existing customers since 2003. Therefore, since the resulting attrition rate approximated the previous historical attrition rate, we concluded that there was not a significant impact to the remaining period of amortization related to our distributor relationships intangible asset.
We tested the recoverability of definite-lived intangible assets at the asset group level, which we determined to be at the entity level, in accordance with ASC 360, Property, Plant and Equipment, as of December 31, 2008 and June 30, 2009 as events or changes in circumstances indicated that the carrying amount may not be recoverable. The recoverability of the asset group was based on the sum of the projected undiscounted cash flows of the asset group, which we then compared to the related carrying value of the asset group. The material inputs into these projections include assumptions regarding estimates of revenue growth rates, gross profit margins, and operating expenses, which were adjusted for known events and circumstances as of the date of our recoverability testing, including the adverse impact from the loss of one of our largest retailer customers. Based upon the results of our recoverability test of the asset group, the sum of the undiscounted cash flows exceeded the carrying value, indicating that the asset group carrying value is recoverable and no impairment charge was required for our distributor relationships and patents intangible assets. We did not perform a recoverability test of our definite-lived intangible assets during 2010 as there were no events or changes in circumstances that indicated that the carrying amount may not be recoverable.
Our impairment test for all of our intangible assets includes assumptions regarding the expected cash flows generated by the assets. The most critical assumptions to our profitability and cash flow projections are our forecasted net sales and product costs. The most critical assumptions for our projected net sales are discussed under other indefinite-lived intangible assets above. The most significant assumptions affecting our product costs relate to our procurement costs for both raw materials and semi-finished goods, which can be affected by inflation, the complexity of our product formulations, freight and fuel costs and the financial condition of our suppliers.
Inherent in any of these assumptions are uncertainties regarding the outcome of our projected sales growth rates, profit margins and operating expenses. Differences between current expectations and future outcomes realized may lead to significant changes in the fair value of our intangible assets, which may result in the incurrence of substantial losses by us.
Additionally, we will not be required to make any current or future cash expenditures as a result of the above impairments, and these impairments did not impact our financial covenant compliance under our debt agreements or our ongoing financial performance.
Share-Based Compensation
We account for share-based compensation in accordance with ASC 718, Compensation–Stock Compensation (“ASC 718”). Under ASC 718, which indicates that share-based payments awards result in a cost that will be measured at fair value on the awards’ grant date, based on the estimated number of awards that are expected to vest. Compensation cost for awards that vest would not be reversed if the awards expire without being exercised.
The estimation of stock awards that will ultimately vest requires judgment, and to the extent actual results differ from our estimates, such amounts will be recorded as a cumulative adjustment in the period estimates are revised. We consider several factors when estimating expected forfeitures, such as types of awards. Actual results may differ substantially from these estimates. Expected volatility of the stock will be based on companies of similar growth and maturity and our peer group in the industry in which we do business because we do not have sufficient historical volatility data for our own stock. The expected life of options granted represents management’s best estimate based upon historical and expected trends in the Company’s stock option activity. In the future, as we gain historical data for volatility in our own stock and the actual term employees hold our options, expected volatility and expected term may change which could substantially change the grant-date fair value of future awards of stock options and, ultimately, the expense we record.
-33-
Income Taxes
We account for income taxes in accordance with ASC 740, Income Taxes (“ASC 740”), which establishes financial accounting and reporting standards for the effects of income taxes that result from an enterprise’s activities during the current and preceding years. Deferred income tax assets and liabilities are computed annually for differences between the financial statements and income tax bases of assets and liabilities. Such deferred income tax asset and liability computations are based on enacted tax laws and rates applicable to periods in which the differences are expected to reverse. A valuation allowance is established, when necessary, to reduce deferred income tax assets to the amount expected to be realized.
We believe that it is more likely than not that the deferred income tax assets of $11.9 million as of December 31, 2010 will be utilized. In arriving at this conclusion we are relying on both the reversal of deferred income tax liabilities and the projection of future taxable income from operations. Of the deferred income tax liabilities, approximately $8.3 million are scheduled to reverse with the appropriate attributes sufficient to utilize the deferred income tax assets recognized as of December 31, 2010. We anticipate that our projected taxable income from operations in future years will exceed $12.3 million, therefore we anticipate we will be able to utilize the remaining deferred income tax assets of $3.6 million. We evaluate all positive and negative evidence when projecting future taxable income from operations and give more weight to evidence that is objectively verifiable, including our historical three-year cumulative taxable income. Management believes that it is more likely than not that we will exceed these requirements. However, if we are unable to generate pre-tax income in the future, this could result in recognizing a valuation allowance against our deferred income tax assets.
Environmental Matters
As discussed under Item 1. “Business,” we have environmental liabilities at our City of Industry facilities. These involve both onsite and regional groundwater contamination. We also have indemnities that have covered, and that we expect will continue to cover, most of these environmental liabilities. The indemnities were given to us by prior owners of the business, by a former operator of the facility and its insurer, by a prior owner’s successor, and by a company with which we entered into a settlement indemnifying us for further regional groundwater contamination liabilities. Based on our agreement and our past dealings with these entities and the nature of their contractual commitments, we expect that they will continue to indemnify most of our environmental liabilities. Some of the entities could contest a future indemnification demand we could make for some aspects of our potential environmental liabilities. We believe all of the entities are financially able to satisfy their indemnity obligations to us.
The growing political and scientific opinion is that global weather patterns (i.e. climate) are being influenced by increased levels of greenhouse gases (“GHGs”) in the earth’s atmosphere. This view and the concern over climate change have led to legislative and regulatory initiatives, some of which have already been enacted and others which are still being contemplated, aimed at reducing GHG emissions, both in the U.S. and in overseas markets.
There are currently climate change environmental laws and regulations in the U.S. and overseas markets to which we are subject, and there are many new laws and regulations being contemplated by the U.S. and international law-making and regulatory bodies to which we could be subject in the future.
To the best of our knowledge, we are not in violation of any current environmental laws or regulations, including those pertaining to greenhouse gas emissions. The only current federal climate change law and regulation that affects our U.S. plants is the EPA's GHG reporting rule. We cannot predict whether a federal climate change bill will be enacted or whether EPA regulations or additional state regulations will be promulgated. Furthermore, if such laws or regulations are promulgated, we cannot predict what requirements will arise, given the uncertain nature of prospective laws and regulations. Specifically, we cannot predict what requirements will be included in the State of California climate change regulations.
Based on current State evaluations, it is likely the California climate change program will not impose requirements on facilities that emit less than 25,000 tons of GHG per year. Our preliminary evaluation using EPA guidance is that each of our U.S. facilities are likely to emit much less than 25,000 tons of GHGs per year. In general, the economic impacts to companies that do not emit greater than 25,000 tons of GHGs per year should be less than companies which emit more than 25,000 tons of GHGs per year; the impact for companies that emit less than 25,000 tons of GHG per year is primarily increased energy, transportation and raw materials costs.
Given that our operations do not currently use large amounts of energy or emit significant GHG emissions, we do not currently foresee any future climate change laws or regulations requiring significant capital spending, which could materially impact our future financial results and liquidity.
We have also attempted to determine whether our suppliers (both those in the U.S. and outside the U.S.), notably the manufacturers of our powders and components, are in compliance with international and U.S. environmental laws and regulations. Given the nature of this segment of the manufacturing sector (e.g. they are not large, energy intensive plants) and the lack of enforceable requirements in many countries, we believe them to be in compliance. However, we cannot conclusively determine their status. As new laws and regulations are adopted, the impacts on our suppliers may change.
Furthermore, given the uncertain nature of environmental laws and regulations, we cannot predict the impact of prospective environmental laws and regulations on our suppliers. We will continue to seek information from our manufacturing suppliers on these impacts.
Because climate change requirements do not currently impose significant capital spending requirements on our suppliers and these suppliers do not emit high levels of GHG emissions or have high energy usages, such climate change requirements are unlikely to have a material impact on our financial results or liquidity. Any cost increases are likely to be due to increased energy, transportation, or raw material costs, increases that are unlikely to apply uniquely to our supply chain.
-34-
We do business with some customers that have GHG emission and/or energy reduction programs that apply to some of their supply chain providers and their upstream manufacturers. It is likely that these customers will extend programs to more of their suppliers and the manufacturers who make the components of the products we sell to our customers. Such a future expansion could require us to reduce our lifecycle GHG emissions and energy usage to remain in good standing with these customers. This, in turn, could lead to increased cost of goods and higher capital spending to deploy technologies required to reduce carbon emission and energy usage. It is not possible to predict with certainty whether these actions will materially impact our financial results and liquidity. However, as stated above, we believe our manufacturer’s operations do not currently use large amounts of energy or emit significant amounts of GHGs, and, therefore, we do not currently foresee any future issues with complying with customer requirements.
Significant changes in weather patterns, frequency and strength of storms and other weather effects could result from escalating, worldwide GHG emissions. These altered weather patterns could result in changes in demand (higher or lower) for our products, notably products containing sun protection (i.e., in some locations, there may be more demand for sun protection and in other locations, there may be less). Alterations in weather patterns can also result in severe weather events, such as hurricanes or tornadoes, which may negatively impact the operations of our retail distribution operations. We cannot predict changes in weather patterns, at what locations such weather changes may occur or whether the changes will increase or decrease costs (e.g. climate change may decrease the number of snow storms or flooding in some locations).
Effects of Inflation
Our monetary assets, consisting primarily of cash and receivables, are not significantly affected by inflation because they are short-term in nature. Our non-monetary assets, consisting primarily of inventory, intangible assets, goodwill and prepaid expenses and other assets, are not currently affected significantly by inflation. We believe that replacement costs of equipment, furniture and leasehold improvements will not materially affect our operations. However, the rate of inflation affects our cost of sales and expenses, such as those for employee compensation, which may not be readily recoverable in the price of the products offered by us.
Forward-Looking Statements
This section and other parts of this Annual Report on Form 10-K contain forward-looking statements within the meaning of Section 27A of the Securities Act of 1933, as amended, and Section 21E of the Securities Exchange Act of 1934, as amended. In some cases, forward-looking statements can be identified by words such as “anticipates,” “expects,” “believes,” “plans,” “predicts,” and similar terms. Such forward-looking statements are based on current expectations, estimates and projections about our industry, management’s beliefs and assumptions made by management. Forward-looking statements are not guarantees of future performance and our actual results may differ significantly from the results discussed in the forward-looking statements. Factors that might cause such differences include, but are not limited to our dependence on a limited number of retailer customers, the loss of any of our retailer customers, fluctuations in buying decisions of our retailer customers, changes in general economic or market conditions, our ability to comply with covenants in our new senior credit agreement and senior subordinated note, our ability to repay or refinance borrowings under the senior credit agreement, the competitive environment in our industry, the demand for our products, loss of any of our key employees, our ability to expand our product offerings, our ability to expand through new and existing distribution channels, our ability to manage our growth and sustain profitability, our ability to protect our intellectual property, our cash needs and financial performance, variations in product quality or delays in order fulfillment, our operations and our ability to achieve cost savings, our dependence on third party suppliers, increases in minimum wages, catastrophic losses or other disruptions at any of our facilities, the effect of regulatory and technological changes, risks associated with doing business outside of the U.S. and other factors discussed in Item 1A. “Risk Factors - Risk Related to Our Business and Industry.” Unless otherwise required by law, we expressly disclaim any obligation to update publicly any forward-looking statements, whether as result of new information, future events or otherwise.
-35-
ITEM 7A. QUANTITATIVE AND QUALITATIVE DISCLOSURES ABOUT MARKET RISK
Foreign Currency Risk
We sell to Canadian customers in Canadian dollars and pay overseas suppliers and third-party manufacturers in U.S. dollars. An increase in the Canadian dollar relative to the U.S. dollar could result in lower net sales and higher selling, general and administrative expenses. Additionally, we hold Canadian dollars in a cash account which could result in higher unrealized foreign currency exchange losses due to a decrease in the Canadian dollar relative to the U.S. dollar. A decrease in the value of the Euro and the Chinese Yuan relative to the U.S. dollar could cause our suppliers to raise prices that would result in higher cost of sales. The volatility of the applicable rates and prices are dependent on many factors that cannot be forecasted with reliable accuracy. Our current sales to Canadian customers and reliance on foreign suppliers for many of the raw materials and components used to produce products make it possible that our operating results may be affected by fluctuations in the exchange rate of the currencies of our customers and suppliers. We do not have any foreign currency hedges.
Interest Rate Risk
Since November 6, 2009, we are exposed to interest rate risks primarily through borrowings under our New Senior Credit Agreement (and previously under our old senior credit agreement). Interest on these borrowings is based upon variable interest rates. Our weighted-average borrowings outstanding during the year ended December 31, 2010 was $23.4 million and the interest rate in effect at December 31, 2010 was 3.80%. A hypothetical 1% increase or decrease in interest rates would have resulted in a $234,000 change to interest expense for the year ended December 31, 2010.
ITEM 8. FINANCIAL STATEMENTS AND SUPPLEMENTARY DATA
Our consolidated financial statements, together with the related notes and the report of independent registered public accounting firm, are set forth on the pages indicated in Item 15 in this Annual Report on Form 10-K.
ITEM 9. CHANGES IN AND DISAGREEMENTS WITH ACCOUNTANTS OR ACCOUNTING AND FINANCIAL DISCLOSURE
None.
-36-
ITEM 9A. CONTROLS AND PROCEDURES
Evaluation of Disclosure Controls and Procedures
Based on an evaluation under the supervision and with the participation of our management, including our Chief Executive Officer and Chief Financial Officer, our Chief Executive Officer and Chief Financial Officer concluded that our disclosure controls and procedures, as defined in Rules 13a-15(e) and 15d-15(e) under the Exchange Act, were effective as of December 31, 2010. Our disclosure controls and procedures are designed to ensure that information required to be disclosed by us in reports that we file or submit under the Exchange Act is (i) recorded, processed, summarized and reported within the time periods specified in the Securities and Exchange Commission rules and forms and (ii) accumulated and communicated to management, including our Chief Executive Officer and Chief Financial Officer, as appropriate, to allow timely decisions regarding required disclosure.
Management's Annual Report on Internal Control Over Financial Reporting
Our management is responsible for establishing and maintaining adequate internal control over financial reporting (as defined in Rule 13a-15(f) and 15d-15(f) under the Exchange Act). Our internal control over financial reporting is designed to provide reasonable assurance regarding the reliability of financial reporting and the preparation of financial statements for external purposes in accordance with generally accepted accounting principles in the U.S. Our internal control over financial reporting includes those policies and procedures that:
| (i) | pertain to the maintenance of records that, in reasonable detail, accurately and fairly reflect the transactions and dispositions of our assets; | |
|
(ii)
|
provide reasonable assurance that transactions are recorded as necessary to permit preparation of financial statements in accordance with generally accepted accounting principles in the U.S., and that our receipts and expenditures are being made only in accordance with authorizations of our management and directors; and | |
|
(iii)
|
provide reasonable assurance regarding prevention or timely detection of unauthorized acquisition, use, or disposition of our assets that could have a material effect on our financial statements. |
Management does not expect that our internal controls will prevent or detect all errors and all fraud. A control system, no matter how well designed and operated, can provide only reasonable, not absolute, assurance that the objectives of the control system are met. Further, the design of a control system must reflect the fact that there are resource constraints, and the benefits of controls must be considered relative to their costs. Because of the inherent limitations in all control systems, no evaluation of internal controls can provide absolute assurance that all control issues and instances of fraud, if any, have been detected. Also, any evaluation of the effectiveness of controls in future periods is subject to the risk that those internal controls may become inadequate because of changes in business conditions, or that the degree of compliance with the policies or procedures may deteriorate.
Management conducted an evaluation of the effectiveness of our internal control over financial reporting as of December 31, 2010 based on the criteria set forth in Internal Control—Integrated Framework issued by the Committee of Sponsoring Organizations of the Treadway Commission. Based on this evaluation, management has concluded that our internal control over financial reporting was effective as of December 31, 2010. Our independent registered public accounting firm, Deloitte & Touche LLP, has issued an attestation report on our internal control over financial reporting which is included herein.
Changes in Internal Control Over Financial Reporting
There has been no change in our internal control over financial reporting during the fourth quarter ended December 31, 2010 that has materially affected, or is reasonably likely to materially affect, our internal control over financial reporting.
-37-
REPORT OF INDEPENDENT REGISTERED PUBLIC ACCOUNTING FIRM
To the Board of Directors and Stockholders of
Physicians Formula Holdings, Inc.
Azusa, California
We have audited the internal control over financial reporting of Physicians Formula Holdings, Inc. and subsidiary (the "Company") as of December 31, 2010, based on criteria established in Internal Control — Integrated Framework issued by the Committee of Sponsoring Organizations of the Treadway Commission. The Company's management is responsible for maintaining effective internal control over financial reporting and for its assessment of the effectiveness of internal control over financial reporting, included in the accompanying Management’s Annual Report on Internal Control Over Financial Reporting. Our responsibility is to express an opinion on the Company's internal control over financial reporting based on our audit.
We conducted our audit in accordance with the standards of the Public Company Accounting Oversight Board (United States). Those standards require that we plan and perform the audit to obtain reasonable assurance about whether effective internal control over financial reporting was maintained in all material respects. Our audit included obtaining an understanding of internal control over financial reporting, assessing the risk that a material weakness exists, testing and evaluating the design and operating effectiveness of internal control based on the assessed risk, and performing such other procedures as we considered necessary in the circumstances. We believe that our audit provides a reasonable basis for our opinion.
A company's internal control over financial reporting is a process designed by, or under the supervision of, the company's principal executive and principal financial officers, or persons performing similar functions, and effected by the company's board of directors, management, and other personnel to provide reasonable assurance regarding the reliability of financial reporting and the preparation of financial statements for external purposes in accordance with generally accepted accounting principles. A company's internal control over financial reporting includes those policies and procedures that (1) pertain to the maintenance of records that, in reasonable detail, accurately and fairly reflect the transactions and dispositions of the assets of the company; (2) provide reasonable assurance that transactions are recorded as necessary to permit preparation of financial statements in accordance with generally accepted accounting principles, and that receipts and expenditures of the company are being made only in accordance with authorizations of management and directors of the company; and (3) provide reasonable assurance regarding prevention or timely detection of unauthorized acquisition, use, or disposition of the company's assets that could have a material effect on the financial statements.
Because of the inherent limitations of internal control over financial reporting, including the possibility of collusion or improper management override of controls, material misstatements due to error or fraud may not be prevented or detected on a timely basis. Also, projections of any evaluation of the effectiveness of the internal control over financial reporting to future periods are subject to the risk that the controls may become inadequate because of changes in conditions, or that the degree of compliance with the policies or procedures may deteriorate.
In our opinion, the Company maintained, in all material respects, effective internal control over financial reporting as of December 31, 2010, based on the criteria established in Internal Control — Integrated Framework issued by the Committee of Sponsoring Organizations of the Treadway Commission.
We have also audited, in accordance with the standards of the Public Company Accounting Oversight Board (United States), the consolidated financial statements as of and for the year ended December 31, 2010 of the Company and our report dated March 11, 2011 expressed an unqualified opinion on those financial statements.
/s/ Deloitte & Touche LLP
Los Angeles, California
March 11, 2011
ITEM 9B. OTHER INFORMATION
None.
-38-
PART III
ITEM 10. DIRECTORS, EXECUTIVE OFFICERS AND CORPORATE GOVERNANCE
The information required by Item 10 is incorporated by reference from the sections captioned “Proposals to be Voted On - Proposal No. 1: Election of Directors,” “Board of Directors and Corporate Governance,” “Executive Officers” and “Section 16(a) Beneficial Ownership Reporting Compliance” contained in our Proxy Statement for the 2011 Annual Meeting of Stockholders.
ITEM 11. EXECUTIVE COMPENSATION
The information required by Item 11 is incorporated by reference from the sections captioned “Executive Compensation” and “Board of Directors and Corporate Governance" contained in our Proxy Statement for the 2011 Annual Meeting of Stockholders.
ITEM 12. SECURITY OWNERSHIP OF CERTAIN BENEFICIAL OWNERS AND MANAGEMENT AND RELATED STOCKHOLDER MATTERS
Options to purchase shares of our common stock have been granted to certain of our executive officers and key employees under our 2006 equity incentive plan and 2003 stock option plan. The following table summarizes the number of stock options issued, net of forfeitures, the weighted-average exercise price of such stock options and the number of securities remaining to be issued under all outstanding equity compensation plans as of December 31, 2010:
|
Number of Securities to be Issued upon Exercise of Outstanding Options, Warrants and Rights
|
Weighted-average Exercise Price of Outstanding Options, Warrants and Rights
|
Number of Securities Remaining Available for Future Issuance Under Equity Compensation Plans
|
|||||||||||||
|
Equity compensation plans approved by security holders:
|
|||||||||||||||
|
2006 Equity Incentive Plan
|
711,389 | $ | 10.62 |
264,317
|
(1
|
) | |||||||||
|
2003 Stock Option Plan
|
538,889 | 0.11 | - | ||||||||||||
|
Total
|
1,250,278 | 6.09 | 264,317 | ||||||||||||
________________________
|
(1)
|
The 2006 Equity Incentive Plan provides that the number of shares available for issuance under the plan automatically increases on the first day of each fiscal year beginning in 2007 and ending in 2016 by the lesser of: (i) 2% of the shares of common stock outstanding on the last day of the immediately preceding fiscal year or (ii) such lesser number of shares as determined by the compensation committee of our board of directors. Accordingly, on January 1, 2011, the total number of shares of our common stock available for issuance under the 2006 Equity Incentive Plan increased by 271,793.
|
The additional information required by Item 12 is incorporated by reference from the section captioned “Common Stock Ownership” contained in our Proxy Statement for the 2011 Annual Meeting of Stockholders.
ITEM 13. CERTAIN RELATIONSHIPS AND RELATED TRANSACTIONS AND DIRECTOR INDEPENDENCE
The information required by Item 13 is incorporated by reference from the sections captioned “Certain Relationships and Related Transactions” and “Board of Directors and Corporate Governance” contained in our Proxy Statement for the 2011 Annual Meeting of Stockholders.
ITEM 14. PRINCIPAL ACCOUNTING FEES AND SERVICES
The information required by Item 14 is incorporated by reference from the sections captioned “Principal Accountant Fees and Services” contained in our Proxy Statement for the 2011 Annual Meeting of Stockholders.
PART IV
ITEM 15. EXHIBITS, FINANCIAL STATEMENT SCHEDULES
(a)(1) Financial Statements. See Index to Consolidated Financial Statements appearing on page F-1.
(a)(2) Financial Statement Schedules. All schedules have been omitted because they are not required or applicable or the information is included in the consolidated financial statements or notes thereto.
(b) Exhibits. The list of exhibits in the Exhibit Index to this Annual Report on Form 10-K is incorporated herein by reference.
-39-
INDEX TO CONSOLIDATED FINANCIAL STATEMENTS
| Page | |
| Report of Independent Registered Public Accounting Firm | F-2 |
| Consolidated Balance Sheets as of December 31, 2010 and 2009 | F-3 |
| Consolidated Statements of Operations for the three years ended December 31, 2010, 2009 and 2008 | F-4 |
| Consolidated Statements of Stockholders' Equity for the three years ended December 31, 2010, 2009 and 2008 | F-5 |
| Consolidated Statements of Cash Flows for the three years ended December 31, 2010, 2009 and 2008 | F-6 |
| Notes to Consolidated Financial Statements | F-7 |
F-1
REPORT OF INDEPENDENT REGISTERED PUBLIC ACCOUNTING FIRM
To the Board of Directors and Stockholders of
Physicians Formula Holdings, Inc.
Azusa, California
We have audited the accompanying consolidated balance sheets of Physicians Formula Holdings, Inc. and subsidiary (the "Company") as of December 31, 2010 and 2009, and the related consolidated statements of operations, stockholders' equity, and cash flows for each of the three years in the period ended December 31, 2010. These financial statements are the responsibility of the Company's management. Our responsibility is to express an opinion on these financial statements based on our audits.
We conducted our audits in accordance with the standards of the Public Company Accounting Oversight Board (United States). Those standards require that we plan and perform the audit to obtain reasonable assurance about whether the financial statements are free of material misstatement. An audit includes examining, on a test basis, evidence supporting the amounts and disclosures in the financial statements. An audit also includes assessing the accounting principles used and significant estimates made by management, as well as evaluating the overall financial statement presentation. We believe that our audits provide a reasonable basis for our opinion.
In our opinion, such consolidated financial statements present fairly, in all material respects, the financial position of the Company as of December 31, 2010 and 2009, and the results of its operations and its cash flows for each of the three years in the period ended December 31, 2010, in conformity with accounting principles generally accepted in the United States of America.
We have also audited, in accordance with the standards of the Public Company Accounting Oversight Board (United States), the Company's internal control over financial reporting as of December 31, 2010, based on the criteria established in Internal Control—Integrated Framework issued by the Committee of Sponsoring Organizations of the Treadway Commission and our report dated March 11, 2011 expressed an unqualified opinion on the Company's internal control over financial reporting.
/s/ Deloitte & Touche LLP
Los Angeles, California
March 11, 2011
F-2
PHYSICIANS FORMULA HOLDINGS, INC.
CONSOLIDATED BALANCE SHEETS
(In thousands, except share data)
|
December 31,
|
||||||||
|
2010
|
2009
|
|||||||
|
ASSETS
|
||||||||
|
CURRENT ASSETS:
|
||||||||
|
Cash and cash equivalents
|
$ | 110 | $ | 3,797 | ||||
|
Accounts receivable, net of allowance for doubtful accounts of $1,131 and $1,165
|
||||||||
|
as of December 31, 2010 and 2009, respectively
|
24,394 | 25,153 | ||||||
|
Inventories
|
23,305 | 21,202 | ||||||
|
Prepaid expenses and other current assets
|
2,234 | 1,764 | ||||||
|
Income taxes receivable
|
294 | 1,462 | ||||||
|
Deferred tax assets, net
|
7,649 | 9,611 | ||||||
|
Total current assets
|
57,986 | 62,989 | ||||||
|
PROPERTY AND EQUIPMENT, NET
|
3,056 | 3,603 | ||||||
|
OTHER ASSETS, NET
|
5,480 | 6,072 | ||||||
|
INTANGIBLE ASSETS, NET
|
32,251 | 34,016 | ||||||
|
TOTAL ASSETS
|
$ | 98,773 | $ | 106,680 | ||||
|
LIABILITIES AND STOCKHOLDERS' EQUITY
|
||||||||
|
CURRENT LIABILITIES:
|
||||||||
|
Accounts payable
|
$ | 9,061 | $ | 9,507 | ||||
|
Accrued expenses
|
2,834 | 2,258 | ||||||
|
Trade allowances
|
6,293 | 5,907 | ||||||
|
Sales returns reserve
|
10,700 | 11,103 | ||||||
| Income taxes payable | 535 | - | ||||||
|
Line of credit borrowings
|
1,406 | 9,926 | ||||||
|
Total current liabilities
|
30,829 | 38,701 | ||||||
|
DEFERRED TAX LIABILITIES, NET
|
8,738 | 10,579 | ||||||
| RELATED PARTY LONG-TERM DEBT, net of unamortized discount of $854 and none | ||||||||
| as of December 31, 2010, and 2009, respectively | 7,525 | 8,000 | ||||||
|
OTHER LONG-TERM LIABILITIES
|
503 | 630 | ||||||
|
Total liabilities
|
47,595 | 57,910 | ||||||
|
COMMITMENTS AND CONTINGENCIES (NOTE 7)
|
||||||||
|
STOCKHOLDERS' EQUITY:
|
||||||||
|
Series A preferred stock, $0.01 par value—10,000,000 shares authorized, no
|
||||||||
|
shares issued and outstanding at December 31, 2010 and 2009
|
- | - | ||||||
|
Common stock, $0.01 par value—50,000,000 shares authorized and
|
||||||||
|
13,589,668 shares issued and outstanding at December 31, 2010 and 2009
|
136 | 136 | ||||||
|
Additional paid-in capital
|
61,930 | 60,080 | ||||||
|
Accumulated deficit
|
(10,888 | ) | (11,446 | ) | ||||
|
Total stockholders' equity
|
51,178 | 48,770 | ||||||
|
TOTAL LIABILITIES AND STOCKHOLDERS' EQUITY
|
$ | 98,773 | $ | 106,680 | ||||
See notes to consolidated financial statements.
F-3
PHYSICIANS FORMULA HOLDINGS, INC.
CONSOLIDATED STATEMENTS OF OPERATIONS
(In thousands, except share data)
|
Years Ended December 31,
|
||||||||||||
|
2010
|
2009
|
2008
|
||||||||||
|
NET SALES
|
$ | 78,523 | $ | 77,796 | $ | 114,032 | ||||||
|
COST OF SALES
|
42,904 | 43,342 | 55,593 | |||||||||
|
GROSS PROFIT
|
35,619 | 34,454 | 58,439 | |||||||||
| SELLING, GENERAL AND ADMINISTRATIVE EXPENSES | 33,359 | 37,994 | 48,936 | |||||||||
|
GOODWILL AND INTANGIBLE ASSET IMPAIRMENT
|
- | 1,100 | 32,661 | |||||||||
|
INCOME (LOSS) FROM OPERATIONS
|
2,260 | (4,640 | ) | (23,158 | ) | |||||||
|
INTEREST EXPENSE, NET
|
2,440 | 1,907 | 925 | |||||||||
|
OTHER (INCOME) EXPENSE, NET
|
(35 | ) | (27) | 380 | ||||||||
|
LOSS BEFORE BENEFIT FOR INCOME TAXES
|
(145 | ) | (6,520 | ) | (24,463 | ) | ||||||
|
BENEFIT FOR INCOME TAXES
|
(703 | ) | (2,617 | ) | (4,694 | ) | ||||||
|
NET INCOME (LOSS)
|
$ | 558 | $ | (3,903 | ) | $ | (19,769 | ) | ||||
|
NET INCOME (LOSS) PER COMMON SHARE:
|
||||||||||||
|
Basic
|
$ | 0.04 | $ | (0.29 | ) | $ | (1.41 | ) | ||||
|
Diluted
|
$ | 0.04 | $ | (0.29 | ) | $ | (1.41 | ) | ||||
|
WEIGHTED-AVERAGE COMMON SHARES OUTSTANDING:
|
||||||||||||
|
Basic
|
13,589,668 | 13,583,685 | 13,973,360 | |||||||||
|
Diluted
|
14,478,641 | 13,583,685 | 13,973,360 | |||||||||
See notes to consolidated financial statements.
F-4
PHYSICIANS FORMULA HOLDINGS, INC.
CONSOLIDATED STATEMENTS OF STOCKHOLDERS' EQUITY
(In thousands, except share data)
|
Common Stock
|
Additional
|
Retained
|
||||||||||||||||||
|
Number of
|
Paid-In
|
(Deficit)
|
||||||||||||||||||
|
Shares
|
Amount
|
Capital
|
Earnings
|
Total
|
||||||||||||||||
|
BALANCE, January 1, 2008
|
14,095,727 | $ | 141 | $ | 59,173 | $ | 13,136 | $ | 72,450 | |||||||||||
|
Stock-based compensation
|
- | - | 2,405 | - | 2,405 | |||||||||||||||
|
Repurchase and retirement of common stock (Note 8)
|
(621,193 | ) | (6 | ) | (2,665 | ) | (910 | ) | (3,581 | ) | ||||||||||
|
Exercise of stock options
|
102,584 | 1 | 10 | - | 11 | |||||||||||||||
|
Tax benefit on exercise of stock options
|
- | - | 45 | - | 45 | |||||||||||||||
|
Net loss
|
- | - | - | (19,769 | ) | (19,769 | ) | |||||||||||||
|
BALANCE, December 31, 2008
|
13,577,118 | 136 | 58,968 | (7,543 | ) | 51,561 | ||||||||||||||
|
Stock-based compensation
|
- | - | 1,153 | - | 1,153 | |||||||||||||||
|
Exercise of stock options
|
12,550 | - | 1 | - | 1 | |||||||||||||||
|
Tax deficiency on cancellation of stock options
|
- | - | (42 | ) | - | (42 | ) | |||||||||||||
|
Net loss
|
- | - | - | (3,903 | ) | (3,903 | ) | |||||||||||||
|
BALANCE, December 31, 2009
|
13,589,668 | 136 | 60,080 | (11,446 | ) | 48,770 | ||||||||||||||
|
Stock-based compensation
|
- | - | 1,242 | - | 1,242 | |||||||||||||||
|
Issuance of warrants
|
- | - | 608 | - | 608 | |||||||||||||||
|
Net income
|
- | - | - | 558 | 558 | |||||||||||||||
|
BALANCE, December 31, 2010
|
13,589,668 | $ | 136 | $ | 61,930 | $ | (10,888 | ) | $ | 51,178 | ||||||||||
See notes to consolidated financial statements.
F-5
PHYSICIANS FORMULA HOLDINGS, INC.
CONSOLIDATED STATEMENTS OF CASH FLOWS
(In thousands)
|
Years Ended December 31,
|
||||||||||||
|
2010
|
2009
|
2008
|
||||||||||
|
CASH FLOWS FROM OPERATING ACTIVITIES:
|
||||||||||||
|
Net income (loss)
|
$ | 558 | $ | (3,903 | ) | $ | (19,769 | ) | ||||
|
Adjustments to reconcile net income (loss) to net cash provided by operating activities:
|
||||||||||||
|
Intangible asset impairment
|
- | 1,100 | 32,661 | |||||||||
|
Depreciation and amortization
|
4,475 | 3,875 | 3,046 | |||||||||
|
Exchange rate (gain) loss
|
(96 | ) | 48 | (58 | ) | |||||||
|
Deferred income taxes
|
(211 | ) | (1,325 | ) | (10,504 | ) | ||||||
|
Provision for bad debts
|
16 | 405 | 503 | |||||||||
|
Amortization of debt discount and debt issuance costs
|
744 | 641 | 37 | |||||||||
|
Stock-based compensation expense
|
1,163 | 1,084 | 2,289 | |||||||||
| Tax benefit on exercise of stock options | - | - | (45 | ) | ||||||||
|
Payment in kind interest
|
329 | 50 | - | |||||||||
|
Changes in assets and liabilities:
|
||||||||||||
|
Accounts receivable
|
839 | 3,580 | 3,790 | |||||||||
|
Inventories
|
(2,024 | ) | 8,561 | 2,071 | ||||||||
|
Prepaid expenses and other current assets
|
384 | 417 | 266 | |||||||||
|
Accounts payable
|
(1,373 | ) | (1,629 | ) | (1,789 | ) | ||||||
|
Accrued expenses, trade allowances and sales returns reserve
|
(245 | ) | (280 | ) | 1,183 | |||||||
|
Income taxes payable (receivable)
|
1,703 | (3,137 | ) | (1,717 | ) | |||||||
|
Other long-term liabilities
|
(157 | ) | (97 | ) | 482 | |||||||
|
Net cash provided by operating activities
|
6,105 | 9,390 | 12,446 | |||||||||
|
CASH FLOWS FROM INVESTING ACTIVITIES:
|
||||||||||||
|
Purchase of property and equipment, net of ($319), $76 and $42 non-cash capital expenditures
|
||||||||||||
|
for the years ended December 31, 2010, 2009 and 2008, respectively
|
(456 | ) | (752 | ) | (1,392 | ) | ||||||
|
Other assets, net of ($608) non-cash retail permanent fixture expenditure for the year ended
|
||||||||||||
|
December 31, 2010
|
(291 | ) | (2,805 | ) | (1,663 | ) | ||||||
|
Net cash used in investing activities
|
(747 | ) | (3,557 | ) | (3,055 | ) | ||||||
|
CASH FLOWS FROM FINANCING ACTIVITIES:
|
||||||||||||
|
Paydowns of term loans
|
- | - | (3,000 | ) | ||||||||
|
Net payments on line of credit from Union Bank
|
- | (18,435 | ) | (2,233 | ) | |||||||
|
Net (payments) borrowings on line of credit from Wells Fargo
|
(8,520 | ) | 9,926 | - | ||||||||
|
Borrowings from related party bridge loan
|
- | 4,200 | - | |||||||||
|
Paydowns of related party bridge loan
|
- | (4,200 | ) | - | ||||||||
|
Borrowings from related party long-term debt
|
- | 8,000 | - | |||||||||
|
Debt issuance costs
|
(525 | ) | (2,148 | ) | (13 | ) | ||||||
|
Repurchase and retirement of common stock
|
- | - |
(3,581
|
) | ||||||||
|
Tax benefit on exercise of stock options
|
- | - | 45 | |||||||||
|
Exercise of stock options
|
- | 1 | 11 | |||||||||
|
Net cash used in financing activities
|
(9,045 | ) | (2,656 | ) | (8,771 | ) | ||||||
|
NET (DECREASE) INCREASE IN CASH AND CASH EQUIVALENTS
|
(3,687 | ) | 3,177 | 620 | ||||||||
|
CASH AND CASH EQUIVALENTS—Beginning of year
|
3,797 | 620 | - | |||||||||
|
CASH AND CASH EQUIVALENTS—End of year
|
$ | 110 | $ | 3,797 | $ | 620 | ||||||
|
SUPPLEMENTAL DISCLOSURE OF CASH FLOW INFORMATION:
|
||||||||||||
|
Cash paid for interest
|
$ | 1,486 | $ | 1,016 | $ | 966 | ||||||
|
Cash (refunds received) paid for income taxes, net
|
$ | (2,151 | ) | $ | 1,855 | $ | 7,043 | |||||
|
SUPPLEMENTAL DISCLOSURE OF NON-CASH OPERATING INVESTING AND FINANCING ACTIVITIES:
|
||||||||||||
|
On March 30, 2009, the Company replaced its previous outstanding borrowings of $10,500 under its term loans with borrowings under the revolving credit facility in connection with an amendment to the senior credit agreement.
|
||||||||||||
|
In May 2009, a non-cash distribution of $375 was made to an executive officer from the Company's 1999 Nonqualified Deferred Compensation Plan.
|
||||||||||||
| In November 2010 and 2009, the Company entered into an agreement for its general, automobile and workers' compensation insurance policies of $938 and $954, respectively. | ||||||||||||
See notes to consolidated financial statements.
F-6
PHYSICIANS FORMULA HOLDINGS, INC.
NOTES TO CONSOLIDATED FINANCIAL STATEMENTS
1. ORGANIZATION AND SUMMARY OF SIGNIFICANT ACCOUNTING POLICIES
Organization. The accompanying consolidated financial statements include the accounts of Physicians Formula Holdings, Inc. (the “Company”), a Delaware corporation, formerly known as PFI Holdings Corp., and its wholly owned subsidiary, Physicians Formula, Inc. (“Physicians”), a New York corporation, and its wholly owned subsidiaries, Physicians Formula Cosmetics, Inc., a Delaware corporation, and Physicians Formula DRTV, LLC, a Delaware limited liability company.
The Company develops, markets, manufactures and distributes innovative, premium-priced products for the mass market channel. The Company’s products include face powders, bronzers, concealers, blushes, foundations, eye shadows, eyeliners, brow makeup and mascaras. The Company sells its products to mass market retailers such as Wal-Mart, CVS, Target and Rite Aid. The Company is headquartered in Azusa, California.
Principles of Consolidation. The consolidated financial statements include the Company and its wholly-owned subsidiary. All intercompany accounts and transactions have been eliminated in consolidation.
Cash and Cash Equivalents. The Company considers all highly liquid investments with a maturity of three months or less, at the time of purchase, to be cash equivalents.
Concentration of Credit Risk. Certain financial instruments subject the Company to concentrations of credit risk. These financial instruments consist primarily of accounts receivable. The Company regularly reevaluates its customer' ability to satisfy credit obligations and records a provision for doubtful accounts based on such evaluations. Significant customers that accounted for more than 10% of gross sales are as follows:
|
Years Ended December 31,
|
||||||||||||
|
2010
|
2009
|
2008
|
||||||||||
|
Customer A
|
32 | % | 30 | % | 22 | % | ||||||
|
Customer B
|
19 | % | 19 | % | 16 | % | ||||||
|
Customer C
|
12 | % | 12 | % | 10 | % | ||||||
|
Customer D
|
- | % | 5 | % | 16 | % | ||||||
Four customers individually accounted for 10% or more of gross accounts receivable and together accounted for approximately 72% of gross accounts receivable at December 31, 2010. Three customers individually accounted for 10% or more of gross receivables and together accounted for approximately 66% of gross receivables at December 31, 2009.
Late in the first quarter of 2009, one of the Company's largest retail customers informed management that, as a result of a change in strategy, the customer intended to reduce its space allocated to the entire color cosmetics category in its stores in 2010. In April 2009, this customer informed management of its decision to completely discontinue selling the Company's products in 2010 rather than implementing only a reduction in the number of the Company's products sold in its stores. This customer began to reduce its inventory levels of the Company's products to prepare for the 2010 discontinuation during the second quarter of 2009, which had a material negative impact on the Company's net sales. This change eliminated the Company's distribution in approximately 5,800 stores. This customer accounted for 5% and 16% of gross sales for the years ended December 31, 2009 and 2008, respectively. There were no sales to this customer during the year ended December 31, 2010.
Inventories. Inventories are stated at the lower of average cost or market. Cost is determined by the first-in, first-out method.
Property and Equipment. Property and equipment are stated at cost and are depreciated using the straight-line method over their estimated useful lives. Computer equipment is depreciated over three years, tooling from 3-5 years, machinery and equipment from 3-8 years, furniture and fixtures from 5-8 years and leasehold improvements are amortized over the shorter of their estimated useful lives or the life of the lease.
Capitalized Interest. Capitalized interest is recorded in property and equipment for construction-in-progress using the average interest rate over the construction period. Capitalized interest for the years ended December 31, 2010, 2009 and 2008 was not significant.
Retail Permanent Fixtures. During 2008, the Company began its retail permanent fixture program, whereby it contracts with third-party contractors for the design, production, shipping and installation of fixtures at certain of its retailer customers' stores. The Company has entered into agreements with these customers, whereby the fixtures are the property of the Company and can be modified, removed, replaced, etc. at the discretion of the Company. The Company believes that these fixtures will provide future economic benefit to the Company. The Company has capitalized the related costs of the fixtures and these costs are being amortized over a period of three years from the date they are put into service with such amortization expense included in selling, general and administrative expense. The Company may accelerate the amortization of retail permanent fixtures if the estimated remaining useful life changes due to store closures or product discontinuance.
Impairment of Long-Lived Assets. The Company evaluates long-lived assets for impairment whenever events or changes in circumstances indicate that the carrying value of an asset may not be recoverable. If the estimated undiscounted future cash flows from the use of an asset are less than the carrying value, an impairment charge would be recorded to reduce the related asset to its estimated fair value.
F-7
Goodwill and Intangible Assets. Goodwill represented the excess of the purchase price over the fair value assigned to the net tangible and specific intangible assets acquired in business combinations. In accordance with ASC 350, goodwill was not amortized and was tested for impairment annually as of June 30, or whenever events or indicators of impairment occur between annual impairment tests. In addition to the annual impairment test, we assessed whether events or circumstances occurred that potentially indicated that the carrying amounts of these assets may not be recoverable. The Company recorded a non-cash impairment charge of $16.8 million representing the entire amount of its previously recorded goodwill for the year ended December 31, 2008.
Other indefinite-lived intangible assets consist exclusively of trade names. Trade names are tested for impairment annually as of June 30, or whenever events or indicators of impairment occur between annual impairment tests. The fair value of the trade names is determined using a discounted cash flow analysis based on the relief-from-royalty approach. The Company recorded non-cash impairment charges of $1.1 million and $15.9 million for the years ended December 31, 2009 and 2008, respectively, to write down the carrying value of the trade names to their fair value. No such impairment charge was recorded during 2010 based on the Company's impairment analysis.
Other intangible assets consist primarily of patents and distributor relationships (the term distributor is used interchangeably with customer). Patents and distributor relationships are amortized over their estimated useful lives of 15 and 20 years, respectively. Intangible assets related to patents and distributor relationships are reviewed for impairment whenever events or changes in circumstances indicate that the carrying value of such asset may not be recoverable.
Debt Issuance Costs. Debt issuance costs are capitalized and amortized over the terms of the underlying debt instruments using the effective-interest method and is included in other assets in the accompanying consolidated balance sheets. Amortization and write-offs of loan costs for the years ended December 31, 2010, 2009 and 2008, totaled $659,000 $641,000 and $37,000, respectively, and is included in interest expense in the consolidated statements of operations.
Fair Value Measurements. The Company's financial instruments are primarily composed of cash and cash equivalents, accounts receivable, accounts payable and line of credit borrowings. The fair value of cash and cash equivalents, accounts receivable, accounts payable and line of credit borrowings closely approximates their carrying value due to their short maturities. Additionally, the fair value of the line of credit borrowings is estimated based on reference to market prices and closely approximates its carrying value.
The valuation techniques required by the Financial Accounting Standards Board ("FASB") Accounting Standards Codification 820 ("ASC 820"), are based upon observable and unobservable inputs. Observable inputs reflect market data obtained from independent sources, while unobservable inputs reflect internal market assumptions. These two types of inputs create the following fair value hierarchy:
| ● | Level 1–Quoted prices in active markets for identical assets or liabilities. | |
|
●
|
Level 2–Observable inputs other than Level 1 prices such as quoted prices for similar assets or liabilities; quoted prices in markets that are not active or other inputs that are observable or can be corroborated by observable market data for substantially the full term of the related asset or liabilities. | |
| ● | Level 3–Unobservable inputs that are supported by little or no market activity and that are significant to the fair value of assets or liabilities. |
The use of observable market inputs (quoted market prices) is required when measuring fair value and requires Level 1 quoted price to be used to measure fair value whenever possible. The Company's restricted investments are classified within Level 1 of the fair value hierarchy and are based on quoted market prices in active markets (see Note 4 for further details).
The fair value of the Company's related party long-term debt was approximately $8.2 million at December 31, 2010 and is classified within level 3 of the fair value hierarchy (see Note 6 for further details).
Indefinite-lived assets are measured at fair value on a non-recurring basis when the fair value exceeds the carrying value. Indefinite-lived intangible assets, consisting exclusively of trade names, are not amortized, but rather are tested for impairment annually or whenever events or circumstances occur indicating that they might be impaired. Trade names are valued using a projected discounted cash flow analysis based on unobservable inputs including projected net sales, discount rate, royalty rate and terminal value assumptions and are classified within Level 3 of the valuation hierarchy.
Revenue Recognition. The Company recognizes revenues from product sales, less estimates for returns and trade allowances, upon shipment of products when title has passed, persuasive evidence of a sales arrangement exists, the price to the buyer is fixed and determinable and collectability of the sales price is reasonably assured.
Sales Returns Reserve. A reserve for product returns is maintained based on estimated future returns determined by using estimates and historical experience. Returns are recorded as a reduction of net sales in the accompanying consolidated statements of operations.
Trade Allowances. The Company offers trade allowances such as rebates, price protection, cash discounts, coupons and other incentives to customers in the normal course of business. The Company also has arrangements with customers pursuant to its trade terms to reimburse them for a portion of their advertising costs, which provide advertising benefits to the Company or incentivize its retail customers or the end consumer. These arrangements include markdown allowances, cooperative advertising, retail marketing, warehouse allowances and miscellaneous allowances (collectively, "trade allowances"). In addition, from time to time, the Company may pay fees to customers in order to place products on end-caps or expand or maintain space for its products. Trade allowances are provided for based on estimates, including anticipated deductions to be taken by the Company's customers for the trade allowance programs provided to them, and historical experience. Trade allowances and end-cap placement and shelf placement costs, if any, are recorded as incurred as an offset against sales in the Company's consolidated statements of operations. The Company also records certain non-cash consideration given to customers for trade allowance programs to cost of sales in its consolidated statements of operations.
F-8
Shipping and Handling Fees. Amounts billed to customers for shipping and handling are included as a component of net sales. Shipping and handling costs, which represent costs incurred to ship products to the Company's customers, are included as a component of selling, general and administrative expenses in the accompanying consolidated statements of operations and totaled $3.5 million, $3.8 million and $5.5 million for the years ended December 31, 2010, 2009 and 2008, respectively.
Advertising Expenditures. Advertising costs are expensed as incurred and include print and television, promotions, public relations and other selling expenses. Advertising expense was $8.6 million, $12.4 million and $14.9 million for the years ended December 31, 2010, 2009 and 2008, respectively, and are included in selling, general and administrative expenses in the accompanying consolidated statements of operations.
Research and Development. Research and development costs are expensed as incurred and consist primarily of product formulation, testing, regulatory analysis and compliance. Research and development costs totaled $699,000, $765,000 and $775,000 for the years ended December 31, 2010, 2009 and 2008, respectively, and are included in selling, general and administrative expenses in the accompanying consolidated statements of operations.
Stock-Based Compensation. The Company accounts for stock-based compensation in accordance with ASC 718, which indicates that share-based payment awards result in a cost that will be measured at fair value on the awards' grant date, based on the estimated number of awards that are expected to vest. Compensation cost for awards that vest would not be reversed if the awards expire without being exercised.
Income Taxes. The Company accounts for income taxes in accordance with ASC 740, which establishes financial accounting and reporting standards for the effects of income taxes that result from an enterprise’s activities during the current and preceding years. Deferred income tax assets and liabilities are computed annually for differences between the financial statements and income tax bases of assets and liabilities. Such deferred income tax asset and liability computations are based on enacted tax laws and rates applicable to periods in which the differences are expected to reverse. A valuation allowance is established, when necessary, to reduce deferred income tax assets to the amount expected to be realized.
Foreign Currency Transactions. The Company enters into sales transactions with customers located in Canada, which are denominated in Canadian dollars. Gains and losses from foreign currency transactions are included in the determination of net income (loss) in the period in which the exchange rate changes. Unrealized gains and losses result when receivables are revalued at the balance sheet date. Foreign currency gains (losses) of $254,000, $391,000 and ($774,000) were recognized for the years ended December 31, 2010, 2009 and 2008, respectively, and are included in selling, general and administrative expenses in the accompanying consolidated statements of operations.
Net Income (Loss) Income Per Share. Basic net income (loss) per common share is computed as net income (loss) divided by the weighted-average number of common shares outstanding during the period. Diluted net income (loss) per common share reflects the potential dilution that could occur from the exercise of outstanding stock options and warrants and is computed by dividing net income (loss) by the weighted-average number of common shares outstanding for the period, plus the dilutive effect of outstanding stock options and warrants, if any, calculated using the treasury stock method. The following table summarizes the potential dilutive effect of outstanding stock options and warrants, calculated using the treasury stock method (in thousands, except per share data):
|
Years Ended December 31,
|
||||||||||||
|
2010
|
2009
|
2008
|
||||||||||
|
Numerator:
|
||||||||||||
|
Net income (loss)
|
$ | 558 | $ | (3,903 | ) | $ | (19,769 | ) | ||||
|
Denominator:
|
||||||||||||
|
Weighted-average number of common shares—basic
|
13,590 | 13,584 | 13,973 | |||||||||
|
Effect of dilutive stock options
|
485 | - | - | |||||||||
|
Effect of dilutive warrants
|
404 | - | - | |||||||||
|
Weighted-average number of common shares—diluted
|
14,479 | 13,584 | 13,973 | |||||||||
|
Net income (loss) per common share:
|
||||||||||||
|
Basic
|
$ | 0.04 | $ | (0.29 | ) | $ | (1.41 | ) | ||||
|
Diluted
|
$ | 0.04 | $ | (0.29 | ) | $ | (1.41 | ) | ||||
Stock options for the purchase of 1,234,000, 1,775,347 and 1,212,439 shares of common stock were excluded from the above calculation during the years ended December 31, 2010, 2009 and 2008, respectively, as the effect of those options were anti-dilutive.
Segments. The Company operates in one reportable segment consisting of the manufacturing, research, development and distribution of cosmetic products.
Use of Estimates. The preparation of financial statements in conformity with accounting principles generally accepted in the United States of America ("GAAP") requires management to make estimates and assumptions that affect the amounts reported in the consolidated financial statements and accompanying notes. Actual results could differ from those estimates.
Subsequent Events. The Company has performed an evaluation of subsequent events through the date the Company issued these financial statements.
F-9
2. INVENTORIES
Inventories consisted of the following (in thousands):
|
December 31,
|
||||||||
|
2010
|
2009
|
|||||||
|
Raw materials and components
|
$ | 11,586 | $ | 11,125 | ||||
|
Finished goods
|
11,719 | 10,077 | ||||||
|
Total
|
$ | 23,305 | $ | 21,202 | ||||
3. PROPERTY AND EQUIPMENT, NET
Property and equipment, net, consisted of the following (in thousands):
|
December 31,
|
||||||||
|
2010
|
2009
|
|||||||
| Machinery and equipment | $ | 5,183 | $ | 5,121 | ||||
| Computer equipment | 2,315 | 2,112 | ||||||
|
Leasehold improvements
|
1,098 | 1,098 | ||||||
| Tooling | 638 | 535 | ||||||
|
Furniture and fixtures
|
340 | 334 | ||||||
|
Property and equipment, cost
|
9,574 | 9,200 | ||||||
|
Construction in progress
|
495 | 94 | ||||||
|
Accumulated depreciation
|
(7,013 | ) | (5,691 | ) | ||||
|
Property and equipment, net
|
$ | 3,056 | $ | 3,603 | ||||
Depreciation expense was $1.3 million for each of the years ended December 31, 2010, 2009 and 2008.
4. OTHER ASSETS
Other assets consisted of the following (in thousands):
|
December 31,
|
||||||||
|
2010
|
2009
|
|||||||
| Retail permanent fixtures, net of accumulated amortization of $2,287 and $899 as of December 31, 2010 and 2009, respectively | $ | 3,343 | $ | 3,236 | ||||
|
Capitalized debt issuance costs, net of accumulated amortization of $807 and $149 as of December 31, 2010 and 2009, respectively
|
1,489 | 2,005 | ||||||
|
Restricted investments
|
276 | 245 | ||||||
| Deposits | 176 | 360 | ||||||
|
Income tax receivable
|
112 | 226 | ||||||
|
Other
|
84 | - | ||||||
|
Total
|
$ | 5,480 | $ | 6,072 | ||||
During 2008, the Company implemented a key project of creating new permanent fixtures ("retail permanent fixtures") for the display of the Company's products which began being delivered to certain retail customers in 2009. The Company incurred costs for retail permanent fixtures of $1.5 million, $2.6 million and $1.6 million for the years ended December 31, 2010, 2009 and 2008, respectively. These retail permanent fixtures are being placed in service in connection with the retail customers' resets of selling space, and are recorded at cost and these costs are amortized over a period of three years. Amortization expense was $1.4 million and $899,000 for the years ended December 31, 2010 and 2009, respectively. No retail permanent fixtures were put into service prior to fiscal 2009. Amortization of retail permanent fixtures is expected to be approximately $1.1 million for 2011, 2012 and 2013.
The Company incurred costs of $2.3 million primarily during late 2009 associated with obtaining the new senior revolving credit facility and new senior subordinated note, and the subsequent amendments thereto (see Note 6 for further details). As of December 31, 2010, these costs are being amortized over the life of the related debt obligations as an additional component of interest expense and are expected to be fully amortized by November 6, 2014. Capitalized debt issuance costs of $263,000 related to the previous senior credit agreement were written off during 2009 to interest expense in the accompanying consolidated statements of operations.
Restricted investments represent a diversified portfolio of mutual funds held in a Rabbi Trust, which fund the nonqualified, unfunded deferred compensation plans (the “Deferred Compensation Plans”). These investments, which are considered trading securities, are recorded at fair value. Unrealized gains related to these investments were $27,000 and $28,000 for the years ended December 31, 2010 and 2009, respectively. On May 7, 2009, the 1999 Nonqualified Deferred Compensation Plan was terminated and $375,000 was distributed to an executive officer. The balance remaining in restricted investments relates to the 2005 Nonqualified Deferred Compensation Plan, which is still in effect.
F-10
5. INTANGIBLE ASSETS
Definite-lived intangible assets consisted of the following (in thousands):
|
December 31, 2010
|
December 31, 2009
|
|||||||||||||||||||||||
|
Gross
Amount
|
Accumulated Amortization
|
Net
Amount
|
Gross
Amount
|
Accumulated Amortization
|
Net
Amount
|
|||||||||||||||||||
|
Patents
|
$ | 8,699 | $ | (4,157 | ) | $ | 4,542 | $ | 8,699 | $ | (3,577 | ) | $ | 5,122 | ||||||||||
|
Distributor relationships
|
23,701 | (8,492 | ) | 15,209 | 23,701 | (7,307 | ) | 16,394 | ||||||||||||||||
|
Total
|
$ | 32,400 | $ | (12,649 | ) | $ | 19,751 | $ | 32,400 | $ | (10,884 | ) | $ | 21,516 | ||||||||||
Amortization expense was $1.8 million for each of the years ended December 31, 2010, 2009 and 2008. Amortization of intangibles will be approximately $1.8 million in each of the next five years.
The changes in the carrying amounts of indefinite-lived intangible assets as of December 31, 2010 and 2009, are as follows (in thousands):
|
December 31,
|
||||||||
|
2010
|
2009
|
|||||||
|
Trade names
|
||||||||
|
Balance—beginning of year
|
$ | 12,500 | $ | 13,600 | ||||
|
Impairment charge
|
- | (1,100 | ) | |||||
|
Balance—end of year
|
$ | 12,500 | $ | 12,500 | ||||
The Company evaluates indefinite-lived intangible assets for impairment in the second quarter of each fiscal year or whenever events or circumstances occur that potentially indicate that the carrying amounts of these assets may not be recoverable. During the second quarter of 2010, the Company tested trade names for impairment and based on the analysis, an impairment charge was not recorded as the fair value of the trade names exceeded their carrying value. During the second quarter of 2009, the Company tested trade names for impairment and based on this analysis and due to the continued downturn in the economy which significantly lowered discretionary spending and the continued decline in the Company's market capitalization, trade names with a carrying amount of $13.6 million were written down to their fair value of $12.5 million, resulting in an impairment charge of $1.1 million, which was included in the operating results for the year ended December 31, 2009.
In order to test the trade names for impairment, the Company determines the fair value of the trade names and compares such amount to its carrying value. The Company determines the fair value of the trade names using a projected discounted cash flow analysis based on the relief-from-royalty approach. The principal factors used in the discounted cash flow analysis requiring judgment are the projected net sales, discount rate, royalty rate and terminal value assumption. The royalty rate used in the analysis is based on transactions that have occurred in the Company's industry.
The Physicians Formula trade name has been used since 1937 and is a recognized brand within the cosmetics industry. It is management's intent to leverage the Company's trade names indefinitely into the future. The Company will continue to monitor operational performance measures and general economic conditions. A continued downward trend could result in our recognizing an impairment charge of the Physicians Formula trade name in connection with a future impairment test.
F-11
6. FINANCING ARRANGEMENTS
Senior Credit Agreement
On November 14, 2006, Physicians entered into a senior credit agreement (the "senior credit agreement") with Union Bank, N.A. ("Union Bank") replacing the previous credit arrangement. The senior credit agreement was scheduled to mature in 2011 and, as of December 31, 2008, provided for an amortizing term loan and for borrowings of up to $25.0 million under a revolving credit facility, with availability reduced by any outstanding letters of credit. Amounts outstanding under the term loan facility and revolving credit facility bore interest at a London Interbank Offered Rate ("LIBOR") Adjusted Rate (as defined in the senior credit agreement) plus 1.75% or at a Base Rate (as defined in the senior credit agreement) plus 0.25%. The senior credit agreement also provided for a commitment fee of one-quarter of 1.0% on any unused commitment.
On March 30, 2009, Physicians entered into an amendment to the senior credit agreement which converted the entire facility into an asset-based revolving credit facility, and the outstanding term loan was replaced with borrowings under the revolving credit facility. On July 29, 2009, Physicians entered into another amendment to the senior credit agreement whereby the lender reduced its revolving loan commitment from $25.0 million to $20.0 million.
The senior credit agreement required the Company to comply with a minimum interest coverage ratio, a minimum EBITDA (as defined in the senior credit agreement) covenant and a minimum tangible net worth covenant. The senior credit agreement contained certain additional negative covenants, including limitations on the Company's ability to: incur other indebtedness and liens; fundamentally change its business through a merger, consolidation, amalgamation or liquidation; sell assets; make restricted payments; pay cash dividends from Physicians Formula, Inc. or pay for expenses of Physicians Formula Holdings, Inc., unless certain conditions are satisfied; make certain acquisitions, investments, loans and advances; engage in transactions with its affiliates; enter into certain agreements; engage in sale-leaseback transactions; incur certain unfunded liabilities; change its line of business; and make capital expenditures in excess of $2.0 million per year. The senior credit agreement required the Company to make mandatory prepayments with the proceeds of certain asset dispositions and upon the receipt of insurance or condemnation proceeds to the extent the Company did not use the proceeds for the purchase of satisfactory replacement assets in accordance with the terms of the senior credit agreement.
Borrowings under the senior credit agreement were guaranteed by Physicians Formula Holdings, Inc. and the domestic subsidiaries of Physicians Formula, Inc. and borrowings under the senior credit agreement were secured by a pledge of the capital stock of Physicians Formula, Inc. and its equity interests in each of its subsidiaries and substantially all of the assets of Physicians Formula, Inc. and its domestic subsidiaries.
On November 6, 2009, the senior credit agreement with Union Bank was replaced with a New Senior Credit Agreement with Wells Fargo Bank, N.A. ("Wells Fargo") as described below.
Bridge Loan
On September 4, 2009, Physicians, as borrower, and Mill Road Capital, L.P. ("Mill Road"), as lender, entered into an agreement (the "Bridge Loan Agreement") for a second-priority senior bridge loan facility (the "Bridge Loan") in the amount of $4.2 million. The Company used borrowings under the Bridge Loan to repay $2.9 million of borrowings under the senior credit agreement with Union Bank, which included approximately $2.4 million of overadvances to Physicians, and to fund short-term working capital requirements. The Bridge Loan was scheduled to mature on December 3, 2009 with interest accruing at a rate of 15% per annum payable upon maturity of the Bridge Loan.
The Bridge Loan Agreement required the Company to comply with the same financial covenants that the Company was required to comply with under its existing senior credit agreement with Union Bank. Borrowings under the Bridge Loan Agreement were guaranteed by the Company and the domestic subsidiaries of Physicians (the "Guarantors"), and borrowings under the Bridge Loan Agreement were secured by a second-priority pledge of the capital stock of Physicians and its equity interests in each of its subsidiaries and substantially all of the assets of Physicians and its subsidiaries.
On November 6, 2009, the Bridge Loan was repaid using the proceeds from the issuance of a new Senior Subordinated Note as described below.
F-12
New Senior Credit Agreement
On November 6, 2009, pursuant to a new senior credit agreement (the “New Senior Credit Agreement”) between Physicians and Wells Fargo, Physicians entered into a new asset-based revolving credit facility (the “new revolving credit facility”) and terminated its previous asset-based revolving credit facility (the “old revolving credit facility”) with Union Bank. Approximately $9.3 million of the proceeds of the new revolving credit facility were used to repay outstanding borrowings under Physicians’ old revolving credit facility. The new revolving credit facility is scheduled to mature on November 6, 2012.
The maximum amount available for borrowing under the new revolving credit facility is equal to the lesser of $25.0 million and a borrowing base formula equal to: (i) 65% or such lesser percentage of eligible accounts receivable as Wells Fargo in its discretion as an asset-based lender may deem appropriate; plus (ii) the least of (1) $14.0 million and (2) the sum of specified percentages (or such lesser percentages as Wells Fargo in its discretion as an asset-based lender may deem appropriate) of each of the following items of eligible inventory (as defined in the New Senior Credit Agreement): (A) of eligible inventory consisting of finished goods that are fully packaged, labeled and ready for shipping, not to exceed 65% of such eligible inventory, (B) eligible inventory consisting of semi-finished goods which are ready for packaging and shipping, not to exceed $4.0 million, (C) eligible inventory consisting of raw materials, not to exceed $1.5 million, (D) eligible inventory consisting of blank components, not to exceed $1.0 million and (E) eligible inventory consisting of returned items, not to exceed $0.75 million; plus (iii) the cash balance in a certain Canadian concentration account; less (iv) a working capital reserve of $1.0 million as such amount may be adjusted by Wells Fargo from time to time and a borrowing base reserve that Wells Fargo establishes from time to time in its discretion as a secured asset-based lender; less (v) indebtedness owed to Wells Fargo other than indebtedness outstanding under the new revolving credit facility. Availability under the new revolving credit facility is reduced by outstanding letters of credit.
Floating rate borrowings under the new revolving credit facility accrue interest at a daily rate equal to the three-month LIBOR plus 3.5% and fixed rate borrowings accrue interest at a fixed rate equal to the three-month LIBOR plus 3.5% on the date of borrowing. Interest on floating rate borrowings is payable monthly in arrears and interest on fixed rate borrowings are payable upon the expiration of the fixed rate term, subject to minimum monthly interest payments in the amount of $25,000. Under the New Senior Credit Agreement, Physicians is required to pay to Wells Fargo an unused credit line fee equal to 0.5% per annum and various other fees associated with cash management and other related services. Physicians may reduce the maximum amount available for borrowing or terminate the facility prior to the scheduled maturity date at any time by paying breakage fees equal to 3% of the maximum amount of the new revolving credit facility or amount of the reduction in the credit facility, as applicable, decreasing to 1.5% after November 6, 2010 and decreasing to 0.5% after November 6, 2011.
Under the New Senior Credit Agreement, all payments to Physicians and its subsidiaries are required to be deposited into a lockbox account provided by Wells Fargo, except that payments in connection with the Company’s Canadian operations may be deposited into a lockbox account with Royal Bank of Canada. Any amounts deposited into a lockbox account with Wells Fargo will be swept to a collection account to be applied to repay the outstanding borrowings under the new revolving credit facility. If the balance in Physicians’ Canadian account exceeds Canadian $2.0 million at any time, Physicians must within 10 days after such occurrence transfer the excess amount to the collection account to repay borrowings under the new revolving credit facility. In addition, at any time, Physicians may transfer amounts out of the Canadian accounts to repay borrowings under the revolving credit facility or, so long as no event of default exists, pay costs and expenses incurred in connection with the Company’s Canadian operations from its Canadian operating account.
The New Senior Credit Agreement requires the Company to comply with a monthly minimum book net worth covenant and a quarterly minimum Adjusted EBITDA (as defined below) covenant. In addition, the Company is required to comply with certain negative covenants, including limitations on its ability to: incur other indebtedness and liens; make certain investments, loans or advances; guaranty indebtedness; pay cash dividends from Physicians, except in an amount up to $100,000 to allow the Company to pay ordinary course expenses; sell assets; suspend operations; consolidate or merge with another entity; enter into sale-leaseback arrangements; or enter into unrelated lines of business or acquire assets not related to the business; and make capital expenditures in excess of $5.5 million for the year ending December 31, 2010 (subject to up to a $600,000 carryforward from the prior year). As of December 31, 2010, the Company held no assets aside from its investment in Physicians. The Company was required, no later than April 30, 2010, to negotiate with Wells Fargo and establish its financial covenants that would apply to periods after December 31, 2010. On December 21, 2010, Physicians entered into an amendment to the New Senior Credit Agreement with Wells Fargo which extended the deadline for negotiating and establishing these future financial covenants to February 28, 2011. The New Senior Credit Agreement also contains customary events of default, including a change of control Physicians. As of December 31, 2010, the Company was in compliance with the covenants contained in the New Senior Credit Agreement (see further details below).
The New Senior Credit Agreement defines “book net worth” as the Company’s stockholders’ equity, determined in accordance with GAAP and calculated without regard to any change in the valuation of goodwill and intangible assets made in accordance with ASC 350. The New Senior Credit Agreement requires that the Company has a minimum book net worth of $46.5 million as of December 31, 2010. As of December 31, 2010, the Company was in compliance with such covenant. The New Senior Credit Agreement defines “Adjusted EBITDA” as the Company’s consolidated net income, calculated before (i) interest expense, (ii) provision (benefit) for income taxes, (iii) depreciation and amortization expense, (iv) gains arising from the write-up of assets, (v) any extraordinary gains, (vi) stock-based compensation expenses, (vii) changes resulting from the valuation of goodwill and intangible assets made in accordance with ASC 350, and (viii) changes resulting from foreign exchange adjustments arising from a revaluation of assets subject to foreign currency revaluation, and (ix) provisions arising from adjustments to the Company’s inventory reserves for obsolete, excess, or slow moving inventory. On June 29, 2010, Physicians entered into the First Amendment to the New Senior Credit Agreement (the "First Amendment") with Wells Fargo which reduced the minimum Adjusted EBITDA covenant for the 12 months ended June 30, 2010 by $850,000 to $11.0 million from $11.85 million. All other covenants, including the book net worth covenant, the maximum capital expenditure covenant and the other 2010 minimum Adjusted EBITDA covenants were not modified. In connection with the First Amendment, the Company paid Wells Fargo a fee of $10,000 and related expenses. The New Senior Credit Agreement requires that the Company has a minimum Adjusted EBITDA of $8.95 million for the 12 months ended December 31, 2010. As of December 31, 2010, the Company was in compliance with such covenant.
On February 28, 2011, Physicians entered into the Second Amendment to the New Senior Credit Agreement (the "Second Amendment") with Wells Fargo to establish financial covenants that will apply to periods after December 31, 2010, including the Company's minimum book net worth covenant, minimum Adjusted EBITDA covenant and maximum capital expenditures covenant. In addition, commencing with the quarter ending March 31, 2011, the Company is required to comply with a quarterly minimum Adjusted EBITDA covenant calculated on a 6-month period basis. The Second Amendment also requires the Company to negotiate with Wells Fargo and establish, no later than April 30, 2012, its financial covenants that will apply to future periods not covered by this amendment.
F-13
The New Senior Credit Agreement and the Note Agreement with respect to the Company's Senior Subordinated Note (discussed below under “New Senior Subordinated Note”) contain provisions that could result in the acceleration of maturity of the indebtedness and entitle the lenders to exercise remedies upon an event of default, including a default of the financial covenants. There is no assurance that the Company would receive waivers should it not meet its financial covenant requirements. Even if the Company is able to obtain a waiver, in connection with negotiating a waiver, it may be required to agree to other changes in the senior credit agreement including increased interest rates, tighter covenants or lower availability thresholds or pay a fee for such waiver. If the Company is not able to comply with the new financial covenants in the senior credit agreement and it is unable to obtain waivers, the Company would need to obtain additional sources of liquidity; however, given the current state of the worldwide credit markets, there can be no assurance that the Company will be able to obtain additional sources of liquidity on terms acceptable to it, or at all.
Borrowings under the new revolving credit facility are guaranteed by the Company and the domestic subsidiaries of Physicians and are secured by a pledge of the capital stock of Physicians and its subsidiaries and substantially all of the assets of the Company and its subsidiaries.
Physicians paid a closing fee to Wells Fargo equal to $250,000 and agreed to pay all expenses incurred by Wells Fargo in connection with the new revolving credit facility.
As of December 31, 2010 and 2009, there was $1.4 million and $9.9 million outstanding under the new revolving credit facility, respectively, at interest rates of 3.80% and 3.75%, respectively. As of December 31, 2010 and 2009, there were no outstanding letters of credit and $15.8 million and $12.2 million available under the new revolving credit facility, respectively. The new revolving credit facility contains a lock-box feature, whereby remittances made by customers to the lock-box repays the outstanding obligation under the new revolving credit facility. As such, in accordance with ASC 470-10-45, the Company classified the above outstanding amount under the new revolving credit facility as a current liability in the accompanying consolidated balance sheets.
New Senior Subordinated Note
On November 6, 2009, pursuant to a Senior Subordinated Note Purchase and Security Agreement between Physicians, the guarantors named therein and Mill Road (the “Note Agreement” or "Senior Subordinated Note"), reported as Related Party Long-Term Debt on the accompanying consolidated balance sheets, Physicians issued a new Senior Subordinated Note to Mill Road in an aggregate principal amount equal to $8.0 million. Physicians used $4.3 million of the proceeds to repay in full the principal of $4.2 million and interest of $107,000 outstanding under its Bridge Loan from Mill Road. The Company used the remaining proceeds for capital expenditures and general corporate purposes. Prior to an amendment entered into during April 2010 as described below, the Senior Subordinated Note was scheduled to mature on May 6, 2013 and accrue interest at 19% per annum, with 15% per annum payable in cash monthly in arrears on the first day of each calendar month and 4% payable in kind with quarterly compounding on the first day of each calendar quarter.
Subject to the terms of the new revolving credit facility, the Senior Subordinated Note may be redeemed in whole or in part prior to November 6, 2010 at an amount equal to 105% of the aggregate principal amount of the outstanding Notes, decreasing to 104% if redeemed on or after November 6, 2010 and prior to November 6, 2011, decreasing to 102% if redeemed on or after November 6, 2011 and prior to November 6, 2012, and decreasing to 101% if redeemed on or after November 6, 2012. In addition, Physicians must make an offer to redeem the Senior Subordinated Notes upon a change of control of Physicians at the then applicable redemption price. The Company is required to comply with substantially the same covenants under the Note Agreement that it is required to comply with under the New Senior Credit Agreement. In addition, the events of default under the Note Agreement are substantially the same as the events of default under the New Senior Credit Agreement. The Senior Subordinated Note is guaranteed by the Company and Physicians’ subsidiaries and is secured by a first lien on certain intellectual property and a second lien on substantially all of the other assets of the Company and its subsidiaries and pledges of the stock of Physicians and its subsidiaries. The value of the collateral subject to these liens is limited to the lesser of 10% of the value of the assets of Physicians Formula Holdings, Inc. and its subsidiaries and 10% of the value of all outstanding common stock of Physicians Formula Holdings, Inc. as of November 6, 2009 (the “10% Cap”). Pursuant to an intercreditor agreement entered into between Physicians, Mill Road and Wells Fargo in connection with the New Senior Credit Agreement and Note Agreement (the "New Intercreditor Agreement"), the Senior Subordinated Note is subordinate in right of payment to the prior paying of all obligations under the New Senior Credit Agreement and the liens securing the obligations under the Note Agreement are junior and subordinate to the liens securing the obligations under the New Senior Credit Agreement (except for first liens on certain intellectual property). In addition, the New Intercreditor Agreement prohibits certain amendments to the Note Agreement without the consent of Wells Fargo and prohibits certain amendments to the New Senior Credit Agreement without the consent of Mill Road.
In connection with the issuance of the Senior Subordinated Note, Mill Road agreed that, until September 30, 2012, it would not acquire more than 35% of the Company’s common stock or seek to elect any directors to the Board (other than the one director it is entitled to nominate while the Senior Subordinated Note is outstanding), in each case, without obtaining the prior written consent of the Board. These restrictions will be released if the Company receives a bid for the acquisition of the Company (other than from Mill Road or its affiliates).
As required under the Note Agreement, the Company sought stockholder approval in order to comply with the Nasdaq shareholder approval requirements and to satisfy certain sections of the Delaware General Corporation Law, because Mill Road is an “interested stockholder” for purposes of the statute. Because Mill Road is an interested stockholder, the Company was required to obtain the vote of 66 2/3% of the outstanding common stock not owned by Mill Road to approve the transactions. At the special meeting of the stockholders held on April 28, 2010, the stockholders approved, by the requisite margin, a Second Amendment to the Senior Subordinated Note (the "Second Amendment") and the issuance of warrants to Mill Road.
F-14
On April 30, 2010, Physicians, the Company, the subsidiaries of Physicians and Mill Road entered into the Second Amendment. Under the Second Amendment, Mill Road agreed to reduce the interest rate on the Senior Subordinated Note from 19% per annum (15% payable in cash monthly and 4% payable in kind with quarterly compounding) to 14% per annum (10% payable in cash monthly and 4% payable in kind with annual compounding), and to extend the maturity of the Senior Subordinated Note by 18 months to November 6, 2014. The prepayment premium for an optional redemption was also amended so that if the Senior Subordinated Note is redeemed on or after November 6, 2011 and prior to November 6, 2012, the prepayment premium would be 102%, decreasing to 101% if redeemed on or after November 6, 2012 and prior to November 6, 2013, and decreasing to 100% if redeemed on or after November 6, 2013. In addition, the existing limit on the amount of collateral securing the Senior Subordinated Note was removed.
In addition, as required by the Note Purchase Agreement and as consideration for the reduction in interest payments, on April 30, 2010, the Company entered into a Common Stock Purchase Warrant agreement with Mill Road pursuant to which warrants have been issued entitling Mill Road to purchase 650,000 shares of the Company's common stock. The warrants have an exercise price equal to $0.25 per share and expire on April 30, 2017. Upon issuance of the warrants, Mill Road beneficially owned 2,516,943 shares of the Company's common stock and warrants to purchase 650,000 shares of common stock, representing aggregate beneficial ownership of 3,166,943 shares (approximately 22%) of the Company's common stock.
On June 3, 2010, Physicians, the Company, the subsidiaries of Physicians and Mill Road entered into a Third Amendment to the Senior Subordinated Note (the "Third Amendment"). Pursuant to the Third Amendment, Mill Road has the right to nominate one individual to serve as a member of the Company's board of directors (the "Board") so long as (A) the outstanding principal amount under the Senior Subordinated Note is no less than $2.0 million and Mill Road owns shares of, or securities convertible into, or exercisable for, capital stock of the Company, or (B) Mill Road owns no less than 5% of the issued and outstanding capital stock of the Company (on a fully diluted basis) and any part of the Senior Subordinated Note is outstanding. In addition, in the Third Amendment, the Company agrees to (i) increase the size of the Board and appoint Mill Road's nominee to the Board, and (ii) recommend to the Company's stockholders that Mill Road's nominee to the Board be elected to the Board at the annual meetings of stockholders (clauses (i) and (ii) together, the "Company Obligations"), in each case so long as the conditions in clauses (A) or (B) of the immediately preceding sentence are met. Prior to the Third Amendment, Mill Road had the right to nominate one individual to serve as a member of the Board and the Company had an obligation to perform the Company Obligations, in each case so long as the Senior Subordinated Note was outstanding.
On February 28, 2011, Physicians, the Company, the subsidiaries of Physicians and Mill Road entered into the Fourth Amendment to the Senior Subordinated Note (the "Fourth Amendment"). The Fourth Amendment establishes the Company's financial covenants that will apply to periods after December 31, 2010, including its minimum book net worth covenant, minimum Adjusted EBITDA covenant and maximum capital expenditures covenant. In addition, commencing with the quarter ending March 31, 2011, the Company is required to comply with a quarterly minimum Adjusted EBITDA covenant calculated on a 6-month period basis. The Company's financial covenants with Mill Road reflect an approximate 20% cushion from those of Wells Fargo. The Fourth Amendment also required the Company to negotiate with Mill Road, no later than April 30, 2012, its financial covenants that will apply to future periods not covered by this amendment.
In connection with the new revolving credit facility and Senior Subordinated Note, and the amendments thereto, the Company incurred total costs of $2.3 million associated with these agreements, which included $250,000 and $222,000 of closing fees paid to Wells Fargo and Mill Road, respectively.
The issuance of the warrants and reduction in interest payments has been accounted for as a partial conversion of the required payments under the Note Purchase Agreement for equity interests under ASC 470-20. ASC 470-20 requires the issuer of convertible debt instruments to separately account for the liability and equity components of the convertible debt instrument in a manner that reflects the issuers borrowing rate at the date of issuance for a similar debt instrument without the conversion feature. ASC 470-20 requires bifurcation of a component of the convertible debt instrument, classification of that component in equity and the accretion of the resulting discount on the debt to be recognized as interest expense.
The equity component of the Senior Subordinated Note was $940,000 at the time of issuance and was applied as debt discount and as additional paid-in capital. Additionally, during 2010, the Company recorded the income tax effect of the debt discount of $332,000 to additional paid-in-capital, as a reduction of the $940,000 recorded above, and established a corresponding deferred income tax liability. The unamortized discount for the Senior Subordinated Note will be amortized through the debt maturity date of November 6, 2014. The effective interest rate on the liability component of the Senior Subordinated Note is 17.5%. Interest expense related to the contractual coupon rate was $1.3 million for the year ended December 31, 2010. Interest expense related to amortization of the debt discount was $86,000 for the year ended December 31, 2010.
Long-term debt and the equity component of the Senior Subordinated Note as of December 31, 2010 is as follows (in thousands):
|
Senior Subordinated Note
|
$ | 8,130 | ||
|
Unamortized discount
|
(854 | ) | ||
| Accrued payable in kind interest | 249 | |||
|
Net carrying value of Senior Subordinated Note
|
$ | 7,525 | ||
|
Equity component of Senior Subordinated Note
|
$ | 940 |
The estimated fair value of the Senior Subordinated Note, based on publicly traded debt of comparable companies with similar features, was approximately $8.2 million compared to its carrying value of $7.5 million at December 31, 2010.
F-15
7. COMMITMENTS AND CONTINGENCIES
Operating Leases
The Company has long-term noncancelable operating leases for its facilities expiring through December 2012 and operating leases, primarily for various pieces of equipment, expiring through September 2013. Certain of the leases contain free rent periods and rent escalation clauses. The Company records rent expense on a straight-line basis. Total rent expense for all facilities and equipment was $1.6 million, $1.7 million and $1.8 million for the years ended December 31, 2010, 2009 and 2008, respectively.
Future minimum commitments under these operating leases as of December 31, 2010 are as follows (in thousands):
|
Year ending December 31,
|
||||
|
2011
|
$ | 1,210 | ||
|
2012
|
1,169 | |||
|
2013
|
44 | |||
| $ | 2,423 | |||
Litigation
The Company is involved in various lawsuits in the ordinary course of business. In management's opinion, the ultimate resolution of these matters will not result in a material impact to the Company's consolidated financial statements.
Environmental
The Company is subject to a broad range of frequently changing federal, state and local environmental, health and safety laws and regulations, including those governing discharges to air, soil and water, the handling and disposal of, and exposure to, hazardous substances and the investigation and remediation of any contamination resulting from the release of any hazardous substances. The Company believes that its business, operations and facilities are in material compliance with all applicable environmental, health and safety laws and regulations, and future expenditures will be necessary in order to maintain such compliance.
The shallow soils and groundwater below the Company's City of Industry facilities were contaminated by the former operator of the property. The former operator performed onsite cleanup, and the Company anticipates that it will receive written confirmation from the State of California that no further onsite cleanup is necessary. Such confirmation would not rule out potential liability for regional groundwater contamination or alleged potable water supply contamination discussed below. If further onsite cleanup is required, the Company believes the cost, which the Company is not able to estimate, would be indemnified, without contest or material limitation, by companies that have fulfilled similar indemnity obligations to the Company in the past, and which the Company believes remain financially able to do so.
The facilities are located within an area of regional groundwater contamination known as the Puente Valley “operable unit” (“PVOU”) of the San Gabriel Valley Superfund Site. The Company, along with many others, was named a potentially responsible party (“PRP”) for the regional contamination by the United States Environmental Protection Agency (“EPA”). The Company entered into a settlement with another PVOU PRP, pursuant to which, in return for a payment the Company had already made and had been fully indemnified for by a third party, the other PRP indemnified the Company against most claims for PVOU contamination. A court approved and entered a consent decree among the other PRP, the Company and the EPA that resolves the Company's liability for cleanup of regional groundwater contamination without any payment by the Company to the EPA. Depending on the scope and duration of the cleanup, the Company may be required to make further payments to the other PRP for regional groundwater remediation costs. The Company estimates the amount of such additional payments, if any, would not exceed approximately $130,000. The estimate is based on component estimates for two distinct contaminants that may require remediation. Those estimates in turn are based on a number of assumptions concerning the likelihood that remediation will be required, the cost of remediation if required and other matters. Uncertainty in predicting these matters limits the reliability and precision of the estimates. The Company expects any such additional payments by the Company to be covered by indemnities given to the Company by other companies. Those companies may contest their indemnity obligation for these payments. The Company believes the companies are financially able to pay the liability. Because the Company believes it is not probable that it will be held liable for any of these expenses, the Company has not recorded a liability for such potential claims.
The Company believes its liability for these contamination matters and related claims is substantially covered by third-party indemnities, has been resolved by prior agreements and settlements, and any costs or expenses associated therewith will be borne by prior operators of the facilities, their successors and their insurers. The Company is attempting to recoup approximately $760,000 in defense costs from one of these indemnitors. These costs have been expensed as paid by the Company and are not recorded in the accompanying consolidated balance sheets.
F-16
8. STOCKHOLDERS' EQUITY
On September 11, 2008, the Board of Directors of the Company authorized the repurchase of up to $10.0 million of the Company’s outstanding common stock pursuant to a stock repurchase program (the "Repurchase Program"). Under the terms of the Repurchase Program, the Company may repurchase shares through open market purchases or through privately negotiated transactions. The stock repurchase activities will be conducted in compliance with the safe harbor provisions of Rule 10b-18 of the Securities Exchange Act of 1934, as amended (the "Exchange Act"). The Repurchase Program does not obligate the Company to repurchase any dollar amount or number of shares of its common stock, and the program may be extended, modified, suspended or discontinued at any time.
On September 12, 2008, the Company entered into a written trading plan under Rule 10b5-1 of the Exchange Act (the "Rule 10b5-1 Trading Plan"), with Deutsche Bank Securities, Inc. ("Deutsche Bank"), to facilitate the repurchase of common stock under the Repurchase Program. The Rule 10b5-1 Trading Plan authorized daily share repurchases from September 12, 2008 through November 6, 2008 at varying prices. Due to unanticipated changes to the volume limitation under Rule 10b-18 of the Exchange Act, the Company terminated its Rule 10b5-1 Trading Plan effective October 10, 2008. From September 12, 2008 through October 9, 2008, the Company repurchased and retired 621,193 shares for an aggregate price of $3.6 million under the Repurchase Program.
On April 30, 2010, in connection with the Second Amendment to the Note Purchase Agreement, the Company entered into a Common Stock Purchase Warrant agreement with Mill Road Capital, L.P. pursuant to which warrants were issued entitling Mill Road to purchase 650,000 shares of the Company's common stock at an exercise price of $0.25 per share. As of December 31, 2010, no warrants have been issued. See Note 6 for a detailed discussion.
9. EQUITY AND STOCK OPTION PLANS
2006 Equity Incentive Plan
In connection with the Company’s initial public offering in November 2006, the Company adopted the Physicians Formula Holdings, Inc. 2006 Equity Incentive Plan (as amended, the “2006 Plan”). The 2006 Plan provides for grants of stock options, stock appreciation rights, restricted stock, restricted stock units, deferred stock units and other performance awards to directors, officers and employees of the Company, as well as others performing services for the Company. The options generally have a 10-year life and vest in equal monthly installments over a four-year period. As of December 31, 2010, a total of 264,317 shares of the Company’s common stock were available for issuance under the 2006 Plan. This amount will automatically increase on the first day of each fiscal year ending in 2016 by the lesser of: (i) 2% of the shares of common stock outstanding on the last day of the immediately preceding fiscal year or (ii) such lesser number of shares as determined by the compensation committee of the Board of Directors.
2003 Stock Option Plan
In November 2003, the Board of Directors adopted the 2003 Stock Option Plan (the “2003 Plan”) and reserved a total of 2,500,000 shares for grants under the 2003 Plan. The 2003 Plan provides for the issuance of stock options for common stock to executives and other key employees. The options generally have a 10-year life and vest over a period of time ranging from 24 months to 48 months. Options granted under the 2003 Plan were originally granted as time-vesting options and performance-vesting options. The original time-vesting options vest in equal annual installments over a four-year period. In connection with the Company's initial public offering during 2006, the 713,334 performance-vesting options were amended to accelerate the vesting of 550,781 of such options, and 296,140 of these options were exercised. The remaining 162,553 performance-vesting options were converted to time-vesting options that vested in equal monthly installments over a two-year period through November 2008.
Options are granted with exercise prices not less than the fair value at the date of grant, as determined by the Board of Directors, which subsequent to the Company's initial public offering is the closing price on the grant date.
The 2006 Plan and 2003 Plan activity is summarized below:
|
Time-Vesting Options
|
Performance-Vesting Options
|
|||||||||||||||||||||||
|
Number
of Shares
|
Weighted-
Average
Exercise
Price
|
Aggregate
Intrinsic
Value
|
Number
of Shares
|
Weighted-
Average
Exercise
Price
|
Aggregate
Intrinsic
Value
|
|||||||||||||||||||
|
Options outstanding—January 1, 2008
|
862,342 | $ | 7.80 | 136,681 | $ | 0.10 | ||||||||||||||||||
|
Granted
|
317,000 | 9.54 | - | - | ||||||||||||||||||||
|
Exercised
|
(102,584 | ) | 0.10 | $ | 595,000 | - | - | |||||||||||||||||
|
Forfeited
|
(1,000 | ) | 9.54 | - | - | |||||||||||||||||||
|
Options outstanding—December 31, 2008
|
1,075,758 | 9.04 | 136,681 | 0.10 | ||||||||||||||||||||
|
Granted
|
702,000 | 2.30 | - | - | ||||||||||||||||||||
|
Exercised
|
(12,550 | ) | 0.10 | $ | 19,000 | - | - | |||||||||||||||||
|
Cancelled
|
(74,767 | ) | 12.48 | - | - | |||||||||||||||||||
|
Forfeited
|
(51,775 | ) | 16.45 | - | - | |||||||||||||||||||
|
Options outstanding—December 31, 2009
|
1,638,666 | 5.83 | 136,681 | 0.10 | ||||||||||||||||||||
|
Granted
|
230,000 | 2.27 | - | - | ||||||||||||||||||||
|
Forfeited
|
(458 | ) | 9.54 | - | - | |||||||||||||||||||
| Options outstanding—December 31, 2010 | 1,868,208 | $ | 5.39 | $ | (3,048,000 | ) | 136,681 | $ | 0.10 | $ | 500,000 | |||||||||||||
|
Vested and expected to vest—December 31, 2010
|
1,868,208 | $ | 5.39 | $ | (3,048,000 | ) | 136,681 | $ | 0.10 | $ | 500,000 | |||||||||||||
F-17
The Company utilized the Black-Scholes option valuation model to calculate the fair value of the options granted or modified during the years ended December 31, 2010, 2009 and 2008 utilizing the following weighted-average assumptions:
|
2010
|
2009
|
2008
|
||||||||||
|
Risk-free interest rate
|
2.4 | % | 2.3 | % | 3.3 | % | ||||||
|
Volatility
|
48.2 | % | 51.8 | % | 50.7 | % | ||||||
|
Dividend rate
|
None
|
None
|
None
|
|||||||||
|
Life in years
|
4.9 | 5.0 | 6.5 | |||||||||
The risk-free interest rate is based upon the U.S. Treasury yield curve in effect at the time of grant for periods corresponding with the expected life of the options. The expected volatility rate is based on companies of similar growth and maturity and the Company's peer group in the industry in which it does business. The dividend rate assumption is excluded from the calculation, as the Company intends to retain all earnings. The expected life of the Company's stock options represents management's best estimate based upon historical and expected trends in the Company's stock option activity.
The vesting activity for the 2006 Plan and 2003 Plan is summarized below:
|
Time-Vesting Options
|
Performance-Vesting Options
|
|||||||||||||||||||||||||
|
|
|
Weighted-Average |
|
Weighted-Average
|
|
|||||||||||||||||||||
|
Vested and
Exercisable
|
Aggregate
Exercise
Price
|
Exercise
Price
|
Remaining
Contractual
Life
|
Aggregate
Intrinsic
Value
|
Vested and
Exercisable
|
Aggregate
Exercise
Price
|
Exercise
Price
|
Remaining
Contractual
Life
|
Aggregate
Intrinsic
Value
|
|||||||||||||||||
|
January 1, 2008
|
475,572 | $ | 1,393,000 | 136,681 | $ | 14,000 | ||||||||||||||||||||
|
Vested
|
265,771 | 2,419,000 | - | - | ||||||||||||||||||||||
|
Exercised
|
(102,584 | ) | (10,000 | ) | - | - | ||||||||||||||||||||
|
Forfeited
|
(1,000 | ) | (9,500 | ) | - | - | ||||||||||||||||||||
|
December 31, 2008
|
637,759 | 3,792,500 | 136,681 | 14,000 | ||||||||||||||||||||||
|
Vested
|
187,736 | 2,210,000 | - | - | ||||||||||||||||||||||
|
Exercised
|
(12,550 | ) | (1,000 | ) | - | - | ||||||||||||||||||||
|
Forfeited
|
(51,775 | ) | (851,000 | ) | - | - | ||||||||||||||||||||
|
December 31, 2009
|
761,170 | 5,150,500 | 136,681 | 14,000 | ||||||||||||||||||||||
|
Vested
|
352,885 | 2,453,000 | - | - | ||||||||||||||||||||||
|
Forfeited
|
(458 | ) | (4,000 | ) | - | - | ||||||||||||||||||||
|
December 31, 2010
|
1,113,597 | $ | 7,599,500 |
$ 6.82
|
5.8 years
|
$ (3,412,000
|
) | 136,681 | $ | 14,000 |
$ 0.10
|
2.8 years
|
$ 500,000
|
|||||||||||||
As of December 31, 2010, the options outstanding under the 2006 Plan and 2003 Plan had exercise prices between $0.10 and $20.75 and the weighted-average remaining contractual life for all options was 6.7 years.
F-18
A summary of the weighted-average grant date fair value of the non-vested stock option awards is presented in the table below:
|
Number
of Options
|
Weighted-
Average
Grant Date
Fair Value
|
|||||||
|
January 1, 2010
|
877,496 | $ | 2.53 | |||||
|
Vested
|
(352,885 | ) | 3.52 | |||||
|
Granted
|
230,000 | 1.01 | ||||||
|
December 31, 2010
|
754,611 | 1.60 | ||||||
The total fair value of options that vested during the years ended December 31, 2010, 2009 and 2008 was $1.2 million, $1.1 million and $2.5 million, respectively.
As of December 31, 2010, total unrecognized estimated compensation cost related to non-vested stock options was approximately $1.2 million, which is expected to be recognized over a weighted-average period of approximately 2.3 years. There were no exercises of stock options during the year ended December 31, 2010. The Company recorded approximately $1,000 of cash received from the exercise of 12,550 stock options during the year ended December 31, 2009 and issued 12,550 of new shares of common stock.
The Company recognized $1.2 million, $1.2 million and $2.4 million of pre-tax non-cash share-based compensation expense for the years ended December 31, 2010, 2009 and 2008, respectively. Non-cash share-based compensation cost of $78,000 was a component of cost of sales and $1.1 million was a component of selling, general and administrative expenses in the accompanying consolidated statement of operations for the year ended December 31, 2010. Non-cash share-based compensation cost of $70,000 was a component of cost of sales and $1.1 million was a component of selling, general and administrative expenses in the accompanying consolidated statement of operations for the year ended December 31, 2009. Non-cash share-based compensation cost of $116,000 was a component of cost of sales and $2.3 million was a component of selling, general and administrative expenses in the accompanying consolidated statement of operations for the year ended December 31, 2008. The Company recognized related tax benefits of $507,000, $474,000 and $1.0 million for the years ended December 31, 2010, 2009 and 2008, respectively. The Company capitalized into inventory non-cash share-based compensation expense of $79,000, $69,000 and $116,000 for the years ended December 31, 2010, 2009 and 2008, respectively.
Excess tax benefits exist when the tax deduction resulting from the exercise of options exceeds the compensation cost recorded. The cash flows resulting from such excess tax benefits, if any, are classified as financing cash flows. Under ASC 718, the Company has classified excess tax benefits of $45,000 for the year ended December 31, 2008. There were no excess tax benefits for the years ended December 31, 2010 and 2009.
10. RELATED PARTY TRANSACTIONS
On September 4, 2009, Physicians entered into an agreement for a second-priority senior secured bridge loan facility with Mill Road in the amount of $4.2 million. See Note 6 for a description of the related party bridge loan. Based on a schedule filed by Mill Road with the Securities and Exchange Commission on March 11, 2009, Mill Road is the beneficial owner of approximately 18% of the Company’s outstanding common stock. On November 6, 2009, the related party bridge loan was repaid using proceeds from the issuance of a new senior subordinated note as described below. Interest expense, which was also paid during 2009, related to the related party bridge loan totaled $107,000 for the year ended December 31, 2009.
On November 6, 2009, Physicians issued a new Senior Subordinated Note to Mill Road in an aggregate principal amount equal to $8.0 million. Physicians used a portion of the proceeds to repay in full amounts outstanding under its related party bridge loan. The new Senior Subordinated Note, as amended, is scheduled to mature on November 6, 2014 and accrues interest at 14% per annum, with 10% per annum payable in cash monthly in arrears on the first day of each calendar month and 4% payable in kind with annual compounding on the first day of each calendar year. The Company paid closing fees to Mill Road of $222,000 in connection with the issuance of the new Senior Subordinated Note, and the amendments thereto. Interest expense related to the new Senior Subordinated Note totaled approximately $1.3 million and $236,000 for the years ended December 31, 2010 and 2009, respectively, of which $70,000 and $236,000 was included in accrued expenses in the accompanying consolidated balance sheet as of December 31, 2010 and 2009, respectively.
In addition, as required by the new Senior Subordinated Note, on April 30, 2010, the Company entered into a Common Stock Purchase Warrant Agreement with Mill Road pursuant to which warrants were issued entitling Mill Road to purchase 650,000 shares of the Company's common stock. The warrants have an exercise price equal to $0.25 per share and expire on April 30, 2017. Upon issuance of the warrants, Mill Road beneficially owned 2,516,943 shares of the Company's common stock and warrants to purchase 650,000 shares of common stock, representing aggregate beneficial ownership of 3,166,943 shares (approximately 22%) of the Company's common stock.
F-19
11. EMPLOYEE BENEFITS
The Company has a defined contribution plan under section 401(k) of the Internal Revenue Code. The plan provides for employee contributions as well as employer matching contributions and is available to eligible participants, as defined in the plan agreement. Participant contributions are matched at 100% of each dollar contributed by the participant up to 5% of a participant’s eligible salary. Matching contributions vest immediately. Matching contributions are included in selling, general and administrative expenses in the accompanying consolidated statements of operations and totaled $334,000, $287,000 and $358,000 for the years ended December 31, 2010, 2009 and 2008, respectively.
The Company’s Deferred Compensation Plans provide certain employees the option to defer a portion of their compensation. Investments have been purchased that may be used to fund the Deferred Compensation Plans. These investments are included in other assets (see Note 4) and the related liabilities are included in other long-term liabilities in the accompanying consolidated balance sheets.
12. INCOME TAXES
The components of the benefit for income taxes for the years ended December 31, 2010, 2009 and 2008, are as follows (dollars in thousands):
|
2010
|
2009
|
2008
|
||||||||||
|
Current:
|
||||||||||||
|
Federal
|
$ | (448 | ) | $ | (1,351 | ) | $ | 5,270 | ||||
|
State
|
(44 | ) | 59 | 540 | ||||||||
|
Total current
|
(492 | ) | (1,292 | ) | 5,810 | |||||||
|
Deferred:
|
||||||||||||
|
Federal
|
31 | (705 | ) | (8,079 | ) | |||||||
|
State
|
(242 | ) | (620 | ) | (2,425 | ) | ||||||
|
Total deferred
|
(211 | ) | (1,325 | ) | (10,504 | ) | ||||||
|
Total benefit for income taxes
|
$ | (703 | ) | $ | (2,617 | ) | $ | (4,694 | ) | |||
The major components of the deferred income tax assets and liabilities at December 31, 2010 and 2009, are as follows (dollars in thousands):
|
2010
|
2009
|
|||||||
|
Sales returns reserve
|
$ | 3,961 | $ | 4,022 | ||||
|
Stock options
|
3,193 | 2,923 | ||||||
|
Inventories
|
2,977 | 4,605 | ||||||
|
Accrued expenses
|
672 | 457 | ||||||
|
Other
|
1,074 | 1,158 | ||||||
|
Deferred income tax assets
|
11,877 | 13,165 | ||||||
|
Trade names
|
(4,622 | ) | (4,941 | ) | ||||
|
Distributor relationships
|
(5,633 | ) | (6,493 | ) | ||||
|
Patents
|
(1,462 | ) | (1,781 | ) | ||||
|
Other
|
(1,249 | ) | (918 | ) | ||||
|
Deferred income tax liabilities
|
(12,966 | ) | (14,133 | ) | ||||
|
Total
|
$ | (1,089 | ) | $ | (968 | ) | ||
F-20
The major elements contributing to the difference between the benefit for income taxes based on the federal statutory rate and the effective tax rate for the years ended December 31, 2010, 2009 and 2008, are as follows (dollars in thousands):
|
2010
|
2009
|
2008
|
||||||||||
|
Benefit for income taxes–based on statutory rate
|
$ | (49 | ) | $ | (2,216 | ) | $ | (8,562 | ) | |||
|
State income taxes, less effects of federal benefit
|
(219 | ) | (437 | ) | (1,223 | ) | ||||||
| Domestic production activities deduction | (40 | ) | - | (57 | ) | |||||||
|
Goodwill and trade name impairment
|
- | - | 5,708 | |||||||||
| Stock option cancellations | 1 | 207 | - | |||||||||
|
Charitable contributions
|
(53 | ) | (24 | ) | (348 | ) | ||||||
|
Meals and entertainment
|
13 | 13 | 28 | |||||||||
|
Research and development credits
|
(126 | ) | (94 | ) | (164 | ) | ||||||
|
True-up of permanent items, including impact of federal graduated rate
|
(231 | ) | (33 | ) | (14 | ) | ||||||
|
Other
|
1 | (33 | ) | (62 | ) | |||||||
|
Benefit for income taxes–based on effective tax rate
|
$ | (703 | ) | $ | (2,617 | ) | $ | (4,694 | ) | |||
At December 31, 2010 and 2009, the Company's liability for uncertain tax positions were $228,000 and $385,000, respectively, and were recorded in other long-term liabilities. The decrease in unrecognized tax benefits during the year ended December 31, 2010 was primarily attributable to the statute of limitations closing on prior year state tax returns. These unrecognized tax benefits would reduce the Company's effective tax rate if recognized. The Company believes it is reasonably possible that approximately $175,000 of these benefits associated with certain state tax filing positions will be recognized upon the expiration of the statute of limitations in various jurisdictions within the next twelve months.
The following is a rollforward of the Company’s unrecognized tax benefits from January 1, 2008 to December 31, 2010 (in thousands):
|
2010
|
2009
|
2008
|
||||||||||
|
Balance - beginning of year
|
$ | 294 | $ | 365 | $ | - | ||||||
|
Gross (decrease) increase - tax positions in prior period
|
- | - | 365 | |||||||||
|
Lapse of statute of limitations
|
(119 | ) | (71 | ) | - | |||||||
|
Balance - end of year
|
$ | 175 | $ | 294 | $ | 365 | ||||||
Interest and penalties related to unrecognized tax benefits are recorded in income tax expense. The Company had approximately $24,000 accrued for interest and $29,000 accrued for penalties at December 31, 2010. The Company had approximately $32,000 accrued for interest and $59,000 accrued for penalties at December 31, 2009. The Company released approximately $8,000 for interest and $30,000 for penalties during the year ended December 31, 2010. The Company released approximately $15,000 for interest and $11,000 for penalties during the year ended December 31, 2009. The Company recognized approximately $26,000 for interest and $70,000 accrual for penalties during the year ended December 31, 2008. The Company is subject to U.S. Federal income tax examinations for the 2007 through 2009 tax years, and is subject to state and local income tax examinations for the 2006 through 2009 tax years.
The Company believes that it is more likely than not that the deferred income tax assets of $11.9 million as of December 31, 2010 will be utilized. In arriving at this conclusion the Company is relying on both the reversal of deferred income tax liabilities and the projection of future taxable income from operations. Of the deferred income tax liabilities, approximately $8.3 million are scheduled to reverse with the appropriate attributes sufficient to utilize the deferred income tax assets recognized as of December 31, 2010. If the Company's projected taxable income from operations in future years exceeds $12.3 million, it will be able to utilize the remaining deferred income tax assets of $3.6 million. The Company evaluates all positive and negative evidence when projecting future taxable income from operations and give more weight to evidence that is objectively verifiable, including its historical three-year cumulative taxable income. Management believes that it is more likely than not that the Company will exceed these requirements.
At December 31, 2010, the Company had net operating loss carryforwards of approximately $3.7 million for state tax purposes that will expire in 5 to 20 years.
F-21
13. GEOGRAPHIC INFORMATION
Geographic revenue information is based on the location of the customer. All of the Company's assets are located in the U.S. and Canada. The Company has total assets of $2.1 million located in Canada, or 2.1% of the Company's total assets, including approximately $830,000 of retail permanent fixtures, which are classified in other assets on the accompanying consolidated balance sheet as of December 31, 2010. The Company had total assets of $1.3 million located in Canada, or 1.2% of the Company's total assets, including approximately $285,000 of retail permanent fixtures, which are classified in other assets on the accompanying consolidated balance sheet as of December 31, 2009. Net sales to unaffiliated customers by geographic region are as follows (in thousands):
|
Years Ended December 31,
|
||||||||||||
|
2010
|
2009
|
2008
|
||||||||||
|
United States
|
$ | 67,556 | $ | 68,682 | $ | 98,661 | ||||||
|
Canada
|
10,440 | 8,594 | 14,594 | |||||||||
|
Australia and other
|
527 | 520 | 777 | |||||||||
| $ | 78,523 | $ | 77,796 | $ | 114,032 | |||||||
14. QUARTERLY RESULTS OF OPERATIONS (UNAUDITED)
The following is a summary of the unaudited quarterly results of operations (in thousands, except per share data):
|
1st Quarter
|
2nd Quarter
|
3rd Quarter
|
4th Quarter
|
|||||||||||||
|
2010
|
||||||||||||||||
|
Net sales
|
$ | 22,966 | $ | 20,761 | $ | 14,335 | $ | 20,461 | ||||||||
|
Gross profit
|
9,971 | 10,984 | 6,781 | 7,883 | ||||||||||||
|
Net income (loss)
|
520 | 1,366 | (420 | ) | (908 | ) | ||||||||||
|
Net income (loss) per common share:
|
||||||||||||||||
|
Basic
|
0.04 | 0.10 | (0.03 | ) | (0.07 | ) | ||||||||||
|
Diluted
|
0.04 | 0.09 | (0.03 | ) | (0.07 | ) | ||||||||||
|
2009
|
||||||||||||||||
|
Net sales
|
$ | 20,174 | $ | 21,051 | $ | 14,230 | $ | 22,341 | ||||||||
|
Gross profit
|
9,743 | 12,831 | 6,457 | 5,423 | ||||||||||||
|
Net (loss) income
|
(1,714 | ) | 591 | (302 | ) | (2,478 | ) | |||||||||
|
Net (loss) income per common share:
|
||||||||||||||||
|
Basic
|
(0.13 | ) | 0.04 | (0.02 | ) | (0.18 | ) | |||||||||
|
Diluted
|
(0.13 | ) | 0.04 | (0.02 | ) | (0.18 | ) | |||||||||
In the fourth quarter of fiscal 2010, the Company recorded a pre-tax charge of $455,000 to correct its previously recognized excess and obsolete inventory provision, all of which related to fiscal 2009. This charge reduced net income in fiscal 2010 by $275,000, or $0.02 per diluted share, on the Company's consolidated statement of operations, and decreased inventory by $455,000 on the Company's consolidated balance sheet. The Company determined this charge to be immaterial to its prior periods and current year consolidated financial statements.
During the second quarter of 2009, the Company recorded a non-cash impairment charge to trade names of $1.1 million.
F-22
SIGNATURES
Pursuant to the requirements of Section 13 or 15(d) of the Securities Exchange Act of 1934, the registrant has duly caused this report to be signed on its behalf by the undersigned, thereunto duly authorized on March 11, 2011.
|
PHYSICIANS FORMULA HOLDINGS, INC.
|
||
|
/s/ INGRID JACKEL
|
||
|
By:
|
Ingrid Jackel
|
|
|
Its:
|
Chief Executive Officer
|
|
Pursuant to the requirements of the Securities Exchange Act of 1934, this report has been signed by the following persons on behalf of the registrant and in the capacities indicated below on March 11, 2011.
|
Signatures
|
Capacity
|
|
|
/s/ INGRID JACKEL
|
Chief Executive Officer (principal executive officer) and Director
|
|
|
Ingrid Jackel
|
|
|
|
/s/ JEFF M. BERRY
|
Chief Financial Officer (principal financial and accounting officer)
|
|
|
Jeff M. Berry
|
|
|
|
/s/ JEFFREY P. ROGERS
|
President and Director
|
|
|
Jeff Rogers
|
||
|
/s/ ZVI EIREF
|
Director
|
|
|
Zvi Eiref
|
||
|
/s/ PADRAIC SPENCE
|
Director
|
|
|
Padraic Spence
|
||
|
/s/ CHARLES J. HINKATY
|
Director
|
|
|
Charles J. Hinkaty
|
||
| /s/ THOMAS E. LYNCH | Director | |
| Thomas E. Lynch |
EXHIBIT INDEX
|
Exhibit Number
|
Description
|
|
|
3.1
|
Amended and Restated Certificate of Incorporation of the Registrant. (2)
|
|
|
3.2
|
Amended and Restated By-laws of the Registrant. (2)
|
|
|
4.1
|
Specimen Common Stock Certificate. (1)
|
|
| 10.1 |
First Amendment to Credit Agreement, dated July 8, 2008, by and among Physicians Formula, Inc., the several banks and other lenders from time to time to the Credit Agreement and Union Bank of California, N.A., as administrative agent. (3)
|
|
| 10.2 |
Second Amendment to Credit Agreement, dated September 9, 2008, by and among Physicians Formula, Inc., the several banks and other lenders from time to time to the Credit Agreement and Union Bank of California, N.A., as administrative agent. (4)
|
|
| 10.3 |
Third Amendment to Credit Agreement, dated December 5, 2008, by and among Physicians Formula, Inc., the several banks and other lenders from time to time parties to the Credit Agreement and Union Bank of California, N.A., as administrative agent. (5)
|
|
|
10.4*
|
Amended and Restated Employment Agreement, dated as of May 6, 2008, by and between the Registrant and Ingrid Jackel. (6)
|
|
|
10.5*
|
Amended and Restated Employment Agreement, dated as of May 6, 2008, by and between the Registrant and Jeff Rogers. (6)
|
|
|
10.6*
|
Amended and Restated Employment Agreement, dated as of May 6, 2008, by and between the Registrant and Joseph J. Jaeger. (6)
|
|
|
10.7*
|
2003 Stock Option Plan. (1)
|
|
|
10.8*
|
Amended and Restated 2006 Equity Incentive Plan. (6)
|
|
|
10.9*
|
Stock Option Agreement (Time Vesting), dated as of November 3, 2003, by and between the Registrant and Ingrid Jackel. (1)
|
|
|
10.10*
|
Stock Option Agreement (Time Vesting), dated as of November 3, 2003, by and between the Registrant and Jeff Rogers. (1)
|
|
|
10.11*
|
Amended and Restated Stock Option Agreement, dated November 14, 2006, by and between the Registrant and Ingrid Jackel. (2)
|
|
|
10.12*
|
Amended and Restated Stock Option Agreement, dated November 14, 2006, by and between the Registrant and Jeff Rogers. (2)
|
|
|
10.13*
|
Stock Option Agreement (Time Vesting), dated as of March 8, 2004, by and between the Registrant and Joseph J. Jaeger. (1)
|
|
| 10.14* |
Amended and Restated Stock Option Agreement, dated November 14, 2006, by and between the Registrant and Joseph J. Jaeger. (2)
|
|
| 10.15* |
Protection of Trade Secrets, Nonsolicitation and Confidentiality Agreement, dated as of November 3, 2003, by and between Physicians Formula, Inc. and Ingrid Jackel. (1)
|
|
| 10.16* |
Protection of Trade Secrets, Nonsolicitation and Confidentiality Agreement, dated as of November 3, 2003, by and between Physicians Formula, Inc. and Jeff Rogers. (1)
|
|
| 10.17* |
Protection of Trade Secrets, Nonsolicitation and Confidentiality Agreement, dated as of March 8, 2004, by and between Physicians Formula, Inc. and Joseph J. Jaeger. (1)
|
|
| 10.18 |
Letter Agreement, dated as of November 3, 2003, by and between Physicians Formula, Inc. and Pierre Fabre Dermo-Cosmetique. (1)
|
|
| 10.19* |
2005 Nonqualified Deferred Compensation Plan, effective as of January 1, 2005, as amended and restated on December 30, 2008.
|
|
| 10.20* |
Nonqualified Deferred Compensation Plan, effective as of December 1, 1999. (1)
|
|
| 10.21* |
Director Indemnification Agreement dated April 24, 2009, by and between the Registrant and Padraic Spence (pursuant to Instruction 2 to Item 601 of Regulation S-K, the Director Indemnification Agreements, which are substantially identical in all material respects, except as to the parties thereto and the dates, between the Registrant and the following individuals, were not filed: Ingrid Jackel, Jeffrey P. Rogers, Zvi Eiref and Charles J. Hinkaty) (16).
|
|
| 10.22* |
Form of option award agreement for awards under Amended and Restated 2006 Equity Incentive Plan. (1)
|
|
| 10.23* |
Form of restricted stock agreement for awards under Amended and Restated 2006 Equity Incentive Plan. (1)
|
|
| 10.24* |
Form of non-qualified option award agreement for Ingrid Jackel, Jeff Rogers and Joseph J. Jaeger under Amended and Restated 2006 Equity Incentive Plan. (8)
|
|
| 10.25* |
2007 Bonus Plan. (7)
|
|
| 10.26* |
Form of performance award for 2008 under Amended and Restated 2006 Equity Incentive Plan. (6)
|
|
| 10.27* |
Stock Repurchase Instruction, dated September 12, 2008, between the registrant and Deutsche Bank Securities, Inc. (9)
|
|
| 10.28 | Fourth Amendment to Credit Agreement, dated March 30, 2009, by and among Physicians Formula, Inc., the several banks and other lender from time to time parties to the Credit Agreement and Union Bank, N.A., as administrative agent. (11) | |
| 10.29 | Fifth Amendment to Credit Agreement, dated July 29, 2009, by and among Physicians Formula, Inc., the several banks and other lenders from time to time parties to the Credit Agreement and Union Bank, N.A., as administrative agent. (12) | |
| 10.30 | Term Loan Agreement, dated as of September 4, 2009, between Physicians Formula, Inc., as borrower, and Mill Road Capital, L.P., as lender. (13) | |
| 10.31 | Term Note, dated as of September 4, 2009, by Physicians Formula, Inc., in favor of Mill Road Capital, L.P. (13) | |
| 10.32 | Security Agreement, dated as of September 4, 2009, by Physicians Formula, Inc. and subsidiaries of Physicians Formula, Inc. party thereto, in favor of Mill Road Capital, L.P. (13) | |
| 10.33 | Pledge Agreement, dated as of September 4, 2009, by Physicians Formula Holdings, Inc., in favor of Mill Road Capital, L.P. (13) | |
| 10.34 | Intercreditor and Subordination Agreement, dated as of September 4, 2009, by and among Mill Road Capital, L.P., Physicians Formula, Inc., Physicians Formula Holdings, Inc., the subsidiaries of Physicians Formula, Inc. party thereto and Union Bank, N.A., as administrative agent. (13) | |
| 10.35 | Sixth Amendment to Credit Agreement, dated as of September 4, 2009, by and among Physicians Formula, Inc., the several banks and other lenders from time to time parties to the Credit Agreement and Union Bank, N.A., as administrative agent. (13) | |
| 10.36 | Pledgor Guarantee, dated as of September 4, 2009, by Physicians Formula Holdings, Inc. in favor of Mill Road Capital, L.P. (13) | |
| 10.37 | Subsidiary Guarantee, dated as of September 4, 2009, by the subsidiaries of Physicians Formula, Inc. party thereto, in favor of Mill Road Capital, L.P. (13) | |
| 10.38 | Credit and Security Agreement, dated as of November 6, 2009, by and among Physicians Formula, Inc. and Wells Fargo Bank, National Association, acting through its Wells Fargo Business Credit operating division. (14) | |
| 10.39 | Revolving Note, dated as of November 6, 2009, by Physicians Formula, Inc., in favor of Wells Fargo Bank, National Association, acting through its Wells Fargo Business Credit operating division. (14) |
E-1
|
Exhibit Number
|
Description
|
|
| 10.40 | Continuing Guaranty, dated as of November 6, 2009, by Physicians Formula Holdings, Inc. to Wells Fargo Bank, National Association. (14) | |
| 10.41 | Continuing Guaranty, dated as of November 6, 2009, by Physicians Formula Cosmetics, Inc. to Wells Fargo Bank, National Association. (14) | |
| 10.42 | Continuing Guaranty, dated as of November 6, 2009, by Physicians Formula DRTV, LLC to Wells Fargo Bank, National Association. (14) | |
| 10.43 | Security Agreement, dated as of November 6, 2009, between Physicians Formula Holdings, Inc. and Wells Fargo Bank, National Association. (14) | |
| 10.44 | Security Agreement, dated as of November 6, 2009, between Physicians Formula Cosmetics, Inc. and Wells Fargo Bank, National Association. (14) | |
| 10.45 | Security Agreement, dated as of November 6, 2009, between Physicians Formula DRTV, LLC and Wells Fargo Bank, National Association. (14) | |
| 10.46 | General Security Agreement, dated as of November 6, 2009, by Physicians Formula, Inc. to and in favor of Wells Fargo Bank, National Association, acting through its Wells Fargo Business Credit operating division. (14) | |
| 10.47 | Senior Subordinated Note Purchase and Security Agreement, dated as of November 6, 2009, among Physicians Formula, Inc., as borrower, the guarantors party thereto and Mill Road Capital, L.P. (14) | |
| 10.48 | Senior Subordinated Note, dated as of November 6, 2009, by Physicians Formula, Inc., in favor of Mill Road Capital, L.P. (14) | |
| 10.49 | Guarantor Security Agreement, dated as of November 6, 2009, by and among Physicians Formula Holdings, Inc., Physicians Formula Cosmetics, Inc., Physicians Formula DRTV, LLC and Mill Road Capital, L.P. (14) | |
| 10.50 | Intercreditor Agreement, dated as of November 6, 2009, by and among Wells Fargo Bank, National Association, acting through its Wells Fargo Business Credit operating division, Mill Road Capital, L.P., Physicians Formula, Inc. and the guarantors party thereto. (14) | |
| 10.51 | First Amendment to Senior Subordinated Note Purchase and Security Agreement, dated as of February 3, 2010, by and among Physicians Formula, Inc., as borrower, the guarantors named therein and Mill Road Capital, L.P., as lender. (15) | |
| 10.52 | Second Amendment to Senior Subordinated Note Purchase and Security Agreement, dated April 30, 2010, by and among Physicians Formula, Inc., as borrower, Physicians Formula Holdings, Inc., as guarantor, and Mill Road Capital, L.P., as lender. (17) | |
| 10.53 | Common Stock Purchase Warrant, dated April 20, 2010, between Physicians Formula Holdings, Inc. and Mill Road Capital, L.P. (17) | |
| 10.54 | Third Amendment to Senior Subordinated Note Purchase and Security Agreement, dated June 3, 2010, by and among Physicians Formula, Inc., as borrower, the guarantors named therein and Mill Road Capital, L.P., as lender. (18) | |
| 10.55 | First Amendment to the Credit and Security Agreement, dated as of June 29, 2010, by and among Physicians Formula, Inc. and Wells Fargo Bank, National Association, acting through its Wells Fargo Business Credit operating division. (19) | |
| 10.56 | Amendment to the Credit and Security Agreement, dated December 21, 2010, by and among Physicians Formula, Inc. and Wells Fargo Bank, National Association, acting through its Wells Fargo Business Credit operating division. | |
| 10.57 | Second Amendment to Credit and Security Agreement, dated as of February 28, 2011, by and among Physicians Formula, Inc. and Wells Fargo Bank, National Association, acting through its Wells Fargo Business Credit operating division. (20) | |
| 10.58 | Fourth Amendment to Senior Subordinated Note Purchase and Security Agreement, dated as of February 28, 2011, by and among Physicians Formula, Inc., as borrower, the guarantors named therein and Mill Road Capital, L.P., as lender. (20) | |
| 21.1 |
Subsidiaries of the Registrant. (10)
|
|
| 23.1 |
Consent of Deloitte & Touche LLP.
|
|
| 31.1 |
Certification by Ingrid Jackel, Chief Executive Officer.
|
|
| 31.2 |
Certification by Jeff M. Berry, Interim Chief Financial Officer.
|
|
| 32.1 |
Certification Pursuant to 18 U.S.C. Section 1350, as adopted pursuant to Section 906 of the Sarbanes-Oxley Act of 2002.
|
|
| 32.2 |
Certification Pursuant to 18 U.S.C. Section 1350, as adopted pursuant to Section 906 of the Sarbanes-Oxley Act of 2002.
|
| ________________________ |
| (1) |
Filed as an exhibit to Amendment No. 5 to the Registrant’s Registration Statement on Form S-1 (File No. 333-136913) filed on November 7, 2006 and incorporated herein by reference.
|
|
| (2) |
Filed as an exhibit to the Registrant’s Form 10-Q (File No. 001-33142) for the period ended September 30, 2006 and incorporated herein by reference.
|
|
| (3) |
Filed as an exhibit to the Registrant’s Form 8-K (File No. 001-33142) filed on July 10, 2008 and incorporated by reference herein.
|
|
| (4) |
Filed as an exhibit to the Registrant’s Form 8-K (File No. 001-33142) filed on September 12, 2008 and incorporated by reference herein.
|
|
| (5) |
Filed as an exhibit to the Registrant’s Form 8-K (File No. 001-33142) filed on December 8, 2008 and incorporated by reference herein.
|
|
| (6) |
Filed as an exhibit to the Registrant’s Form 8-K (File No. 001-33142) filed on May 8, 2008 and incorporated by reference herein.
|
|
| (7) |
Filed as an exhibit to the Registrant’s Form 8-K (File No. 001-33142) filed on March 12, 2007 and incorporated by reference herein.
|
|
| (8) |
Filed as an exhibit to the Registrant’s Form 10-K (File No. 001-33142) for the year ended December 31, 2006 and incorporated herein by reference.
|
|
| (9) |
Filed as an exhibit to the Registrant’s Form 10-Q (File No. 001-33142) for the period ended September 30, 2008 and incorporated herein by reference.
|
|
| (10) |
Filed as an exhibit to the Registrant’s Registration Statement on Form S-1 (File No. 333-141678) and incorporated herein by reference.
|
|
| (11) |
Filed as an exhibit to the Registrant's Form 8-K (File No. 001-33142) filed on March 31, 2009 and incorporated by reference herein.
|
|
| (12) | Filed as an exhibit to the Registrant's Form 8-K (File No. 001-33142) filed on August 4, 2009 and incorporated by reference herein. | |
| (13) | Filed as an exhibit to the Registrant's Form 8-K (File No. 001-33142) filed on September 11, 2009 and incorporated by reference herein. | |
| (14) | Filed as an exhibit to the Registrant's Form 10-Q (File No. 001-33142) for the period ended September 30, 2009 and incorporated herein by reference. | |
| (15) | Filed as an exhibit to the Registrant's Form 8-K (File No. 001-33142) filed on February 4, 2010 and incorporated by reference herein. | |
| (16) | Filed as an exhibit to the Registrant's Form 10-K (File No. 001-33142) for the year ended December 31, 2009 and incorporated herein by reference. | |
| (17) | Filed as an exhibit to the Registrant's Form 8-K (File No. 001-33142) filed on May 3, 2010 and incorporated by reference herein. | |
| (18) | Filed as an exhibit to the Registrant's Form 8-K (File No. 001-33142) filed on June 8, 2010 and incorporated by reference herein. | |
| (19) | Filed as an exhibit to the Registrant's Form 8-K (File No. 001-33142) filed on July 6, 2010 and incorporated by reference herein. | |
| (20) | Filed as an exhibit to the Registrant's Form 8-K (File No. 001-33142) filed on March 3, 2011 and incorporated by reference herein. | |
| * |
Indicates management contract or compensatory plan or arrangement.
|
E-2