Attached files
| file | filename |
|---|---|
| EX-23 - EXHIBIT 23 - NATIONAL BANKSHARES INC | ex23.htm |
| EX-32.1 - EXHIBIT 32.1 - NATIONAL BANKSHARES INC | ex32i.htm |
| EX-31.1 - EXHIBIT 31.1 - NATIONAL BANKSHARES INC | ex31i.htm |
| EX-31.2 - EXHIBIT 31.2 - NATIONAL BANKSHARES INC | ex31ii.htm |
| EX-32.2 - EXHIBIT 32.2 - NATIONAL BANKSHARES INC | ex32ii.htm |
UNITED STATES
SECURITIES AND EXCHANGE COMMISSION
Washington, D.C. 20549
FORM 10-K
|
[x] Annual Report Pursuant to Section 13 or 15(d) of the Securities Exchange Act of 1934
|
|
For the Fiscal Year Ended December 31, 2010
|
|
[ ] Transition Report Pursuant to Section 13 or 15(d) of the Securities Exchange Act of 1934
|
For the transition period from ________ to ________.
Commission File Number: 0-15204
NATIONAL BANKSHARES, INC.
(Exact name of registrant as specified in its charter)
|
Virginia
(State of incorporation)
|
54-1375874
(I.R.S. Employer Identification No.)
|
101 Hubbard Street
P.O. Box 90002
Blacksburg, VA 24062-9002
(540) 951-6300
(Address and telephone number of principal executive offices)
|
Securities registered pursuant to Section 12(b) of the Act:
None
|
Securities registered Pursuant to Section 12(g) of the Act:
Common Stock, Par Value $1.25 per share
|
Indicate by check mark if the registrant is a well-known seasoned issuer, as defined in Rule 405 of the Securities Act. Yes [ ] No [x]
Indicate by check mark if the registrant is not required to file reports pursuant to Section 13 or Section 15(d) of the Act. Yes [ ] No [x]
Indicate by check mark whether the registrant (1) has filed all reports required to be filed by Section 13 or 15(d) of the Securities Exchange Act of 1934 during the preceding 12 months (or for such shorter period that the registrant was required to file such reports), and (2) has been subject to such filing requirements for the past 90 days. Yes [x] No [ ]
Indicate by check mark whether the registrant has submitted electronically and posted on its corporate Website, if any, every Interactive Data File required to be submitted and posted pursuant to Rule 405 of Regulation S-T(§232.405 of this chapter) during the preceding 12 months (or for such period that the registrant was required to submit and post files). Yes [x] No [ ]
Indicate by check mark if disclosure of delinquent filers pursuant to Item 405 of Regulation S-K (§229.405 of this chapter) is not contained herein, and will not be contained, to the best of registrant’s knowledge, in definitive proxy or information statements incorporated by reference in Part III of this Form 10-K or any amendment to this Form 10-K. [x]
Indicate by check mark whether the registrant is a large accelerated filer, an accelerated filer, a non-accelerated filer or a smaller reporting company. See definition of “accelerated filer, large accelerated filer, and smaller reporting company” in Rule 12b-2 of the Exchange Act. (Check one):
Large accelerated filer [ ] Accelerated filer [x] Non-accelerated filer [ ] Smaller reporting company [ ]
Indicate by check mark whether the registrant is a shell company (as defined in Rule 12b-2 of the Act). Yes [ ] No [x]
The aggregate market value of the voting common stock of the registrant held by stockholders (not including voting common stock held by Directors, Executive Officers and Corporate Governance) on June 30, 2010 (the last business day of the most recently completed second fiscal quarter) was approximately $157,991,618. As of February 23, 2011, the registrant had 6,933,474 shares of voting common stock outstanding.
DOCUMENTS INCORPORATED BY REFERENCE
Portions of the following documents are incorporated herein by reference into the Part of the Form 10-K indicated.
|
Document
|
Part of Form 10-K into which incorporated
|
|
National Bankshares, Inc. 2010 Annual Report to Stockholders
|
Part II
|
|
National Bankshares, Inc. Proxy Statement for the 2011 Annual Meeting of Stockholders
|
Part III
|
Form 10-K
Index
|
Page
|
||
|
Item 1.
|
3
|
|
|
Item 1A.
|
8
|
|
|
Item 1B.
|
8
|
|
|
Item 2.
|
9
|
|
|
Item 3.
|
9
|
|
|
Item 4.
|
9
|
|
|
Item 5.
|
9
|
|
|
Item 6.
|
11
|
|
|
Item 7.
|
12
|
|
|
Item 7A.
|
30
|
|
|
Item 8.
|
31
|
|
|
Item 9.
|
67
|
|
|
Item 9A.
|
67
|
|
|
Item 9B.
|
68
|
|
|
Item 10.
|
68
|
|
|
Item 11.
|
68
|
|
|
Item 12.
|
69
|
|
|
Item 13.
|
69
|
|
|
Item 14.
|
69
|
|
|
Item 15.
|
70
|
|
|
71
|
||
|
76
|
2
$ in thousands, except per share data
History and Business
National Bankshares, Inc. (the Company or NBI) is a financial holding company that was organized in 1986 under the laws of Virginia and is registered under the Bank Holding Company Act of 1956. It conducts most of its operations through its wholly-owned community bank subsidiary, the National Bank of Blacksburg (NBB). It also owns National Bankshares Financial Services, Inc. (NBFS), which does business as National Bankshares Insurance Services and National Bankshares Investment Services.
The National Bank of Blacksburg
The National Bank of Blacksburg, which does business as National Bank, was originally chartered in 1891 as the Bank of Blacksburg. Its state charter was converted to a national charter in 1922 and it became the National Bank of Blacksburg. In 2004, NBB purchased Community National Bank of Pulaski, Virginia. In May, 2006, Bank of Tazewell County, a Virginia bank which since 1996 had also been a wholly-owned subsidiary of NBI, was merged with and into NBB.
NBB is community-oriented, and it offers a full range of retail and commercial banking services to individuals, businesses, non-profits and local governments from its headquarters in Blacksburg, Virginia and its twenty-four branch offices throughout southwest Virginia. NBB has telephone and internet banking and it operates twenty-five automated teller machines in its service area. Lending is focused at small and mid-sized businesses and at individuals. Loan types include commercial, agricultural, real estate, home equity and consumer. Merchant credit card services and business and consumer debit and credit cards are available. Deposit accounts offered include demand deposit accounts, money market deposit accounts, savings accounts and certificates of deposit. NBB offers other miscellaneous services normally provided by commercial banks, such as letters of credit, night depository, safe deposit boxes, travelers checks, utility payment services and automatic funds transfer. NBB conducts a general trust business that has wealth management and trust and estate services for individual and business customers.
At December 31, 2010, NBB had total assets of $1,018,622 and total deposits of $884,658. NBB’s net income for 2010 was $15,935, which produced a return on average assets of 1.62% and a return on average equity of 12.65%. Refer to Note 12 of the Notes to Consolidated Financial Statements for NBB’s risk-based capital ratios.
National Bankshares Financial Services, Inc.
In 2001, National Bankshares Financial Services, Inc. was formed in Virginia as a wholly-owned subsidiary of NBI. NBFS offers non-deposit investment products and insurance products for sale to the public. NBFS works cooperatively with Infinex Investments, Inc. to provide investments and with Bankers Insurance, LLC for insurance products. NBFS does not significantly contribute to NBI’s net income.
Operating Revenue
The percentage of total operating revenue attributable to each class of similar service that contributed 15% or more of the Company’s total operating revenue for the years ended December 31, 2010, 2009 and 2008 is set out in the following table.
|
Period
|
Class of Service
|
Percentage of
Total Revenues
|
|||
|
December 31, 2010
|
Interest and Fees on Loans
|
64.22
|
%
|
||
|
Interest on Investments
|
21.03
|
%
|
|||
|
December 31, 2009
|
Interest and Fees on Loans
|
63.38
|
%
|
||
|
Interest on Investments
|
21.62
|
%
|
|||
|
December 31, 2008
|
Interest and Fees on Loans
|
62.68
|
%
|
||
|
Interest on Investments
|
21.21
|
%
|
3
Market Area
The Company’s market area in southwest Virginia is made up of the counties of Montgomery, Giles, Pulaski, Tazewell, Wythe, Smyth and Washington. It includes the independent cities of Radford and Galax, and the portions of Carroll and Grayson Counties that are adjacent to Galax. The Company also serves those portions of Mercer County and McDowell County, West Virginia that are contiguous with Tazewell County, Virginia. Although largely rural, the market area is home to two major universities, Virginia Tech and Radford University, and to three community colleges. Virginia Tech, located in Blacksburg, Virginia, is the area’s largest employer and is the Commonwealth’s second largest university. A second state supported university, Radford University, is located nearby. State support for public colleges and universities, like Virginia Tech and Radford University, has been adversely affected by the recession and State budget considerations. As a result, the normally stable base of university employment is likely to be reduced. In recent years, Virginia Tech’s Corporate Research Center has brought a number of technology related companies to Montgomery County. However, the recession has slowed the growth of new jobs in the Center.
In addition to education, the market area has a diverse economic base, with manufacturing, agriculture, tourism, healthcare, retail and service industries all represented. Large manufacturing facilities in the region include Celanese Acetate, the largest employer in Giles County, and Volvo Heavy Trucks, the largest company in Pulaski County. Both of these firms have experienced layoffs within the past several years. During the past year, Volvo Heavy Trucks has begun to slowly re-hire some employees whose jobs were cut in the previous year in response to a rapid decline in the demand for trucks because of the economic downturn. Pulaski and Galax have in the past been centers for furniture manufacturing. However, this industry has been declining because of growing furniture imports and the loss of demand. Several furniture companies have gone out of business in the recent past. Tazewell County is largely dependent on the coal mining industry and on agriculture for its economic base. Coal production is a cyclical industry that was negatively affected by the economic decline. Montgomery County, Bluefield in Tazewell County and Abingdon in Washington County are regional retail centers and have facilities to provide basic health care for the region.
NBI’s market area offers the advantages of a good quality of life, scenic beauty, moderate climate and historical and cultural attractions. The region has some recent success attracting retirees, particularly from the Northeast and urban northern Virginia.
Because NBI’s market area is economically diverse and includes large public employers, it has historically avoided the most extreme effects of past economic downturns. However, because the current national and state economic problems have been severe and prolonged, most the Company’s market area is experiencing higher levels of unemployment and very slow economic growth. For the Company, the result is a higher number of loan defaults than its historical average and a lower loan demand.
Competition
The banking and financial services industry in NBI’s market area is highly competitive. The competitive business environment is a result of changes in regulation, changes in technology and product delivery systems and competition from other financial institutions as well as non-traditional financial services. NBB competes for loans and deposits with other commercial banks, credit unions, securities and brokerage companies, mortgage companies, insurance companies, retailers, automobile companies and other nonbank financial service providers. Many of these competitors are much larger in total assets and capitalization, have greater access to capital markets and offer a broader array of financial services than NBB. In order to compete, NBB relies upon a deep knowledge of its markets, a service-based business philosophy, personal relationships with customers, specialized services tailored to meet customers’ needs and the convenience of office locations. In addition, the bank is generally competitive with other financial institutions in its market area with respect to interest rates paid on deposit accounts, interest rates charged on loans and other service charges on loans and deposit accounts.
Organization and Employment
NBI, NBB and NBFS are organized in a holding company/subsidiary structure. Functions that serve both subsidiaries, including audit, compliance, loan review and human resources, are at the holding company level, and fees are charged to the respective subsidiary for those services.
At December 31, 2010, NBI employed 18 full time employees, NBB had 199 full time equivalent employees and NBFS had 3 full time employees.
Regulation, Supervision and Government Policy
NBI and NBB are subject to state and federal banking laws and regulations that provide for general regulatory oversight of all aspects of their operations. As a result of substantial regulatory burdens on banking, financial institutions like NBI and NBB are at a disadvantage to other competitors who are not as highly regulated, and NBI and NBB’s costs of doing business are accordingly higher. Legislative efforts to prevent a repeat of the 2008 financial crisis culminated in the Dodd-Frank Wall Street Reform Act of 2010. This legislation, together with existing and planned implementing regulations, has dramatically increased the regulatory burden on commercial banks. The burden falls disproportionately on community banks like NBB, which must devote a higher proportion of their human and other resources to compliance than do their larger competitors. The financial crisis has also heightened the examination focus by banking regulators, particularly on real estate related assets and commercial loans. In the current environment, the potential for additional laws and regulations that will impact the Company, as well as heightened examination standards with regard to asset quality, cannot be ruled out. The following is a brief summary of certain laws, rules and regulations that affect NBI and NBB.
4
National Bankshares, Inc.
NBI is a bank holding company qualified as a financial holding company under the Federal Bank Holding Company Act (BHCA), which is administered by the Board of Governors of the Federal Reserve System (the Federal Reserve). NBI is required to file an annual report with the Federal Reserve and may be required to furnish additional information pursuant to the BHCA. The Federal Reserve is authorized to examine NBI and its subsidiaries. With some limited exceptions, the BHCA requires a bank holding company to obtain prior approval from the Federal Reserve before acquiring or merging with a bank or before acquiring more than 5% of the voting shares of a bank unless it already controls a majority of shares.
The Bank Holding Company Act. Under the BHCA, a bank holding company is generally prohibited from engaging in nonbanking activities unless the Federal Reserve has found those activities to be incidental to banking. Bank holding companies also may not acquire more than 5% of the voting shares of any company engaged in nonbanking activities. Amendments to the BHCA that were included in the Gramm-Leach-Bliley Act of 1999 (see below) permitted any bank holding company with bank subsidiaries that are well-capitalized, well-managed and which have a satisfactory or better rating under the Community Reinvestment Act (see below) to file an election with the Federal Reserve to become a financial holding company. A financial holding company may engage in any activity that is (i) financial in nature (ii) incidental to a financial activity or (iii) complementary to a financial activity. Financial activities include insurance underwriting, securities dealing and underwriting and providing financial, investment or economic advising services. NBI is a financial holding company.
The Virginia Banking Act. The Virginia Banking Act requires all Virginia bank holding companies to register with the Virginia State Corporation Commission (the Commission). NBI is required to report to the Commission with respect to financial condition, operations and management. The Commission may also make examinations of any bank holding company and its subsidiaries and must approve the acquisition of ownership or control of more than 5% of the voting shares of any Virginia bank or bank holding company.
The Gramm-Leach-Bliley Act. The Gramm-Leach-Bliley Act (GLBA) permits significant combinations among different sectors of the financial services industry, allows for expansion of financial service activities by bank holding companies and offers financial privacy protections to consumers. GLBA preempts most state laws that prohibit financial holding companies from engaging in insurance activities. GBLA permits affiliations between banks and securities firms in the same holding company structure, and it permits financial holding companies to directly engage in a broad range of securities and merchant banking activities.
The Sarbanes-Oxley Act. The Sarbanes-Oxley Act (SOX) enacted major reforms of the federal securities laws intended to protect investors by improving the accuracy and reliability of corporate disclosures. It impacts all companies with securities registered under the Securities Exchange Act of 1934, including NBI. SOX creates increased responsibility for chief executive officers and chief financial officers with respect to the content of filings with the Securities and Exchange Commission. Section 404 of SOX and related Securities and Exchange Commission rules focused increased scrutiny by internal and external auditors on NBI’s systems of internal controls over financial reporting, which is designed to insure that those internal controls are effective in both design and operation. SOX sets out enhanced requirements for audit committees, including independence and expertise, and it includes stronger requirements for auditor independence and limits the types of non-audit services that auditors can provide. Finally, SOX contains additional and increased civil and criminal penalties for violations of securities laws.
Capital Requirements. The Federal Reserve has adopted risk-based capital guidelines that are applicable to NBI. The guidelines provide that the Company must maintain a minimum ratio of 8% of qualified total capital to risk-weighted assets (including certain off-balance sheet items, such as standby letters of credit). At least half of total capital must be comprised of Tier 1 capital, for a minimum ratio of Tier 1 capital to risk-weighted assets of 4%. In addition, the Federal Reserve has established minimum leverage ratio guidelines of 4% for banks that meet certain specified criteria. The leverage ratio is the ratio of Tier 1 capital to total average assets, less intangibles. NBI is expected to be a source of capital strength for its subsidiary bank, and regulators can undertake a number of enforcement actions against NBI if its subsidiary bank becomes undercapitalized. NBI’s bank subsidiary is well capitalized and fully in compliance with capital guidelines.
Bank regulators could choose to raise capital requirements for banking organizations beyond current levels. NBI is unable to predict if higher capital levels may be mandated in the future.
Emergency Economic Stabilization Act of 2008. On October 14, 2008, the U.S. Treasury announced the Troubled Asset Relief Program (TARP) under the Emergency Economic Stabilization Act of 2008. In the program, the Treasury was authorized to purchase up to $250 billion of senior preferred shares in qualifying U.S. banks, saving and loan associations and bank and savings and loan holding companies. The amount of TARP funds was later increased to $350 billion. The minimum subscription amount was 1% of risk-weighted assets and the maximum amount was the lesser of $25 billion or 3% of risk-weighted assets. NBI did not participate in TARP.
5
American Recovery and Reinvestment Act of 2009. The ARRA was enacted in 2009 and includes a wide range of programs to stimulate economic recovery. In addition, it also imposed new executive compensation and corporate governance obligations on TARP Capital Purchase Program recipients. Because NBI did not participate in TARP, it is not affected by these requirements.
Dodd-Frank Wall Street Reform and Consumer Protection Act. The Dodd-Frank Act was signed into law on July 21, 2010. Its wide ranging provisions affect all federal financial regulatory agencies and nearly every aspect of the American financial services industry. Among the provisions of the Dodd-Frank Act that directly impact the Company is the creation of an independent Consumer Financial Protection Bureau (CFPB), which has the ability to write rules for consumer protections governing all financial institutions. All consumer protection responsibility formerly handled by other banking regulators is consolidated in the CFPB. It will also oversee the enforcement of all federal laws intended to ensure fair access to credit. For smaller financial institutions such as NBI and NBB, the CFPB will coordinate its examination activities through their primary regulators.
The Dodd-Frank Act contains provisions designed to reform mortgage lending, which includes the requirement of additional disclosures for consumer mortgages. In addition, the Federal Reserve must issue new rules that will have the effect of limiting the fees charged to merchants by credit card companies for debit card transactions. The result of these rules will be to limit the amount of interchange fee income available to the Company. The Dodd-Frank Act also contains provisions that affect corporate governance and executive compensation.
Although the Dodd-Frank Act provisions themselves are extensive, the ultimate impact on the Company of this massive legislation is unknown. The Act provides that several federal agencies, including the Federal Reserve and the Securities and Exchange Commission, shall issue regulations implementing major portions of the legislation, and this process is ongoing.
The National Bank of Blacksburg
NBB is a national banking association incorporated under the laws of the United States, and the bank is subject to regulation and examination by the Office of the Comptroller of the Currency (OCC). NBB’s deposits are insured by the Federal Deposit Insurance Corporation (FDIC) up to the limits of applicable law. The OCC, as the primary regulator, and the FDIC regulate and monitor all areas of NBB’s operation. These areas include adequacy of capitalization and loss reserves, loans, deposits, business practices related to the charging and payment of interest, investments, borrowings, payment of dividends, security devices and procedures, establishment of branches, corporate reorganizations and maintenance of books and records. NBB is required to maintain certain capital ratios. It must also prepare quarterly reports on its financial condition for the OCC and conduct an annual audit of its financial affairs. OCC requires NBB to adopt internal control structures and procedures designed to safeguard assets and monitor and reduce risk exposure. While appropriate for the safety and soundness of banks, these requirements add to overhead expense for NBB and other banks.
The Community Reinvestment Act. NBB is subject to the provisions of the Community Reinvestment Act (CRA), which imposes an affirmative obligation on financial institutions to meet the credit needs of the communities they serve, including low and moderate income neighborhoods. The OCC monitors NBB’s compliance with the CRA and assigns public ratings based upon the bank’s performance in meeting stated assessment goals. Unsatisfactory CRA ratings can result in restrictions on bank operations or expansion. NBB received a “satisfactory” rating in its last CRA examination by the OCC.
The Gramm-Leach-Bliley Act. In addition to other consumer privacy provisions, the Gramm-Leach-Bliley Act (GLBA) restricts the use by financial institutions of customers’ nonpublic personal information. At the inception of the customer relationship and annually thereafter, NBB is required to provide its customers with information regarding its policies and procedures with respect to handling of customers’ nonpublic personal information. GLBA generally prohibits a financial institution from providing a customer’s nonpublic personal information to unaffiliated third parties without prior notice and approval by the customer.
The USA Patriot Act. The USA Patriot Act (Patriot Act) facilitates the sharing of information among government entities and financial institutions to combat terrorism and money laundering. The Patriot Act imposes an obligation on NBB to establish and maintain anti-money laundering policies and procedures, including a customer identification program. The bank is also required to screen all customers against government lists of known or suspected terrorists. There is additional regulatory oversight to insure compliance with the Patriot Act.
Consumer Laws and Regulations. There are a number of laws and regulations that regulate banks’ consumer loan and deposit transactions. Among these are the Truth in Lending Act, the Truth in Savings Act, the Expedited Funds Availability Act, the Equal Credit Opportunity Act, the Fair Housing Act, the Fair Credit Reporting Act, the Electronic Funds Transfer Act and the Fair Debt Collections Practices Act. NBB is required to comply with these laws and regulations in its dealings with customers. There are numerous disclosure and other compliance requirements associated with the consumer laws and regulations.
6
Deposit Insurance. NBB has deposits that are insured by the Federal Deposit Insurance Corporation (FDIC). FDIC maintains a Deposit Insurance Fund (DIF) that is funded by risk-based insurance premium assessments on insured depository institutions. Assessments are determined based upon several factors, including the level of regulatory capital and the results of regulatory examinations. FDIC may adjust assessments if the insured institution’s risk profile changes or if the size of the DIF declines in relation to the total amount of insured deposits. In 2009, because of the troubled economy and the number of failed banks nationwide, there was pressure on the reserve ratio of the DIF. In order to rebuild the Fund and to help maintain public confidence in the banking system, on June 30, 2009, the FDIC imposed a special assessment of five basis points of NBB’s FDIC insured assets, minus Tier 1 capital. The special assessment, which was in addition to regular DIF assessments was payable on September 30, 2009. In an effort to further strengthen the Fund, on November 12, 2009 the FDIC adopted a rule requiring insured depository institutions (including NBB) to prepay their estimated quarterly regular risk-based assessments for the fourth quarter of 2009, and for all of 2010, 2011 and 2012 on December 30, 2009. These changes in FDIC assessments have resulted in significant increased costs to NBB.
On May 20, 2009, the FDIC announced that the increase in deposit insurance to at least $250,000 from $100,000, which became effective in October 2008, would be extended to December 31, 2013.
FDIC announced its Transaction Account Guarantee Program on October 14, 2008. On July 21, 2010, the Dodd-Frank Act made the increase permanent and made it retroactive to January 1, 2008. The Transaction Account Guarantee Program, which was a part of the Temporary Liquidity Guarantee Program, provided unlimited coverage for noninterest bearing deposit accounts for FDIC-insured institutions that elected to participate. NBB elected to participate in this program, and its DIF assessments increased to reflect the additional FDIC coverage. The Dodd-Frank Act expanded the program to all FDIC insured depository institutions and extended it until December 31, 2012.
After giving primary regulators an opportunity to first take action, FDIC may initiate an enforcement action against any depository institution it determines is engaging in unsafe or unsound actions or which is in an unsound condition, and the FDIC may terminate that institution’s deposit insurance. NBB has no knowledge of any matter that would threaten its FDIC insurance coverage.
Capital Requirements. The same capital requirements that are discussed above with relation to NBI are applied to NBB by the OCC. The OCC guidelines provide that banks experiencing internal growth or making acquisitions are expected to maintain strong capital positions well above minimum levels, without reliance on intangible assets.
Limits on Dividend Payments. A significant portion of NBI’s income is derived from dividends paid by NBB. As a national bank, NBB may not pay dividends from its capital, and it may not pay dividends if the bank would become undercapitalized, as defined by regulation, after paying the dividend. Without prior OCC approval, NBB’s dividend payments in any calendar year are restricted to the bank’s retained net income for that year, as that term is defined by the laws and regulations, combined with retained net income from the preceding two years, less any required transfer to surplus.
The OCC and FDIC have authority to limit dividends paid by NBB if the payments are determined to be an unsafe and unsound banking practice. Any payment of dividends that depletes the bank’s capital base could be deemed to be an unsafe and unsound banking practice.
Branching. As a national bank, NBB is required to comply with the state branch banking laws of Virginia, the state in which the bank is located. NBB must also have the prior approval of OCC to establish a branch or acquire an existing banking operation. Under Virginia law, NBB may open branch offices or acquire existing banks or bank branches anywhere in the state. Virginia law also permits banks domiciled in the state to establish a branch or to acquire an existing bank or branch in another state. The Dodd-Frank Act permits the OCC to approve applications by national banks like NBB to establish de novo branches in any state in which a bank located in that state is permitted to establish a branch.
Monetary Policy
The monetary and interest rate policies of the Federal Reserve, as well as general economic conditions, affect the business and earnings of NBI. NBB and other banks are particularly sensitive to interest rate fluctuations. The spread between the interest paid on deposits and that which is charged on loans is the most important component of the bank’s earnings. In addition, interest earned on investments held by NBI and NBB has a significant effect on earnings. As conditions change in the national and international economy and in the money markets, the Federal Reserve’s actions, particularly with regard to interest rates, can impact loan demand, deposit levels and earnings at NBB. It is not possible to accurately predict the effects on NBI of economic and interest rate changes.
Other Legislative and Regulatory Concerns
Particularly because of uncertain economic conditions and the current political environment, federal and state laws and regulations are regularly proposed that could affect the regulation of financial institutions. New regulations could add to the regulatory burden on banks and other financial service providers and increase the costs of compliance, or they could change the products that can be offered and the manner in which financial institutions do business. We cannot foresee how regulation of financial institutions may change in the future and how those changes might affect NBI.
7
Company Website
NBI maintains a website at www.nationalbankshares.com. The Company’s annual report on Form 10-K, quarterly reports on Form 10-Q, current reports on Form 8-K and all amendments to those reports are made available on its website as soon as is practical after the material is electronically filed with the Securities and Exchange Commission. The Company’s proxy materials for the 2011 annual meeting of stockholders are also posted on a separate website at www.nationalbanksharesproxy.com.
If recovery from the economic downturn is delayed, our credit risk will increase and there could be greater loan losses.
A slow economic recovery is likely to result in a higher rate of business closures and increased job losses in the region in which we do business. In addition, reduced State funding for the public colleges and universities that are large employers in our market area could have an adverse effect on employment levels and on the area’s economy. These factors would increase the likelihood that more of our customers would become delinquent or default on their loans. A higher level of loan defaults could result in higher loan losses, which could adversely affect our performance.
An extended economic recovery could increase the risk of losses in our investment portfolio.
We hold both corporate and municipal bonds in our investment portfolio. A slow recovery could increase the actual or perceived risk of default by both corporate and government issuers and, in either case, could adversely affect the value of these investments.
If the real estate market remains depressed for an extended period, our business could be negatively affected.
A depressed real estate market can impact us in several ways. First, the demand for new real estate loans will decline, and existing loans may become delinquent. In addition, if there is a general devaluation in real estate, loan collateral values will decline.
Market interest rates are currently low. If market interest rates rise, our net interest income can be negatively affected in the short term.
The direction and speed of interest rate changes affect our net interest margin and net interest income. In the short term, rising interest rates may negatively affect our net interest income, because our interest-bearing liabilities (generally deposits) reprice sooner than our interest-earning assets (generally loans).
A large number of bank failures nationwide could significantly increase the cost of FDIC insurance.
Since insured depositary institutions, including our bank, bear the full cost of deposit insurance provided by FDIC, a high number of bank failures could put additional pressure on a stressed Deposit Insurance Fund. This possibility could in turn lead to higher assessments that could negatively impact our earnings.
If more competitors come into our market area, our business could suffer.
The financial services industry in our market area is highly competitive, with a number of commercial banks, credit unions, insurance companies and stockbrokers seeking to do business with our customers. If there is additional competition from new business or if our existing competitors focus more attention on our market, we could lose customers and our business could suffer.
Additional laws and regulations could lead to a significant increase in our regulatory burden.
The Dodd-Frank Act and its implementing regulations will result in greater compliance costs and may reduce the profitability of some of our products and services. Both federal and state governments could enact new laws affecting financial institutions that would increase our regulatory burden and could negatively affect our profits.
New laws and regulations could limit our sources of noninterest income.
New laws and regulations could limit our ability to offer certain profitable products and services or require that we offer unprofitable products and services. This could have a negative effect on the level of noninterest income.
Intense oversight by regulators could result in stricter requirements and higher overhead costs.
The regulatory environment could cause financial industry regulators to impose additional requirements, such as higher capital limits, which would impact the Company’s earnings.
There are none.
8
NBB owns and has a branch bank in NBI’s headquarters building located at 101 Hubbard Street, Blacksburg, Virginia. The bank’s main office is at 100 South Main Street, Blacksburg, Virginia. NBB owns an additional nineteen branch offices and it leases four. NBI owns a building in Pulaski, Virginia that is rented. We believe that existing facilities are adequate for current needs and to meet anticipated growth.
NBI, NBB, and NBFS are not currently involved in any material pending legal proceedings.
Item 5. Market for Registrant’s Common Equity, Related Stockholder Matters and Issuer Purchases of Equity Securities
Common Stock Information and Dividends
National Bankshares, Inc.’s common stock is traded on the NASDAQ Capital Market under the symbol “NKSH”. As of December 31, 2010, there were 837 record stockholders of NBI common stock. The following is a summary of the market price per share and cash dividend per share of the common stock of National Bankshares, Inc. for 2010 and 2009.
Common Stock Market Prices
|
2010
|
2009
|
Dividends per share
|
||||||||||||||||||||||
|
High
|
Low
|
High
|
Low
|
2010
|
2009
|
|||||||||||||||||||
|
First Quarter
|
$ | 29.15 | 23.01 | $ | 20.50 | 17.91 | $ | --- | $ | --- | ||||||||||||||
|
Second Quarter
|
28.50 | 22.96 | 25.80 | 18.51 | 0.44 | 0.41 | ||||||||||||||||||
|
Third Quarter
|
25.88 | 21.76 | 26.90 | 24.27 | --- | --- | ||||||||||||||||||
|
Fourth Quarter
|
32.28 | 25.39 | 29.21 | 25.08 | 0.47 | 0.43 | ||||||||||||||||||
NBI’s primary source of funds for dividend payments is dividends from its bank subsidiary, NBB. Bank dividend payments are restricted by regulators, as more fully disclosed in Note 11 of Notes to Consolidated Financial Statements.
On May 12, 2010, NBI’s Board of Directors approved the repurchase of up to 100,000 shares of equity securities that are registered by the Company pursuant to Section 12 of the Securities Exchange Act of 1934. During the fourth quarter of 2010 there were no shares repurchased, and 100,000 shares may yet be purchased under the program.
9
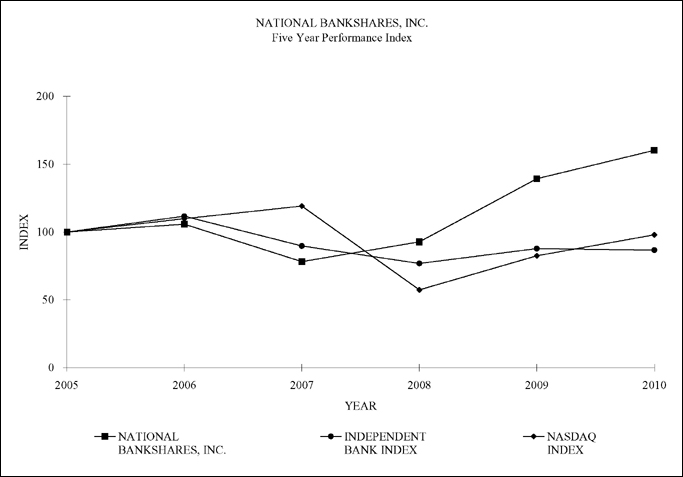
Stock Performance Graph
The following graph compares the yearly percentage change in the cumulative total of stockholder return on NBI common stock with the cumulative return on the NASDAQ Index and a peer group index comprised of southeastern independent community banks and bank holding companies for the five-year period commencing on December 31, 2005. These comparisons assume the investment of $100 in National Bankshares, Inc. common stock in each of the indices on December 31, 2005, and the reinvestment of dividends.
|
2005
|
2006
|
2007
|
2008
|
2009
|
2010
|
||||||||
|
NATIONAL BANKSHARES, INC.
|
100
|
106
|
78
|
93
|
139
|
160
|
|||||||
|
INDEPENDENT BANK INDEX
|
100
|
112
|
90
|
77
|
88
|
87
|
|||||||
|
NASDAQ INDEX
|
100
|
110
|
119
|
57
|
83
|
98
|
The peer group Independent Bank Index is the compilation of the total return to stockholders over the past five years of the following group of 23 independent community banks and bank holding companies located in the southeastern states of Alabama, Florida, Georgia, North Carolina, South Carolina, Tennessee, Virginia and West Virginia. The banks and bank holding companies are: American National Bankshares, Inc., Auburn National Bancorporations, Inc., BNC Bancorp, C&F Financial Corporation, Carolina Trust Bank, Central Virginia Bankshares, Inc., Community First, CNB Corporation, Fidelity Southern Corporation, First Century Bankshares, Inc., First Community Bank Corporation of America, First Pulaski National Corporation, Four Oaks Fincorp, Inc., Geer Bancshares Incorporated, Monarch Financial Holdings, Inc., National Bankshares, Inc., New Bridge Bancorp, Peoples Bancorporation, Inc., Savannah Bancorp, Inc., Southeastern Banking Corporation, Southwest Georgia Financial Corp., United Security Bancshares, Inc. and Uwharrie Capital Corp.
10
National Bankshares, Inc. and Subsidiaries
Selected Consolidated Financial Data
|
$ in thousands, except per share data
|
Years ended December 31,
|
|||||||||||||||||||
|
2010
|
2009
|
2008
|
2007
|
2006
|
||||||||||||||||
|
Selected Income Statement Data:
|
||||||||||||||||||||
|
Interest income
|
$ | 49,139 | $ | 50,487 | $ | 50,111 | $ | 50,769 | $ | 47,901 | ||||||||||
|
Interest expense
|
11,158 | 15,825 | 18,818 | 21,745 | 18,564 | |||||||||||||||
|
Net interest income
|
37,981 | 34,662 | 31,293 | 29,024 | 29,337 | |||||||||||||||
|
Provision for loan losses
|
3,409 | 1,634 | 1,119 | 423 | 49 | |||||||||||||||
|
Noninterest income
|
8,347 | 8,804 | 9,087 | 8,760 | 8,802 | |||||||||||||||
|
Noninterest expense
|
23,127 | 23,853 | 22,023 | 20,956 | 21,670 | |||||||||||||||
|
Income taxes
|
4,223 | 3,660 | 3,645 | 3,730 | 3,788 | |||||||||||||||
|
Net income
|
15,569 | 14,319 | 13,593 | 12,675 | 12,632 | |||||||||||||||
|
Per Share Data:
|
||||||||||||||||||||
|
Basic net income
|
2.25 | 2.07 | 1.96 | 1.82 | 1.80 | |||||||||||||||
|
Diluted net income
|
2.24 | 2.06 | 1.96 | 1.82 | 1.80 | |||||||||||||||
|
Cash dividends declared
|
0.91 | 0.84 | 0.80 | 0.76 | 0.73 | |||||||||||||||
|
Book value
|
18.63 | 17.61 | 15.89 | 15.07 | 13.86 | |||||||||||||||
|
Selected Balance Sheet Data at End of Year:
|
||||||||||||||||||||
|
Loans, net
|
568,779 | 583,021 | 569,699 | 518,435 | 495,486 | |||||||||||||||
|
Total securities
|
315,907 | 297,417 | 264,999 | 273,343 | 285,489 | |||||||||||||||
|
Total assets
|
1,022,238 | 982,367 | 935,374 | 887,647 | 868,203 | |||||||||||||||
|
Total deposits
|
884,583 | 852,112 | 817,848 | 776,339 | 764,692 | |||||||||||||||
|
Stockholders’ equity
|
129,187 | 122,076 | 110,108 | 104,800 | 96,755 | |||||||||||||||
|
Selected Balance Sheet Daily Averages:
|
||||||||||||||||||||
|
Loans, net
|
577,210 | 572,438 | 533,190 | 505,070 | 488,624 | |||||||||||||||
|
Total securities
|
289,532 | 298,237 | 281,367 | 282,734 | 271,066 | |||||||||||||||
|
Total assets
|
989,952 | 971,538 | 899,462 | 867,061 | 840,080 | |||||||||||||||
|
Total deposits
|
852,953 | 846,637 | 783,774 | 758,657 | 741,071 | |||||||||||||||
|
Stockholders’ equity
|
129,003 | 117,086 | 108,585 | 100,597 | 94,194 | |||||||||||||||
|
Selected Ratios:
|
||||||||||||||||||||
|
Return on average assets
|
1.57 | % | 1.47 | % | 1.51 | % | 1.46 | % | 1.50 | % | ||||||||||
|
Return on average equity
|
12.07 | % | 12.23 | % | 12.52 | % | 12.60 | % | 13.41 | % | ||||||||||
|
Dividend payout ratio
|
40.52 | % | 40.67 | % | 40.78 | % | 41.80 | % | 40.44 | % | ||||||||||
|
Average equity to average assets
|
13.03 | % | 12.05 | % | 12.07 | % | 11.60 | % | 11.21 | % | ||||||||||
11
$ in thousands, except per share data
The purpose of this discussion and analysis is to provide information about the results of operations, financial condition, liquidity and capital resources of National Bankshares, Inc. and its subsidiaries (the Company). The discussion should be read in conjunction with the material presented in Item 8, “Financial Statements and Supplementary Data”, of this Form 10-K.
Per share data has been adjusted to reflect a 2-for-1 stock split effective March 31, 2006.
Subsequent events have been considered through the date on which the Form 10-K was issued.
Cautionary Statement Regarding Forward-Looking Statements
We make forward-looking statements in this Form 10-K that are subject to significant risks and uncertainties. These forward-looking statements include statements regarding our profitability, liquidity, allowance for loan losses, interest rate sensitivity, market risk, growth strategy, and financial and other goals, and are based upon our management’s views and assumptions as of the date of this report. The words “believes,” “expects,” “may,” “will,” “should,” “projects,” “contemplates,” “anticipates,” “forecasts,” “intends,” or other similar words or terms are intended to identify forward-looking statements.
These forward-looking statements are based upon or are affected by factors that could cause our actual results to differ materially from historical results or from any results expressed or implied by such forward-looking statements. These factors include, but are not limited to, changes in:
|
·
|
interest rates,
|
|
·
|
general economic conditions,
|
|
·
|
the legislative/regulatory climate,
|
|
·
|
monetary and fiscal policies of the U.S. Government, including policies of the U.S. Treasury, the Office of the Comptroller of the Currency, the Federal Reserve Board and the Federal Deposit Insurance Corporation, and the impact of any policies or programs implemented pursuant to the Emergency Economic Stabilization Act of 2008 (EESA) the Dodd-Frank Wall Street Reform and Consumer Protection Act of 2010 (the Dodd-Frank Act) and other financial reform legislation,
|
|
·
|
unanticipated increases in the level of unemployment in the Company’s trade area,
|
|
·
|
the quality or composition of the loan and/or investment portfolios,
|
|
·
|
demand for loan products,
|
|
·
|
deposit flows,
|
|
·
|
competition,
|
|
·
|
demand for financial services in the Company’s trade area,
|
|
·
|
the real estate market in the Company’s trade area,
|
|
·
|
the Company’s technology initiatives, and
|
|
·
|
applicable accounting principles, policies and guidelines.
|
These risks and uncertainties should be considered in evaluating the forward-looking statements contained in this report. We caution readers not to place undue reliance on those statements, which speak only as of the date of this report. This discussion and analysis should be read in conjunction with the description of our “Risk Factors” in Item 1A. of this Form 10-K.
The Company was not negatively impacted during the initial phases of the economic slowdown in late 2008. Its markets did not experience the dramatic declines in real estate values seen in some other areas of the country. In addition, the diverse economy of the Company’s market area, including several large employers that are public colleges or universities, helped to insulate the Company from the worst effects of the recession. As the recession continued into 2009, real estate values in the Company’s trade area declined moderately. In 2010, the Company experienced an increasing level of nonperforming assets, including nonperforming loans and other real estate owned. If the economic recovery progresses slowly or is reversed, it is likely that unemployment will continue to rise in the Company’s trade area. Because of the importance to the Company’s markets of state-funded universities, cutbacks in the funding provided by the State as a result of the recession could also negatively impact employment. This could lead to an even higher rate of delinquent loans and a greater number of real estate foreclosures. Higher unemployment and the fear of layoffs causes reduced consumer demand for goods and services, which negatively impacts the Company’s business and professional customers. In conclusion, a slow economic recovery could have an adverse effect on all financial institutions, including the Company.
Critical Accounting Policies
General
The Company’s financial statements are prepared in accordance with accounting principles generally accepted in the United States (GAAP). The financial information contained within our statements is, to a significant extent, financial information that is based on measures of the financial effects of transactions and events that have already occurred. A variety of factors could affect the ultimate value that is obtained when earning income, recognizing an expense, recovering an asset or relieving a liability. The Company uses historical loss factors as one factor in determining the inherent loss that may be present in the loan portfolio. Actual losses could differ significantly from one previously acceptable method to another method. Although the economics of the Company’s transactions would be the same, the timing of events that would impact the transactions could change.
12
Allowance for Loan Losses
The allowance for loan losses is an accrual of estimated losses that have been sustained in our loan portfolio. The allowance is reduced by charge-offs of loans and increased by the provision for loan losses and recoveries of previously charged-off loans. The determination of the allowance is based on two accounting principles, FASB Topic 450-20 (Contingencies) which requires that losses be accrued when occurrence is probable and the loss is reasonably estimable, and FASB Topic 310-10 (Receivables) which requires accrual of losses on impaired loans if the recorded investment exceeds fair value.
Probable losses are accrued through two calculations, individual evaluation of impaired loans and evaluation on a group basis of the remainder of the portfolio. Impaired loans are larger nonhomogeneous loans for which there is a probability that collection will not occur according to the loan terms, as well as loans whose terms have been modified in a troubled debt restructuring. Impaired loans are individually evaluated for potential loss. Impaired loans with an estimated impairment loss are placed on nonaccrual status.
Estimated loss for an impaired loan is the amount of recorded investment that exceeds the loan’s fair value. Fair value of an impaired loan is measured by one of three methods, the fair value (less cost to sell) of collateral, the present value of future cash flows, or observable market price. For loans that are not collateral dependent, the potential loss is accrued in the allowance. For collateral-dependent loans, the potential loss is charged off against the allowance, instead of being accrued. Impaired loans with partial charge-offs are maintained as impaired until it becomes evident that the borrower can repay the remaining balance of the loan according to the terms.
For impaired loans for which the collateral method is elected, the Company requires a current third-party appraisal of “as is” value. If an existing appraisal is older than 12 months, a new appraisal is ordered immediately after the date of impairment designation. If a current appraisal cannot be obtained prior to reporting deadlines, the existing appraisal is discounted according to published independent indices. The Company believes this serves as a conservative estimate of fair value until the updated appraisal can be obtained.
Impaired loans are measured for impairment at least quarterly. Loss reserves and nonaccrual designation, or partial charge-off for estimated losses on impaired loans are recorded at the first measurement date and at each measurement date thereafter.
In the third quarter of 2010, the Company revised its policy for evaluation of nonimpaired loans. The policy formalized criteria used to group loans for purposes of estimating losses; provided for analysis of trends and current levels of risk indicators; and designated loans that the Company determines to have inherently higher risk.
Nonimpaired loans are grouped according to risk characteristic into portfolio segments and loan classes. Loans within a segment or class have similar risk characteristics. Each segment and class is evaluated for probable loss by applying quantitative and qualitative factors, including net charge-off trends, delinquency rates, concentration trends and economic trends. Net charge-off trends are evaluated by segment within a two to three year time frame. The Company accrues additional reserves for criticized loans within each class and for loans designated high risk. High risk loans are defined as junior lien mortgages, loans with high loan-to-value ratios and loans with payments of interest-only required. Both classified loans and high risk loans are included in the base risk analysis for each class and are allocated additional reserves.
The change in methodology did not materially affect the total estimated accrual; however, previously unallocated amounts became allocated with the new methodology.
The estimation of the accrual involves analysis of internal and external variables, methodologies, assumptions and our judgment and experience. Key judgments used in determining the allowance for loan losses include internal risk ratings, market and collateral values, discount rates, loss rates, and our view of current economic conditions. The inherent subjectivity of these judgments, as well as the lagging of credit quality measurements relative to the performance of the loan portfolio, create a degree of imprecision. Our actual losses could be greater or less than the estimate. Future estimates of the allowance could increase or decrease based on changes in the financial condition of individual borrowers, concentrations of various types of loans, economic conditions or the markets in which collateral may be sold. The estimate of the allowance accrual determines the amount of provision expense and directly affects our financial results.
During 2009 and 2010, the Company experienced increases in delinquencies and net charge-offs due to deterioration of the real estate market and the economy as a whole. The estimate of the allowance incorporated these market conditions in determining the accrual. However, given the continued economic difficulties, the ultimate amount of loss could vary from that estimate. For additional discussion of the allowance, see Note 5 of the Notes to Consolidated Financial Statements and “Asset Quality”, and “Provision and Allowance for Loan Losses”.
Goodwill and Core Deposit Intangibles
Goodwill is subject to at least an annual assessment for impairment by applying a fair value based test. The Company performs impairment testing in the fourth quarter. The Company’s goodwill impairment analysis considered three valuation techniques appropriate to the measurement. The first technique uses the Company’s market capitalization as an estimate of fair value; the second technique estimates fair value using current market pricing multiples for companies comparable to NBI; while the third technique uses current market pricing multiples for change-of-control transactions involving companies comparable to NBI. Each measure indicated that the Company’s fair value exceeded its book value, validating that goodwill is not impaired.
13
Certain key judgments were used in the valuation measurement. Goodwill is held by the Company’s bank subsidiary. The bank subsidiary is 100% owned by the Company, and no market capitalization is available. Because most of the Company’s assets are comprised of the subsidiary bank’s equity, the Company’s market capitalization was used to estimate the Bank’s. Other judgments include the assumption that the companies and transactions used as comparables for the second and third technique were appropriate to the estimate of the Company’s fair value, and that the comparable multiples are appropriate indicators of fair value, and compliant with accounting guidance.
Acquired intangible assets (such as core deposit intangibles) are recognized separately from goodwill if the benefit of the asset can be sold, transferred, licensed, rented, or exchanged, and amortized over its useful life. The Company amortizes intangible assets arising from branch transactions over their useful life. Core deposit intangibles are subject to a recoverability test based on undiscounted cash flows, and to the impairment recognition and measurement provisions required for other long-lived assets held and used. The impairment testing showed that the expected cash flows of the intangible assets exceeded the carrying value.
Overview
National Bankshares, Inc. is a financial holding company incorporated under the laws of Virginia. Located in southwest Virginia, NBI has two wholly-owned subsidiaries, the National Bank of Blacksburg and National Bankshares Financial Services, Inc. The National Bank of Blacksburg, which does business as National Bank from twenty-five office locations, is a community bank. NBB is the source of nearly all of the Company’s revenue. National Bankshares Financial Services, Inc. does business as National Bankshares Investment Services and National Bankshares Insurance Services. Income from NBFS is not significant at this time, nor is it expected to be so in the near future.
National Bankshares, Inc. common stock is listed on the NASDAQ Capital Market and is traded under the symbol “NKSH.” National Bankshares, Inc. has been included in the Russell Investments Russell 3000 and Russell 2000 Indexes since June 29, 2009.
Performance Summary
The following table presents NBI’s key performance ratios for the years ending December 31, 2010 and December 31, 2009:
|
12/31/10
|
12/31/09
|
|||||||
|
Return on average assets
|
1.57 | % | 1.47 | % | ||||
|
Return on average equity
|
12.07 | % | 12.23 | % | ||||
|
Basic net earnings per share
|
$ | 2.25 | $ | 2.07 | ||||
|
Fully diluted net earnings per share
|
$ | 2.24 | $ | 2.06 | ||||
|
Net interest margin (1)
|
4.52 | % | 4.23 | % | ||||
|
Noninterest margin (2)
|
1.49 | % | 1.55 | % | ||||
|
|
(1)
|
Net Interest Margin – Year-to-date tax equivalent net interest income divided by year-to-date average earning assets.
|
|
|
(2)
|
Noninterest Margin – Noninterest income (excluding securities gains and losses) less noninterest expense (excluding the provision for bad debts and income taxes) divided by average year-to-date assets.
|
The return on average assets for the year ended December 31, 2010 was 1.57%, an increase of 10 basis points from the 1.47% for the year ended December 31, 2009. The return on average equity declined from 12.23% for the year ended December 31, 2009 to 12.07% for the year ended December 31, 2010. Earnings benefited from reduced assessments for Federal Deposit Insurance Corporation Deposit Insurance Fund. The total FDIC assessments for the year ended December 31, 2010 were $1,080, as compared with $1,727 for 2009. Please refer to the discussion of “Noninterest Expense” for additional details about FDIC assessments. Reflecting both the effects of the low interest rate environment throughout 2010 on NBI’s funding costs and the Company’s asset/liability management practices, the net interest margin increased from 4.23% at year-end 2009 to 4.52% at December 31, 2010. The noninterest margin decreased from 1.55% to 1.49% over the same period due to decreases in both FDIC assessment and salaries and benefits expense.
The higher net interest margin, together with decreases in FDIC assessments and controllable noninterest expenses, are largely responsible for the increase in basic net earnings per share, from $2.07 for the year ended December 31, 2009 to $2.25 for the year ended December 31, 2010.
14
Growth
NBI’s key growth indicators are shown in the following table:
|
12/31/10
|
12/31/09
|
|||||||
|
Securities
|
$ | 315,907 | $ | 297,417 | ||||
|
Loans, net
|
568,779 | 583,021 | ||||||
|
Deposits
|
884,583 | 852,112 | ||||||
|
Total assets
|
1,022,238 | 982,367 | ||||||
Securities, deposits and total assets all experienced growth, while loans declined when December 31, 2010 and 2009 are compared. Deposits grew $32,471, or 3.81%, from December 31, 2009, with increases mainly from municipal deposits and individuals seeking to safeguard principal by avoiding more volatile investments in financial markets. Net loans at year-end 2010 were $568,779, a decrease of $14,242, or 2.44%, when compared to $583,021 at December 31, 2009. The excess liquidity from increased deposits and decreased loans was held in interest-bearing deposits and securities, which grew by $18,490, or 6.22%, from December 31, 2009 to December 31, 2010. The Company’s total assets at December 31, 2010 were $1,022,238, an increase of $39,871, or 4.06%, when compared with total assets of $982,367 at December 31, 2009.
In both 2009 and 2010, the Company’s growth was internally generated and was not the result of acquisitions.
Asset Quality
Key indicators of NBI’s asset quality are presented in the following table:
|
12/31/10
|
12/31/09
|
|||||||
|
Nonperforming loans
|
$ | 8,421 | $ | 6,750 | ||||
|
Loans past due 90 days or more
|
1,336 | 1,697 | ||||||
|
Other real estate owned
|
1,723 | 2,126 | ||||||
|
Allowance for loan losses to loans
|
1.33 | % | 1.17 | % | ||||
|
Net charge-off ratio
|
0.46 | % | 0.10 | % | ||||
Nonperforming loans at December 31, 2010 were $8,421, or 1.46% of loans net of unearned income and deferred fees, plus other real estate owned. This compares with $6,750 in nonperforming loans reported at year-end 2009. Of the nonperforming loans reported at December 31, 2010, all are nonaccrual loans, with the exception of one restructured loan.
Loans designated as troubled debt restructurings totaled $6,483. Loans past due 90 days or more and still accruing at year-end 2010 totaled $1,336, a decrease of $361, or 21.27%, from $1,697 at December 31, 2009.
The increase in nonperforming loans from 2009 to 2010 has pushed the ratio of nonperforming loans to net loans to a level that is higher than it has been for the Company in the recent past. However, the level of nonperforming loans remains manageable and below that of peers. Sufficient resources have been dedicated to working out problem assets, and exposure to loss is somewhat mitigated because most of the non-performing loans are collateralized. In addition, the Company’s conservative loan underwriting policies help to limit potential loss. More information about nonaccrual and past due loans is provided in “Balance Sheet – Loans – Risk Elements”. Management also dedicates sufficient resources to monitoring loan portfolio quality on an ongoing basis.
In response to an increase in problem loans, the ratio of the allowance for loan losses to loans grew from 1.17% at December 31, 2009 to 1.33% at the same period in 2010. For more information see “Allowance for Loan Losses”.
The net charge-off ratio was 0.10% at year-end 2009 and 0.46% at December 31, 2010. Other real estate owned declined from $2,126 at December 31, 2009 to $1,723 at the same period in 2010, a decrease of $403, or 18.96%. Management anticipates that the level of other real estate owned may still increase as a consequence of the process of working through loan delinquencies.
Net Interest Income
Net interest income for the period ended December 31, 2010 was $37,981, an increase of $3,319, or 9.58%, when compared to the prior year. Net interest income for the period ended December 31, 2009 was $34,662, an increase of $3,369, or 10.71%, from 2008. The net interest margin for 2010 was 4.52%, compared to 4.23% for 2009. Total interest income for the period ended December 31, 2010 was $49,139, a decrease of $1,348 from the period ended December 31, 2009. Interest expense was down by $4,667 during the same time frame, from $15,825 for 2009 to $11,158 for the year ended December 31, 2010. The decline in interest expense came about because higher priced certificates of deposit renewed at a lower interest rate and noninterest-bearing deposits grew at a faster rate than interest-bearing deposits. In summary, the rates paid on the Company’s deposit liabilities declined at a more rapid pace than the interest rates on its interest-earning assets.
15
The amount of net interest income earned is affected by various factors, including changes in market interest rates due to the Federal Reserve Board’s monetary policy, the level and composition of the earning assets, and the composition of interest-bearing liabilities. The Company has the ability to respond over time to interest rate movements and reduce volatility in the net interest margin. However, the frequency and/or magnitude of changes in market interest rates are difficult to predict and may have a greater impact on net interest income than adjustments by management.
During 2010, interest rates continued at historic lows, and low and stable interest rates benefited the Company. Offsetting the positive effect of low interest rates is the fact that some higher yielding securities in the Company’s investment portfolio were called and were replaced with securities yielding at the lower market rate. Another negative effect of the low interest rate environment is the level of interest earned on overnight funds. These assets are used primarily to provide liquidity. The yield on these assets in 2010 was 0.23%, while the cost to fund them was 1.21% in the same period.
The primary source of funds used to support the Company’s interest-earning assets is deposits. Deposits are obtained in the Company’s trade area through traditional marketing techniques. Other funding sources, such as the Federal Home Loan Bank, while available, are only used occasionally. The cost of funds is dependent on interest rate levels and competitive factors. This limits the ability of the Company to react to interest rate movements.
If interest rates remain low and stable, management does not anticipate any further improvement in the net interest margin. If interest rates rise quickly, the net interest margin would narrow, because deposit rates would increase at a faster rate than loan rates. If interest rates rise more slowly, the negative effect on the net interest margin would be less pronounced.
Because interest rates are at historic lows, interest rates can only trend up in the future. Management cannot predict the timing and level of interest rate increases.
Analysis of Net Interest Earnings
The following table shows the major categories of interest-earning assets and interest-bearing liabilities, the interest earned or paid, the average yield or rate on the daily average balance outstanding, net interest income and net yield on average interest-earning assets for the years indicated.
|
December 31, 2010
|
December 31, 2009
|
December 31, 2008
|
||||||||||||||||||||||||||||||||||
|
Average
Balance
|
Interest
|
Average
Yield/
Rate
|
Average
Balance
|
Interest
|
Average
Yield/
Rate
|
Average
Balance
|
Interest
|
Average
Yield/
Rate
|
||||||||||||||||||||||||||||
|
Interest-earning assets:
|
||||||||||||||||||||||||||||||||||||
|
Loans, net (1)(2)(3)
|
$ | 585,933 | $ | 37,282 | 6.36 | % | $ | 579,581 | $ | 37,903 | 6.54 | % | $ | 538,868 | $ | 37,356 | 6.93 | % | ||||||||||||||||||
|
Taxable securities
|
123,920 | 5,588 | 4.51 | % | 134,607 | 6,273 | 4.66 | % | 137,497 | 6,817 | 4.96 | % | ||||||||||||||||||||||||
|
Nontaxable securities (1)(4)
|
161,571 | 10,074 | 6.24 | % | 162,889 | 10,154 | 6.23 | % | 144,137 | 8,911 | 6.18 | % | ||||||||||||||||||||||||
|
Interest-bearing deposits
|
55,477 | 128 | 0.23 | % | 35,841 | 90 | 0.25 | % | 21,440 | 449 | 2.09 | % | ||||||||||||||||||||||||
|
Total interest-earning assets
|
$ | 926,901 | $ | 53,072 | 5.73 | % | $ | 912,918 | $ | 54,420 | 5.96 | % | $ | 841,942 | $ | 53,533 | 6.36 | % | ||||||||||||||||||
|
Interest-bearing liabilities:
|
||||||||||||||||||||||||||||||||||||
|
Interest-bearing demand deposits
|
$ | 322,705 | $ | 3,332 | 1.03 | % | $ | 282,532 | $ | 3,076 | 1.09 | % | $ | 243,409 | $ | 3,486 | 1.43 | % | ||||||||||||||||||
|
Savings deposits
|
54,543 | 51 | 0.09 | % | 48,992 | 52 | 0.11 | % | 45,796 | 132 | 0.29 | % | ||||||||||||||||||||||||
|
Time deposits
|
352,887 | 7,775 | 2.20 | % | 399,873 | 12,694 | 3.17 | % | 381,961 | 15,188 | 3.98 | % | ||||||||||||||||||||||||
|
Short-term borrowings
|
--- | --- | --- | % | 49 | 3 | 6.12 | % | 297 | 12 | 4.04 | % | ||||||||||||||||||||||||
|
Total interest-bearing liabilities
|
$ | 730,135 | $ | 11,158 | 1.53 | % | $ | 731,446 | $ | 15,825 | 2.16 | % | $ | 671,463 | $ | 18,818 | 2.80 | % | ||||||||||||||||||
|
Net interest income and interest rate spread
|
$ | 41,914 | 4.20 | % | $ | 38,595 | 3.80 | % | $ | 34,715 | 3.56 | % | ||||||||||||||||||||||||
|
Net yield on average interest-earning assets
|
4.52 | % | 4.23 | % | 4.12 | % | ||||||||||||||||||||||||||||||
|
(1)
|
Interest on nontaxable loans and securities is computed on a fully taxable equivalent basis using a Federal income tax rate of 35% in the three years presented.
|
|
(2)
|
Loan fees of $863 in 2010, $956 in 2009 and $859 in 2008 are included in total interest income.
|
|
(3)
|
Nonaccrual loans are included in average balances for yield computations.
|
|
(4)
|
Daily averages are shown at amortized cost.
|
16
Analysis of Changes in Interest Income and Interest Expense
The Company’s primary source of revenue is net interest income, which is the difference between the interest and fees earned on loans and investments and the interest paid on deposits and other funds. The Company’s net interest income is affected by changes in the amount and mix of interest-earning assets and interest-bearing liabilities and by changes in yields earned on interest-earning assets and rates paid on interest-bearing liabilities. The following table sets forth, for the years indicated, a summary of the changes in interest income and interest expense resulting from changes in average asset and liability balances (volume) and changes in average interest rates (rate).
|
2010 Over 2009
|
2009 Over 2008
|
|||||||||||||||||||||||
|
Changes Due To
|
Changes Due To
|
|||||||||||||||||||||||
|
Rates(2)
|
Volume(2)
|
Net Dollar
Change
|
Rates(2)
|
Volume(2)
|
Net Dollar Change
|
|||||||||||||||||||
|
Interest income: (1)
|
|
|
|
|
|
|
||||||||||||||||||
|
Loans
|
$ | (1,033 | ) | $ | 412 | $ | (621 | ) | $ | (2,184 | ) | $ | 2,731 | $ | 547 | |||||||||
|
Taxable securities
|
(198 | ) | (487 | ) | (685 | ) | (403 | ) | (141 | ) | (544 | ) | ||||||||||||
|
Nontaxable securities
|
2 | (82 | ) | (80 | ) | 75 | 1,168 | 1,243 | ||||||||||||||||
|
Interest-bearing deposits
|
(8 | ) | 46 | 38 | (651 | ) | 292 | (359 | ) | |||||||||||||||
|
Increase (decrease) in income on interest-earning assets
|
$ | (1,237 | ) | $ | (111 | ) | $ | (1,348 | ) | $ | (3,163 | ) | $ | 4,050 | $ | 887 | ||||||||
|
Interest expense:
|
||||||||||||||||||||||||
|
Interest-bearing demand deposits
|
$ | (165 | ) | $ | 421 | $ | 256 | $ | (916 | ) | $ | 506 | $ | (410 | ) | |||||||||
|
Savings deposits
|
(7 | ) | 6 | (1 | ) | (89 | ) | 9 | (80 | ) | ||||||||||||||
|
Time deposits
|
(3,553 | ) | (1,366 | ) | (4,919 | ) | (3,179 | ) | 685 | (2,494 | ) | |||||||||||||
|
Short-term borrowings
|
--- | (3 | ) | (3 | ) | 4 | (13 | ) | (9 | ) | ||||||||||||||
|
Increase (decrease) in expense of interest-bearing liabilities
|
$ | (3,725 | ) | $ | (942 | ) | $ | (4,667 | ) | $ | (4,180 | ) | $ | 1,187 | $ | (2,993 | ) | |||||||
|
Increase in net interest income
|
$ | 2,488 | $ | 831 | $ | 3,319 | $ | 1,017 | $ | 2,863 | $ | 3,880 | ||||||||||||
|
|
(1) Taxable equivalent basis using a Federal income tax rate of 35% in 2010, 2009 and 2008.
|
|
(2)
|
Variances caused by the change in rate times the change in volume have been allocated to rate and volume changes proportional to the relationship of the absolute dollar amounts of the change in each.
|
With interest rates remaining at historic lows throughout 2010, interest expense declined by $4,667 when 2010 and 2009 are compared. For the same period, there was a decrease of $1,348 in interest income. The result was an increase of $3,319 in net interest income in 2010 over 2009. Of this increase, $2,488 was attributable to rates, and $831 came from higher volume.
The lower interest rate environment led to a decline of $1,033 in interest income from loans. This was partially offset by interest on a higher volume of loans. The average balance of loans increased from $579,581 in 2009 to $585,933 in 2010, causing an increase in interest income of $412. The net decrease in loan interest income was $621.
Interest income on taxable securities decreased $198 due to rates and $487 because of average volume, for a total decrease of $685 compared to 2009. The low interest rate environment increased the number of called securities in 2010 and reduced the opportunity to reinvest the proceeds in securities with more attractive yields. Because of low yields in the securities markets and flat loan demand, the Company did not aggressively pursue deposit growth.
Interest on time deposits declined $4,919 from 2009 to 2010, with a decline of $3,553 due to rates and $1,366 attributable to volume. See “Net Interest Income” for additional information related to the decline in interest expense.
If the volume of interest bearing liabilities remains at December 31, 2010 levels and interest rates remain low and stable, management does not anticipate any further improvement in the net interest margin. However, any interest rate increases would have a negative effect on net interest income. The negative effect would be more pronounced if rates were to rise rapidly.
Interest rates began to fall in 2008. As compared with 2008, there was a $2,993 decline in interest expense associated with time deposits in 2009. Of the total decline, $4,180 was due to rates, offset by $1,187 from higher deposit volume. Management focused on deposit pricing in 2009 and took advantage of falling rates to lower interest expense.
From 2008 to 2009 interest on loans increased by $547. Loan interest income attributable to rates was $2,184 lower, offset to a large degree to an increase of $2,731 because of volume. As compared with 2008, there was an increase of $3,880 in net interest income in 2009, $1,017 of the increase was due to rates and $2,863 due to volume.
17
Interest Rate Sensitivity
The Company considers interest rate risk to be a significant market risk and has systems in place to measure the exposure of net interest income and fair market values to movement in interest rates. Among the tools available to management is interest rate sensitivity analysis, which provides information related to repricing opportunities. Interest rate shock simulations indicate potential economic loss due to future interest rate changes. Shock analysis is a test that measures the effect of a hypothetical, immediate and parallel shift in interest rates. The following table shows the results of a rate shock and the effects on the return on average assets and the return on average equity projected at December 31, 2010 and 2009. For purposes of this analysis, noninterest income and expenses are assumed to be flat.
|
Rate Shift (bp)
|
Return on Average Assets
|
Return on Average Equity
|
|||||||
|
2010
|
2009
|
2010
|
2009
|
||||||
|
300
|
1.04
|
%
|
0.87
|
%
|
7.93
|
%
|
8.60
|
%
|
|
|
200
|
1.22
|
%
|
1.11
|
%
|
9.28
|
%
|
10.84
|
%
|
|
|
100
|
1.40
|
%
|
1.33
|
%
|
10.54
|
%
|
12.92
|
%
|
|
|
(-)100
|
1.70
|
%
|
1.79
|
%
|
12.68
|
%
|
17.08
|
%
|
|
|
(-)200
|
1.62
|
%
|
1.72
|
%
|
12.12
|
%
|
16.40
|
%
|
|
|
(-)300
|
1.50
|
%
|
1.59
|
%
|
11.27
|
%
|
15.26
|
%
|
|
Simulation analysis is another tool available to the Company to test asset and liability management strategies under rising and falling rate conditions. As a part of the simulation process, certain estimates and assumptions must be made. These include, but are not limited to, asset growth, the mix of assets and liabilities, rate environment and local and national economic conditions. Asset growth and the mix of assets can, to a degree, be influenced by management. Other areas, such as the rate environment and economic factors, cannot be controlled. In addition, competitive pressures can make it difficult to price deposits and loans in a manner that optimally minimizes interest rate risk. Therefore, actual results may vary materially from any particular forecast or shock analysis. This shortcoming is offset somewhat by the periodic reforecasting of the balance sheet to reflect current trends and economic conditions. Shock analysis must also be updated periodically as a part of the asset and liability management process.
Noninterest Income
|
Year Ended
|
||||||||||||
|
December 31, 2010
|
December 31, 2009
|
December 31, 2008
|
||||||||||
|
Service charges on deposits
|
$ | 2,858 | $ | 3,314 | $ | 3,425 | ||||||
|
Other service charges and fees
|
317 | 343 | 326 | |||||||||
|
Credit card fees
|
2,954 | 2,803 | 2,808 | |||||||||
|
Trust fees
|
1,118 | 1,053 | 1,231 | |||||||||
|
Bank-owned life insurance income
|
760 | 756 | 684 | |||||||||
|
Other income
|
354 | 491 | 438 | |||||||||
|
Realized securities gains (losses)
|
(14 | ) | 44 | 175 | ||||||||
|
Total noninterest income
|
$ | 8,347 | $ | 8,804 | $ | 9,087 | ||||||
Service charges on deposit accounts totaled $2,858 for the year ended December 31, 2010. This is a decline of $456, or 13.76%, from $3,314 for the year ended December 31, 2009. Service charges on deposit accounts decreased $111, or 3.24%, from 2008 to 2009. This expense category is affected by the number of deposit accounts, the level of service charges and the number of checking account overdrafts. The 2010 and 2009 decline resulted from a decrease in fees from checking account overdrafts and fees for checks returned for insufficient funds. This decline was caused by two factors. First, we believe consumers have become more conscientious about managing bank accounts so as to avoid overdraft fees in a challenging economy. Second, and to a lesser extent, in mid-2010 banking regulations were changed to prevent all banks, including NBB, from charging overdraft fees associated with ATM or debit card transactions.
Other service charges and fees included charges for official checks, income from the sale of checks to customers, safe deposit box rent, fees from letters of credit and income from commissions on the sale of credit life, accident and health insurance. These fees were $317 for the year ended December 31, 2010, down by $26, or 7.58%, from the $343 for 2009. The total for the year ended December 31, 2009 was $17 above the $326 posted for the year ended December 31, 2008. Both the $26 decrease in 2010 and the $17 increase in 2009 in other service charges and fees were the result of small changes in several categories of fees, none of which is significant by itself.
Credit card fees for the year ended December 31, 2010, were $151 above the $2,803 reported for the year ended December 31, 2009. From 2008 to 2009, credit card fees declined $5, or 0.18%. The increase in 2010 is due to increased volume of merchant transaction fees and credit card fees, while the small decline in 2009 was the result of lower volume.
18
Trust fees, at $1,118, increased by $65, or 6.17%, when the years ended December 31, 2010 and 2009 are compared. For the year ended December 31, 2009 trust fees were $1,053, a decline of $178, or 14.46%, from 2008. Trust fees are generated from a number of different types of accounts, including estates, personal trusts, employee benefit trusts, investment management accounts, attorney-in-fact accounts and guardianships. Trust income varies depending on the number and type of accounts under management and financial market conditions. The significant declines in the financial markets in 2008 and early 2009 negatively affected Trust fee income in both years. Recovering financial markets in 2010 resulted in a higher level of Trust fee income. The mix of account types also affected the level of Trust fees in 2009 and 2010.
Noninterest income from bank-owned life insurance (BOLI) increased $4, or 0.53%, from $756 for the year ended December 31, 2009 to $760 for 2010. It grew from $684 to $756 from December 31, 2008 to December 31, 2009, an increase of $72, or 10.53%. The Company purchased additional BOLI in mid-2009. The additional insurance purchase and the performance of the variable rate policies are the source of growth in BOLI income for 2010 and 2009.
Other income is income that cannot be classified in another category. Some examples include net gains from the sales of fixed assets, rent from foreclosed properties and revenue from investment and insurance sales. Other income for the year 2010 was $354, a decrease of $137, or 27.90%, when compared with $491 for the year ended December 31, 2009. Other income for 2009 increased by $53, or 12.10%, when compared with 2008. The decrease from 2009 to 2010 was primarily due to a one-time contract signing incentive of $150 received in 2009.
Realized securities gains decreased $58, from gains of $44 for the year ended December 31, 2009 to losses of $14 for December 31, 2010. The losses were associated with called securities with premiums that were amortizable to a date beyond the call date. The unamortized premium at the date of the call constituted the amount of the loss. Gains in 2009 fell $131 from $175 in 2008. The decrease in gains from 2008 to 2009 was due to a gain in 2008 of $290 from the initial public offering of Visa, Inc. stock.
Noninterest Expense
|
Year Ended
|
||||||||||||
|
December 31, 2010
|
December 31, 2009
|
December 31, 2008
|
||||||||||
|
Salaries and employee benefits
|
$ | 10,963 | $ | 11,336 | $ | 11,168 | ||||||
|
Occupancy, furniture and fixtures
|
1,875 | 1,792 | 1,751 | |||||||||
|
Data processing and ATM
|
1,499 | 1,371 | 1,381 | |||||||||
|
FDIC assessment
|
1,080 | 1,727 | 209 | |||||||||
|
Credit card processing
|
2,300 | 2,121 | 2,105 | |||||||||
|
Intangibles amortization
|
1,083 | 1,093 | 1,119 | |||||||||
|
Net costs of other real estate owned
|
214 | 393 | 100 | |||||||||
|
Franchise taxes
|
963 | 885 | 823 | |||||||||
|
Other operating expenses
|
3,150 | 3,135 | 3,367 | |||||||||
|
Total noninterest expense
|
$ | 23,127 | $ | 23,853 | $ | 22,023 | ||||||
Salary and benefits expense decreased $373, or 3.29%, from $11,336 for the year ended December 31, 2009 to $10,963 for the year ended December 31, 2010. The decline is the result of the Company’s efforts to control salary costs. There was also a decrease of $94 in net periodic pension expense associated with the Company’s defined benefit pension plan. Net periodic expense varies because of changes in the number of plan participants, the age of participants, the investment performance of the plan trust and the interest rate environment. The modest increase in salary and benefits expense from 2008 to 2009 was also the result of the Company’s efforts to control salary costs.
Occupancy, furniture and fixtures expense was $1,875 for the year ended December 31, 2010, an increase of $83, or 4.63%, from the prior year. The 2009 total was $1,792, an increase of $41, or 2.34%, from the $1,751 reported at year-end 2008. The small increases reported in both 2010 and 2009 are reflective of the Company’s emphasis on containing controllable expenses. On June 30, 2009, NBB consolidated one of its Tazewell, Virginia branch offices with a nearby office. Although this closure at mid-year did not produce significant cost savings in 2009, it is expected to assist in the Company’s future efforts to control its occupancy expense.
Data processing and ATM expense was $1,499 in 2010, $1,371 in 2009 and $1,381 in 2008. The increase of $128 or 9.34% from 2009 to 2010 was due to replacement of the Company’s host computer.
When the year ended December 31, 2009 and December 31, 2010 are compared, there was a significant decline in the Federal Deposit Insurance Corporation Deposit Insurance Fund assessment. The total expense for 2009 was $1,727, which compares to $1,080 for 2010. During the second quarter of 2009, all FDIC-insured banks, including NBB, were required to pay a one-time special assessment of five basis points of total assets, less Tier 1 Capital. There were no special assessments in 2010. By December 31, 2009, all FDIC-insured banks prepaid the estimated regular quarterly risk-based assessments for the fourth quarter of 2009 and all of 2010, 2011 and 2012. Given the severe impact of the economic downturn on some of the nation’s banks, the Company has no assurance that the FDIC will not impose future special assessments on insured banks or increase regular assessments to maintain the integrity of the Deposit Insurance Fund.
19
Credit card processing expense was $2,300 for the period ended December 31, 2010, an increase of $179, or 8.44% from 2009’s total of $2,121. Credit card processing expense in 2008 totaled $2,105. Credit card processing expense in 2009 increased $16, or 0.76%, from $2,105 in 2008. This expense is driven by the volume of credit card, debit card and merchant account transactions and by the level of merchant discount fees. It is subject to a degree of variability.
The expense for intangibles and goodwill amortization is related to acquisitions. There were no acquisitions in the last year, and certain expenses from past transactions have been fully amortized. This accounts for the $10, or 0.91% decline in 2010, from $1,093 for 2009 to $1,083 for 2010 and the $26, or 2.32%, decline reported for 2009.
Net costs of other real estate owned have decreased from $393 for the period ended December 31, 2009 to $214 in 2010. From 2008 to 2009, net costs of other real estate owned increased from $100 to $393. This expense category varies with the number of foreclosed properties owned by NBB and with the expense associated with each. It includes write-downs on other real estate owned plus other costs associated with carrying these properties, as well as gains or losses on the sale of other real estate. In 2010, write-downs on other real estate were $34. This compares with $308 in 2009. Other costs for these properties in 2010 were $151, while they were $79 in 2009. There was a total of $29 in losses on the sale of other real estate for 2010 and $6 in gains for 2009. Because the Company’s market area continues to experience the effects of the prolonged recession, it is anticipated that there will be additional foreclosures in the near future. This will result in an associated increase in the costs of other real estate owned.
Franchise taxes were $963 for the period ended December 31, 2010 and $885 for 2009. They increased from $823 to $885 from 2008 to 2009. State bank franchise taxes are based upon total equity, which increased in both 2009 and 2010.
The category of other operating expenses includes noninterest expense items such as professional services, stationery and supplies, telephone costs and charitable donations. For the year ended December 31, 2010, other operating expenses were $3,150. This compares with $3,135 for 2009 and $3,367 for 2008. The nominal $15 increase from 2009 to 2010 is the result of changes in several categories of expense, with no one item making a significant contribution to the total.
Income Taxes
Income tax expense for 2010 was $4,223 compared to $3,660 in 2009 and $3,645 in 2008. Tax exempt income is the primary difference between expected and actual income tax expense. The Company’s effective tax rates for 2010, 2009 and 2008 were 21.34%, 20.36% and 21.15%, respectively. The Company is subject to the 35% marginal tax rate. See Note 10 of the Notes to Consolidated Financial Statements for addition information relating to income taxes.
Effects of Inflation
The Company’s consolidated statements of income generally reflect the effects of inflation. Since interest rates, loan demand and deposit levels are related to inflation, the resulting changes are included in net income. The most significant item which does not reflect the effects of inflation is depreciation expense. Historical dollar values used to determine depreciation expense do not reflect the effects of inflation on the market value of depreciable assets after their acquisition.
Provision and Allowance for Loan Losses
The national recession and its effects on the local economy continued to impact the Company’s asset quality in 2010. Historically, national economic downturns have affected the Company’s market area less severely than other areas of the country. In addition, downturns and recoveries in the national economy typically have a delayed effect on the Company’s local economy.
At December 31, 2010 total nonperforming assets were $10,144 compared to $8,876 at December 31, 2009. See “Balance Sheet – Loans – Risk Elements” for additional detail about nonperforming assets. Net charge-offs increased by $2,105, with the ratio of net charge-offs to average loans increasing 36 basis points, from 0.10% in 2009 to 0.46% in 2010.
The Company’s internal credit risk analysis takes into consideration these trends in nonperforming loans and charge-offs. Based on the analysis, the Company increased the allowance for loan losses to $7,664, or 1.33% of loans at December 31, 2010. At December 31, 2009, the allowance for loan losses was $6,926, or 1.17% of loans. The provision for loan losses for 2010 was $3,409, an increase of $1,775 over 2009.
The current level of nonperforming assets is manageable in management’s opinion. Core earnings remain strong, and there are sufficient resources available to deal with these assets.
As previously mentioned, the increase in nonperforming assets is primarily the result of local economic conditions created by the recent national recession and a prolonged economic recovery. A high degree of uncertainty remains concerning the speed of recovery, and in particular the speed of the recovery in the Company’s relatively limited market area. For that reason, management is unable to predict with any degree of certainty whether and how much its asset quality may improve or continue to deteriorate. Based on current information, management believes the level of nonperforming assets will continue to compare well with peers, but will likely be high when considering its own historic level of nonperforming assets. Please see “Critical Accounting Policies” above for additional information.
20
|
|
Summary of Loan Loss Experience
|
A. Analysis of the Allowance for Loan Losses
The following tabulation shows average loan balances at the end of each period; changes in the allowance for loan losses arising from loans charged off and recoveries on loans previously charged off by loan category; and additions to the allowance which have been charged to operating expense:
|
December 31,
|
||||||||||||||||||||
|
2010
|
2009
|
2008
|
2007
|
2006
|
||||||||||||||||
|
Average net loans outstanding
|
$ | 586,133 | $ | 579,581 | $ | 538,868 | $ | 505,070 | $ | 488,624 | ||||||||||
|
Balance at beginning of year
|
6,926 | 5,858 | 5,219 | 5,157 | 5,449 | |||||||||||||||
|
Charge-offs:
|
||||||||||||||||||||
|
Commercial and industrial loans
|
1,969 | 83 | 146 | --- | 101 | |||||||||||||||
|
Real estate mortgage loans
|
53 | 181 | 24 | 66 | 6 | |||||||||||||||
|
Real estate construction loans
|
415 | --- | --- | 64 | --- | |||||||||||||||
|
Loans to individuals
|
373 | 383 | 441 | 341 | 352 | |||||||||||||||
|
Total loans charged off
|
2,810 | 647 | 611 | 471 | 459 | |||||||||||||||
|
Recoveries:
|
||||||||||||||||||||
|
Commercial and industrial loans
|
63 | 3 | 37 | 18 | 29 | |||||||||||||||
|
Real estate mortgage loans
|
9 | 16 | --- | 2 | 1 | |||||||||||||||
|
Real estate construction loans
|
--- | --- | --- | --- | --- | |||||||||||||||
|
Loans to individuals
|
67 | 62 | 94 | 90 | 88 | |||||||||||||||
|
Total recoveries
|
139 | 81 | 131 | 110 | 118 | |||||||||||||||
|
Net loans charged off
|
2,671 | 566 | 480 | 361 | 341 | |||||||||||||||
|
Additions charged to operations
|
3,409 | 1,634 | 1,119 | 423 | 49 | |||||||||||||||
|
Balance at end of year
|
$ | 7,664 | $ | 6,926 | $ | 5,858 | $ | 5,219 | $ | 5,157 | ||||||||||
|
Net charge-offs to average net loans outstanding
|
0.46 | % | 0.10 | % | 0.09 | % | 0.07 | % | 0.07 | % | ||||||||||
The majority of 2010 charge-offs stemmed from commercial and industrial loans, which increased $1,886 from 2009. Of the total commercial and industrial loan charge-offs, 69% was attributable to a small number of commercial real estate loans. The loans were designated impaired in 2009, and the Company’s impairment reserve as of December 31, 2009 exceeded the amount of the charge-offs taken in 2010.
The company charges off commercial loans at the time that a loss is confirmed. When delinquency status or other information indicates that the borrower will not repay the loan, the Company considers collateral value based upon a current appraisal. Any loan amount in excess of collateral value is charged off and the collateral is taken into other real estate owned.
Factors influencing management’s judgment in determining the amount of the loan loss provision charged to operating expense include: the quality of the loan portfolio as determined by management, the historical loan loss experience, diversification as to type of loans in the portfolio, the amount of secured as compared with unsecured loans and the value of underlying collateral, banking industry standards and averages, and general economic conditions.
21
B. Allocation of the Allowance for Loan Losses
The allowance for loan losses has been allocated according to the amount deemed necessary to provide for anticipated losses within the categories of loans for the years indicated as follows:
|
December 31,
|
||||||||||||||||||||||
|
2010
|
2009
|
2008
|
2007
|
2006
|
||||||||||||||||||
|
Allowance
Amount
|
Percent of
Loans in Each
Category to
Total
Loans
|
Allowance
Amount
|
Percent of
Loans in
Each
Category to
Total
Loans
|
Allowance
Amount
|
Percent of
Loans in
Each
Category to
Total Loans
|
Allowance
Amount
|
Percent of
Loans in
Each
Category to
Total
Loans
|
Allowance
Amount
|
Percent of
Loans in
Each
Category to
Total Loans
|
|||||||||||||
|
Commercial
and
industrial
loans
|
$
|
4,790
|
46.73
|
%
|
$
|
2,670
|
48.05
|
%
|
$
|
2,861
|
42.70
|
%
|
$
|
1,894
|
41.32
|
%
|
$
|
1,651
|
42.90
|
%
|
||
|
Real estate
mortgage
loans
|
1,014
|
30.05
|
%
|
980
|
28.01
|
%
|
1,213
|
28.22
|
%
|
951
|
27.73
|
%
|
935
|
25.17
|
%
|
|||||||
|
Real estate
construction
loans
|
1,151
|
8.00
|
%
|
1,941
|
7.72
|
%
|
614
|
10.54
|
%
|
396
|
8.90
|
%
|
342
|
6.75
|
%
|
|||||||
|
Loans to
individuals
|
580
|
15.22
|
%
|
1,049
|
16.22
|
%
|
1,048
|
18.54
|
%
|
1,830
|
22.05
|
%
|
1,867
|
25.18
|
%
|
|||||||
|
Unallocated
|
129
|
286
|
122
|
148
|
362
|
|||||||||||||||||
|
$
|
7,664
|
100.00
|
%
|
$
|
6,926
|
100.00
|
%
|
$
|
5,858
|
100.00
|
%
|
$
|
5,219
|
100.00
|
%
|
$
|
5,157
|
100.00
|
%
|
|||
An analysis of the allowance for loan losses by impairment basis follows:
|
December 31,
|
||||||||||||
|
2010
|
2009
|
2008
|
||||||||||
|
Impaired loans
|
$ | 8,791 | $ | 7,680 | $ | 3,576 | ||||||
|
Allowance related to impaired loans
|
1,200 | 2,495 | 679 | |||||||||
|
Allowance to impaired loans
|
13.65 | % | 32.49 | % | 18.99 | % | ||||||
|
Nonimpaired loans
|
567,652 | 582,267 | 571,981 | |||||||||
|
Allowance related to nonimpaired loans
|
6,464 | 4,431 | 5,179 | |||||||||
|
Allowance to nonimpaired loans
|
1.14 | % | 0.76 | % | 0.91 | % | ||||||
|
Total loans, net of unearned income and deferred fees
|
576,443 | 589,947 | 575,557 | |||||||||
|
Total allowance for loan losses
|
7,664 | 6,926 | 5,858 | |||||||||
|
Total allowance for total loans
|
1.33 | % | 1.17 | % | 1.02 | % | ||||||
The allowance percentage for impaired loans was 13.65%, 32.49% and 18.99% as of December 31, 2010, 2009 and 2008 respectively. The ratio is subject to fluctuation because impaired loans are individually evaluated. The amount of the individual impaired loan balances that exceeds the fair value is accrued in the allowance for loan losses.
The allowance percentage for nonimpaired loans was 1.14%, 0.76% and 0.91% as of December 31, 2010, 2009 and 2008 respectively. The allowance for nonimpaired loans is determined by applying historical charge-off percentages, as well as additional percentages for internal and external credit risk factors to groups of non-impaired loans. The ratio increased from prior years because of increased charge-off percentages and higher risk indications from other factors. The increase in the ratio for nonimpaired loans directed the increase in the ratio of total allowance to total loans.
22
Balance Sheet
On December 31, 2010, the Company had total assets of $1,022,238, an increase of $39,871, or 4.06%, over the total of $982,367 on December 31, 2009. For 2010, the growth in assets was entirely internally generated and was not the result of acquisitions. Total assets at December 31, 2009 were up by $46,993, or 5.02%, over the total in 2008.
Loans
The Company divides loans into four groups. Commercial and industrial loans include demand loans, single-payment loans, municipal loans, lines of credit, and commercial real estate secured by farmland, multi-family dwellings and non-farm/non-residential buildings. Real estate mortgage includes personal real estate loans and commercial real estate loans secured by 1-4 family properties. Real estate construction includes personal and commercial construction loans. Loans to individuals include dealer loans, unsecured and secured personal installment loans, equity lines and installment loans.
A. Types of Loans
|
December 31,
|
||||||||||||||||||||
|
2010
|
2009
|
2008
|
2007
|
2006
|
||||||||||||||||
|
Commercial and industrial loans
|
$ | 269,818 | $ | 283,998 | $ | 246,218 | $ | 216,830 | $ | 215,244 | ||||||||||
|
Real estate mortgage loans
|
173,533 | 165,542 | 162,757 | 145,542 | 126,302 | |||||||||||||||
|
Real estate construction loans
|
46,169 | 45,625 | 60,798 | 46,697 | 33,840 | |||||||||||||||
|
Loans to individuals
|
87,868 | 95,844 | 106,907 | 115,704 | 126,316 | |||||||||||||||
|
Total loans
|
$ | 577,388 | $ | 591,009 | $ | 576,680 | $ | 524,773 | $ | 501,702 | ||||||||||
|
Less unearned income and deferred fees
|
(945 | ) | (1,062 | ) | (1,123 | ) | (1,119 | ) | (1,059 | ) | ||||||||||
|
Total loans, net of unearned income
|
$ | 576,443 | $ | 589,947 | $ | 575,557 | $ | 523,654 | $ | 500,643 | ||||||||||
|
Less allowance for loans losses
|
(7,664 | ) | (6,926 | ) | (5,858 | ) | (5,219 | ) | (5,157 | ) | ||||||||||
|
Total loans, net
|
$ | 568,779 | $ | 583,021 | $ | 569,699 | $ | 518,435 | $ | 495,486 | ||||||||||
B. Maturities and Interest Rate Sensitivities
|
December 31, 2010
|
||||||||||||||||
|
< 1 Year
|
1 – 5 Years
|
After 5 Years
|
Total
|
|||||||||||||
|
Commercial and industrial
|
$ | 59,744 | $ | 52,872 | $ | 157,202 | $ | 269,818 | ||||||||
|
Real estate construction
|
28,575 | 17,594 | --- | 46,169 | ||||||||||||
|
Total
|
88,319 | 70,466 | 157,202 | 315,987 | ||||||||||||
|
Less loans with predetermined interest rates
|
25,740 | 10,049 | 21,733 | 57,522 | ||||||||||||
|
Loans with adjustable rates
|
$ | 62,579 | $ | 60,417 | $ | 135,469 | $ | 258,465 | ||||||||
23
C. Risk Elements
Nonaccrual, Restructured Loans and Past Due.
The following table presents aggregate amounts for nonaccrual loans, restructured loans, other real estate owned net, and accruing loans which are contractually past due ninety days or more as to interest or principal payments.
|
December 31,
|
||||||||||||||||||||
|
2010
|
2009
|
2008
|
2007
|
2006
|
||||||||||||||||
|
Nonaccrual loans:
|
||||||||||||||||||||
|
Commercial and industrial
|
$ | 974 | $ | 1,455 | $ | 1,333 | $ | 1,144 | $ | --- | ||||||||||
|
Real estate mortgage
|
964 | --- | --- | --- | --- | |||||||||||||||
|
Real estate construction
|
--- | 2,643 | --- | --- | --- | |||||||||||||||
|
Loans to individuals
|
--- | --- | --- | 6 | --- | |||||||||||||||
|
Total nonaccrual loans
|
$ | 1,938 | $ | 4,098 | $ | 1,333 | $ | 1,150 | $ | --- | ||||||||||
|
Restructured loans: (TDR Loans)
|
||||||||||||||||||||
|
Commercial and industrial
|
$ | 4,011 | $ | 2,652 | $ | --- | $ | --- | $ | --- | ||||||||||
|
Real estate mortgage
|
287 | --- | --- | --- | --- | |||||||||||||||
|
Real estate construction
|
2,185 | --- | --- | --- | --- | |||||||||||||||
|
Loans to individuals
|
--- | --- | --- | --- | --- | |||||||||||||||
|
Total restructured loans
|
6,483 | 2,652 | --- | --- | --- | |||||||||||||||
|
Total nonperforming loans
|
$ | 8,421 | $ | 6,750 | $ | 1,333 | $ | 1,150 | $ | --- | ||||||||||
|
Other real estate owned, net
|
1,723 | 2,126 | 1,984 | 263 | 390 | |||||||||||||||
|
Total nonperforming assets
|
$ | 10,144 | $ | 8,876 | $ | 3,317 | $ | 1,413 | $ | 390 | ||||||||||
|
Accruing loans past due 90 days or more:
|
||||||||||||||||||||
|
Commercial and industrial
|
$ | 658 | $ | 762 | $ | 663 | $ | 984 | $ | 338 | ||||||||||
|
Real estate mortgage
|
612 | 864 | 394 | 55 | 274 | |||||||||||||||
|
Real estate construction
|
--- | --- | --- | --- | --- | |||||||||||||||
|
Loans to individuals
|
66 | 71 | 70 | 142 | 69 | |||||||||||||||
| $ | 1,336 | $ | 1,697 | $ | 1,127 | $ | 1,181 | $ | 681 | |||||||||||
Loan loss and other industry indicators related to asset quality are presented in the Loan Loss Data table.
Loan Loss Data Table
|
2010
|
2009
|
2008
|
||||||||||
|
Provision for loan losses
|
$ | 3,409 | $ | 1,634 | $ | 1,119 | ||||||
|
Net charge-offs to average net loans
|
0.46 | % | 0.10 | % | 0.09 | % | ||||||
|
Allowance for loan losses to loans, net of unearned
income and deferred fees
|
1.33 | % | 1.17 | % | 1.02 | % | ||||||
|
Allowance for loan losses to nonperforming loans
|
91.01 | % | 102.61 | % | 439.46 | % | ||||||
|
Allowance for loan losses to nonperforming assets
|
75.55 | % | 78.03 | % | 176.61 | % | ||||||
|
Nonperforming assets to loans, net of unearned income
and deferred fees, plus other real estate owned
|
1.75 | % | 1.50 | % | 0.23 | % | ||||||
|
Nonaccrual loans
|
$ | 1,938 | $ | 4,098 | $ | 1,333 | ||||||
|
Restructured loans
|
6,483 | 2,652 | --- | |||||||||
|
Other real estate owned, net
|
1,723 | 2,126 | 1,984 | |||||||||
|
Total nonperforming assets
|
$ | 10,144 | $ | 8,876 | $ | 3,317 | ||||||
|
Accruing loans past due 90 days or more
|
$ | 1,336 | $ | 1,697 | $ | 1,127 | ||||||
Nonperforming loans include nonaccrual loans and restructured loans (“Troubled debt restructurings” or “TDR loans”), but do not include accruing loans 90 days or more past due. Impaired loans, or loans in which management has identified a weakness, but which may or may not be nonperforming, are presented in Note 5 of Notes to Consolidated Financial Statements. Total impaired loans at December 31, 2010 were $8,791, including $6,483 in troubled debt restructurings. Impaired loans in nonaccrual status amounted to $7,612. Impaired loans at December 31, 2009 and 2008 were $7,680 and $1,333, respectively. Impaired loans at December 31, 2009 included nonaccrual loans of $4,098 and one accruing restructured loan of $2,652. All impaired loans in 2008 were nonaccrual loans.
24
The ratio of the allowance for loan losses to total nonperforming loans decreased from 102.61% in 2009 to 91.01% in 2010. The Company believes the allowance for loan losses is adequate for the credit risk inherent in the loan portfolio. The decline in 2010 in the ratio stems from an increase in troubled debt restructuring (shown as “Restructured loans” above). While the increase in troubled debt restructurings caused an increase in nonperforming assets, troubled debt restructurings are also individually evaluated for impairment. Individual impairment measurement is a more precise estimate of the risk of loss than the estimate used for loans that are not designated as impaired.
Loans in nonaccrual status, including nonaccrual troubled debt restructurings, were $8,071 at December 31, 2010. Two credits composed $3,875 of nonaccruals, or 48%. The credits are secured by real estate, one by residential property and one by income-producing commercial property. Both credits are designated impaired, with a combined allowance of $144.
D. Troubled Debt Restructurings (TDR Loans)
In the ordinary course of business the Company modifies loan terms on a case-by-case basis, including both consumer and commercial loans, for a variety of reasons. Modifications to consumer loans generally involve short-term deferrals to accommodate specific, temporary circumstances. The Company may grant extensions to consumers who have demonstrated a willingness and ability to repay their loan but who are dealing with the consequences of a specific unforeseen temporary hardship event.
An extension defers monthly payments and requires a balloon payment at the original contractual maturity. Where the temporary event is not expected to impact a borrower’s ability to repay the debt, and where the Company expects to collect all amounts due including interest accrued at the contractual interest rate for the period of delay at contractual maturity, the modification is not designated a TDR.
Modifications to commercial loans may include, but are not limited to, changes in interest rate, maturity, amortization and financial covenants. In the original underwriting, loan terms are established that represent the then current and projected financial condition of the borrower. If the modified terms are consistent with competitive market conditions and representative of terms the borrower could otherwise obtain in the open market, the modified loan is not categorized as a TDR.
For a loan modification to be a TDR, the following three conditions must all be present: (1) the borrower is experiencing financial difficulty, (2) the Company makes a concession to the original contractual loan terms, and (3) the concessions are for economic or legal reasons related to the borrower’s financial difficulty that the Company would not otherwise consider.
Modifications of loan terms to borrowers experiencing financial difficulty are made in an attempt to protect as much of the Company’s investment in the loan as possible. The determination of whether a modification should be accounted for as a TDR requires significant judgment after consideration of all facts and circumstances surrounding the transaction.
Assuming all other TDR criteria are met, the Corporation considers one or a combination of the following concessions to the loan terms to indicate TDR status: a reduction of the stated interest rate, an extension of the maturity date at an interest rate lower than the current market rate for a new loan with a similar term, or forgiveness of principal or accrued interest.
The Company recognizes that the current economy, elevated levels of unemployment and depressed real estate values have resulted in many customers experiencing financial difficulties. The Company has restructured loan terms for certain qualified financially distressed borrowers who have agreed to work in good faith and have demonstrated the ability to make the restructured payments in order to avoid a foreclosure.
The Company had $6,483 in TDRs as of December 31, 2010 and $2,652 as of December 31, 2009. Accruing TDR loans amounted to $350 at December 31, 2010 compared to $2,652 at December 31, 2009. All TDR loans are specifically assessed for impairment for purposes of determining the allowance for loan losses. TDR loans with an impairment loss are maintained on nonaccrual until the borrower demonstrates sustained repayment history under the restructured terms and continued repayment is not in doubt. Otherwise, interest income is recognized using a cost recovery method.
Restructuring generally results in loans with either lower payments or an extended maturity beyond that originally required, and are expected to have a lower risk of loss due to nonperformance than loans classified as nonperforming. The Company’s experience with TDR loan performance is relatively new, and it has not yet gained historical experience with TDR loans. The Company has not observed a consistent pattern regarding the frequency of redefaults based on the passage of time.
25
At December 31, 2010, the delinquency status of the Company’s TDR loans was as follows:
|
Accruing
|
||||||||||||||||||||
|
Total TDR Loans
|
Current
|
30-89 Days Past Due
|
90+ Days
Past Due
|
Nonaccrual
|
||||||||||||||||
|
Commercial & Industrial
|
$ | 4,011 | $ | 350 | $ | --- | $ | --- | $ | 3,661 | ||||||||||
|
Real Estate Mortgage
|
287 | --- | --- | --- | 287 | |||||||||||||||
|
Construction Real Estate
|
2,185 | --- | --- | --- | 2,185 | |||||||||||||||
|
Total TDR Loans
|
$ | 6,483 | $ | 350 | $ | --- | $ | --- | $ | 6,133 | ||||||||||
At December 31, 2009, the Company had one commercial real estate loan of $2,652 designated as a TDR. The increase in TDR loans stems from the ongoing negative economic environment and from recent accounting guidance. The Company expects that troubled debt restructurings will continue until the economy recovers, bringing improvement in the unemployment rate and the depressed real estate market.
Securities
The total amortized cost of securities available for sale at December 31, 2010 was $185,045, and total fair value was $184,907. This represents an increase of $16,866, or 10.04%, when compared with the fair value of securities available for sale of $168,041 at December 31, 2009.
At December 31, 2010, the total amortized cost of securities held to maturity was $131,000 and fair value was $129,913. This compares with amortized cost of $129,376 and fair value of $129,892 at the same period in 2009 and represents an increase of $1,624, or 1.26%, when amortized cost for the two periods is compared. Both categories of securities increased in 2010, as liquidity from deposit growth outpaced loan opportunities. The Company elected to designate a greater portion of new securities as available for sale instead of held to maturity.
Additional information about securities available for sale and securities held to maturity can be found in Note 3 of the Notes to Consolidated Financial Statements.
The financial markets have experienced increased volatility and increased risk during the economic downturn. The risk in financial markets affects the Company in the same way that it affects other institutional and individual investors. The Company’s investment portfolio includes corporate bonds. If, because of economic hardship, the corporate issuers were to default, there could be a delay in the payment of interest, or there could be a loss of principal and accrued interest. To date, there have been no defaults in any of the corporate bonds held in the portfolio. The Company’s investment portfolio also contains a large percentage of municipal bonds. The recession and a slow recovery may negatively impact the ability of states and municipalities to make scheduled principal and interest payments on their outstanding indebtedness. If their income from taxes and other sources declines significantly because of the recession, states and municipalities could default on their bond obligations. The risk is at this point hypothetical, because there have been no defaults among the municipal bonds in the Company’s investment portfolio.
In making investment decisions, management follows internal policy guidelines that help to limit risk by specifying parameters for both security quality and industry and geographic concentrations. Management regularly monitors the quality of the investment portfolio and tracks changes in financial markets. The value of individual securities will be written down if a decline in fair value is considered to be other than temporary, given the totality of the circumstances.
26
|
|
Maturities and Associated Yields
|
The following table presents the maturities for securities available for sale and held to maturity at their carrying values as of December 31, 2010 and weighted average yield for each range of maturities.
|
Maturities and Yields
|
||||||||||||||||||||||||
|
$ in thousands, except percent data
|
December 31, 2010
|
|||||||||||||||||||||||
|
< 1 Year
|
1-5 Years
|
5-10 Years
|
> 10 Years
|
None
|
Total
|
|||||||||||||||||||
|
Available for Sale:
|
|
|||||||||||||||||||||||
|
U.S. Treasury
|
$ | --- | $ | 2,183 | $ | --- | $ | --- | $ | --- | $ | 2,183 | ||||||||||||
| --- | 3.97 | % | --- | --- | --- | 3.97 | % | |||||||||||||||||
|
U.S. Government agencies
|
1,004 | 4,250 | 5,955 | 76,943 | --- | 88,152 | ||||||||||||||||||
| 4.50 | % | 4.16 | % | 3.97 | % | 4.15 | % | --- | 4.14 | % | ||||||||||||||
|
Mortgage-backed securities
|
292 | 3,937 | 2,747 | 4,403 | --- | 11,379 | ||||||||||||||||||
| 4.03 | % | 4.81 | % | 5.07 | % | 5.33 | % | --- | 5.05 | % | ||||||||||||||
|
States and political subdivision – taxable
|
981 | 1,777 | --- | --- | --- | 2,758 | ||||||||||||||||||
| 4.20 | % | 4.83 | % | --- | --- | --- | 4.61 | % | ||||||||||||||||
|
States and political subdivision – nontaxable (1)
|
7,247 | 26,412 | 13,267 | 11,998 | --- | 58,924 | ||||||||||||||||||
| 5.56 | % | 5.74 | % | 5.73 | % | 5.80 | % | --- | 5.73 | % | ||||||||||||||
|
Corporate
|
1,037 | 16,643 | --- | --- | --- | 17,680 | ||||||||||||||||||
| 5.03 | % | 4.85 | % | --- | --- | --- | 4.86 | % | ||||||||||||||||
|
Federal Home Loan Bank stock
|
--- | --- | --- | --- | 1,677 | 1,677 | ||||||||||||||||||
| --- | --- | --- | --- | 0.01 | % | 0.01 | % | |||||||||||||||||
|
Federal Reserve Bank stock
|
--- | --- | --- | --- | 92 | 92 | ||||||||||||||||||
| --- | --- | --- | --- | 6.0 | % | 6.0 | % | |||||||||||||||||
|
Other securities
|
492 | --- | --- | --- | 1,570 | 2,062 | ||||||||||||||||||
| 0.16 | % | --- | --- | --- | 2.65 | % | 2.05 | % | ||||||||||||||||
|
Total
|
$ | 11,053 | $ | 55,202 | $ | 21,969 | $ | 93,344 | $ | 3,339 | $ | 184,907 | ||||||||||||
| 5.02 | % | 5.18 | % | 5.17 | % | 4.42 | % | 1.41 | % | 4.72 | % | |||||||||||||
|
Held to Maturity:
|
||||||||||||||||||||||||
|
U.S. Government agencies
|
$ | 1,999 | $ | 1,000 | $ | 2,008 | $ | 8,067 | $ | --- | $ | 13,074 | ||||||||||||
| 4.36 | % | 5.00 | % | 4.39 | % | 4.30 | % | --- | 4.38 | % | ||||||||||||||
|
Mortgage-backed securities
|
--- | --- | --- | 1,142 | --- | 1,142 | ||||||||||||||||||
| --- | --- | --- | 5.63 | % | --- | 5.63 | % | |||||||||||||||||
|
States and political subdivision – taxable
|
--- | 2,000 | 1,021 | 1,012 | --- | 4,033 | ||||||||||||||||||
| --- | 5.32 | % | 4.47 | % | 5.52 | % | --- | 5.15 | % | |||||||||||||||
|
States and political subdivision – nontaxable (1)
|
1,674 | 17,958 | 12,755 | 76,205 | --- | 108,592 | ||||||||||||||||||
| 5.91 | % | 6.15 | % | 5.71 | % | 6.11 | % | --- | 6.07 | % | ||||||||||||||
|
Corporate
|
500 | 1,659 | 2,000 | --- | --- | 4,159 | ||||||||||||||||||
| 6.50 | % | 4.01 | % | 5.03 | % | --- | --- | 4.80 | % | |||||||||||||||
|
Total
|
$ | 4,173 | $ | 22,617 | $ | 17,784 | $ | 86,426 | $ | --- | $ | 131,000 | ||||||||||||
| 5.24 | % | 5.87 | % | 5.41 | % | 5.93 | % | --- | 5.83 | % | ||||||||||||||
|
|
(1) Rates shown represent weighted average yield on a fully taxable basis.
|
The majority of mortgage-backed securities and collateralized mortgage obligations held at December 31, 2010 were backed by U.S. agencies. Certain holdings are required to be periodically subjected to the Federal Financial Institution Examination Council’s (FFIEC) high risk mortgage security test. These tests address possible fluctuations in the average life and variances caused by the change in rate times the change in volume have been allocated to rate and volume changes proportional to the relationship of the absolute dollar amounts of the change in each. Except for U.S. Government securities, the Company has no securities with any issuer that exceeds 10% of stockholders’ equity.
27
|
|
Deposits
|
Total deposits increased by $32,471, or 3.81%, from $852,112 at December 31, 2009 to $884,583 at December 31, 2010. Total deposits grew $34,264, or 4.19%, from $817,848 at December 31, 2008 to the same period in 2009. A portion of the increase in both 2010 and 2009 is attributable to a higher level of municipal deposits. The increases in total deposits for 2010 and 2009 were internally generated and not the result of acquisitions.
A. Average Amounts of Deposits and Average Rates Paid
|
|
Average amounts and average rates paid on deposit categories are presented below:
|
|
Year Ended December 31,
|
||||||||||||||
|
2010
|
2009
|
2008
|
||||||||||||
|
Average
Amounts
|
Average
Rates
Paid
|
Average
Amounts
|
Average
Rates
Paid
|
Average
Amounts
|
Average
Rates
Paid
|
|||||||||
|
Noninterest-bearing demand deposits
|
$
|
122,817
|
---
|
$
|
115,241
|
---
|
$
|
112,608
|
---
|
|||||
|
Interest-bearing demand deposits
|
322,705
|
1.03
|
%
|
282,532
|
1.09
|
%
|
243,409
|
1.43
|
%
|
|||||
|
Savings deposits
|
54,543
|
0.09
|
%
|
48,992
|
0.11
|
%
|
45,796
|
0.29
|
%
|
|||||
|
Time deposits
|
352,888
|
2.20
|
%
|
399,872
|
3.17
|
%
|
381,961
|
3.98
|
%
|
|||||
|
Average total deposits
|
$
|
852,953
|
1.53
|
%
|
$
|
846,637
|
2.16
|
%
|
$
|
783,774
|
2.80
|
%
|
||
B. Time Deposits of $100,000 or More
The following table sets forth time certificates of deposit and other time deposits of $100,000 or more:
|
December 31, 2010
|
||||||||||||||||||||
|
3 Months or Less
|
Over 3 Months Through 6 Months
|
Over 6 Months
Through 12 Months
|
Over 12 Months
|
Total
|
||||||||||||||||
|
Total time deposits of $100,000 or more
|
$ | 30,185 | $ | 19,242 | $ | 45,393 | $ | 44,661 | $ | 139,481 | ||||||||||
Derivatives and Market Risk Exposures
The Company is not a party to derivative financial instruments with off-balance sheet risks such as futures, forwards, swaps, and options. The Company is a party to financial instruments with off-balance sheet risks such as commitments to extend credit, standby letters of credit, and recourse obligations in the normal course of business to meet the financing needs of its customers. See Note 14, of Notes to Consolidated Financial Statements for additional information relating to financial instruments with off-balance sheet risk. Management does not plan any future involvement in high risk derivative products. The Company has investments in mortgage-backed securities, principally GNMA’s and FNMA’s, with a fair value of approximately $12,617. See Note 3 of Notes to Consolidated Financial Statements for additional information relating to securities.
The Company’s securities and loans are subject to credit and interest rate risk, and its deposits are subject to interest rate risk. Management considers credit risk when a loan is granted and monitors credit risk after the loan is granted. The Company maintains an allowance for loan losses to absorb losses in the collection of its loans. See Note 5 of Notes to Consolidated Financial Statements for information relating to the allowance for loan losses. See Note 15 of Notes to Consolidated Financial Statements for information relating to concentrations of credit risk. The Company has an asset/liability program to manage its interest rate risk. This program provides management with information related to the rate sensitivity of certain assets and liabilities and the effect of changing rates on profitability and capital accounts.
The effects of changing interest rates are primarily managed through adjustments to the loan portfolio and deposit base, to the extent competitive factors allow. The investment portfolio is generally longer term. Adjustments for asset and liability management concerns are addressed when securities are called or mature and funds are subsequently reinvested. Historically, securities have been sold for reasons related to credit quality or regulatory limitations. Few, if any, securities available for sale have been disposed of for the express purpose of managing interest rate risk. No trading activity for this purpose is planned in the foreseeable future, though it does remain an option.
While the asset/liability planning program is designed to protect the Company over the long term, it does not provide near-term protection from interest rate shocks, as interest rate sensitive assets and liabilities do not by their nature move up or down in tandem in response to changes in the overall rate environment. The Company’s profitability in the near term may be temporarily negatively affected in a period of rapidly rising or rapidly falling rates, because it takes some time for the Company to change its rates to adjust to a new interest rate environment. See Note 16 of Notes to Consolidated Financial Statements for information relating to fair value of financial instruments and comments concerning interest rate sensitivity.
28
Liquidity
Liquidity measures the Company’s ability to meet its financial commitments at a reasonable cost. Demands on the Company’s liquidity include funding additional loan demand and accepting withdrawals of existing deposits. The Company has diverse liquidity sources, including customer and purchased deposits, customer repayments of loan principal and interest, sales, calls and maturities of securities, Federal Reserve discount window borrowing, short-term borrowing, and Federal Home Loan Bank advances. At December 31, 2010, the bank did not have discount window borrowings, short-term borrowings, or FHLB advances. To assure that short-term borrowing is readily available, the Company tests accessibility annually.
Liquidity from securities is restricted by accounting and business considerations. The securities portfolio is segregated into available-for-sale and held-to-maturity. The Company considers only securities designated available-for-sale for typical liquidity needs. Further, portions of the securities portfolio are pledged to meet state requirements for public funds deposits. Discount window borrowings also require pledged securities. Increased/decreased liquidity from public funds deposits or discount window borrowings results in increased/decreased liquidity from pledging requirements. The Company monitors public funds pledging requirements and unpledged available-for-sale securities accessible for liquidity needs.
Regulatory capital levels determine the Company’s ability to use purchased deposits and the Federal Reserve discount window. At December 31, 2010, the Company is considered well capitalized and does not have any restrictions on purchased deposits or the Federal Reserve discount window.
The Company monitors factors that may increase its liquidity needs. Some of these factors include deposit trends, large depositor activity, maturing deposit promotions, interest rate sensitivity, maturity and repricing timing gaps between assets and liabilities, the level of unfunded loan commitments and loan growth. At December 31, 2010, the Company’s liquidity is sufficient to meet projected trends in these areas.
To monitor and estimate liquidity levels, the Company performs stress testing under varying assumptions on credit sensitive liabilities and the sources and amounts of balance sheet and external liquidity available to replace outflows. The Company’s Contingency Funding Plan sets forth avenues for rectifying liquidity shortfalls. At December 31, 2010, the analysis indicated adequate liquidity under the tested scenarios.
The Company utilizes several other strategies to maintain sufficient liquidity. Loan and deposit growth are managed to keep the loan to deposit ratio within the Company’s own policy range of 65% to 75%. At December 31, 2010, the loan to deposit ratio was 65.17%. The investment strategy takes into consideration the term of the investment, and securities in the available for sale portfolio are laddered based upon projected funding needs.
Recent Accounting Pronouncements
See Note 1 of Notes to Consolidated Financial Statements for information relating to recent accounting pronouncements.
Capital Resources
Total stockholders’ equity at December 31, 2010 was $129,187, an increase of $7,111, or 5.83%, from the $122,076 at December 31, 2009. The largest factor in determining 2010 stockholders’ equity were retained earnings of $123,161, which included net income of $15,569, offset by dividends of $6,309.
Total stockholders’ equity grew by $11,968, or 10.87%, from $110,108 on December 31, 2008 to $122,076 on December 31, 2009. Earnings, net of the change in unrealized gains and losses for securities available for sale and dividends paid, accounted for most of the increase in 2009. Exercised stock options provided $54 in 2009.
The Tier I and Tier II risk-based capital ratios at December 31, 2010 were 18.2% and 19.4%, respectively. Capital ratios are significantly above the regulatory minimum requirements of 4.0% for Tier I and 8.0% for Tier II. The Tier I and Tier II risk-based capital ratios at December 31, 2009 were 16.3% and 17.3%, respectively.
29
Off-Balance Sheet Arrangements
The Company’s off-balance sheet arrangements at December 31, 2010 are detailed in the table below.
|
Payments Due by Period
|
||||||||||||||||||||
|
Total
|
Less Than 1 Year
|
1-3 Years
|
3-5 Years
|
More Than 5 Years
|
||||||||||||||||
|
Commitments to extend credit
|
$ | 149,106 | $ | 149,106 | $ | --- | $ | --- | $ | --- | ||||||||||
|
Standby letters of credit
|
13,540 | 13,540 | --- | --- | --- | |||||||||||||||
|
Mortgage loans with potential recourse
|
19,595 | 19,595 | --- | --- | --- | |||||||||||||||
|
Operating leases
|
950 | 228 | 449 | 249 | 24 | |||||||||||||||
|
Total
|
$ | 183,191 | $ | 182,469 | $ | 449 | $ | 249 | $ | 24 | ||||||||||
In the normal course of business the Company’s banking affiliate extends lines of credit to its customers. Amounts drawn upon these lines vary at any given time depending on the business needs of the customers.
Standby letters of credit are also issued to the bank’s customers. There are two types of standby letters of credit. The first is a guarantee of payment to facilitate customer purchases. The second type is a performance letter of credit that guarantees a payment if the customer fails to perform a specific obligation. Revenue from these letters was approximately $44 in 2010.
While it would be possible for customers to draw in full on approved lines of credit and letters of credit, historically this has not occurred. In the event of a sudden and substantial draw on these lines, the Company has its own lines of credit on which it can draw funds. A sale of loans or investments would also be an option.
The Company sells mortgages on the secondary market for which there are recourse agreements should the borrower default. The mortgages originated must meet strict underwriting and documentation requirements for the sale to be completed. The Company estimates a potential loss reserve for recourse provisions. The amount is not material as of December 31, 2010. To date, no recourse provisions have been invoked.
Operating leases are for buildings used in the Company’s day-to-day operations.
Information about market risk is set forth above in the “Interest Rate Sensitivity” and “Derivatives and Market Risk Exposure” sections of the Management’s Discussion and Analysis.
30
Consolidated Balance Sheets
|
December 31,
|
||||||||
|
$ in thousands, except share data
|
2010
|
2009
|
||||||
|
Assets
|
||||||||
|
Cash and due from banks
|
$ | 9,858 | $ | 12,894 | ||||
|
Interest-bearing deposits
|
69,400 | 32,730 | ||||||
|
Securities available for sale, at fair value
|
184,907 | 168,041 | ||||||
|
Securities held to maturity (fair value approximates $129,913 at December 31, 2010 and $129,892 at
December 31, 2009)
|
131,000 | 129,376 | ||||||
|
Mortgage loans held for sale
|
2,460 | 126 | ||||||
|
Loans:
|
||||||||
|
Real estate construction loans
|
46,169 | 45,625 | ||||||
|
Real estate mortgage loans
|
173,533 | 165,542 | ||||||
|
Commercial and industrial loans
|
269,818 | 283,998 | ||||||
|
Loans to individuals
|
87,868 | 95,844 | ||||||
|
Total loans
|
577,388 | 591,009 | ||||||
|
Less unearned income and deferred fees
|
(945 | ) | (1,062 | ) | ||||
|
Loans, net of unearned income and deferred fees
|
576,443 | 589,947 | ||||||
|
Less allowance for loan losses
|
(7,664 | ) | (6,926 | ) | ||||
|
Loans, net
|
568,779 | 583,021 | ||||||
|
Premises and equipment, net
|
10,470 | 10,628 | ||||||
|
Accrued interest receivable
|
6,016 | 6,250 | ||||||
|
Other real estate owned, net
|
1,723 | 2,126 | ||||||
|
Intangible assets and goodwill
|
11,543 | 12,626 | ||||||
|
Other assets
|
26,082 | 24,549 | ||||||
|
Total assets
|
$ | 1,022,238 | $ | 982,367 | ||||
|
Liabilities and Stockholders’ Equity
|
||||||||
|
Noninterest-bearing demand deposits
|
$ | 131,540 | $ | 122,549 | ||||
|
Interest-bearing demand deposits
|
365,040 | 310,629 | ||||||
|
Saving deposits
|
55,800 | 51,622 | ||||||
|
Time deposits
|
332,203 | 367,312 | ||||||
|
Total deposits
|
884,583 | 852,112 | ||||||
|
Accrued interest payable
|
257 | 336 | ||||||
|
Other liabilities
|
8,211 | 7,843 | ||||||
|
Total liabilities
|
893,051 | 860,291 | ||||||
|
Commitments and contingencies
|
--- | --- | ||||||
|
Stockholders’ equity:
|
||||||||
|
Preferred stock, no par value, 5,000,000 shares authorized; none issued and outstanding
|
--- | --- | ||||||
|
Common stock of $1.25 par value. Authorized 10,000,000 shares; issued and outstanding, 6,933,474 shares – 2010 and 2009
|
8,667 | 8,667 | ||||||
|
Retained earnings
|
123,161 | 113,901 | ||||||
|
Accumulated other comprehensive (loss), net
|
(2,641 | ) | (492 | ) | ||||
|
Total stockholders’ equity
|
129,187 | 122,076 | ||||||
|
Total liabilities and stockholders’ equity
|
$ | 1,022,238 | $ | 982,367 | ||||
The accompanying notes are an integral part of these consolidated financial statements.
31
Consolidated Statements of Income
|
Years ended December 31,
|
||||||||||||
|
$ in thousands, except per share data
|
2010
|
2009
|
2008
|
|||||||||
|
Interest Income
|
||||||||||||
|
Interest and fees on loans
|
$ | 36,919 | $ | 37,578 | $ | 37,108 | ||||||
|
Interest on interest-bearing deposits
|
128 | 90 | 449 | |||||||||
|
Interest on securities – taxable
|
5,588 | 6,273 | 6,816 | |||||||||
|
Interest on securities – nontaxable
|
6,504 | 6,546 | 5,738 | |||||||||
|
Total interest income
|
49,139 | 50,487 | 50,111 | |||||||||
|
Interest Expense
|
||||||||||||
|
Interest on time deposits of $100,000 or more
|
3,439 | 5,417 | 6,004 | |||||||||
|
Interest on other deposits
|
7,719 | 10,405 | 12,802 | |||||||||
|
Interest on borrowed funds
|
--- | 3 | 12 | |||||||||
|
Total interest expense
|
11,158 | 15,825 | 18,818 | |||||||||
|
Net interest income
|
37,981 | 34,662 | 31,293 | |||||||||
|
Provision for loan losses
|
3,409 | 1,634 | 1,119 | |||||||||
|
Net interest income after provision for loan losses
|
34,572 | 33,028 | 30,174 | |||||||||
|
Noninterest Income
|
||||||||||||
|
Service charges on deposit accounts
|
2,858 | 3,314 | 3,425 | |||||||||
|
Other service charges and fees
|
317 | 343 | 326 | |||||||||
|
Credit card fees
|
2,954 | 2,803 | 2,808 | |||||||||
|
Trust income
|
1,118 | 1,053 | 1,231 | |||||||||
|
BOLI income
|
760 | 756 | 684 | |||||||||
|
Other income
|
354 | 491 | 438 | |||||||||
|
Realized securities gains (losses), net
|
(14 | ) | 44 | 175 | ||||||||
|
Total noninterest income
|
8,347 | 8,804 | 9,087 | |||||||||
|
Noninterest Expense
|
||||||||||||
|
Salaries and employee benefits
|
10,963 | 11,336 | 11,168 | |||||||||
|
Occupancy and furniture and fixtures
|
1,875 | 1,792 | 1,751 | |||||||||
|
Data processing and ATM
|
1,499 | 1,371 | 1,381 | |||||||||
|
FDIC assessment
|
1,080 | 1,727 | 209 | |||||||||
|
Credit card processing
|
2,300 | 2,121 | 2,105 | |||||||||
|
Intangible assets amortization
|
1,083 | 1,093 | 1,119 | |||||||||
|
Net costs of other real estate owned
|
214 | 393 | 100 | |||||||||
|
Franchise taxes
|
963 | 885 | 823 | |||||||||
|
Other operating expenses
|
3,150 | 3,135 | 3,367 | |||||||||
|
Total noninterest expense
|
23,127 | 23,853 | 22,023 | |||||||||
|
Income before income taxes
|
19,792 | 17,979 | 17,238 | |||||||||
|
Income tax expense
|
4,223 | 3,660 | 3,645 | |||||||||
|
Net income
|
$ | 15,569 | $ | 14,319 | $ | 13,593 | ||||||
|
Basic net income per share
|
$ | 2.25 | $ | 2.07 | $ | 1.96 | ||||||
|
Fully diluted net income per share
|
$ | 2.24 | $ | 2.06 | $ | 1.96 | ||||||
The accompanying notes are an integral part of these consolidated financial statements.
32
Consolidated Statements of Changes in Stockholders’ Equity
|
$ in thousands, except per share data
|
Common Stock
|
Retained Earnings
|
Accumulated Other Comprehensive Income (Loss)
|
Comprehensive Income
|
Total
|
|||||||||||||||
|
Balance at December 31, 2007
|
$ | 8,690 | $ | 97,810 | $ | (1,700 | ) | $ | 104,800 | |||||||||||
|
Net income
|
--- | 13,593 | --- | $ | 13,593 | 13,593 | ||||||||||||||
|
Other comprehensive loss:
|
||||||||||||||||||||
|
Unrealized holding losses on available for sale securities net of deferred taxes of ($908)
|
--- | --- | --- | (1,690 | ) | --- | ||||||||||||||
|
Reclassification adjustment, net of income taxes of ($51)
|
--- | --- | --- | (96 | ) | --- | ||||||||||||||
|
Minimum pension liability adjustment, net of deferred taxes of ($230)
|
--- | --- | --- | (427 | ) | --- | ||||||||||||||
|
Other comprehensive loss, net of tax of ($1,189)
|
--- | --- | (2,213 | ) | (2,213 | ) | (2,213 | ) | ||||||||||||
|
Total comprehensive income
|
--- | --- | --- | $ | 11,380 | --- | ||||||||||||||
|
Adjustments to apply measurement data
provision of ASC 715, net of tax of ($24)
|
--- | (45 | ) | 3 | (42 | ) | ||||||||||||||
|
Cash dividend ($0.80 per share)
|
--- | (5,543 | ) | --- | (5,543 | ) | ||||||||||||||
|
Exercise of stock options
|
8 | 67 | --- | 75 | ||||||||||||||||
|
Common stock repurchased
|
(36 | ) | (526 | ) | --- | (562 | ) | |||||||||||||
|
Balance at December 31, 2008
|
$ | 8,662 | $ | 105,356 | $ | (3,910 | ) | $ | 110,108 | |||||||||||
|
Net income
|
--- | 14,319 | --- | $ | 14,319 | 14,319 | ||||||||||||||
|
Other comprehensive income:
|
||||||||||||||||||||
|
Unrealized holding gains on available for sale securities net of deferred taxes of $1,720
|
--- | --- | --- | 3,193 | --- | |||||||||||||||
|
Reclassification adjustment, net of income taxes of ($10)
|
--- | --- | --- | (19 | ) | --- | ||||||||||||||
|
Minimum pension liability adjustment, net of deferred taxes of $131
|
--- | --- | --- | 244 | --- | |||||||||||||||
|
Other comprehensive income, net of tax of $1,841
|
--- | --- | 3,418 | 3,418 | 3,418 | |||||||||||||||
|
Total comprehensive income
|
--- | --- | --- | $ | 17,737 | --- | ||||||||||||||
|
Cash dividend ($0.84 per share)
|
--- | (5,823 | ) | --- | (5,823 | ) | ||||||||||||||
|
Exercise of stock options
|
5 | 49 | --- | 54 | ||||||||||||||||
|
Balance at December 31, 2009
|
$ | 8,667 | $ | 113,901 | $ | (492 | ) | $ | 122,076 | |||||||||||
|
Net income
|
--- | 15,569 | --- | $ | 15,569 | 15,569 | ||||||||||||||
|
Other comprehensive loss:
|
||||||||||||||||||||
|
Unrealized holding losses on available for sale securities net of deferred taxes of ($923)
|
--- | --- | --- | (1,716 | ) | --- | ||||||||||||||
|
Reclassification adjustment, net of income taxes of $7
|
--- | --- | --- | (12 | ) | --- | ||||||||||||||
|
Minimum pension liability adjustment, net of deferred taxes of ($227)
|
--- | --- | --- | (421 | ) | --- | ||||||||||||||
|
Other comprehensive loss, net of tax of ($1,157)
|
--- | --- | (2,149 | ) | (2,149 | ) | (2,149 | ) | ||||||||||||
|
Total comprehensive income
|
--- | --- | --- | $ | 13,420 | --- | ||||||||||||||
|
Cash dividend ($0.91 per share)
|
--- | (6,309 | ) | --- | (6,309 | ) | ||||||||||||||
|
Balance at December 31, 2010
|
$ | 8,667 | $ | 123,161 | $ | (2,641 | ) | $ | 129,187 | |||||||||||
The accompanying notes are an integral part of these consolidated financial statements.
33
Consolidated Statements of Cash Flows
|
Years Ended December 31,
|
||||||||||||
|
$ in thousands
|
2010
|
2009
|
2008
|
|||||||||
|
Cash Flows from Operating Activities
|
||||||||||||
|
Net income
|
$ | 15,569 | $ | 14,319 | $ | 13,593 | ||||||
|
Adjustment to reconcile net income to net cash provided by operating activities:
|
||||||||||||
|
Provision for loan losses
|
3,409 | 1,634 | 1,119 | |||||||||
|
Deferred income tax benefit
|
(312 | ) | (1,057 | ) | (310 | ) | ||||||
|
Depreciation of premises and equipment
|
886 | 906 | 965 | |||||||||
|
Amortization of intangibles
|
1,083 | 1,093 | 1,119 | |||||||||
|
Amortization of premiums and accretion of discounts, net
|
300 | 357 | 250 | |||||||||
|
(Gains) losses on disposal of fixed assets
|
(5 | ) | --- | 32 | ||||||||
|
(Gains) on sale and calls of securities available for sale, net
|
(19 | ) | (29 | ) | (147 | ) | ||||||
|
(Gains) losses on calls of securities held to maturity, net
|
33 | (15 | ) | (28 | ) | |||||||
|
Losses and writedowns on other real estate owned
|
63 | 309 | 6 | |||||||||
|
Originations of mortgage loans held for sale
|
(21,929 | ) | (25,265 | ) | (13,594 | ) | ||||||
|
Sales of mortgage loans held for sale
|
19,595 | 25,487 | 13,466 | |||||||||
|
Net change in:
|
||||||||||||
|
Accrued interest receivable
|
234 | (490 | ) | (49 | ) | |||||||
|
Other assets
|
17 | (3,564 | ) | (1,414 | ) | |||||||
|
Accrued interest payable
|
(79 | ) | (319 | ) | (137 | ) | ||||||
|
Other liabilities
|
(280 | ) | 1,508 | 993 | ||||||||
|
Net cash provided by operating activities
|
18,565 | 14,874 | 15,864 | |||||||||
|
Cash Flows from Investing Activities
|
||||||||||||
|
Net change in interest-bearing deposits
|
(36,670 | ) | (3,074 | ) | 31 | |||||||
|
Proceeds from repayments of mortgage-backed securities
|
5,817 | 7,119 | 5,394 | |||||||||
|
Proceeds from sales of securities available for sale
|
--- | --- | 290 | |||||||||
|
Proceeds from calls and maturities of securities available for sale
|
68,565 | 22,446 | 19,636 | |||||||||
|
Proceeds from calls and maturities of securities held to maturity
|
39,234 | 36,951 | 29,003 | |||||||||
|
Purchases of securities available for sale
|
(93,862 | ) | (45,439 | ) | (16,800 | ) | ||||||
|
Purchases of securities held to maturity
|
(41,297 | ) | (49,003 | ) | (32,350 | ) | ||||||
|
Purchases of loan participations
|
(55 | ) | (13 | ) | (1,614 | ) | ||||||
|
Collections of loan participations
|
876 | 727 | 1,021 | |||||||||
|
Loan originations and principal collections, net
|
7,820 | (16,662 | ) | (53,715 | ) | |||||||
|
Purchase of bank-owned life insurance
|
--- | --- | (2,250 | ) | ||||||||
|
Proceeds from disposal of other real estate owned
|
2,393 | 460 | 67 | |||||||||
|
Recoveries on loans charged off
|
139 | 81 | 131 | |||||||||
|
Additions to premises and equipment
|
(728 | ) | (330 | ) | (351 | ) | ||||||
|
Proceeds from sale of premises and equipment
|
5 | --- | 166 | |||||||||
|
Net cash used in investing activities
|
(47,763 | ) | (46,737 | ) | (51,341 | ) | ||||||
|
Cash Flows from Financing Activities
|
||||||||||||
|
Net change in time deposits
|
(35,109 | ) | (39,161 | ) | 25,616 | |||||||
|
Net change in other deposits
|
67,580 | 73,425 | 15,893 | |||||||||
|
Net change in other borrowed funds
|
--- | (54 | ) | (10 | ) | |||||||
| (continued) | ||||||||||||
34
|
Cash dividends paid
|
(6,309 | ) | (5,823 | ) | (5,543 | ) | ||||||
|
Common stock repurchased
|
--- | --- | (562 | ) | ||||||||
|
Stock options exercised
|
--- | 54 | 75 | |||||||||
|
Net cash provided by financing activities
|
26,162 | 28,441 | 35,469 | |||||||||
|
Net change in cash and due from banks
|
(3,036 | ) | (3,422 | ) | (8 | ) | ||||||
|
Cash and due from banks at beginning of year
|
12,894 | 16,316 | 16,324 | |||||||||
|
Cash and due from banks at end of year
|
$ | 9,858 | $ | 12,894 | $ | 16,316 | ||||||
|
Supplemental Disclosures of Cash Flow Information
|
||||||||||||
|
Interest paid on deposits and borrowed funds
|
$ | 11,237 | $ | 16,144 | $ | 18,955 | ||||||
|
Income taxes paid
|
5,478 | 3,914 | 4,231 | |||||||||
|
Supplemental Disclosures of Noncash Activities
|
||||||||||||
|
Loans charged against the allowance for loan losses
|
$ | 2,810 | $ | 647 | $ | 611 | ||||||
|
Loans transferred to other real estate owned
|
2,053 | 911 | 1,794 | |||||||||
|
Unrealized gains (losses) on securities available for sale
|
(2,658 | ) | 4,884 | (2,742 | ) | |||||||
|
Minimum pension liability adjustment
|
(648 | ) | 375 | (657 | ) | |||||||
|
Capital reduction due to change in pension measurement date
|
--- | --- | (66 | ) |
The accompanying notes are an integral part of these consolidated financial statements.
35
Notes to Consolidated Financial Statements
$ in thousands, except share data and per share data
Note 1: Summary of Significant Accounting Policies
The consolidated financial statements include the accounts of National Bankshares, Inc. (Bankshares) and its wholly-owned subsidiaries, the National Bank of Blacksburg (NBB), and National Bankshares Financial Services, Inc. (NBFS), (the Company). All significant intercompany balances and transactions have been eliminated in consolidation.
The accounting and reporting policies of the Company conform to accounting principles generally accepted in the United States of America and to general practices within the banking industry. The following is a summary of the more significant accounting policies.
Subsequent events have been considered through the date when the Form 10-K was issued.
Cash and Cash Equivalents
For purposes of the consolidated statements of cash flows, cash and cash equivalents include cash and due from banks.
Securities
Certain debt securities that management has the positive intent and ability to hold to maturity are classified as “held to maturity” and recorded at amortized cost. Trading securities are recorded at fair value with changes in fair value and included in earnings. Securities not classified as held to maturity or trading, including equity securities with readily determinable fair values, are classified as “available for sale” and recorded at fair value, with unrealized gains and losses excluded from earnings and reported in other comprehensive income. Purchase premiums and discounts are recognized in interest income using the interest method over the terms of the securities. Gains and losses on the sale of securities are recorded on the trade date and are determined using the specific identification method.
Effective April 1, 2009, the Company adopted new accounting guidance related to recognition and presentation of other-than-temporary impairment. This recent accounting guidance amends the recognition guidance for other-than-temporary impairment losses on debt and equity securities. The recent guidance replaced the “intent and ability” indication in prior guidance by specifying that (a) if a company does not have the intent to sell a debt security prior to recovery and (b) it is more likely than not that it will not have to sell the debt security prior to recovery, the security would not be considered other-than-temporarily impaired unless there is a credit loss. When an entity does not intend to sell the security, and it is more likely than not, the entity will not have to sell the security before recovery of its cost basis, it will recognize the credit component of an other-than-temporary impairment of a debt security in earnings and the remaining portion in other comprehensive income. For held-to-maturity debt securities, the amount of an other-than-temporary impairment recorded in other comprehensive income for the noncredit portion of a previous other-than-temporary impairment should be amortized prospectively over the remaining life of the security on the basis of the timing of future estimated cash flows of the security.
Prior to the adoption of the accounting guidance on April 1, 2009, management considered, in determining whether other-than-temporary impairment exists, (1) the length of time and the extent to which the fair value has been less than cost, (2) the financial condition and near-term prospects of the issuer, and (3) the intent and ability of the Company to retain its investment in the issuer for a period of time sufficient to allow for any anticipated recovery in fair value.
For equity securities, when the Company has decided to sell an impaired available-for-sale security and the equity does not expect the fair value of the security to fully recover before the expected time of sale, the security is deemed other-than-temporarily impaired in the period in which the decision to sell is made. The Company recognizes an impairment loss when the impairment is deemed other than temporary even if a decision to sell has not been made.
Loans Held for Sale
Loans originated and intended for sale in the secondary market are carried at the lower of cost or estimated fair value on an individual loan basis. Net unrealized losses, if any, are recognized through a valuation allowance by charges to income. Loans held for sale are sold with the mortgage servicing rights released by the Company.
Loans
The Company, through its banking subsidiary, grants mortgage, commercial, and consumer loans to customers. A substantial portion of the loan portfolio is represented by mortgage loans, particularly commercial mortgages. The ability of the Company’s debtors to honor their contracts is dependent upon the real estate and general economic conditions in the Company’s market area.
Loans that management has the intent and ability to hold for the foreseeable future, or until maturity or payoff, generally are reported at their outstanding unpaid principal balances adjusted for the allowance for loan losses and any deferred fees or costs on originated loans. Interest income is accrued on the unpaid principal balance. Loan origination fees, net of certain direct origination costs, are deferred and recognized as an adjustment of the related loan yield using the interest method.
The accrual of interest is discontinued for all loans for which collection of interest and/or full principal is considered doubtful. Generally, interest accrual is discontinued at the time a loan is 90 days delinquent unless the credit is well-secured and in the process of collection. Interest accrual is also discontinued for impaired loans with an associated impairment loss; as well as loans that are modified to allow the borrower to discontinue payments of principal or interest for more than 90 days, unless the modification provides reasonable assurance of repayment performance and collateral value supports regular underwriting requirements; and loans that finance the sale of OREO property that do not meet down payment thresholds. If deemed appropriate, loans for which collection is considered doubtful may be partially or fully charged off.
36
All interest accrued but not collected for loans that are placed on nonaccrual or charged off is reversed against interest income. The interest on these loans is accounted for on the cash-basis or cost-recovery method until qualifying for return to accrual. Loans are returned to accrual status when all the principal and interest amounts contractually due are current; future payments are reasonably assured; and for loans that financed the sale of OREO property, loan-to-value thresholds are met.
A loan is considered past due when a payment of principal and/or interest is due but not paid. Credit card payments not received within 30 days after the statement date, real estate loan payments not received within the payment cycle; and all other non-real estate secured loans for which payment is not made within 30 days of the payment due date are considered 30 days past due. Management closely monitors past due loans in timeframes of 30-59 days past due, 60-89 days past due and 90 or more days past due.
Allowance for Loan Losses
The allowance for loan losses represents management’s estimate of probable losses inherent in the Company’s loan portfolio. A provision for estimated losses is charged to earnings to establish and maintain the allowance for loan losses at a level reflective of the estimated credit risk. When management determines that a loan balance or portion of a loan balance is not collectible, the loss is charged against the allowance. Subsequent recoveries, if any, are credited to the allowance.
Management evaluates the allowance each quarter through a methodology that estimates losses on individual impaired loans and evaluates the effect of numerous factors on the credit risk of groups of homogeneous loans.
Specific allowances are established for individual impaired loans based on the excess of the loan balance relative to the fair value of the loan. Impaired loans are designated as such when current information indicates that it is probable that the Company will be unable to collect principal or interest according to the contractual terms of the loan agreement. Large loans in nonaccrual status that are significantly past due, or for which a credit review identified weaknesses that indicate principal and interest will not be collected according to the loan terms as well as all loans modified in a troubled debt restructuring, are designated impaired.
Fair value of impaired loans is estimated in one of three ways. These are (1) the estimated fair value (less selling costs) of the underlying collateral, (2) the present value of the loan’s expected future cash flows, or (3) the loan’s observable market value. The amount of recorded investment (unpaid principal and accrued interest) in an impaired loan that exceeds the fair value is accrued as estimated loss in the allowance, except for impaired loans considered collateral dependent. Estimated losses on collateral dependent impaired loans or loans in foreclosure are charged off against the allowance, instead of being accrued.
All impaired loans that are determined to have an impairment loss are placed in nonaccrual status. Impaired loans without an associated impairment loss may be placed in nonaccrual if collection of interest is in doubt.
General allowances are established for non-impaired loans. Nonimpaired loans are grouped into classes based on similar characteristics. Generally, any group that exceeds 5% of regulatory capital is analyzed separately. Factors considered in determining general allowances include net charge-off trends, internal risk ratings, delinquency and nonperforming rates, product mix, underwriting practices, industry trends and economic trends.
The Company’s charge-off policy meets or is more stringent than the minimum standards required by regulators. When available information confirms that a specific loan or portions thereof is uncollectible, the amount is charged off against the allowance for loan losses. Additionally, losses on consumer loans are typically charged off no later than when the loans are 120-180 days past due, and losses on loans secured by residential real estate or by commercial real estate are charged off by the time the loans reach 180 days past due, in compliance with regulatory guidelines. Accordingly, secured loans may be charged down to the estimated value of the collateral, with previously accrued unpaid interest reversed. Subsequent charge-offs may be required as a result of changes in the market value of collateral or other repayment prospects.
Troubled Debt Restructurings (“TDRs”)
In situations where, for economic or legal reasons related to a borrower’s financial condition, management grants a concession to the borrower that it would not otherwise consider, the related loan is classified as a troubled debt restructuring (TDR). These modified terms may include reduction of the interest rate, extension of the maturity date at an interest rate lower than the current market rate for a new loan with similar risk, forgiveness of principal or accrued interest or other actions intended to minimize the economic loss. TDR loans are measured for impairment.
Rate Lock Commitments
The Company enters into commitments to originate mortgage loans in which the interest rate on the loan is determined prior to funding (rate lock commitments). Rate lock commitments on mortgage loans that are intended to be sold are considered to be derivatives. The period of time between issuance of a loan commitment and closing and sale of the loan generally ranges from 30 to 60 days. The Company protects itself from changes in interest rates through the use of best efforts forward delivery commitments, by committing to sell a loan at the time the borrower commits to an interest rate with the intent that the buyer has assumed interest rate risk on the loan. As a result, the Company is not exposed to losses nor will it realize significant gains related to its rate lock commitments due to changes in interest rates. The correlation between the rate lock commitments and the best efforts contracts is very high due to their similarity.
37
The market value of rate lock commitments and best efforts contracts is not readily ascertainable with precision because rate lock commitments and best effort contracts are not actively traded in stand-alone markets. The Company determines the fair value of rate lock commitments and best efforts contracts by measuring the changes in the value of the underlying assets while taking into consideration the probability that the rate lock commitments will close. Because of the high correlation between rate lock commitments and best efforts contracts, no gain or loss occurs on the rate lock commitments.
Premises and Equipment
Land is carried at cost. Premises and equipment are stated at cost, net of accumulated depreciation. Depreciation is charged to expense over the estimated useful lives of the assets on the straight-line basis. Depreciable lives include 40 years for premises, 3-10 years for furniture and equipment, and 3 years for computer software. Costs of maintenance and repairs are charged to expense as incurred and improvements are capitalized.
Other Real Estate
Real estate acquired through, or in lieu of, foreclosure is held for sale and is initially recorded at fair value at the date of foreclosure, establishing a new cost basis. Subsequent to foreclosure, valuations are periodically performed by management and the assets are carried at the lower of carrying amount or fair value less cost to sell. Revenue and expenses from operations and changes in the valuation allowance are included in other operating expenses.
Intangible Assets and Goodwill
The Company records as goodwill the excess of purchase price over the fair value of the identifiable net assets acquired. It utilizes a two-step process for impairment testing of goodwill, which is performed annually, as well as when an event triggering impairment may have occurred. The first step tests for impairment, while the second step, if necessary, measures the impairment. The Company has elected to perform its annual analysis during the fourth quarter of each fiscal year. No indicators of impairment were identified during the years ended December 31, 2010, 2009 and 2008.
Intangible assets include customer deposit intangibles. Such intangible assets are amortized on a straight-line basis over their estimated useful lives, which are generally ten to twelve years.
Stock-Based Compensation
The Company’s 1999 Stock Option Plan terminated on March 9, 2009. Incentive stock options, all of which are now vested, were granted in the early years of the Plan. There were no stock options granted in 2009 and 2008. The Company recognizes the cost of employment services received in exchange for awards of equity instruments based on the fair value of those awards on the date of grant. Compensation cost is recognized over the award’s required service period, which is usually the vesting period.
Pension Plan
The Company recognizes the overfunded or underfunded status of a defined benefit postretirement plan as an asset or liability in its statement of financial position and recognizes changes in that funded status in the year in which the changes occur through comprehensive income. The funded status of a benefit plan is measured as the difference between plan assets at fair value and the benefit obligation. The benefit obligation is the projected benefit obligation.
Income Taxes
Income tax accounting guidance results in two components of income tax expense: current and deferred. Current income tax expense reflects taxes to be paid or refunded for the current period by applying the provisions of the enacted tax law to the taxable income or excess of deductions over revenues. The Company determines deferred income taxes using the liability (or balance sheet) method. Under this method, the net deferred tax asset or liability is based on the tax effects of the differences between the book and tax bases of assets and liabilities, and enacted changes in tax rates and laws are recognized in the period in which they occur.
Deferred income tax expense results from changes in deferred tax assets and liabilities between periods. Deferred tax assets are recognized if it is more likely than not, based on the technical merits, that the tax position will be realized or sustained upon examination. The term more likely than not means a likelihood of more than 50 percent; the terms examined and upon examination also include resolution of the related appeals or litigation processes, if any. A tax position that meets the more-likely-than-not recognition threshold is initially and subsequently measured as the largest amount of tax benefit that has a greater than 50 percent likelihood of being realized upon settlement with a taxing authority that has full knowledge of all relevant information. The determination of whether or not a tax position has met the more-likely-than-not recognition threshold considers the facts, circumstances, and information available at the reporting date and is subject to management’s judgment. Deferred tax assets are reduced by a valuation allowance if, based on the weight of evidence available, it is more likely than not that some portion or all of a deferred tax asset will not be realized.
The Company recognizes interest and penalties on income taxes as a component of income tax expense.
38
Trust Assets and Income
Assets (other than cash deposits) held by the Trust Department in a fiduciary or agency capacity for customers are not included in the consolidated financial statements since such items are not assets of the Company. Trust income is recognized on the accrual basis.
Earnings Per Share
Basic earnings per share represents income available to common stockholders divided by the weighted-average number of common shares outstanding during the period. Diluted earnings per share reflects additional common shares that would have been outstanding if dilutive potential common shares had been issued, as well as any adjustment to income that would result from the assumed issuance. Potential common shares that may be issued by the Company relate solely to outstanding stock options and are determined using the treasury stock method.
The following shows the weighted average number of shares used in computing earnings per share and the effect on the weighted average number of shares of dilutive potential common stock. Potential dilutive common stock had no effect on income available to common stockholders.
|
2010
|
2009
|
2008
|
|||||
|
Average number of common shares outstanding
|
6,933,474
|
6,932,126
|
6,929,755
|
||||
|
Effect of dilutive options
|
16,462
|
13,404
|
6,195
|
||||
|
Average number of common shares outstanding used to calculate diluted earnings per share
|
6,949,936
|
6,945,530
|
6,935,950
|
In 2010, 2009 and 2008, stock options representing 7,750, 22,500 and 95,250 shares respectively, were not included in the computation of diluted net income per share because to do so would have been anti-dilutive.
Advertising
The Company practices the policy of charging advertising costs to expenses as incurred. In 2010, the Company charged $163 to expenses, and in 2009, $179 and in 2008, $146 was expensed.
Use of Estimates
In preparing consolidated financial statements in conformity with accounting principles generally accepted in the United States of America, management is required to make estimates and assumptions that affect the reported amounts of assets and liabilities as of the date of the balance sheet and reported amounts of revenues and expenses during the reporting period. Actual results could differ from those estimates. Material estimates that are particularly susceptible to significant change in the near term relate to the determination of the allowance for loan losses, the valuation of foreclosed real estate and deferred tax assets, other-than-temporary impairments of securities and the fair value of financial instruments.
Changing economic conditions, adverse economic prospects for borrowers, as well as regulatory agency action as a result of examination, could cause NBB to recognize additions to the allowance for loan losses and may also affect the valuation of real estate acquired in connection with foreclosures or in satisfaction of loans.
Certain reclassifications have been made to prior period balances to conform to the current year provisions.
Recent Accounting Pronouncements
In June 2009, the Financial Accounting Standards Board (FASB) issued new guidance relating to the accounting for transfers of financial assets. The new guidance, which was issued as SFAS No. 166, “Accounting for Transfers of Financial Assets, an amendment to SFAS No. 140,” was adopted into the Accounting Standards Codification (Codification) in December 2009 through the issuance of Accounting Standards Update (ASU) 2009-16. The new standard provides guidance to improve the relevance, representational faithfulness, and comparability of the information that an entity provides in its financial statements about a transfer of financial assets; the effects of a transfer on its financial position, financial performance, and cash flows; and a transferor’s continuing involvement, if any, in transferred financial assets. ASU 2009-16 was effective for transfers on or after January 1, 2010. The adoption of the new guidance did not have a material impact on the Company’s consolidated financial statements.
In June 2009, the FASB issued new guidance relating to variable interest entities. The new guidance, which was issued as SFAS No. 167, “Amendments to FASB Interpretation No. 46(R),” was adopted into the Codification in December 2009. The objective of the guidance is to improve financial reporting by enterprises involved with variable interest entities and to provide more relevant and reliable information to users of financial statements. SFAS No. 167 was effective as of January 1, 2010. The adoption of the new guidance did not have a material impact on the Company’s consolidated financial statements.
In October 2009, the FASB issued ASU 2009-15, “Accounting for Own-Share Lending Arrangements in Contemplation of Convertible Debt Issuance or Other Financing.” ASU 2009-15 amends Subtopic 470-20 to expand accounting and reporting guidance for own-share lending arrangements issued in contemplation of convertible debt issuance. ASU 2009-15 is effective for fiscal years beginning on or after December 15, 2009 and interim periods within those fiscal years for arrangements outstanding as of the beginning of those fiscal years. The adoption of the new guidance did not have a material impact on the Company’s consolidated financial statements.
39
In January 2010, the FASB issued ASU 2010-04, Accounting for Various Topics – Technical Corrections to SEC Paragraphs. ASU 2010-04 makes technical corrections to existing Securities and Exchange Commission (SEC) guidance including the following topics: accounting for subsequent investments, termination of an interest rate swap, issuance of financial statements - subsequent events, use of residential method to value acquired assets other than goodwill, adjustments in assets and liabilities for holding gains and losses, and selections of discount rate used for measuring defined benefit obligation. The adoption of the new guidance did not have a material impact on the Company’s consolidated financial statements.
In January 2010, the FASB issued ASU 2010-06, “Fair Value Measurements and Disclosures (Topic 820): Improving Disclosures about Fair Value Measurements.” ASU 2010-06 amends Subtopic 820-10 to clarify existing disclosures, require new disclosures, and includes conforming amendments to guidance on employers’ disclosures about postretirement benefit plan assets. ASU 2010-06 is effective for interim and annual periods beginning after December 15, 2009, except for disclosures about purchases, sales, issuances, and settlements in the roll forward of activity in Level 3 fair value measurements. Those disclosures are effective for fiscal years beginning after December 15, 2010 and for interim periods within those fiscal years. The adoption of the new guidance did not have a material impact on the Company’s consolidated financial statements.
In February 2010, the FASB issued ASU 2010-09, “Subsequent Events (Topic 855): Amendments to Certain Recognition and Disclosure Requirements.” ASU 2010-09 addresses both the interaction of the requirements of Topic 855 with the SEC’s reporting requirements and the intended breadth of the reissuance disclosures provisions related to subsequent events. An entity that is an SEC filer is not required to disclose the date through which subsequent events have been evaluated. ASU 2010-09 was effective immediately. The adoption of the new guidance did not have a material impact on the Company’s consolidated financial statements.
In July 2010, the FASB issued ASU 2010-20, “Disclosures about the Credit Quality of Financing Receivables and the Allowance for Credit Losses.” The new disclosure guidance significantly expands the existing requirements and will lead to greater transparency into a company’s exposure to credit losses from lending arrangements. The extensive new disclosures of information as of the end of a reporting period will become effective for both interim and annual reporting periods ending on or after December 15, 2010. Specific disclosures regarding activity that occurred before the issuance of the ASU, such as the allowance roll forward and modification disclosures, will be required for periods beginning on or after December 15, 2010. The Company has included the required disclosures in its consolidated financial statements.
On September 17, 2010, the SEC issued Release No. 33-9144, “Commission Guidance on Presentation of Liquidity and Capital Resources Disclosures in Management’s Discussion and Analysis.” This interpretive release is intended to improve discussion of liquidity and capital resources in Management’s Discussion and Analysis of Financial Condition and Results of Operations in order to facilitate understanding by investors of the liquidity and funding risks facing the registrant. This release was issued in conjunction with a proposed rule, “Short-Term Borrowings Disclosures,” that would require public companies to disclose additional information to investors about their short-term borrowing arrangements. Release No. 33-9144 was effective on September 28, 2010.
In January 2011, the FASB issued ASU 2011-01, “Deferral of the Effective Date of Disclosures about Troubled Debt Restructurings in Update No. 2010-20.” The amendments in this ASU temporarily delay the effective date of the disclosures about troubled debt restructurings in ASU 2010-20 for public entities. The delay is intended to allow the FASB time to complete its deliberations on what constitutes a troubled debt restructuring. The effective date of the new disclosures about troubled debt restructurings for public entities and the guidance for determining what constitutes a troubled debt restructuring will then be coordinated. Currently, that guidance is anticipated to be effective for interim and annual periods ending after June 15, 2011.
In December 2010, the FASB issued ASU 2010-29, “Disclosure of Supplementary Pro Forma Information for Business Combinations.” The guidance requires pro forma disclosure for business combinations that occurred in the current reporting period as though the acquisition date for all business combinations that occurred during the year had been as of the beginning of the annual reporting period. If comparative financial statements are presented, the pro forma information should be reported as though the acquisition date for all business combinations that occurred during the current year had been as of the beginning of the comparable prior annual reporting period. ASU 2010-29 is effective for business combinations for which the acquisition date is on or after the beginning of the first annual reporting period beginning on or after December 15, 2010. Early adoption is permitted. The adoption of the new guidance is not expected to have a material impact on the Company’s consolidated financial statements.
In December 2010, the FASB issued ASU 2010-28, “When to Perform Step 2 of the Goodwill Impairment Test for Reporting Units with Zero or Negative Carrying Amounts.” The amendments in this ASU modify Step 1 of the goodwill impairment test for reporting units with zero or negative carrying amounts. For those reporting units, an entity is required to perform Step 2 of the goodwill impairment test if it is more likely than not that a goodwill impairment exists. The amendments in this ASU are effective for fiscal years, and interim periods within those years, beginning after December 15, 2010. Early adoption is not permitted. The adoption of the new guidance is not expected to have a material impact on the Company’s consolidated financial statements.
40
The SEC has issued Final Rule No. 33-9002, Interactive Data to Improve Financial Reporting, which requires companies to submit financial statements in XBRL (extensible business reporting language) format with their SEC filings on a phased-in schedule. Large accelerated filers and foreign large accelerated filers using U.S. GAAP were required to provide interactive data reports starting with their first quarterly report for fiscal periods ending on or after June 15, 2010. All remaining filers are required to provide interactive data reports starting with their first quarterly report for fiscal periods ending on or after June 15, 2011.
Note 2: Restriction on Cash
As members of the Federal Reserve System, the Company’s subsidiary bank is required to maintain certain average reserve balances. For the final weekly reporting period in the years ended December 31, 2010 and 2009, the aggregate amounts of daily average required balances approximated $350 in 2010 and $5,250 in 2009.
Note 3: Securities
The amortized cost and fair value of securities available for sale, with gross unrealized gains and losses, follows:
|
December 31, 2010
|
||||||||||||||||
|
Available for sale:
|
Amortized
Cost
|
Gross
Unrealized
Gains
|
Gross
Unrealized
Losses
|
Fair Value
|
||||||||||||
|
U.S. Treasury
|
$ | 2,015 | $ | 168 | $ | --- | $ | 2,183 | ||||||||
|
U.S. Government agencies and corporations
|
90,641 | 424 | 2,913 | 88,152 | ||||||||||||
|
States and political subdivisions
|
60,676 | 1,417 | 411 | 61,682 | ||||||||||||
|
Mortgage-backed securities
|
10,744 | 635 | --- | 11,379 | ||||||||||||
|
Corporate debt securities
|
16,902 | 778 | --- | 17,680 | ||||||||||||
|
Federal Home Loan Bank stock – restricted
|
1,677 | --- | --- | 1,677 | ||||||||||||
|
Federal Reserve Bank stock – restricted
|
92 | --- | --- | 92 | ||||||||||||
|
Other securities
|
2,308 | --- | 246 | 2,062 | ||||||||||||
|
Total securities available for sale
|
$ | 185,055 | $ | 3,422 | $ | 3,570 | $ | 184,907 | ||||||||
|
December 31, 2009
|
||||||||||||||||
|
Available for sale:
|
Amortized
Cost
|
Gross
Unrealized
Gains
|
Gross
Unrealized
Losses
|
Fair Value
|
||||||||||||
|
U.S. Treasury
|
$ | 2,020 | $ | 157 | $ | --- | $ | 2,177 | ||||||||
|
U.S. Government agencies and corporations
|
48,137 | 375 | 925 | 47,587 | ||||||||||||
|
States and political subdivisions
|
72,743 | 2,016 | 354 | 74,405 | ||||||||||||
|
Mortgage-backed securities
|
16,250 | 766 | --- | 17,016 | ||||||||||||
|
Corporate debt securities
|
21,950 | 754 | 62 | 22,642 | ||||||||||||
|
Federal Home Loan Bank stock – restricted
|
1,677 | --- | --- | 1,677 | ||||||||||||
|
Federal Reserve Bank stock – restricted
|
92 | --- | --- | 92 | ||||||||||||
|
Other securities
|
2,662 | --- | 217 | 2,445 | ||||||||||||
|
Total securities available for sale
|
$ | 165,531 | $ | 4,068 | $ | 1,558 | $ | 168,041 | ||||||||
41
The amortized cost and fair value of single maturity securities available for sale at December 31, 2010, by contractual maturity, are shown below. Expected maturities may differ from contractual maturities because borrowers may have the right to call or prepay obligations with or without call or prepayment penalties. Mortgage-backed securities included in these totals are categorized by final maturity at December 31, 2010.
|
December 31, 2010
|
||||||||
|
Amortized Cost
|
Fair Value
|
|||||||
|
Due in one year or less
|
$ | 10,906 | $ | 11,053 | ||||
|
Due after one year through five years
|
52,989 | 55,202 | ||||||
|
Due after five years through ten years
|
21,407 | 21,969 | ||||||
|
Due after ten years
|
96,167 | 93,344 | ||||||
|
No maturity
|
3,586 | 3,339 | ||||||
| $ | 185,055 | $ | 184,907 | |||||
The amortized cost and fair value of securities held to maturity, with gross unrealized gains and losses, follows:
|
December 31, 2010
|
||||||||||||||||
|
Held to maturity:
|
Amortized
Cost
|
Gross
Unrealized
Gains
|
Gross
Unrealized
Losses
|
Fair Value
|
||||||||||||
|
U.S. Government agencies and corporations
|
$ | 13,074 | $ | 310 | $ | 214 | $ | 13,170 | ||||||||
|
States and political subdivisions
|
112,625 | 1,174 | 2,452 | 111,347 | ||||||||||||
|
Mortgage-backed securities
|
1,142 | 97 | --- | 1,239 | ||||||||||||
|
Corporate debt securities
|
4,159 | 29 | 31 | 4,157 | ||||||||||||
|
Total securities held to maturity
|
$ | 131,000 | $ | 1,610 | $ | 2,697 | $ | 129,913 | ||||||||
|
December 31, 2009
|
||||||||||||||||
|
Held to maturity:
|
Amortized
Cost
|
Gross
Unrealized
Gains
|
Gross
Unrealized
Losses
|
Fair Value
|
||||||||||||
|
U.S. Government agencies and corporations
|
$ | 25,078 | $ | 279 | $ | 426 | $ | 24,931 | ||||||||
|
States and political subdivisions
|
94,674 | 1,847 | 915 | 95,606 | ||||||||||||
|
Mortgage-backed securities
|
1,458 | 87 | --- | 1,545 | ||||||||||||
|
Corporate debt securities
|
8,166 | 66 | 422 | 7,810 | ||||||||||||
|
Total securities held to maturity
|
$ | 129,376 | $ | 2,279 | $ | 1,763 | $ | 129,892 | ||||||||
The amortized cost and fair value of single maturity securities held to maturity at December 31, 2010, by contractual maturity, are shown below. Expected maturities may differ from contractual maturities because borrowers may have the right to call or prepay obligations with or without call or prepayment penalties. Mortgage-backed securities included in these totals are categorized by final maturity at December 31, 2010.
|
December 31, 2010
|
||||||||
|
Amortized
Cost
|
Fair
Value
|
|||||||
|
Due in one year or less
|
$ | 4,173 | $ | 4,224 | ||||
|
Due after one year through five years
|
22,617 | 23,315 | ||||||
|
Due after five years through ten years
|
17,784 | 18,169 | ||||||
|
Due after ten years
|
86,426 | 84,205 | ||||||
| $ | 131,000 | $ | 129,913 | |||||
42
Information pertaining to securities with gross unrealized losses at December 31, 2010 and 2009 aggregated by investment category and length of time that individual securities have been in a continuous loss position, follows:
|
December 31, 2010
|
||||||||||||||||
|
Less Than 12 Months
|
12 Months or More
|
|||||||||||||||
|
Fair
Value
|
Unrealized
Loss
|
Fair
Value
|
Unrealized
Loss
|
|||||||||||||
|
U. S. Government agencies and corporations
|
$ | 64,850 | $ | 3,127 | $ | --- | $ | --- | ||||||||
|
State and political subdivisions
|
65,640 | 2,605 | 2,528 | 258 | ||||||||||||
|
Corporate debt securities
|
969 | 31 | --- | --- | ||||||||||||
|
Other
|
--- | --- | 247 | 246 | ||||||||||||
|
Total temporarily impaired securities
|
$ | 131,459 | $ | 5,763 | $ | 2,775 | $ | 504 | ||||||||
|
December 31, 2009
|
||||||||||||||||
|
Less Than 12 Months
|
12 Months or More
|
|||||||||||||||
|
Fair
Value
|
Unrealized
Loss
|
Fair
Value
|
Unrealized
Loss
|
|||||||||||||
|
U. S. Government agencies and corporations
|
42,876 | $ | 1,351 | $ | --- | $ | --- | |||||||||
|
State and political subdivisions
|
28,537 | 571 | 13,382 | 698 | ||||||||||||
|
Corporate debt securities
|
662 | 1 | 3,517 | 483 | ||||||||||||
|
Other
|
--- | --- | 277 | 217 | ||||||||||||
|
Total temporarily impaired securities
|
$ | 72,075 | $ | 1,923 | $ | 17,176 | $ | 1,398 | ||||||||
At December 31, 2010, the Company had 166 securities with a fair value of $134,234 which had total unrealized losses of $6,267. The Company has made the determination that these securities are temporarily impaired at December 31, 2010 for the following reasons:
U.S. Government agencies and corporations. The unrealized losses in this category of investments were caused by interest rate fluctuations. The contractual terms of the investments do not permit the issuer to settle the securities at a price less than the cost basis of each investment. Because the Company does not intend to sell any of the investments and it is not more likely than not that the Company will be required to sell any of these investments before recovery of its amortized cost basis, which may be maturity, the Company does not consider these investments to be other-than-temporarily impaired.
State and political subdivisions. This category’s unrealized losses are primarily the result of interest rate fluctuations and also a certain few ratings downgrades brought about by the impact of the economic downturn on states and political subdivisions. The contractual terms of the investments do not permit the issuer to settle the securities at a price less than the cost basis of each investment. Because the Company does not intend to sell any of the investments and it is not more likely than not that the Company will be required to sell any of the investments before recovery of its amortized cost basis, which may be maturity, the Company does not consider these investments to be other-than-temporarily impaired.
Corporate debt securities. The Company’s unrealized losses in corporate debt securities are related to both interest rate fluctuations and ratings downgrades for a limited number of securities. The contractual terms of the investments do not permit the issuer to settle the securities at a price less than the cost basis of each investment. Because the Company does not intend to sell any of the investments before recovery of its amortized cost basis, which may be maturity, the Company does not consider these investments to be other-than-temporarily impaired.
Other. The Company holds an investment in an LLC and a small amount of community bank stock. The value of these investments has been negatively affected by market conditions. Because the Company does not intend to sell these investments before recovery of amortized cost basis, the Company does not consider these investments to be other-than-temporarily impaired.
At December 31, 2009, the Company had 120 securities with a fair value of $89,251 which were temporarily impaired. The total unrealized loss on these securities, which was attributed to interest rate fluctuations, was $3,321. Because the Company had the ability and intent to hold the securities until maturity or until the cost was recovered, the losses associated with the securities were not considered other than temporary at December 31, 2009.
At December 31, 2010 and 2009, securities with a carrying value of $141,810 and $100,794, respectively, were pledged to secure trust deposits and for other purposes as required or permitted by law.
As a member of the Federal Reserve and the Federal Home Loan Bank (FHLB) of Atlanta, NBB is required to maintain certain minimum investments in the common stock of those entities. Required levels of investment are based upon NBB’s capital and a percentage of qualifying assets. In addition, NBB is eligible to borrow from the FHLB with borrowings collateralized by qualifying assets, primarily residential mortgage loans totaling approximately $117,440, and NBB’s capital stock investment in the FHLB. Redemption of FHLB stock is subject to certain limitations and conditions. At its discretion, the FHLB may declare dividends on the stock. Management reviews for impairment based upon the ultimate recoverability of the cost basis in the FHLB stock.
43
Note 4: Related Party Transactions
In the ordinary course of business, the Company, through its banking subsidiary, has granted loans to executive officers and directors of Bankshares and its subsidiaries amounting to $4,025 at December 31, 2010 and $3,466 at December 31, 2009. During the year ended December 31, 2010, total principal additions were $3,003 and principal payments were $2,444.
Note 5: Allowance for Loan Losses
The allowance for loan losses methodology incorporates individual evaluation of impaired loans and collective evaluation of groups of nonimpaired loans. The Company performs ongoing analysis of the loan portfolio to determine credit quality and identify impaired loans. Credit quality is rated based on the loan’s payment history, the borrower’s current financial situation and value of the underlying collateral. Impaired loans are identified through the credit quality review of the Company.
Impaired loans are those loans that are modified in a troubled debt restructure and larger, nonhomogeneous loans that are in nonaccrual or exhibit payment history or financial status that indicate the probability that collection will not occur according to the loan’s terms. Generally, loans with a regulatory risk rating of “classified” are designated impaired. Impaired loans are measured at the lower of the invested amount or the fair market value. Impaired loans with an impairment loss are designated nonaccrual. Please refer to Note 1, “Summary of Significant Accounting Policies” for additional information on evaluation of impaired loans and associated specific reserves.
The nonimpaired portfolio is divided according to risk characteristics and evaluated for credit risk. In 2010, the Company identified five major categories of loans, called portfolio segments, consisting of real estate-secured consumer loans, non-real estate-secured consumer loans, commercial real estate, commercial and industrial loans and construction, development and land loans. Further analysis of characteristics within the segments including borrower type, collateral type and loan term details is used to identify subgroups. Subgroups with total balances exceeding 5% of Tier I and Tier II Capital are designated loan classes. Risk factors are analyzed for each class to estimate collective reserves.
Portfolio segments and classes are determined using a risk-based perspective. An analysis of loan characteristics, including collateral type, repayment sources, and (if applicable) the borrower’s business model was included in the determination of segments and classes. This approach differs from the classification methodology prescribed for the Management’s Discussion and Analysis section (“MD&A”) of this report.
For purposes of calculating the allowance for loan losses, the company segregated the portfolio based on a risk perspective. The Company determined five major segments: consumer real estate, consumer non-real estate, commercial real estate, commercial and industrial, and construction, development and land. Consumer real estate is composed of loans to purchase or build a primary residence as well as equity lines secured by a primary residence. Consumer non-real estate is composed of credit cards, automobile and other installment loans, and deposit overdrafts. Commercial real estate is composed of all commercial loans that are secured by real estate. Commercial and industrial is composed of commercial loans that are not secured by real estate. Construction, development and other land loans are composed of loans to developers of residential and commercial properties.
The segments were further divided into classes, as listed below.
|
Consumer Real Estate
Equity lines
Closed-end consumer real estate
Consumer construction
Consumer, Non-Real Estate
Credit cards
Consumer, general
Consumer overdraft
Commercial & Industrial
Commercial & industrial
Construction, Development and Land
Residential
Commercial
|
Commercial Real Estate
College housing
Office/Retail space
Nursing homes
Hotel
Municipalities
Medical professionals
Religious organizations
Convenience stores
Entertainment and sports
Nonprofit
Restaurants
General contractors
Other commercial real estate
|
Factors applied to the classes include allocations for the historical charge-off percentage, percentage of past due and nonaccrual loans to class balance, and external economic factors. Higher allocations for the risk factors applied to each class are made for special mention and classified loans.
The policy for collective evaluation of nonimpaired loans was revised in the third quarter of 2010. The methodology for grouping loans, analyzing credit risk and allocating allowances was formalized. The adoption of the policy did not materially affect the total estimated accrual or the provision for loan losses charged to income in 2010; however, previously unallocated amounts became allocated with the revised methodology.
44
An analysis of the allowance for loan losses follows:
|
Years ended December 31,
|
||||||||||||
|
2010
|
2009
|
2008
|
||||||||||
|
Balance at beginning of year
|
$ | 6,926 | $ | 5,858 | $ | 5,219 | ||||||
|
Provision for loan losses
|
3,409 | 1,634 | 1,119 | |||||||||
|
Loans charged off
|
(2,810 | ) | (647 | ) | (611 | ) | ||||||
|
Recoveries of loans previously charged off
|
139 | 81 | 131 | |||||||||
|
Balance at end of year
|
$ | 7,664 | $ | 6,926 | $ | 5,858 | ||||||
A detailed analysis showing the allowance roll-forward by portfolio segment for the year ended December 31, 2010 follows:
|
Consumer Real Estate
|
Consumer Non-Real Estate
|
Commercial Real Estate
|
Commercial & Industrial
|
Construction, Development & Land
|
Unallocated
|
Total
|
||||||||||||||||||||||
|
Allowance for Loan Losses
|
||||||||||||||||||||||||||||
|
Beginning Balance
|
$ | 249 | $ | 1,049 | $ | 4,321 | $ | 459 | $ | 562 | $ | 286 | $ | 6,926 | ||||||||||||||
|
Charge-offs
|
(89 | ) | (358 | ) | (1,021 | ) | (927 | ) | (415 | ) | --- | (2,810 | ) | |||||||||||||||
|
Recoveries
|
10 | 67 | 61 | 1 | --- | --- | 139 | |||||||||||||||||||||
|
Provision for loan losses
|
889 | (172 | ) | 672 | 1,575 | 602 | (157 | ) | 3,409 | |||||||||||||||||||
|
Ending Balance
|
$ | 1,059 | $ | 586 | $ | 4,033 | $ | 1,108 | $ | 749 | $ | 129 | $ | 7,664 | ||||||||||||||
An analysis of the components of the ending balance of the allowance for loan losses by portfolio segment follows:
|
Consumer Real Estate
|
Consumer Non-Real Estate
|
Commercial Real Estate
|
Commercial & Industrial
|
Construction, Development & Other Land
|
Unallocated
|
Total
|
||||||||||||||||||||||
|
Allowance for loans individually evaluated for impairment
|
$ | 27 | $ | --- | $ | 565 | $ | 508 | $ | 100 | $ | --- | $ | 1,200 | ||||||||||||||
|
Allowance for loans collectively evaluated for impairment
|
$ | 1,032 | $ | 586 | $ | 3,468 | $ | 600 | $ | 649 | $ | 129 | $ | 6,464 | ||||||||||||||
The ending balance of loans associated with the components of the allowance for loans losses follows:
|
Consumer Real Estate
|
Consumer Non-Real Estate
|
Commercial Real Estate
|
Commercial & Industrial
|
Construction, Development & Other Land
|
Unallocated
|
Total
|
||||||||||||||||||||||
|
Loans individually evaluated for impairment
|
$ | 505 | $ | --- | $ | 5,151 | $ | 698 | $ | 2,437 | $ | --- | $ | 8,791 | ||||||||||||||
|
Loans collectively evaluated for impairment
|
$ | 108,855 | $ | 35,679 | $ | 343,780 | $ | 36,374 | $ | 42,964 | $ | --- | $ | 567,652 | ||||||||||||||
45
The following is a summary of information pertaining to impaired loans:
|
December 31,
|
||||||||||||
|
2010
|
2009
|
2008
|
||||||||||
|
Impaired loans without a valuation allowance
|
$ | 1,115 | $ | 50 | $ | 1,028 | ||||||
|
Impaired loans with a valuation allowance
|
7,676 | 7,630 | 2,548 | |||||||||
|
Total impaired loans
|
$ | 8,791 | $ | 7,680 | $ | 3,576 | ||||||
|
Valuation allowance related to impaired loans
|
$ | 1,200 | $ | 2,495 | $ | 679 | ||||||
|
Years ended December 31,
|
||||||||||||
|
2010
|
2009
|
2008
|
||||||||||
|
Average investment in impaired loans
|
$ | 7,526 | $ | 7,851 | $ | 3,790 | ||||||
|
Interest income recognized on impaired loans
|
17 | 169 | 140 | |||||||||
|
Interest income recognized on a cash basis on impaired loans
|
--- | --- | --- | |||||||||
A detailed analysis of investment in impaired loans, associated reserves and interest income recognized, segregated by loan class for the year ended December 31, 2010 follows:
|
Average Recorded Investment in Impaired
Loans
|
Unpaid Principal Balance of Impaired Loans
|
(A)
Total Recorded Investment in Impaired Loan
|
Recorded Investment in (A) for Which There is No Related Allowance
|
Recorded Investment in (A) for Which There is a Related Allowance
|
Related Allowance for Impaired Loans
|
Interest Income Recognized
|
||||||||||||||||||||||
|
Consumer Real Estate
|
||||||||||||||||||||||||||||
|
Closed-end Consumer Real Estate
|
$ | 337 | $ | 505 | 505 | $ | --- | $ | 505 | $ | 26 | $ | --- | |||||||||||||||
|
Commercial Real Estate
|
||||||||||||||||||||||||||||
|
Office & Retail
|
253 | --- | --- | --- | --- | --- | --- | |||||||||||||||||||||
|
Hotel
|
2,767 | 3,509 | 3,509 | 287 | 3,222 | 267 | --- | |||||||||||||||||||||
|
Convenience stores
|
49 | 577 | 592 | 592 | --- | --- | 15 | |||||||||||||||||||||
|
Other commercial real estate
|
337 | 1,065 | 1,066 | --- | 1,066 | 299 | 1 | |||||||||||||||||||||
|
Commercial & Industrial
|
||||||||||||||||||||||||||||
|
Commercial & Industrial
|
1,183 | 698 | 698 | --- | 698 | 508 | --- | |||||||||||||||||||||
|
Construction, Development and Land
|
||||||||||||||||||||||||||||
|
Residential
|
2,579 | 2,185 | 2,185 | --- | 2,185 | 100 | --- | |||||||||||||||||||||
|
Commercial
|
21 | 252 | 253 | 253 | --- | --- | 1 | |||||||||||||||||||||
|
Total
|
$ | 7,526 | $ | 8,791 | $ | 8,808 | $ | 1,132 | $ | 7,676 | $ | 1,200 | $ | 17 | ||||||||||||||
Note: Only classes with impaired loans are shown.
The Company collects and discloses data in compliance with accounting guidance in effect for the year disclosed. The table above and the following tables disclose information for 2010 only, following accounting guidance adopted in 2010. Information for prior years was collected according to guidance in effect for those years and is not available in the format adopted in 2010.
46
An analysis of past due and nonaccrual loans follows:
|
For the year ended December 31, 2010
|
||||||||||||||||
|
30 – 89 Days Past Due
|
90 or More Days Past Due
|
90 Days Past Due and Still Accruing
|
Nonaccruals (Including Impaired Nonaccruals)
|
|||||||||||||
|
Consumer Real Estate
|
||||||||||||||||
|
Equity Lines
|
$ | 69 | $ | --- | $ | --- | $ | --- | ||||||||
|
Closed-ended Consumer Real Estate
|
1,868 | 1,178 | 612 | 783 | ||||||||||||
|
Consumer Construction
|
--- | --- | --- | --- | ||||||||||||
|
Consumer, Non-Real Estate
|
||||||||||||||||
|
Credit Cards
|
67 | 42 | 29 | --- | ||||||||||||
|
Consumer General
|
518 | 45 | 37 | --- | ||||||||||||
|
Consumer Overdraft
|
--- | --- | --- | --- | ||||||||||||
|
Commercial Real Estate
|
||||||||||||||||
|
College Housing
|
224 | 262 | --- | --- | ||||||||||||
|
Office/Retail
|
--- | --- | --- | --- | ||||||||||||
|
Nursing Homes
|
--- | --- | --- | --- | ||||||||||||
|
Hotel
|
--- | 802 | --- | 3,509 | ||||||||||||
|
Municipalities
|
--- | --- | --- | --- | ||||||||||||
|
Medical Professionals
|
--- | 181 | --- | --- | ||||||||||||
|
Religious Organizations
|
--- | --- | --- | --- | ||||||||||||
|
Convenience Stores
|
9 | 577 | 577 | --- | ||||||||||||
|
Entertainment and Sports
|
--- | --- | --- | --- | ||||||||||||
|
Nonprofit
|
--- | --- | --- | --- | ||||||||||||
|
Restaurants
|
--- | --- | --- | --- | ||||||||||||
|
General Contractors
|
--- | 85 | --- | --- | ||||||||||||
|
Other Commercial Real Estate
|
792 | 136 | --- | 715 | ||||||||||||
|
Commercial and Industrial
|
||||||||||||||||
|
Commercial and Industrial
|
740 | 609 | 81 | 879 | ||||||||||||
|
Construction, Development and Land
|
||||||||||||||||
|
Residential
|
--- | 2,185 | --- | 2,185 | ||||||||||||
|
Commercial
|
25 | --- | --- | --- | ||||||||||||
|
Total
|
$ | 4,312 | $ | 6,102 | $ | 1,336 | $ | 8,071 | ||||||||
Nonaccrual loans that meet the Company’s balance thresholds are designated as impaired. Total nonaccrual loans at December 31, 2010 were $8,071, of which $7,612 were impaired. At December 31, 2009 and 2008, all nonaccrual loans met the balance threshold and were designated impaired.
Loans past due greater than 90 days which continue to accrue interest totaled $1,336 at December 31, 2010, compared with $1,697 and $1,127 at December 31, 2009 and 2008, respectively.
The estimate of credit risk for nonimpaired loans is obtained by applying allocations for internal and external factors. The allocations are increased for loans that exhibit greater credit quality risk.
Credit quality indicators, which the Company terms risk grades, are assigned through the Company’s credit review function for larger loans and selective review of loans that fall below credit review thresholds. Loans that do not indicate heightened risk are graded as “pass”. Loans that appear to have elevated credit risk because of frequent or persistent past due status which is less than 75 days or that show weakness in the borrower’s financial condition are risk graded “special mention”. Loans with frequent or persistent delinquency exceeding 75 days or that have a higher level of weakness in the borrower’s financial condition are graded “classified”. Classified loans have regulatory risk ratings of “substandard” and “doubtful”. Allocations are increased by 50% and by 100% for loans with grades of “special mention” and “classified”, respectively.
Determination of risk grades was completed for the portfolio as of December 31, 2010 and 2009.
47
The following displays nonimpaired loans by credit quality indicator at December 31, 2010:
|
Pass
|
Special Mention
|
Classified
(Excluding Impaired)
|
||||||||||
|
Consumer Real Estate
|
||||||||||||
|
Equity Lines
|
$ | 15,735 | $ | --- | $ | 119 | ||||||
|
Closed-ended Consumer Real Estate
|
85,313 | 731 | 2,969 | |||||||||
|
Consumer Construction
|
3,988 | --- | --- | |||||||||
|
Consumer, Non-Real Estate
|
||||||||||||
|
Credit Cards
|
6,446 | --- | 14 | |||||||||
|
Consumer General
|
28,730 | 392 | 94 | |||||||||
|
Consumer Overdraft
|
3 | --- | --- | |||||||||
|
Commercial Real Estate
|
||||||||||||
|
College Housing
|
88,110 | 461 | 1,016 | |||||||||
|
Office/Retail
|
60,540 | 3,500 | 848 | |||||||||
|
Nursing Homes
|
28,018 | --- | --- | |||||||||
|
Hotel
|
10,689 | 1,878 | 625 | |||||||||
|
Municipalities
|
16,979 | --- | --- | |||||||||
|
Medical Professionals
|
17,111 | --- | 181 | |||||||||
|
Religious Organizations
|
12,643 | --- | --- | |||||||||
|
Convenience Stores
|
9,010 | 9 | --- | |||||||||
|
Entertainment and Sports
|
7,694 | --- | --- | |||||||||
|
Nonprofit
|
6,421 | --- | --- | |||||||||
|
Restaurants
|
6,740 | --- | 153 | |||||||||
|
General Contractors
|
6,175 | --- | 240 | |||||||||
|
Other Commercial Real Estate
|
63,679 | 111 | 951 | |||||||||
|
Commercial and Industrial
|
||||||||||||
|
Commercial and Industrial
|
34,826 | 129 | 1,419 | |||||||||
|
Construction, Development and Land
|
||||||||||||
|
Residential
|
25,760 | --- | 2,633 | |||||||||
|
Commercial
|
14,405 | --- | 164 | |||||||||
|
Total
|
$ | 549,015 | $ | 7,211 | $ | 11,426 | ||||||
Sales, Purchases and Reclassification of Loans
The Company finances mortgages under “best efforts” contracts with mortgage purchasers. The mortgages are designated as held for sale upon initiation. There have been no major reclassifications from portfolio loans to held for sale. Occasionally, the Company purchases or sells participations in loans. The Company purchased one participation in 2010, which is included in Commercial Real Estate loans. All participation loans met the Company’s normal underwriting standards at the time the participation was entered. Participation loans are included in the appropriate portfolio balances to which the allowance methodology is applied.
48
Off-Balance Sheet and Secondary Market Risk
In conjunction with the estimation of the allowance for loan losses, the Company also estimates credit risk for off-balance sheet items and secondary market risk. Off-balance sheet items are unfunded portions of lines of credit and letters of credit for which the company has committed to lend but has not yet been, and may never be, called upon to disburse funds. The methodology for estimating credit risk for off-balance sheet items is similar to that used for the allowance for loan losses. If the Company has unfunded commitments to a borrower with an impaired loan that it cannot revoke, the full amount of the unfunded commitment is accrued in a liability for off-balance sheet risk. The estimate of off-balance sheet risk is currently immaterial. If the estimate becomes material, a liability will be recorded.
Secondary market risk stems from the recourse provisions in the Company’s contracts to sell mortgages. The methodology for estimating secondary market risk applies risk factors to total secondary market loans sold for the previous year. The estimate of secondary market risk is currently immaterial. If the estimate becomes material, a separate liability for secondary market risk will be recorded.
Note 6: Premises and Equipment
A summary of the cost and accumulated depreciation of premises and equipment follows:
|
December 31,
|
||||||||
|
2010
|
2009
|
|||||||
|
Premises
|
$ | 14,348 | $ | 14,225 | ||||
|
Furniture and equipment
|
12,656 | 11,918 | ||||||
|
Construction-in-progress
|
9 | 195 | ||||||
|
Premises and equipment
|
$ | 27,013 | $ | 26,338 | ||||
|
Accumulated depreciation
|
(16,543 | ) | (15,710 | ) | ||||
|
Premises and equipment, net
|
$ | 10,470 | $ | 10,628 | ||||
Depreciation expense for the years ended December 2010, 2009 and 2008 amounted to $886, $906 and $965, respectively.
The Company leases certain branch facilities under noncancellable operating leases. The future minimum lease payments under these leases (with initial or remaining lease terms in excess of one year) as of December 31, 2010 are as follows: $228 in 2011, $229 in 2012, $221 in 2013, $194 in 2014, $55 in 2015, and $24 thereafter.
Note 7: Deposits
The aggregate amounts of time deposits in denominations of $100 or more at December 31, 2010 and 2009 were $139,481 and $149,266, respectively.
At December 31, 2010 the scheduled maturities of time deposits are as follows:
|
2011
|
$
|
224,121
|
||
|
2012
|
85,880
|
|||
|
2013
|
10,623
|
|||
|
2014
|
1,473
|
|||
|
2015
|
10,010
|
|||
|
Thereafter
|
96
|
|||
|
$
|
332,203
|
At December 31, 2010 and 2009, overdraft demand deposits reclassified to loans totaled $1,206 and $937, respectively.
Note 8: Employee Benefit Plans
401(k) Plan
The Company has a Retirement Accumulation Plan qualifying under IRS Code Section 401(k), in which NBI, NBB and NBFS are participating employers. Eligible participants may contribute up to 100% of their total annual compensation to the plan, subject to certain limits based on federal tax laws. Employee contributions are matched by the employer based on a percentage of an employee’s total annual compensation contributed to the plan. For the years ended December 31, 2010, 2009 and 2008, the Company contributed $277, $268 and $262, respectively, to the plan.
49
Employee Stock Ownership Plan
The Company has a nonleveraged Employee Stock Ownership Plan (ESOP) which enables employees of NBI and its subsidiaries who have one year of service and who have attained the age of 21 prior to the plan’s January 1 and July 1 enrollment dates to own NBI common stock. Contributions to the ESOP, which are not mandatory, are determined annually by the Board of Directors. Contribution expense amounted to $350, $300 and $300 in the years ended December 31, 2010, 2009 and 2008, respectively. Dividends on ESOP shares are charged to retained earnings. As of December 31, 2010, the number of allocated shares held by the ESOP was 243,499 and the number of unallocated shares was 13,196. All shares held by the ESOP are treated as outstanding in computing the Company’s basic net income per share. Upon reaching age 55 with ten years of plan participation, a vested participant has the right to diversify 50% of his or her allocated ESOP shares and NBI or the ESOP, with the agreement of the Trustee, is obligated to purchase those shares. The ESOP contains a put option which allows a withdrawing participant to require the Company or the ESOP, if the plan administrator agrees, to purchase his or her allocated shares if the shares are not readily tradable on an established market at the time of distribution.
Defined Benefit Plan
The Company’s defined benefit pension plan covers substantially all employees. The plan benefit formula is based upon the length of service of retired employees and a percentage of qualified W-2 compensation during their final years of employment. The defined benefit plan was amended in 2008 to reduce the benefit formula for future accruals. This resulted in a reduction in prior cost. Information pertaining to activity in the plan is as follows:
|
December 31,
|
||||||||||||
|
2010
|
2009
|
2008
|
||||||||||
|
Change in benefit obligation
|
||||||||||||
|
Projected benefit obligation at beginning of year
|
$ | 11,598 | $ | 10,703 | $ | 11,859 | ||||||
|
Service cost
|
400 | 353 | 500 | |||||||||
|
Interest cost
|
687 | 661 | 719 | |||||||||
|
Actuarial (gain) loss
|
958 | 362 | (613 | ) | ||||||||
|
Benefits paid
|
(672 | ) | (481 | ) | (336 | ) | ||||||
|
Prior cost due to amendment
|
--- | --- | (1,426 | ) | ||||||||
|
Projected benefit obligation at end of year
|
12,971 | 11,598 | 10,703 | |||||||||
|
Change in plan assets
|
||||||||||||
|
Fair value of plan assets at beginning of year
|
7,461 | 6,337 | 8,242 | |||||||||
|
Actual return on plan assets
|
782 | 1,249 | (1,964 | ) | ||||||||
|
Employer contribution
|
585 | 356 | 395 | |||||||||
|
Benefits paid
|
(672 | ) | (481 | ) | (336 | ) | ||||||
|
Fair value of plan assets at end of year
|
8,156 | 7,461 | 6,337 | |||||||||
|
Funded status at the end of the year
|
$ | (4,815 | ) | $ | (4,137 | ) | $ | (4,366 | ) | |||
|
Amounts recognized in the Balance Sheet
|
||||||||||||
|
Other liabilities
|
$ | (4,815 | ) | $ | (4,137 | ) | $ | (4,366 | ) | |||
|
Amounts recognized in accumulated other comprehensive income (loss), net
|
||||||||||||
|
Net (loss)
|
$ | (4,957 | ) | $ | (4,420 | ) | $ | (5,114 | ) | |||
|
Prior service cost
|
1,080 | 1,180 | 1,281 | |||||||||
|
Deferred tax asset
|
1,357 | 1,130 | 1,335 | |||||||||
|
Net obligation at transition
|
--- | 11 | 23 | |||||||||
|
Amount recognized
|
$ | (2,520 | ) | $ | (2,099 | ) | $ | (2,475 | ) | |||
50
|
Components of net periodic benefit cost
|
||||||||||||
|
Service cost
|
$ | 400 | $ | 353 | $ | 429 | ||||||
|
Interest cost
|
687 | 661 | 616 | |||||||||
|
Expected return on plan assets
|
(607 | ) | (527 | ) | (667 | ) | ||||||
|
Amortization of prior service cost
|
(101 | ) | (101 | ) | (101 | ) | ||||||
|
Amortization of net obligation at transition
|
(11 | ) | (13 | ) | (13 | ) | ||||||
|
Recognized net actuarial loss
|
246 | 335 | 154 | |||||||||
|
Net periodic benefit cost
|
$ | 614 | $ | 708 | $ | 418 | ||||||
|
Other changes in plan assets and benefit obligations recognized in accumulated other comprehensive (income) loss
|
||||||||||||
|
Net (gain) loss
|
$ | 536 | $ | (489 | ) | $ | 1,951 | |||||
|
Prior service cost
|
--- | --- | (1,426 | ) | ||||||||
|
Amortization of prior service cost
|
101 | 101 | 117 | |||||||||
|
Amortization of net obligation at transition
|
11 | 13 | 15 | |||||||||
|
Deferred income tax (benefit) expense
|
(227 | ) | 131 | (230 | ) | |||||||
|
Total recognized
|
$ | 421 | $ | (244 | ) | $ | 427 | |||||
|
Total recognized in net periodic benefit cost and other comprehensive (income) loss, net of income tax (benefit) expense
|
$ | 1,035 | $ | 464 | $ | 845 | ||||||
|
Adjustments to retained earnings due to change in measurement date
|
||||||||||||
|
Service cost
|
$ | --- | $ | --- | $ | 71 | ||||||
|
Interest cost
|
--- | --- | 102 | |||||||||
|
Expected return on plan assets
|
--- | --- | (111 | ) | ||||||||
|
Amortization of prior service cost
|
--- | --- | (17 | ) | ||||||||
|
Amortization of net obligation at transition
|
--- | --- | (2 | ) | ||||||||
|
Recognized net actuarial loss
|
--- | --- | 26 | |||||||||
|
Deferred tax benefit
|
--- | --- | (24 | ) | ||||||||
|
Adjustment to retained earnings
|
$ | --- | $ | --- | $ | 45 | ||||||
|
Weighted average assumptions at end of the year
|
||||||||||||
|
Discount rate used for net periodic pension cost
|
6.00 | % | 6.00 | % | 6.00 | % | ||||||
|
Discount rate used for disclosure
|
5.50 | % | 6.00 | % | 6.00 | % | ||||||
|
Expected return on plan assets
|
8.00 | % | 8.00 | % | 8.00 | % | ||||||
|
Rate of compensation increase
|
4.00 | % | 4.00 | % | 4.00 | % | ||||||
Long Term Rate of Return
The Company, as plan sponsor, selects the expected long-term rate-of-return-on-assets assumption in consultation with its investment advisors and actuary. This rate is intended to reflect the average rate of earnings expected to be earned on the funds invested or to be invested to provide plan benefits. Historical performance is reviewed, especially with respect to real rates of return (net of inflation), for the major asset classes held or anticipated to be held by the trust, and for the trust itself. Undue weight is not given to recent experience, which may not continue over the measurement period, but other higher significance is placed on current forecasts of future long-term economic conditions.
Because assets are held in a qualified trust, anticipated returns are not reduced for taxes. Further, and solely for this purpose, the plan is assumed to continue in force and not terminate during the period during which assets are invested. However, consideration is given to the potential impact of current and future investment policy, cash flow into and out of the trust, and expenses (both investment and non-investment) typically paid from plan assets (to the extent such expenses are not explicitly estimated within periodic cost).
51
The Company, as plan sponsor, has adopted a Pension Administrative Committee Policy (the Policy) for monitoring the investment management of its qualified plans. The Policy includes a statement of general investment principles and a listing of specific investment guidelines, to which the committee may make documented exceptions. The guidelines state that, unless otherwise indicated, all investments that are permitted under the Prudent Investor Rule shall be permissible investments for the defined benefit pension plan. All plan assets are to be invested in marketable securities. Certain investments are prohibited, including commodities and future contracts, private placements, repurchase agreements, options and derivatives. The Policy establishes quality standards for fixed income investments and mutual funds included in the pension plan trust. The Policy also outlines diversification standards.
The preferred target allocation for the assets of the defined benefit pension plan is 65% in equity securities and 35% in fixed income securities. Equity securities include investments in large-cap and mid-cap companies primarily located in the United States, although a small number of international large-cap companies are included. There are also investments in mutual funds holding the equities of large-cap and mid-cap U.S. companies. Fixed income securities include U.S. government agency securities and corporate bonds from companies representing diversified industries. There are no investments in hedge funds, private equity funds or real estate.
Fair value measurements of the pension plan’s assets at December 31, 2010 follow:
|
Fair Value Measurements at December 31, 2010
|
||||||||||
|
Asset Category
|
Total
|
Quoted Prices in Active Markets for Identical Assets (Level 1)
|
Significant Observable Inputs (Level 2)
|
Significant Unobservable Inputs (Level 3)
|
||||||
|
Cash
|
$
|
183
|
$
|
183
|
$
|
---
|
$
|
---
|
||
|
Equity securities:
|
||||||||||
|
U. S. companies
|
3,375
|
3,375
|
---
|
---
|
||||||
|
International companies
|
134
|
134
|
---
|
---
|
||||||
|
Equities mutual funds (a)
|
1,403
|
1,403
|
---
|
---
|
||||||
|
U. S. government agencies and corporations
|
425
|
---
|
425
|
---
|
||||||
|
State and political subdivisions
|
268
|
---
|
268
|
---
|
||||||
|
Corporate bonds – investment grade (b)
|
2,176
|
---
|
2,176
|
---
|
||||||
|
Corporate bonds – below investment grade (c)
|
192
|
---
|
192
|
---
|
||||||
|
Total pension plan assets
|
$
|
8,156
|
$
|
5,095
|
$
|
3,061
|
$
|
---
|
||
|
(a)
|
This category comprises actively managed equity funds invested in large-cap and mid-cap U.S. companies.
|
|
(b)
|
This category represents investment grade bonds of U.S. issuers from diverse industries.
|
|
(c)
|
This category represents bonds from U.S. issuers from diverse industries that were purchased at investment grade, but which have fallen below investment grade.
|
The Company’s required minimum pension contribution for 2011 has not yet been determined.
Estimated future benefit payments, which reflect expected future service, as appropriate, are as follows:
|
2011
|
$
|
237
|
||
|
2012
|
$
|
278
|
||
|
2013
|
$
|
328
|
||
|
2014
|
$
|
456
|
||
|
2015
|
$
|
509
|
||
|
2016 - 2020
|
$
|
3,827
|
52
Note 9: Stock Option Plan
The Company had a stock option plan, the 1999 Stock Option Plan, that was adopted in 1999 and that was terminated on March 9, 2009. Incentive stock options were granted annually to key employees of NBI and its subsidiaries from 1999 to 2005 and none have been granted since 2005. All of the stock options are vested.
A summary of the status of the Company’s stock option plan is presented below:
|
Options
|
Shares
|
Weighted-
Average
Exercise
Price
|
Weighted-
Average
Remaining
Contractual
Term
|
Aggregate
Intrinsic
Value
|
||||||
|
Outstanding at January 1, 2010
|
109,500
|
$
|
22.14
|
|||||||
|
Granted
|
---
|
---
|
||||||||
|
Exercised
|
---
|
---
|
||||||||
|
Forfeited or expired
|
---
|
---
|
||||||||
|
Outstanding at December 31, 2010
|
109,500
|
$
|
22.14
|
4.49
|
$
|
1,024
|
||||
|
Exercisable at December 31, 2010
|
109,500
|
$
|
22.14
|
4.49
|
$
|
1,024
|
||||
There were no shares exercised in 2010. For 2009 and 2008, the intrinsic value of shares exercised were $59 and $40, respectively. No tax benefit was recognized on shares exercised in those years.
Note 10: Income Taxes
The Company files United States federal income tax returns, and Virginia and West Virginia state income tax returns. With few exceptions, the Company is no longer subject to U.S. federal, state and local income tax examinations by tax authorities for years prior to 2007.
Allocation of income tax expense between current and deferred portions is as follows:
|
Years ended December 31,
|
||||||||||||
|
2010
|
2009
|
2008
|
||||||||||
|
Current
|
$ | 4,535 | $ | 4,717 | $ | 3,955 | ||||||
|
Deferred
|
(312 | ) | (1,057 | ) | (310 | ) | ||||||
|
Total income tax expense
|
$ | 4,223 | $ | 3,660 | $ | 3,645 | ||||||
The following is a reconciliation of the “expected” income tax expense, computed by applying the U.S. Federal income tax rate of 35% to income before income tax expense, with the reported income tax expense:
|
Years ended December 31,
|
||||||||||||
|
2010
|
2009
|
2008
|
||||||||||
|
Computed “expected” income tax expense
|
$ | 6,927 | $ | 6,293 | $ | 6,033 | ||||||
|
Tax-exempt interest income
|
(2,556 | ) | (2,556 | ) | (2,224 | ) | ||||||
|
Nondeductible interest expense
|
195 | 267 | 291 | |||||||||
|
Other, net
|
(343 | ) | (344 | ) | (455 | ) | ||||||
|
Reported income tax expense
|
$ | 4,223 | $ | 3,660 | $ | 3,645 | ||||||
53
The components of net deferred tax assets, included in other assets, are as follows:
|
December 31,
|
||||||||
|
2010
|
2009
|
|||||||
|
Deferred tax assets:
|
||||||||
|
Allowance for loan losses and unearned fee income
|
$ | 2,857 | $ | 2,365 | ||||
|
Valuation allowance on other real estate owned
|
123 | 159 | ||||||
|
Deferred compensation and other liabilities
|
2,609 | 2,483 | ||||||
|
Net unrealized losses on securities available for sale
|
90 | --- | ||||||
|
Total deferred tax assets
|
$ | 5,679 | $ | 5,007 | ||||
|
Deferred tax liabilities:
|
||||||||
|
Fixed assets
|
$ | (72 | ) | $ | (77 | ) | ||
|
Discount accretion on securities
|
(44 | ) | (77 | ) | ||||
|
Deposit intangibles and goodwill
|
(798 | ) | (677 | ) | ||||
|
Other
|
(142 | ) | (182 | ) | ||||
|
Net unrealized gains on securities available for sale
|
--- | (875 | ) | |||||
|
Total deferred tax liabilities
|
(1,056 | ) | (1,888 | ) | ||||
|
Net deferred tax assets
|
$ | 4,623 | $ | 3,119 | ||||
The Company has determined that a valuation allowance for the gross deferred tax assets is not necessary at December 31, 2010 and 2009 because the realization of all gross deferred tax assets can be supported by the amount of taxes paid during the carryback period available under current tax laws.
Note 11: Restrictions on Dividends
The Company’s principal source of funds for dividend payments is dividends received from its subsidiary bank. For the years ended December 31, 2010, 2009 and 2008, dividends received from subsidiary banks were $6,309, $5,884 and $5,591, respectively.
Substantially all of Bankshares’ retained earnings are undistributed earnings of its sole banking subsidiary, which are restricted by various regulations administered by federal bank regulatory agencies. Bank regulatory agencies restrict, without prior approval, the total dividend payments of a bank in any calendar year to the bank’s retained net income of that year to date, as defined, combined with its retained net income of the preceding two years, less any required transfers to surplus. At December 31, 2010, retained net income, which was free of such restriction, amounted to approximately $26,698.
Note 12: Minimum Regulatory Capital Requirement
The Company (on a consolidated basis) and its subsidiary bank are subject to various regulatory capital requirements administered by the federal banking agencies. Failure to meet minimum capital requirements can initiate certain mandatory and possible additional discretionary actions by regulators that, if undertaken, could have a direct material effect on the Company’s and the bank’s financial statements. Under capital adequacy guidelines and the regulatory framework for prompt corrective action, the Company and the bank must meet specific capital guidelines that involve quantitative measures of their assets, liabilities, and certain off balance sheet items as calculated under regulatory accounting practices. The capital amounts and classification are also subject to qualitative judgments by regulators about components, risk weightings, and other factors. Prompt corrective action provisions are not applicable to bank holding companies.
Quantitative measures established by regulation to ensure capital adequacy require the Company and the bank to maintain minimum amounts and ratios (set forth in the following table) of total and Tier 1 capital (as defined in the regulations) to risk-weighted assets (as defined), and of Tier 1 capital (as defined) to average assets (as defined). Management believes, as of December 31, 2010 and 2009, that the Company and the bank meet all capital adequacy requirements to which they are subject.
As of December 31, 2010, the most recent notifications from the appropriate regulatory authorities categorized the bank as well capitalized under the regulatory framework for prompt corrective action. To be categorized as well capitalized, an institution must maintain minimum total risk-based, Tier 1 risk-based and Tier 1 leverage ratios, as set forth in the following tables. There are no conditions or events since these notifications that management believes have changed the bank’s category. The Company’s and the bank’s actual capital amounts and ratios as of December 31, 2010 and 2009 are also presented in the following tables.
54
|
Actual
|
Minimum Capital
Requirement
|
Minimum To Be Well
Capitalized Under
Prompt Corrective
Action Provisions
|
||||||||||||
|
Amount
|
Ratio
|
Amount
|
Ratio
|
Amount
|
Ratio
|
|||||||||
|
December 31, 2010
|
||||||||||||||
|
Total capital (to risk weighted assets)
|
||||||||||||||
|
NBI consolidated
|
$
|
127,958
|
19.4
|
%
|
$
|
52,883
|
8.0
|
%
|
N/A
|
N/A
|
||||
|
NBB
|
124,758
|
19.0
|
%
|
52,594
|
8.0
|
%
|
$
|
65,742
|
10.0
|
%
|
||||
|
Tier 1 capital (to risk weighted assets)
|
||||||||||||||
|
NBI consolidated
|
$
|
120,294
|
18.2
|
%
|
$
|
26,441
|
4.0
|
%
|
N/A
|
N/A
|
||||
|
NBB
|
117,094
|
17.8
|
%
|
26,297
|
4.0
|
%
|
$
|
39,445
|
6.0
|
%
|
||||
|
Tier 1 capital (to average assets)
|
||||||||||||||
|
NBI consolidated
|
$
|
120,294
|
12.1
|
%
|
$
|
39,848
|
4.0
|
%
|
N/A
|
N/A
|
||||
|
NBB
|
117,094
|
11.9
|
%
|
39,516
|
4.0
|
%
|
$
|
49,395
|
5.0
|
%
|
||||
|
Actual
|
Minimum Capital
Requirement
|
Minimum To Be Well
Capitalized Under
Prompt Corrective
Action Provisions
|
||||||||||||
|
Amount
|
Ratio
|
Amount
|
Ratio
|
Amount
|
Ratio
|
|||||||||
|
December 31, 2009
|
||||||||||||||
|
Total capital (to risk weighted assets)
|
||||||||||||||
|
NBI consolidated
|
$
|
116,783
|
17.3
|
%
|
$
|
53,931
|
8.0
|
%
|
N/A
|
N/A
|
||||
|
NBB
|
113,310
|
16.9
|
%
|
53,625
|
8.0
|
%
|
$
|
67,031
|
10.0
|
%
|
||||
|
Tier 1 capital (to risk weighted assets)
|
||||||||||||||
|
NBI consolidated
|
$
|
109,857
|
16.3
|
%
|
$
|
26,966
|
4.0
|
%
|
N/A
|
N/A
|
||||
|
NBB
|
106,384
|
15.9
|
%
|
26,812
|
4.0
|
%
|
$
|
40,218
|
6.0
|
%
|
||||
|
Tier 1 capital (to average assets)
|
||||||||||||||
|
NBI consolidated
|
$
|
109,857
|
11.5
|
%
|
$
|
38,259
|
4.0
|
%
|
N/A
|
N/A
|
||||
|
NBB
|
106,384
|
11.2
|
%
|
37,981
|
4.0
|
%
|
$
|
47,477
|
5.0
|
%
|
||||
Note 13: Condensed Financial Statements of Parent Company
Financial information pertaining only to NBI (Parent) is as follows:
Condensed Balance Sheets
|
December 31,
|
||||||||
|
2010
|
2009
|
|||||||
|
Assets
|
||||||||
|
Cash due from subsidiaries
|
$ | 2 | $ | 13 | ||||
|
Securities available for sale
|
2,331 | 2,445 | ||||||
|
Investments in subsidiaries, at equity
|
127,019 | 119,472 | ||||||
|
Refundable income taxes due from subsidiaries
|
--- | 56 | ||||||
|
Other assets
|
691 | 645 | ||||||
|
Total assets
|
$ | 130,043 | $ | 122,631 | ||||
|
Liabilities and Stockholders’ Equity
|
||||||||
|
Other liabilities
|
$ | 856 | $ | 555 | ||||
|
Stockholders’ equity
|
129,187 | 122,076 | ||||||
|
Total liabilities and stockholders’ equity
|
$ | 130,043 | $ | 122,631 | ||||
55
Condensed Statements of Income
|
Years Ended December 31,
|
||||||||||||
|
2010
|
2009
|
2008
|
||||||||||
|
Income
|
||||||||||||
|
Dividends from Subsidiaries
|
$ | 6,309 | $ | 5,884 | $ | 5,591 | ||||||
|
Interest on securities – taxable
|
23 | 7 | 41 | |||||||||
|
Interest on securities – nontaxable
|
44 | 61 | 62 | |||||||||
|
Other income
|
1,157 | 1,129 | 1,147 | |||||||||
|
Securities gains (losses)
|
--- | 2 | (62 | ) | ||||||||
| 7,533 | 7,083 | 6,779 | ||||||||||
|
Expenses
|
||||||||||||
|
Other expenses
|
1,756 | 1,590 | 1,720 | |||||||||
|
Income before income tax benefit and equity in undistributed net income of subsidiaries
|
5,777 | 5,493 | 5,059 | |||||||||
|
Applicable income tax benefit
|
152 | 120 | 182 | |||||||||
|
Income before equity in undistributed net income of subsidiaries
|
5,929 | 5,613 | 5,241 | |||||||||
|
Equity in undistributed net income of subsidiaries
|
9,640 | 8,706 | 8,352 | |||||||||
|
Net income
|
$ | 15,569 | $ | 14,319 | $ | 13,593 | ||||||
Condensed Statements of Cash Flows
|
Years ended December 31,
|
||||||||||||
|
2010
|
2009
|
2008
|
||||||||||
|
Cash Flows from Operating Expenses
|
||||||||||||
|
Net income
|
$ | 15,569 | $ | 14,319 | $ | 13,593 | ||||||
|
Adjustments to reconcile net income to net cash provided by operating activities:
|
||||||||||||
|
Equity in undistributed net income of subsidiaries
|
(9,640 | ) | (8,706 | ) | (8,352 | ) | ||||||
|
Amortization of premiums and accretion of discounts, net
|
2 | 1 | 1 | |||||||||
|
Depreciation expense
|
9 | 9 | 9 | |||||||||
|
Securities (gains) losses
|
--- | (2 | ) | 62 | ||||||||
|
Net change in refundable income taxes due from subsidiaries
|
56 | (31 | ) | 59 | ||||||||
|
Net change in other assets
|
(24 | ) | (56 | ) | (28 | ) | ||||||
|
Net change in other liabilities
|
244 | 66 | 4 | |||||||||
|
Net cash provided by operating activities
|
6,216 | 5,600 | 5,348 | |||||||||
|
Cash Flows from Investing Activities
|
||||||||||||
|
Purchases of securities available for sale
|
(1,868 | ) | (327 | ) | (930 | ) | ||||||
|
Maturities and calls of securities available for sale
|
1,950 | 524 | 1,615 | |||||||||
|
Net cash provided by investing activities
|
82 | 197 | 685 | |||||||||
|
Cash Flows from Financing Activities
|
||||||||||||
|
Cash dividends paid
|
(6,309 | ) | (5,823 | ) | (5,543 | ) | ||||||
|
Common stock repurchased
|
--- | --- | (562 | ) | ||||||||
|
Exercise of stock options
|
--- | 54 | 75 | |||||||||
|
Note payable
|
--- | (54 | ) | --- | ||||||||
|
Net cash used in financing activities
|
(6,309 | ) | (5,823 | ) | (6,030 | ) | ||||||
|
Net change in cash
|
(11 | ) | (26 | ) | 3 | |||||||
|
Cash due from subsidiaries at beginning of year
|
13 | 39 | 36 | |||||||||
|
Cash due from subsidiaries at end of year
|
$ | 2 | $ | 13 | $ | 39 | ||||||
56
Note 14: Financial Instruments with Off-Balance Sheet Risk
The Company is a party to financial instruments with off-balance sheet risk in the normal course of business to meet the financing needs of its customers. These financial instruments include commitments to extend credit, standby letters of credit and interest rate locks. These instruments involve, to varying degrees, elements of credit risk in excess of the amount recognized in the consolidated balance sheets.
The Company’s exposure to credit loss, in the event of nonperformance by the other party to the financial instrument for commitments to extend credit and standby letters of credit, is represented by the contractual amount of those instruments. The Company uses the same credit policies in making commitments and conditional obligations as it does for on-balance sheet instruments. The Company may require collateral or other security to support the following financial instruments with credit risk.
At December 31, 2010 and 2009, the following financial instruments were outstanding whose contract amounts represent credit risk:
|
December 31,
|
||||||||
|
2010
|
2009
|
|||||||
|
Financial instruments whose contract amounts represent credit risk:
|
||||||||
|
Commitments to extend credit
|
$ | 149,106 | $ | 133,816 | ||||
|
Standby letters of credit
|
13,540 | 11,953 | ||||||
|
Mortgage loans sold with potential recourse
|
19,595 | 25,487 | ||||||
Commitments to extend credit are agreements to lend to a customer as long as there is no violation of any condition established in the contract. Commitments generally have fixed expiration dates or other termination clauses and may require payment of a fee. The commitments for lines of credit may expire without being drawn upon. Therefore, the total commitment amounts do not necessarily represent future cash requirements. The amount of collateral obtained, if it is deemed necessary by the Company, is based on management’s credit evaluation of the customer.
Unfunded commitments under commercial lines of credit, revolving credit lines, and overdraft protection agreements are commitments for possible future extensions of credit. Some of these commitments are uncollateralized and do not contain a specified maturity date and may not be drawn upon to the total extent to which the Company is committed.
Standby letters of credit are conditional commitments issued by the Company to guarantee the performance of a customer to a third party. The credit risk involved in issuing letters of credit is essentially the same as that involved in extending loans to customers. Collateral held varies but may include accounts receivable, inventory, property, plant and equipment, and income-producing commercial properties.
The Company originates mortgage loans for sale to secondary market investors subject to contractually specified and limited recourse provisions. In 2010, the Company originated $21,929 and sold $19,595 to investors, compared to $25,265 originated and $25,487 sold in 2009. Every contract with each investor contains certain recourse language. In general, the Company may be required to repurchase a previously sold mortgage loan if there is major noncompliance with defined loan origination or documentation standards, including fraud, negligence or material misstatement in the loan documents. Repurchase may also be required if necessary governmental loan guarantees are canceled or never issued, or if an investor is forced to buy back a loan after it has been resold as a part of a loan pool. In addition, the Company may have an obligation to repurchase a loan if the mortgagor has defaulted early in the loan term. This potential default period is approximately twelve months after sale of a loan to the investor.
At December 31, 2010, the Company had locked-rate commitments to originate mortgage loans amounting to approximately $1,029 and loans held for sale of $2,460. Risks arise from the possible inability of counterparties to meet the terms of their contracts. The Company does not expect any counterparty to fail to meet its obligations.
The Company maintains cash accounts in other commercial banks. The amount on deposit with correspondent institutions at December 31, 2010 that exceeded the insurance limits of the Federal Deposit Insurance Corporation was $9,752.
Note 15: Concentrations of Credit Risk
The Company does a general banking business, serving the commercial and personal banking needs of its customers. NBB’s market area in southwest Virginia is made up of the counties of Montgomery, Giles, Pulaski, Tazewell, Wythe, Smyth and Washington. It also includes the independent cities of Radford and Galax, and the portions of Carroll and Grayson Counties that are adjacent to Galax. In addition, it serves those portions of Mercer County and McDowell County, West Virginia that are contiguous with Tazewell County. Substantially all of NBB’s loans are made in its market area. The ultimate collectability of the bank’s loan portfolio and the ability to realize the value of any underlying collateral, if needed, is influenced by the economic conditions of the market area. The Company’s operating results are therefore closely correlated with the economic trends within this area.
At December 31, 2010 and 2009, approximately $339,161 and $328,786, respectively, of the loan portfolio was concentrated in commercial real estate. This represents approximately 59% of the loan portfolio at December 31, 2010 and 56% at December 31, 2009. Included in commercial loans at December 31, 2010 and 2009 was approximately $154,330 and $154,835, respectively, in loans for college housing and professional office buildings. This represents approximately 27% and 26% of the loan portfolio at December 31, 2010 and 2009, respectively. Loans secured by residential real estate were approximately $154,750 and $154,084 at December 31, 2010 and 2009, respectively. This represents approximately 27% of the loan portfolio at December 31, 2010 and 26% at December 31, 2009, respectively. Loans secured by automobiles were approximately $15,271 and $15,180 at December 31, 2010 and 2009, respectively. This represents approximately 3% of the loan portfolio at December 31, 2010 and 2009.
57
The Company has established operating policies relating to the credit process and collateral in loan originations. Loans to purchase real and personal property are generally collateralized by the related property and with loan amounts established based on certain percentage limitations of the property’s total stated or appraised value. Credit approval is primarily a function of collateral and the evaluation of the creditworthiness of the individual borrower or project based on available financial information. Management considers the concentration of credit risk to be minimal.
Note 16: Fair Value Measurements
The Company records fair value adjustments to certain assets and liabilities and determines fair value disclosures utilizing a definition of fair value of assets and liabilities that states that fair value is an exit price, representing the amount that would be received to sell an asset or paid to transfer a liability in an orderly transaction between market participants. Additional considerations come into play in determining the fair value of financial assets in markets that are not active.
The Company uses a hierarchy of valuation techniques based on whether the inputs to those valuation techniques are observable or unobservable. Observable inputs reflect market data obtained from independent sources, while unobservable inputs reflect the Company’s market assumptions. The three levels of the fair value hierarchy based on these two types of inputs are as follows:
|
Level 1 –
|
Valuation is based on quoted prices in active markets for identical assets and liabilities.
|
||
|
Level 2 –
|
Valuation is based on observable inputs including quoted prices in active markets for similar assets and liabilities, quoted prices for identical or similar assets and liabilities in less active markets, and model-based valuation techniques for which significant assumptions can be derived primarily from or corroborated by observable data in the market.
|
||
|
Level 3 –
|
Valuation is based on model-based techniques that use one or more significant inputs or assumptions that are unobservable in the market.
|
The following describes the valuation techniques used by the Company to measure certain financial assets and liabilities recorded at fair value on a recurring basis in the financial statements:
Securities Available for Sale
Securities available for sale are recorded at fair value on a recurring basis. Fair value measurement is based upon quoted market prices, when available (Level 1). If quoted market prices are not available, fair values are measured utilizing independent valuation techniques of identical or similar securities for which significant assumptions are derived primarily from or corroborated by observable market data. Third party vendors compile prices from various sources and may determine the fair value of identical or similar securities by using pricing models that considers observable market data (Level 2). The carrying value of restricted Federal Reserve Bank and Federal Home Loan Bank stock approximates fair value based upon the redemption provisions of each entity and is therefore excluded from the following table.
The following table’s presents the balances of financial assets and liabilities measured at fair value on a recurring basis as of December 31, 2010 and 2009:
|
Fair Value Measurements at December 31, 2010 Using
|
||||||||||||||||
|
Description
|
Balance as of
December 31,
2010
|
Quoted Prices
in Active
Markets for
Identical Assets
(Level 1)
|
Significant
Other
Observable
Inputs
(Level 2)
|
Significant
Unobservable Inputs
(Level 3)
|
||||||||||||
|
U.S. Treasury
|
$ | 2,183 | $ | --- | $ | 2,183 | $ | --- | ||||||||
|
U.S. Government agencies and corporations
|
88,152 | --- | 88,152 | --- | ||||||||||||
|
States and political subdivisions
|
61,682 | --- | 61,682 | --- | ||||||||||||
|
Mortgage-backed securities
|
11,379 | --- | 11,379 | --- | ||||||||||||
|
Corporate debt securities
|
17,680 | --- | 17,680 | --- | ||||||||||||
|
Other securities
|
2,062 | --- | 2,062 | --- | ||||||||||||
|
Total securities available for sale
|
$ | 183,138 | $ | --- | $ | 183,138 | $ | --- | ||||||||
58
|
Fair Value Measurements at December 31, 2009 Using
|
||||||||||||||||
|
Description
|
Balance as of
December 31,
2009
|
Quoted Prices
in Active
Markets for
Identical Assets
(Level 1)
|
Significant
Other
Observable
Inputs
(Level 2)
|
Significant
Unobservable Inputs
(Level 3)
|
||||||||||||
|
U.S. Treasury
|
$ | 2,177 | $ | --- | $ | 2,177 | $ | --- | ||||||||
|
U.S. Government agencies and corporations
|
47,587 | --- | 47,587 | --- | ||||||||||||
|
States and political subdivisions
|
74,405 | --- | 74,405 | --- | ||||||||||||
|
Mortgage-backed securities
|
17,016 | --- | 17,016 | --- | ||||||||||||
|
Corporate debt securities
|
22,642 | --- | 22,642 | --- | ||||||||||||
|
Other securities
|
2,445 | --- | 2,445 | --- | ||||||||||||
|
Total securities available for sale
|
$ | 166,272 | $ | --- | $ | 166,272 | $ | --- | ||||||||
Certain financial assets are measured at fair value on a nonrecurring basis in accordance with GAAP. Adjustments to the fair value of these assets usually result from the application of lower-of-cost-or-market accounting or write-downs of individual assets.
The following describes the valuation techniques used by the Company to measure certain financial assets recorded at fair value on a nonrecurring basis in the financial statements:
Loans Held for Sale
Loans held for sale are carried at the lower of cost or market value. These loans currently consist of one-to-four family residential loans originated for sale in the secondary market. Fair value is based on the price secondary markets are currently offering for similar loans using observable market data which is not materially different than cost due to the short duration between origination and sale (Level 2). As such, the Company records any fair value adjustments on a nonrecurring basis. No nonrecurring fair value adjustments were recorded on loans held for sale during the year ended December 31, 2010. Gains and losses on the sale of loans are recorded within income from mortgage banking on the Consolidated Statements of Income.
Impaired Loans
Loans are designated as impaired when, in the judgment of management based on current information and events, it is probable that all amounts due according to the contractual terms of the loan agreement will not be collected. Troubled debt restructurings are impaired loans. The measurement of loss associated with impaired loans can be based on either the observable market price of the loan or the fair value of the collateral. Fair value is measured based on the value of the collateral securing the loans. Collateral may be in the form of real estate or business assets including equipment, inventory, and accounts receivable. The vast majority of the collateral is real estate. The value of real estate collateral is determined utilizing an income or market valuation approach based on an appraisal conducted by an independent, licensed appraiser outside of the Company using observable market data (Level 2). However, if the collateral is a house or building in the process of construction or if an appraisal of the real estate property is over two years old, then the fair value is considered Level 3. The value of business equipment is based upon an outside appraisal if deemed significant, or the net book value on the applicable business’ financial statements if not considered significant using observable market data. Likewise, values for inventory and accounts receivables collateral are based on financial statement balances or aging reports (Level 3). Impaired loans allocated to the Allowance for Loan Losses are measured at fair value on a nonrecurring basis. Any fair value adjustments are recorded in the period incurred as provision for loan losses on the Consolidated Statements of Income.
59
The following table summarizes the Company’s financial assets that were measured at fair value on a nonrecurring basis during the period.
|
Carrying value at December 31, 2010
|
||||||||||||||||
|
Description
|
Balance as of
December 31,
2010
|
Quoted Prices
in Active
Markets for
Identical Assets
(Level 1)
|
Significant
Other
Observable
Inputs
(Level 2)
|
Significant
Unobservable Inputs
(Level 3)
|
||||||||||||
|
Assets:
|
||||||||||||||||
|
Impaired loans net of valuation allowance
|
$ | 6,476 | $ | --- | $ | --- | $ | 6,476 | ||||||||
|
Carrying value at December 31, 2009
|
||||||||||||||||
|
Description
|
Balance as of
December 31,
2009
|
Quoted Prices
in Active
Markets for
Identical Assets
(Level 1)
|
Significant
Other
Observable
Inputs
(Level 2)
|
Significant
Unobservable Inputs
(Level 3)
|
||||||||||||
|
Assets:
|
||||||||||||||||
|
Impaired loans net of valuation allowance
|
$ | 5,135 | $ | --- | $ | --- | $ | 5,135 | ||||||||
The fair value of a financial instrument is the current amount that would be exchanged between willing parties, other than in a forced liquidation. Fair value is best determined based upon quoted market prices. However, in many instances, there are no quoted market prices for the Company’s various financial instruments. In cases where quoted market prices are not available, fair values are based on estimates using present value or other valuation techniques. Those techniques are significantly affected by the assumptions used, including the fair discount rate and estimates of future cash flows. Accordingly, the fair value estimates may not be realized in an immediate settlement of the instrument. Accounting guidance for fair value excludes certain financial instruments and all nonfinancial instruments from its disclosure requirements. Accordingly, the aggregate fair value amounts presented may not necessarily represent the underlying fair value of the Company.
Other Real Estate Owned
Certain assets such as other real estate owned (OREO) are measured at fair value less cost to sell.
The following table summarizes the Company’s other real estate owned that were measured at fair value on a nonrecurring basis during the period.
|
Carrying Value at December 31, 2010
|
||||||||||||||||
|
Description
|
Balance as of
December 31,
2010
|
Quoted Prices
in Active
Markets for
Identical Assets
(Level 1)
|
Significant
Other
Observable
Inputs
(Level 2)
|
Significant
Unobservable Inputs
(Level 3)
|
||||||||||||
|
Assets:
|
||||||||||||||||
|
Other real estate owned net of valuation allowance
|
$ | 535 | $ | --- | $ | --- | $ | 535 | ||||||||
|
Carrying Value at December 31, 2009
|
||||||||||||||||
|
Description
|
Balance as of
December 31,
2009
|
Quoted Prices
in Active
Markets for
Identical Assets
(Level 1)
|
Significant
Other
Observable
Inputs
(Level 2)
|
Significant
Unobservable Inputs
(Level 3)
|
||||||||||||
|
Assets:
|
||||||||||||||||
|
Other real estate owned net of valuation allowance
|
$ | 1,868 | $ | --- | $ | --- | $ | 1,868 | ||||||||
60
The following methods and assumptions were used by the Company in estimating fair value disclosures for financial instruments:
Cash and Due from Banks, Interest-Bearing Deposits, and Federal Funds Sold
The carrying amounts approximate fair value.
Securities
The fair values of securities, excluding restricted stock, are determined by quoted market prices or dealer quotes. The fair value of certain state and municipal securities is not readily available through market sources other than dealer quotations, so fair value estimates are based on quoted market prices of similar instruments adjusted for differences between the quoted instruments and the instruments being valued. The carrying value of restricted securities approximates fair value based upon the redemption provisions of the applicable entities.
Loans Held for Sale
Fair values of loans held for sale are based on commitments on hand from investors or prevailing market prices.
Loans
Fair values are estimated for portfolios of loans with similar financial characteristics. Loans are segregated by type such as commercial, real estate – commercial, real estate – construction, real estate – mortgage, credit card and other consumer loans. Each loan category is further segmented into fixed and adjustable rate interest terms and by performing and nonperforming categories.
The fair value of performing loans is calculated by discounting scheduled cash flows through the estimated maturity using estimated market discount rates that reflect the credit and interest rate risk inherent in the loan, as well as estimates for prepayments. The estimate of maturity is based on the Company’s historical experience with repayments for loan classification, modified, as required, by an estimate of the effect of economic conditions on lending.
Fair value for significant nonperforming loans is based on estimated cash flows which are discounted using a rate commensurate with the risk associated with the estimated cash flows. Assumptions regarding credit risk, cash flows and discount rates are determined within management’s judgment, using available market information and specific borrower information.
Deposits
The fair value of demand and savings deposits is the amount payable on demand. The fair value of fixed maturity term deposits and certificates of deposit is estimated using the rates currently offered for deposits with similar remaining maturities.
Accrued Interest
The carrying amounts of accrued interest approximate fair value.
Other Borrowed Funds
Other borrowed funds, represents treasury tax and loan deposits and short-term borrowings from the Federal Home Loan Bank. The carrying amount is a reasonable estimate of fair value because the deposits are generally repaid within 120 days from the transaction date.
Commitments to Extend Credit and Standby Letters of Credit
The only amounts recorded for commitments to extend credit, standby letters of credit and financial guarantees written are the deferred fees arising from these unrecognized financial instruments. These deferred fees are not deemed significant at December 31, 2010 and 2009, and, as such, the related fair values have not been estimated.
The estimated fair values, and related carrying amounts, of the Company’s financial instruments are as follows:
|
December 31,
|
||||||||||||||||
|
2010
|
2009
|
|||||||||||||||
|
Carrying
Amount
|
Estimated Fair
Value
|
Carrying
Amount
|
Estimated Fair
Value
|
|||||||||||||
|
Financial assets:
|
||||||||||||||||
|
Cash and due from banks
|
$ | 9,858 | $ | 9,858 | $ | 12,894 | $ | 12,894 | ||||||||
|
Interest-bearing deposits
|
69,400 | 69,400 | 32,730 | 32,730 | ||||||||||||
|
Securities
|
315,907 | 314,820 | 297,417 | 297,933 | ||||||||||||
|
Mortgage loans held for sale
|
2,460 | 2,460 | 126 | 126 | ||||||||||||
|
Loans, net
|
568,779 | 539,152 | 583,021 | 588,201 | ||||||||||||
|
Accrued interest receivable
|
6,016 | 6,016 | 6,250 | 6,250 | ||||||||||||
|
Financial liabilities:
|
||||||||||||||||
|
Deposits
|
$ | 884,583 | $ | 880,290 | $ | 852,112 | $ | 856,556 | ||||||||
|
Accrued interest payable
|
257 | 257 | 336 | 336 | ||||||||||||
61
Note 17: Selected Quarterly Data (Unaudited)
The following is a summary of the unaudited quarterly results of operations for the years ended December 31, 2010 and 2009:
|
2010
|
||||||||||||||||
|
First
Quarter
|
Second
Quarter
|
Third
Quarter
|
Fourth
Quarter
|
|||||||||||||
|
Income Statement Data:
|
|
|||||||||||||||
|
Interest income
|
$ | 12,240 | $ | 12,347 | $ | 12,287 | $ | 12,265 | ||||||||
|
Interest expense
|
2,979 | 2,850 | 2,726 | 2,603 | ||||||||||||
|
Net interest income
|
9,261 | 9,497 | 9,561 | 9,662 | ||||||||||||
|
Provision for loan losses
|
647 | 852 | 710 | 1,200 | ||||||||||||
|
Noninterest income
|
1,971 | 2,123 | 2,101 | 2,152 | ||||||||||||
|
Noninterest expense
|
5,784 | 5,697 | 5,826 | 5,820 | ||||||||||||
|
Income taxes
|
1,032 | 1,075 | 1,129 | 987 | ||||||||||||
|
Net income
|
$ | 3,769 | $ | 3,996 | $ | 3,997 | $ | 3,807 | ||||||||
|
Per Share Data:
|
||||||||||||||||
|
Basic net income per share
|
$ | 0.54 | $ | 0.58 | $ | 0.58 | $ | 0.55 | ||||||||
|
Fully diluted net income per share
|
0.54 | $ | 0.58 | $ | 0.58 | $ | 0.55 | |||||||||
|
Cash dividends per share
|
--- | 0.44 | --- | 0.47 | ||||||||||||
|
Book value per share
|
18.25 | 18.44 | 19.13 | 18.63 | ||||||||||||
|
2009
|
||||||||||||||||
|
First
Quarter
|
Second
Quarter
|
Third
Quarter
|
Fourth
Quarter
|
|||||||||||||
|
Income Statement Data:
|
|
|||||||||||||||
|
Interest income
|
$ | 12,578 | $ | 12,711 | $ | 12,616 | $ | 12,582 | ||||||||
|
Interest expense
|
4,412 | 4,274 | 3,876 | 3,263 | ||||||||||||
|
Net interest income
|
8,166 | 8,437 | 8,740 | 9,319 | ||||||||||||
|
Provision for loan losses
|
370 | 278 | 305 | 681 | ||||||||||||
|
Noninterest income
|
2,107 | 2,172 | 2,212 | 2,313 | ||||||||||||
|
Noninterest expense
|
5,630 | 6,180 | 5,891 | 6,152 | ||||||||||||
|
Income taxes
|
886 | 794 | 976 | 1,004 | ||||||||||||
|
Net income
|
$ | 3,387 | $ | 3,357 | $ | 3,780 | $ | 3,795 | ||||||||
|
Per Share Data:
|
||||||||||||||||
|
Basic net income per share
|
$ | 0.49 | $ | 0.48 | $ | 0.55 | $ | 0.55 | ||||||||
|
Fully diluted net income per share
|
0.49 | 0.48 | 0.54 | 0.55 | ||||||||||||
|
Cash dividends per share
|
--- | 0.41 | --- | 0.43 | ||||||||||||
|
Book value per share
|
16.39 | 16.58 | 17.52 | 17.61 | ||||||||||||
Note 18. Intangible Assets and Goodwill
In accounting for goodwill and intangible assets, the Company conducts an impairment review at least annually and more frequently if certain impairment indicators are in evidence. Based on the testing for impairment of goodwill and intangible assets, there were no impairment charges for 2010, 2009 or 2008.
62
Information concerning goodwill and intangible assets for years ended December 31, 2010 and 2009 is presented in the following table:
|
Gross Carrying Value
|
Accumulated Amortization
|
Net Carrying Value
|
||||||||||
|
December 31, 2010
|
||||||||||||
|
Amortizable core deposit intangibles
|
$ | 16,257 | $ | 10,562 | $ | 5,695 | ||||||
|
Unamortizable goodwill
|
$ | 5,848 | $ | --- | $ | 5,848 | ||||||
|
December 31, 2009
|
||||||||||||
|
Amortizable core deposit intangibles
|
$ | 16,257 | $ | 9,479 | $ | 6,778 | ||||||
|
Unamortizable goodwill
|
$ | 5,848 | $ | --- | $ | 5,848 | ||||||
As of December 31, 2009, the estimated amortization expense of core deposit intangibles are as follows:
|
2011
|
$
|
1,083
|
||
|
2012
|
1,083
|
|||
|
2013
|
1,077
|
|||
|
2014
|
1,075
|
|||
|
2015
|
1,075
|
|||
|
Thereafter
|
302
|
|||
|
Total
|
$
|
5,695
|
63

REPORT OF INDEPENDENT REGISTERED PUBLIC ACCOUNTING FIRM
To the Board of Directors and Stockholders
National Bankshares, Inc.
Blacksburg, Virginia
We have audited the accompanying consolidated balance sheets of National Bankshares, Inc. and subsidiaries as of December 31, 2010 and 2009, and the related consolidated statements of income, changes in stockholders' equity, and cash flows for each of the three years in the period ended December 31, 2010. These financial statements are the responsibility of the Company’s management. Our responsibility is to express an opinion on these financial statements based on our audits.
We conducted our audits in accordance with the standards of the Public Company Accounting Oversight Board (United States). Those standards require that we plan and perform the audit to obtain reasonable assurance about whether the financial statements are free of material misstatement. An audit includes examining, on a test basis, evidence supporting the amounts and disclosures in the financial statements. An audit also includes assessing the accounting principles used and significant estimates made by management, as well as evaluating the overall financial statement presentation. We believe that our audits provide a reasonable basis for our opinion.
In our opinion, the consolidated financial statements referred to above present fairly, in all material respects, the financial position of National Bankshares, Inc. and subsidiaries as of December 31, 2010 and 2009, and the results of their operations and their cash flows for each of the three years in the period ended December 31, 2010, in conformity with U.S. generally accepted accounting principles.
We have also audited, in accordance with the standards of the Public Company Accounting Oversight Board (United States), National Bankshares, Inc. and subsidiaries’ internal control over financial reporting as of December 31, 2010, based on criteria established in Internal Control — Integrated Framework issued by the Committee of Sponsoring Organizations of the Treadway Commission, and our report dated March 9, 2011 expressed an unqualified opinion on the effectiveness of National Bankshares, Inc. and subsidiaries’ internal control over financial reporting.

Winchester, Virginia
March 9, 2011
64
REPORT OF INDEPENDENT REGISTERED PUBLIC ACCOUNTING FIRM
To the Board of Directors and Stockholders
National Bankshares, Inc.
Blacksburg, Virginia
We have audited National Bankshares, Inc. and subsidiaries’ internal control over financial reporting as of December 31, 2010, based on criteria established in Internal Control — Integrated Framework issued by the Committee of Sponsoring Organizations of the Treadway Commission. National Bankshares, Inc. and subsidiaries’ management is responsible for maintaining effective internal control over financial reporting and for its assessment of the effectiveness of internal control over financial reporting included in the accompanying Management’s Report on Internal Control over Financial Reporting. Our responsibility is to express an opinion on the Company's internal control over financial reporting based on our audit.
We conducted our audit in accordance with the standards of the Public Company Accounting Oversight Board (United States). Those standards require that we plan and perform the audit to obtain reasonable assurance about whether effective internal control over financial reporting was maintained in all material respects. Our audit included obtaining an understanding of internal control over financial reporting, assessing the risk that a material weakness exists, and testing and evaluating the design and operating effectiveness of internal control based on the assessed risk. Our audit also included performing such other procedures as we considered necessary in the circumstances. We believe that our audit provides a reasonable basis for our opinion.
A company's internal control over financial reporting is a process designed to provide reasonable assurance regarding the reliability of financial reporting and the preparation of financial statements for external purposes in accordance with generally accepted accounting principles. A company's internal control over financial reporting includes those policies and procedures that (a) pertain to the maintenance of records that, in reasonable detail, accurately and fairly reflect the transactions and dispositions of the assets of the company; (b) provide reasonable assurance that transactions are recorded as necessary to permit preparation of financial statements in accordance with generally accepted accounting principles, and that receipts and expenditures of the company are being made only in accordance with authorizations of management and directors of the company; and (c) provide reasonable assurance regarding prevention or timely detection of unauthorized acquisition, use, or disposition of the company's assets that could have a material effect on the financial statements.
Because of its inherent limitations, internal control over financial reporting may not prevent or detect misstatements. Also, projections of any evaluation of effectiveness to future periods are subject to the risk that controls may become inadequate because of changes in conditions, or that the degree of compliance with the policies or procedures may deteriorate.
65
In our opinion, National Bankshares, Inc. and subsidiaries maintained, in all material respects, effective internal control over financial reporting as of December 31, 2010, based on criteria established in Internal Control — Integrated Framework issued by the Committee of Sponsoring Organizations of the Treadway Commission.
We have also audited, in accordance with the standards of the Public Company Accounting Oversight Board (United States), the consolidated balance sheets as of December 31, 2010 and 2009, and the related consolidated statements of income, changes in stockholders’ equity and cash flows for each of the three years in the period ended December 31, 2010 of National Bankshares, Inc. and subsidiaries and our report dated March 9, 2011 expressed an unqualified opinion.
Winchester, Virginia
March 9, 2011
66
None
Disclosure Controls and Procedures
The Company’s management evaluated, with the participation of the Company’s principal executive officer and principal financial officer, the effectiveness of the Company’s disclosure controls and procedures (as defined in Rule 13a-15(e) under the Securities Exchange Act of 1934, as amended (the “Exchange Act”)) as of the end of the period covered by this report. Based on that evaluation, the Company’s principal executive officer and principal financial officer concluded that the Company’s disclosure controls and procedures are effective as of December 31, 2010 to ensure that information required to be disclosed in the reports that the Company files or submits under the Exchange Act is recorded, processed, summarized and reported, within the time periods specified by the Company’s management, including the Company’s principal executive officer and principal financial officer, as appropriate, to allow timely decisions regarding required disclosure.
There were no changes in the Company’s internal control over financial reporting (as defined in Rule 13a-15(f) of the Exchange Act) during the year ended December 31, 2010 that have materially affected, or are reasonably likely to materially affect, the Corporation’s internal control over financial reporting.
Because of the inherent limitations in all control systems, the Company believes that no system of controls, no matter how well designed and operated, can provide absolute assurance that all control issues have been detected.
Internal Control Over Financial Reporting
Management’s Report on Internal Control Over Financial Reporting
To the Stockholders of National Bankshares, Inc.:
Management is responsible for the preparation and fair presentation of the financial statements included in this annual report. The financial statements have been prepared in conformity with accounting principles generally accepted in the United States of America and reflect management’s judgments and estimates concerning effects of events and transactions that are accounted for or disclosed.
Management is also responsible for establishing and maintaining adequate internal control over financial reporting. The Company’s internal control over financial reporting includes those policies and procedures that pertain to the Company’s ability to record, process, summarize and report reliable financial data. Management recognizes that there are inherent limitations in the effectiveness of any internal control over financial reporting, including the possibility of human error and the circumvention or overriding of internal control. Accordingly, even effective internal control over financial reporting can provide only reasonable assurance with respect to financial statement preparation. Further, because of changes in conditions, the effectiveness of internal control over financial reporting may vary over time.
In order to ensure that the Company’s internal control over financial reporting is effective, management regularly assesses such controls and did so most recently for its financial reporting as of December 31, 2010. This assessment was based on criteria for effective internal control over financial reporting described in Internal Control Integrated Framework issued by the Committee of Sponsoring Organizations (COSO) of the Treadway Commission. Based on this assessment, management believes the Company maintained effective internal control over financial reporting as of December 31, 2010.
The Board of Directors, acting through its Audit Committee, is responsible for the oversight of the Company’s accounting policies, financial reporting and internal control. The Audit Committee of the Board of Directors is comprised entirely of outside directors who are independent of management. The Audit Committee is responsible for the appointment and compensation of the independent registered public accounting firm and approves decisions regarding the appointment or removal of the Company Auditor. It meets periodically with management, the independent registered public accounting firm and the internal auditors to ensure that they are carrying out their responsibilities. The Audit Committee is also responsible for performing an oversight role by reviewing and monitoring the financial, accounting and auditing procedures of the Company in addition to reviewing the Company’s financial reports. The independent registered public accounting firm and the internal auditors have full and unlimited access to the Audit Committee, with or without management, to discuss the adequacy of internal control over financial reporting, and any other matter which they believe should be brought to the attention of the Audit Committee. The Company’s independent registered public accounting firm has also issued an attestation report on the effectiveness of internal control over financial reporting.
|
/s/ JAMES G. RAKES
|
/s/ DAVID K. SKEENS
|
|
|
Chairman, President and
Chief Executive Officer
|
Treasurer and
Chief Financial Officer
|
67
Subsequent Events
From December 31, 2010, the balance sheet date of this Form 10-K, through the date of filing of the Form 10-K with the Securities and Exchange Commission, there have been no material subsequent events that 1) provide additional evidence about conditions that existed on the date of the balance sheet, or 2) provides evidence about conditions that did not exist at the date of the balance sheet, but arose after the balance sheet date.
Information with respect to the directors of Bankshares is set out under the caption “Election of Directors” on pages 2 through 4 of Bankshares’ Proxy Statement dated March 11, 2011 which information is incorporated herein by reference.
The Board of Directors of Bankshares has a standing audit committee made up entirely of independent directors, as that term is defined in the NASDAQ Stock Market Listing Rules. In 2010, Dr. J. M. Lewis chaired the Audit Committee and its members were Mr. L. J. Ball, Mr. J. W. Bowling and Mr. J. H. Harry. Each member of the Audit Committee has extensive business experience; however, the Committee has identified Dr. Lewis as its financial expert, since he has a professional background which involves financial oversight responsibilities. Dr. Lewis currently oversees the preparation of financial statements in his role as President of New River Community College. He previously served as the College’s Chief Financial Officer. The Audit Committee’s Charter is available on the Company’s web site at www.nationalbankshares.com.
The Company and each of its subsidiaries have adopted Codes of Ethics for directors, officers and employees, specifically including the Chief Executive Officer and Chief Financial Officer of Bankshares. These Codes of Ethics are available on the Company’s web site at www.nationalbankshares.com.
The following is a list of names and ages of all executive officers of Bankshares; their terms of office as officers; the positions and offices within Bankshares held by each officer; and each person’s principal occupation or employment during the past five years.
|
Name
|
Age
|
Offices and Positions Held
|
Year Elected an Officer/Director
|
|
James G. Rakes
|
66
|
Chairman, President and Chief Executive Officer, National Bankshares, Inc.; President and Chief Executive Officer of National Bank of Blacksburg since 1983 and Chairman since 2005. Chairman, President and Treasurer of National Bankshares Financial Services, Inc. since 2001.
|
1986
|
|
David K. Skeens
|
44
|
Treasurer and Chief Financial Officer of National Bankshares, Inc. since January 14, 2009; Senior Vice President/Operations & Risk Management & CFO of National Bank of Blacksburg since 2009; prior thereto Senior Vice President/Operations & Risk Management since 2008; prior thereto Vice President/Operations & Risk Management since 2004.
|
2009
|
|
F. Brad Denardo
|
58
|
Executive Vice President, National Bankshares, Inc. since 2008; Interim Treasurer and Chief Financial Officer from May 23, 2008 to January 14, 2009; prior thereto Corporate Officer since 1989; Executive Vice President/Chief Operating Officer of National Bank of Blacksburg since 2002.
|
1989
|
|
Marilyn B. Buhyoff
|
62
|
Secretary & Counsel, National Bankshares, Inc.; Counsel of National Bank of Blacksburg since 1989; Secretary of National Bankshares Financial Services, Inc. since 2001, and Executive Vice President since 2004.
|
1989
|
The information set forth under “Executive Compensation” on pages 11 through 17 of NBI’s Proxy Statement dated March 11, 2011 is incorporated herein by reference.
68
Item 12. Security Ownership of Certain Beneficial Owners and Management and Related Stockholder Matters
The information contained under “Stock Ownership of Directors and Executive Officers” on page 2 of NBI’s Proxy Statement dated March 11, 2011 for the Annual Meeting of Stockholders to be held April 12, 2011 is incorporated herein by reference.
The following table summarizes information concerning National Bankshares equity compensation plans at December 31, 2010:
|
Plan Category
|
Number of Shares to be
Issued upon Exercise of
Outstanding Options
and Warrants
|
Weighted Average Exercise
Price of Outstanding
Options and Warrants
|
Number of Shares Remaining
Available for Future Issuance
Under Equity Compensation
Plans (Excluding Shares
Reflected in First Column)
|
|||
|
Equity compensation plans approved by stockholders 1999 Stock Option Plan
|
109,500
|
$
|
22.14
|
109,500
|
||
|
Equity compensation plans not approved by stockholders
|
---
|
---
|
---
|
|||
|
Total
|
109,500
|
$
|
22.14
|
109,500
|
||
The information contained under “Director Independence and Certain Transactions With Officers and Directors” on pages 6 and 7 of NBI’s Proxy Statement dated March 11, 2011 is incorporated herein by reference.
The following fees were paid to Yount, Hyde & Barbour, P.C., Certified Public Accountants, for services provided to NBI for the years ended December 31, 2010 and 2009. The Audit Committee determined that the provision of non-audit services by Yount, Hyde & Barbour P.C. did not compromise the firm’s ability to maintain its independence.
Principal Accounting Fees and Services
|
2010
|
2009
|
|||||||||
|
Fees
|
Percentage
|
Fees
|
Percentage
|
|||||||
|
Audit fees
|
$
|
105,500
|
79
|
%
|
$
|
102,500
|
78
|
%
|
||
|
Audit-related fees
|
21,650
|
16
|
%
|
21,300
|
16
|
%
|
||||
|
Tax fees
|
7,200
|
5
|
%
|
8,492
|
6
|
%
|
||||
|
$
|
134,350
|
100
|
%
|
$
|
132,292
|
100
|
%
|
|||
Audit fees: Audit and review services and review of documents filed with the SEC.
Audit-related fees: Employee benefit plan audits and consultation concerning financial accounting and reporting standards.
Tax fees: Preparation of federal and state tax returns, review of quarterly estimated tax payments and consultation concerning tax compliance issues.
The Audit Committee of the Board of Directors meets in advance and specifically approves of the provision of all services of Yount, Hyde & Barbour, P.C.
69
(a) (1) Financial Statements
The following consolidated financial statements of National Bankshares, Inc. are included in Item 8:
|
|
Reports of Independent Registered Public Accounting Firm
|
|
|
Consolidated Balance Sheets – As of December 31, 2010 and 2009
|
|
|
Consolidated Statements of Income – Years ended December 31, 2010, 2009 and 2008
|
|
|
Consolidated Statements of Changes in Stockholders’ Equity – Years ended December 31, 2010, 2009 and 2008
|
|
|
Consolidated Statements of Cash Flows – Years ended December 31, 2010, 2009 and 2008
|
|
|
Notes to Consolidated Financial Statements
|
|
|
(a) (2) Financial Statement Schedules
|
Certain schedules to the consolidated financial statements have been omitted if they were not required by Article 9 of Regulation S-X or if, under the related instructions, they were inapplicable, or if the information is contained elsewhere in this Annual Report on Form
10-K.
(a) (3) Exhibits
A list of the exhibits filed or incorporated in this Annual Report by reference is as follows:
|
Exhibit No.
|
Description
|
Page No. in
Sequential System
|
|
3(i)
|
Amended and Restated Articles of Incorporation of National Bankshares, Inc.
|
(incorporated herein by reference to Exhibit 3.1 of the Form 8K for filed on March 16, 2006)
|
|
3(ii)
|
Amended By-laws of National Bankshares, Inc.
|
(incorporated herein by reference to Exhibit 3(ii) of the Annual Report on Form 10K for fiscal year ended December 31, 2007)
|
|
4(i)
|
Specimen copy of certificate for National Bankshares, Inc. common stock
|
(incorporated herein by reference to Exhibit 4(a) of the Annual Report on Form 10K for fiscal year ended December 31, 1993)
|
|
*10(iii)(A)
|
National Bankshares, Inc. 1999 Stock Option Plan
|
(incorporated herein by reference to Exhibit 4.3 of the Form S-8, filed as Registration No. 333-79979 with the Commission on June 4, 1999)
|
|
*10(iii)(A)
|
Executive Employment Agreement dated December 17, 2008, between National Bankshares, Inc. and James G. Rakes
|
(incorporated herein by reference to Exhibit 10(iii)(A) of the Annual Report on Form 10K for fiscal year ended December 31, 2008)
|
|
*10(iii)(A)
|
Employee Lease Agreement dated August 14, 2002, between National Bankshares, Inc. and The National Bank of Blacksburg
|
(incorporated herein by reference to Exhibit 10 (iii) (A) of Form 10Q for the period ended September 30, 2002)
|
|
*10(iii)(A)
|
Executive Employment Agreement dated December 17, 2008, between National Bankshares, Inc. and F. Brad Denardo
|
(incorporated herein by reference to Exhibit 10(iii)(A) of the Annual Report on Form 10K for fiscal year ended December 31, 2008)
|
|
*10(iii)(A)
|
Executive Employment Agreement dated December 17, 2008, between National Bankshares, Inc. and Marilyn B. Buhyoff
|
(incorporated herein by reference to Exhibit 10(iii)(A) of the Annual Report on Form 10K for fiscal year ended December 31, 2008)
|
|
*10(iii)(A)
|
Salary Continuation Agreement dated February 8, 2006, between The National Bank of Blacksburg and James G. Rakes
|
(incorporated herein by reference to Exhibit 10(iii)(A) of the Form 8K filed on February 8, 2006)
|
|
*10(iii)(A)
|
Salary Continuation Agreement dated February 8, 2006, between The National Bank of Blacksburg and F. Brad Denardo
|
(incorporated herein by reference to Exhibit 10(iii)(A) of the Form 8K filed on February 8, 2006)
|
|
*10(iii)(A)
|
Salary Continuation Agreement dated February 8, 2006, between
National Bankshares, Inc. and Marilyn B. Buhyoff
|
(incorporated herein by reference to Exhibit 10(iii)(A) of the Form 8K filed on February 8, 2006)
|
|
*10(iii)(A)
|
First Amendment, dated December 19, 2007, to The National Bank of Blacksburg Salary Continuation Agreement for James G. Rakes
|
(incorporated herein by reference to Exhibit 10(iii)(A) of the Form 8K filed on December 19, 2007)
|
|
*10(iii)(A)
|
First Amendment, dated December 19, 2007, to The National Bank of Blacksburg Salary Continuation Agreement for F. Brad Denardo
|
(incorporated herein by reference to Exhibit 10(iii)(A) of the Form 8K filed on December 19, 2007)
|
70
|
*10(iii)(A)
|
First Amendment, dated December 19, 2007, to National Bankshares, Inc. Salary Continuation Agreement for Marilyn B. Buhyoff
|
(incorporated herein by reference to Exhibit 10(iii)(A) of the Form 8K filed on December 19, 2007)
|
|
*10(viii)(A)
|
Second Amendment, dated June 12, 2008, to The National Bank of Blacksburg Salary Continuation Agreement for F. Brad Denardo
|
(incorporated herein by reference to Exhibit 10(iii)(A) of the Form 8K filed on June 12, 2008)
|
|
*10(viii)(A)
|
Second Amendment, dated December 17, 2008, to The National Bank of Blacksburg Salary Continuation Agreement for James G. Rakes
|
(incorporated herein by reference to Exhibit 10(viii)(A) of the Annual Report on Form 10K for fiscal year ended December 31, 2008)
|
|
*10(viii)(A)
|
Second Amendment, dated December 17, 2008, to The National Bank of Blacksburg Salary Continuation Agreement for Marilyn B. Buhyoff
|
(incorporated herein by reference to Exhibit 10(viii)(A) of the Annual Report on Form 10K for fiscal year ended December 31, 2008)
|
|
*10(viii)(A)
|
Third Amendment, dated December 17, 2008, to The National Bank of Blacksburg Salary Continuation Agreement for F. Brad Denardo
|
(incorporated herein by reference to Exhibit 10(viii)(A) of the Annual Report on Form 10K for fiscal year ended December 31, 2008)
|
|
+23
|
Consent of Yount, Hyde & Barbour, P.C. to incorporation by reference of independent auditor’s report included in this Form 10-K, into registrant’s registration statement on Form S-8
|
Page 64
|
|
+31(i)
|
Section 906 Certification of Chief Executive Officer
|
Page 72
|
|
+31(ii)
|
Section 906 Certification of Chief Financial Officer
|
Page 73
|
|
+32(i)
|
18 U.S.C. Section 1350 Certification of Chief Executive Officer
|
Page 75
|
|
+32(ii)
|
18 U.S.C. Section 1350 Certification of Chief Financial Officer
|
Page 75
|
*Indicates a management contract or compensatory plan required to be filed herein.
+Filed with this Annual Report on Form 10-K.
Pursuant to the requirements of Section 13 or 15(d) of the Securities Exchange Act of 1934, National Bankshares, Inc. has duly caused this report to be signed on its behalf by the undersigned, thereunto duly authorized.
NATIONAL BANKSHARES, INC.
|
/s/ JAMES G. RAKES
|
|
James G. Rakes
Chairman, President and Chief Executive Officer
(Principal Executive Officer)
|
|
/s/ DAVID K. SKEENS
|
|
David K. Skeens
Treasurer
(Principal Financial Officer)
(Principal Accounting Officer)
|
|
Date: March 11, 2011
|
71
Exhibit No. 31(i)
CERTIFICATIONS UNDER SECTION 906 OF THE SARBANES OXLEY ACT OF 2002
I, James G. Rakes, Chairman, President and Chief Executive Officer of National Bankshares, Inc., certify that:
|
1.
|
I have reviewed this annual report on Form 10-K of National Bankshares, Inc.;
|
|
2.
|
Based on my knowledge, this report does not contain any untrue statement of a material fact or omit to state a material fact necessary to make the statements made, in light of the circumstances under which such statements were made, not misleading with respect to the period covered by this report;
|
|
3.
|
Based on my knowledge, the financial statements, and other financial information included in this report, fairly present in all material respects the financial condition, results of operations and cash flows of the registrant as of, and for, the periods presented in this report;
|
|
4.
|
The registrant’s other certifying officer(s) and I are responsible for establishing and maintaining disclosure controls and procedures (as defined in Exchange Act Rules 13a – 15 (e) and 15d – 15 (e)) and internal control over financial reporting (as defined in Exchange Act Rules 13a – 15(f) and 15d – 15(f)) for the registrant and have:
|
|
|
(a)
|
Designed such disclosure controls and procedures, or caused such disclosure controls and procedures to be designed under our supervision, to ensure that material information relating to the registrant, including its consolidated subsidiaries, is made known to us by others within those entities, particularly during the period in which this report is being prepared; and
|
|
|
(b)
|
Designed such internal control over financial reporting, or caused such internal control over financial reporting to be designed under our supervision, to provide reasonable assurance regarding the reliability of financial reporting and the preparation of financial statements for external purposes in accordance with generally accepted accounting principles; and
|
|
|
(c)
|
Evaluated the effectiveness of the registrant’s disclosure controls and procedures and presented in this report our conclusions about the effectiveness of the disclosure controls and procedures, as of the end of the period covered by this report based on such evaluations; and
|
|
|
(d)
|
Disclosed in this report any change in the registrant’s internal control over financial reporting that occurred during the registrant’s most recent fiscal quarter (the registrant’s fourth fiscal quarter in the case of an annual report) that has materially affected, or is reasonably likely to materially affect, the registrant’s internal control over financial reporting.
|
|
5.
|
The registrant’s other certifying officer(s) and I have disclosed, based on our most recent evaluation of internal control over financial reporting, to the registrant’s auditors and the audit committee of the registrant’s board of directors (or persons performing the equivalent functions):
|
|
|
(a)
|
All significant deficiencies and material weaknesses in the design or operation of internal control over financial reporting which are reasonably likely to adversely affect the registrant’s ability to record, process, summarize and report financial information; and
|
|
|
(b)
|
Any fraud, whether or not material, that involves management or other employees who have a significant role in the registrant’s internal control over financial reporting.
|
Date: March 11, 2011
|
/s/ JAMES G. RAKES
|
|
James G. Rakes
Chairman, President and Chief Executive Officer
(Principal Executive Officer)
|
72
Exhibit 31(ii)
I, David K. Skeens, Treasurer (Chief Financial Officer) of National Bankshares, Inc., certify that:
|
1.
|
I have reviewed this annual report on Form 10-K of National Bankshares, Inc.;
|
|
2.
|
Based on my knowledge, this report does not contain any untrue statement of a material fact or omit to state a material fact necessary to make the statements made, in light of the circumstances under which such statements were made, not misleading with respect to the period covered by this report;
|
|
3.
|
Based on my knowledge, the financial statements, and other financial information included in this report, fairly present in all material respects the financial condition, results of operations and cash flows of the registrant as of, and for, the periods presented in this report;
|
|
4.
|
The registrant’s other certifying officer(s) and I are responsible for establishing and maintaining disclosure controls and procedures (as defined in Exchange Act Rules 13a – 15 (e) and 15d – 15 (e)) and internal control over financial reporting (as defined in Exchange Act Rules 13a – 15(f) and 15d – 15(f)) for the registrant and have:
|
|
|
(a)
|
Designed such disclosure controls and procedures, or caused such disclosure controls and procedures to be designed under our supervision, to ensure that material information relating to the registrant, including its consolidated subsidiaries, is made known to us by others within those entities, particularly during the period in which this report is being prepared; and
|
|
|
(b)
|
Designed such internal control over financial reporting, or caused such internal control over financial reporting to be designed under our supervision, to provide reasonable assurance regarding the reliability of financial reporting and the preparation of financial statements for external purpose in accordance with generally accepted accounting principles; and
|
|
|
(c)
|
Evaluated the effectiveness of the registrant’s disclosure controls and procedures and presented in this report our conclusions about the effectiveness of the disclosure controls and procedures, as of the end of the period covered by this report based on such evaluations; and
|
|
|
(d)
|
Disclosed in this report any change in the registrant’s internal control over financial reporting that occurred during the registrant’s most recent fiscal quarter (the registrant’s fourth fiscal quarter in the case of an annual report) that has materially affected, or is reasonably likely to materially affect, the registrant’s internal control over financial reporting.
|
|
5.
|
The registrant’s other certifying officer(s) and I have disclosed, based on our most recent evaluation of internal control over financial reporting, to the registrant’s auditors and the audit committee of the registrant’s board of directors (or persons performing the equivalent functions):
|
|
(a)
|
All significant deficiencies and material weaknesses in the design or operation of internal control over financial reporting which are reasonably likely to adversely affect the registrant’s ability to record, process, summarize and report financial information; and
|
|
(b)
|
Any fraud, whether or not material, that involves management or other employees who have a significant role in the registrant’s internal control over financial reporting.
|
Date: March 11, 2011
|
/s/ DAVID K. SKEENS
|
|
David K. Skeens
Treasurer and
Chief Financial Officer
(Principal Financial Officer)
|
73
Pursuant to the requirements of the Securities Exchange Act of 1934, this report has been signed by the following persons on behalf of the Registrant and in the capacities and on the date indicated.
|
Date
|
Title
|
|
|
/s/ L. J. BALL
|
03/11/2011
|
Director
|
|
L. J. Ball
|
||
|
/s/ J. W. BOWLING
|
03/11/2011
|
Director
|
|
J. W. Bowling
|
||
|
/s/ J. H. HARRY
|
03/11/2011
|
Director
|
|
J. H. Harry
|
||
|
/s/ J. M. LEWIS
|
03/11/2011
|
Director
|
|
J. M. Lewis
|
||
|
/s/ M. G. MILLER
|
03/11/2011
|
Director
|
|
M. G. Miller
|
||
|
/s/ W. A. PEERY
|
03/11/2011
|
Director
|
|
W. A. Peery
|
||
|
/s/ J. G. RAKES
|
03/11/2011
|
Chairman of the Board
|
|
J. G. Rakes
|
President and Chief Executive Officer –
National Bankshares, Inc.
Director
|
|
|
/s/ G. P. REYNOLDS
|
03/11/2011
|
Director
|
|
G. P. Reynolds
|
||
|
/s/ J. M. SHULER
|
03/11/2011
|
Director
|
|
J. M. Shuler
|
||
74
Exhibit 32(i)
CERTIFICATION OF CHIEF EXECUTIVE OFFICER
PURSUANT TO U.S.C. SECTION 1350
In connection with the Form 10-K of National Bankshares, Inc. for the year ended December 31, 2010, I, James G. Rakes, Chairman, President and Chief Executive Officer of National Bankshares, Inc., hereby certify pursuant to 18 U.S.C. Section 1350, as adopted pursuant to section 906 of the Sarbanes-Oxley Act of 2002, to the best of my knowledge and belief that:
|
|
(1)
|
such Form 10-K for the year ended December 31, 2010, fully complies with the requirements of section 13(a) or 15(d) of the Securities Act of 1934; and
|
|
|
(2)
|
the information contained in such Form 10-K for the year ended December 31, 2010, fairly presents in all material respects, the financial condition and results of operations of National Bankshares, Inc.
|
|
/s/ JAMES G. RAKES
|
|
James G. Rakes
Chairman, President and Chief Executive Officer
(Principal Executive Officer)
|
Exhibit 32(ii)
CERTIFICATION OF CHIEF FINANCIAL OFFICER
PURSUANT TO U.S.C. SECTION 1350
In connection with the Form 10-K of National Bankshares, Inc. for the year ended December 31, 2010, I, David K. Skeens, Treasurer of National Bankshares, Inc., hereby certify pursuant to 18 U. S. C. Section 1350, as adopted pursuant to section 906 of the Sarbanes-Oxley Act of 2002, to the best of my knowledge and belief that:
|
|
(1) such Form 10-K for the year ended December 31, 2010, fully complies with the requirements of section 13(a) or 15(d) of the Securities Act of 1934; and
|
|
|
(2) the information contained in such Form 10-K for the year ended December 31, 2010, fairly presents in all material respects, the financial condition and results of operations of National Bankshares, Inc.
|
|
/s/ DAVID K. SKEENS
|
|
David K. Skeens
Treasurer and
Chief Financial Officer
(Principal Financial Officer)
|
75
The following exhibits are filed with this Annual Report on Form 10-K.
|
Exhibit No.
|
Title
|
Page Number
|
|
23
|
Consent of Yount, Hyde & Barbour, P.C. to incorporation by reference of independent auditor’s report included in this Form 10-K, into registrant’s registration statement on Form S-8.
|
Page 64
|
|
31(i)
|
Section 906 Certification of Chief Executive Officer
|
Page 72
|
|
31(ii)
|
Section 906 Certification of Chief Financial Officer
|
Page 73
|
|
32(i)
|
18 U.S.C. Section 1350 Certification of Chief Executive Officer
|
Page 75
|
|
32(ii)
|
18 U.S.C. Section 1350 Certification of Chief Financial Officer
|
Page 75
|
76