Attached files
Table of Contents
UNITED STATES
SECURITIES AND EXCHANGE COMMISSION
Washington, D.C. 20549
Form 10-K
(Mark One)
| þ | ANNUAL REPORT PURSUANT TO SECTION 13 OR 15(d) OF THE SECURITIES EXCHANGE ACT OF 1934 |
For the fiscal year ended December 31, 2010
OR
| ¨ | TRANSITION REPORT PURSUANT TO SECTION 13 OR 15(d) OF THE SECURITIES EXCHANGE ACT OF 1934. |
For the transition period from to
Commission file number 001-33508
Limelight Networks, Inc.
(Exact name of registrant as specified in its charter)
| Delaware | 20-1677033 | |
| (State or other jurisdiction of incorporation or organization) |
(I.R.S. Employer Identification No.) |
2220 W. 14th Street
Tempe, AZ 85281
(Address of principal executive offices, including Zip Code)
(602) 850-5000
(Registrant’s telephone number, including area code)
Securities registered pursuant to Section 12(b) of the Act:
| Title of each class |
Name of each exchange on which registered | |
| Common Stock, $0.001 par value | NASDAQ Global Select Market |
Securities registered pursuant to Section 12(g) of the Act: None
Indicate by check mark if the registrant is a well-known seasoned issuer, as defined in Rule 405 of the Securities Act. Yes ¨ No þ
Indicate by check mark if the registrant is not required to file reports pursuant to Section 13 or 15(d) of the Securities Exchange Act of 1934. Yes ¨ No þ
Indicate by check mark whether the registrant (1) has filed all reports required to be filed by Section 13 or 15(d) of the Securities Exchange Act of 1934 during the preceding 12 months (or for such shorter period that the registrant was required to file such reports), and (2) has been subject to such filing requirements for the past 90 days. Yes þ No ¨
Indicate by check mark whether the registrant has submitted electronically and posted on its corporate Web site, if any, every Interactive Data File required to be submitted and posted pursuant to Rule 405 of Regulation S-T (§232.405 of this chapter) during the preceding 12 months (or for such shorter period that the registrant was required to submit and post such files). Yes ¨ No ¨
Indicate by check mark if disclosure of delinquent filers pursuant to Item 405 of Regulation S-K is not contained herein, and will not be contained, to the best of the registrant’s knowledge, in definitive proxy or information statements incorporated by reference in Part III of this Form 10-K or any amendment to this Form 10-K. ¨
Indicate by check mark whether the registrant is a large accelerated filer, an accelerated filer, a non-accelerated filer, or a smaller reporting company. See the definitions of “large accelerated filer,” “accelerated filer” and “smaller reporting company” in Rule 12b-2 of the Exchange Act. (Check one):
| Large accelerated filer ¨ | Accelerated filer þ | Non-accelerated filer ¨ | Smaller Reporting Company ¨ | |||
| (Do not check if a smaller reporting company) | ||||||
Indicate by check mark whether the registrant is a shell company (as defined in Exchange Act Rule 12b-2). Yes ¨ No þ
The aggregate market value of the voting and non-voting common stock held by non-affiliates of the registrant was approximately $218.7 million based on the last reported sale price of the common stock on the Nasdaq Global Select Market on June 30, 2010.
The number of shares outstanding of the registrant’s Common Stock, par value $0.001 per share, as of March 9, 2011: 111,737,258 shares.
DOCUMENTS INCORPORATED BY REFERENCE
Portions of the Proxy Statement for the Registrant’s 2011 Annual Meeting of Stockholders are incorporated by reference in Part III of this Form 10-K.
Table of Contents
LIMELIGHT NETWORKS, INC.
ANNUAL REPORT ON FORM 10-K
For the Fiscal Year Ended December 31, 2010
| Page | ||||||
| PART I |
||||||
| Item 1. |
1 | |||||
| Item 1A. |
10 | |||||
| Item 1B. |
31 | |||||
| Item 2. |
31 | |||||
| Item 3. |
31 | |||||
| Item 4. |
33 | |||||
| PART II |
||||||
| Item 5. |
34 | |||||
| Item 6. |
36 | |||||
| Item 7. |
Management’s Discussion and Analysis of Financial Condition and Results of Operations |
39 | ||||
| Item 7A. |
71 | |||||
| Item 8. |
72 | |||||
| Item 9. |
Changes in and Disagreements with Accountants on Accounting and Financial Disclosure |
117 | ||||
| Item 9A. |
117 | |||||
| Item 9B. |
120 | |||||
| PART III |
||||||
| Item 10. |
120 | |||||
| Item 11. |
120 | |||||
| Item 12. |
Security Ownership of Certain Beneficial Owners and Management and Related Stockholder Matters |
120 | ||||
| Item 13. |
Certain Relationships, Related Transactions, and Director Independence |
121 | ||||
| Item 14. |
121 | |||||
| PART IV |
||||||
| Item 15. |
122 | |||||
| 123 | ||||||
| EX-21.1 |
||||||
| EX-23.1 |
||||||
| EX-31.1 |
||||||
| EX-31.2 |
||||||
| EX-32.1 |
||||||
| EX-32.2 |
||||||
Table of Contents
SPECIAL NOTE REGARDING FORWARD-LOOKING STATEMENTS
This annual report on Form 10-K contains “forward-looking statements” within the meaning of the Private Securities Litigation Reform Act of 1995. Forward-looking statements include statements as to industry trends and future expectations of ours and other matters that do not relate strictly to historical facts. These statements are often identified by the use of words such as “may,” “will,” “expect,” “believe,” “anticipate,” “intend,” “could,” “estimate,” or “continue,” and similar expressions or variations. These statements are based on the beliefs and assumptions of our management based on information currently available to management. Such forward-looking statements are subject to risks, uncertainties and other factors that could cause actual results and the timing of certain events to differ materially from future results expressed or implied by such forward-looking statements. Factors that could cause or contribute to such differences include, but are not limited to, those identified below, and those discussed in the section titled “Risk Factors” set forth in Part I, Item 1A of this annual report on Form 10-K. We undertake no obligation to update any forward-looking statements to reflect events or circumstances after the date of such statements.
PART I
| Item 1. | Business |
Overview
Limelight Networks, Inc., or Limelight, is a provider of high-performance content delivery network services. Limelight provides scalable software services that improve the quality of online media, accelerate the performance of web applications, enable secure online transactions, manage and monetize digital assets, and optimize advertising campaigns. These services are supported by Limelight’s global platform, which provides highly-available, highly-redundant storage, bandwidth, and computing resources as well as connectivity to last-mile broadband network providers. Limelight provides services to traditional and emerging media companies, or content publishers, including businesses operating in the television, music, radio, newspaper, magazine, movie, videogame, software and social media industries as well as enterprises, technology companies, and government entities doing business online. Limelight derives revenue from the sale of services to customers executing contracts with terms of one year or longer. These contracts generally commit the customer to a minimum monthly level of usage with additional charges applicable for actual usage above the monthly minimum. We believe that having a consistent and predictable base level of revenue is important to our financial success. Accordingly, to be successful, we must maintain the majority of our base of recurring revenue contracts and build on that base by adding new customers and increasing the number of services and amount of capacity our existing customers purchase. At the same time, we must ensure that our expenses do not increase faster than, or at the same rate as, our revenues. Accomplishing these goals requires that we compete effectively in the marketplace on the basis of scale, service quality, platform capability, and price.
We were formed as an Arizona limited liability company, Limelight Networks, LLC, in June 2001 and converted into a Delaware corporation, Limelight Networks, Inc., in August 2003. Our principal executive offices are located at 2220 W. 14th Street, Tempe, Arizona 85281 and 201 Lomas Santa Fe Drive, Solana Beach, California 92075, and our main telephone number is (602) 850-5000. Our website address is www.limelightnetworks.com. We began development of our infrastructure in 2001 and began generating meaningful revenue in 2002. As of December 31, 2010, we had approximately 1,824 active customers and had a presence in approximately 60 countries throughout the world.
On March 2, 2011 we completed an underwritten public offering of our common stock in which we sold and issued 11,500,000 shares of our common stock, including 1,500,000 shares subject to the underwriters’ over-allotment option, at a price to the public of $7.10 per share. The newly issued common shares began trading on the Nasdaq Global Select Market on March 2, 2011. We raised a total of approximately $81.7 million in gross proceeds from the offering, or approximately $77.3 million in net proceeds after deducting underwriting discounts and commissions of approximately $3.9 million and other offering costs of approximately $0.5 million.
1
Table of Contents
The offering was made pursuant to the effective registration statement on Form S-3 (Registration Statement No. 333-170609) previously filed with and declared effective by the Securities and Exchange Commission on November 26, 2010 and the prospectus supplement thereunder filed with the Securities and Exchange Commission on February 28, 2011.
During 2010, we completed three acquisitions that are all complementary to our core CDN business and have accelerated the growth of our cloud based services revenue.
In January 2010, we acquired chors GmbH, or chors, an on-line and direct marketing solution provider located in Germany. The purchase price of approximately $5.9 million consisted of approximately $2.8 million of cash and 860,000 shares of our common stock with an estimated fair value of approximately $3.1 million at the time of the acquisition.
On April 30, 2010, we completed the acquisition of EyeWonder, Inc., or EyeWonder, a provider of interactive digital advertising products and services to advertisers, advertising agencies and publishers. The purchase price of approximately $114.0 million consisted of approximately $62.8 million of cash and 12,740,000 shares of our common stock with an estimated fair value of approximately $51.2 million at the time of the acquisition. EyeWonder was founded in 1999 and is headquartered in Atlanta, Georgia, with offices in New York, Chicago, San Francisco, Dallas, Los Angeles, the United Kingdom, Ireland, the Netherlands, France, Germany, Spain and Australia.
On July 30, 2010 we acquired Delve Networks, Inc., or Delve, a privately-held provider of cloud-based video publishing and analytics services located in Seattle, Washington. The purchase price of approximately $4.1 million consisted of approximately $2.8 million of cash and 313,663 shares of our common stock with an estimated fair value of approximately $1.3 million at the time of the acquisition.
During the year, the company also introduced new service offerings, including website acceleration services designed to improve web experiences by providing consistent performance from any geography for dynamic and personalized content, online commerce transactions, and web applications, and a dynamic creative optimization service that helps advertisers maximize the impact of every impression by dynamically analyzing then optimizing the performance of the creative elements that make up a display advertisement.
We are registered as a reporting company under the Securities Exchange Act of 1934, as amended, which we refer to as the Exchange Act. Accordingly, we file or furnish with the Securities and Exchange Commission, or the Commission, annual reports on Form 10-K, quarterly reports on Form 10-Q, current reports on Form 8-K and all amendments to such reports as required by the Exchange Act and the rules and regulations of the Commission. We refer to these reports as Periodic Reports. The public may read and copy any Periodic Reports or other materials we file with the Commission at the Commission’s Public Reference Room at 100 F. Street, NE, Washington, DC 20549. Information on the operation of the Public Reference Room is available by calling 1-800-SEC-0330. In addition, the Commission maintains an Internet website that contains reports, proxy and information statements and other information regarding issuers, such as Limelight Networks, Inc., that file electronically with the Commission. The address of this website is http://www.sec.gov.
Our Internet website address is www.limelightnetworks.com. We make available, free of charge, on or through our Internet website our Periodic Reports and amendments to those Periodic Reports as soon as reasonably practicable after we electronically file them with the Commission. We are not, however, including the information contained on our website, or information that may be accessed through links on our website, as part of, or incorporating it by reference into, this annual report on Form 10-K.
2
Table of Contents
Three Trends Driving Internet Traffic Growth
Three important trends continue to drive a substantial need to rapidly and efficiently deliver web applications, e-commerce transactions, rich media advertising, and broadcast-quality rich media content over the Internet to a wide variety of on-line mobile and connected devices. These trends are:
| • | The shift of content and advertising to the Internet. Publishers are making available video, music, software, and other forms of media accessible over the Internet. Accordingly, advertisers are increasingly shifting their budgets online to target these audiences. |
| • | The rapid consumer adoption of connected devices, particularly smartphones and other media-capable mobile devices. Consumers are increasingly consuming content, using web applications, and making purchases from “smartphones,” or mobile devices with large displays, fast processors, and Internet connectivity. |
| • | The migration of IT services into the cloud. Enterprises are looking to decrease infrastructure expenditures by moving to a “cloud-based” model where application delivery and storage are available on-demand and paid for on an as-needed basis. |
Requirements for Delivering Applications, Media, and Advertising over the Internet
We believe that the challenges of delivering content, applications, and advertising over the Internet to a wide variety of mobile and connected devices have created a new set of technical, management and economic requirements for organizations seeking to do business online. Our solutions help content publishers, enterprises and government entities achieve the following:
| • | Consistent high quality experience from any geography. Consumers expect a high quality experience, will not tolerate interruptions or inconsistency in the delivery of content, and may never return to a particular media provider if that provider is unable to meet their expectations. A media stream, for example, should begin immediately and play continuously without interruption every time a customer accesses that stream. |
| • | High availability of expansive libraries of content. Consumers increasingly expect the ability to consume any form of media content online. To meet this expectation, traditional media companies are making their enormous libraries of content, such as television shows or movies, available to be viewed online. Users expect a consistent media experience across every title in these large libraries, for each title regardless of its popularity, each time it is viewed. |
| • | Ability to scale capacity to handle rapidly accelerating demand. Online businesses must scale delivery of their web presence smoothly as the quantity of their site visitors or audience increases. When a large number of users simultaneously access a particular website, the operator must be able to meet that surge in demand without making users wait. Rapidly accelerating demand can be related to a single event, such as seasonal shopping, or can be spread across an entire library of content, such as when a social media website surges in popularity. |
| • | Reliability. Throughout the path data must traverse to reach a user, problems with the underlying infrastructure supporting the Internet can occur. For instance, servers can crash, or network connections can fail. Avoiding these problems is important because network, datacenter, or service provider outages can mean frustrated users, lost audiences, and missed revenue opportunities. |
| • | Security. Maintaining effective security is a challenge for any entity that operates an Internet presence. Threats, such as attacks, viruses, or piracy can impact its online web presence in many ways, including compromising personal and sensitive information, loss of customer trust and loyalty, loss of revenue, and negative publicity and brand reputation. |
| • | Flexibility and manageability. Website operators are making significant investments in preparing their applications, content or advertising for delivery over the Internet. Once content is ready for Internet distribution, operators must be able to support a wide range of formats and devices, begin to distribute their object quickly, and monitor their delivery activities. |
3
Table of Contents
| • | Managing delivery costs. Managing the cost of delivery is important for website operators so that they can maximize profits. As a result, the combination of major capital outlays and operating expenditures required to build and maintain large server clusters, peak period capacity, extensive Internet backbone networks and multiple connections to global broadband access networks may not be practical for many companies. For example, as users increasingly demand access to large files and media streams, the infrastructure needs associated with providing this content increase accordingly. |
Our Services
Our services are purpose-built for the delivery of content, applications, and advertising to Internet audiences. Our primary services include the following:
| • | Media Delivery services, including our Limelight DELIVER and Limelight STREAM services, which enable the on-demand distribution of digital media files such as video, music, games, and software or live streaming of corporate or entertainment events. We support all major formats including Adobe Flash, QuickTime, Windows Media, RealNetworks RealPlayer WebM, and MP3 audio. |
| • | Interactive Advertising services, including EyeWonder in-page, in-stream, mobile and custom ad formats, which help agencies and advertisers create, deliver, measure, analyze and optimize campaigns for online, mobile, and connected devices. |
| • | Video Content Management services, including our Limelight Video Platform, MediaVault and our Media Transcode service, which help organizations publish, manage, syndicate, analyze, and monetize web video through a cloud-based service. |
| • | Mobility and Monetization services, including our Limelight REACH and Limelight ADS services, which help publishers deliver properly-formatted, device-optimized content to almost any media-enabled mobile handset, as well as to present dynamic pre-, mid-, or post-roll video and audio advertising into media that is delivered to mobile or connected users. |
| • | Web Acceleration services, including our Site Accelerator, Portal Accelerator and Commerce Accelerator services, which improve web experiences by providing consistent performance from any geography for dynamic and personalized content, online commerce transactions, and web applications. |
| • | Cloud Storage services, including our Limelight Content Storage service, which provides customers with a scalable, redundant, geographically diverse service for the storage of enterprise content. |
| • | Global Consulting and Technical services, including Limelight Professional Services, which help customers optimize their publishing, e-commerce, mobility, or content distribution workflows, and provide best practice support for network architecture design, storage infrastructure, web application development, creative design, advertising campaign management, live event execution, and the design, deployment and management of infrastructure. |
| • | Reporting and Analytics services, including our Limelight CONTROL and EyeOne services, which help online businesses increase efficiency, reduce expenses, improve end-user experience, and provide insight into performance of an online advertising campaign or web property. These services include features such as customer provisioning, custom control over delivery and storage options, custom reports, and internet health monitor — which provides insight into potential sources of end user experience issues. |
We use the term “cloud based services” to collectively refer to our Interactive Advertising, Video Content Management, Mobility and Monetization, Cloud Storage, Reporting and Analytics, and Global Consulting and Technical services. Collectively, our cloud based services represented 30% of revenue in 2010.
4
Table of Contents
Limelight Networks Global Computing Platform
Our global network platform provides highly-available, highly-redundant storage, bandwidth, and computing resources in support of our service families. This architecture, managed by our proprietary software, seamlessly and automatically responds to network and datacenter outages and disruptions. All of our delivery locations are interconnected via our global optical network and also connected to multiple Internet backbone and broadband Internet service provider networks. Additionally, each location has redundant servers, enabling us to continue serving content even if a network connection or server fails. Automatic failover and recovery not only provide uninterrupted customer service but also simplify network maintenance and upgrades.
The main features of this platform include:
| • | Densely Configured, High-Capacity Architecture. Our infrastructure consists of dense clusters of specially configured servers organized into large, multi-tiered, logical delivery locations. The extensive storage capacity of these logical locations leads to fewer cache misses to our network of servers than we believe would occur in an early CDN architecture and provides significant scalability and responsiveness to surges in end-user demand. The clustering of many high-performance CPUs provide us with aggregated computational power which we can direct to run applications, or make advertising targeting decisions. |
| • | Many Connections to Other Networks. Our logical locations are directly connected to hundreds of user access networks, which are computer networks connected to end-users. In addition, for dedicated connectivity between our logical locations, we operate our own private optical backbone and metro area networks. Lastly, our infrastructure has multiple connections to the Internet. In combination, these connections enable us to frequently bypass the often-congested public Internet, improving the delivery speed of content, applications, and advertising. |
| • | Intelligent Software to Manage the Network. We have developed proprietary software that manages our platform. This software manages the delivery of content objects, the retrieval of dynamic content, storage and retrieval of objects, activity logging, and information reporting. |
Business Segments and Geographic Information
We operate in one business segment: providing content delivery network services. We operate in three geographic areas — North America, Europe, Middle East and Africa (EMEA) and Asia Pacific. For the years ended December 31, 2010, 2009 and 2008, approximately 29%, 22% and 16%, respectively, of our total revenue was derived from our operations outside North America. For the years ended December 31, 2010, 2009 and 2008 we derived approximately 65%, 69% and 75%, respectively of our international revenue from EMEA and approximately 35%, 31% and 25%, respectively of our international revenue from Asia Pacific. No single country outside of the United States accounted for 10% or more of our revenues in any of such years. For a description of risks attendant to our foreign operations, see the section titled “Risk Factors” set forth in Part 1, Item 1A of this annual report on Form 10-K. For more segment and geographic information, including revenue from customers, a measure of profit or loss and total assets for each of the last three fiscal years, see our consolidated financial statements included in this annual report on Form 10-K, including Note 22 thereto.
Sales, Service and Marketing
Our sales and service professionals are located in 12 offices in the United States with an additional 10 office locations in Europe and Asia. We sell our services directly through our telesales and field sales forces. We also have customers who incorporate our services into their offerings and function as resellers, as well as other distribution partners. We target media, high tech, software, gaming, enterprise and government agencies and other providers of online media content through our:
| • | Telesales force. Our telesales force is responsible for managing direct sales opportunities within the small and mid-market within North America. |
5
Table of Contents
| • | Field sales force. Our field sales force is responsible for managing direct sales opportunities in major accounts in North America, Europe and the Asia Pacific region. |
| • | Distribution partners. We have certain customers who incorporate our services into their offerings, and we also maintain relationships with a number distribution partners. |
| • | Resellers. We sell our services to resellers who have a relationship with us that entitle them to represent our products and/or services to their customers. The customer, when purchasing our services from the reseller, often has a direct relationship with the third party company. Additionally, support for our product and/or services are handled by the reseller on behalf of the customer. |
Our sales and service organization includes employees in telesales and field sales, professional services, account management and solutions engineering. As of December 31, 2010, we had approximately 218 employees in our sales and support organization. Our ability to achieve revenue growth in the future will depend in large part on whether we successfully recruit, train and retain sufficient sales, technical and global services personnel, and how well we establish and maintain our strategic alliances. We believe that the complexity of our services will continue to require a number of highly trained global sales and services personnel.
To support our sales efforts and promote the Limelight brand, we conduct comprehensive marketing programs. Our marketing strategies include an active public relations campaign, print advertisements, on-line advertisements, participation at trade shows, strategic alliances and on-going customer communication programs. As of December 31, 2010, we had 8 employees in our global marketing organization, which is a component of our sales and support organization.
Customers
Our customers operate in the media, entertainment, gaming, software, enterprise, and public sectors. As of December 31, 2010, we had approximately 1,824 active customers worldwide, including many top names in the fields of video, digital music, new media, games, rich media applications and software delivery. During 2010, some of our most notable customers included Amazon, Avenue A/Razorfish, Blue Cross, Crispin, Porter, and Bogusky, Deutsche Bank, Electronic Arts, Goodby, Silverstein, and Partners, GroupM, General Electric, HBO, Microsoft, MySpace.com, Netflix, Nintendo Wii, Nissan, Ogilvy, Oracle, Pokeman, Sony Playstation, Toyota of Japan, TWBA, Universal McCann, and Yahoo.
During 2010, we had no customer that accounted for more than 10% of our revenue. One customer, Microsoft, accounted for more than 10% of our revenue for the years ended December 31, 2009 and 2008. During the first quarter of 2008, one large traffic customer shut down its site, and from time to time we have discontinued service to customers for non-payment. Although we did not receive continuing revenue from these former customers, these changes provided for a stronger mix of customers across our base, decreased our days sales outstanding (DSO) and allowed us to recoup network capacity to help meet future growth needs. We continue to focus on acquiring and retaining high quality customers across our strategic and government, emerging, channel and international market segments.
Competition
The markets in which we operate are rapidly evolving and highly competitive. We expect this competitive environment to continue. We believe that the principal competitive factors affecting the market for content delivery are performance, as measured by file delivery time, end-user media consumption rates and quality of the end-user experience; scalability, both in terms of average capacity and special event capacity; proprietary software designed to efficiently locate and deliver web content; ease of implementation; flexibility in designing delivery systems for unique content types and mixes; reliability; security; and cost efficiency.
We believe that the principal competitive factors affecting the market for digital interactive advertising services are existing strategic relationships with customers and vendors globally; ease-of- use, integration and
6
Table of Contents
customization; innovation; technology; quality and breadth of service, including local language support; data analysis; and cost efficiency.
With respect to these significant competitive factors, we believe that our content delivery services strongly compete in the areas of performance and scalability, and we believe our interactive advertising services strongly compete in the areas of vendor relationships, customization; innovation; technology; quality and breadth of service; and data analysis. Our advertising technology platform is supported by publishers worldwide, and we are able to customize our services and solutions to meet our specific customer needs.
Research and Development
Our research and development organization is responsible for the design, development, testing and certification of the software, hardware and network architecture of our content delivery network system and support of our cloud based services. As of December 31, 2010, we had 118 employees in our research and development group. Our research and development personnel are primarily located in Atlanta, Georgia and at our headquarters in Tempe, Arizona. Our engineering efforts support product development across all of our service areas as well as innovation related to the global computing platform itself. We test our services to ensure scalability in times of peak demand. We use internally-developed and third-party software to monitor and to improve the performance of our platform in the major Internet consumer markets around the world where we provide services for our customers. Our research and development expenses were approximately $15.8 million in 2010, $7.9 million in 2009 and $7.4 million in 2008, including stock-based compensation expense of approximately $3.1 million in 2010, $2.5 million in 2009 and $2.4 million in 2008. We believe that the investments that we have made in research and development have been effectively utilized. In 2011, we anticipate that our research and development expenditures will increase in absolute dollars and increase as a percentage of our revenue.
Intellectual Property
Our success depends in part upon our ability to protect our core technology and other intellectual capital. To accomplish this, we rely on a combination of intellectual property rights, including patents, trade secrets, copyrights, trademarks, domain registrations and contractual protections.
As of December 31, 2010, we have received 8 patents in the United States, the Patent and Trademark Office has allowed 2 more US applications, and we have 34 US patent applications pending including 2 provisional applications. We have 1 issued patent in Australia and one allowed. We have 21 pending applications in foreign countries and 17 patent applications filed under the Patent Cooperation Treaty awaiting possible entry into the regional or national phase. We do not know whether any of our patent applications will result in the issuance of a patent or whether the examination process will require us to narrow our claims. Any patents that may be issued to us may be contested, circumvented, found unenforceable or invalidated, and we may not be able to prevent third parties from infringing them. Therefore, we cannot predict the exact effect of having a patent with certainty.
We have received 9 trademarks in the United States. Our name, Limelight Networks, has been filed for multiple classes in the United States, Australia, Canada, the European Union, India, Japan, South Korea and Singapore. We have 7 pending trademark applications in foreign countries, and 22 non United States trademarks registered. There is a risk that pending trademark applications may not issue, and that those trademarks that have issued may be challenged by others who believe they have superior rights to the marks.
We generally control access to and use of our proprietary software and other confidential information through the use of internal and external controls, including physical and electronic security, contractual protections with employees, contractors, customers and partners, and domestic and foreign copyright laws.
Despite our efforts to protect our trade secrets and proprietary rights and other intellectual property rights by following sound business practices, licenses and confidentiality agreements, there is risk that unauthorized
7
Table of Contents
parties may still copy or otherwise obtain and use our software and technology. In addition, we intend to expand our international operations, and effective patent, copyright, trademark and trade secret protection may not be available or may be limited in foreign countries. Further, expansion of our business with additional employees, locations and legal jurisdictions may create greater risk that our trade secrets and proprietary rights will be harmed. If we fail to effectively protect our intellectual property and other proprietary rights, our business could be harmed.
Third parties could claim that our products or technologies infringe their proprietary rights. The Internet content delivery industry is characterized by the existence of a large number of patents, trademarks, and copyrights and by frequent litigation based on allegations of infringement or other violations of intellectual property rights. We expect that infringement claims may further increase as the number of products, services, and competitors in our market increases. Further, continued success in this market may provide an impetus to those who might use intellectual property litigation as a weapon against us.
As described under “Legal Proceedings” in Part 1, Item 3 of this annual report on Form 10-K, during 2010 we were party to two separate lawsuits alleging aspects of our CDN infringed upon third party patent rights.
In one matter, Akamai Technologies, Inc. v. Limelight Networks, Inc., a jury returned a verdict in February 2008 against us finding we infringed four claims of one patent at issue in that lawsuit, and awarded damages of approximately $45.5 million plus pre-judgment interest estimated to be $2.6 million. An additional provision of approximately $17.5 million for potential additional infringement damages and interest was recorded during the year ended December 31, 2008. In November 2008, a bench trial was conducted regarding our equitable defenses. We filed a renewed motion for judgment as a matter of law, and on May 27, 2009, the court entered judgment as a matter of law that we did not infringe Akamai’s patent. Akamai appealed that judgment and on December 20, 2010 the Court of Appeals for the Federal Circuit affirmed the District Court’s grant of our motion for judgment as a matter of law. On February 18, 2011, Akamai filed a motion with the Court of Appeals for the Federal Circuit seeking a rehearing and rehearing en banc. We believe that we do not infringe Akamai’s patents and will continue to vigorously defend our position.
In the other matter, in December 2007, Level 3 Communications, LLC (Level 3) filed a lawsuit against us in the United States District Court for the Eastern District of Virginia alleging we infringed three patents owned by it. On January 23, 2009, in Federal Court for the Eastern District of Virginia, a jury returned a verdict finding that we did not infringe on patents held by Level 3 and the District Court entered judgment in our favor. Level 3 appealed that decision to the Court of Appeals for the Federal Circuit. On May 3, 2010 the Court of Appeals heard oral argument on this matter, and on May 5, 2010, the Court of Appeals issued an order affirming the District Court’s judgment in our favor. Level 3 filed motions for rehearing and rehearing en banc, which were both denied. We consider this matter successfully concluded. Please refer to the “Legal Proceedings” in Part 1, Item 3 of this annual report on Form 10-K for more detailed information about these two lawsuits.
As we gain greater visibility and market exposure as a public company, we are likely to face an increased risk of being the subject of intellectual property infringement claims from other third parties.
Employees
As of December 31, 2010, we had 689 employees. Of these employees, 536 are based in North America, 130 are based in Europe, Middle East and Africa and 23 are based in Asia Pacific. None of our employees are represented by a labor union, and we have not experienced any work stoppages to date. We consider the relationships with our employees to be positive. Competition for technical personnel in the industry in which we compete is intense. We believe that our future success depends in part on our continued ability to hire, assimilate, and retain qualified personnel. To date, we believe that we have been successful in recruiting and retaining qualified employees, but there is no assurance that we will continue to be successful in the future.
8
Table of Contents
Executive Officers
Our executive officers and their ages and positions as of March 1, 2011 are as follows:
| Name |
Age | Position | ||||
| Jeffrey W. Lunsford |
45 | President, Chief Executive Officer and Chairman | ||||
| Nathan F. Raciborski |
44 | Co-Founder, Chief Technical Officer and Director | ||||
| Douglas S. Lindroth |
44 | Senior Vice President, Chief Financial Officer and Treasurer | ||||
| David M. Hatfield |
42 | Senior Vice President of Worldwide Sales, Marketing and Services | ||||
| Philip C. Maynard |
56 | Senior Vice President, Chief Legal Officer and Secretary | ||||
| John J. Vincent |
39 | Chief Executive Officer, EyeWonder and Director | ||||
Jeffrey W. Lunsford has served as our President, Chief Executive Officer and Chairman since November 2006. Prior to joining us, Mr. Lunsford served as Chairman and Chief Executive Officer of WebSideStory, Inc., a provider of real-time data analytics and visualization applications, from April 2003 to November 2006. WebSideStory acquired and assumed the name of Visual Sciences, Inc. in 2006 and was acquired by Omniture, Inc. in 2007. Prior to that, he served as the Chief Executive Officer of TogetherSoft Corporation, a software development company, from September 2002 to February 2003, and as the Senior Vice President of Corporate Development of S1 Corporation, a provider of customer interaction software for financial and payment services, from March 1996 to August 2002. He also currently serves on the board of directors of Engine Yard, Inc. Mr. Lunsford received a B.S. in Information and Computer Sciences from the Georgia Institute of Technology.
Nathan F. Raciborski, one of our Co-Founders in June 2001, has served as our Chief Technical Officer since June 2001 and as a director since July 2006. Prior to co-founding Limelight, Mr. Raciborski was the Co-Founder and Chief Technical Officer of Aerocast, Inc., from 1999 to 2000. In 1997, he co-founded Entera and served on its board of directors until it was acquired by Cacheflow in 2000. In 1993, Mr. Raciborski co-founded and served as President, Chief Executive Officer and Director of Primenet Services for the Internet, which later merged with GlobalCenter, Inc. where he served as President and Director. GlobalCenter was acquired in 1997 by Frontier Communications, Inc., where he served as President of Network Services until 1998. He also currently serves as a managing member of Cocoon Capital, LLC, a private venture fund.
Douglas S. Lindroth has served as our Senior Vice President and Chief Financial Officer since October 2008 and Treasurer since January 2009. Prior to joining us, Mr. Lindroth served as a member of our board of directors since February 2008. Mr. Lindroth has also served as a General Partner of Bayview Investment Company, a real estate investment company, since November 2005. From April 2006 to May 2007, Mr. Lindroth served as Senior Vice-President and Chief Financial Officer of BakBone Software Incorporated, a developer and distributor of data backup, restoration, disaster recovery, replication and storage reporting software. From 1997 through February 2006, Mr. Lindroth served in various capacities for Memec Group Holdings Limited, a privately held company and a specialty semiconductor distributor, including as its Chief Financial Officer beginning in 2003. Mr. Lindroth formerly served on the board of directors of BakBone Software Incorporated from May 2007 to January 2011. He is a Certified Public Accountant and received a B.A. in Business Administration from San Diego State University.
David M. Hatfield has served as our Senior Vice President of Worldwide Sales, Marketing and Services since March 2007. Prior to joining us, Mr. Hatfield served as Vice President-General Manager of Professional Services for the Americas at Symantec Corporation from September 2006 to March 2007 and as the Vice President of Sales, Western Area, at Symantec from April 2005 to September 2006. Prior to that, from December 2003 to April 2005, Mr. Hatfield served as Vice President of Sales of VERITAS Software. From October 2001 to October 2003, he served as the Vice President of Worldwide Field Operations at Rearden Commerce, Inc. (formerly Talaris Corporation). Mr. Hatfield also served in a number of senior sales leadership positions at Akamai Technologies, Inc. from September 1999 to October 2001, most recently as the Director of North America Sales. Mr. Hatfield received a B.S. in Political Science from Santa Clara University.
9
Table of Contents
Philip C. Maynard has served as our Senior Vice President, Chief Legal Officer and Secretary since October 2007. From August 2004 to October 2006, Mr. Maynard served as Senior Vice President, Chief Legal Officer and Secretary of FileNet Corporation, a provider of data and content management software for managing and sharing information across corporate networks and the Internet, and as Associate General Counsel for IBM Corporation from October 2006 to October 2007, following IBM’s acquisition of FileNet. From March 2004 to August 2004, Mr. Maynard served as Executive Vice President and Chief Legal Officer of SRS Labs, Inc., a leading provider of audio enhancement and integrated circuit solutions. From 2003 to 2004, Mr. Maynard was of counsel with the law firm of Stradling Yocca Carlson & Rauth in Newport Beach, California. From 2000 to 2002, Mr. Maynard served as Vice President & Division General Counsel for Invensys Software Systems, a division of Invensys, PLC, a UK-based engineering firm. From 1997 to 2000, Mr. Maynard was General Counsel for Wonderware Corporation, a leading developer of industrial automation software solutions, which was acquired by Invensys. Mr. Maynard received his J.D. (magna cum laude) from Loyola Law School in Los Angeles, California.
John J. Vincent has served as Chief Executive Officer, EyeWonder and director since April 2010. Prior to joining us, he co-founded EyeWonder in December 1999 and served as a director until EyeWonder was acquired by Limelight in April 2010. He served as EyeWonder’s Chief Executive Officer from December 1999 through October 2004 and then again from March 2006 until April 2010. Before founding EyeWonder, he served as Executive Officer and Director of Sales for Magellan Marketing, Inc., a privately held, national outdoor media company. Mr. Vincent founded Telluride Real Estate Corporation in September 1997, a real estate holding company specializing in long-term holdings of single- and multi-family residential dwellings. Mr. Vincent also founded Captive Concepts, Inc., an arena advertising and place-based media company, in July 1995. While with Captive Concepts, he led the development of the business through capital investments, business plan development, client solicitation and staff development. Mr. Vincent graduated from Vanderbilt University with a B.A. in Psychology and concentrations in Economics and Pre-Medicine.
| Item 1A. | Risk Factors |
You should carefully consider the risks described below. These risks are not the only risks that we may face. Additional risks and uncertainties that we are unaware of, or that we currently deem immaterial, also may become important factors that affect us. If any of the following risks occurs, our business, financial condition or results of operations could be materially and adversely affected which could cause our actual operating results to differ materially from those indicated or suggested by forward-looking statements made in this annual report on Form 10-K or presented elsewhere by management from time to time.
Risks Related to Our Business
We are a party to several lawsuits, and an adverse outcome in any or all of those lawsuits is possible, which could have a significant, adverse effect on our financial condition and operations. If an injunction were entered against us it could force us to cease providing our CDN services.
We are currently a defendant in two significant lawsuits and formerly a defendant in a third significant lawsuit, (see discussion in “Legal Proceedings” in Part I, Item 3 of this annual report on Form 10-K). In each case, we currently have favorable rulings, but we cannot provide any assurance that these favorable rulings won’t be overturned or reversed on appeal, or that the ultimate outcome of any of these lawsuits won’t be materially adverse to us. The expenses of defending these lawsuits and other lawsuits to which we may become a party, particularly fees paid to our lawyers and expert consultants, have been significant and may continue to adversely affect our operating results during the pendency of the lawsuits. Also, this litigation has been a distraction to our management in operating our business. Now that the trial and appeal phases of these lawsuits have concluded, we expect that our litigation expenses will reduce on a quarterly basis for the foreseeable future and that the distraction to management in operating our business will also decrease.
10
Table of Contents
In February 2008, a jury returned a verdict in a patent infringement lawsuit filed by Akamai Technologies, Inc., or Akamai, and the Massachusetts Institute of Technology, or MIT, against us, finding that we infringed four claims of the patent at issue and rejecting our invalidity defenses. The jury awarded Akamai an aggregate of approximately $45.5 million in lost profits, reasonable royalties and price erosion damages, plus pre-judgment interest estimated to be $2.6 million that we recorded in 2007. During 2008 we recorded an additional provision of approximately $17.5 million for potential additional infringement damages and interest.
The court conducted a bench trial in November 2008, regarding our equitable defenses; and we filed a motion for reconsideration of the court’s earlier denial of our motion for Judgment as a Matter of Law (JMOL). Our motion for JMOL was based largely upon a clarification in the standard for a finding of joint infringement articulated by the Federal Circuit in the case of Muniauction, Inc. v. Thomson Corp. (the Muniauction Case), released after the court denied our initial motion for JMOL. On April 24, 2009 the court issued its order and memorandum setting aside the adverse jury verdict and ruling that we do not infringe Akamai’s ‘703 patent and that we are entitled to judgment as a matter of law. Based upon the court’s April 24, 2009 order we have reversed the provision for litigation relating to this matter as we no longer believe that payment of any amounts represented by the litigation provision is probable. Akamai appealed the judgment, and on June 7, 2010 the United States Court of Appeals for the Federal Circuit heard oral argument on this matter. On December 20, 2010 the Court of Appeals for the Federal Circuit affirmed the District Court’s grant of our motion for judgment as a matter of law. On February 18, 2011, Akamai filed a motion with the Court of Appeals for the Federal Circuit seeking a rehearing and rehearing en banc. We believe that we do not infringe Akamai’s patents and will continue to vigorously defend our position; however, we cannot provide any assurance that the lawsuit ultimately will be resolved in our favor. An adverse ruling could seriously impact our ability to conduct our business and to offer our products and services to our customers. A permanent injunction could prevent us from operating our CDN to deliver certain types of traffic, which could impact the viability of our business. Any adverse ruling, in turn, would harm our revenue, market share, reputation, liquidity and overall financial position.
In January 2009, in a patent infringement lawsuit filed against us by Level 3 Communications LLC, or Level 3, a jury returned a verdict finding that we did not infringe any of the claims of the patents at issue in that case. The court denied Level 3’s subsequent motion for JMOL or alternatively for a new trial, and entered judgment in our favor. Level 3 appealed that decision. On May 3, 2010 the United States Court of Appeals for the Federal Circuit heard oral argument on this matter, and on May 5, 2010 the court affirmed the District Court judgment in our favor. Level 3 filed motions for rehearing and rehearing en banc, which were both denied. We consider this matter successfully concluded.
In August 2007, we, certain of our officers and directors, and the firms that served as the lead underwriters in our initial public offering were named as defendants in several purported class action lawsuits. These lawsuits have been consolidated into a single lawsuit in United States District Court for the District of Arizona. The consolidated complaint asserts causes of action under Sections 11, 12 and 15 of the Securities Act of 1933, as amended, on behalf of a professed class consisting of all those who were allegedly damaged as a result of acquiring our common stock in our initial public offering (IPO) between June 8, 2007 and August 8, 2007. The complaint seeks compensatory damages and plaintiffs’ costs and expenses in the litigation. The complaint alleges, among other things, that we omitted and/or misstated certain facts concerning the seasonality of our business and the loss of revenue with respect to certain customers. On March 17, 2008, we and the individual defendants moved to dismiss all of the plaintiffs’ claims, and a hearing was held on this motion on June 16, 2008. On August 8, 2008, the court granted the motion to dismiss, dismissing plaintiffs’ claims under Section 12 with prejudice and granting leave to amend the claims under Sections 11 and 15. Plaintiffs chose not to amend the claims under Sections 11 and 15, and on August 29, 2008 the court entered judgment in favor of us. On September 5, 2008, plaintiffs filed a notice of appeal, and appellate briefs were filed by the parties in January and February 2009. We do have in place directors and officers liability insurance and notice of this matter has been given to the insurance carriers. The insurance has reimbursed certain of the expenses incurred by us in defending this action. In November 2009 the parties entered into a Memorandum of Understanding to settle this lawsuit for an amount well within the coverage limits of the primary carrier of our directors and officers liability insurance,
11
Table of Contents
and on July 7, 2010 the parties entered into a settlement agreement consistent with the terms of the Memorandum of Understanding, which will require court approval. A hearing before the Federal District Court is currently scheduled for March 22, 2011. We anticipate court approval of the settlement. Although we believe that we and the individual defendants have meritorious defenses to the claims made in the complaint, there can be no assurance at this time that the settlement will be approved by the court, or otherwise completed. If we receive an adverse ruling with respect to the approval of the settlement in this case and we subsequently receive an adverse judgment which exceeds the amount of our directors and officers liability insurance coverage or that insurance is not available to satisfy the judgment, such a ruling could harm our liquidity and overall financial position.
We may need to defend our intellectual property and processes against patent or copyright infringement claims, which would cause us to incur substantial costs and threaten our ability to do business.
Companies, organizations or individuals, including our competitors, may hold or obtain patents or other proprietary rights that would prevent, limit or interfere with our ability to make, use or sell our services or develop new services, which could make it more difficult for us to operate our business. From time to time, we may receive inquiries from holders of patents inquiring whether we infringe their proprietary rights. Companies holding Internet-related patents or other intellectual property rights are increasingly bringing suits alleging infringement of such rights or otherwise asserting their rights and seeking licenses. In addition, many of our agreements with customers require us to indemnify such customers for third-party intellectual property infringement claims against them. Pursuant to such agreements, we may be required to defend such customers against certain claims which could cause us to incur additional significant costs. Any litigation or claims, whether or not valid, could result in substantial costs and diversion of resources. See “Legal Proceeding” in Part I, Item 3 of this annual report on Form 10-K. In addition, if we are determined to have infringed upon a third party’s intellectual property rights, we may be required to do one or more of the following:
| • | cease selling, incorporating or using products or services that incorporate the challenged intellectual property; |
| • | pay substantial damages; |
| • | obtain a license from the holder of the infringed intellectual property right, which license may or may not be available on reasonable terms or at all; or |
| • | redesign products or services. |
If we are forced to take any of these actions, our business may be seriously harmed. In the event of a successful claim of infringement against us and our failure or inability to obtain a license to the infringed technology, our business and operating results could be harmed.
We use certain “open-source” software the use of which could result in our having to distribute our proprietary software, including our source code, to third parties on unfavorable terms which could materially affect our business.
Certain of our service offerings use software that is subject to open-source licenses. Open-source code is software that is freely accessible, usable and modifiable. Certain open-source code is governed by license agreements, the terms of which could require users of such open-source code to make any derivative works of such open-source code available to others on unfavorable terms or at no cost. Because we use open-source code, we may be required to take remedial action in order to protect our proprietary software. Such action could include replacing certain source code used in our software, discontinuing certain of our products or taking other actions that could divert resources away from our development efforts.
In addition, the terms relating to disclosure of derivative works in many open-source licenses are unclear. We periodically review our compliance with the open-source licenses we use and do not believe we will be required to make our proprietary software freely available. However, if a court interprets one or more such open-source licenses in a manner that is unfavorable to us, we could be required to make our software available at no cost.
12
Table of Contents
We currently face competition from established competitors and may face competition from others in the future.
We compete in markets that are intensely competitive, rapidly changing and characterized by constantly declining prices and vendors offering a wide range of content delivery solutions. We have experienced and expect to continue to experience increased competition, and particularly aggressive price competition. Many of our current competitors, as well as a number of our potential competitors, have longer operating histories, greater name recognition, broader customer relationships and industry alliances and substantially greater financial, technical and marketing resources than we do. As a consequence of the competitive dynamics in our market we have experienced reductions in our prices, which in turn adversely affect our revenue, gross margin and operating results.
Our primary competitors include content delivery service providers such as Akamai, Level 3 Communications, AT&T, CDNetworks and Internap Network Services Corporation, which acquired VitalStream. Also, as a result of the growth of the content delivery market, a number of companies have recently entered or are currently attempting to enter our market, either directly or indirectly, some of which may become significant competitors in the future. Our largest value-added service, the EyeWonder brand, faces formidable competition in every aspect of our business from other companies that provide solutions and services similar to those offered by us. Currently, the EyeWonder business unit’s primary competitors are DoubleClick, Eyeblaster, Pointroll, a subsidiary of Gannett, and Atlas. DoubleClick is owned by Google and Atlas is part of the Microsoft Advertising portfolio. DoubleClick and Atlas offer solutions and services similar to those offered by us and compete directly with us. We expect that Google and Microsoft will use their substantial financial and engineering resources to expand the DoubleClick and Atlas businesses and increase their ability to compete with us. We believe that both Google and Microsoft have a greater ability to attract and retain customers due to numerous competitive advantages, including their ability to offer and provide their marketing and advertising customers with a significantly broader range of related solutions and services than us. Google and Microsoft may use their experience and resources to compete with us in a variety of ways, including through acquisitions of competitors or related businesses, and could also use campaign management solutions as a loss leader or provide campaign management solutions without charge or below cost in order to encourage customers to use their other product offerings. The EyeWonder business unit also faces significant competition from rich-media solutions companies such as Unicast (a DG FastChannel company) and UK-based Flashtalking, as well as ad serving companies such as Zedo and CheckM8. In addition, we may experience competition from companies that provide web analytics or web intelligence. Other companies, such as Yahoo!, also are developing campaign management solutions.
Our competitors may be able to respond more quickly than we can to new or emerging technologies and changes in customer requirements. Given the relative ease by which customers typically can switch among providers, differentiated offerings or pricing by competitors could lead to a rapid loss of customers. Some of our current or potential competitors may bundle their offerings with other services, software or hardware in a manner that may discourage content providers from purchasing the services that we offer. In addition, as we expand internationally, we face different market characteristics and competition with local content delivery service providers, many of which are very well positioned within their local markets. Increased competition could result in price reductions and revenue shortfalls, loss of customers and loss of market share, which could harm our business, financial condition and results of operations.
If we fail to manage future growth effectively, we may not be able to market and sell our services successfully.
Our future operating results depend to a large extent on our ability to manage expansion and growth successfully. Risks that we face in undertaking this expansion include: training new sales personnel to become productive and generate revenue; forecasting revenue; controlling expenses and investments in anticipation of expanded operations; implementing and enhancing our content delivery network, or CDN, and administrative infrastructure, systems and processes; addressing new markets; and expanding international operations. A failure to manage our growth effectively could materially and adversely affect our ability to market and sell our products and services.
13
Table of Contents
If we fail to maintain proper and effective internal controls or fail to implement our controls and procedures with respect to acquired or merged operations, our ability to produce accurate financial statements could be impaired, which could adversely affect our operating results, our ability to operate our business and investors’ views of us.
We must ensure that we have adequate internal financial and accounting controls and procedures in place so that we can produce accurate financial statements on a timely basis. We are required to spend considerable effort on establishing and maintaining our internal controls, which is costly and time-consuming and needs to be re-evaluated frequently.
We have only operated as a public company since June 2007 and we will continue to incur significant legal, accounting and other expenses as we comply with the Sarbanes-Oxley Act of 2002, as well as new rules subsequently implemented by the Securities and Exchange Commission (SEC) and the Nasdaq Stock Market’s Global Market. These rules impose various requirements on public companies, including requiring changes in corporate governance practices, increased reporting of compensation arrangements and other requirements. Our management and other personnel will continue to devote a substantial amount of time to these compliance initiatives. Moreover, these rules and regulations will increase our legal and financial compliance costs and will make some activities more time-consuming and costly. These rules and regulations could also make it more difficult for us to attract and retain qualified persons to serve on our board of directors, our board committees or as executive officers.
Section 404 of the Sarbanes-Oxley Act of 2002 requires that we include in our annual report our assessment of the effectiveness of our internal control over financial reporting and our audited financial statements as of the end of each fiscal year. Furthermore, our independent registered public accounting firm, Ernst & Young LLP, (E&Y), is required to report on whether it believes we maintained, in all material respects, effective internal control over financial reporting as of the end of the year. We successfully completed our assessment and obtained E&Y’s attestation as to the effectiveness of our internal control over financial reporting as of December 31, 2010, 2009 and 2008, respectively. Our continued compliance with Section 404 will require that we incur substantial expense and expend significant management time on compliance related issues, including our efforts in implementing controls and procedures related to acquired or merged operations. We currently do not have an internal audit group and use an international accounting firm to assist us with our assessment of the effectiveness of our internal controls over financial reporting. In future years, if we fail to timely complete this assessment, or if E&Y cannot timely attest, there may be a loss of public confidence in our internal controls, the market price of our stock could decline and we could be subject to regulatory sanctions or investigations by the Nasdaq Stock Market’s Global Market, the SEC or other regulatory authorities, which would require additional financial and management resources. In addition, any failure to implement required new or improved controls, or difficulties encountered in their implementation, could harm our operating results or cause us to fail to timely meet our regulatory reporting obligations.
We may lose customers if they elect to develop content delivery solutions internally.
Our customers and potential customers may decide to develop their own content delivery solutions rather than outsource these solutions to CDN services providers like us. This is particularly true as our customers increase their operations and begin expending greater resources on delivering their content using third party solutions. If we fail to offer CDN services that are competitive to in-sourced solutions, we may lose additional customers or fail to attract customers that may consider pursuing this in-sourced approach, and our business and financial results would suffer.
14
Table of Contents
We may lose customers if they are unable to build business models that effectively monetize delivery of their content.
Some of our customers will not be successful in selling advertising or otherwise monetizing the content we deliver on their behalf and consequently may not be successful in creating a profitable business model. This will result in some of our customers discontinuing their Internet or web-based business operations and discontinuing use of our services and products. Further, weakness and related uncertainty in the global financial markets and economy — which has included, among other things, significant reductions in available capital and liquidity from banks and other providers of credit, substantial reductions and/or fluctuations in equity and currency values worldwide and concerns that the worldwide economy may be in a prolonged recessionary period — may materially adversely impact our customers’ access to capital or willingness to spend capital on our services or in some cases, ultimately cause the customer to file for protection from creditors under applicable insolvency or bankruptcy laws or simply go out of business. This uncertainty may also impact our customers’ levels of cash liquidity, which could affect their ability or willingness to timely pay for services that they will order or have already ordered from us. From time to time we discontinue service to customers for non-payment of services. We expect further customers may discontinue operations or not be willing or able to pay for services that they have ordered from us. Further loss of customers may adversely affect our financial results.
Rapidly evolving technologies or new business models could cause demand for our CDN services to decline or could cause these services to become obsolete.
Customers or third parties may develop technological or business model innovations that address content delivery requirements in a manner that is, or is perceived to be, equivalent or superior to our CDN services. If competitors introduce new products or services that compete with or surpass the quality or the price/performance of our services, we may be unable to renew our agreements with existing customers or attract new customers at the prices and levels that allow us to generate attractive rates of return on our investment. For example, one or more third parties might develop improvements to current peer-to-peer technology, which is a technology that relies upon the computing power and bandwidth of its participants, such that this technological approach is better able to deliver content in a way that is competitive to our CDN services, or even makes CDN services obsolete. We may not anticipate such developments and may be unable to adequately compete with these potential solutions. In addition, our customers’ business models may change in ways that we do not anticipate and these changes could reduce or eliminate our customers’ needs for CDN services. If this occurred, we could lose customers or potential customers, and our business and financial results would suffer. As a result of these or similar potential developments, in the future it is possible that competitive dynamics in our market may require us to reduce our prices, which could harm our revenue, gross margin and operating results.
If we are unable to sell our services at acceptable prices relative to our costs, our revenue and gross margins will decrease, and our business and financial results will suffer.
Prices for CDN services have fallen in recent years and are likely to fall further in the future. We have invested significant amounts in purchasing capital equipment to increase the capacity of our CDN services. For example, in 2007, 2008 and 2009 we invested $22.3 million, $17.4 million and $20.4 million, respectively, in capital expenditures primarily for computer equipment associated with the build-out and expansion of our CDN. For the year ended December 31, 2010, we invested $34.2 million. Our investments in our infrastructure are based upon our assumptions regarding future demand and also prices that we will be able to charge for our services. These assumptions may prove to be wrong. If the price that we are able to charge customers to deliver their content falls to a greater extent than we anticipate, if we over-estimate future demand for our services or if our costs to deliver our services do not fall commensurate with any future price declines, we may not be able to achieve acceptable rates of return on our infrastructure investments and our gross profit and results of operations may suffer dramatically.
During 2011, as we further expand our CDN services and begin to refresh our network equipment, we expect our capital expenditures to be approximately 15% of total revenue. As a consequence, we are dependent
15
Table of Contents
on significant future growth in demand for our services to provide the necessary gross profit to pay these additional expenses. If we fail to generate significant additional demand for our services, our results of operations will suffer and we may fail to achieve planned or expected financial results. There are numerous factors that could, alone or in combination with other factors, impede our ability to increase revenue, moderate expenses or maintain gross margins, including:
| • | failure to increase sales of our core services; |
| • | increases in electricity, bandwidth and rack space costs or other operating expenses, and failure to achieve decreases in these costs and expenses relative to decreases in the prices we can charge for our services and products; |
| • | inability to maintain our prices relative to our costs; |
| • | failure of our current and planned services and software to operate as expected; |
| • | loss of any significant customers or loss of existing customers at a rate greater than our increase in new customers or our sales to existing customers; |
| • | failure to increase sales of our services to current customers as a result of their ability to reduce their monthly usage of our services to their minimum monthly contractual commitment; |
| • | failure of a significant number of customers to pay our fees on a timely basis or at all or failure to continue to purchase our services in accordance with their contractual commitments; and |
| • | inability to attract high quality customers to purchase and implement our current and planned services. |
If we are unable to develop new services and enhancements to existing services or fail to predict and respond to emerging technological trends and customers’ changing needs, our operating results may suffer.
The market for our CDN and value-added services is characterized by rapidly changing technology, evolving industry standards and new product and service introductions. Our operating results depend on our ability to predict user preferences or industry changes, and modify our solutions and services on a timely basis or develop and introduce new services into existing and emerging markets. The process of developing new technologies is complex and uncertain. We must commit significant resources to developing new services or enhancements to our existing services before knowing whether our investments will result in services the market will accept. Furthermore, we may not execute successfully our technology initiatives because of errors in planning or timing, technical hurdles that we fail to overcome in a timely fashion, misunderstandings about market demand or a lack of appropriate resources. As prices for CDN continue to fall, we will increasingly rely on new product offerings and other value-added services to maintain or increase our gross margins. Failures in execution or market acceptance of new services we introduce could result in competitors providing those solutions before we do, which could lead to loss of market share, revenue and earnings.
Advertisers may not find Internet advertising effective and may reduce their allocations of advertisement spending on Internet campaigns.
Most large advertisers have fixed advertising budgets, a very small portion of which is allocated to Internet advertising. The future success of our EyeWonder business depends highly on an increase in the use of the Internet, the commitment of advertisers and advertising agencies to the Internet as an advertising and marketing medium, the advertisers’ implementation of advertising campaigns, and the willingness of current or potential customers to outsource their Internet advertising and marketing needs. If the market for Internet advertising or marketing deteriorates, or develops more slowly than we expect, our business could suffer. The market for Internet advertising and marketing is relatively new and rapidly evolving, and we expect that large advertisers will continue to focus most of their advertising efforts on traditional media. Advertisers, including current and potential customers, may also find Internet advertising or marketing to be less effective than traditional media advertising or marketing methods for promoting their products and services, and therefore may decrease the
16
Table of Contents
portion of their budget allocated to Internet advertising or may shift their advertising away from the Internet. Even if Internet advertising increases in the aggregate, if display advertising does not increase, the market for our products and services may not continue to be viable and our revenues may decrease. If we fail to convince these companies to spend a portion of their advertising budgets with us to advertise online, or if our existing advertisers reduce the amount they spend on its services, our business, financial condition or results of operations could be materially adversely affected.
Our EyeWonder business may be adversely affected by cyclicality or an extended downturn in the United States or worldwide economy in or related to the industries we serve.
Revenues for our EyeWonder business unit are generated primarily from providing online campaign management solutions and services to advertising agencies and advertisers across digital media channels and a variety of formats. Demand for these services tends to be tied to economic cycles, reflecting overall economic conditions as well as budgeting and buying patterns. Following the recent negative developments in the world economy, several agency and analyst organizations now predict that the growth in online advertising will be slower than previously expected. We cannot provide assurance that advertising budgets and expenditures by advertising agencies and advertisers will not decline in any given period or that advertising spending will not be diverted to more traditional media or other online marketing products and services, which would lead to a decline in the demand for our campaign management solutions and services. A decline in the economic prospects of advertisers or the economy in general could alter current or prospective customers’ spending priorities. As a result, our revenues may not increase or may decline significantly in any given period.
Consolidation of Internet advertising networks, web portals, Internet search engine sites and web publishers may impair our ability to serve advertisements and to collect campaign data, and could lead to a loss of significant customers.
The growing trend of consolidation of Internet advertising networks, web portals, Internet search engine sites and web publishers, and increasing industry presence of a small number of large companies, such as Google and Microsoft, could harm our business. We currently are able to serve, track and manage advertisements for our customers in a variety of networks and websites. Concentration of advertising networks or any disruption in our relationship with our publishers could substantially impair our ability to serve advertisements if networks or websites decide not to permit us to serve, track or manage advertisements on their websites, if publishers develop ad placement systems that are not compatible with our systems, or if they use their market power to force their customers to use certain vendors on their networks or websites. These networks or websites also could prohibit or limit our aggregation of advertising campaign data if they use technology that is not compatible with our technology. In addition, concentration of desirable advertising space in a small number of networks and websites could result in pricing pressures and diminish the value of our advertising campaign data, as the value of this data depends to some degree on the continuous aggregation of data from advertising campaigns on a variety of different advertising networks and websites. Additionally, major networks and publishers can terminate our ability to serve advertisements on their properties on short notice. If we are no longer able to serve, track and manage advertisements on a variety of networks and websites, our offerings will be significantly impacted.
New advertisement blocking technologies could limit or block the delivery or display of advertisements by our service offerings, which could undermine the viability of our business.
Advertisement blocking technologies, such as “filter” software programs, that can limit or block the delivery or display of advertisements delivered through our service offerings are currently available for Internet users and are continuing to be developed. If these technologies become widespread, the commercial viability of the current Internet advertisement model may be undermined. As a result, ad-blocking technology could, in the future, have a material adverse affect on our business, financial condition and results of operations.
17
Table of Contents
More individuals are using non-personal computer devices to access the Internet, and the solutions developed for these devices may not be widely deployed.
The number of people who access the Internet through devices other than personal computers (PCs), including mobile devices, game consoles and television set-top devices, has increased dramatically in the past few years. The lower resolution, functionality and memory associated with alternative devices make the use of our service offerings through these devices more difficult and potentially less effective. If we are unable to deliver our service offerings to a substantial number of alternative device users or if we are slow to develop services and technologies that are more compatible with non-PC Internet-enabled devices, we will fail to capture a significant share of an increasingly important portion of the market. Such a failure could limit our ability to compete effectively in an industry that is rapidly growing and changing.
Our EyeWonder business may be adversely affected by malicious third-party software applications that interfere with the function of our technology.
Our EyeWonder business may be adversely affected by malicious software applications that make changes to Internet users’ computers and interfere with our technology. These applications may attempt to change the users’ experience in using our services, including altering or replacing advertisements delivered by our platform, changing configurations of our user interface, or otherwise interfering with our ability to deliver advertisements to users’ devices. The interference may occur without disclosure to or consent from users, resulting in a negative experience that users may associate with our services. If our efforts to combat these malicious software applications are unsuccessful, our reputation may be harmed and the communications with certain users on behalf of our customers could be impaired. This could result in a decline in usage of our services and corresponding revenues, which would have a material adverse effect on our business, financial condition and results of operations.
If we fail to detect click-through fraud or other invalid clicks, we could lose the confidence of our advertisers, thereby causing our business to suffer.
We are exposed to the risk of fraudulent clicks and other invalid clicks on advertisements delivered by us from a variety of potential sources. Invalid clicks are clicks that we have determined are not intended by the user to link to the underlying content, such as inadvertent clicks on the same ad twice and clicks resulting from click fraud. Click fraud occurs when a user intentionally clicks on an ad displayed on a web site for a reason other than to view the underlying content. These types of fraudulent activities could harm our business and brand. If fraudulent clicks are not detected, the data that our solutions provide to customers may be less reliable and the affected advertisers may lose confidence in our solutions to deliver a return on their investment. If advertisers become dissatisfied with our solutions, they may choose to do business with our competitors or reduce their Internet advertising spending.
Our business depends on a strong brand reputation of the EyeWonder and Limelight Networks brands, and if we are not able to maintain and enhance our brands, our business will suffer.
We believe that maintaining and enhancing the “EyeWonder” and “Limelight Networks” brands is important to expanding our base of customers and maintaining brand loyalty among customers, particularly in North America where brand perception can impact the competitive position in other markets worldwide, and that the importance of brand recognition will increase due to the growing number of competitors providing similar services and solutions. Maintaining and enhancing our brand may require us to make substantial investments in research and development and in the marketing of our solutions and services and these investments may not be successful. If we fail to promote and maintain the “Limelight Networks” and “EyeWonder” brands, or if we incur excessive expenses in this effort, our business and results of operations could be adversely impacted. We anticipate that, as our market becomes increasingly competitive, maintaining and enhancing our brand may become increasingly difficult and expensive. Maintaining and enhancing our brand will depend largely on our ability to be a technology leader and to continue to provide high quality solutions and services, which we may not do successfully.
18
Table of Contents
We depend on a limited number of customers for a substantial portion of our revenue in any fiscal period, and the loss of, or a significant shortfall in demand from these customers could significantly harm our results of operations.
During any given fiscal period, a relatively small number of customers typically account for a significant percentage of our revenue. For example, in 2010, sales to our top 10 customers, in terms of revenue, accounted for approximately 30% of our total revenue. During 2009 and 2008, sales to our top 10 customers, in terms of revenue, accounted for approximately 36% and 38%, respectively of our total revenue. During 2010, we had no customer who represented more than 10% of our total revenue. During 2009 and 2008, one of these top 10 customers, Microsoft, represented approximately 14% and 18%, respectively of our total revenue for that period. Microsoft, and other large customers, may not continue to be as significant going forward as they have been in the past. During 2011, we anticipate that our revenue from Microsoft will decline from that earned in 2010 and as a percent of our total revenue. In the past, the customers that comprised our top 10 customers have continually changed, and we also have experienced significant fluctuations in our individual customers’ usage of our services. As a consequence, we may not be able to adjust our expenses in the short term to address the unanticipated loss of a large customer during any particular period. As such, we may experience significant, unanticipated fluctuations in our operating results which may cause us to not meet our expectations or those of stock market analysts, which could cause our stock price to decline.
If we are unable to attract new customers or to retain our existing customers, our revenue could be lower than expected and our operating results may suffer.
In addition to adding new customers, to increase our revenue, we must sell additional services to existing customers and encourage existing customers to increase their usage levels. If our existing and prospective customers do not perceive our services to be of sufficiently high value and quality, we may not be able to retain our current customers or attract new customers. We sell our services pursuant to service agreements that generally include some form of financial minimum commitment. Our customers have no obligation to renew their contracts for our services after the expiration of their initial commitment, and these service agreements may not be renewed at the same or higher level of service, if at all. Moreover, under some circumstances, some of our customers have the right to cancel their service agreements prior to the expiration of the terms of their agreements. This fact, in addition to the changing competitive landscape in our market, means that we cannot accurately predict future customer renewal rates or usage rates. Our customers’ renewal rates may decline or fluctuate as a result of a number of factors, including:
| • | their satisfaction or dissatisfaction with our services; |
| • | the prices of our services; |
| • | the prices of services offered by our competitors; |
| • | discontinuation by our customers of their Internet or web-based content distribution business; |
| • | mergers and acquisitions affecting our customer base; and |
| • | reductions in our customers’ spending levels. |
If our customers do not renew their service agreements with us or if they renew on less favorable terms, our revenue may decline and our business will suffer. Similarly, our customer agreements often provide for minimum commitments that are often significantly below our customers’ historical usage levels. Consequently, even if we have agreements with our customers to use our services, these customers could significantly curtail their usage without incurring any penalties under our agreements. In this event, our revenue would be lower than expected and our operating results could suffer.
It also is an important component of our growth strategy to market our CDN services to industries, such as enterprise and the government. As an organization, we do not have significant experience in selling our services into these markets. We have only recently begun a number of these initiatives, and our ability to successfully sell
19
Table of Contents
our services into these markets to a meaningful extent remains unproven. If we are unsuccessful in such efforts, our business, financial condition and results of operations could suffer.
Our results of operations may fluctuate in the future. As a result, we may fail to meet or exceed the expectations of securities analysts or investors, which could cause our stock price to decline.
Our results of operations may fluctuate as a result of a variety of factors, many of which are outside of our control. If our results of operations fall below the expectations of securities analysts or investors, the price of our common stock could decline substantially. In addition to the effects of other risks discussed in this section, fluctuations in our results of operations may be due to a number of factors, including:
| • | our ability to increase sales to existing customers and attract new customers to our CDN and value-added services; |
| • | the addition or loss of large customers, or significant variation in their use of our CDN and value-added services; |
| • | costs associated with current or future intellectual property lawsuits and other lawsuits; |
| • | service outages or security breaches; |
| • | the amount and timing of operating costs and capital expenditures related to the maintenance and expansion of our business, operations and infrastructure; |
| • | the timing and success of new product and service introductions by us or our competitors; |
| • | the occurrence of significant events in a particular period that result in an increase in the use of our CDN and value-added services, such as a major media event or a customer’s online release of a new or updated video game; |
| • | changes in our pricing policies or those of our competitors; |
| • | the timing of recognizing revenue; |
| • | limitations of the capacity of our content delivery network and related systems; |
| • | the timing of costs related to the development or acquisition of technologies, services or businesses; |
| • | general economic, industry and market conditions (such as the fluctuations experienced in the stock and credit markets during the recent deterioration of global economic conditions) and those conditions specific to Internet usage; |
| • | limitations on usage imposed by our customers in order to limit their online expenses; and |
| • | geopolitical events such as war, threat of war or terrorist actions. |
Additionally, the operating results for our EyeWonder business unit have historically fluctuated on a quarterly basis due to the seasonal nature of brand-oriented advertising on the Internet, and we expect this fluctuation to continue. The fourth calendar quarter is typically the strongest, and the first quarter is often the weakest quarter for the EyeWonder business unit. The increase in revenue in the fourth quarter is primarily the result of heavy advertising and online shopping during November and December due to the holidays. The drop in revenues in the first quarter is linked to the drop in online advertising and shopping that occurs at the beginning of each year. We believe that cyclicality and seasonality may have a more pronounced effect on our EyeWonder business unit’s operating results in the future, as its growth slows. Our EyeWonder business unit’s operating expenses are relatively fixed in the near term. As a result, we cannot quickly react to changes in revenue and therefore, changes in revenue could lead to changes in our operating results.
We believe that our revenue and results of operations may vary significantly in the future and that period-to-period comparisons of our operating results may not be meaningful. You should not rely on the results of one period as an indication of future performance.
20
Table of Contents
After being profitable in 2004 and 2005, we were unprofitable in 2006, 2007, 2008 and 2010, and would have been unprofitable in 2009, had we not reversed a significant reserve for litigation, primarily due to increased stock-based compensation expense and litigation costs, which could affect our ability to achieve and maintain profitability in the future.
Our adoption of ASC 718 (formerly FAS 123R) in 2006 substantially increased the amount of share-based compensation expense we record and has had a significant impact on our results of operations. After being profitable in 2004 and 2005, we were unprofitable in 2006, 2007, 2008 and 2010 partially due to our share-based compensation expense which increased from $0.1 million in 2005 to $9.2 million in 2006, to $18.9 million in 2007 to $18.1 million in 2008 and was $17.4 million in 2010. We were profitable in 2009, due to the reversal of a significant reserve for litigation; however our share-based compensation was still significant at $17.5 million for the year. This significant amount of share-based compensation expense reflects an increase in the level of stock options, restricted stock and restricted stock unit (RSU) grants. Our unrecognized share-based compensation expense totaled $27.5 million at December 31, 2010 based on current outstanding stock options and restricted stock units, of which we expect to amortize $13.3 million during 2011, $7.2 million in 2012 and the remainder thereafter based upon the scheduled vesting of the options, restricted stock and RSUs outstanding at that time. Our share-based compensation expense could adversely affect our ability to achieve and maintain profitability in the future. In 2006, we were sued by Akamai and MIT alleging infringement of certain patents. In December 2007, we were sued by Level 3 Communications alleging infringement of certain patents. We have incurred, and will potentially continue to incur, significant costs associated with litigation. These costs were $3.1 million, $7.3 million, $20.8 million and $5.4 million, respectively, in 2006, 2007, 2008 and 2009, respectively. For the year ended December 31, 2010, we incurred $2.1 million in litigation costs. These costs may continue to be significant during 2011.
We generate our revenue primarily from the sale of CDN services, and the failure of the market for these services to expand as we expect or the reduction in spending on those services by our current or potential customers would seriously harm our business.
While we offer our customers a number of services associated with our CDN, we generated the majority of our revenue in 2007, 2008, 2009 and 2010 from charging our customers for the content delivered on their behalf through our CDN. We are subject to an elevated risk of reduced demand for these services. Furthermore, if the market for delivery of rich media content in particular does not continue to grow as we expect or grows more slowly, then we may fail to achieve a return on the significant investment we are making to prepare for this growth. Our success, therefore, depends on the continued and increasing reliance on the Internet for delivery of media content and our ability to cost-effectively deliver these services. Factors that may have a general tendency to limit or reduce the number of users relying on the Internet for media content or the number of providers making this content available online include a general decline in Internet usage, litigation involving our customers and third party restrictions on online content, including copyright restrictions, digital rights management and restrictions in certain geographic regions, as well as a significant increase in the quality or fidelity of offline media content beyond that available online to the point where users prefer the offline experience. The influence of any of these factors may cause our current or potential customers to reduce their spending on CDN services, which would seriously harm our operating results and financial condition.
Many of our significant current and potential customers are pursuing emerging or unproven business models which, if unsuccessful, could lead to a substantial decline in demand for our CDN services.
Because the proliferation of broadband Internet connections and the subsequent monetization of content libraries for distribution to Internet users are relatively recent phenomena, many of our customers’ business models that center on the delivery of rich media and other content to users remain unproven. For example, social media companies have been among our top recent customers and are pursuing emerging strategies for monetizing the user content and traffic on their web sites. Our customers will not continue to purchase our CDN services if their investment in providing access to the media stored on or deliverable through our CDN does not generate a sufficient return on their investment. A reduction in spending on CDN services by our current or potential customers would seriously harm our operating results and financial condition.
21
Table of Contents
Our business will be adversely affected if we are unable to protect our intellectual property rights from unauthorized use or infringement by third parties.
We rely on a combination of patent, copyright, trademark and trade secret laws and restrictions on disclosure to protect our intellectual property rights. These legal protections afford only limited protection, and we have only one currently issued patent. Monitoring infringement of our intellectual property rights is difficult, and we cannot be certain that the steps we have taken will prevent unauthorized use of our intellectual property rights. We have applied for patent protection in a number of foreign countries, but the laws in these jurisdictions may not protect our proprietary rights as fully as in the United States. Furthermore, we cannot be certain that any pending or future patent applications will be granted, that any future patent will not be challenged, invalidated or circumvented, or that rights granted under any patent that may be issued will provide competitive advantages to us.
Any unplanned interruption in the functioning of our network or services or attacks on our internal information technology systems could lead to significant costs and disruptions that could reduce our revenue and harm our business, financial results and reputation.
Our business is dependent on providing our customers with fast, efficient and reliable distribution of application and content delivery services over the Internet. Many of our customers depend primarily or exclusively on our services to operate their businesses. Consequently, any disruption of our services could have a material impact on our customers’ businesses. Our network or services could be disrupted by numerous events, including natural disasters, failure or refusal of our third party network providers to provide the necessary capacity, failure of our software or CDN delivery infrastructure and power losses. In addition, we deploy our servers in third party co-location facilities, and these third-party co-location providers could experience system outages or other disruptions that could constrain our ability to deliver our services. We may also experience disruptions caused by software viruses or other attacks by unauthorized users.
While we have not experienced any significant, unplanned disruption of our services to date, our CDN may fail in the future. Despite our significant infrastructure investments, we may have insufficient communications and server capacity to address these or other disruptions, which could result in interruptions in our services. Any widespread interruption of the functioning of our CDN and value-added services for any reason would reduce our revenue and could harm our business and financial results. If such a widespread interruption occurred or if we failed to deliver content to users as expected during a high-profile media event, game release or other well-publicized circumstance, our reputation could be damaged severely. Moreover, any disruptions could undermine confidence in our services and cause us to lose customers or make it more difficult to attract new ones, either of which could harm our business and results of operations.
We may have difficulty scaling and adapting our existing architecture to accommodate increased traffic and technology advances or changing business requirements, which could lead to the loss of customers and cause us to incur unexpected expenses to make network improvements.
Our CDN services are highly complex and are designed to be deployed in and across numerous large and complex networks. Our network infrastructure has to perform well and be reliable for us to be successful. The greater the user traffic and the greater the complexity of our products and services, the more resources we will need to invest in additional infrastructure and support. Further, as a result of the adverse jury verdict in February 2008 in the Akamai Technologies, Inc. v. Limelight Networks, Inc. lawsuit, which verdict was overturned by the court’s April 24, 2009 order granting our motion for judgment as a matter of law, we made significant investment in designing and implementing changes to our CDN architecture in order to implement our CDN services in a manner we believe does not infringe the claims of Akamai’s ‘703 patent as alleged in the February 2008 trial. We have spent and expect to continue to spend substantial amounts on the purchase and lease of equipment and data centers and the upgrade of our technology and network infrastructure to handle increased traffic over our network, implement changes to our CDN architecture and to roll out new products and services. This expansion
22
Table of Contents
is expensive and complex and could result in inefficiencies, operational failures or defects in our network and related software. If we do not implement such changes or expand successfully, or if we experience inefficiencies and operational failures, the quality of our products and services and user experience could decline. From time to time, we have needed to correct errors and defects in our software or in other aspects of our CDN. In the future, there may be additional errors and defects that may harm our ability to deliver our services, including errors and defects originating with third party networks or software on which we rely. These occurrences could damage our reputation and lead us to lose current and potential customers. We must continuously upgrade our infrastructure in order to keep pace with our customers’ evolving demands. Cost increases or the failure to accommodate increased traffic or these evolving business demands without disruption could harm our operating results and financial condition.
Our operations are dependent in part upon communications capacity provided by third party telecommunications providers. A material disruption of the communications capacity we have leased could harm our results of operations, reputation and customer relations.
We lease private line capacity for our backbone from a third party provider, Global Crossing Ltd. or Global Crossing. Our contracts for private line capacity with Global Crossing generally have terms of three to four years. In January and September 2009, we amended our agreement with Global Crossing to enhance the private line capacity for our backbone. The communications capacity we have leased may become unavailable for a variety of reasons, such as physical interruption, technical difficulties, contractual disputes, or the financial health of our third party provider. As it would be time consuming and expensive to identify and obtain alternative third party connectivity, we are dependent on Global Crossing in the near term. Financial failure of Global Crossing could jeopardize utilization of the service fees pre-paid by us under our agreement with Global Crossing. Additionally, as we grow, we anticipate requiring greater private line capacity than we currently have in place. If we are unable to obtain such capacity on terms commercially acceptable to us or at all, our business and financial results would suffer. We may not be able to deploy on a timely basis enough network capacity to meet the needs of our customer base or effectively manage demand for our services.
Our business depends on continued and unimpeded access to third party controlled end-user access networks.
Our content delivery services depend on our ability to access certain end-user access networks in order to complete the delivery of rich media and other online content to end-users. Some operators of these networks may take measures, such as the deployment of a variety of filters, that could degrade, disrupt or increase the cost of our or our customers’ access to certain of these end-user access networks by restricting or prohibiting the use of their networks to support or facilitate our services, or by charging increased fees to us, our customers or end-users in connection with our services. This or other types of interference could result in a loss of existing customers, increased costs and impairment of our ability to attract new customers, thereby harming our revenue and growth.
In addition, the performance of our infrastructure depends in part on the direct connection of our CDN to a large number of end-user access networks, known as peering, which we achieve through mutually beneficial cooperation with these networks. In some instances, network operators charge us for the peering connections. If, in the future, a significant percentage of these network operators elected to no longer peer with our CDN or peer with our CDN on less favorable economic terms, then the performance of our infrastructure could be diminished, our costs could increase and our business could suffer.
If our ability to deliver media files in popular proprietary content formats was restricted or became cost-prohibitive, demand for our content delivery services could decline, we could lose customers and our financial results could suffer.
Our business depends on our ability to deliver media content in all major formats. If our legal right or technical ability to store and deliver content in one or more popular proprietary content formats, such as Adobe
23
Table of Contents
Flash or Windows Media, was limited, our ability to serve our customers in these formats would be impaired and the demand for our CDN services would decline by customers using these formats. Owners of propriety content formats may be able to block, restrict or impose fees or other costs on our use of such formats, which could lead to additional expenses for us and for our customers, or which could prevent our delivery of this type of content altogether. Such interference could result in a loss of existing customers, increased costs and impairment of our ability to attract new customers, which would harm our revenue, operating results and growth.
As part of our business strategy, we may acquire businesses or technologies and may have difficulty integrating these operations.
We may seek to acquire businesses or technologies that are complementary to our business. For example, in May 2009, we acquired substantially all of the assets of Kiptronic Inc., a developer of mobility and monetization solutions for content publishers, in January 2010, we acquired chors GmbH, an on-line and direct marketing solutions provider located in Germany, in April 2010, we acquired EyeWonder, Inc., a provider of interactive digital advertising products and services to advertisers, and in July 2010, we acquired Delve Networks, Inc., a provider of online video solutions to manage, publish, measure and monetize high quality video content on the Internet. Acquisitions involve a number of risks to our business, including the difficulty of integrating the operations and personnel of the acquired companies, the potential disruption of our ongoing business, the potential distraction of management, the possibility that our business culture and the business culture of the acquired companies will not be compatible, the difficulty of incorporating acquired technology and rights into our operations, expenses related to the acquisition and to the integration of the acquired companies, the impairment of relationships with employees and customers as a result of any integration of new personnel, risks related to the businesses of acquired companies that may continue to impact the businesses following the merger and potential unknown liabilities associated with acquired companies. Any inability to integrate operations or personnel in an efficient and timely manner could harm our results of operations.
In order to realize the expected benefits and synergies of our recent merger with EyeWonder, we must meet a number of significant challenges, including:
| • | integrating the management teams, strategies, cultures, technologies and operations of the two businesses; |
| • | retaining and assimilating the key personnel of each company; |
| • | retaining existing customers; and |
| • | implementing and retaining uniform standards, controls, procedures, policies and information systems. |
Until the completion of the merger on April 30, 2010, we and EyeWonder had operated independently. It is possible that the integration process could result in the loss of the technical skills and management expertise of key employees, the disruption of each company’s ongoing businesses or inconsistencies in standards, controls, procedures and policies due to possible cultural conflicts or differences of opinions on technical decisions and services. A failure to integrate the two organizations successfully could adversely affect our ability to maintain relationships with customers, suppliers and employees or to achieve the anticipated benefits of the merger. Even if we are able to integrate the EyeWonder business operations successfully, this integration may not result in the realization of the full benefits of synergies, cost savings, innovation and operational efficiencies that may be possible from this integration, and these benefits may not be achieved within a reasonable period of time.
We have little prior experience as a company in this complex process of acquiring and integrating businesses. If we are not successful in completing acquisitions that we may pursue in the future, we may be required to reevaluate our business strategy, and we may incur substantial expenses and devote significant management time and resources without a productive result. In addition, future acquisitions will require the use of our available cash or dilutive issuances of securities. Future acquisitions or attempted acquisitions could also harm our ability to achieve profitability. We may also experience significant turnover from the acquired operations or from our current operations as we integrate businesses.
24
Table of Contents
If we are unable to retain our key employees and hire qualified sales and technical personnel, our ability to compete could be harmed.
Our future success depends upon the continued services of our executive officers and other key technology, sales, marketing and support personnel who have critical industry experience and relationships that they rely on in implementing our business plan. In particular, we are dependent on the services of our Chief Executive Officer, Jeffrey W. Lunsford and also our Chief Technical Officer, Nathan F. Raciborski. Neither of these officers nor any of our other key employees is bound by an employment agreement for any specific term. There is increasing competition for talented individuals with the specialized knowledge to deliver CDN services and this competition affects both our ability to retain key employees and hire new ones. The loss of the services of any of our key employees could disrupt our operations, delay the development and introduction of our services, and negatively impact our ability to sell our services.
We face risks associated with international operations that could harm our business.
We have operations in numerous foreign countries and may continue to expand our sales and support organizations internationally. As part of our growth strategy, we intend to expand our sales and support organizations internationally, as well as to further expand our international network infrastructure. We have limited experience in providing our services internationally and such expansion could require us to make significant expenditures, including the hiring of local employees, in advance of generating any revenue. As a consequence, we may fail to achieve profitable operations that will compensate our investment in international locations. In addition, expansion into international markets is important to the long-term success of our EyeWonder business, which has only limited experience with operations outside the United States. We are subject to a number of risks associated with international business activities that may increase our costs, lengthen our sales cycle and require significant management attention.
These risks include:
| • | increased expenses associated with sales and marketing, deploying services and maintaining our infrastructure in foreign countries; |
| • | competition from local content delivery service providers, many of which are very well positioned within their local markets; |
| • | challenges caused by distance, language and cultural differences; |
| • | unexpected changes in regulatory requirements preventing us from operating our CDN or resulting in unanticipated costs and delays; |
| • | interpretations of laws or regulations that would subject us to regulatory supervision or, in the alternative, require us to exit a country, which could have a negative impact on the quality of our services or our results of operations; |
| • | longer accounts receivable payment cycles and difficulties in collecting accounts receivable; |
| • | corporate and personal liability for violations of local laws and regulations; |
| • | currency exchange rate fluctuations; |
| • | potentially adverse tax consequences; |
| • | credit risk and higher levels of payment fraud; and |
| • | foreign exchange controls that might prevent us from repatriating cash earned in countries outside the United States. |
25
Table of Contents
Internet-related and other laws relating to taxation issues, privacy and consumer protection and liability for content distributed over our network, could harm our business.
Laws and regulations that apply to communications and commerce conducted over the Internet are becoming more prevalent, both in the United States and internationally, and may impose additional burdens on companies conducting business online or providing Internet-related services such as ours. Increased regulation could negatively affect our business directly, as well as the businesses of our customers, which could reduce their demand for our services. For example, tax authorities abroad may impose taxes on the Internet-related revenue we generate based on where our internationally deployed servers are located. In addition, domestic and international taxation laws are subject to change. Our services, or the businesses of our customers, may become subject to increased taxation, which could harm our financial results either directly or by forcing our customers to scale back their operations and use of our services in order to maintain their operations. In addition, the laws relating to the liability of private network operators for information carried on or disseminated through their networks are unsettled, both in the United States and abroad. Network operators have been sued in the past, sometimes successfully, based on the content of material disseminated through their networks. We may become subject to legal claims such as defamation, invasion of privacy and copyright infringement in connection with content stored on or distributed through our network. In addition, our reputation could suffer as a result of our perceived association with the type of content that some of our customers deliver. If we need to take costly measures to reduce our exposure to these risks, or are required to defend ourselves against such claims, our financial results could be negatively affected.
Several other federal laws also could expose us to liability and impose significant additional costs on us. For example, the Digital Millennium Copyright Act has provisions that limit, but do not eliminate, our liability for the delivery of customer content that infringe copyrights or other rights, so long as we comply with the statutory requirements of the Act. In addition, the Children’s Online Privacy Protection Act restricts the ability of online services to collect information from minors and the Protection of Children from Sexual Predators Act of 1998 requires online service providers to report evidence of violations of federal child pornography laws under certain circumstances. Compliance with these laws and regulations is complex and any failure on our part to comply with these regulations may subject us to additional liabilities.
Privacy concerns could lead to legislative and other limitations on our ability to collect usage data from Internet users, including limitations on our use of cookie or conversion tag technology and user profiling, which is crucial to our ability to provide services to our customers.
Our ability to conduct targeted advertising campaigns and compile data that we use to formulate campaign strategies for customers depends on the use of “cookies” and “conversion tags” to track Internet users and their online behavior, which allows us to measure an advertising campaign’s effectiveness and avoid repeatedly delivering the same ad to a particular user’s device. A cookie is a small file of information stored on a user’s computer that allows us to recognize that user’s browser when it serves advertisements. A conversion tag functions similarly to a banner advertisement, except that the conversion tag is not visible. Our conversion tags may be placed on specific pages of clients of customers’ or prospective customers’ websites. Government authorities inside the United States concerned with the privacy of Internet users have suggested limiting or eliminating the use of cookies, conversion tags or user profiling. Bills aimed at regulating the collection and use of personal data from Internet users are currently pending in U.S. Congress and many state legislatures. Attempts at such regulation may be drafted in such a way as to limit or prohibit the use of technology like cookies and conversion tags, thereby creating restrictions that could reduce our ability to use them. In addition, the Federal Trade Commission and the Department of Commerce have conducted hearings regarding user profiling, the collection of non-personally identifiable information and online privacy.
Our foreign operations may also be adversely affected by regulatory action outside the United States. For example, the European Union has adopted a directive addressing data privacy that limits the collection, disclosure and use of information regarding European Internet users. In addition, the European Union has enacted an electronic communications directive that imposes certain restrictions on the use of cookies and conversion
26
Table of Contents
tags and also places restrictions on the sending of unsolicited communications. Each European Union member country was required to enact legislation to comply with the provisions of the electronic communications directive by October 31, 2003 (though not all have done so). Germany has also enacted additional laws limiting the use of user profiling, and other countries, both in and out of the European Union, may impose similar limitations.
Internet users may directly limit or eliminate the placement of cookies on their computers by using third-party software that blocks cookies, or by disabling or restricting the cookie functions of their Internet browser software. Internet browser software upgrades also may result in limitations on the use of cookies or conversion tags. Technologies like the Platform for Privacy Preferences (P3P) Project may limit collection of cookie and conversion tag information. Plaintiffs’ attorneys also have organized class action suits against companies related to the use of cookies and several companies, including companies in the Internet advertising industry, have had claims brought against them before the Federal Trade Commission regarding the collection and use of Internet user information. We may be subject to such suits in the future, which could limit or eliminate our ability to collect such information. If our ability to use cookies or conversion tags or engage in other user profiling were substantially restricted due to the foregoing, or for any other reason, we would have to generate and use other technology or methods that allow the gathering of user profile data in order to provide services to customers. This change in technology or methods could require significant reengineering time and resources, and may not be complete in time to avoid negative consequences to our business. In addition, alternative technology or methods might not be available on commercially reasonable terms, if at all. If the use of cookies and conversion tags are prohibited and we are not able to efficiently and cost effectively create new technology, our business, financial condition and results of operations would be materially adversely affected. In addition, any compromise of security that results in the release of Internet users’ and/or our customers’ data could seriously limit the adoption of our service offerings as well as harm our reputation and brand, expose us to liability and subject us to reporting obligations under various state laws, which could have an adverse effect on our business. The risk that these types of events could seriously harm our business is likely to increase as the amount of data stored for customers on our servers (including personal information) and the number of countries where we operate has been increasing, and we may need to expend significant resources to protect against security breaches, which could have an adverse effect on our business, financial condition or results of operations.
If we are required to seek funding, such funding may not be available on acceptable terms or at all.
We may need to obtain funding due to a number of factors beyond our control, including a shortfall in revenue, increased expenses, final adverse judgments in litigation matters, increased investment in capital equipment or the acquisition of significant businesses or technologies. We believe that our cash, cash equivalents and marketable securities classified as current plus cash from operations will be sufficient to fund our operations and proposed capital expenditures for at least the next 12 months. However, we may need or desire funding before such time. If we do need to obtain funding, it may not be available on commercially reasonable terms or at all. If we are unable to obtain sufficient funding, our business would be harmed. Even if we were able to find outside funding sources, we might be required to issue securities in a transaction that could be highly dilutive to our investors or we may be required to issue securities with greater rights than the securities we have outstanding today. We might also be required to take other actions that could lessen the value of our common stock, including borrowing money on terms that are not favorable to us. If we are unable to generate or raise capital that is sufficient to fund our operations, we may be required to curtail operations, reduce our capabilities or cease operations in certain jurisdictions or completely.
Our business requires the continued development of effective business support systems to support our customer growth and related services.
The growth of our business depends on our ability to continue to develop effective business support systems. This is a complicated undertaking requiring significant resources and expertise. Business support systems are needed for:
| • | implementing customer orders for services; |
27
Table of Contents
| • | delivering these services; and |
| • | timely billing for these services. |
Because our business plan provides for continued growth in the number of customers that we serve and services offered, there is a need to continue to develop our business support systems on a schedule sufficient to meet proposed service rollout dates. The failure to continue to develop effective business support systems could harm our ability to implement our business plans and meet our financial goals and objectives.
Changes in financial accounting standards or practices may cause adverse, unexpected financial reporting fluctuations and affect our reported results of operations.
A change in accounting standards or practices can have a significant effect on our operating results and may affect our reporting of transactions completed before the change is effective. New accounting pronouncements and varying interpretations of existing accounting pronouncements have occurred and may occur in the future. Changes to existing rules or the questioning of current practices may adversely affect our reported financial results or the way we conduct our business. For example, our adoption of ASC 718 (formerly FAS 123R) in 2006 increased the amount of stock-based compensation expense we recorded. This, in turn, has impacted our results of operations for the periods since this adoption and has made it more difficult to evaluate our recent financial results relative to prior periods.
We have incurred, and will continue to incur significantly increased costs as a result of operating as a public company, and our management is required to devote substantial time to compliance initiatives.
As a public company, we have incurred, and will continue to incur, significant accounting and other expenses that we did not incur as a private company. These expenses include increased accounting, legal and other professional fees, insurance premiums, investor relations costs, and costs associated with compensating our independent directors. In addition, the Frank-Dodd Act and the Sarbanes-Oxley Act of 2002, as well as rules subsequently implemented by the SEC and the Nasdaq Global Select Market, imposes additional requirements on public companies, including requiring changes in corporate governance practices. For example, the listing requirements of the Nasdaq Global Select Market require that we satisfy certain corporate governance requirements relating to independent directors, audit committees, distribution of annual and interim reports, stockholder meetings, stockholder approvals, solicitation of proxies, conflicts of interest, stockholder voting rights and codes of conduct. Our management and other personnel need to devote a substantial amount of time to these compliance initiatives. Moreover, these rules and regulations have increased our legal and financial compliance costs and make some activities more time-consuming and costly. For example, these rules and regulations make it more difficult and more expensive for us to obtain director and officer liability insurance. These rules and regulations could also make it more difficult for us to identify and retain qualified persons to serve on our board of directors, our board committees or as executive officers.
Failure to effectively expand our sales and marketing capabilities could harm our ability to increase our customer base and achieve broader market acceptance of our services.
Increasing our customer base and achieving broader market acceptance of our services will depend to a significant extent on our ability to expand our sales and marketing operations. Historically, we have concentrated our sales force at our headquarters in Tempe, Arizona. However, we are also building a field sales force to augment our sales efforts and to bring our sales personnel closer to our current and potential customers. Developing such a field sales force has been and will continue to be expensive and we have limited knowledge in developing and operating a widely dispersed sales force. As a result, we may not be successful in developing an effective sales force, which could cause our results of operations to suffer.
We believe that there is significant competition for both inside and direct sales personnel with the sales skills and technical knowledge that we require. Our ability to achieve significant growth in revenue in the future
28
Table of Contents
will depend, in large part, on our success in recruiting, training and retaining sufficient numbers of inside and direct sales personnel. We have expanded our sales and marketing personnel from a total of 13 at December 31, 2004 to 140 at December 31, 2009, to 226 at December 31, 2010. New hires require significant training and, in most cases, take a significant period of time before they achieve full productivity. Our recent hires and planned hires may not become as productive as we would like, and we may be unable to hire or retain sufficient numbers of qualified individuals in the future in the markets where we do business. Our business will be seriously harmed if these expansion efforts do not generate a corresponding significant increase in revenue.
If the accounting estimates we make, and the assumptions on which we rely, in preparing our financial statements prove inaccurate, our actual results may be adversely affected.
Our financial statements have been prepared in accordance with accounting principles generally accepted in the United States. The preparation of these financial statements requires us to make estimates and judgments about, among other things, taxes, revenue recognition, share-based compensation costs, contingent obligations and doubtful accounts. These estimates and judgments affect the reported amounts of our assets, liabilities, revenue and expenses, the amounts of charges accrued by us, and related disclosure of contingent assets and liabilities. We base our estimates on historical experience and on various other assumptions that we believe to be reasonable under the circumstances and at the time they are made. If our estimates or the assumptions underlying them are not correct, we may need to accrue additional charges or reduce the value of assets that could adversely affect our results of operations, investors may lose confidence in our ability to manage our business and our stock price could decline.
Risks Related to Ownership of Our Common Stock
Our limited operating history makes evaluating our business and future prospects difficult, and may increase the risk of your investment.
Our Company has only been in existence since 2001. A significant amount of our growth, in terms of employees, operations and revenue, has occurred. For example, our revenue has grown from $5.0 million in 2003 to $65.2 million in 2006 to $183.3 million in 2010. As a consequence, we have a limited operating history which makes it difficult to evaluate our business and our future prospects. We have encountered, and will continue to encounter, risks and difficulties frequently experienced by growing companies in rapidly changing industries, such as the risks described in this report on Form 10-K. If we do not address these risks successfully, our business will be harmed.
The trading price of our common stock has been, and is likely to continue to be, volatile.
The trading prices of our common stock and the securities of technology companies generally have been highly volatile. Factors affecting the trading price of our common stock will include:
| • | variations in our operating results; |
| • | announcements of technological innovations, new services or service enhancements, strategic alliances or significant agreements by us or by our competitors; |
| • | commencement or resolution of, our involvement in and uncertainties arising from, litigation, particularly our current litigation with Akamai and MIT, and our Securities Litigation matter; |
| • | recruitment or departure of key personnel; |
| • | changes in the estimates of our operating results or changes in recommendations by any securities analysts that elect to follow our common stock; |
| • | developments or disputes concerning our intellectual property or other proprietary rights; |
| • | the gain or loss of significant customers; |
29
Table of Contents
| • | market conditions in our industry, the industries of our customers and the economy as a whole; and |
| • | adoption or modification of regulations, policies, procedures or programs applicable to our business. |
In addition, if the market for technology stocks or the stock market in general experiences loss of investor confidence, the trading price of our common stock could decline for reasons unrelated to our business, operating results or financial condition. The trading price of our common stock might also decline in reaction to events that affect other companies in our industry even if these events do not directly affect us.
If securities or industry analysts do not publish research or reports about our business or if they issue an adverse or misleading opinion or report, our stock, our stock price and trading volume could decline.
The trading market for our common stock will be influenced by the research and reports that industry or securities analysts publish about us or our business. If any of the analysts who cover us issue an adverse or misleading opinion regarding our stock, our stock price would likely decline. If one or more of these analysts cease coverage of our company or fail to publish reports on us regularly, we could lose visibility in the financial markets, which in turn could cause our stock price or trading volume to decline.
Insiders have substantial control over us and will be able to influence corporate matters.
As of March 9, 2011, our directors and executive officers and their affiliates beneficially owned, in the aggregate, approximately 39% of our outstanding common stock, including approximately 27% beneficially owned by investment entities affiliated with Goldman, Sachs & Co. These stockholders are able to exercise significant influence over all matters requiring stockholder approval, including the election of directors and approval of significant corporate transactions, such as a merger or other sale of our company or its assets. This concentration of ownership could limit other stockholders’ ability to influence corporate matters and may have the effect of delaying or preventing a third party from acquiring control over us.
Future equity issuances or a sale of a substantial number of shares of our common stock may cause the price of our common stock to decline.
Because we may need to raise additional capital in the future to continue to expand our business and our research and development activities, among other things, we may conduct additional equity offerings. If we or our stockholders sell substantial amounts of our common stock (including shares issued upon the exercise of options and warrants) in the public market, the market price of our common stock could fall. A decline in the market price of our common stock could make it more difficult for us to sell equity or equity-related securities in the future at a time and price that we deem appropriate.
Management has broad discretion as to the use of the proceeds from our recently completed underwritten public offering of our common stock, and we may not use the proceeds effectively.
Our management has broad discretion in the application of the net proceeds from the recently completed underwritten public offering of our common stock and could spend the proceeds in ways that do not improve our results of operations or enhance the value of our common stock. Our failure to apply these funds effectively could have a material adverse effect on our business, delay the development of our product candidates and cause the price of our common stock to decline.
30
Table of Contents
Anti-takeover provisions in our charter documents and Delaware law could discourage, delay or prevent a change in control of our company and may affect the trading price of our common stock.
Provisions of our amended and restated certificate of incorporation and bylaws, as well as provisions of Delaware law, could make it more difficult for a third party to acquire us, even if doing so would benefit our stockholders. These provisions:
| • | establish that members of the board of directors may be removed only for cause upon the affirmative vote of stockholders owning a majority of our capital stock; |
| • | authorize the issuance of “blank check” preferred stock that could be issued by our board of directors to increase the number of outstanding shares and thwart a takeover attempt; |
| • | limit who may call special meetings of stockholders; |
| • | prohibit stockholder action by written consent, thereby requiring stockholder actions to be taken at a meeting of the stockholders; |
| • | establish advance notice requirements for nominations for election to the board of directors or for proposing matters that can be acted upon at stockholder meetings; |
| • | provide for a board of directors with staggered terms; and |
| • | provide that the authorized number of directors may be changed only by a resolution of our board of directors. |
In addition, Section 203 of the Delaware General Corporation Law, which imposes certain restrictions relating to transactions with major stockholders, may discourage, delay or prevent a third party from acquiring us.
| Item 1B. | Unresolved Staff Comments |
None.
| Item 2. | Properties |
Our headquarters are located in three buildings with approximately 7,529, 13,341 and 10,696 square feet respectively, of leased office space in Tempe, Arizona. We also lease approximately 8,224 square feet of space for a data center in Phoenix, Arizona. We lease offices in several other locations in the United States, including in or near Atlanta Georgia, Chicago, Illinois, Dallas, Texas, Los Angeles, San Diego, San Francisco and San Jose, California, New York, New York, Seattle, Washington and Washington DC. We also lease offices in Europe and Asia in or near the following cities: Amsterdam, The Netherlands, Cologne, Hamburg and Woeilfersheim, Germany, Dublin, Ireland, London, England, Madrid, Spain, Paris, France Stockholm, Sweden, Sydney, Australia, and Tokyo, Japan. In July 2010, we entered into a lease agreement for approximately 64,000 square feet of office space located at 222 South Mill Avenue, Tempe, Arizona 85281. The premises will serve as the Company’s new global corporate headquarters. The estimated commencement date of the lease term is March 15, 2011 and continues through the last day of the month in which the eighth (8th) anniversary of the commencement date occurs. The Company has one option to extend the term for an additional five (5) years, at then-current market rates. In addition, the Company will rent parking spaces from the adjacent parking structure. We believe our facilities are sufficient to meet our needs for the foreseeable future and, if needed, additional space will be available at a reasonable cost.
| Item 3. | Legal Proceedings |
We are involved in litigation with Akamai Technologies, Inc. and the Massachusetts Institute of Technology relating to a claim of patent infringement. The action was filed in June 2006 in the United States District Court
31
Table of Contents
for the District of Massachusetts. The trial date was set for February 2008 with respect to four claims in United States Patent No. 6,108,703 (the ‘703 patent). In February 2008, a jury returned a verdict in this lawsuit, finding that we infringed four claims of the ‘703 patent at issue and rejecting our invalidity defenses. The jury awarded an aggregate of approximately $45.5 million which includes lost profits, reasonable royalties and price erosion damages for the period April 2005 through December 31, 2007. In addition, the jury awarded pre-judgment interest which we estimated to be $2.6 million at December 31, 2007. We recorded the aggregate $48.1 million as a provision for litigation as of December 31, 2007. During 2008, we recorded an additional provision of approximately $17.5 million for potential additional infringement damages and interest. On July 1, 2008, the court denied our Motions for Judgment as a Matter of Law (JMOL), Obviousness, and a New Trial. The court also denied Akamai’s Motion for Permanent Injunction as premature and denied its Motions for Summary Judgment regarding our equitable defenses. The court conducted a bench trial in November 2008 regarding our equitable defenses. We also filed a motion for reconsideration of the court’s earlier denial of our motion for JMOL. Our motion for reconsideration of JMOL was based largely upon a clarification in the standard for a finding of joint infringement articulated by the Federal Circuit in the case of Muniauction, Inc. v. Thomson Corp. (the Muniauction Case), released after the court denied our initial motion for JMOL. On April 24, 2009 the court issued its order and memorandum setting aside the adverse jury verdict and ruling that we did not infringe Akamai’s ‘703 patent and that we are entitled to judgment as a matter of law. Based upon the court’s April 24, 2009 order we have reversed the $65.6 million provision for litigation previously recorded for this lawsuit as we no longer believe that payment of any amounts represented by the litigation provision is probable. The court entered final judgment in favor of us. Akamai filed a notice of appeal of the court’s decision on May 26, 2009. The Court of Appeals for the Federal Circuit heard arguments by both parties on June 7, 2010. On December 20, 2010 the Court of Appeals for the Federal Circuit issued its opinion affirming the District Court’s entry of judgment in our favor. On February 18, 2011, Akamai filed a motion with the Court of Appeals for the Federal Circuit seeking a rehearing and rehearing en banc. We believe that we do not infringe Akamai’s patents and will continue to vigorously defend our position. In light of the favorable ruling from the Court of Appeals we do not believe that a loss is probable. Therefore, we have made no provision for this lawsuit in our financial statements.
In December 2007, Level 3 Communications, LLC (Level 3) filed a lawsuit against us in the United States District Court for the Eastern District of Virginia alleging that we were infringing certain patents Level 3 acquired from Savvis Communications Corp. In addition to monetary relief, including treble damages, interest, fees and costs, the complaint sought an order permanently enjoining us from conducting our business in a manner that infringed the relevant patents. A jury trial was conducted in January 2009, and on January 23, 2009 the jury returned a verdict favorable to us finding that we did not infringe the Level 3 patents. The court denied Level 3’s subsequent motion for judgment as a matter of law or alternatively for a new trial, and entered a judgment in our favor. Level 3 filed a notice of appeal on July 21, 2009. On May 3, 2010 the United States Court of Appeals for the Federal Circuit heard oral argument on this matter, and on May 5, 2010 the court affirmed the District Court judgment in our favor. Level 3 subsequently filed a motion for rehearing and rehearing en banc that the Court subsequently denied. In light of the favorable ruling from the Court of Appeals we consider this matter successfully concluded, and accordingly we do not believe that a loss is probable. Therefore, we have made no provision for this lawsuit in our financial statements.
In August 2007, we, certain of our officers and directors, and the firms that served as the lead underwriters in our initial public offering were named as defendants in several purported class action lawsuits. These lawsuits have been consolidated into a single lawsuit in United States District Court for the District of Arizona. The consolidated complaint asserts causes of action under Sections 11, 12 and 15 of the Securities Act of 1933, as amended, on behalf of a professed class consisting of all those who were allegedly damaged as a result of acquiring our common stock in our initial public offering (IPO) between June 8, 2007 and August 8, 2007. The complaint seeks compensatory damages and plaintiffs’ costs and expenses in the litigation. The complaint alleges, among other things, that we omitted and/or misstated certain facts concerning the seasonality of our business and that the loss of revenue with respect to certain customers. On March 17, 2008, we and the individual defendants moved to dismiss all of the plaintiffs’ claims, and a hearing was held on this motion on June 16, 2008. On August 8, 2008, the court granted the motion to dismiss, dismissing plaintiffs’ claims under Section 12 with
32
Table of Contents
prejudice and granting leave to amend the claims under Sections 11 and 15. Plaintiffs chose not to amend the claims under Sections 11 and 15, and on August 29, 2008 the court entered judgment in favor of us. On September 5, 2008, plaintiffs filed a notice of appeal, and appellate briefs were filed by the parties in January and February 2009. We believe that we and the individual defendants have meritorious defenses to the claims made in the complaint and we intend to continue to contest the lawsuit vigorously. We do have in place directors and officers liability insurance and notice of this matter has been given to the insurance carriers. The insurance has reimbursed certain of the expenses incurred by us in defending this action. In November 2009 the parties entered into a Memorandum of Understanding to settle this lawsuit for an amount well within the coverage limits of the primary carrier of our directors and officers liability insurance, and on July 7, 2010 the parties entered into a settlement agreement consistent with the terms of the Memorandum of Understanding, which will require court approval. A hearing before the Federal District Court is currently scheduled for March 22, 2011. We anticipate court approval of the settlement. We do not believe that a loss is probable. Therefore, we have made no provision for this lawsuit in our financial statements.
From time to time, we also may become involved in legal proceedings arising in the ordinary course of our business.
| Item 4. | Reserved |
This item is not applicable.
33
Table of Contents
PART II
| Item 5. | Market for Registrant’s Common Equity, Related Stockholder Matters and Issuer Purchases of Equity Securities |
Market Information
Our common stock, par value $0.001 per share, trades on The Nasdaq Global Select Market under the symbol “LLNW”.
The following table sets forth, for the periods indicated, the high and low sale price per share of the common stock on The Nasdaq Global Select Market:
| High | Low | |||||||
| 2009: |
||||||||
| First Quarter |
$ | 3.72 | $ | 2.05 | ||||
| Second Quarter |
$ | 5.78 | $ | 3.21 | ||||
| Third Quarter |
$ | 4.90 | $ | 3.17 | ||||
| Fourth Quarter |
$ | 4.05 | $ | 3.22 | ||||
| 2010: |
||||||||
| First Quarter |
$ | 4.09 | $ | 3.25 | ||||
| Second Quarter |
$ | 4.51 | $ | 3.61 | ||||
| Third Quarter |
$ | 6.35 | $ | 3.57 | ||||
| Fourth Quarter |
$ | 8.97 | $ | 5.58 | ||||
Holders
As of March 9, 2011, there were 180 holders of record of our common stock.
Dividends
We have never paid or declared any cash dividends on shares of our common stock or other securities and do not anticipate paying any cash dividends in the foreseeable future. We currently intend to retain all future earnings, if any, for use in the operation of our business. We did not repurchase any equity securities in 2010.
Use of Proceeds from Public Offerings of Common Stock
On June 7, 2007, our registration statement on Form S-1 (No. 333-141516) was declared effective in connection with our initial public offering. The offering closed on June 13, 2007, and, as a result, we received net proceeds of approximately $203.9 million after underwriters’ discounts and commissions of approximately $15.6 million and additional offering-related costs of approximately $4.0 million.
In June 2007, we used $23.8 million of the net proceeds to repay the outstanding balance of our credit facility with Silicon Valley Bank. We expect to use the remaining net proceeds for acquisitions of companies complementary to our core CDN business, capital expenditures, working capital and other general corporate purposes. For the year ended December 31, 2010, we made capital expenditures of $34.2 million and expect aggregate capital expenditures of approximately 15% of total revenue in 2011. We may also use a portion of our net proceeds to fund acquisitions of complementary businesses, products or technologies. In July 2010, we acquired Delve Networks, Inc. for which we used approximately $2.6 million, net of cash acquired, and could use an additional $1.2 million if certain financial targets are achieved. On April 30, 2010 we acquired EyeWonder, Inc. for which we used approximately $62.0 million, net of cash acquired, and in January 2010 we acquired chors GmbH, for which we used approximately $2.0 million, net of cash acquired, and will use an
34
Table of Contents
additional $0.3 million for the achievement of specific financial targets during 2010. During 2011 pending the uses described above, we intend to invest the net proceeds in a variety of short-term, interest-bearing, investment grade securities. Depending upon the final outcome of pending litigation a portion of the net proceeds may be used to satisfy a final damages judgment, if any.
On March 2, 2011 we completed an underwritten public offering of our common stock in which we sold and issued 11,500,000 shares of our common stock, including 1,500,000 shares subject to the underwriters’ over-allotment option, at a price to the public of $7.10 per share. The newly issued common shares began trading on the Nasdaq Global Select Market on March 2, 2011. We raised a total of approximately $81.7 million in gross proceeds from the offering, or approximately $77.3 million in net proceeds after deducting underwriting discounts and commissions of approximately $3.9 million and other offering costs of approximately $0.5 million. The offering was made pursuant to the effective registration statement on Form S-3 (Registration Statement No. 333-170609) previously filed with and declared effective by the Securities and Exchange Commission on November 26, 2010 and the prospectus supplement thereunder filed with the Securities and Exchange Commission on February 28, 2011.
STOCK PERFORMANCE GRAPH
The graph set forth below compares the cumulative total stockholder return on our common stock between June 8, 2007 (the date our common stock began trading on Nasdaq) and December 31, 2010, with the cumulative total return of (i) the Nasdaq Composite Index and (ii) the S&P Information Technology Sector Index, over the same period. This graph assumes the investment of $100 on June 8, 2007 in our common stock, the Nasdaq Composite Index and the S&P Information Technology Sector Index, and assumes the reinvestment of dividends, if any. The graph assumes the initial value of our common stock on June 8, 2007 was the closing sales price of $22.18 per share.
The comparisons shown in the graph below are based upon historical data. We caution that the stock price performance shown in the graph below is not necessarily indicative of, nor is it intended to forecast, the potential future performance of our common stock.
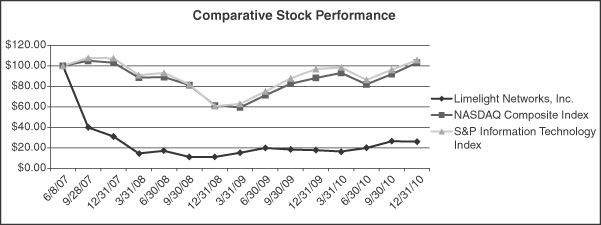
This graph assumes an investment on June 8, 2007 of $100 in our common stock (based on the closing sale price of our common stock), and in each of such indices (including the reinvestment of all dividends). Measurement points are to the last trading day for each respective period. The performance shown is not necessarily indicative of future performance.
35
Table of Contents
| Item 6. | Selected Financial Data |
The following selected consolidated financial data should be read in conjunction with our consolidated financial statements and related notes and with “Management Discussion and Analysis of Financial Condition and Results of Operations” and other financial data included elsewhere in this Annual Report on Form 10-K.
In May 2009, we acquired substantially all of the assets of Kiptronic Inc. (Kiptronic) for approximately $1.0 million. The aggregate purchase price consisted of 213,334 shares of our common stock. Our consolidated financial statements include the results of operations of Kiptronic from the date of acquisition. The historical results of operations of Kiptronic were not significant to our consolidated results of operations for the periods presented. The total purchase consideration was allocated to the assets acquired and liabilities assumed at their estimated fair values as of the date of acquisition. Net income (loss) for each of the years ended December 31, 2010 and 2009, respectively, included approximately $0.1 million for the amortization of other intangible assets related to this acquisition.
In January 2010, we acquired chors GmbH (chors) for a purchase price of approximately $5.9 million. The purchase price was comprised of both cash and shares of our common stock. Our consolidated financial statements include the results of operations of chors from the date of acquisition. The historical results of operations of chors were not significant to our consolidated results of operations for the periods presented. The total purchase consideration was allocated to the assets acquired and liabilities assumed at their estimated fair values as of the date of acquisition. Net loss for the year ended December 31, 2010 included approximately $0.8 million for the amortization of other intangible assets related to this acquisition.
In April 2010, we acquired EyeWonder, Inc. (EyeWonder) for a purchase price of approximately $114.0 million. The purchase price was comprised of both cash and shares of our common stock. Our consolidated financial statements include the results of operations of EyeWonder from the date of acquisition. The total purchase consideration was allocated to the assets acquired and liabilities assumed at their estimated fair values as of the date of acquisition. Net loss for the year ended December 31, 2010 included approximately $2.8 million for the amortization of other intangible assets related to this acquisition.
36
Table of Contents
In July 2010, we acquired Delve Networks, Inc. (Delve) for a purchase price of approximately $4.1 million. The purchase price was comprised of both cash and shares of our common stock. Our consolidated financial statements include the results of operations of Delve from the date of acquisition. The historical results of operations of Delve were not significant to our consolidated results of operations for the periods presented. The preliminary total purchase consideration was allocated to the assets acquired and liabilities assumed at their estimated fair values as of the date of acquisition. Net loss for the year ended December 31, 2010 included approximately $0.2 million for the amortization of other intangible assets related to this acquisition.
| Limelight Networks, Inc. | ||||||||||||||||||||
| Year Ended December 31, | ||||||||||||||||||||
| 2010 | 2009 | 2008 | 2007 | 2006 | ||||||||||||||||
| In thousands, except per share amounts | ||||||||||||||||||||
| Consolidated Statement of Operations Data: |
||||||||||||||||||||
| Revenue |
$ | 183,327 | $ | 131,663 | $ | 129,530 | $ | 103,111 | $ | 65,243 | ||||||||||
| Cost of revenue: |
||||||||||||||||||||
| Cost of services (1) |
80,352 | 61,572 | 58,186 | 44,802 | 25,662 | |||||||||||||||
| Depreciation — network |
22,367 | 24,051 | 25,675 | 20,739 | 10,316 | |||||||||||||||
| Total cost of revenue |
102,719 | 85,623 | 83,861 | 65,541 | 35,978 | |||||||||||||||
| Gross margin |
80,608 | 46,040 | 45,669 | 37,570 | 29,265 | |||||||||||||||
| Operating expenses: |
||||||||||||||||||||
| General and administrative (1) |
35,760 | 34,128 | 52,440 | 31,827 | 18,388 | |||||||||||||||
| Sales and marketing (1) |
46,752 | 32,587 | 34,916 | 25,462 | 6,841 | |||||||||||||||
| Research and development (1) |
15,755 | 7,937 | 7,365 | 5,504 | 3,151 | |||||||||||||||
| Depreciation and amortization |
6,359 | 2,351 | 1,356 | 857 | 226 | |||||||||||||||
| Provision for litigation (2) |
— | (65,645 | ) | 17,515 | 48,130 | — | ||||||||||||||
| Total operating expenses |
104,626 | 11,358 | 113,592 | 111,780 | 28,606 | |||||||||||||||
| Operating (loss) income |
(24,018 | ) | 34,682 | (67,923 | ) | (74,210 | ) | 659 | ||||||||||||
| Other income (expense): |
||||||||||||||||||||
| Interest expense |
(77 | ) | (39 | ) | (55 | ) | (1,418 | ) | (1,828 | ) | ||||||||||
| Interest income |
914 | 1,345 | 5,098 | 5,153 | 208 | |||||||||||||||
| Other (expense) income |
(222 | ) | (14 | ) | (171 | ) | (144 | ) | 175 | |||||||||||
| Total other income (expense) |
615 | 1,292 | 4,872 | 3,591 | (1,445 | ) | ||||||||||||||
| (Loss) income before income taxes |
(23,403 | ) | 35,974 | (63,051 | ) | (70,619 | ) | (786 | ) | |||||||||||
| Income tax (benefit) expense |
(3,052 | ) | 1,084 | 16 | 2,401 | 2,591 | ||||||||||||||
| Net (loss) income |
$ | (20,351 | ) | $ | 34,890 | $ | (63,067 | ) | $ | (73,020 | ) | $ | (3,377 | ) | ||||||
| Net (loss) income per weighted average share: |
||||||||||||||||||||
| Basic |
$ | (0.22 | ) | $ | 0.41 | $ | (0.76 | ) | $ | (1.26 | ) | $ | (0.13 | ) | ||||||
| Diluted |
$ | (0.22 | ) | $ | 0.40 | $ | (0.76 | ) | $ | (1.26 | ) | $ | (0.13 | ) | ||||||
| Shares used in per share weighted average share calculation: |
||||||||||||||||||||
| Basic |
94,300 | 84,202 | 82,932 | 57,982 | 25,059 | |||||||||||||||
| Diluted |
94,300 | 87,972 | 82,932 | 57,982 | 25,059 | |||||||||||||||
37
Table of Contents
| (1) | Includes share-based compensation as follows: |
| Limelight Networks, Inc. | ||||||||||||||||||||
| Year Ended December 31, | ||||||||||||||||||||
| 2010 | 2009 | 2008 | 2007 | 2006 | ||||||||||||||||
| (In thousands) | ||||||||||||||||||||
| Cost of revenue |
$ | 2,441 | $ | 2,414 | $ | 2,243 | $ | 1,489 | $ | 459 | ||||||||||
| General and administrative |
6,881 | 7,556 | 8,060 | 10,653 | 6,794 | |||||||||||||||
| Sales and marketing |
5,023 | 4,970 | 5,400 | 3,948 | 334 | |||||||||||||||
| Research and development |
3,056 | 2,523 | 2,355 | 2,820 | 1,661 | |||||||||||||||
| Total |
$ | 17,401 | $ | 17,463 | $ | 18,058 | $ | 18,910 | $ | 9,248 | ||||||||||
| (2) | In February 2008, a jury returned a verdict in a patent infringement lawsuit filed by Akamai Technologies, Inc., or Akamai, and the Massachusetts Institute of Technology, or MIT, against us, finding that we infringed four claims of the patent at issue and rejecting our invalidity defenses. The jury awarded Akamai an aggregate of approximately $45.5 million in lost profits, reasonable royalties and price erosion damages, plus pre-judgment interest estimated to be $2.6 million. During 2008, we recorded an additional potential damage liability relating to this infringement of $15.5 million, plus additional interest of $2.0 million. The total provision for litigation at December 31, 2008 was $65.6 million. We also filed a motion for reconsideration of the court’s earlier denial of our motion for JMOL. Our motion for reconsideration of JMOL was based largely upon a clarification in the standard for a finding of joint infringement articulated by the Federal Circuit in the case of Muniauction, Inc. v. Thomson Corp. (the Muniauction Case), released after the court denied our initial motion for JMOL. On April 24, 2009 the court issued its order and memorandum setting aside the adverse jury verdict and ruling that we did not infringe Akamai’s ‘703 patent and that we are entitled to judgment as a matter of law. Based upon the court’s April 24, 2009 order we have reversed the $65.6 million provision for litigation previously recorded for this lawsuit as we no longer believe that payment of any amounts represented by the litigation provision is probable. The court entered final judgment in favor of us. Akamai filed a notice of appeal of the court’s decision on May 26, 2009; and the Court of Appeals for the Federal Circuit heard arguments by both parties on June 7, 2010. On December 20, 2010 the Court of Appeals for the Federal Circuit issued its opinion affirming the District Court’s entry of judgment in our favor. On February 18, 2011, Akamai filed a motion with the Court of Appeals for the Federal Circuit seeking a rehearing and rehearing en banc. We believe that we do not infringe Akamai’s patents and will continue to vigorously defend our position. In light of the favorable ruling from the Court of Appeals we do not believe that a loss is probable. Therefore, we have made no provision for this lawsuit in our financial statements. |
| Limelight Networks, Inc. | ||||||||||||||||||||
| Year Ended December 31, | ||||||||||||||||||||
| 2010 | 2009 | 2008 | 2007 | 2006 | ||||||||||||||||
| (In thousands) | ||||||||||||||||||||
| Consolidated Balance Sheet Data: |
||||||||||||||||||||
| Cash and cash equivalents and marketable securities, current |
$ | 68,750 | $ | 154,379 | $ | 174,643 | $ | 197,097 | $ | 7,611 | ||||||||||
| Non-current marketable securities |
1,755 | 12 | 13 | 87 | 285 | |||||||||||||||
| Working capital |
80,877 | 159,530 | 116,608 | 154,501 | 14,596 | |||||||||||||||
| Property and equipment, net |
54,407 | 35,524 | 40,185 | 46,968 | 41,784 | |||||||||||||||
| Total assets |
298,640 | 235,670 | 256,792 | 273,428 | 74,424 | |||||||||||||||
| Long-term debt, less current portion |
1,750 | — | — | — | 20,491 | |||||||||||||||
| Convertible preferred stock |
— | — | — | — | 45 | |||||||||||||||
| Total stockholders’ equity |
256,109 | 202,800 | 150,131 | 194,037 | 37,039 | |||||||||||||||
38
Table of Contents
| Item 7. | Management’s Discussion and Analysis of Financial Condition and Results of Operations |
This annual report on Form 10-K contains “forward-looking statements” within the meaning of the Private Securities Litigation Reform Act of 1995. Forward-looking statements include statements as to industry trends and future expectations of ours and other matters that do not relate strictly to historical facts. These statements are often identified by the use of words such as “may,” “will,” “expect,” “believe,” “anticipate,” “intend,” “could,” “estimate,” or “continue,” and similar expressions or variations. These statements are based on the beliefs and assumptions of our management based on information currently available to management. Such forward-looking statements are subject to risks, uncertainties and other factors that could cause actual results and the timing of certain events to differ materially from future results expressed or implied by such forward-looking statements. Factors that could cause or contribute to such differences include, but are not limited to, those identified below, and those discussed in the section titled “Risk Factors” set forth in Part I, Item 1A of this annual report on Form 10-K. We undertake no obligation to update any forward-looking statements to reflect events or circumstances after the date of such statements.
Overview
We were founded in 2001 as a provider of content delivery network, or CDN, services to deliver digital content over the Internet. We began development of our infrastructure in 2001 and began generating meaningful revenue in 2002. In May 2009, January 2010, April 2010 and July 2010, respectively, we acquired Kiptronic, chors, EyeWonder and Delve. Today, Limelight Networks provides on-demand software, platform, and infrastructure services that help global businesses reach and engage audiences on any mobile or connected device, enabling them to enhance their brand presence, build stronger customer relationships, manage video assets, analyze viewer preferences, optimize their advertising, and monetize their digital assets. We provide services to customers in North America, EMEA, and the Asia Pacific region. As of December 31, 2010, we had approximately 1,824 active customers worldwide. We derive revenue from the sale of services to our customers. These services include the delivery of digital media, including video, music, games, software and social media, the acceleration of web sites and web-based applications, and value-added services such as mobility, interactive advertising, computing, storage, data center, transit, and consulting. We operate in one business segment. Our CDN customers normally execute contracts with terms of one year or longer, which we refer to as recurring revenue contracts or long-term contracts. These contracts generally commit the customer to a minimum monthly level of usage with additional charges applicable for actual usage above the monthly minimum commitment. We have entered into an increasing number of customer contracts that have minimum usage commitments that are based on twelve-month or longer periods and in some cases, other arrangements. We believe that having a consistent and predictable base level of revenue is important to our financial success. Accordingly, to be successful, we must maintain our base of recurring revenue contracts by eliminating or reducing any customer cancellations or terminations and build on that base by adding new customers and increasing the number of services, features and functionalities our existing customers purchase. We also derive revenue from campaigns, services and events sold as discrete, non-recurring events or based solely on usage. For these services, we recognize revenue after an enforceable contract has been signed by both parties, the fee is fixed or determinable, the event or usage has occurred and collection is reasonably assured.
On March 2, 2011 we completed an underwritten public offering of our common stock in which we sold and issued 11,500,000 shares of our common stock, including 1,500,000 shares subject to the underwriters’ over-allotment option, at a price to the public of $7.10 per share. The newly issued common shares began trading on the Nasdaq Global Select Market on March 2, 2011. We raised a total of approximately $81.7 million in gross proceeds from the offering, or approximately $77.3 million in net proceeds after deducting underwriting discounts and commissions of approximately $3.9 million and other offering costs of approximately $0.5 million. The offering was made pursuant to the effective registration statement on Form S-3 (Registration Statement No. 333-170609) previously filed with and declared effective by the Securities and Exchange Commission on November 26, 2010 and the prospectus supplement thereunder filed with the Securities and Exchange Commission on February 28, 2011.
39
Table of Contents
On July 30, 2010 we acquired Delve Networks, Inc., or Delve, a privately-held provider of cloud-based video publishing and analytics services located in Seattle, Washington. The purchase price of approximately $4.1 million consisted of approximately $2.8 million of cash and 313,663 shares of our common stock with an estimated fair value of approximately $1.3 million at the time of the acquisition. Our consolidated financial statements include the results of operations of Delve from the date of acquisition. The historical results of operations of Delve were not significant to our consolidated results of operations for the periods presented.
On April 30, 2010, we completed the acquisition of EyeWonder, Inc., or EyeWonder, a provider of interactive digital advertising products and services to advertisers, advertising agencies and publishers. The purchase price of approximately $114.0 million consisted of approximately $62.8 million of cash and 12,740,000 shares of our common stock with an estimated fair value of approximately $51.2 million at the time of the acquisition. EyeWonder is a provider of interactive digital advertising products and services to advertisers, advertising agencies and publishers. EyeWonder creates and executes online video and rich media advertising campaigns — “interactive digital advertising” — on behalf of advertisers. EyeWonder was a pioneer in the delivery of video ads online and continues to be a leader in industry innovation, delivering engaging brand experiences across hundreds of online publishers and digital media channels, including online, mobile and in-game, and across a variety of formats. Through its innovative technology, products and services, EyeWonder provides advertisers, advertising agencies and content publishers the ability to create, build, deliver, track and optimize interactive advertising campaigns. EyeWonder’s in-page, in-stream and mobile advertising products combine the quality and power of Adobe Flash® video and the latest creative features, as well as online tracking and reporting capabilities to enhance the impact and effectiveness of rich media advertising campaigns. EyeWonder has executed campaigns for hundreds of advertisers across a wide variety of sectors.
EyeWonder was founded in 1999 and is headquartered in Atlanta, Georgia, with offices in New York, Chicago, San Francisco, Dallas, Los Angeles, the United Kingdom, Ireland, the Netherlands, France, Germany, Spain and Australia. At the time of the acquisition, EyeWonder and its subsidiaries employed a staff of approximately 240.
In January 2010, we acquired chors GmbH, or chors, an on-line and direct marketing solution provider located in Germany. The purchase price of approximately $5.9 million consisted of approximately $2.8 million of cash and 860,000 shares of our common stock with an estimated value of approximately $3.1 million at the time of the acquisition.
40
Table of Contents
The following table sets forth our historical operating results, as a percentage of revenue for the periods indicated:
| Year Ended December 31, | ||||||||||||
| 2010 | 2009 | 2008 | ||||||||||
| Consolidated Statement of Operations Data: |
||||||||||||
| Revenue |
100 | % | 100 | % | 100 | % | ||||||
| Cost of revenue: |
||||||||||||
| Cost of services |
44 | 47 | 45 | |||||||||
| Depreciation — network |
12 | 18 | 20 | |||||||||
| Total cost of revenue |
56 | 65 | 65 | |||||||||
| Gross margin |
44 | 35 | 35 | |||||||||
| Operating expenses: |
||||||||||||
| General and administrative |
20 | 26 | 40 | |||||||||
| Sales and marketing |
26 | 25 | 27 | |||||||||
| Research and development |
9 | 6 | 6 | |||||||||
| Depreciation and amortization |
3 | 2 | 1 | |||||||||
| Provision for Litigation |
— | (50 | ) | 14 | ||||||||
| Total operating expenses |
57 | 9 | 88 | |||||||||
| Operating (loss) income |
(13 | ) | 26 | (52 | ) | |||||||
| Other income (expense): |
||||||||||||
| Interest expense |
— | — | — | |||||||||
| Interest income |
— | 1 | 4 | |||||||||
| Other income (expense) |
— | — | — | |||||||||
| Total other income (expense) |
— | 1 | 4 | |||||||||
| (Loss) income before income taxes |
(13 | ) | 27 | (49 | ) | |||||||
| Income tax (benefit) expense |
(2 | ) | 1 | — | ||||||||
| Net (loss) income |
(11 | )% | 26 | % | (49 | )% | ||||||
Traffic on our network and our cloud based services business has continued to grow. This traffic growth is primarily the result of growth in the traffic delivered on behalf of both new and existing customers. Our CDN revenue is generated by charging for traffic delivered. During 2010, we continued to add new customers, both through new business and through our business acquisitions. We have seen an increase in the length of our sales cycle, but we continue to see that new and existing customers want the benefits of the specialized services that we bring to the market. We like the traction our cloud based services are getting in the market, the growth rates we are seeing there, and the growth rates in the core CDN business, which we believe are coming from market share gains as well as a healthier pricing environment.
Historically, we have derived a relatively small portion of our revenue from outside of North America. Our international revenue has grown recently, and we expect this trend to continue as we focus on our strategy of expanding our network and customer base internationally. For the years ended December 31, 2010, 2009 and 2008, respectively, revenue derived from customers outside North America accounted for approximately 29%, 22% and 16% respectively, of our total revenue. For the years ended December 31, 2010, 2009 and 2008, respectively, we derived approximately 65%, 69% and 75%, respectively of our international revenue from EMEA and approximately 35%, 31% and 25%, respectively of our international revenue from Asia Pacific. We expect foreign revenue to continue to increase in absolute dollars in 2011. Our international business is managed as a single-geographic segment, and we report our financial results on this basis.
During any given fiscal period, a relatively small number of customers typically account for a significant percentage of our revenue. For example, in 2010, sales to our top 10 customers, in terms of revenue, accounted
41
Table of Contents
for approximately 30% of our total revenue and we had no customer that accounted for more than 10% of our revenue. During 2009 and 2008, revenue generated from sales to our top 10 customers, in terms of revenue, accounted for approximately 36% and 38%, respectively, of our total revenue. During 2009 and 2008, one of these top 10 customers, Microsoft, represented approximately 14% and 18%, respectively of our total revenue for that period. We anticipate customer concentration levels will decrease compared to prior years. In addition to selling to our direct customers, we maintain relationships with a number of resellers that purchase our services and charge a mark-up to their end customers. Revenue generated from sales to reseller customers was approximately 5%, 2% and 1%, respectively of our total revenue for the years ended December 31, 2010, 2009 and 2008, respectively.
In addition to these revenue-related business trends, our cost of revenue increased in absolute dollars and decreased as a percentage of revenue in 2010 when compared to 2009. This increase in absolute dollars is primarily the result of increased cost of backbone and peering costs associated with increased traffic on our network, increased co-location fees associated with increased investments to build out the capacity of our network and increased operations personnel resulting from our business acquisitions and additional personnel required to operate our expanding network. Gross margin increased during 2010 as a result of the growth in our higher margin cloud based services from both our internally developed products and our acquisitions during the year.
Through 2008 operating expenses increased in absolute dollars each period as revenue increased. In 2008, these increases were primarily due to increased litigation costs and legal fees associated with ongoing intellectual property litigation. For the year ended December 31, 2009, operating expenses, excluding the provision for litigation, decreased compared to the year ended December 31, 2008. This decrease was primarily due to decreased general and administrative costs (primarily litigation costs, bad debt expense and general legal fees) and decreased sales and marketing costs (primarily due to a reduction in marketing programs) off-set by increased research and development costs and non-network related depreciation. During 2010, operating expenses, which includes operating expenses from our business acquisitions increased compared to 2009. This increase was primarily due to increased general and administrative costs (primarily payroll and related employee costs, due to increased staffing and our annual bonus accrual, increased facility related expenses, additional fees, licenses and non-income taxes, off-set by lower litigation expenses and reduced bad debt expense), increased sales and marketing expenses (primarily payroll and related employee costs due to increased staffing) and increased research and development costs (also, primarily payroll and related employee costs due to increased staffing), and increased non-network related depreciation and amortization associated with the amortization of acquired intangible assets.
We make our capital investment decisions based upon careful evaluation of a number of variables, such as the amount of traffic we anticipate on our network, the cost of the physical infrastructure required to deliver that traffic, and the forecasted capacity utilization of our network. Our capital expenditures have varied over time, in particular as we purchased servers and other network equipment associated with our network build-out. For example, in 2008 and 2009, we made capital purchases of $17.4 million and $20.4 million, respectively. For the year ended December 31, 2010, we made capital investments of $34.2 million. We continue to see improvements in the efficiency of our network allowing us to meet traffic growth with less investment, however, we expect to have ongoing capital expenditure requirements, as we continue to invest in and expand our CDN. For 2011, we currently anticipate making aggregate capital expenditures of approximately 15% of total revenue for the year.
Occasionally we generate revenue from certain customers that are entities related to certain of our executives. The aggregate amounts of revenue derived from these related party transactions was less than 1% for the years ended December 31, 2010 and 2008, respectively. For the year ended December 31, 2009, we did not generate any revenue from related parties.
We are currently engaged in litigation with one of our principal competitors, Akamai Technologies, Inc., or Akamai, and its licensor, the Massachusetts Institute of Technology, or MIT, in which these parties have alleged
42
Table of Contents
that we are infringing three of their patents. In February 2008, a jury returned a verdict in this lawsuit, finding that we infringed four claims of the patent at issue (United States Patent No. 6,108,703 (the ‘703 patent) and rejecting our invalidity defenses. The court conducted a bench trial in November 2008, regarding our equitable defenses; and we filed a motion for reconsideration of the court’s earlier denial of our motion for Judgment as a Matter of Law (JMOL). Our motion for reconsideration of JMOL was based largely upon a clarification in the standard for a finding of joint infringement articulated by the Federal Circuit in the case of Muniauction, Inc. v. Thomson Corp. (the Muniauction Case), released after the court denied our initial motion for JMOL. On April 24, 2009 the court issued its order and memorandum setting aside the adverse jury verdict and ruling that we did not infringe Akamai’s ‘703 patent and that we are entitled to judgment as a matter of law. Based upon the court’s April 24, 2009 order we reversed the $65.6 million provision for litigation previously recorded for this lawsuit as we no longer believe that payment of any amounts represented by the litigation provision is probable. The court entered final judgment in favor of us on May 22, 2009. Akamai filed a notice of appeal of the court’s decision on May 26, 2009; and the Court of Appeals for the Federal Circuit heard arguments by both parties on June 7, 2010. On December 20, 2010 the Court of Appeals for the Federal Circuit issued its opinion affirming the District Court’s entry of judgment in our favor. On February 18, 2011, Akamai filed a motion with the Court of Appeals for the Federal Circuit seeking a rehearing and rehearing en banc. We believe that we do not infringe Akamai’s patents and will continue to vigorously defend our position. In light of the favorable ruling from the Court of Appeals we do not believe that a loss is probable. Therefore, we have made no provision for this lawsuit in our financial statements.
In December 2007, Level 3 Communications, LLC, or Level 3, filed a lawsuit against us in the United States District Court for the Eastern District of Virginia alleging that we were infringing certain patents Level 3 acquired from Savvis Communications Corp. In addition to monetary relief, including treble damages, interest, fees and costs, the complaint sought an order permanently enjoining us from conducting our business in a manner that infringed the relevant patents. A jury trial was conducted in January 2009, and on January 23, 2009 the jury returned a verdict favorable to us finding that we did not infringe the Level 3 patents. We believe the jury verdict finding that we did not infringe the Level 3 patents is correct, and that the claims of infringement asserted against us by Level 3 in the litigation were without merit. The court denied Level 3’s subsequent motion for JMOL or alternatively for a new trial, and entered a judgment in our favor. Level 3 filed a notice of appeal on July 21, 2009. On May 3, 2010 the United States Court of Appeals for the Federal Circuit heard oral argument on this matter, and on May 5, 2010 the court affirmed the District Court judgment in our favor. Level 3 subsequently filed a motion for rehearing and rehearing en banc that the Court subsequently denied. In light of the favorable rulings from the Court of Appeals we consider this matter successfully concluded. Our legal and other expenses associated with this case have been significant. We include these litigation expenses in general and administrative expenses, as reported in our condensed consolidated statement of operations.
In August 2007, we, certain of our officers and current and former directors, and the firms that served as the lead underwriters in our initial public offering were named as defendants in several purported class action lawsuits filed in the United States District Courts for the District of Arizona and the Southern District of New York. All of the New York cases were transferred to Arizona and consolidated into a single action. The plaintiffs’ consolidated complaint asserted causes of action under Sections 11, 12, and 15 of the Securities Act of 1933, as amended, on behalf of a purported class of individuals who purchased our common stock in our initial public offering and/or pursuant to our Prospectus. The complaint alleged, among other things, that we omitted and/or misstated certain facts concerning the seasonality of our business and the loss of revenue related to certain customers. On March 17, 2008, we and the individual defendants moved to dismiss all of the plaintiffs’ claims, a hearing was held on this motion on June 16, 2008. On August 8, 2008, the court granted the motion to dismiss, dismissing plaintiffs’ claims under Section 12 with prejudice and granting leave to amend the claims under Sections 11 and 15. Plaintiffs chose not to amend the claims under Sections 11 and 15, and on August 29, 2008, the court entered judgment in favor of us. On September 5, 2008 plaintiffs filed a notice of appeal, and appellate briefs were filed by the parties in January and February, 2009. We believe that we and the individual defendants have meritorious defenses to the plaintiffs’ claims and intend to contest the lawsuit vigorously. In November 2009 the parties entered into a Memorandum of Understanding to settle this lawsuit for an amount well within
43
Table of Contents
the coverage limits of the primary carrier of our directors and officers liability insurance, and on July 7, 2010 the parties entered into a settlement agreement consistent with the terms of the Memorandum of Understanding, which will require court approval. A hearing before the Federal District Court is currently scheduled for March 22, 2011. We anticipate court approval of the settlement. We do not believe that a loss is probable. Therefore, we have made no provision for this lawsuit in our financial statements.
We were unprofitable for the year ended December 31, 2010; significant items impacting our unprofitability were depreciation and amortization expense of $28.7 million and share-based compensation expense of $17.4 million. We were profitable for the year ended December 31, 2009 and unprofitable for the year ended December 31, 2008, respectively. For the year ended December 31, 2009; the largest impact to our profitability was the reversal of our provision for litigation judgment accrual of $65.6 million regarding the patent infringement lawsuit filed by Akamai Technologies, Inc. For the year ended December 31, 2008; the largest negative impact to our profitability was litigation costs of $20.8 million, the accrual of $15.5 million, for the potential continuing damages, plus additional interest of $2.0 million, respectively from the jury verdict returned against us regarding the patent infringement lawsuit filed by Akamai Technologies, Inc., and $18.1 million in share-based compensation.
Our future results will be affected by many factors identified in the section captioned “Risk Factors,” in this annual report on Form 10-K, including our ability to:
| • | increase our revenue by adding customers and limiting customer cancellations and terminations, as well as increasing the amount of monthly recurring revenue that we derive from our existing customers; |
| • | manage the prices we charge for our services, as well as the costs associated with operating our network in light of increased competition; |
| • | successfully manage our litigation with Akamai to a favorable conclusion; |
| • | prevent disruptions to our services and network due to accidents or intentional attacks; and |
| • | continued ability to deliver a significant portion of our traffic through settlement free peering relationships which significantly reduce our cost of delivery. |
As a result, we cannot assure you that we will achieve our expected financial objectives, including positive net income.
Basis of Presentation
Revenue
We derive revenue from the sale of content delivery network services to customers executing contracts having terms of one year or longer. These contracts generally commit the customer to a minimum monthly or annual level of usage and provide the rate at which the customer must pay for actual usage above the monthly or annual minimum. For these services, we recognize the monthly minimum as revenue each month provided that an enforceable contract has been signed by both parties, the service has been delivered to the customer, the fee for the service is fixed or determinable and collection is reasonably assured. Should a customer’s usage of our services exceed the monthly minimum commit, we recognize revenue for such excess in the period of the usage. For annual or other non-monthly period revenue commitments, we recognize revenue monthly based upon the customer’s actual usage each month of the commitment period and only recognize any remaining committed amount for the applicable period in the last month thereof. We typically charge the customer an installation fee when the services are first activated. The installation fees are recorded as deferred revenue and recognized as revenue ratably over the life of the customer arrangement. We also derive revenue from campaigns, services and events sold as discrete, non-recurring events or based solely on usage. For these services, we recognize revenue after an enforceable contract has been signed by both parties, the fee is fixed or determinable, the event or usage has occurred and collection is reasonably assured.
44
Table of Contents
We have on occasion entered into multi-element arrangements. In October 2009, the Financial Accounting Standards Board (FASB) issued Accounting Standards Update (ASU) 2009-13, Revenue Recognition (Topic 605) — Multiple-Deliverable Revenue Arrangements. ASU 2009-13 addresses the accounting for multiple-deliverable arrangements to enable vendors to account for products or services (deliverables) separately rather than as a combined unit. Specifically, this guidance amends the criteria in Subtopic 605-25, Revenue Recognition-Multiple-Element Arrangements (Subtopic 605-25), for separating consideration in multiple-deliverable arrangements. This guidance establishes a selling price hierarchy for determining the selling price of a deliverable, which is based on: (a) vendor-specific objective evidence; (b) third-party evidence; or (c) management’s best estimate. This guidance also eliminates the residual method of allocation and requires that arrangement consideration be allocated at the inception of the arrangement to all deliverables using the relative selling price method. During the third quarter of 2010, we early adopted ASU 2009-13 with such adoption being effective for revenue arrangements entered into or materially modified after January 1, 2010. The impact of adoption was not material to our financial position, results of operations or cash flows.
In October 2009, the FASB also issued ASU 2009-14, Software (Topic 985) — Certain Revenue Arrangements That Include Software Elements. ASU 2009-14 changes revenue recognition for tangible products containing software and hardware elements. Specifically, tangible products containing software and hardware that function together to deliver the tangible products’ essential functionality are scoped out of the existing software revenue recognition guidance and will be accounted for under the multiple-element arrangements revenue recognition guidance under ASU 2009-13. In the third quarter of 2010 in conjunction with the adoption of ASU 2009-13, we early adopted ASU 2009-14 with such adoption being effective for revenue arrangements entered into or materially modified after January 1, 2010. We did not enter into or modify any arrangements falling under the scope of ASU 2009-14 during the year ended December 31, 2010, and accordingly the impact of adoption was not material to our financial position, results of operations or cash flows.
Prior to the adoption of ASU 2009-13 effective January 1, 2010, when we entered into multiple element arrangements, each element was accounted for separately over its respective service period or at the time of delivery, provided that there was objective evidence of fair value for the separate elements. Objective evidence of fair value includes the price charged for the element when sold separately. If the fair value of each element could not be objectively determined, the total value of the arrangement was recognized ratably over the entire service period to the extent that all services have begun to be provided, and other revenue recognition criteria have been satisfied.
Cost of Revenue
Cost of revenue consists of costs related to the delivery of services, as well as the depreciation costs associated with our network. Costs related to the delivery of our services include:
| • | fees for transit bandwidth provided by network operators; |
| • | fees paid for the use of private line capacity for our backbone and metro fiber rings to inter-connect our delivery zones; |
| • | fees paid for co-location services, which are the housing, electric and cooling of servers and other equipment in third party data centers; |
| • | fees paid for non settlement free peering and connection to Internet service provider networks; |
| • | network operations and cloud based services employee costs, including share-based compensation expense; and |
| • | costs associated with third party software licenses. |
We enter into contracts with third party network and data center providers, with terms typically ranging from several months to several years. Our contracts related to transit bandwidth provided by network operators
45
Table of Contents
generally commit us to pay either a fixed monthly fee or monthly fees plus additional fees for bandwidth usage above a contracted level. In January and September 2009, we entered into multi-year arrangements with a telecommunications provider for additional bandwidth and backbone capacity. The agreements required us to make advanced payments for future services to be received. Our recently amended master contract with Global Crossing provides for the use of private lines of varying capacity for our backbone. The amended agreement provides for added capacity for a 4 year term, and includes a substantial prepayment of fees and charges. In addition to purchasing services from communications providers, we connect directly to over 900 broadband Internet service providers, or ISPs, generally without either party paying the other. This industry practice, known as settlement free peering, benefits us by allowing us to place content objects directly on user access networks, which helps us provide higher performance delivery for our customers and eliminate paying transit bandwidth fees to network operators. This practice also benefits the ISP and its customers by allowing them to receive improved content delivery through our local servers and eliminate cost of transit bandwidth associated with delivery receipt of the traffic. We do not consider these relationships to represent the culmination of an earnings process. Accordingly, we do not recognize as revenue the value to the ISPs associated with the use of our servers nor do we recognize as expense the value of the bandwidth received at discounted or no cost. These peering relationships are mutually beneficial and are not contractual commitments. In addition to settlement free peering, we incur costs for non settlement free peering as well as costs associated with connecting to the Internet service providers.
During 2010, we continued to reduce our network transit bandwidth delivery costs per gigabyte transferred by entering into new supplier contracts with lower pricing and amending existing contracts to take advantage of price reductions from our existing suppliers associated with higher purchase commitments. However, due to increased traffic delivered over our network, our total transit bandwidth delivery costs increased during 2010. We anticipate our overall transit bandwidth delivery costs will continue to increase in absolute dollars as a result of expected higher traffic levels, partially offset by continued reductions in bandwidth costs per unit. We expect that our overall transit bandwidth delivery costs as a percentage of revenue will remain relatively constant in 2011 compared to 2010.
Depreciation expense related to our network equipment increased from 2005 through 2008 due to additional equipment purchases each year. During 2009 and 2010 depreciation expense related to our network equipment decreased from the prior year. We anticipate depreciation expense related to our network equipment will increase in 2011 compared to 2010 in absolute dollars and will remain consistent with 2010 as a percentage of revenue.
In total, we believe our cost of revenue will increase in 2011 in absolute dollars and will decrease slightly compared to 2010 as a percentage of revenue. Each year we expect to deliver more traffic on our network, which would result in higher transit bandwidth delivery cost associated with the increased traffic, increased rack and co-location costs and costs associated with our increases in cloud based services. Additionally, we expect an increase in payroll and payroll-related costs, as we continue to make investments in our network to service our expanding customer base as well as our increases in cloud based services. While we expect an increase in absolute dollars, we expect cost of revenue to decrease as a percentage of revenue.
General and Administrative Expense
General and administrative expense consists primarily of the following components:
| • | payroll, share-based compensation and other related costs, including related expenses for executive, finance, legal, business applications, internal network management, human resources and other administrative personnel; |
| • | fees for professional services and litigation expenses; |
| • | rent and other facility-related expenditures for leased properties; |
| • | the provision for doubtful accounts; and |
| • | non-income related taxes. |
46
Table of Contents
We expect our general and administrative expense in 2011 to remain consistent with 2010 in absolute dollars and to decrease as a percentage of revenue. During 2011, we expect to see increased salaries and related employee cost, as well as increased facility costs. These increases will be off-set by lower litigation costs and reduced professional fees. In 2012 and in the longer term, we expect our general and administrative expense to decrease as a percentage of revenue as our costs are expected to grow slower than our top line revenue. We expect that share-based compensation expense will increase slightly in 2011.
Sales and Marketing Expense
Sales and marketing expense consists primarily of payroll and related costs, including share-based compensation expense and commissions and other variable compensation for personnel engaged in marketing, sales and service support functions, professional fees (consultants and recruiting fees), travel and travel-related expenses as well as advertising and promotional expenses.
We anticipate our sales and marketing expenses will continue to increase in 2011 in absolute dollars and will decrease slightly as a percentage of revenue. The increase in absolute dollars is due to an expected increase in salaries and related employee costs for our sales and marketing personnel, increased commissions on higher forecast sales, and an increase in marketing costs such as advertising and other lead generating activities. We expect that share-based compensation expense will increase in 2011.
Research and Development Expense
Research and development expense consists primarily of payroll and related costs and share-based compensation expense associated with the design, development, testing and certification of the software, hardware and network architecture of our CDN and our other value added service products. Research and development costs are expensed as incurred.
We anticipate our research and development expenses will increase in 2011 in absolute dollars and increase as a percentage of revenue as we continue to make investments in our core technology and refinements to our other service offerings. We expect increased payroll and related employee costs associated with continued hiring of research and development personnel, as well as increased professional fees for outside services. We expect that share-based compensation expense will increase slightly in 2011.
Non-Network Depreciation and Amortization Expense
Non-network depreciation and amortization expense consists of depreciation on equipment and furnishing used by general administrative, sales and marketing and research and development personnel. Amortization expense consists of amortization of intangible assets acquired in business combinations. We expect that non-network depreciation and amortization will increase 2011.
Provision for Litigation
Provision for litigation relates to our accrual for the adverse jury verdict in the Akamai litigation. On February 29, 2008, a jury returned a verdict in favor of Akamai in the amount of $45.5 million plus pre-judgment interest estimated to be $2.6 million that we recorded in 2007. During the year ended December 31, 2008, we estimated our revenue from alleged infringing methods totaled approximately 25% of our total revenue. We recorded a potential additional provision for litigation totaling $15.5 million, plus additional interest of $2.0 million, for the year ended December 31, 2008. The total provision for litigation at December 31, 2008 was $65.6 million. On April 24, 2009 the court issued its order and memorandum setting aside the adverse jury verdict and ruling that we did not infringe Akamai’s ‘703 patent and that we are entitled to judgment as a matter of law. Based upon the court’s April 24, 2009 order we have reversed the $65.6 million provision for litigation previously recorded for this lawsuit as we no longer believe that payment of any amounts represented by the litigation provision is probable. The court entered final judgment in favor of us. Akamai filed a notice of appeal
47
Table of Contents
of the court’s decision on May 26, 2009. The court heard arguments by both parties on June 7, 2010. On December 20, 2010 the Court of Appeals for the Federal Circuit issued its opinion affirming the District Court’s entry of judgment in our favor. On February 18, 2011, Akamai filed a motion with the Court of Appeals for the Federal Circuit seeking a rehearing and rehearing en banc. We believe that we do not infringe Akamai’s patents and will continue to vigorously defend our position. In light of the favorable ruling from the Court of Appeals we do not believe that a loss is probable. Therefore, we have made no provision for this lawsuit in our financial statements. We cannot assure you that this lawsuit ultimately will be resolved in our favor. Our legal and other expenses associated with this case have been significant. We include these litigation expenses in general and administrative expenses, as reported in our condensed consolidated statement of operations. We expect that litigation expenses may continue to be significant.
Interest Expense
Interest expense includes interest paid on our debt obligations as well as amortization of deferred financing costs.
Interest Income
Interest income includes interest earned on invested cash balances, cash equivalents and marketable securities. Interest income also includes the realized gains and loss on investments. We anticipate interest income to increase in 2011 as a result of increased average cash balances. Our average cash balance will increase in 2011, primarily due to our follow-on offering of our common stock in which we received approximately $77.3 million in net proceeds after deducting underwriting discounts, commissions and other offering costs.
Other Income (Expense)
Our other income (expense) consists primarily of foreign exchange gains and losses resulting from the re-measurement of accounts payable and receivables denominated in a foreign currency, the effect of exchange rates on monetary balance sheet and income statement items and the application of our cost plus model on foreign operations in various countries. Other income (expense) also includes gains or losses from the disposal of assets.
Income Tax Expense (Benefit)
Our provision for income taxes is primarily comprised of the tax benefit of a partial release of our valuation allowance related to the EyeWonder acquisition, the accounting for uncertainty in income taxes, and tax expense from various foreign jurisdictions.
Income tax expense depends on the statutory rate in the countries where we operate. Historically, we have primarily been subject to taxation in the United States because we have sold the majority of our services to customers based there. We continue to expand our operations in locations outside the United States, in which case we are subject to taxation based on the statutory rates in the foreign countries. Our effective tax rate could fluctuate accordingly.
Management periodically evaluates if it is more likely than not that some or all of the deferred tax assets will be realized. In making such determination, we consider all available positive and negative evidence, including scheduled reversals of deferred tax liabilities, projected future taxable income, tax planning strategies and recent financial performance.
During the year ended December 31, 2010, management performed an assessment of the recoverability of deferred tax assets. As a result of the acquisition of EyeWonder, $3.9 million of net deferred tax liabilities were
48
Table of Contents
recorded resulting from the temporary differences generated by the differences between the fair value of assets and liabilities acquired (mainly intangible assets such as existing technologies) and their corresponding tax bases. Management determined that $3.9 million of our pre-acquisition deferred tax assets that had a full valuation allowance are now more-likely-than-not to be realized as a result of the acquisition by offsetting such deferred tax assets against the $3.9 million net deferred tax liabilities recorded as of the acquisition date. Therefore, we recorded a tax benefit of $3.9 million related to the partial release of the related valuation allowance. For the remaining balance of deferred tax assets, there was sufficient negative evidence as a result of our cumulative losses to conclude that it was more likely than not that our deferred tax assets would not be realized, with the exception of deferred tax assets at certain foreign subsidiaries, and we accordingly maintained a valuation allowance of $37.5 million. In the event we were to determine that we would be able to realize our deferred income tax assets in the future in excess of their net recorded amount, we would make an adjustment to the valuation allowance which would reduce the provision for income taxes.
Related to the chors and Kiptronic acquisitions, we also have certain taxable temporary differences related to intangible assets that cannot be offset by existing deductible temporary differences resulting in a deferred tax liability of approximately $0.6 million.
Critical Accounting Policies and Estimates
Our discussion and analysis of our financial condition and results of operations are based upon our consolidated financial statements, which have been prepared in accordance with United States generally accepted accounting principles. These principles require us to make estimates and judgments that affect the reported amounts of assets, liabilities, revenue and expenses, cash flow and related disclosure of contingent assets and liabilities. Our estimates include those related to revenue recognition, accounts receivable and related reserves, useful lives and realizability of long-term assets, capitalized software, acquired intangibles, provision for litigation, income and other taxes, the fair value of stock-based compensation and other contingent liabilities. We base our estimates on historical experience and on various other assumptions that we believe to be reasonable under the circumstances. Actual results may differ from these estimates. To the extent that there are material differences between these estimates and our actual results, our future financial statements will be affected.
We define our “critical accounting policies” as those United States generally accepted accounting principles that require us to make subjective estimates about matters that are uncertain and are likely to have a material impact on our financial condition and results of operations as well as the specific manner in which we apply those principles. Our estimates are based upon assumptions and judgments about matters that are highly uncertain at the time the accounting estimate is made and applied and require us to continually assess a range of potential outcomes.
Revenue Recognition
We primarily derive revenue from the sale of content delivery network services to customers executing contracts having terms of one year or longer. These contracts generally commit the customer to a minimum monthly or annual level of usage and provide the rate at which the customer must pay for actual usage above the monthly or annual minimum. For these services, we recognize the monthly minimum as revenue each month provided that an enforceable contract has been signed by both parties, the service has been delivered to the customer, the fee for the service is fixed or determinable and collection is reasonably assured. Should a customer’s usage of our services exceed the monthly minimum commit, we recognize revenue for such excess in the period of the usage. For annual or other non-monthly period revenue commitments, we recognize revenue monthly based upon the customer’s actual usage each month of the commitment period and only recognize any remaining committed amount for the applicable period in the last month thereof. We typically charge the customer an installation fee when the services are first activated. The installation fees are recorded as deferred revenue and recognized as revenue ratably over the estimated life of the customer arrangement. We also derive revenue from campaigns, services and events sold as discrete, non-recurring events or based solely on usage. For
49
Table of Contents
these services, we recognize revenue after an enforceable contract has been signed by both parties, the fee is fixed or determinable, the event or usage has occurred and collection is reasonably assured.
We have on occasion entered into multi-element arrangements. In October 2009, the Financial Accounting Standards Board (FASB) issued Accounting Standards Update (ASU) 2009-13, Revenue Recognition (Topic 605) — Multiple-Deliverable Revenue Arrangements. ASU 2009-13 addresses the accounting for multiple-deliverable arrangements to enable vendors to account for products or services (deliverables) separately rather than as a combined unit. Specifically, this guidance amends the criteria in Subtopic 605-25, Revenue Recognition-Multiple-Element Arrangements (Subtopic 605-25), for separating consideration in multiple-deliverable arrangements. This guidance establishes a selling price hierarchy for determining the selling price of a deliverable, which is based on: (a) vendor-specific objective evidence; (b) third-party evidence; or (c) management’s best estimate. This guidance also eliminates the residual method of allocation and requires that arrangement consideration be allocated at the inception of the arrangement to all deliverables using the relative selling price method. In the third quarter of 2010, we early adopted ASU 2009-13 with such adoption being effective for revenue arrangements entered into or materially modified after January 1, 2010. We recognized $1.1 million of revenue related to a multi-element arrangement accounted for in accordance with ASU 2009-13 during the year ended December 31, 2010. In October 2009, the FASB also issued ASU 2009-14, Software (Topic 985) — Certain Revenue Arrangements That Include Software Elements. ASU 2009-14 changes revenue recognition for tangible products containing software and hardware elements. Specifically, tangible products containing software and hardware that function together to deliver the tangible products’ essential functionality are scoped out of the existing software revenue recognition guidance and will be accounted for under the multiple-element arrangements revenue recognition guidance under ASU 2009-13. In the third quarter of 2010 in conjunction with the adoption of ASU 2009-13, we early adopted ASU 2009-14 with such adoption being effective for revenue arrangement entered into or materially modified after January 1, 2010. We did not enter into or modify any arrangements falling under the scope of ASU 2009-14 during the year ended December 31, 2010, and accordingly the impact of adoption was not material to our financial position, results of operations or cash flows.
Prior to the adoption of ASU 2009-13 effective January 1 2010, we accounted for multiple element arrangements in accordance with Subtopic 605-25. When we entered into such arrangements, each element was accounted for separately over its respective service period or at the time of delivery, provided that there was objective evidence of fair value for the separate elements. Objective evidence of fair value includes the price charged for the element when sold separately. If the fair value of each element could not be objectively determined, the total value of the arrangement was recognized ratably over the entire service period to the extent that all services have begun to be provided, and other revenue recognition criteria have been satisfied.
If the multi-element arrangement included a significant software component, we recognized software license revenue when persuasive evidence of an arrangement exists, delivery occurs, the fee is fixed or determinable and collection of the receivable is reasonably assured. If a software license contained an undelivered element, the vendor-specific objective evidence (VSOE) of fair value of the undelivered element is deferred and the revenue recognized once the element is delivered. The undelivered elements related to these arrangements are primarily software support and professional services. VSOE of fair value of software support and professional services is based upon hourly rates or fixed fees charged when those services are sold separately. If VSOE could not be established for all elements to be delivered, we deferred all amounts received under the arrangement and did not begin to recognize revenue until the delivery of the last element of the contract started. Subsequent to commencement of delivery of the last element, we commenced revenue recognition. Amounts to be received under the contract are then included in the amortizable base and recognized as revenue ratably over the remaining term of the arrangement until we have delivered all elements and have no additional performance obligations.
We have certain multi-element arrangements as of December 31, 2010 that were entered into prior to the adoption of ASU 2009-13 in 2010. Under these arrangements, we recognized approximately $11.0 million, $6.9 million and $5.1 million, respectively, in revenue for the years ended December 31, 2010, 2009 and 2008. As of
50
Table of Contents
December 31, 2010, we had deferred revenue related to these multi-element arrangements of approximately $2.1 million that will be recognized over the remaining terms of the respective arrangements based on the underlying elements of the arrangements in accordance with our revenue recognition policies.
We also sell services through a reseller channel. Assuming all other revenue recognition criteria are met, revenue from reseller arrangements is recognized over the term of the contract, based on the reseller’s contracted non-refundable minimum purchase commitments plus amounts sold by the reseller to its customers in excess of the minimum commitments. These excess commitments are recognized as revenue in the period in which the service is provided. We record revenue under these agreements on a net or gross basis depending upon the terms of the arrangement. We typically record revenue gross when we have risk of loss, latitude in establishing price, credit risk and are the primary obligor in the arrangement. Reseller revenue was approximately 5%, 2% and 1%, respectively, of our total revenue for the years ended December 31, 2010, 2009 and 2008, respectively.
From time to time, we enter into contracts to sell services to unrelated companies at or about the same time we enter into contracts to purchase products or services from the same companies. If we conclude that these contracts were negotiated concurrently, we record as revenue only the net cash received from the vendor. For certain non-cash arrangements whereby we provide rack space and bandwidth services to several companies in exchange for advertising we record barter revenue and expense if the services are objectively measurable. The various types of advertising include radio, website, print and signage. We recorded barter revenue and corresponding expense of approximately $93,000, $185,000 and $487,000, respectively, for the years ended December 31, 2010, 2009 and 2008, respectively.
We may from time to time resell licenses or services of third parties. Revenue for these transactions is recorded when we have risk of loss related to the amounts purchased from the third party and we add value to the license or service, such as by providing maintenance or support for such license or service. If these conditions are present, we recognize revenue when all other revenue recognition criteria are satisfied.
At the inception of a customer contract for service, we make an assessment as to that customer’s ability to pay for the services provided. If we subsequently determine that collection from the customer is not reasonably assured, we record an allowance for doubtful accounts and bad debt expense or deferred revenue for all of that customer’s unpaid invoices and ceases recognizing revenue for continued services provided until cash is received.
Accounts Receivable and Related Reserves
Trade accounts receivable are recorded at the invoiced amounts and do not bear interest. We record reserves as a reduction of our accounts receivable balance. Estimates are used in determining these reserves. We calculate the allowance for doubtful accounts using the aging of the accounts receivable method. Under this method, the allowance for doubtful accounts is based upon a calculation that uses our aging of accounts receivable and applies a reserve percentage to the specific age of the receivable to estimate the allowance for doubtful accounts. These estimates could change significantly if our customers’ financial condition changes or if the economy in general deteriorates. We perform on-going credit evaluations of our customers. If such an evaluation indicates that payment is no longer reasonably assured for current services provided, any future services provided to that customer will result in the deferral of revenue until payment is made or we determine payment is reasonably assured. In addition, we record a reserve for service credits. Reserves for service credits are measured based on an analysis of credits to be issued after the month of billing related to management’s estimate of the resolution of customer disputes and billing adjustments. We do not have any off-balance sheet credit exposure related to our customers.
Share-Based Compensation
We account for our share-based compensation awards using the fair-value method. The grant date fair value was determined using the Black-Scholes-Merton pricing model. The Black-Scholes-Merton valuation calculation
51
Table of Contents
requires us to make key assumptions such as future stock price volatility, expected terms, risk-free rates and dividend yield. The weighted-average expected term for stock options granted was calculated using the simplified method. The simplified method defines the expected term as the average of the contractual term and the vesting period of the stock option. We have estimated the volatility rates used as inputs to the model based on our volatility rate as a publicly traded company and an analysis of the most similar public companies for which we have data. We have used judgment in selecting these companies, as well as in evaluating the available historical volatility data for these companies.
We develop an estimate of the number of share-based awards which will be forfeited due to employee turnover. Annual changes in the estimated forfeiture rate may have a significant effect on share-based payments expense, as the effect of adjusting the rate for all expense amortization after January 1, 2006 is recognized in the period the forfeiture estimate is changed. If the actual forfeiture rate is higher than the estimated forfeiture rate, then an adjustment is made to increase the estimated forfeiture rate, which will result in a decrease to the expense recognized in the financial statements. If the actual forfeiture rate is lower than the estimated forfeiture rate, then an adjustment is made to decrease the estimated forfeiture rate, which will result in an increase to the expense recognized in the financial statements. The risk-free rate is based on the United States Treasury yield curve in effect at the time of grant. We have never paid cash dividends, and do not currently intend to pay cash dividends, and thus have assumed a 0% dividend yield.
We will continue to use judgment in evaluating the expected term, volatility and forfeiture rate related to our own share-based awards on a prospective basis, and in incorporating these factors into the model. If our actual experience differs significantly from the assumptions used to compute our share-based compensation cost, or if different assumptions had been used, we may have recorded too much or too little share-based compensation cost.
We recognize share-based compensation expense using the straight-line attribution method. We also estimate when and if performance-based awards will be earned. If an award is not considered probable of being earned, no amount of stock-based compensation is recognized. If the award is deemed probable of being earned, related compensation expense is recorded over the estimated service period. To the extent our estimates of awards considered probable of being earned changes, the amount of stock-based compensation recognized will also change. We recorded share-based compensation expense related to stock options, restricted stock and RSUs of $17.4 million, $17.5 million and $18.1 million during the years ended December 31, 2010, 2009 and 2008, respectively. Unrecognized share-based compensation expense totaled $27.5 million at December 31, 2010 based on current outstanding stock options and restricted stock units, of which we expect to recognize over a weighted average period of 2.58 years. We expect to amortize $13.3 million during 2011; $7.2 million in 2012 and the remainder thereafter of the unrecognized share-based compensation at December 31, 2010 based upon the scheduled vesting of the options and restricted stock units outstanding at that time. We expect our share-based payments expense to increase in 2011 and potentially to increase thereafter as we grant additional stock options and restricted stock awards.
Contingencies
We record contingent liabilities resulting from asserted and unasserted claims against us, when it is probable that a liability has been incurred and the amount of the loss is reasonably estimable. We disclose contingent liabilities when there is a reasonable possibility that the ultimate loss will exceed the recorded liability. Estimating probable losses requires analysis of multiple factors, in some cases including judgments about the potential actions of third party claimants and courts. Therefore, actual losses in any future period are inherently uncertain. With regard to our litigation with Akamai, during our financial statement close process for the year ended December 31, 2008, we evaluated if additional accrual amounts were required at each reporting period. We would record additional accrual amounts to the extent we determine amounts are probable of being paid and also reasonably estimable. On April 24, 2009 the court issued its order and memorandum setting aside the adverse jury verdict and ruling that we did not infringe Akamai’s ‘703 patent and that we are entitled to judgment
52
Table of Contents
as a matter of law. Based upon the court’s April 24, 2009 order we have reversed the $65.6 million provision for litigation previously recorded for this lawsuit as we no longer believe that payment of any amounts represented by the litigation provision is probable. The court entered final judgment in our favor. Akamai filed a notice of appeal of the court’s decision on May 26, 2009. The court heard arguments by both parties on June 7, 2010. On December 20, 2010 the Court of Appeals for the Federal Circuit issued its opinion affirming the District Court’s entry of judgment in our favor. On February 18, 2011, Akamai filed a motion with the Court of Appeals for the Federal Circuit seeking a rehearing and rehearing en banc. We believe that we do not infringe Akamai’s patents and will continue to vigorously defend our position. In light of the favorable ruling from the Court of Appeals we do not believe that a loss is probable. Therefore, we have made no provision for this lawsuit in our financial statements. We cannot assure you that this lawsuit ultimately will be resolved in our favor.
Contingent Consideration
Contingent consideration is included in Other Current Liabilities or as a component of Equity on our consolidated Balance Sheet depending upon characteristics of the obligation. In connection with certain of our acquisitions, additional contingent considerations may be earned in the future by the selling entity upon completion of certain financial milestones. We record a liability or equity that is recognized on the acquisition date for an estimate of the acquisition date fair value of the contingent consideration based on the probability of achieving the milestones and the probability weighted discount on cash flows. Any change in the fair value of contingent milestone consideration subsequent to the acquisition date is recognized in the consolidated statements of income. Contingent consideration classified as a liability is re-measured to fair value each reporting period until the contingency is resolved. The changes in fair value are recognized in earnings. Contingent consideration classified as equity is not re-measured.
Deferred Taxes and Uncertain Tax Positions
We utilize the liability method of accounting for income taxes. We record net deferred tax assets to the extent we believe these assets will more likely than not be realized. In making such determination, we consider all available positive and negative evidence, including scheduled reversals of deferred tax liabilities, projected future taxable income, tax planning strategies and recent financial performance. ASC 740 states that forming a conclusion that a valuation allowance is not required is difficult when there is negative evidence such as cumulative losses in recent years. As a result of our recent cumulative losses, we have recorded a valuation allowance to reduce our deferred tax assets to the amount that is more likely than not to be realized. In the event we were to determine that we would be able to realize our deferred income tax assets in the future in excess of their net recorded amount, we would make an adjustment to the valuation allowance which would reduce the provision for income taxes in the period of such realization.
We adopted the provisions of ASC 740 (formerly FIN 48, Accounting for Uncertainty in Income Taxes), on January 1, 2007, which clarifies the accounting for uncertainty in income taxes recognized in the financial statements in accordance with SFAS No. 109, Accounting for Income Taxes. The standard provides that a tax benefit from an uncertain tax position may be recognized when it is more likely than not that the position will be sustained upon examination, including resolutions of any related appeals or litigation processes, based on the technical merits. Income tax positions must meet a more-likely-than-not recognition threshold at the effective date to be recognized upon the adoption of the standard and in subsequent periods. This interpretation also provides guidance on measurement, de-recognition, classification, interest and penalties, accounting in interim periods, disclosure and transition. The adoption of the standard did not result in the recognition of an adjustment for the cumulative effect of adoption of a new accounting principle. The unrecognized tax benefit decreased from January 1, 2010 to December 31, 2010. We anticipate that our unrecognized tax benefits will continue to decrease within twelve months of the reporting date, as a result of settling potential tax liabilities in certain foreign jurisdictions. We recognize interest and penalties related to unrecognized tax benefits in our tax provision. As of December 31, 2010, we had an interest and penalties accrual related to unrecognized tax benefits of $113,000, which decreased $112,000 during 2010.
53
Table of Contents
Our effective tax rate is influenced by the recognition of tax positions pursuant to the more likely than not standard that such positions will be sustained by the taxing authority. In addition, other factors such as changes in tax laws, rulings by taxing authorities and court decisions, and significant changes in our operations through acquisitions or divestitures can have a material impact on the effective tax rate. Differences between our estimated and actual effective income tax rates and related liabilities are recorded in the period they become known.
We conduct business in various foreign countries. As a multinational corporation, we are subject to taxation in multiple locations, and the calculation of our foreign tax liabilities involves dealing with uncertainties in the application of complex tax laws and regulations in various taxing jurisdictions. We have subjected the profits of certain foreign subsidiaries to United States tax. If we ultimately determine that the payment of these liabilities will be unnecessary, we reverse the liability and recognize a tax benefit during the period in which we determine the liability no longer applies. Conversely, we record additional tax charges in a period in which we determine that a recorded tax liability is less than we expect the ultimate assessment to be.
The application of tax laws and regulations is subject to legal and factual interpretation, judgment and uncertainty. Tax laws and regulations themselves are subject to change as a result of changes in fiscal policy, changes in legislation, the evolution of regulations and court rulings. Therefore, the actual liability for United States or foreign taxes may be materially different from our estimates, which could result in the need to record additional tax liabilities or potentially reverse previously recorded tax liabilities.
Results of Operations
Comparison of the Years Ended December 31, 2010 and 2009
Revenue
| Year Ended December 31, | Increase (Decrease) |
Percent Change |
||||||||||||||
| 2010 | 2009 | |||||||||||||||
| (in thousands) | ||||||||||||||||
| Revenue |
$ | 183,327 | $ | 131,663 | $ | 51,664 | 39 | % | ||||||||
Revenue increased 39%, or $51.7 million, to $183.3 million for the year ended December 31, 2010 as compared to $131.7 million for the year ended December 31, 2009. The increase in revenue for the year ended December 31, 2010 as compared to the year ended December 31, 2009, was primarily attributable to an increase in our cloud based services revenue (which includes revenue from the date of acquisition of chors, EyeWonder and Delve) of approximately $39.3 million. We provide cloud based services in the following areas: website and enterprise application acceleration, mobile content delivery, online and mobile ad serving, rich media ad unit design and creation, cloud storage, transcoding, computing functions and strategic consulting. We continued to increase the amount of traffic moving through our network; however we continue to see a decline in our average unit sales price. Our core delivery revenue increased approximately $12.3 million, for the year ended December 31, 2010, compared to the year ended December 31, 2009. As of December 31, 2010, we had approximately 1,824 customers as compared to approximately 1,370 as of December 31, 2009.
For the years ended December 31, 2010 and 2009, approximately 29% and 22%, respectively, of our total revenues were derived from our operations located outside of North America. For the years ended December 31, 2010 and 2009, we derived approximately 65% and 69%, respectively, of our international revenue from EMEA and approximately 35% and 31%, respectively, of our international revenue from Asia Pacific. No single country outside of the United States accounted for 10% or more of revenues during these periods.
54
Table of Contents
Cost of Revenue
| Year Ended December 31, | Increase (Decrease) |
Percent Change |
||||||||||||||
| 2010 | 2009 | |||||||||||||||
| (in thousands) | ||||||||||||||||
| Cost of revenue |
$ | 102,719 | $ | 85,623 | $ | 17,096 | 20 | % | ||||||||
Cost of revenue includes fees paid to network providers for bandwidth and backbone, costs incurred for non settlement free peering and connection to Internet service provider networks or ISPs, and fees paid to data center operators for co-location of our network equipment. Cost of revenue also includes depreciation of network equipment used to deliver our CDN services, payroll and related costs and equity-related compensation for our network operations, operations and cloud based services personnel.
Cost of revenue increased 20%, or $17.1 million, to $102.7 million for the year ended December 31, 2010 as compared to $85.6 million for the year ended December 31, 2009. These increases were primarily due to an increase in payroll and related employee costs of $9.7 million associated with increased staff to build and operate our CDN, as well as increased operations personnel resulting from our business acquisitions whose primary focus is on our delivery of cloud based services, an increase in aggregate bandwidth and co-location fees of $5.6 million due to higher traffic levels and increased amounts of deployed network assets, an increase in travel and travel related expenses of $0.5 million, and an increase in other costs of $3.1 million. The increase in other costs was primarily related to costs associated with cloud based services and the sale of equipment to certain of our customers. These increases were off-set by a reduction in depreciation expense of network equipment of $1.6 million.
Additionally, for both the years ended December 31, 2010 and 2009, cost of revenue includes share-based compensation expense of approximately $2.4 million.
Cost of revenue in 2010 and 2009 was composed of the following:
| Year Ended December 31, | ||||||||
| 2010 | 2009 | |||||||
| (in millions) | ||||||||
| Bandwidth and co-location fees |
$ | 51.5 | $ | 45.9 | ||||
| Depreciation — network |
22.4 | 24.0 | ||||||
| Payroll and related employee costs |
18.6 | 8.9 | ||||||
| Share-based compensation expense |
2.4 | 2.4 | ||||||
| Travel and travel-related expenses |
0.8 | 0.3 | ||||||
| Professional fees and outside services |
0.7 | 0.6 | ||||||
| Royalty expenses |
0.4 | 0.7 | ||||||
| Other costs |
5.9 | 2.8 | ||||||
| Total cost of revenue |
$ | 102.7 | $ | 85.6 | ||||
We anticipate cost of revenues will increase in 2011 which will include a full year of expenses from our business acquisitions. We expect to deliver more traffic on our network, which would result in higher expenses associated with the increased bandwidth, peering, rack and co-location costs to support increased traffic; however, such costs are likely to be partially offset by lower bandwidth costs per unit. We anticipate depreciation expense related to our network equipment to increase compared to 2010 in absolute dollars, as we continue to expand our network and to re-fresh older servers. Additionally, we expect an increase in payroll and related costs, as we continue to make investments in our network to service our expanding customer base as well as our increase in cloud based services personnel. We expect that share-based compensation expense will remain consistent with 2010.
55
Table of Contents
General and Administrative
| Year Ended December 31, | Increase (Decrease) |
Percent Change |
||||||||||||||
| 2010 | 2009 | |||||||||||||||
| (in thousands) | ||||||||||||||||
| General and administrative |
$ | 35,760 | $ | 34,128 | $ | 1,632 | 5 | % | ||||||||
General and administrative expenses consist primarily of the following components:
| • | payroll, share-based compensation and other related costs, including related expenses for executive, finance, legal, business applications, internal network management, human resources and other administrative personnel; |
| • | fees for professional services and litigation expenses; |
| • | rent and other facility-related expenditures for leased properties; |
| • | the provision for doubtful accounts; and |
| • | non-income related taxes. |
General and administrative expenses increased 5%, or $1.6 million, to $35.8 million for the year ended December 31, 2010 as compared to $34.1 million for the year ended December 31, 2009. The increase in general and administrative expenses was primarily due to an increase of $4.6 million in payroll and related employee cost, primarily due to increased personnel resulting from our business acquisitions and bonus accruals for our annual bonus plan, an increase in other costs of $3.2 million, primarily due to increased facilities and facilities related costs of $1.3 million, increased fees, licenses and non-income taxes of $1.2 million, increased telephone costs of $0.4 million and an increase in general office expenses (office and computer supplies, postage and shipping) of approximately $0.2 million. Other expenses include such items as rent, utilities, telephone, insurance, fees and licenses and property taxes. In addition, travel and travel related expenses increased $0.5 million during 2010. These increases were off-set by a decrease of $3.2 million in litigation expenses related to our decreased activity pertaining to litigation with Akamai and MIT, and Level 3, a decrease in professional fees of $0.4 million, primarily lower accounting fees, off-set by increased recruiting, outside services and general legal fees, and a decrease of $2.3 million in bad debt expense.
Additionally, general and administrative share-based compensation expense decreased $0.7 million for the year ended December 31, 2010 compared to December 31, 2009.
General and administrative expenses in 2010 and 2009 were composed of the following:
| Year Ended December 31, | ||||||||
| 2010 | 2009 | |||||||
| (in millions) | ||||||||
| Payroll and related employee costs |
$ | 10.4 | $ | 5.8 | ||||
| Share-based compensation |
6.9 | 7.6 | ||||||
| Professional fees |
6.8 | 7.2 | ||||||
| Litigation expenses |
2.2 | 5.4 | ||||||
| Bad debt expense |
1.4 | 3.7 | ||||||
| Travel and travel related expenses |
0.9 | 0.4 | ||||||
| Other expenses |
7.2 | 4.0 | ||||||
| Total general and administrative |
$ | 35.8 | $ | 34.1 | ||||
We expect our general and administrative expense to remain consistent with 2010 in absolute dollars and decrease as a percentage of revenue. During 2011, (which will include a full year of expenses from our business
56
Table of Contents
acquisitions) we expect to see increased salaries and related employee cost, as well as increased facility costs. These increases will be off-set by lower litigation costs and reduced professional fees. In 2012 and in the longer term, we expect our general and administrative expense to decrease as a percentage of revenue as our costs are expected to grow slower than our top line revenue. We expect that share-based compensation expense will increase slightly in 2011.
Sales and Marketing
| Year Ended December 31, | Increase (Decrease) |
Percent Change |
||||||||||||||
| 2010 | 2009 | |||||||||||||||
| (in thousands) | ||||||||||||||||
| Sales and marketing |
$ | 46,752 | $ | 32,587 | $ | 14,165 | 43 | % | ||||||||
Sales and marketing expenses consist primarily of payroll and related costs, share-based compensation and commissions for personnel engaged in marketing, sales and service support functions, professional fees (consultants and recruiting fees), travel and travel-related expenses as well as advertising and promotional expenses.
Sales and marketing expenses increased 43%, or $14.2 million, to $46.8 million for the year ended December 31, 2010, as compared to $32.6 million for the year ended December 31, 2009. The increase in sales and marketing expenses was primarily due to an increase in payroll and related employee costs of $10.3 million, primarily due to increased staffing, which resulted in higher salaries, commissions and bonuses, plus the addition of sales and marketing personnel from our business acquisitions, an increase in travel and travel-related expenses of $1.4 million, an increase in marketing expenses of $1.3 million, an increase in professional fees for outside services of approximately $0.3 million, and an increase in other expenses of $0.9 million. Other expenses include such items as rent and property taxes for our Europe and Asia Pacific sales offices, fees, licenses and non-income taxes, telephone and office supplies.
Additionally, sales and marketing share-based compensation expense was $5.0 million for both of the years ended December 31, 2010 and 2009.
Sales and marketing expenses in 2010 and 2009 were composed of the following:
| Year Ended December 31, | ||||||||
| 2010 | 2009 | |||||||
| (in millions) | ||||||||
| Payroll and related employee costs |
$ | 30.4 | $ | 20.1 | ||||
| Share-based compensation expense |
5.0 | 5.0 | ||||||
| Travel and travel-related expense |
3.8 | 2.4 | ||||||
| Marketing programs |
2.2 | 0.9 | ||||||
| Professional fees and outside services |
1.9 | 1.6 | ||||||
| Other expenses |
3.5 | 2.6 | ||||||
| Total sales and marketing |
$ | 46.8 | $ | 32.6 | ||||
We anticipate our sales and marketing expense will increase in 2011 in absolute dollars and decrease slightly as a percentage of revenue compared to 2010. The increase in absolute dollars (which will include a full year of expenses from our business acquisitions) is due to an expected increase in salaries and related employee costs for our sales and marketing personnel, increased commissions on higher forecast sales, and an increase in marketing costs such as advertising and other lead generating activities. We expect that share-based compensation expense will increase in 2011.
57
Table of Contents
Research and Development
| Year Ended December 31, | Increase (Decrease) |
Percent Change |
||||||||||||||
| 2010 | 2009 | |||||||||||||||
| (in thousands) | ||||||||||||||||
| Research and development |
$ | 15,755 | $ | 7,937 | $ | 7,818 | 99 | % | ||||||||
Research and development expenses consist primarily of payroll and related costs and share-based compensation expense for research and development personnel who design, develop, test and enhance our services, network and software.
Research and development expenses increased 99%, or $7.8 million, to $15.8 million for the year ended December 31, 2010, as compared to $7.9 million for the year ended December 31, 2009. The increase in research and development expenses was primarily due to an increase of $5.1 million in payroll and related employee costs associated with our hiring of additional network and software engineering personnel, bonus accruals for our annual bonus plan, and the addition of research and development personnel resulting from our business acquisitions, an increase in professional fees and outside services of $1.4 million, primarily for consulting and contract labor, an increase in share-based compensation of $0.6 million, and an increase in other expenses of $0.8 million. Other expenses include such items as travel and travel related expenses, telephone, training and seminars and office supplies.
Research and development expenses in 2010 and 2009 were composed of the following:
| Year Ended December 31, | ||||||||
| 2010 | 2009 | |||||||
| (in millions) | ||||||||
| Payroll and related employee costs |
$ | 9.7 | $ | 4.6 | ||||
| Share-based compensation expense |
3.1 | 2.5 | ||||||
| Professional fees and outside services |
2.0 | 0.6 | ||||||
| Other |
1.0 | 0.2 | ||||||
| Total research and development |
$ | 15.8 | $ | 7.9 | ||||
We anticipate our research and development expenses will increase in 2011 (which will include a full year of expenses from our business acquisitions) in absolute dollars and increase as a percentage of revenue as we continue to make investments in our core technology, refinements and additions to our other service offerings. We expect increased payroll and related employee costs associated with continued hiring of research and development personnel, as well as increased professional fees for outside services. We expect that share-based compensation expense will increase slightly in 2011.
Depreciation and Amortization (Operating Expenses)
| Year Ended December 31, | Increase (Decrease) |
Percent Change |
||||||||||||||
| 2010 | 2009 | |||||||||||||||
| (in thousands) | ||||||||||||||||
| Depreciation and amortization |
$ | 6,359 | $ | 2,351 | $ | 4,008 | 170 | % | ||||||||
Depreciation expense consists of depreciation on equipment and furnishing used by general administrative, sales and marketing and research and development personnel. Amortization expense consists of amortization of intangible assets acquired in business combinations.
Depreciation and amortization expenses increased 170%, or $4.0 million, to $6.4 million for the year December 31, 2010, as compared to $2.4 million for the year ended December 31, 2009. The increase in
58
Table of Contents
depreciation and amortization expense was primarily due to an increase of approximately $3.8 million in amortization of intangibles acquired in business combinations. For the year ended December 31, 2010, amortization of intangibles was approximately $3.9 million. Based on our intangible assets at December 31, 2010, we expect amortization of other intangible assets to be approximately $5.6 million for 2011, and $5.4 million, $4.9 million and $1.7 million for fiscal years 2012, 2013 and 2014, respectively.
Provision for Litigation
| Year Ended December 31, | Increase (Decrease) |
Percent Change |
||||||||||||||
| 2010 | 2009 | |||||||||||||||
| (in thousands) | ||||||||||||||||
| Provision for Litigation |
$ | — | $ | (65,645 | ) | $ | 65,645 | 100 | % | |||||||
The provision for litigation related to our accrual for potential damages and interest associated with revenue generated from allegedly infringing methods associated with the Akamai litigation. At December 31, 2008, the total accrual was $65.6 million. Based upon an April 24, 2009 court order setting aside the adverse jury verdict and ruling that we did not infringe Akamai’s ‘703 patent and that we are entitled to judgment as a matter of law, we reversed this provision for litigation of $65.6 million during the first quarter of 2009 as we no longer believe that payment of any amounts represented by the litigation provision is probable.
Interest Expense
| Year Ended December 31, | Increase (Decrease) |
Percent Change |
||||||||||||||
| 2010 | 2009 | |||||||||||||||
| (in thousands) | ||||||||||||||||
| Interest expense |
$ | 77 | $ | 39 | $ | 38 | 100 | % | ||||||||
Interest expense consists of interest paid and the amortization of deferred financing costs.
Interest expense increased 100%, or $39,000, to $77,000 for the year ended December 30, 2010, as compared to $39,000 for the year ended December 31, 2009. Interest expense for the year ended December 31, 2010 included interest paid in association with a filing of non-income tax related payments and interest paid on capital leases. The $39,000 for the year ended December 31, 2009 represents the amortization of loan fees associated with a then unused line of credit. The line of credit expired on October 31, 2009 and we did not renew it. As of December 31, 2010, with the exception of our capital leases, we had no outstanding credit facilities.
Interest Income
| Year Ended December 31, | Increase (Decrease) |
Percent Change |
||||||||||||||
| 2010 | 2009 | |||||||||||||||
| (in thousands) | ||||||||||||||||
| Interest income |
$ | 914 | $ | 1,345 | $ | (431 | ) | (32 | )% | |||||||
Interest income includes interest earned on invested cash balances and marketable securities.
Interest income decreased 32%, or $0.4 million to $0.9 million for the year ended December 31, 2010, as compared to $1.3 million for the year ended December 31, 2009. The decrease in interest income was primarily due to decreased cash balances. During 2011, we anticipate interest income to increase as a result of expected increased average cash balances.
59
Table of Contents
Other (Expense) Income
| Year Ended December 31, | Increase (Decrease) |
Percent Change |
||||||||||||||
| 2010 | 2009 | |||||||||||||||
| (in thousands) | ||||||||||||||||
| Other (expense) income |
$ | (222 | ) | $ | (14 | ) | $ | 208 | 1,486 | % | ||||||
Other expense increased $208,000 to $222,000 for year ended December 31, 2010, as compared to $14,000 for the year ended December 31, 2009. Other expense for the year ended December 31, 2010 consists primarily of foreign exchange losses resulting from the re-measurement of certain accounts payable and value added tax receivable/payable denominated in a foreign currency of approximately $123,000. Loss on disposals of assets for 2010 accounted for $45,000. Additionally, miscellaneous other expense for the year ended December 31, 2010 was $18,000. Other expense for the year ended December 31, 2009 includes loss on disposal of assets of $139,000, and a non-income tax payment of approximately $64,000, partially offset by net foreign exchange gains of $155,000 and other miscellaneous income of $34,000.
Income Tax (Benefit) Expense
| Year Ended December 31, | Increase (Decrease) |
Percent Change |
||||||||||||||
| 2010 | 2009 | |||||||||||||||
| (in thousands) | ||||||||||||||||
| Income tax (benefit) expense |
$ | (3,052 | ) | $ | 1,084 | $ | (4,136 | ) | (382 | )% | ||||||
We had an income tax benefit during the year ended December 31, 2010 of $3.1 million or 13% of our pre-tax loss of $23.4 million which was different than our statutory income tax rate due primarily to the effect of the change in valuation allowance as a result of our acquisition of EyeWonder for the year ended December 31, 2010. For the year ended December 31, 2009, we had an income tax provision of $1.1 million or 3% of our pre-tax income of $36.0 million.
Comparison of the Years Ended December 31, 2009 and 2008
Revenue
| Year Ended December 31, | Increase (Decrease) |
Percent Change |
||||||||||||||
| 2009 | 2008 | |||||||||||||||
| (in thousands) | ||||||||||||||||
| Revenue |
$ | 131,663 | $ | 129,530 | $ | 2,133 | 2 | % | ||||||||
Revenue increased 2%, or $2.1 million, to $131.7 million for the year ended December 31, 2009 as compared to $129.5 million for the year ended December 31, 2008. The increase in revenue for the year ended December 31, 2009 as compared to 2008 was primarily attributable to an increase in professional services revenue of approximately $1.7 million. Our CDN service revenue increased $0.2 million which was the result of increased traffic moving through our network (which was partially off-set by a decrease in average unit sales price) and to a lesser extent by the increased number of customers under recurring revenue contracts. As of December 31, 2009, we had approximately 1,370 customers under recurring CDN service revenue contracts as compared to approximately 1,330 as of December 31, 2008.
For the years ended December 31, 2009 and 2008, approximately 22% and 16%, respectively, of our total revenues were derived from our operations located outside of the United States. For the years ended December 31, 2009 and 2008, we derived approximately 69% and 75%, respectively, of our international revenue from Europe and approximately 31% and 25%, respectively, of our international revenue from Asia Pacific.
60
Table of Contents
Cost of Revenue
| Year Ended December 31, | Increase (Decrease) |
Percent Change |
||||||||||||||
| 2009 | 2008 | |||||||||||||||
| (in thousands) | ||||||||||||||||
| Cost of revenue |
$ | 85,623 | $ | 83,861 | $ | 1,762 | 2 | % | ||||||||
Cost of revenue includes fees paid to network providers for bandwidth and backbone, costs incurred for non settlement free peering and connection to Internet service provider networks or ISPs, and fees paid to data center operators for co-location of our network equipment. Cost of revenue also includes payroll and related costs, depreciation of network equipment used to deliver our CDN services and equity-related compensation for network operations personnel.
Cost of revenue increased 2%, or $1.8 million, to $85.6 million for the year ended December 31, 2009 as compared to $83.9 million for the year ended December 31, 2008. This increase was primarily due to an increase in payroll and related employee costs of $2.1 million associated with increased staff and to a lesser extent increases in other costs of $0.6 million, primarily related to a re-negotiated contract with a third party vendor, an increase in professional fees of $0.4 million, due to increased consulting and casual labor and a increase in bandwidth and co-location fees of $0.3 million. These increases were partially off-set by a decrease in depreciation expense of network equipment of $1.7 million due to certain network assets being fully depreciated.
Additionally, for the years ended December 31, 2009 and 2008, cost of revenue includes share-based compensation expense of approximately $2.4 million and $2.2 million, respectively.
Cost of revenue in 2009 and 2008 was composed of the following:
| Year Ended December 31, | ||||||||
| 2009 | 2008 | |||||||
| (in millions) | ||||||||
| Bandwidth and co-location fees |
$ | 45.9 | $ | 45.6 | ||||
| Depreciation — network |
24.0 | 25.7 | ||||||
| Payroll and related employee costs |
8.9 | 6.8 | ||||||
| Share-based compensation expense |
2.4 | 2.2 | ||||||
| Travel and travel-related expenses |
0.3 | 0.4 | ||||||
| Professional fees and outside services |
0.6 | 0.2 | ||||||
| Royalty expenses |
0.7 | 0.8 | ||||||
| Other costs |
2.8 | 2.2 | ||||||
| Total cost of revenue |
$ | 85.6 | $ | 83.9 | ||||
General and Administrative
| Year Ended December 31, | Increase (Decrease) |
Percent Change |
||||||||||||||
| 2009 | 2008 | |||||||||||||||
| (in thousands) | ||||||||||||||||
| General and administrative |
$ | 34,128 | $ | 52,440 | $ | (18,312 | ) | (35 | )% | |||||||
General and administrative expenses consist primarily of the following components:
| • | payroll, share-based compensation and other related costs, including related expenses for executive, finance, legal, business applications, internal network management, human resources and other administrative personnel; |
| • | fees for professional services and litigation expenses; |
61
Table of Contents
| • | rent and other facility-related expenditures for leased properties; |
| • | the provision for doubtful accounts; and |
| • | non-income related taxes. |
General and administrative expenses decreased 35%, or $18.3 million, to $34.1 million for the year ended December 31, 2009 as compared to $52.4 million for the year ended December 31, 2008. The decrease in general and administrative expenses was primarily due to a decrease of $15.4 million in litigation expenses, a decrease in bad debt expense of $1.7 million and a decrease in other costs of $0.7 million. The decrease in other costs is primarily due to a decrease in property taxes of approximately $0.8 million, off-set by increased utilities of approximately $0.1 million. Other expenses include such items as rent, utilities, telephone, insurance, fees and licenses and property taxes.
Additionally, general and administrative share-based compensation expense decreased $0.5 million for the year ended December 31, 2009 compared to December 31, 2008.
General and administrative expenses in 2009 and 2008 were composed of the following:
| Year Ended December 31, | ||||||||
| 2009 | 2008 | |||||||
| (in millions) | ||||||||
| Share-based compensation |
$ | 7.6 | $ | 8.1 | ||||
| Professional fees |
7.2 | 7.2 | ||||||
| Payroll and related employee costs |
5.8 | 5.8 | ||||||
| Litigation expenses |
5.4 | 20.8 | ||||||
| Bad debt expense |
3.7 | 5.4 | ||||||
| Travel and travel related expenses |
0.4 | 0.4 | ||||||
| Other expenses |
4.0 | 4.7 | ||||||
| Total general and administrative |
$ | 34.1 | $ | 52.4 | ||||
Sales and Marketing
| Year Ended December 31, | Increase (Decrease) |
Percent Change |
||||||||||||||
| 2009 | 2008 | |||||||||||||||
| (in thousands) | ||||||||||||||||
| Sales and marketing |
$ | 32,587 | $ | 34,916 | $ | (2,329 | ) | (7 | )% | |||||||
Sales and marketing expenses consist primarily of payroll and related costs, share-based compensation and commissions for personnel engaged in marketing, sales and service support functions, professional fees (consultants and recruiting fees), travel and travel-related expenses as well as advertising and promotional expenses.
Sales and marketing expenses decreased 7%, or $2.3 million, to $32.6 million for the year ended December 31, 2009, as compared to $34.9 million for the year ended December 31, 2008. The decrease in sales and marketing expenses was primarily due to a decrease of $1.3 million in marketing programs, a decrease of $0.6 million in professional fees and outside services, primarily due to lower marketing consulting costs, and a decrease of $0.1 million in payroll and related employee costs primarily due to lower commission payments. These decreases were off-set by an increase of $0.1 million in other expenses. Other expense included such items as rent and property taxes for our Europe and Asia Pacific sales offices, training, telephone and office supplies.
Additionally, sales and marketing share-based compensation expense decreased $0.4 million for the year ended December 31, 2009 compared to December 31, 2008.
62
Table of Contents
Sales and marketing expenses in 2009 and 2008 were composed of the following:
| Year Ended December 31, | ||||||||
| 2009 | 2008 | |||||||
| (in millions) | ||||||||
| Payroll and related employee costs |
$ | 20.1 | $ | 20.2 | ||||
| Share-based compensation expense |
5.0 | 5.4 | ||||||
| Travel and travel-related expense |
2.4 | 2.4 | ||||||
| Marketing programs |
0.9 | 2.2 | ||||||
| Professional fees and outside services |
1.6 | 2.2 | ||||||
| Other expenses |
2.6 | 2.5 | ||||||
| Total sales and marketing |
$ | 32.6 | $ | 34.9 | ||||
Research and Development
| Year Ended December 31, | Increase (Decrease) |
Percent Change |
||||||||||||||
| 2009 | 2008 | |||||||||||||||
| (in thousands) | ||||||||||||||||
| Research and development |
$ | 7,937 | $ | 7,365 | $ | 572 | 8 | % | ||||||||
Research and development expenses consist primarily of payroll and related costs and share-based compensation expense for research and development personnel who design, develop, test and enhance our services, network and software.
Research and development expenses increased 8%, or $0.5 million, to $7.9 million for the year ended December 31, 2009, as compared to $7.4 million for year ended December 31, 2008. The increase in research and development was primarily due to an increase of $1.1 million in payroll and related employee costs associated with our hiring of additional network and software engineering personnel, the addition of Kiptronic research and development personnel, and an increase of $0.1 million in share-based compensation. These increases were partially offset by a decrease in professional fees and outside services of $0.7 million. The decrease in professional fees and outside services was primarily due to lower consulting and contract labor costs. Other expenses remained at $0.2 million which includes such items as travel and travel related expenses, telephone, and office supplies.
Research and development expenses in 2009 and 2008 were composed of the following:
| Year Ended December 31, | ||||||||
| 2009 | 2008 | |||||||
| (in millions) | ||||||||
| Payroll and related employee costs |
$ | 4.6 | $ | 3.5 | ||||
| Share-based compensation expense |
2.5 | 2.4 | ||||||
| Professional fees and outside services |
0.6 | 1.3 | ||||||
| Other |
0.2 | 0.2 | ||||||
| Total research and development |
$ | 7.9 | $ | 7.4 | ||||
Provision for Litigation
| Year Ended December 31, | Increase (Decrease) |
Percent Change |
||||||||||||||
| 2009 | 2008 | |||||||||||||||
| (in thousands) | ||||||||||||||||
| Provision for Litigation |
$ | (65,645 | ) | $ | 17,515 | $ | (83,160 | ) | (475 | )% | ||||||
63
Table of Contents
The provision for litigation related to our accrual for potential damages and interest associated with revenue generated from allegedly infringing methods associated with the Akamai litigation. During the year ended December 31, 2008 we accrued potential additional damages of $15.5 million plus additional interest of $2.0 million to bring the total accrual to $65.6 million. Based upon an April 24, 2009 court order setting aside the adverse jury verdict and ruling that we did not infringe Akamai’s ‘703 patent and that we are entitled to judgment as a matter of law, we reversed this provision for litigation of $65.6 million in 2009, as we no longer believe that payment of any amounts represented by the litigation provision is probable.
Interest Expense
| Year Ended December 31, | Increase (Decrease) |
Percent Change |
||||||||||||||
| 2009 | 2008 | |||||||||||||||
| (in thousands) | ||||||||||||||||
| Interest expense |
$ | 39 | $ | 55 | $ | (16 | ) | (29 | )% | |||||||
Interest expense consists of the amortization of deferred financing costs.
Interest expense decreased 29%, or $16,000 to $39,000 for the year ended December 31, 2009, as compared to $55,000 for the year ended December 31, 2008. For the years ended December 31, 2009 and 2008, respectively, interest expense represents the amortization of loan fees associated with our unused line of credit. The line of credit matured on October 31, 2009 and we did not renew it. As of December 31, 2009 and 2008, we had no outstanding balances due on any of our credit facilities.
Interest Income
| Year Ended December 31, | Increase (Decrease) |
Percent Change |
||||||||||||||
| 2009 | 2008 | |||||||||||||||
| (in thousands) | ||||||||||||||||
| Interest income |
$ | 1,345 | $ | 5,098 | $ | (3,753 | ) | (74 | )% | |||||||
Interest income includes interest earned on invested cash balances and marketable securities.
Interest income decreased 74%, or $3.8 million to $1.3 million for the year ended December 31, 2009, as compared to $5.1 million for the year ended December 31, 2008. The decrease in interest income was primarily due to lower market interest rates on decreased cash balances.
Other (Expense) Income
| Year Ended December 31, | Increase (Decrease) |
Percent Change |
||||||||||||||
| 2009 | 2008 | |||||||||||||||
| (in thousands) | ||||||||||||||||
| Other (expense) income |
$ | (14 | ) | $ | (171 | ) | $ | 157 | 92 | % | ||||||
Other (expense) income for the years ended December 31, 2009 and 2008, consists primarily of foreign exchange gains (losses) resulting from the re-measurement of accounts payable and receivables denominated in a foreign currency, and the effect of exchange rates on monetary balance sheet and income statement items resulting from foreign operations. Additionally, other income (expense) for the year ended December 31, 2009 includes a loss on disposal of assets of approximately $0.1 million and a non-income tax payment of approximately $64,000.
Income Tax Expense
| Year Ended December 31, | Increase (Decrease) |
Percent Change |
||||||||||||||
| 2009 | 2008 | |||||||||||||||
| (in thousands) | ||||||||||||||||
| Income tax expense |
$ | 1,084 | $ | 16 | $ | 1,068 | 6,675 | % | ||||||||
64
Table of Contents
We had an income tax provision during the year ended December 31, 2009 of $1.1 million or 3% of our pre-tax income of $36.0 million which was different than our statutory income tax rate due primarily to the effect of the change in valuation allowance, for the year ended December 31, 2009. For the year ended December 31, 2008, we had an income tax expense of $16,000 despite having a pre-tax loss of $63.1 million, due primarily to the increase in valuation allowance.
Liquidity and Capital Resources
To date, we have financed our operations primarily through the following transactions:
| • | private sales of common and preferred stock and subordinated notes; |
| • | an initial public offering of our common stock in June 2007; |
| • | an underwritten public offering of our common stock in March 2011; |
| • | borrowing on credit facilities; and |
| • | cash generated by operations. |
As of December 31, 2010, our cash, cash equivalents and marketable securities classified as current totaled $68.8 million.
Cash Flow for the Years Ended December 31, 2010, 2009 and 2008
Operating Activities
Net cash provided by operating activities improved by $14.7 million, with net cash provided by operating activities equaling $15.0 million for the year ended December 31, 2010, compared to net cash provided by operating activities of approximately $0.3 million for the year ended December 31, 2009. The increase in net cash provided by operating activities for the year ended December 31, 2010 compared to the year ended December 31, 2009, was primarily due to changes in operating assets and liabilities. Cash used due to changes in operating assets and liabilities was $7.5 million in the year ended December 31, 2010 compared to $17.7 million in the year ended December 31, 2009, a decrease in usage of $10.2 million. The change relates primarily to greater cash usage during the year ended December 31, 2009 related primarily to (1) increases in prepaid expenses and other current and long-term assets associated with advanced payments for backbone services with a telecommunications provider; (2) a decrease in accounts payable related to the timing of payments; (3) a decrease in other current liabilities primarily due to the payment of certain accrued legal fees and cost of sales accruals; and (4) a decrease in deferred revenue resulting from revenue recognition, offset by cash generated from a decrease in accounts receivable due to collection efforts during this period.
Net cash provided by operating activities was $0.3 million for the year ended December 31, 2009, compared to net cash used in operating activities of $6.8 million for the year ended December 31, 2008. The decrease in cash used in operating activities was primarily due to the net income for the year ended December 31, 2009 and changes in working capital resulting from decreases in accounts receivable of $2.3 million, partially offset by increases in other assets of $7.4 million, prepaid expenses of $1.9 million, income taxes receivable of $0.6 million, and decreases in accounts payable of $5.2 million, deferred revenue of $3.6 million and other current liabilities of $1.4 million. The decrease in accounts receivable is the result of increased focus on both the quality of our customers and our continued collection efforts. The increase in prepaid expenses and other assets is primarily comprised of the current and long-term portion of advanced payments made to a telecommunications provider. The decrease in accounts payable and other current liabilities primarily resulted from decreased legal activity and timing of payments for accounts payable. The decrease in deferred revenue primarily resulted from the amortization of our Multi-Element Arrangement.
We expect that cash provided by operating activities may not be sufficient to cover new purchases of property and equipment during 2011 and potential litigation expenses associated with patent litigation. The timing and amount of future working capital changes and our ability to manage our days sales outstanding will also affect the future amount of cash used in or provided by operating activities.
65
Table of Contents
Investing Activities
Cash used in investing activities was $48.1 million for the year ended December 31, 2010, compared to cash used in investing activities of $48.3 million for the year ended December 30, 2009. Cash used in investing activities was principally comprised of cash used for the acquisition of businesses, the purchase of short-term marketable securities and capital expenditures primarily for computer equipment associated with the build-out and expansion of our CDN, offset by cash generated from the sale of short-term marketable securities.
Cash used in investing activities changed $77.9 million to $48.3 million for the year ended December 31, 2009, compared to $29.6 million of cash provided by investing activities for the year ended December 31, 2008. The change relates to the timing of purchases and sales of short-term marketable securities and higher capital expenditures in 2009 primarily for network equipment associated with adding additional capacity and geographic expansion of our content delivery network.
In January 2010, we acquired chors Gmbh or chors, an on-line and direct marketing solutions provider located in Germany. Cash paid, net of cash acquired for the chors acquisition was approximately $2.0 million.
On April 30, 2010, we acquired EyeWonder, Inc. or EyeWonder. EyeWonder is a provider of interactive digital advertising products and services to advertisers, advertising agencies and publishers. The purchase price included both cash and company stock for the acquisition. Cash paid, net of cash acquired was approximately $61.9 million.
On July 30, 2010, we acquired Delve Networks, Inc. a privately-held provider of cloud-based video publishing and analytics services located in Seattle, Washington. The transaction was completed with a combination of our common stock and cash. Cash paid, net of cash acquired, was $2.6 million excluding a potential earn-out payment of $0.1 million.
We expect to have ongoing capital expenditure requirements as we continue to invest in and expand our CDN. We currently anticipate making aggregate capital expenditures of approximately 15% of total revenue in 2011.
Financing Activities
Net cash used in financing activities decreased approximately $0.4 million, to $40,000 for the year ended December 31, 2010. Cash used in financing activities relates to proceeds from the exercise of stock options which were $1.9 million for the year ended December 31, 2010, as compared to $0.3 million for the year ended December 31, 2009, off-set by payments of employee tax withholdings related to restricted stock of approximately $1.6 million and payments made on our capital lease obligations of approximately $0.4 million.
Net cash used in financing activities changed approximately $1.6 million, to approximately $0.5 million for the year ended December 31, 2009, as compared to net cash provided by financing activities of $1.1 million for the year ended December 31, 2008. The decrease was primarily due to the $1.1 million reimbursement of litigation expenses received from our escrow account in 2008 and the payment of employee tax withholdings related to restricted stock of approximately $0.8 million, off-set by the proceeds from the exercise of stock options of approximately $0.3 million.
On July 27, 2010, we entered into a lease agreement with a vendor to purchase equipment. Under the terms of the agreement, we financed approximately $2.3 million, excluding applicable taxes, of equipment for a period of thirty six (36) months. The financing is being accounted for as a capital lease and has been reflected as a non-cash transaction in the condensed consolidated statement of cash flows. The financing agreement is collateralized by the equipment purchased.
On March 2, 2011 we completed an underwritten public offering of our common stock in which we sold and issued 11,500,000 shares of our common stock, including 1,500,000 shares subject to the underwriters’
66
Table of Contents
over-allotment option, at a price to the public of $7.10 per share. The newly issued common shares began trading on the Nasdaq Global Select Market on March 2, 2011. We raised a total of approximately $81.7 million in gross proceeds from the offering, or approximately $77.3 million in net proceeds after deducting underwriting discounts and commissions of approximately $3.9 million and other offering costs of approximately $0.5 million. The offering was made pursuant to the effective registration statement on Form S-3 (Registration Statement No. 333-170609) previously filed with and declared effective by the Securities and Exchange Commission on November 26, 2010 and the prospectus supplement thereunder filed with the Securities and Exchange Commission on February 28, 2011.
The Company had a $5.0 million bank Line of Credit that matured on October 31, 2009. The Company did not renew the Line of Credit. As of December 31, 2010, the Company had no outstanding bank debt other than the aforementioned capital leases.
Changes in cash, cash equivalents and marketable securities are dependent upon changes in, among other things, working capital items such as deferred revenues, accounts payable, accounts receivable, accrued provision for litigation and various accrued expenses, as well as changes in our capital and financial structure due to debt repurchases and issuances, stock option exercises, sales of equity investments and similar events.
We believe that our existing cash, cash equivalents and marketable securities will be sufficient to meet our anticipated cash needs for at least the next 12 months. If the assumptions underlying our business plan regarding future revenue and expenses change, or if unexpected opportunities or needs arise, we may seek to raise additional cash by selling equity or debt securities.
Contractual Obligations, Contingent Liabilities and Commercial Commitments
In the normal course of business, we make certain long-term commitments for operating leases, primarily office facilities, bandwidth and computer rack space. These leases expire on various dates ranging from 2011 to 2019. We expect that the growth of our business will require us to continue to add to and increase our long-term commitments in 2011 and beyond. As a result of our growth strategies, we believe that our liquidity and capital resources requirements will grow.
The following table presents our contractual obligations and commercial commitments, as of December 31, 2010 over the next five years and thereafter (in thousands):
| Payments Due by Period | ||||||||||||||||||||
| Contractual Obligations as of December 31, 2010 |
Total | Less than 1 year |
1-3 years | 3-5 years | More than 5 years |
|||||||||||||||
| Operating Leases |
||||||||||||||||||||
| Bandwidth leases |
$ | 23,490 | $ | 14,613 | $ | 7,560 | $ | 1,309 | $ | 8 | ||||||||||
| Rack space leases |
19,619 | 6,932 | 7,728 | 4,900 | 59 | |||||||||||||||
| Real estate leases |
16,784 | 2,018 | 4,382 | 4,594 | 5,790 | |||||||||||||||
| Total operating leases |
59,893 | 23,563 | 19,670 | 10,803 | 5,857 | |||||||||||||||
| Capital leases |
3,022 | 1,195 | 1,827 | — | — | |||||||||||||||
| Bank debt |
— | — | — | — | — | |||||||||||||||
| Interest on bank debt |
— | — | — | — | — | |||||||||||||||
| Total commitments |
$ | 62,915 | $ | 24,758 | $ | 21,497 | $ | 10,803 | $ | 5,857 | ||||||||||
Off Balance Sheet Arrangements
We do not have, and have never had, any relationships with unconsolidated entities or financial partnerships, such as entities often referred to as structured finance or special purpose entities, which would have been established for the purpose of facilitating off-balance sheet arrangements or other contractually narrow or limited purposes.
67
Table of Contents
Use of Non-GAAP Financial Measures
To evaluate our business, we consider and use Non-GAAP net income (loss) and Adjusted EBITDA as a supplemental measure of operating performance. These measures include the same adjustments that management takes into account when it reviews and assesses operating performance on a period-to-period basis. We consider Non-GAAP net income (loss) to be an important indicator of overall business performance because it allows us to illustrate the impact of the effects of share-based compensation, litigation expenses, provision for litigation, amortization of intangibles and acquisition related expenses. We define EBITDA as GAAP net income (loss) before interest income, interest expense, other income and expense, provision for income taxes and, depreciation and amortization. We believe that EBITDA provides a useful metric to investors to compare us with other companies within our industry and across industries. We define Adjusted EBITDA as EBITDA adjusted for operational expenses that we do not consider reflective of our ongoing operations. We use Adjusted EBITDA as a supplemental measure to review and assess operating performance. We also believe use of Adjusted EBITDA facilitates investors’ use of operating performance comparisons from period to period. In addition, it should be noted that our performance-based executive officer bonus structure is tied closely to our performance as measured in part by certain non-GAAP financial measures.
In our February 14, 2011 earnings press release, as furnished on Form 8-K, we included Non-GAAP net income (loss), EBITDA and Adjusted EBITDA. The terms Non-GAAP net income (loss), EBITDA and Adjusted EBITDA are not defined under United States generally accepted accounting principles, or United States GAAP, and are not measures of operating income, operating performance or liquidity presented in accordance with United States GAAP. Our Non-GAAP net income (loss), EBITDA and Adjusted EBITDA have limitations as analytical tools, and when assessing our operating performance, Non-GAAP net income (loss), EBITDA and Adjusted EBITDA should not be considered in isolation, or as a substitute for net income (loss) or other consolidated income statement data prepared in accordance with United States GAAP. Some of these limitations include, but are not limited to:
| • | EBITDA and Adjusted EBITDA do not reflect our cash expenditures or future requirements for capital expenditures or contractual commitments; |
| • | they do not reflect changes in, or cash requirements for, our working capital needs; |
| • | they do not reflect the cash requirements necessary for litigation costs; |
| • | they do not reflect the interest expense, or the cash requirements necessary to service interest or principal payments, on our debt that we may incur; |
| • | they do not reflect income taxes or the cash requirements for any tax payments; |
| • | although depreciation and amortization are non-cash charges, the assets being depreciated and amortized will be replaced sometime in the future, and EBITDA and Adjusted EBITDA do not reflect any cash requirements for such replacements; |
| • | while share-based compensation is a component of operating expense, the impact on our financial statements compared to other companies can vary significantly due to such factors as the assumed life of the options and the assumed volatility of our common stock; and |
| • | other companies may calculate EBITDA and Adjusted EBITDA differently than we do, limiting their usefulness as comparative measures. |
We compensate for these limitations by relying primarily on our GAAP results and using Non-GAAP net income (loss) and Adjusted EBITDA only as supplemental support for management’s analysis of business performance. Non-GAAP net income (loss), EBITDA and Adjusted EBITDA are calculated as follows for the periods presented.
68
Table of Contents
Reconciliation of Non-GAAP Financial Measures
In accordance with the requirements of Regulation G issued by the Securities and Exchange Commission, we are presenting the most directly comparable GAAP financial measures and reconciling the non-GAAP financial metrics to the comparable GAAP measures.
Reconciliation of GAAP Net Income (Loss) to Non-GAAP Net Income (Loss)
(In thousands)
(Unaudited)
| For the Year Ended December 31, | ||||||||||||
| 2010 | 2009 | 2008 | ||||||||||
| GAAP net (loss) income |
$ | (20,351 | ) | $ | 34,890 | $ | (63,067 | ) | ||||
| Provision for litigation |
— | (65,645 | ) | 17,515 | ||||||||
| Share-based compensation |
17,401 | 17,463 | 18,058 | |||||||||
| Litigation defense expenses |
2,149 | 5,412 | 20,799 | |||||||||
| Acquisition related expenses |
1,527 | 1,481 | — | |||||||||
| Amortization of intangibles |
3,899 | 93 | — | |||||||||
| Non-GAAP net income (loss) |
$ | 4,625 | $ | (6,306 | ) | $ | (6,695 | ) | ||||
Reconciliation of GAAP Net Income (Loss) to EBITDA to Adjusted EBITDA
(In thousands)
(Unaudited)
| For the Year Ended December 31, | ||||||||||||
| 2010 | 2009 | 2008 | ||||||||||
| GAAP net (loss) income |
$ | (20,351 | ) | $ | 34,890 | $ | (63,067 | ) | ||||
| Depreciation and amortization |
28,726 | 26,402 | 27,031 | |||||||||
| Interest expense |
77 | 39 | 55 | |||||||||
| Interest and other income (expense) |
(692 | ) | (1,331 | ) | (4,927 | ) | ||||||
| Income tax (benefit) expense |
(3,052 | ) | 1,084 | 16 | ||||||||
| EBITDA |
$ | 4,708 | $ | 61,084 | $ | (40,892 | ) | |||||
| Provision for litigation |
— | (65,645 | ) | 17,515 | ||||||||
| Share-based compensation |
17,401 | 17,463 | 18,058 | |||||||||
| Litigation defense expenses |
2,149 | 5,412 | 20,799 | |||||||||
| Acquisition related expenses |
1,527 | 1,481 | — | |||||||||
| Adjusted EBITDA |
$ | 25,785 | $ | 19,795 | $ | 15,480 | ||||||
Recent Accounting Pronouncements
In October 2009, the Financial Accounting Standards Board (FASB) issued Accounting Standards Update (ASU) 2009-13, Revenue Recognition (Topic 605) — Multiple-Deliverable Revenue Arrangements. ASU 2009-13 addresses the accounting for multiple-deliverable arrangements to enable vendors to account for products or services (deliverables) separately rather than as a combined unit. Specifically, this guidance amends the criteria in Subtopic 605-25, Revenue Recognition-Multiple-Element Arrangements (Subtopic 605-25), for separating consideration in multiple-deliverable arrangements. This guidance establishes a selling price hierarchy for determining the selling price of a deliverable, which is based on: (a) vendor-specific objective evidence; (b) third-party evidence; or (c) management’s best estimate. This guidance also eliminates the residual method of allocation and requires that arrangement consideration be allocated at the inception of the arrangement to all deliverables using the relative selling price method. In the third quarter of 2010, we early adopted ASU 2009-13
69
Table of Contents
with such adoption being effective for revenue arrangement entered into or materially modified after January 1, 2010, and accordingly the impact of adoption was not material to our financial position, results of operations or cash flows.
In October 2009, the FASB also issued ASU 2009-14, Software (Topic 985) — Certain Revenue Arrangements That Include Software Elements. ASU 2009-14 changes revenue recognition for tangible products containing software and hardware elements. Specifically, tangible products containing software and hardware that function together to deliver the tangible products’ essential functionality are scoped out of the existing software revenue recognition guidance and will be accounted for under the multiple-element arrangements revenue recognition guidance under ASU 2009-13. In the third quarter of 2010 in conjunction with the adoption of ASU 2009-13, we early adopted ASU 2009-14 with such adoption being effective for revenue arrangement entered into or materially modified after January 1, 2010. We did not enter into or modify any arrangements falling under the scope of ASU 2009-14 during the year ended December 31, 2010, and accordingly the impact of adoption was not material to our financial position, results of operations or cash flows.
As of January 1, 2010, we adopted Accounting Standards Update 2010-06 Fair Value Measurements and Disclosures (Topic 820) — Improving Disclosures about Fair Value Measurements. This new accounting standard requires new disclosures and clarifies certain existing disclosure requirements about fair value measurements. The standard requires a reporting entity to disclose significant transfers in and out of Level 1 and Level 2 fair value measurements, to describe the reasons for the transfers and to present separately information about purchases, sales, issuances and settlements for fair value measurements using significant unobservable inputs. The standard is effective for interim and annual reporting periods beginning after December 15, 2009, except for the disclosures about purchases, sales, issuances and settlements in the roll forward of activity in Level 3 fair value measurements, which is effective for interim and annual reporting periods beginning after December 15, 2010; early adoption is permitted. The adoption of the standard did not have a material impact on our financial position, results of operations or cash flows.
As of January 1, 2010, we adopted Accounting Standards Update 2010-02, Consolidation (Topic 810) — Accounting and Reporting for Decreases in Ownership of a Subsidiary. This new accounting standard clarifies the scope of the decrease in ownership provisions and expands the disclosure requirements about deconsolidation of a subsidiary or de-recognition of a group of assets. The standard is effective beginning in the first interim or annual reporting period ending on or after December 15, 2009 and thus was effective for our first quarter reporting in 2010. The amendments in the standard must be applied retrospectively to the first period that an entity adopted SFAS 160. The adoption of the standard did not have a material impact on our financial position, results of operations or cash flows.
In February 2010, the FASB issued FASB Accounting Standards Update 2010-09, Subsequent Events: Amendments to Certain Recognition and Disclosure Requirements (ASU 2010-09), which amends FASB ASC Topic 855, Subsequent Events. The update provides that SEC filers, as defined in ASU 2010-09, are no longer required to disclose the date through which subsequent events have been evaluated in originally issued and revised financial statements. The update also requires SEC filers to evaluate subsequent events through the date the financial statements are issued rather than the date the financial statements are available to be issued. We adopted ASU 2010-09 upon issuance. This update had no impact on our financial position, results of operations or cash flows.
In December 2010, the Financial Accounting Standards Board (FASB) issued Accounting Standards Update (ASU) 2010-28, Intangibles — Goodwill and Other (Topic 350): When to Perform Step 2 of the Goodwill Impairment Test for Reporting Units with Zero or Negative Carrying Amounts (ASU 2010-28). ASU 2010-28 clarifies the requirement to test for impairment of goodwill. ASC Topic 350 has required that goodwill be tested for impairment if the carrying amount of a reporting unit exceeds its fair value. Under ASU 2010-28, when the carrying amount of a reporting unit is zero or negative an entity must assume that it is more likely than not that a goodwill impairment exists, perform an additional test to determine whether goodwill has been impaired and
70
Table of Contents
calculate the amount of that impairment. The modifications to ASC Topic 350 resulting from the issuance of ASU 2010-28 are effective for fiscal years beginning after December 15, 2010 and interim periods within those years. Early adoption is not permitted. The adoption of ASU 2010-08 is not expected to have an impact on the financial statements of the Company.
In December 2010, the FASB issued ASU 2010-29 “Business Combinations (Topic 805) — Disclosure of Supplementary Pro Forma Information for Business Combinations” (ASU 2010-29). This standard update clarifies that, when presenting comparative financial statements, SEC registrants should disclose revenue and earnings of the combined entity as though the current period business combinations had occurred as of the beginning of the comparable prior annual reporting period only. The update also expands the supplemental pro forma disclosures to include a description of the nature and amount of material, nonrecurring pro forma adjustments directly attributable to the business combination included in the reported pro forma revenue and earnings. ASU 2010-29 is effective prospectively for material (either on an individual or aggregate basis) business combinations entered into in fiscal years beginning on or after December 15, 2010 with early adoption permitted. We do not expect the adoption of the standard to have a material impact on our consolidated results of operations and financial condition.
| Item 7A. | Quantitative and Qualitative Disclosures about Market Risk |
Interest Rate Risk
Our exposure to market risk for changes in interest rates relates primarily to our debt and investment portfolio. In our investment portfolio, we do not use derivative financial instruments. Our investments are primarily with our commercial and investment banks and, by policy, we limit the amount of risk by investing primarily in money market funds, United States Treasury obligations, high quality corporate and municipal obligations and certificates of deposit. We do not believe that a 10% change in interest rates would have a significant impact on our interest income, operating results or liquidity.
Foreign Currency Risk
A large portion of our customer agreements are denominated in U.S. dollars; however, we may be exposed to fluctuations in foreign exchange rates with respect to customer agreements with certain of our international customers. Additionally, because we have operations in Europe and Asia we may be exposed to fluctuations in foreign exchange rates with respect to certain operating expenses and cash flows. We may continue to expand our operations globally and increase our revenues related to customers in foreign locations which may increase our exposure to foreign exchange fluctuations. At this time, we do not have any foreign currency hedge contracts.
Inflation Risk
We do not believe that inflation has had a material effect on our business, financial condition or results of operations. If our costs were to become subject to significant inflationary pressures, we may not be able to fully offset such higher costs through price increases. Our inability or failure to do so could harm our business, financial condition and results of operations.
71
Table of Contents
| Item 8. | Financial Statements and Supplementary Data |
LIMELIGHT NETWORKS, INC.
Index to Consolidated Financial Statements and Schedule
72
Table of Contents
Report of Independent Registered Public Accounting Firm
The Board of Directors and Stockholders of Limelight Networks, Inc.
We have audited the accompanying consolidated balance sheets of Limelight Networks, Inc. as of December 31, 2010 and 2009, and the related consolidated statements of operations, stockholders’ equity, and cash flows for each of the three years in the period ended December 31, 2010. Our audits also included the financial statement schedule listed in Item 15(a). These consolidated financial statements and schedule are the responsibility of the Company’s management. Our responsibility is to express an opinion on these financial statements and schedule based on our audits.
We conducted our audit in accordance with the standards of the Public Company Accounting Oversight Board (United States). Those standards require that we plan and perform the audit to obtain reasonable assurance about whether the financial statements are free of material misstatement. An audit also includes examining, on a test basis, evidence supporting the amounts and disclosures in the financial statements, assessing the accounting principles used and significant estimates made by management, and evaluating the overall financial statement presentation. We believe that our audits provide a reasonable basis for our opinion.
In our opinion, the financial statements referred to above present fairly, in all material respects, the consolidated financial position of Limelight Networks, Inc. at December 31, 2010 and 2009, and the consolidated results of its operations and its cash flows for each of the three years in the period ended December 31, 2010, in conformity with U.S. generally accepted accounting principles. Also, in our opinion, the related financial statement schedule, when considered in relation to the basic financial statements taken as a whole, presents fairly in all material respects the information set forth therein.
We also have audited, in accordance with the standards of the Public Company Accounting Oversight Board (United States), Limelight Networks, Inc.’s internal control over financial reporting as of December 31, 2010, based on criteria established in Internal Control-Integrated Framework issued by the Committee of Sponsoring Organizations of the Treadway Commission and our report dated March 11, 2011 expressed an unqualified opinion thereon.
/s/ Ernst & Young LLP
Phoenix, Arizona
March 11, 2011
73
Table of Contents
Consolidated Balance Sheets
(In thousands, except per share data)
| December 31, | ||||||||
| 2010 | 2009 | |||||||
| ASSETS | ||||||||
| Current assets: |
||||||||
| Cash and cash equivalents |
$ | 56,741 | $ | 89,509 | ||||
| Marketable securities |
12,009 | 64,870 | ||||||
| Accounts receivable, net of reserves of $7,295 and $9,226 at December 31, 2010 and 2009, respectively |
41,940 | 26,363 | ||||||
| Income taxes receivable |
721 | 617 | ||||||
| Prepaid expenses and other current assets |
9,628 | 9,654 | ||||||
| Total current assets |
121,039 | 191,013 | ||||||
| Property and equipment, net |
54,407 | 35,524 | ||||||
| Marketable securities, less current portion |
1,755 | 12 | ||||||
| Deferred income tax, less current portion |
718 | — | ||||||
| Goodwill |
94,364 | 619 | ||||||
| Other intangible assets, net |
19,406 | 370 | ||||||
| Other assets |
6,951 | 8,132 | ||||||
| Total assets |
$ | 298,640 | $ | 235,670 | ||||
| LIABILITIES AND STOCKHOLDERS’ EQUITY | ||||||||
| Current liabilities: |
||||||||
| Accounts payable |
$ | 12,236 | $ | 5,144 | ||||
| Deferred revenue, current portion |
6,877 | 12,199 | ||||||
| Capital lease obligations, current portion |
1,049 | — | ||||||
| Other current liabilities |
20,000 | 14,140 | ||||||
| Total current liabilities |
40,162 | 31,483 | ||||||
| Capital lease obligations, less current portion |
1,750 | — | ||||||
| Deferred income tax, less current portion |
598 | 10 | ||||||
| Deferred revenue, less current portion |
— | 1,377 | ||||||
| Other long term liabilities |
21 | — | ||||||
| Total liabilities |
42,531 | 32,870 | ||||||
| Commitments and contingencies |
||||||||
| Stockholders’ equity: |
||||||||
| Convertible preferred stock, $0.001 par value; 7,500 shares authorized; 0 shares issued and outstanding |
— | — | ||||||
| Common stock, $0.001 par value; 150,000 shares authorized; 100,068 and 85,011 shares issued and outstanding at December 31, 2010 and 2009, respectively |
100 | 85 | ||||||
| Additional paid-in capital |
380,338 | 308,537 | ||||||
| Contingent consideration |
1,608 | — | ||||||
| Accumulated other comprehensive income |
329 | 93 | ||||||
| Accumulated deficit |
(126,266 | ) | (105,915 | ) | ||||
| Total stockholders’ equity |
256,109 | 202,800 | ||||||
| Total liabilities and stockholders’ equity |
$ | 298,640 | $ | 235,670 | ||||
The accompanying notes are an integral part of the consolidated financial statements.
74
Table of Contents
Consolidated Statements of Operations
(In thousands, except per share data)
| Years Ended December 31, | ||||||||||||
| 2010 | 2009 | 2008 | ||||||||||
| Revenue |
$ | 183,327 | $ | 131,663 | $ | 129,530 | ||||||
| Cost of revenue: |
||||||||||||
| Cost of services (exclusive of amortization) |
80,352 | 61,572 | 58,186 | |||||||||
| Depreciation — network |
22,367 | 24,051 | 25,675 | |||||||||
| Total cost of revenue |
102,719 | 85,623 | 83,861 | |||||||||
| Gross margin |
80,608 | 46,040 | 45,669 | |||||||||
| Operating expenses: |
||||||||||||
| General and administrative |
35,760 | 34,128 | 52,440 | |||||||||
| Sales and marketing |
46,752 | 32,587 | 34,916 | |||||||||
| Research and development |
15,755 | 7,937 | 7,365 | |||||||||
| Depreciation and amortization |
6,359 | 2,351 | 1,356 | |||||||||
| Provision for litigation |
— | (65,645 | ) | 17,515 | ||||||||
| Total operating expenses |
104,626 | 11,358 | 113,592 | |||||||||
| Operating (loss) income |
(24,018 | ) | 34,682 | (67,923 | ) | |||||||
| Other income (expense): |
||||||||||||
| Interest expense |
(77 | ) | (39 | ) | (55 | ) | ||||||
| Interest income |
914 | 1,345 | 5,098 | |||||||||
| Other (expense) income |
(222 | ) | (14 | ) | (171 | ) | ||||||
| Total other income (expense) |
615 | 1,292 | 4,872 | |||||||||
| (Loss) income before income taxes |
(23,403 | ) | 35,974 | (63,051 | ) | |||||||
| Income tax (benefit) expense |
(3,052 | ) | 1,084 | 16 | ||||||||
| Net (loss) income |
$ | (20,351 | ) | $ | 34,890 | $ | (63,067 | ) | ||||
| Net (loss) income per weighted average share: |
||||||||||||
| Basic |
$ | (0.22 | ) | $ | 0.41 | $ | (0.76 | ) | ||||
| Diluted |
$ | (0.22 | ) | $ | 0.40 | $ | (0.76 | ) | ||||
| Shares used in per share weighted average share calculation: |
||||||||||||
| Basic |
94,300 | 84,202 | 82,932 | |||||||||
| Diluted |
94,300 | 87,972 | 82,932 | |||||||||
The accompanying notes are an integral part of the consolidated financial statements.
75
Table of Contents
Consolidated Statements of Stockholders’ Equity
(In thousands)
| Common Stock | Additional Paid-In Capital |
Contingent Consideration |
Accumulated Other Comprehensive Income (Loss) |
Accumulated Deficit |
Total | |||||||||||||||||||||||
| Shares | Amount | |||||||||||||||||||||||||||
| Balance at December 31, 2007 |
82,541 | $ | 83 | $ | 271,586 | $ | — | $ | 106 | $ | (77,738 | ) | $ | 194,037 | ||||||||||||||
| Net loss |
— | — | — | — | — | (63,067 | ) | (63,067 | ) | |||||||||||||||||||
| Change in unrealized gains (losses) on investments |
— | — | — | — | (125 | ) | — | (125 | ) | |||||||||||||||||||
| Foreign exchange translation |
— | — | — | — | 279 | — | 279 | |||||||||||||||||||||
| Comprehensive loss |
— | — | — | — | — | — | (62,913 | ) | ||||||||||||||||||||
| Exercise of common stock options |
645 | — | 225 | — | — | — | 225 | |||||||||||||||||||||
| Vesting of restricted stock units |
337 | — | — | — | — | — | — | |||||||||||||||||||||
| Restricted stock units surrendered in lieu of taxes |
(75 | ) | — | (169 | ) | — | — | — | (169 | ) | ||||||||||||||||||
| Cancellation of restricted stock |
(43 | ) | — | — | — | — | — | — | ||||||||||||||||||||
| Escrow funds returned from share repurchase |
— | — | 1,070 | — | — | — | 1,070 | |||||||||||||||||||||
| Reversal of tax benefit related to NOL |
— | — | (177 | ) | — | — | — | (177 | ) | |||||||||||||||||||
| Share-based compensation |
— | — | 18,058 | — | — | — | 18,058 | |||||||||||||||||||||
| Balance at December 31, 2008 |
83,405 | 83 | 290,593 | — | 260 | (140,805 | ) | 150,131 | ||||||||||||||||||||
76
Table of Contents
| Common Stock | Additional Paid-In Capital |
Contingent Consideration |
Accumulated Other Comprehensive Income (Loss) |
Accumulated Deficit |
Total | |||||||||||||||||||||||
| Shares | Amount | |||||||||||||||||||||||||||
| Net income |
— | — | — | — | — | 34,890 | 34,890 | |||||||||||||||||||||
| Change in unrealized gains (losses) on investments |
— | — | — | — | 104 | — | 104 | |||||||||||||||||||||
| Foreign exchange translation |
— | — | — | — | (271 | ) | — | (271 | ) | |||||||||||||||||||
| Comprehensive income |
— | — | — | — | — | — | 34,723 | |||||||||||||||||||||
| Exercise of common stock options |
722 | 1 | 273 | — | — | — | 274 | |||||||||||||||||||||
| Vesting of restricted stock units |
845 | 1 | (1 | ) | — | — | — | — | ||||||||||||||||||||
| Restricted stock units surrendered in lieu of taxes |
(174 | ) | — | (753 | ) | — | — | — | (753 | ) | ||||||||||||||||||
| Issuance of common stock for acquisition of a business |
213 | — | 962 | — | — | — | 962 | |||||||||||||||||||||
| Share-based compensation |
— | — | 17,463 | — | — | — | 17,463 | |||||||||||||||||||||
| Balance at December 31, 2009 |
85,011 | 85 | 308,537 | — | 93 | (105,915 | ) | 202,800 | ||||||||||||||||||||
| Net loss |
— | — | — | — | — | (20,351 | ) | (20,351 | ) | |||||||||||||||||||
| Change in unrealized gains (losses) on investments, net of taxes |
— | — | — | — | 406 | — | 406 | |||||||||||||||||||||
| Foreign exchange translation |
— | — | — | — | (170 | ) | — | (170 | ) | |||||||||||||||||||
| Comprehensive loss |
— | — | — | — | — | — | (20,115 | ) | ||||||||||||||||||||
| Exercise of common stock options |
829 | 1 | 1,947 | — | — | — | 1,948 | |||||||||||||||||||||
| Vesting of restricted stock units |
1,039 | 1 | (1 | ) | — | — | — | — | ||||||||||||||||||||
| Restricted stock units surrendered in lieu of taxes |
(286 | ) | — | (1,582 | ) | — | — | — | (1,582 | ) | ||||||||||||||||||
| Contingent consideration for business acquisitions |
— | — | — | 3,012 | — | — | 3,012 | |||||||||||||||||||||
| Issuance of common stock for contingent consideration |
387 | — | 1,404 | (1,404 | ) | — | — | — | ||||||||||||||||||||
| Issuance of common stock for business acquisitions |
13,088 | 13 | 52,632 | — | — | — | 52,645 | |||||||||||||||||||||
| Share-based compensation |
— | — | 17,401 | — | — | — | 17,401 | |||||||||||||||||||||
| Balance at December 31, 2010 |
100,068 | $ | 100 | $ | 380,338 | $ | 1,608 | $ | 329 | $ | (126,266 | ) | $ | 256,109 | ||||||||||||||
The accompanying notes are an integral part of the consolidated financial statements.
77
Table of Contents
Consolidated Statements of Cash Flows
(In thousands)
| Years Ended December 31, | ||||||||||||
| 2010 | 2009 | 2008 | ||||||||||
| Operating activities |
||||||||||||
| Net (loss) income |
$ | (20,351 | ) | $ | 34,890 | $ | (63,067 | ) | ||||
| Adjustments to reconcile net (loss) income to net cash provided by (used in) operating activities: |
||||||||||||
| Depreciation and amortization |
28,726 | 26,402 | 27,031 | |||||||||
| Share-based compensation |
17,401 | 17,463 | 18,058 | |||||||||
| Deferred income taxes |
(997 | ) | — | (91 | ) | |||||||
| Income tax benefit related to business acquisition |
(3,869 | ) | — | — | ||||||||
| Provision for litigation |
— | (65,645 | ) | 17,515 | ||||||||
| Loss (gain) on foreign currency transactions |
17 | 201 | (167 | ) | ||||||||
| Loss on sale of property and equipment |
45 | — | — | |||||||||
| Excess tax shortfalls (benefits) related to stock option exercises |
— | — | 177 | |||||||||
| Accounts receivable charges |
1,083 | 5,013 | 9,250 | |||||||||
| Accretion of marketable securities |
359 | (366 | ) | (427 | ) | |||||||
| Loss on marketable securities |
— | — | 71 | |||||||||
| Changes in operating assets and liabilities: |
||||||||||||
| Accounts receivable |
(7,120 | ) | 2,348 | (21,326 | ) | |||||||
| Prepaid expenses and other current assets |
832 | (1,863 | ) | (2,253 | ) | |||||||
| Income taxes receivable |
299 | (600 | ) | 1,953 | ||||||||
| Other assets |
1,617 | (7,396 | ) | 816 | ||||||||
| Accounts payable |
842 | (5,204 | ) | (2,890 | ) | |||||||
| Accounts payable, related parties |
— | — | (230 | ) | ||||||||
| Deferred revenue |
(6,878 | ) | (3,591 | ) | 4,742 | |||||||
| Other current liabilities |
2,951 | (1,361 | ) | 4,807 | ||||||||
| Other long term liabilities |
— | — | (770 | ) | ||||||||
| Net cash provided by (used in) operating activities |
14,957 | 291 | (6,801 | ) | ||||||||
| Investing activities |
||||||||||||
| Purchase of marketable securities |
(28,509 | ) | (71,235 | ) | (65,125 | ) | ||||||
| Sale of marketable securities |
81,101 | 43,300 | 112,150 | |||||||||
| Purchases of property and equipment |
(34,174 | ) | (20,407 | ) | (17,432 | ) | ||||||
| Acquisition of businesses, net of cash acquired |
(66,529 | ) | 22 | — | ||||||||
| Net cash (used in) provided by investing activities |
(48,111 | ) | (48,320 | ) | 29,593 | |||||||
| Financing activities |
||||||||||||
| Payments on capital lease obligations |
(409 | ) | — | — | ||||||||
| Payment of employee tax withholdings related to restricted stock |
(1,579 | ) | (753 | ) | — | |||||||
| Escrow funds returned from share repurchase |
— | — | 1,070 | |||||||||
| Excess tax benefits related to stock option exercises |
— | — | (177 | ) | ||||||||
| Proceeds from exercise of stock options |
1,948 | 274 | 225 | |||||||||
| Net cash (used in) provided by financing activities |
(40 | ) | (479 | ) | 1,118 | |||||||
| Effect of exchange rate changes on cash |
426 | (163 | ) | 446 | ||||||||
| Net (decrease) increase in cash and cash equivalents |
(32,768 | ) | (48,671 | ) | 24,356 | |||||||
| Cash and cash equivalents, beginning of year |
89,509 | 138,180 | 113,824 | |||||||||
| Cash and cash equivalents, end of year |
$ | 56,741 | $ | 89,509 | $ | 138,180 | ||||||
| Supplement disclosure of cash flow information |
||||||||||||
| Cash paid during the year for interest |
$ | 18 | $ | — | $ | — | ||||||
| Cash paid during the year for income taxes |
$ | 2,064 | $ | 1,017 | $ | 235 | ||||||
| Property and equipment remaining in accounts payable and other current liabilities |
$ | 5,300 | $ | 1,520 | $ | 3,522 | ||||||
| Purchase of property and equipment under capital leases |
$ | 2,909 | $ | — | $ | — | ||||||
| Common stock issued in connection with acquisition of businesses |
$ | 54,049 | $ | 962 | $ | — | ||||||
The accompanying notes are an integral part of the consolidated financial statements.
78
Table of Contents
Notes to Consolidated Financial Statements
December 31, 2010
1. Nature of Business
Limelight Networks, Inc. (the Company) is a provider of high-performance content delivery network services. The Company provides scalable software services that improve the quality of online media, accelerate the performance of web applications, enable secure online transactions, manage and monetize digital assets, and optimize advertising campaigns. These services are supported by its global platform, which provides highly-available, highly-redundant storage, bandwidth and computing resources as well as connectivity to last-mile broadband network providers. The Company provides services to traditional and emerging media companies, or content publishers, including businesses operating in the television, music, radio, newspaper, magazine, movie, videogame, software and social media industries, as well as enterprises, technology companies, and government entities doing business online. The Company was formed in June 2001 as an Arizona limited liability company, Limelight Networks, LLC, and converted into a Delaware corporation, Limelight Networks, Inc., in August 2003. The Company has operated in the Phoenix metropolitan area since 2001 and elsewhere throughout the United States since 2003. The Company began international operations in 2004.
2. Summary of Significant Accounting Policies and Use of Estimates
Basis of Presentation
The consolidated financial statements include accounts of the Company and its wholly-owned subsidiaries. All significant intercompany balances and transactions have been eliminated. The accompanying consolidated financial statements have been prepared in accordance with United States generally accepted accounting principles (GAAP) and pursuant to the rules and regulations of the Securities and Exchange Commission (SEC). These principles require management to make estimates, judgments and assumptions that affect the reported amounts of assets, liabilities, revenues and expenses, together with amounts disclosed in the related notes to the consolidated financial statements. Actual results and outcomes may differ from management’s estimates, judgments and assumptions. Significant estimates used in these financial statements include, but are not limited to, revenues, accounts receivable and related reserves, useful lives and realizability of long-term asset, provision for litigation, capitalized software, acquired intangibles, income and other taxes, the fair value of share-based compensation and other contingent liabilities. Estimates are periodically reviewed in light of changes in circumstances, facts and experience. The effects of material revisions in estimates are reflected in the consolidated financial statements prospectively from the date of the change in estimate. The results of operations presented in this Annual Report on Form 10-K are not necessarily indicative of the results that may be expected for the year ending December 31, 2011 or for any future periods.
Effect of Recent Accounting Pronouncements
As of January 1, 2010, the Company adopted Accounting Standards Update 2010-06 Fair Value Measurements and Disclosures (Topic 820) — Improving Disclosures about Fair Value Measurements. This new accounting standard requires new disclosures and clarifies certain existing disclosure requirements about fair value measurements. The standard requires a reporting entity to disclose significant transfers in and out of Level 1 and Level 2 fair value measurements, to describe the reasons for the transfers and to present separately information about purchases, sales, issuances and settlements for fair value measurements using significant unobservable inputs. The standard is effective for interim and annual reporting periods beginning after December 15, 2009, except for the disclosures about purchases, sales, issuances and settlements in the roll forward of activity in Level 3 fair value measurements, which is effective for interim and annual reporting periods beginning after December 15, 2010; early adoption is permitted. The adoption of the standard did not have a material impact on the Company’s financial position, results of operations or cash flows.
79
Table of Contents
As of January 1, 2010, the Company adopted Accounting Standards Update 2010-02, Consolidation (Topic 810) — Accounting and Reporting for Decreases in Ownership of a Subsidiary. This new accounting standard clarifies the scope of the decrease in ownership provisions and expands the disclosure requirements about deconsolidation of a subsidiary or de-recognition of a group of assets. The standard was effective for the Company beginning in the first quarter of 2010. The amendments in the standard must be applied retrospectively to the first period that an entity adopted ASC 810. The adoption of the standard did not have a material impact on the Company’s financial position, results of operations or cash flows.
In February 2010, the FASB issued FASB Accounting Standards Update 2010-09, Subsequent Events: Amendments to Certain Recognition and Disclosure Requirements (ASU 2010-09), which amends FASB ASC Topic 855, Subsequent Events. The update provides that SEC filers, as defined in ASU 2010-09, are no longer required to disclose the date through which subsequent events have been evaluated in originally issued and revised financial statements. The update also requires SEC filers to evaluate subsequent events through the date the financial statements are issued rather than the date the financial statements are available to be issued. The Company adopted ASU 2010-09 upon issuance. This update had no impact on the Company’s financial position, results of operations or cash flows.
Revenue Recognition
The Company primarily derives revenue from the sale of content delivery network services to customers executing contracts having terms of one year or longer. These contracts generally commit the customer to a minimum monthly or annual level of usage and provide the rate at which the customer must pay for actual usage above the monthly or annual minimum. For these services, the Company recognizes the monthly minimum as revenue each month provided that an enforceable contract has been signed by both parties, the service has been delivered to the customer, the fee for the service is fixed or determinable and collection is reasonably assured. Should a customer’s usage of the Company’s services exceed the monthly minimum commit, the Company recognizes revenue for such excess in the period of the usage. For annual or other non-monthly period revenue commitments, the Company recognizes revenue monthly based upon the customer’s actual usage each month of the commitment period and only recognizes any remaining committed amount for the applicable period in the last month thereof. The Company typically charges the customer an installation fee when the services are first activated. The installation fees are recorded as deferred revenue and recognized as revenue ratably over the life of the customer arrangement. The Company also derives revenue from campaigns, services and events sold as discrete, non-recurring events or based solely on usage. For those services, the Company recognizes revenue after an enforceable contract has been signed by both parties, the fee is fixed or determinable, the event or usage has occurred and collection is reasonably assured.
The Company has on occasion entered into multi-element arrangements. In October 2009, the Financial Accounting Standards Board (FASB) issued Accounting Standards Update (ASU) 2009-13, Revenue Recognition (Topic 605) — Multiple-Deliverable Revenue Arrangements. ASU 2009-13 addresses the accounting for multiple-deliverable arrangements to enable vendors to account for products or services (deliverables) separately rather than as a combined unit. Specifically, this guidance amends the criteria in Subtopic 605-25, Revenue Recognition-Multiple-Element Arrangements (Subtopic 605-25), for separating consideration in multiple-deliverable arrangements. This guidance establishes a selling price hierarchy for determining the selling price of a deliverable, which is based on: (a) vendor-specific objective evidence; (b) third-party evidence; or (c) management’s best estimate. This guidance also eliminates the residual method of allocation and requires that arrangement consideration be allocated at the inception of the arrangement to all deliverables using the relative selling price method. In the third quarter of 2010, the Company early adopted ASU 2009-13 with such adoption being effective for revenue arrangements entered into or materially modified after January 1, 2010. The impact of adoption was not material to our financial position, results of operations or cash flows.
In October 2009, the FASB also issued ASU 2009-14, Software (Topic 985) — Certain Revenue Arrangements That Include Software Elements. ASU 2009-14 changes revenue recognition for tangible products
80
Table of Contents
containing software and hardware elements. Specifically, tangible products containing software and hardware that function together to deliver the tangible products’ essential functionality are scoped out of the existing software revenue recognition guidance and will be accounted for under the multiple-element arrangements revenue recognition guidance under ASU 2009-13. In the third quarter of 2010 in conjunction with the adoption of ASU 2009-13, the Company early adopted ASU 2009-14 with such adoption being effective for revenue arrangements entered into or materially modified after January 1, 2010. The Company did not enter into or modify any arrangements falling under the scope of ASU 2009-14 during the year ended December 31, 2010, and accordingly the impact of adoption was not material to its financial position, results of operations or cash flows.
Prior to the adoption of ASU 2009-13 effective January 1 2010, when the Company entered into multiple element arrangements, each element was accounted for separately over its respective service period or at the time of delivery, provided that there was objective evidence of fair value for the separate elements. Objective evidence of fair value includes the price charged for the element when sold separately. If the fair value of each element could not be objectively determined, the total value of the arrangement was recognized ratably over the entire service period to the extent that all services have begun to be provided, and other revenue recognition criteria have been satisfied.
If the multi-element arrangement included a significant software component, the Company recognized software license revenue when persuasive evidence of an arrangement exists, delivery occurs, the fee is fixed or determinable and collection of the receivable is reasonably assured. If a software license contained an undelivered element, the vendor-specific objective evidence (VSOE) of fair value of the undelivered element is deferred and the revenue recognized once the element is delivered. The undelivered elements related to these arrangements are primarily software support and professional services. VSOE of fair value of software support and professional services is based upon hourly rates or fixed fees charged when those services are sold separately. If VSOE could not be established for all elements to be delivered, the Company deferred all amounts received under the arrangement and did not begin to recognize revenue until the delivery of the last element of the contract started. Subsequent to commencement of delivery of the last element, the Company commenced revenue recognition. Amounts to be received under the contract are then included in the amortizable base and recognized as revenue ratably over the remaining term of the arrangement until the Company had delivered all elements and had no additional performance obligations.
The Company has certain multi-element arrangements as of December 31, 2010 that were entered into prior to the adoption of ASU 2009-13 in 2010. Under these arrangements, the Company recognized approximately $11.0 million, $6.9 million and $5.1 million, respectively, in revenue for the years ended December 31, 2010, 2009 and 2008. As of December 31, 2010, the Company had deferred revenue related to these multi-element arrangements of approximately $2.1 million that will be recognized over the remaining terms of the respective arrangements based on the underlying elements of the arrangements in accordance with its revenue recognition policies.
The Company also sells services through a reseller channel. Assuming all other revenue recognition criteria are met, revenue from reseller arrangements is recognized over the term of the contract, based on the reseller’s contracted non-refundable minimum purchase commitments plus amounts sold by the reseller to its customers in excess of the minimum commitments. These excess commitments are recognized as revenue in the period in which the service is provided. The Company records revenue under these agreements on a net or gross basis depending upon the terms of the arrangement. The Company typically records revenue gross when they have risk of loss, latitude in establishing price, credit risk and are the primary obligor in the arrangement. Reseller revenue was approximately 5%, 2% and 1%, respectively, of the Company’s total revenue for the years ended December 31, 2010, 2009 and 2008, respectively.
From time to time, the Company enters into contracts to sell services to unrelated companies at or about the same time it enters into contracts to purchase products or services from the same companies. If the Company concludes that these contracts were negotiated concurrently, the Company records as revenue only the net cash
81
Table of Contents
received from the vendor. For certain non-cash arrangements whereby the Company provides rack space and bandwidth services to several companies in exchange for advertising, the Company records barter revenue and expense if the services are objectively measurable. The various types of advertising include radio, website, print and signage. The Company recorded barter revenue and expense of approximately $93,000, $185,000 and $487,000, respectively, for the years ended December 31, 2010, 2009 and 2008.
The Company may from time to time resell licenses or services of third parties. Revenue for these transactions is recorded when the Company has risk of loss related to the amounts purchased from the third party and the Company adds value to the license or service, such as by providing maintenance or support for such license or service. If these conditions are present, the Company recognizes revenue when all other revenue recognition criteria are satisfied.
At the inception of a customer contract for service, the Company makes an assessment as to that customer’s ability to pay for the services provided. If the Company subsequently determines that collection from the customer is not reasonably assured, the Company records an allowance for doubtful accounts and bad debt expense or deferred revenue for all of that customer’s unpaid invoices and ceases recognizing revenue for continued services provided until cash is received.
Cash and Cash Equivalents
The Company holds its cash and cash equivalents in checking, money market, and investment accounts with a minimum credit rating of at least A1/P1. The Company considers all highly liquid investments with maturities of three months or less when purchased to be cash equivalents.
Restricted Cash
The Company secures one of its capital lease obligations with a letter of credit that is collateralized by $263,000 of cash. When the capital lease is repaid, the letter of credit would no longer be required and the restricted cash would be available for general use. In addition, the Company secures a business credit card with a letter of credit that is collateralized by approximately $50,000 of cash. Restricted cash is excluded from cash and cash equivalents and is recorded in other long term assets (due to the term of the lease being greater that one year and the expectation that the usage of the credit card will continue beyond one year) in the accompanying balance sheets.
Investments in Marketable Securities
Management determines the appropriate classification of its debt and equity securities at the time of purchase and reevaluates such classification as of each balance sheet date. Realized gains and losses and declines in value judged to be other than temporary are determined based on the specific identification method and are reported in the statements of operations.
The Company has classified its investments in equity and debt securities as available-for-sale. Available-for-sale investments are initially recorded at cost with temporary changes in fair value periodically adjusted through comprehensive income. The Company periodically reviews its investments for other-than-temporary declines in fair value based on the specific identification method and writes down investments to their fair value when an other-than-temporary decline has occurred.
82
Table of Contents
The following is a summary of available-for-sale securities at December 31, 2010 (in thousands):
| Amortized Cost |
Gross Unrealized Gains |
Gross Unrealized Losses |
Estimated Fair Value |
|||||||||||||
| Government agency bonds |
$ | 8,985 | $ | 2 | $ | (1 | ) | $ | 8,986 | |||||||
| Corporate notes and bonds |
3,022 | 1 | — | 3,023 | ||||||||||||
| Total available-for-sale debt securities |
12,007 | 3 | (1 | ) | 12,009 | |||||||||||
| Publicly traded common stock |
1,133 | 622 | — | 1,755 | ||||||||||||
| Total available-for-sale securities |
$ | 13,140 | $ | 625 | $ | (1 | ) | $ | 13,764 | |||||||
At December 31, 2010, the Company evaluated its investment portfolio in available-for-sale debt securities, and noted unrealized losses of approximately $1,000 were due to fluctuations in interest rates. Management does not believe any of the unrealized losses represented an other-than-temporary impairment based on its evaluation of available evidence as of December 31, 2010. The Company’s intent is to hold these investments to such time as these assets are no longer impaired.
Expected maturities can differ from contractual maturities because the issuers of the securities may have the right to prepay obligations without prepayment penalties, and the Company views its available-for-sale securities as available for current operations.
The amortized cost and estimated fair value of the available-for-sale debt securities at December 31, 2010, by maturity, are shown below (in thousands):
| Amortized Cost |
Gross Unrealized Gains |
Gross Unrealized Losses |
Estimated Fair Value |
|||||||||||||
| Available-for-sale debt securities |
||||||||||||||||
| Due in one year or less |
$ | 12,007 | $ | 3 | $ | (1 | ) | $ | 12,009 | |||||||
| Due after one year and through five years |
— | — | — | — | ||||||||||||
| $ | 12,007 | $ | 3 | $ | (1 | ) | $ | 12,009 | ||||||||
The following is a summary of available-for-sale securities at December 31, 2009 (in thousands):
| Amortized Cost |
Gross Unrealized Gains |
Gross Unrealized Losses |
Estimated Fair Value |
|||||||||||||
| Government agency bonds |
$ | 46,153 | $ | 16 | $ | (33 | ) | $ | 46,136 | |||||||
| Commercial paper |
8,996 | — | — | 8,996 | ||||||||||||
| Corporate notes and bonds |
9,631 | 108 | (1 | ) | 9,738 | |||||||||||
| Total available-for-sale debt securities |
64,780 | 124 | (34 | ) | 64,870 | |||||||||||
| Publicly traded common stock |
13 | — | (1 | ) | 12 | |||||||||||
| Total available-for-sale securities |
$ | 64,793 | $ | 124 | $ | (35 | ) | $ | 64,882 | |||||||
83
Table of Contents
The amortized cost and estimated fair value of the available-for-sale debt securities at December 31, 2009, by maturity, are shown below (in thousands):
| Amortized Cost |
Gross Unrealized Gains |
Gross Unrealized Losses |
Estimated Fair Value |
|||||||||||||
| Available-for-sale debt securities |
||||||||||||||||
| Due in one year or less |
$ | 62,223 | $ | 124 | $ | (27 | ) | $ | 62,320 | |||||||
| Due after one year and less than two years |
2,557 | — | (7 | ) | 2,550 | |||||||||||
| $ | 64,780 | $ | 124 | $ | (34 | ) | $ | 64,870 | ||||||||
Accounts Receivable
Trade accounts receivable are recorded at the invoiced amounts and do not bear interest. The Company records reserves against its accounts receivable balance for service credits and for doubtful accounts. Estimates are used in determining both of these reserves. The allowance for doubtful accounts charges are included as a component of general and administrative expenses.
The Company’s reserve for service credits increases as a result of specific service credits that are expected to be issued to customers during the ordinary course of business, as well as for billing disputes. These credits typically relate to customer disputes and billing adjustments and are estimated at the time the revenue is recognized and recorded as a reduction of revenues. Estimates for service credits are based on an analysis of credits to be issued after the month of billing related to managements estimate of the resolution of customer disputes and billing adjustments. Decreases to the reserve are the result of actual credits being issued to customers, causing a corresponding reduction in accounts receivable.
The allowance for doubtful accounts is based upon a calculation that uses the Company’s aging of accounts receivable and applies a reserve percentage to the specific age of the receivable to estimate the allowance for doubtful accounts. These estimates could change significantly if the Company’s customers’ financial condition changes or if the economy in general deteriorates. The Company performs on-going credit evaluations of its customers. If such an evaluation indicates that payment is no longer reasonably assured for current services provided, any future services provided to that customer will result in the deferral of revenue until the Company receives payments or it determines payment is reasonably assured.
Property and Equipment
Property and equipment are carried at cost less accumulated depreciation or amortization. Depreciation and amortization are computed using the straight-line and accelerated methods over the assets’ estimated useful lives of the applicable asset.
| Network equipment |
3 years | |||
| Computer equipment |
3 years | |||
| Capitalized software |
3 years | |||
| Furniture and fixtures |
3-5 years | |||
| Other equipment |
3-7 years |
Leasehold improvements are amortized over the shorter of the asset’s estimated useful life or the respective lease term. Maintenance and repairs are charged to expense as incurred.
Goodwill and Other Intangible Assets
Goodwill represents costs in excess of fair values assigned to the underlying net assets of the acquired company. Goodwill is not amortized but instead is tested for impairment annually or more frequently if events or changes in circumstances indicate the asset might be impaired.
84
Table of Contents
The Company’s other intangible assets represent existing technologies, trade names and trademarks, non-compete agreements, patent, usage contract, domain names and customer relationships intangibles. Other intangible assets are amortized over their respective estimated lives, ranging from less than one year to six years. In the event that facts and circumstances indicate intangibles or other long-lived assets may be impaired, the Company evaluates the recoverability and estimated useful lives of such assets.
Contingent Consideration
Contingent consideration is included in Other Current Liabilities or as a component of Equity on our consolidated Balance Sheet depending upon characteristics of the obligation. In connection with certain of our acquisitions, additional contingent considerations may be earned in the future by the selling entity upon completion of certain financial milestones. The Company records a liability or equity that is recognized on the acquisition date for an estimate of the acquisition date fair value of the contingent consideration based on the probability of achieving the milestones and the probability weighted discount on cash flows. Any change in the fair value of contingent milestone consideration subsequent to the acquisition date is recognized in the consolidated statements of income. Contingent consideration classified as a liability is re-measured to fair value each reporting period until the contingency is resolved. The changes in fair value are recognized in earnings. Contingent consideration classified as equity is not re-measured.
Long-Lived Assets
The Company reviews its long-lived assets for impairment annually. Whenever events or circumstances indicate that the carrying amount of an asset may not be fully recoverable, the Company would recognize an impairment loss if the sum of the expected long-term undiscounted cash flows that the long-lived asset is expected to generate is less than the carrying amount of the long-lived asset being evaluated. The Company treats any write-downs as permanent reductions in the carrying amounts of the assets. The Company believes the carrying amounts of its assets at December 31, 2010 and 2009 are fully realizable and has not recorded any impairment losses.
Deferred Rent and Lease Accounting
The Company leases bandwidth, co-location and office space in various locations. At the inception of each lease, the Company evaluates the lease terms to determine whether the lease will be accounted for as an operating or a capital lease. The term of the lease used for this evaluation includes renewal option periods only in instances where the exercise of the renewal option can be reasonably assured and failure to exercise the option would result in an economic penalty. The Company records tenant improvement allowances granted under the lease agreements as leasehold improvements within property and equipment and within deferred rent.
For leases that contain rent escalation provisions, the Company records the total rent payable during the lease term, as determined above, on a straight-line basis over the term of the lease (including any “rent free” period beginning upon possession of the premises), and records any difference between the actual rent paid and the straight-line rent expense recorded as increases or decreases in deferred rent.
Cost of Revenue
Cost of revenues consists primarily of fees paid to network providers for bandwidth and backbone, costs incurred for non settlement free peering and connection to Internet service provider networks or ISPs and fees paid to data center operators for housing network equipment in third party network data centers, also known as co-location costs. Cost of revenues also includes employee costs, network storage costs, cost of professional services, costs of licenses, and depreciation of network equipment. The Company enters into contracts for bandwidth with third party network providers with terms typically ranging from several months to five years. These contracts generally commit the Company to pay minimum monthly fees plus additional fees for bandwidth
85
Table of Contents
usage above contracted minimums. A significant portion of the CDN traffic delivery is completed through direct connection to Internet service provider networks, called peering, generally at no charge. This avoids entirely the bandwidth cost associated with the delivery. The Company does not consider these relationships to represent the culmination of an earnings process. Accordingly, the Company does not recognize as revenue the value to the ISPs associated with the use of the Company’s servers nor does the Company recognize as expense the value of the rack space and bandwidth received at no cost.
Research and Development and Software Development Costs
The Company charges research and development costs, other than certain software development costs, to expense as incurred. Software development costs incurred subsequent to the establishment of technological feasibility and prior to the introduction into the Company’s content delivery network or other provided services are capitalized and amortized to cost of revenue over the estimated useful life of the related software. There were no costs capitalized at December 31, 2010, 2009 or 2008, respectively, because the costs incurred from technological feasibility to the introduction into the network were immaterial.
Income Taxes
The Company accounts for income taxes under the asset and liability method, which requires the recognition of deferred tax assets and liabilities for the expected future tax consequences of events that have been included in the financial statements. Under this method, deferred tax assets and liabilities are determined based on the differences between the financial statements and tax basis of assets and liabilities using enacted tax rates in effect for the year in which the differences are expected to reverse. The effect of a change in tax rates on deferred tax assets and liabilities is recognized in income in the period that includes the enactment date.
The Company records net deferred tax assets to the extent it believes these assets will more likely than not be realized. In making such determination, the Company considers all available positive and negative evidence, including scheduled reversals of deferred tax liabilities, projected future taxable income, tax planning strategies and recent financial performance. In the event the Company was to determine that it would be able to realize its deferred income tax assets in the future in excess of their net recorded amount, the Company would make an adjustment to the valuation allowance which would reduce the provision for income taxes.
The Company recognizes uncertain income tax positions in its financial statements when it is more-likely-than-not the position will be sustained upon examination.
Fair Value of Financial Instruments
The carrying amounts of cash and cash equivalents approximate fair value due to the short maturity of those instruments. The respective fair values of investments are determined based on quoted market prices, which approximate fair values. The carrying amounts of accounts receivable, accounts payable and accrued liabilities reported in the consolidated balance sheets approximate their respective fair values because of the immediate or short-term maturity of these financial instruments.
Use of Estimates
The preparation of financial statements in conformity with United States generally accepted accounting principles requires management to make estimates and assumptions that affect the amounts reported in the consolidated financial statements and accompanying notes. Actual results could differ from those estimates. Significant estimates used in these financial statements include, but are not limited to, revenues, accounts receivable and related reserves, useful lives and realizability of long-term asset, provision for litigation, capitalized software, acquired intangibles, income and other taxes, the fair value of share-based compensation and other contingent liabilities.
86
Table of Contents
Recently Issued Accounting Pronouncements
In December 2010, the Financial Accounting Standards Board (FASB) issued Accounting Standards Update (ASU) 2010-28, Intangibles — Goodwill and Other (Topic 350): When to Perform Step 2 of the Goodwill Impairment Test for Reporting Units with Zero or Negative Carrying Amounts (ASU 2010-28). ASU 2010-28 clarifies the requirement to test for impairment of goodwill. ASC Topic 350 has required that goodwill be tested for impairment if the carrying amount of a reporting unit exceeds its fair value. Under ASU 2010-28, when the carrying amount of a reporting unit is zero or negative an entity must assume that it is more likely than not that a goodwill impairment exists, perform an additional test to determine whether goodwill has been impaired and calculate the amount of that impairment. The modifications to ASC Topic 350 resulting from the issuance of ASU 2010-28 are effective for fiscal years beginning after December 15, 2010 and interim periods within those years. Early adoption is not permitted. The adoption of ASU 2010-08 is not expected to have an impact on the financial statements of the Company.
In December 2010, the FASB issued ASU 2010-29 “Business Combinations (Topic 805) — Disclosure of Supplementary Pro Forma Information for Business Combinations” (ASU 2010-29). This update clarifies that, when presenting comparative financial statements, SEC registrants should disclose revenue and earnings of the combined entity as though the current period business combinations had occurred as of the beginning of the comparable prior annual reporting period only. The update also expands the supplemental pro forma disclosures to include a description of the nature and amount of material, nonrecurring pro forma adjustments directly attributable to the business combination included in the reported pro forma revenue and earnings. ASU 2010-29 is effective prospectively for material (either on an individual or aggregate basis) business combinations entered into in fiscal years beginning on or after December 15, 2010 with early adoption permitted. The Company does not expect the adoption of the standard to have a material impact on its consolidated results of operations and financial condition.
3. Business Acquisition
Delve Networks, Inc. Acquisition
On July 30, 2010, the Company acquired Delve Networks, Inc. (Delve), a privately-held provider of cloud-based video publishing and analytics services located in Seattle, Washington. The aggregate purchase price of approximately $4.1 million consisted of approximately $2.6 million of cash paid at the closing and 262,453 shares of the Company’s common stock with an estimated fair value of approximately $1.1 million. The fair value of the common stock issued as consideration for Delve was determined on the basis of the closing market price of the Company’s common stock on the acquisition date. In addition, the Company recorded as part of the purchase price approximately $0.4 million of contingent consideration it estimates will be earned relating to an earn-out provision. The estimated earn-out obligation is comprised of approximately $0.2 million of cash consideration and approximately 51,210 shares of the Company’s common stock with an estimated value of approximately $0.2 million at the time of the acquisition. Under the terms of the Merger Agreement, approximately $0.6 million of the cash portion of the purchase price has been set aside in an escrow account and will be held for a period of up to 36 months following the closing date to satisfy any unresolved indemnification claims. In addition, the Company incurred approximately $0.2 million of transaction costs, which primarily consisted of fees for legal services. These transaction costs were included in general and administrative expenses in the Company’s statement of operations for the year ended December 31, 2010. The Company’s consolidated financial statements include the results of operations of Delve from the date of acquisition. The historical results of operations of Delve were not significant to the Company’s consolidated results of operations for the periods presented. The total purchase consideration was allocated to the assets acquired and liabilities assumed at their estimated fair values as of the date of acquisition, as determined by management. In addition, management has made a preliminary estimate of identifiable intangible assets. The allocation is preliminary and they expect it will be finalized during the first quarter of 2011. The excess of the purchase price over the amounts allocated to assets acquired and liabilities assumed has been recorded as goodwill. In accordance with current accounting standards, goodwill associated with the Delve acquisition will not be amortized and will be tested for impairment at least annually (see Note 6).
87
Table of Contents
The following table presents the preliminary allocation of the purchase price for Delve:
| (In thousands) | ||||
| Consideration (including estimated unpaid contingent consideration): |
||||
| Cash |
$ | 2,755 | ||
| Common stock |
1,335 | |||
| Total consideration |
$ | 4,090 | ||
| Acquisition-related costs (included in general and administrative expenses) |
$ | 152 | ||
| Recognized amounts of identifiable assets acquired and liabilities assumed: |
||||
| Financial assets |
$ | 134 | ||
| Property and equipment |
12 | |||
| Identifiable intangible assets |
2,010 | |||
| Financial liabilities |
(315 | ) | ||
| Total identifiable net assets |
1,841 | |||
| Goodwill |
2,249 | |||
| $ | 4,090 | |||
The following were the identified intangible assets acquired and the respective estimated periods over which such assets will be amortized:
| Amount | Weighted Average useful life |
|||||||
| (In thousands) | (In years) | |||||||
| Technology |
$ | 1,830 | 4.0 | |||||
| Customer relationships |
150 | 6.0 | ||||||
| Trade names and trademarks |
30 | 2.5 | ||||||
| Total |
$ | 2,010 | ||||||
In determining the purchase price allocation, the Company considered, among other factors, its intention to use the acquired assets and the historical and estimated future demand for Delve services. The estimated fair value of intangible assets was based upon the income approach. The income approach relies on an estimation of the present value of the future monetary benefits expected to flow to the owner of an asset during its remaining economic life. This approach requires a projection of the cash flow that the asset is expected to generate in the future. The projected cash flow is discounted to its present value using a rate of return, or discount rate that accounts for the time value of money and the degree of risks inherent in the asset. The expected future cash flow that is projected should include all of the economic benefits attributable to the asset, including the tax savings associated with the amortization of the intangible asset value over the tax life of the asset. The income approach may take the form of a “relief from royalty” methodology, a cost savings methodology, a “with and without” methodology, or excess earnings methodology, depending on the specific asset under consideration.
The relief-from-royalty method was used to value the Trade Names and Trademarks and Technology acquired from Delve. The relief-from-royalty method estimates the cost savings that accrue to the owner of an intangible asset that would otherwise be required to pay royalties or license fees on revenues earned through the use of the asset. The royalty rate used is based on an analysis of empirical, market-derived royalty rates for guideline intangible assets. Typically, revenue is projected over the expected remaining useful life of the intangible asset. The royalty rate is then applied to estimate the royalty savings. The key assumptions used in valuing the existing Trade Names and Trademarks acquired are as follows: royalty rate of 0.8%, discount rate of
88
Table of Contents
25%, tax rate of 39% and an economic life of approximately 2.5 years. The key assumptions used in valuing the Technology acquired are as follows: royalty rate of 20%, discount rate of 25%, tax rate of 39%, and an economic life of approximately 4.0 years.
The customer relationships were valued using a form of the income approach know as the multi-period excess earnings method. Inherent in the multi-period excess earnings method is the recognition that, in most cases, all of the assets of the business, both tangible and intangible, contribute to the generation of the cash flow of the business and the net cash flows attributable to the subject asset must recognize the support of the other assets which contribute to the realization of the cash flows. The contributory asset charges are based on the fair value of the contributory assets and either pre-tax or after-tax cash flows are assessed charges representing “returns on” the contributory assets. A contributory asset charge for the use of the technology was assessed on pre-tax cash flows, while contributory asset charges for the use of the working capital, fixed assets, and assembled work force have been deducted from the after-tax cash flow in each year to determine the net future cash flow attributable to the relationships. This future cash flow was then discounted using an estimated required rate of return for the asset to determine the present value of the future cash flows attributable to the asset. The key assumptions used in valuing the customer relationships acquired are as follows: discount rate of 22.5%, tax rate of 39% and estimated average economic life of 6 years.
The total weighted average amortization period for the identified intangible assets acquired from Delve is 4.1 years. The goodwill resulting from the Delve acquisition is not currently deductible for income tax purposes.
EyeWonder, Inc. Acquisition
On April 30, 2010, the Company completed its acquisition of EyeWonder, Inc. (EyeWonder), a provider of interactive digital advertising products and services to advertisers, advertising agencies and publishers headquartered in Atlanta, Georgia. The aggregate purchase price of approximately $114.0 million consisted of approximately $62.8 million of cash and 12,740,000 shares of the Company’s common stock with an estimated fair value of approximately $51.2 million. The fair value of the common shares issued as consideration for EyeWonder was determined on the basis of the closing market price of the Company’s common shares on the acquisition date. Under the terms of the Merger Agreement, 3,013,699 shares of the Company’s common stock have been set aside in an escrow account and will be held until June 28, 2011, subject to any unresolved indemnification claims. As of December 31, 2010, the Company has recorded an asset of $0.5 million which is included in prepaid expenses and other current assets in the accompanying balance sheets related to claims against the escrow account. In addition, the former EyeWonder securityholders had the opportunity to receive up to 4,774,000 shares of the Company’s common stock and approximately $0.3 million in cash in April 2011 if certain performance metrics were satisfied as of December 31, 2010. The Company does not believe that the performance metrics were achieved and accordingly has not recorded any contingent consideration. In addition, the Company incurred approximately $2.4 million of transaction costs, which primarily consisted of fees for legal and financial advisory services. Approximately $1.5 million of these costs were recorded in 2009 and approximately $0.9 million, are included in general and administrative expenses in the Company’s statement of operations for the year ended December 31, 2010. The Company’s consolidated financial statements include the results of operations of EyeWonder from the date of acquisition. The total purchase consideration was allocated to the assets acquired and liabilities assumed at their estimated fair values as of the date of acquisition, as determined by management and, with respect to identifiable intangible assets, by management with the assistance of an appraisal provided by a third party valuation firm. The excess of the purchase price over the amounts allocated to assets acquired and liabilities assumed has been recorded as goodwill. The value of the goodwill from this acquisition can be attributed to a number of business factors including, but not limited to, potential sales opportunities of providing Limelight services to EyeWonder customers; trained technical workforce in place in the United States and Europe; existing sales pipeline and trained sales force and potential cost synergies to be realized. In accordance with current accounting standards, goodwill associated with the EyeWonder acquisition will not be amortized and will be tested for impairment at least annually (see Note 6).
89
Table of Contents
The following table presents the allocation of the purchase price for EyeWonder:
| (In thousands) | ||||
| Consideration: |
||||
| Cash |
$ | 62,782 | ||
| Common stock |
51,215 | |||
| Total consideration |
$ | 113,997 | ||
| Acquisition-related costs (included in general and administrative expenses) |
$ | 2,358 | ||
| Recognized amounts of identifiable assets acquired and liabilities assumed: |
||||
| Financial assets |
$ | 13,218 | ||
| Property and equipment |
1,100 | |||
| Identifiable intangible assets |
18,537 | |||
| Financial liabilities |
(6,717 | ) | ||
| Total identifiable net assets |
26,138 | |||
| Goodwill |
87,859 | |||
| $ | 113,997 | |||
The following were the identified intangible assets acquired and the respective estimated periods over which such assets will be amortized:
| Amount | Weighted Average useful life |
|||||||
| (In thousands) | (In years) | |||||||
| Existing technologies |
$ | 15,770 | 4.0 | |||||
| Patent |
830 | 4.0 | ||||||
| Trademarks |
1,800 | Indefinite | ||||||
| Non-compete agreements |
137 | 1.5 | ||||||
| Total |
$ | 18,537 | ||||||
In determining the purchase price allocation, the Company considered, among other factors, its intention to use the acquired assets and the historical and estimated future demand for EyeWonder services. The estimated fair value of intangible assets was based upon the market approach and the income approach. In applying the market approach, the values of the intangible assets acquired were determined based upon the economic principal of competition. Although there is no established public market for intangible assets, the market approach can be utilized through the analysis of market-derived empirical transaction data. The market approach involves empirical market data involving comparable intangible assets and a comparison of the subject intangible assets to such comparable intangible assets. This method is sometimes referred to as the Net Avoided Royalty Method. In the Net Avoided Royalty Method, transactions involving the licensing of comparable intangible assets are analyzed and the value of an asset is estimated by capitalizing the royalty expense saved because the company owns the asset.
The relief-from-royalty method was used to value the trademarks acquired from EyeWonder. The relief-from-royalty method estimates the cost savings that accrue to the owner of an intangible asset that would otherwise be required to pay royalties or license fees on revenues earned through the use of the asset. The royalty rate used is based on an analysis of empirical, market-derived royalty rates for guideline intangible assets. Typically, revenue is projected over the expected remaining useful life of the completed technology. The market-derived royalty rate is then applied to estimate the royalty savings. The key assumptions used in valuing the existing trademarks acquired are as follows: royalty rate of 0.5%, discount rate of 17%, tax rate of 38% and an indefinite economic life.
90
Table of Contents
The existing technologies, patents and non-compete agreements were valued using the income approach. In utilizing the income approach, the Company estimates the value of an intangible based on the present value of future economic income attributable to the ownership of the asset. This approach is typically determined through a Discounted Cash Flow Method. The Discounted Cash Flow Method provides an indication of value based on discounting projected debt-free net cash flows to their present value at a discount rate that reflects both market based return requirements and risks inherent in the specific intangible asset. In applying this approach, the values of the intangible assets acquired were determined using projections of revenues and expenses specifically attributed to the intangible assets. The income streams were then discounted to present value using estimated risk-adjusted discount rates. The rate used to discount the expected future net cash flows from the intangible assets to their present values was based upon a weighted average cost of capital of approximately 16%. The discount rate was determined after consideration of market rates of return on debt and equity capital, the weighted average return on invested capital and the risk associated with achieving forecasted sales related to the technology and assets acquired from EyeWonder. The key assumptions used in valuing the existing technologies and patents acquired are as follows: discount rate of 17%, tax rate of 38% and estimated average economic life of 4 years. The key assumptions used in valuing the non-compete agreements were as follows: discount rate of 16%, tax rate of 38% and estimated remaining economic life of 1.5 years.
The total weighted average amortization period for the intangible assets acquired from EyeWonder is 3.6 years. The intangible assets are being amortized based upon the pattern in which the economic benefits of the intangible assets are being utilized, which in general reflects the cash flows generated from such assets. The goodwill resulting from the EyeWonder acquisition is not deductible for income tax purposes.
The following table reflects unaudited pro forma results of operations of the Company for the years ended December 30, 2010 and 2009 assuming that the EyeWonder acquisition had occurred on January 1, 2010 and January 1, 2009, respectively (in thousands, expect per share data):
| For the Years Ended December 31, |
||||||||
| 2010 | 2009 | |||||||
| Revenues |
$ | 192,847 | $ | 166,423 | ||||
| Net income |
$ | (22,996 | ) | $ | 31,161 | |||
| Net income per share — basic |
$ | (0.24 | ) | $ | 0.32 | |||
| Net income per share — diluted |
$ | (0.24 | ) | $ | 0.31 | |||
chors GmbH Acquisition
On January 27, 2010, the Company acquired chors GmbH (chors), an on-line and direct marketing solutions provider located in Germany. The aggregate purchase price of approximately $5.9 million consisted of approximately $2.5 million of cash that was paid at closing, and 86,000 shares of the Company’s common stock with an estimated value of approximately $0.3 million that were issued at closing. The fair value of the common shares issued as consideration for chors was determined on the basis of the closing market price of the Company’s common shares on the acquisition date. In addition, the Company recorded as part of the purchase price approximately $3.1 million of estimated contingent consideration relating to an earn-out provision. The estimated earn-out obligation is comprised of approximately $0.3 million of cash consideration and 774,000 shares of the Company’s common stock with an estimated value of approximately $2.8 million at the time of the acquisition. In addition, the Company incurred approximately $0.3 million of transaction costs, which primarily consisted of fees for legal and financial advisory services. These transaction costs were included in general and administrative expenses in the Company’s statement of operations for the year ended December 31, 2010. The Company’s consolidated financial statements include the results of operations of chors from the date of acquisition. The historical results of operations of chors were not significant to the Company’s consolidated results of operations for the periods presented. The total purchase consideration was allocated to the assets acquired and liabilities assumed at their estimated fair values as of the date of acquisition, as determined by
91
Table of Contents
management and, with respect to identifiable intangible assets, by management with the assistance of an appraisal provided by a third party valuation firm. The excess of the purchase price over the amounts allocated to assets acquired and liabilities assumed has been recorded as goodwill. In accordance with current accounting standards, goodwill associated with the chors acquisition will not be amortized and will be tested for impairment at least annually (see Note 6). In accordance with the terms and conditions of the contingent milestone consideration, the Company determined that 387,000 shares of its common stock were earned and those shares were distributed to the former shareholders of chors in November 2010. As of December 31, 2010, the remaining financial milestones in the earn-out provision have been achieved and accordingly the Company expects to distribute the remaining contingent consideration of $0.3 million cash and 387,000 shares of common stock to the former shareholders of chors in March 2011.
The following table presents the allocation of the purchase price for chors:
| (In thousands) | ||||
| Consideration (including estimated unpaid contingent consideration): |
||||
| Cash |
$ | 2,762 | ||
| Common stock |
3,122 | |||
| Total consideration |
$ | 5,884 | ||
| Acquisition-related costs (included in general and administrative expenses) |
$ | 265 | ||
| Recognized amounts of identifiable assets acquired and liabilities assumed: |
||||
| Financial assets |
$ | 845 | ||
| Property and equipment |
63 | |||
| Identifiable intangible assets |
2,498 | |||
| Financial liabilities |
(1,327 | ) | ||
| Total identifiable net assets |
2,079 | |||
| Goodwill |
3,805 | |||
| $ | 5,884 | |||
The following were the identified intangible assets acquired and the respective estimated periods over which such assets will be amortized:
| Amount | Weighted Average useful life |
|||||||
| (In thousands) | (In years) | |||||||
| Existing technologies |
$ | 1,180 | 3.0 | |||||
| Non-compete agreements |
940 | 4.0 | ||||||
| Usage contract |
370 | 1.6 | ||||||
| Trademarks |
8 | 5.0 | ||||||
| Total |
$ | 2,498 | ||||||
In determining the purchase price allocation, the Company considered, among other factors, its intention to use the acquired assets and the historical and estimated future demand for chors services. The fair value of intangible assets was based upon the market approach and the income approach. In applying the market approach, the values of the intangible assets acquired were determined based upon the economic principal of competition. Although there is no established public market for intangible assets, the market approach can be utilized through the analysis of market-derived empirical transaction data. The market approach involves empirical market data involving comparable intangible assets and a comparison of the subject intangible assets to
92
Table of Contents
such comparable intangible assets. This method is sometimes referred to as the Net Avoided Royalty Method. In the Net Avoided Royalty Method, transactions involving the licensing of comparable intangible assets are analyzed and the value of an asset is estimated by capitalizing the royalty expense saved because the company owns the asset.
The relief-from-royalty method was used to value the existing technologies and trademarks acquired from chors. The relief-from-royalty method estimates the cost savings that accrue to the owner of an intangible asset that would otherwise be required to pay royalties or license fees on revenues earned through the use of the asset. The royalty rate used is based on an analysis of empirical, market-derived royalty rates for guideline intangible assets. Typically, revenue is projected over the expected remaining useful life of the completed technology. The market-derived royalty rate is then applied to estimate the royalty savings. The key assumptions used in valuing the existing technologies are as follows: royalty rate of 14%, discount rate of 21.5%, tax rate of 25% and estimated average economic life of 3 years. The key assumptions used in valuing the existing trademarks are as follows: royalty rate of 0.5%, discount rate of 21.5%, tax rate of 25% and estimated average economic life of 5 years.
The non-compete agreements and usage contract were valued using the income approach. In utilizing the income approach, the Company estimates the value of an intangible based on the present value of future economic income attributable to the ownership of the asset. This approach is typically determined through a Discounted Cash Flow Method. The Discounted Cash Flow Method provides an indication of value based on discounting projected debt-free net cash flows to their present value at a discount rate that reflects both market based return requirements and risks inherent in the specific intangible asset. In applying this approach, the values of the intangible assets acquired were determined using projections of revenues and expenses specifically attributed to the intangible assets. The income streams were then discounted to present value using estimated risk-adjusted discount rates. The rate used to discount the expected future net cash flows from the intangible assets to their present values was based upon a weighted average cost of capital of approximately 20%. The discount rate was determined after consideration of market rates of return on debt and equity capital, the weighted average return on invested capital and the risk associated with achieving forecasted sales related to the technology and assets acquired from chors. The key assumptions used in valuing the non-compete agreements and usage contract were as follows: 20.5% for non-compete agreements, and 18.5% for usage contract, tax rate of 25% and estimated remaining economic life of 4 years for non-compete agreements and 1.6 years for the usage contract.
The total weighted average amortization period for the intangible assets acquired from chors is 3.2 years. The intangible assets are being amortized based upon the pattern in which the economic benefits of the intangible assets are being utilized, which in general reflects the cash flows generated from such assets. The goodwill resulting from the chors acquisition is not deductible for income tax purposes.
Kiptronic Inc. Acquisition
On May 20, 2009, the Company entered into an asset purchase agreement to acquire substantially all of the assets of Kiptronic Inc. (Kiptronic) for approximately $1.0 million. The aggregate purchase price of approximately $1.0 million consisted of 213,334 shares of the Company’s common stock. The fair value of the common shares issued as consideration for Kiptronic was determined on the basis of the closing market price of the Company’s common shares on the acquisition date. In addition, the Company incurred $0.1 million of transaction costs, which primarily consisted of fees for legal and financial advisory services. These transaction costs are included in general and administrative expenses in the Company’s statement of operations for the year ended December 31, 2009. The Company’s consolidated financial statements include the results of operations of Kiptronic from the date of acquisition. The historical results of operations of Kiptronic were not significant to the Company’s consolidated results of operations for the periods presented. The total purchase consideration was allocated to the assets acquired and liabilities assumed at their estimated fair values as of the date of acquisition, as determined by management and, with respect to identifiable intangible assets, by management with the
93
Table of Contents
assistance of an appraisal provided by a third party valuation firm. The purchase price allocation was finalized during the quarter ended September 30, 2009. The excess of the purchase price over the amounts allocated to assets acquired and liabilities assumed has been recorded as goodwill. In accordance with current accounting standards, goodwill associated with the Kiptronic acquisition will not be amortized and will be tested for impairment at least annually (see Note 6). The allocation of the aggregate purchase price includes: tangible assets of $0.2 million, identifiable intangible assets of $0.5 million, assumed liabilities of $0.3 million, and goodwill of $0.6 million. Kiptronic develops mobility and monetization solutions for content publishers. The combination of the Company’s distributed computing and delivery platform with Kiptronic device-targeting and dynamic ad insertion technologies will allow the Company to provide media and entertainment companies a streamlined and scalable solution for the migration of media consumption from the PC to the wider variety of Internet-connected and mobile devices.
The following table presents the allocation of the purchase price for Kiptronic:
| (In thousands) | ||||
| Consideration: |
||||
| Common stock |
$ | 962 | ||
| Total consideration |
$ | 962 | ||
| Acquisition-related costs (included in general and administrative expenses) |
$ | 135 | ||
| Recognized amounts of identifiable assets acquired and liabilities assumed: |
||||
| Financial assets |
$ | 87 | ||
| Property and equipment |
96 | |||
| Identifiable intangible assets |
463 | |||
| Financial liabilities |
(303 | ) | ||
| Total identifiable net assets |
343 | |||
| Goodwill |
619 | |||
| $ | 962 | |||
The following were the identified intangible assets acquired and the respective estimated periods over which such assets will be amortized:
| Amount | Weighted Average useful life |
|||||||
| (In thousands) | (In years) | |||||||
| Existing technologies |
$ | 440 | 4.0 | |||||
| Domain names |
11 | 1.0 | ||||||
| Customer relationships and contracts |
12 | 0.6 | ||||||
| Total |
$ | 463 | ||||||
In determining the purchase price allocation, the Company considered, among other factors, its intention to use the acquired assets and the historical and estimated future demand for Kiptronic services. The fair value of intangible assets was based upon the market approach and the cost approach. In applying the market approach, the values of the intangible assets acquired were determined based upon the economic principal of competition. Although there is no established public market for intangible assets, the market approach can be utilized through the analysis of market-derived empirical transaction data. The market approach involves empirical market data involving comparable intangible assets and a comparison of the subject intangible assets to such comparable intangible assets. This method is sometimes referred to as the Net Avoided Royalty Method. In the Net Avoided
94
Table of Contents
Royalty Method, transactions involving the licensing of comparable intangible assets are analyzed and the value of an asset is estimated by capitalizing the royalty expense saved because the company owns the asset.
The relief-from-royalty method was used to value the existing technologies acquired from Kiptronic. The relief-from-royalty method estimates the cost savings that accrue to the owner of an intangible asset that would otherwise be required to pay royalties or license fees on revenues earned through the use of the asset. The royalty rate used is based on an analysis of empirical, market-derived royalty rates for guideline intangible assets. Typically, revenue is projected over the expected remaining useful life of the completed technology. The market-derived royalty rate is then applied to estimate the royalty savings. The key assumptions used in valuing the existing technologies are as follows: royalty rate of 10%, discount rate of 22%, tax rate of 39% and estimated average economic life of 4 years.
In determining the value of domain names, an analysis of the market for domain names was performed. This analysis shows that prices range from $499 to $3,300, with a median of $1,588. Management determined that the acquired domain names have an estimated value of $1,500 each. Applying a tax rate of 39% and adding the present value of the tax savings to the estimated value of the domain names the Company arrived at the aggregate fair value of the domain names.
The customer relationships and customer contracts were valued using the cost approach. In utilizing the cost approach, the Company estimates the costs that are associated with establishing the customer relationship and contact. These estimates are used to value the customer relationship and contracts net of the Company’s effective tax rate of 39% and the present value of the tax savings amortization. The key assumptions used in valuing the customer relationships and contracts were as follows: estimated salaries of functional personnel, man-hours per relationship, estimated attrition rate of 10% (customer relationships only), tax rate of 39% and estimated remaining economic life of 7 months.
The total weighted average amortization period for the intangible assets acquired from Kiptronic is 3.8 years. The intangible assets are being amortized based upon the pattern in which the economic benefits of the intangible assets are being utilized, which in general reflects the cash flows generated from such assets. The goodwill resulting from the Kiptronic acquisition is deductible for income tax purposes and will be amortized over 15 years.
4. Accounts Receivable
Accounts receivable include (in thousands):
| December 31, | ||||||||
| 2010 | 2009 | |||||||
| Accounts receivable |
$ | 41,167 | $ | 29,457 | ||||
| Unbilled accounts receivable |
8,068 | 6,132 | ||||||
| 49,235 | 35,589 | |||||||
| Less: credit allowance |
(1,080 | ) | (1,190 | ) | ||||
| Less: allowance for bad debt |
(6,215 | ) | (8,036 | ) | ||||
| Total accounts receivable, net |
$ | 41,940 | $ | 26,363 | ||||
95
Table of Contents
5. Prepaid Expenses and Other Current Assets
Prepaid expenses and other current assets include (in thousands):
| December 31, | ||||||||
| 2010 | 2009 | |||||||
| Prepaid bandwidth and backbone services |
$ | 3,238 | $ | 3,511 | ||||
| Non-income taxes receivable (VAT) |
2,178 | 3,449 | ||||||
| Employee advances and prepaid recoverable commissions |
208 | 147 | ||||||
| Interest receivable |
97 | 413 | ||||||
| Other |
3,907 | 2,134 | ||||||
| Total prepaid expenses and other current assets |
$ | 9,628 | $ | 9,654 | ||||
The Company is subject to and has paid Value Added Tax (VAT) in certain foreign jurisdictions in which it operates. Based on analysis and application of the VAT laws in particular locations, the Company believes it is entitled to a refund of VAT previously paid.
In January and September 2009, the Company entered into multi-year arrangements with a telecommunications provider for additional bandwidth and backbone capacity. The agreements required the Company to make advanced payments for future services to be received.
6. Goodwill and Other Intangible Assets
The Company has recorded goodwill and other intangible assets as a result of its business acquisitions of Kiptronic, chors, EyeWonder and Delve that occurred in May 2009, January 2010, April 2010 and July 2010, respectively.
The excess of the purchase price over the amounts allocated to assets acquired and liabilities assumed has been recorded as goodwill. As of December 31, 2010, the Company has recorded goodwill of approximately $94.4 million.
The Company reviews goodwill for impairment annually or whenever events or changes in circumstances indicate that the carrying amount may exceed their fair value. The Company concluded that it had one reporting unit and assigned the entire balance of goodwill to this reporting unit as of December 31, 2010.
Other intangible assets that are subject to amortization consist of the following (in thousands):
| December 31, 2010 | ||||||||||||
| Gross Carrying Amount |
Accumulated Amortization |
Net Carrying Amount |
||||||||||
| Existing technologies |
$ | 19,168 | $ | (3,345 | ) | $ | 15,823 | |||||
| Trademark |
1,837 | (6 | ) | 1,831 | ||||||||
| Non-compete agreements |
1,035 | (265 | ) | 770 | ||||||||
| Patents |
830 | (138 | ) | 692 | ||||||||
| Usage contract |
354 | (204 | ) | 150 | ||||||||
| Customer relationships |
162 | (22 | ) | 140 | ||||||||
| Domain names |
11 | (11 | ) | — | ||||||||
| Total other intangible assets |
$ | 23,397 | $ | (3,991 | ) | $ | 19,406 | |||||
96
Table of Contents
| December 31, 2009 | ||||||||||||
| Gross Carrying Amount |
Accumulated Amortization |
Net Carrying Amount |
||||||||||
| Existing technologies |
$ | 440 | $ | (74 | ) | $ | 366 | |||||
| Domain names |
11 | (7 | ) | 4 | ||||||||
| Customer relationships and contracts |
12 | (12 | ) | — | ||||||||
| Total other intangible assets |
$ | 463 | $ | (93 | ) | $ | 370 | |||||
Aggregate expense related to amortization of other intangible assets for the year ended December 31, 2010, 2009 and 2008 was approximately $3.9 million, $0.1 million and $0, respectively. Based on the Company’s other intangible assets as of December 31, 2010, aggregate expense related to amortization of other intangible assets is expected to be approximately $5.6 million, $5.4 million, $4.9 million and $1.7 million for fiscal years 2011, 2012, 2013 and 2014, respectively.
7. Property and Equipment
Property and equipment include (in thousands):
| December 31, | ||||||||
| 2010 | 2009 | |||||||
| Network equipment |
$ | 151,350 | $ | 115,505 | ||||
| Computer equipment |
8,112 | 5,493 | ||||||
| Furniture and fixtures |
952 | 691 | ||||||
| Leasehold improvements |
3,525 | 2,812 | ||||||
| Other equipment |
498 | 473 | ||||||
| 164,437 | 124,974 | |||||||
| Less: accumulated depreciation |
(110,030 | ) | (89,450 | ) | ||||
| Total property and equipment, net |
$ | 54,407 | $ | 35,524 | ||||
Depreciation and amortization expense related to property and equipment was approximately $24.8 million, $26.3 million, and $27.0 million for the years ended December 31, 2010, 2009 and 2008, respectively.
8. Other Assets
Other assets include (in thousands):
| December 31, | ||||||||
| 2010 | 2009 | |||||||
| Prepaid backbone services |
$ | 4,326 | $ | 7,413 | ||||
| Vendor deposits and other |
1,904 | 719 | ||||||
| Restricted cash |
314 | — | ||||||
| Cost basis investments |
407 | — | ||||||
| Total other assets |
$ | 6,951 | $ | 8,132 | ||||
In January and September 2009, the Company entered into multi-year arrangements with a telecommunications provider for additional bandwidth and backbone capacity. The agreements required the Company to make advanced payments for future services to be received.
97
Table of Contents
The Company secures its capital lease obligation with a letter of credit that is collateralized by $263,000 of cash as of September 30, 2010. Upon repayment of the capital lease obligation, the letter of credit would no longer be required and the restricted cash would be available for general use. In addition, the Company secures a business credit card with a letter of credit that is collateralized by approximately $50,000 of cash that the Company also considers as restricted cash.
On May 18, 2010, the Company made a strategic investment in Gaikai, a private cloud-based gaming technology company that allows users to play major PC and console games through a web browser. The Company will provide services to Gaikai, which will be recorded as revenue when earned, with a corresponding increase in its cost basis of its investment.
9. Other Current Liabilities
Other current liabilities include (in thousands):
| December 31, | ||||||||
| 2010 | 2009 | |||||||
| Accrued compensation and benefits |
$ | 7,476 | $ | 2,827 | ||||
| Accrued cost of revenue |
2,795 | 2,822 | ||||||
| Contingent consideration liability |
414 | — | ||||||
| Non income taxes payable |
1,762 | 747 | ||||||
| Income taxes payable |
1,643 | 1,905 | ||||||
| Accrued legal fees |
1,545 | 2,702 | ||||||
| Other accrued expenses |
4,365 | 3,137 | ||||||
| Total other current liabilities |
$ | 20,000 | $ | 14,140 | ||||
The Company has determined that certain transactions are subject to sales tax in some of the states in which it operates. Accordingly, the Company has recorded a liability for those amounts which are probable and reasonably estimated.
10. Litigation
In June 2006, Akamai Technologies, Inc., or Akamai, and the Massachusetts Institute of Technology, or MIT, filed a lawsuit against the Company in the United States District Court for the District of Massachusetts alleging that the Company was infringing two patents assigned to MIT and exclusively licensed by MIT to Akamai, United States Patent No. 6,553,413 (the ‘413 patent) and United States Patent No. 6,108,703 (the ‘703 patent). In September 2006, Akamai and MIT expanded their claims to assert infringement of a third, recently issued patent United States Patent No. 7,103,645 (the ‘645 patent). In February 2008, a jury returned a verdict in this lawsuit, finding that the Company infringed four claims of the ‘703 patent at issue and rejecting the Company’s invalidity defenses for the period April 2005 through December 31, 2007. The jury awarded an aggregate of approximately $45.5 million which includes lost profits, reasonable royalties and price erosion damages. In addition, the jury awarded prejudgment interest which the Company estimated to be $2.6 million at December 31, 2007. The Company recorded an aggregate $48.1 million as a provision for litigation as of December 31, 2007. During the year ended December 31, 2008, the Company estimated its revenue from alleged infringing methods totaled approximately 25% of total revenue. The Company recorded a potential additional provision for litigation totaling $15.5 million, plus additional interest of $2.0 million, for the year ended December 31, 2008. The total provision for litigation at December 31, 2008 was $65.6 million.
On July 1, 2008, the court denied the Company’s Motions for Judgment as a Matter of Law (JMOL), Obviousness, and a New Trial. The court also denied Akamai’s Motion for Permanent Injunction as premature and its Motions for Summary Judgment regarding the Company’s equitable defenses. The court conducted a
98
Table of Contents
bench trial in November 2008 regarding the Company’s equitable defenses. The Company also filed a motion for reconsideration of the court’s earlier denial of the Company’s motion for JMOL. The Company’s motion for JMOL was based largely upon a clarification in the standard for a finding of joint infringement articulated by the Federal Circuit in the case of Muniauction, Inc. v. Thomson Corp. (the Muniauction Case), released after the court denied the Company’s initial motion for JMOL. On April 24, 2009 the court issued its order and memorandum setting aside the adverse jury verdict and ruling that the Company did not infringe Akamai’s ‘703 patent and that the Company is entitled to judgment as a matter of law. Based upon the court’s April 24, 2009 order the Company has reversed the $65.6 million provision for litigation previously recorded for this lawsuit as the Company no longer believes that payment of any amounts represented by the litigation provision is probable. The court entered final judgment in favor of the Company on May 22, 2009, and Akamai filed its notice of appeal of the court’s decision on May 26, 2009. The court heard arguments by both parties on June 7, 2010. On December 20, 2010 the Court of Appeals for the Federal Circuit issued its opinion affirming the District Court’s entry of judgment in our favor. On February 18, 2011, Akamai filed a motion with the Court of Appeals for the Federal Circuit seeking a rehearing and rehearing en banc. We believe that we do not infringe Akamai’s patents and will continue to vigorously defend our position. In light of the favorable ruling from the Court of Appeals we do not believe that a loss is probable. Therefore, we have made no provision for this lawsuit in our financial statements.
Legal and other expenses associated with this case have been significant. The Company includes these litigation expenses in general and administrative expenses, as reported in its consolidated statement of operations.
In December 2007, Level 3 Communications, LLC, or Level 3, filed a lawsuit against the Company in the United States District Court for the Eastern District of Virginia alleging that the Company was infringing certain patents Level 3 acquired from Savvis Communications Corp. In addition to monetary relief, including treble damages, interest, fees and costs, the complaint sought an order permanently enjoining the Company from conducting its business in a manner that infringed the relevant patents. A jury trial was conducted in the United States District Court for the Eastern District of Virginia in January 2009, and on January 23, 2009 the jury returned a verdict favorable to the Company finding that the Company did not infringe the Level 3 patents. The Company believes the jury verdict finding that the Company did not infringe the Level 3 patents is correct, and that the claims of infringement asserted against the Company by Level 3 in the litigation were without merit. The court denied Level 3’s subsequent motion for JMOL or alternatively for a new trial, and entered judgment in favor of the Company. Level 3 filed its notice of appeal of the court’s decision on July 21, 2009. On May 3, 2010 the United States Court of Appeals for the Federal Circuit heard oral argument on this matter, and on May 5, 2010 the court affirmed the District Court judgment in favor of the Company. Level 3 subsequently filed a motion for re-hearing and rehearing en banc that the Court subsequently denied. In light of the favorable ruling the Company does not believe a loss is probable. Therefore, there is no provision for this lawsuit in the Company’s financial statements.
In August 2007, the Company, certain of its officers and current and former directors, and the firms that served as the lead underwriters in the Company’s initial public offering were named as defendants in several purported class action lawsuits filed in the United States District Courts for the District of Arizona and the Southern District of New York. All of the New York cases were transferred to Arizona and consolidated into a single action. The plaintiffs’ consolidated complaint asserted causes of action under Sections 11, 12, and 15 of the Securities Act of 1933, as amended, on behalf of a purported class of individuals who purchased the Company’s common stock in its initial public offering and/or pursuant to its Prospectus. The complaint alleges, among other things, that the Company omitted and/or misstated certain facts concerning the seasonality of its business and the loss of revenue related to certain customers. On March 17, 2008, the Company and the individual defendants moved to dismiss all of the plaintiffs’ claims and a hearing was held on June 16, 2008. On August 8, 2008, the court granted the motion to dismiss, dismissing plaintiffs’ claims under Section 12 with prejudice and granting leave to amend the claims under Sections 11 and 15. Plaintiffs chose not to amend the claims under Sections 11 and 15, and on August 29, 2008 the court entered judgment in favor of the Company. On September 5, 2008, plaintiffs filed a notice of appeal, and appellate briefs were filed by the parties in January
99
Table of Contents
and February 2009. The Company believes that it and the individual defendants have meritorious defenses to the plaintiffs’ claims and intends to contest the lawsuits vigorously. In November 2009 the parties entered into a Memorandum of Understanding to settle this lawsuit for an amount well within the coverage limits of the primary carrier of our directors and officers liability insurance, and on July 7, 2010 the parties entered into a settlement agreement consistent with the terms of the Memorandum of Understanding, which will require court approval. A hearing before the Federal District Court is currently scheduled for March 22, 2011. We anticipate court approval of the settlement. We do not believe that a loss is probable. Therefore, we have made no provision for this lawsuit in our financial statements.
11. Net (Loss) Income per Share
The Company calculates basic and diluted earnings per weighted average share based on net (loss) income and includes the restricted stock as participating securities. The Company uses the weighted-average number of common shares outstanding during the period, plus the restricted stock discussed below, for the computation of basic earnings per share. Diluted earnings per share include the dilutive effect of convertible stock options and restricted stock units in the weighted-average number of common shares outstanding.
On January 1, 2009, the Company adopted ASC Topic 260 (ASC 260), (formerly FSP No. EITF 03-6-1, Determining Whether Instruments Granted in Share-Based Payment Transactions are Participating Securities. ASC 260 addresses whether instruments granted in share-based payment awards are participating securities prior to vesting and therefore, must be included in the earnings allocation in calculating earnings per share under the two-class method described in ASC 260. The Company’s restricted stock qualifies as a participating security as defined by ASC 260 as the holders have the non-forfeitable right to receive dividends declared or paid with respect to such restricted stock. The Company has applied ASC 260 to the earnings per share calculations for the periods ended December 31, 2009 and 2008. The Company has included in the computation of outstanding shares approximately 248,000 and 872,000, respectively of non-vested restricted stock for the years ended December 31, 2009 and 2008, respectively. The impact of adoption changed previously reported net loss per share for the year ended December 31, 2008 from ($0.77) to ($0.76) per share.
The following table sets forth the components used in the computation of basic and diluted net (loss) income per share for the periods indicated (in thousands, except per share data):
| 2010 | 2009 | 2008 | ||||||||||
| Net (loss) income |
$ | (20,351 | ) | $ | 34,890 | $ | (63,067 | ) | ||||
| Basic weighted average common shares |
94,300 | 84,202 | 82,932 | |||||||||
| Basic weighted average common shares |
94,300 | 84,202 | 82,932 | |||||||||
| Dilutive effect of stock options and restricted stock units |
— | 3,770 | — | |||||||||
| Diluted weighted average common shares |
94,300 | 87,972 | 82,932 | |||||||||
| Basic net (loss) income per share |
$ | (0.22 | ) | $ | 0.41 | $ | (0.76 | ) | ||||
| Diluted net (loss) income per share |
$ | (0.22 | ) | $ | 0.40 | $ | (0.76 | ) | ||||
The following outstanding options and common stock subject to repurchase were excluded from the computation of diluted net loss per common share for the periods presented because including them would have had an antidilutive effect (in thousands):
| 2010 | 2009 | 2008 | ||||||||||
| Options to purchase common stock and stock subject to repurchase |
5,046 | 4,415 | 2,168 | |||||||||
100
Table of Contents
12. Comprehensive Loss
The following table presents the calculation of comprehensive income (loss) and its components (in thousands):
| Years Ended December 31, | ||||||||||||
| 2010 | 2009 | 2008 | ||||||||||
| (In thousands, except per share data) | ||||||||||||
| Net (loss) income |
$ | (20,351 | ) | $ | 34,890 | $ | (63,067 | ) | ||||
| Other comprehensive (loss) income, net of tax: |
||||||||||||
| Unrealized gain (loss) on investments |
406 | 104 | (125 | ) | ||||||||
| Foreign exchange translation |
(170 | ) | (271 | ) | 279 | |||||||
| Other comprehensive income (loss) |
236 | (167 | ) | 154 | ||||||||
| Comprehensive (loss) income |
$ | (20,115 | ) | $ | 34,723 | $ | (62,913 | ) | ||||
For the periods presented, accumulated other comprehensive income consisted of (in thousands):
| December 31, | ||||||||
| 2010 | 2009 | |||||||
| Net unrealized gain on investments, net of tax |
$ | 499 | $ | 93 | ||||
| Foreign currency translation, net of tax |
(170 | ) | — | |||||
| Total accumulated other comprehensive income |
$ | 329 | $ | 93 | ||||
13. Notes Payable and Credit Facilities
Line of Credit — Bank
The Company had a $5.0 million bank Line of Credit that matured on October 31, 2009. The Company did not renew the Line of Credit. As of December 31, 2010, the Company had no outstanding bank debt.
Interest expense during 2010, 2009 and 2008 was approximately $77,000, $39,000 and $55,000, respectively and was comprised of interest paid in association with a filing of non-income tax related payments, interest paid on capital leases and the amortization of deferred financing costs.
14. Stockholders’ Equity
Common Stock
The Board of Directors has authorized 150,000,000 shares of $0.001 par value Common Stock at December 31, 2010. The Company has reserved 5,896,000 unissued shares of Common Stock for options outstanding under the incentive compensation plan.
On March 2, 2011 the Company completed an underwritten public offering of its common stock in which it sold and issued 11,500,000 shares of its common stock, including 1,500,000 shares subject to the underwriters’ over-allotment option, at a price to the public of $7.10 per share. The newly issued common shares began trading on the Nasdaq Global Select Market on March 2, 2011. The Company raised a total of approximately $81.7 million in gross proceeds from the offering, or approximately $77.3 million in net proceeds after deducting underwriting discounts and commissions of approximately $3.9 million and other offering costs of approximately $0.5 million. The offering was made pursuant to the effective registration statement on Form S-3 (Registration Statement No. 333-170609) previously filed with and declared effective by the Securities and Exchange Commission on November 26, 2010 and the prospectus supplement thereunder filed with the Securities and Exchange Commission on February 28, 2011.
101
Table of Contents
Preferred Stock
The Board of Directors has authorized the issuance of up to 7,500,000 shares of preferred stock at December 31, 2010. The preferred stock may be issued in one or more series pursuant to a resolution or resolutions providing for such issuance duly adopted by the Board of Directors. As of December 31, 2010, the Board of Directors had not adopted any resolutions for the issuance of preferred stock.
15. Share-Based Compensation
The Company measures all employee share-based payment awards using a fair-value method. The grant date fair value is determined using the Black-Scholes-Merton pricing model. The Black-Scholes-Merton valuation calculation requires the Company to make key assumptions such as future stock price volatility, expected terms, risk-free rates and dividend yield. The weighted-average expected term for stock options granted was calculated using the simplified method. The simplified method defines the expected term as the average of the contractual term and the vesting period of the stock option. The Company has estimated the volatility rates used as inputs to the model based on an analysis of the most similar public companies for which it has data. The selection of representative companies as well as in evaluating the available historical volatility data for these companies requires considerable judgment by the Company.
In computing share based compensation the Company develops an estimate of the number of share-based awards which it expects will be forfeited due to employee turnover and reduces share-based compensation based on this estimate. Changes in the estimated forfeiture rate may have a significant effect on share-based payments expense, as the effect of adjusting the rate for all expense amortization after January 1, 2006 is recognized in the period the forfeiture estimate is changed. If the actual forfeiture rate is higher than the estimated forfeiture rate, then an adjustment is made to increase the estimated forfeiture rate, which will result in a decrease to the expense recognized in the financial statements. If the actual forfeiture rate is lower than the estimated forfeiture rate, then an adjustment is made to decrease the estimated forfeiture rate, which will result in an increase to the expense recognized in the financial statements. The risk-free rate is based on the United States Treasury yield curve in effect at the time of grant. The Company has never paid cash dividends, and does not currently intend to pay cash dividends, and thus have assumed a 0% dividend yield.
The Company will continue to use judgment in evaluating the expected term, volatility and forfeiture rate related to the Company’s own stock-based awards on a prospective basis, and in incorporating these factors into the model. If the Company’s actual experience differs significantly from the assumptions used to compute the Company’s share-based compensation cost, or if different assumptions had been used, the Company may have recorded too much or too little share-based compensation cost.
Incentive Compensation Plans
The Company maintains Incentive Compensation Plans (the Plans) to attract, motivate, retain and reward high quality executives and other employees, officers, directors and consultants by enabling such persons to acquire or increase a propriety interest in the Company. The Plans are intended to be qualified plans under the Internal Revenue Code.
The Plans allow the Company to award stock option grants and restricted stock to employees, directors and consultants of the Company. Through December 31, 2010 the Company has granted awards to employees, directors and consultants. The exercise price of incentive stock options granted under the Plan may not be granted at less than 100% of the fair market value of the Company’s common stock on the date of the grant. Stock options and restricted stock are generally subjected to 4 year vesting with the first 25% of the grant vesting on the first anniversary date of the grant, with the remainder vesting monthly thereafter.
102
Table of Contents
Data pertaining to stock option activity under the Plan is as follows:
| Number of Shares |
Weighted Average Exercise Price |
|||||||
| (In thousands) | ||||||||
| Balance at December 31, 2007 |
8,474 | $ | 6.17 | |||||
| Granted |
3,835 | 5.57 | ||||||
| Exercised |
(645 | ) | 0.34 | |||||
| Cancelled |
(4,825 | ) | 8.21 | |||||
| Balance at December 31, 2008 |
6,839 | 4.94 | ||||||
| Granted |
2,454 | 4.56 | ||||||
| Exercised |
(722 | ) | 0.38 | |||||
| Cancelled |
(711 | ) | 5.10 | |||||
| Balance at December 31, 2009 |
7,860 | 5.22 | ||||||
| Granted |
5,751 | 4.17 | ||||||
| Exercised |
(829 | ) | 2.35 | |||||
| Cancelled |
(774 | ) | 4.95 | |||||
| Balance at December 31, 2010 |
12,008 | 4.94 | ||||||
The following table summarizes the information about stock options outstanding and exercisable at December 31, 2010:
| Options Outstanding |
Options Exercisable | |||||||||||||||||||
| Exercise Price |
Number of Shares Outstanding |
Weighted Average Remaining Contractual Life (Years) |
Weighted Average Exercise Price |
Number of Shares Exercisable |
Weighted Average Exercise Price |
|||||||||||||||
| (In thousands) | (In thousands) | |||||||||||||||||||
| $ 0.00 — $ 1.50 |
952 | 5.03 | $ | 0.36 | 952 | $ | 0.36 | |||||||||||||
| $ 1.51 — $ 3.00 |
262 | 7.21 | 2.40 | 189 | 2.35 | |||||||||||||||
| $ 3.01 — $ 4.50 |
6,130 | 9.07 | 3.95 | 971 | 3.61 | |||||||||||||||
| $ 4.51 — $ 6.00 |
1,525 | 8.41 | 4.96 | 607 | 4.99 | |||||||||||||||
| $ 6.01 — $ 7.50 |
2,172 | 6.98 | 6.46 | 1,311 | 6.43 | |||||||||||||||
| $ 7.51 — $ 9.00 |
172 | 7.35 | 7.76 | 113 | 7.76 | |||||||||||||||
| $ 9.01 — $10.50 |
10 | 6.86 | 9.93 | 10 | 9.93 | |||||||||||||||
| $10.51 — $12.00 |
178 | 6.50 | 11.12 | 146 | 11.13 | |||||||||||||||
| $12.01 — $13.50 |
3 | 6.85 | 12.52 | 2 | 12.52 | |||||||||||||||
| $13.51 — $15.00 |
604 | 6.41 | 15.00 | 528 | 15.00 | |||||||||||||||
| 12,008 | 4,829 | |||||||||||||||||||
The weighted-average grant-date fair value of options granted during the year ended December 31, 2010, 2009 and 2008 on a per-share basis was approximately $2.55, $3.02 and $4.03, respectively. The total intrinsic value of the options exercised during the years ended December 31, 2010, 2009 and 2008 was approximately $2.8 million, $2.4 million and $2.3 million, respectively. The aggregate intrinsic value of options outstanding at December 31, 2010 is approximately $18.8 million.
103
Table of Contents
The fair value of each new option awarded is estimated on the grant date using the Black-Scholes-Merton model using the assumptions noted in the following table:
| Years Ended December 31, | ||||||||||||
| 2010 | 2009 | 2008 | ||||||||||
| Expected volatility |
74.95 | % | 77.17 | % | 84.84 | % | ||||||
| Expected term, years |
5.61 | 5.47 | 5.83 | |||||||||
| Risk-free interest |
3.54 | % | 3.81 | % | 4.32 | % | ||||||
| Expected dividends |
0.00 | % | 0.00 | % | 0.00 | % | ||||||
The Company recognizes expense using the straight-line attribution method. Unrecognized share-based compensation related to stock options totaled $19.2 million at December 31, 2010. The Company expects to amortize unvested stock compensation related to stock options over a weighted average period of 2.67 years at December 31, 2010.
The Company’s expected volatility is derived from its own volatility rate as a publicly traded company and historical volatilities of similar public companies within the Internet services and network industry. Each company’s historical volatility is weighted based on certain qualitative factors and combined to produce a single volatility factor used by the Company. The risk-free interest factor is based on the United States Treasury yield curve in effect at the time of the grant for zero coupon United States Treasury notes with maturities of approximately equal to each grant’s expected term. The expected term is calculated using the “short-cut” method provided in the Securities Exchange Commission’s Staff Accounting Bulletin No. 107, which takes into consideration the grant’s contractual life and the vesting periods. The Company estimates its forfeiture rate based on an analysis of its actual forfeitures and will continue to evaluate the adequacy of the forfeiture rate based on actual forfeiture experience, analysis of employee turnover behavior, and other factors. Any impact from a forfeiture rate adjustment will be recognized in full in the period of the adjustment. During the year ended December 31, 2010, 2009 and 2008, the Company recorded share-based compensation related to stock options of approximately $10.2 million, $8.6 million and $10.6 million, respectively.
In November 2008, the Company entered into an Equity Award Amendment with the Company’s Chief Executive Officer (CEO). In connection with this award, 750,000 options to purchase common stock were cancelled and another 750,000 options were modified. In exchange, the CEO received 500,000 RSUs of which 100,000 are service awards vesting over two years and the remaining 400,000 are performance awards. Accordingly, the Company measured the incremental fair value of the RSUs issued over the fair value of the options cancelled and modified and calculated there to be $317,500 of additional unrecognized share-based compensation which will be recognized over the vesting period of the modified options and RSUs granted.
The performance based RSUs vested if the Company exceeded specified revenue and cash gross margin targets during the quarters ending on or before March 31, 2010. The RSUs are separated into four tranches of 100,000 Performance RSUs each. The maximum number of performance-based RSUs that may vest is based on the achievement of specific quarterly financial targets. Any performance based RSUs that did not vest based on the achievement of the quarterly financial targets with respect to quarters on or before March 31, 2010, expired and were cancelled. As of March 31, 2010, 100,000 of the performance RSUs had vested. The remaining 300,000 performance RSU’s expired and have been cancelled.
In May 2009, the Company granted 282,168 performance-based RSUs to various employees. The performance-based RSUs will only vest if a specific revenue target is achieved in any one quarter during the ten full quarters following the date of the grant and provided the employees remain with the Company through the vesting date. As of December 31, 2010, the performance requirement was not probable of being achieved and accordingly no compensation expense has been recognized.
104
Table of Contents
On June 1, 2009, the Company granted 230,000 performance-based RSUs to certain executive officers. Based upon the achievement of certain financial performance targets for the twelve-month period ending June 30, 2010, 207,000 became eligible for vesting with approximately 69,000 vesting in the third quarter of 2010 and approximately 69,000 vesting on June 1, 2011 and June 1, 2012, respectively, provided the executive officer remains with the Company through each such vesting date.
On June 1, 2009 the Company granted 320,000 stock options to certain executive officers. Each of the stock option awards vested one quarter (1/4th) on June 1, 2010, and one forty-eighth (1/48th) each month thereafter on the first day of each month, provided the executive officer remains with the Company through each such vesting date.
On February 26, 2010, the Company granted 1,850,000 stock options to certain executive officers. Each of the stock option awards vested one forty-eighth (1/48th) on February 1, 2010, and one forty-eighth (1/48th) each month thereafter on the first day of each month, provided the executive officer remains with the Company through each such vesting date.
On February 26, 2010, the Company granted 300,000 performance-based RSUs to the Company’s CEO. The RSUs granted to the CEO (and not forfeited) will vest in three tranches, the first of which will vest on the third business day following the release of the Company’s fiscal 2010 financial results, the second of which will vest on December 31, 2011 and the third of which will vest on December 31, 2012; provided that the CEO remains an employee or service provider of the Company on each vesting date. All or a portion of the RSUs may become eligible for vesting based upon the achievement of certain financial performance targets related to the earn-out feature described in the Agreement and Plan of Merger to acquire EyeWonder, Inc., a copy of which was filed with a Current Report on Form 8-K on December 21, 2009. RSUs that do not become eligible are forfeited. As of December 31, 2010, the performance requirement was not probable of being achieved and accordingly no compensation expense has been recognized.
On April 30, 2010, in connection with the acquisition of EyeWonder, the Company granted 750,000 RSUs to an executive officer and member of its board of directors. The RSUs vest in equal quarterly installments over a period of four years subject to the individual’s continued service with the Company.
On April 30, 2010, in connection with the acquisition of EyeWonder, the Company granted 250,000 RSUs to a member of its board of directors, of which 197,500 RSUs were later assigned to eValue AG pursuant to a Consulting Services Agreement with the Company. The RSUs vest in equal quarterly installments over a period of four years subject to continued service to the Company through each vesting date.
On December 30, 2010, the Company approved an award of 300,000 performance-based RSUs to the Company’s CEO. All or a portion of the RSUs granted to the CEO (and not forfeited) may become eligible for vesting based upon the achievement of certain financial performance targets, provided that the CEO remains an employee or service provider of the Company on each vesting date. RSUs that do not become eligible are forfeited. As of December 31, 2010, the Company had not yet established the financial performance targets related to this award and accordingly the Company has excluded the 300,000 performance-based RSUs from the number of outstanding RSUs as of December 31, 2010 because the grant date had not occurred.
The following table summarizes the different types of restricted stock units (RSUs) outstanding:
| Year Ended December 31, 2010 |
Year Ended December 31, 2009 |
|||||||
| (In thousands) | (In thousands) | |||||||
| RSUs with service-based vesting conditions |
1,473 | 1,303 | ||||||
| Performance-based RSUs |
1,154 | 881 | ||||||
| Unvested RSUs |
2,627 | 2,184 | ||||||
105
Table of Contents
Each RSU represents the right to receive one share of the Company’s common stock upon vesting. The fair value of these RSUs was calculated based upon the Company’s closing stock price on the date of grant, and the share-based compensation expense is being recognized over the service period of the award.
Data pertaining to restricted stock units activity under the Plan is as follows:
| Number of Units |
Weighted Average Fair Value |
|||||||
| (In thousands) | ||||||||
| Balance at December 31, 2007 |
— | $ | — | |||||
| Granted |
2,976 | 6.75 | ||||||
| Vested |
(337 | ) | 8.58 | |||||
| Cancelled |
(21 | ) | 11.61 | |||||
| Balance at December 31, 2008 |
2,618 | 6.52 | ||||||
| Granted |
540 | 4.70 | ||||||
| Vested |
(846 | ) | 6.86 | |||||
| Cancelled |
(128 | ) | 9.16 | |||||
| Balance at December 31, 2009 |
2,184 | 5.22 | ||||||
| Granted |
1,939 | 4.18 | ||||||
| Vested |
(1,039 | ) | 5.57 | |||||
| Cancelled |
(457 | ) | 1.12 | |||||
| Balance at December 31, 2010 |
2,627 | 4.31 | ||||||
The weighted-average grant-date fair value of RSUs granted during the years ended December 31, 2010, 2009 and 2008 was approximately $4.18, $4.70 and $6.75, respectively. The total intrinsic value of the units vested during the year ended December 31, 2010, 2009 and 2008 was approximately $5.4 million, $3.4 million and $0.8 million, respectively. The aggregate intrinsic value of restricted stock units outstanding at December 31, 2010 is $7.7 million.
The Company has also granted restricted stock awards to certain employees. In 2006, the Company granted 1,845,000 shares of restricted stock with a deemed fair value of $12.2 million. The restricted stock awards were valued at the deemed fair value of the Company’s common stock on the date of grant and the total value of the award is expensed ratably over the service period of the award. There were no grants of restricted stock during the years ended December 31, 2010, 2009 and 2008, respectively.
Also during 2006, certain executives of the Company early exercised 2,939,000 unvested stock options and received restricted stock. The restrictions on these shares lapse under the vesting terms of the original option grants.
106
Table of Contents
Data pertaining to restricted stock activity under the Plan is as follows:
| Number Shares |
||||
| (In thousands) | ||||
| Balance at December 31, 2007 of unvested shares |
1,131 | |||
| Granted |
— | |||
| Vested |
(623 | ) | ||
| Cancelled |
(43 | ) | ||
| Balance at December 31, 2008 of unvested shares |
465 | |||
| Granted |
— | |||
| Vested |
(402 | ) | ||
| Cancelled |
— | |||
| Balance at December 31, 2009 of unvested shares |
63 | |||
| Granted |
— | |||
| Vested |
(63 | ) | ||
| Cancelled |
— | |||
| Balance at December 31, 2010 of unvested shares |
— | |||
Share-based payment compensation related to all restricted stock awards and restricted stock units for the years ended December 31, 2010, 2009 and 2008 was approximately $7.2 million, $8.9 million and $7.5 million, respectively. At December 31, 2010 there was $8.3 million of total unrecognized compensation costs related to restricted stock unit’s share-based compensation arrangements. That cost is expected to be recognized over a weighted-average period of 2.38 years as of December 31, 2010.
The Company’s stock option plan contains an “early exercise” provision. Upon early exercise of the option, the exercising holder receives restricted common stock. The restricted stock shares vest over the same period as the original stock option award. If the restricted stock does not vest because the required service period is unmet, the Company has the option to reacquire the restricted common stock for the lesser of the amount paid to acquire it or the fair value of the common stock at the call date. As of December 31, 2010, 2009 and 2008, respectively, there were no unvested shares of restricted common stock related to the early exercise of stock options subject to repurchase by the Company.
The Company recognizes expense using the straight-line attribution method. The Company also estimates when and if performance-based awards will be earned. If an award is not considered probable of being earned, no amount of stock-based compensation is recognized. If the award is deemed probable of being earned, related compensation expense is recorded over the estimated service period. To the extent the Company’s estimates of awards considered probable of being earned changes, the amount of stock-based compensation recognized will also change. The Company recorded share-based compensation expense related to stock options, restricted stock and RSUs during the years ended December 31, 2010, 2009 and 2008 of approximately $17.4 million, $17.5 million and $18.1 million, respectively. Unrecognized share-based compensation expense totaled approximately $27.5 million at December 31, 2010, which is expected to be recognized over a weighted average period of 2.58 years.
107
Table of Contents
The following table summarizes the components of share-based compensation expense included in the Company’s consolidated statement of operations for the years ended December 31, 2010, 2009 and 2008 in accordance with current accounting standards (in thousands):
| Years Ended December 31, | ||||||||||||
| 2010 | 2009 | 2008 | ||||||||||
| Share-based compensation expense by type of award: |
||||||||||||
| Stock options |
$ | 10,206 | $ | 8,554 | $ | 10,576 | ||||||
| Restricted stock awards and units |
7,195 | 8,909 | 7,482 | |||||||||
| Total share-based compensation expense |
$ | 17,401 | $ | 17,463 | $ | 18,058 | ||||||
| Effect of share-based compensation expense on income by line: |
||||||||||||
| Cost of services |
$ | 2,441 | $ | 2,414 | $ | 2,243 | ||||||
| General and administrative expense |
6,881 | 7,556 | 8,060 | |||||||||
| Sales and marketing expense |
5,023 | 4,970 | 5,400 | |||||||||
| Research and development expense |
3,056 | 2,523 | 2,355 | |||||||||
| Total cost related to share-based compensation expense |
$ | 17,401 | $ | 17,463 | $ | 18,058 | ||||||
16. Related Party Transactions
In July 2006, an aggregate of 39,869,960 shares of Series B Preferred Stock was issued at a purchase price of $3.26 per share to certain accredited investors in a private placement transaction. As a result of this transaction, entities affiliated with Goldman, Sachs & Co., one of the lead underwriters of the Company’s initial public offering became holders of more than 10% of the Company’s common stock. On June 14, 2007, upon the closing of the Company’s IPO, all outstanding shares of the Company’s Series B Convertible Preferred Stock automatically converted into shares of common stock on a 1-for-1 share basis. As of December 31, 2010, 2009 and 2008, Goldman, Sachs & Co. owned approximately 30%, 36% and 36%, respectively, of the Company’s outstanding common stock.
The Company leased office space from a company owned by one of the Company’s executives. Rent expense for the lease, including reimbursement for telecommunication lines, was approximately $4,000, $12,000, and $12,000 for each of the years ended December 31, 2010, 2009 and 2008, respectively.
As a result of the acquisition of EyeWonder, the Company leases office space both to and from an entity in which a member of our executive staff and a member of our board of directors have an ownership interest and are members of the board of directors. During the year ended December 31, 2010, the Company received approximately $26,012 from this entity for office space rental. During the year ended December 31, 2010, the Company paid approximately $38,919 to this entity for office space rental. In addition, the Company paid to a company owned by a member of its board of directors approximately $119,455 for human resources, public relations and administrative services during the year ended December 31, 2010.
The Company sells services to entities owned, in whole or in part, by certain of the Company’s executive staff and board of directors. Revenue derived from related parties was less than 1% for the years ended December 31, 2010 and 2008, respectively. For the year ended December 31, 2009, the Company did not generate any revenue from related parties.
108
Table of Contents
17. Leases and Commitments
Operating Leases
The Company is committed to various non-cancelable operating leases for office space and office equipment which expire through 2019. Certain leases contain provisions for renewal options and rent escalations upon expiration of the initial lease terms. Approximate future minimum lease payments over the remaining lease periods as of December 31, 2010 are as follows (in thousands):
| 2011 |
$ | 2,018 | ||
| 2012 |
2,018 | |||
| 2013 |
2,364 | |||
| 2014 |
2,378 | |||
| 2015 and thereafter |
8,006 | |||
| Total minimum payments |
$ | 16,784 | ||
Purchase Commitments
The Company has long-term commitments for bandwidth usage and co-location with various networks and ISPs. The following summarizes minimum commitments as of December 31, 2010 for the next five years (in thousands):
| 2011 |
$ | 21,545 | ||
| 2012 |
10,244 | |||
| 2013 |
5,044 | |||
| 2014 |
4,288 | |||
| 2015 and thereafter |
1,988 | |||
| Total minimum payments |
$ | 43,109 | ||
Rent and operating expense relating to these operating lease agreements and bandwidth and co-location agreements was approximately $53.7 million, $46.7 million and $46.6 million for the years ended December 31, 2010, 2009 and 2008, respectively.
Capital Leases
The Company leases equipment under capital lease agreements which extend through 2013. As of December 31, 2010, the outstanding balance for capital leases was approximately $2.8 million. The Company has recorded assets under capital lease obligations of approximately $3.2 million as of December 31, 2010. Related accumulated amortization totaled approximately $0.2 million as of December 31, 2010. The assets acquired under capital leases and related accumulated amortization are included in property and equipment, net in the consolidated balance sheet. The related amortization is included in depreciation and amortization expense in the Consolidated Statements of Operations. Interest expense related to capital leases was approximately $73,000 for the year ended December 31, 2010.
As of December 31, 2009, the Company had no commitments under any capital lease obligations.
Future minimum capital lease payments at December 31, 2010 are as follows (in thousands)
| 2011 |
$ | 1,195 | ||
| 2012 |
1,161 | |||
| 2013 |
666 | |||
| 2014 |
— | |||
| 2015 and thereafter |
— | |||
| Total |
3,022 | |||
| Amounts representing interest |
(223 | ) | ||
| Present value of minimum lease payments |
$ | 2,799 | ||
109
Table of Contents
18. Concentrations
For the year ended December 31, 2010, the Company did not have any customer for which revenue exceeded 10% of total revenue. For the years ended December 31, 2009 and 2008, respectively, the Company had one customer, Microsoft that accounted for more than 10% of its revenue. Revenues for this customer were approximately $18.8 million and $22.8 million, respectively, for the years ended December 31, 2009 and 2008.
Revenue from sources outside North America totaled approximately $53.4 million, $29.0 million and $20.7 million for the years ended December 31, 2010, 2009 and 2008, respectively. No single country outside of the United States accounted for 10% or more of the Company’s total revenues during these years.
19. Income Taxes
(Loss) income before income taxes consists of the following (in thousands):
| Years Ended December 31, | ||||||||||||
| 2010 | 2009 | 2008 | ||||||||||
| (Loss) income before income taxes: |
||||||||||||
| United States |
$ | (25,735 | ) | $ | 33,336 | $ | (63,592 | ) | ||||
| Foreign |
2,332 | 2,638 | 541 | |||||||||
| $ | (23,403 | ) | $ | 35,974 | $ | (63,051 | ) | |||||
The components of the (benefit) provision for income taxes are as follows (in thousands):
| Years Ended December 31, | ||||||||||||
| 2010 | 2009 | 2008 | ||||||||||
| Current: |
||||||||||||
| Federal |
$ | — | $ | (141 | ) | $ | (530 | ) | ||||
| State |
18 | 83 | (30 | ) | ||||||||
| Foreign |
1,741 | 1,142 | 667 | |||||||||
| Total current |
1,759 | 1,084 | 107 | |||||||||
| Deferred: |
||||||||||||
| Federal |
(3,069 | ) | — | (77 | ) | |||||||
| State |
(761 | ) | — | (14 | ) | |||||||
| Foreign |
(981 | ) | — | — | ||||||||
| Total deferred |
(4,811 | ) | — | (91 | ) | |||||||
| Total (benefit) provision |
$ | (3,052 | ) | $ | 1,084 | $ | 16 | |||||
A reconciliation of the Company’s tax (benefit) provision to the expected tax (benefit) provision is as follows (in thousands):
| Years Ended December 31, | ||||||||||||
| 2010 | 2009 | 2008 | ||||||||||
| Tax (benefit) provision at the federal statutory rate — 35% |
$ | (8,191 | ) | $ | 12,591 | $ | (22,068 | ) | ||||
| State income taxes, net of the federal effect |
(912 | ) | 839 | (1,020 | ) | |||||||
| Foreign income taxes |
1,292 | 1,113 | — | |||||||||
| Share based compensation |
211 | 1,219 | 698 | |||||||||
| Valuation allowance changes affecting federal income tax expense |
5,371 | (12,638 | ) | 21,475 | ||||||||
| Uncertain tax positions |
(366 | ) | 26 | 667 | ||||||||
| Change in state rate |
(311 | ) | (756 | ) | 984 | |||||||
| Other |
(146 | ) | (1,310 | ) | (720 | ) | ||||||
| Tax (benefit) provision |
$ | (3,052 | ) | $ | 1,084 | $ | 16 | |||||
110
Table of Contents
Deferred income taxes reflect the net tax effects of temporary differences between the carrying amounts of assets and liabilities for financial reporting purposes and the amounts used for income tax purpose. Significant components of the Company’s deferred tax assets and liabilities are as follows (in thousands):
| Years Ended December 31, | ||||||||
| 2010 | 2009 | |||||||
| Deferred tax assets: |
||||||||
| Accounts receivable reserves |
$ | 93 | $ | 274 | ||||
| Share-based compensation |
21,968 | 15,261 | ||||||
| Deferred revenue |
3,532 | 5,077 | ||||||
| Fixed assets |
805 | 7,878 | ||||||
| NOL carryforward |
16,603 | 4,058 | ||||||
| Foreign tax credit |
596 | 1,562 | ||||||
| Other |
861 | 643 | ||||||
| Total deferred tax assets |
44,458 | 34,753 | ||||||
| Deferred tax liabilities: |
||||||||
| Prepaid expenses |
(157 | ) | (144 | ) | ||||
| State taxes |
(171 | ) | (129 | ) | ||||
| Goodwill related to Kiptronic Inc. acquisition |
(25 | ) | (10 | ) | ||||
| Intangible assets |
(5,983 | ) | — | |||||
| Other |
(477 | ) | (112 | ) | ||||
| Total deferred tax liabilities |
(6,813 | ) | (395 | ) | ||||
| Valuation allowance |
(37,525 | ) | (34,368 | ) | ||||
| Net deferred tax assets (liabilities) |
$ | 120 | $ | (10 | ) | |||
A deferred United States tax liability has not been provided on the undistributed earnings of certain foreign subsidiaries because it is the Company’s intent to permanently reinvest such earnings. At December 31, 2010, the Company had $42.7 million federal and $43.0 million state net operating loss carryforwards, excluding amounts anticipated from the exercise of non-qualified stock options. Under the carryback provisions available for federal income tax purposes, the Company has carried back the maximum federal net operating loss allowed. The Company’s federal net operating losses will begin to expire in 2027. For state income tax purposes, a carryback of the loss is not available; however, the state net operating loss can generally be carried forward and used to offset future state taxable income. The state net operating loss carryforwards will begin to expire in 2012.
The Company reduces the carrying amounts of deferred tax assets by a valuation allowance, if based on the evidence available, it is more-likely-than-not that such assets will not be realized. In making the assessment under the more-likely-than-not standard, appropriate consideration must be given to all positive and negative evidence related to the realization of the deferred tax assets. This assessment considers, among other matters, the nature, frequency and severity of current and cumulative losses, forecasts of future profitability, the duration of statutory carryforward periods by jurisdiction, unitary versus stand alone state tax filings, the Company’s experience with loss carryforwards not expiring unutilized, and all tax planning alternatives that may be available.
During the year ended December 31, 2010, management performed an assessment of the recoverability of deferred tax assets. As a result of the acquisition of EyeWonder, $3.9 million of net deferred tax liabilities were recorded resulting from the temporary differences generated by the differences between the fair value of assets and liabilities acquired (mainly intangible assets such as existing technologies) and their corresponding tax bases. Management determined that $3.9 million of our pre-acquisition deferred tax assets that had a full valuation allowance are now more-likely-than-not to be realized as a result of the acquisition by offsetting such deferred tax assets against the $3.9 million net deferred tax liabilities recorded as of the acquisition date. Therefore, the
111
Table of Contents
Company recorded a tax benefit of $3.9 million related to the partial release of the related valuation allowance. For the remaining balance of deferred tax assets, there was sufficient negative evidence as a result of the Company’s cumulative losses to conclude that it was more likely than not that our deferred tax assets would not be realized, with the exception of deferred tax assets in certain foreign subsidiaries, and the Company accordingly maintained a valuation allowance of $37.5 million. Related to the chors and Kiptronic acquisitions, the Company also has certain taxable temporary differences related to intangible assets that cannot be offset by existing deductible temporary differences resulting in a deferred tax liability of approximately $0.6 million.
A summary of the activities associated with the Company’s reserve for unrecognized tax benefits, interest and penalties follow (in thousands):
| Unrecognized Tax Benefits |
||||
| Balance at January 1, 2009 |
$ | 1,208 | ||
| Increases related to current year tax positions |
— | |||
| Expiration of statute of limitations for the assessment of taxes |
— | |||
| Other |
— | |||
| Balance at December 31, 2009 |
1,208 | |||
| Increases related to current year tax positions |
— | |||
| Expiration of statute of limitations for the assessment of taxes |
— | |||
| Settlements |
(773 | ) | ||
| Reduction for tax positions of prior years |
(382 | ) | ||
| Other |
— | |||
| Balance at December 31, 2010 |
$ | 53 | ||
The Company recognizes interest and penalties related to unrecognized tax benefits in its tax provision. As of December 31, 2010, the Company had an interest and penalties accrual related to unrecognized tax benefits of $113,000, which decreased during 2010 by $112,000. Unrecognized tax benefits decreased for the year ended December 31, 2010 as a result of payments made in certain foreign jurisdictions and reductions related to prior year tax positions based on actual amounts due. The Company anticipates its unrecognized tax benefits will continue to decrease within twelve months of the reporting date, as a result of settling potential tax liabilities in certain foreign jurisdictions.
The Company files income tax returns in jurisdictions with varying statues of limitations. Tax years 2007 through 2009 generally remain subject to examination by federal and most state tax authorities. As of December 31, 2010, the Company is not under any Federal examination.
20. Advertising and Marketing
Costs associated with advertising are expensed as incurred. Advertising expenses, which are comprised of Internet, trade show and publications advertising, were approximately $2.1 million, $0.8 million and $1.9 million for the years ended December 31, 2010, 2009 and 2008, respectively.
21. 401(k) Plan
Effective January 1, 2004, the Company adopted the Limelight Networks 401(k) Plan covering effectively all employees of the Company. The plan is a 401(k) profit sharing plan in which participating employees are fully vested in any contributions they make. Through December 31, 2006, the Company was not obligated to make matching contributions. No matching contributions were made by the Company in 2006.
112
Table of Contents
Effective January 1, 2007, the Company amended the plan to include a Company match. The Company will match employee deferrals as follows: a dollar-for-dollar match on eligible employee’s deferral that does not exceed 3% of compensation for the year and a 50% match on the next 2% of the employee deferrals. Company employees may elect to reduce their current compensation by up to 15% or the statutory limit. The Company made matching contributions of approximately $0.7 million, $0.7 million and $0.6 million, respectively, during the years ended December 31, 2010, 2009 and 2008.
22. Segment Reporting
The Company operates in one industry segment — content delivery network services. The Company operates in three geographic areas — North America, EMEA and Asia Pacific.
Operating segments are defined as components of an enterprise about which separate financial information is available that is evaluated regularly by the chief operating decision maker, or decision making group, in deciding how to allocate resources and in assessing performance. The Company’s chief operating decision maker is its Chief Executive Officer. The Company’s Chief Executive Officer reviews financial information presented on a consolidated basis for purposes of allocating resources and evaluating financial performance. The Company has one business activity and there are no segment managers who are held accountable for operations, operating results and plans for products or components below the consolidated unit level. Accordingly, the Company reports as a single operating segment.
Revenue by geography is based on the location of the customer from which the revenue is earned. The following table sets forth revenue and long-lived assets by geographic area (in thousands):
| Years Ended December 31, | ||||||||||||
| 2010 | 2009 | 2008 | ||||||||||
| Revenue |
||||||||||||
| Domestic revenue |
$ | 129,934 | $ | 102,622 | $ | 108,819 | ||||||
| International revenue |
53,393 | 29,041 | 20,711 | |||||||||
| Total revenue |
$ | 183,327 | $ | 131,663 | $ | 129,530 | ||||||
| Years Ended December 31, | ||||||||||||
| 2010 | 2009 | 2008 | ||||||||||
| Long-lived Assets |
||||||||||||
| Domestic long-lived assets |
$ | 38,757 | $ | 20,889 | $ | 28,701 | ||||||
| International long-lived assets |
15,650 | 14,635 | 11,484 | |||||||||
| Total long-lived assets |
$ | 54,407 | $ | 35,524 | $ | 40,185 | ||||||
23. Fair Value Measurements
The Company evaluates certain of its financial instruments within the three-tier fair value hierarchy, which prioritizes the inputs used in measuring fair value. These tiers include:
| Level 1 |
— | defined as observable inputs such as quoted prices in active markets; | ||||
| Level 2 |
— | defined as inputs other than quoted prices in active markets that are either directly or indirectly observable; and | ||||
| Level 3 |
— | defined as unobservable inputs in which little or no market data exists, therefore requiring an entity to develop its own assumptions. |
As of December 31, 2010, the Company held certain assets and liabilities that are required to be measured at fair value on a recurring basis. These include corporate notes and bonds and US Government Agency Bonds,
113
Table of Contents
publicly traded stocks, and private equity securities which are classified as marketable securities and acquisition related contingent consideration which is classified as a current liability on the Company’s consolidated balance sheet.
The following is a summary of marketable securities, other investment-related assets and current liabilities held at December 31, 2010 (in thousands):
| Fair Value Measurements at Reporting Date Using | ||||||||||||||||
| Description |
Total | Quoted Prices In Active Markets for Identical Assets (Level 1) |
Significant Other Observable Inputs (Level 2) |
Significant Unobservable Inputs (Level 3) |
||||||||||||
| Assets: |
||||||||||||||||
| Government agency bonds |
$ | 8,986 | $ | 8,986 | $ | — | $ | — | ||||||||
| Corporate notes and bonds |
3,023 | 3,023 | — | — | ||||||||||||
| Private equity security |
407 | — | — | 407 | ||||||||||||
| Publicly traded common stock |
1,755 | 1,755 | — | — | ||||||||||||
| Total assets measured at fair value |
$ | 14,171 | $ | 13,764 | $ | — | $ | 407 | ||||||||
| Liabilities: |
||||||||||||||||
| Acquisition related contingent consideration |
$ | 414 | $ | — | $ | — | $ | 414 | ||||||||
| Total liabilities measured at fair value |
$ | 414 | $ | — | $ | — | $ | 414 | ||||||||
For the year ended December 31, 2010, realized gains and losses for marketable securities are reported in interest income, unrealized gains and losses for marketable securities are included in other comprehensive income and expense. For the year ended December 31, 2010, the Company had net unrealized gains of approximately $624,000.
On January 27, 2010, the Company acquired chors. The total consideration included contingent consideration of up to $3.1 million upon the achievement of certain financial milestones. On the acquisition date, a liability was recognized for an estimate of the acquisition date fair value of the contingent financial milestone consideration based on the probability of achieving the financial milestones and the probability weighted discount on cash flows. At that time the Company believed that the financial milestones would be achieved and did not discount the contingent consideration. In accordance with the terms and conditions of the contingent milestone consideration, approximately 45% of the contingent consideration was distributed to the former shareholders of chors in November 2010. Future changes in fair value of the contingent financial milestone consideration, as results of changes in significant inputs such as the discount rate and estimated probabilities of financial milestone achievements, could have a material effect on the statement of operations and financial position in the period of the change.
On May 18, 2010, the Company made a strategic investment in Gaikai, a private cloud-based gaming technology company that allows users to play major PC and console games through a web browser. The Company will provide services to Gaikai, which will be recorded as revenue when earned, with a corresponding increase in its cost basis of its investment.
On July 30, 2010, the Company acquired Delve. The total consideration included contingent consideration of up to $0.5 million upon the achievement of certain financial milestones. On the acquisition date, a liability of $0.4 million was recognized for an estimate of the acquisition date fair value of the contingent financial milestone consideration based on the probability of achieving the financial milestones and the probability weighted discount on cash flows. At this time the Company believes that the financial milestones will be
114
Table of Contents
achieved and did not discount the contingent consideration. Future changes in fair value of the contingent financial milestone consideration, as results of changes in significant inputs such as the discount rate and estimated probabilities of financial milestone achievements, could have a material effect on the statement of income and financial position in the period of the change.
The fair value measurement for both the contingent consideration and the private equity security is based on significant inputs not observed in the market and thus represents a Level 3 measurement. Level 3 instruments are valued based on unobservable inputs that are supported by little or no market activity and reflect the Company’s own assumptions in measuring fair value.
The progressions of the Company’s Level 3 instruments for the year ended December 31, 2010 are shown in the table below (in thousands):
| Acquisition Related Contingent Consideration |
Private Equity Securities |
|||||||
| Balance at January 1, 2010 |
$ | — | $ | — | ||||
| Additions |
414 | 407 | ||||||
| Change in value |
— | — | ||||||
| Balance at December 31, 2010 |
$ | 414 | $ | 407 | ||||
The Company’s assets measured at fair value at December 31, 2009, were as follows (in thousands):
| Fair Value Measurements at Reporting Date Using | ||||||||||||||||
| Description |
Total | Quoted Prices In Active Markets for Identical Assets (Level 1) |
Significant Other Observable Inputs (Level 2) |
Significant Unobservable Inputs (Level 3) |
||||||||||||
| Government agency bonds |
$ | 46,136 | $ | 46,136 | $ | — | $ | — | ||||||||
| Commercial paper |
8,996 | — | 8,996 | — | ||||||||||||
| Corporate notes and bonds |
9,738 | 9,738 | — | — | ||||||||||||
| Publicly traded common stock |
12 | 12 | — | — | ||||||||||||
| Total assets measured at fair value |
$ | 64,882 | $ | 55,886 | $ | 8,996 | $ | — | ||||||||
For the year ended December 31, 2009, realized gains and losses for marketable securities are reported in interest income, unrealized gains and losses for marketable securities are included in other comprehensive income and expense. For the year ended December 31, 2009, the Company had unrealized gains of approximately $124,000.
115
Table of Contents
24. Quarterly Financial Results (unaudited)
The following table sets forth certain unaudited quarterly results of operations of the Company for the years ended December 31, 2010 and 2009. In the opinion of management, this information has been prepared on the same basis as the audited consolidated financial statements and all necessary adjustments, consisting only of normal recurring adjustments, have been included in the amounts below for a fair statement of the quarterly information when read in conjunction with the audited consolidated financial statements and related notes included elsewhere in this annual report on Form 10-K (in thousands, except per share data):
| For the Three Months Ended | ||||||||||||||||
| March 31, 2010 |
June 30, 2010 |
Sept. 30, 2010 |
Dec. 31, 2010 |
|||||||||||||
| Revenues |
$ | 36,087 | $ | 42,195 | $ | 49,803 | $ | 55,243 | ||||||||
| Gross margin |
$ | 15,104 | $ | 18,370 | $ | 21,857 | $ | 25,277 | ||||||||
| Net loss |
$ | (5,785 | ) | $ | (2,265 | ) | $ | (5,954 | ) | $ | (6,348 | ) | ||||
| Basic net loss per share |
$ | (0.07 | ) | $ | (0.02 | ) | $ | (0.06 | ) | $ | (0.06 | ) | ||||
| Diluted net loss per share |
$ | (0.07 | ) | $ | (0.02 | ) | $ | (0.06 | ) | $ | (0.06 | ) | ||||
| Basic weighted average common shares outstanding |
85,119 | 93,889 | 98,634 | 99,557 | ||||||||||||
| Diluted weighted average common shares outstanding |
85,119 | 93,889 | 98,634 | 99,557 | ||||||||||||
| For the Three Months Ended | ||||||||||||||||
| March 31, 2009 |
June 30, 2009 |
Sept. 30, 2009 |
Dec. 31, 2009 |
|||||||||||||
| Revenues |
$ | 33,175 | $ | 32,333 | $ | 32,530 | $ | 33,625 | ||||||||
| Gross margin |
$ | 11,704 | $ | 11,255 | $ | 11,623 | $ | 11,458 | ||||||||
| Net income (loss) |
$ | 55,135 | $ | (5,298 | ) | $ | (5,220 | ) | $ | (9,726 | ) | |||||
| Basic net income (loss) per share |
$ | 0.66 | $ | (0.06 | ) | $ | (0.06 | ) | $ | (0.11 | ) | |||||
| Diluted net income (loss) per share |
$ | 0.64 | $ | (0.06 | ) | $ | (0.06 | ) | $ | (0.11 | ) | |||||
| Basic weighted average common shares outstanding |
83,515 | 84,033 | 84,489 | 84,770 | ||||||||||||
| Diluted weighted average common shares outstanding |
85,968 | 84,033 | 84,489 | 84,770 | ||||||||||||
25. Subsequent Event
On March 2, 2011 the Company completed an underwritten public offering of its common stock in which it sold and issued 11,500,000 shares of its common stock, including 1,500,000 shares subject to the underwriters’ over-allotment option, at a price to the public of $7.10 per share. The newly issued common shares began trading on the Nasdaq Global Select Market on March 2, 2011. The Company raised a total of approximately $81.7 million in gross proceeds from the offering, or approximately $77.3 million in net proceeds after deducting underwriting discounts and commissions of approximately $3.9 million and other offering costs of approximately $0.5 million. The offering was made pursuant to the effective registration statement on Form S-3 (Registration Statement No. 333-170609) previously filed with and declared effective by the Securities and Exchange Commission on November 26, 2010 and the prospectus supplement thereunder filed with the Securities and Exchange Commission on February 28, 2011.
116
Table of Contents
| Item 9. | Changes in and Disagreements with Accountants on Accounting and Financial Disclosure |
None.
| Item 9A. | Controls and Procedures |
Evaluation of Disclosure Controls and Procedures
Under the supervision and with the participation of our management, including our Chief Executive Officer and Chief Financial Officer, we evaluated the effectiveness of our disclosure controls and procedures as of December 31, 2010. Based upon that evaluation, our Chief Executive Officer and Chief Financial Officer concluded that, as of December 31, 2010, our disclosure controls and procedures were (1) effective in that they were designed to ensure that material information relating to us, including our consolidated subsidiaries, is made known to our Chief Executive Officer and Chief Financial Officer by others within those entities, particularly during the period in which this report was being prepared, as appropriate to allow timely discussions regarding required disclosure therein and (2) effective, in that they provide reasonable assurance that information required to be disclosed by us in the reports that we file or submit under the Exchange Act is recorded, processed, summarized and reported within the time periods specified in the Commission’s rules and forms.
Management’s Annual Report on Internal Control over Financial Reporting
Our management, with the participation of our Chief Executive Officer and Chief Financial Officer, is responsible for establishing and maintaining adequate internal control over financial reporting. Internal control over financial reporting is defined in Rules 13a-15(f) and 15d-15(f) promulgated under the Exchange Act as a process designed by, or under the supervision of, our principal executive and principal financial officers and effected by the company’s board of directors, management and other personnel, to provide reasonable assurance regarding the reliability of financial reporting and the preparation of financial statements for external purposes in accordance with generally accepted accounting principles and includes those policies and procedures that:
| • | pertain to the maintenance of records, that in reasonable detail, accurately and fairly reflect the transactions and dispositions of the assets of the company; |
| • | provide reasonable assurance that transactions are recorded as necessary to permit preparation of financial statements in accordance with generally accepted accounting principles, and that receipts and expenditures of the company are being made only in accordance with authorizations of management and directors of the company; and |
| • | provide reasonable assurance regarding prevention or timely detection of unauthorized acquisition, use or disposition of the company’s assets that could have a material effect on the financial statements. |
To assist management, we engaged an international accounting firm to assist in verifying and monitoring our internal controls and procedures. A control system, no matter how well conceived and operated, can provide only reasonable, not absolute, assurance that the objectives of the control system are met. Further, the benefits of controls must be considered relative to their costs. Because of the inherent limitations in all control systems, no evaluation of controls can provide absolute assurance that all control issues and instances of management override or improper acts, if any, have been detected. These inherent limitations include the realities that judgments in decision making can be faulty and that breakdowns can occur because of simple errors or mistakes. Additionally, controls can be circumvented by the individual acts of some persons, by collusion of two or more people or by management override of the control. The design of any system of controls is also based in part upon certain assumptions about the likelihood of future events, and there can be no assurance that any design will succeed in achieving its stated goals under all potential future conditions. Because of the inherent limitations in a cost-effective control system, misstatements due to management override, error or improper acts may occur and not be detected. Any resulting misstatement or loss may have an adverse and material effect on our business, financial condition and results of operations.
117
Table of Contents
Our management assessed the effectiveness of the Company’s internal control over financial reporting as of December 31, 2010. In making this assessment, our management used the criteria set forth by the Committee of Sponsoring Organizations of the Treadway Commission (COSO) in Internal Control — Integrated Framework.
Based on our assessment, management, with the participation of our Chief Executive Officer and Chief Financial Officer, concluded that, as of December 31, 2010, our internal control over financial reporting was effective based on those criteria.
The scope of management’s assessment of the effectiveness of internal control over financial reporting did not include the internal controls of chors GmbH, EyeWonder, Inc., and Delve Networks, Inc., which are included in our 2010 consolidated financial statements since the dates of acquisition and constituted 15% and 14% of total assets and net assets, respectively, as of December 31, 2010 and 16% of both revenues and net loss for the year then ended. Our audit of internal control over financial reporting also did not include an evaluation of the internal control over financial reporting of chors GmbH, EyeWonder, Inc., and Delve Networks, Inc.
Our internal control over financial reporting as of December 31, 2010 has been audited by Ernst & Young LLP, an independent registered public accounting firm, as stated in their report, which is included herein.
118
Table of Contents
Report of Independent Registered Public Accounting Firm
The Board of Directors and Stockholders of Limelight Networks, Inc.
We have audited Limelight Networks, Inc.’s internal control over financial reporting as of December 31, 2010, based on criteria established in Internal Control—Integrated Framework issued by the Committee of Sponsoring Organizations of the Treadway Commission (the COSO criteria). Limelight Networks, Inc.’s management is responsible for maintaining effective internal control over financial reporting, and for its assessment of the effectiveness of internal control over financial reporting included in the accompanying Management’s Annual Report on Internal Control Over Financial Reporting. Our responsibility is to express an opinion on the company’s internal control over financial reporting based on our audit.
We conducted our audit in accordance with the standards of the Public Company Accounting Oversight Board (United States). Those standards require that we plan and perform the audit to obtain reasonable assurance about whether effective internal control over financial reporting was maintained in all material respects. Our audit included obtaining an understanding of internal control over financial reporting, assessing the risk that a material weakness exists, testing and evaluating the design and operating effectiveness of internal control based on the assessed risk, and performing such other procedures as we considered necessary in the circumstances. We believe that our audit provides a reasonable basis for our opinion.
A company’s internal control over financial reporting is a process designed to provide reasonable assurance regarding the reliability of financial reporting and the preparation of financial statements for external purposes in accordance with generally accepted accounting principles. A company’s internal control over financial reporting includes those policies and procedures that (1) pertain to the maintenance of records that, in reasonable detail, accurately and fairly reflect the transactions and dispositions of the assets of the company; (2) provide reasonable assurance that transactions are recorded as necessary to permit preparation of financial statements in accordance with generally accepted accounting principles, and that receipts and expenditures of the company are being made only in accordance with authorizations of management and directors of the company; and (3) provide reasonable assurance regarding prevention or timely detection of unauthorized acquisition, use or disposition of the company’s assets that could have a material effect on the financial statements.
Because of its inherent limitations, internal control over financial reporting may not prevent or detect misstatements. Also, projections of any evaluation of effectiveness to future periods are subject to the risk that controls may become inadequate because of changes in conditions, or that the degree of compliance with the policies or procedures may deteriorate.
As indicated in the accompanying Management’s Annual Report on Internal Control Over Financial Reporting, management’s assessment of and conclusion on the effectiveness of internal control over financial reporting did not include the internal controls of chors GmbH, EyeWonder, Inc. and Delve Networks, Inc., which are included in the 2010 consolidated financial statements of Limelight Networks, Inc. and constituted 15% and 14% of total and net assets, respectively, as of December 31, 2010 and 16% of both revenues and net loss for the year then ended. Our audit of internal control over financial reporting of Limelight Networks, Inc. also did not include an evaluation of the internal control over financial reporting of chors GmbH, EyeWonder, Inc. and Delve Networks, Inc.
In our opinion, Limelight Networks, Inc. maintained, in all material respects, effective internal control over financial reporting as of December 31, 2010, based on the COSO criteria.
We also have audited, in accordance with the standards of the Public Company Accounting Oversight Board (United States), the consolidated balance sheets of Limelight Networks, Inc. as of December 31, 2010 and 2009 and the related consolidated statements of operations, stockholders’ equity and cash flows for each of the three years in the period ended December 31, 2010 of Limelight Networks, Inc. and our report dated March 11, 2011 expressed an unqualified opinion thereon.
/s/ Ernst & Young LLP
Phoenix, Arizona
March 11, 2011
119
Table of Contents
Changes in Internal Control over Financial Reporting
With the exception of the change in controls noted below, no additional changes in our internal control over financial reporting (as defined in Rules 13a-15(f) and 15d-15(f) under the Exchange Act) occurred during the year ended December 31, 2010 that have materially affected, or are reasonably likely to materially affect, our internal control over financial reporting.
We have implemented a new revenue and invoicing, purchasing, accounts payable and general ledger reporting system. We believe these new reporting systems will further enhance our internal controls over financial reporting. In the future we may make modification and enhancements to the system. There have been no other changes in our internal control over financial reporting during the period covered by this report that have materially affected, or are reasonably likely to materially affect, our internal control over financial reporting.
| Item 9B. | Other Information |
None.
PART III
| Item 10. | Directors, Executive Officers and Corporate Governance |
Information required by this item is incorporated by reference to our Proxy Statement for our 2011 Annual Meeting of Stockholders to be filed with the SEC within 120 days after the end of the fiscal year ended December 31, 2010.
| Item 11. | Executive Compensation |
Information required by this item is incorporated by reference to our Proxy Statement for our 2011 Annual Meeting of Stockholders to be filed with the SEC within 120 days after the end of the fiscal year ended December 31, 2010.
| Item 12. | Security Ownership of Certain Beneficial Owners and Management and Related Stockholder Matters |
Information required by this item is incorporated by reference to our Proxy Statement for our 2011 Annual Meeting of Stockholders to be filed with the SEC within 120 days after the end of the fiscal year ended December 31, 2010.
120
Table of Contents
Equity Compensation Plan Information
The following table provides information regarding our current equity compensation plans as of December 31, 2010 (shares in thousands):
| Plan category |
Number of securities to be issued upon exercise of outstanding options, warrants and rights (a) |
Weighted-average exercise price of outstanding options, warrants and rights (b) |
Number of securities remaining available for future issuance under equity compensation plans (excluding securities reflected in column (a)) (c) |
|||||||||
| Equity compensation plans approved by security holders |
12,008 | $ | 4.94 | 5,896 | ||||||||
| Equity compensation plans not approved by security holders |
— | — | — | |||||||||
| Total |
12,008 | $ | 4.94 | 5,896 | ||||||||
| Item 13. | Certain Relationships, Related Transactions, and Director Independence |
Information required by this item is incorporated by reference to our Proxy Statement for our 2011 Annual Meeting of Stockholders to be filed with the SEC within 120 days after the end of the fiscal year ended December 31, 2010.
| Item 14. | Principal Accountant Fees and Services. |
Information required by this item is incorporated by reference to our Proxy Statement for our 2011 Annual Meeting of Stockholders to be filed with the SEC within 120 days after the end of the fiscal year ended December 31, 2010.
121
Table of Contents
PART IV
| Item 15. | Exhibits and Financial Statement Schedules. |
| (a) | Documents included in this annual report on Form 10-K. |
| (1) | Financial Statements. See Item 8 — Financial Statements and Supplementary Data included in this annual report on Form 10-K. |
| (2) | Financial Schedules. The schedule listed below is filed as part of this annual report on Form 10-K: |
| Page | ||||
| 124 | ||||
All other schedules are omitted as the information required is inapplicable or the information is presented in the consolidated financial statements and the related notes.
| (b) | Exhibits. The exhibits required by Item 601 of Regulation S-K are listed in the Exhibit Index immediately preceding the exhibits and are incorporated herein. |
122
Table of Contents
Pursuant to the requirements of Section 13 or 15(d) of the Securities Exchange Act of 1934, the registrant has duly caused this report to be signed on its behalf by the undersigned, thereunto duly authorized.
| LIMELIGHT NETWORKS, INC. | ||||||||
| Date: March 11, 2011 | By: | /S/ DOUGLAS S. LINDROTH | ||||||
| Douglas S. Lindroth | ||||||||
| Senior Vice President, Chief Financial Officer and Treasurer | ||||||||
| (Principal Financial Officer and Principal Accounting Officer) | ||||||||
POWER OF ATTORNEY
KNOW ALL PERSONS BY THESE PRESENTS, that each person whose signature appears below constitutes and appoints Jeffrey W. Lunsford and Douglas S. Lindroth and each of them, each with the power of substitution, their attorney-in-fact, to sign any amendments to this Annual Report on Form 10-K (including post-effective amendments), and to file the same, with exhibits thereto and other documents in connection therewith, with the Securities and Exchange Commission, hereby ratifying and confirming all that each of said attorneys-in-fact, or their substitute or substitutes, may do or cause to be done by virtue hereof.
Pursuant to the requirements of the Securities Act of 1934, this report has been signed below by the following persons on behalf of the registrant and in the capacities and on the dates indicated.
| Signature |
Title |
Date | ||
| /S/ JEFFREY W. LUNSFORD Jeffrey W. Lunsford |
President, Chief Executive Officer and Chairman of the Board (Principal Executive Officer) |
March 11, 2011 | ||
| /S/ DOUGLAS S. LINDROTH Douglas S. Lindroth |
Senior Vice President, Chief Financial Officer and Treasurer (Principal Financial Officer and Principal Accounting Officer) |
March 11, 2011 | ||
| /S/ WALTER D. AMARAL Walter D. Amaral |
Director |
March 11, 2011 | ||
| /S/ THOMAS FALK Thomas Falk |
Director |
March 11, 2011 | ||
| /S/ JEFFREY T. FISHER Jeffrey T. Fisher |
Director |
March 11, 2011 | ||
| /S/ JOSEPH H. GLEBERMAN Joseph H. Gleberman |
Director |
March 11, 2011 | ||
| /S/ FREDRIC W. HARMAN Fredric W. Harman |
Director |
March 11, 2011 | ||
| /S/ PETER J. PERRONE Peter J. Perrone |
Director |
March 11, 2011 | ||
| /S/ DAVID C. PETERSCHMIDT David C. Peterschmidt |
Director |
March 11, 2011 | ||
| /S/ NATHAN F. RACIBORSKI Nathan F. Raciborski |
Co-Founder, Chief Technical Officer and Director |
March 11, 2011 | ||
| /S/ JOHN J. VINCENT John J. Vincent |
Chief Executive Officer of EyeWonder and Director |
March 11, 2011 | ||
123
Table of Contents
SCHEDULE II — VALUATION AND QUALIFYING ACCOUNTS
(In thousands)
| Additions | Deductions | |||||||||||||||||||
| Description |
Balance at Beginning of Period |
Charged to Costs and Expenses |
Charged Against Revenue |
Write-Offs Net of Recoveries |
Balance at End of Period |
|||||||||||||||
| Year ended December 31, 2008: |
||||||||||||||||||||
| Allowances deducted from asset accounts: |
||||||||||||||||||||
| Reserves for accounts receivable |
$ | 4,022 | 5,408 | 3,842 | 5,707 | $ | 7,565 | |||||||||||||
| Deferred tax asset valuation allowance |
$ | 25,723 | 21,672 | — | — | $ | 47,395 | |||||||||||||
| Year ended December 31, 2009: |
||||||||||||||||||||
| Allowances deducted from asset accounts: |
||||||||||||||||||||
| Reserves for accounts receivable |
$ | 7,565 | 3,869 | 1,144 | 3,352 | $ | 9,226 | |||||||||||||
| Deferred tax asset valuation allowance |
$ | 47,395 | — | — | 13,027 | $ | 34,368 | |||||||||||||
| Year ended December 31, 2010: |
||||||||||||||||||||
| Allowances deducted from asset accounts: |
||||||||||||||||||||
| Reserves for accounts receivable |
$ | 9,226 | 1,193 | (110 | ) | 3,014 | $ | 7,295 | ||||||||||||
| Deferred tax asset valuation allowance |
$ | 34,368 | 3,157 | — | — | $ | 37,525 | |||||||||||||
124
Table of Contents
INDEX TO EXHIBITS
| Exhibit Number |
Exhibit Title | |
| 2.1(1) | Agreement and Plan of Merger by and among Registrant, Elvis Merger Sub One Corporation, Elvis Merger Sub Two LLC, EyeWonder, Inc., John J. Vincent, as Stockholder Representative and Deutsche Bank National Trust, as Escrow Agent, dated December 21, 2009. | |
| 3.1(2) | Amended and Restated Certificate of Incorporation of the Registrant, as currently in effect. | |
| 3.2(3) | Amended and Restated Bylaws of the Registrant, as currently in effect. | |
| 4.1(4) | Specimen Common Stock Certificate of the Registrant. | |
| 4.2(4) | Amended and Restated Investors’ Rights Agreement dated July 12, 2006. | |
| 10.1(4) | Form of Indemnification Agreement for directors and officers. | |
| 10.2(4) | Amended and Restated 2003 Incentive Compensation Plan and form of agreement thereunder. | |
| 10.3(4) | 2007 Equity Incentive Plan and form of agreement thereunder. | |
| 10.4(4) | Employment Agreement between the Registrant and Jeffrey W. Lunsford dated October 20, 2006. | |
| 10.4.01†(5) | Equity Award Amendment and Grant of Restricted Stock Units under the Registrant’s 2007 Equity Incentive Plan dated November 25, 2008. | |
| 10.4.02(6) | Amendment to Employment Agreement between the Registrant and Jeffrey W. Lunsford dated December 30, 2008. | |
| 10.5(7) | Lease between the Registrant and Bel de Mar, LLC dated November 18, 2002. | |
| 10.6(8) | Lease between the Registrant and Bel de Mar, LLC dated December 1, 2004. | |
| 10.7(9) | Lease between the Registrant and Calwest Industrial Properties, LLC dated September 7, 2005. | |
| 10.8(10) | Loan and Security Agreement dated April 15, 2005 between the Registrant and Silicon Valley Bank, and amendments thereto. | |
| 10.9†(11) | Bandwidth/Capacity Agreement between the Registrant and Global Crossing Bandwidth, Inc., dated August 29, 2001, and amendments thereto. | |
| 10.9.01†(12) | Amendments to Bandwidth/Capacity Agreement between the Registrant and Global Crossing Bandwidth, Inc., dated August 29, 2001. | |
| 10.9.02†(13) | Amendment #23 to Bandwidth/Capacity Agreement between the Registrant and Global Crossing Bandwidth, Inc., dated August 29, 2001, as amended. | |
| 10.9.03†(14) | Amendment #24 to Bandwidth/Capacity Agreement between the Registrant and Global Crossing Bandwidth, Inc., dated August 29, 2001, as amended. | |
| 10.10(15) | Form of At-Will Employment, Confidential Information, Invention Assignment, and Arbitration Agreement for officers and employees. | |
| 10.11(16) | Employment Agreement between the Registrant and David M. Hatfield dated March 27, 2007. | |
| 10.11.01(17) | Amendment to Employment Agreement between the Registrant and David M. Hatfield dated December 30, 2008. | |
| 10.12†(18) | Edge Computing Network Service and License Agreement dated March 1, 2007 between the Registrant and Microsoft Corporation, and Addendum to the Edge Computing Network Service and License Agreement dated March 19, 2007. | |
| 10.12.01†(19) | Amendment to Edge Computing Network Service and License Agreement between the Registrant and Microsoft Corporation dated October 1, 2008. | |
125
Table of Contents
| Exhibit Number |
Exhibit Title | |
| 10.13(20) | Employment Agreement between the Registrant and Philip C. Maynard effective October 22, 2007. | |
| 10.13.01(21) | Amendment to Employment Agreement between the Registrant and Philip C. Maynard dated December 30, 2008. | |
| 10.14(22) | Employment Agreement between the Registrant and Nathan F. Raciborski dated September 22, 2008. | |
| 10.14.01(23) | Amendment to Employment Agreement between the Registrant and Nathan F. Raciborski dated December 30, 2008. | |
| 10.15(24) | Employment Agreement between the Registrant and Michael M. Gordon dated September 22, 2008. | |
| 10.15.01(25) | Amendment to Employment Agreement between the Registrant and Michael M. Gordon dated December 30, 2008. | |
| 10.15.02(26) | Amendment No. 2 to Employment Agreement between the Registrant and Michael M. Gordon dated as of July 8, 2010. | |
| 10.16(27) | Employment Agreement between the Registrant and Douglas S. Lindroth dated October 14, 2008. | |
| 10.16.01(28) | Amendment to Employment Agreement between the Registrant and Douglas S. Lindroth dated December 30, 2008. | |
| 10.17(29) | Master Executive Bonus and Management Bonus Plan. | |
| 10.18(30) | Form of EyeWonder, Inc. Voting Agreement by and between the Registrant and EyeWonder, Inc. dated December 21, 2009. | |
| 10.19(31) | Form of Stock Purchase Agreement by and between the Registrant and EyeWonder, Inc. dated December 21, 2009. | |
| 10.20(32) | Form of Limelight Networks, Inc. Voting Agreement by and between the Registrant and EyeWonder, Inc. dated December 21, 2009. | |
| 10.21(33) | Form of 2007 Equity Incentive Plan Restricted Stock Unit Agreement. | |
| 10.22(34) | Form of 2007 Equity Incentive Plan Restricted Stock Unit Agreement for Non-U.S. Employees. | |
| 10.23(35) | Employment Agreement between the Registrant and John Vincent dated December 21, 2009. | |
| 10.24(36) | Non-Competition Agreement between the Registrant and John Vincent dated December 21, 2009. | |
| 10.25(37) | European Expansion Consulting Agreement among the Registrant, eValue AG and Thomas Falk dated April 13, 2010. | |
| 10.26(38) | Non-Competition Agreement between the Registrant and Thomas Falk dated April 13, 2010. | |
| 10.27(39) | Form of Restriction Agreement. | |
| 10.28(40) | Standard Office Lease between the Registrant and GateWay Tempe LLC dated as of July 20, 2010. | |
| 21.1 | List of subsidiaries of the Registrant. | |
| 23.1 | Consent of Ernst & Young LLP, Independent Registered Public Accounting Firm. | |
| 24.1 | Power of Attorney (See signature page). | |
126
Table of Contents
| Exhibit Number |
Exhibit Title | |
| 31.1 | Certification of Chief Executive Officer pursuant to Securities Exchange Act Rules 13a-14(a) and 15d-14(a), as adopted pursuant to Section 302 of the Sarbanes-Oxley Act of 2002. | |
| 31.2 | Certification of Chief Financial Officer pursuant to Securities Exchange Act Rules 13a-14(a) and 15d-14(a), as adopted pursuant to Section 302 of the Sarbanes-Oxley Act of 2002. | |
| 32.1* | Certification of Chief Executive Officer pursuant to 18 U.S.C. Section 1350, as adopted pursuant to Section 906 of the Sarbanes-Oxley Act of 2002. | |
| 32.2* | Certification of Chief Financial Officer pursuant to 18 U.S.C. Section 1350, as adopted pursuant to Section 906 of the Sarbanes-Oxley Act of 2002. | |
| (1) | Incorporated by reference to Exhibit 2.1 of the Registrant’s Current Report on Form 8-K filed on December 21, 2009. |
| (2) | Incorporated by reference to Exhibit 3.2 of the Registrant’s Form S-1 Registration Statement (Registration No. 333-141516), declared effective by the Securities and Exchange Commission on June 7, 2007. |
| (3) | Incorporated by reference to Exhibit 3.4 of the Registrant’s Form S-1 Registration Statement (Registration No. 333-141516), declared effective by the Securities and Exchange Commission on June 7, 2007. |
| (4) | Incorporated by reference to the same number exhibit of the Registrant’s Form S-1 Registration Statement (Registration No. 333-141516), declared effective by the Securities and Exchange Commission on June 7, 2007. |
| (5) | Incorporated by reference to Exhibit 99.1 of the Registrant’s Current Report on Form 8-K filed on November 26, 2008. |
| (6) | Incorporated by reference to Exhibit 99.1 of the Registrant’s Current Report on Form 8-K filed on December 31, 2008. |
| (7) | Incorporated by reference to Exhibit 10.6 of the Registrant’s Form S-1 Registration Statement (Registration No. 333-141516), declared effective by the Securities and Exchange Commission on June 7, 2007. |
| (8) | Incorporated by reference to Exhibit 10.7 of the Registrant’s Form S-1 Registration Statement (Registration No. 333-141516), declared effective by the Securities and Exchange Commission on June 7, 2007. |
| (9) | Incorporated by reference to Exhibit 10.8 of the Registrant’s Form S-1 Registration Statement (Registration No. 333-141516), declared effective by the Securities and Exchange Commission on June 7, 2007. |
| (10) | Incorporated by reference to Exhibit 10.9 of the Registrant’s Form S-1 Registration Statement (Registration No. 333-141516), declared effective by the Securities and Exchange Commission on June 7, 2007. |
| (11) | Incorporated by reference to Exhibit 10.10 of the Registrant’s Form S-1 Registration Statement (Registration No. 333-141516), declared effective by the Securities and Exchange Commission on June 7, 2007. |
| (12) | Incorporated by reference to Exhibit 10.10.01 of the Registrant’s Quarterly Report on Form 10-Q filed on August 14, 2008. |
| (13) | Incorporated by reference to Exhibit 10.10.02 of the Registrant’s Annual Report on Form 10-K filed on March 13, 2009. |
| (14) | Incorporated by reference to Exhibit 10.10.03 of the Registrant’s Quarterly Report on Form 10-Q filed on November 6, 2009. |
| (15) | Incorporated by reference to Exhibit 10.12 of the Registrant’s Form S-1 Registration Statement (Registration No. 333-141516), declared effective by the Securities and Exchange Commission on June 7, 2007. |
127
Table of Contents
| (16) | Incorporated by reference to Exhibit 10.13 of the Registrant’s Form S-1 Registration Statement (Registration No. 333-141516), declared effective by the Securities and Exchange Commission on June 7, 2007. |
| (17) | Incorporated by reference to Exhibit 99.6 of the Registrant’s Current Report on Form 8-K filed on December 31, 2008. |
| (18) | Incorporated by reference to Exhibit 10.15 of the Registrant’s Quarterly Report on Form 10-Q filed on November 14, 2007. |
| (19) | Incorporated by reference to Exhibit 10.15.01 of the Registrant’s Quarterly Report on Form 10-Q filed on November 13, 2008. |
| (20) | Incorporated by reference to Exhibit 99.2 of the Registrant’s Current Report on Form 8-K filed on November 13, 2007. |
| (21) | Incorporated by reference to Exhibit 99.7 of the Registrant’s Current Report on Form 8-K filed on December 31, 2008. |
| (22) | Incorporated by reference to Exhibit 99.1 of the Registrant’s Current Report on Form 8-K filed on September 23, 2008. |
| (23) | Incorporated by reference to Exhibit 99.2 of the Registrant’s Current Report on Form 8-K filed on December 31, 2008. |
| (24) | Incorporated by reference to Exhibit 99.2 of the Registrant’s Current Report on Form 8-K filed on September 23, 2008. |
| (25) | Incorporated by reference to Exhibit 99.3 of the Registrant’s Current Report on Form 8-K filed on December 31, 2008. |
| (26) | Incorporated by reference to Exhibit 99.1 of the Registrant’s Current Report on Form 8-K filed on July 14, 2010. |
| (27) | Incorporated by reference to Exhibit 99.1 of the Registrant’s Current Report on Form 8-K filed on October 15, 2008. |
| (28) | Incorporated by reference to Exhibit 99.4 of the Registrant’s Current Report on Form 8-K filed on December 31, 2008. |
| (29) | Incorporated by reference to Exhibit 99.1 of the Registrant’s Current Report on Form 8-K filed on May 19, 2009. |
| (30) | Incorporated by reference to Exhibit 10.21 of the Registrant’s Current Report on Form 8-K filed on December 21, 2009. |
| (31) | Incorporated by reference to Exhibit 10.22 of the Registrant’s Current Report on Form 8-K filed on December 21, 2009. |
| (32) | Incorporated by reference to Exhibit 10.23 of the Registrant’s Current Report on Form 8-K filed on December 21, 2009. |
| (33) | Incorporated by reference to Exhibit (a)(1)(I) of the Registrant’s Schedule TO filed on May 15, 2008. |
| (34) | Incorporated by reference to Exhibit (a)(1)(J) of the Registrant’s Schedule TO filed on May 15, 2008. |
| (35) | Incorporated by reference to Exhibit 99.1 of the Registrant’s Current Report on Form 8-K filed on May 6, 2010. |
| (36) | Incorporated by reference to Exhibit 99.2 of the Registrant’s Current Report on Form 8-K filed on May 6, 2010. |
| (37) | Incorporated by reference to Exhibit 99.3 of the Registrant’s Current Report on Form 8-K filed on May 6, 2010. |
| (38) | Incorporated by reference to Exhibit 99.4 of the Registrant’s Current Report on Form 8-K filed on May 6, 2010. |
128
Table of Contents
| (39) | Incorporated by reference to Exhibit 99.5 of the Registrant’s Current Report on Form 8-K filed on May 6, 2010. |
| (40) | Incorporated by reference to Exhibit 10.32 of the Registrant’s Quarterly Report on Form 10-Q filed on November 5, 2010. |
| * | This exhibit shall not be deemed “filed” for purposes of Section 18 of the Securities Exchange Act of 1934 or otherwise subject to the liabilities of that Section, nor shall it be deemed incorporated by reference in any filings under the Securities Act of 1933 or the Securities Exchange Act of 1934, whether made before or after the date hereof and irrespective of any general incorporation language in any filings. |
| † | Confidential treatment has been requested or granted for portions of this exhibit by the Securities and Exchange Commission. |
129