Attached files
Table of Contents
UNITED STATES
SECURITIES AND EXCHANGE COMMISSION
Form 10-K
| x | ANNUAL REPORT PURSUANT TO SECTION 13 OR 15(d) OF THE SECURITIES EXCHANGE ACT OF 1934 |
For the fiscal year ended December 31, 2010
OR
| ¨ | TRANSITION REPORT PURSUANT TO SECTION 13 OR 15(d) OF THE SECURITIES EXCHANGE ACT OF 1934 |
For the transition period from to
Commission file number: 001-32977
GMX RESOURCES INC.
(Exact name of registrant as specified in its charter)
| Oklahoma | 73-1534474 | |
| (State or other jurisdiction of incorporation or organization) |
(I.R.S. Employer Identification No.) | |
| 9400 North Broadway, Suite 600, Oklahoma City, Oklahoma |
73114 | |
| (Address of principal executive offices) | (Zip Code) | |
(405) 600-0711
(Registrant’s telephone number, including area code)
Securities registered under Section 12(b) of the Exchange Act:
| Title of Class |
Name of Exchange on Which Registered | |
| Common Stock, $0.001 par value |
New York Stock Exchange | |
| Series B Cumulative Preferred Stock, $0.001 par value |
New York Stock Exchange | |
| Series A Preferred Stock Purchase Rights |
New York Stock Exchange |
Securities registered under Section 12(g) of the Exchange Act: None
Indicate by check mark if registrant is a well-known seasoned issuer, as defined in Rule 405 of the Securities Act. Yes ¨ No x
Indicate by check mark if registrant is not required to file reports pursuant to Section 13 or Section 15(d) of the Act. Yes ¨ No x
Indicate by check mark whether the registrant (1) has filed all reports required to be filed by Section 13 or 15(d) of the Securities Exchange Act of 1934 during the preceding 12 months (or for such shorter period that the registrant was required to file such reports), and (2) has been subject to such filing requirements for the past 90 days. Yes x No ¨
Indicate by check mark whether the registrant has submitted electronically and posted on its corporate Web site, if any, every Interactive Data File required to be submitted and posted pursuant to Rule 405 of Regulation S-T (§232.405 of this chapter) during the preceding 12 months (or for such shorter period that the registrant was required to submit and post such files). Yes ¨ No ¨
Indicate by check mark if disclosure of delinquent filers pursuant to Item 405 of Regulation S-K (§229.405 of this chapter) is not contained herein, and will not be contained, to the best of registrant’s knowledge, in definitive proxy or information statements incorporated by reference in Part III of this Form 10-K or any amendment to this Form 10-K. ¨
Indicate by check mark whether the registrant is a large accelerated filer, an accelerated filer, a non-accelerated filer, or a smaller reporting company. See definition of “large accelerated filer”, “accelerated filer” and “smaller reporting company” in Rule 12b-2 of the Exchange Act. Check one:
| Large accelerated filer ¨ | Accelerated filer x | |
| Non-accelerated filer ¨ (Do not check if a smaller reporting company) | Smaller reporting company ¨ |
Indicate by check mark whether the registrant is a shell company (as defined in Rule 12b-2 of the Act) Yes ¨ No x
As of June 30, 2010, the aggregate market value of the registrant’s common stock held by non-affiliates was $186,431,169 based on the closing price of such common stock in the daily composite list of transactions on the New York Stock Exchange of $6.49.
As of March 10, 2011, there were 56,415,790 shares of the registrant’s common stock outstanding, including 2,640,000 shares under a share lending agreement that will be returned to the registrant upon conversion or maturity of certain outstanding convertible notes and 688,822 shares of unvested restricted stock.
DOCUMENTS INCORPORATED BY REFERENCE: Portions of the registrant’s definitive proxy statement for its 2011 Annual Meeting of Shareholders (to be filed within 120 days of the close of the registrant’s fiscal year) are incorporated by reference into Part III of this Form 10-K.
Table of Contents
Form 10-K
Table of Contents
| Page | ||||||
| 1 | ||||||
| ITEM 1. | BUSINESS | 1 | ||||
| ITEM 1A. | RISK FACTORS | 28 | ||||
| ITEM 2. | PROPERTIES | 48 | ||||
| ITEM 3. | LEGAL PROCEEDINGS | 48 | ||||
| ITEM 4. | (REMOVED AND RESERVED) | 48 | ||||
| 49 | ||||||
| ITEM 5. | MARKET FOR REGISTRANT’S COMMON EQUITY, RELATED STOCKHOLDER MATTERS AND ISSUER PURCHASES OF EQUITY SECURITIES | 49 | ||||
| ITEM 6. | SELECTED FINANCIAL DATA | 51 | ||||
| ITEM 7. | MANAGEMENT’S DISCUSSION AND ANALYSIS OF FINANCIAL CONDITION AND RESULTS OF OPERATIONS | 52 | ||||
| ITEM 7A. | QUANTITATIVE AND QUALITATIVE DISCLOSURES ABOUT MARKET RISK | 70 | ||||
| ITEM 8. | FINANCIAL STATEMENTS AND SUPPLEMENTARY DATA | 72 | ||||
| ITEM 9. | CHANGES IN AND DISAGREEMENTS WITH ACCOUNTANTS ON ACCOUNTING AND FINANCIAL DISCLOSURE | 72 | ||||
| ITEM 9A. | CONTROLS AND PROCEDURES | 72 | ||||
| ITEM 9B. | OTHER INFORMATION | 75 | ||||
| 76 | ||||||
| 77 | ||||||
| ITEM 15. | EXHIBITS AND FINANCIAL STATEMENT SCHEDULES | 77 | ||||
Table of Contents
| Item 1. | Business. |
General
GMX Resources Inc. (“GMX”) and its subsidiaries (collectively, the “Company”) is an independent oil and natural gas exploration and production company historically focused on the development of the Cotton Valley group of formations, specifically the Cotton Valley Sands layer in the Schuler formation and the Upper Bossier, Middle Bossier and Haynesville/Lower Bossier layers of the Bossier formation (the “Haynesville/Bossier Shale”) in the Sabine Uplift of the Carthage, North Field of Harrison and Panola counties of East Texas (our “core area”).
We were incorporated in 1998 and acquired producing and undeveloped oil and natural gas properties located primarily in our core area, Kansas, and southeastern New Mexico from a bankruptcy liquidation of a small, privately-held company. We have leased additional undeveloped acreage and drilled wells in our core area since 1998. Since 1998, we have sold the Kansas and New Mexico properties and have historically concentrated our efforts in our core area, primarily since 2003 when we entered into a joint development agreement with Penn Virginia Oil & Gas, L.P. (“PVOG”), a wholly-owned subsidiary of Penn Virginia Corporation (NYSE: PVA). Although the area of mutual interest portion of this joint development agreement has expired, we continue to own acreage in our core area jointly with PVOG. We have drilled approximately 350 vertical and three horizontal Cotton Valley Sands wells in addition to Travis Peak Sand wells. However, during 2010 we did not drill any Cotton Valley Sand wells and only elected to participate in a 10% working interest in two Cotton Valley Sand horizontal wells drilled by PVOG on our joint venture acreage. Beginning in the fall of 2008, we transitioned into drilling horizontal wells into the Haynesville/Bossier Shale. As of December 31, 2010, we had drilled and completed 31 Haynesville/Bossier Shale horizontal (“H/B Hz”) wells, we had three H/B Hz wells that were drilled and awaiting completion, and we had two Helmerich & Payne FlexRig3™ rigs (“FlexRigs”) drilling H/B Hz wells.
During 2010, we made a strategic decision to begin looking for properties that would expand our assets and development into other basins, diversify our company’s concentrated natural gas focus from two resource plays in one basin and provide the company more liquid hydrocarbon opportunities. We sought out several key employee hires to aid in this expansion. These efforts have led to definitive agreements to acquire core positions in approximately 67,000 net acres (includes 15,417 net acres in which seller has an option to acquire a 50% working interest by May 15, 2011) in the two of the leading oil resource plays in the U.S. During January and February 2011, we entered into separate agreements to purchase undeveloped leasehold in the Williston Basin of North Dakota/Montana, targeting the Bakken/Sanish-Three Forks Formation, and the oil window of the Denver Julesburg Basin (the “DJ Basin”) of Wyoming, targeting the emerging Niobrara Formation. We are making plans to deploy our capital and resources into these development opportunities beginning in 2011. With the acquisition of the liquids-rich (estimated 90% oil) Bakken and Niobrara acreage, we will have better flexibility to deploy capital based on a variety of economic and technical factors, including wells costs, service availability, take-away capacity and commodity prices (including differentials applicable to the basins). We believe this flexibility will enable us to generate better cash flow growth to fund our capital expenditure program. We believe our contracted FlexRigs and experienced Rockies and Haynesville/Bossier Shale horizontal drilling personnel will enable us to succeed in the development of these new oil resource plays.
We have three subsidiaries: Diamond Blue Drilling Co. (“Diamond Blue”), which owns three conventional drilling rigs in our core area; Endeavor Pipeline Inc. (“Endeavor Pipeline”), which operates our water supply and salt water disposal systems in our core area; and Endeavor Gathering, LLC (“Endeavor Gathering”), which owns the natural gas gathering system and related equipment operated by Endeavor Pipeline. Kinder Morgan Endeavor LLC (“KME”) owns a 40% membership interest in Endeavor Gathering.
Our principal executive office is located at 9400 North Broadway, Suite 600, Oklahoma City, Oklahoma, 73114 and our telephone number is (405) 600-0711.
1
Table of Contents
Company Strengths
Large, contiguous acreage position in three high quality basins. With our announced acquisitions of undeveloped acreage in the Bakken and Niobrara, we will have a material position in two of the leading oil resource plays in the United States. This acreage is an addition to our core area position in the Haynesville/Bossier Shale and Cotton Valley Sands, which are located in the East Texas Basin and regarded as one of the top natural gas basins in the United States. Upon completion of these acquisitions, we expect to have 26,087 net acres in the Bakken and 40,642 net acres (includes 15,417 net acres in which seller has an option to acquire a 50% working interest by May 15, 2011), in the Niobrara. As of March 7, 2011, we have completed the acquisitions of 17,797 net acres in the Bakken and 30,843 net acres in the Niobrara. We have 61,528 gross acres (44,032 net acres) containing our Haynesville/Bossier Shale resource development in Harrison and Panola counties Texas and Caddo parish, Louisiana. As of December 31, 2010, we have drilled and completed 31 successful horizontal Haynesville/Bossier Shale wells with production profiles that we believe provide an attractive rate of return even in a low natural gas commodity price environment. We have an active natural gas hedging strategy that has provided us above-market prices since 2009, which has improved our margins. We have identified 226 net potential undrilled locations across our core area property base, based on 80-acre spacing. Furthermore, we drilled 19 vertical test wells in 2006, which confirmed a consistent 350-foot layer of Haynesville/Bossier Shale to be present and substantially reduced the risk associated with our Haynesville/Bossier Shale acreage. The Cotton Valley Sands resource development contains 65,284 gross acres (46,651 net acres) and has 314 producing locations, and between 100 and 250 net potential undrilled 80-acre horizontal locations. We have a track record of drilling success in our core area with nearly a 100% drilling success rate since the inception of our Company. A significant portion of our Haynesville/Bossier Shale and Cotton Valley Sands acreage is held by production, which gives us the ability to drill where we choose without significant risk of lease expirations.
Strong historical growth profile with multi-year, lower risk crude oil and natural gas resources drilling inventory. We have an inventory of approximately 261 net potential undrilled proved and unproved Haynesville/Bossier Shale drilling locations as of December 31, 2010. In addition to these Haynesville/Bossier Shale drilling locations that are primarily natural gas, we expect to have 81 net undrilled locations (4 horizontal wells/1,280 acres; 10,000’ laterals) in the Bakken and 254 net undrilled locations (excludes 15,417 net acres subject to clawback and based on 4 horizontal wells/640 acres; 5,000’ laterals) in the Niobrara that are crude oil targets. This large undrilled inventory of 335 horizontal oil resource locations and 511 horizontal gas resource locations, which includes 250 horizontal locations for the Cotton Valley Sands, provides us with a multi-year drilling inventory that will allow us to continue significant organic reserve and production growth. For the five-year period ending December 31, 2010, we have grown our production at a compounded annual growth rate of 51%.
Ability to allocate capital to either crude oil or natural gas and higher rate of return opportunities. With the addition of the Bakken and Niobrara acreage, which are primarily crude oil resource plays, we will have commodity and basin diversity that will allow us to allocate capital to achieve the highest risk-adjusted rate of return for our portfolio of resource development opportunities. Most of our Haynesville/Bossier Shale and Cotton Valley Sands acreage is held by production, which gives us the flexibility to choose where we drill and allocate capital. Approximately 98% of our proved reserves as of December 31, 2010 were natural gas. With the acquisition of the Bakken and Niobrara acreage, we will have better flexibility to deploy capital based on a variety of economic and technical factors, including wells costs, service availability, take-away capacity and commodity prices (including differentials applicable to the basin). We believe this flexibility will enable us to generate better cash flow growth and to fund our capital expenditure program.
High degree of horizontal drilling experience combined with operational control. We have drilled and completed 31 horizontal wells in the Haynesville/Bossier Shale using the latest technology. We routinely drill these wells with total measured depths of greater than 17,000 feet in less than 30 days. We intend to use our horizontal drilling expertise and our on-staff Rockies’ technical experience to successfully drill and operate wells in the both the Bakken and Niobrara. Once they become available, we currently intend to move two of our three
2
Table of Contents
available FlexRigs to the Bakken, use a contracted rig in the Niobrara and maintain a one FlexRig program in our East Texas core area. We operate over 84% of our acreage in our East Texas core area, which permits us to better manage our operating costs and better control capital expenditures and the timing of development and exploitation activities. We believe that by being an operator in the Bakken and Niobrara acreage and by using our Haynesville/Bossier Shale horizontal drilling experience, we can achieve superior operational efficiencies.
Significant infrastructure in place for East Texas core area. As of December 31, 2010, we had over 100 miles of gathering pipeline, 215 MMcf per day of takeaway capacity and 25,000 horsepower of compression. We also own salt-water disposal and other field infrastructure in our East Texas core area. We also have contracted four FlexRigs (one of which has been subleased to a third party for the remainder of a three-year primary term) and own three drilling rigs, in which six of these rigs have the capacity to drill horizontal wells in all four resource plays in which we operate. In November 2009, we contributed our gathering and compression assets to Endeavor Gathering as part of the sale of 40% of Endeavor Gathering to KME, and we obtained commitments from Endeavor Gathering for priority rights to its takeaway capacity. Based on our average daily production rate of 57.1 MMcfe per day for the quarter ended December 31, 2010 and our takeaway capacity of 215 MMcf per day as of December 31, 2010, we believe our current infrastructure has sufficient capacity to support material growth in production.
Strategy
Our current strategy is to expand our assets into oil resource plays in several basins that will provide the Company the ability to optimize its capital allocation and create shareholder value. We also intend to use two of our contracted FlexRigs, once they become available, to develop our two new oil resource horizontal developments in the Bakken/Sanish-Three Forks Formation of the Williston Basin in North Dakota and Montana, and the Niobrara Formation of the DJ Basin in Wyoming. We also plan to keep one contracted FlexRig drilling in our horizontal development of the Haynesville/Bossier Shale natural gas resource in East Texas. Our strategies emphasize:
| • | Developing our undeveloped acreage in the Niobrara Formation and Bakken Formation—We have entered into five agreements to acquire 26,087 net acres in the Bakken/Sanish-Three Forks oil resource play and 40,642 net acres, of which 15,417 net acres are subject to a claw back in the Niobrara oil resource play. Both plays have 81 and 254 net undeveloped horizontal locations, respectively. We currently intend to commence a two rig multi-year drilling program in these properties during the second half of 2011. We estimate these locations can be drilled and completed in about 8 years for the Bakken and 10 years for the Niobrara. We may selectively acquire additional acreage in these project areas in the normal course of business. |
| • | Diversifying into higher margin crude oil production through the acquisition of the Bakken and Niobrara acreage—We plan to increase our profitability, operating cash flows and flexibility by deploying our working capital to increase oil production and reserves. As current and forecast crude oil and natural gas prices fluctuate, we will continue to evaluate our allocation of capital between our oil and natural gas resources. |
| • | Using our Haynesville/Bossier horizontal drilling and on-staff technical experience to economically develop our newly acquired Bakken and Niobrara acreage—Our team has drilled and completed 31 Haynesville/Bossier horizontal wells, and we significantly reduced our completed well cost to under $1,700 per lateral foot in the fourth quarter of 2010. We reduced our spud to total depth drilling times from an average of 41 days to drill a horizontal well with an average lateral length of 4,787 feet in 2009 to an average of 29 days to drill a horizontal well with an average lateral length of 6,243 in the fourth quarter of 2010. We plan to utilize our experience and horizontal drilling efficiencies and advancements as we deploy our available FlexRigs in the Bakken and Niobrara. We have assembled a technical staff with PhDs in Engineering and Geology and with Rocky Mountain experience, including the following basins: Powder River Basin, Williston Basin, Uinta Basin, San Juan Basin, Piceance |
3
Table of Contents
| Basin, D-J Basin, Wind River Basin, Greater Green River Basin, Shirley-Hannah Basin and Canadian Rockies. We have also assembled an experienced group of senior land executives with wide-ranging experiences in acquisition, integration, and operation in conventional and unconventional resource plays in more than one million acres, covering multiple-rig drilling programs over the past 25 years in the Anadarko (Woodford and Granite Wash), Arkoma (Fayetteville, Woodford Caney and CBM), Permian, Hugoton, Barnett Shale, Haynesville / Bossier Shale, Bakken and Three Forks, and Marcellus Shale basins. |
| • | Developing our existing Haynesville/Bossier Shale acreage—We seek to maximize the value of our existing legacy assets by developing these properties with the lowest risk and the highest production and reserve growth potential. We intend to continue to develop our multi-year inventory of drilling locations in the Haynesville/Bossier Shale in order to develop our natural gas reserves in East Texas. We estimate that our approximate 44,032 net acres in the Haynesville/Bossier Shale includes as many as 261 net potential proved and unproved undrilled locations based on 80-acre spacing. |
| • | Maintaining operational control with focus on reducing operating costs—We have consistently maintained low finding and development costs and consistently operate with one of the lower operating cost structures in the industry. Our per unit lease operating expenses have declined from $0.86 per Mcfe for the year ended December 31, 2009 to $0.61 per Mcfe for the year ended December 31, 2010. |
| • | Actively hedging production to provide greater certainty of cash flow and earnings—For 2011 and 2012, we had hedged approximately 15.5 million MMBtu and 16.7 million MMBtu of natural gas at a weighted average floor price of $6.11 and $6.08 per MMbtu, respectively, as of December 31, 2010. Our 2011 hedges represent approximately 74% of our average daily production for the fourth quarter of 2010. We plan to continue to use hedging to mitigate commodity price risks. |
New Focus on Oil Plays and Pending Acquisitions
As discussed above, we made the strategic decision during 2010 to pursue oil focused properties that would diversify our concentrated natural gas focus and produce opportunities for us to expand our property development and technical experience into other basins. We have entered into five transactions to purchase undeveloped leasehold located in the Williston Basin in North Dakota/Montana, targeting the Bakken/Sanish-Three Forks Formation, as well as in the oil window of the DJ Basin in Wyoming, targeting the emerging Niobrara Formation. The Company is making plans to deploy an increasing amount of its capital and resources into these development opportunities in 2011 and 2012.
The acquisition terms consist of:
| • | Bakken acquisitions-Arkoma Bakken and other parties—a purchase and sale agreement, dated as of January 24, 2011, and a letter of intent, with Arkoma Bakken, LLC and other sellers with respect to undeveloped acreage located in the Bakken formation in North Dakota. These agreements provide for consideration payable in cash and in our common stock. The stock consideration will be based on a volume weighted average closing price of our common stock on the NYSE during the 15 trading days immediately prior to and including the date three trading days prior to the closing date; provided in the event such calculated price is less than $5.50, the price used will be $5.50, and in the event such calculated price is more than $6.50, the price used will be $6.50. The first purchase and sale agreement relates to the acquisition by us of an undivided 87.5% of the sellers’ working interest and an 82.5% net revenue interest in approximately 7,613 undeveloped acres located in McKenzie and Dunn Counties, North Dakota (with the acquired interest representing 6,661 net acres). The aggregate purchase price for these properties is approximately $31.3 million of which approximately one-third will be paid in cash. Based on stock consideration of $20,895,423, the stock consideration would be between 3,799,168 shares (based on a value of $5.50 per share) and 3,214,681 shares (based on a value of $6.50 per share) of our common stock. The letter of intent and proposed second purchase and sale agreement relates to the acquisition by us of an 87.5% working interest and an 80% net revenue interest in |
4
Table of Contents
| approximately 1,862 gross acres in Williams County, North Dakota (with the acquired interest representing 1,629 net acres). The aggregate purchase price for these properties is currently expected to be approximately $7.3 million. Based on stock consideration of $3,828,388, the stock consideration would be between 696,071 shares of our common stock (based on a value of $5.50 per share) and 588,983 shares (based on a value of $6.50 per share). In addition to the execution of a definitive agreement for the second transaction for 1,629 net acres, the transactions remain subject to customary title diligence and purchase price adjustments for title defects, as well as other diligence. We expect to close the transaction relating to these properties under the first purchase and sale agreement on or before April 30, 2011. At each closing, we will enter into a participation agreement with a joint operating agreement designating us as the operator of these properties. We have also agreed, or will agree, to enter into a registration rights agreement with these sellers at closing relating to the resale of the shares of common stock received in this transaction. However, these sellers will agree not to sell the shares of common stock received by them for six months following the closing of these transactions; |
| • | Bakken acquisition-Retamco—a purchase and sale agreement, entered into on January 13, 2011, relating to the acquisition by us of all of the working interest and an 80% net revenue interest in approximately 17,797 undeveloped net acres of oil and gas leases located in the Bakken formation in Montana and North Dakota. As consideration for the oil and gas leases, we have issued to the seller, Retamco Operating, Inc., at the closing of this transaction on February 28, 2011, 2,268,971 shares of our common stock and approximately $4.2 million in cash. At the closing, we also entered into a registration rights agreement with this seller relating to the resale of the shares of common stock received in this transaction; |
| • | Niobrara acquisition-Retamco—a separate purchase and sale agreement with Retamco Operating, Inc. relating to the acquisition by us of all of the working interest and an 80% net revenue interest in approximately 9,809 undeveloped net acres of oil and gas leases located in the Niobrara basin in Wyoming. The purchase price for this transaction is approximately $24.0 million in cash. The transaction remains subject to customary title diligence and purchase price adjustments for title defects. We expect to close the transaction relating to these properties on or prior to April 30, 2011. The closing of the transaction for these properties is not conditioned on the closing of the transaction relating to the seller’s Bakken formation properties; and |
| • | Niobrara acquisition—an agreement to purchase all of the working interest and an 80% net revenue interest in approximately 30,834 undeveloped acres of oil and gas leases located in the Niobrara basin in Wyoming for approximately $27.8 million, including commissions. We closed the transaction relating to these properties on February 14, 2011. Pursuant to our agreements with the seller, the seller has the option to reacquire 50% of the working interest acquired by May 15, 2011. |
The above referenced acquisitions are collectively referred to herein as the “Acquisitions.”
5
Table of Contents
The following is a summary of our recently closed and pending acreage acquisitions:
Williston Basin (Bakken/Three Forks)
| State |
County |
Total Net Acres |
% of GMX Acres in Basin |
Total Net Wells on 1,280 Acre Spacing |
||||||||||
| North Dakota |
Stark | 8,013 | 31 | % | 25.0 | |||||||||
| McKenzie |
5,959 | 23 | % | 18.6 | ||||||||||
| Williams(1) |
1,629 | 6 | % | 5.0 | ||||||||||
| Billings |
1,503 | 6 | % | 4.7 | ||||||||||
| Dunn |
1,342 | 5 | % | 4.2 | ||||||||||
| Total North Dakota |
18,446 | 71 | % | 57.5 | ||||||||||
| Montana |
Richland | 6,039 | 23 | % | 18.9 | |||||||||
| Sheridan |
1,280 | 5 | % | 4.0 | ||||||||||
| Wibaux |
321 | 1 | % | 1.0 | ||||||||||
| Total Montana |
7,640 | 29 | % | 23.9 | ||||||||||
| Total Williston Basin (Bakken/Three Forks)(3) |
26,086 | 100 | % | 81.4 | ||||||||||
| DJ Basin (Niobrara) | ||||||||||||||
| State |
County |
Total Net Acres |
% of GMX Acres in Basin |
Total Net Wells on 640 Acre Spacing |
||||||||||
| Wyoming |
Laramie | 21,970 | 54 | % | 137.3 | |||||||||
| Goshen |
13,087 | 32 | % | 81.8 | ||||||||||
| Platte |
5,587 | 14 | % | 34.9 | ||||||||||
| Total DJ Basin (Niobrara)(2)(3) |
40,644 | 100 | % | 254.0 | ||||||||||
| Total Acquisitions |
67,730 | 335.4 | ||||||||||||
| (1) | Includes 1,629 net acres subject to a letter of intent. |
| (2) | Includes 15,417 net acres related to a 50% option to purchase by seller by May 15, 2011. |
| (3) | As of March 7, 2011, we have closed on 17,797 net acres in the Williston Basin and on 30,834 net acres in the DJ Basin (50% of which DJ Basin net acres are subject to an option to purchase by the seller by May 15, 2011). |
Bakken/Sanish-Three Forks. Our entry into the Williston Basin involves transactions for approximately 26,086 total net acres in eight counties. The acreage is primarily in five distinct areas, all of which are within the Bakken “thermal maturity window.” The leases have a minimum 80% NRI and an average 80.8% NRI and are a mix of fee (freehold), state, and federal leases, all taken within the past 12 months. The leases have five-year primary terms and many of the fee leases have options to renew for five more years. The total acreage represents the potential for 81.5 net wells using four wells per 1,280-acre spaced units.
The Upper Devonian and Lower Mississippian Bakken Formation is an unconventional reservoir that produces oil from natural fracture systems. The Bakken Formation consists of three informal but distinct members that were deposited in an intra-cratonic basin: an organic-rich upper black shale that is up to 25 ft thick, an organic-poor middle grey-brown calcareous siltstone, sandstone or dolomitic limestone that is up to 85 ft thick, and a lower organic rich black shale similar to the upper member that is up to 50 ft thick. The upper and lower shale members contain significant volumes of type II oil-prone kerogen. Total organic carbon of the upper and lower members averages around 12% by weight. The total system is often described in conjunction with a “false Bakken” hot shale located in the overlying Lodgepole formation, and the Sanish-Three Forks (“S3”) sandstone located right below the Bakken.
6
Table of Contents
In addition to the cost of these acquisitions, we are currently budgeting capital expenditures in the Williston Basin to be $25.1 million in 2011 to establish a presence and begin our drilling program for the new Bakken properties (of which we expect to pay $15.5 million and $9.6 million in 2011 and 2012, respectively). Our plan is to drill 10,000’ laterals using one of our FlexRigs beginning in the third quarter of 2011, and drilling continuously thereafter. Our initial acreage contains 81.5 net long lateral locations using four wells per 1,280 acre density. We plan to continue leasing and have successfully recruited experienced Bakken land staff, brokerage, and title teams to augment our current land staff capacities and competencies. We plan to join consortiums and create data sharing relationships with other operators in the basin. We have hired local consultants in the area to execute our initial plans. As we expand our development we intend to establish a GMX field office in the area.
Niobrara- DJ Basin. Our entry into the Niobrara involves two transactions for approximately 40,644 net acres in southwestern Goshen, southeastern Platte and north central Laramie Counties in Wyoming with a minimum 80% NRI. One of the sellers has retained a 90-day option to reacquire 50% of our working interest (approximately 16,000 net acres) in these net acres at our initial cost. The fee leases generally have five-year primary terms, and many have options to extend the lease another five years. Approximately 20% of the total net acres are new federal leases with ten-year terms. The 40,644 net acres provides the Company with a development potential of 254 net wells using four wells per 640-acre unit.
The upper Cretaceous Niobrara Formation, an over-pressured fractured shale/chalk/limestone 300’ to 350’ thick reservoir, is the primary target for the play. Production varies from a nearly pure oil play in the north end where the Silo Field in Laramie County is less than 1 mcf/bbl to approximately 70% gas in the southern portion in the Wattenberg Field. The Silo Field was a vertical Niobrara play discovered in the early 1980’s. In the early 1990’s, horizontal development (without using more recent horizontal completion techniques) increased recoveries in the Silo Field nearly ten-fold to around 225,000 barrels of oil per well. As an example, operators in the early 1990’s reported single stage stimulation treatments consisting of 30,000 barrels of water pumped with wax beads as diverting material. Some horizontal wells were simple open-hole completions.
In addition to the Niobrara, the project area contains two other targets that are known producers in the DJ Basin. The Codell Sandstone formation (below the Niobrara) produced 30 million barrels of oil and 320 Bcf of gas in the Wattenberg Field. Also, the Sharon Springs Member of the Pierre Shale Formation (above the Niobrara) has produced in the Florence and Boulder Fields and has promise as an unconventional horizontal oil play.
In addition to the cost of these acquisitions, we are budgeting capital expenditures in the DJ Basin to be $26.9 million in 2011 to establish a presence and begin our drilling program (of which we expect to pay 14.8 million and $12.1 million in 2011 and 2012, respectively). We plan to continue leasing and have successfully recruited experienced land staff, brokerage, and title teams to augment our current competencies. Our operational plan is to deploy a third party rig in August 2011 to drill several vertical test wells down to 8,000’—9,000’, to log and study the results, and then begin the drilling program with a contracted rig to drill 8,000’—9,000’ vertical and 5,000’—10,000’ lateral wells. We plan to continue leasing, participate in and/or initiate our own 3D seismic shoot, join consortiums and create data sharing relationships with other operators. We have hired local consultants in the area to execute our initial plans. As we expand our development we intend to establish a GMX field office in the area.
Oil and Gas Properties as of December 31, 2010
The following section summarizes our oil and gas properties as of December 31, 2010.
East Texas
As of December 31, 2010, we owned 414 gross (264 net) producing wells. In our East Texas core area 325 gross (187 net) wells are Cotton Valley Sands wells at depths of 8,000 to 12,000 feet and 45 gross (37 net) wells
7
Table of Contents
are productive in the shallower conventional Rodessa, Travis Peak, Hosston and Pettit formations in our core area, and 31 gross (30 net) Haynesville/Bossier Shale horizontal wells producing, and 5 gross (2.8 net) wells in Louisiana at year-end 2010. We have historically grown by developing in our core area with a high degree of drilling success and with low finding and development costs. “Finding and Development Costs” is defined in “Glossary of Oil and Gas Terms.” The Cotton Valley Sands and Haynesville/Bossier are considered to be unconventional natural gas resources that are pervasive throughout large areas, which explains our historical drilling success in these formations. As of December 31, 2010, we had 319.3 Bcfe of proved reserves, which were 98% natural gas and 51% proved developed.
We presently are focusing a majority of our development efforts on the Haynesville/Bossier Shale areas. As of December 31, 2010, we have approximately 261 net proved and unproved Haynesville/Bossier Shale drilling locations (based on 80 acre well spacing) in Harrison and Panola Counties, Texas surrounded by our existing wells and other operators drilling Haynesville/Bossier Shale wells. We are continuing to see improving Haynesville/Bossier Shale results in East Texas, including Harrison County.
As of December 31, 2010, we had approximately 65,284 gross and 46,651 net acres in the Cotton Valley Sands formation, with between 100 and 250 undrilled Cotton Valley Sands horizontal drilling locations based on 80-acre spacing.
Our core area properties accounted for more than 98% of our total proved reserves at December 31, 2010, 93% of our total net acreage and 98% of our 2010 production.
We operate 183 wells, or 45% of our core area gross wells, that produced 83% of our oil and natural gas production as of December 31, 2010. Average daily net operated plus non-operated production in 2010 was 44.5 MMcf of gas and 261 Bbls of oil. The producing lives of these fields are generally between 12 to 70 years with a majority of the gas produced in the first ten years. Cotton Valley Sands gas sold from the area has a high MMBtu content, which after processing, can result in a net price above average daily Henry Hub natural gas prices. Oil is sold separately at a slight discount to the average Sweet Crude oil price at Cushing, Oklahoma (the NYMEX delivery point), inclusive of deductions. The acreage in East Texas lies on the Sabine Uplift, a broad positive feature that acts as a structural trap for most reservoirs. Most of the reservoirs are shallow and deep marine sediments that tend to have tremendous aerial extent and substantial thicknesses. Natural gas and oil have been produced from 3,000 feet to 11,700 feet in our core area. Prior to shifting our focus to the Haynesville/Bossier Shale, the primary objective of our development was the Cotton Valley Sands, which occurs between 8,200 feet and 10,000 feet and contains multiple layers of sands containing natural gas. Due to the multiple layers and widespread deposition of these gas saturated layers, we have a very high success rate of finding commercial wells.
In 2010, the Company did not drill or participate in any dry holes. The following table sets forth the gross and net wells completed and brought to sales in our core area in 2010:
| Wells Completed 2010 |
||||||||
| Gross | Net | |||||||
| Cotton Valley Sands Horizontal—Non-Operated |
2.0 | 0.2 | ||||||
| Haynesville/Bossier Shale Horizontal—Operated |
19.0 | 18.1 | ||||||
| Total |
21.0 | 18.3 | ||||||
In early 2006, we drilled and completed 19 vertical Haynesville/Bossier Shale wells across our property base. The exploratory work found a gas rich unconventional reservoir below the Cotton Valley Sands. We determined from these tests that the reservoirs had consistent open hole log characteristics across all of our acreage in Harrison and Panola counties. We did extensive open hole logging, coring and a variety of completion methods that determined, in our view, a viable horizontal unconventional candidate. We subsequently joined the
8
Table of Contents
Core Laboratories Haynesville/Bossier Gas Shale Consortium (with approximately 50 other E&P companies) to share technical data with other operators about horizontal shale development. In early 2008, several E&P companies achieved great success in Haynesville/Bossier Shale horizontal exploration near our properties. We determined the Haynesville/Bossier Shale horizontal potential on our properties to be of greater value than the Cotton Valley Sands and gathered the resources necessary to begin Haynesville/Bossier Shale horizontal development. We were also the first company to join the Core Laboratories Haynesville/Bossier Shale Consortium.
In 2010, we funded our drilling and development activity of $190.2 million in our core area with cash on hand at December 31, 2009 from the proceeds of a $86 million offering of 4.50% convertible senior notes due 2015 in October 2009, a $104 million common stock offering in October 2009, the sale of a non-controlling, minority interest in Endeavor Gathering for $36 million in November 2009, proceeds from borrowings on our revolving bank credit facility and cash flow from operations.
The following table sets forth our proved undeveloped locations in our core area as of December 31, 2010:
| Proved Undeveloped Locations |
||||||||
| Gross | Net | |||||||
| Haynesville / Bossier Shale Horizontal—Operated |
35 | 33.2 | ||||||
| Total |
35 | 33.2 | ||||||
In accordance with the five-year limitation on proved undeveloped locations, we removed approximately 290 net proved undeveloped locations related to the Cotton Valley Sands due to our focus on the new oil resource plays, as well as the intention to develop the Cotton Vally Sands on a horizontal basis.
The pace of future development of this property will depend on availability of capital, future drilling and completion results, the general economic conditions of the energy industry and on the price we receive for the natural gas and crude oil produced. Additionally, in certain areas in which we own our interest jointly with PVOG, the pace of future development will depend on PVOG’s level of activity in those areas. Based on the joint development agreement, we have the ability to limit the number of rigs that PVOG operates in these areas and we have the ability to limit our participation in any PVOG well.
The number of wells we drill in 2011 will vary, and our potential capital expenditures may vary depending on the number of wells drilled, drilling and completion results and other factors. We have budgeted $125.7 million for capital expenditures in 2011 for Haynesville/Bossier Shale horizontal drilling, including $29.5 million of the completion of wells drilled in 2010, along with acreage acquisitions, new gathering systems infrastructure, other capital expenditures including capitalized interest and capitalized overhead. We plan to continue to operate one FlexRig in the H/B Hz Shale play in East Texas in 2011, with expectations of drilling approximately 10 H/B Hz wells and completing 12 wells in East Texas in 2011. We are also exploring opportunities to joint venture with a non-operating partner to continue to develop our Haynesville/Bossier Shale acreage. We will fund our drilling expenses primarily from existing cash, internal cash flow, borrowings under our revolving bank credit facility, and the February 2011 debt and equity offerings (see “Note O—Subsequent Events” in the Financial Statements and Supplementary Data section below).
Other Oil and Gas Properties
We have approximately 2,400 gross (2,100 net) acres in the Waskom Field in Caddo parish in Louisiana with five gross (2.6 net) producing wells, three of which we operate. Total reserves and production from these areas represent less than 1% of our proved reserves and 2010 production.
9
Table of Contents
Oil and Gas Lease Terms and Expirations
Unless production is established within the spacing units covering the undeveloped acres on which some of our drilling locations are identified, the leases for such acreage will expire. As of December 31, 2010, we had leases representing 3,406 net acres expiring in 2011, 1,298 net acres expiring in 2012 and 2,231 net acres expiring in 2013. In addition, substantially all of the acreage we have acquired or expect to acquire in the Acquisitions will expire in the next three to five years.
Gas Gathering
We have, through our majority-owned subsidiary, Endeavor Gathering, gas gathering lines and compression equipment for gathering and delivery of natural gas from our core area that we operate. As of December 31, 2010, Endeavor Gathering had invested approximately $60 million in this gathering system, including the purchase of compressors and pipe inventory, which consisted of over 100 miles of gathering lines and 25,000 horsepower of compressors that collect and compress gas from approximately 99% of our operated gas production from wells in our core area. At year end 2010, this gas gathering system had takeaway capacity of 115 MMcf per day compared to our year end gross production volumes of 78.5 MMcfe per day. This system enables us to improve the control over our production and enhances our ability to obtain access to pipelines for ultimate sale of our gas. At present, Endeavor Gathering only gathers from wells in which we own an interest. Remaining gas is gathered by unrelated third parties. See “Business—Marketing.”
PVOG has installed and operates gathering facilities to each of the wells drilled and operated by PVOG in our jointly-owned areas. PVOG charges us a gathering fee of $0.10/MMBtu and actual cost of compression plus five percent for all gas gathered at the wellhead and redelivered to a central sales point. At year end 2010, the PVOG gathering system had takeaway capacity of 80 MMcf per day compared to production of 20.7 MMcf per day.
Assets Held for Sale
In December 2010, the Company finalized a plan to dispose of three drilling rigs, four compressors, pipe and valves by sale. These assets will either be disposed of individually or as part of a disposal group, depending on the purchaser’s interest. The accounting for these assets at the plan date was in accordance with ASC 360-10, Property, Plant and Equipment. Under this guidance, the assets are carried on the balance sheet at their carrying value or fair value less cost to sell, whichever is less. Subsequent increases in fair value less cost to sell will be recognized as a gain, but not in excess of the cumulative loss previously recognized. In determining fair value for the drilling rigs, management used third party appraisers. For all other assets, management performed internal estimates to the value of the assets based on verbal bids gathered through their marketing efforts. Management also performed internal estimates to estimate the cost to sell the assets, which primarily consisted of commissions to sale the assets, and were estimated based on past experience selling similar assets and verbal bids. As a result of determining fair value, an impairment loss was recorded on the assets held for sale in the amount of $9.6 million and selling costs were estimated to be $1.3 million, resulting in a total write-down of $10.9 million, which was included in the Impairment of Oil and Natural Gas Properties and Assets Held for Sale in the Statements of Operations on the Consolidated Balance sheet as of December 31, 2010.
Diamond Blue Drilling
Our subsidiary, Diamond Blue, owns three drilling rigs that were laid down in 2009 due to the decline in natural gas prices and our long-term drilling. As of December 31, 2010, these rigs were classified as held for sale on our balance sheet and the Company’s intention is to sell the rigs in 2011.
Oil and Natural Gas Reserves
At December 31, 2010, our estimated total proved oil and natural gas reserves, as prepared by our independent reserve engineering firms, MHA Petroleum Consultants, Inc. (“MHA”) and DeGolyer and
10
Table of Contents
MacNaughton (“D&M”), were approximately 319.3 Bcfe. As of December 31, 2010, D&M estimated our proved reserves related to the Haynesville/Bossier Shale to be 234.1 Bcfe, of which 79.1 Bcfe was proved developed reserves, and MHA estimated our remaining reserves related to other areas, including the Cotton Valley Sands, to be 85.2 Bcfe. An estimated 164.4 Bcfe is expected to be produced from existing wells and another 154.9 Bcfe is classified as proved undeveloped. Substantially all of our proved reserves relate to our Haynesville/Bossier Shale and Cotton Valley Sands development based on SEC rules. All of our proved undeveloped reserves are on locations that are adjacent to wells productive in the same formations.
In December 2008, the SEC issued its final rule, Modernization of Oil and Gas Reporting, which was effective for reporting 2009 and 2010 reserve information. In January 2010, the FASB issued its authoritative guidance on extractive activities for oil and gas to align its requirements with the SEC’s final rule. We adopted the guidance as of December 31, 2009 in conjunction with our 2009 and 2010 reserve reports as a change in accounting principle. Under the SEC’s final rule, 2008 reserves were not restated. The primary impacts of the SEC’s final rule on the fiscal years ended 2009 and 2010 included the use of the twelve-month average of the first-day-of-the-month reference prices and a five year limitation on proved undeveloped locations.
The following table shows the estimated net quantities of our proved reserves as of the dates indicated and the Estimated Future Net Revenues and Present Values attributable to total proved reserves at December 31. All of our proved reserves are located in the United States:
| 2010 | 2009 | 2008 | ||||||||||
| Proved Developed: |
||||||||||||
| Gas (Bcf) |
157.1 | 124.6 | 150.6 | |||||||||
| Oil (MMBbls) |
1.2 | 1.4 | 1.9 | |||||||||
| Total (Bcfe) |
164.3 | 133.3 | 162.1 | |||||||||
| Proved Undeveloped: |
||||||||||||
| Gas (Bcf) |
154.9 | 208.6 | 284.7 | |||||||||
| Oil (MMBbls) |
— | 2.3 | 3.1 | |||||||||
| Total (Bcfe) |
154.9 | 222.0 | 303.2 | |||||||||
| Total Proved: |
||||||||||||
| Gas (Bcf) |
312.0 | 333.2 | 435.3 | |||||||||
| Oil (MMBbls) |
1.2 | 3.7 | 5.0 | |||||||||
| Total (Bcfe) |
319.3 | 355.3 | 465.3 | |||||||||
| Estimated Future Net Revenues(1) ($MM) |
$ | 692.7 | $ | 625.7 | $ | 1,012.3 | ||||||
| Present Value(1) ($MM) |
$ | 249.9 | $ | 188.6 | $ | 280.7 | ||||||
| Standardized Measure(1) ($MM) |
$ | 249.9 | $ | 188.6 | $ | 228.8 | ||||||
| (1) | For 2008, prices used in calculating Estimated Future Net Revenues and the Present Value were determined using prices as of period end. For 2009 and 2010, prices used for Estimated Future Net Revenues and the Present Value are an average first-day of the month price for the last 12 months in accordance with recent amendments to Regulations S-K and S-X of the SEC. Estimated Future Net Revenues and the Present Value give no effect to federal or state income taxes attributable to estimated future net revenues. The Present Value, or PV-10, represents the estimated future net cash flows attributable to our estimated proved oil and gas reserves before income tax, discounted at 10%. PV-10 may be considered a non-GAAP financial measure as defined by the SEC. We believe that the Estimated Future Net Revenue and Present Value are useful measures in addition to the standardized measure as it assists in both the determination of future cash flows of the current reserves as well as in making relative value comparisons among peer companies. See “Note M—Supplemental Information on Oil and Natural Gas Operations” in our consolidated financial statements for information about the standardized measure of discounted future net cash flows. The standardized measure is dependent on the unique tax situation of each individual company, while the pre-tax Present Value is based on prices and discount factors that are consistent from company to company. We also understand that securities analysts use this measure in similar ways. |
11
Table of Contents
Proved oil and natural gas reserves are the estimated quantities of crude oil and natural gas which geological and engineering data demonstrate with reasonable certainty to be recoverable in future years from known reservoirs under existing economic and operating conditions. Proved developed reserves are reserves that can be expected to be recovered through existing wells with existing equipment and operating methods. Proved undeveloped reserves are reserves that are expected to be recovered from new wells on undrilled acreage, or from existing wells where a relatively major expenditure is required for recompletion.
There are numerous uncertainties inherent in estimating quantities of proved crude oil and natural gas reserves. Crude oil and natural gas engineering is a subjective process of estimating underground accumulations of crude oil and natural gas that cannot be precisely measured. The accuracy of any reserve estimate is a function of the quality of available data and of engineering and geological interpretation and judgment. Results of drilling, testing and production subsequent to the date of the estimate may justify revision of such estimate. Accordingly, reserve estimates are often different from the quantities of crude oil and natural gas that are ultimately recovered.
In accordance with the guidelines of the SEC, our independent reserve engineer’s estimates for 2009 and 2010 of future net revenues from our properties, and the PV-10 and standardized measure thereof, were determined to be economically producible under existing economic conditions, which requires the use of the 12-month average price for each product, calculated as the unweighted arithmetic average of the first-day-of-the-month price for the period January through December, except where such guidelines permit alternate treatment, including the use of fixed and determinable contractual price escalations. For 2009 and 2010, the average prices used in such estimates were $3.87 and $4.38 per MMbtu of natural gas and $61.18 and $79.43 per Bbl of crude oil, respectively. These prices do not include the impact of hedging transactions, nor do they include applicable transportation and quality differentials, nor price differentials between natural gas liquids and oil, which are deducted from or added to the index prices on a well by well basis.
The following table shows our total 2009 and 2010 proved reserves by area:
Proved Reserves—2010 SEC Pricing
| Area |
Oil (MMBbl) |
Natural Gas (Bcf) |
Total (Bcfe) |
% Proved Developed |
PV-10 ($ in millions) |
|||||||||||||||
| Cotton Valley Sands & Other |
1.2 | 77.8 | 85.2 | 100 | % | $ | 98.0 | |||||||||||||
| Haynesville/Bossier Shale |
— | 234.1 | 234.1 | 34 | % | $ | 151.9 | |||||||||||||
| Total |
1.2 | 311.9 | 319.3 | 51 | % | $ | 249.9 | |||||||||||||
Proved Reserves—2009 SEC Pricing
| Area |
Oil (MMBbl) |
Natural Gas (Bcf) |
Total (Bcfe) |
% Proved Developed |
PV-10 ($ in millions) |
|||||||||||||||
| Cotton Valley Sands & Other |
3.7 | 307.3 | 329.4 | 33 | % | $ | 155.8 | |||||||||||||
| Haynesville/Bossier Shale |
— | 25.9 | 25.9 | 91 | % | $ | 32.8 | |||||||||||||
| Total |
3.7 | 333.2 | 355.3 | 37 | % | $ | 188.6 | |||||||||||||
The amendments to Regulations S-K and S-X of the SEC also revised the guidelines for reporting proved undeveloped reserves. Reserves may be classified as proved undeveloped if there is a high degree of confidence that the quantities will be recovered, and they are scheduled to be drilled within five years of their initial inclusion as proved reserves, unless specific circumstances justify a longer time. In addition, proved undeveloped reserves may be estimated through the use of reliable technology in addition to flow tests and production history.
12
Table of Contents
Approximately 49% of our proved reserves are undeveloped under the new SEC rules. At the end of 2009, we, like other operators, reviewed all our existing proved undeveloped reserves in light of the SEC’s new five-year rule and decided to remove proved undeveloped reserves in the Cotton Valley Sands where we had 30% working interests in non-operated locations. At December 31, 2010, due to the drilling opportunities we have in the Haynesville/Bossier Shale and now in the oil resource plays of the Bakken and Niobrara, we do not believe we will develop our remaining Cotton Valley Sands proved undeveloped locations within the SEC’s five-year rule. None of these Cotton Valley Sands locations were actually beyond the five-year limit, but would have presented scheduling and capital priority issues under the new SEC guidelines going forward, especially in the context of our focus on the Haynesville/Bossier Shale, Bakken, and Niobrara drilling opportunities. We still believe the removed Cotton Valley Sands locations to be geologically and economically viable. If the price environment should improve, we would consider accelerating this development. The determination, as of December 31, 2009, to remove the 30% working interests in non-operated Cotton Valley Sands undeveloped locations resulted in the reduction of proved reserves by 53 Bcfe. The determination, as of December 31, 2010, to remove the remaining Cotton Valley Sands locations resulted in the reduction of proved reserves by 219.6 Bcfe. The remaining proved undeveloped reserves correspond to Haynesville/Bossier Shale horizontal drilling locations in our core area that are planned to be drilled within the next five years. The quantity and value of our proved undeveloped Haynesville/Bossier Shale reserves are dependent upon our ability to fund the associated development costs, which were estimated to be $269.8 million in the aggregate as of December 31, 2010. The estimated future development costs do not include exploration costs related to our Bakken, Niobrara and Haynesville/Bossier Shale drilling programs, which are estimated to be in the range of $175 million to $200 million per year, based on a one rig drilling program in each of the three areas. We have examined all sources of available funding, including our expected operating cash flows, availability under our revolving bank credit facility, and potential future debt and equity issuances, and we are reasonably certain that we will be able to fund the necessary development costs for our proved undeveloped reserves over the next five years.
Our estimates of proved reserves, related future net revenues and PV-10 at December 31, 2008, 2009 and 2010 of our Cotton Valley Sands development reserves were prepared by our independent petroleum consultant, MHA, in accordance with generally accepted petroleum engineering and evaluation principles and definitions and guidelines established by the SEC. The primary person responsible for the reserve estimates prepared by MHA is Mr. John Arsenault. Mr. Arsenault is a Vice President with MHA and has approximately 25 years of direct industry engineering experience, 11 of which have been specifically related to reserves estimation. He obtained a B. Sc. in Petroleum Engineering from the Colorado School of Mines in 1985 and is a member of the Society of Petroleum Engineers.
Our estimates of proved reserves and related future net revenues and PV-10 at December 31, 2010 with respect to our Haynesville/ Bossier Shale reserves are based on reports prepared by D&M, our independent reserve engineer, in accordance with generally accepted petroleum engineering and evaluation principles and definitions and current guidelines established by the SEC. D&M is a Delaware corporation with offices in Dallas, Houston, Calgary and Moscow. The firm’s more than 100 professionals include engineers, geologists, geophysicists, petrophysicists and economists engaged in the appraisal of oil and gas properties, evaluation of hydrocarbon and other mineral prospects, basin evaluations, comprehensive field studies and equity studies related to the domestic and international energy industry. These services have been provided for over 70 years. D&M restricts its activities exclusively to consultation; it does not accept contingency fees, nor does it own operating interests in any oil, gas or mineral properties, or securities or notes of clients. The firm subscribes to a code of professional conduct, and its employees actively support their related technical and professional societies. The Senior Vice President at D&M primarily responsible for overseeing the preparation of the reserve estimates is a Registered Petroleum Engineer in the State of Texas with more than 36 years of experience in oil and gas reservoir studies and reserve evaluations. He graduated with a Bachelor of Science degree in Petroleum Engineering from Texas A&M University in 1974 and he is a member of the International Society of Petroleum Engineers and the American Association of Petroleum Geologists. The firm is a Texas Registered Engineering Firm.
13
Table of Contents
Technology used to establish proved reserves
Under the new SEC rules, proved reserves are those quantities of oil and natural gas, which, by analysis of geoscience and engineering data, can be estimated with reasonable certainty to be economically producible from a given date forward, from known reservoirs, and under existing economic conditions, operating methods, and government regulations. The term “reasonable certainty” implies a high degree of confidence that the quantities of oil and/or natural gas actually recovered will equal or exceed the estimate. Reasonable certainty can be established using techniques that have been proved effective by actual production from projects in the same reservoir or an analogous reservoir or by other evidence using reliable technology that establishes reasonable certainty. Reliable technology is a grouping of one or more technologies (including computational methods) that has been field tested and has been demonstrated to provide reasonably certain results with consistency and repeatability in the formation being evaluated or in an analogous formation.
In order to establish reasonable certainty with respect to our estimated proved reserves, D&M and MHA employed technologies that have been demonstrated to yield results with consistency and repeatability. The technologies and economic data used in the estimation of our proved reserves include, but are not limited to, electrical logs, radioactivity logs, core analyses, geologic maps and available downhole and production data, seismic data and well test data. Reserves attributable to producing wells with sufficient production history were estimated using appropriate decline curves or other performance relationships. Reserves attributable to producing wells with limited production history and for undeveloped locations were estimated using performance from analogous wells in the surrounding area and geologic data to assess the reservoir continuity.
Internal controls over reserves estimation process.
Our policies and practices regarding internal control over the estimating of reserves are structured to objectively and accurately estimate our oil and natural gas reserves quantities and present values in compliance with the SEC’s regulations and U.S. Generally Accepted Accounting Principles. We maintain an internal staff of petroleum engineers and geosciences professionals who work closely with our independent petroleum consultant and our independent reserve engineer to ensure the integrity, accuracy and timeliness of data furnished to MHA and to D&M in their reserves estimation process. Inputs to our reserves estimation process are based on historical results for production history, oil and natural gas prices, lease operating expenses, development costs, ownership interest and other required data. Our technical team meets regularly with representatives of MHA and D&M to review properties and discuss methods and assumptions used in MHA’s and D&M’s preparation of the year-end reserves estimates. While we have no formal committee specifically designated to review reserves reporting and the reserves estimation process, our senior management reviews and approves the MHA and D&M reserve reports and any internally estimated significant changes to our proved reserves on a timely basis. For the 2010 reserve report, our Audit Committee discussed the results of the Haynesville/Bossier reserve report with D&M. The Audit Committee will conduct similar reviews on an annual basis.
Our Vice President—Geosciences, Timothy Benton, was the technical person within the Company primarily responsible for overseeing the preparation of our year-end 2010 reserves estimates. Mr. Benton has over 30 years of industry experience in engineering and reservoir evaluations. He is a Registered Professional Engineer in the state of Oklahoma, a member of the Society of Petrophysics & Well Log Analysts and a member of the Society of Petroleum Engineers. Mr. Benton reports directly to our Chief Executive Officer and our President.
No estimates of our proved reserves comparable to those included in this report have been included in reports to any federal agency other than the SEC.
14
Table of Contents
Acquisition, Exploration and Development Costs
The following table shows certain information regarding the costs incurred by us in our acquisition, exploration and development activities during the periods indicated.
| 2010 | 2009 | 2008 | ||||||||||
| (in thousands) | ||||||||||||
| Development and exploration costs: |
||||||||||||
| Development drilling |
$ | 7,788 | $ | 14,202 | $ | 183,081 | ||||||
| Exploratory drilling |
164,355 | 116,250 | 15,943 | |||||||||
| Tubular and other drilling inventories |
3,167 | 1,697 | 39,773 | |||||||||
| Asset retirement obligation |
706 | 565 | 2,407 | |||||||||
| 176,016 | 132,714 | 241,204 | ||||||||||
| Acquisition: |
||||||||||||
| Proved |
3,884 | 6,881 | 23,246 | |||||||||
| Unproved |
8,149 | 11,450 | 26,236 | |||||||||
| 12,033 | 18,331 | 49,482 | ||||||||||
| Total |
$ | 188,049 | $ | 151,045 | $ | 290,686 | ||||||
The exploratory drilling costs of $164.4 million, $116.2 million, and $15.9 million in 2010, 2009 and 2008, respectively, relate to our Haynesville/Bossier Shale drilling. As of December 31, 2010, we had drilled and completed 31 successful horizontal Haynesville/Bossier Shale wells with production profiles that support our strategy of continued and focused development of this play. As a result of our 2010 drilling program, we added approximately 67.8 Bcfe of Haynesville/Bossier net proved developed reserves.
Oil and Natural Gas Production, Production Prices and Production Costs
For a summary of our oil and natural gas production, prices and production costs, please read “Management’s Discussion and Analysis of Financial Condition and Results of Operations- Summary Operating and Reserve Data,” which is incorporated by reference into this Item.
Drilling Activity
We drilled or participated in the drilling of wells as set out in the table below for the periods indicated. The table was completed based upon the date the wells were completed regardless of when drilling was initiated. You should not consider the results of prior drilling activities as necessarily indicative of future performance, nor should you assume that there is necessarily any correlation between the number of productive wells drilled and the oil and natural gas reserves generated by those wells. All of the following wells were drilled in the United States. We did not participate in the drilling of any oil wells or dry holes during the periods presented below.
| Year Ended December 31, | ||||||||||||||||||||||||
| 2010 | 2009 | 2008 | ||||||||||||||||||||||
| Gross | Net | Gross | Net | Gross | Net | |||||||||||||||||||
| Development wells: |
||||||||||||||||||||||||
| Natural Gas |
1.0 | 1.0 | 6.0 | 6.0 | 89.0 | 59.2 | ||||||||||||||||||
| Exploratory wells: |
||||||||||||||||||||||||
| Natural Gas |
20.0 | 17.3 | 11.0 | 10.94 | 1.0 | 1.0 | ||||||||||||||||||
| Total |
21.0 | 18.3 | 17.0 | 16.94 | 90.0 | 60.2 | ||||||||||||||||||
As of December 31, 2010 and 2009, we had two gross and net Haynesville/Bossier Shale horizontal wells drilling that are not included in the table above. These wells were considered exploratory wells as they were not identified as proved undeveloped locations in a prior year reserve report.
15
Table of Contents
Acreage
The following table shows our developed and undeveloped oil and natural gas lease and mineral acreage as of December 31, 2010.
| Developed | Undeveloped | Total | ||||||||||||||||||||||
| Gross | Net | Gross | Net | Gross | Net | |||||||||||||||||||
| East Texas |
42,071 | 27,200 | 25,687 | 20,562 | 67,758 | 47,762 | ||||||||||||||||||
| Other (United States) |
320 | 240 | — | — | 320 | 240 | ||||||||||||||||||
| Total |
42,391 | 27,440 | 25,687 | 20,562 | 68,078 | 48,002 | ||||||||||||||||||
We have approximately 226 net potential undrilled Haynesville/Bossier Shale locations in central and eastern Harrison and Panola counties in East Texas that are near acreage actively being drilled by other operators.
Title to oil and natural gas acreage is often complex. Landowners may have subdivided interests in the mineral estate. Oil and natural gas companies frequently subdivide the leasehold estate to spread drilling risk and often create overriding royalties. When we purchased the properties, the purchase included title opinions prepared by counsel analyzing mineral ownership in each well drilled. Further, for each producing well there is a division order signed by the current recipients of payments from production stipulating their assent to the fraction of the revenues they receive. We obtain similar title opinions with respect to each new well drilled. While these practices, which are common in the industry, do not assure that there will be no claims against title to the wells or the associated revenues, we believe that we are within normal and prudent industry practices. Because many of the properties in our current portfolio were purchased out of bankruptcy in 1998, we have the advantage that any known or unknown liens against the properties were cleared in the bankruptcy.
As of December 31, 2010, we had leases representing 3,406 net acres expiring in 2011, 1,298 net acres expiring in 2012 and 2,231 net acres expiring in 2013. In addition, substantially all of the acreage we expect to acquire in connection with our pending acquisitions will expire in the next three to five years.
Productive Well Summary
The following table shows the number of productive wells in which we had interests as of December 31, 2010. Gross oil and natural gas wells include wells with multiple completions. Wells with multiple completions are counted only once for purposes of the following table.
| Productive Wells | ||||||||
| Gross | Net | |||||||
| Natural gas |
392.0 | 246.6 | ||||||
| Oil |
22.0 | 17.2 | ||||||
| Total |
414.0 | 263.8 | ||||||
A substantial portion of our productive wells are related to our Cotton Valley Sands development.
Facilities
As of December 31, 2010, we leased 32,458 square feet in Oklahoma City, Oklahoma for our corporate headquarters. The annual rental cost is approximately $487,000. We also lease approximately 2,500 square feet of office space in Marshall, Texas used primarily for land field operations. The annual rent is approximately $27,000.
16
Table of Contents
We own a 50-acre operations field yard approximately seven miles southeast of Marshall, Texas that has approximately 21,500 square feet of office and warehouse space. We also own 48 acres on which our gas gathering sales point is located. In addition, we own 100 acres for expansion of our field operations near Marshall, Texas. In 2008, we opened a second field office of approximately 2,400 square feet dedicated to land operations situated on 14 acres approximately two miles from the operations field yard.
Employees
As of December 31, 2010, we had 109 full-time employees. This compares to 95 full-time employees at December 31, 2009, We also use a number of independent contractors to assist in land and field operations. We believe our relations with our employees are satisfactory. Our employees are not covered by a collective bargaining agreement.
Delivery Commitments and Marketing Arrangements
Our ability to market oil and natural gas often depends on factors beyond our control. The potential effects of governmental regulation and market factors, including alternative domestic and imported energy sources, available pipeline capacity, and general market conditions, are not entirely predictable.
Natural Gas. Natural gas is generally sold pursuant to individually negotiated gas purchase contracts, which vary in length from spot market sales of a single day to term agreements that may extend several years. None of our current contracts require us to provide a fixed and determinable quantity of gas. However, we do have a gas transportation and a gas marketing contract that charges us a reservation fee. Customers who purchase natural gas include marketing affiliates of the major oil and gas companies, pipeline companies, natural gas marketing companies, and a variety of commercial and public authorities, industrial, and institutional end-users who ultimately consume the gas. Gas purchase contracts define the terms and conditions unique to each of these sales. The price received for natural gas sold on the spot market may vary daily, reflecting changing market conditions. The deliverability and price of natural gas are subject to both governmental regulation and supply and demand forces.
Substantially all of our gas from our East Texas company-operated wells is initially sold to our wholly owned subsidiary, Endeavor Pipeline, which in turn sells gas to unrelated third parties. All of our gas is currently sold under contracts providing for market sensitive terms that are terminable with 30-60 day notice by either party without penalty. This means that we both enjoy the benefits of high prices in increasing price markets and suffer the impact of low prices when gas prices decline. In addition, PVOG markets 100% of the gas produced from wells operated by PVOG in areas we jointly own. A subsidiary of PVOG charges us a marketing fee of 1% of the sales proceeds subject to certain price caps for oil and natural gas sold on our behalf in areas we jointly own.
In June 2009, we entered into a firm sales agreement for 15,000 MMBtu per day increasing to 100,000 MMBtu per day through May 2014 at a price equal to the NGPL Tx-Ok index minus $0.02 per MMBtu. If we do not deliver physical gas, we have to pay a $0.02 per MMBtu deficiency fee on volumes not delivered. We sell a comingled package of gas owned by GMX, other working interest owners, and royalty owners under this agreement.
On February 1, 2010, we began shipping gas from east Texas to Perryville, Louisiana on the Regency pipeline under a ten-year firm transportation agreement in which we reserved 50,000 MMBtu per day of firm capacity; we pay a demand fee of $0.30 per MMBtu per day, and pay variable shipping fees equal to $0.05 per MMBtu plus the pipeline retains 1.0% fuel on volumes of gas that flow under our firm agreement. We ship a comingled package of gas owned by GMX, other working interest owners, and royalty owners under this agreement.
On February 1, 2010, as we began shipping gas on the Regency pipeline, we also began shipping gas on the Gulf States pipeline under a ten-year firm transportation agreement in which we reserved 35,000 MMBtu per day
17
Table of Contents
of firm capacity; we pay a demand fee of $0.0151 per MMBtu per day, and pay variable shipping fees equal to $0.0019 per MMBtu; there is no fuel retained by the pipeline under our firm agreement. We ship a comingled package of gas owned by GMX, other working interest owners, and royalty owners under this agreement.
In 2010, our largest purchaser of natural gas was Texla Energy Management, Inc. which accounted for over 43% of total natural gas sales. Other customers that accounted for 10% or more of our 2010 total natural gas sales were Tenaska, various purchasers through Penn Virginia Oil & Gas, L.P. and Louis Dreyfus Energy. We do not believe that the loss of any of our purchasers would have a material adverse effect on our operations as there are other purchasers active in the market.
Crude Oil. Oil produced from our properties is sold at the prevailing field price to one or more of a number of unaffiliated purchasers in the area. Generally, purchase contracts for the sale of oil are cancelable on 30 days’ notice. The price paid by these purchasers is an established market or “posted” price that is offered to all producers. In 2010, our largest purchaser of crude oil was Sunoco, Inc., which accounted for 61% of crude oil sales. Various purchasers through Penn Virginia Oil & Gas, L.P. accounted for 39% of our sales of crude oil. We do not believe that the loss of any of our purchasers would have a material adverse effect on our operations as there are other purchasers active in the market.
Competition
We compete with major integrated oil and natural gas companies and independent oil and natural gas companies in all areas of operation. In particular, we compete for property acquisitions and for the equipment and labor required to operate and develop these properties. Most of our competitors have substantially greater financial and other resources than we have. In addition, larger competitors may be able to absorb the burden of any changes in federal, state and local laws and regulations more easily than we can, which could adversely affect our competitive position. These competitors may be able to pay more for exploratory prospects and may be able to define, evaluate, bid for and purchase a greater number of properties and prospects than we can. Further, our competitors may have technological advantages and may be able to implement new technologies more rapidly than we can. Our ability to explore for natural gas and oil prospects and to acquire additional properties in the future will depend on our ability to conduct operations, to evaluate and select suitable properties and to consummate transactions in this highly competitive environment. In addition, most of our competitors have operated for longer than we have and have demonstrated the ability to operate through industry cycles.
Availability of Supplies and Materials
At various times, we have and may continue to experience occasional or prolonged shortages or unavailability of drilling rigs, drill pipe and other material used in oil and natural gas drilling. Such unavailability could result in increased costs, delays in timing of anticipated development or cause interests in undeveloped oil and natural gas leases to lapse.
Regulation
Exploration and Production. The exploration, production and sale of oil and natural gas are subject to various types of local, state and federal laws and regulations. These laws and regulations govern a wide range of matters, including the drilling and spacing of wells, allowable rates of production, restoration of surface areas, plugging and abandonment of wells and requirements for the operation of wells. Our operations are also subject to various conservation requirements. These include the regulation of the size and shape of drilling and spacing units or proration units and the density of wells that may be drilled and the unitization or pooling of oil and natural gas properties. In this regard, some states allow forced pooling or integration of tracts to facilitate exploration, while other states rely on voluntary pooling of lands and leases. In addition, state conservation laws establish maximum rates of production from oil and natural gas wells, generally prohibit the venting or flaring of natural gas and impose certain requirements regarding the ratability of production. All of these regulations may adversely affect the rate at which wells produce oil and natural gas and the number of wells we may drill. All statements in this report about the number of locations or wells reflect current laws and regulations.
18
Table of Contents
The failure to comply with these rules and regulations can result in substantial penalties. Our competitors in the oil and natural gas industry are subject to the same regulatory requirements and restrictions that affect our operations.
Environmental, Health and Safety Matters. We are subject to various federal, regional, state and local laws and regulations governing health and safety, the discharge of materials into the environment or otherwise relating to environmental protection. These laws and regulations may, among other things, require the acquisition of permits to conduct exploration, drilling and production operations; govern the amounts and types of substances that may be released into the environment in connection with oil and gas drilling and production; restrict the way we handle or dispose of our materials and wastes; limit or prohibit construction or drilling activities in sensitive areas such as wetlands, wilderness areas or areas inhabited by endangered or threatened species; require investigatory and remedial actions to mitigate pollution conditions caused by our operations or attributable to former operations; and impose obligations to reclaim any abandoned well sites and pits. These laws and regulations may also restrict the rate of oil and natural gas production below the rate that would otherwise be possible. The regulatory burden on the oil and gas industry increases the cost of doing business in the industry and consequently affects profitability. Compliance with these laws and regulations requires expenditures of time and financial resources, and failure to comply with these laws, regulations and permits may result in the assessment of administrative, civil and criminal penalties, the imposition of remedial obligations and the issuance of orders enjoining some or all of our operations in affected areas. While we believe that compliance with current requirements will not have a material adverse effect on our financial condition or results of operations, there is no assurance that changes in environmental requirements for the interpretation or enforcement of them will not have a material adverse effect.
Natural gas, oil or other pollutants, including salt water brine, may be discharged in many ways, including from a well or drilling equipment at a drill site, leakage from pipelines or other gathering and transportation facilities, leakage from storage tanks and sudden discharges from damage or explosion at natural gas facilities or oil and natural gas wells. Discharged hydrocarbons may migrate through soil to water supplies or adjoining property, giving rise to additional liabilities. Accidental releases or spills of substances may occur in the course of our operations, and we cannot assure you that we will not incur significant costs and liabilities as a result of such releases or spills, including any third party claims for damage to property, natural resources or persons.
Additionally, federal and state legislatures and government agencies frequently revise environmental, health and safety laws and regulations, and any changes that result in more stringent and costly compliance, waste handling, disposal, cleanup and remediation requirements for the oil and gas industry could have a significant impact on our operating costs. The trend in environmental regulation has been to place more restrictions and limitations on activities that may affect the environment, and thus, any changes in environmental laws and regulations or re-interpretation of enforcement policies that result in more stringent and costly waste handling, storage, transport, disposal, emissions or remediation requirements could have a material adverse effect on our operations and financial position. We may be unable to pass on such increased compliance costs to our customers.
The following is a summary of the more significant existing environmental, health and safety laws and regulations to which our business operations are subject and for which compliance may have a material adverse impact on our capital expenditures, results of operations or financial position.
The federal Comprehensive Environmental Response, Compensation and Liability Act (“CERCLA”), also known as the “superfund law,” imposes liability, often regardless of fault or the legality of the original conduct, on some classes of persons that are considered to have contributed to the release of a “hazardous substance” into the environment. These persons include the present and past owner or operator of a disposal site or sites where the release occurred or sites affected by the release, and persons that dispose or arrange for disposal of hazardous substances. Persons who are or were responsible for releases of hazardous substances under CERCLA may be subject to joint and severable liability for the costs of cleaning up the hazardous substances that have been released into the environment and for damages to natural resources, and it is not uncommon for neighboring
19
Table of Contents
landowners and other third parties to file claims for personal injury and property damage allegedly caused by the hazardous substances released into the environment. Many states have analogous programs assigning liability for the release of hazardous substances. We could be subject to the liability under CERCLA or state analogues because our drilling and production activities generate waste that may be subject to classification as hazardous substances under CERCLA.
The federal Resource Conservation and Recovery Act of 1976, as amended (“RCRA”), is the principal federal statute governing the treatment, storage and disposal of hazardous wastes. RCRA imposes stringent operating and waste handling requirements, and imposes liability for failure to meet such requirements, on a person who is a “generator” or “transporter” of hazardous waste or an “owner” or “operator” of a hazardous waste treatment, storage or disposal facility. At present, RCRA includes a statutory exemption that allows most oil and natural gas exploration and production waste to be classified as nonhazardous waste. A similar exemption is contained in many of the state-law counterparts to RCRA. As a result, we are not required to comply with a substantial portion of RCRA’s requirements because our operations generate exempt quantities of hazardous wastes. However, at various times in the past, proposals have been made to amend RCRA to rescind the exemption that excludes oil and natural gas exploration and production wastes from regulation as hazardous waste. Repeal or modification of the exemption by administrative, legislative or judicial process, or modification of similar exemptions in applicable state statutes, could increase the volume of hazardous waste we are required to manage and dispose of and could cause us to incur increased operating expenses.
The federal Water Pollution Control Act of 1972, as amended (“Clean Water Act”), and analogous state laws, impose restrictions and strict controls regarding the discharge of pollutants into certain water bodies. Pursuant to the Clean Water Act and analogous state laws, permits must be obtained to discharge pollutants into waters of the United States or, under state law, state surface or subsurface waters. Any such discharge of pollutants into regulated waters must be performed in accordance with the terms of a permit issued by the EPA or the analogous state agency. Spill prevention, control and countermeasure requirements under federal law require appropriate operating protocols including containment berms and similar structures to help prevent the contamination of regulated waters in the event of a petroleum hydrocarbon tank spill, rupture or leak. In addition, the Clean Water Act and analogous state laws require individual permits or coverage under general permits for discharges of storm water runoff from certain types of facilities or during construction activities.
Our operations employ hydraulic fracturing techniques to stimulate natural gas production from unconventional geological formations, which entails the injection of pressurized fracturing fluids (consisting of water, sand and certain chemicals) into a well bore. The federal Energy Policy Act of 2005 amended the Underground Injection Control (“UIC”) provisions of the federal Safe Drinking Water Act (“SDWA”) to exclude hydraulic fracturing from the definition of “underground injection” under certain circumstances. However, the repeal of this exclusion has been advocated by certain advocacy organizations and others in the public. Legislation to amend the SDWA to repeal this exemption and require federal permitting and regulatory control of hydraulic fracturing, as well as legislative proposals to require disclosure of the chemical constituents of the fluids used in the fracturing process, were proposed in recent sessions of Congress. Similar legislation could be introduced in the current session of Congress, which commenced on January 3, 2011. Scrutiny of hydraulic fracturing activities continues in other ways, with the EPA having commenced a study of the potential environmental impacts of hydraulic fracturing, the results of which are anticipated to be available by late 2012. Last year, a committee of the U.S. House of Representatives commenced investigations into hydraulic fracturing practices. The U.S. Department of the Interior has announced that it will consider regulations relating to the use of hydraulic fracturing techniques on public lands and disclosure of fracturing fluid constituents. In addition, some states and localities have adopted, and others are considering adopting, regulations or ordinances that could restrict hydraulic fracturing in certain circumstances, or that would impose higher taxes, fees or royalties on natural gas production. For example, New York has imposed a de facto moratorium on the issuance of permits for certain hydraulic fracturing practices until an environmental review and potential new regulations are finalized, which will at the earliest be July 31, 2011. Significant controversy has surrounded drilling operations in Pennsylvania. Wyoming has adopted legislation requiring drilling operators conducting hydraulic fracturing
20
Table of Contents
activities in that state to publicly disclose the chemicals used in the fracturing process, and Colorado requires recordkeeping and disclosure of fracturing fluid constituents to officials in certain circumstances. Our current operations have been concentrated largely in Texas and Louisiana, and we do not currently have operations on federal lands or in the states where the most stringent proposals have been advanced. However, if new federal or state laws or regulations that significantly restrict hydraulic fracturing are adopted, such legal requirements could result in delays, eliminate certain drilling and injection activities, make it more difficult or costly for us to perform fracturing and increase our costs of compliance and doing business. It is also possible that our drilling and injection operations could adversely affect the environment, which could result in a requirement to perform investigations or clean-ups or in the incurrence of other unexpected material costs or liabilities.
The Oil Pollution Act of 1990, as amended (“OPA”), which amends the Clean Water Act, establishes strict liability for owners and operators of facilities that are the site of a release of oil into waters of the United States. The OPA and its associated regulations impose a variety of requirements on responsible parties related to the prevention of oil spills and liability for damages resulting from such spills. A “responsible party” under the OPA includes owners and operators of certain onshore facilities from which a release may affect regulated waters.
The Federal Clean Air Act, as amended (“Clean Air Act”), and state air pollution permitting laws, restrict the emission of air pollutants from many sources, including processing plants and compressor stations and potentially from our drilling and production operations, and as a result affects oil and natural gas operations. We may be required to incur compliance costs or capital expenditures for existing or new facilities to remain in compliance. In addition, more stringent regulations governing emissions of air pollutants, including greenhouse gases such as methane (a component of natural gas) and carbon dioxide (“CO2”) are being developed by the federal government, and may increase the costs of compliance for some facilities or the cost of transportation or processing of produced oil and gas which may affect our operating costs. Obtaining permits has the potential to delay the development of oil and natural gas projects. While we may be required to incur certain capital expenditures in the next few years for air pollution control equipment or other air emissions-related issues, we do not believe, based on current law, that such requirements will have a material adverse effect on our operations.
In response to findings that emissions of carbon dioxide, methane and other greenhouse gases from industrial and energy sources contribute to increases of carbon dioxide levels in the earth’s atmosphere and oceans and cause global warming, effects on climate, and other environmental effects and therefore present an endangerment to public health and the environment, the EPA has adopted various regulations under the federal Clean Air Act addressing emissions of greenhouse gases that may affect the oil and gas industry. On November 8, 2010, the EPA finalized rules expanding its Mandatory Greenhouse Gas Reporting Rule, originally promulgated in October 2009, to be applicable to the oil and natural gas industry, including certain onshore oil and natural gas production activities, which may affect certain of our existing or future operations and require the inventory and reporting of emissions. In addition, EPA has taken the position that existing Clean Air Act provisions require an assessment of greenhouse gas emissions within the permitting process for certain large new or modified stationary sources under EPA’s Prevention of Significant Deterioration (“PSD”) and Title V permit programs beginning in 2011. Facilities triggering permit requirements may be required to reduce greenhouse gas emissions consistent with “best available control technology” standards if deemed to be cost-effective. Such changes will affect state air permitting programs in states that administer the federal Clean Air Act under a delegation of authority, including states in which we have operations. In the last Congress, numerous legislative measures were introduced that would have imposed restrictions or costs on greenhouse gas emissions, including from the oil and gas industry. It is uncertain whether similar measures will be introduced in, or passed by, the new Congress which convened in January 2011. In addition, the United States has been involved in international negotiations regarding greenhouse gas reductions under the United Nations Framework Convention on Climate Change. In addition, certain U.S. states or regional coalitions of states have adopted measures regulating or limiting greenhouse gases from certain sources or have adopted policies seeking to reduce overall emissions of greenhouse gases. The adoption and implementation of any international treaty, of federal or state legislation or regulations, imposing reporting obligations on, or limiting emissions of greenhouse gases from, our equipment and operations could require us to incur costs to comply with such requirements and possibly require the
21
Table of Contents
reduction or limitation of emissions of greenhouse gases associated with our operations and other sources within the industrial or energy sectors. Such legislation or regulations could adversely affect demand for the oil and natural gas we produce or the cost of transportation and processing our products. Finally, it should be noted that some scientists have concluded that increasing concentrations of greenhouse gases may produce changes in climate or weather, such as increased frequency and severity of storms, floods and other climatic events, which if any such effects were to occur, could have adverse physical effects on our exploration and production operations or associated infrastructure or disrupt markets for our products.
The federal Endangered Species Act, as amended (“ESA”), and comparable state laws, may restrict activities that affect endangered and threatened species or their habitats. Some of our facilities may be located in areas that are designated as habitat for endangered or threatened species. The designation of previously unidentified endangered or threatened species could cause us to incur additional costs or become subject to operating restrictions or bans in the affected areas.
We are subject to a number of federal and state laws and regulations, including the federal Occupational Safety and Health Act, as amended (“OSHA”), and comparable state laws, whose purpose is to protect the health and safety of workers. In addition, the OSHA hazard communication standard, the EPA community right-to-know regulations under Title III of the federal Superfund Amendment and Reauthorization Act and comparable state statutes require that information be maintained concerning hazardous materials used or produced in our operations and that this information be provided to employees, state and local government authorities and citizens. These laws and provisions of CERCLA require reporting of spills and releases of hazardous chemicals in certain situations.
We do not believe that our environmental, health and safety risks will be materially different from those of comparable U.S. companies in the oil and natural gas industry. Nevertheless, there can be no assurance that such environmental, health and safety laws and regulations will not result in a curtailment of production or material increase in the cost of production, development or exploration or otherwise adversely affect our capital expenditures, financial condition and results of operations.
In accordance with industry practice, we maintain insurance against some, but not all, potential operating losses including environmental liabilities, and some environmental risks generally are not fully insurable. For some operating risks, we may not obtain insurance if we believe the cost of available insurance is excessive relative to the risks presented. If a significant operating accident or other event occurs and is not fully covered by insurance, it could adversely affect the profitability or viability of the Company.
In addition, because we have acquired and may acquire interests in properties that have been operated in the past by others, we may be liable for environmental damage, including historical contamination, caused by such former operators. Additional liabilities could also arise from continuing violations or contamination not discovered during our assessment of the acquired properties.
Natural Gas Marketing and Transportation. Our sales of natural gas are affected by the availability, terms and cost of transportation. The price and terms for access to pipeline transportation are subject to extensive federal and state regulation. From 1985 to the present, several major regulatory changes have been implemented by Congress and the Federal Energy Regulatory Commission (“FERC”). The FERC regulates interstate natural gas transportation rates, and terms and conditions of service, which affects the marketing of natural gas that we produce, as well as the revenues we receive for sales of our natural gas. Since 1985, the FERC has endeavored to make natural gas transportation more accessible to natural gas buyers and sellers on an open and non-discriminatory basis. Beginning in 1992, the FERC issued a series of orders, beginning with Order No. 636, to implement its open access policies. As a result, the interstate pipelines’ traditional role of providing the sale and transportation of natural gas as a single service has been eliminated and replaced by a structure under which pipelines provide transportation and storage service on an open access basis to others who buy and sell natural gas. Although the FERC’s orders do not directly regulate natural gas producers, they are intended to foster increased competition within all phases of the natural gas industry.
22
Table of Contents
In 2000, the FERC issued Order No. 637 and subsequent orders, which imposed a number of additional reforms designed to enhance competition in natural gas markets. Among other things, Order No. 637 revised the FERC’s pricing policy by waiving price ceilings for short-term released capacity for a two-year experimental period, and effected changes in FERC regulations relating to scheduling procedures, capacity segmentation, penalties, rights of first refusal and information reporting.
In addition, the FERC is continually proposing and implementing new rules affecting segments of the natural gas industry, most notably interstate natural gas transmission companies, that remain subject to FERC’s jurisdiction. These initiatives may also affect the intrastate transportation of gas under certain circumstances. The stated purpose of many of these regulatory changes is to promote competition among the various sectors of the natural gas industry and these initiatives generally reflect more light-handed regulation.
The natural gas industry historically has been very heavily regulated. Therefore, we cannot provide any assurance that the less stringent regulatory approach established by the FERC under Order No. 637 will continue. However, we do not believe that any action taken will affect us in a way that materially differs from the way it affects other natural gas producers, gatherers and marketers with which we compete.
The price at which we sell natural gas is not currently subject to federal rate regulation and, for the most part, is not subject to state regulation. However, with regard to our physical sales of these energy commodities, we are required to observe anti-market manipulation laws and related regulations enforced by the FERC, the Commodity Futures Trading Commission, or the CFTC and/or the Federal Trade Commission, or the FTC. Please see below the discussion of “Other Federal Laws and Regulations Affecting Our Industry—Energy Policy Act of 2005.” Should we violate the anti-market manipulation laws and regulations, we could also be subject to related third party damage claims by, among others, sellers, royalty owners and taxing authorities.
Crude Oil Marketing and Transportation. Our sales of crude oil and condensate are currently not regulated and are made at market prices. Nevertheless, Congress could reenact price controls in the future.
Intrastate oil pipeline transportation rates are subject to regulation by state regulatory commissions. The basis for intrastate oil pipeline regulation, and the degree of regulatory oversight and scrutiny given to intrastate oil pipeline rates, varies from state to state. Insofar as effective interstate and intrastate rates are equally applicable to all comparable shippers, we believe that the regulation of oil transportation rates will not affect our operations in any way that is materially different from those of our competitors who are similarly situated.
Further, intrastate common carrier oil pipelines must provide service on a non-discriminatory basis. Under this open access standard, common carriers must offer service to all similarly situated shippers requesting service on the same terms and under the same rates. Accordingly, we believe that access to oil pipeline transportation services generally will be available to us to the same extent as to our similarly situated competitors.
Other Federal Laws and Regulations Affecting Our Industry
Energy Policy Act of 2005. On August 8, 2005, President Bush signed into law the Energy Policy Act of 2005, or the EPAct 2005. Among other matters, EPAct 2005 amends the NGA to add an anti-manipulation provision which makes it unlawful for any entity to engage in prohibited behavior prescribed by the FERC. EPAct 2005 also provides the FERC with the power to assess civil penalties of up to $1,000,000 per day for violations of the NGA and increases the FERC’s civil penalty authority under the NGPA from $5,000 per violation per day to $1,000,000 per violation per day. The civil penalty provisions are applicable to entities that engage in the sale of natural gas for resale in interstate commerce. On January 19, 2006, the FERC issued Order No. 670, a rule implementing the anti-manipulation provision of EPAct 2005. The rule makes it unlawful for any entity, directly or indirectly, in connection with the purchase or sale of natural gas subject to the jurisdiction of FERC, or the purchase or sale of transportation services subject to the jurisdiction of FERC, (1) to use or employ any device, scheme or artifice to defraud; (2) to make any untrue statement of material fact or omit to make any
23
Table of Contents
such statement necessary to make the statements made not misleading; or (3) to engage in any act, practice, or course of business that operates as a fraud or deceit upon any person. The anti-manipulation rules do not apply to activities that relate only to intrastate or other non-jurisdictional sales or gathering, but do apply to activities of gas pipelines and storage companies that provide interstate services, such as Section 311 service, as well as otherwise non-jurisdictional entities to the extent the activities are conducted “in connection with” gas sales, purchases or transportation subject to FERC jurisdiction, which now includes the annual reporting requirements under Order 704. The anti-manipulation rules and enhanced civil penalty authority reflect an expansion of FERC’s NGA enforcement authority. Should we fail to comply with all applicable FERC administered statutes, rules, regulations, and orders, we could be subject to substantial penalties and fines.
FTC Anti-Manipulation Rule. Effective November 4, 2009, pursuant to the Energy Independence and Security Act of 2007, the FTC issued a rule prohibiting market manipulation in the petroleum industry. The FTC rule prohibits any person, directly or indirectly, in connection with the purchase or sale of crude oil, gasoline or petroleum distillates at wholesale from: (a) knowingly engaging in any act, practice or course of business, including the making of any untrue statement of material fact, that operates or would operate as a fraud or deceit upon any person; or (b) intentionally failing to state a material fact that under the circumstances renders a statement made by such person misleading, provided that such omission distorts or is likely to distort market conditions for any such product. A violation of this rule may result in civil penalties of up to $1 million per day per violation, in addition to any applicable penalty under the Federal Trade Commission Act.
Additional proposals and proceedings that might affect the natural gas industry are pending before Congress, FERC and the courts. We cannot predict the ultimate impact of these or the above regulatory changes to our natural gas operations. We do not believe that we would be affected by any such action materially differently than similarly situated competitors.
Certain Technical Terms
Bbl. One stock tank barrel, or 42 U.S. gallons liquid volume, used herein in reference to oil or other liquid hydrocarbons.
BBtu. Billion Btus.
Bcf. Billion cubic feet.
Bcfe. Billion cubic feet of natural gas equivalent, determined using the ratio of one Bbl of oil or condensate to six Mcf of natural gas.
BOE. Barrel of oil equivalent.
Btu. British thermal unit, which is the heat required to raise the temperature of a one pound mass of water from 58.5 to 59.5 degrees Fahrenheit.
Developed Acreage. The number of acres which are allocated or assignable to producing wells or wells capable of production.
Development Location. A location on which a development well can be drilled.
Development Well. A well drilled within the proved area of an oil or gas reservoir to the depth of a stratigraphic horizon known to be productive.
Drilling Unit. An area specified by governmental regulations or orders or by voluntary agreement for the drilling of a well to a specified formation or formations which may combine several smaller tracts or subdivides a large tract, and within which there is usually some right to share in production or expense by agreement or by operation of law.
24
Table of Contents
Dry Hole. A well found to be incapable of producing either oil or gas in sufficient quantities to justify completion as an oil or gas well.
Estimated Future Net Revenues. Estimated future gross revenue to be generated from the production of proved reserves, net of estimated production, future development costs, and future abandonment costs, using an average first-day of the month price for the last 12 months under the new SEC rules and costs in effect as of the date of the report or estimate, without giving effect to non-property related expenses such as general and administrative expenses, debt service and future income tax expense or to depreciation, depletion and amortization.
Exploratory Well. A well drilled to find and produce oil or gas in an unproved area, to find a new reservoir in a field previously found to be productive of oil or gas in another reservoir, or to extend a known reservoir.
Finding and Development Costs. The total costs incurred for exploration and development activities (excluding exploratory drilling in progress and drilling inventories), divided by total proved reserve additions. To the extent any portion of the proved reserve additions consist of proved undeveloped reserves, additional costs would have to be incurred in order for such proved undeveloped reserves to be produced. This measure may differ from the measure used by other oil and natural gas companies.
Gross Acre. An acre in which a working interest is owned.
Gross Well. A well in which a working interest is owned.
H/B Hz. Haynesville/Bossier Shale horizontal well.
Hz. Horizontal.
Infill Drilling. Drilling for the development and production of proved undeveloped reserves that lie within an area bounded by producing wells.
Injection Well. A well which is used to place liquids or gases into the producing zone during secondary/tertiary recovery operations to assist in maintaining reservoir pressure and enhancing recoveries from the field or productive horizons.
Lease Operating Expense. All direct costs associated with and necessary to operate a producing property.
MBbls. Thousand barrels.
MBtu. Thousand Btus.
Mcf. Thousand cubic feet.
Mcfe. Thousand cubic feet of natural gas equivalent, determined using the ratio of one Bbl of oil or condensate to six Mcf of natural gas.
Mcfpd. Thousand cubic feet per day.
MMBbls. Million barrels.
MMBtu. Million Btus.
MMcf. Million cubic feet.
25
Table of Contents
MMcfe. Million cubic feet of natural gas equivalent, determined using the ratio of one Bbl of oil or condensate to six Mcf of natural gas.
Natural Gas Liquids. Liquid hydrocarbons which have been extracted from natural gas (e.g., ethane, propane, butane and natural gasoline).
Net Acres or Net Wells. The sum of the fractional working interests owned in gross acres or gross wells.
NYMEX. New York Mercantile Exchange.
Operator. The individual or company responsible for the exploration, exploitation and production of an oil or natural gas well or lease, usually pursuant to the terms of a joint operating agreement among the various parties owning the working interest in the well.
Present Value. When used with respect to oil and natural gas reserves, present value means the Estimated Future Net Revenues discounted using an annual discount rate of 10%.
Productive Well. A well that is producing oil or gas or that is capable of production.
Proved Developed Reserves. Proved reserves are expected to be recovered through existing wells with existing equipment and operating methods. Additional oil and natural gas expected to be obtained through the application of fluid injection or other improved recovery techniques for supplementing the natural forces and mechanisms of primary recovery are included as proved developed reserves only after testing by pilot project or after the operation of an installed program as confirmed through production response that increased recovery will be achieved.
Proved Reserves. Proved natural gas and oil reserves are those quantities of natural gas and oil, which, by analysis of geoscience and engineering data, can be estimated with reasonable certainty to be economically producible—from a given date forward, from known reservoirs, and under existing economic conditions, operating methods, and government regulations—prior to the time at which contracts providing the right to operate expire, unless evidence indicates that renewal is reasonably certain, regardless of whether deterministic or probabilistic methods are used for the estimation. The project to extract the hydrocarbons must have commenced or the operator must be reasonably certain that it will commence the project within a reasonable time. The area of a reservoir considered as proved includes (a) the area identified by drilling and limited by fluid contacts, if any, and (b) adjacent undrilled portions of the reservoir that can, with reasonable certainty, be judged to be continuous with it and to contain economically producible natural gas or oil on the basis of available geoscience and engineering data. In the absence of information on fluid contacts, proved quantities in a reservoir are limited by the lowest known hydrocarbons (LKH) as seen in a well penetration unless geoscience, engineering, or performance data and reliable technology establishes a lower contact with reasonable certainty. Where direct observation from well penetrations has defined a highest known oil (HKO) elevation and the potential exists for an associated gas cap, proved oil reserves may be assigned in the structurally higher portions of the reservoir only if geoscience, engineering, or performance data and reliable technology establish the higher contact with reasonable certainty. Reserves which can be produced economically through application of improved recovery techniques (including, but not limited to, fluid injection) are included in the proved classification when (a) successful testing by a pilot project in an area of the reservoir with properties no more favorable than in the reservoir as a whole, the operation of an installed program in the reservoir or an analogous reservoir, or other evidence using reliable technology establishes the reasonable certainty of the engineering analysis on which the project or program was based and (b) the project has been approved for development by all necessary parties and entities, including governmental entities. Existing economic conditions include prices and costs at which economic producibility from a reservoir is to be determined. The price shall be the average price during the 12-month period prior to the ending date of the period covered by the report, determined as an unweighted arithmetic average of the first-day-of-the-month price for each month within such period, unless prices are defined by contractual arrangements, excluding escalations based upon future conditions.
26
Table of Contents
Proved Undeveloped Reserves. Proved reserves that are expected to be recovered from new wells on undrilled acreage, or from existing wells where a relatively major expenditure is required for recompletion. Reserves on undrilled acreage shall be limited to those directly offsetting development spacing areas that are reasonably certain of production when drilled, unless evidence using reliable technology exists that establishes reasonable certainty of economic producibility at greater distances. Undrilled locations can be classified as having undeveloped reserves only if a development plan has been adopted indicating that they are scheduled to be drilled within five years, unless the specific circumstances, justify a longer time. Estimates for proved undeveloped reserves are not attributed to any acreage for which an application of fluid injection or other improved recovery technique is contemplated, unless such techniques have been proved effective by actual projects in the same reservoir or an analogous reservoir, or by other evidence using reliable technology establishing reasonable certainty.
Recompletion. The completion for production of an existing wellbore in another formation from that in which the well has previously been completed.
Royalty. An interest in an oil and natural gas lease that gives the owner of the interest the right to receive a portion of the production from the leased acreage (or of the proceeds of the sale), but generally does not require the owners to pay any portion of the costs of drilling or operating wells on the leased acreage. Royalties may be either landowner’s royalties, which are reserved by the owner of a leased acreage at the time the lease is granted, or overriding royalties, which are usually reserved by an owner of the leasehold in connection with the transfer to a subsequent owner.
Secondary Recovery. An artificial method or process used to restore or increase production from a reservoir after the primary production by the natural producing mechanism and reservoir pressure has experienced partial depletion. Gas injection and water flooding are examples of this technique.
Undeveloped Acreage. Lease acreage on which wells have not been drilled or completed to a point that would permit the production of commercial quantities of oil and natural gas regardless of whether such acreage contains proved reserves.
Waterflood. A secondary recovery operation in which water is injected into the producing formation in order to maintain reservoir pressure and force oil toward and into the producing wells.
Working Interest. An interest in an oil and natural gas lease that gives the owner of the interest the right to drill for and produce oil and natural gas on the leased acreage and requires the owner to pay a share of the costs of drilling and production operations.
Workover. To carry out remedial operations on a productive well with the intention of restoring or increasing production.
Availability of Information
Our SEC filings are available to the public over the Internet at the SEC’s web site at www.sec.gov. You may also read and copy any document we file at the SEC’s public reference room located at 100 F Street, N.E., Washington D.C. 20549. Please call the SEC at 1-800-SEC-0330 for further information on the public reference room and copy charges. Also, using our website, http://www.gmxresources.com, you can access electronic copies of documents we file with the SEC, including our annual reports on Form 10-K, quarterly reports on Form 10-Q, and current reports on Form 8-K and any amendments to those reports. Information on our website is not incorporated by reference in this report. You may also request a copy of those filings, excluding exhibits, at no cost by writing Alan Van Horn at our principal executive office, which is located at 9400 North Broadway, Suite 600, Oklahoma City, OK 73114, or by telephone or email at (405) 600-0711 or avanhorn@gmxresources.com, respectively.
27
Table of Contents
| Item 1A. | Risk Factors. |
Risks Related to GMX
During February 2011, the Company sold $200 million of 11.75% senior notes due 2019 (the “Senior Notes”) in a private placement and, concurrent with the sale of the Senior Notes, the Company issued and sold 22,173,518 shares of common stock. The following risks relate to our overall risks as of December 31, 2010, together with the risks related to these subsequent events.
Our future performance depends upon our ability to obtain capital to find or acquire additional oil and natural gas reserves that are economically recoverable.
Unless we successfully replace the reserves that we produce, our reserves will decline, eventually resulting in a decrease in oil and natural gas production and lower revenues and cash flows from operations. The business of exploring for, developing and acquiring reserves requires substantial capital expenditures. Our ability to make the necessary capital investment to maintain or expand our oil and natural gas reserves is limited by our relatively small size. In addition, approximately 49% of our total estimated proved reserves at December 31, 2010 were undeveloped. By their nature, estimates of undeveloped reserves are less certain. Recovery of such reserves will require significant capital expenditures and successful drilling operations. Further, our drilling activities are subject to numerous risks, including the risk that no commercially productive oil or natural gas reserves will be encountered. Thus, our future natural gas and oil reserves and production and, therefore, our cash flow and income are highly dependent on our success in efficiently developing and exploiting our current reserves and economically finding or acquiring additional recoverable reserves.
We have historically relied upon draws on our secured revolving credit facility to help fund our capital expenditures. The amounts we may borrow under our secured revolving credit facility are subject to a borrowing base calculation that depends on the value that our bank lenders place on our oil and natural gas properties, which in turn depends on prevailing commodity prices. Lower commodity prices may result in a reduction of our borrowing base. The most recent redetermination by our bank lenders resulted in no change to the borrowing base of $130 million. However, effective subsequent to December 31, 2010 at the closing of the offering of the Senior Notes, we have entered into an amended and restated secured revolving credit facility that resulted in a reduction of the borrowing base to $60 million. The next redetermination of our borrowing base by our bank lenders is expected to occur on or around October 1, 2011. Future redeterminations of the borrowing base are expected to occur on or before April 1 and October 1 of each year. Future reductions in our borrowing base may occur for several reasons, including if we do not successfully grow our reserves or if commodity prices further weaken. Our ability to reborrow under our secured revolving credit facility to fund our capital expenditures will be constrained by any reductions in the borrowing base, which could adversely affect our ability to operate our business.
Our secured revolving credit facility and the indenture governing the Senior Notes contain certain covenants that may inhibit our ability to make certain investments, incur additional indebtedness and engage in certain other transactions, which could adversely affect our ability to meet our future goals. If our secured revolving credit facility were to be accelerated, we may not have sufficient liquidity to repay our indebtedness in full.
Our secured revolving credit facility and the indenture governing the Senior Notes contain certain covenants that, among other things, restrict our ability to:
| • | make investments, loans and advances, pay dividends on our common stock, and other restricted payments; |
| • | incur additional indebtedness; |
| • | grant liens, other than liens created pursuant to the secured revolving credit facility and certain permitted liens; |
| • | merge, consolidate and sell all or a substantial part of our business or properties; and |
28
Table of Contents
| • | hedge and engage in forward sales or swaps of our production of crude oil or natural gas or other commodities. |
Our amended secured revolving credit facility requires us to maintain certain financial ratios, including leverage ratios such as secured senior debt to earnings before interest, taxes, depreciation, depletion and amortization expenses and adjustments for certain non-cash items (“Adjusted EBITDA”) and Adjusted EBITDA to cash interest expense (including dividends payable under the Series B Cumulative Preferred Stock). We may not be able to satisfy these covenants in the future or be able to pursue our strategies within the constraints of these covenants. A breach of a covenant contained in our debt instruments could result in an event of default under one or more of our debt instruments. Such breaches would permit the lenders under our debt instruments to declare the amounts borrowed or otherwise owing thereunder to be due and payable, and the commitments of the lenders under our secured revolving credit facility to make further extensions of credit could be terminated. Each of these circumstances could materially and adversely impair our liquidity.
All of these restrictive covenants may restrict our ability to expend or pursue our business strategies. Our ability to comply with these and other provisions of our secured revolving credit facility and the indenture governing the Senior Notes issued subsequent to year-end may be impacted by lower commodity prices, changes in economic or business conditions, results of operations or events beyond our control. The breach of any of these covenants could result in a default under our secured revolving credit facility, in which case, depending on the actions taken by the lenders thereunder or their successors or assignees, such lenders could elect to declare all amounts borrowed under our secured revolving credit facility, together with accrued interest, to be due and payable. If we were unable to repay such borrowings or interest, our lenders could proceed against their collateral. The amounts we can borrow under our secured revolving credit facility are subject to a borrowing base calculation that depends on the value that our banks place on our oil and natural gas properties, which in turn depends on prevailing commodity prices. Lower commodity prices may result in a reduction of our borrowing base. If the indebtedness under our secured revolving credit facility were to be accelerated, our 5.00% convertible senior notes due 2013, our 4.50% convertible senior notes due 2015 and the Senior Notes issued subsequent to year and would also be accelerated and we may not have sufficient liquidity to repay our indebtedness in full.
Our new program in other existing and emerging shale plays will use some relatively new horizontal drilling and completion techniques, and results for our planned exploratory drilling in these plays will be subject to drilling techniques and completion risks. As a result, our drilling results may not meet our expectations for reserves or production, and we may incur material write downs and the value of our undeveloped acreage could decline in the future.
Operations in the Bakken and Niobrara formations involve utilizing relatively new drilling and completion techniques as developed by our service providers or us in order to maximize cumulative recoveries and to generate the highest possible returns. Risks that we will face include, but are not limited to, landing our well bore in the desired drilling zone, staying in the desired drilling zone while drilling horizontally through the formation, running our casing the entire length of the well bore and being able to run tools and other equipment consistently through the horizontal well bore. Risks that we will face while completing our wells include, but are not limited to, being able to fracture stimulate the planned number of stages, being able to run tools the entire length of the well bore during completion operations and successfully cleaning out the well bore after completion of the final fracture stimulation stage.
We do not currently have experience, and we believe our service providers will have limited experience, utilizing the latest drilling and completion techniques being used specifically in the Bakken formations. The success of these drilling and completion techniques can only be evaluated over time as more wells are drilled and production profiles are established over a sufficiently long time period. If our drilling results in these formations are less than anticipated, or we are unable to execute our drilling program because of capital constraints, lease expirations, access to gathering systems and limited takeaway capacity or otherwise, and/or natural gas or oil
29
Table of Contents
prices decline, the return on our investment in these areas may not be as attractive as we anticipate and we could incur material write downs of unevaluated properties and the value of our undeveloped acreage could decline in the future.
Significant capital expenditures are required to replace our reserves, and our cash flows from operations may not be sufficient for future capital expenditures.
Our development, exploration, and acquisition activities require substantial capital expenditures. Historically, we have funded our capital expenditures through a combination of cash flows from operations and debt and equity financing. Future cash flows are subject to a number of variables, such as the level of production from existing wells, prices of oil and natural gas, and our success in developing and producing new reserves. If our cash flow from operations is not sufficient to fund our capital expenditure budget, we may not be able to access additional bank debt or other methods of financing on commercially reasonable terms to meet these requirements. If revenue were to decrease as a result of lower oil and natural gas prices or decreased production, and our access to capital were limited, we would have a reduced ability to replace our reserves which may have an adverse effect on our results of operations and financial condition. In addition to cash flow, we anticipate funding future capital expenditures with debt and equity transactions, as well as, potential asset sales and joint venture opportunities.
The loss of our Chief Executive Officer or other key personnel could adversely affect us.
We depend to a large extent on the efforts and continued employment of Ken L. Kenworthy, Jr., our Chief Executive Officer. The loss of his services could adversely affect our business. In addition, if Mr. Kenworthy resigns or we terminate him as our Chief Executive Officer, we would be in default under our secured revolving credit facility, and we would also be required to offer to repurchase all of our outstanding Series B Preferred Stock. If Mr. Kenworthy dies or becomes disabled, we would be required to offer to repurchase all of our outstanding Series B Preferred Stock, and, unless we appoint a successor acceptable to our lenders within four months of Mr. Kenworthy’s death or disability, we would also be in default under our secured revolving credit facility.
A majority of our production, revenue and cash flow from operating activities is derived from assets that are concentrated in a single geographic area.
Substantially all of our estimated proved reserves at December 31, 2010 and a similar percentage of our production during 2010 were associated with our East Texas wells. Accordingly, if the level of production from these properties substantially declines, it could have a material adverse effect on our overall production level and our revenue. Approximately 27% of our estimated proved reserves relate to wells in the Cotton Valley Sands and shallower layers as of December 31, 2010. We currently plan to allocate only a de minimis portion of our capital expenditure budget to the Cotton Valley Sands formation layer in favor of wells to develop the Haynesville/Bossier Shale formation layer. This may affect the production, revenue and cash flow we derive from further development of the Cotton Valley Sands formation layer.
Certain of our Cotton Valley Sands wells produce oil and natural gas at a relatively slow rate.
We expect that our existing Cotton Valley Sands wells and certain other wells that we plan to drill on our existing properties will produce the oil and natural gas constituting the reserves associated with those wells over a period of between 10 and 50 years. Because of the relatively slow rates of production of our wells, our reserves will be affected by long term changes in oil or natural gas prices or both, and we will be limited in our ability to anticipate any price declines by increasing rates of production. We may hedge our reserve position by selling oil and natural gas forward for limited periods of time, but we do not anticipate that, in declining markets, the price of any such forward sales will be attractive.
30
Table of Contents
Delays in development or production curtailment affecting our material properties may adversely affect our financial position and results of operations.
The size of our operations and our capital expenditure budget limits the number of wells that we can develop in any given year. Complications in the development of any single material well may result in a material adverse effect on our financial condition and results of operations. If we were to experience operational problems resulting in the curtailment of production in a material number of our wells, our total production levels would be adversely affected, which would have a material adverse effect on our financial condition and results of operations.
We have entered into long-term rig contracts, which will require a significant portion of our budgeted capital expenditures over their terms.
In 2008, we entered into agreements with Helmerich & Payne for four new FlexRigs™ for three-year terms each. As of January 1, 2011, we are obligated to pay $46.5 million over the remaining terms of these agreements. This represents a significant portion of our future capital expenditures budget. We have entered into sublease agreements for three of these FlexRigs, one of which is for the remaining balance of the term, that help to offset our obligations under these agreements, although the subleases do not cover our entire obligations under the agreements. The presence of this commitment will limit our ability to deploy our capital to other projects. Additionally, the term of these commitments restricts our flexibility to adjust the scale of our drilling efforts based on prevailing commodity prices and other industry conditions, meaning that we will continue to be obligated to pay for these rigs even if market conditions do not render their use economical for us. As such, this long-term commitment could have an adverse effect on our financial condition and results of operations.
Increased drilling in our current leased or owned properties or properties to be acquired pursuant to the Acquisitions may cause pipeline capacity problems that may limit our ability to sell natural gas and oil.
If the Haynesville/Bossier Shale continues to be successful, the amount of gas being produced in and around our core area from these new wells, as well as other existing wells, may exceed the capacity of the various gathering and intrastate or interstate transportation pipelines currently available. If this occurs, it will be necessary for new pipelines and gathering systems to be built. In addition, capital constraints could limit our ability to build intrastate gathering systems necessary to transport our gas to interstate pipelines. In such event, we might have to shut in our wells awaiting a pipeline connection or capacity and/or sell natural gas production at significantly lower prices than we currently project, which would adversely affect our results of operations.
In addition, there are crude oil and natural gas pricing and take-away risks in the Bakken and Niobrara basins. In the Bakken, producers sell their crude oil to marketers who take delivery and title at the producer’s tank battery facilities, and transport the crude to markets for resale. Crude oil is trucked from the producer’s tank batteries to both pipelines and rail facilities whose available capacity can be curtailed in the winter season due to inclement weather. There is currently 500,000 Bbls of take-away capacity which is comprised of approximately 385,000 Bbls of pipeline capacity and 115,000 Bbls of rail capacity. Third parties have announced expansion projects totaling approximately 1,134,000 Bbls of new capacity projects that may become available over the next 18 months. The average difference between the WTI crude oil price and the North Dakota Crude Oil First Purchase Price for the year ended December 31, 2010 was $9.24 per Bbl.
Natural gas produced in the Bakken has a high Btu content that requires gas processing to remove the natural gas liquids before it can be redelivered into transmission pipelines; this is done by either producers or third party processors, who currently operate a total of 15 plants. There is over 3.0 Bcf per day of natural gas take-away capacity on transmission pipelines; the capacity is currently fully subscribed, though the entire capacity is not currently being utilized. There have been announced additional capacity projects totaling over 1.0 Bcf per day that are scheduled to go in service in 2011. The natural gas prices realized by producers in the Bakken are a function of the NYMEX price, less transportation costs, plus the upgrade received from the proceeds related to the natural gas liquids that are extracted and sold separately.
31
Table of Contents
In the Niobrara, producers sell their crude oil to marketers who take delivery and title at the producer’s tank battery facilities, and transport the crude to markets for resale. Crude oil is trucked from the producer’s tank batteries to pipelines whose available capacity can be curtailed in the winter season due to inclement weather. There is currently 200,000 Bbls of pipeline take-away capacity. The average difference between the WTI crude oil price and the Wyoming Crude Oil First Purchase Price for the year ended December 31, 2010 was $11.29 per Bbl.
Natural gas produced in the Niobrara has a high Btu content that requires gas processing to remove the natural gas liquids before it can be redelivered into transmission pipelines; this is done by either producers or third party processors. There is over 6.0 Bcf per day of natural gas take-away capacity on transmission pipelines; the capacity is currently fully subscribed, though approximately 40% of the entire capacity is not currently being utilized. There have been announced additional capacity projects totaling over 2.0 Bcf per day that are scheduled to go in service in 2011. Though transmission capacity exists, extensive gas gathering infrastructure does not currently exist in the counties in which we will operate, and will need to be built by producers or pipeline companies. The natural gas prices realized by producers in the Niobrara are a function of the NYMEX price, less transportation costs, plus the upgrade received from the proceeds related to the natural gas liquids that are extracted and sold separately.
Such fluctuations and discounts could have a material adverse effect on our financial condition and results of operations.
Hedging our production may result in losses or limit potential gains.
We enter into hedging arrangements to limit our exposure to the volatility in the prices of oil and natural gas and provide stability to cash flows. As of December 31, 2010 we had entered into derivative instruments that include crude oil and natural gas swaps, collars, three-way collars, and put spreads. For 2011 and 2012, we have hedged 15.5 million MMBtu and 16.7 million MMBtu of natural gas at a weighted average floor price of $6.11 and $6.08 per MMBtu, respectively. Hedging arrangements expose us to risk of financial loss in some circumstances, including the following:
| • | production is substantially less than expected; |
| • | the counter-party to the hedging contract defaults on its contractual obligations; and |
| • | there is a change in the expected differential between the underlying price in the hedging agreement and actual prices received. |
In addition, these hedging arrangements may limit the benefit we would receive from increases in the prices for oil and natural gas. Additionally, derivatives that are not hedges must be adjusted to fair value through income. If the derivative qualifies and is designated as a cash flow hedge, the effective portion of changes in the fair value of the derivative is recognized in other comprehensive income (loss) until the hedged item is recognized in income. The ineffective portion of a derivative’s change in fair value, as measured using the dollar offset method, is immediately recognized in gain (loss) from oil and natural gas hedging activities in the statement of operations.
If it is probable the oil or natural gas sales that are hedged will not occur, hedge accounting must be discontinued, and the gain or loss reported in accumulated other comprehensive income (loss) is immediately reclassified into income. If a derivative that qualified for cash flow hedge accounting ceases to be highly effective, or is liquidated or sold prior to maturity, hedge accounting must be discontinued. The gain or loss associated with the discontinued hedges remains in accumulated other comprehensive income (loss) and is reclassified into income as the hedged transactions occur.
While the primary purpose of our derivative transactions is to protect ourselves against the volatility in oil and natural gas prices, under certain circumstances, or if hedges are deemed ineffective, discontinued, or
32
Table of Contents
terminated for any reason, we may incur substantial losses in closing out our positions, which could have a material adverse effect on our financial condition, results of operations, and cash flows. If we choose not to engage in hedging arrangements in the future, we may be more adversely affected by changes in oil and natural gas prices than our competitors, who may or may not engage in hedging arrangements.
The recent adoption of The Dodd-Frank Wall Street Reform and Consumer Protection Act, or the “Dodd-Frank Act,” could have an adverse effect on our ability to use derivative instruments to reduce the effect of commodity price and other risks associated with our business.
We use derivative instruments to manage our commodity price risk. The United States Congress recently adopted comprehensive financial reform legislation that establishes federal oversight and regulation of the over-the-counter derivatives market and entities that participate in that market. The Dodd-Frank Act requires the Commodity Futures Trading Commission (the “CFTC”) and the SEC to promulgate rules and regulations implementing the new legislation within 360 days from the date of enactment. The CFTC has also proposed regulations to set position limits for certain futures and option contracts in the major energy markets, although it is not possible at this time to predict whether or when the CFTC will adopt those rules or include comparable provisions in its rulemaking under the new legislation. The financial reform legislation may also require us to comply with margin requirements and with certain clearing and trade-execution requirements in connection with our derivative activities, although the application of those provisions to us is uncertain at this time. The financial reform legislation may also require the counterparties to our derivative instruments to spin off some of their derivatives activities to a separate entity, which may not be as creditworthy as the current counterparty.
The new legislation and any new regulations could significantly increase the cost of derivative contracts (including through requirements to post collateral, which could adversely affect our available liquidity), materially alter the terms of derivative contracts, reduce the availability of derivatives to protect against risks we encounter, reduce our ability to monetize or restructure our existing derivative contracts, and increase our exposure to less creditworthy counterparties. If we reduce our use of derivatives as a result of the legislation and regulations, our results of operations may become more volatile and our cash flows may be less predictable, which could adversely affect our ability to plan for and fund capital expenditures. Finally, the legislation was intended, in part, to reduce the volatility of oil and natural gas prices, which some legislators attributed to speculative trading in derivatives and commodity instruments related to oil and natural gas. Our revenues could therefore be adversely affected if a consequence of the legislation and regulations is to lower commodity prices. Any of these consequences could have a material adverse effect on us, our financial condition and our results of operations.
We are subject to financing and interest rate exposure risks.
Our future success depends in part on our ability to access capital markets and obtain financing on reasonable terms. Our ability to access financial markets and obtain financing on commercially reasonable terms in the future is dependent on a number of factors, many of which we cannot control, including changes in:
| • | our credit ratings; |
| • | interest rates; |
| • | the structured and commercial financial markets; |
| • | market perceptions of us or the oil and natural gas exploration and production industry; and |
| • | tax burden due to new tax laws. |
Amounts due under our secured revolving credit facility will bear interest at a variable rate. As a result, any increases in our interest rates, or our inability to access the debt or equity markets on reasonable terms, could have an adverse impact on our financial condition, results of operations and growth prospects.
33
Table of Contents
The concentration of accounts for our oil and natural gas sales, joint interest billings or hedging with third parties could expose us to credit risk.
Substantially all of our accounts receivable result from oil and natural gas sales or joint interest billings to third parties in the energy industry. The concentration of customers and joint interest owners may impact our overall credit risk in that these entities may be similarly affected by changes in economic and other conditions. Historically, we have not experienced any material credit losses on our receivables other than losses on our crude oil sales to SemGroup, L.P., which filed for bankruptcy, in 2008. Future concentration of sales of oil and natural gas commensurate with decreases in commodity prices could result in adverse effects.
In addition, our oil and natural gas swaps or other hedging contracts expose us to credit risk in the event of non-performance by counterparties. Generally, these contracts are with major investment grade financial institutions that are lenders under our secured revolving credit facility, and historically we have not experienced any credit losses. We believe that the guarantee of a fixed price for the volume of oil and natural gas hedged reduces volatility in our reported results of operations, financial position and cash flows from period to period and lowers our overall business risk. However, as also discussed along with other risks specific to hedging activities, we may be exposed to greater credit risk in the future.
Failure by us to achieve and maintain effective internal control over financial reporting in accordance with the rules of the SEC could harm our business and operating results and/or result in a loss of investor confidence in our financial reports, which could have a material adverse effect on our business.
We have evaluated our internal controls systems to allow management to report on, and our independent auditors to audit, our internal controls over financial reporting. We have performed the system and process evaluation and testing required to comply with the management certification and auditor attestation requirements of Section 404 of the Sarbanes-Oxley Act of 2002. As a public company, we are required to report, among other things, control deficiencies that constitute a “material weakness” or changes in internal controls that, or that are reasonably likely to, materially affect internal controls over financial reporting. In March 2010, we identified control deficiencies under applicable SEC and Public Company Accounting Oversight Board rules and regulations that resulted in a “material weakness” and resulted from management’s improper application of GAAP resulting in corrections to our previously reported December 31, 2008 consolidated financial statements and the financial statements for the first three quarters of 2009. Management failed to timely detect and correct errors relating to the improper application of GAAP in determining our full cost pool impairment charges, other impairment charges, and related deferred income taxes. Management also failed to timely detect and correct errors as a result of improperly including dilutive securities in our computation of diluted loss per share. We reported this “material weakness” in Part II. Item 9A—Controls and Procedures of our 2009 Form 10-K. A “material weakness” is a deficiency, or combination of deficiencies, in internal control over financial reporting, such that there is a reasonable possibility that a material misstatement of the Company’s annual or interim consolidated financial statements will not be prevented or detected on a timely basis. The report by us of a material weakness may cause investors to lose confidence in our consolidated financial statements, and our stock price may be adversely affected as a result. As a consequence of the material weakness described above, our management implemented a plan to add and reassign certain duties within the financial reporting department to ensure executive financial management has sufficient resources to properly research new and existing accounting guidance on a regular basis. As of December 31, 2010, qualified personnel had been added and duties have been reassigned to remediate these internal control deficiencies. If we fail to achieve and maintain effective internal control over financial reporting, our consolidated financial statements may be inaccurate, we may face restricted access to the capital markets and the price of our securities may be adversely affected.
The continued instability in the global financial system may have impacts on our liquidity and financial condition that we currently cannot predict.
The continued instability in the global financial system may have a material impact on our liquidity and our financial condition, and we may ultimately face major challenges if conditions in the financial markets do not
34
Table of Contents
continue to improve from their lows in early 2009. Our ability to access the capital markets or borrow money may be restricted or made more expensive at a time when we would like, or need, to raise capital, which could have an adverse impact on our flexibility to react to changing economic and business conditions and on our ability to fund our operations and capital expenditures in the future. The economic situation could have an impact on our lenders or customers, causing them to fail to meet their obligations to us, and on the liquidity of our operating partners, resulting in delays in operations or their failure to make required payments. Also, market conditions could have an impact on our natural gas and oil derivatives transactions if our counterparties are unable to perform their obligations or seek bankruptcy protection. Additionally, the current economic situation could lead to further reductions in the demand for natural gas and oil, or further reductions in the prices of natural gas and oil, or both, which could have a negative impact on our financial position, results of operations and cash flows. While the ultimate outcome and impact of the current financial situation cannot be predicted, it may have a material adverse effect on our future liquidity, results of operations and financial condition.
A portion of total proved reserves as of December 31, 2010 are undeveloped, and those reserves may not ultimately be developed.
As of December 31, 2010, approximately 49% of our estimated proved reserves were undeveloped. Recovery of undeveloped reserves requires significant capital expenditures and successful drilling. The reserve data assumes that we can and will make these expenditures and conduct these operations successfully. While we are reasonably certain of our ability to make these expenditures and to conduct these operations under existing economic conditions, these assumptions may not prove correct and we may ultimately determine the development of all, or any portion of, such proved, but undeveloped, reserves is not economically feasible.
If we are not able to replace reserves, we may not be able to sustain production.
Our future success depends largely upon our ability to find, develop or acquire additional oil and natural gas reserves that are economically recoverable. Unless we replace the reserves we produce through successful development, exploration or acquisition activities, our proved reserves and production will decline over time. In addition, approximately 49% of our total estimated proved reserves (by volume) at December 31, 2010 were undeveloped. By their nature, estimates of undeveloped reserves are less certain.
Recovery of such reserves will require significant capital expenditures, successful drilling. Our December 31, 2010 reserve estimates reflect that our production rate on current proved developed producing reserve properties will decline at annual rates of approximately 34%, 20% and 14% for the next three years. Thus, our future oil and natural gas reserves and production and, therefore, our financial condition, results of operations and cash flows are highly dependent on our success in efficiently developing our current reserves and economically discovering or acquiring additional recoverable reserves.
The closing of each of the Acquisitions under the applicable purchase agreements is subject to significant contingencies and closing conditions. The failure to complete all of the Acquisitions could adversely affect the market price of our common stock and otherwise have an adverse effect on us.
The completion of each of the Acquisitions pursuant to the applicable purchase agreements and related documentation is subject to a number of contingencies and the satisfaction of various closing conditions, and there can be no assurance that the Acquisitions will be completed.
If some of the Acquisitions are not completed, we must nonetheless pay costs related to the Acquisitions including, among others, legal, accounting and financial advisory. We also could be subject to litigation related to the failure to complete an Acquisition or other factors, which may adversely affect our business, financial results and stock price. A failed transaction may result in negative publicity and/or negative impression of us in the investment community and may affect our relationships with creditors and other business partners. Additionally, the market price of our common stock may fall to the extent that the market price reflects an expectation that all of the Acquisitions will be completed.
35
Table of Contents
The completion of the Acquisitions will result in us having exposure to producing properties and operations in the Bakken formation in Montana and North Dakota region, which makes us vulnerable to risks associated with operating in one major geographic area.
The Acquisitions consists of undeveloped lease acreage in the Niobrara formation of the DJ Basin in Wyoming and the Bakken/Sanish-Three Forks formation in Montana and North Dakota. Consequently, as a result of the Acquisitions, we will be exposed to the risks associated with operating in this geographic area, including, but not limited to, delays or interruptions of production from these wells caused by transportation capacity constraints, curtailment of production, availability of equipment, facilities, personnel or services, significant governmental regulation, natural disasters, adverse weather conditions, plant closures for scheduled maintenance or interruption of transportation of oil or natural gas produced from the wells in this area. In addition, the effect of fluctuations on supply and demand may become more pronounced within specific geographic oil and gas producing areas, which may cause these conditions to occur with greater frequency or magnify the effect of these conditions. Such delays or interruptions could have a material adverse effect on our financial condition and results of operations.
The undeveloped acreage and undeveloped proved reserves to be acquired pursuant to the Acquisitions, in addition to our already large inventory of undeveloped acreage and large percentage of undeveloped proved reserves, creates additional economic risk. Such assets may not produce oil or natural gas as projected.
Our success is dependent upon our ability to develop significant amounts undeveloped acreage and undeveloped reserves. As of December 31, 2010, approximately 49% of our total proved reserves were undeveloped. The Acquisitions consist entirely of undeveloped acreage and do not have any undeveloped proved reserves. To the extent the drilling results on our current properties or on the properties acquired and to be acquired pursuant to the Acquisitions are not as successful as we anticipate, natural gas and oil prices decline, or sufficient funds are not available to drill these locations and reserves, we may not capture the expected or projected value of these properties. In addition, delays in the development of our reserves or increases in costs to drill and develop such reserves will reduce the PV-10 value of our estimated proved undeveloped reserves and future net revenues estimated for such reserves and may result in some projects becoming uneconomic, including those on the properties to be acquired pursuant to the Acquisitions.
We may not have accurately estimated the benefits to be realized from the Acquisitions, or we may fail to identify problems associated with the assets to be acquired under the related purchase and sale agreements, either of which could cause us to incur significant losses.
The expected benefits from the Acquisitions may not be realized if our estimates of the potential production and net cash flows associated with the assets, once developed, are materially inaccurate or if we fail to identify problems or liabilities associated with the assets prior to closing. We are performing an inspection of the assets to be acquired, which we believe to be generally consistent with industry practices. However, the accuracy of our assessments of the assets and of our estimates are inherently uncertain. Our inspection will not likely reveal all existing or potential problems nor will it likely permit us to fully assess the deficiencies and potential recoverable reserves of the assets to be acquired. There could be environmental or other problems that are not necessarily observable even when the inspection is undertaken. If problems were to be identified after closing of the Acquisitions, the purchase and sale agreements relating to the Acquisitions provide for very limited, recourse against the sellers.
We have no experience drilling wells in the Bakken or Niobrara shale formations and less information regarding reserves and decline rates in the Bakken and Niobrara formations than in other areas of our operations.
We have no exploration or development experience in the Bakken or Niobrara shale formations. Other operators in the these formations and the related Williston and DJ basins have significantly more experience in the drilling of Bakken and Niobrara wells, including the drilling of horizontal wells. As a result, we have less
36
Table of Contents
information with respect to the ultimate recoverable reserves and the production decline rate in the Bakken and Niobrara formations than we have in other areas in which we operate.
We may not complete additional acquisitions in areas with exposure to oil, condensate and natural gas liquids.
If we are unable to complete additional Niobrara or Bakken shale acquisitions, this may detract from our efforts to realize our growth strategy in crude oil and liquids-rich plays. Additionally, we may be unable to find or consummate other opportunities in these areas or in other areas with similar exposure to oil, condensate and natural gas liquids on similar terms or at all.
Development and exploration drilling may not result in commercially productive reserves.
Drilling activities are subject to many risks, including the risk that commercially productive reservoirs will not be encountered. We cannot provide assurance that new wells drilled by us will be productive or that we will recover all or any portion of our investment in such wells. The seismic data and other technologies we use do not allow us to know conclusively prior to drilling a well that oil or natural gas is present or may be economically recovered and/or produced. Drilling for oil and natural gas often involves unprofitable efforts, not only from dry wells but also from wells that are productive but do not produce sufficient net reserves to return a profit at then-realized prices after deducting drilling, operating and other costs. The cost of drilling, completing and operating a well is often uncertain, and cost factors can adversely affect the economics of a project. Further, our drilling operations may be curtailed, delayed or cancelled as a result of numerous factors, including:
| • | unexpected drilling conditions; |
| • | title problems; |
| • | pressure or lost circulation in formations; |
| • | equipment failures or accidents; |
| • | adverse weather conditions; |
| • | compliance with environmental and other governmental requirements; and |
| • | increases in the cost of, or shortages or delays in the availability of, drilling rigs, equipment and services. |
If, for any reason, we are unable to economically recover reserves through our exploration and drilling activities, our results of operations, cash flows, growth and reserve replenishment may be materially affected.
Properties that we acquire may not produce as projected and we may be unable to accurately predict reserve potential, identify liabilities associated with the properties or obtain protection from sellers against such liabilities.
Acquisitions of producing and undeveloped properties have been an important part of our historical growth. We expect acquisitions will also contribute to our future growth. Successful acquisitions require an assessment of a number of factors, including recoverable reserves, exploration or development potential, future oil and natural gas prices, operating costs, and potential environmental and other liabilities. We perform an engineering, geological and geophysical review of the acquired properties, the scope of which review we believe is generally consistent with industry practices. However, such assessments are inexact and their accuracy is inherently uncertain for a number of reasons. For instance, in connection with our assessments, such a review may not permit us to become sufficiently familiar with the properties to fully assess their deficiencies and capabilities or other liabilities associated therewith. We do not physically inspect every well. Even when we inspect a well, we do not always discover structural, subsurface and environmental problems that may currently exist or arise in the future. Our review prior to signing a definitive purchase agreement may be even more limited. Often we are not entitled to contractual indemnification for pre-closing liabilities, including environmental liabilities associated with acquired properties.
37
Table of Contents
Normally, we acquire interests in properties on an “as is” basis with limited remedies for breaches of representations and warranties. As a result, significant unknown liabilities, including environmental liabilities, may exist, and we may experience losses due to title defects in acquisitions for which we have limited or no contractual remedies or insurance coverage. In addition, we may acquire oil and natural gas properties that contain economically recoverable reserves that are less than predicted. Thus, liabilities and uneconomically feasible oil and natural gas recoveries related to our acquisitions of producing and undeveloped properties may have a material adverse effect on our results of operations and reserve growth.
If the third parties we rely on for gathering and distributing our oil and natural gas are unable to meet our needs for such services and facilities, our future exploration and production activities could be adversely affected.
The marketability of our production depends upon the proximity of our reserves to, and the capacity of, third-party facilities and third-party services, including oil and natural gas gathering systems, pipelines, trucking or terminal facilities, and refineries or processing facilities. Such third parties are subject to federal and state regulation of the production and transportation of oil and natural gas. If such third parties are unable to comply with such regulations and we are unable to replace such service and facilities providers, we may be required to shut-in producing wells or delay or discontinue development plans for our properties. A shut-in, delay or discontinuance could adversely affect our financial condition.
Our undeveloped acreage must be drilled before lease expiration, generally within three to five years, in order to hold the acreage by production. In the highly competitive market for acreage, failure to drill sufficient wells to hold acreage will result in a substantial lease renewal cost, or if renewal is not feasible, loss of our lease and prospective drilling opportunities.
Unless production is established within the spacing units covering the undeveloped acres on which some of the locations are identified, the leases for such acreage will expire. As of December 31, 2010, we had leases representing 3,406 net acres expiring in 2011, 1,298 net acres expiring in 2012 and 2,231 net acres expiring in 2013. In addition, substantially all of the acreage we have acquired and expect to acquire in connection with our pending Acquisitions described under “Item 1. Business” will expire in the next three to five years. The cost to renew such leases may increase significantly, and we may not be able to renew such leases on commercially reasonable terms or at all. In addition, on certain portions of our acreage, third-party leases become immediately effective if our leases expire. As such, our actual drilling activities may differ materially from our current expectations, which could adversely affect our business.
We may incur losses as a result of title defects in the properties in which we invest.
As is customary in the industry, we do not generally incur the expense of retaining lawyers to examine title to the mineral interest when acquiring oil and gas leases or interests. Rather, we rely on the judgment of oil and gas lease brokers or landmen who perform the fieldwork in examining records in the appropriate governmental office before attempting to acquire a lease in a specific mineral interest. Prior to drilling an oil and gas well, it is the customary practice in our industry for the operator of the well to obtain a preliminary title review to ensure there are no obvious defects in title to the well. Frequently, as a result of such examinations, certain curative work must be done to correct defects in the marketability of title, and such curative work entails expense. Our failure to cure any title defects may adversely impact our ability in the future to increase production and reserves. There is no assurance that we will not suffer a monetary loss from title defects or title failure. Additionally, undeveloped acreage has greater risk of title defects than developed acreage. If there are any title defects or defects in assignment of leasehold rights in properties in which we hold an interest, we will suffer a financial loss.
We may have difficulty managing any future growth and the related demands on our resources.
We have experienced growth in the past through the expansion of our drilling program and through acquisitions. Any future growth may place a significant strain on our financial, technical, operational and
38
Table of Contents
administrative resources. We may experience difficulties in finding and retaining additional qualified personnel. In an effort to meet the demands of our planned activities in 2011 and thereafter, we may be required to supplement our staff with contract and consultant personnel until we are able to hire new employees. As a result, we may be unable to fully execute our growth plans, including acquiring new properties in our core area and drilling new and existing wells in our core area, all of which could have a material adverse effect on our growth, results of operations and our ability to pay the principal, premium, if any, and interest on our long-term indebtedness, including the Senior Notes.
Our operations in North Dakota, Montana and Wyoming could be adversely affected by abnormally poor weather conditions.
Our operations in North Dakota, Montana and Wyoming will be conducted in areas subject to extreme weather conditions and often in difficult terrain. Primarily in the winter and spring, our operations are often curtailed because of cold, snow and wet conditions. Unusually severe weather could further curtail these operations, including drilling of new wells or production from existing wells, and depending on the severity of the weather, could have a material adverse effect on our business, financial condition and results of operations.
Our working capital could be adversely affected if we enter into derivative instruments that require cash collateral.
The use of derivatives may, in some cases, require the posting of cash collateral with counterparties (i.e. margin requirements). Although we currently do not, and do not anticipate that we will in the future, enter into derivative transactions that require an initial deposit of cash collateral, our working capital, and by extension, our growth, could be impacted if we enter into derivative transactions that require cash collateral, and if commodity prices move in a manner adverse to us, we may be required to meet margin calls. Future collateral requirements are uncertain and will depend on arrangements with our counterparties and highly volatile oil and natural gas prices.
Risks Related to the Oil and Natural Gas Industry
Oil and natural gas prices have a material impact on us.
Lower oil and natural gas prices would adversely affect our financial position, financial results, cash flows, access to capital and ability to grow. Our revenues, operating results, profitability, future rate of growth and the carrying value of our oil and natural gas properties depend primarily upon the prices we receive for the oil and natural gas we sell. Prices also affect the amount of cash flow available for capital expenditures and our ability to borrow money or raise additional capital. The amount we can borrow under our secured revolving credit facility is subject to periodic redeterminations based on the valuation by our banks of our oil and natural gas reserves, which will depend on oil and natural gas prices used by our banks at the time of determination. In addition, we may have full-cost ceiling test write-downs in the future if prices fall.
Historically, the markets for oil and natural gas have been volatile, and they are likely to continue to be volatile. Wide fluctuations in oil and natural gas prices may result from relatively minor changes in the supply of and demand for oil and natural gas, market uncertainty and other factors that are beyond our control, including:
| • | worldwide and domestic supplies of oil and natural gas; |
| • | weather conditions; |
| • | commodity processing, gathering, and transportation availability and the availability of refining capacity; |
| • | the level of consumer demand for oil and natural gas; |
| • | the price and availability of alternative fuels; |
39
Table of Contents
| • | the availability of pipeline capacity; |
| • | the price and level of foreign imports of oil and natural gas; |
| • | domestic and foreign governmental regulations and taxes; |
| • | the ability of the members of the Organization of Petroleum Exporting Countries to agree to and maintain oil price and production controls; |
| • | financial and commercial market uncertainty; |
| • | political instability or armed conflict in oil and natural gas producing regions; and |
| • | the overall global economic environment. |
These factors and the volatility of the energy markets make it extremely difficult to predict future oil and natural gas price movements with any certainty. Declines in oil and natural gas prices would not only reduce revenue, but could reduce the amount of oil and natural gas that we can produce economically and, as a result, could have a material adverse effect on our financial condition, results of operations and reserves. Further, oil and natural gas prices do not necessarily move in tandem. Because approximately 98% of our reserves at December 31, 2010 are natural gas reserves, we are more affected by movements in natural gas prices.
Estimates of proved natural gas and oil reserves and present value of proved reserves are not precise.
There are numerous uncertainties inherent in estimating quantities of proved oil and natural gas reserves and their values, including many factors beyond our control. The reserve data included in this report represent only estimates. Reserve engineering is a subjective process of estimating underground accumulations of oil and natural gas that cannot be measured in an exact manner. The accuracy of any reserve estimate is a function of the quality of available data, the precision of the engineering and geological interpretation, and judgment. As a result, estimates of different engineers often vary. The estimates of reserves, future cash flows and present value are based on various assumptions, including those prescribed by the SEC, and are inherently imprecise. Actual future production, cash flows, taxes, development expenditures, operating expenses and quantities of recoverable oil and natural gas reserves may vary substantially from our estimates and any significant variations in the interpretations or assumptions underlying our estimates or changes of conditions (e.g., economic growth or regulation) could cause the estimated quantities and net present value of our reserves to differ materially. In addition, we may adjust estimates of proved reserves to reflect production history, results of exploration and developmental drilling, prevailing oil and natural gas prices and other factors, many of which are beyond our control. Furthermore, the use of a 10% discount factor for reporting purposes may not necessarily represent the most appropriate discount factor, given actual interest rates and risks to which our business or the oil and natural gas industry in general are subject.
Quantities of proved reserves are estimated based on economic conditions, including average oil and natural gas prices calculated at the date of assessment. A reduction in oil and natural gas prices not only would reduce the value of any proved reserves, but also might reduce the amount of oil and natural gas that could be economically produced, thereby reducing the quantity of reserves. Our proved reserves are estimated using assumptions of decline rates based on historic experience. Due to the limited production history we have in our core area, our initial assumptions of decline rates are subject to modification as we gain more experience in operating our wells. Our reserves and future cash flows may be subject to revisions, based upon changes in economic conditions, including oil and natural gas prices, as well as due to production results, results of future development, operating and development costs, and other factors. Downward revisions of our reserves could have an adverse effect on our financial condition and operating results.
At December 31, 2010, approximately 49% of our estimated proved reserves (by volume) were undeveloped. Estimates of proved undeveloped reserves are less certain than estimates of proved developed reserves. Recovery of proved undeveloped reserves requires significant capital expenditures and successful
40
Table of Contents
drilling operations. The reserve data assumes that we will make significant capital expenditures to develop our reserves. Although we have prepared estimates of these oil and natural gas reserves and the costs associated with development of these reserves in accordance with SEC regulations, actual capital expenditures will likely vary from estimated capital expenditures, development may not occur as scheduled and actual results may not be as estimated.
The present value of future net revenues from our proved reserves will not necessarily be the same as the current market value of our estimated oil and natural gas reserves.
You should not assume that the present value of future net revenues from our proved reserves is the current market value of our estimated oil and natural gas reserves. In accordance with current SEC requirements, we have based the estimated discounted future net revenues from our proved reserves on the 12-month unweighted arithmetic average of the first-day-of-the-month price for the preceding twelve months without giving effect to derivative transactions. Actual future net revenues from our oil and natural gas properties will be affected by factors such as:
| • | actual prices we receive for oil and natural gas; |
| • | actual cost of development and production expenditures; |
| • | the amount and timing of actual production; and |
| • | changes in governmental regulations or taxation. |
The timing of both our production and our incurrence of expenses in connection with the development and production of oil and natural gas properties will affect the timing and amount of actual future net revenues from proved reserves, and thus their actual present value. In addition, the 10% discount factor we use when calculating discounted future net revenues may not be the most appropriate discount factor based on interest rates in effect from time to time and risks associated with us or the oil and natural gas industry in general. Actual future prices and costs may differ materially from those used in the present value estimates included in this report. If oil prices decline by $15.00 per Bbl, and natural gas prices decline by $0.50 per Mcf, then our PV-10 as of December 31, 2010 would decrease by approximately $80 million.
We may incur write-downs of the net book values of our oil and natural gas properties that would adversely affect our equity and earnings.
The full cost method of accounting, which we follow, requires that we periodically compare the net book value of our oil and natural gas properties, including related deferred income taxes, to a calculated “ceiling.” The ceiling is the estimated after-tax present value of the future net revenues from proved reserves using a 10% annual discount rate and using constant prices and costs. Any excess of net book value of oil and natural gas properties is written off as an expense and may not be reversed in subsequent periods even though higher oil and natural gas prices may have increased the ceiling in these future periods. The full cost ceiling is evaluated at the end of each quarter using the SEC prices for oil and natural gas in effect at that date as adjusted for our derivative positions deemed “cash flow hedge positions.” A write-off constitutes a charge to earnings and reduces equity, but does not impact our cash flows from operating activities. Once incurred, a write-down of oil and natural gas properties is not reversible at a later date. On December 31, 2008, we recorded an impairment charge of $192.7 million on our oil and natural gas properties due to a ceiling test write-down based on a natural gas price of $5.71 per MMBtu and a crude oil price of $44.60 per barrel at December 31, 2008. On March 31, 2009, we recorded an additional impairment charge of $138.1 million on our oil and natural gas properties due to a ceiling test write-down based on a natural gas price of $3.63 per MMBtu and a crude oil price of $49.64 per barrel at March 31, 2009. On December 31, 2009, we recorded an impairment charge of $50.1 million on our oil and natural gas properties due to a ceiling test write-down based on a natural gas price of $3.87 per MMBtu and a crude oil price of $61.19 per barrel. In connection with our December 31, 2010 financial statements, we recorded an impairment charge of approximately $132.8 million on our oil and natural gas properties due to a ceiling test writedown
41
Table of Contents
based on a natural gas price of $4.38 per MMBtu and a crude oil price of $79.43 per barrel. The 2010 impairment charge was a result of our decision to remove approximately 290 net proved undrilled Cotton Valley locations that had proved reserves totaling 219.6 Bcfe at December 31, 2009. Due to the drilling opportunities we have in the Haynesville/Bossier Shale and will have in the Bakken and Niobrara Formations, we do not believe we would develop our Cotton Valley Sands proved undeveloped locations within the required five-year timeframe under SEC requirements for including estimated proved reserves. In addition, future development in the Cotton Valley Sands will be on a horizontal basis. If commodity prices continue to remain low, we may be subject to additional ceiling test write-downs. Future write-offs may occur that would have a material adverse effect on our net income in the period taken, but would not affect our cash flows. Even though such write-offs do not affect cash flow, they could have an adverse effect on our financial conditions and results of operations.
Operational risks in our business are numerous and could materially impact us.
Our operations involve operational risks and uncertainties associated with drilling for, and production and transportation of, oil and natural gas, all of which can affect our operating results. Our operations may be materially curtailed, delayed or canceled as a result of numerous factors, including:
| • | the presence of unanticipated pressure or irregularities in formations; |
| • | accidents; |
| • | title problems; |
| • | weather conditions (including any caused by climate change); |
| • | compliance with governmental requirements; |
| • | shortages or delays in the delivery of equipment; |
| • | injury or loss of life; |
| • | severe damage to or destruction of property, natural resources and equipment; and |
| • | pollution or other environmental damage. |
| • | clean-up responsibilities; |
| • | regulatory investigation and penalties; |
| • | other losses resulting in suspension of our operations; and |
| • | injunctions or other proceedings that suspend, limit or prohibit operations. |
In accordance with customary industry practice, we maintain insurance against some, but not all, of the risks described above with a general liability and commercial umbrella policy. We do not maintain insurance for damages arising out of exposure to radioactive material. Even in the case of risks against which we are insured, our policies are subject to limitations and exceptions that could cause us to be unprotected against some or all of the risk. The occurrence of an uninsured loss could have a material adverse effect on our financial condition or results of operations
Competition in the oil and natural gas industry is intense, and many of our competitors have greater financial and other resources than we do.
We compete with major integrated oil and natural gas companies and independent oil and natural gas companies in all areas of operation. In particular, we compete for property acquisitions and for the equipment and labor required to operate and develop these properties. Most of our competitors have substantially greater financial and other resources than we have. In addition, larger competitors may be able to absorb the burden of any changes in federal, state and local laws and regulations more easily than we can, which would adversely
42
Table of Contents
affect our competitive position. These competitors may be able to pay more for exploratory prospects and may be able to define, evaluate, bid for and purchase a greater number of properties and prospects than our financial or other resources permit. Further, our competitors may have technological advantages and may be able to implement new technologies more rapidly than we can. Our ability to explore for natural gas and oil prospects and to acquire additional properties in the future will depend on our ability to conduct operations, to evaluate and select suitable properties and to consummate transactions in this highly competitive environment.
We may encounter difficulty in obtaining equipment and services.
Higher oil and natural gas prices and increased oil and natural gas drilling activity generally stimulate increased demand and result in increased prices and unavailability for drilling rigs, crews, associated supplies, equipment and services. While we have recently been successful in acquiring or contracting for services, we could experience difficulty obtaining drilling rigs, crews, associated supplies, equipment and services in the future. These shortages could also result in increased costs or delays in timing of anticipated development or cause interests in oil and natural gas leases to lapse. We cannot be certain that we will be able to implement our drilling plans or do so at costs that will be as estimated or acceptable to us.
Due to the recent increase of drilling Haynesville/Bossier Shale wells in and around our core area, demand for higher pressure downhole pipe and other equipment necessary for drilling these wells has been very high. If we are unable to obtain this equipment in a timely manner, the implementation of our Haynesville/Bossier Shale drilling plans could be delayed.
Governmental regulations could adversely affect our business.
Our business is subject to various federal, state and local laws and regulations on taxation, the exploration for and development, production and marketing of oil and natural gas, and environmental and safety matters. Many laws and regulations require drilling permits and govern the spacing of wells, rates, health of production, prevention of waste and pollution and other matters. These laws and regulations have increased the costs of our operations. In addition, these laws and regulations, and any others that are passed by the jurisdictions where we have production, could limit the total number of wells drilled or the allowable production from successful wells, which could limit our revenues.
Laws and regulations relating to our business frequently change, and future laws and regulations, including changes to existing laws and regulations, could adversely affect our business.
In particular and without limiting the foregoing, various tax proposals under consideration could increase our tax burden. For example, President Obama’s budget proposal for the fiscal year 2011, released on February 1, 2010, recommended the elimination of certain key U.S. federal income tax preferences currently available to oil and gas exploration companies. These proposed changes include, but are not limited to, (i) repeal of the percentage of depletion allowance for oil and gas properties, (ii) the elimination of current deductions for intangible drilling and development costs, (iii) the elimination of the deduction for United Stated production activities, and (iv) the increase of the amortization period from two years to seven years for geophysical costs paid or incurred in connection with the exploration for, or development of, oil or gas within the United States. In addition, proposals under consideration relating to the over-the-counter derivatives market could adversely affect our hedging program related to our natural gas and oil production, since we rely upon the over-the-counter derivatives market for our hedging activities.
Oil and natural gas drilling and production operations can be hazardous and may expose us to environmental or other liabilities that could adversely affect our business.
In the event of a release of oil, natural gas, well fluids, air emissions, or other substances from our operations into the environment, we could incur liability for any and all consequences of such release, including
43
Table of Contents
personal injuries, property damage, cleanup costs, damages to natural resources including drinking water resources, and governmental fines or other sanctions. We could potentially discharge these materials into the environment in several ways, including:
| • | from a well or drilling equipment at a drill site; |
| • | formations with abnormal pressures; |
| • | uncontrollable flows of oil, natural gas, brine or well fluids; |
| • | high pressures and mechanical difficulties related to our drilling operations such as stuck pipes, collapsed casings and separated cables; |
| • | leakage from gathering systems, pipelines, transportation facilities and storage tanks; |
| • | damage to oil and natural gas wells resulting from accidents during normal operations; |
| • | blowouts, fires, cratering and explosions; and |
| • | other environmental hazards and risks. |
In addition, because we may acquire interests in or lease properties that have been owned or operated in the past by others, we may be liable for environmental damage, including historical contamination, caused by such former owners or operators. Additional liabilities could also arise from continuing violations of environmental laws and regulations or contamination that we have not yet discovered relating to the acquired properties or any of our other properties. In addition, government regulators could impose additional requirements relating to insurance, bonding or financial assurance, which could increase the costs of our operations.
Although we maintain liability insurance coverage for liabilities from pollution, environmental risks generally are not fully insurable and our insurance may not be adequate to cover any or all resulting losses or liabilities. Moreover, in the future, we may not be able to obtain any such insurance on commercially reasonable terms. The occurrence of, or failure by us to obtain or maintain adequate insurance coverage for, any of the events listed above could have a material adverse effect on our financial condition and results of operations, as well as our growth, exploration, and employee recruitment activities.
To the extent we incur any environmental liabilities, they could adversely affect our results of operations or financial condition.
Environmental liabilities could adversely affect our operating results.
We are subject to numerous environmental laws and regulations that obligate us to prevent or manage pollution, to install and maintain pollution controls and to clean up various sites at, from or to which regulated materials may have been disposed of or released. Under these laws and regulations, we are required to obtain permits from governmental authorities for certain of our operations. We cannot assure you that we have been or will be at all times in complete compliance with all environmental laws, regulations and permits. If we violate or fail to comply with these laws, regulations or permits, we could be fined or otherwise sanctioned by regulators. We could also be held liable for any and all consequences arising out of human exposure to such substances or other environmental damage. In addition, it is not possible for us to estimate reliably the amount and timing of all future expenditures related to environmental matters because of:
| • | the uncertainties in estimating clean up or compliance costs; |
| • | the potential discovery of additional contamination or contamination more widespread than previously thought; |
| • | the uncertainty in quantifying liability under environmental laws, including those that impose joint and several liability on all potentially responsible parties; and |
44
Table of Contents
| • | the uncertainty of potential future changes to environmental laws and regulations and their enforcement. |
Climate change legislation or regulations restricting emissions of “greenhouse gases” could result in increased operating costs and reduced demand for the natural gas and other hydrocarbon products that we transport, store or otherwise handle in connection with our exploration, production, transportation, storage and midstream services.
On December 15, 2009, the EPA published its findings that emissions of carbon dioxide, methane and other greenhouse gases present an endangerment to public health and the environment because emissions of such gases are, according to the EPA, contributing to warming of the earth’s atmosphere and other climatic changes. These findings allow the EPA to adopt and implement regulations that would restrict emissions of greenhouse gases under existing provisions of the federal Clean Air Act. Accordingly, the EPA recently adopted two sets of regulations addressing greenhouse gas emissions under the Clean Air Act. The first limits emissions of greenhouse gases from motor vehicles beginning with the 2012 model year. EPA has asserted that these final motor vehicle greenhouse gas emission standards trigger Clean Air Act construction and operating permit requirements for stationary sources, commencing when the motor vehicle standards take effect on January 2, 2011. On June 3, 2010, EPA published its final rule to address the permitting of greenhouse gas emissions from stationary sources under the Prevention of Significant Deterioration (“PSD”) and Title V permitting programs. This rule “tailors” these permitting programs to apply to certain stationary sources of greenhouse gas emissions in a multi-step process, with the largest sources first subject to permitting. It is widely expected that facilities required to obtain PSD permits for their greenhouse gas emissions will be required to also reduce those emissions according to “best available control technology” standards for greenhouse gases that have yet to be developed. Any regulatory or permitting obligation that limits emissions of greenhouse gases could require us to incur costs to reduce emissions of greenhouse gases associated with our operations and also adversely affect demand for the oil and natural gas that we produce.
In addition, on October 30, 2009, the EPA published a final rule requiring the reporting of greenhouse gas emissions from specified large greenhouse gas sources in the United States on an annual basis, beginning in 2011 for emissions occurring after January 1, 2010. On November 9, 2010, the EPA expanded its greenhouse gas reporting rule to include onshore oil and natural gas production, processing, transmission, storage, and distribution facilities. Under these rules, reporting of greenhouse gas emissions from such facilities, including many of our facilities, is required on an annual basis, with reporting beginning in 2012 for emissions occurring in 2011.
In June 2009, the United States House of Representatives passed the “American Clean Energy and Security Act of 2009,” or “ACESA,” which would establish an economy-wide cap on emissions of greenhouse gases in the United States and would require most sources of greenhouse gas emissions to obtain and hold “allowances” corresponding to their annual emissions of greenhouse gases. Similar legislation may be considered by Congress in the future. Additionally, more than one-third of the states have already taken legal measures to reduce emissions of greenhouse gases, primarily through the planned development of greenhouse gas emission inventories and/or regional greenhouse gas cap and trade programs. The passage of legislation that limits emissions of greenhouse gases from our equipment and operations could require us to incur costs to reduce the greenhouse gas emissions from our own operations, and it could also adversely affect demand for the oil and natural gas that we produce.
Some have suggested that one consequence of climate change could be increased severity of extreme weather, such as increased hurricanes and floods. If such effects were to occur, our operations could be adversely affected in various ways, including damages to our facilities from powerful winds or rising waters, or increased costs for insurance.
Another possible consequence of climate change is increased volatility in seasonal temperatures. The market for natural gas is generally improved by periods of colder weather and impaired by periods of warmer weather,
45
Table of Contents
so any changes in climate could affect the market for the fuels that we produce. Despite the use of the term “global warming” as a shorthand for climate change, some studies indicate that climate change could cause some areas to experience temperatures substantially colder than their historical averages. As a result, it is difficult to predict how the market for our fuels could be affected by increased temperature volatility, although if there is an overall trend of warmer temperatures, it would be expected to have an adverse effect on our business.
We are subject to complex laws and regulations, including environmental and safety regulations, which can adversely affect the cost, manner and feasibility of doing business.
We are subject to certain federal, state, and local laws and regulations relating to the exploration for, and development, production and transportation of, oil and natural gas, as well as environmental and safety matters. We cannot be certain that existing laws or regulations, as currently interpreted or reinterpreted in the future, or future laws or regulations will not harm our business, results of operations and financial condition. We may be required to make large and unanticipated capital expenditures to comply with environmental and other governmental regulations such as:
| • | land use restrictions; |
| • | drilling bonds and other financial responsibility requirements; |
| • | spacing of wells; |
| • | reporting or other limitations on emissions of greenhouse gases; |
| • | unitization and pooling of properties; |
| • | habitat and endangered species protection, reclamation and remediation, and other environmental protection; |
| • | well stimulation processes; |
| • | CO2 pipeline requirements; |
| • | produced water disposal; |
| • | safety precautions; |
| • | operational reporting; and |
| • | taxation. |
Under these laws and regulations, we could be liable for:
| • | personal injuries; |
| • | property and natural resource damages; |
| • | oil spills and releases or discharges of hazardous materials; |
| • | well reclamation costs; |
| • | remediation and clean-up costs and other governmental sanctions, such as fines and penalties; |
| • | other environmental damages; and |
| • | reporting or other issues arising from greenhouse gas emissions. |
Our operations could be significantly delayed or curtailed and our costs of operations could significantly increase as a result of regulatory requirements or restrictions. We are unable to predict the ultimate cost of compliance with these requirements or their effect on our operations.
46
Table of Contents
Potential legislative and regulatory actions could increase our costs, reduce our revenue and cash flow from oil and natural gas sales, reduce our liquidity or otherwise alter the way we conduct our business.
Pending federal budget proposals released by the White House on February 26, 2009 and February 1, 2010 would potentially increase and accelerate the payment of federal income taxes of independent producers of oil and natural gas. Proposals that would significantly affect us include, but are not limited to, repealing the expensing of intangible drilling costs, repealing the percentage depletion allowance, repealing the manufacturing tax deduction for oil and natural gas companies and increasing the amortization period of geological and geophysical expenses. Additionally, the Senate Bill version of the Oil Industry Tax Break Repeal Act of 2009, introduced on April 23, 2009, and the Senate Bill version of the Energy Fairness for America Act, introduced on May 20, 2009, include many of the proposals outlined in the federal budget proposals. It is unclear, however, whether any such changes will be enacted or how soon such changes could be effective. The passage of any legislation as a result of the budget proposals, either Senate Bill or any other similar change in U.S. federal income tax law could eliminate certain tax deductions that are currently available with respect to oil and natural gas exploration and development, and any such change (i) would make it more costly for us to explore for and develop our oil and natural gas resources and (ii) could negatively affect our financial condition, results of operation and cash flows.
The U.S. Congress is considering measures aimed at increasing the transparency and stability of the over-the-counter (“OTC”) derivative markets and preventing excessive speculation. We maintain an active price and basis protection hedging program related to the oil and natural gas we produce.
Additionally, we have used the OTC market exclusively for our oil and natural gas derivative contracts and rely on our hedging activities to manage the risk of low commodity prices and to predict with greater certainty the cash flow from our hedged production. Proposals being considered would impose clearing and standardization requirements for all OTC derivatives and restrict trading positions in the energy futures markets. Such changes would likely materially reduce our hedging opportunities and could negatively affect our revenues and cash flow during periods of low commodity prices.
Federal, state and local legislative and regulatory initiatives relating to hydraulic fracturing could result in increased costs and additional operating restrictions or delays in the production of oil and natural gas, including from the developing shale plays. A decline in drilling of new wells and related servicing activities caused by these initiatives could adversely affect our financial position, results of operations and cash flows.
Bills have been introduced in the previous U.S. Congress to regulate hydraulic fracturing operations and related injection of fracturing fluids and propping agents used in fracturing fluids by the oil and natural gas industry under the federal Safe Drinking Water Act (“SDWA”) and to require the disclosure of chemicals used in the hydraulic fracturing process under the SDWA, Emergency Planning and Community Right-to-Know Act (“EPCRA”), or other authority. Hydraulic fracturing is an important and commonly used process in the completion of unconventional oil and natural gas wells in shale, coalbed and tight sand formations. We use hydraulic fracturing in many of our wells. Sponsors of such bills have asserted that chemicals used in the fracturing process could adversely affect drinking water supplies, surface waters, and other natural resources, and threaten health and safety. During the last Congress, the former Chairman of the House Energy and Commerce Committee has initiated an investigation of the potential impacts of hydraulic fracturing, which has involved seeking information about fracturing activities and chemicals from certain companies in the oil and gas sector. It is possible that similar measures will be considered in the recently convened 112th Congress. In addition, in March 2010, the EPA announced its intention to conduct a comprehensive research study on the potential adverse impacts that hydraulic fracturing may have on water quality and public health. Certain states, including Wyoming, have also considered or imposed reporting obligations relating to the use of hydraulic fracturing techniques.
47
Table of Contents
There has been increasing public controversy regarding hydraulic fracturing with regard to use of fracturing fluids, impacts on drinking water supplies, use of waters, and the potential for impacts to surface water, groundwater and the environment generally. A number of lawsuits and enforcement actions have been initiated in Texas and other states implicating hydraulic fracturing practices. Additional legislation or regulation could make it easier for third parties opposing the hydraulic fracturing process to initiate legal proceedings based on allegations that specific chemicals used in the fracturing process could adversely affect groundwater.
These proposals may lead to additional levels of regulation at the federal, state or local level that could cause operational delays or increased operating costs and could result in additional regulatory burdens that could make it more difficult to perform hydraulic fracturing and increase our costs of compliance and doing business.
Increased regulation and attention given to the hydraulic fracturing process could lead to greater opposition, including litigation, to oil and gas production activities using hydraulic fracturing techniques. Additional legislation or regulation could also lead to operational delays or increased operating costs in the production of crude oil and natural gas, including from the developing shale plays, incurred by our customers or could make it more difficult to perform hydraulic fracturing. If these legislative and regulatory initiatives cause a material decrease in the drilling of new wells and related servicing activities, our business and profitability could be materially impacted.
We are responsible for the decommissioning, abandonment and reclamation costs for our facilities, which could decrease funds available for servicing our debt obligations and other operating expenses.
We are responsible for compliance with all applicable laws and regulations regarding the decommissioning, abandonment and reclamation of our facilities at the end of their economic life, including addressing environmental matters, the costs of which may be substantial. It is not possible to predict these costs with certainty since they will be a function of regulatory requirements at the time of decommissioning, abandonment and reclamation. We may, in the future, determine it prudent or be required by applicable laws or regulations to establish and fund one or more decommissioning, abandonment and reclamation reserve funds to provide for payment of future decommissioning, abandonment and reclamation costs, which could decrease funds available to service debt obligations. In addition, such reserves, if established, may not be sufficient to satisfy such future decommissioning, abandonment and reclamation costs and we will be responsible for the payment of the balance of such costs.
| Item 2. | Properties. |
The information required by Item 2 is contained in Item 1—Business.
| Item 3. | Legal Proceedings. |
The Company is party to various legal actions arising in the normal course of business. Matters that are probable of unfavorable outcome to the Company and which can be reasonably estimated are accrued. Such accruals are based on information known about the matters, the Company’s estimates of the outcomes of such matters, and its experience in contesting, litigating, and settling similar financial position or results of operations after consideration of recorded accruals.
| Item 4. | (Removed and Reserved). |
48
Table of Contents
| Item 5. | Market for Registrant’s Common Equity, Related Stockholder Matters and Issuer Purchases of Equity Securities. |
Common Stock
On December 16, 2009, we transferred the listing of our common stock from The NASDAQ Global Select Market to The New York Stock Exchange. The high and low sales prices for our common stock as listed on The NASDAQ Global Select Market or The New York Stock Exchange, as applicable during the periods described below, were as follows:
| High | Low | |||||||
| Year Ended December 31, 2010 |
||||||||
| First Quarter |
$ | 15.00 | $ | 7.86 | ||||
| Second Quarter |
9.62 | 6.00 | ||||||
| Third Quarter |
7.28 | 3.98 | ||||||
| Fourth Quarter |
5.95 | 4.05 | ||||||
| Year Ended December 31, 2009 |
||||||||
| First Quarter |
$ | 30.49 | $ | 5.96 | ||||
| Second Quarter |
19.10 | 5.57 | ||||||
| Third Quarter |
16.61 | 8.38 | ||||||
| Fourth Quarter |
19.00 | 10.95 | ||||||
As of March 3, 2011, there were 105 record owners of our common stock and an estimated 15,584 beneficial owners.
Dividend Policy
We have never declared or paid any cash dividends on our shares of common stock and do not anticipate paying any cash dividends on our shares of common stock in the foreseeable future. Currently, we intend to retain any future earnings for use in the operation and expansion of our business. Any future decision to pay cash dividends on our common stock will be at the discretion of our board of directors and will be dependent upon our financial condition, results of operations, capital requirements and other facts our board of directors may deem relevant. The declaration and payment of dividends is currently prohibited under the terms of our revolving bank credit facility and may be similarly restricted in the future. See “Management’s Discussion and Analysis of Financial Condition and Results of Operations—Revolving Bank Credit Facility and Other Debt.”
Securities Authorized for Issuance under Equity Compensation Plans
The following table summarizes the number of outstanding options granted to employees and directors, as well as the number of securities remaining available for future issuance, under our equity compensation plans as of December 31, 2010.
| Plan Category |
Number of securities to be issued upon exercise of outstanding options |
Weighted- average exercise price of outstanding options |
Number of securities remaining available for future issuance under equity compensation plans (excluding securities to be issued upon exercise of outstanding options) |
|||||||||
| Equity compensation plans approved by security holders |
576,051 | $ | 27.93 | 797,833 | ||||||||
49
Table of Contents
Shareholder Return Performance Graph
The following graph compares the cumulative total shareholder returns of our Common Stock during the five years ended December 31, 2010 with the cumulative total shareholder returns of the Russell 2000 Index and the NYSE Arca Oil Index. The comparison assumes an investment of $100 on December 31, 2005 in each of our Common Stock, the Russell 2000 Index and the NYSE Arca Oil Index and that any dividends were reinvested.
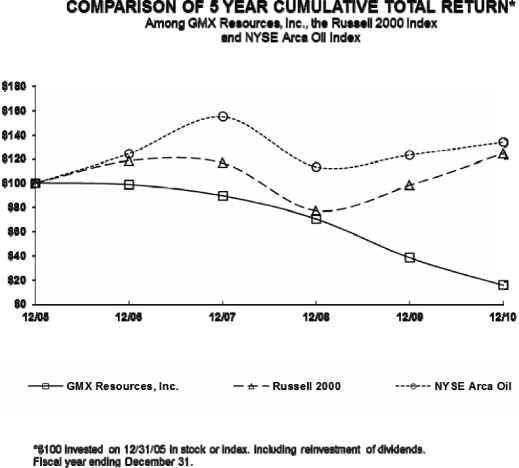
Recent Sales of Unregistered Equity Securities
On December 21 and 22, 2010, the Company entered into exchange agreements with one holder of its 5.00% Convertible Senior Notes due 2013 (the “2013 Convertible Notes”). Pursuant to these agreements, as consideration for the surrender by the holder of $2,250,000 aggregate principal amount of the 2013 Convertible Notes, the Company issued to the holder an aggregate of 380,250 shares of the Company’s common stock.
Purchases of Equity Securities
There were no repurchases of our common stock during the three months ended December 31, 2010.
50
Table of Contents
| Item 6. | Selected Financial Data. |
The following table presents our selective financial information for the periods indicated which were derived from our consolidated financial statements. It should be read in conjunction with our consolidated financial statements and related notes (beginning on page F-1 at the end of this report) and other financial information included herein.
| Year Ended December 31, | ||||||||||||||||||||
| 2010 | 2009 (as adjusted)(2) |
2008 (as adjusted)(2) |
2007 | 2006 | ||||||||||||||||
| (in thousands, except share and per share data) | ||||||||||||||||||||
| Statement of Operations Data: |
||||||||||||||||||||
| Oil and natural gas sales |
$ | 96,523 | $ | 94,294 | $ | 125,736 | $ | 67,883 | $ | 31,882 | ||||||||||
| Expenses: |
||||||||||||||||||||
| Lease operations |
10,651 | 11,776 | 15,101 | 8,982 | 4,479 | |||||||||||||||
| Production and severance taxes(1) |
743 | (930 | ) | 5,306 | 2,746 | 465 | ||||||||||||||
| General and administrative |
27,119 | 21,390 | 16,899 | 8,717 | 5,829 | |||||||||||||||
| Depreciation, depletion and amortization |
38,061 | 31,006 | 31,744 | 18,681 | 8,046 | |||||||||||||||
| Impairment of oil and natural gas properties and assets held for sale |
143,712 | 188,150 | 192,650 | — | — | |||||||||||||||
| Total expenses |
220,286 | 251,392 | 261,700 | 39,126 | 18,819 | |||||||||||||||
| Income (loss) from operations |
(123,763 | ) | (157,098 | ) | (135,964 | ) | 28,757 | 13,063 | ||||||||||||
| Total non-operating income (expense) |
(18,768 | ) | (24,022 | ) | (14,174 | ) | (3,862 | ) | (673 | ) | ||||||||||
| Income (loss) before income taxes |
(142,531 | ) | (181,120 | ) | (150,138 | ) | 24,895 | 12,390 | ||||||||||||
| (Provision) benefit for income taxes |
4,239 | 33 | 26,217 | (8,010 | ) | (3,415 | ) | |||||||||||||
| Net income (loss) |
(138,292 | ) | (181,087 | ) | (123,921 | ) | 16,885 | 8,975 | ||||||||||||
| Net income attributable to non-controlling interest |
3,114 | 173 | — | — | — | |||||||||||||||
| Net income (loss) applicable to GMX |
(141,406 | ) | (181,260 | ) | (123,921 | ) | 16,885 | 8,975 | ||||||||||||
| Preferred stock dividends |
4,633 | 4,625 | 4,625 | 4,625 | 1,799 | |||||||||||||||
| Net income (loss) applicable to GMX common shareholders |
$ | (146,039 | ) | $ | (185,885 | ) | $ | (128,546 | ) | $ | 12,260 | $ | 7,176 | |||||||
| Earnings (loss) per share—basic |
$ | (5.18 | ) | $ | (9.20 | ) | $ | (9.04 | ) | $ | 0.94 | $ | 0.65 | |||||||
| Earnings (loss) per share—diluted |
$ | (5.18 | ) | $ | (9.20 | ) | $ | (9.04 | ) | $ | 0.93 | $ | 0.64 | |||||||
| Weighted average common shares—basic |
28,206,506 | 20,210,400 | 14,216,466 | 13,075,560 | 11,120,204 | |||||||||||||||
| Weighted average common shares—diluted |
28,206,506 | 20,210,400 | 14,216,466 | 13,208,746 | 11,283,265 | |||||||||||||||
| Statement of Cash Flows Data: |
||||||||||||||||||||
| Cash provided by operating activities |
$ | 58,735 | $ | 49,490 | $ | 83,237 | $ | 52,445 | $ | 38,333 | ||||||||||
| Cash used in investing activities |
(176,000 | ) | (181,324 | ) | (318,360 | ) | (194,998 | ) | (130,573 | ) | ||||||||||
| Cash provided by financing activities |
84,068 | 160,672 | 235,932 | 143,500 | 94,807 | |||||||||||||||
| Balance Sheet Data (at end of period): |
||||||||||||||||||||
| Oil and natural gas properties, net |
$ | 347,763 | $ | 331,329 | $ | 383,890 | $ | 320,955 | $ | 157,300 | ||||||||||
| Total assets |
507,090 | 522,071 | 525,001 | 395,340 | 210,322 | |||||||||||||||
| Long-term debt, including current portion |
284,969 | 190,278 | 224,342 | 125,734 | 41,820 | |||||||||||||||
| Total GMX equity |
116,420 | 246,380 | 246,797 | 208,926 | 131,481 | |||||||||||||||
| (1) | Production and severance taxes in 2010, 2009, 2008, 2007 and 2006 reflect severance tax refunds of $3.1 million, $2.9 million, $1.2 million, $518,000 and $1.2 million, respectively, received and accrued during the year. |
| (2) | Certain amounts have been adjusted for the adoption of ASU 2009-15. See “Note B—Share Lending Arrangements and Adoption of ASU 2009-15,” in the consolidated financial statements. |
51
Table of Contents
| Item 7. | Management’s Discussion and Analysis of Financial Condition and Results of Operation. |
Summary Operating and Reserve Data
The following table presents an unaudited summary of oil and natural gas production, production prices, production costs and oil and natural gas reserve data for the periods indicated.
| Year Ended December 31, | ||||||||||||||||||||
| 2010 | 2009 | 2008 | 2007 | 2006 | ||||||||||||||||
| Production: |
||||||||||||||||||||
| Oil (MBbls) |
95 | 119 | 190 | 127 | 69 | |||||||||||||||
| Natural gas (MMcf) |
16,901 | 12,908 | 11,777 | 7,974 | 3,915 | |||||||||||||||
| Gas equivalent (MMcfe) |
17,474 | 13,620 | 12,918 | 8,735 | 4,327 | |||||||||||||||
| Average daily (MMcfe) |
47.9 | 37.3 | 35.3 | 23.9 | 11.9 | |||||||||||||||
| Average Sales Price: |
||||||||||||||||||||
| Oil (per Bbl) |
||||||||||||||||||||
| Wellhead price |
$ | 76.77 | $ | 56.61 | $ | 99.16 | $ | 71.08 | $ | 63.22 | ||||||||||
| Effect of hedges, excluding gain or loss from ineffectiveness of derivatives |
— | 19.41 | (10.66 | ) | (1.97 | ) | — | |||||||||||||
| Total |
$ | 76.77 | $ | 76.02 | $ | 88.50 | $ | 69.11 | $ | 63.22 | ||||||||||
| Natural gas (per Mcf) |
||||||||||||||||||||
| Wellhead price |
$ | 3.96 | $ | 3.85 | $ | 9.50 | $ | 7.00 | $ | 6.79 | ||||||||||
| Effect of hedges, excluding gain or loss from ineffectiveness of derivatives |
1.39 | 2.68 | (0.34 | ) | 0.41 | 0.24 | ||||||||||||||
| Total |
$ | 5.35 | $ | 6.53 | $ | 9.16 | $ | 7.41 | $ | 7.03 | ||||||||||
| Average sales price, excluding gain or loss from ineffectiveness of derivatives (per Mcfe) |
$ | 5.60 | $ | 6.85 | $ | 9.65 | $ | 7.77 | $ | 7.37 | ||||||||||
| Operating and Overhead Costs (per Mcfe): |
||||||||||||||||||||
| Lease operating expenses(4) |
$ | 0.61 | $ | 0.86 | $ | 1.17 | $ | 1.03 | $ | 1.04 | ||||||||||
| Production and severance taxes |
0.04 | (0.07 | ) | 0.41 | 0.31 | 0.11 | ||||||||||||||
| General and administrative |
1.55 | 1.57 | 1.31 | 1.00 | 1.35 | |||||||||||||||
| Total |
$ | 2.20 | $ | 2.36 | $ | 2.89 | $ | 2.34 | $ | 2.50 | ||||||||||
| Other (per Mcfe): |
||||||||||||||||||||
| Depreciation, depletion and amortization—oil and natural gas production |
$ | 1.88 | $ | 1.76 | $ | 2.08 | $ | 1.88 | $ | 1.59 | ||||||||||
| Estimated Net Proved Reserves (as of period-end): |
||||||||||||||||||||
| Natural gas (Bcf) |
312.0 | 333.2 | 435.3 | 406.3 | 236.9 | |||||||||||||||
| Oil (MMbls) |
1.2 | 3.7 | 5.0 | 4.7 | 2.7 | |||||||||||||||
| Total (Bcfe) |
319.3 | 355.3 | 465.3 | 434.5 | 253.0 | |||||||||||||||
| Estimated Future Net Revenues ($MM)(1)(2) |
$ | 692.7 | $ | 625.7 | $ | 1,012.3 | $ | 1,896.3 | $ | 519.5 | ||||||||||
| Present Value ($MM)(1)(2) |
$ | 249.9 | $ | 188.6 | $ | 280.7 | $ | 592.8 | $ | 173.3 | ||||||||||
| Standardized measure of discounted future net cash flows ($MM)(3) |
$ | 249.9 | $ | 188.6 | $ | 228.8 | $ | 427.7 | $ | 134.4 | ||||||||||
| (1) | See “Item 1 Business—Certain Technical Terms.” |
| (2) | The 2010 and 2009 prices used in calculating Estimated Future Net Revenues and the Present Value are determined using prices as prescribed by the SEC. Estimated Future Net Revenues and the Present Value give no effect to federal or state income taxes attributable to estimated future net revenues. See “Item 1 Business—Reserves.” |
| (3) | The standardized measure of discounted future net cash flows give effect to federal and state income taxes attributable to estimated future net revenues. In years where our effective tax rate is 0%, there is no effect to |
52
Table of Contents
| the standardized measure for federal or state taxes as was the case in 2010 and 2009. See “Note M—Supplemental Information on Oil and Natural Gas Operations” in our consolidated financial statements. |
| (4) | Lease operating expenses include ad valorem taxes which increases the per Mcfe cost by $0.09, $0.06, $0.10, $0.01 and $0.06 in 2010, 2009, 2008, 2007, and 2006, respectively. |
We are an independent oil and gas company historically engaged in the exploration, development and production of oil and natural gas from the Haynesville/Bossier Shale and Cotton Valley Sands in our core area, the Sabine Uplift of the Carthage, North Field of Harrison and Panola counties of East Texas. For 2010 and prior periods, we consider and report all of our operations as one segment because our operating areas have similar economic characteristics and each meet the criteria for aggregation as defined in the Financial Accounting Standards Board Accounting Standards Codification 280.
During 2010, we focused on the development of our Haynesville/Bossier Shale horizontal well development as well as Cotton Valley Sand wells, which are substantially all natural gas wells. During 2011, we will begin to shift our focus from our core area into the Bakken and Niobrara formations in which we have acquired or have pending acquisitions for undeveloped acreage that consist of oil-focused resource plays. We also intend to continue acreage acquisitions and to convert our unproved reserves to proved reserves, while maintaining balanced prudent financial management.
Results of Operations—Year ended December 31, 2010 Compared to Year ended December 31, 2009
Certain amounts in 2009 have been adjusted as disclosed in “Note B—Share Lending Arrangements and Adoption of ASU 2009-15,” to the consolidated financial statements and reflect retrospective adjustments for the adoption of ASC 2009-15.
Oil and Natural Gas Sales. Oil and natural gas sales in the year ended December 31, 2010 increased 2% to $96.5 million compared to the year ended December 31, 2009. This sales increase is primarily due to an increase in natural gas and oil production of 28%, offset by a decrease in natural gas and oil prices of 18%, net of effect of hedging. The average prices per barrel of oil and mcf of natural gas received in the year ended December 31, 2010 were $76.77 and $5.35, respectively, compared to $76.02 and $6.53, respectively, in the year ended December 31, 2009. Oil production in 2010 decreased to 95 MBbls compared to 119 MBbls for 2009. The decrease in oil production is due to the natural decline in the Company’s Cotton Valley Sands vertical well production, which has historically provided most of the Company’s oil production. H/B Hz wells typically do not have oil production. Natural gas production in 2010 increased to 16,901 MMcf for 2010 compared to 12,908 MMcf for the year ended December 31, 2009, an increase of 31%. The increase in natural gas production resulted from 19 additional producing H/B Hz wells that were completed and brought on-line during 2010 and the respective production exceeding the normal decline in production for wells producing at the beginning of the period. Production from H/B Hz wells accounted for 63% of total production for 2010 compared to 33% for 2009.
In the year ended December 31, 2010, as a result of hedging activities, we recognized an increase in oil and natural gas sales of $22.3 million, compared to an increase in oil and natural gas sales of $37.9 million in the year ended December 31, 2009. In the year ended December 31, 2010, hedging, excluding ineffectiveness, increased the average natural gas sales price by $1.39 per Mcf compared to an increase of the average natural gas and oil sales price by $2.68 per Mcf and $19.41 per Bbl in the year ended December 31, 2009. Oil related derivative instruments had no impact on oil and natural gas sales in 2010.
Lease Operations. Lease operations expense decreased $1.1 million in the year ended December 31, 2010 to $10.7 million, a 10% decrease compared to $11.8 million in the year ended December 31, 2009. Lease operating expense on an equivalent unit of production basis was $0.61 per Mcfe in the year ended December 31, 2010 compared to $0.86 per Mcfe for the year ended December 31, 2009. The decrease in lease operating expenses on an equivalent unit basis resulted from a higher volume H/B Hz well production relative to the corresponding
53
Table of Contents
lease operations expense per well and cost control measures implemented during 2010. With little to no incremental increase in lease operating costs from a typical Cotton Valley vertical well, the significantly larger amount of production from a typical H/B Hz well results in lower per unit lease operating costs.
Production and Severance Taxes. The State of Texas grants an exemption of severance taxes for wells that qualify as “high cost” wells. Certain wells, including all of our H/B wells, qualify for severance tax relief for a period of ten years or recovery of 50% of the cost of drilling and completion, whichever is less. As a result, refunds for severance tax paid to the State of Texas on wells that qualify for reimbursement are recognized as accounts receivable and offset severance tax expense for the amount refundable (net of filing fees paid to a third party). Production and severance taxes increased 180% to a an expense of $0.7 million for the year ended December 31, 2010 compared to a benefit of $0.9 million for the year ended December 31, 2009, as a result of the Company recording production and severance tax refunds of $2.9 million offset by production and severance tax funds receivable of $1.3 million for the year ended December 31, 2009 for severance taxes paid in 2009 and prior for which reimbursement was due.
General and Administrative Expense. General and administrative expense for the year ended December 31, 2010 was $27.1 million compared to $21.4 million for the year ended December 31, 2009, an increase of 27%. An increase of $5.7 million was due to an increase in administrative and supervisory personnel, severance compensation, as well as in increase in corporate operating expenses due to our expected growth. General and administrative expense per equivalent unit of production was $1.55 per Mcfe for the year ended December 31, 2010 compared to $1.57 per Mcfe for the comparable period in 2009. Approximately $5.5 million or 20% of the general and administrative expenses in 2010 was related to non-cash compensation expense compared to $4.6 million or 22% in 2009. General and administrative expense has not historically varied in direct proportion to oil and natural gas production because certain types of general and administrative expenses are non-recurring or fixed in nature. The Company expects general and administrative expenses on a per Mcfe basis to decrease as production increases.
Depreciation, Depletion and Amortization. Depreciation, depletion and amortization expense increased $7.1 million to $38.1 million in the year ended December 31, 2010, up 23% from $31.0 million in the year ended December 31, 2009. The oil and gas properties depreciation, depletion and amortization rate per equivalent unit of production was $1.88 per Mcfe in the year ended December 31, 2010 compared to $1.76 per Mcfe in the year ended December 31, 2009. The increase is due to current year production being a greater percentage of the total proved reserves as a result of negative reserve revisions to the Cotton Valley proved reserves in 2010.
Impairment of oil and natural gas properties and assets held for sale. The removal of the Company’s proved undeveloped Cotton Valley Sand Reserves from the year end 2010 reserve report and the reduction in the present value at 10% of the reserves has limited the amount of oil and gas properties that could be capitalized on the balance sheet under the SEC’s “ceiling” test. We recognized an impairment charge on oil and gas properties of $132.8 million in the year ended December 31, 2010 compared to an impairment charge on oil and gas properties of $188.2 million in the year ended December 31, 2009. The Company may be required to recognize additional impairment charges or writedowns in future reporting periods if market prices for oil decline and market prices for natural gas continue to decline or remain at their depressed levels. In addition, the Company impaired an additional $10.9 million related to assets held for sale as of December 31, 2010.
Interest. Interest expense for the year ended December 31, 2010 was $18.6 million compared to $16.7 million for the year ended December 31, 2009. This increase is due to a higher amount of outstanding debt during 2010, as well as non-cash interest expense relating to the amortization of the discount of the deferred premiums on derivative instruments. Interest expense for the years ended December 31, 2010 and 2009 includes non-cash interest expense of $4.9 million and $3.9 million, respectively related to the accretion of the 5.00% senior convertible notes due 2013 and the 4.50% convertible senior notes due 2015. Interest expense for 2010 and 2009 also includes amortization of the discount related to our share lending agreement of $0.7 million and $0.6 million, respectively, under the accounting rules adopted in 2010 (see Note B). In addition, interest expense for 2010 includes $0.8 million of amortized discount related to the deferred premiums, which began during 2010.
54
Table of Contents
Income Taxes. Income tax for 2010 was a benefit of $4.2 million as compared to a benefit of $33,000 in 2009. Virtually all of the Company’s deferred tax assets are reserved except to the extent offset by deferred tax liabilities and provisions that are recorded for items included in Accumulated Other Comprehensive Income. Deferred tax liabilities for items included in Accumulated Other Comprehensive Income increased by $4.2 million in 2010, which resulted in the recognition (benefit) of $4.2 million for the change in valuation allowance or net of deferred tax assets. The effective tax rates for 2010 and 2009 were 3% and 0%, respectively.
Year ended December 31, 2009 Compared to Year ended December 31, 2008
Certain amounts in 2008 have been restated as disclosed in “Note B—Share Lending Arrangements and Adoption of ASU 2009-15,” to the consolidated financial statements and reflect retrospective adjustments for the adoption of ASU 2009-15 as disclosed in Note B to the consolidated financial statements.
Oil and Natural Gas Sales. Oil and natural gas sales in the year ended December 31, 2009 decreased 25% to $94.3 million compared to $125.7 million in the year ended December 31, 2008. This decrease is due to lower natural gas and oil prices of 29%, offset by a 5% increase in natural gas and oil production. The average prices per barrel of oil and mcf of natural gas received in the year ended December 31, 2009 were $76.02 and $6.53, respectively, compared to $88.50 and $9.16, respectively, in the year ended December 31, 2008. Production of oil decreased to 119 MBbls compared to 190 MBbls for 2008. The decrease in oil production is due to the natural decline in the Company’s Cotton Valley Sands vertical well production, which has historically provided most of the Company’s oil production. H/B Hz wells typically do not have oil production. Natural gas production increased to 12,908 MMcf for 2009 compared to 11,777 MMcf for the year ended December 31, 2008, an increase of 10%. The increase in natural gas production resulted from production related to 12 producing H/B Hz wells that were on-line during 2009. Production from H/B Hz wells accounted for 33% of total production for 2009 compared to 1% for 2008.
In the year ended December 31, 2009, as a result of hedging activities, we recognized an increase in oil and natural gas sales of $37.9 million, compared to a decrease in oil and natural gas sales of $5.0 million in the year ended December 31, 2008. In the year ended December 31, 2009, hedging increased the average natural gas and oil sales price by $2.68 per Mcf and $19.41 per Bbl compared to a reduction of the average natural gas and oil sales price by $0.34 per Mcf and $10.66 per Bbl in the year ended December 31, 2008.
Lease Operations. Lease operating expense decreased $3.3 million in the year ended December 31, 2009 to $11.8 million, a 22% decrease compared to $15.1 million in the year ended December 31, 2008. Lease operating expense on an equivalent unit of production basis was $0.86 per Mcfe in the year ended December 31, 2009 compared to $1.17 per Mcfe for the year ended December 31, 2008. The decrease in lease operating expenses on an equivalent unit basis resulted from an increase in H/B Hz well production and cost control measures implemented during 2009. With little to no incremental increase in lease operating expenses compared to a typical Cotton Valley Sands vertical well, the significantly larger amount of production from a typical H/B Hz well results in lower per unit lease operating costs.
Production and Severance Taxes. Partially as a result of the recognition of severance tax refunds of approximately $2.9 million in 2009, production and severance taxes decreased 118% from an expense of $5.3 million in the year ended December 31, 2008 to income of $0.9 million in the year ended December 31, 2009. Upon approval by the State of Texas, certain high cost wells, including our H/B Hz wells, are exempt from severance taxes for a period of ten years and we expect this to reduce our expense going forward. Excluding the production and severance tax refunds received in 2009, production and severance tax expense also decreased $3.3 million in comparison to 2008 due to a decrease in oil and natural gas prices between the two periods and the fact that more producing wells in 2009 have received the production and severance tax exemptions.
General and Administrative Expense. General and administrative expense for the year ended December 31, 2009 was $21.4 million compared to $16.9 million for the year ended December 31, 2008, an increase of 27%.
55
Table of Contents
The increase of $4.5 million was due to an increase in administrative and supervisory personnel. General and administrative expense per equivalent unit of production was $1.57 per Mcfe for the year ended December 31, 2009 compared to $1.31 per Mcfe for the comparable period in 2008. Approximately $4.6 million or 22% of the general and administrative expenses in 2009 was related to non-cash compensation expense compared to $3.1 million or 18% in 2008. General and administrative expense has not historically varied in direct proportion to oil and natural gas production because certain types of general and administrative expenses are non-recurring or fixed in nature. The Company expects general and administrative expenses on a per Mcfe basis to decrease as production increases.
Depreciation, Depletion and Amortization. Depreciation, depletion and amortization expense decreased 0.7 million to $31.0 million in the year ended December 31, 2009, down 2% from $31.8 million in the year ended December 31, 2008. The oil and gas properties depreciation, depletion and amortization rate per equivalent unit of production was $1.76 per Mcfe in the year ended December 31, 2009 compared to $2.08 per Mcfe in the year ended December 31, 2008. The depletion rate decrease was due to a lower cost basis in oil and gas properties subject to amortization due to previously recorded impairment charges as a result of lower crude oil and natural gas prices at year end 2008 and 2009.
Impairment of oil and natural gas properties. As a result of the continued decline in natural gas prices from year-end 2008, which limited the amount of oil and gas properties that could be capitalized on the balance sheet under the SEC’s “ceiling” test, we recognized an impairment charge on oil and gas properties of $188.2 million in the year ended December 31, 2009 compared to an impairment charge on oil and gas properties of $192.7 million in the year ended December 31, 2008. The Company may be required to recognize additional impairment charges or writedowns in future reporting periods if market prices for oil or natural gas continue to decline or remain at their depressed levels.
Interest. Interest expense for the year ended December 31, 2009 was $16.7 million compared to $14.1 million for the year ended December 31, 2008. This increase is due to a greater amount of outstanding debt during 2009 and an increase in non-cash interest expense related to our convertible notes. Interest expense for the years ended December 31, 2008 and 2009 includes non-cash interest expense of $1.9 million and $3.9 million, respectively related to the accretion of the 5.00% senior convertible notes due 2013 and the 4.50% convertible senior notes due 2015.
Loss on Extinguishment of Debt. In October 2009, we entered into an amendment with the Prudential Insurance Company of America (“Prudential”), pursuant to which Prudential agreed to accept repayment of its senior secured subordinated notes with the proceeds of our offering of 4.50% convertible senior notes due 2015. We repaid all the senior secured subordinated notes on October 29, 2009. As a result of prepaying the senior secured subordinated notes, we recognized a pre-payment penalty of $4.6 million and expensed remaining deferred debt issue costs of $0.3 million.
Income Taxes. Income tax for 2009 was a benefit of $33,000 compared to a benefit of $25.0 million in 2008. The effective tax rates for 2008 and 2009 were 17% and 0%, respectively. The decrease in the effective tax rate from the 34% statutory tax rate in the years ended December 31, 2008 and 2009 was due to $11.5 million and $17.5 million, respectively, of deferred tax expense relating to a valuation allowance for deferred tax assets that reduced our tax benefit.
Net Loss Applicable to GMX Shareholders and Net Loss per Share
Net Loss Applicable to GMX Shareholders and Net Loss Per Share—Year Ended December 31, 2010 Compared to Year Ended December 31, 2009. For the year ended December 31, 2010 and 2009, we reported net loss applicable to GMX shareholders of $146.0 million and $185.9 million, respectively. Net loss applicable to GMX shareholders per basic and fully diluted share was $5.18 for the year ended 2010 compared to net loss applicable to GMX shareholders per basic and fully diluted share of $9.20 for the year ended 2009.
56
Table of Contents
Net Loss Applicable to GMX Shareholders and Net Loss Per Share—Year Ended December 31, 2009 Compared to Year Ended December 31, 2008. For the year ended December 31, 2009 and 2008, we reported net loss applicable to GMX shareholders of $185.9 million and $128.5 million, respectively. Net loss applicable to GMX shareholders per basic and fully diluted share was $9.20 for the year ended 2009 compared to net loss applicable to GMX shareholders per basic and fully diluted share of $9.04 for the year ended 2008.
Capital Resources and Liquidity
Our business is capital intensive. Our ability to grow our reserve base is dependent upon our ability to obtain outside capital and generate cash flows from operating activities to fund our drilling and capital expenditures. Our cash flows from operating activities are substantially dependent upon crude oil and natural gas prices. Significant decreases in market prices of crude oil or natural gas could result in reductions of cash flow and affect our drilling and capital expenditure plan. To mitigate the risk of declines in crude oil and natural gas prices, we typically enter into crude oil and natural gas swaps, collars, three-way collars, and put spreads.
For the year ended December 31, 2010, our capital expenditures were $190.2 million, of which:
| • | $165.4 million was for drilling and completing H/B Hz wells; |
| • | $4.0 million was for rig delay fees; |
| • | $1.5 million on Cotton Valley Sands and Travis Peak drilling and other drilling related expenditures including tubular inventory; and |
| • | $19.3 million was related to leasehold and infrastructure costs. |
We currently expect to spend cash capital expenditures of $224 million in 2011, including the payment of an anticipated $56 million for the cash portion of the Bakken and Niobrara acreage acquisitions announced in January 2011. We also anticipate issuing approximately 6.8 million common shares in connection with these acreage acquisitions. We continually review our drilling and capital expenditure plans and may change the amount we spend based on industry conditions and the availability of capital. Based on management’s current oil and natural gas price expectations for the year ended December 31, 2011, we anticipate that we will have sufficient sources of working capital, including net proceeds from the offerings of our Senior Notes and common stock completed in February 2011, our current, including cash on hand, cash flow from operating activities, proceeds from assets held for sale and availability under our revolving bank credit facility ($60 million as of March 7, 2011) , to meet our cash obligations for our 2011 fiscal year, including to fund our one-rig Haynesville/Bossier horizontal drilling program, the 2011 acreage acquisitions in the Bakken and Niobrara, and our anticipated drilling programs in these two new oil plays. We will continually adjust our capital expenditures based on the current and forecasted commodity price environment to ensure that we have adequate liquidity in cash and/or with availability under our revolving bank credit facility. We anticipate using various derivative contracts such as puts, put spreads, and collars to mitigate natural gas and crude oil price risk on 60% to 80% of our expected production over a rolling 24-to 36-month period.
During 2010, we funded our H/B Hz drilling program through cash flows from operations, available cash of $35.5 million at the beginning of 2010, and $92 million from borrowings under our bank credit facility. The $35.5 million of available cash at January 1, 2010 was the result of raising $65.3 million, net of expenses, from the sale of 5.75 million shares of common stock in May 2009, raising $98.8 million, net of expenses, from the sale of 6.95 million shares of common stock and $82.8 million from the issuance of 4.50% convertible senior notes due 2015 in October 2010. In addition to these capital market transactions, we received $36.0 million in November 2009 from the partial monetization of our mid-stream assets in the Endeavor Gathering transaction.
For 2011 and 2012, we had hedged approximately 15.5 million MMBtu and 16.7 million MMBtu of natural gas at a weighted average floor price of $6.11 and $6.08 per MMbtu, respectively, as of December 31, 2010. Our 2011 hedges represent approximately 74% of our average daily production for the fourth quarter of 2010. We plan to continue to use hedging to mitigate our commodity price risk.
57
Table of Contents
Cash Flow—Year Ended December 31, 2010 Compared to Year Ended December 31, 2009. In 2010, we had a positive cash flow from operating activities of $58.7 million. Our cash flow from operating activities in 2009 was $49.5 million. We received a net $84.1 million in cash from financing activities in 2010 compared to 2009 amounts of $160.7 million. The cash flow from financing activities in 2010 was primarily from draws on our line of credit totaling $92 million, sale of preferred stock of $0.9 million and contributions from our non-controlling interest holder of $1.2 million, offset by dividend payments on our Series B preferred stock of $4.6 million, distributions to our non-controlling interest member of $4.6 million and financing fees of $0.9 million. The cash flow from financing activities in 2009 was primarily from the sale of common stock of $164.1 million, issuance of 4.50% convertible senior notes due 2015 of $86.3 million, and the sale of the equity interest in Endeavor Gathering for $36.0 million, offset by paydowns of debt under our revolving bank credit facility and Senior Secured Notes totaling $213.7 million.
Cash Flow—Year Ended December 31, 2009 Compared to Year Ended December 31, 2008. In 2009, we had a positive cash flow from operating activities of $49.5 million. Our cash flow from operating activities in 2008 was $83.2 million. Cash flow from operating activities before changes in operating assets and liabilities and after preferred stock dividends was $50.8 million in 2009 compared to $73.7 million in 2008. This resulted from a 25% decrease in oil and natural gas sales in 2009. We received a net $160.7 million in cash from financing activities in 2009 compared to 2008 amounts of $235.9 million. The cash flow from financing activities in 2009 was primarily from $99.0 million borrowed under our revolving bank facility, the sale of common stock of $164.1 million, issuance of 4.50% convertible senior notes due 2015 of $86.3 million, and the sale of the equity interest in Endeavor Gathering for $36.0 million, offset by paydowns of debt under our revolving bank credit facility and Senior Secured Notes totaling $213.7 million and $4.6 million in dividend payments. The cash flow from financing activities in 2008 was primarily from the sale of common stock of $134.7 million, issuance of 5.00% convertible senior notes due 2013 of $125.0 million and additional debt under our revolving bank credit facility.
Revolving Bank Credit Facility and Other Debt
Revolving Bank Credit Facility. As of December 31, 2010 we had a secured revolving bank credit facility, which matures on July 8, 2013 if on or prior to July 31, 2012, all of the Company’s $122.75 million aggregate principal amount of 5.00% convertible notes either have been fully converted to common stock of the Company or have been paid in full with the proceeds of an equity offering or new debt with a maturity date no earlier than 180 days after July 8, 2013. The revolving bank credit facility provides for loans totaling up to $250 million (the “commitment”), subject to a borrowing base, which is based on a periodic evaluation of oil and gas reserves (“borrowing base”). The amount of credit available at any one time under the credit facility is the lesser of the borrowing base or the amount of the commitment.
The borrowing base has been adjusted from time to time and was $130.0 million at December 31, 2010. As of December 31, 2010, the Company had $92 million of borrowings under the credit facility.
The loans under the credit facility bear interest at a rate elected by us which is based on the prime, LIBO or federal funds rate with margins ranging from 1% to 4.25% depending on the base rate used and the amount of the loan outstanding in relation to the borrowing base. Upon delivery of a monthly EBITDA certificate indicating a “Total Net Debt to EBITDA” ratio as being 4.00 to 1.00 or higher than the applicable LIBO rate margin will be 6.00% and the applicable prime rate margin will be 3.75%. The increase margins will remain in effect until “Total Net Debt to EBITDA” is less than 4.00 to 1.00. Principal is payable voluntarily by us or is required to be paid (i) if the loan amount exceeds the borrowing base; (ii) if the Lender elects to require periodic payments as part of a borrowing base redetermination; and (iii) at the maturity date. The Company is obligated to pay a facility fee equal to 0.5% per year of the unused portion of the borrowing base payable quarterly.
The loan is secured by a first mortgage on substantially all of our oil and natural gas properties, a pledge of our ownership of the equity interests in subsidiaries, a guaranty from certain of our subsidiaries and a security interest in all of the assets of certain of our subsidiaries.
58
Table of Contents
In addition to customary reporting and compliance requirements, the principal covenants, as amended as of December 31, 2010, under the revolving bank credit facility are:
| • | Maintain a current ratio (as defined in the loan agreement) of not less than 1 to 1; |
| • | Maintain on a quarterly basis a rolling four quarter ratio of EBITDA to cash interest expense and preferred dividends of not less than 3 to 1; |
| • | Maintain on a monthly basis a ratio of total debt to EBITDA of no more than: |
| • | December 1, 2010 through February 28, 2011: 4.75 to 1 |
| • | March 1, 2011 through August 31, 2011: 4.60 to 1 |
| • | September 1, 2011 through October 31, 2011: 4.40 to 1.00 |
| • | November 1, 2011 through maturity date: 4.00 to 1 |
| • | Maintain on a quarterly basis a ratio of senior secured debt to EBITDA of not more that 2.50 to 1; |
| • | Maintain a hedging program on mutually acceptable terms whenever the loan amount outstanding exceeds 75% of the borrowing base; |
| • | Pay all accounts payable within 60 days of the due date other than those being contested in good faith; |
| • | Not incur any other debt other than our Series B Preferred Stock, our $125 million of 5.00% convertible senior notes due 2013, and our $86.5 million of 4.50% convertible senior notes due 2015; |
| • | Not permit any liens other than those permitted by the loan agreement; |
| • | Not make any investments, loans or advances other than as permitted by the loan agreement, which includes permitted investment in Diamond Blue Drilling for no more than three drilling rigs; |
| • | Not engage in any mergers or consolidations or sales of all or substantially all of our assets; |
| • | Not pay any dividends on common stock or make any other distributions with respect to our stock, including stock repurchases; |
| • | Not permit Ken L. Kenworthy Jr. to cease being our chief executive officer, other than by reason of his death or disability unless we name a successor acceptable to the lenders within four months; |
| • | Not permit a person or group (other than existing management) to acquire more than 50% of the outstanding common stock or otherwise suffer a change in control; and |
| • | Not to make any cash payments in respect of interest or on account of the conversion, purchase, acquisition or termination of our 5.00% convertible senior notes due 2013 or our 4.50% convertible senior notes due 2015 unless no event of default under the loan agreement exists or the payment would not result in such a default and the borrowing base has not been exceeded. |
As of December 31, 2010, we were in compliance with all financial covenants under the revolving bank credit facility.
We will borrow under the revolving bank credit facility up to the borrowing base, currently $130 million, $38 million of which is available as of December 31, 2010, to fund planned capital expenditures and for other general corporate purposes. Our lending bank group consists of Capital One, N.A., BNP Paribas, Compass Bank, U.S. Bank, N.A, Credit Suisse AG and Bank America, N.A.
On February 2, 2011, the Company entered into a Fifth Amended and Restated Loan Agreement among the Company, as borrower, Capital One, National Association, as administrative agent, arranger and bookrunner, BNP Paribas, as syndication agent, and the lenders named therein (the “Restated Loan Agreement”). The Restated Loan Agreement became effective after specified conditions had been satisfied, as amended on
59
Table of Contents
February 3, 2011, including (i) the completion of an equity offering of at least $75.0 million of common stock and an offering of senior unsecured notes in a principal amount of at least $175.0 million, on terms specified, in each case on or before February 28, 2011, (ii) the deposit of at least $50.0 million of the proceeds from the common stock and senior unsecured notes offerings in a restricted account with the agent on or before the closing date, for use solely for the purpose of retiring a portion of the Company’s convertible senior notes due 2013, such that the principal of such notes will be no more than $75.0 million within 45 days after the effective date of the Restated Loan Agreement (with such restricted account and remaining funds continuing as collateral under the Restated Loan Agreement if such debt is not retired to such outstanding balance at such time), and (iii) no advances, unpaid fees or other borrowings are outstanding under the prior loan agreement, excluding letters of credit that will be transferred to be outstanding under the Restated Loan Agreement.
The Restated Loan Agreement will mature on January 1, 2013; provided, that if our 5.0% convertible senior notes due 2013 have been repurchased and no longer remain outstanding, the maturity date will be extended automatically to December 31, 2013 assuming we are in compliance with all covenants under the amended secured revolving credit facility.
The Restated Loan Agreement provides for a line of credit of up to $100.0 million, subject to a borrowing base. The initial borrowing base availability under the Restated Loan Agreement is $60.0 million. The amount of loans available at any one time under the Restated Loan Agreement is the lesser of the borrowing base or the amount of the commitment. The borrowing base will be subject to semi-annual redeterminations (approximately April 1 and October 1) during the term of the loan, commencing October 1, 2011, and is based on evaluations of our oil and gas reserves. The Restated Loan Agreement includes a letter of credit sublimit of up to $10.0 million.
The loans under our Restated Loan Agreement bear interest at a rate elected by the Company which is based on the prime rate, LIBOR or federal funds rate plus margins ranging from 1% to 3.50% depending on the base rate used and the amount of loans outstanding in relation to the borrowing base. We may voluntarily prepay the loans without premium or penalty. If and to the extent the loans outstanding exceed the most recently determined borrowing base, the loan excess will be mandatorily prepayable within 90 days after notice. Otherwise, any unpaid principal or interest will be due and payable at maturity. The Company is obligated to pay a facility fee equal to 0.5% per annum of the unused portion of the borrowing base, payable quarterly in arrears beginning March 31, 2011.
Loans under Restated Loan Agreement are secured by a first priority mortgage on substantially all of our oil and natural gas properties, a pledge on the Company’s ownership of equity interests in its subsidiaries, a guaranty from Endeavor Pipeline, Inc. and any future subsidiaries of the Company and a security interest in certain of our and the guarantors’ assets.
5.00% Convertible Senior Notes Due 2013. In February 2008, we completed a $125 million private placement of 5.00% Convertible Senior Notes due 2013 (the “5.00% Convertible Notes”). Net proceeds of approximately $121 million were used to repay our revolving bank credit facility and other indebtedness. The 5.00% Convertible Notes are governed by an indenture, dated as of February 15, 2008 (the “Indenture”) between the Company and The Bank of New York Trust Company, N.A., as trustee (the “Trustee”).
The 5.00% Convertible Notes bear interest at a rate of 5.00% per year, payable semiannually in arrears on February 1 and August 1 of each year, beginning August 1, 2008. The 5.00% Convertible Notes mature on February 1, 2013, unless earlier converted or repurchased by us. Holders may convert their 5.00% Convertible Notes at their option prior to the close of business on the business day immediately preceding November 1, 2012 only under the following circumstances:
| • | during any fiscal quarter commencing after March 31, 2008 if the last reported sale price of our common stock for at least 20 trading days during a period of 30 consecutive trading days ending on the last trading day of the preceding fiscal quarter is greater than or equal to 130% of the applicable conversion price on each such trading day; |
60
Table of Contents
| • | during the five business-day period after any five consecutive trading-day period in which the trading price per $1,000 principal amount of 5.00% Convertible Notes for each day of that measurement period was less than 98% of the product of the last reported sale price of our common stock and the applicable conversion rate on each such day; |
| • | upon the occurrence of a corporate event pursuant to which: (1) we issue rights to all or substantially all of the holders of our common stock entitling them to purchase, for a period expiring within 60 days after the date of the distribution, shares of our common stock at a price below the average market price at the time, or (2) we distribute to all or substantially all of the holders of our common stock our assets, debt securities or rights to purchase our securities, if the distribution has a per share value in excess of 10% of the last reported sale price for our common stock at the time; or |
| • | if: (1) a “person” or “group” within the meaning of Section 13(d) of the Exchange Act acquires more than 50% of our outstanding voting stock, (2) we consummate a recapitalization, reclassification or change of our common stock as a result of which our common stock would be converted into or exchanged for stock, other securities, other property or assets, (3) we consummate a share exchange, consolidation or merger pursuant to which our common stock will be converted into cash, securities or other property, (4) we consummate any sale, lease or other transfer in one transaction or a series of transactions of all or substantially all of our and our subsidiaries’ consolidated assets to any person other than one of our subsidiaries, (5) continuing directors cease to constitute at least a majority of our board of directors, (6) our shareholders approve any plan or proposal for our liquidation or dissolution, or (7) our common stock ceases to be listed on a United States national or regional securities exchange (any of the events described in clauses (1) through (7), a “fundamental change”). |
On and after November 1, 2012 until the close of business on the business day immediately preceding the maturity date, holders may convert their 5.00% Convertible Notes at any time, regardless of the foregoing circumstances.
Upon conversion, we will satisfy our conversion obligation by paying and delivering cash for the lesser of the principal amount or the conversion value, and, if the conversion value is in excess of the principal amount, by paying or delivering, at our option, cash and/or shares of our common stock for such excess. The conversion value is a daily value calculated on a proportionate basis for each day of a 60 trading-day observation period.
The conversion rate is initially 30.7692 shares of our common stock per $1,000 principal amount of 5.00% Convertible Notes (equivalent to a conversion price of approximately $32.50 per share of common stock). The conversion rate is subject to adjustment in some events but will not be adjusted for accrued interest. In addition, following any fundamental change that occurs prior to the maturity date, we will increase the conversion rate for a holder who elects to convert its 5.00% Convertible Notes in connection with such a fundamental change in certain circumstances. The increase in the conversion rate is determined based on a formula that takes into consideration our stock price at the time of the fundamental change (ranging from $25.00 to $150.00 per share) and the remaining time to maturity of the 5.00% Convertible Notes. The increase in the conversion rate ranges from 0% to 30%, increasing as the stock price at the time of the fundamental change increases from $25.00 and declining as the remaining time to maturity of the 5.00% Convertible Notes decreases.
We may not redeem the 5.00% Convertible Notes prior to maturity. However, if we undergo a fundamental change, holders may require us to repurchase the 5.00% Convertible Notes in whole or in part for cash at a price equal to 100% of the principal amount of the 5.00% Convertible Notes to be repurchased plus any accrued and unpaid interest (including additional interest, if any) to, but excluding, the fundamental change repurchase date.
The 5.00% Convertible Notes are senior unsecured obligations of the Company and rank equally in right of payment to all of our other existing and future senior indebtedness and our existing 4.50% Convertible Notes discussed below. The 5.00% Convertible Notes are effectively subordinated to all our secured indebtedness, including indebtedness under our revolving bank credit facility and our senior secured notes, to the extent of the
61
Table of Contents
value of our assets pledged as collateral for such indebtedness. The 5.00% Convertible Notes are also effectively subordinated to all liabilities of our subsidiaries, including liabilities under any guarantees they have issued.
We currently have pending a tender offer for $50.0 million of our 5.00% Convertible Notes.
4.50% Convertible Senior Notes Due 2015. In October 2009, we completed an $86.3 million public offering of 4.50% convertible senior notes due 2015 (“4.50% Convertible Notes”). The proceeds of the offering were used to repay the Senior Subordinated Secured Notes due 2012 and a portion of the outstanding indebtedness under the revolving bank credit facility.
The 4.50% Convertible Notes bear interest at a rate of 4.50% per year, payable semiannually in arrears on May 1 and November 1 of each year, beginning May 1, 2010. The 4.50% Convertible Notes mature on May 1, 2015, unless earlier converted or repurchased by us. Holders may convert their notes prior to the close of business on the business day immediately preceding February 1, 2015, only under the following circumstances:
| • | during any fiscal quarter commencing after January 1, 2010, if the last reported sale price of our common stock for at least 20 trading days during a period of 30 consecutive trading days ending on the last trading day of the preceding fiscal quarter is greater than or equal to 130% of the applicable conversion price on each such trading day; |
| • | during the five business-day period after any five consecutive trading-day period in which the trading price per $1,000 principal amount of 4.50% Convertible Notes for each day of such five consecutive trading-day period was less than 98% of the product of the last reported sale price of our common stock and the applicable conversion rate on each such day; |
| • | upon the occurrence of a corporate event pursuant to which: (1) we issue rights to all or substantially all of the holders of our common stock entitling them to purchase, for a period of not more than 60 calendar days after the announcement date of such issuance to subscribe for or purchase, shares of our common stock at a price per share less than the average of the last reported sale prices of our common stock for the 10 consecutive trading day period ending on the trading day immediately preceding the date of announcement of such issuance; (2) we distribute to all or substantially all of the holders of our common stock our assets, debt securities or rights to purchase our securities, if the distribution has a per share value in excess of 10% of the last reported sale price for our common stock on the trading day immediately preceding the date of announcement of such distribution; or (3) we are a party to a consolidation, merger, binding share exchange, or transfer or lease of all or substantially all of our assets, pursuant to which our common stock would be converted into cash, securities or other assets; |
| • | if: (1) a “person” or “group” within the meaning of Section 13(d) of the Exchange Act acquires more than 50% of our outstanding voting stock, (2) we consummate a recapitalization, reclassification or change of our common stock as a result of which our common stock would be converted into or exchanged for stock, other securities, other property or assets, less than 90% of which received by our common shareholders consists of publicly traded securities, (3) we consummate a share exchange, consolidation or merger pursuant to which our common stock will be converted into cash, securities or other property, (4) we consummate any sale, lease or other transfer in one transaction or a series of transactions of all or substantially all of our and our subsidiaries’ consolidated assets to any person other than one of our subsidiaries, (5) continuing directors cease to constitute at least a majority of our board of directors, (6) our shareholders approve any plan or proposal for our liquidation or dissolution, or (7) our common stock ceases to be listed on any of The New York Stock Exchange, The NASDAQ Global Select Market or The NASDAQ Global Market; or |
| • | if we call the 4.50% Convertible Notes for redemption, at any time prior to the close of business on the business day prior to the redemption date (any of the events described in the fourth and fifth bullets above, a “make-whole fundamental change”). |
62
Table of Contents
On and after February 1, 2015 until the close of business on the business day immediately preceding the maturity date, holders may convert their 4.50% Convertible Notes, in multiples of $1,000 principal amount, at the option of the holder regardless of the foregoing circumstances.
Upon conversion, we will satisfy our conversion obligation by paying or delivering cash, shares of our common stock or a combination of cash and shares of our common stock, at our election. The conversion rate is initially 53.3333 shares of our common stock per $1,000 principal amount of 4.50% Convertible Notes (equivalent to a conversion price of approximately $18.75 per share of our common stock). The conversion rate is subject to adjustment in some events but will not be adjusted for accrued and unpaid interest. In addition, following any make-whole fundamental change that occurs prior to the maturity date, we will increase the conversion rate for a holder who elects to convert its 4.50% Convertible Notes in connection with such a make-whole fundamental change in certain circumstances. The increase in the conversion rate is determined based on a formula that takes into consideration our stock price at the time of the make-whole fundamental change (ranging from $15.00 to $100.00 per share) and the remaining time to maturity of the 4.50% Convertible Notes. The increase in the conversion rate declines from a high of 25.0% to 0.0% as the stock price at the time of the make-whole fundamental change increases from $15.00 and the remaining time to maturity of the 4.50% Convertible Notes decreases.
On or after November 1, 2012, and prior to the maturity date, we may redeem for cash all, but not less than all, of the 4.50% Convertible Notes if the last reported sales price of our common stock equals or exceeds 130% of the conversion price then in effect for 20 or more trading days in a period of 30 consecutive trading days ending on the trading day immediately prior to the date of the redemption notice. The redemption price will equal 100% of the principal amount of the 4.50% Convertible Notes to be redeemed plus any accrued and unpaid interest, including any additional interest, to, but excluding, the redemption date. To the extent a holder converts its 4.50% Convertible Notes in connection with our redemption notice, we will increase the conversion rate as described in the preceding paragraph.
The 4.50% Convertible Notes are senior, unsecured obligations of the Company and rank equally in right of payment with our senior unsecured debt and our existing 5.00% Convertible Notes, and are senior in right of payment to our debt that is expressly subordinated to the 4.50% Convertible Notes, if any. The 4.50% Convertible Notes are structurally subordinated to all debt and other liabilities and commitments of our subsidiaries, including our subsidiaries’ guarantees of our indebtedness under our revolving bank credit facility, and are effectively junior to our secured debt to the extent of the assets securing such debt.
Senior Notes. On February 9, 2011, we successfully completed the issuance and sale of $200,000,000 aggregate principal amount of 11.375% Senior Notes due 2019 (the “Senior Notes”). The Senior Notes are jointly and severally, and unconditionally, guaranteed (the “Guarantees”) on a senior unsecured basis initially by two of our wholly-owned subsidiaries, and all of our future subsidiaries other than immaterial subsidiaries (such guarantors, the “Guarantors”). The Senior Notes and the Guarantees were issued pursuant to an indenture dated as of February 9, 2011 (the “Indenture”), by and among the Company, the Guarantors party thereto and The Bank of New York Mellon Trust Company, N.A., a national banking association, as trustee (the “Trustee”).
Interest on the Senior Notes will accrue from and including February 9, 2011 at a rate of 11.375% per year. Interest on the Senior Notes is payable semi-annually in arrears on February 15 and August 15 of each year, commencing on August 15, 2011. The Senior Notes mature on February 15, 2019.
The Indenture contains covenants that, among other things, limit the Company’s ability and the ability of certain of its subsidiaries to:
| • | incur additional indebtedness; |
| • | issue preferred stock; |
| • | pay dividends or repurchase or redeem capital stock; |
63
Table of Contents
| • | make certain investments; |
| • | incur liens; |
| • | enter into certain types of transactions with its affiliates; |
| • | limit dividends or other payments by the Company’s restricted subsidiaries to the Company; and |
| • | sell assets, or consolidate or merge with or into other companies. |
These limitations are subject to a number of important exceptions and qualifications.
Upon an Event of Default (as defined in the Indenture), the Trustee or the holders of at least 25% in aggregate principal amount of the Senior Notes then outstanding may declare the entire principal of all the Notes to be due and payable immediately.
At any time on or prior to February 15, 2014, we may, at our option, redeem up to 35% of the Senior Notes, including additional notes, with the proceeds of certain public offerings of our common stock at a price of 111.375% of their principal amount plus accrued interest, provided that: (i) at least 65% of the aggregate principal amount of the notes originally issued remains outstanding after the redemption; and (ii) the redemption occurs within 90 days after the closing of the related public offering.
At any time on or prior to February 15, 2015, we may, at our option, redeem the Senior Notes at a redemption price equal to 100% of the aggregate principal amount thereof, plus accrued and unpaid interest, if any, to the redemption date plus a “make-whole” premium.
On or after February 15, 2015, we may, at our option, redeem some or all of the Senior Notes at any time at the redemption prices set forth below, plus accrued and unpaid interest, if any, to the redemption date:
| Year |
Percentage | |||
| 2015 |
108.531 | % | ||
| 2016 |
105.688 | % | ||
| 2017 |
102.844 | % | ||
| 2018 and thereafter |
100.000 | % | ||
If we experience certain kinds of changes of control, holders of the Senior Notes will be entitled to require us to purchase all or a portion of the Senior Notes at 101% of their principal amount, plus accrued and unpaid interest to the date of repurchase.
Senior Subordinated Secured Notes. In July 2007, we entered into a Note Purchase Agreement (“Note Agreement”) with The Prudential Insurance Company of America (“Prudential”) providing for the issuance and sale from time to time of up to $100 million in senior subordinated secured notes (the “Secured Notes”) and sold to Prudential an initial tranche of $30 million of 7.58% Series A fixed rate notes due July 31, 2012 with interest payable quarterly. Proceeds from the sale of the Secured Notes were used for general corporate purposes including additional funding of drilling and development costs in the Cotton Valley Sands in East Texas. On October 18, 2009, the Company entered into an amendment with Prudential to provide for the repayment of the outstanding indebtedness of the Secured Notes. The Company repaid all of the outstanding indebtedness under the Secured Notes with a portion of the proceeds from the 4.50% Convertible Notes issued in October 2009. The terms of the repayment included a prepayment penalty of $4.6 million.
Share Lending Agreement
In February 2008, in connection with the offer and sale of the 5.00% Convertible Notes, we entered into a share lending agreement (the “Share Lending Agreement”) with an affiliate of Jefferies & Company, Inc. (the
64
Table of Contents
“share borrower”) and Jefferies & Company, Inc., as collateral agent for the Company. Under this agreement, we will loan to the share borrower up to the maximum number of shares of our common stock underlying the 5.00% Convertible Notes during a specified loan availability period. This maximum number of shares is initially 3,846,150 shares. We will receive a loan fee of $0.001 per share for each share of our common stock that we loan to the share borrower, payable at the time such shares are borrowed. The share borrower may borrow and re-borrow up to the maximum number of shares of our common stock during the loan availability period. As of December 31, 2010, 2,640,000 shares of our common stock were subject to outstanding loans to the share borrower. 500,000 of such shares were returned to us in March 2010.
The share borrower’s obligations under the Share Lending Agreement are unconditionally guaranteed by Jefferies Group, Inc., the ultimate parent company of the share borrower and Jefferies & Company, Inc. (the “guarantor”). If the guarantor receives a rating downgrade for its long term unsecured and unsubordinated debt below a specified level by both Standard & Poor’s Ratings Services and Moody’s Investors Service, Inc. (or any substitute rating agency mutually agreed upon by the Company and the share borrower), or by either of such rating agencies in certain circumstances, the share borrower has agreed to post and maintain with Jefferies & Company, Inc., acting as collateral agent for the Company, collateral in the form of cash, government securities, certificates of deposit, high-grade commercial paper of U.S. issuers, letters of credit or money market shares with a market value at least equal to 100% of the market value of the shares of our common stock borrowed by the share borrower as security for the share borrower’s obligation to return the borrowed shares to the Company pursuant to the Share Lending Agreement.
The loan availability period under the Share Lending Agreement commenced on the date of the Share Lending Agreement and will continue until the date that any of the following occurs:
| • | we notify the share borrower in writing of our intention to terminate the Share Lending Agreement at any time after the entire principal amount of the 5.00% Convertible Notes ceases to be outstanding as a result of conversion, repurchase, at maturity or otherwise; |
| • | we and the share borrower agree to terminate the Share Lending Agreement; |
| • | we elect to terminate all of the outstanding loans upon a default by the share borrower under the Share Lending Agreement or by the guarantor under its guarantee, including a breach by the share borrower of any of its obligations or a breach in any material respect of any of the representations or covenants under the Share Lending Agreement or a breach by the guarantor of the guarantee, or the bankruptcy of the share borrower or the guarantor; or |
| • | the share borrower elects to terminate all outstanding loans upon the bankruptcy of the Company. |
Any shares we loan to the share borrower will be issued and outstanding for corporate law purposes, and accordingly, the holders of the borrowed shares will have all of the rights of a holder of a share of our outstanding common stock, including the right to vote the shares on all matters submitted to a vote of the Company’s shareholders and the right to receive any dividends or other distributions that we may pay or make on our outstanding shares of common stock. However, under the Share Lending Agreement, the share borrower has agreed:
| • | not to vote any shares of the Company’s common stock it has borrowed to the extent it owns such borrowed shares; and |
| • | to pay to us an amount equal to any cash dividends that we pay on the borrowed shares. |
Under U.S. generally accepted accounting principles currently in effect, the borrowed shares will not be considered outstanding for the purpose of computing and reporting our earnings per share.
Common and Preferred Stock Offerings
We had no common stock offerings for the year ended December 31, 2010.
65
Table of Contents
In December 2010 the Company announced an at-the-market offering for up to $62,712,500 of its 9.25% Series B Cumulative Preferred Stock (liquidation preference of $25.00). In December 2010, the Company sold 41,169 shares of preferred stock for an average price of $23.81 per share. Net proceeds to the Company were approximately $1.0 million. The Company used the net proceeds from the offering for working capital.
In February 2011, we completed an offering of 21,075,000 shares of common stock at a price of $4.75 per share. Net proceeds to the Company were $93.6 million after underwriter fees. The Underwriters also exercised an option to purchase an additional 1,098,518 shares from the Company for additional net proceeds of $4.9 million after underwriters’ fees. The Company expects to use the net proceeds, together with proceeds from a concurrent private placement of senior notes, to fund an offer to purchase up to $50.0 million of its 5.00% convertible senior notes due 2013, (ii) to repay the current outstanding balance under its secured revolving credit facility, (iii) to fund the cash portion of the purchase price of pending acquisitions of undeveloped oil and gas leases for approximately $69.5 million, (iv) to fund its exploration and development program and (v) for other general corporate purposes.
2011 Note Offerings and Sale
On February 9, 2011, the Company successfully completed the issuance and sale of $200,000,000 aggregate principal amount of 11.375% Senior Notes due 2019 (the “Notes”). The Notes are jointly and severally, and unconditionally, guaranteed (the “Guarantees”) on a senior unsecured basis initially by two of the Company’s wholly-owned subsidiaries, and all of the Company’s future subsidiaries other than immaterial subsidiaries (such guarantors, the “Guarantors”). The Notes and the Guarantees were offered and sold in private transactions in accordance with Rule 144A and Regulation S under the Securities Act of 1933, as amended (the “Securities Act”). The Notes and Guarantees have not been registered under the Securities Act or applicable state securities laws and may not be offered or sold in the United States absent registration or an applicable exemption from the registration requirements of the Securities Act and applicable state laws.
The purchase price for the Notes and Guarantees was 96.833% of their principal amount. The net proceeds from the issuance of the Notes were approximately $187.2 million after discounts and underwriters’ fees. The Company intends to use the net proceeds of this offering (i) to fund an offer to purchase up to $50.0 million of our 5.00% convertible senior notes due 2013, (ii) to repay the current outstanding balance under its secured revolving credit facility, (iii) to fund the cash portion of the purchase price of pending acquisitions of undeveloped oil and gas leases for approximately $69.5 million, (iv) to fund our exploration and development program and (v) for other general corporate purposes.
Interest on the Notes will accrue from and including February 9, 2011 at a rate of 11.375% per year. Interest on the Notes is payable semi-annually in arrears on February 15 and August 15 of each year, commencing on August 15, 2011. The Notes mature on February 15, 2019.
Working Capital
At December 31, 2010, we had working capital of $0.6 million. Including availability under our credit facility, our working capital as of December 31, 2010 would have been $38.6 million.
66
Table of Contents
Contractual Obligations
The following table reflects the Company’s contractual obligations as of December 31, 2010:
| Payments Due by Period | ||||||||||||||||||||
| Total | Less than 1 year |
1-3 years | 3-5 years | More than 5 years |
||||||||||||||||
| (in thousands) | ||||||||||||||||||||
| Long-term debt |
$ | 301,000 | $ | — | $ | 214,750 | $ | 86,250 | $ | — | ||||||||||
| Interest on long-term debt |
38,726 | 15,779 | 17,772 | 5,175 | — | |||||||||||||||
| Operating leases |
4,757 | 1,129 | 1,920 | 1,045 | 663 | |||||||||||||||
| Drilling contracts |
46,564 | 22,948 | 23,616 | — | — | |||||||||||||||
| Transportation agreements |
52,892 | 6,043 | 12,539 | 11,638 | 22,672 | |||||||||||||||
| Deferred premiums on derivative instruments |
18,242 | 7,367 | 10,875 | — | — | |||||||||||||||
| Asset retirement obligations |
7,278 | 406 | 544 | 33 | 6,295 | |||||||||||||||
| 75% PVOG financing(1) |
1,366 | 26 | 34 | 11 | 1,295 | |||||||||||||||
| Total |
$ | 470,825 | $ | 53,698 | $ | 282,050 | $ | 104,152 | $ | 30,925 | ||||||||||
| (1) | PVOG financing is payable out of 75% of revenues from the wells financed and repayment is based on estimated production which may vary from actual. |
Other than obligations under our revolving bank credit facility, the 5.00% Convertible Notes, the 4.50% Convertible Notes, the PVOG financing and operating leases, our commitments relate to capital expenditures for development of oil and natural gas properties. We will not enter into drilling or development commitments until such time as a source of funding for such commitments is known to be available, either through financing proceeds, internal cash flow, additional funding under our revolving bank credit facility or working capital.
Off-Balance Sheet Arrangements
We do not currently utilize any off-balance sheet arrangements to enhance our liquidity and capital resources position or for any other purpose.
Critical Accounting Policies
The preparation of the consolidated financial statements requires us to make a number of estimates and assumptions relating to the reported amounts of assets and liabilities and the disclosures of contingent assets and liabilities at the date of the consolidated financial statements and the reported amounts of revenues and expenses during the period. When alternatives exist among various accounting methods, the choice of accounting method can have a significant impact on reported amounts. The following is a discussion of our accounting estimates and judgments which management believes are most significant in its application of generally accepted accounting principles used in the preparation of the consolidated financial statements.
Full Cost Method of Accounting
The accounting for our business is subject to special accounting rules that are unique to the oil and natural gas industry. There are two allowable methods of accounting for oil and natural gas business activities: the successful efforts method and the full cost method. We follow the full cost method of accounting under which all costs associated with property acquisition, exploration and development activities are capitalized. We also capitalize internal costs that can be directly identified with our acquisition, exploration and development activities and do not include any costs related to production, general corporate overhead or similar activities. Under the successful efforts method, geological and geophysical costs and costs of carrying and retaining undeveloped properties are charged to expense as incurred. Costs of drilling exploratory wells that do not result in proved reserves are charged to expense. Depreciation, depletion, amortization and impairment of oil and
67
Table of Contents
natural gas properties are generally calculated on a well by well or lease or field basis versus the aggregated “full cost” pool basis. Depreciation, depletion and amortization of oil and gas properties (“DD&A”) are provided using the units-of-production method based on estimates of proved oil and gas reserves and production, which are converted to a common unit of measure based upon their relative energy content. The Company’s cost basis for depletion includes estimated future development costs to be incurred on proved undeveloped properties. Additionally, gain or loss is generally recognized on all sales of oil and natural gas properties under the successful efforts method. As a result, our financial statements will differ from companies that apply the successful efforts method since we will generally reflect a higher level of capitalized costs as well as a higher oil and natural gas depreciation, depletion and amortization rate, although this difference could change in periods of lower price environments that result in write-downs of our costs as described below.
The full cost method subjects companies to quarterly calculations of a “ceiling,” or limitation on the amount of costs that can be capitalized on the balance sheet. If our capitalized costs are in excess of the calculated ceiling, the excess must be written off as an expense. Our discounted present value of estimated future net revenues (adjusted for cash flow hedges) from our proved oil and natural gas reserves is a major component of the ceiling calculation, and represents the component that requires the most subjective judgments. Estimates of reserves are forecasts based on engineering data, projected future rates of production and the timing of future expenditures. The process of estimating oil and natural gas reserves requires substantial judgment, resulting in imprecise determinations, particularly for new discoveries.
The passage of time provides more qualitative information regarding estimates of reserves, and revisions are made to prior estimates to reflect updated information. Annual performance revisions have occurred over the past years, which have both increased and decreased in individual years. There can be no assurance that more significant revisions will not be necessary in the future. If future significant revisions are necessary that reduce previously estimated reserve quantities, it could result in a write-down of our capitalized costs. In addition to the impact of the estimates of proved reserves on the calculation of the ceiling, estimates of proved reserves are also a significant component of the calculation of the full cost pool, depreciation, depletion and amortization.
The estimates of proved undeveloped reserve quantities and values are based on estimated future drilling which assumes that we will have the financing available to fund the estimated drilling costs. If we do not have such financing available at the time projected, the estimates of proved undeveloped reserve quantities and values will change.
While the quantities of proved reserves require substantial judgment, the associated prices of oil and natural gas reserves that are included in the discounted present value of the reserves do not require judgment. The ceiling calculation dictates that prices used in the determination of future net revenues represent the average of the first day of the month price for the 12-month period prior to the end of the quarterly period. Therefore, the future net revenues associated with the estimated proved reserves are not based on our assessment of future prices, but rather are based on prices in effect 12 months prior to each quarter when the ceiling calculation is performed. Such prices are utilized except where different prices are fixed and determinable from applicable contracts for the remaining term of those contracts, including the effects of derivatives qualifying as cash flow hedges. Based on the average first-day-of-the-month prices for natural gas and oil during the 12-months of 2010 and 2009, these cash flow hedges increased the full-cost ceiling by $52.3 million and $69.7 million, respectively, thereby reducing the ceiling test write-down by the same amount. Prior to December 31, 2009, the SEC rules required the use of the year-end price in the determination of future net revenues.
Because prices are held constant indefinitely, the resulting value is not indicative of the true fair value of the reserves. Oil and natural gas prices have historically been cyclical and can be either substantially higher or lower than various industry long-term price forecasts. Therefore, oil and natural gas property write-downs that result from applying the full cost ceiling limitation rules, and that are caused by fluctuations in price as opposed to reductions in the underlying quantities of reserves, should not be viewed as absolute indicators of a reduction of the ultimate value of the related reserves.
68
Table of Contents
Capitalized costs are amortized on a composite unit-of-production method based on proved oil and natural gas reserves. Depreciation, depletion and amortization expense is also based on the amount of estimated reserves. If we maintain the same level of production year over year, the depreciation, depletion and amortization expense may be significantly different if our estimate of remaining reserves changes significantly.
Because of the volatile nature of crude oil and natural gas prices, it is not possible to predict the timing or magnitude of full cost writedowns.
Asset Retirement Obligations
Our asset retirement obligations (“ARO”) consist primarily of estimated costs of dismantlement, removal, site reclamation and similar activities associated with our oil and natural gas properties. We recognize the discounted fair value of a liability for an ARO in the period in which it is incurred with the associated asset retirement cost capitalized as part of the carrying cost of the oil and natural gas asset. The recognition of an ARO requires that management make numerous estimates, assumptions and judgments regarding such factors as the existence of a legal obligation for an ARO; estimated probabilities, amounts and timing of settlements; the credit-adjusted risk-free rate to be used; inflation rates; and future advances in technology. In periods subsequent to initial measurement of the ARO, the Company must recognize period-to-period changes in the liability resulting from the passage of time and revisions to either the timing or the amount of the original estimate of undiscounted cash flows. The related accretion of the liability is charged as an expense on the consolidated statement of operations.
Income Taxes
As part of the process of preparing the consolidated financial statements, we are required to estimate the federal and state income taxes in each of the jurisdictions in which we operate. This process involves estimating the actual current tax exposure together with assessing temporary differences resulting from differing treatment of items, such as derivative instruments, depreciation, depletion and amortization, and certain accrued liabilities for tax and accounting purposes. These differences and the net operating loss carryforwards result in deferred tax assets and liabilities, which are included in our consolidated balance sheet. We must then assess, using all available positive and negative evidence, the likelihood that it is more likely than not that the deferred tax assets will be recovered from future taxable income. If we believe that it is reasonable that the deferred tax assets will not be recovered in the future, we must establish a valuation allowance. Generally, to the extent we establish a valuation allowance or increase or decrease this allowance in a period, we must include an expense or reduction of expense within the tax provisions in the consolidated statement of operations.
Derivative Instruments
We recognize derivative instruments at fair value. Upon entering into a derivative contract, we may designate the derivative as either a fair value hedge or a cash flow hedge, or decide that the contract is not a hedge, and thenceforth, mark the contract to market through earnings. We document the relationship between the derivative instrument designated as a hedge and the hedged items, as well as our objective for risk management and strategy for use of the hedging instrument to manage the risk. Derivative instruments designated as cash flow hedges are linked to specific forecasted transactions. We assess at inception, and on an ongoing basis, whether a derivative instrument used as a hedge is highly effective in offsetting changes in the fair value or cash flows of the hedged item. A derivative that is not a highly effective hedge does not qualify for hedge accounting.
Changes in fair value of a qualifying cash flow hedge are recorded in accumulated other comprehensive income, until earnings are affected by the cash flows of the hedged item. When the cash flow of the hedged item is recognized in the statement of operations, the fair value of the associated cash flow hedge is reclassified from accumulated other comprehensive income into earnings as a component of oil and gas sales. Ineffective portions of a cash flow hedge are recognized currently as a component of oil and gas sales. The changes in fair value of
69
Table of Contents
derivative instruments not qualifying or not designated as hedges are reported currently in the consolidated statement of operations as unrealized gains (losses) on derivatives, a component of non-operating income (expense). If a derivative instrument no longer qualifies as a cash flow hedge, hedge accounting is discontinued and the gain or loss that was recorded in accumulated other comprehensive income is recognized over the period anticipated in the original hedge transaction.
Oil and Gas Revenues
Oil and natural gas revenues are recognized when sold to a purchaser at a fixed or determinable price, when delivery has occurred and title has transferred, and if collectability of the revenue is probable. Delivery occurs and title is transferred when production has been delivered to a purchaser’s pipeline or truck. As a result of the numerous requirements necessary to gather information from purchasers or various measurement locations, calculate volumes produced, perform field and wellhead allocations and distribute and disburse funds to various working interest partners and royalty owners, the collection of revenues from oil and gas production may take up to 60 days following the month of production. Therefore, we make accruals for revenues and accounts receivable based on estimates of our share of production, particularly from properties that are operated by others. Since the settlement process may take 30 to 60 days following the month of actual production, our financial results include estimates of production and revenues for the related time period. We record any differences, which we do not expect to be significant, between the actual amounts ultimately received and the original estimates in the period they become finalized.
During the course of normal operations, the Company and other joint interest owners of natural gas reservoirs will take more or less than their respective ownership share of the natural gas volumes produced. These volumetric imbalances are monitored over the lives of the wells’ production capability. If an imbalance exists at the time the wells’ reserves are depleted, cash settlements are made among the joint interest owners under a variety of arrangements. The Company follows the sales method of accounting for gas imbalances. A liability is recorded when the Company’s excess takes of natural gas volumes exceed its estimated remaining recoverable reserves. No receivables are recorded for those wells where the Company has taken less than its ownership share of gas production. There are no significant imbalances as of December 31, 2010, 2009 or 2008.
Other
See Note A—Nature of Operations and Summary of Significant Accounting Policies, to the Consolidated Financial Statements for information related to other accounting and reporting policies.
Recently Issued Accounting Pronouncements
See Note A—Nature of Operations and Summary of Significant Accounting Policies, to the Consolidated Financial Statements for a discussion of recently issued accounting pronouncements.
Price Risk Management
See Item 7A—Quantitative and Qualitative Disclosures About Market Risk.
| Item 7A. | Quantitative and Qualitative Disclosures About Market Risk. |
Commodity Price Risk
We are subject to price fluctuations of natural gas and crude oil. Prices received for natural gas and crude oil sold on the spot market are volatile due to factors beyond our control. Reductions in crude oil and natural gas prices could have a material adverse effect on our financial position, results of operations, capital expenditures and quantities of reserves recoverable on an economic basis. Any reduction in reserves, including reductions due
70
Table of Contents
to lower prices, can reduce our borrowing base under our revolving bank credit facility and adversely affect our liquidity and our ability to obtain capital for our acquisition and development activities.
To mitigate a portion of our exposure to fluctuations in commodity prices, we enter into financial price risk management activities with respect to a portion of projected crude oil and natural gas production through financial price commodity swaps, collars and put spreads. Our revolving bank credit facility requires us to maintain a hedging program on mutually acceptable terms whenever the loan amount outstanding exceeds 75% of the borrowing base.
Following is a summary of the outstanding natural gas derivative contracts we have in place as of December 31, 2010:
| Effective Date |
Maturity Date |
Notional Amount Per Month |
Remaining Notional Amount as of December 31, 2010 |
Additional Put Options |
Floor | Ceiling | ||||||||||||||||||
| Natural Gas (MMBtu): |
||||||||||||||||||||||||
| 1/1/2011 |
12/31/2012 | 155,337 | 3,728,100 | — | $ | 7.00 | ||||||||||||||||||
| 1/1/2011 |
12/31/2011 | 188,781 | 2,265,372 | — | $ | 8.00 | ||||||||||||||||||
| 1/1/2011 |
3/31/2011 | 200,000 | 600,000 | $ | 5.00 | $ | 7.00 | $ | 7.25 | |||||||||||||||
| 1/1/2011 |
3/31/2011 | 200,000 | 600,000 | — | $ | 8.90 | ||||||||||||||||||
| 4/1/2011 |
10/31/2011 | 200,000 | 1,400,000 | $ | 5.00 | $ | 6.50 | $ | 8.30 | |||||||||||||||
| 11/1/2011 |
3/31/2012 | 200,000 | 1,000,000 | $ | 5.50 | $ | 7.00 | $ | 10.10 | |||||||||||||||
| 1/1/2011 |
12/31/2012 | 1,021,666 | 24,520,000 | $ | 4.00 | $ | 6.00 | $ | — | |||||||||||||||
| 1/1/2011 |
12/31/2012 | 167,612 | 4,022,697 | $ | 4.50 | $ | 6.25 | $ | — | |||||||||||||||
| Crude Oil (Bbls): |
||||||||||||||||||||||||
| 1/1/2011 |
12/31/2011 | 3,042 | 36,500 | $ | — | $ | 100.00 | |||||||||||||||||
The estimated total fair value of our derivative contracts in effect at December 31, 2010 was an asset of $37.0 million, of which $19.5 million is classified as a current asset and $17.5 million is classified as a long-term asset. The asset at December 31, 2010, reflects the fact that the prices under our derivative contracts in the aggregate are higher than period end forward prices. The fair value of these contracts varies based on commodity prices. While we will not recognize the benefit from commodity prices in excess of our fixed prices, we mitigate the risk of lower prices.
Based on the monthly notional amount for natural gas in effect at December 31, 2010, a hypothetical $0.10 increase in natural gas prices would have decreased the fair value of our natural gas swaps and options by $3.3 million and a $0.10 decrease in natural gas prices would increase the fair value of our natural gas swaps and options by $3.6 million.
Interest Rate Risk
Our revolving bank credit facility bears interest at a rate elected by us that is based on the prime, LIBO or federal funds rate plus margins ranging from 1 to 6% depending on the base rate used and the amount of the loan outstanding in relation to the borrowing base. The Company is obligated to pay a facility fee equal to 0.5% per year of the unused portion of the borrowing base payable quarterly. As a result, our interest costs fluctuate based on short-term interest rates relating to our credit facility. We had no interest rate derivatives during the years ended December 31, 2009 or 2010. Based on borrowings outstanding as of December 31, 2010, a 100 basis point change in interest rates would change our annual interest expense by approximately $0.9 million for the year ended December 31, 2010.
Our $125 million of 5.00% Convertible Notes and $86 million of 4.50% Convertible Notes have fixed interest rates.
71
Table of Contents
| Item 8. | Financial Statements and Supplementary Data. |
Our consolidated financial statements are presented beginning on page F-1 found at the end of this report.
| Item 9. | Changes in and Disagreements With Accountants on Accounting and Financial Disclosure. |
None.
| Item 9A. | Controls and Procedures. |
Controls and Procedures
Our principal executive officer and principal financial officer have reviewed and evaluated the effectiveness of our disclosure controls and procedures (as defined in Exchange Act Rule 13a-15(e)) as of December 31, 2010. Disclosure controls and procedures include, without limitation, controls and procedures designed to provide us with reasonable assurance that information required to be disclosed by us in the reports that we file or submit under the Exchange Act is recorded, processed, summarized and reported within the time periods specified in the SEC’s rules and forms and is accumulated and communicated to our management, including our principal executive officer and principal financial officer, or persons performing similar functions, as appropriate to allow timely decisions regarding required disclosures. A control system, no matter how well conceived and operated, can provide only reasonable, not absolute, assurance that the objectives of the control system are met. Further, the design of a control system must reflect the fact that there are resource constraints, and the benefits of controls must be considered relative to their costs. Our disclosure controls and procedures are designed to provide us with reasonable assurance of achieving their objective. Based on that evaluation and what is described below in Management’s Annual Report on Internal Control over Financial Reporting, our principal executive officer and principal financial officer have concluded that our disclosure controls and procedures were effective as of December 31, 2010.
Changes in Internal Control Over Financial Reporting
During the fourth quarter of 2010, no change occurred in our internal control over financial reporting that materially affected, or is likely to materially affect, our internal control over financial reporting.
Management’s Annual Report on Internal Control over Financial Reporting
Our management is responsible for establishing and maintaining adequate internal control over financial reporting as defined in Exchange Act Rules 13a-15(f) and 15d-15(f). Our system of internal control over financial reporting is designed to provide reasonable assurance regarding the reliability of financial reporting and the preparation of financial statements for external purposes in accordance with generally accepted accounting principles. Our internal control over financial reporting includes those policies and procedures that (i) pertain to the maintenance of records that, in reasonable detail, accurately and fairly reflect the transactions and dispositions of our assets; (ii) provide reasonable assurance that transactions are recorded as necessary to permit preparation of financial statements in accordance with generally accepted accounting principles, and that our receipts and expenditures are being made only in accordance with authorizations of our management and directors; and (iii) provide reasonable assurance regarding prevention or timely detection of unauthorized acquisition, use, or disposition of our assets that could have a material effect on the financial statements.
Because of its inherent limitations, internal control over financial reporting may not prevent or detect misstatements. Also, projections of any evaluation of effectiveness to future periods are subject to the risk that controls may become inadequate because of changes in conditions, or that the degree of compliance with the policies or procedures may deteriorate.
72
Table of Contents
In order to evaluate the effectiveness of internal control over financial reporting, as required by Section 404 of the Sarbanes-Oxley Act, our management, including our principal executive officer and principal financial officer, conducted an assessment, including testing, using the criteria in Internal Control—Integrated Framework, issued by the Committee of Sponsoring Organizations of the Treadway Commission (“COSO”).
Based on our evaluation under the framework in Internal Control – Integrated Framework, we have concluded that our internal control over financial reporting was effective as of December 31, 2010.
Grant Thornton LLP, our independent registered public accounting firm, audited the Company’s internal control over financial reporting and, based on that audit, issued the attestation report that follows.
| /s/ Ken L. Kenworthy, Jr. |
| Ken L. Kenworthy, Jr. Chief Financial Officer |
| /s/ James A. Merrill |
| James A. Merrill Chief Financial Officer |
73
Table of Contents
REPORT OF INDEPENDENT REGISTERED PUBLIC ACCOUNTING FIRM
Board of Directors and Shareholders
GMX Resources Inc.
We have audited GMX Resources Inc. (an Oklahoma corporation) and Subsidiaries’ (collectively, the “Company”) internal control over financial reporting as of December 31, 2010, based on criteria established in Internal Control—Integrated Framework issued by the Committee of Sponsoring Organizations of the Treadway Commission (COSO). The Company’s management is responsible for maintaining effective internal control over financial reporting and for its assessment of the effectiveness of internal control over financial reporting, included in the accompanying Management’s Annual Report on Internal Control Over Financial Reporting. Our responsibility is to express an opinion on the Company’s internal control over financial reporting based on our audit.
We conducted our audit in accordance with the standards of the Public Company Accounting Oversight Board (United States). Those standards require that we plan and perform the audit to obtain reasonable assurance about whether effective internal control over financial reporting was maintained in all material respects. Our audit included obtaining an understanding of internal control over financial reporting, assessing the risk that a material weakness exists, testing and evaluating the design and operating effectiveness of internal control based on the assessed risk, and performing such other procedures as we considered necessary in the circumstances. We believe that our audit provides a reasonable basis for our opinion.
A company’s internal control over financial reporting is a process designed to provide reasonable assurance regarding the reliability of financial reporting and the preparation of financial statements for external purposes in accordance with generally accepted accounting principles. A company’s internal control over financial reporting includes those policies and procedures that (1) pertain to the maintenance of records that, in reasonable detail, accurately and fairly reflect the transactions and dispositions of the assets of the company; (2) provide reasonable assurance that transactions are recorded as necessary to permit preparation of financial statements in accordance with generally accepted accounting principles, and that receipts and expenditures of the company are being made only in accordance with authorizations of management and directors of the company; and (3) provide reasonable assurance regarding prevention or timely detection of unauthorized acquisition, use, or disposition of the company’s assets that could have a material effect on the financial statements.
Because of its inherent limitations, internal control over financial reporting may not prevent or detect misstatements. Also, projections of any evaluation of effectiveness to future periods are subject to the risk that controls may become inadequate because of changes in conditions, or that the degree of compliance with the policies or procedures may deteriorate.
In our opinion, GMX Resources Inc. and Subsidiaries maintained, in all material respects, effective internal control over financial reporting as of December 31, 2010, based on criteria established in Internal Control—Integrated Framework issued by COSO.
We also have audited, in accordance with the standards of the Public Company Accounting Oversight Board (United States), the consolidated balance sheets of GMX Resources Inc. and Subsidiaries as of December 31, 2010 and 2009, and the related consolidated statements of operations, changes in equity, comprehensive income (loss) and cash flows for the years then ended and our report dated March 10, 2011 expressed an unqualified opinion.
/s/ GRANT THORNTON LLP
Oklahoma City, Oklahoma
March 10, 2011
74
Table of Contents
Certifications
Our chief executive and chief financial officers have completed the certifications required to be filed as an Exhibit to this Report (See Exhibits 31.1 and 31.2) relating to the design of our disclosure controls and procedures and the design of our internal control over financial reporting.
| Item 9B. | Other Information. |
None.
75
Table of Contents
In accordance with the provisions of General Instruction G(3), the information required by Items 10 through 14 of Part III of this Form 10-K is incorporated herein by reference to the Company’s definitive Proxy Statement for the 2011 Annual Meeting of Shareholders to be filed by the Company pursuant to Regulation 14A of the General Rules and Regulation under the Exchange Act prior to April 30, 2011.
Code of Business Conduct and Ethical Practices
We have adopted a Code of Business Conduct and Ethics. The Code of Business Conduct and Ethics is applicable to all employees and directors, including our principal executive officer, principal financial officer, principal accounting officer and persons performing similar functions. The Company has also adopted Corporate Governance Guidelines that apply to all directors. A copy of the Code of Business Conduct and Ethics and the Corporate Governance Guidelines, as well as the charters for the Audit, Compensation and Nominating/Corporate Governance Committees, are available under “Corporate Governance” at the Company’s web site, www.gmxresources.com. Copies of the Code of Business Conduct and Ethics may also be obtained free of charge on our website or by requesting a copy in writing from our Corporate Secretary at 9400 North Broadway, Suite 600, Oklahoma City, Oklahoma 73114. Any waivers of the Code of Business Conduct and Ethics must be approved by our board of directors (or a designated board committee). The Company intends to disclose amendments to, or waivers from, its Code of Business Conduct and Ethics and its Corporate Governance Guidelines by posting to its web site noted above.
76
Table of Contents
| Item 15. | Exhibits and Financial Statement Schedules. |
The following documents are filed as part of this report.
Financial Statements: See Index to Consolidated Financial Statements and Consolidated Financial Statement Schedule set forth on page F-1 of this report.
Exhibits: For a list of documents filed as exhibits to this report, see the Exhibit Index immediately preceding the Exhibits filed with this report.
77
Table of Contents
SIGNATURES
Pursuant to the requirements of Section 13 or 15(d) of the Securities Exchange Act of 1934, the Registrant has duly caused this report to be signed on its behalf by the undersigned, thereunto duly authorized.
| GMX RESOURCES INC. | ||||||||
| Dated: March 10, 2011 | By: | /s/ JAMES A. MERRILL | ||||||
| James A. Merrill, Chief Financial Officer | ||||||||
Pursuant to the requirement of the Securities Exchange Act of 1934, this report has been signed below by the following persons on behalf of the Registrant and in the capacities and on the dates indicated.
| Signatures |
Title |
Date | ||
| /s/ KEN L. KENWORTHY, JR. Ken L. Kenworthy, Jr. |
Chief Executive Officer and Director (Principal Executive Officer) | March 10, 2011 | ||
| /s/ JAMES A. MERRILL James A. Merrill |
Chief Financial Officer (Principal Financial and Accounting Officer) | March 10, 2011 | ||
| /s/ T. J. BOISMIER T. J. Boismier |
Director | March 10, 2011 | ||
| /s/ STEVEN CRAIG Steven Craig |
Director | March 10, 2011 | ||
| /s/ KEN L. KENWORTHY, SR. Ken L. Kenworthy, Sr. |
Director | March 10, 2011 | ||
| /s/ JON W. MCHUGH Jon W. McHugh |
Director | March 10, 2011 | ||
| /s/ MICHAEL G. COOK Michael G. Cook |
Director | March 10, 2011 | ||
| /s/ THOMAS G. CASSO Thomas G. Casso |
Director | March 10, 2011 | ||
78
Table of Contents
INDEX TO CONSOLIDATED FINANCIAL STATEMENTS
F-1
Table of Contents
REPORT OF INDEPENDENT REGISTERED PUBLIC ACCOUNTING FIRM
Board of Directors and Shareholders
GMX Resources Inc.
We have audited the accompanying consolidated balance sheets of GMX Resources Inc. (an Oklahoma corporation) and Subsidiaries (collectively, the “Company”) as of December 31, 2010 and 2009, and the related consolidated statements of operations, changes in equity, comprehensive income (loss) and cash flows for the years then ended. These financial statements are the responsibility of the Company’s management. Our responsibility is to express an opinion on these financial statements based on our audits.
We conducted our audits in accordance with the standards of the Public Company Accounting Oversight Board (United States). Those standards require that we plan and perform the audit to obtain reasonable assurance about whether the financial statements are free of material misstatement. An audit includes examining, on a test basis, evidence supporting the amounts and disclosures in the financial statements. An audit also includes assessing the accounting principles used and significant estimates made by management, as well as evaluating the overall financial statement presentation. We believe that our audits provide a reasonable basis for our opinion.
In our opinion, the consolidated financial statements referred to above present fairly, in all material respects, the financial position of GMX Resources Inc. and Subsidiaries as of December 31, 2010 and 2009, and the results of their operations and their cash flows for the years then ended in conformity with accounting principles generally accepted in the United States of America.
As discussed in Note A to the consolidated financial statements, the Company changed its method of estimating oil and gas reserves and related disclosures in 2009. Also, as discussed in Note B to the consolidated financial statements, the Company changed the manner in which it accounts for share lending arrangements, as of January 1, 2010, and retrospectively applied the effects of the adjustments to prior periods.
We also have audited the adjustments to the 2008 consolidated financial statements to retrospectively apply the change in accounting for share lending arrangements, as described in Note B to the consolidated financial statements. We also have audited the adjustments to the 2008 consolidated financial statements to retrospectively apply the changes in accounting for convertible notes that may be settled in cash upon conversion, as described in Note C to the consolidated financial statements included in the Company’s 2009 Annual Report on Form 10-K (not included herein). In our opinion, such adjustments are appropriate and have been properly applied. We were not engaged to audit, review, or apply any procedures to the 2008 financial statements of the Company other than with respect to such adjustments and, accordingly, we do not express an opinion or any other form of assurance on the 2008 financial statements taken as a whole.
We also have audited, in accordance with the standards of the Public Company Accounting Oversight Board (United States), GMX Resources Inc. and Subsidiaries’ internal control over financial reporting as of December 31, 2010, based on criteria established in Internal Control—Integrated Framework issued by the Committee of Sponsoring Organizations of the Treadway Commission (COSO) and our report dated March 10, 2011 expressed an unqualified opinion.
/s/ GRANT THORNTON LLP
Oklahoma City, Oklahoma
March 10, 2011
F-2
Table of Contents
REPORT OF INDEPENDENT REGISTERED PUBLIC ACCOUNTING FIRM
The Board of Directors and
Stockholders of GMX Resources Inc. and Subsidiaries
We have audited, before the effects of the adjustments, to retrospectively apply the change in accounting described in Note C (not presented herein) of the financial statements included in the Company’s 2009 Annual Report on Form 10-K and before the effects of the adjustments to retrospectively apply the change in accounting described in Note B (included herein), to the consolidated statements of operations, changes in equity, comprehensive income (loss), and cash flows of GMX Resources Inc. and Subsidiaries for the year ended December 31, 2008. (The 2008 financial statements before the effects of the aforementioned adjustments are not presented herein.) These financial statements are the responsibility of the company’s management. Our responsibility is to express an opinion on these financial statements based on our audit.
We conducted our audit in accordance with the standards of the Public Company Accounting Oversight Board (United States). Those standards require that we plan and perform the audit to obtain reasonable assurance about whether the financial statements are free of material misstatement. An audit includes examining, on a test basis, evidence supporting the amounts and disclosures in the financial statements. An audit also includes assessing the accounting principles used and significant estimates made by management, as well as evaluating the overall financial statement presentation. We believe that our audit provides a reasonable basis for our opinion.
As described in Note B (not presented herein) of the financial statements included in the Company’s 2009 Annual Report on Form 10-K, the 2008 financial statements have been restated to correct a material misstatement relating to the method used to record the Company’s full cost pool impairment charges and related deferred taxes and the computation of the Company’s diluted loss per share.
In our opinion, the 2008 financial statements presented herein, before the effects of the adjustments to retrospectively apply the change in accounting described in Note C (not presented herein) to the financial statements included in the Company’s 2009 Annual Report on Form 10-K and before the effects of the adjustments to retrospectively apply the change in accounting described in Note B (included herein), present fairly, in all material respects, the results of operations and cash flows of GMX Resources Inc. and Subsidiaries as of December 31, 2008, in conformity with generally accepted accounting principles in the United States of America.
We were not engaged to audit, review, or apply any procedures to the adjustments to retrospectively apply the change in accounting described in Note C (not presented herein) of the financial statements included in the Company’s 2009 Annual Report on Form 10-K or to the adjustments to retrospectively apply the change in accounting described in Note B (included herein) and, accordingly, we do not express an opinion or any other form of assurance about whether such adjustments are appropriate and have been properly applied. Those adjustments were audited by Grant Thornton LLP.
/s/ Smith, Carney & Co., p.c.
Oklahoma City, Oklahoma
February 27, 2009, except for the
restatement described in Note B
(not presented herein) of the Company’s
2009 Annual Report on Form 10-K,
as to which the date is March 16, 2010
F-3
Table of Contents
GMX Resources Inc. and Subsidiaries
Consolidated Balance Sheets
(dollars in thousands, except share data)
| December 31, | ||||||||
| 2010 | 2009 | |||||||
| (as adjusted) | ||||||||
| ASSETS | ||||||||
| CURRENT ASSETS: |
||||||||
| Cash and cash equivalents |
$ | 2,357 | $ | 35,554 | ||||
| Accounts receivable—interest owners |
5,339 | 1,233 | ||||||
| Accounts receivable—oil and natural gas revenues, net |
6,829 | 9,340 | ||||||
| Derivative instruments |
19,486 | 12,252 | ||||||
| Inventories |
326 | 326 | ||||||
| Prepaid expenses and deposits |
5,767 | 4,506 | ||||||
| Assets held for sale |
26,618 | — | ||||||
| Total current assets |
66,722 | 63,211 | ||||||
| OIL AND NATURAL GAS PROPERTIES, BASED ON THE FULL COST METHOD |
||||||||
| Properties being amortized |
938,701 | 756,412 | ||||||
| Properties not subject to amortization |
39,694 | 39,789 | ||||||
| Less accumulated depreciation, depletion, and impairment |
(630,632 | ) | (464,872 | ) | ||||
| 347,763 | 331,329 | |||||||
| PROPERTY AND EQUIPMENT, AT COST, NET |
69,037 | 101,755 | ||||||
| DERIVATIVE INSTRUMENTS |
17,484 | 17,292 | ||||||
| OTHER ASSETS |
6,084 | 8,484 | ||||||
| TOTAL ASSETS |
$ | 507,090 | $ | 522,071 | ||||
| LIABILITIES AND EQUITY | ||||||||
| CURRENT LIABILITIES: |
||||||||
| Accounts payable |
$ | 24,919 | $ | 19,180 | ||||
| Accrued expenses |
33,048 | 12,907 | ||||||
| Accrued interest |
3,317 | 3,361 | ||||||
| Revenue distributions payable |
4,839 | 4,434 | ||||||
| Current maturities of long-term debt |
26 | 48 | ||||||
| Total current liabilities |
66,149 | 39,930 | ||||||
| LONG-TERM DEBT, LESS CURRENT MATURITIES |
284,943 | 190,230 | ||||||
| DEFERRED PREMIUMS ON DERIVATIVE INSTRUMENTS |
10,622 | 16,299 | ||||||
| OTHER LIABILITIES |
7,157 | 7,151 | ||||||
| COMMITMENTS AND CONTINGENCIES—SEE NOTE I |
||||||||
| EQUITY: |
||||||||
| Preferred stock, par value $.001 per share, 10,000,000 shares authorized: |
||||||||
| Series A Junior Participating Preferred Stock—25,000 shares authorized, none issued and outstanding |
— | — | ||||||
| 9.25% Series B Cumulative Preferred Stock— 6,000,000 Shares authorized, 2,041,169 and 2,000,000 shares issued and outstanding as of 2010 and 2009, respectively, (aggregate liquidation preference $50,000,000) |
2 | 2 | ||||||
| Common stock, par value $.001 per share—100,000,000 shares authorized, 31,283,353 issued and outstanding in 2010 and 31,214,968 shares in 2009 |
31 | 31 | ||||||
| Additional paid-in capital |
531,944 | 522,645 | ||||||
| Accumulated deficit |
(430,784 | ) | (284,745 | ) | ||||
| Accumulated other comprehensive income, net of taxes |
15,227 | 8,447 | ||||||
| Total GMX equity |
116,420 | 246,380 | ||||||
| Noncontrolling interest |
21,799 | 22,081 | ||||||
| Total equity |
138,219 | 268,461 | ||||||
| TOTAL LIABILITIES AND EQUITY |
$ | 507,090 | $ | 522,071 | ||||
See accompanying notes to consolidated financial statements.
F-4
Table of Contents
GMX Resources Inc. and Subsidiaries
Consolidated Statements of Operations
(dollars in thousands, except share and per share data)
| Year Ended December 31, | ||||||||||||
| 2010 | 2009 | 2008 | ||||||||||
| (as adjusted) | (as adjusted) | |||||||||||
| OIL AND GAS SALES, net of gain or (loss) from ineffectiveness of derivatives of $(1,280) $1,018 and $1,014, respectively |
$ | 96,523 | $ | 94,294 | $ | 125,736 | ||||||
| EXPENSES: |
||||||||||||
| Lease operations |
10,651 | 11,776 | 15,101 | |||||||||
| Production and severance taxes |
743 | (930 | ) | 5,306 | ||||||||
| Depreciation, depletion, and amortization |
38,061 | 31,006 | 31,744 | |||||||||
| Impairment of oil and natural gas properties and assets held for sale |
143,712 | 188,150 | 192,650 | |||||||||
| General and administrative |
27,119 | 21,390 | 16,899 | |||||||||
| Total expenses |
220,286 | 251,392 | 261,700 | |||||||||
| Loss from operations |
(123,763 | ) | (157,098 | ) | (135,964 | ) | ||||||
| NON-OPERATING INCOME (EXPENSES): |
||||||||||||
| Interest expense |
(18,642 | ) | (16,748 | ) | (14,105 | ) | ||||||
| Loss on extinguishment of debt |
— | (4,976 | ) | — | ||||||||
| Interest and other income (expense) |
(4 | ) | 72 | 285 | ||||||||
| Unrealized loss on derivatives |
(122 | ) | (2,370 | ) | (354 | ) | ||||||
| Total non-operating expenses |
(18,768 | ) | (24,022 | ) | (14,174 | ) | ||||||
| Loss before income taxes |
(142,531 | ) | (181,120 | ) | (150,138 | ) | ||||||
| BENEFIT FOR INCOME TAXES |
4,239 | 33 | 26,217 | |||||||||
| NET LOSS |
(138,292 | ) | (181,087 | ) | (123,921 | ) | ||||||
| Net income attributable to noncontrolling interest |
3,114 | 173 | — | |||||||||
| NET LOSS APPLICABLE TO GMX |
(141,406 | ) | (181,260 | ) | (123,921 | ) | ||||||
| Preferred stock dividends |
4,633 | 4,625 | 4,625 | |||||||||
| NET LOSS APPLICABLE TO COMMON SHAREHOLDERS |
$ | (146,039 | ) | $ | (185,885 | ) | $ | (128,546 | ) | |||
| LOSS PER SHARE—Basic |
$ | (5.18 | ) | $ | (9.20 | ) | $ | (9.04 | ) | |||
| LOSS PER SHARE—Diluted |
$ | (5.18 | ) | $ | (9.20 | ) | $ | (9.04 | ) | |||
| WEIGHTED AVERAGE COMMON SHARES—Basic |
28,206,506 | 20,210,400 | 14,216,466 | |||||||||
| WEIGHTED AVERAGE COMMON SHARES—Diluted |
28,206,506 | 20,210,400 | 14,216,466 | |||||||||
See accompanying notes to consolidated financial statements.
F-5
Table of Contents
GMX Resources Inc. and Subsidiaries
Consolidated Statement of Changes in Equity
Year Ended December 31, 2008, 2009 and 2010
(dollars and shares in thousands)
| Preferred shares |
Common shares |
Preferred par value |
Common par value |
Additional paid-in capital |
Retained earnings (accumulated deficit) |
Accumulated other comprehensive income |
Total GMX Resources equity |
Non- controlling interest |
Total equity |
|||||||||||||||||||||||||||||||
| BALANCE AT DECEMBER 31, 2007 |
2,000 | 13,268 | $ | 2 | $ | 13 | $ | 180,543 | $ | 29,686 | $ | (1,318 | ) | $ | 208,926 | $ | — | $ | 208,926 | |||||||||||||||||||||
| Stock Options Exercised |
— | 73 | — | — | 979 | — | — | 979 | — | 979 | ||||||||||||||||||||||||||||||
| Restricted Stock Awards |
— | 14 | — | — | — | — | — | — | — | — | ||||||||||||||||||||||||||||||
| Stock Compensation Expense |
— | — | — | — | 3,545 | — | — | 3,545 | — | 3,545 | ||||||||||||||||||||||||||||||
| Preferred Stock Dividends |
— | — | — | — | — | (4,625 | ) | — | (4,625 | ) | — | (4,625 | ) | |||||||||||||||||||||||||||
| Shares Issued |
— | 2,000 | — | 2 | 133,685 | — | — | 133,687 | — | 133,687 | ||||||||||||||||||||||||||||||
| Shares Pursuant to Share Lending Agreement |
— | 3,440 | — | 4 | 2,338 | — | — | 2,342 | — | 2,342 | ||||||||||||||||||||||||||||||
| Convertible Debt Issued |
— | — | — | — | 9,250 | — | — | 9,250 | — | 9,250 | ||||||||||||||||||||||||||||||
| Net Loss (as adjusted) |
— | — | — | — | — | (123,921 | ) | — | (123,921 | ) | — | (123,921 | ) | |||||||||||||||||||||||||||
| Other Comprehensive Income |
— | — | — | — | — | — | 16,614 | 16,614 | — | 16,614 | ||||||||||||||||||||||||||||||
| BALANCE AT DECEMBER 31, 2008 |
2,000 | 18,795 | $ | 2 | $ | 19 | $ | 330,340 | $ | (98,860 | ) | $ | 15,296 | $ | 246,797 | $ | — | $ | 246,797 | |||||||||||||||||||||
| Stock Options Exercised |
— | 1 | — | — | 5 | — | — | 5 | — | 5 | ||||||||||||||||||||||||||||||
| Restricted Stock Awards |
— | 19 | — | — | — | — | — | — | — | — | ||||||||||||||||||||||||||||||
| Stock Compensation Expense |
— | — | — | — | 5,844 | — | — | 5,844 | — | 5,844 | ||||||||||||||||||||||||||||||
| Preferred Stock Dividends |
— | — | — | — | — | (4,625 | ) | — | (4,625 | ) | — | (4,625 | ) | |||||||||||||||||||||||||||
| Shares Issued |
— | 12,700 | — | 13 | 164,051 | — | — | 164,064 | — | 164,064 | ||||||||||||||||||||||||||||||
| Shares Pursuant to Share Lending Agreement |
— | (300 | ) | — | (1 | ) | — | — | — | (1 | ) | — | (1 | ) | ||||||||||||||||||||||||||
| Convertible Debt Issued |
— | — | — | — | 8,421 | — | — | 8,421 | — | 8,421 | ||||||||||||||||||||||||||||||
| Sale of Subsidiary Membership Interest to Noncontrolling Interest |
— | — | — | — | 13,984 | — | — | 13,984 | 21,908 | 35,892 | ||||||||||||||||||||||||||||||
| Net Loss (as adjusted) |
— | — | — | — | — | (181,260 | ) | — | (181,260 | ) | 173 | (181,087 | ) | |||||||||||||||||||||||||||
| Other Comprehensive Loss |
— | — | — | — | — | — | (6,849 | ) | (6,849 | ) | — | (6,849 | ) | |||||||||||||||||||||||||||
| BALANCE AT DECEMBER 31, 2009 |
2,000 | 31,215 | $ | 2 | $ | 31 | $ | 522,645 | $ | (284,745 | ) | $ | 8,447 | $ | 246,380 | $ | 22,081 | $ | 268,461 | |||||||||||||||||||||
| Restricted Stock Awards |
— | 188 | — | — | — | — | — | — | — | — | ||||||||||||||||||||||||||||||
| Preferred Stock Dividends |
— | — | — | — | — | (4,633 | ) | — | (4,633 | ) | — | (4,633 | ) | |||||||||||||||||||||||||||
| Stock Compensation Expense |
— | — | — | — | 6,274 | — | — | 6,274 | — | 6,274 | ||||||||||||||||||||||||||||||
| Shares Issued |
41 | 380 | — | — | 3,025 | — | — | 3,025 | — | 3,025 | ||||||||||||||||||||||||||||||
| Shares Pursuant to Share Lending Agreement |
— | (500 | ) | — | — | — | — | — | — | — | — | |||||||||||||||||||||||||||||
| Net Loss |
— | — | — | — | — | (141,406 | ) | — | (141,406 | ) | 3,114 | (138,292 | ) | |||||||||||||||||||||||||||
| Contributions—Non-Controlling Interest |
— | — | — | — | — | — | — | — | 1,244 | 1,244 | ||||||||||||||||||||||||||||||
| Distributions—Non-Controlling Interest |
— | — | — | — | — | — | — | — | (4,640 | ) | (4,640 | ) | ||||||||||||||||||||||||||||
| Other Comprehensive Income |
— | — | — | — | — | — | 6,780 | 6,780 | — | 6,780 | ||||||||||||||||||||||||||||||
| BALANCE AT DECEMBER 31, 2010 |
2,041 | 31,283 | $ | 2 | $ | 31 | $ | 531,944 | $ | (430,784 | ) | $ | 15,227 | $ | 116,420 | $ | 21,799 | $ | 138,219 | |||||||||||||||||||||
See accompanying notes to consolidated financial statements.
F-6
Table of Contents
GMX Resources Inc. and Subsidiaries
Consolidated Statements of Comprehensive Income (Loss)
(dollars in thousands)
| Years Ended December 31, | ||||||||||||
| 2010 | 2009 | 2008 | ||||||||||
| (as adjusted) | (as adjusted) | |||||||||||
| Net loss |
$ | (138,292 | ) | $ | (181,087 | ) | $ | (123,921 | ) | |||
| Other comprehensive income (loss), net of income tax: |
||||||||||||
| Change in fair value of derivative instruments, net of income taxes of $11,512, $6,961 and $6,499, respectively |
22,346 | 13,513 | 12,615 | |||||||||
| Reclassification of (gain) loss on settled contracts, net of income taxes of ($8,019), ($10,489) and $2,060, respectively |
(15,566 | ) | (20,362 | ) | 3,999 | |||||||
| Comprehensive loss |
(131,512 | ) | (187,936 | ) | (107,307 | ) | ||||||
| Comprehensive income attributable to the noncontrolling interest |
3,114 | 173 | — | |||||||||
| Comprehensive loss attributable to GMX shareholders |
$ | (134,626 | ) | $ | (188,109 | ) | $ | (107,307 | ) | |||
See accompanying notes to consolidated financial statements.
F-7
Table of Contents
GMX Resources Inc. and Subsidiaries
Consolidated Statements of Cash Flows
(dollars in thousands)
| Year Ended December 31, | ||||||||||||
| 2010 | 2009 | 2008 | ||||||||||
| (as adjusted) | (as adjusted) | |||||||||||
| CASH FLOWS DUE TO OPERATING ACTIVITIES |
||||||||||||
| Net loss |
$ | (138,292 | ) | $ | (181,087 | ) | $ | (123,921 | ) | |||
| Adjustments to reconcile net loss to net cash provided by operating activities: |
||||||||||||
| Depreciation, depletion, and amortization |
38,061 | 31,006 | 31,744 | |||||||||
| Impairment and other writedowns |
143,712 | 188,150 | 192,650 | |||||||||
| Deferred income taxes |
(4,209 | ) | — | (26,243 | ) | |||||||
| Non-cash stock compensation expense |
5,450 | 4,635 | 3,085 | |||||||||
| Loss (gain) on extinguishment of debt |
(141 | ) | 4,976 | — | ||||||||
| Non-cash interest expense |
9,330 | 6,036 | 2,159 | |||||||||
| Other |
1,402 | 1,838 | (1,151 | ) | ||||||||
| Decrease (increase) in: |
||||||||||||
| Accounts receivable |
(1,595 | ) | (1,338 | ) | 717 | |||||||
| Prepaid expenses and other assets |
(1,730 | ) | (457 | ) | (1,089 | ) | ||||||
| Increase (decrease) in: |
||||||||||||
| Accounts payable and accrued expenses |
6,680 | (2,852 | ) | 3,558 | ||||||||
| Revenue distributions payable |
67 | (1,417 | ) | 1,728 | ||||||||
| Net cash provided by operating activities |
58,735 | 49,490 | 83,237 | |||||||||
| CASH FLOWS DUE TO INVESTING ACTIVITIES |
||||||||||||
| Purchase of oil and natural gas properties |
(172,726 | ) | (162,076 | ) | (281,447 | ) | ||||||
| Proceeds from sales of oil and natural gas properties |
5,522 | — | — | |||||||||
| Purchase of property and equipment |
(10,284 | ) | (19,248 | ) | (36,913 | ) | ||||||
| Proceeds from sale of property and equipment |
1,488 | — | — | |||||||||
| Net cash used in investing activities |
(176,000 | ) | (181,324 | ) | (318,360 | ) | ||||||
| CASH FLOWS DUE TO FINANCING ACTIVITIES |
||||||||||||
| Advance on revolving bank credit facility |
92,000 | 99,000 | 190,000 | |||||||||
| Payments on debt |
(79 | ) | (179,079 | ) | (204,210 | ) | ||||||
| Proceeds from sale of common stock |
— | 164,069 | 134,681 | |||||||||
| Proceeds from sale of preferred stock |
949 | — | — | |||||||||
| Issuance of 5.00% Convertible Senior Notes |
— | — | 125,000 | |||||||||
| Issuance of 4.50% Convertible Senior Notes |
— | 86,250 | — | |||||||||
| Dividends paid on Series B cumulative preferred stock |
(4,633 | ) | (4,625 | ) | (4,625 | ) | ||||||
| Proceeds from (repayment of) Senior Secured Notes |
— | (34,590 | ) | — | ||||||||
| Sale of equity interest of a business |
— | 36,000 | — | |||||||||
| Contributions from non-controlling interest member |
1,244 | — | — | |||||||||
| Distributions to non-controlling interest member |
(4,640 | ) | — | — | ||||||||
| Fees paid related to financing activities |
(773 | ) | (7,085 | ) | (4,914 | ) | ||||||
| Other |
— | 732 | — | |||||||||
| Net cash provided by financing activities |
84,068 | 160,672 | 235,932 | |||||||||
| NET INCREASE (DECREASE) IN CASH |
(33,197 | ) | 28,838 | 809 | ||||||||
| CASH AND CASH EQUIVALENTS AT BEGINNING OF PERIOD |
35,554 | 6,716 | 5,907 | |||||||||
| CASH AND CASH EQUIVALENTS AT END OF PERIOD |
$ | 2,357 | $ | 35,554 | $ | 6,716 | ||||||
| SUPPLEMENTAL CASH FLOW DISCLOSURE CASH PAID (RECEIVED) DURING THE PERIOD FOR: |
||||||||||||
| INTEREST, NET OF AMOUNTS CAPITALIZED |
$ | 11,988 | $ | 15,611 | $ | 10,343 | ||||||
| INCOME TAXES |
$ | (30 | ) | $ | (33 | ) | $ | 26 | ||||
See accompanying notes to consolidated financial statements.
F-8
Table of Contents
GMX Resources Inc. and Subsidiaries
Notes to Consolidated Financial Statements
December 31, 2010, 2009 and 2008
NOTE A—NATURE OF OPERATIONS AND SUMMARY OF SIGNIFICANT ACCOUNTING POLICIES
NATURE OF BUSINESS AND PRINCIPLES OF CONSOLIDATION
GMX Resources Inc. (“GMX”) and its subsidiaries (collectively, the “Company”, “we,” “us” and “our”) is an independent oil and natural gas exploration and production company historically focused on the development of the Cotton Valley group of formations, specifically the Cotton Valley Sands layer in the Schuler formation and the Upper Bossier, Middle Bossier and Haynesville/Lower Bossier layers of the Bossier formation (the “Haynesville/Bossier Shale”), in the Sabine Uplift of the Carthage, North Field of Harrison and Panola counties of East Texas (our “core area”).
During 2010, we made a strategic decision to pursue properties that would expand our assets and development into other basins, diversify our company’s concentrated natural gas focus from two resource plays in one basin and provide the company more liquid hydrocarbon opportunities. These efforts have led to successful agreements to acquire core positions in over 67,000 net acres in two of the leading oil resource plays in the U.S. We have recently in 2011 entered into separate agreements to purchase undeveloped leasehold in the very successful and competitive region located in the Williston Basin of North Dakota/Montana, targeting the Bakken/Sanish-Three Forks Formation, and in the oil window of the Denver Julesburg Basin (the “DJ Basin”) of Wyoming, targeting the emerging Niobrara Formation. We are making plans to deploy our capital and resources into these development opportunities in 2011. With the acquisition of the liquids-rich (estimated 90% oil) Bakken and Niobrara acreage, we will have better flexibility to deploy capital based on a variety of economic and technical factors, including well costs, service availability, take-away capacity and commodity prices (including differentials applicable to the basin). We believe this flexibility will enable us to generate better cash flow growth to fund our capital expenditure program. We believe our contracted FlexRigs and experienced Rockies and Haynesville/Bossier Shale horizontal drilling personnel will enable us to succeed in the development of these new oil resource plays.
We have three subsidiaries: Diamond Blue Drilling Co. (“Diamond Blue”), which owns three conventional drilling rigs, Endeavor Pipeline Inc. (“Endeavor Pipeline”), which operates our water supply and salt water disposal systems in our core area, and Endeavor Gathering, LLC (“Endeavor Gathering”), which owns the natural gas gathering system and related equipment operated by Endeavor Pipeline. A 40% membership interest in Endeavor Gathering is owned by Kinder Morgan Endeavor LLC (“KME”).
The accompanying consolidated financial statements have been prepared in conformity with accounting principles generally accepted in the United States (“GAAP”). References to GAAP issued by the Financial Accounting Standards Board (“FASB”) in these footnotes are to the FASB Accounting Standards Codification (“ASC”). The consolidated financial statements include the accounts of GMX and its wholly and majority owned subsidiaries. Undivided interests in oil and gas joint ventures are consolidated on a proportionate basis. All significant intercompany transactions have been eliminated.
USE OF ESTIMATES: The preparation of financial statements in conformity with accounting principles generally accepted in the United States requires management to make estimates and assumptions that affect the reported amounts of oil and gas reserves, assets and liabilities, disclosure of contingent assets and liabilities at the date of the financial statements and the reported amounts of revenues and expenses during the reporting period. Actual results could differ from those estimates. Significant estimates include estimates for proved oil and natural gas reserve quantities, deferred income taxes, asset retirement obligations, fair value of derivative instruments, useful lives of property and equipment, expected volatility and contract term to exercise outstanding stock options, and are subject to change.
F-9
Table of Contents
RECLASSIFICATIONS: Certain reclassifications in the Consolidated Statements of Cash Flows have been made to prior years amounts to conform to current year presentations.
CASH AND CASH EQUIVALENTS: The Company considers all highly liquid investments with maturities of three months or less at the time of purchase to be cash equivalents. The carrying value of cash and cash equivalents approximates fair value due to the short-term nature of these instruments.
CONCENTRATIONS OF CREDIT RISK: Substantially all of the Company’s receivables are within the oil and gas industry, primarily from purchasers of natural gas and crude oil and from partners with interests in common properties operated by the Company. Although diversified among many companies, collectability is dependent upon the financial wherewithal of each individual company as well as the general economic conditions of the industry. The receivables are not collateralized; however the Company does review these parties for creditworthiness and general financial condition.
The Company has accounts with separate banks in Louisiana and Oklahoma. At December 31, 2010 and 2009, the Company had $4.5 million and $32.3 million, respectively, invested in overnight investment sweep accounts. Bank deposit accounts may, at times, exceed federally insured limits. The Company has not experienced any losses in such accounts and does not believe it is exposed to significant credit risk on its cash. The difference between the investment amount and the cash and cash equivalents amount on the accompanying consolidated balance sheets represents uncleared disbursements and non-interest bearing checking accounts.
The Company currently uses natural gas and crude oil commodity derivatives to hedge a portion of its exposure to natural gas and crude oil price volatility. These arrangements expose the Company to credit risk from its counterparties. To mitigate that risk, the Company only uses counterparties that are highly-rated entities with corporate credit ratings at or exceeding A or Aa as classified by Standard & Poor’s and Moody’s, respectively.
Sales to individual customers constituting 10% or more of total natural gas and crude oil sales were as follows for each of the years ended December 31:
| 2010 | 2009 | 2008 | ||||||||||
| Natural gas |
||||||||||||
| Texla Energy Management, Inc. |
44 | % | 54 | % | 20 | % | ||||||
| Tenaska |
16 | % | — | — | ||||||||
| Various purchasers through Penn Virginia Oil & Gas, L.P. |
14 | % | 21 | % | 42 | % | ||||||
| Louis Dreyfus |
10 | % | — | — | ||||||||
| BP Energy Company |
— | 12 | % | — | ||||||||
| Waskom Gas Processing Company |
— | 11 | % | 10 | % | |||||||
| CrossTex Energy Services, Inc. |
— | — | 22 | % | ||||||||
| Crude oil |
||||||||||||
| Sunoco, Inc |
61 | % | 52 | % | 14 | % | ||||||
| Various purchasers through Penn Virginia Oil & Gas, L.P. |
39 | % | 43 | % | 54 | % | ||||||
| Teppco Crude Oil, LLC |
— | — | 14 | % | ||||||||
| SemCrude, L.P. |
— | — | 17 | % | ||||||||
If the Company were to lose a purchaser, it believes it could replace it with a substitute purchaser with substantially equivalent terms.
INVENTORIES: Inventories consist of crude oil in tanks and natural gas liquids. Treated and stored crude oil inventory and natural gas liquids at the end of the year are valued at the lower of production cost or market.
ACCOUNTS RECEIVABLE: The Company has receivables from joint interest owners and oil and gas purchasers that are generally uncollateralized. The Company reviews these parties for creditworthiness and general financial condition. Accounts receivable are generally due within 30 days and accounts outstanding
F-10
Table of Contents
longer than 60 days are considered past due. If necessary, the Company would determine an allowance by considering the length of time past due, previous loss history, future net revenues of the debtor’s ownership interest in oil and gas properties operated by the Company and the owners ability to pay its obligation, among other things. The Company writes off accounts receivable when they are determined to be uncollectible.
The Company establishes provisions for losses on accounts receivable if it determines that it will not collect all or part of the outstanding balance. The Company regularly reviews collectability and establishes or adjusts the allowance as necessary using the specific identification method. There was no allowance for doubtful accounts at December 31, 2010 and 2009.
OIL AND NATURAL GAS PROPERTIES: The Company follows the full cost method of accounting for its oil and natural gas properties and activities. Accordingly, the Company capitalizes all costs incurred in connection with the acquisition, exploration and development of oil and natural gas properties. The Company capitalizes internal costs that can be directly identified with exploration and development activities, but does not include any costs related to production, general corporate overhead, or similar activities. Capitalized costs include geological and geophysical work, 3D seismic, delay rentals, drilling and completing and equipping oil and gas wells, including salaries and benefits and other internal costs directly attributable to these activities. Also included in oil and natural gas properties are tubular and other lease and well equipment of $4.1 million and $32.2 million at December 31, 2010 and 2009, respectively, that have not been placed in service but for which we plan to utilize in our on-going exploration and development activities.
Proceeds from dispositions of oil and gas properties are accounted for as a reduction of capitalized costs, with no gain or loss generally recognized upon disposal of oil and natural gas properties unless such disposal significantly alters the relationship between capitalized costs and proved reserves. Revenues from services provided to working interest owners of properties in which GMX also owns an interest, to the extent they exceed related costs incurred, are accounted for as reductions of capitalized costs of oil and natural gas properties.
Investments in unevaluated properties and major development projects are not amortized until proved reserves associated with the projects can be determined or until impairment occurs. The balance of unevaluated properties is comprised of capital costs incurred for undeveloped acreage, exploratory wells in progress and capitalized interest costs. We assess all items classified as unevaluated property on a quarterly basis for possible impairment or reduction in value. We assess our properties on an individual basis or as a group if properties are individually insignificant. Our assessment includes consideration of the following factors, among others: intent to drill; remaining lease term; geological and geophysical evaluations; drilling results and activity; the assignment of proved reserves; and the economic viability of development if proved reserves are assigned. During any period in which these factors indicate an impairment, the cumulative drilling costs incurred to date for such property and all or a portion of the associated leasehold costs are transferred to the full-cost pool and are then subject to amortization.
Depreciation, depletion and amortization of oil and gas properties (“DD&A”) are provided using the units-of-production method based on estimates of proved oil and gas reserves and production, which are converted to a common unit of measure based upon their relative energy content. The Company’s cost basis for depletion includes estimated future development costs to be incurred on proved undeveloped properties. The computation of DD&A takes into consideration restoration, dismantlement, and abandonment costs and the anticipated proceeds from salvaging equipment. DD&A expense for oil and natural gas properties was $32.9 million, $23.9 million and $26.9 million for the years ended December 31, 2010, 2009, and 2008, respectively.
Capitalized costs are subject to a “ceiling test,” which limits the net book value of oil and natural gas properties less related deferred income taxes to the estimated after-tax future net revenues discounted at a 10-percent interest rate. The cost of unproved properties is added to the future net revenues less income tax effects. At December 31, 2010 and 2009, future net revenues are calculated using prices that represent the average of the first day of the month price for the 12-month period prior to the end of the period.
F-11
Table of Contents
Such prices are utilized except where different prices are fixed and determinable from applicable contracts for the remaining term of those contracts, including the effects of derivatives qualifying as cash flow hedges. Based on average prices for the prior 12-month period for natural gas and oil as of December 31, 2010 and 2009, these cash flow hedges increased the full-cost ceiling by $52.3 million and $69.7 million, respectively, thereby reducing the ceiling test write-down by the same amount. Our qualifying cash flow hedges as of December 31, 2010, which consisted of swaps and collars, covered 19.6 Bcf and 18.5 Bcf in 2011and 2012, respectively. Our natural gas and oil hedging activities are discussed in “Note E—Derivative Activities,” of these consolidated financial statements.
Two primary factors impacting the ceiling test are reserve levels and natural gas and oil prices, and their associated impact on the present value of estimated future net revenues. Revisions to estimates of natural gas and oil reserves and/or an increase or decrease in prices can have a material impact on the present value of estimated future net revenues. Any excess of the net book value, less deferred income taxes, is generally written off as an expense. As a result of the Company’s ceiling test as of December 31, 2010, 2009 and 2008, the Company recorded impairment expense of $132.8 million, $188.2 million, and $192.7 million, respectively.
PROPERTY AND EQUIPMENT: Property and equipment are capitalized and stated at cost, while maintenance and repairs are expensed currently. Depreciation and amortization of other property and equipment are provided when assets are placed in service using the straight-line method based on estimated useful lives ranging from three to twenty years. In 2009, we changed the estimated useful life of the pipeline assets from 10 to 20 years. Depreciation and amortization expense for property and equipment was $5.1 million, $7.1 million and $4.8 million for the years ending December 31, 2010, 2009, and 2008, respectively.
IMPAIRMENT OF LONG-LIVED ASSETS: Pipeline and gathering system assets and other long-lived assets used in operations are periodically assessed to determine if circumstances indicate that the carrying amount of an asset may not be recoverable. An impairment loss is recognized only if the carrying amount of a long-lived asset is not recoverable from its undiscounted cash flows. An impairment loss is the difference between the carrying amount and fair value of the asset. The Company had no such impairment losses for the years ended December 31, 2010, 2009 or 2008.
Assets held for sale are carried on the balance sheet at their carrying value or fair value less cost to sell, whichever is less. Subsequent increases in fair value less cost to sell will be recognized as a gain, but not in excess of the cumulative loss previously recognized. As a result of determining fair value, an impairment loss was recorded for the year ended December 31, 2010 on the assets held for sale in the amount of $9.6 million and selling costs were estimated to be $1.3 million, resulting in a total write-down of $10.9 million.
DEBT ISSUE COSTS: The Company amortizes debt issue costs related to its revolving bank credit facility, 5.00% Convertible Senior Notes and 4.50% Convertible Senior Notes as interest expense over the scheduled maturity period of the debt. Unamortized debt issue costs were approximately $9.1 million and $8.6 million as of December 31, 2010 and 2009, respectively. The Company includes those unamortized costs in current prepaid expenses and deposits and other assets.
REVENUE DISTRIBUTIONS PAYABLE: For certain oil and natural gas properties, the Company receives production proceeds from the purchaser and further distributes such amounts to other revenue and royalty owners. Production proceeds applicable to other revenue and royalty owners are reflected as revenue distributions payable in the accompanying balance sheets. We recognize revenue for only our net interest in oil and natural gas properties.
DEFERRED INCOME TAXES: Deferred income taxes are provided for significant carryforwards and temporary differences between the tax basis of an asset or liability and its reported amount in the financial statements that will result in taxable or deductible amounts in future years. Deferred income tax assets or
F-12
Table of Contents
liabilities are determined by applying the presently enacted tax rates and laws. The Company records a valuation allowance for the amount of net deferred tax assets when, in management’s opinion, it is more likely than not that such assets will not be realized.
The Company recognizes the financial statement effects of tax positions when it is more likely than not, based on the technical merits, that the position will be sustained upon examination by a taxing authority. Recognized tax positions are initially and subsequently measured as the largest amount of tax benefit that is more likely than not of being realized upon ultimate settlement with a taxing authority. Liabilities for unrecognized tax benefits related to such tax positions are included in other long-term liabilities unless the tax position is expected to be settled within the upcoming year, in which case the liabilities are included in accrued expenses and other current liabilities. As of December 31, 2010 and 2009, the Company had no such liabilities.
REVENUE RECOGNITION: Natural gas and crude oil revenues are recognized when sold to a purchaser at a fixed or determinable price, when delivery has occurred and title has transferred, and if collectability of the revenue is probable. Delivery occurs and title is transferred when production has been delivered to a purchaser’s pipeline or truck. As a result of the numerous requirements necessary to gather information from purchasers or various measurement locations, calculate volumes produced, perform field and wellhead allocations and distribute and disburse funds to various working interest partners and royalty owners, the collection of revenues from oil and gas production may take up to 60 days following the month of production. Therefore, the Company makes accruals for revenues and accounts receivable based on estimates of its share of production, particularly from properties that are operated by others. Since the settlement process may take 30 to 60 days following the month of actual production, the Company’s financial results include estimates of production and revenues for the related time period. The Company records any differences, which are not expected to be significant, between the actual amounts ultimately received and the original estimates in the period they become finalized.
NATURAL GAS BALANCING: During the course of normal operations, the Company and other joint interest owners of natural gas reservoirs will take more or less than their respective ownership share of the natural gas volumes produced. These volumetric imbalances are monitored over the lives of the wells’ production capability. If an imbalance exists at the time the wells’ reserves are depleted, cash settlements are made among the joint interest owners under a variety of arrangements. The Company follows the sales method of accounting for gas imbalances. A liability is recorded when the Company’s natural gas volumes exceed its estimated remaining recoverable reserves. No receivables are recorded for those wells where the Company has taken less than its ownership share of gas production. There are no significant imbalances as of December 31, 2010 or 2009.
PRODUCTION AND SEVERANCE TAXES: Production taxes are set by state and local governments and vary as to the tax rate and the value to which that rate is applied. In Texas, where substantially all of our production is derived, severance taxes are levied as a percent of revenue received. The rate in Texas is complicated by certain severance tax exemptions or rate deductions on high cost wells. Certain wells, including all of our H/B wells, qualify for full severance tax relief for a period of ten years or recovery of 50% of the cost of drilling and completions, whichever is less. As a result, refunds for severance tax paid to the State of Texas on wells that qualify for reimbursement are recognized as accounts receivable and offset severance tax expense for the amount refundable as of December 31, 2010 (net of filing fees paid to a third party). As of December 31, 2009 and 2008 credits were not recognized until approvals are received. Production and severance taxes for the years ended December 31, 2010, 2009 and 2008 reflect tax refunds received and accrued of $3.1 million, $2.9 million and $1.2 million, respectively.
DERIVATIVE INSTRUMENTS: The Company uses derivative financial instruments to manage its exposure to lower oil and natural gas prices. Derivative instruments are measured at fair value and recognized as assets or liabilities in the balance sheet. Upon entering into a derivative contract, the derivative may be designated as a cash flow hedge. The relationship between the derivative instrument designated as a hedge and the hedged items is documented, as well as our objective for risk management and strategy for use of the hedging instrument to manage the risk. Derivative instruments designated as cash flow hedges are linked to specific
F-13
Table of Contents
forecasted transactions. At inception, and on an ongoing basis, a derivative instrument used as a hedge is assessed as to whether it is highly effective in offsetting changes in the cash flows of the hedged item. A derivative that is not a highly effective hedge does not qualify for hedge accounting.
Changes in fair value of a qualifying cash flow hedge are recorded in accumulated other comprehensive income, until earnings are affected by the cash flows of the hedged item. When the cash flow of the hedged item is recognized in the statement of operations, the fair value of the associated cash flow hedge is reclassified from accumulated other comprehensive income into earnings as a component of oil and gas sales. Ineffective portions of a cash flow hedge are recognized currently in earnings as a component of oil and gas sales. The changes in fair value of derivative instruments not qualifying or not designated as hedges are reported currently in the consolidated statement of operations as unrealized gains (losses) on derivatives, a component of non-operating income (expense). If a derivative instrument no longer qualifies as a cash flow hedge, hedge accounting is discontinued and the gain or loss that was recorded in accumulated other comprehensive income is recognized over the period anticipated in the original hedge transaction.
FAIR VALUE. Fair value is defined as the price that would be received to sell an asset or price paid to transfer a liability in an orderly transaction between market participants at the measurement date. Inputs used in determining fair value are characterized according to a hierarchy that prioritizes those inputs based upon the degree to which they are observable. The three levels of the fair-value-measurement hierarchy are as follows:
Level 1—inputs represent quoted prices in active markets for identical assets or liabilities (for example, exchange-traded commodity derivatives).
Level 2—inputs other than quoted prices included within Level 1 that are observable for the asset or liability, either directly or indirectly (for example, quoted market prices for similar assets or liabilities in active markets or quoted market prices for identical assets or liabilities in markets not considered to be active, inputs other than quoted prices that are observable for the asset or liability, or market-corroborated inputs).
Level 3—inputs that are not observable from objective sources, such as the Company’s internally developed assumptions used in pricing an asset or liability.
In determining fair value, the Company utilizes observable market data when available, or models that incorporate observable market data. In addition to market information, the Company incorporates transaction-specific details that, in management’s judgment, market participants would take into account in measuring fair value. In arriving at fair-value estimates, the Company utilizes the most observable inputs available for the valuation technique employed. If a fair-value measurement reflects inputs at multiple levels within the hierarchy, the fair-value measurement is characterized based upon the lowest level of input that is significant to the fair-value measurement. Recurring fair-value measurements are performed for derivatives instruments. The carrying amount of cash and cash equivalents, accounts receivable, accounts payable and deferred premiums on derivative instruments reported on the balance sheet approximates fair value.
ASSET RETIREMENT OBLIGATIONS: The Company’s asset retirement obligations relate to estimated future plugging and abandonment expenses on its oil and gas properties and related facilities disposal. These obligations to abandon and restore properties are based upon estimated future costs that may change based upon future inflation rates and changes in statutory remediation rules. The Company records the fair value of a liability for an asset retirement obligation in the period in which it is incurred and a corresponding increase in the carrying amount of oil and gas properties.
ENVIRONMENTAL LIABILITIES: Environmental expenditures that relate to an existing condition caused by past operation and that do not contribute to current or future revenue generation are expensed. Liabilities are accrued when environmental assessments and/or clean-ups are probable, and the costs can be reasonably estimated. As of December 31, 2010 and 2009, the Company has not accrued for or been fined or cited for any
F-14
Table of Contents
environmental violations that would have a material adverse effect upon the financial position, operating results or the cash flows of the Company.
BASIC EARNINGS PER SHARE AND DILUTED EARNINGS PER SHARE: Basic net income per common share is computed by dividing the net income (loss) applicable to common stock by the weighted average number of shares of common stock outstanding during the period. Diluted net income per common share is calculated in the same manner, but also considers the impact to net income and common shares for the potential dilution from our convertible notes, outstanding stock options and non-vested restricted stock awards. The following table reconciles the weighted average shares outstanding used for these computations for the years ending December 31:
| 2010 | 2009 | 2008 | ||||||||||
| Weighted average shares outstanding—basic |
28,206,506 | 20,210,400 | 14,216,466 | |||||||||
| Effective of dilutive securities: |
||||||||||||
| Stock options |
— | — | — | |||||||||
| Weighted average shares outstanding—diluted |
28,206,506 | 20,210,400 | 14,216,466 | |||||||||
Common shares outstanding loaned in connection with the 5.00% Convertible Senior Notes issued in February 2008 in the amount of 2,640,000 and 3,140,000 shares were not included in the computation of earnings per common share for the years ending December 31, 2010 or 2009, respectively.
For purposes of calculating weighted average common shares—diluted, non-vested restricted stock and outstanding stock options would be included in the computation using the treasury stock method, with the proceeds equal to the amount of cash received from the employee upon exercise and the average unrecognized compensation during the period, adjusted for any estimated future tax consequences recognized directly in equity.
Due to our net loss from operations for the years ended December 31, 2010, 2009 and 2008, we excluded the effects of the convertible notes, stock options and shares of non-vested restricted stock as they would have been antidilutive. The amount of shares excluded for 2010, 2009 and 2008 was 66,061, 794,000 and 995,000, respectively.
STOCK BASED COMPENSATION: The Company recognizes compensation expense for all stock-based payment awards made to employees, contractors and non-employee directors. Stock-based compensation expense is measured at the grant date based on the fair value of the award and is recognized as expense over the requisite service period, which is generally the vesting period. For stock options, the Company uses the Black-Scholes option-pricing model to determine the option fair value, which requires the input of highly subjective assumptions, including the expected volatility of the underlying stock, the expected term of the award, the risk-free interest rate and expected future divided payments. Expected volatilities are based on our historical volatility. The expected life of an award is estimated using historical exercise behavior data and estimated future behavior. The risk-free interest rate is based on the U.S. Treasury yields in effect at the time of grant and extrapolated to approximate the expected life of the award. The Company does not expect to declare or pay dividends in the foreseeable future.
COMMITMENTS AND CONTINGENCIES: Liabilities for loss contingencies arising from claims, assessments, litigation, or other sources are recorded when it is probable that a liability has been incurred and the amount can be reasonably estimated.
SUPPLEMENTAL DISCLOSURE OF NON-CASH INVESTING AND FINANCING ACTIVITIES: During the years ended December 31, 2010, 2009 and 2008, the Company recorded non-cash additions to oil and gas properties of $1.0 million, $1.2 million and $3.6 million, respectively related to the depreciation of its
F-15
Table of Contents
Company-owned rigs and the capitalization of non-cash stock compensation expense related to employees directly involved in exploration and development activities.
Capital additions funded through accounts payable include $14.6 million, $25.6 million, and $34.6 million for the years ended December 31, 2010, 2009, and 2008, respectively.
During the years ended December 31, 2010, 2009 and 2008, the Company recorded a net non-cash asset and related liability of $0.7 million, $0.6 million, and $2.4 million respectively, associated with the asset retirement obligation on the acquisition and/or development of oil and gas properties.
Interest of $2.6 million, $1.8 million, and $0.4 million, was capitalized during the years ended December 31, 2010, 2009, and 2008, respectively, related to the unproved properties that were not being currently depreciated, depleted or amortized and on which exploration or development activities were in progress.
RECENTLY ISSUED ACCOUNTING PRONOUNCEMENTS:
In December 2009, the Company adopted revised oil and gas reserve estimation and disclosure requirements. The primary impact of the new disclosures for the Company is to align the definition of proved reserves with the Securities and Exchange Commission (SEC) Modernization of Oil and Gas Reporting rules, which were issued by the SEC at the end of 2008 and effective for fiscal periods ending on or after December 31, 2009. The accounting standards revised the definition of proved oil and gas reserves to require that the average, first-day-of-the-month price during the 12-month period preceding the end of the year rather than the year-end price, must be used when estimating whether reserve quantities are economical to produce. This same 12-month average price is also used in calculating the aggregate amount of (and changes in) future cash inflows related to the standardized measure of discounted future net cash flows. The rules also allow for the use of reliable technology to estimate proved oil and gas reserves, if those technologies have been demonstrated to result in reliable conclusions about reserve volumes. The unaudited supplemental information on oil and gas exploration and production activities for 2010 and 2009 has been presented following these new reserve estimation and disclosure rules, which may not be applied retrospectively. The 2008 data is presented in accordance with the previous oil and gas disclosure requirements. See “Note M—Supplemental Information on Oil and Natural Gas Properties” for additional disclosures associated with the adoption of this standard.
In October 2009, the Financial Accounting Standards Board (the “FASB”) issued ASU 2009-15, “Accounting for Own-Share Lending Arrangements in Contemplation of Convertible Debt Issuance or Other Financing,” now codified under FASB ASC Topic 470 “Debt”, (“ASU 2009-15”), which provided guidance for accounting and reporting for own-share lending arrangements issued in contemplation of a convertible debt issuance. At the date of issuance, a share-lending arrangement entered into on an entity’s own shares should be measured at fair value in accordance with Topic 820 and recognized as an issuance cost, with an offset to additional paid-in capital. Loaned shares are excluded from basic and diluted earnings per share unless default of the share-lending arrangement occurs. The guidance also requires several disclosures including a description of the terms of the arrangement and the reason for entering into the arrangement. The effective dates of the guidance are dependent upon the date the share-lending arrangement was entered into and include retrospective application for arrangements outstanding as of the beginning of fiscal years beginning on or after December 15, 2009. For further discussion, see “Note B—Share Lending Arrangements and Adoption of ASU 2009-15.”
A standard to improve disclosures about fair value measurements was issued in January 2010. The standard requires additional disclosures about fair value measurements, adding a new requirement to disclose transfers in and out of Levels 1 and 2 measurements and gross presentation of activity within a Level 3 roll forward. The guidance also clarified existing disclosure requirements regarding the level of disaggregation of fair value measurements and disclosures regarding inputs and valuation techniques. We adopted this guidance effective first quarter 2010. The adoption had no impact on our financial position or results of operations.
F-16
Table of Contents
NOTE B—SHARE LENDING ARRANGEMENTS AND ADOPTION OF ASU 2009-15
In February 2008, in connection with the offer and sale of the 5.00% convertible notes, we entered into a share lending agreement (the “Share Lending Agreement”) with an affiliate of Jefferies & Company, Inc. (the “Share Borrower”) and Jefferies & Company, Inc., as collateral agent for GMX. Under this agreement, we may loan to the Share Borrower up to the maximum number of shares of our common stock underlying the 5.00% convertible notes during a specified loan availability period. This maximum number of shares was initially 3,846,150 shares. We will receive a loan fee of $0.001 per share for each share of our common stock that we loan to the Share Borrower, payable at the time such shares are borrowed. The Share Borrower may borrow and re-borrow up to the maximum number of shares of our common stock during the loan availability period.
The Share Borrower’s obligations under the Share Lending Agreement are unconditionally guaranteed by Jefferies Group, Inc., the ultimate parent company of the Share Borrower and Jefferies & Company, Inc. (the “guarantor”). If the guarantor receives a rating downgrade for its long term unsecured and unsubordinated debt below a specified level by both Standard & Poor’s Ratings Services and Moody’s Investors Service, Inc. (or any substitute rating agency mutually agreed upon by the Company and the Share Borrower), or by either of such rating agencies in certain circumstances, the Share Borrower has agreed to post and maintain with Jefferies & Company, Inc., acting as collateral agent for the Company, collateral in the form of cash, government securities, certificates of deposit, high-grade commercial paper of U.S. issuers, letters of credit or money market shares with a market value at least equal to 100% of the market value of the shares of our common stock borrowed by the Share Borrower as security for the Share Borrower’s obligation to return the borrowed shares to the Company pursuant to the Share Lending Agreement.
The loan availability period under the Share Lending Agreement commenced on the date of the Share Lending Agreement and will continue until the date that any of the following occurs:
| • | the Company notifies the Share Borrower in writing of our intention to terminate the Share Lending Agreement at any time after the entire principal amount of the 5.00% convertible notes ceases to be outstanding as a result of conversion, repurchase, at maturity or otherwise; |
| • | the Company and the Share Borrower agree to terminate the Share Lending Agreement; |
| • | the Company elects to terminate all of the outstanding loans upon a default by the Share Borrower under the Share Lending Agreement or by the guarantor under its guarantee, including a breach by the Share Borrower of any of its obligations or a breach in any material respect of any of the representations or covenants under the Share Lending Agreement or a breach by the guarantor of the guarantee, or the bankruptcy of the Share Borrower or the guarantor; or |
| • | the Share Borrower elects to terminate all outstanding loans upon the bankruptcy of the Company. |
Any shares the Company loans to the Share Borrower will be issued and outstanding for corporate law purposes, however, the borrowed shares will not be considered outstanding for the purpose of computing and reporting earnings per share. The holders of the borrowed shares will have all of the rights of a holder of a share of our outstanding common stock, including the right to vote the shares on all matters submitted to a vote of the Company’s shareholders and the right to receive any dividends or other distributions that we may pay or make on our outstanding shares of common stock. However, under the Share Lending Agreement, the Share Borrower has agreed:
| • | not to vote any shares of the Company’s common stock it has borrowed to the extent it owns such borrowed shares; and |
| • | to pay to the Company an amount equal to any cash dividends that are paid on the borrowed shares. |
On January 1, 2010, the Company was required to adopt ASU 2009-15, Accounting for Own-Share Lending Arrangements in Contemplation of Convertible Debt Issuance or Other Financing, which changes the accounting treatment of the Company’s share lending arrangements. Under ASU 2009-15, the Company must recognize the value of share lending arrangements as issuance cost at inception.
F-17
Table of Contents
The comparative financial statements have been restated to apply the new pronouncement retrospectively. The following financial statement line items in the consolidated balance sheet as of December 31, 2009 were affected by the adoption:
| As Reported | Adjustments | As Adjusted | ||||||||||
| (in thousands) | ||||||||||||
| ASSETS | ||||||||||||
| CURRENT ASSETS: |
||||||||||||
| Prepaid expenses and deposits |
$ | 3,809 | $ | 697 | $ | 4,506 | ||||||
| OTHER ASSETS |
$ | 6,748 | $ | 1,736 | $ | 8,484 | ||||||
| LIABILITIES AND EQUITY | ||||||||||||
| EQUITY |
||||||||||||
| Additional paid-in capital |
$ | 520,307 | $ | 2,338 | $ | 522,645 | ||||||
| Accumulated deficit |
$ | (284,840 | ) | $ | 95 | $ | (284,745 | ) | ||||
The following financial statement line items in the consolidated statement of operations for the year ended December 31, 2009 and 2008, respectively, were affected by the adoption:
| Year ended December 31, 2009 | ||||||||||||
| As Reported | Adjustments | As Adjusted | ||||||||||
| (in thousands) | ||||||||||||
| NON-OPERATING INCOME (EXPENSES) |
||||||||||||
| Interest expense |
$ | (16,127 | ) | $ | (621 | ) | $ | (16,748 | ) | |||
| NET LOSS |
$ | (180,466 | ) | $ | (621 | ) | $ | (181,087 | ) | |||
| NET LOSS APPLICABLE TO COMMON SHAREHOLDERS |
$ | (185,264 | ) | $ | (621 | ) | $ | (185,885 | ) | |||
| EARNINGS (LOSS) PER SHARE—BASIC |
$ | (9.17 | ) | $ | (.03 | ) | $ | (9.20 | ) | |||
| EARNINGS (LOSS) PER SHARE—DILUTED |
$ | (9.17 | ) | $ | (.03 | ) | $ | (9.20 | ) | |||
| Year ended December 31, 2008 | ||||||||||||
| As Reported | Adjustments | As Adjusted | ||||||||||
| (in thousands) | ||||||||||||
| NON-OPERATING INCOME (EXPENSES) |
||||||||||||
| Interest expense |
$ | (13,617 | ) | $ | (488 | ) | $ | (14,105 | ) | |||
| BENEFIT FOR INCOME TAXES |
$ | 25,013 | $ | 1,204 | $ | 26,217 | ||||||
| NET LOSS |
$ | (124,637 | ) | $ | 716 | $ | (123,921 | ) | ||||
| NET LOSS APPLICABLE TO COMMON SHAREHOLDERS |
$ | (129,262 | ) | $ | 716 | $ | (128,546 | ) | ||||
| EARNINGS (LOSS) PER SHARE—BASIC |
$ | (9.09 | ) | $ | .05 | $ | (9.04 | ) | ||||
| EARNINGS (LOSS) PER SHARE—DILUTED |
$ | (9.09 | ) | $ | .05 | $ | (9.04 | ) | ||||
As of December 31, 2010 and 2009, respectively, 2,640,000 and 3,140,000, shares of our common stock were subject to outstanding loans to the Share Borrower with a fair value of $14.6 million and $43.1 million. As of December 31, 2010 and 2009, respectively, the unamortized amount of issuance costs associated with the share lending agreement was $1.7 million and $2.4 million, of which $0.8 million and $0.7 million is classified as a current asset and $0.9 million and $1.7 million, is a long-term asset included in Other Assets. The Company recognized $0.7 million, $0.6 million and $0.5 million in interest expense relating to the amortization of the Share Lending Agreement for the year ended December 31, 2010, 2009 and 2008 respectively
NOTE C—NONCONTROLLING INTEREST
On November 1, 2009, GMX and its wholly owned subsidiary, Endeavor Pipeline, transferred mid-stream gas gathering, compression and related equipment to a newly formed Endeavor Gathering and sold a 40% membership interest in Endeavor Gathering to KME for $36.0 million. Endeavor Gathering provides firm capacity gathering services to the Company in our Cotton Valley Sands and Haynesville/Bossier Shale horizontal
F-18
Table of Contents
developments in East Texas, and will also provide funding of future gathering infrastructure needs to support the Company’s production growth. The results of operations and financial position of Endeavor Gathering are included in the consolidated financial statements of GMX. The portion of Endeavor Gathering’s results of operations not attributable to GMX are recorded as noncontrolling interests.
Distributions to the members will be made on a monthly basis to the members and allocated 80% and 20% to the noncontrolling interest and to GMX, respectively until the noncontrolling interest member has received $36.0 million. Subsequently, distributions will be allocated 40% and 60% to the noncontrolling interest member and GMX, respectively.
The following table sets forth the effects of changes in GMX’s ownership interest in Endeavor Gathering on GMX’s equity for the years ended December 31:
| 2010 | 2009 (as adjusted) |
2008 (as adjusted) |
||||||||||
| (in thousands) | ||||||||||||
| Net loss applicable to GMX |
$ | (141,406 | ) | $ | (181,260 | ) | $ | (123,921 | ) | |||
| Transfers from the noncontrolling interest: |
||||||||||||
| Increase in GMX paid-in capital for sale of 40% membership interest in Endeavor Gathering |
$ | — | $ | 13,984 | — | |||||||
| Change from net loss applicable to GMX and transfers from noncontrolling interest |
$ | (141,406 | ) | $ | (167,276 | ) | $ | (123,921 | ) | |||
NOTE D—PROPERTY AND EQUIPMENT
Major classes of property and equipment included the following at December 31:
| December 31, | ||||||||
| 2010 | 2009 | |||||||
| (in thousands) | ||||||||
| Pipeline and related facilities |
$ | 57,798 | $ | 68,440 | ||||
| Drilling rigs |
— | 30,492 | ||||||
| Machinery and equipment |
5,576 | 5,173 | ||||||
| Buildings and leasehold improvement |
8,418 | 6,003 | ||||||
| Office equipment |
4,619 | 2,324 | ||||||
| 76,411 | 112,432 | |||||||
| Less accumulated depreciation and amortization |
(9,455 | ) | (12,751 | ) | ||||
| 66,956 | 99,681 | |||||||
| Land |
2,081 | 2,074 | ||||||
| $ | 69,037 | $ | 101,755 | |||||
In December 2010, the Company finalized a plan to dispose of three drilling rigs, four compressors, pipe and valves by sale. These assets will either be disposed of individually or as part of a disposal group, depending on the purchaser’s interest. The accounting for these assets at the plan date was in accordance with ASC 360-10, Property, Plant and Equipment. Under this guidance, the assets are carried on the balance sheet at their carrying value or fair value less cost to sell, whichever is less. Subsequent increases in fair value less cost to sell will be recognized as a gain, but not in excess of the cumulative loss previously recognized. In determining fair value for the drilling rigs, management used third party appraisals. For all other assets, management performed internal estimates of the value of the assets based on verbal bids gathered through their marketing efforts and other marketing information. Management also performed internal estimates to estimate the cost to sell the assets,
F-19
Table of Contents
which primarily consisted of commissions to sell the assets, and were estimated based on past experience selling similar assets and verbal bids. As a result of determining fair value, an impairment loss was recorded on the assets held for sale in the amount of $9.6 million and selling costs were estimated to be $1.3 million, resulting in a total write-down of $10.9 million, which was included in the Impairment of Oil and Natural Gas Properties and Assets Held for Sale in the Statements of Operations for the year ended December 31, 2010.
NOTE E—DERIVATIVE ACTIVITIES
The Company is subject to price fluctuations for natural gas and crude oil. Prices received for natural gas and crude oil sold on the spot market are volatile due to factors beyond the Company’s control. Reductions in crude oil and natural gas prices could have a material adverse effect on the Company’s financial position, results of operations, capital expenditures and quantities of reserves recoverable on an economic basis. Any reduction in reserves, including reductions due to lower prices, can reduce the Company’s borrowing base under the revolving bank credit facility and adversely affect the Company’s liquidity and ability to obtain capital for acquisition and development activities.
To mitigate a portion of its exposure to fluctuations in commodity prices, the Company enters into financial price risk management activities with respect to a portion of projected crude oil and natural gas production through financial price swaps, collars, and put spreads (collectively “derivatives”). Additionally, the Company uses basis protection swaps to reduce basis risk. Basis is the difference between the physical commodity being hedged and the price of the futures contract used for hedging. Basis risk is the risk that an adverse change in the futures market will not be completely offset by an equal and opposite change in the cash price of the commodity being hedged. Basis risk exists in natural gas due to the geographic price differentials between a given cash market location and the futures contract delivery locations. Settlement or expiration of the hedges is designed to coincide as closely as possible with the physical sale of the commodity being hedged—daily for oil and monthly for natural gas—to obtain reasonable assurance that a gain in the cash sale will offset the loss on the hedge and vice versa.
The Company’s revolving bank credit facility requires it to maintain a hedging program on mutually acceptable terms whenever the loan amount outstanding exceeds 75% of the borrowing base.
The Company’s derivative financial instruments potentially consist of price swaps, collars, put spreads and basis swaps. A description of these types of instruments is provided below:
| Fixed price swaps |
The Company receives a fixed price and pays a variable price to the contract counterparty. The fixed-price payment and the floating price payment are netted, resulting in a net amount due to or from the counterparty. | |
| Costless collars |
The instrument contains a fixed floor price (long put option) and ceiling price (short call option), where the purchase price of the put option equals the sales price of the call option. At settlement, if the market price exceeds the ceiling price, the Company pays the difference between the market price and the ceiling price. If the market price is less than the fixed floor price, the Company receives the difference between the fixed floor price and the market price. If the market price is between the ceiling and the fixed floor price, no payments are due from either party. | |
| Three-way collars |
A three-way collar contract consists of a standard collar contract plus a put sold by the Company with a price below the floor price of the collar. This additional put requires us to make a payment to the counterparty if the settlement price for any settlement period is below the put price. Combining the collar contract with the additional put results in the Company being entitled to a net payment equal to the difference between the floor price of the standard collar and the additional put price if the settlement price is equal to or less than the additional put price. If the settlement | |
F-20
Table of Contents
| price is greater than the additional put price, the result is the same as it would have been with a standard collar contract only. Therefore, if market prices are below the additional put option, the Company would be entitled to receive the market price plus the difference between the additional put option and the floor. This strategy enables the Company to increase the floor and the ceiling price of the collar beyond the range of a traditional costless collar while defraying the associated cost with the sale of the additional put. | ||
| Put spreads |
A put spread is the same as a three-way collar without the ceiling price (short call option). Therefore, if market prices are below the additional put option, the Company would be entitled to receive the market price plus the difference between the additional put option and the floor. | |
| Basis swaps |
Natural gas basis protection swaps are arrangements that guarantee a price differential between NYMEX natural gas futures and Houston Ship Channel or Mainline (Columbia Gulf), which is a close proximity for the Company’s primary market hubs. The Company receives a payment from the counterparty if the price differential is less than the stated terms of the contract and pays the counterparty if the price differential is greater than the stated terms of the contract. | |
The Company utilizes counterparties for our derivative instruments that are members of our lending bank group and that the Company believes are credit-worthy entities at the time the transactions are entered into. The Company closely monitors the credit ratings of these counterparties. Additionally, the Company performs both quantitative and qualitative assessments of these counterparties based on their credit ratings and credit default swap rates where applicable. However, the recent events in the financial markets demonstrate there can be no assurance that a counterparty financial institution will be able to meet its obligations to the Company.
None of the Company’s derivative instruments contain credit-risk-related contingent features. Additionally, the Company has not incurred any credit-related losses associated with derivative activities and believes that its counterparties will continue to be able to meet their obligations under these transactions.
ASC 815, Derivatives and Hedging requires all derivative instruments to be recognized at fair value in the balance sheet. Fair value is generally determined based on the difference between the fixed contract price and the underlying estimated market price at the determination date. Derivative instruments with the same counterparty are presented on a net basis where the legal right of offset exists. The following is a summary of the asset and liability fair values of the Company’s derivative contracts:
|
Balance Sheet Location |
Asset Fair Value | |||||||||
| December 31, 2010 | December 31, 2009 | |||||||||
| (in thousands) | ||||||||||
| Derivatives designated as Hedging Instruments under ASC 815 |
||||||||||
| Natural gas |
Current derivative asset | $ | 23,187 | $ | 12,896 | |||||
| Natural gas |
Derivative instruments—non-current asset | 20,503 | 19,144 | |||||||
| Total derivative asset fair value |
$ | 43,690 | $ | 32,040 | ||||||
F-21
Table of Contents
| Balance Sheet Location |
Liability Fair Value | |||||||||
| December 31, 2010 | December 31, 2009 | |||||||||
| (in thousands) | ||||||||||
| Derivatives designated as Hedging Instruments under ASC 815 |
||||||||||
| Natural gas |
Current derivative asset | $ | 2,963 | $ | — | |||||
| Natural gas basis |
Current derivative asset | 566 | — | |||||||
| Natural gas |
Derivative instruments—non-current asset | 2,897 | — | |||||||
| Natural gas basis |
Derivative instruments—non-current asset | 122 | 549 | |||||||
| $ | 6,548 | $ | 549 | |||||||
| Derivatives not designated as Hedging Instruments under ASC 815 |
||||||||||
| Natural gas |
Current derivative asset | $ | — | $ | 374 | |||||
| Natural gas basis |
Current derivative asset | — | 270 | |||||||
| Natural gas |
Derivative instruments—non-current asset | — | 1,303 | |||||||
| Crude oil |
Current derivative asset | 172 | — | |||||||
| 172 | 1,947 | |||||||||
| Total derivative liability fair value |
$ | 6,720 | $ | 2,496 | ||||||
| Net derivative fair value |
$ | 36,970 | $ | 29,544 | ||||||
Following is a summary of the outstanding volumes and prices on the oil and natural gas swaps and options in place as of December 31, 2010:
| Effective Date |
Maturity Date |
Notional Amount Per Month |
Remaining Notional Amount as of December 31, 2010 |
Additional Put Options |
Floor | Ceiling | Designation under | |||||||||||||||||||
| Natural Gas (MMBtu): |
||||||||||||||||||||||||||
| 1/1/2011 |
12/31/2012 | 155,337 | 3,728,100 | $ | — | $ | — | $ | 7.00 | Cash flow hedge | ||||||||||||||||
| 1/1/2011 |
12/31/2011 | 188,781 | 2,265,372 | $ | — | $ | — | $ | 8.00 | Cash flow hedge | ||||||||||||||||
| 1/1/2011 |
3/31/2011 | 200,000 | 600,000 | $ | 5.00 | $ | 7.00 | $ | 7.25 | Cash flow hedge | ||||||||||||||||
| 1/1/2011 |
3/31/2011 | 200,000 | 600,000 | $ | — | $ | — | $ | 8.90 | Cash flow hedge | ||||||||||||||||
| 4/1/2011 |
10/31/2011 | 200,000 | 1,400,000 | $ | 5.00 | $ | 6.50 | $ | 8.30 | Cash flow hedge | ||||||||||||||||
| 11/1/2011 |
3/31/2012 | 200,000 | 1,000,000 | $ | 5.50 | $ | 7.00 | $ | 10.10 | Cash flow hedge | ||||||||||||||||
| 1/1/2011 |
12/31/2012 | 1,021,666 | 24,520,000 | $ | 4.00 | $ | 6.00 | $ | — | Cash flow hedge | ||||||||||||||||
| 1/1/2011 |
12/31/2012 | 167,612 | 4,022,697 | $ | 4.50 | $ | 6.25 | $ | — | Cash flow hedge | ||||||||||||||||
| Crude Oil (Bbls): |
||||||||||||||||||||||||||
| 1/1/2011 |
12/31/2011 | 3,042 | 36,500 | $ | — | $ | — | $ | 100.00 | Not designated | ||||||||||||||||
All of the above natural gas contracts are settled against NYMEX and all oil contracts are settled against NYMEX Light Sweet Crude. The NYMEX and NYMEX Light Sweet Crude have historically had a high degree of correlation with the actual prices received by the Company.
F-22
Table of Contents
Effects of derivative instruments on the Consolidated Statement of Operations
For derivative instruments that are designated and qualify as a cash flow hedge, the effective portion of the gain or loss on the derivative is reported as a component of other comprehensive income and reclassified into earnings in the same period or periods during which the hedged transaction affects earnings. Gains and losses on the derivative representing either hedge ineffectiveness or hedge components excluded from the assessment of effectiveness are recognized in current earnings.
| For the Year Ended December 31, 2010 | ||||||||||||||
| Amount of Gain (Loss) Recognized in OCI on Derivative (Effective Portion) |
Location of Gain Reclassified from Accumulated OCI into Income Excluded |
Amount of Gain Reclassified from Accumulated OCI into Income (Effective Portion) |
Amount of Gain (Loss) Recognized in Income on Derivative (Ineffective Portion and Amount Excluded from Effectiveness Testing) |
|||||||||||
| (in thousands) | (in thousands) | |||||||||||||
| Natural gas |
$ | 33,858 | Oil and Gas Sales | $ | 23,585 | $ | (1,280 | ) | ||||||
| For the Year Ended December 31, 2009 | ||||||||||||||
| Amount of Gain (Loss) Recognized in OCI on Derivative (Effective Portion) |
Location of Gain Reclassified from Accumulated OCI into Income Excluded |
Amount of Gain Reclassified from Accumulated OCI into Income (Effective Portion) |
Amount of Gain Recognized in Income on Derivative (Ineffective Portion and Amount Excluded from Effectiveness Testing) |
|||||||||||
| (in thousands) | (in thousands) | |||||||||||||
| Natural gas |
$ | 20,911 | Oil and Gas Sales | $ | 28,546 | $ | 1,018 | |||||||
| Crude oil |
(437 | ) | Oil and Gas Sales | 2,305 | — | |||||||||
| $ | 20,474 | $ | 30,851 | $ | 1,018 | |||||||||
| For the Year Ended December 31, 2008 | ||||||||||||||
| Amount of Gain Recognized in OCI on Derivative (Effective Portion) |
Location of Gain Reclassified from Accumulated OCI into Income Excluded |
Amount of Loss Reclassified from Accumulated OCI into Income (Effective Portion) |
Amount of Gain Recognized in Income on Derivative (Ineffective Portion and Amount Excluded from Effectiveness Testing) |
|||||||||||
| (in thousands) | (in thousands) | |||||||||||||
| Natural gas |
$ | 14,999 | Oil and Gas Sales | $ | 4,032 | $ | 925 | |||||||
| Crude oil |
4,115 | Oil and Gas Sales | 2,027 | 89 | ||||||||||
| $ | 19,114 | $ | 6,059 | $ | 1,014 | |||||||||
Assuming that the market prices of oil and gas futures as of December 31, 2010 remain unchanged, the Company would expect to transfer a gain of approximately $9.4 million from accumulated other comprehensive income to earnings during the next 12 months. The actual reclassification into earnings will be based on market prices at the contract settlement date.
F-23
Table of Contents
For derivative instruments that do not qualify as hedges pursuant to ASC 815, changes in the fair value of these derivatives that occur prior to their maturity (i.e., temporary fluctuations in value) are recognized in current earnings. A summary of the effect of the derivatives not qualifying for hedges is as follows:
| Location of Gain (Loss) |
Amount of Gain (Loss) Recognized in Income on Derivative |
|||||||||||||
| For the Year Ended | ||||||||||||||
| 2010 | 2009 | 2008 | ||||||||||||
| Realized |
||||||||||||||
| Natural gas |
Oil and Gas Sales | $ | (23 | ) | $ | 5,920 | $ | — | ||||||
| Unrealized |
||||||||||||||
| Natural gas |
Unrealized losses on derivatives | (221 | ) | (2,100 | ) | (354 | ) | |||||||
| Natural gas basis |
Unrealized losses on derivatives | — | (270 | ) | — | |||||||||
| Crude Oil |
Unrealized losses on derivatives | 99 | — | — | ||||||||||
| $ | (145 | ) | $ | 3,550 | $ | (354 | ) | |||||||
The valuation of our derivative instruments are based on industry standard models that primarily rely on market observable inputs. Substantially all of the assumptions for industry standard models are observable in active markets throughout the full term of the instrument. The Company categorizes these measurements as Level 2. The following table sets forth by level within the fair value hierarchy our derivative instruments, which are our only financial assets and liabilities that were accounted for at fair value on a recurring basis, as of December 31, 2010 and 2009:
| As of December 31, 2010: | As of December 31, 2009: | |||||||||||||||||||||||
| Quoted Prices in Active Markets (Level 1) |
Significant Other Observable Inputs (Level 2) |
Significant Unobservable Inputs (Level 3) |
Quoted Prices in Active Markets (Level 1) |
Significant Other Observable Inputs (Level 2) |
Significant Unobservable Inputs (Level 3) |
|||||||||||||||||||
| (in thousands) | ||||||||||||||||||||||||
| Financial assets: |
||||||||||||||||||||||||
| Natural gas derivative instruments |
$ | — | $ | 37,142 | $ | — | $ | — | $ | 29,544 | $ | — | ||||||||||||
| Crude oil derivative instruments |
$ | — | $ | (172 | ) | $ | — | $ | — | $ | — | $ | — | |||||||||||
F-24
Table of Contents
NOTE F—LONG-TERM DEBT
The table below presents the carrying amounts and approximate fair values of our debt obligations. The carrying amounts of our revolving bank credit facility borrowings approximate their fair values due to the short-term nature and frequent repricing of these obligations. The approximate fair values of our convertible debt securities are determined based on market quotes from independent third party brokers as they are actively traded in an established market.
| December 31, | ||||||||||||||||
| 2010 | 2009 | |||||||||||||||
| Carrying Amount | Fair Value | Carrying Amount | Fair Value | |||||||||||||
| (in thousands) | ||||||||||||||||
| Revolving bank credit facility(1) |
$ | 92,000 | $ | 92,000 | $ | — | $ | — | ||||||||
| 5.00% Senior Convertible Notes due February 2013 |
116,365 | 105,258 | 115,646 | 111,406 | ||||||||||||
| 4.50% Senior Convertible Notes due May 2015 |
75,238 | 63,825 | 73,187 | 87,652 | ||||||||||||
| Joint venture financing(2) |
1,366 | 1,366 | 1,445 | 1,445 | ||||||||||||
| Total |
$ | 284,969 | $ | 262,449 | $ | 190,278 | $ | 200,503 | ||||||||
| (1) | Maturity date of August 2012 bearing a weighted average interest rate of 4.11% and 3.83% as of December 31, 2010 and 2009, respectively, collateralized by all assets of the Company. See “Note O—Subsequent Events.” |
| (2) | Non-recourse, no interest rate |
Maturities of Long-Term Debt
Maturities of long-term debt as of December 31, 2010 are as follows:
| Year |
Amount | |||
| (in thousands) | ||||
| 2011 |
$ | 26 | ||
| 2012 |
92,019 | |||
| 2013 |
122,765 | |||
| 2014 |
11 | |||
| 2015 |
86,250 | |||
| Thereafter |
1,295 | |||
| $ | 302,366 | |||
Revolving Bank Credit Facility
The Company has an executed loan agreement providing for a secured revolving line of credit for up to $250 million in loans as the borrowing base permits, which is based on the Company’s oil and natural gas reserves (the “borrowing base”). The borrowing base at December 31, 2010 was $130 million and may be adjusted from time to time. The loan bears interest at a rate elected by the Company that is based on the prime, LIBO or federal funds rate plus margins ranging from 1% to 4.25% depending on the base rate used and the amount of the loan outstanding in relation to the borrowing base. Upon delivery by the Company of the monthly EBITDA certificate which sets forth the Total Net Debt to EBITDA ratio as being 4.00 to 1.00 or higher, the applicable LIBO rate margin and the applicable prime rate margin are automatically adjusted, effective on the first day of the month in which the monthly EBITDA certificate is delivered, as set forth in the agreement. The applicable LIBO rate margin will be 6.00% and the applicable prime rate margin will be 3.75%. The increased margins will remain in effect until the Total Net Debt to EBITDA ratio is less than 4.00 to 1.00.
F-25
Table of Contents
During 2010, the maturity date for amounts borrowed by the Company pursuant to the loan agreement was extended from July 15, 2011, to August 1, 2012, and the Company may automatically extend this new maturity date to July 8, 2013, in certain circumstances. Principal is payable voluntarily by the Company or is required to be paid (i) if the loan amount exceeds the borrowing base; (ii) if the lender elects to require periodic payments as a part of a borrowing base re-determination; and (iii) at the maturity date. The Company is obligated to pay a facility fee equal to 0.5% per year of the unused portion of the borrowing base payable quarterly. The loan is secured by a first mortgage on assets of the Company.
During 2010, the financial covenants of the loan agreement were amended relating to the maximum ratio of total debt to EBITDA (as defined in the Loan Agreement). First, the definition of “total debt” was modified to include only the portions of the Company’s $122.75 million aggregate principal amount of 5.00% senior convertible notes and $86.25 million aggregate principal amount of 4.50% senior convertible notes classified as indebtedness and to exclude the portions of such convertible notes classified as equity under generally accepted accounting principles. Second, the Company is required to maintain, on a monthly basis as of the last day of each month, a ratio (on a rolling twelve month basis) of Total Net Debt to EBITDA during the preceding twelve months not to exceed the following levels:
| Period |
Maximum Ratio | |||
| June 1, 2010 through November 30, 2010 |
4.50 to 1.00 | |||
| December 1, 2010 through February 28, 2011 |
4.75 to 1.00 | |||
| March 1, 2011 through August 31, 2011 |
4.60 to 1.00 | |||
| September 1, 2011 through October 31, 2011 |
4.40 to 1.00 | |||
| November 1, 2011 through Maturity Date |
4.00 to 1.00 | |||
Additionally, the Company is required to maintain, on a monthly basis as of the last day of each month, a ratio (on a rolling twelve month basis) of Total Senior Secured Debt to EBITDA (as defined) during the preceding twelve (12) months not to exceed 2.50 to 1.00. “Total Senior Secured Debt” means the Company’s Indebtedness (as defined) plus any other senior secured indebtedness for borrowed money owing by the Company or any subsidiaries which is secured by a lien (whether on any of the Company’s property which is not collateral or on a pari passu basis with the Indebtedness).
The loan agreement contains additional affirmative and restrictive covenants. These covenants, among other things, prohibit additional indebtedness, sales of assets, mergers and consolidations, dividends and distributions, and changes in management and require the maintenance of various financial ratios. The required and actual financials ratios as of December 31, 2010 are shown below:
| Financial Covenant |
Required Ratio | Actual Ratio | ||||
| Current ratio(1) |
Not less than 1 to 1 | 1.29 to 1 | ||||
| Ratio of Total Net Debt to EBITDA(2) |
Not greater than 4.75 to 1 | 4.62 to 1 | ||||
| Total Senior Secured Debt to EBITDA(2) |
Not greater than 2.50 to 1 | 1.50 to 1 | ||||
| Ratio of EBITDA, as defined in the revolving bank credit facility agreement to cash interest expense(3) |
Not less than 3 to 1 | 3.40 to 1 | ||||
| (1) | Current ratio is defined in our revolving bank credit facility as the ratio of current assets plus the unused and available portion of the revolving bank credit facility ($38 million as of December 31, 2010) to current liabilities. The calculation will not include the effects, if any, of derivatives under ASC 815. As of December 31, 2010, current assets included derivatives assets of $19.5 million. In addition, the convertible notes are not considered a current liability unless one or more convertible notes have been surrendered for conversion and then only to the extent of the cash payment due on the conversion of the notes surrendered. |
| (2) | EBITDA as defined in our revolving bank credit facility as of December 31, 2010 is calculated as follows (amounts in thousands): |
F-26
Table of Contents
| Net loss |
$ | (138,292 | ) | |
| Plus: |
||||
| Interest expense |
18,642 | |||
| Early extinguishment of debt |
(141 | ) | ||
| Impairment of oil and natural gas properties and assets held for sale |
143,712 | |||
| Depreciation, depletion and amortization |
38,061 | |||
| Non-cash compensation and other expenses |
4,167 | |||
| Less: |
||||
| Income tax benefit |
4,239 | |||
| EBITDA |
$ | 61,910 | ||
| (3) | Cash interest expense is defined in the revolving bank credit facility as all interest, fees, charges, and related expenses payable in cash for the applicable period payable to a lender in connection with borrowed money or the deferred purchase price of assets that is considered interest expense under GAAP, plus the portion of rent paid or payable for that period under capital lease obligations that should be treated as interest. For 2010, cash interest expense included fees paid related to bank financing activities and other loan fees of $1.7 million. As of December 31, 2010, non-cash interest expense of $7.7 million was deducted from interest expense to arrive at the cash interest expense used in the debt covenant calculation. Non-cash interest expense primarily relates to the amortization of debt issuance costs. Capitalized interest of $2.6 million was added to interest expense. |
As of December 31, 2010, the Company was in compliance with financial covenants under the revolving bank credit facility. The lenders may accelerate all of the indebtedness under the revolving bank credit facility upon the occurrence of any event of default unless the Company cures any such default within any applicable grace period. For payments of principal and interest under the revolving bank credit facility, the Company generally has a three business day grace period, and a 30-day cure period for most covenant defaults, but not for defaults of certain specific covenants, including the financial covenants and negative covenants.
See “Note O—Subsequent Events.” The loan agreement was amended on February 2, 2011 in connection with the Company’s issuance of senior unsecured notes, sale of common stock and tender offer for at least $50 million of the Company’s convertible senior notes due 2013.
5.00% Convertible Senior Notes
In February 2008, the Company completed a $125 million private placement of 5.00% convertible senior notes due 2013 (“5.00% Convertible Notes”). In connection with such offering, we agreed to loan up to 3,846,150 shares of our common stock to an affiliate of Jefferies & Company, Inc. to facilitate hedging transactions by purchasers of the notes.
On December 21 and December 22, 2010, the Company entered into two separate agreements with a third party to retire $2.25 million of the 5.00% Convertible Notes for a combined total of 380,250 shares of the Company’s common stock and $45,659.72 in cash. The cash consideration satisfies unpaid and accrued interest on the 5.00% Convertible Notes.
As a result of the adoption of the new authoritative accounting guidance under ASC as of January 1, 2009 and its retrospective application, the Company recorded a debt discount of $14.3 million, which represented the fair value of the equity conversion feature, and recorded a corresponding increase in additional paid-in capital (“APIC”), net of deferred taxes. In addition, the transaction costs incurred directly related to the issuance of the 5.00% Convertible Notes were allocated proportionately to the equity conversion feature and recorded as APIC. The equity component is not subsequently re-valued as long as it continues to qualify for equity treatment.
F-27
Table of Contents
The debt discount is amortized as additional non-cash interest expense over the expected term of the 5.00% Convertible Notes through February 2013. As of December 31, 2010, the net carrying amount was as follows (amounts in the thousands):
| 2010 | 2009 | |||||||
| Principal amount |
$ | 122,750 | $ | 125,000 | ||||
| Unamortized debt discount |
(6,385 | ) | (9,354 | ) | ||||
| Carrying amount |
$ | 116,365 | $ | 115,646 | ||||
The 5.00% Convertible Notes bear interest at a rate of 5.00% per year, payable semiannually in arrears on February 1 and August 1 of each year, which began August 1, 2008. As a result of the amortization of the debt discount through non-cash interest expense, the effective interest rate on the 5.00% Convertible Notes is 8.7% per annum. The amount of the cash interest expense recognized with respect to the 5.00% contractual interest coupon for the years ended December 31, 2010 and 2009 was $6.2 million and $6.3 million, respectively. The amount of non-cash interest expense for the years ended December 31, 2010 and 2009 related to the amortization of the debt discount and amortization of the transaction costs was $3.7 million and $3.5 million, respectively. As of December 31, 2010, the unamortized discount is expected to be amortized into earnings over 2.1 years. The carrying value of the equity component of the 5.00% Convertible Notes was $9.2 million as of December 31, 2010.
Holders may convert their 5.00% Convertible Notes at their option prior to the close of business on the business day immediately preceding November 1, 2012 only under the following circumstances:
| • | during any fiscal quarter commencing after March 31, 2008 if the last reported sale price of the common stock for at least 20 trading days during a period of 30 consecutive trading days ending on the last trading day of the preceding fiscal quarter is greater than or equal to 130% of the applicable conversion price on each such trading day; |
| • | during the five business-day period after any five consecutive trading-day period in which the trading price for each day of that measurement period was less than 98% of the last reported sale price of our common stock and the applicable conversion rate on each such day; or |
| • | the occurrence of certain sales of assets, distributions or changes to distribution rights to common stockholders, mergers and consolidations, changes in management, or our common stock ceases to be listed on a United States national or regional securities exchange, among other things. |
On and after November 1, 2012 until the close of business on the business day immediately preceding the maturity date, holders may convert their 5.00% Convertible Notes at any time, regardless of the foregoing circumstances.
Upon conversion, the Company will satisfy its conversion obligation by paying and delivering cash for the lesser of the principal amount or the conversion value, and, if the conversion value is in excess of the principal amount, by paying or delivering, at its option, cash and/or shares of its common stock for such excess. The conversion value is a daily value calculated on a proportionate basis for each day of a 60 trading-day observation period. The conversion rate is initially 30.7692 shares of the Company’s common stock per $1,000 principal amount of notes (equivalent to a conversion price of approximately $32.50 per share of common stock). The conversion rate is subject to adjustment in some events but will not be adjusted for accrued interest. In addition, following any fundamental change that occurs prior to the maturity date, we will increase the conversion rate for a holder who elects to convert its 5.00% Convertible Notes in connection with such a fundamental change in certain circumstances. The increase in the conversion rate is determined based on a formula that takes into consideration our stock price at the time of the fundamental change (ranging from $25.00 to $150.00 per share) and the remaining time to maturity of the notes. The increase in the conversion rate ranges from 0% to 30% increasing as the stock price at the time of the fundamental change increases from $25.00 and declines as the remaining time to maturity of the notes decreases.
F-28
Table of Contents
We may not redeem the 5.00% Convertible Notes prior to maturity. However, if we undergo a fundamental change, holders may require us to repurchase the 5.00% Convertible Notes in whole or in part for cash at a price equal to 100% of the principal amount of the 5.00% Convertible Notes to be repurchased plus any accrued and unpaid interest (including additional interest, if any) to, but excluding, the fundamental change repurchase date.
The 5.00% Convertible Notes are senior unsecured obligations of the Company and rank equally in right of payment to all of the Company’s other existing and future senior indebtedness. The 5.00% Convertible Notes are effectively subordinated to revolving bank credit facility, to the extent of the value of our assets pledged as collateral for such indebtedness. The 5.00% Convertible Notes are also effectively subordinated to all liabilities of our subsidiaries, including liabilities under any guarantees they have issued.
See “Note O—Subsequent Events.” On January 28, 2011, the Company offered to tender for up to $50 million aggregate principal at its 5.00% Convertible Senior Notes due 2013 in connection with the sale of common stock and the issuance of $200 million of senior notes due 2019.
4.50% Convertible Senior Notes
In October 2009, the Company completed a $86.3 million private placement of 4.50% convertible senior notes due 2015 (“4.50% Convertible Notes”). The proceeds of the offering were used to repay the Senior Subordinated Secured Notes due 2012 and a portion of the outstanding indebtedness under the revolving bank credit facility. The Company recorded a debt discount of $13.4 million, which represented the fair value of the equity conversion feature, and recorded a corresponding increase in APIC, net of deferred taxes. In addition, the transaction costs incurred directly related to the issuance of the 4.50% Convertible Notes were allocated proportionately to the equity conversion feature and recorded as APIC. The equity component is not subsequently re-valued as long as it continues to qualify for equity treatment. As of December 31, 2010, the net carrying amount was as follows (amounts in thousands):
| 2010 | 2009 | |||||||
| Principal amount |
$ | 86,250 | $ | 86,250 | ||||
| Unamortized debt discount |
(11,012 | ) | (13,063 | ) | ||||
| Carrying amount |
$ | 75,238 | $ | 73,187 | ||||
The 4.50% Convertible Notes bear interest at a rate of 4.50% per year, payable semiannually in arrears on November 1 and May 1 of each year, beginning May 1, 2010. As a result of the amortization of the debt discount through non-cash interest expense, the effective interest rate on the 4.50% Convertible Notes is 9.09% per annum. The amount of the cash interest expense recognized with respect to the 4.50% contractual interest coupon for the year ended December 31, 2010 was $3.9 million. The amount of non-cash interest expense for the year ended December 31, 2010 related to the amortization of the debt discount and amortization of the transaction costs was $2.5 million. As of December 31, 2010, the unamortized discount is expected to be amortized into earnings over 4.3 years. The carrying value of the equity component of the 4.50% Convertible Notes was $8.4 million as of December 31, 2010.
The 4.50% Convertible Notes mature on May 1, 2015, unless earlier converted or repurchased by us. Holders may convert their notes prior to the close of business on the business day immediately preceding February 1, 2015, only under the following circumstances:
| • | during any fiscal quarter commencing after January 1, 2010, if the last reported sale price of our common stock for at least 20 trading days during a period of 30 consecutive trading days ending on the last trading day of the preceding fiscal quarter is greater than or equal to 130% of the applicable conversion price on each such trading day; |
F-29
Table of Contents
| • | during the five business-day period after any five consecutive trading-day period in which the trading price per $1,000 principal amount of 4.50% Convertible Notes for each day of such five consecutive trading-day period was less than 98% of the product of the last reported sale price of our common stock and the applicable conversion rate on each such day; |
| • | upon the occurrence of a corporate event pursuant to which: (1) we issue rights to all or substantially all of the holders of our common stock entitling them to purchase, for a period of not more than 60 calendar days after the announcement date of such issuance to subscribe for or purchase, shares of our common stock at a price per share less than the average of the last reported sale prices of our common stock for the 10 consecutive trading day period ending on the trading day immediately preceding the date of announcement of such issuance; (2) we distribute to all or substantially all of the holders of our common stock our assets, debt securities or rights to purchase our securities, if the distribution has a per share value in excess of 10% of the last reported sale price for our common stock on the trading day immediately preceding the date of announcement of such distribution; or (3) we are a party to a consolidation, merger, binding share exchange, or transfer or lease of all or substantially all of our assets, pursuant to which our common stock would be converted into cash, securities or other assets; |
| • | if: (1) a “person” or “group” within the meaning of Section 13(d) of the Exchange Act acquires more than 50% of our outstanding voting stock, (2) we consummate a recapitalization, reclassification or change of our common stock as a result of which our common stock would be converted into or exchanged for stock, other securities, other property or assets, less than 90% of which received by our common shareholders consists of publicly traded securities, (3) we consummate a share exchange, consolidation or merger pursuant to which our common stock will be converted into cash, securities or other property, (4) we consummate any sale, lease or other transfer in one transaction or a series of transactions of all or substantially all of our and our subsidiaries’ consolidated assets to any person other than one of our subsidiaries, (5) continuing directors cease to constitute at least a majority of our board of directors, (6) our shareholders approve any plan or proposal for our liquidation or dissolution, or (7) our common stock ceases to be listed on any of The New York Stock Exchange, The NASDAQ Global Select Market or The NASDAQ Global Market; or |
| • | if we call the 4.50% Convertible Notes for redemption, at any time prior to the close of business on the business day prior to the redemption date (any of the events described in the fourth and fifth bullets above, a “make-whole fundamental change”). |
On and after February 1, 2015 until the close of business on the business day immediately preceding the maturity date, holders may convert their 4.50% Convertible Notes, in multiples of $1,000 principal amount, at the option of the holder regardless of the foregoing circumstances.
Upon conversion, we will satisfy our conversion obligation by paying or delivering cash, shares of our common stock or a combination of cash and shares of our common stock, at our election. The conversion rate is initially 53.3333 shares of our common stock per $1,000 principal amount of 4.50% Convertible Notes (equivalent to a conversion price of approximately $18.75 per share of our common stock). The conversion rate is subject to adjustment in some events but will not be adjusted for accrued and unpaid interest. In addition, following any make-whole fundamental change that occurs prior to the maturity date, we will increase the conversion rate for a holder who elects to convert its 4.50% Convertible Notes in connection with such a make-whole fundamental change in certain circumstances. The increase in the conversion rate is determined based on a formula that takes into consideration our stock price at the time of the make-whole fundamental change (ranging from $15.00 to $100.00 per share) and the remaining time to maturity of the 4.50% Convertible Notes. The increase in the conversion rate declines from a high of 25.0% to 0.0% as the stock price at the time of the make-whole fundamental change increases from $15.00 and the remaining time to maturity of the 4.50% Convertible Notes decreases.
On or after November 1, 2012, and prior to the maturity date, we may redeem for cash all, but not less than all, of the 4.50% Convertible Notes if the last reported sales price of our common stock equals or exceeds 130%
F-30
Table of Contents
of the conversion price then in effect for 20 or more trading days in a period of 30 consecutive trading days ending on the trading day immediately prior to the date of the redemption notice. The redemption price will equal 100% of the principal amount of the 4.50% Convertible Notes to be redeemed, plus any accrued and unpaid interest, including any additional interest, to, but excluding, the redemption date. To the extent a holder converts its 4.50% Convertible Notes in connection with our redemption notice, we will increase the conversion rate as described in the preceding paragraph.
The 4.50% Convertible Notes are senior, unsecured obligations of the Company and rank equally in right of payment with our senior unsecured debt and our existing 5.00% Convertible Notes, and are senior in right of payment to our debt that is expressly subordinated to the 4.50% Convertible Notes, if any. The 4.50% Convertible Notes are structurally subordinated to all debt and other liabilities and commitments of our subsidiaries, including our subsidiaries’ guarantees of our indebtedness under our revolving bank credit facility, and are effectively junior to our secured debt to the extent of the assets securing such debt.
Senior Subordinated Secured Notes
In July 2007, we entered into a Note Purchase Agreement (“Note Agreement”) with The Prudential Insurance Company of America (“Prudential”) providing for the issuance and sale from time to time of up to $100 million in senior subordinated secured notes (the “Secured Notes”) and sold to Prudential an initial tranche of $30 million of 7.58% Series A fixed rate notes due July 31, 2012 with interest payable quarterly. Proceeds from the sale of the Secured Notes were used for general corporate purposes including additional funding of drilling and development costs in the Cotton Valley Sands in East Texas. On October 18, 2009, the Company entered into an amendment with Prudential to provide for the repayment of the outstanding indebtedness of the Secured Notes. The Company repaid all of the outstanding indebtedness under the Secured Notes with a portion of the proceeds from the 4.50% Convertible Senior Notes issued in October 2009. The terms of the repayment included a prepayment penalty of $4.6 million. Additionally, we expensed approximately $0.3 million in deferred debt issue costs for the year ended December 31, 2009.
Joint Venture Financing
In 2004, we entered into an arrangement with PVOG to purchase dollar denominated production payments from the Company on certain wells drilled during a portion of 2004. Under this agreement, PVOG provided $2.8 million in funding for our share of costs of four wells drilled which is repayable solely from 75% of GMX’s share of production revenues from these wells without interest.
NOTE G—ASSET RETIREMENT OBLIGATIONS
The activity incurred in the asset retirement obligation is as follows:
| 2010 | 2009 | |||||||
| (in thousands) | ||||||||
| Beginning balance |
$ | 6,789 | $ | 6,049 | ||||
| Liabilities incurred |
269 | 324 | ||||||
| Liabilities settled |
(467 | ) | (204 | ) | ||||
| Accretion |
412 | 378 | ||||||
| Revisions |
275 | 242 | ||||||
| Ending balance(1) |
7,278 | 6,789 | ||||||
| Less current portion(1) |
406 | 259 | ||||||
| $ | 6,861 | $ | 6,530 | |||||
| (1) | The Company’s liability for asset retirement obligations is included in other liabilities in the consolidated balance sheets, net of the current obligations. The current portion is included in accrued expenses in the consolidated balance sheets. |
F-31
Table of Contents
NOTE H—INCOME TAXES
Income tax expense (benefit) consists of the following for the years ended December 31:
| 2010 | 2009 | 2008 | ||||||||||
| (in thousands) | ||||||||||||
| Current tax expense (benefit) |
$ | (30 | ) | $ | (33 | ) | $ | 26 | ||||
| Deferred tax expense (benefit) |
(4,209 | ) | — | (26,243 | ) | |||||||
| $ | (4,239 | ) | $ | (33 | ) | $ | (26,217 | ) | ||||
Total income tax expense (benefit) differed from the amounts computed by applying the U.S. federal tax rate to earnings before income taxes as a result of the following for the years ended December 31:
| 2010 | 2009 | 2008 | ||||||||||
| U.S. statutory tax rate |
34 | % | 34 | % | 34 | % | ||||||
| Statutory depletion |
3 | — | (4 | ) | ||||||||
| Change in valuation allowance |
(37 | ) | (33 | ) | (17 | ) | ||||||
| Other |
3 | (1 | ) | 4 | ||||||||
| Effective income tax rate |
3 | % | — | % | 17 | % | ||||||
Intangible development costs may be capitalized or expensed for income tax reporting purposes, whereas they are capitalized and amortized for financial statement purposes. Lease and well equipment and other property and equipment may be depreciated for income tax reporting purposes using accelerated methods and different lives. Other temporary differences include the effect of hedging transactions and stock based compensation awards. Deferred income taxes are provided on these temporary differences to the extent that income taxes which otherwise would have been payable are reduced. Deferred income tax assets are also available to offset future income taxes.
The following table sets forth the Company’s deferred tax assets and liabilities at December 31:
| 2010 | 2009 (as adjusted) |
2008 (as adjusted) |
||||||||||
| (in thousands) | ||||||||||||
| Deferred tax assets: |
||||||||||||
| Federal net operating loss carryforwards |
$ | 71,911 | $ | 26,500 | $ | 13,132 | ||||||
| Property and equipment |
10,644 | 548 | — | |||||||||
| Statutory depletion carryforwards |
5,723 | 2,245 | 3,588 | |||||||||
| Stock compensation expense |
1,416 | 1,030 | 641 | |||||||||
| Derivative instruments |
704 | 662 | 734 | |||||||||
| Oil and natural gas properties |
56,992 | 60,089 | 23,059 | |||||||||
| Other |
480 | 431 | 34 | |||||||||
| Valuation allowance on deferred tax assets not expected to be realized |
(133,451 | ) | (79,182 | ) | (25,037 | ) | ||||||
| Total |
14,419 | 12,323 | 16,151 | |||||||||
| Deferred tax liabilities: |
||||||||||||
| Property and equipment |
— | — | (1,983 | ) | ||||||||
| Derivative instruments |
(8,066 | ) | (4,237 | ) | (9,260 | ) | ||||||
| Convertible debt and share lending agreement |
(6,353 | ) | (8,086 | ) | (4,908 | ) | ||||||
| Total |
(14,419 | ) | (12,323 | ) | (16,151 | ) | ||||||
| Net deferred tax asset (liability) |
$ | — | $ | — | $ | — | ||||||
F-32
Table of Contents
The valuation allowance for deferred tax assets increased by $54.2 million in 2010. In determining the carrying value of a deferred tax asset, accounting standards provides for the weighing of evidence in estimating whether and how much of a deferred tax asset may be recoverable. As we have incurred net operating losses in 2010 and prior years, relevant accounting guidance suggest that cumulative losses in recent years constitute significant negative evidence, and that future expectations about income are insufficient to overcome a history of such losses. Therefore, with the before mentioned adjustment of $54.2 million, we continue to reduce the carrying value of our net deferred tax asset to zero for 2010, which has been the case in prior years. The valuation allowance has no impact on our net operating loss (“NOL”) position for tax purposes, and if we generate taxable income in future periods, we will be able to use our NOLs to offset taxes due at that time. The Company will continue to assess the valuation allowance against deferred tax assets considering all available evidence obtained in future reporting periods.
At December 31, 2010, the Company had federal net operating loss carryforwards of $211.5 million which will begin to expire in 2018 if unused. The Company’s federal net operating loss carryforward has an annual limitation under Internal Revenue Code Section 382. In addition, at December 31, 2010, the Company had tax percentage depletion carryforwards of approximately $16.8 million which are not subject to expiration.
The Company and its subsidiaries file income tax returns in the U.S. federal jurisdiction and in various states. With few exceptions, the Company is no longer subject to U.S. federal or state income tax examinations by these tax authorities for years before and including 2006. We have not paid any significant interest or penalties associated with our income taxes, but classify both interest expense and penalties as part of our income tax expense.
NOTE I—COMMITMENTS AND CONTINGENCIES
The Company is party to various legal actions arising in the normal course of business. Matters that are probable of unfavorable outcome to the Company and which can be reasonably estimated are accrued. Such accruals are based on information known about the matters, the Company’s estimates of the outcomes of such matters, and its experience in contesting, litigating, and settling similar matters. None of the actions are believed by management to involve future amounts that would be material to the Company’s financial position or results of operations after consideration of recorded accruals.
The Company leases offices and certain equipment under operating leases and has contracts with a drilling contractor for the use of four rigs with 3 year terms. Additionally, in 2010, the Company entered into a firm transportation and a firm sales contract for various terms through 2020. Under these contracts, the Company is obligated to transport or sell minimum daily gas volumes, as calculated on a monthly basis, or pay for any deficiencies, at a set rate. The firm transportation contract for 50 Mmbtu per day commences with the completion of a pipeline which occurred in the first quarter of 2010. An additional sales contract was effective in September 2009 for 15 Mmbtu per day and increases through 2014 up to 100 Mmbtu per day. These commitments are not recorded in the accompanying consolidated balance sheets.
The following is schedule by year of these obligations and minimum lease payments at December 31, 2010:
| Year |
Operating Leases | Transportation | Drilling Contracts | Total | ||||||||||||
| (in thousands) | ||||||||||||||||
| 2011 |
$ | 1,129 | $ | 6,043 | $ | 22,948 | $ | 30,120 | ||||||||
| 2012 |
1,118 | 6,190 | 22,463 | 29,771 | ||||||||||||
| 2013 |
802 | 6,349 | 1,153 | 8,304 | ||||||||||||
| 2014 |
491 | 5,970 | — | 6,461 | ||||||||||||
| 2015 |
555 | 5,668 | — | 6,223 | ||||||||||||
| Thereafter |
662 | 22,672 | — | 23,334 | ||||||||||||
| Total |
$ | 4,757 | $ | 52,892 | $ | 46,564 | $ | 104,213 | ||||||||
F-33
Table of Contents
Rent expense on operating leases for the years ended December 31, 2010, 2009 and 2008 was $2.8 million, $1.4 million and $693,000, respectively.
NOTE J—STOCK COMPENSATION PLANS
We recognized $6.6 million, $4.6 million and $3.1 million of stock compensation expense for the years ending December 31, 2010, 2009 and 2008, respectively. These non-cash expenses are reflected as a component of the Company’s general and administrative expense. To the extent amortization of compensation costs relates to employees directly involved in exploration and development activities, such amounts are capitalized to oil and natural gas properties. Stock based compensation capitalized as part of oil & natural gas properties was $1.0 million and $1.2 million for the years ended December 31, 2010 and 2009.
2008 Long-Term Incentive Plan
In May 2008, the Board of Directors and shareholders adopted the 2008 Long-Term Incentive Plan (or “LTI Plan”) to retain and attract employees, consultants and directors, and to stimulate the active interest in the development and financial success of the Company. The LTI Plan provides for the grant of stock options, restricted stock awards, bonus stock awards, stock appreciation rights, performance units and performance bonuses, subject to certain conditions.
On June 17, 2010, the LTI Plan was amended. Under the terms of the amended LTI Plan, the aggregate number of shares of common stock available for awards may not exceed 1,750,000 shares. Of the shares available for issuance under the LTI Plan as of the amendment date of the LTI Plan, 750,000 could be granted as “incentive stock options” as defined in Section 422 of the Internal Revenue Code of 1986, as amended (the “Code”).
2000 Stock Option Plan
In October 2000, the Board of Directors and shareholders adopted the GMX Resources Inc. Stock Option Plan (the “2000 Option Plan”). Under the 2000 Option Plan, the Company may grant both stock options intended to qualify as incentive stock options under Section 422 of the Internal Revenue Code and options which are not qualified as incentive stock options.
The maximum number of shares of common stock issuable under the 2000 Option Plan, as amended in May 2007, is 850,000, subject to appropriate adjustment in the event of reorganization, stock split, stock dividend, reclassification or other change affecting the Company’s common stock. All officers, employees and directors are eligible to receive awards under the 2000 Option Plan. The exercise price of options granted is not less than 100% of the fair market value of the shares on the date of grant. Options granted become exercisable as the Board of Directors may determine in connection with the grant of each option. In addition, the Board of Directors may at any time accelerate the date that any option granted becomes exercisable. Stock options generally vest over four years and have a 10-year contractual term. 25,698 options were accelerated in vesting during 2010 as a result of agreements with terminated employees. There have been no options for which vesting was accelerated in 2009 and 2008.
The 2000 Option Plan terminated on October 30, 2010, and no options will be granted pursuant to this plan except with respect to awards then outstanding.
F-34
Table of Contents
Stock Options
The following table provides information related to stock option activity under the 2000 Option Plan for the years ended December 31, 2008, 2009 and 2010:
| Number of shares underlying options |
Weighted average exercise price per share |
Aggregate intrinsic value(1) (in thousands) |
Weighted average grant date fair value per share |
|||||||||||||
| Outstanding as of December 31, 2007 |
574,500 | $ | 28.86 | |||||||||||||
| Granted |
100,000 | 25.84 | $ | 25.84 | ||||||||||||
| Exercised |
(73,450 | ) | 13.34 | $ | 2,396 | |||||||||||
| Forfeited |
(18,000 | ) | 33.41 | |||||||||||||
| Outstanding as of December 31, 2008 |
583,050 | 30.16 | ||||||||||||||
| Exercised |
(750 | ) | 6.10 | $ | 3 | |||||||||||
| Forfeited |
(5,500 | ) | 33.95 | |||||||||||||
| Outstanding as of December 31, 2009 |
576,800 | 30.16 | ||||||||||||||
| Granted |
48,001 | 6.34 | $ | 4.36 | ||||||||||||
| Forfeited |
(48,750 | ) | 32.84 | |||||||||||||
| Outstanding as of December 31, 2010 |
576,051 | $ | 27.93 | $ | — | |||||||||||
| Exercisable as of December 31, 2010 |
446,050 | $ | 29.11 | $ | — | |||||||||||
| (1) | The intrinsic value is the amount by which the market value of the underlying stock exceeds the exercise price. |
The weighted-average remaining contractual life of outstanding and exercisable options at December 31, 2010 was 5.18 and 4.10 years, respectively. As of December 31, 2010 there was $649,186 of total unrecognized compensation costs related to non-vested stock options granted under the Company’s stock option plan. That cost is expected to be recognized over a weighted average period of 1.2 years.
The fair value of each stock award is estimated on the date of grant using the Black-Scholes option pricing model. Assumptions used in the valuation are disclosed in the following table:
| 2010 | 2009 | 2008 | ||||||||||
| Expected volatility |
77.2 | % | — | 41.3 | % | |||||||
| Expected dividend yields |
0 | % | — | 0 | % | |||||||
| Expected term (in years) |
6.25 | — | 4 | |||||||||
| Risk free rate |
2.2 | % | — | 2.7 | % | |||||||
The Company estimated volatility is based on the historical volatility of the Company’s common stock. The risk free interest rate is based on the U. S. Treasury yield curve in effect at the time of grant for the expected term of the option. The expected dividend yield is based on the Company’s current dividend yield and the best estimate of projected dividend yield for future periods within the expected life of the option.
Restricted Stock
In July 2008, the Company began issuing restricted stock awards to its officers, independent directors, consultants and certain employees under the LTI Plan. The holders of these shares have all the rights and privileges of owning the shares (including voting rights) except that the holders are not entitled to delivery of a portion thereof until certain passage of time requirements are met. With respect to the restricted stock granted to officers, consultants, and employees of the Company, the shares generally vest over a 3 or 4 year period. With
F-35
Table of Contents
respect to restricted shares issued to the Company’s independent board members, the shares vest over a two year period. The fair value of the awards issued is determined based on the fair market value of the shares on the date of grant. The value is amortized over the vesting period. In 2010, 74,799 restricted shares accelerated vesting as a result of termination agreements with employees.
A summary of the status of our unvested shares of restricted stock and the changes for the years ending December 31, 2008, 2009 and 2010 is presented below:
| Number of unvested restricted shares |
Weighted average grant- date fair value per share |
|||||||
| Unvested shares as of January 1, 2008 |
— | $ | — | |||||
| Granted |
79,347 | $ | 74.11 | |||||
| Vested |
(16,521 | ) | $ | 76.65 | ||||
| Forfeited |
(98 | ) | $ | 76.73 | ||||
| Unvested shares as of December 31, 2008 |
62,728 | $ | 73.44 | |||||
| Granted |
542,847 | $ | 18.55 | |||||
| Vested |
(23,574 | ) | $ | 70.38 | ||||
| Forfeited |
(1,471 | ) | $ | 29.00 | ||||
| Unvested shares as of December 31, 2009 |
580,530 | $ | 22.35 | |||||
| Granted |
359,385 | $ | 6.34 | |||||
| Vested |
(220,016 | ) | $ | 24.21 | ||||
| Forfeited |
(27,903 | ) | $ | 23.11 | ||||
| Unvested shares as of December 31, 2010 |
691,996 | $ | 13.47 | |||||
As of December 31, 2010, there was $9.3 million of unrecognized compensation expense related to non-vested restricted stock grants. This unrecognized compensation cost is expected to be recognized over a weighted-average period of 2.3 years.
The vesting of certain restricted stock grants results in state and federal income tax benefits related to the difference between the market price of the common stock at the date of vesting and the date of grant. During the years ended December 31, 2010 and 2009, we did not recognize excess tax benefits related to the vesting of restricted stock due to the market price of the common stock at the date of grant exceeding the market price at the vesting date.
401(k) Plan
The GMX Resources Inc. 401(k) Plan was adopted April 15, 2001. The plan is a qualified retirement plan under the Internal Revenue Code. All employees are eligible who have attained age 21. GMX matches the employee contributions up to 5% of the employee’s gross wages. The Company contributed $449,000, $281,000 and $448,000 in 2010, 2009 and 2008, respectively.
NOTE K—CAPITAL STOCK
In July 2008, GMX completed an offering of 2,000,000 shares of its common stock for $70.50 per share. Net proceeds to the Company were approximately $134.0 million. The Company repaid outstanding indebtedness under its revolving bank credit facility. The balance of the net proceeds were used to fund the development of oil and natural gas properties, acquisitions of additional oil and natural gas properties and for general corporate purposes.
F-36
Table of Contents
In May 2009, GMX completed an offering of 5,750,000 shares of its common stock for $12.00 per share. Net proceeds to the Company were $65.3 million. The Company used the net proceeds from this offering to repay outstanding indebtedness under its revolving bank credit facility.
In October 2009, GMX completed an offering of 6,950,000 shares of its common stock at $15.00 per share. Net proceeds to the Company were approximately $98.8 million. The Company used the net proceeds from this offering, along with the proceeds from the concurrent issuance of the 4.50% Convertible Notes, to repay the outstanding indebtedness under its revolving bank credit facility and to repay all of its outstanding senior subordinated secured notes, and for general corporate purposes.
As mentioned in “Note F—Long-Term Debt,” in December, 2010, the Company converted $2.25 million of the 5.00% Convertible Notes for a combined total of 380,250 shares of the Company’s common stock.
In August 2006, GMX sold 2,000,000 shares of 9.25% Series B Cumulative Preferred Stock at $25.00 per share in a public offering, resulting in a total offering of $50 million. The net proceeds of $47.1 million from the sale of preferred stock were used to fund the drilling and development of the Company’s East Texas properties and for other general corporate purposes.
In December 2010, GMX sold 41,169 shares of the Series B Cumulative Preferred stock in connection with a continuing “at-the-market” offering.
The annual dividends on each share of Series B Cumulative Preferred Stock are $2.3125 and is payable quarterly when, as and if declared by GMX, in cash (subject to specified exceptions), in arrears to holders of record as of the dividend payment record date, on or about the last calendar day of each March, June, September and December.
The Series B Cumulative Preferred Stock is not convertible into the GMX’s common stock and can be redeemed at the Company’s option after September 30, 2011 at $25.00 per share. The Series B Cumulative Preferred Stock will be required to be redeemed prior to September 30, 2011 at specified redemption prices and thereafter at $25.00 per share in the event of a change of ownership or control of GMX if the acquirer is not a public company meeting certain financial criteria.
F-37
Table of Contents
NOTE L—OIL AND NATURAL GAS OPERATIONS
Costs incurred in oil and natural gas property acquisitions, exploration, and development activities are as follows for the years ended December 31:
| 2010 | 2009 | 2008 | ||||||||||
| (in thousands) | ||||||||||||
| Development and exploration costs: |
||||||||||||
| Development drilling |
$ | 7,788 | $ | 14,202 | $ | 183,081 | ||||||
| Exploratory drilling |
164,355 | 116,250 | 15,943 | |||||||||
| Tubular and other drilling inventories |
3,167 | 1,697 | 39,773 | |||||||||
| Asset retirement obligation |
706 | 565 | 2,407 | |||||||||
| 176,016 | 132,714 | 241,204 | ||||||||||
| Acquisition: |
||||||||||||
| Proved |
3,884 | 6,881 | 23,246 | |||||||||
| Unproved(1) |
8,149 | 11,450 | 26,236 | |||||||||
| 12,033 | 18,331 | 49,482 | ||||||||||
| Total |
$ | 188,049 | $ | 151,045 | $ | 290,686 | ||||||
| (1) | Includes $2.6 million, $1.8 million and $361,000 of capitalized interest for the years ended December 31, 2010, 2009 and 2008, respectively. |
Costs excluded from amortization are as follows at December 31:
| 2010 | 2009 | |||||||
| (in thousands) | ||||||||
| Unproved property acquisition |
$ | 37,006 | $ | 33,122 | ||||
| Exploratory drilling |
2,688 | 6,667 | ||||||
| $ | 39,694 | $ | 39,789 | |||||
Unproved property acquisition costs include costs to acquire new leasehold, unevaluated leaseholds, and capitalized interest. Of the $37.0 million of unproved property costs at December 31, 2010 being excluded from the amortization base, $8.1 million, $11.5 million and $21.0 million were incurred in 2010, 2009, and 2008, respectively. Subject to industry conditions, evaluation of most of these properties and the inclusion of their costs in the amortized capital costs is expected to be completed within three years.
The average DD&A rate per equivalent unit of production was $1.88, $1.76 and 2.08 for the years ended December 31, 2010, 2009 and 2008, respectively.
NOTE M—SUPPLEMENTAL INFORMATION ON OIL AND NATURAL GAS OPERATIONS (UNAUDITED)
In December 2008, the SEC issued its final rule, Modernization of Oil and Gas Reporting, which is effective for reporting 2009 and 2010 reserve information. In January 2010, the FASB issued its authoritative guidance on extractive activities for oil and gas to align its requirements with the SEC’s final rule. We adopted the guidance as of December 31, 2009 in conjunction with our year-end reserve report as a change in accounting principle that is inseparable from a change in accounting estimate. Under the SEC’s final rule, reserves recorded for the year ended December 31, 2008 were not restated. The primary impacts in 2009 of the SEC’s final rule included:
| • | the use of the 2009 twelve-month average of the first-day-of-the-month reference prices (prior to adjustment for location and quality differentials) of $61.18 per Bbl for oil and $3.87 per MMBtu for |
F-38
Table of Contents
| natural gas compared to the year-end 2009 reference prices (prior to adjustment for location and quality differentials) of $79.36 per Bbl for oil and $5.79 per MMBtu for natural gas resulted in negative revisions of 16 Bcfe; |
| • | certain of our undeveloped locations are not scheduled to be developed within five years of December 31, 2009, had the impact of reducing our proved undeveloped reserves by 25 Bcfe; and |
| • | applying the same pricing methodology that was in effect for 2008 in 2009 would have resulted in the recognition of an additional 99 Bcfe in reserves at December 31, 2009. |
In addition to the 2009 pricing discussed above, the twelve month average of the first-day-of-the-month reference prices (prior to adjustment for location and quality differentials) for 2010 were $79.43 per Bbl for oil and $4.38 per MMBtu for natural gas. For 2008, prior to the SEC issuing its final rule, the reference price was $44.60 per Bbl for oil and $5.71 per MMBtu for natural gas.
All of our reserves were located in the United States. Our reserves were based upon reserve reports prepared by the independent petroleum engineers of MHA Petroleum Consultants, Inc. (“MHA”) and DeGolyer and MacNaughton (“D&M”). Management believes the reserve estimates presented herein, in accordance with generally accepted engineering and evaluation principles consistently applied, are reasonable. However, there are numerous uncertainties inherent in estimating quantities and values of proved reserves and in projecting future rates of production and the amount and timing of development expenditures, including many factors beyond our control. Reserve engineering is a subjective process of estimating the recovery from underground accumulations of oil and gas that cannot be measured in an exact manner, and the accuracy of any reserve estimate is a function of the quality of available data and of engineering and geological interpretation and judgment. Because all reserve estimates are to some degree speculative, the quantities of oil and gas that are ultimately recovered, production and operating costs, the amount and timing of future development expenditures and future oil and gas sales prices may all differ from those assumed in these estimates. In addition, different reserve engineers may make different estimates of reserve quantities and cash flows based upon the same available data.
Therefore, the Standardized Measure shown below represents estimates only and should not be construed as the current market value of the estimated oil and gas reserves attributable to our properties. In this regard, the information set forth in the following tables includes revisions of reserve estimates attributable to proved properties included in the preceding year’s estimates. Such revisions reflect additional information from subsequent development activities, production history of the properties involved and any adjustments in the projected economic life of such properties resulting from changes in product prices. Decreases in the prices of oil and natural gas have had, and could have in the future, an adverse effect on the carrying value of our proved reserves, reserve volumes and our revenues, profitability and cash flow.
As of December 31, 2010, our reserves shown are net wellhead volumes that have been reduced for lease use volumes (volumes that are consumed or lost between the wellhead and the point of custody transfer). Prior to December 31, 2010, wellhead volumes had not been reduced for lease use volumes which were estimated to be 11% and 10% of ending proved reserves as of December 31, 2009 and 2008, respectively. Historically, the Company had reduced the natural gas price used in determining future cash inflows to compensate for lease use volumes and in determining net realized price.
F-39
Table of Contents
Estimated Quantities of Oil and Natural Gas
The following table sets forth certain data pertaining to our proved, proved developed and proved undeveloped reserves for the three years ended December 31, 2010.
| OIL (MBBLS) |
GAS (MMCF) |
|||||||
| December 31, 2008 |
||||||||
| Proved reserves, beginning of period |
4,693 | 406,342 | ||||||
| Extensions, discoveries, and other additions |
1,613 | 132,434 | ||||||
| Production |
(190 | ) | (11,777 | ) | ||||
| Revisions of previous estimates |
(1,112 | ) | (91,678 | ) | ||||
| Proved reserves, end of period |
5,004 | 435,321 | ||||||
| December 31, 2009 |
||||||||
| Proved reserves, beginning of period |
5,004 | 435,321 | ||||||
| Extensions, discoveries, and other additions |
38 | 25,672 | ||||||
| Production |
(119 | ) | (12,908 | ) | ||||
| Revisions of previous estimates |
(1,244 | ) | (114,873 | ) | ||||
| Proved reserves, end of period |
3,679 | 333,212 | ||||||
| December 31, 2010 |
||||||||
| Proved reserves, beginning of period |
3,679 | 333,212 | ||||||
| Extensions, discoveries, and other additions |
— | 232,629 | ||||||
| Production |
(95 | ) | (16,901 | ) | ||||
| Revisions of previous estimates |
(2,363 | ) | (236,991 | ) | ||||
| Proved reserves, end of period |
1,221 | 311,949 | ||||||
| Proved Developed Reserves |
||||||||
| December 31, 2007 |
1,776 | 144,164 | ||||||
| December 31, 2008 |
1,920 | 150,585 | ||||||
| December 31, 2009 |
1,439 | 124,611 | ||||||
| December 31, 2010 |
1,221 | 157,027 | ||||||
| Proved Undeveloped Reserves |
||||||||
| December 31, 2007 |
2,917 | 262,178 | ||||||
| December 31, 2008 |
3,084 | 284,736 | ||||||
| December 31, 2009 |
2,240 | 208,601 | ||||||
| December 31, 2010 |
— | 154,922 | ||||||
Revisions of Previous Estimates
In 2010, we had negative revisions of 251 Bcfe, which was primarily the result of all of our Cotton Valley Sands undeveloped locations being removed for adherence with the SEC 5-year guideline for booking our proved reserves, resulting in a negative revision of 219.6 Bcfe. In addition to the Cotton Valley Sands undeveloped locations, the Company also had negative revisions of 10.2 Bcfe related to individual well production history and 16.2 Bcfe related to reporting reserves at net well head volumes.
In 2009, we had negative revisions of 122 Bcfe. Certain of our Cotton Valley Sands undeveloped locations are scheduled for development beyond five years and were excluded from our proved reserves, resulting in a negative revision of 53 Bcfe. The proved reserves for Cotton Valley Sands producers were reduced by 53 Bcfe based on individual well production history. Negative revisions of 16 Bcfe were related to lower natural gas prices as declines in prices result in certain reserves becoming uneconomic at earlier periods.
F-40
Table of Contents
In 2008, we had a total of 98 Bcfe of negative revisions primarily related to the significant decline in oil and natural gas prices at December 31, 2008 as declines in prices result in certain reserves becoming uneconomic at earlier periods.
Extensions, Discoveries and Other Additions
In 2010, we had a total of 233 Bcfe of extensions and discoveries in the Haynesville Shale resulting from successful drilling during 2010 that extended and developed the proved acreage.
In 2009, we had a total of 25 Bcfe of extensions and discoveries, including 22 Bcfe in the Haynesville Shale resulting from successful drilling during 2009 that extended and developed the proved acreage.
In 2008, the increases in proved reserves from extensions and discoveries is the direct result of additional drilling on our acreage in the Cotton Valley Sands formation.
Standardized measure of discounted future net cash flows
The Standardized Measure of discounted future net cash flows (discounted at 10%) from production of proved reserves was developed as follows:
| • | An estimate was made of the quantity of proved reserves and the future periods in which they are expected to be produced based on year-end economic conditions. |
| • | In accordance with SEC guidelines, the engineers’ estimates of future net revenues from our proved properties and the present value thereof for 2009 and 2010 are made using the twelve-month average of the first-day-of-the-month reference prices as adjusted for location and quality differentials. 2008 estimates were not required to be restated and reflect previously disclosed estimates using year-end prices. These prices are held constant throughout the life of the properties. Oil and natural gas prices are adjusted for each lease for quality, contractual agreements, and regional price variations. |
| • | The future gross revenue streams were reduced by estimated future operating costs (including production and ad valorem taxes) and future development and abandonment costs, all of which were based on current costs in effect at December 31 of the year presented and held constant throughout the life of the properties. |
| • | Future income taxes were calculated by applying the statutory federal and state income tax rate to pre-tax future net cash flows, net of the tax basis of the properties involved and utilization of available tax carryforwards related to oil and gas operations. |
The following summary sets forth the Company’s future net cash flows relating to proved oil and natural gas reserves based on the standardized measure as of December 31:
| 2010 | 2009 | 2008 | ||||||||||
| (in thousands) | ||||||||||||
| Future cash inflows |
$ | 1,381,031 | $ | 1,540,047 | $ | 2,586,574 | ||||||
| Future production costs |
(401,387 | ) | (591,102 | ) | (1,014,500 | ) | ||||||
| Future development costs |
(286,897 | ) | (323,246 | ) | (559,777 | ) | ||||||
| Future income tax provisions |
— | — | (187,084 | ) | ||||||||
| Net future cash inflows |
692,747 | 625,699 | 825,213 | |||||||||
| Less effect of a 10% discount factor |
(442,857 | ) | (437,121 | ) | (596,420 | ) | ||||||
| Standardized measure of discounted future net cash flows |
$ | 249,890 | $ | 188,578 | $ | 228,793 | ||||||
F-41
Table of Contents
Principal changes in the standardized measure of discounted future net cash flows attributable to the Company’s proved reserves are as follows at December 31:
| 2010 | 2009 | 2008 | ||||||||||
| (in thousands) | ||||||||||||
| Standardized measure, beginning of year |
$ | 188,578 | $ | 228,793 | $ | 427,730 | ||||||
| Sales of oil and natural gas, net of production costs |
(62,847 | ) | (45,233 | ) | (110,375 | ) | ||||||
| Net changes in prices and production costs |
164,062 | (135,218 | ) | (255,999 | ) | |||||||
| Change in estimated future development costs |
300,915 | 76,929 | 96,063 | |||||||||
| Extensions and discoveries, net of future development costs |
113,367 | 60,206 | 49,551 | |||||||||
| Previously estimated development cost incurred |
5,761 | 143,316 | 120,028 | |||||||||
| Revisions of quantity estimates |
(260,272 | ) | (82,836 | ) | (106,288 | ) | ||||||
| Accretion of discount |
68,045 | 83,475 | 164,367 | |||||||||
| Changes in timing of production and other |
(267,719 | ) | (192,723 | ) | (269,525 | ) | ||||||
| Net changes in income taxes |
— | 51,869 | 113,241 | |||||||||
| Standardized measure, end of year |
$ | 249,890 | $ | 188,578 | $ | 228,793 | ||||||
NOTE N—QUARTERLY FINANCIAL DATA (UNAUDITED)
Summarized unaudited quarterly financial data for 2010 and 2009 are as follows:
| First Quarter |
Second Quarter |
Third Quarter |
Fourth Quarter |
|||||||||||||
| (in thousands, except per share data) | ||||||||||||||||
| 2010 |
||||||||||||||||
| Oil and gas sales |
$ | 21,300 | $ | 23,213 | $ | 24,833 | $ | 27,177 | ||||||||
| Income (loss) before income taxes(1) |
(504 | ) | 1,167 | 1,570 | (144,763 | ) | ||||||||||
| Net income (loss)(1) |
5,284 | (1,202 | ) | 4,504 | (146,878 | ) | ||||||||||
| Net income applicable (loss) to GMX Common Shareholders(1) |
3,815 | (2,977 | ) | 2,168 | (149,045 | ) | ||||||||||
| Basic earnings (loss) per share(2) |
0.14 | (0.11 | ) | 0.08 | (5.27 | ) | ||||||||||
| Diluted earnings (loss) per share(2) |
0.14 | (0.11 | ) | 0.08 | (5.27 | ) | ||||||||||
| First Quarter (as adjusted)(3) |
Second Quarter (as adjusted)(3) |
Third Quarter (as adjusted)(3) |
Fourth Quarter (as adjusted)(3) |
|||||||||||||
| (in thousands, except per share data) | ||||||||||||||||
| 2009 |
||||||||||||||||
| Oil and gas sales |
$ | 22,826 | $ | 22,837 | $ | 23,075 | $ | 25,556 | ||||||||
| Income (loss) before income taxes(1) |
(134,430 | ) | 2,737 | 1,687 | (51,114 | ) | ||||||||||
| Net income (loss)(1) |
(132,002 | ) | (216 | ) | (1,381 | ) | (47,487 | ) | ||||||||
| Net income (loss) applicable to GMX Common Shareholders(1) |
(133,158 | ) | (1,373 | ) | (2,537 | ) | (48,816 | ) | ||||||||
| Basic earnings (loss) per share(2) |
(8.67 | ) | (0.08 | ) | (0.12 | ) | (1.88 | ) | ||||||||
| Diluted earnings (loss) per share(2) |
(8.67 | ) | (0.08 | ) | (0.12 | ) | (1.88 | ) | ||||||||
| (1) | Includes impairment charges on our oil and natural gas properties due to a ceiling test write-down of $138.1 million, $50.1 million and $132.8 million for the first quarter 2009 fourth quarter 2009 and fourth quarter 2010, respectively. In addition, the fourth quarter 2010 loss includes $10.9 million in impairment related to assets classified as held for sale (see Note D). |
| (2) | The sum of the per share amounts per quarter does not equal the per share amount for the year due to the changes in the average number of common shares outstanding. |
| (3) | Amounts adjusted for adoption of new issued accounting standards related to the adoption of ASU 2009-15. See “Note B—share Lending Agreement and Adoption of ASU 2009-15.” |
F-42
Table of Contents
NOTE O—SUBSEQUENT EVENTS
Undeveloped Leasehold Acquisitions:
In January 2011, the Company entered into five transactions to purchase undeveloped leasehold located in the Williston Basin in North Dakota/Montana, targeting the Bakken/Sanish-Three Forks Formation, as well as in the oil window of the DJ Basin in Wyoming, targeting the emerging Niobrara Formation. A summary of the transactions are as follows:
| • | Niobrara acquisition—an agreement to purchase all of the working interest and an 80% net revenue interest in approximately 30,834 undeveloped acres of oil and gas leases located in the Niobrara basin in Wyoming for approximately $27.8 million, including commissions. The Company closed the transaction relating to these properties on February 14, 2011. Pursuant to our agreements with the seller, the seller has the option to reacquire 50% of the working interest acquired by us in these properties at the same purchase price paid by us within three months following the closing of this transaction. |
| • | Bakken acquisition-Retamco—a purchase and sale agreement, entered into on January 13, 2011, relating to the acquisition by the Company of all of the working interest and an 80% net revenue interest in approximately 17,797 undeveloped net acres of oil and gas leases located in the Bakken formation in Montana and North Dakota. Pursuant to this agreement, as partial consideration for the oil and gas leases, we issued to the seller, Retamco Operating, Inc., at the closing of this transaction on February 28, 2011 2,268,971 shares of common stock and approximately $4.2 million in cash. At the closing, the Company also entered into a registration rights agreement with this seller relating to the resale of the shares of common stock received in this transaction. |
| • | Niobrara acquisition-Retamco—a separate purchase and sale agreement with Retamco Operating, Inc. relating to the acquisition by the Company of all of the working interest and an 80% net revenue interest in approximately 9,809 undeveloped net acres of oil and gas leases located in the Niobrara basin in Wyoming. The purchase price for this transaction is approximately $24.0 million in cash. The transaction remains subject to customary title diligence and purchase price adjustments for title defects. We expect to close the transaction relating to these properties on or prior to April 30, 2011. The closing of the transaction for these properties is not conditioned on the closing of the transaction relating to the seller’s Bakken formation properties. |
| • | Bakken acquisitions-Arkoma Bakken and other parties—a purchase and sale agreement, dated as of January 24, 2011, and a letter of intent, with Arkoma Bakken, LLC and other sellers with respect to undeveloped acreage located in the Bakken formation in North Dakota. These agreements provide for consideration payable in cash and in our common stock. The stock consideration will be based on a volume weighted average closing price of our common stock on the NYSE during the 15 trading days immediately prior to and including the date three trading days prior to the closing date; provided in the event such calculated price is less than $5.50, the price used will be $5.50, and in the event such calculated price is more than $6.50, the price used will be $6.50. The first purchase and sale agreement relates to the acquisition by us an undivided 87.5% of the sellers’ working interest and an 82.5% net revenue interest in approximately 7,613 undeveloped acres located in McKenzie and Dunn Counties, North Dakota (with the acquired interest representing 6,661 net acres). The aggregate purchase price for these properties is approximately $31.3 million of which approximately one-third will be paid in cash. Based on stock consideration of $20,895,423, the stock consideration would be between 3,799,168 shares (based on a value of $5.50 per share) and 3,214,681 shares (based on a value of $6.50 per share) of our common stock. The letter of intent and proposed second purchase and sale agreement relates to the acquisition of 87.5% working interest and an 80% net revenue interest in approximately 1,862 net acres in Williams County, North Dakota (with the acquired interest representing 1,629 net acres). The aggregate purchase price for these properties is currently expected to be approximately $7.3 million. Based on stock consideration of $3,828,388, the stock consideration would be between 696,071 shares of our common stock (based on a value of $5.50 per share) and 588,983 shares (based |
F-43
Table of Contents
| on a value of $6.50 per share). In addition to the execution of a definitive agreement for the second transaction for 1,629 net acres, the transactions remain subject to customary title diligence and purchase price adjustments for title defects, as well as other diligence. The Company expects to close the transaction relating to these properties under the first purchase and sale agreement on or before April 30, 2011. At each closing, the Company will enter into a participation agreement with a joint operating agreement designating the Company as the operator of these properties. The Company has also agreed, or will agree, to enter into a registration rights agreement with these sellers at closing relating to the resale of the shares of common stock received in this transaction. However, these sellers will agree not to sell the shares of common stock received by them for six months following the closing of these transactions. |
Sale of Common Stock:
In February 2011, GMX completed an offering of 21,075,000 shares of its common stock at a price of $4.75 per share, The net proceeds to the Company were $93.6 million after underwriters’ fees. The Underwriters exercised an option to purchase an additional 1,098,518 shares from GMX that increased the net proceeds by $4.9 million after Underwriters’ fees. The Company expects to use the net proceeds, together with proceeds from a concurrent private placement of senior notes, to fund an offer to purchase up to $50.0 million of its 5.00% convertible senior notes due 2013, (ii) to repay the current outstanding balance under its secured revolving credit facility, (iii) to fund the cash portion of the purchase price of the above acquisitions of undeveloped oil and gas leases for approximately $69.5 million (assumes seller in the Niobrara acquisition above does not exercise the option to reacquire a 50% working interest in the acreage), (iv) to fund its exploration and development program and (v) for other general corporate purposes.
Issuance and Sale of Notes:
On February 9, 2011, the Company successfully completed the issuance and sale of $200,000,000 aggregate principal amount of 11.375% Senior Notes due 2019 (the “Senior Notes”). The Senior Notes are jointly and severally, and unconditionally, guaranteed (the “Guarantees”) on a senior unsecured basis initially by two of our wholly-owned subsidiaries, and all of our future subsidiaries other than immaterial subsidiaries (such guarantors, the “Guarantors”). The Senior Notes and the Guarantees were issued pursuant to an indenture dated as of February 9, 2011 (the “Indenture”), by and among the Company, the Guarantors party thereto and The Bank of New York Mellon Trust Company, N.A., a national banking association, as trustee (the “Trustee”).
Interest on the Senior Notes will accrue from and including February 9, 2011 at a rate of 11.375% per year. Interest on the Senior Notes is payable semi-annually in arrears on February 15 and August 15 of each year, commencing on August 15, 2011. The Senior Notes mature on February 15, 2019.
The Indenture contains covenants that, among other things, limit the Company’s ability and the ability of certain of its subsidiaries to:
| • | incur additional indebtedness; |
| • | issue preferred stock; |
| • | pay dividends or repurchase or redeem capital stock; |
| • | make certain investments; |
| • | incur liens; |
| • | enter into certain types of transactions with its affiliates; |
| • | limit dividends or other payments by the Company’s restricted subsidiaries to the Company; and |
| • | sell assets, or consolidate or merge with or into other companies. |
F-44
Table of Contents
These limitations are subject to a number of important exceptions and qualifications.
Upon an Event of Default (as defined in the Indenture), the Trustee or the holders of at least 25% in aggregate principal amount of the Senior Notes then outstanding may declare the entire principal of all the Notes to be due and payable immediately.
At any time on or prior to February 15, 2014, the Company may, at our option, redeem up to 35% of the Senior Notes, including additional notes, with the proceeds of certain public offerings of our common stock at a price of 111.375% of their principal amount plus accrued interest, provided that: (i) at least 65% of the aggregate principal amount of the notes originally issued remains outstanding after the redemption; and (ii) the redemption occurs within 90 days after the closing of the related public offering.
At any time on or prior to February 15, 2015, the Company may, at its option, redeem the Senior Notes at a redemption price equal to 100% of the aggregate principal amount thereof, plus accrued and unpaid interest, if any, to the redemption date plus a “make-whole” premium.
On or after February 15, 2015, the Company may, at its option, redeem some or all of the Senior Notes at any time at the redemption prices set forth below, plus accrued and unpaid interest, if any, to the redemption date:
| Year |
Percentage | |||
| 2015 |
108.531 | % | ||
| 2016 |
105.688 | % | ||
| 2017 |
102.844 | % | ||
| 2018 and thereafter |
100.000 | % | ||
If the Company experiences certain kinds of changes of control, holders of the Senior Notes will be entitled to require us to purchase all or a portion of the Senior Notes at 101% of their principal amount, plus accrued and unpaid interest to the date of repurchase.
The purchase price for the Senior Notes and Guarantees was 96.833% of their principal amount. The net proceeds from the issuance of the Notes were approximately $187.2 million after discounts and underwriters’ fees. The Company intends to use the net proceeds of this offering (i) to fund an offer to purchase up to $50.0 million of our 5.00% convertible senior notes due 2013, (ii) to repay the current outstanding balance under its secured revolving credit facility, (iii) to fund the cash portion of the purchase price of pending acquisitions of undeveloped oil and gas leases for approximately $69.5 million, (iv) to fund the Company’s exploration and development program and (v) for other general corporate purposes.
Amended Loan Agreement:
On February 2, 2011, the Company entered into a Fifth Amended and Restated Loan Agreement among the Company, as borrower, Capital One, National Association, as administrative agent, arranger and bookrunner, BNP Paribas, as syndication agent, and the lenders named therein (the “Restated Loan Agreement”). The Restated Loan Agreement became effective after specified conditions had been satisfied, as amended on February 3, 2011, including (i) the completion of an equity offering of at least $75.0 million of common stock and an offering of senior unsecured notes in a principal amount of at least $175.0 million, on terms specified, in each case on or before February 28, 2011, (ii) the deposit of at least $50.0 million of the proceeds from the common stock and senior unsecured notes offerings in a restricted account with the agent on or before the closing date, for use solely for the purpose of retiring a portion of the Company’s convertible senior notes due 2013, such that the principal of such notes will be no more than $75.0 million within 45 days after the effective date of the Restated Loan Agreement (with such restricted account and remaining funds continuing as collateral under the Restated Loan Agreement if such debt is not retired to such outstanding balance at such time), and (iii) no
F-45
Table of Contents
advances, unpaid fees or other borrowings are outstanding under the prior loan agreement, excluding letters of credit that will be transferred to be outstanding under the Restated Loan Agreement. The Restated Loan Agreement will terminate automatically if these conditions are not satisfied by February 28, 2011.
The Restated Loan Agreement will mature on January 1, 2013; provided, that if our 5.0% convertible senior notes due 2013 have been repurchased and no longer remain outstanding, the maturity date will be extended automatically to December 31, 2013 assuming we are in compliance with all covenants under the amended secured revolving credit facility.
The Restated Loan Agreement provides for a line of credit of up to $100.0 million (the “commitment”), subject to a borrowing base (“borrowing base”). The initial borrowing base availability under the Restated Loan Agreement is $60.0 million. The amount of loans available at any one time under the Restated Loan Agreement is the lesser of the borrowing base or the amount of the commitment. The borrowing base will be subject to semi-annual redeterminations (approximately April 1 and October 1) during the term of the loan, commencing October 1, 2011, and is based on evaluations of our oil and gas reserves. The Restated Loan Agreement includes a letter of credit sublimit of up to $10.0 million.
The loans under our Restated Loan Agreement bear interest at a rate elected by the Company which is based on the prime rate, LIBOR or federal funds rate plus margins ranging from 1% to 3.50% depending on the base rate used and the amount of loans outstanding in relation to the borrowing base. We may voluntarily prepay the loans without premium or penalty. If and to the extent the loans outstanding exceed the most recently determined borrowing base, the loan excess will be mandatorily prepayable within 90 days after notice. Otherwise, any unpaid principal or interest will be due and payable at maturity. The Company is obligated to pay a facility fee equal to 0.5% per annum of the unused portion of the borrowing base, payable quarterly in arrears beginning March 31, 2011.
Loans under Restated Loan Agreement are secured by a first priority mortgage on substantially all of our oil and natural gas properties, a pledge on the Company’s ownership of equity interests in its subsidiaries, a guaranty from Endeavor Pipeline, Inc. and any future subsidiaries of the Company and a security interest in certain of our and the guarantors’ assets.
F-46
Table of Contents
EXHIBIT INDEX
| Incorporated by Reference | ||||||||||||||||
| Exhibit |
Exhibit Description |
Form | SEC File No. |
Exhibit | Filing Date | Filed Herewith |
||||||||||
| 3.1(a) |
Amended and Restated Certificate of Incorporation of GMX Resources Inc. | SB-2 | 353-49328 | 3.1 | 11/06/2000 | |||||||||||
| 3.1(b) |
Amended Certificate of Incorporation of GMX Resources Inc. | 8-K | 001-32977 | 3.1 | 05/25/2010 | |||||||||||
| 3.2 |
Amended and Restated Bylaws of GMX Resources Inc | 8-K | 001-32977 | 3.2 | 11/04/2008 | |||||||||||
| 3.3 |
Certificate of Designation of Series A Junior Participating Preferred Stock of GMX Resources Inc. | 8-K | 000-32325 | 3.1 | 05/18/2005 | |||||||||||
| 3.4(a) |
Certificate of Designation of 9.25% Series B Cumulative Preferred Stock | 8-A12B | 001-32977 | 4.1 | 08/08/2006 | |||||||||||
| 3.4(b) |
Certificate of Amendment to the Certificate of Designation of the 9.25% Series B Cumulative Preferred Stock | 8-K | 001-32977 | 3.1 | 12/14/2010 | |||||||||||
| 4.1(a) |
Rights Agreement dated May 17, 2005 by and between GMX Resources Inc. and UMB Bank, N.A., as Rights Agent | 8-K | 000-32325 | 4.1 | 05/18/2005 | |||||||||||
| 4.1(b) |
Amendment No. 1 to Rights Agreement dated February 1, 2008 | 8-A/A | 001-32977 | 2.1 | 02/21/2008 | |||||||||||
| 4.1(c) |
Amendment No. 2 to Rights Agreement dated October 30, 2008 | 8-A/A | 001-32977 | 1 | 11/17/2008 | |||||||||||
| 4.2 |
Indenture dated February 15, 2008, between GMX Resources Inc. and The Bank of New York Trust Company, N.A., as trustee | 8-K | 001-32977 | 4.1 | 02/15/2008 | |||||||||||
| 4.3 |
Registration Rights Agreement dated February 11, 2008, between GMX Resources Inc. and Jefferies Funding LLC | 8-K | 001-32977 | 10.4 | 02/15/2008 | |||||||||||
| 4.4 (a) |
Indenture dated October 28, 2009, between GMX Resources Inc. and The Bank of New York Mellon Trust Company, N.A., as trustee | 8-K | 001-32977 | 4.1 | 10/28/2009 | |||||||||||
| 4.4(b) |
Supplemental Indenture dated October 28, 2009, between GMX Resources Inc. and The Bank of New York Mellon Trust Company, N.A., as trustee | 8-K | 001-32977 | 4.2 | 10/28/2009 | |||||||||||
| 4.5 |
Indenture dated February 9, 2011, between GMX Resources Inc. and The Bank of New York Mellon Trust Company, N.A., as trustee | 8-K | 001-32977 | 4.1 | 02/09/2011 | |||||||||||
| 4.6 |
Registration Rights Agreement dated February 9, 2011, between GMX Resources Inc. and Credit Suisse Securities (USA) LLC and Morgan Stanley & Co. Incorporated | 8-K | 001-32977 | 4.3 | 02/09/2011 | |||||||||||
| 4.7 |
Registration Rights Agreement dated February 28, 2011, between GMX Resources Inc. and Retamco Operating, Inc. | 8-K | 001-32977 | 10.1 | 03/02/2011 | |||||||||||
| 10.1+ |
Amended and Restated Stock Option Plan | 10-Q | 001-32977 | 10.1 | 11/09/2007 | |||||||||||
| 10.2 |
Form of Director Indemnification Agreement | SB-2 | 333-49328 | 10.5 | 11/06/2000 | |||||||||||
Table of Contents
| Incorporated by Reference | ||||||||||||||||
| Exhibit |
Exhibit Description |
Form | SEC File No. |
Exhibit | Filing Date | Filed Herewith |
||||||||||
| 10.3+ |
Amended and Restated 2008 Long-Term Incentive Plan (Effective as of May 28, 2008) | 8-K | 001-32977 | 10.1 | 05/25/2010 | |||||||||||
| 10.4+ |
Form of Restricted Stock Grant Agreement | |||||||||||||||
| 10.5(a) |
Participation Agreement dated December 29, 2003 by and among Penn Virginia Oil & Gas Company, the Company and its wholly owned subsidiaries | 8-K | 000-32325 | 10.1 | 12/31/2003 | |||||||||||
| 10.5(b) |
First Amendment dated February 27, 2004 to Participation Agreement between GMX Resources Inc. and Penn Virginia Oil & Gas Corporation | 8-K | 000-32325 | 10.1 | 09/14/2004 | |||||||||||
| 10.5(c) |
Second Amendment dated May 9, 2004 to Participation Agreement between GMX Resources Inc. and Penn Virginia Oil & Gas Corporation | 8-K | 000-32325 | 10.2 | 09/14/2004 | |||||||||||
| 10.5(d) |
Third Amendment dated April 6, 2004 to Participation Agreement between GMX Resources Inc. and Penn Virginia Oil & Gas Corporation | 8-K | 000-32325 | 10.3 | 09/14/2004 | |||||||||||
| 10.5(e) |
Fourth Amendment dated August 11, 2004 to Participation Agreement between GMX Resources Inc. and Penn Virginia Oil & Gas Corporation | 8-K | 000-32325 | 10.4 | 09/14/2004 | |||||||||||
| 10.5(f) |
Fifth Amendment dated effective January 1, 2005 to Participation Agreement between GMX Resources Inc. and Penn Virginia Oil & Gas L.P., successor to Penn Virginia Oil & Gas Corporation | 10-QSB | 000-32325 | 10.6(e) | 05/12/2005 | |||||||||||
| 10.5(g) |
Sixth Amendment dated effective January 1, 2006, to Participation Agreement between GMX Resources Inc. and Penn Virginia Oil & Gas L.P., successor to Penn Virginia Oil & Gas Corporation | 8-K | 000-32325 | 10.1 | 01/20/2006 | |||||||||||
| 10.6(a) |
Third Amended and Restated Loan Agreement dated June 12, 2008 among Capital One, National Association and Union Bank of California N.A. | 8-K | 001-32977 | 10.1 | 06/18/2008 | |||||||||||
| 10.6(b) |
First Amendment to Restated Loan Agreement dated October 29, 2008, between GMX Resources Inc., Capital One, National Association and Union Bank of California, N.A. | 10-Q | 001-32977 | 10.4(b) | 11/10/2008 | |||||||||||
| 10.6(c) |
Second Amendment to Restated Loan Agreement dated November 12, 2008, between GMX Resources Inc., Capital One, National Association, and Union Bank of California, N.A. | 8-K | 001-32977 | 10.1 | 03/02/2009 | |||||||||||
Table of Contents
| Incorporated by Reference | ||||||||||||||||
| Exhibit |
Exhibit Description |
Form | SEC File No. |
Exhibit | Filing Date | Filed Herewith |
||||||||||
| 10.6(d) |
Third Amendment to Restated Loan Agreement dated February 26, 2009 between GMX Resources Inc., Capital One, National Association, and Union Bank of California, N.A. | 8-K | 001-32977 | 10.2 | 03/02/2009 | |||||||||||
| 10.6(e) |
Fourth Amendment to Restated Loan Agreement dated June 3, 2009 among GMX Resources Inc., Capital One, National Association, Union Bank, N.A., BNP Paribas and Compass Bank | 8-K | 001-32977 | 10.1 | 06/08/2009 | |||||||||||
| 10.6(f) |
Fifth Amendment to Restated Loan Agreement and Waiver dated as of October 17, 2009, among GMX Resources Inc., Capital One, National Association, as Administrative Agent, and the banks named therein | 8-K | 001-32977 | 10.1 | 10/20/2009 | |||||||||||
| 10.7(a) |
Fourth Amended and Restated Loan Agreement dated July 8, 2010 among GMX Resources Inc., the Lenders named therein and Capital One, National Association | 8-K | 001-32977 | 10.1 | 07/13/2010 | |||||||||||
| 10.7(b) |
First Amendment to Restated Loan Agreement dated December 13, 2010 among GMX Resources Inc., the Lenders named therein and Capital One, National Association | 8-K | 001-32977 | 10.1 | 12/14/2010 | |||||||||||
| 10.7(c) |
Second Amendment to Restated Loan Agreement dated December 21, 2010 among GMX Resources Inc., the Lenders named therein and Capital One, National Association | 8-K | 001-32977 | 10.1 | 12/27/2010 | |||||||||||
| 10.8(a) |
Fifth Amended and Restated Loan Agreement dated February 2, 2011 among GMX Resources Inc., the Lenders named therein and Capital One, National Association | 8-K | 001-32977 | 10.1 | 02/03/2011 | |||||||||||
| 10.8(b) |
First Amendment to Restated Loan Agreement dated February 3, 2011 among GMX Resources Inc., the Lenders named therein and Capital One, National Association | 8-K | 001-32977 | 10.1 | 02/04/2011 | |||||||||||
| 10.9 |
Gas Gathering and Processing Agreement effective January 31, 2008 between PVR East Texas Gas Processing LLC and GMX Resources Inc. | 8-K | 001-32977 | 10.1 | 02/01/2008 | |||||||||||
| 10.10 |
Purchase Agreement dated February 11, 2008, between GMX Resources Inc. and Jefferies & Company, Inc., as representative of the Initial Purchasers named therein | 8-K | 001-32977 | 10.1 | 02/15/2008 | |||||||||||
| 10.11 |
Share Lending Agreement dated February 11, 2008, between GMX Resources Inc., Jefferies Funding LLC and Jefferies & Company, Inc., as collateral agent | 8-K | 001-32977 | 10.3 | 02/15/2008 | |||||||||||
| 10.12 |
Purchase Agreement dated October 16, 2009, between GMX Resources Inc. and Kinder Morgan Endeavor LLC | 8-K | 001-32977 | 10.1 | 10/19/2009 | |||||||||||
Table of Contents
| Incorporated by Reference | ||||||||||||||||
| Exhibit |
Exhibit Description |
Form | SEC File No. |
Exhibit | Filing Date | Filed Herewith |
||||||||||
| 10.13 |
Amended and Restated Limited Liability Company Agreement of Endeavor Gathering LLC dated effective November 1, 2009, between GMX Resources Inc. and Kinder Morgan Endeavor LLC | 8-K | 001-32977 | 10.1 | 11/5/2009 | |||||||||||
| 10.14 |
Pipeline Operating Agreement dated effective November 1, 2009, between Endeavor Gathering LLC and Endeavor Pipeline Inc. | 8-K | 001-32977 | 10.2 | 11/5/2009 | |||||||||||
| 10.15 |
Gas Gathering Agreement dated effective November 1, 2009, among GMX Resources Inc., Endeavor Pipeline Inc. and Endeavor Gathering LLC | 8-K | 001-32977 | 10.3 | 11/5/2009 | |||||||||||
| 10.16(a) |
Restated Guarantee Agreement, dated effective July 8, 2010 by Blue Diamond Drilling Co. in favor of Capital One, National Association | 8-K | 001-32977 | 10.3 | 02/03/2011 | |||||||||||
| 10.16(b) |
Confirmation of Guarantee Agreement, dated effective February 2, 2011 by Blue Diamond Drilling Co. in favor of Capital One, National Association | 8-K | 001-32977 | 10.2 | 02/03/2011 | |||||||||||
| 10.17(a) |
Restated Guarantee Agreement, dated effective July 8, 2010 by Endeavor Pipeline Inc. in favor of Capital One, National Association | 8-K | 001-32977 | 10.5 | 02/03/2011 | |||||||||||
| 10.17(b) |
Confirmation of Guarantee Agreement, dated effective February 2, 2011 by Endeavor Pipeline Inc. in favor of Capital One, National Association | 8-K | 001-32977 | 10.4 | 02/03/2011 | |||||||||||
| 10.18(a) |
Note Purchase Agreement, dated as of July 31, 2007 between GMX Resources, Inc. and the Purchasers named therein | 10-Q | 001-32977 | 10.6 | 08/09/2007 | |||||||||||
| 10.18(b) |
Amendment No. 1 to Note Purchase Agreement and Limited Consent, dated as of February 11, 2008 between GMX Resources, Inc. and the Noteholder named therein | 8-K | 001-32977 | 10.6 | 02/15/2008 | |||||||||||
| 10.18(c) |
Amendment No. 2 to Note Purchase Agreement, dated as of June 12, 2008 between GMX Resources, Inc. and the Noteholder named therein | 8-K | 001-32977 | 10.3 | 06/18/2008 | |||||||||||
| 10.18(d) |
Amendment No. 3 to Note Purchase Agreement and Limited Waiver, dated as of February 27, 2009 between GMX Resources, Inc. and the Noteholder named therein | 8-K | 001-32977 | 10.3 | 03/02/2009 | |||||||||||
| 10.18(e) |
Amendment No. 4 to Note Purchase Agreement and Limited Waiver, dated as of May 6, 2009 between GMX Resources, Inc. and the Noteholder named therein | 8-K | 001-32977 | 10.1 | 05/07/2009 | |||||||||||
| 10.18(f) |
Amendment No. 5 to Note Purchase Agreement, Limited Consent and Limited Waiver, dated as of October 18, 2009 between GMX Resources, Inc. and the Noteholder named therein | 8-K | 001-32977 | 10.2 | 10/20/2009 | |||||||||||
Table of Contents
| Incorporated by Reference | ||||||||||||||||
| Exhibit |
Exhibit Description |
Form | SEC File No. |
Exhibit | Filing Date |
Filed Herewith |
||||||||||
| 10.19 |
Purchase and Sale Agreement (Montana and North Dakota Subject Leases), dated as of January 13, 2011, between GMX Resources Inc. and Retamco Operating, Inc. | 001-32977 | * | |||||||||||||
| 10.20 |
Purchase and Sale Agreement (Wyoming Subject Leases), dated as of January 13, 2011, between GMX Resources Inc. and Retamco Operating, Inc. | 001-32977 | * | |||||||||||||
| 10.21 |
Lease Acquisition Agreement (McKenzie and Dunn County, North Dakota Subject Leases), dated as of January 24, 2011, by and among GMX Resources Inc., Long Properties Trust, Arkoma Bakken, LLC and Reynolds Drilling, Inc. | 001-32977 | * | |||||||||||||
| 12.1 |
Computation of Ratio of Earnings to Fixed Charges and to Combined Fixed Charges and Preference Dividends | 001-32977 | * | |||||||||||||
| 21 |
List of Subsidiaries | 001-32977 | * | |||||||||||||
| 23.1 |
Consent of Grant Thornton, independent registered public accounting firm | 001-32977 | * | |||||||||||||
| 23.2 |
Consent of Smith, Carney & Co., p.c., independent registered public accounting firm | 001-32977 | * | |||||||||||||
| 23.3 |
Consent of MHA Petroleum Consultants, Inc. | 001-32977 | * | |||||||||||||
| 23.4 |
Consent of DeGolyer and MacNaughton | 001-32977 | * | |||||||||||||
| 31.1 |
Rule 13a-14(a) Certification of Chief Executive Officer | 001-32977 | * | |||||||||||||
| 31.2 |
Rule 13a-14(a) Certification of Chief Financial Officer | 001-32977 | * | |||||||||||||
| 32.1 |
Certification of Chief Executive Officer pursuant to 18 U.S.C. § 1350 | 001-32977 | * | |||||||||||||
| 32.2 |
Certification of Chief Financial Officer pursuant to 18 U.S.C. § 1350 | 001-32977 | * | |||||||||||||
| 99.1 |
Report of MHA Petroleum Consultants, Inc. | 8-K | 001-32977 | 99.3 | 1/28/11 | |||||||||||
| 99.21 |
Report of DeGolyer and MacNaughton | 8-K | 001-32977 | 99.4 | 1/28/11 | |||||||||||
| + | Identifies management contract and compensatory plan arrangements. |