Attached files
| file | filename |
|---|---|
| EX-99.1 - EX-99.1 - FiberTower CORP | a11-7759_1ex99d1.htm |
| 8-K - 8-K - FiberTower CORP | a11-7759_18k.htm |
Exhibit 99.2
|
|
FiberTower Corporation Fourth Quarter 2010 Results March 11, 2011 |
|
|
Safe Harbor Statement Statements included in this presentation which are not historical in nature are “forward-looking” statements, as that term is defined in the Private Securities Litigation Reform Act of 1995 or by the Securities and Exchange Commission, or SEC, in its rules, regulations and releases. Forward-looking statements relate to expectations, beliefs, projections, future plans and strategies, anticipated events or trends and similar expressions concerning matters that are not historical facts. These include statements regarding, among other things, our future financial performance and results of operations, including guidance for expected positive 2011 Adjusted EBITDA, our expected range of 2011 capital expenditures and expected 2011 SG&A reductions, our financial and business prospects, the deployment of services, capital requirements, financing prospects, planned capital expenditures, expected cost per site, anticipated customer growth, expansion plans, and anticipated cash balances. There are many risks, uncertainties and other factors that can prevent the achievement of goals or cause results to differ materially from those expressed or implied by these forward-looking statements including, among other things, negative cash flows and operating losses, additional liquidity requirements, potential loss of significant customers, downturns in the wireless communications industry, regulatory costs and restrictions, potential loss of FCC licenses, equipment supply disruptions and cost increases, competition from alternative backhaul service providers and technologies, along with those risk factors described in the Company’s Annual Reports on Form 10-K and Quarterly Reports on Form 10-Q, as filed with the SEC. |
|
|
Kurt Van Wagenen – Quarterly and 2010 Discussion |
|
|
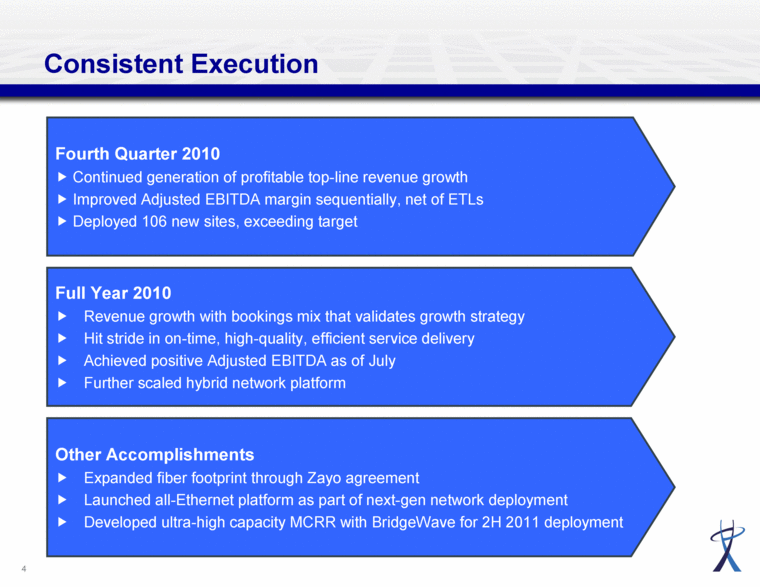
Consistent Execution Fourth Quarter 2010 Continued generation of profitable top-line revenue growth Improved Adjusted EBITDA margin sequentially, net of ETLs Deployed 106 new sites, exceeding target Full Year 2010 Revenue growth with bookings mix that validates growth strategy Hit stride in on-time, high-quality, efficient service delivery Achieved positive Adjusted EBITDA as of July Further scaled hybrid network platform Other Accomplishments Expanded fiber footprint through Zayo agreement Launched all-Ethernet platform as part of next-gen network deployment Developed ultra-high capacity MCRR with BridgeWave for 2H 2011 deployment |
|
|
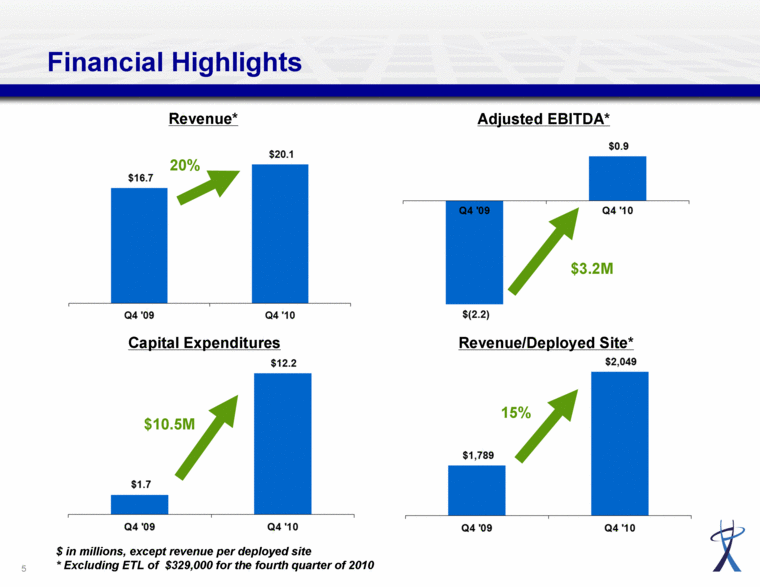
Financial Highlights Capital Expenditures Revenue/Deployed Site* $ in millions, except revenue per deployed site * Excluding ETL of $329,000 for the fourth quarter of 2010 20% 15% $3.2M $10.5M Revenue* Adjusted EBITDA* Q3 '09 Q3 '10 |
|
|
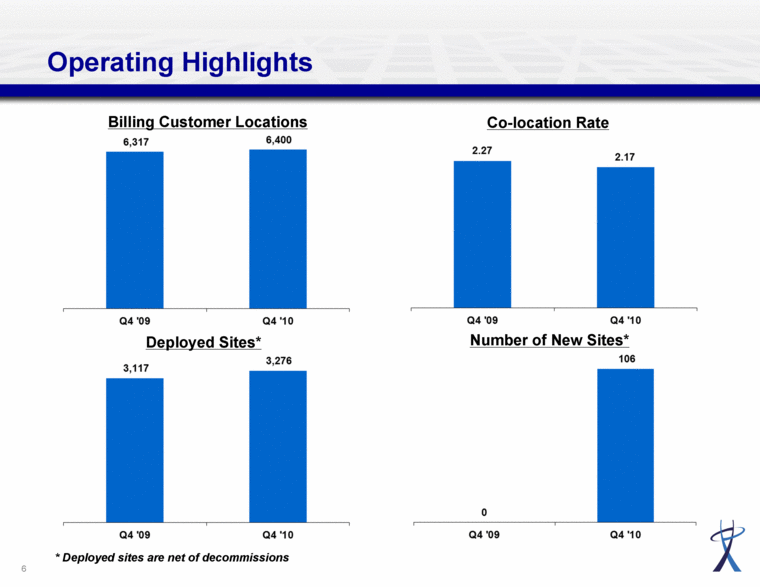
Operating Highlights Billing Customer Locations Co-location Rate Number of New Sites* * Deployed sites are net of decommissions Deployed Sites* |
|
|
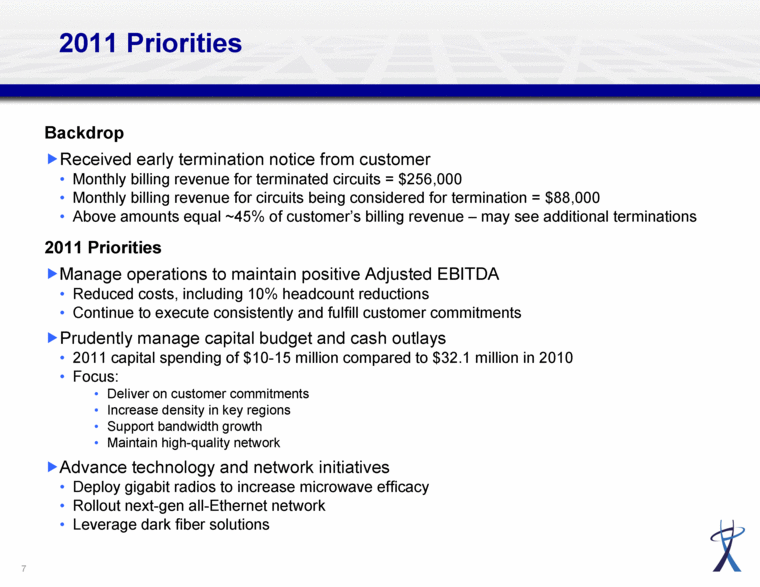
Backdrop Received early termination notice from customer Monthly billing revenue for terminated circuits = $256,000 Monthly billing revenue for circuits being considered for termination = $88,000 Above amounts equal ~45% of customer’s billing revenue – may see additional terminations 2011 Priorities Manage operations to maintain positive Adjusted EBITDA Reduced costs, including 10% headcount reductions Continue to execute consistently and fulfill customer commitments Prudently manage capital budget and cash outlays 2011 capital spending of $10-15 million compared to $32.1 million in 2010 Focus: Deliver on customer commitments Increase density in key regions Support bandwidth growth Maintain high-quality network Advance technology and network initiatives Deploy gigabit radios to increase microwave efficacy Rollout next-gen all-Ethernet network Leverage dark fiber solutions 2011 Priorities |
|
|
Thomas Scott - Financial Review |
|
|
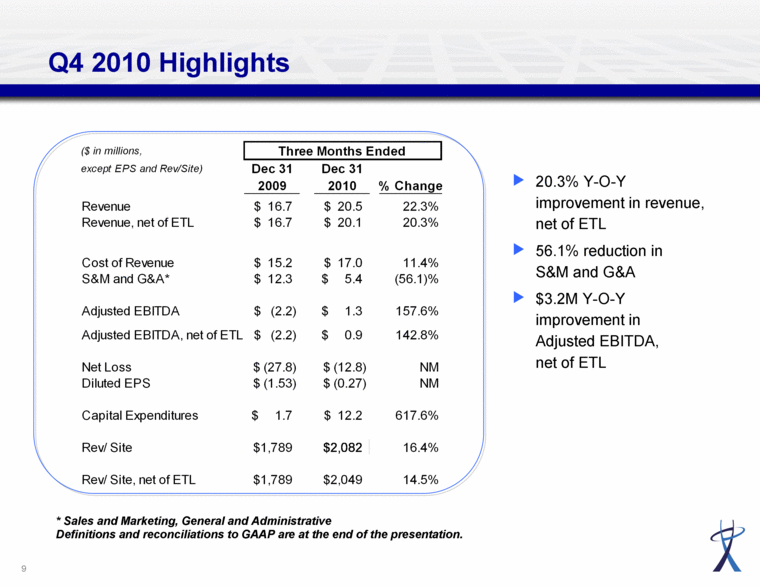
Q4 2010 Highlights 20.3% Y-O-Y improvement in revenue, net of ETL 56.1% reduction in S&M and G&A $3.2M Y-O-Y improvement in Adjusted EBITDA, net of ETL * Sales and Marketing, General and Administrative Definitions and reconciliations to GAAP are at the end of the presentation. ($ in millions, except EPS and Rev/Site) Dec 31 Dec 31 2009 2010 % Change Revenue 16.7 $ 20.5 $ 22.3% Revenue, net of ETL 16.7 $ 20.1 $ 20.3% Cost of Revenue 15.2 $ 17.0 $ 11.4% S&M and G&A* 12.3 $ 5.4 $ (56.1)% Adjusted EBITDA (2.2) $ 1.3 $ 157.6% Adjusted EBITDA, net of ETL (2.2) $ 0.9 $ 142.8% Net Loss (27.8) $ (12.8) $ NM Diluted EPS (1.53) $ (0.27) $ NM Capital Expenditures 1.7 $ 12.2 $ 617.6% Rev/ Site 1,789 $ 2,082 $ 16.4% Rev/ Site, net of ETL 1,789 $ 2,049 $ 14.5% Three Months Ended |
|
|
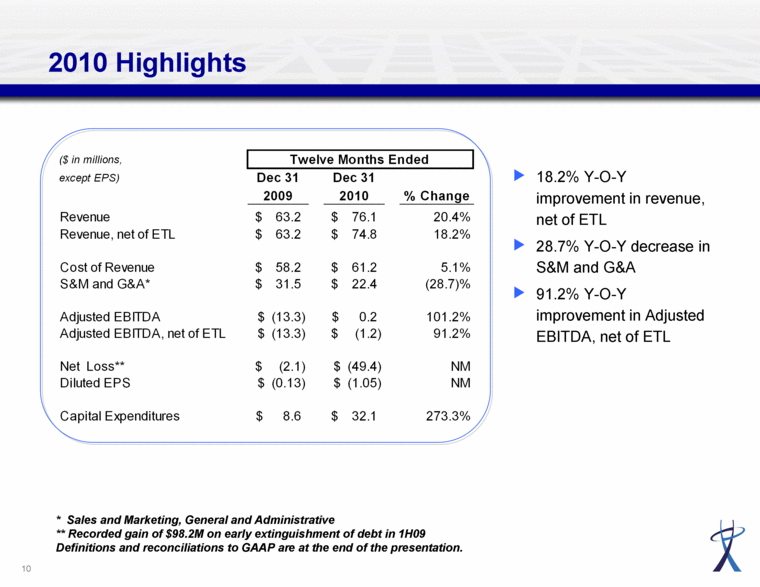
* Sales and Marketing, General and Administrative ** Recorded gain of $98.2M on early extinguishment of debt in 1H09 Definitions and reconciliations to GAAP are at the end of the presentation. 2010 Highlights 18.2% Y-O-Y improvement in revenue, net of ETL 28.7% Y-O-Y decrease in S&M and G&A 91.2% Y-O-Y improvement in Adjusted EBITDA, net of ETL ($ in millions, except EPS) Dec 31 Dec 31 2009 2010 % Change Revenue 63.2 $ 76.1 $ 20.4% Revenue, net of ETL 63.2 $ 74.8 $ 18.2% Cost of Revenue 58.2 $ 61.2 $ 5.1% S&M and G&A* 31.5 $ 22.4 $ (28.7)% Adjusted EBITDA (13.3) $ 0.2 $ 101.2% Adjusted EBITDA, net of ETL (13.3) $ (1.2) $ 91.2% Net Loss** (2.1) $ (49.4) $ NM Diluted EPS (0.13) $ (1.05) $ NM Capital Expenditures 8.6 $ 32.1 $ 273.3% Twelve Months Ended |
|
|
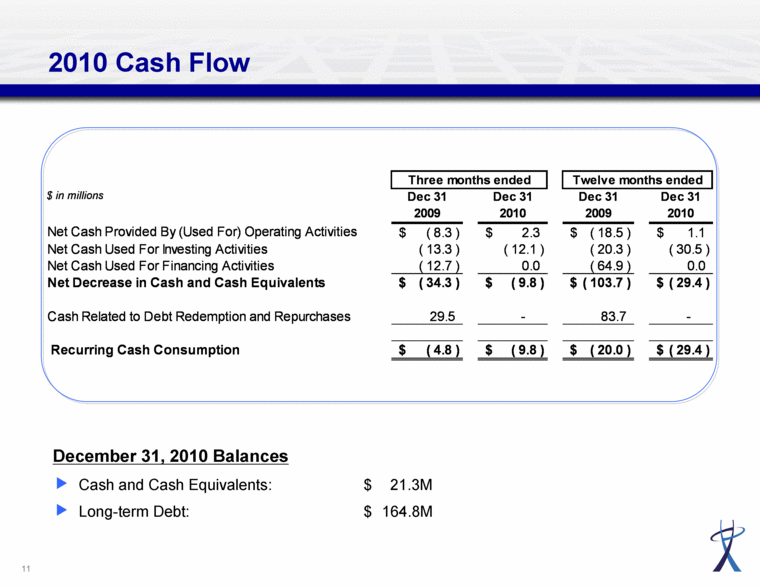
2010 Cash Flow December 31, 2010 Balances Cash and Cash Equivalents: $ 21.3M Long-term Debt: $ 164.8M $ in millions Dec 31 2009 Dec 31 2010 Dec 31 2009 Dec 31 2010 Net Cash Provided By (Used For) Operating Activities ( 8.3 ) $ 2.3 $ ( 18.5 ) $ 1.1 $ Net Cash Used For Investing Activities ( 13.3 ) ( 12.1 ) ( 20.3 ) ( 30.5 ) Net Cash Used For Financing Activities ( 12.7 ) 0.0 ( 64.9 ) 0.0 Net Decrease in Cash and Cash Equivalents ( 34.3 ) $ ( 9.8 ) $ ( 103.7 ) $ ( 29.4 ) $ Cash Related to Debt Redemption and Repurchases 29.5 - 83.7 - Recurring Cash Consumption ( 4.8 ) $ ( 9.8 ) $ ( 20.0 ) $ ( 29.4 ) $ Three months ended Twelve months ended |
|
|
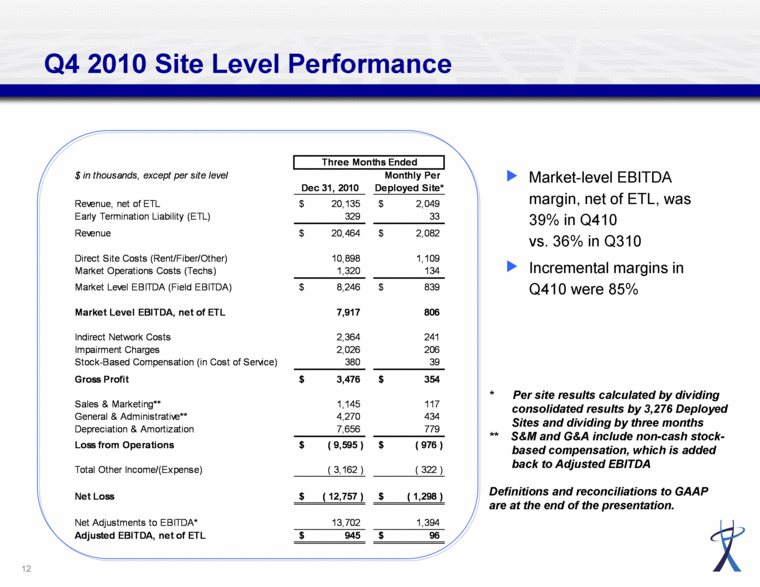
Q4 2010 Site Level Performance Market-level EBITDA margin, net of ETL, was 39% in Q410 vs. 36% in Q310 Incremental margins in Q410 were 85% * Per site results calculated by dividing consolidated results by 3,276 Deployed Sites and dividing by three months ** S&M and G&A include non-cash stock-based compensation, which is added back to Adjusted EBITDA Definitions and reconciliations to GAAP are at the end of the presentation. $ in thousands, except per site level Monthly Per Dec 31, 2010 Deployed Site* Revenue, net of ETL 20,135 $ 2,049 $ Early Termination Liability (ETL) 329 33 Revenue 20,464 $ 2,082 $ Direct Site Costs (Rent/Fiber/Other) 10,898 1,109 Market Operations Costs (Techs) 1,320 134 Market Level EBITDA (Field EBITDA) 8,246 $ 839 $ Market Level EBITDA, net of ETL 7,917 806 Indirect Network Costs 2,364 241 Impairment Charges 2,026 206 Stock-Based Compensation (in Cost of Service) 380 39 Gross Profit 3,476 $ 354 $ Sales & Marketing** 1,145 117 General & Administrative** 4,270 434 Depreciation & Amortization 7,656 779 Loss from Operations ( 9,595 ) $ ( 976 ) $ Total Other Income/(Expense) ( 3,162 ) ( 322 ) Net Loss ( 12,757 ) $ ( 1,298 ) $ Net Adjustments to EBITDA* 13,702 1,394 Adjusted EBITDA, net of ETL 945 $ 96 $ Three Months Ended |
|
|
Q&A |
|
|
Appendix |
|
|
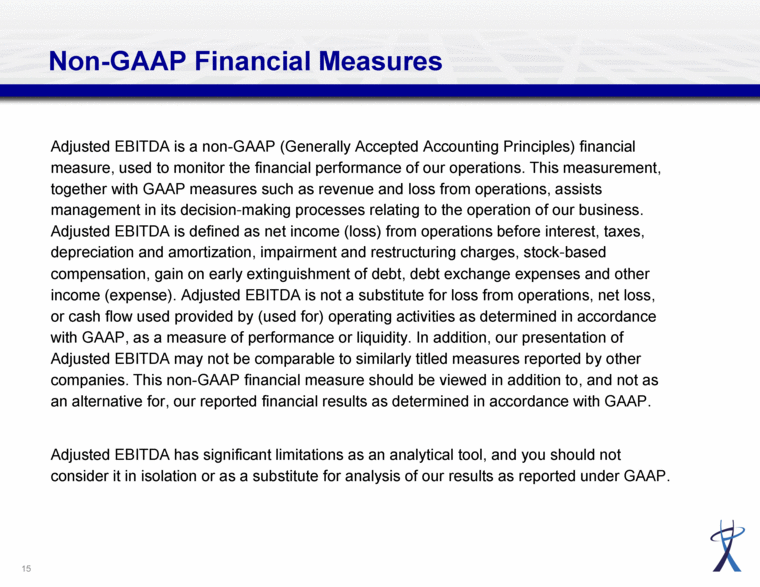
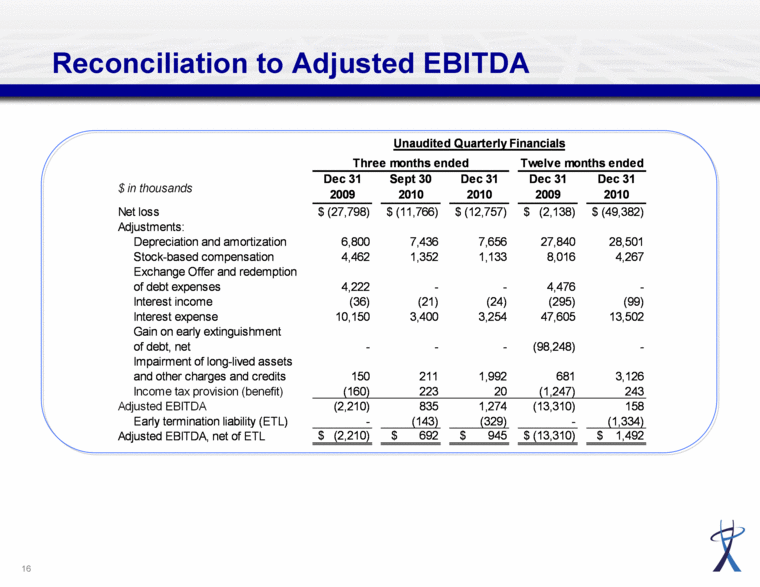
Non-GAAP Financial Measures Adjusted EBITDA is a non-GAAP (Generally Accepted Accounting Principles) financial measure, used to monitor the financial performance of our operations. This measurement, together with GAAP measures such as revenue and loss from operations, assists management in its decision-making processes relating to the operation of our business. Adjusted EBITDA is defined as net income (loss) from operations before interest, taxes, depreciation and amortization, impairment and restructuring charges, stock-based compensation, gain on early extinguishment of debt, debt exchange expenses and other income (expense). Adjusted EBITDA is not a substitute for loss from operations, net loss, or cash flow used provided by (used for) operating activities as determined in accordance with GAAP, as a measure of performance or liquidity. In addition, our presentation of Adjusted EBITDA may not be comparable to similarly titled measures reported by other companies. This non-GAAP financial measure should be viewed in addition to, and not as an alternative for, our reported financial results as determined in accordance with GAAP. Adjusted EBITDA has significant limitations as an analytical tool, and you should not consider it in isolation or as a substitute for analysis of our results as reported under GAAP. |
|
|
Reconciliation to Adjusted EBITDA $ in thousands Dec 31 2009 Sept 30 2010 Dec 31 2010 Dec 31 2009 Dec 31 2010 Net loss $ (27,798) $ (11,766) $ (12,757) $ (2,138) $ (49,382) Adjustments: Depreciation and amortization 6,800 7,436 7,656 27,840 28,501 Stock-based compensation 4,462 1,352 1,133 8,016 4,267 Exchange Offer and redemption of debt expenses 4,222 - - 4,476 - Interest income (36) (21) (24) (295) (99) Interest expense 10,150 3,400 3,254 47,605 13,502 Gain on early extinguishment of debt, net - - - (98,248) - Impairment of long-lived assets and other charges and credits 150 211 1,992 681 3,126 Income tax provision (benefit) (160) 223 20 (1,247) 243 Adjusted EBITDA (2,210) 835 1,274 (13,310) 158 Early termination liability (ETL) - (143) (329) - (1,334) Adjusted EBITDA, net of ETL $ (2,210) $ 692 $ 945 $ (13,310) $ 1,492 Three months ended Twelve months ended Unaudited Quarterly Financials |
|
|
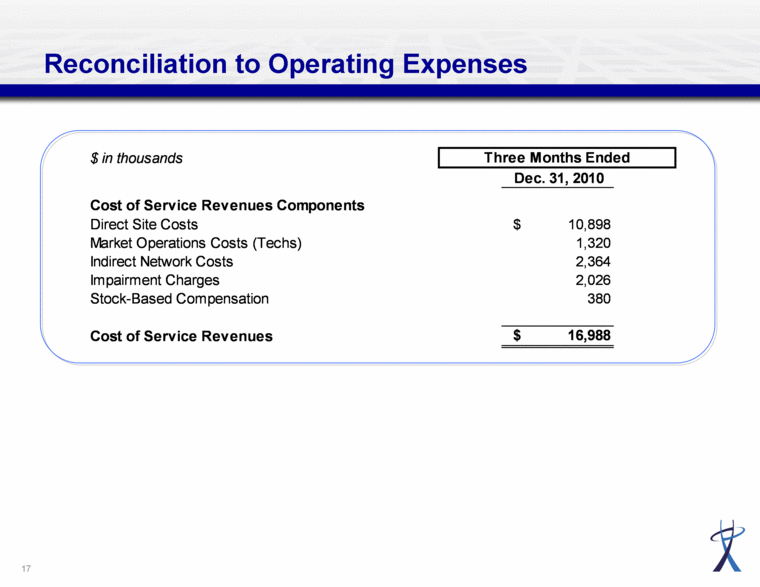
Reconciliation to Operating Expenses $ in thousands Dec. 31, 2010 Cost of Service Revenues Components Direct Site Costs $ 10,898 Market Operations Costs (Techs) 1,320 Indirect Network Costs 2,364 Impairment Charges 2,026 Stock-Based Compensation 380 Cost of Service Revenues $ 16,988 Three Months Ended |

