Attached files
| file | filename |
|---|---|
| EX-23.1 - EXHIBIT 23.1 CONSENT - PLUS THERAPEUTICS, INC. | exhibit231_consent.htm |
| EX-32.1 - EXHIBIT 32.1 SECTION 906 CERTIFICATION - PLUS THERAPEUTICS, INC. | exhibit321_section906cert.htm |
| EX-31.1 - EXHIBIT 31.1 CEO CERTIFICATION - PLUS THERAPEUTICS, INC. | exhibit311_ceocertification.htm |
| EX-31.2 - EXHIBIT 31.2 CFO CERTIFICATION - PLUS THERAPEUTICS, INC. | exhibit312_cfocertification.htm |
UNITED STATES SECURITIES AND EXCHANGE COMMISSION
Washington, D.C. 20549
FORM 10-K
|
(Mark One)
|
||
|
ý
|
ANNUAL REPORT PURSUANT TO SECTION 13 OR 15(d) OF THE SECURITIES EXCHANGE ACT OF 1934
|
|
|
For the fiscal year ended December 31, 2010
|
||
|
OR
|
||
|
o
|
TRANSITION REPORT PURSUANT TO SECTION 13 OR 15(d) OF THE SECURITIES EXCHANGE ACT OF 1934
|
|
|
For the transition period from to
|
||
|
Commission file number 001-34375
|
||
CYTORI THERAPEUTICS, INC.
(Exact name of Registrant as Specified in Its Charter)
|
DELAWARE
|
33-0827593
|
|
|
(State or Other Jurisdiction
of Incorporation or Organization)
|
(I.R.S. Employer
Identification No.)
|
|
|
3020 CALLAN ROAD, SAN DIEGO, CALIFORNIA
|
92121
|
|
|
(Address of principal executive offices)
|
(Zip Code)
|
Registrant’s telephone number, including area code: (858) 458-0900
Securities registered pursuant to Section 12(b) of the Act:
Common stock, par value $0.001
Warrants, exercisable for common stock, par value $0.001
Securities registered pursuant to Section 12(g) of the Act:
None
Indicate by check mark if the registrant is a well-known seasoned issuer as defined in Rule 405 of the Securities Act. Yes o No ý
Indicate by check mark if the registrant is not required to file reports pursuant to Section 13 or Section 15(d) of the Exchange Act.
Yes o No ý
Indicate by check mark whether the registrant: (1) has filed all reports required to be filed by Section 13 or 15(d) of the Securities Exchange Act of 1934 during the preceding 12 months (or for such shorter period that the registrant was required to file such reports), and (2) has been subject to such filing requirements for the past 90 days.
Yes ý No o
Indicate by check mark whether the registrant has submitted electronically and posted on its corporate Web site, if any, every Interactive Data File required to be submitted and posted pursuant to Rule 405 of Regulation S-T (§232.405 of this chapter) during the preceding 12 months (or for such shorter period that the registrant was required to submit and post such files).
Yes o No o
Indicate by check mark if disclosure of delinquent filers pursuant to Item 405 of Regulation S-K (§229.405 of this chapter) is not contained herein, and will not be contained, to the best of the registrant’s knowledge, in definitive proxy or information statements incorporated by reference in Part III of this Form 10-K or any amendment to this Form 10-K. ý
Indicate by check mark whether the registrant is a large accelerated filer, an accelerated filer, a non-accelerated filer, or a smaller reporting company. See definitions of “large accelerated filer,” “accelerated filer” and “smaller reporting company” in Rule 12b-2 of the Exchange Act (Check one).
|
Large Accelerated Filer o
|
Accelerated Filer ý
|
Non-Accelerated Filer o
|
Smaller reporting company o
|
|
(Do not check if a smaller reporting company)
|
Indicate by check mark whether the registrant is a shell company (as defined in Rule 12b-2 of the Exchange Act). Yes o No ý
The aggregate market value of the common stock of the registrant held by non-affiliates of the registrant on June 30, 2010, the last business day of the registrant’s most recently completed second fiscal quarter, was $142,140,826 based on the closing sales price of the registrant’s common stock on June 30, 2010 as reported on the Nasdaq Global Market, of $3.48 per share.
As of February 28, 2011, there were 51,963,679 shares of the registrant’s common stock outstanding.
DOCUMENTS INCORPORATED BY REFERENCE
Portions of the registrant’s definitive proxy statement for the 2010 Annual Meeting of Stockholders, which will be filed with the Securities and Exchange Commission within 120 days after the end of the year ended December 31, 2010, are incorporated by reference in Part III, Items 10, 11, 12, 13 and 14 of this Form 10-K.
TABLE OF CONTENTS
|
PART I
|
|
|
Item 1.
|
Business
|
|
Item 1A.
|
Risk Factors
|
|
Item 1B.
|
Unresolved Staff Comments
|
|
Item 2.
|
Properties
|
|
Item 3.
|
Legal Proceedings
|
|
Item 4.
|
(Reserved)
|
|
PART II
|
|
|
Item 5.
|
Market for Registrant’s Common Equity, Related Stockholder Matters and Issuer Purchases of Equity Securities
|
|
Item 6.
|
Selected Financial Data
|
|
Item 7.
|
Management’s Discussion and Analysis of Financial Condition and Results of Operations
|
|
Item 7A.
|
Quantitative and Qualitative Disclosures About Market Risk
|
|
Item 8.
|
Financial Statements and Supplementary Data
|
|
Item 9.
|
Changes in and Disagreements with Accountants on Accounting and Financial Disclosure
|
|
Item 9A.
|
Controls and Procedures
|
|
Item 9B.
|
Other Information
|
|
PART III
|
|
|
Item 10.
|
Directors, Executive Officers and Corporate Governance
|
|
Item 11.
|
Executive Compensation
|
|
Item 12.
|
Security Ownership of Certain Beneficial Owners and Management and Related Stockholder Matters
|
|
Item 13.
|
Certain Relationships and Related Transactions, and Director Independence
|
|
Item 14.
|
Principal Accountant Fees and Services
|
|
PART IV
|
|
|
Item 15.
|
Exhibits, Financial Statement Schedules
|
PART I
Item 1. Business
General
Cytori Therapeutics, Inc., or Cytori, develops, manufactures, and sells a portfolio of medical products and devices to enable the practice of regenerative medicine. Regenerative medicine describes the emerging field that aims to repair or restore lost or damaged tissue and cell function. By providing real-time access to naturally occurring stem and regenerative cells in fat tissue and optimized fat grafting technologies, we aim to address ischemic conditions and diseases, including soft tissue repair, acute heart attacks and chronic myocardial ischemia, along with a broad pipeline spanning cardiovascular disease, wound healing, gastrointestinal disorders, stress urinary incontinence, liver and renal disease, spinal disc degeneration and pelvic health conditions. To achieve our goal of making regenerative medicine available worldwide, we have partnered with Olympus Corporation, GE Healthcare, and Green Hospital Supply, Inc..
Our core technology is the patented Celution® family of products which processes patients’ adipose tissue to obtain adipose-derived stem and regenerative cells (ADRCs) at the point of care. The Celution® family of products consists of a central device, a related single-use consumable used for each patient procedure, proprietary enzyme reagents, and related instrumentation. Our commercialization model is based on the sale of Celution® Systems and on generating recurring revenues from the single-use consumable sets.
Our PureGraft™ System, or PureGraft™, formally launched in the U.S. in April 2010 at the meeting of the American Society of Aesthetic Plastic Surgery (ASAPS) following Food and Drug Administration, or FDA, clearance in January 2010, optimizes the preparation of autologous fat grafts. PureGraft™ is an innovative consumable product that provides consistent, quality grafts for use in aesthetic body contouring procedures. In Europe, PureGraft™ is sold as a complement to the Celution® System. We received the EU CE Mark for PureGraft™ in July 2010. In the United States, PureGraft™ is a strategic product that allows us to build relationships in the cosmetic and reconstructive surgery community while Celution® is under review by the FDA. In addition, we believe our PureGraft™ customer base will provide valuable sales leads, if Celution® is approved in the United States.
We also sell the StemSource® family of products worldwide, including in the United States, for research as well as for the cryopreservation and storage of ADRCs. The StemSource® System is offered as a standalone product, or as a part of a comprehensive suite of systems, equipment, and protocols for ADRC and fat tissue banking, collectively referred to as a StemSource® Cell Bank. The StemSource® Cell Bank is being marketed in Japan through our commercialization partner, Green Hospital Supply, Inc. (Green Hospital Supply) and in the United States by our direct sales team. The first U.S. StemSource® Bank was sold in Texas in May 2010.
Commercial Activities & Markets: the Celution® System
Cytori’s commercial activities are currently focused in two areas: regenerative medicine (breast reconstruction, soft tissue defect filling) and regenerative aesthetics (elective, cosmetic surgery procedures). In Europe and Asia-Pacific, Cytori’s core product, the Celution® System, or Celution®, provides physicians with clinical grade stem and regenerative cells at the point of care for re-implantation into the patient. It is the only such device with a CE Mark under the Europe’s medical device directive (MDD 93/42/EEC). With expanded CE Mark approval received in July 2010, the Celution® System is currently sold for use in Europe for cosmetic and reconstructive procedures, including breast reconstruction and augmentation, soft tissue defect repair, healing of Crohn’s wounds, buttock augmentation, and facial procedures. We are currently working with the FDA on multiple fronts to make Celution® available in the United States.
With our newly expanded CE Mark claims for breast reconstruction and wound healing, we are shifting our sales focus to concentrate more on hospitals, rather than private pay clinics. We are seeking to broaden Celution® adoption through our 70-patient, European multi-center post-marketing trial, RESTORE 2. Interim 6 month data on the first 32 patients, indicating high levels of patient and physician satisfaction, was presented at the San Antonio Breast Cancer Symposium in December 2009. The data was further supported by interim 6 and 12 month results reported by an investigator in June of this year. Complete 12-month results were reported in March 2011.
Introduced in Europe and Asia-Pacific in the first quarter of 2008, Celution® is currently sold directly or through select medical distributors, including GE Healthcare, in many European countries including Austria, Belgium, Denmark, Germany, Greece, Finland, Italy, the Netherlands, Norway, Portugal, Spain, Sweden, Switzerland, Turkey, and the United Kingdom, as well is in select Asian, Middle Eastern, and Eastern European countries. Our distribution agreement with GE Healthcare was amended in September 2010. The agreement, which has been extended through 2011, returned to Cytori rights to sell Celution® for cosmetic and reconstructive surgery applications. GE Healthcare maintains non-exclusive cosmetic and reconstructive surgery rights for Celution®.
4
In addition to sales into the reconstructive and cosmetic surgery markets, the Celution® System is being marketed to physicians, academic centers, and research hospitals, to fulfill the demand for access to clinical-grade stem and regenerative cells. Availability at the point of care enables physicians to apply the cells across an array of applications. Certain physicians have chosen to study patient outcomes to understand the benefit of these cells under their own independently sponsored studies. We are aware of physicians around the world independently conducting investigator initiated studies for breast augmentation and reconstruction, stress urinary incontinence, wound healing, liver insufficiency, radiation injury, and bone regeneration. Researchers are also using ADRCs for preclinical research in kidney disease, spinal disc injury, periodontal disease, vocal cord paralysis and peripheral vascular disease, among others. We expect the breadth of these new applications to grow as physicians and researchers continue to develop and adopt cell based regenerative medicine into their treatment strategies based on the availability of safe clinical grade cells at the point of care.
Pipeline: the Celution® System
Cardiovascular Disease: Acute Myocardial Infarction & Chronic Myocardial Ischemia
The most advanced therapeutic application in our product development pipeline is cardiovascular disease. Building upon extensive preclinical work, we have completed two clinical trials in Europe investigating the use of ADRCs processed with the Celution® System as potential treatment for cardiovascular disease. The PRECISE clinical trial for chronic myocardial ischemia, a severe form of coronary artery disease and the APOLLO trial for acute heart attacks are both double-blind, placebo controlled safety and feasibility studies.
Primary outcomes of the APOLLO trial at 6 months were reported in May 2010 at the 7th International Symposium on Cardiovascular Cell Therapy and at the American Heart Association in November 2010. In addition to safety, the data showed positive signals for efficacy: a reduction in infarct size and an improvement in perfusion. Six month primary outcomes in the PRECISE trial were reported at the same conference in May 2010, with additional 18 month data presented at the American Heart Association in November 2010. The data showed, in addition to safety, a statistically significant improvement in patient’s functional capacity.
Building on the positive results of the APOLLO study, Cytori has initiated a European pivotal, approval trial for use of the Celution® System to treat patients with acute heart attacks, the ADVANCE trial. The ADVANCE trial is a randomized, placebo controlled, double-blind trial that will enroll up to 360 patients with myocardial infarction in up to 35 treatment centers, predominately in Europe. This trial will use our next-generation Celution® device, the Celution® One System, manufactured by the Olympus-Cytori Joint Venture. Celution® One can process greater tissue volumes in less time, maximizing the efficiency for the hospital and cath-lab setting. In January 2011, Cytori received approval to initiate the ADVANCE trial in the Netherlands. Additional country and trial-center approvals are anticipated throughout Europe during the first half of 2011.
We believe there is significant need for new forms of treatment for cardiovascular disease, which represents one of the largest healthcare market opportunities. According the American Heart Association Heart Disease & Stroke Statistics: 2010 Update, it is estimated that in the United States alone, there were approximately 8,500,000 heart attacks for the last reported year, with more than 17,000,000 people suffering from coronary heart disease.
Other Applications
Other potential applications for the Celution® System family of products under investigation include wound healing, gastrointestinal disorders, stress urinary incontinence, liver and renal disease, spinal disc degeneration, pelvic health conditions, and vascular disease. Several of these applications are being studied as part of independent, investigator-led clinical studies sponsored and funded by the investigators in Asia and Europe. Additionally, our scientists are, to a varying degree, investigating some of these applications in pre-clinical models. As an example, preclinical renal data was published in October 2010 showing significant improvement in survival in the cell treated group in an animal model.
5
In December 2010, Cytori entered into a strategic equity agreement with Astellas Pharma Inc, the second largest pharmaceutical company in Japan. As part of the agreement, we granted Astellas Pharma a two year right of first refusal to enter into a development and commercialization collaboration with us regarding the use of our technology, on a worldwide basis, for the treatment of liver conditions. We also granted Astellas Pharma a non-voting observer seat on our Board of Directors and the right to designate a representative member to our Scientific Advisory Board.
Commercial Activities & Markets: PureGraft™ and StemSource®
PureGraft™
The PureGraft™250/PURE System, or PureGraft™, is designed to streamline the fat graft preparation process by selectively washing and filtering the tissue to remove contaminants in a closed, sterile field. PureGraft™, was cleared for sale in the U.S. and approval for sale in the EU in January and July 2010, respectively, and is currently being sold into the regenerative medicine arena (for breast reconstruction) and the regenerative aesthetics (cosmetic procedure) markets in the US and in the EU.
By providing consistent, quality grafts, PureGraft™ provides an innovative solution for breast cancer patients who have undergone a lumpectomy or partial mastectomy, for which there is no generally accepted reconstruction option. We have also taken the PureGraft™ technology and applied it toward cosmetic fat grafting procedures. PureGraft™ provides a natural option for women who are looking to enhance or contour their bodies without artificial implants or substances. To promote the demand for PureGraft™, we have substantially increased our U.S. sales force to include regional sales representatives in the Pacific states, Midwest, Mid-America, East Coast and Southeast and added additional personnel to our EU based team.
Used in conjunction with the Celution® System in Europe to further optimize cell-enriched fat grafting procedures or as a standalone device in the US for optimized fat grafting procedures, PureGraft™ is a strategic product for our sales team. In Europe, PureGraft™ provides a low-cost entry point into the regenerative medicine and regenerative aesthetics fields. As our Celution® technology becomes more established and accepted, some of our PureGraft™ customers may find that Celution® is a better fit for their practice as they strive to distinguish themselves from their competitors. In the US, PureGraft™ allows our sales team to build relationships within the cosmetic and reconstructive surgery community that we can later draw on, once Celution® becomes available in the US.
StemSource®
Our StemSource® product line, available in the US and the rest of world, is laboratory equipment designed to separate and concentrate stem and regenerative cells from adipose tissue. The StemSource® System, or StemSource®, is available worldwide for research and laboratory use and as the foundation of our StemSource® Cell Bank for cryopreserving patients’ adult stem and regenerative cells for potential later use. In 2010, Cytori further developed the StemSource® Cell Bank to include additional features for processing intact adipose tissue for cryopreservation. StemSource® tissue banking of intact adipose tissue allows for greater versatility in future procedures, and makes banking more practical for plastic surgery clinics.
The StemSource® Cell Bank is being marketed to hospitals, plastic surgery clinics, tissue banks, and stem cell banking companies in Europe, Asia and the US. With a StemSource® Cell Bank on site, such facilities will be able to offer their patients the option of storing their adipose tissue and adipose tissue-derived stem and regenerative cells, accessing them in the future when clinical applications are approved.
For our hospital, tissue bank and surgery clinic partners, the economic value of a StemSource® Cell Bank lies in the recurring revenue from processing and freezing. It starts with a tissue collection procedure, which may be performed during an already planned surgery or a separate elective procedure. The cells are prepared for storage using the StemSource® System, which automates the separation and concentration of stem and regenerative cells from adipose tissue and thereby allows hospitals to more affordably offer such service to their patients. We have found that this model is also conducive to the plastic surgery clinic setting. Not only is liposuction already a part of a plastic surgery practice, banking a patient’s fat makes it much more likely that the patient will return to cash in their investment, providing critical patient retention for the practice. Tissue banking allows for a greater versatility in potential procedures to be performed, and makes banking more practical for plastic surgery clinics.
6
We are currently marketing the StemSource® Cell Bank worldwide through a combination of distributor relationships and direct sales. Cytori remains responsible for manufacturing the StemSource® System and sourcing all necessary equipment, including but not limited to cryopreservation chambers, cooling and thawing devices, cell banking protocols and the proprietary software and database application.
In Japan, Korea, Taiwan and Thailand, we sell the StemSource® Cell Bank directly and through our partner Green Hospital Supply, Inc. We equally split revenues from the sales of StemSource® Cell Banks and single-use, per-procedure consumables sold by Green Hospital Supply. Green Hospital Supply continues its sales and marketing efforts in these territories for larger institutional sales to hospitals and universities, while Cytori focuses primarily on marketing and selling the StemSource® Cell Banks in these territories to local private clinics. In addition to our agreement with Green Hospital, GE Healthcare is selling the StemSource® translational research platform in Thailand as a part of our distribution agreement.
In the European Union, Cytori is selling the StemSource® equipment for translational research and as a part of the cell banking platform directly and through our distribution agreement with GE Healthcare, amended in September 2010 to continue through 2011. In the United States, we sell StemSource® for translational research and cell banking directly and through GE Healthcare. In May 2010, we sold our first U.S. cell bank.
Other Products
Celution®, PureGraft™ and StemSource® are currently our primary product offerings. We also sell a range of ancillary products designed to optimize tissue harvest and graft delivery. Among the offerings is the Celbrush™, a surgical instrument for precise delivery of micro droplets that was launched in 2009. Sold separately and in combination with other items, the Celbrush™ is sold to reconstructive and cosmetic surgeons worldwide.
Additionally, we have a ThinFilm biomaterial product line in Japan. We sold our non-Japan Thin Film business in 2004. Pending regulatory approval in Japan, this product line would be distributed exclusively through Senko Medical Trading Co. (Senko) for anti-adhesion applications, soft tissue support, and minimization of the attachment of soft tissues throughout the body.
Manufacturing
The Celution® and StemSource® Systems and related single-use consumables as well our PureGraft™ technology are being manufactured at Cytori’s headquarters in San Diego, CA. Our internal manufacturing capabilities are expected to enable us to meet anticipated demand in 2011.
In the future, the next generation commercial Celution® System (Celution® One) will be manufactured through a joint venture arrangement between Cytori and Olympus Corporation (Olympus), a global optics and life science company. Olympus-Cytori Inc. (the Joint Venture), enables Cytori to access Olympus’ expertise in engineering, manufacturing and servicing of sophisticated medical devices. The Joint Venture will supply the Celution® One System for all therapeutic applications solely to Cytori at a formula-based transfer price. Cytori owns Celution® System marketing rights for all therapeutic applications.
Competition
We compete with multiple pharmaceutical, biotechnology and medical device companies involved in the development and commercialization of medical technologies and therapies.
Regenerative medicine is rapidly progressing, in large part through the development of cell-based therapies or devices designed to isolate cells from human tissues. Most efforts involve cell sources, such as bone marrow, embryonic and fetal tissue, umbilical cord and peripheral blood, and skeletal muscle. We work exclusively with adult stem and regenerative cells from adipose tissue.
Companies working in this area of regenerative medicine include, among others, Aastrom Biosciences, Aldagen, BioTime, Baxter International, Inc., Celgene, Genzyme (acquired by Sanofi-aventis), Geron, Harvest Technologies, Mesoblast, Osiris Therapeutics, and Tissue Genesis, Inc. Many of our competitors and potential competitors have substantially greater financial, technological, research and development, marketing, and personnel resources than we do. We cannot with any accuracy forecast when or if these companies are likely to bring cell therapies to market for indications that we are also pursuing.
7
Some of our competitors are also working with adipose-derived cells. To the best of our knowledge, none of these companies are currently conducting prospective, controlled human clinical trials nor do any of these companies have regulatory clearance for their product in Europe (under the medical device directive) or in the United States. In addition, we are aware of several surgeons who are performing autologous fat transfers using manual methods, some of whom enrich the fat with autologous adipose-derived cells.
Companies researching and developing cell-based therapies for cardiovascular disease include, among others, Aldagen, Baxter, Harvest Technologies, Mesoblast, and Osiris. Baxter completed a Phase II study in the United States using stem cells extracted from peripheral blood for chronic myocardial ischemia. Mesoblast is conducting a Phase II study in heart failure and another Phase II in combination with a heart assist device. Osiris Therapeutics, Inc. completed enrollment in a Phase II clinical trial using allogeneic (donor), mesenchymal stem cells, for acute myocardial infarction.
Research and Development
Research and development expenses were $9,687,000, $12,231,000 and $17,371,000 for the years ended December 31, 2010, 2009 and 2008, respectively. As a part of our shift towards commercialization, research and development expenses significantly reduced starting in the first half of 2009.
Our research and development efforts in 2010 focused predominantly on the following areas:
|
·
|
Completed patient follow-up in our 70 patient European breast reconstruction post-marketing clinical study using the Celution® System. The study took place across several centers in Europe and measured safety, patient and physician satisfaction, improvement in breast deformity as well as other outcomes related to autologous fat transfers enriched with the Celution® System output to correct partial mastectomy defects. Full 12 month primary outcomes will be announced in the first half of 2011;
|
|
·
|
Six month data from two randomized, double blind, placebo controlled European clinical trials in chronic myocardial ischemia and acute heart attacks were reported in May 2010. Eighteen month chronic ischemia data was subsequently reported in November 2010;
|
|
·
|
Planning & initial steps taken in preparation for a pivotal, approval trial for acute heart attack patients (the ADVANCE study). Study initiation is anticipated to take place throughout 2011;
|
|
·
|
Preparation and submission of multiple regulatory filings in the United States, Europe, and Japan related to various cell and tissue processing systems under development;
|
|
·
|
Continued optimization and development of the Celution® System family of products, single-use consumables and related instrumentation, including software updates for process efficiencies and to accommodate multiple languages;
|
|
·
|
Collaboration with Olympus Corporation to finalize the development of the Celution® One System, the next-generation Celution® System, which will be manufactured by the Olympus-Cytori Joint Venture;
|
|
·
|
Development and optimization of the next generations of the PureGraft™ product line;
|
|
·
|
Development of the infrastructure and logistics for the commercialization expansion of the StemSource® Cell Bank in the United States, Europe and Asia, including optimization of proprietary systems and technology and the development of the tissue banking component;
|
|
·
|
Investigating the cellular and molecular properties, composition, and characteristics of stem and regenerative cells residing in adipose tissue to increase our understanding and control of our therapeutic products and to improve our intellectual property position.
|
Customers
Cytori has established a network of distributors, including GE Healthcare, who offer our Celution® System, instrumentation and consumables to surgeons and hospitals throughout Europe. These distributors purchase the devices from Cytori at a contractually agreed-upon transfer price. We also market our Celution® System directly to customers in select countries within Europe. In addition, we offer the StemSource® 900/MB as laboratory equipment or as part of the StemSource® Cell Bank (a comprehensive suite of products to allow hospitals or tissue banks to cryopreserve adipose-derived stem and regenerative cells) both directly to customers and through GE Healthcare in the United States. In Europe and Asia, we sell the Celution® System directly to customers, many of whom are academic hospitals, who are sponsoring and funding their own independent, investigator-led clinical studies using the product.
8
In July 2004, we entered into a Distribution Agreement with Senko under which we granted to Senko an exclusive license to sell and distribute Thin Film products in Japan. The sale of products through Senko commences upon “commercialization,” which requires regulatory clearance from the Japanese regulatory authorities. We are currently pursuing the required regulatory clearance in Japan. Following commercialization, the Distribution Agreement has a five-year duration and is renewable for an additional five years after reaching mutually agreed minimum purchase guarantees. In 2004, we sold all of our non-Japan Thin Film business.
Sales by Geographic Region
For the years ended December 31, 2010 and 2009, most of our product revenue came from sales of the Celution®800/CRS System, related instrumentation and consumables to the European and Asia-Pacific cosmetic and reconstructive surgery markets, as well as from sales of the StemSource® laboratory and banking equipment in the U.S. and Asia. Upon receiving regulatory approval during 2010, we began selling PureGraft™ Systems in the United States and Europe. For the year ended December 31, 2008, all of our product revenue came from sales of Celution® 800/CRS System to the European and Asia-Pacific reconstructive surgery market and installation of our first StemSource® Cell Bank.
Under a distribution agreement with Senko, we are responsible for the completion of the initial regulatory application to the MHLW (the Japanese equivalent of the U.S. Food and Drug Administration). We did not recognize development revenue based on milestones defined within this agreement in 2010, 2009 or 2008. We have not generated any Thin Film product revenue in Japan yet, and we sold all our non-Japan Thin Film business in 2004.
We anticipate that our future international product revenues will increase in part as a result of our Distribution Agreement with Senko in the event our Thin Film products are approved for sale in Japan.
Planned Capital Expenditures
Although capital expenditures may vary significantly depending on a variety of factors, we may spend up to $1 million on capital equipment purchases in 2011. These may be paid with our available cash, or financed if appropriate.
Raw Materials
Raw materials required to manufacture the Celution® System family of products and disposables are commonly available from multiple sources, and we have identified and executed supply agreements with our preferred vendors. Some specialty components are custom made for us, and we are dependent on the ability of these suppliers to deliver functioning parts in a timely manner to meet the ongoing demand for our products. There can be no assurance that we will be able to obtain adequate quantities of the necessary raw materials supplies within a reasonable time or at commercially reasonable prices. Interruptions in supplies due to price, timing, or availability or other issues with our suppliers could have a negative impact on our ability to manufacture products.
Intellectual Property
Our success depends in large part on our ability to protect our proprietary technology, including the Celution® System product platform, and to operate without infringing on the proprietary rights of third parties. We rely on a combination of patent, trade secret, copyright and trademark laws, as well as confidentiality agreements, licensing agreements and other agreements, to establish and protect our proprietary rights. Our success also depends, in part, on our ability to avoid infringing patents issued to others. If we were judicially determined to be infringing on any third party patent, we could be required to pay damages, alter our products or processes, obtain licenses or cease certain activities.
To protect our proprietary medical technologies, including the Celution® System platform and other scientific discoveries, Cytori has 31 issued patents worldwide. We have 12 issued U.S. patents and 19 issued international patents. Of the 12 issued U.S. patents, 3 were issued in 2010 and 2 have been issued in 2011 thus far. Of the 19 issued international patents, 6 were issued in 2010 and 1 has been issued so far in 2011. In addition, we have over 100 patent applications pending worldwide related to our technology. We are seeking additional patents on methods and systems for processing adipose-derived stem and regenerative cells, on the use of adipose-derived stem and regenerative cells for a variety of therapeutic indications, including their mechanisms of actions, on compositions of matter that include adipose-derived stem and regenerative cells, and on other scientific discoveries. We are also the exclusive, worldwide licensee of the Regents of the University of California’s rights to a portfolio related to isolated adipose derived stem cells.
9
We cannot assure that any of our pending patent applications will be issued, that we will develop additional proprietary products that are patentable, that any patents issued to us will provide us with competitive advantages or will not be challenged by any third parties or that the patents of others will not prevent the commercialization of products incorporating our technology. Furthermore, we cannot assure that others will not independently develop similar products, duplicate any of our products or design around our patents. U.S. patent applications are not immediately made public, so we might be surprised by the grant to someone else of a patent on a technology we are actively using.
There is a risk that any patent applications that we file and any patents that we hold or later obtain could be challenged by third parties and declared invalid or infringing of third party claims. A patent interference proceeding may be instituted with the U.S. Patent and Trademark Office (the “USPTO”) when more than one person files a patent application covering the same technology, or if someone wishes to challenge the validity of an issued patent. At the completion of the interference proceeding, the USPTO will determine which competing applicant is entitled to the patent, or whether an issued patent is valid. Patent interference proceedings are complex, highly contested legal proceedings, and the USPTO’s decision is subject to appeal. This means that if an interference proceeding arises with respect to any of our patent applications, we may experience significant expenses and delay in obtaining a patent, and if the outcome of the proceeding is unfavorable to us, the patent could be issued to a competitor rather than to us. In addition to interference proceedings, the USPTO can reexamine issued patents at the request of a third party seeking to have the patent invalidated. All patents are subject to requests for reexamination by third parties. This means that patents owned or licensed by us may be subject to reexamination and may be lost, or some or all claims may require amendment or cancellation, if the outcome of the reexamination is unfavorable to us. Patent reexamination proceedings are long and complex proceedings and could result in a reduction or loss of patent rights.
Patent law outside the United States is uncertain and in many countries is currently undergoing review and revisions. The laws of some countries may not protect our proprietary rights to the same extent as the laws of the United States. Third parties may attempt to oppose the issuance of patents to us in foreign countries by initiating opposition proceedings. Opposition proceedings against any of our patent filings in a foreign country could have an adverse effect on our corresponding patents that are issued or pending in the U.S. It may be necessary or useful for us to participate in proceedings to determine the validity of our patents or our competitors’ patents that have been issued in countries other than the United States. This could result in substantial costs, divert our efforts and attention from other aspects of our business, and could have a material adverse effect on our results of operations and financial condition. We currently have pending patent applications and issued patents in Europe, Brazil, Mexico, India, Russia, Australia, Japan, Canada, China, Korea, and Singapore, among others.
In addition to patent protection, we rely on unpatented trade secrets and proprietary technological expertise. We cannot assure you that others will not independently develop or otherwise acquire substantially equivalent techniques, somehow gain access to our trade secrets and proprietary technological expertise or disclose such trade secrets, or that we can ultimately protect our rights to such unpatented trade secrets and proprietary technological expertise. We rely, in part, on confidentiality agreements with our marketing partners, employees, advisors, vendors and consultants to protect our trade secrets and proprietary technological expertise. We cannot assure you that these agreements will not be breached, that we will have adequate remedies for any breach or that our unpatented trade secrets and proprietary technological expertise will not otherwise become known or be independently discovered by competitors.
Government Regulation
As newly developed medical devices, our Celution® and PureGraft™ family of products must receive regulatory clearances or approvals from the European Union, the FDA and, from other state governments prior to their sale. Our current and future Celution® Systems are or will be subject to stringent government regulation in the United States by the FDA under the Federal Food, Drug and Cosmetic Act. The FDA regulates the design/development process, clinical testing, manufacture, safety, labeling, sale, distribution, and promotion of medical devices and drugs. Included among these regulations are pre-market clearance and pre-market approval requirements, design control requirements, and the Quality System Regulations/Good Manufacturing Practices. Other statutory and regulatory requirements govern, among other things, registration and inspection, medical device listing, prohibitions against misbranding and adulteration, labeling and post-market reporting.
10
The Celution® System family of products must also comply with the government regulations of each individual country in which the products are to be distributed and sold. These regulations vary in complexity and can be as stringent, and on occasion even more stringent, than FDA regulations in the United States. International government regulations vary from country to country and region to region. For example, regulations in some parts of the world only require product registration while other regions / countries require a complex product approval process. Due to the fact that there are new and emerging cell therapy and cell banking regulations that have recently been drafted and/or implemented in various countries around the world, the application and subsequent implementation of these new and emerging regulations have little to no precedence. Therefore, the level of complexity and stringency is not always precisely understood today for each country, creating greater uncertainty for the international regulatory process. Furthermore, government regulations can change with little to no notice and may result in up-regulation of our product(s), thereby, creating a greater regulatory burden for our cell processing and cell banking technology products.
Summary of Celution® System Family Regulatory Status
|
Region
|
Clinical Applications
|
Regulatory Status
|
|
Japan
|
Cell Banking
|
Approved
|
|
Europe
|
Cell Processing for re-implantation or re-infusion into same patient (General Processing)
|
CE Mark
|
|
Breast reconstruction, healing of Crohn’s wounds and other cosmetic procedures
|
CE Mark
|
|
|
Cardiovascular disease
|
In clinical trials
|
|
|
Multiple specific surgical claims
|
Pre-clinical
|
|
|
Cell Concentration
|
CE Mark
|
|
|
Cosmetic and reconstructive surgery claims (Celution® One)
|
In process
|
|
|
USA
|
Soft tissue filling/aesthetic body contouring
|
In process
|
|
Cardiovascular disease
|
Pre-clinical
|
|
|
Multiple general surgical claims
|
Pre-clinical
|
|
|
Blood processing
|
510k clearance
|
|
Summary of PureGraft™ and Celbrush™ Regulatory Status
|
Series
|
Region
|
Clinical Applications
|
Regulatory Status
|
|
PureGraft™250/PURE System
|
USA
|
For use in the harvesting, filtering and transferring of autologous fat tissue for reinjecting back into the same patient for aesthetic body contouring
|
510(k) clearance
|
|
PureGraft™250/PURE-EU System
|
Europe
|
For use in the harvesting, filtering and transferring of autologous fat tissue for reinjecting back into the same patient for aesthetic body contouring
|
CE Marked
|
|
PureGraft™250/PURE System
|
Japan
|
For use in the harvesting, filtering and transferring of autologous fat tissue for reinjecting back into the same patient for aesthetic body contouring
|
In process
|
|
Celbrush™
|
USA
|
For precise delivery of tissue micro droplets
|
Registered
|
|
Celbrush™
|
Europe
|
For precise delivery of tissue micro droplets
|
CE Marked
|
|
Celbrush™
|
Japan
|
For precise delivery of tissue micro droplets
|
In process
|
11
The regulatory process can be lengthy, expensive, and uncertain. Before any new medical device may be introduced to the U.S. market, the manufacturer generally must obtain FDA clearance or approval through either the 510(k) pre-market notification process (which our PureGraft™ System has received) or the lengthier pre-market approval application (PMA) process. It generally takes from three to 12 months from submission to obtain 510(k) pre-market clearance, although it may take longer. Approval of a PMA could take four or more years from the time the process is initiated. The 510(k) and PMA processes can be expensive, uncertain, and lengthy, and there is no guarantee of ultimate clearance or approval. Our core Celution® System processing device products under development as well as Olympus-Cytori’s may be subject to the lengthier PMA process for many specific applications. Securing FDA clearances and approvals may require the submission of extensive clinical data and supporting information to the FDA, and there can be no guarantee of ultimate clearance or approval. Failure to comply with applicable requirements can result in application integrity proceedings, fines, recalls or seizures of products, injunctions, civil penalties, total or partial suspensions of production, withdrawals of existing product approvals or clearances, refusals to approve or clear new applications or notifications, and criminal prosecution.
Medical devices are also subject to post-market reporting requirements for deaths or serious injuries when the device may have caused or contributed to the death or serious injury, and for certain device malfunctions that would be likely to cause or contribute to a death or serious injury if the malfunction were to recur. If safety or effectiveness problems occur after the product reaches the market, the FDA may take steps to prevent or limit further marketing of the product. Additionally, the FDA actively enforces regulations prohibiting marketing and promotion of devices for indications or uses that have not been cleared or approved by the FDA. In addition, modifications or enhancements of products that could affect the safety or effectiveness or effect a major change in the intended use of a device that was either cleared through the 510(k) process or approved through the PMA process may require further FDA review through new 510(k) or PMA submissions.
Lastly, the FDA is currently considering modifications to the 510(k) process. The extent and effect of these proposals are not known. Moreover, the effect of these changes on our ability to obtain future 510(k) clearances is also not clear. Regardless of the effect, it is relatively well accepted that these changes to the FDA 510(k) system will result in a more rigorous approval process.
Under the terms of our Joint Venture Agreements with Olympus, we are the party with the primary responsibility for obtaining regulatory approvals to sell the Olympus-Cytori, Inc. devices. To date we have prepared and submitted multiple regulatory filings in the United States and Europe related to various cell processing systems under development, which notably resulted in receipt of a CE Mark on the Celution® 800 System and the PureGraft™ 250/PURE System as well as 510(k) clearance in the United States for various related medical technologies, including the PureGraft™250/PURE System and an autologous blood processing device.
In July 2009, we learned that the Celution®700/AFT will be regulated in the United States by the FDA as a medical device. Subsequently, we filed an initial 510(k) marketing application for use in aesthetic body contouring and/or filling of soft tissue voids with the FDA in November 2009. Our application was reviewed by the FDA's Center for Biologics Evaluation and Research under the law applicable to medical devices, and in February 2010 they informed us that our Celution® 700/AFT has been classified as a class III medical device for which a PMA will be required for these applications. We are currently working with the FDA to determine if this classification is final and if so, the necessary size and scope of clinical studies to obtain an approval and are exploring multiple additional avenues to bring Celution® to the United States.
We must comply with extensive regulations from foreign jurisdictions regarding safety, manufacturing processes and quality. These regulations, including the requirements for marketing authorization, may differ from the FDA regulatory scheme in the United States. Specifically, in regard to our Thin Film product line in Japan (distributed by Senko), we have been seeking marketing authorization from the Japanese Ministry of Health, Labour and Welfare, but have not obtained approvals yet.
Staff
As of December 31, 2010, we had 124 employees, including part-time and full-time employees. These employees are comprised of 16 employees in manufacturing, 39 employees in research and development, 37 employees in sales and marketing and 32 employees in management, finance and administration. From time to time, we also employ independent contractors to support our operations. Our employees are not represented by any collective bargaining agreements and we have never experienced an organized work stoppage.
12
Web Site Access to SEC Filings
We maintain an Internet website at www.cytori.com. Through this site, we make available free of charge our annual reports on Form 10-K, quarterly reports on Form 10-Q, current reports on Form 8-K, and amendments to those reports filed or furnished pursuant to Section 13(a) of the Securities Exchange Act of 1934 as soon as reasonably practicable after we electronically file such material with, or furnish it to, the U.S. Securities and Exchange Commission (SEC). In addition, we publish on our website all reports filed under Section 16(a) of the Securities Exchange Act by our directors, officers and 10% stockholders. These materials are accessible via the Investor Relations section of our website within the “SEC Filings” link. Some of the information is stored directly on our website, while other information can be accessed by selecting the provided link to the section on the SEC website, which contains filings for our company and its insiders.
The SEC maintains an Internet site that contains reports, proxy information and information statements, and other information regarding issuers that file electronically with the SEC. The address of that website is http://www.sec.gov. The materials are also available at the SEC’s Public Reference Room, located at 100 F Street, Washington, D.C. 20549. The public may obtain information through the public reference room by calling the SEC at 1-800-SEC-0330.
Item 1A. Risk Factors
In analyzing our company, you should consider carefully the following risk factors together with all of the other information included in this annual report on Form 10-K. Factors that could adversely affect our business, operating results, and financial condition, as well as adversely affect the value of an investment in our common stock, include those discussed below, as well as those discussed above in “Management’s Discussion and Analysis of Financial Condition and Results of Operations” and elsewhere throughout this annual report on Form 10-K.
We are subject to the following significant risks, among others:
We may need to raise more cash in the future
We have almost always had negative cash flows from operations. Our business will continue to result in a substantial requirement for research and development expenses for several years, during which we may not be able to bring in sufficient cash and/or revenues to offset these expenses. We will likely be required to raise capital from one or more sources in the future to continue funding our operations to profitability. We do not currently believe that our cash balance and the revenues from our operations will be sufficient to fund the development and marketing efforts required to reach profitability without raising additional capital from accessible sources of financing in the future. In addition, our Amended and Restated Loan and Security Agreement with General Electric Capital Corporation, Silicon Valley Bank and Oxford Finance Corporation requires us to maintain certain minimum cash requirements, and if our cash reserves fall below those minimum requirements, then we could be in default under our loan agreement and subject to potential adverse remedies by the lenders, which would have a substantial and material adverse effect on our business, financial condition, results of operations, the value of our common stock and warrants and our ability to raise capital. There is no guarantee that adequate funds will be available when needed from additional debt or equity financing, arrangements with development and commercialization partners, increased results of operations, or from other sources, or on terms attractive to us. Our inability to obtain sufficient additional funds in the future would, at a minimum, require us to delay, scale back, or eliminate some or all of our research or product development, manufacturing operations, clinical or regulatory activities, which could have a substantial negative effect on our results of operations and financial condition.
Continued turmoil in the economy could harm our business
Negative trends in the general economy, including trends resulting from an actual or perceived recession, tightening credit markets, increased cost of commodities, including oil, actual or threatened military action by the United States and threats of terrorist attacks in the United States and abroad, could cause a reduction of investment in and available funding for companies in certain industries, including ours. Our ability to raise capital has been and may in the future be adversely affected by downturns in current credit conditions, financial markets and the global economy.
We have never been profitable on an operational basis and expect significant operating losses for the next few years
We have incurred net operating losses in each year since we started business. As our focus on the Celution® System platform and development of therapeutic applications for its cellular output has increased, losses have resulted primarily from expenses associated with research and development activities and general and administrative expenses. While we work continuously to implement cost reduction measures where possible, we nonetheless expect to continue operating in a loss position on a consolidated basis and that recurring operating expenses will be at high levels for the next several years, in order to perform clinical trials, additional pre-clinical research, product development, and marketing. As a result of our historic losses, we have been, and are likely to continue to be, reliant on raising outside capital to fund our operations as discussed in the prior risk factor.
13
Our business strategy is high-risk
We are focusing our resources and efforts primarily on development of the Celution® System family of products and the therapeutic applications of its cellular output, which requires extensive cash needs for research, development, and commercialization activities. This is a high-risk strategy because there is no assurance that our products will ever become commercially viable (commercial risk), that we will prevent other companies from depriving us of market share and profit margins by selling products based on our inventions and developments (legal risk), that we will successfully manage a company in a new area of business (regenerative medicine) and on a different scale than we have operated in the past (operational risk), that we will be able to achieve the desired therapeutic results using stem and regenerative cells (scientific risk), or that our cash resources will be adequate to develop our products until we become profitable, if ever (financial risk). We are using our cash in one of the riskiest industries in the economy (strategic risk). This may make our stock an unsuitable investment for many investors.
We must keep our joint venture with Olympus operating smoothly
Our business depends in part on keeping our Joint Venture collaboration with Olympus operating smoothly and efficiently. We have given Olympus-Cytori, Inc. an exclusive license to manufacture future generation Celution® System devices. If Olympus-Cytori, Inc. does not successfully develop and manufacture these devices, we may not be able to commercialize these devices successfully into the market. In addition, future disruption or breakup of our relationship would be extremely costly to our reputation, in addition to causing many serious practical problems.
We and Olympus must overcome contractual and cultural barriers. Although our relationship is formally measured by a set of complex contracts, many aspects of the relationship will be non-contractual and must be worked out between the parties and the responsible individuals. The Joint Venture is intended to have a long life, and it is difficult to maintain cooperative relationships over a long period of time in the face of various kinds of change. Cultural differences, including language barrier to some degree, may affect the efficiency of the relationship.
Olympus-Cytori, Inc. is 50% owned by us and 50% owned by Olympus. By contract, each side must consent before any of a wide variety of important business actions can occur. This situation possesses a risk of potentially time-consuming and difficult negotiations which could at some point delay the Joint Venture from pursuing its business strategies.
Olympus is entitled to designate the Joint Venture's chief executive officer and a majority of its board of directors, which means that day-to-day decisions which are not subject to a contractual veto will essentially be controlled by Olympus. In addition, Olympus-Cytori, Inc. may require more money than its current capitalization in order to complete development and production of future generation devices. If we are unable to help provide future financing for Olympus-Cytori, Inc., our relative equity interest in Olympus-Cytori, Inc. may decrease.
Furthermore, under a License/Joint Development Agreement among Olympus-Cytori, Inc., Olympus, and us, Olympus will have a primary role in the development of Olympus-Cytori, Inc.’s next generation devices. Although Olympus has extensive experience in developing medical devices, this arrangement will result in a reduction of our control over the development and manufacturing of the next generation devices.
We have a limited operating history; operating results and stock price can be volatile like many life science companies
Our prospects must be evaluated in light of the risks and difficulties frequently encountered by emerging companies and particularly by such companies in rapidly evolving and technologically advanced biotech and medical device fields. From time to time, we have tried to update our investors’ expectations as to our operating results by periodically announcing financial guidance. However, we have in the past been forced to revise or withdraw such guidance due to lack of visibility and predictability of product demand.
14
We are vulnerable to competition and technological change, and also to physicians’ inertia
We compete with many domestic and foreign companies in developing our technology and products, including biotechnology, medical device, and pharmaceutical companies. Many current and potential competitors have substantially greater financial, technological, research and development, marketing, and personnel resources. There is no assurance that our competitors will not succeed in developing alternative products that are more effective, easier to use, or more economical than those which we have developed or are in the process of developing, or that would render our products obsolete and non-competitive. In general, we may not be able to prevent others from developing and marketing competitive products similar to ours or which perform similar functions.
Competitors may have greater experience in developing therapies or devices, conducting clinical trials, obtaining regulatory clearances or approvals, manufacturing and commercialization. It is possible that competitors may obtain patent protection, approval, or clearance from the FDA or achieve commercialization earlier than we can, any of which could have a substantial negative effect on our business. Finally, Olympus and our other partners might pursue parallel development of other technologies or products, which may result in a partner developing additional products competitive with ours.
We compete against cell-based therapies derived from alternate sources, such as bone marrow, umbilical cord blood and potentially embryos. Doctors historically are slow to adopt new technologies like ours, whatever the merits, when older technologies continue to be supported by established providers. Overcoming such inertia often requires very significant marketing expenditures or definitive product performance and/or pricing superiority.
We expect physicians’ inertia and skepticism to also be a significant barrier as we attempt to gain market penetration with our future products. We believe we will need to finance lengthy time-consuming clinical studies (so as to provide convincing evidence of the medical benefit) in order to overcome this inertia and skepticism particularly in reconstructive surgery, cell preservation, the cardiovascular area and many other indications.
Most potential applications of our technology are pre-commercialization, which subjects us to development and marketing risks
We are in a relatively early stage of the path to commercialization with many of our products. We believe that our long-term viability and growth will depend in large part on our ability to develop commercial quality cell processing devices and useful procedure-specific consumables, and to establish the safety and efficacy of our therapies through clinical trials and studies. With our Celution® System platform, we are pursuing new approaches for reconstructive surgery, preservation of stem and regenerative cells for potential future use, therapies for cardiovascular disease, gastrointestinal disorders and spine and orthopedic conditions. There is no assurance that our development programs will be successfully completed or that required regulatory clearances or approvals will be obtained on a timely basis, if at all.
There is no proven path for commercializing the Celution® System platform in a way to earn a durable profit commensurate with the medical benefit. Although we began to commercialize our reconstructive surgery products in Europe and certain Asian markets, and our cell banking products in Japan, Europe, and certain Asian markets in 2008, additional market opportunities for our products and/or services are likely to be another two to four years away.
Successful development and market acceptance of our products is subject to developmental risks, including failure of inventive imagination, ineffectiveness, lack of safety, unreliability, failure to receive necessary regulatory clearances or approvals, high commercial cost, preclusion or obsolescence resulting from third parties’ proprietary rights or superior or equivalent products, competition from copycat products, and general economic conditions affecting purchasing patterns. There is no assurance that we or our partners will successfully develop and commercialize our products, or that our competitors will not develop competing technologies that are less expensive or superior. Failure to successfully develop and market our products would have a substantial negative effect on our results of operations and financial condition.
Future clinical trial results may differ significantly from our expectations
While our early clinical trial results so far have been very positive, and we have proceeded incrementally in the our these clinical trials in an effort to gauge the risks of proceeding with larger and more expensive trials, we cannot guarantee that we will not experience negative results in these larger and much more expensive clinical trials, such as the new ADVANCE acute heart attack trial in Europe. Poor results in our clinical trials could result in substantial delays in commercialization, substantial negative effects on the perception of our products, and substantial additional costs. These risks are increased by our reliance on third parties in the performance of many of the clinical trial functions, including the clinical investigators, hospitals, and other third party service providers.
15
The timing and amount of Thin Film revenues from Senko are uncertain
The sole remaining product line in our MacroPore Biosurgery segment is our Japan Thin Film business. Our right to receive royalties from Senko, and to recognize certain deferred revenues, depends on the timing of MHLW approval for commercialization of the product in Japan. We have no control over this timing and our previous expectations have not been met. Also, even after commercialization, we will be dependent on Senko, our exclusive distributor, to drive product sales in Japan.
We have limited manufacturing experience
We have limited experience in manufacturing the Celution® System platform or its consumables at a commercial level. With respect to our Joint Venture, although Olympus is a highly capable and experienced manufacturer of medical devices, there can be no guarantee that the Olympus-Cytori Joint Venture will be able to successfully develop and manufacture the next generation Celution® System in a manner that is cost-effective or commercially viable, or that development and manufacturing capabilities might not take much longer than currently anticipated to be ready for the market.
Although we have begun introduction of the Celution® 800 and the StemSource® 900-based Cell Bank in 2008, we cannot assure that we will be able to manufacture sufficient numbers of such products to meet the demand, or that we will be able to overcome unforeseen manufacturing difficulties for these sophisticated medical devices, as we await the availability of the Joint Venture next generation Celution® System.
In the event that the Olympus-Cytori Joint Venture is not successful, Cytori may not have the resources or ability to self-manufacture sufficient numbers of devices and consumables to meet market demand, and this failure may substantially extend the time it would take for us to bring a more advanced commercial device to market. This makes us significantly dependant on the continued dedication and skill of Olympus for the successful development of the next generation Celution® System.
We may not be able to protect our proprietary rights
Our success depends in part on whether we can maintain our existing patents, obtain additional patents, maintain trade secret protection, and operate without infringing on the proprietary rights of third parties.
There can be no assurance that any of our pending patent applications will be approved or that we will develop additional proprietary products that are patentable. There is also no assurance that any patents issued to us will not become the subject of a re-examination, will provide us with competitive advantages, will not be challenged by any third parties, or that the patents of others will not prevent the commercialization of products incorporating our technology. Furthermore, there can be no guarantee that others will not independently develop similar products, duplicate any of our products, or design around our patents.
Our commercial success will also depend, in part, on our ability to avoid infringing on patents issued to others. If we were judicially determined to be infringing on any third-party patent, we could be required to pay damages, alter our products or processes, obtain licenses, or cease certain activities. If we are required in the future to obtain any licenses from third parties for some of our products, there can be no guarantee that we would be able to do so on commercially favorable terms, if at all. U.S. patent applications are not immediately made public, so we might be surprised by the grant to someone else of a patent on a technology we are actively using. As noted above and in the case of the University of Pittsburgh lawsuit, even patents issued to us or our licensors might be judicially determined to belong in full or in part to third parties.
Litigation, which would result in substantial costs to us and diversion of effort on our part, may be necessary to enforce or confirm the ownership of any patents issued or licensed to us, or to determine the scope and validity of third-party proprietary rights. If our competitors claim technology also claimed by us and prepare and file patent applications in the United States, we may have to participate in interference proceedings declared by the U.S. Patent and Trademark Office or a foreign patent office to determine priority of invention, which could result in substantial costs to and diversion of effort, even if the eventual outcome is favorable to us. Any such litigation or interference proceeding, regardless of outcome, could be expensive and time-consuming.
Successful challenges to our patents through oppositions, reexamination proceedings or interference proceedings could result in a loss of patent rights in the relevant jurisdiction. If we are unsuccessful in actions we bring against the patents of other parties and it is determined that we infringe the patents of third-parties, we may be subject to litigation, or otherwise prevented from commercializing potential products in the relevant jurisdiction, or may be required to obtain licenses to those patents or develop or obtain alternative technologies, any of which could harm our business. Furthermore, if such challenges to our patent rights are not resolved in our favor, we could be delayed or prevented from entering into new collaborations or from commercializing certain products, which could adversely affect our business and results of operations.
16
Competitors or third parties may infringe our patents. We may be required to file patent infringement claims, which can be expensive and time-consuming. In addition, in an infringement proceeding, a court may decide that a patent of ours is not valid or is unenforceable, or that the third party’s technology does not in fact infringe upon our patents. An adverse determination of any litigation or defense proceedings could put one or more of our patents at risk of being invalidated or interpreted narrowly and could put our related pending patent applications at risk of not issuing. Litigation may fail and, even if successful, may result in substantial costs and be a distraction to our management. We may not be able to prevent misappropriation of our proprietary rights, particularly in countries outside the U.S. where patent rights may be more difficult to enforce. Furthermore, because of the substantial amount of discovery required in connection with intellectual property litigation, there is a risk that some of our confidential or sensitive information could be compromised by disclosure in the event of litigation. In addition, during the course of litigation there could be public announcements of the results of hearings, motions or other interim proceedings or developments. If securities analysts or investors perceive these results to be negative, it could have a substantial adverse effect on the price of our common stock.
In addition to patents, which alone may not be able to protect the fundamentals of our regenerative cell business, we also rely on unpatented trade secrets and proprietary technological expertise. Some of our intended future cell-related therapeutic products may fit into this category. We rely, in part, on confidentiality agreements with our partners, employees, advisors, vendors, and consultants to protect our trade secrets and proprietary technological expertise. There can be no guarantee that these agreements will not be breached, or that we will have adequate remedies for any breach, or that our unpatented trade secrets and proprietary technological expertise will not otherwise become known or be independently discovered by competitors.
Our amended regenerative cell technology license agreement with the Regents of the University of California (UC) which includes issued U.S. patent number 7,470,537, contains certain developmental milestones, which if not achieved could result in the loss of exclusivity or loss of the license rights. The loss of such rights could impact our ability to develop certain regenerative cell technology products. Also, our power as licensee to successfully use these rights to exclude competitors from the market is untested.
Failure to obtain or maintain patent protection, or protect trade secrets, for any reason (or third-party claims against our patents, trade secrets, or proprietary rights, or our involvement in disputes over our patents, trade secrets, or proprietary rights, including involvement in litigation), could have a substantial negative effect on our results of operations and financial condition.
We may not be able to protect our intellectual property in countries outside the United States
Intellectual property law outside the United States is uncertain and in many countries is currently undergoing review and revisions. The laws of some countries do not protect our patent and other intellectual property rights to the same extent as United States laws. This is particularly relevant to us as most of our current commercial product sales and clinical trials are outside of the United States. Third parties may attempt to oppose the issuance of patents to us in foreign countries by initiating opposition proceedings. Opposition proceedings against any of our patent filings in a foreign country could have an adverse effect on our corresponding patents that are issued or pending in the United States. It may be necessary or useful for us to participate in proceedings to determine the validity of our patents or our competitors’ patents that have been issued in countries other than the U.S. This could result in substantial costs, divert our efforts and attention from other aspects of our business, and could have a material adverse effect on our results of operations and financial condition. We currently have pending patent applications in Europe, Australia, Japan, Canada, China, Korea, and Singapore, among others.
We and Olympus-Cytori, Inc. are subject to FDA regulation
As newly developed medical devices, the Celution® System family of products must receive regulatory clearances or approvals from the FDA and, in many instances, from non-U.S. and state governments prior to their sale. The Celution® System family of products is subject to stringent government regulation in the United States by the FDA under the Federal Food, Drug and Cosmetic Act. The FDA regulates the design/development process, clinical testing, manufacture, safety, labeling, sale, distribution, and promotion of medical devices and drugs. Included among these regulations are pre-market clearance and pre-market approval requirements, design control requirements, and the Quality System Regulations/Good Manufacturing Practices. Other statutory and regulatory requirements govern, among other things, establishment registration and inspection, medical device listing, prohibitions against misbranding and adulteration, labeling and post-market reporting.
17
The regulatory process can be lengthy, expensive, and uncertain. Before any new medical device may be introduced to the U.S. market, the manufacturer generally must obtain FDA clearance or approval through either the 510(k) pre-market notification process or the lengthier pre-market approval application, or PMA, process. It generally takes from three to 12 months from submission to obtain 510(k) pre-market clearance, although it may take longer. Approval of a PMA could take four or more years from the time the process is initiated. The 510(k) and PMA processes can be expensive, uncertain, and lengthy, and there is no guarantee of ultimate clearance or approval. We expect that some of our future products under development as well as Olympus-Cytori’s will be subject to the lengthier PMA process. Securing FDA clearances and approvals may require the submission of extensive clinical data and supporting information to the FDA, and there can be no guarantee of ultimate clearance or approval. Failure to comply with applicable requirements can result in application integrity proceedings, fines, recalls or seizures of products, injunctions, civil penalties, total or partial suspensions of production, withdrawals of existing product approvals or clearances, refusals to approve or clear new applications or notifications, and criminal prosecution.
Medical devices are also subject to post-market reporting requirements for deaths or serious injuries when the device may have caused or contributed to the death or serious injury, and for certain device malfunctions that would be likely to cause or contribute to a death or serious injury if the malfunction were to recur. If safety or effectiveness problems occur after the product reaches the market, the FDA may take steps to prevent or limit further marketing of the product. Additionally, the FDA actively enforces regulations prohibiting marketing and promotion of devices for indications or uses that have not been cleared or approved by the FDA.
There can be no guarantee that we will be able to obtain the necessary 510(k) clearances or PMA approvals to market and manufacture our other products in the United States for their intended use on a timely basis, if at all. Delays in receipt of or failure to receive such clearances or approvals, the loss of previously received clearances or approvals, or failure to comply with existing or future regulatory requirements could have a substantial negative effect on our results of operations and financial condition.
To sell in international markets, we will be subject to regulation in foreign countries
In cooperation with our distribution partners, we intend to market our current and future products both domestically and in many foreign markets. A number of risks are inherent in international transactions. In order for us to market our products in Europe, Canada, Japan and certain other non-U.S. jurisdictions, we need to obtain and maintain required regulatory approvals or clearances and must comply with extensive regulations regarding safety, manufacturing processes and quality. For example, we still have not obtained regulatory approval for our Thin Film products in Japan. These regulations, including the requirements for approvals or clearances to market, may differ from the FDA regulatory scheme. International sales also may be limited or disrupted by political instability, price controls, trade restrictions and changes in tariffs. Additionally, fluctuations in currency exchange rates may adversely affect demand for our products by increasing the price of our products in the currency of the countries in which the products are sold.
There can be no assurance that we will obtain regulatory approvals or clearances in all of the countries where we intend to market our products, or that we will not incur significant costs in obtaining or maintaining foreign regulatory approvals or clearances, or that we will be able to successfully commercialize current or future products in various foreign markets. Delays in receipt of approvals or clearances to market our products in foreign countries, failure to receive such approvals or clearances or the future loss of previously received approvals or clearances could have a substantial negative effect on our results of operations and financial condition.
Changing, New and/or Emerging Government Regulations
Government regulations can change without notice. Given the fact that Cytori operates in various international markets, our access to such markets could change with little to no warning due to a change in government regulations that suddenly up-regulate our product(s) and create greater regulatory burden for our cell therapy and cell banking technology products.
Due to the fact that there are new and emerging cell therapy and cell banking regulations that have recently been drafted and/or implemented in various countries around the world, the application and subsequent implementation of these new and emerging regulations have little to no precedence. Therefore, the level of complexity and stringency is not known and may vary from country to country, creating greater uncertainty for the international regulatory process.
18
Anticipated or unanticipated changes in the way or manner in which the FDA regulates products or classes/groups of products can delay, further burden, or alleviate regulatory pathways that were once available to other products. There are no guarantees that such changes in FDA’s approach to the regulatory process will not deleteriously affect some or all of our products or product applications.
We do not know if the current FDA proposed changes to the 510(k) system will have any material effect on any of our current or future 510(k) applications.
Health Insurance Reimbursement Risks
New and emerging cell therapy and cell banking technologies, such as those provided by the Celution® System family of products, may have difficulty or encounter significant delays in obtaining health care reimbursement in some or all countries around the world due to the novelty of our cell therapy and cell banking technology and subsequent lack of existing reimbursement schemes / pathways. Therefore, the creation of new reimbursement pathways may be complex and lengthy with no assurances that such reimbursements will be successful. The lack of health insurance reimbursement or reduced or minimal reimbursement pricing may have a significant impact on our ability to successfully sell our cell therapy and cell banking technology product(s) into a county or region.
Concentration of Sales
We have a significant concentration of sales in Japan, the United States, and Europe given our early stage of commercialization. As a result of this regional concentration of sales, changes in the regulatory environment in these countries, or any other countries in which we have a significant concentration of sales, could adversely impact our sales. If the government of any of these countries significantly curtailed or prohibited the sale of our products, our revenues would be adversely affected.
Market Acceptance of New Technology
New and emerging cell therapy and cell banking technologies, such as those provided by the Celution® System family of products, may have difficulty or encounter significant delays in obtaining market acceptance in some or all countries around the world due to the novelty of our cell therapy and cell banking technologies. Therefore, the market adoption of our cell therapy and cell banking technologies may be slow and lengthy with no assurances that significant market adoption will be successful. The lack of market adoption or reduced or minimal market adoption of our cell therapy and cell banking technologies may have a significant impact on our ability to successfully sell our product(s) into a country or region.
We and/or the Joint Venture have to maintain quality assurance certification and manufacturing approvals
The manufacture of our Celution® System will be, and the manufacture of any future cell-related therapeutic products would be, subject to periodic inspection by regulatory authorities and distribution partners. The manufacture of devices and products for human use is subject to regulation and inspection from time to time by the FDA for compliance with the FDA’s Quality System Regulation, or QSR, requirements, as well as equivalent requirements and inspections by state and non-U.S. regulatory authorities. There can be no guarantee that the FDA or other authorities will not, during the course of an inspection of existing or new facilities, identify what they consider to be deficiencies in our compliance with QSRs or other requirements and request, or seek remedial action.
Failure to comply with such regulations or a potential delay in attaining compliance may adversely affect our manufacturing activities and could result in, among other things, injunctions, civil penalties, FDA refusal to grant pre-market approvals or clearances of future or pending product submissions, fines, recalls or seizures of products, total or partial suspensions of production, and criminal prosecution. There can be no assurance after such occurrences that we will be able to obtain additional necessary regulatory approvals or clearances on a timely basis, if at all. Delays in receipt of or failure to receive such approvals or clearances, or the loss of previously received approvals or clearances could have a substantial negative effect on our results of operations and financial condition.
We depend on a few key officers
Our performance is substantially dependent on the performance of our executive officers and other key scientific and sales staff, including Christopher J. Calhoun, our Chief Executive Officer, and Marc Hedrick, MD, our President. We rely upon them for strategic business decisions and guidance. We believe that our future success in developing marketable products and achieving a competitive position will depend in large part upon whether we can attract and retain additional qualified management and scientific personnel. Competition for such personnel is intense, and there can be no assurance that we will be able to continue to attract and retain such personnel. The loss of the services of one or more of our executive officers or key scientific staff or the inability to attract and retain additional personnel and develop expertise as needed could have a substantial negative effect on our results of operations and financial condition.
19
We may not have enough product liability insurance
The testing, manufacturing, marketing, and sale of our regenerative cell products involve an inherent risk that product liability claims will be asserted against us, our distribution partners, or licensees. There can be no guarantee that our clinical trial and commercial product liability insurance is adequate or will continue to be available in sufficient amounts or at an acceptable cost, if at all. A product liability claim, product recall, or other claim, as well as any claims for uninsured liabilities or in excess of insured liabilities, could have a substantial negative effect on our results of operations and financial condition. Also, well-publicized claims could cause our stock to fall sharply, even before the merits of the claims are decided by a court.
Our charter documents contain anti-takeover provisions and we have adopted a Stockholder Rights Plan to prevent hostile takeovers
Our Amended and Restated Certificate of Incorporation and Bylaws contain certain provisions that could prevent or delay the acquisition of Cytori by means of a tender offer, proxy contest, or otherwise. They could discourage a third party from attempting to acquire control of Cytori, even if such events would be beneficial to the interests of our stockholders. Such provisions may have the effect of delaying, deferring, or preventing a change of control of Cytori and consequently could adversely affect the market price of our shares. Also, in 2003 we adopted a Stockholder Rights Plan of the kind often referred to as a poison pill. The purpose of the Stockholder Rights Plan is to prevent coercive takeover tactics that may otherwise be utilized in takeover attempts. The existence of such a rights plan may also prevent or delay a change in control of Cytori, and this prevention or delay adversely affect the market price of our shares.
We pay no dividends
We have never paid cash dividends in the past, and currently do not intend to pay any cash dividends in the foreseeable future.
Item 1B. Unresolved Staff Comments
Not applicable.
Item 2. Properties
We currently lease 60,118 square feet at 3020 and 3030 Callan Road, San Diego, California. The related lease agreement bears monthly rent at a rate of $1.75 per square foot, with annual increase of $0.05 per square foot. The lease term is 64 months, commencing on July 1, 2010 and expiring on October 31, 2015. In connection with this lease, we received a four month rent abatement period and an allowance for leasehold improvements of approximately $300,000. Additionally, we’ve entered into several lease agreements for international office locations and corporate housing for our employees on international assignments. For these properties, we pay an aggregate of approximately $155,000 in rent per month.
Item 3. Legal Proceedings
From time to time, we have been involved in routine litigation incidental to the conduct of our business. As of December 31, 2010, we were not a party to any material legal proceeding.
Item 4. (Reserved)
20
PART II
Item 5. Market for Registrant’s Common Equity, Related Stockholder Matters and Issuer Purchases of Equity Securities
Market Prices
From August 2000 (our initial public offering in Germany) through September 2007 our common stock was quoted on the Frankfurt Stock Exchange under the symbol “XMPA” (formerly XMP). In September 2007 our stock closed trading on the Frankfurt Stock Exchange. Effective December 19, 2005, our common stock began trading on the Nasdaq Capital Market under the symbol “CYTX,” and has since transferred to the Nasdaq Global Market effective February 14, 2006. Warrants, issued as part of a financing agreement in March 2009, began trading on the Nasdaq Global Market under the symbol “CYTXW” effective June 22, 2009. The following tables show the high and low sales prices for our common stock and warrants for the periods indicated, as reported by the Nasdaq Stock Market. These prices do not include retail markups, markdowns or commissions.
Common Stock
|
High
|
Low
|
||||||
|
2009
|
|||||||
|
Quarter ended March 31, 2009
|
$
|
5.14
|
$
|
1.68
|
|||
|
Quarter ended June 30, 2009
|
$
|
4.80
|
$
|
1.42
|
|||
|
Quarter ended September 30, 2009
|
$
|
4.32
|
$
|
2.93
|
|||
|
Quarter ended December 31, 2009
|
$
|
6.65
|
$
|
3.08
|
|||
|
2010
|
|||||||
|
Quarter ended March 31, 2010
|
$
|
9.50
|
$
|
4.40
|
|||
|
Quarter ended June 30, 2010
|
$
|
6.12
|
$
|
3.42
|
|||
|
Quarter ended September 30, 2010
|
$
|
5.43
|
$
|
3.15
|
|||
|
Quarter ended December 31, 2010
|
$
|
6.15
|
$
|
4.07
|
All of our outstanding shares have been deposited with DTCC since December 9, 2005.
Warrants
|
High
|
Low
|
||||||
|
2009
|
|||||||
|
Quarter ended June 30, 2009
|
$
|
2.00
|
$
|
1.60
|
|||
|
Quarter ended September 30, 2009
|
$
|
2.37
|
$
|
1.40
|
|||
|
Quarter ended December 31, 2009
|
$
|
4.50
|
$
|
1.74
|
|||
|
2010
|
|||||||
|
Quarter ended March 31, 2010
|
$
|
6.90
|
$
|
2.62
|
|||
|
Quarter ended June 30, 2010
|
$
|
4.70
|
$
|
1.94
|
|||
|
Quarter ended September 30, 2010
|
$
|
3.64
|
$
|
2.05
|
|||
|
Quarter ended December 31, 2010
|
$
|
4.19
|
$
|
2.99
|
As of February 28, 2011, we had approximately twenty seven record holders of our common stock and three record holders of our warrants. Because many of our shares and warrants are held by brokers and other institutions on behalf of stockholders and warrantholders, we are unable to estimate the total number of individual stockholders and warrantholders represented by these record holders.
Dividends
We have never declared or paid any dividends and do not anticipate paying any in the foreseeable future.
21
Equity Compensation Plan Information
|
Plan Category
|
Number of securities to be issued
upon exercise of outstanding
options, warrants and rights
|
Weighted-average exercise price
of outstanding options, warrants
and rights
|
Number of securities remaining
available for future issuance under equity compensation
plans (excluding securities reflected in column(a))
|
|||||
|
(a)
|
(b)
|
(c)
|
||||||
|
Equity compensation plans approved by security holders (1)
|
2,766,271
|
$
|
4.64
|
—
|
||||
|
Equity compensation plans not approved by security holders (2)
|
4,324,687
|
$
|
5.50
|
1,305,400
|
||||
|
Total
|
7,090,958
|
$
|
5.16
|
1,305,400
|
||||
________________________________________
|
|
(1)
|
The 1997 Stock Option and Stock Purchase Plan expired on October 22, 2007.
|
|
|
(2)
|
The maximum number of shares shall be cumulatively increased on the first January 1 after the Effective Date, August 24, 2004, and each January 1 thereafter for 9 more years, by a number of shares equal to the lesser of (a) 2% of the number of shares issued and outstanding on the immediately preceding December 31, and (b) a number of shares set by the Board.
|
Comparative Stock Performance Graph
The following graph shows how an initial investment of $100 in our common stock would have compared to an equal investment in the Nasdaq Composite Index and the NASDAQ Biotechnology Index during the period from December 31, 2005 through December 31, 2010. The performance shown is not necessarily indicative of future price performance.
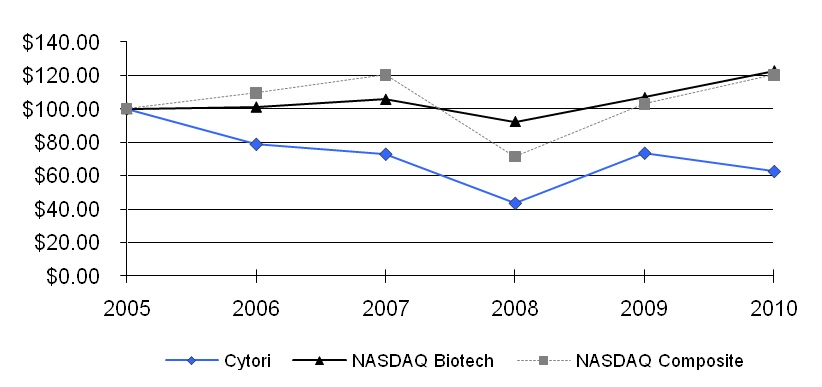
Item 6. Selected Financial Data
The selected data presented below under the captions “Statements of Operations Data,” “Statements of Cash Flows Data” and “Balance Sheet Data” for, and as of the end of, each of the years in the five-year period ended December 31, 2010, are derived from, and should be read in conjunction with, our audited consolidated financial statements. The consolidated balance sheets as of December 31, 2010 and 2009, and the related consolidated statements of operations and comprehensive loss, stockholders’ equity (deficit), and cash flows for each of the years in the three-year period ended December 31, 2010, which have been audited by KPMG LLP, an independent registered public accounting firm, and their report thereon, are included elsewhere in this annual report. The consolidated balance sheets as of December 31, 2008, 2007 and 2006, and the related consolidated statements of operations and comprehensive loss, stockholders’ equity (deficit), and cash flows for the years ended December 31, 2007 and 2006, which were also audited by KPMG LLP, are included with our annual reports previously filed.
22
The information contained in this table should also be read in conjunction with “Management’s Discussion and Analysis of Financial Condition and Results of Operations” and the financial statements and related notes thereto included elsewhere in this report (in thousands except share and per share data):
|
2010
|
2009
|
2008
|
2007
|
2006
|
||||||||||||||||
|
Statements of Operations Data:
|
||||||||||||||||||||
|
Product revenues:
|
||||||||||||||||||||
|
Sales to related party
|
$ | 590 | $ | 591 | $ | 28 | $ | 792 | $ | 1,451 | ||||||||||
|
Sales to third parties
|
7,664 | 5,246 | 4,500 | — | — | |||||||||||||||
| 8,254 | 5,837 | 4,528 | 792 | 1,451 | ||||||||||||||||
|
Cost of product revenues
|
3,908 | 3,394 | 1,854 | 422 | 1,634 | |||||||||||||||
|
Gross profit (loss)
|
4,346 | 2,443 | 2,674 | 370 | (183 | ) | ||||||||||||||
|
Development revenues:
|
||||||||||||||||||||
|
Development, related party
|
2,122 | 8,840 | 774 | 5,158 | 6,057 | |||||||||||||||
|
Other, related party
|
— | — | 1,500 | — | — | |||||||||||||||
|
Research grants and other
|
251 | 53 | 51 | 99 | 419 | |||||||||||||||
| 2,373 | 8,893 | 2,325 | 5,257 | 6,476 | ||||||||||||||||
|
Operating expenses:
|
||||||||||||||||||||
|
Research and development
|
9,687 | 12,231 | 17,371 | 20,020 | 21,977 | |||||||||||||||
|
Sales and marketing
|
11,040 | 6,583 | 4,602 | 2,673 | 2,055 | |||||||||||||||
|
General and administrative
|
12,570 | 10,415 | 11,727 | 14,184 | 12,547 | |||||||||||||||
|
Change in fair value of warrants
|
(1,285 | ) | 4,574 | — | — | — | ||||||||||||||
|
Change in fair value of option liabilities
|
30 | (920 | ) | 1,060 | 100 | (4,431 | ) | |||||||||||||
|
Total operating expenses
|
32,042 | 32,883 | 34,760 | 36,977 | 32,148 | |||||||||||||||
|
Total operating loss
|
(25,323 | ) | (21,547 | ) | (29,761 | ) | (31,350 | ) | (25,855 | ) | ||||||||||
|
Other income (expense):
|
||||||||||||||||||||
|
Gain on sale of assets
|
— | — | — | 1,858 | — | |||||||||||||||
|
Interest income
|
9 | 20 | 230 | 1,028 | 708 | |||||||||||||||
|
Interest expense
|
(2,052 | ) | (1,427 | ) | (420 | ) | (155 | ) | (199 | ) | ||||||||||
|
Other income (expense), net
|
23 | (218 | ) | (40 | ) | (46 | ) | (27 | ) | |||||||||||
|
Equity loss in investments
|
(151 | ) | (44 | ) | (45 | ) | (7 | ) | (74 | ) | ||||||||||
|
Net loss
|
$ | (27,494 | ) | $ | (23,216 | ) | $ | (30,036 | ) | $ | (28,672 | ) | $ | (25,447 | ) | |||||
|
Basic and diluted net loss per share
|
$ | (0.60 | ) | $ | (0.65 | ) | $ | (1.12 | ) | $ | (1.25 | ) | $ | (1.53 | ) | |||||
|
Basic and diluted weighted average common shares
|
45,947,966 | 35,939,260 | 26,882,431 | 22,889,250 | 16,603,550 | |||||||||||||||
|
Statements of Cash Flows Data:
|
||||||||||||||||||||
|
Net cash used in operating activities
|
$ | (23,574 | ) | $ | (23,807 | ) | $ | (33,389 | ) | $ | (29,995 | ) | $ | (16,483 | ) | |||||
|
Net cash provided by (used in) investing activities
|
(1,290 | ) | (221 | ) | (393 | ) | 5,982 | 591 | ||||||||||||
|
Net cash provided by financing activities
|
64,678 | 24,271 | 34,928 | 26,576 | 16,787 | |||||||||||||||
|
Net increase in cash
|
39,814 | 243 | 1,146 | 2,563 | 895 | |||||||||||||||
|
Cash and cash equivalents at beginning of year
|
12,854 | 12,611 | 11,465 | 8,902 | 8,007 | |||||||||||||||
|
Cash and cash equivalents at end of year
|
$ | 52,668 | $ | 12,854 | $ | 12,611 | $ | 11,465 | $ | 8,902 | ||||||||||
|
Balance Sheet Data:
|
||||||||||||||||||||
|
Cash, cash equivalents and short-term investments
|
$ | 52,668 | $ | 12,854 | $ | 12,611 | $ | 11,465 | $ | 12,878 | ||||||||||
|
Working capital
|
45,730 | 9,915 | 10,090 | 4,168 | 7,392 | |||||||||||||||
|
Total assets
|
66,347 | 24,749 | 25,609 | 21,507 | 24,868 | |||||||||||||||
|
Deferred revenues, related party
|
5,512 | 7,634 | 16,474 | 18,748 | 23,906 | |||||||||||||||
|
Deferred revenues
|
4,929 | 2,388 | 2,445 | 2,379 | 2,389 | |||||||||||||||
|
Warrant liabilities
|
4,987 | 6,272 | — | — | — | |||||||||||||||
|
Option liabilities
|
1,170 | 1,140 | 2,060 | 1,000 | 900 | |||||||||||||||
|
Long-term deferred rent
|
398 | — | 168 | 473 | 741 | |||||||||||||||
|
Long-term obligations, less current portion
|
13,255 | 2,790 | 5,044 | 237 | 1,159 | |||||||||||||||
|
Total stockholders’ equity (deficit)
|
$ | 22,873 | $ | (3,658 | ) | $ | (7,717 | ) | $ | (9,400 | ) | $ | (10,813 | ) | ||||||
23
Item 7. Management’s Discussion and Analysis of Financial Condition and Results of Operations
CAUTIONARY STATEMENT REGARDING FORWARD-LOOKING STATEMENTS
This report contains certain statements that may be deemed “forward-looking statements” within the meaning of U.S. securities laws. All statements, other than statements of historical fact, that address activities, events or developments that we intend, expect, project, believe or anticipate and similar expressions or future conditional verbs such a will, should, would, could or may occur in the future are forward-looking statements. Such statements are based upon certain assumptions and assessments made by our management in light of their experience and their perception of historical trends, current conditions, expected future developments and other factors they believe to be appropriate.
These statements include, without limitation, statements about our anticipated expenditures, including those related to clinical research studies, and general and administrative expenses; the potential size of the market for our products, future development and/or expansion of our products and therapies in our markets, ability to generate product revenues or effectively manage our gross profit margins; our ability to obtain regulatory clearance; expectations as to our future performance; the “Liquidity and Capital Resources” section of this report, including our need for additional financing and the availability thereof; and the potential enhancement of our cash position through development, marketing, and licensing arrangements. Our actual results will likely differ, perhaps materially, from those anticipated in these forward-looking statements as a result of various factors, including: our need and ability to raise additional cash, our joint ventures, risks associated with laws or regulatory requirements applicable to us, market conditions, product performance, unforeseen litigation, and competition within the regenerative medicine field, to name a few. The forward-looking statements included in this report are subject to a number of additional material risks and uncertainties, including but not limited to the risks described in our filings with the Securities and Exchange Commission and under the “Risk Factors” section in Part I above.
We encourage you to read our Risk Factors descriptions carefully. We caution you not to place undue reliance on the forward-looking statements contained in this report. These statements, like all statements in this report, speak only as of the date of this report (unless an earlier date is indicated) and we undertake no obligation to update or revise the statements except as required by law. Such forward-looking statements are not guarantees of future performance and actual results will likely differ, perhaps materially, from those suggested by such forward-looking statements.
Overview
Cytori develops, manufactures, and commercializes innovative medical devices, which enable physicians to practice regenerative medicine worldwide. Cytori’s core device provides real-time access to patients’ own stem and regenerative cells which reside naturally within their adipose (fat) tissue. These stem and regenerative cells may help to improve blood flow in damaged or diseased tissues and therefore can potentially be used to treat multiple conditions resulting from a lack of blood supply (ischemia). Cytori has three key product lines: the Celution® family, which includes the first and only broadly available device that provides clinical grade adipose derived autologous stem and regenerative cells for re-injection into the patient at the point of care, the PureGraft™ family for optimized preparation of autologous fat grafts, and the StemSource® family for use in laboratory research and stem cell banking.
Our business is based on the sale of our medical devices and laboratory equipment, the generation of recurring revenue thereafter from the sale of single-use consumables used in every procedure, and sales of related instrumentation and ancillary products. Cytori’s near term strategy is to focus first on development and sales of our approved products into the cosmetic and reconstructive surgery (CRS) market and the cell banking market, which we believe can be successfully penetrated more quickly than our other target markets. The market opportunity for cosmetic and reconstructive surgery alone is over $2 billion worldwide. In addition to our near term growth drivers, we are also working toward Celution® System claims for cardiovascular disease applications through ongoing and planned European clinical trials. Cardiovascular disease is a multi-billion dollar worldwide market. Other potential market opportunities for our technology include stress urinary incontinence, wound healing, burns, liver disease, renal failure, pelvic health conditions and gastrointestinal disorders. Our customers at academic hospitals are identifying and developing new applications for the Celution® output. Applications initially developed by our customers represent a broad catalog from which Cytori can draw upon to incorporate into their own pipeline. The more therapeutic applications that are developed for the Celution® System and its cellular output, the more opportunities we will have to offer the Celution® System and related consumable sets to hospitals, clinics, and physicians.
Our current commercial activities are primarily focused on market development and sales of our Celution® and PureGraft™ Systems into the cosmetic and reconstructive surgery markets around the world. With the expanded CE Mark claims for the Celution® System to include breast reconstruction, repair of soft tissue defects, augmentation procedures and as well as Crohn’s wound healing in July 2010, we have shifted our sales efforts to focus more on hospitals for cell-enriched breast reconstruction and Crohn’s wound applications in Europe and less on private, cosmetic clinics, while also supporting the company’s efforts to gain treatment reimbursement. Adoption of cell-enriched breast reconstruction has been strengthened by interim results from our RESTORE 2 trial for partial mastectomy defect reconstruction reported in May 2009 and June 2010. Final results from this trial are expected to be reported in the first half of 2011.
24
Also, in July 2010, we received the CE Mark for the PureGraft™ 250/PURE System for autologous fat transfers. The PureGraft™ System is designed to facilitate and streamline the fat graft preparation process, washing and filtering the tissue to remove contaminants and is sold in Europe as both a standalone product for cosmetic procedures and as a complement to Cytori’s Celution® System in Europe for reconstructive procedures. Having both PureGraft™ and Celution® approved in Europe allows Cytori to offer a broader portfolio of products to plastic and cosmetic surgeons and expand our market opportunity. In addition, the PureGraft™ System offers a lower cost entry point for customers to whom we could potentially up-sell a Celution® System.
In the United States, we are currently focused on expanding our autologous fat grafting business with the sale of the PureGraft™ System and related products. Fat grafting procedures have seen an upsurge in popularity in recent years. PureGraft™ is positioned to be a leader as the market makes the conscious shift from artificial to natural procedures. With 510(k) clearance of PureGraft™ in January 2010 and the formal product launch in April, we have built an initial regional physician customer base and are working to expand acceptance of the technology in the United States. In addition to expanding our U.S. sales team in 2010, we have put an increased focus on our consumer marketing for both reconstructive and cosmetic procedures through practice development activities designed to educate doctors about our technology. By working with our customers to fully integrate Cytori technology into their practices, we are providing a valuable service and further distinguishing our brand.
In addition to our commercial activities in Europe and the United States where we are focused primarily on reconstructive and cosmetic surgery, we are also pursuing commercialization strategies for the Celution® System into Japan and other Asia-Pacific markets, with limited sales into the translational medicine markets. In 2010, we laid the foundation for an emerging market commercialization strategy. To this end, we established an office in Mumbai, India and have begun building key relationships in these regions. In 2011, our emerging market strategic activities will focus on India, Brazil, Argentina, Australia, Kuala Lumpur, New Zealand and Thailand with the goal of establishing a Celution® presence in the growing regenerative medicine market.
We anticipate that the StemSource® cell banking business will continue to contribute to product sales in 2011, but we expect sales to further ramp once a greater number of therapeutic applications are available. With the tissue banking capabilities introduced in 2010, we believe that an increasing number of cell bank orders will be from cosmetic and reconstructive surgery clinics in regions where physicians are already performing elective liposuction. The StemSource®900/MB, is marketed as a standalone piece of laboratory research equipment and serves as the foundation of the StemSource® Cell Bank, both of which are offered worldwide to hospitals, tissue banks and other research centers. Once installed, commercialization activities are performed predominantly by our customers.
As we move forward in 2011, we will continue to seek regulatory and marketing approval of the Celution® System family of products in the United States as a medical device. We filed a 510(k) marketing application for use in aesthetic body contouring and/or filling of soft tissue voids with the FDA in November 2009. Our application was reviewed by the FDA's Center for Biologics Evaluation and Research as a medical device. In February 2010, we were informed by the FDA that we will be required to seek approval for the Celution® System for use in aesthetic body contouring and filling of soft tissue defect voids through the pre-market approval application (PMA) process. We are now working to determine the necessary size and scope of clinical studies to obtain this approval of Celution® and are exploring multiple additional avenues to bring Celution® to the United States.
We also intend to build upon the 2010 advancements made to our cardiovascular pipeline and to take the next step in potentially bringing these applications for the Celution® System to market. In 2010, we reported positive six month primary outcomes in both our safety and feasibility trials for acute heart attack (the APOLLO trial) and for chronic myocardial ischemia (the PRECISE trial) at the 7th International Symposium on Stem Cell Therapy & Cardiovascular Innovations in May and at the meeting of the American Heart Association (AHA) in November. Eighteen month data was reported from the PRECISE study also at the AHA meeting. We are looking to leverage data from the PRECISE study for future regulatory applications. In addition, we are currently in the process of initiating our ADVANCE trial for acute heart attack patients. The ADVANCE trial will be a randomized, double-blind, placebo-controlled European approval trial that is expected to range in size from 259 to 360 patients. The trial will utilize the next generation Celution® One System. In January 2011, Cytori received approval to initiate the trial in the Netherlands. We expect to continue to initiate up to 35 trial sites, predominantly in Europe, through the first half of 2011.
25
Our strategy for the future, with a new product that has multiple potential applications, is to focus the majority of our financial resources on activities that will promote immediate sales of the Celution®, StemSource®, and PureGraft™ products, through investment in sales and marketing activities. Other key drivers for the future include the planning and initiation of a cardiac pivotal trial, which we believe will increase the long term prospects for the company, the introduction of Celution® One and the continued development and innovation of our technology. We can effectively manage our investment in these initiatives with our current cash position, but we may need to raise additional funds to further broaden our investment in our other pipeline products.
Olympus Partnership
On November 4, 2005, we entered into a strategic development and manufacturing joint venture agreement and other related agreements with Olympus. As part of the terms of these agreements, we formed a joint venture, Olympus-Cytori, Inc. (Joint Venture), to develop and manufacture future generation devices based on our Celution® System platform.
Under the Joint Venture Agreements:
|
·
|
Olympus paid $30,000,000 for its 50% interest in the Joint Venture. Moreover, Olympus simultaneously entered into a License/Joint Development Agreement with the Joint Venture and us to develop a second generation commercial system and manufacturing capabilities.
|
|
·
|
We licensed our device technology, including the Celution® System platform and certain related intellectual property, to the Joint Venture for use in future generation devices. These devices will process and purify adult stem and regenerative cells residing in adipose (fat) tissue for various therapeutic clinical applications. In exchange for this license, we received a 50% interest in the Joint Venture, as well as an initial $11,000,000 payment from the Joint Venture; the source of this payment was the $30,000,000 contributed to the Joint Venture by Olympus. Moreover, upon receipt of a CE mark for the first generation Celution® System platform in January 2006, we received an additional $11,000,000 development milestone payment from the Joint Venture.
|
Put/Calls and Guarantees
The Shareholders’ Agreement between Cytori and Olympus provides that in certain specified circumstances of insolvency or if we experience a change in control, Olympus will have the rights to (i) repurchase our interests in the Joint Venture at the fair value of such interests or (ii) sell its own interests in the Joint Venture to Cytori at the higher of (a) $22,000,000 or (b) the Put’s fair value.
As of December 31, 2010, the fair value of the Put was $1,170,000. Fluctuations in the estimated Put value are recorded in the statements of operations as a component of Change in fair value of option liabilities. The estimated fair value of the Put has been recorded as a long-term liability on the balance sheet in the option liability caption.
The Put has no expiration date. Accordingly, we will continue to recognize a liability for the Put and mark it to market each quarter until it is exercised or until the arrangements with Olympus are amended.
The Joint Venture currently has exclusive access to our Celution® System device technology for the development, manufacture, and supply of such systems to us. Once a second generation Celution® System is developed and approved by regulatory agencies, the Joint Venture will exclusively supply us with these systems at a formula-based transfer price. We have retained all marketing rights (subject to our various distribution agreements) to sell the Celution® System devices for all therapeutic applications of adipose stem and regenerative cells.
We have worked closely with Olympus’ team of scientists and engineers to design the future generations of the Celution® System so that it will contain certain product enhancements and that can be manufactured in a streamlined manner.
In August 2007, we entered into a License and Royalty Agreement with the Joint Venture which provides us the ability to commercially launch the Celution® System platform earlier than we could have otherwise done so under the terms of the Joint Venture Agreements. The Royalty Agreement allows us to manufacture the Cytori-developed Celution® System platform, including the Celution® 800/CRS, until such time as the Joint Venture’s products are commercially available for the same market served by the Cytori platform, subject to a reasonable royalty that will be payable to the Joint Venture for all such sales.
We account for our investment in the Joint Venture under the equity method of accounting.
26
Other Related Party Transactions
In a separate agreement entered into on February 23, 2006, we granted Olympus an exclusive right to negotiate a commercialization collaboration for the use of adipose stem and regenerative cells for a specific therapeutic area outside of cardiovascular disease. In exchange for this right, we received a $1,500,000 payment from Olympus. As part of this agreement, Olympus could conduct market research and pilot clinical studies in collaboration with us for the therapeutic area up to December 31, 2008 when this exclusive right expired. Accordingly, on December 31, 2008, we recognized $1,500,000 as other development revenue and reduced our deferred revenues, related party balance for the same amount.
On February 8, 2008, we agreed to sell 2,000,000 shares of unregistered common stock to Green Hospital Supply, Inc. for $12,000,000 cash, or $6.00 per share, in a private stock placement. On February 29, 2008, we closed the first half of the private placement with Green Hospital Supply, Inc. and received $6,000,000. We closed the second half of the private placement on April 30, 2008 and received the second payment of $6,000,000.
In August 2008, we received an additional $6,000,000 from Olympus in a private placement of 1,000,000 unregistered shares of our common stock and a warrant to purchase an additional 500,000 shares of our common stock at an original exercise price of $8.50 per share. The purchase price was $6.00 per unit (with each unit consisting of one share and 50% warrant coverage). The warrant is exercisable anytime after February 11, 2009 and will expire on August 11, 2013.
Thin Film Japan Distribution Agreement
In 2004, we sold the majority of our Thin Film business to MAST Biosurgery AG (MAST). We retained all rights to Thin Film business in Japan (subject to a purchase option of MAST, which expired in May 2007), and we received back from MAST a license of all rights to Thin Film technologies in the spinal field, exclusive at least until 2012, and the field of regenerative medicine, non-exclusive on a perpetual basis.
In the third quarter of 2004, we entered into a Distribution Agreement with Senko Medical Trading Company (Senko). Under this agreement, we granted to Senko an exclusive license to sell and distribute certain Thin Film products in Japan. Specifically, the license covers Thin Film products with the following indications: anti-adhesion; soft tissue support; and minimization of the attachment of soft tissues. The Distribution Agreement with Senko commences upon “commercialization.” Commercialization will occur when one or more Thin Film product registrations are completed with the Japanese Ministry of Health, Labour and Welfare, or MHLW. Following commercialization, the Distribution Agreement has a duration of five years and is renewable for an additional five years after reaching mutually agreed minimum purchase guarantees.
We received a $1,500,000 upfront license fee from Senko. We have recorded the $1,500,000 received as a component of deferred revenues in the accompanying consolidated balance sheet. Half of the license fee is refundable if the parties agree commercialization is not achievable and a proportional amount is refundable if we terminate the arrangement, other than for material breach by Senko, before three years post-commercialization.
Under the Distribution Agreement, we will also be entitled to earn additional payments from Senko based on achieving defined milestones. On September 28, 2004, we notified Senko of completion of the initial regulatory application to the MHLW for the Thin Film product. As a result, we became entitled to a nonrefundable payment of $1,250,000, which we received in October 2004 and recorded as a component of deferred revenues. We did not recognize any development revenues with respect to Senko during each of the years ended December 31, 2010, 2009 and 2008. To date we have recognized a total of $371,000 in development revenues (all of which was recognized prior to 2008) related to this agreement.
27
Results of Operations
Product revenues
Product revenues consisted of revenues from our Celution® and PureGraft™ Systems and StemSource® Cell Banks.
The following table summarizes the components for the years ended December 31, 2010, 2009, and 2008:
|
Years ended
|
||||||||||||
|
2010
|
2009
|
2008
|
||||||||||
|
Related party
|
$ | 590,000 | $ | 591,000 | $ | 28,000 | ||||||
|
Third party
|
7,664,000 | 5,246,000 | 4,500,000 | |||||||||
|
Total product revenues
|
$ | 8,254,000 | $ | 5,837,000 | $ | 4,528,000 | ||||||
|
% attributable to Olympus
|
0.1 | % | — | 0.6 | % | |||||||
|
% attributable to Green Hospital Supply
|
7.1 | % | 10.1 | % | — | |||||||
Beginning in March of 2008, we began sales and shipments of our Celution® 800/CRS System to the European and Asia-Pacific reconstructive surgery markets and during 2010 we began sales of our PureGraft™ System in the United States and Europe. Assuming all other applicable revenue recognition criteria have been met, revenue for these product sales is recognized upon delivery to the customer, as all risks and rewards of ownership have been substantively transferred to the customer at that point. For product sales to customers who arrange for and manage all aspects of the shipping process, we recognize revenue upon shipment from our facilities. For product sales that include a combination of equipment, services, or other multiple deliverables that will be provided in the future, we defer an estimate of the fair value of those future deliverables from product revenue until such deliverables have been provided or earned. Shipping and handling costs that are billed to our customers are classified as revenue.
The future: We expect to continue to generate product revenues from Celution® 800/CRS and consumable sales in Europe and we expect to continue to generate product revenues from StemSource® Cell Bank sales and Celution® System translational medical sales in Japan through direct sales and through our distribution partner Green Hospital Supply, from StemSource® banking and research products in the United States and elsewhere through direct sales and through our distribution partner GE Healthcare, and we also expect to generate PureGraft™ System sales in the US and Europe. Additionally, we expect to have Thin Film product revenues, pending regulatory approval, when commercialization of the Thin Film products in Japan occurs and we begin Thin Film shipments to Senko.
Cost of product revenues
Cost of product revenues relate primarily to Celution® and PureGraft™ System products and StemSource® Cell Banks and includes material, manufacturing labor, and overhead costs. The following table summarizes the components of our cost of revenues for the years ended December 31, 2010, 2009 and 2008:
|
Years ended
|
||||||||||||
|
2010
|
2009
|
2008
|
||||||||||
|
Cost of product revenues
|
$ | 3,852,000 | $ | 3,340,000 | $ | 1,811,000 | ||||||
|
Share-based compensation
|
56,000 | 54,000 | 43,000 | |||||||||
|
Total cost of product revenues
|
$ | 3,908,000 | $ | 3,394,000 | $ | 1,854,000 | ||||||
|
Total cost of product revenues as % of product revenues
|
47.3 | % | 58.1 | % | 40.9 | % | ||||||
Cost of product revenues as a percentage of product revenues was 47.3%, 58.1% and 40.9% for the years ended December 31, 2010, 2009 and 2008, respectively. Fluctuation in this percentage is to be expected due to the product mix as well as mix of distributor and direct sales comprising the revenue for the period. For the year ended December 31, 2008, cost of sales included an economic benefit of approximately $347,000 related to material cost and labor/overhead previously expensed as research and development prior to commercialization date of March 1, 2008 that was sold during the year ended December 31, 2008.
The future. We expect to continue to see variation in our gross profit margin as the product mix comprising revenues fluctuates. Additionally, we expect to incur costs related to our MacroPore products if and when commercialization is achieved for our Japan Thin Film product line.
28
Development revenues
The following table summarizes the components of our development revenues for the years ended December 31, 2010, 2009 and 2008:
|
Years ended
|
||||||||||||
|
2010
|
2009
|
2008
|
||||||||||
|
Milestone revenue (Olympus)
|
$ | 2,122,000 | $ | 8,840,000 | $ | 774,000 | ||||||
|
Other revenue (Olympus)
|
— | — | 1,500,000 | |||||||||
|
Research grant (NIH)
|
— | 49,000 | — | |||||||||
|
Grant Revenue
|
244,000 | — | — | |||||||||
|
Regenerative cell storage services
|
4,000 | 4,000 | 4,000 | |||||||||
|
Other
|
3,000 | — | 47,000 | |||||||||
|
Total development revenues
|
$ | 2,373,000 | $ | 8,893,000 | $ | 2,325,000 | ||||||
We recognize deferred revenues, related party, as development revenue when certain performance obligations are met (i.e., using a proportional performance approach). During the year ended December 31, 2010, we recognized $2,122,000 of revenue associated with our arrangements with Olympus as a result of achieving one product development milestone as well as a clinical milestone related to the assessment of trial outcomes at 6 months in one of our cardiac trials. During the year ended December 31, 2009, we recognized $8,840,000 of revenue associated with our arrangement with Olympus as a result of achieving three clinical milestones during the year. The clinical milestones reflect the achievement of the primary goals of safety and feasibility, the completion of the enrollment process for both of our clinical cardiac trials, and completion of a monitoring end point for one cardiac trial. During the year ended December 31, 2008, we recognized $774,000 of revenue associated with our arrangements with Olympus as a result of completing two study milestones.
During the year ended December 31, 2008, we recognized $1,500,000 of other development revenue that relates to the agreement we entered into on February 23, 2006, in which we granted Olympus an exclusive right to negotiate a commercialization collaboration for the use of adipose stem and regenerative cells for a specific therapeutic area outside of cardiovascular disease. In exchange for this right, we received a $1,500,000 payment from Olympus. As part of this agreement, Olympus could conduct market research and pilot clinical studies in collaboration with us for the therapeutic area up to December 31, 2008 when this exclusive right expired. Accordingly, on December 31, 2008, we recognized $1,500,000 as other development revenue and reduced our deferred, related party balance for the same amount.
The research grant revenue related to our agreement with the National Institutes of Health (NIH). Under this arrangement, the NIH reimbursed us for “qualifying expenditures” related to research on Adipose Tissue-Derived Cells for Vascular Cell Therapy. To receive funds under the grant arrangement, we were required to (i) demonstrate that we incurred “qualifying expenses,” as defined in the grant agreement between the NIH and us, (ii) maintain a system of controls, whereby we can accurately track and report all expenditures related solely to research on Adipose Tissue-Derived Cells for Vascular Cell Therapy, and (iii) file appropriate forms and follow appropriate protocols established by the NIH. During the year ended December 31, 2009, we incurred $49,000 in qualified expenditures. We recognized a total of $49,000 in revenues for the year ended December 31, 2009, which included allowable grant fees as well as cost reimbursements. There were no comparable revenues and expenditures for the year ended December 31, 2010.
During the year ended December 31, 2010, we received a $244,000 federal grant from the Internal Revenue Service as part of the Qualifying Therapeutic Discovery Program (“QTDP”). The QTDP, administered by the Department of Health and Human Services and the Department of the Treasury, was enacted to encourage biomedical research for projects that show the greatest potential to create and sustain high-quality, high-paying U.S. jobs and to advance U.S. competitiveness in life, biological and medical sciences. Through this program, eligible companies can elect to receive either a cash grant or a tax credit. We elected to receive a cash grant and the funds were received during late 2010.
29
The future. We may recognize additional development revenues during 2011, as the anticipated completion for the next phase of our Joint Venture and other Olympus product development performance obligations is in 2011. If we are successful in completing these activities, we may recognize approximately $1,500,000 in development revenues during 2011. The exact timing of when amounts will be reported in revenue will depend on internal factors (for instance, our ability to complete certain contributions and obligations that we have agreed to perform) as well as external considerations, including obtaining certain regulatory clearances and/or approvals related to the Celution® System. The cash for these contributions and obligations was received when the agreement was signed and no further related cash payments will be made to us.
We will continue to recognize revenue from the Thin Film development work we are performing on behalf of Senko, based on the relative fair value of the milestones completed as compared to the total efforts expected to be necessary to obtain regulatory clearance from the MHLW. We are still awaiting regulatory clearance from the MHLW in order for initial commercialization to occur. Accordingly, we expect to recognize approximately $1,129,000 (consisting of $879,000 in deferred revenues plus a non-refundable payment of $250,000 to be received upon commercialization) in revenues associated with this milestone arrangement if and when regulatory approval is achieved. Moreover, we expect to recognize $500,000 per year associated with deferred Senko license fees over a three-year period following commercialization, if achieved, as the refund rights associated with the license payment expire.
Research and development expenses
Research and development expenses include costs associated with the design, development, testing and enhancement of our products, regulatory fees, the purchase of laboratory supplies, pre-clinical studies, and clinical studies. The following table summarizes the components of our research and development expenses for the years ended December 31, 2010, 2009 and 2008:
|
Years ended
|
||||||||||||
|
2010
|
2009
|
2008
|
||||||||||
|
Regenerative cell technology:
|
||||||||||||
|
Regenerative cell technology
|
$ | 7,012,000 | $ | 9,007,000 | $ | 14,324,000 | ||||||
|
Development milestone (Joint Venture)
|
2,221,000 | 2,713,000 | 2,546,000 | |||||||||
|
Research grants (NIH)
|
— | 49,000 | — | |||||||||
|
Stock-based compensation
|
454,000 | 462,000 | 501,000 | |||||||||
|
Total research and development expenses
|
$ | 9,687,000 | $ | 12,231,000 | $ | 17,371,000 | ||||||
Research and development expenses relate to the development of a technology platform that involves using adipose tissue as a source of autologous regenerative cells for therapeutic applications. These expenses, in conjunction with our continued development efforts related to our Celution® System, result primarily from the broad expansion of our research and development efforts enabled by the funding we received from Olympus in 2005 and 2006 and from other investors during the last few years.
The decrease in research and development expenses for the year ended December 31, 2010 as compared to the same period in 2009 is primarily due to the decrease in clinical and preclinical study expense of $967,000 and decrease in supplies related expense of $412,000 primarily due to the decreased research and development experiment supplies usage as well as supplies purchased for prototype work prior to the related product commercialization.
The decrease in research and development expenses for the year ended December 31, 2009 as compared to the same period in 2008 is primarily due a decrease in labor-related expenses, not including share-based compensation, of $2,336,000 for the year ended December 31, 2009 as compared to the same period in 2008 primarily due to the decrease in headcount for our research and development department as a result of a reduction in force implemented by the management at the end of the first quarter of 2009 and third quarter of 2008 in efforts to cut costs as well as achievement of commercialization and transfer of employees from research and development to the manufacturing department. Additionally, professional services expense decreased by $1,084,000 from 2008 to 2009, primarily due to decreased use of consultants and temporary labor during the year ended December 31, 2009. Expenses for supplies decreased by $817,000 from 2008 to 2009, primarily due to purchases of production supplies prior to the related product line commercialization, which occurred on March 1, 2008. These reductions were offset by an increase of $1,310,000 from 2008 to 2009 due primarily to increased clinical study activity and the associated expense.
30
Expenditures related to the Joint Venture with Olympus, which are included in the variation analysis above, include costs that are necessary to support the commercialization of future generation devices, including the next generation Celution® System. These development activities, which began in November 2005, include performing pre-clinical and clinical studies, seeking regulatory approval, and performing product development related to therapeutic applications for adipose stem and regenerative cells for multiple large markets.
The following table summarizes the components of our development milestone (Joint Venture) expenses for the years ended December 31, 2010, 2009 and 2008:
|
Years ended
|
||||||||||||
|
2010
|
2009
|
2008
|
||||||||||
|
Labor and related benefits
|
$ | 1,130,000 | $ | 834,000 | $ | 1,310,000 | ||||||
|
Consulting and other professional services
|
1,055,000 | 1,640,000 | 706,000 | |||||||||
|
Supplies
|
2,000 | 143,000 | 111,000 | |||||||||
|
Other miscellaneous
|
34,000 | 96,000 | 419,000 | |||||||||
|
Total development milestone (Joint Venture)
|
$ | 2,221,000 | $ | 2,713,000 | $ | 2,546,000 | ||||||
The future: We expect research and development expenditures to increase in 2011 as we are scheduled to begin enrollment in the ADVANCE cardiac trial in the first half of 2011.
Sales and marketing expenses
Sales and marketing expenses include costs of marketing personnel, tradeshows, physician training, and promotional activities and materials. The following table summarizes the components of our sales and marketing expenses for the years ended December 31, 2010, 2009 and 2008:
|
Years ended
|
||||||||||||
|
2010
|
2009
|
2008
|
||||||||||
|
Sales and marketing
|
$ | 10,177,000 | $ | 6,076,000 | $ | 4,241,000 | ||||||
|
Stock-based compensation
|
863,000 | 507,000 | 361,000 | |||||||||
|
Total sales and marketing
|
$ | 11,040,000 | $ | 6,583,000 | $ | 4,602,000 | ||||||
The increase in sales and marketing expense for the year ended December 31, 2010 as compared to the same period in 2009 was mainly attributed to the increase in salary and related benefits expense (excluding share-based compensation) of $2,050,000, an increase in travel related expenses of $526,000, increased promotional expenses of $503,000 and an increase in professional services of $373,000, which are due to our emphasis in seeking strategic alliances and/or co-development partners.
The increase in sales and marketing expense for the year ended December 31, 2009 as compared to the same period in 2008 was mainly attributed to the increase in salary and related benefits expense (excluding share-based compensation) of $1,215,000, and an increase in professional services of $245,000.
The future. We expect sales and marketing expenditures related to the regenerative cell technology to increase as we continue to expand our base of distribution partners, strategic alliances and co-development partners, as well as our direct marketing sales force for our Celution® System and StemSource® Cell Bank.
31
General and administrative expenses
General and administrative expenses include costs for administrative personnel, legal and other professional expenses and general corporate expenses. The following table summarizes the general and administrative expenses for the years ended December 31, 2010, 2009 and 2008:
|
Years ended
|
||||||||||||
|
2010
|
2009
|
2008
|
||||||||||
|
General and administrative
|
$ | 10,888,000 | $ | 8,789,000 | $ | 10,375,000 | ||||||
|
Stock-based compensation
|
1,682,000 | 1,626,000 | 1,352,000 | |||||||||
|
Total general and administrative expenses
|
$ | 12,570,000 | $ | 10,415,000 | $ | 11,727,000 | ||||||
For the year ended December 31, 2010 as compared to the same period in 2009, the increase in general and administrative expenses (excluding share-based compensation) occurred primarily due to an increase in salary and related benefits expense of $462,000 and an increase in professional services expense of $1,207,000.
For the year ended December 31, 2009 as compared to the same period in 2008, the decrease in general and administrative expenses (excluding share-based compensation) occurred primarily due to a decrease in professional services expense of $2,119,000 for the year ended December 31, 2009 as compared to the same periods in 2008, partially offset by an increase in bad debt expense of $541,000. The decreases resulted from management efforts to decrease costs.
The future. We expect general and administrative expenses to stay at approximately the same level in 2011.
Stock-based compensation expenses
Stock-based compensation expenses include charges related to options issued to employees, directors and non-employees. We measure stock-based compensation expense based on the grant-date fair value of any awards granted to our employees. Such expense is recognized over the period of time that employees provide service to us and earn all rights to the awards. Stock-based compensation expense related to options to purchase common stock issued to non-employees is based on the fair value of the stock on the date of issuance, even if such stock contains sales restrictions.
The following table summarizes the components of our stock-based compensation for the years ended December 31, 2010, 2009 and 2008:
|
Years ended
|
||||||||||||
|
2010
|
2009
|
2008
|
||||||||||
|
Cost of product revenues
|
$ | 56,000 | $ | 54,000 | $ | 43,000 | ||||||
|
Research and development related
|
454,000 | 462,000 | 501,000 | |||||||||
|
Sales and marketing related
|
863,000 | 507,000 | 361,000 | |||||||||
|
General and administrative related
|
1,682,000 | 1,626,000 | 1,352,000 | |||||||||
|
Total stock-based compensation
|
$ | 3,055,000 | $ | 2,649,000 | $ | 2,257,000 | ||||||
Most of the share-based compensation expenses for the years ended December 31, 2010, 2009 and 2008 related to the vesting of stock option awards to employees.
During the first quarter of 2010, we issued to our directors, executive officers and certain non-executive employees options to purchase an aggregate of up to 1,155,000 shares of our common stock, with four-year vesting for our officers and employees and two-year vesting for our directors. The grant date fair value of the awards granted to our officers and employees was $4.07 and to our directors was $4.16 per share. The resulting share-based compensation expense of $4,713,000, net of estimated forfeitures, will be recognized as expense over the respective vesting periods.
During the first quarter of 2009, we made a company-wide option grant to our non-executive employees to purchase up to 249,250 shares of our common stock, subject to a four-year graded vesting schedule. The grant date fair value of the awards was $2.00 per share. Following the reduction of our workforce at the end of this quarter, 182,100 of these options remained outstanding. The resulting share-based compensation expense of $364,200, net of estimated forfeitures, is being recognized as expense over the employees’ respective expected vesting periods.
32
During the first quarter of 2009, we issued to our officers and directors options to purchase an aggregate of up to 585,000 shares of our common stock, with four-year graded vesting for our officers and two-year graded vesting for our directors. The grant date fair value of the awards granted to our officers and directors was $2.70 per share. The resulting share-based compensation expense of $1,579,500, net of estimated forfeitures, is being recognized as expense over the respective expected vesting periods.
During the second quarter of 2009, we made a company-wide option grant to our non-executive employees to purchase up to 155,580 shares of our common stock, subject to a four-year graded vesting schedule. The grant date fair value of the awards was $1.18 per share. The resulting share-based compensation expense of $183,000, net of estimated forfeitures, is being recognized as expense over the employees’ respective expected vesting periods.
During the third quarter of 2009, we issued 25,000 shares of restricted common stock to a non-employee consultant. The stock is restricted in that it cannot be sold for a specified period of time. There are no vesting requirements. Because the shares issued are not subject to additional future vesting or service requirements, the stock-based compensation expense of $92,000 recorded in the third quarter of 2009 constitutes the entire expense related to this grant, and no future period charges will be incurred.
During the first quarter of 2008, we issued to our officers and directors stock options to purchase up to 450,000 shares of our common stock, with a four-year graded vesting schedule for our officers and two-year graded vesting for our directors. The grant date fair value of option awards granted to our officers and directors was $2.73 per share. The resulting share-based compensation expense of $1,230,000, net of estimated forfeitures, is being recognized as expense over the respective expected vesting periods.
The future. We will continue to grant options (which will result in an expense) to our employees and, as appropriate, to non-employee service providers. In addition, previously-granted options will continue to vest in accordance with their original terms. As of December 31, 2010, the total compensation cost related to non-vested stock options not yet recognized for all our plans is approximately $5,428,000. These costs are expected to be recognized over a weighted average period of 1.8 years.
Change in fair value of warrant liability
The following is a table summarizing the change in fair value of warrant liability for the years ended December 31, 2010, 2009 and 2008:
|
Years ended December 31,
|
||||||||||||
|
2010
|
2009
|
2008
|
||||||||||
|
Change in fair value of warrant liability
|
$ | (1,285,000 | ) | $ | 4,574,000 | $ | — | |||||
Effective January 1, 2009, we changed our method of accounting for certain common stock purchase warrants with exercise price reset features due to the adoption of a new accounting standard. These warrants were issued in connection with our August 2008 private placement of 2,825,517 unregistered shares of common stock and 1,412,758 common stock warrants. The warrants had an original exercise price of $8.50 and expire in August 2013. Under the new standard, these warrants previously recognized in stockholders’ equity (deficit) are now accounted for as fair value liabilities, with changes in fair value included in net earnings (loss).
33
The common stock purchase warrants were not issued with the intent of effectively hedging any future cash flow, fair value of any asset, liability or any net investment in a foreign operation. The warrants do not qualify for hedge accounting, and as such, all future changes in the fair value of these warrants will be recognized currently in earnings until such time as the warrants are exercised or expire. These common stock purchase warrants do not trade in an active securities market, and as such, we estimate the fair value of these warrants using the Black-Scholes option pricing model using the following assumptions:
|
As of
December 31, 2010
|
As of
December 31, 2009
|
|||||||
|
Expected term
|
2.61 years
|
3.61 years
|
||||||
|
Common stock market price
|
$ | 5.19 | $ | 6.10 | ||||
|
Risk-free interest rate
|
0.82 | % | 1.70 | % | ||||
|
Expected volatility
|
86.03 | % | 76.16 | % | ||||
|
Resulting fair value (per warrant)
|
$ | 2.50 | $ | 3.28 | ||||
Expected volatility is based primarily on historical volatility. Historical volatility was computed using daily pricing observations for recent periods that correspond to the expected term of the warrants. We believe this method produces an estimate that is representative of our expectations of future volatility over the expected term of these warrants. We currently have no reason to believe future volatility over the expected remaining life of these warrants is likely to differ materially from historical volatility. The expected life is based on the remaining term of the warrants. The risk-free interest rate is the interest rate for treasury constant maturity instruments published by the Federal Reserve Board that is closest to the expected term of the warrant.
The future. Future changes in the fair value of the warrant liability will be recognized currently in earnings until such time as the warrants are exercised or expire.
Change in fair value of option liability
The following is a table summarizing the change in fair value of option liability for the years ended December 31, 2010, 2009 and 2008:
|
Years ended
|
||||||||||||
|
2010
|
2009
|
2008
|
||||||||||
|
Change in fair value of option liability
|
$ | 30,000 | $ | (920,000 | ) | $ | 1,060,000 | |||||
In reference to the Joint Venture, the Shareholders’ Agreement between Cytori and Olympus provides that in certain specified circumstances of insolvency or if we experience a change in control, Olympus will have the right to (i) repurchase our interests in the Joint Venture at the fair value of such interests or (ii) sell its own interests in the Joint Venture to us at the higher of (a) $22,000,000 or (b) the Put’s fair value. The Put has been classified as a liability.
The valuations of the Put were completed using an option pricing theory-based simulation analysis (i.e., a Monte Carlo simulation). The valuations are based on assumptions as of the valuation date with regard to the market value of Cytori and the estimated fair value of the Joint Venture, the expected correlation between the values of Cytori and the Joint Venture, the expected volatility of Cytori and the Joint Venture, the bankruptcy recovery rate for Cytori, the bankruptcy threshold for Cytori, the probability of a change of control event for Cytori, and the risk-free interest rate.
The following assumptions were employed in estimating the value of the Put:
|
December 31, 2010
|
December 31, 2009
|
December 31, 2008
|
||||||||||
|
Expected volatility of Cytori
|
73.00 | % | 72.00 | % | 68.00 | % | ||||||
|
Expected volatility of the Joint Venture
|
73.00 | % | 72.00 | % | 68.00 | % | ||||||
|
Bankruptcy recovery rate for Cytori
|
28.00 | % | 19.00 | % | 21.00 | % | ||||||
|
Bankruptcy threshold for Cytori
|
$ | 5,842,000 | $ | 11,308,000 | $ | 16,740,000 | ||||||
|
Probability of a change of control event for Cytori
|
3.43 | % | 2.95 | % | 2.80 | % | ||||||
|
Expected correlation between fair values of Cytori and the Joint Venture in the future
|
99.00 | % | 99.00 | % | 99.00 | % | ||||||
|
Risk free interest rate
|
3.30 | % | 3.85 | % | 2.25 | % | ||||||
The future. The Put has no expiration date. Accordingly, we will continue to recognize a liability for the Put until it is exercised or until the arrangements with Olympus are amended.
34
Financing items
The following table summarizes interest income, interest expense, and other income and expenses for the years ended December 31, 2010, 2009 and 2008:
|
Years ended
|
||||||||||||
|
2010
|
2009
|
2008
|
||||||||||
|
Interest income
|
$ | 9,000 | $ | 20,000 | $ | 230,000 | ||||||
|
Interest expense
|
(2,052,000 | ) | (1,427,000 | ) | (420,000 | ) | ||||||
|
Other income (expense), net
|
23,000 | (218,000 | ) | (40,000 | ) | |||||||
|
Total
|
$ | (2,020,000 | ) | $ | (1,625,000 | ) | $ | (230,000 | ) | |||
|
·
|
Interest income decreased for the year December 31, 2010 as compared to the same period in 2009 and 2008 primarily due to a decrease in interest rates.
|
|
·
|
Interest expense increased in 2010 as compared to 2009 and 2008 due to cash interest and non-cash amortization of debt issuance costs and debt discount for the $20.0 million term loan. During the second quarter of 2010, we entered into an Amended and Restated Loan and Security Agreement, pursuant to which the lenders funded a term loan in the amount of $20.0 million on June 14, 2010, and which refinanced the remaining balance of the term loan from 2008.
|
|
·
|
The changes in other income (expense) in 2010, 2009 and 2008 resulted primarily from changes in foreign currency exchange rates.
|
The future. Interest income earned in the remainder of 2011 will be dependent on our levels of funds available for investment as well as general economic conditions. Subject to our future financing activities, we expect interest expense in 2011 to increase as we continue to pay interest on the $20.0 million term loan that funded in June 2010.
Equity loss from investment in Joint Venture
The following table summarizes equity loss from investment in joint venture for the years ended December 31, 2010, 2009 and 2008:
|
Years ended
|
||||||||||||
|
2010
|
2009
|
2008
|
||||||||||
|
Equity loss from investment in joint venture
|
$ | (151,000 | ) | $ | (44,000 | ) | $ | (45,000 | ) | |||
The losses relate entirely to our 50% equity interest in the Joint Venture, which we account for using the equity method of accounting.
The future. We do not expect to recognize significant losses from the activities of the Joint Venture in the foreseeable future. Over the next one to two years, the Joint Venture is expected to incur labor costs related to the development of our second generation commercial system as well as general and administrative expenses, offset by royalty and product revenue expected to be generated by our current Celution® 800/CRS and future generation devices. Though we have no obligation to do so, we plan to contribute funding to the Joint Venture to cover any costs should the Joint Venture deplete its cash balance.
35
Liquidity and Capital Resources
Short-term and long-term liquidity
The following is a summary of our key liquidity measures at December 31, 2010 and 2009:
|
As of December 31,
|
||||||||
|
2010
|
2009
|
|||||||
|
Cash and cash equivalents
|
$ | 52,668,000 | $ | 12,854,000 | ||||
|
Current assets
|
$ | 58,953,000 | $ | 18,098,000 | ||||
|
Current liabilities
|
13,223,000 | 8,183,000 | ||||||
|
Working capital
|
$ | 45,730,000 | $ | 9,915,000 | ||||
We incurred net losses of $27,494,000, $23,216,000 and $30,036,000 for the years ended December 31, 2010, 2009 and 2008, respectively. We have an accumulated deficit of $209,998,000 as of December 31, 2010. Additionally, we have used net cash of $23,574,000, $23,807,000 and $33,389,000 to fund our operating activities for years ended December 31, 2010, 2009 and 2008, respectively. To date these operating losses have been funded primarily from outside sources of invested capital.
During 2010, we expanded our commercialization activities while simultaneously pursuing available financing sources to support operations and growth. We have had, and continue to have, an ongoing need to raise additional cash from outside sources to fund our operations. If we cannot do so, we would be required to reduce our research, development, and administrative operations, including reductions of our employee base, in order to offset lack of available funding. We continue to evaluate available financing opportunities as part of our normal course of business.
In June 2010, we entered into an Amended and Restated Loan and Security Agreement with General Electric Capital Corporation, Silicon Valley Bank and Oxford Finance Corporation (together, the Lenders), pursuant to which the Lenders agreed to make a term loan to Cytori in an aggregate principal amount of up to $20.0 million (Term Loan). The Term Loan amends and restates the term loan agreement entered into with GECC and SVB on October 14, 2008 (Original Term Loan), of which an aggregate balance of approximately $4.1 million along with a prorated final payment fee of $205,000 remained outstanding and was refinanced under the Term Loan. The net proceeds of the Term Loan, after payment of lender fees and expenses and the refinancing of the Original Term Loan, were approximately $15.3 million.
In June 2009, we entered into a common stock purchase agreement with Seaside 88, LP (Seaside) relating to the offering and sale of a total of up to 7,150,000 shares of our common stock. Pursuant to the agreement, Seaside purchased 275,000 shares of our common stock every two weeks, subject to the satisfaction of customary closing conditions. Between June 2009 and June 2010, we raised approximately $30,172,000 in gross proceeds from the sale of 7,150,000 shares of our common stock related to Seaside closings.
In October 2010, we entered into an underwriting agreement with Jefferies & Company (Jefferies), relating to the issuance and sale of 4,600,000 shares of our common stock. The price to the public in this offering was $4.50 per share and Jefferies agreed to purchase the shares from us at a price of $4.23 per share. The transaction was completed on October 13, 2010 raising approximately $20,700,000 in gross proceeds before deducting underwriting discounts and commissions and other offering expenses payable by us.
In December 2010, we raised $10,000,000 in gross proceeds from a sale of 1,428,571 shares of unregistered common stock to Astellas Pharma Inc. for $7.00 per share in a private stock placement. Pursuant to the terms of the purchase agreement, we granted Astellas Pharma Inc. a two year right of first refusal to enter into a development and commercialization collaboration with us regarding the use of our technology, on a worldwide basis, for the treatment of liver conditions. In addition, we have agreed to use reasonable efforts to file a registration statement with the Securities and Exchange Commission to register the shares of common stock for resale upon the request of Asetellas Pharma Inc. We also granted Astellas Pharma Inc. a non-voting observer seat on our Board of Directors and the right to designate a representative member to our Scientific Advisory Board.
36
In order to continue the operations of our regenerative cell business at or near current levels, we will need to either substantially increase revenues or continue to raise additional capital in the future.
From January 1, 2008 to December 31, 2010, we have financed our operations primarily by:
|
·
|
Receiving $12,000,000 in net proceeds from a private placement to Green Hospital Supply, Inc. during first half of 2008,
|
|
·
|
Receiving $17,000,000 in gross proceeds in August 2008 from a private placement of 2,825,517 unregistered shares of common stock and 1,412,758 common stock warrants (with an original exercise price of $8.50 per share) to a syndicate of investors including Olympus Corporation, who acquired 1,000,000 unregistered shares and 500,000 common stock warrants in exchange for $6,000,000 of the total proceeds raised,
|
|
·
|
Obtaining a term loan of $7,500,000 from General Electric Capital Corporation and Silicon Valley Bank (Lenders) in October 2008,
|
|
·
|
Receiving approximately $10,000,000 in gross proceeds from sale to institutional investors of a total of 4,771,174 shares of our common stock and warrants to purchase up to a total of 6,679,644 additional shares of our common stock with an exercise price of $2.59 per share in March 2009,
|
|
·
|
Receiving approximately $4,252,000 in gross proceeds from a private placement of 1,864,783 unregistered shares of common stock and 3,263,380 common stock warrants (with an exercise price of $2.62 per share) to a syndicate of investors in May 2009,
|
|
·
|
In June 2009, we entered into a common stock purchase agreement with Seaside 88, LP relating to the offering and sale of a total of up to 7,150,000 shares of our common stock. The agreement required us to issue and Seaside to buy 275,000 shares of our common stock once every two weeks. Between June 2009 and June 2010, we raised an aggregate of approximately $30,172,000 in gross proceeds from the sale of 7,150,000 shares of our common stock,
|
|
·
|
In June 2010, we entered into an Amended and Restated Loan and Security Agreement with the GECC, SVB, and Oxford Finance Corporation (Lenders), pursuant to which the Lenders funded a term loan in the amount of $20,000,000 on June 14, 2010, which refinanced the remaining balance of the term loan entered into with GECC and SVB on October 14, 2008,
|
|
·
|
In October 2010, we entered into an underwriting agreement with Jefferies, relating to the issuance and sale of 4,600,000 shares of our common stock. This price to the public in this offering was $4.50 per share and Jefferies agreed to purchase the shares from us at a price of $4.23 per share. The transaction was completed on October 13, 2010 raising approximately $20,700,000 in gross proceeds before deducting underwriting discounts and commissions and other offering expenses payable by us, and
|
|
·
|
In December 2010, we raised $10,000,000 in gross proceeds from a sale of 1,428,571 shares of unregistered common stock to Astellas Pharma Inc. for $7.00 per share in a private stock placement.
|
The following summarizes our contractual obligations and other commitments at December 31, 2010, and the effect such obligations could have on our liquidity and cash flow in future periods:
|
Payments due by period
|
||||||||||||||||||||
|
Contractual Obligations
|
Total
|
Less than 1
year
|
1 – 3 years
|
3 – 5 years
|
More than
5 years
|
|||||||||||||||
|
Long-term obligations
|
$ | 21,030,000 | $ | 6,667,000 | $ | 14,363,000 | $ | — | $ | — | ||||||||||
|
Interest commitment on long-term obligations
|
2,858,000 | 1,779,000 | 1,079,000 | — | — | |||||||||||||||
|
Operating lease obligations
|
7,212,000 | 1,778,000 | 2,877,000 | 2,557,000 | — | |||||||||||||||
|
Minimum purchase requirements
|
1,307,000 | 1,307,000 | — | — | — | |||||||||||||||
|
Pre-clinical research study obligations
|
148,000 | 148,000 | — | — | — | |||||||||||||||
|
Clinical research study obligations
|
19,100,000 | 5,200,000 | 12,300,000 | 1,600,000 | —— | |||||||||||||||
|
Total
|
$ | 51,655,000 | $ | 16,879,000 | $ | 30,619,000 | $ | 4,157,000 | $ | — | ||||||||||
37
Net cash (used in) provided by operating, investing and financing activities for the years ended December 31, 2010, 2009 and 2008 is summarized as follows:
|
Years Ended
|
||||||||||||
|
2010
|
2009
|
2008
|
||||||||||
|
Net cash used in operating activities
|
$ | (23,574,000 | ) | $ | (23,807,000 | ) | $ | (33,389,000 | ) | |||
|
Net cash used in investing activities
|
(1,290,000 | ) | (221,000 | ) | (393,000 | ) | ||||||
|
Net cash provided by financing activities
|
64,678,000 | 24,271,000 | 34,928,000 | |||||||||
Operating activities
Operational activities, inclusive of research and development, sales and marketing, and general and administrative efforts, offset in part by product sales, generated a $27,494,000 net loss for the year ended December 31, 2010. The operating cash impact of this loss was $23,574,000, after adjusting for the recognition of non-cash development revenue of $2,122,000, the consideration of non-cash share-based compensation, other adjustments for material non-cash activities, such as depreciation, amortization, change in fair value of option liabilities and warrants, and changes in working capital due to timing of product shipments (accounts receivable) and payment of liabilities.
Research and development efforts and other operational activities, offset in part by product sales, generated a $23,216,000 net loss for the year ended December 31, 2009. The cash impact of this loss was $23,807,000, after adjusting for the recognition of $8,840,000 of deferred revenue, for which cash was received in earlier years, the consideration of non-cash share-based compensation of $2,649,000, other adjustments for material non-cash activities, such as depreciation and amortization of $1,681,000, change in fair value of option liabilities of $920,000 and warrants of $4,574,000, non-cash amortization of deferred financing costs and debt discount along with other changes in working capital due to timing of product shipments (accounts receivable) and payment of liabilities.
Research and development efforts, other operational activities, offset in part by product sales, generated a $30,036,000 net loss for the year ended December 31, 2008. The cash impact of this loss was $33,389,000, after adjusting for the recognition of $774,000 of deferred revenue, related party, recognized in 2008, for which cash was received in earlier years, $1,533,000 of depreciation and amortization, a $1,060,000 change in the value of our put option, $2,257,000 non-cash stock based compensation expense, and $178,000 of non-cash amortization of deferred financing costs and debt discount along with other changes in working capital due to timing of product shipments (accounts receivable) and payment of liabilities.
Investing activities
Net cash used in investing activities for the year ended December 31, 2010 resulted from cash outflow for investment in our Joint Venture, purchases of property and equipment and investment in restricted cash and cash equivalents.
Net cash used by investing activities for the year ended December 31, 2009 and 2008 resulted primarily from purchases of property and equipment.
Financing Activities
The net cash provided by financing activities for the year ended December 31, 2010 related primarily to a sale of 3,300,000 shares for approximately $17,314,000 in gross proceeds in connection with the common stock purchase agreement with Seaside entered into on June 19, 2009, the sale of 4,600,000 shares of common stock and for approximately $20,700,000 in gross proceeds in the October 2010 public offering, the sale of 1,428,571 shares of unregistered common stock to Astellas Pharma Inc. for $7.00 per share in a private stock placement raising $10,000,000 in gross proceeds, and proceeds from exercise of warrants and employee stock options of $7,128,000. Additionally, in June 2010, we obtained a term loan in the amount of $20,000,000, less fees and expenses, which was used in part to refinance the remaining balance of the term loan entered into with GECC and SVB on October 14, 2008.
The net cash provided by financing activities for the year ended December 31, 2009 related primarily to a March 2009 equity offering of approximately $10,000,000 in gross proceeds to institutional investors for a total of 4,771,174 shares of our common stock and warrants to purchase up to a total of 6,679,644 additional shares of our common stock; the May 2009 private placement of approximately $4,252,000 in gross proceeds to a syndicate of investors for a total of 1,864,783 unregistered shares of common stock and 3,263,380 common stock warrants; and the sale of 3,850,000 shares for approximately $12,859,000 in gross proceeds in connection with common stock purchase agreement with Seaside entered into on June 19, 2009.
38
The net cash provided by financing activities for the year ended December 31, 2008 related mainly to the private issuance of 2,000,000 shares of unregistered common stock to Green Hospital Supply, Inc. for $12,000,000 and the private placement offering of 2,825,517 unregistered shares of common stock and 1,412,758 common stock warrants (with an original exercise price of $8.50 per share) to a syndicate of investors for approximately $17,000,000 in gross proceeds, of which Olympus Corporation acquired 1,000,000 unregistered shares and 500,000 common stock warrants in exchange for $6,000,000 of the total proceeds raised. Additionally, in October 2008, we obtained a term loan in the amount of $7,500,000, less fees and expenses, from General Electric Capital Corporation and Silicon Valley Bank.
Critical Accounting Policies and Significant Estimates
The preparation of financial statements in conformity with accounting principles generally accepted in the United States requires us to make estimates and assumptions that affect the reported amounts of our assets, liabilities, revenues and expenses, and that affect our recognition and disclosure of contingent assets and liabilities.
While our estimates are based on assumptions we consider reasonable at the time they were made, our actual results may differ from our estimates, perhaps significantly. If results differ materially from our estimates, we will make adjustments to our financial statements prospectively as we become aware of the necessity for an adjustment.
We believe it is important for you to understand our most critical accounting policies. These are our policies that require us to make our most significant judgments and, as a result, could have the greatest impact on our future financial results.
Warrant Liability
Effective January 1, 2009, we changed our method of accounting for certain common stock purchase warrants with exercise price reset features due to the adoption of a new accounting standard. These warrants were issued in connection with our August 2008 private placement of 2,825,517 unregistered shares of common stock and 1,412,758 common stock warrants. The warrants had an original exercise price of $8.50 and expire in August 2013. Under the new standard, these warrants previously recognized in stockholders’ equity (deficit) are now accounted for as fair value liabilities, with changes in fair value included in net earnings (loss).
The cumulative effect of the adoption is to present these warrants as liabilities on the date of the adoption as if they had been accounted for as liabilities since the warrants were issued. As a result, on January 1, 2009, we recognized a $1.7 million long-term warrant liability, a $2.9 million decrease in accumulated deficit and a corresponding decrease in additional paid-in capital of $4.6 million. The fair value of these warrants increased to $6.3 million as of December 31, 2009, which resulted in a $4.6 million loss from the change in fair value of warrants for the year ended December 31, 2009. The fair value of these warrants decreased to $5.0 million as of December 31, 2010, which resulted in a $1.3 million gain from the change in fair value of warrants for the year ended December 31, 2010.
Since these warrants do not qualify for hedge accounting, all future changes in the fair value of the warrants will be recognized currently in earnings until such time as the warrants are exercised or expire. These warrants are not traded in an active securities market, and as such, we estimated the fair value of these warrants using the Black-Scholes option pricing model using the following assumptions:
|
As of
December 31, 2010
|
As of
December 31, 2009
|
|||||||
|
Expected term
|
2.61 years
|
3.61 years
|
||||||
|
Common stock market price
|
$ | 5.19 | $ | 6.10 | ||||
|
Risk-free interest rate
|
0.82 | % | 1.70 | % | ||||
|
Expected volatility
|
86.03 | % | 76.16 | % | ||||
|
Resulting fair value (per warrant)
|
$ | 2.50 | $ | 3.28 | ||||
Expected volatility is based on historical volatility. Historical volatility was computed using daily pricing observations for recent periods that correspond to the expected term of the warrants. We believe this method produces an estimate that is representative of our expectations of future volatility over the expected term of these warrants. We currently have no reason to believe future volatility over the expected remaining life of these warrants is likely to differ materially from historical volatility. The expected life is based on the remaining term of the warrants. The risk-free interest rate is the interest rate for treasury constant maturity instruments published by the Federal Reserve Board that is closest to the expected term of the warrant.
39
Revenue Recognition
Product Sales
We recognize revenue from product sales when the following fundamental criteria are met: (i) persuasive evidence of an arrangement exists, (ii) delivery has occurred, (iii) the price to the customer is fixed or determinable and (iv) collection of the resulting accounts receivable is reasonably assured.
For all sales, we use a binding purchase order or a signed agreement as evidence of an arrangement. Revenue for these product sales is recognized upon delivery to the customer, as all risks and rewards of ownership have been substantively transferred to the customer at that point. For sales to customers who arrange for and manage the shipping process, we recognize revenue upon shipment from our facilities. Shipping and handling costs that are billed to our customers are classified as revenue. The customer’s obligation to pay and the payment terms are set at the time of delivery and are not dependent on the subsequent use or resale of our product.
For those sales that include multiple deliverables, we allocate revenue based on the relative fair values of the individual components. When more than one element such as product maintenance or technical support services are included in an arrangement, we allocate revenue between the elements based on each element’s relative fair value, provided that each element meets the criteria for treatment as a separate unit of accounting. An item is considered a separate unit of accounting if it has value to the customer on a standalone basis and there is objective and reliable evidence of the fair value of the undelivered items. Fair value is generally determined based upon the price charged when the element is sold separately. In the absence of fair value for a delivered element, we allocate revenue first to the fair value of the undelivered elements and allocate the residual revenue to the delivered elements. Fair values for undelivered elements are determined based on vendor-specific objective evidence as well as market participant quotes for similar services. Deferred service revenue is recognized ratably over the period the services are provided. In the absence of fair value for an undelivered element, the arrangement is accounted for as a single unit of accounting, resulting in a deferral of revenue recognition for delivered elements until all undelivered elements have been fulfilled.
Concentration of Significant Customers
Our Asia-Pacific and North America region sales accounted for 79% of our product revenue recognized for the year ended December 31, 2010. Additionally, two customers accounted for 26% of total outstanding accounts receivable as of December 31, 2010.
For the year ended December 31, 2009, our sales were concentrated with three distributors and one direct customer, which in aggregate comprised 46% of our product revenue recognized for the year ended December 31, 2009. Our Asia-Pacific, North America and Europe region sales accounted for 91% of our product revenue recognized for the year ended December 31, 2009. Additionally, one distributor and two direct customers accounted for 55% of total outstanding accounts receivable as of December 31, 2009.
Research and Development
We earn revenue for performing tasks under research and development agreements with both commercial enterprises, such as Olympus and Senko, and governmental agencies like the National Institutes of Health (NIH). Revenue earned under development agreements is classified as either research grant or development revenues depending on the nature of the arrangement. Revenues derived from reimbursement of direct out-of-pocket expenses for research costs associated with grants are recorded as research grant and other within development revenues. Research grant revenue is recorded at the gross amount of the reimbursement. The costs associated with these reimbursements are reflected as a component of research and development expense in our consolidated statements of operations. Additionally, research and development arrangements we have with commercial enterprises such as Olympus and Senko are considered a key component of our central and ongoing operations. Accordingly, when recognized, the inflows from such arrangements are presented as revenues in our consolidated statements of operations.
40
We received funds from Olympus and Olympus-Cytori, Inc. during 2005 and 2006. We recorded upfront fees totaling $28,311,000 as deferred revenues, related party. In exchange for these proceeds, we agreed to (a) provide Olympus-Cytori, Inc. an exclusive and perpetual license to our Celution® System device technology and certain related intellectual property, and (b) provide future development contributions related to commercializing the Celution® System platform. The license and development services are not separable and as a result the recognition of this deferred amount requires achievement of service related milestones, under a proportional performance methodology. If and as such revenues are recognized, deferred revenue will be decreased. Proportional performance methodology was elected due to the nature of our development obligations and efforts in support of the Joint Venture including product development activities and regulatory efforts to support the commercialization of the Joint Venture products. The application of this methodology uses the achievement of R&D milestones as outputs of value to the Joint Venture. We received up-front, non-refundable payments in connection with these development obligations, which we have broken down into specific R&D milestones that are definable and substantive in nature, and which will result in value to the Joint Venture when achieved. As our research and development efforts progress, we periodically evaluate, and modify if necessary, the milestone points in our proportional performance model to ensure that revenue recognition accurately reflects our best estimate of substantive value deliverable to the Joint Venture. Revenue will be recognized as the above mentioned R&D milestones are completed. Of the amounts received and deferred, we recognized development revenues of $2,122,000, $8,840,000 and $774,000 for the years ended December 31, 2010, 2009 and 2008, respectively. All related development costs are expensed as incurred and are included in research and development expense on the statement of operations.
Under a Distribution Agreement with Senko, we granted to Senko an exclusive license to sell and distribute certain Thin Film products in Japan. We have also earned or will be entitled to earn additional payments under the Distribution Agreement based on achieving the defined research and development milestones. There was no development revenue recognized during the years ended December 31, 2010, 2009 and 2008.
Goodwill Impairment Testing
In late 2002, we purchased StemSource, Inc. and recognized over $4,600,000 in goodwill associated with the acquisition, of which $3,922,000 remains on our balance sheet as of December 31, 2010. We test this goodwill at least annually for impairment as well as when an event occurs or circumstances change such that it is reasonably possible that impairment may exist. The application of the goodwill impairment test involves a substantial amount of judgment. The judgments employed may have an effect on whether a goodwill impairment loss is recognized.
This testing must be performed at a level of the organization known as the reporting unit. A reporting unit is at least the same level as a company’s operating segments, and sometimes even one level lower. We currently operate under a single reporting unit. The process for testing goodwill for impairment involves the comparison of fair value of our business to the carrying value of our net assets. If the fair value of the reporting unit is lower than its carrying amount, goodwill may be impaired – additional testing is required.
In 2007, all goodwill that previously had been assigned to our MacroPore Biosurgery reporting unit was derecognized as a result of our sale of our spine and orthopedic product line to Kensey Nash. Accordingly, there was no need to test this component of our business for goodwill impairment.
We completed our goodwill impairment testing as of November 30, 2010 using an income-based approach incorporating discounted projections of estimated future cash flows as well as a market-based approach. We concluded that for all periods presented, our fair value exceeded carrying value, and that none of our reported goodwill was impaired.
Variable Interest Entity (Olympus-Cytori Joint Venture)
A variable interest entity, or VIE, must be consolidated by its primary beneficiary. Evaluating whether an entity is a VIE and determining its primary beneficiary involves significant judgment.
We concluded that the Olympus-Cytori Joint Venture was a VIE based on the following factors:
|
·
|
An entity is a VIE if it has insufficient equity to finance its activities. We recognized that the initial cash contributed to the Joint Venture formed by Olympus and Cytori ($30,000,000) would be completely utilized by the first quarter of 2006. Moreover, it was highly unlikely that the Joint Venture would be able to obtain the necessary financing from third party lenders without additional subordinated financial support – such as personal guarantees by one or both of the Joint Venture stockholders. Accordingly, the joint venture will require additional financial support from Olympus and Cytori to finance its ongoing operations, indicating that the Joint Venture is a VIE. In fact, we contributed $330,000, $300,000 and $150,000 in 2010, 2009, and 2008, respectively.
|
41
|
·
|
Olympus has a contingent put option that would, in specified circumstances, require Cytori to purchase Olympus’s interests in the Joint Venture for a fixed amount of $22,000,000. Accordingly, Olympus is protected in some circumstances from absorbing all expected losses in the Joint Venture, and as such, Olympus may not be an “at-risk” equity holder, although Olympus clearly has decision rights over the operations of the Joint Venture.
|
Because the Joint Venture is undercapitalized, and because one of the Joint Venture’s decision makers may be protected from losses, we have determined that the Joint Venture is a VIE.
As noted previously, a VIE is consolidated by its primary beneficiary. The primary beneficiary is defined as the entity that would absorb the majority of the VIE’s expected losses or be entitled to receive the majority of the VIE’s residual returns (or both).
Significant judgment was involved in determining the primary beneficiary of the Joint Venture. We believe that Olympus and Cytori are “de facto agents” and, together, will absorb more than 50% of the Joint Venture’s expected losses and residual returns. Ultimately, we concluded that Olympus, and not Cytori, was the party most closely related with the joint venture and, hence, its primary beneficiary. Our conclusion was based on the following factors:
|
·
|
The business operations of the Joint Venture will be most closely aligned to those of Olympus (i.e., the manufacture of devices).
|
|
·
|
Olympus controls the Board of Directors, as well as the day-to-day operations of the Joint Venture, and therefore has the primary power to direct activities that could significantly impact economic performance.
|
Had we consolidated the Joint Venture, though, there would be no effect on our net loss or shareholders’ equity at December 31, 2010 or for the year then ended. However, certain balance sheet and income statement captions would have been presented in a different manner. For instance, we would not have presented a single line item entitled investment in joint venture in our balance sheet but, instead, would have performed a line by line consolidation of each of the Joint Venture’s accounts into our financial statements.
Net Operating Loss and Tax Credit Carryforwards
We have established a valuation allowance against our net deferred tax assets due to the uncertainty surrounding the realization of such assets. We periodically evaluate the recoverability of the deferred tax assets. At such time as it is determined that it is more likely than not that deferred assets are realizable, the valuation allowance will be reduced. We have recorded a valuation allowance of $74,994,000 as of December 31, 2010 to reflect the estimated amount of deferred tax assets that may not be realized. We increased our valuation allowance by approximately $11,133,000 during the year ended December 31, 2010. The valuation allowance includes approximately $579,000 related to stock option deductions, the benefit of which, if realized, will eventually be credited to equity and not to income.
At December 31, 2010, we had federal and state tax loss carryforwards of approximately $163,320,000 and $123,275,000 respectively. The federal and state net operating loss carryforwards begin to expire in 2019 and 2011 respectively, if unused. At December 31, 2010, we had federal and state tax credit carryforwards of approximately $3,803,000 and $3,691,000 respectively. The federal credits will begin to expire in 2017, if unused, and $97,000 of the state credits will begin to expire in 2011 if unused. The remaining state credits carry forward indefinitely. In addition, we had a foreign tax loss carryforward of $8,636,000 in Japan, $733,000 in Italy, $187,000 in Switzerland, and $13,000 in India.
The Internal Revenue Code limits the future availability of net operating loss and tax credit carryforwards that arose prior to certain cumulative changes in a corporation’s ownership resulting in a change of our control. We have completed an ownership change analysis pursuant to IRC Section 382 through April 17, 2007. We do not have any ownership change limitations based on this study. We are in the process of updating this analysis through December 31, 2010.
Recent Accounting Pronouncements
See Notes to Consolidated Financial Statements included elsewhere herein for disclosure and discussion of new accounting standards.
42
Item 7A. Quantitative and Qualitative Disclosures About Market Risk
We are exposed to market risk related to fluctuations in interest rates and in foreign currency exchange rates.
Interest Rate Exposure
We are not subject to market risk due to fluctuations in interest rates on our long-term obligations as they bear a fixed rate of interest. Our exposure relates primarily to short-term investments, including funds classified as cash equivalents. As of December 31, 2010, all excess funds were invested in money market funds and other highly liquid investments, therefore our interest rate exposure is not considered to be material.
Foreign Currency Exchange Rate Exposure
Our exposure to market risk due to fluctuations in foreign currency exchange rates relates primarily to our activities in Europe and Japan. Transaction gains or losses resulting from cash balances and revenues have not been significant in the past and we are not engaged in any hedging activity in the Euro, the Yen or other currencies. Based on our cash balances and revenues derived from markets other than the United States for the year ended December 31, 2010, a hypothetical 10% adverse change in the Euro or Yen against the U.S. dollar would not result in a material foreign currency exchange loss. Consequently, we do not expect that reductions in the value of such sales denominated in foreign currencies resulting from even a sudden or significant fluctuation in foreign exchange rates would have a direct material impact on our financial position, results of operations or cash flows.
Notwithstanding the foregoing, the indirect effect of fluctuations in interest rates and foreign currency exchange rates could have a material adverse effect on our business, financial condition and results of operations. For example, foreign currency exchange rate fluctuations may affect international demand for our products. In addition, interest rate fluctuations may affect our customers’ buying patterns. Furthermore, interest rate and currency exchange rate fluctuations may broadly influence the United States and foreign economies resulting in a material adverse effect on our business, financial condition and results of operations.
Under our Japanese Thin Film agreement with Senko, we would receive payments in the nature of royalties based on Senko’s net sales, which would be Yen denominated.
43
|
Item 8. Financial Statements and Supplementary Data
|
|
Reports of Independent Registered Public Accounting Firm
|
|
Consolidated Balance Sheets as of December 31, 2010 and 2009
|
|
Consolidated Statements of Operations and Comprehensive Loss for the years ended December 31, 2010, 2009 and 2008
|
|
Consolidated Statements of Stockholders’ Equity (Deficit) for the years ended December 31, 2010, 2009 and 2008
|
|
Consolidated Statements of Cash Flows for the years ended December 31, 2010, 2009 and 2008
|
|
Notes to Consolidated Financial Statements
|
44
|
PART I. FINANCIAL INFORMATION
|
||||||||||||||||
|
Item 1. Financial Statements
|
||||||||||||||||
Report of Independent Registered Public Accounting Firm
The Board of Directors and Stockholders
Cytori Therapeutics, Inc.:
We have audited the accompanying consolidated balance sheets of Cytori Therapeutics, Inc. (the Company) and subsidiaries as of December 31, 2010 and 2009, and the related consolidated statements of operations and comprehensive loss, stockholders’ equity (deficit), and cash flows for each of the years in the three-year period ended December 31, 2010. In connection with our audits of the consolidated financial statements, we have also audited the accompanying schedule of valuation and qualifying accounts. These consolidated financial statements and financial statement schedule are the responsibility of the Company’s management. Our responsibility is to express an opinion on these consolidated financial statements and financial statement schedule based on our audits.
We conducted our audits in accordance with the standards of the Public Company Accounting Oversight Board (United States). Those standards require that we plan and perform the audit to obtain reasonable assurance about whether the financial statements are free of material misstatement. An audit includes examining, on a test basis, evidence supporting the amounts and disclosures in the financial statements. An audit also includes assessing the accounting principles used and significant estimates made by management, as well as evaluating the overall financial statement presentation. We believe that our audits provide a reasonable basis for our opinion.
In our opinion, the consolidated financial statements referred to above present fairly, in all material respects, the financial position of Cytori Therapeutics, Inc. and subsidiaries as of December 31, 2010 and 2009, and the results of their operations and their cash flows for each of the years in the three-year period ended December 31, 2010, in conformity with U.S. generally accepted accounting principles. Also in our opinion, the related financial statement schedule, when considered in relation to the basic consolidated financial statements taken as a whole, presents fairly, in all material respects, the information set forth therein.
We also have audited, in accordance with the standards of the Public Company Accounting Oversight Board (United States), Cytori Therapeutics, Inc.’s internal control over financial reporting as of December 31, 2010, based on criteria established in Internal Control – Integrated Framework issued by the Committee of Sponsoring Organizations of the Treadway Commission (COSO), and our report dated March 11, 2011, expressed an unqualified opinion on the effectiveness of the Company’s internal control over financial reporting.
|
/s/ KPMG LLP
|
San Diego, California
March 11, 2011
45
Report of Independent Registered Public Accounting Firm
The Board of Directors and Stockholders
Cytori Therapeutics, Inc.:
We have audited Cytori Therapeutics, Inc.’s internal control over financial reporting as of December 31, 2010, based on criteria established in Internal Control – Integrated Framework issued by the Committee of Sponsoring Organizations of the Treadway Commission (COSO). Cytori Therapeutics, Inc.’s management is responsible for maintaining effective internal control over financial reporting and for its assessment of the effectiveness of internal control over financial reporting, included in the accompanying Management’s Report on Internal Control Over Financial Reporting (Item 9A). Our responsibility is to express an opinion on the Company’s internal control over financial reporting based on our audit.
We conducted our audit in accordance with the standards of the Public Company Accounting Oversight Board (United States). Those standards require that we plan and perform the audit to obtain reasonable assurance about whether effective internal control over financial reporting was maintained in all material respects. Our audit included obtaining an understanding of internal control over financial reporting, assessing the risk that a material weakness exists, and testing and evaluating the design and operating effectiveness of internal control based on the assessed risk. Our audit also included performing such other procedures as we considered necessary in the circumstances. We believe that our audit provides a reasonable basis for our opinion.
A company’s internal control over financial reporting is a process designed to provide reasonable assurance regarding the reliability of financial reporting and the preparation of financial statements for external purposes in accordance with U.S. generally accepted accounting principles. A company’s internal control over financial reporting includes those policies and procedures that (1) pertain to the maintenance of records that, in reasonable detail, accurately and fairly reflect the transactions and dispositions of the assets of the company; (2) provide reasonable assurance that transactions are recorded as necessary to permit preparation of financial statements in accordance with U.S. generally accepted accounting principles, and that receipts and expenditures of the company are being made only in accordance with authorizations of management and directors of the company; and (3) provide reasonable assurance regarding prevention or timely detection of unauthorized acquisition, use, or disposition of the company’s assets that could have a material effect on the financial statements.
Because of its inherent limitations, internal control over financial reporting may not prevent or detect misstatements. Also, projections of any evaluation of effectiveness to future periods are subject to the risk that controls may become inadequate because of changes in conditions, or that the degree of compliance with the policies or procedures may deteriorate.
In our opinion, Cytori Therapeutics, Inc. maintained, in all material respects, effective internal control over financial reporting as of December 31, 2010, based on criteria established in Internal Control – Integrated Framework issued by the Committee of Sponsoring Organizations of the Treadway Commission (COSO).
We also have audited, in accordance with the standards of the Public Company Accounting Oversight Board (United States), the consolidated balance sheets of Cytori Therapeutics, Inc. as of December 31, 2010 and 2009, and the related consolidated statements of operations and comprehensive loss, stockholders’ equity (deficit), and cash flows for each of the years in the three-year period ended December 31, 2010, and our report dated March 11, 2011, expressed an unqualified opinion on those consolidated financial statements.
|
/s/ KPMG LLP
|
San Diego, California
March 11, 2011
46
CYTORI THERAPEUTICS, INC.
|
As of December 31,
|
||||||||
|
2010
|
2009
|
|||||||
|
Assets
|
||||||||
|
Current assets:
|
||||||||
|
Cash and cash equivalents
|
$ | 52,668,000 | $ | 12,854,000 | ||||
|
Accounts receivable, net of reserves of $306,000 and of $751,000 in 2010 and 2009, respectively
|
2,073,000 | 1,631,000 | ||||||
|
Inventories, net
|
3,378,000 | 2,589,000 | ||||||
|
Other current assets
|
834,000 | 1,024,000 | ||||||
|
Total current assets
|
58,953,000 | 18,098,000 | ||||||
|
Property and equipment, net
|
1,684,000 | 1,314,000 | ||||||
|
Restricted cash and cash equivalents
|
350,000 | — | ||||||
|
Investment in joint venture
|
459,000 | 280,000 | ||||||
|
Other assets
|
566,000 | 500,000 | ||||||
|
Intangibles, net
|
413,000 | 635,000 | ||||||
|
Goodwill
|
3,922,000 | 3,922,000 | ||||||
|
Total assets
|
$ | 66,347,000 | $ | 24,749,000 | ||||
|
Liabilities and Stockholders’ Equity (Deficit)
|
||||||||
|
Current liabilities:
|
||||||||
|
Accounts payable and accrued expenses
|
$ | 6,770,000 | $ | 5,478,000 | ||||
|
Current portion of long-term obligations
|
6,453,000 | 2,705,000 | ||||||
|
Total current liabilities
|
13,223,000 | 8,183,000 | ||||||
|
Deferred revenues, related party
|
5,512,000 | 7,634,000 | ||||||
|
Deferred revenues
|
4,929,000 | 2,388,000 | ||||||
|
Warrant liability
|
4,987,000 | 6,272,000 | ||||||
|
Option liability
|
1,170,000 | 1,140,000 | ||||||
|
Long-term deferred rent
|
398,000 | — | ||||||
|
Long-term obligations, net of discount, less current portion
|
13,255,000 | 2,790,000 | ||||||
|
Total liabilities
|
43,474,000 | 28,407,000 | ||||||
|
Commitments and contingencies
|
||||||||
|
Stockholders’ equity (deficit):
|
||||||||
|
Preferred stock, $0.001 par value; 5,000,000 shares authorized; -0- shares issued and outstanding in 2010 and 2009
|
— | — | ||||||
|
Common stock, $0.001 par value; 95,000,000 shares authorized; 51,955,265 and 40,039,259 shares issued and 51,955,265 and 40,039,259 shares outstanding in 2010 and 2009, respectively
|
52,000 | 40,000 | ||||||
|
Additional paid-in capital
|
232,819,000 | 178,806,000 | ||||||
|
Accumulated deficit
|
(209,998,000 | ) | (182,504,000 | ) | ||||
|
Total stockholders’ equity (deficit)
|
22,873,000 | (3,658,000 | ) | |||||
|
Total liabilities and stockholders’ equity (deficit)
|
$ | 66,347,000 | $ | 24,749,000 | ||||
THE ACCOMPANYING NOTES ARE AN INTEGRAL PART OF THESE CONSOLIDATED FINANCIAL STATEMENTS
47
CYTORI THERAPEUTICS, INC.
|
For the Years Ended December 31,
|
||||||||||||
|
2010
|
2009
|
2008
|
||||||||||
|
Product revenues:
|
||||||||||||
|
Related party
|
$ | 590,000 | $ | 591,000 | $ | 28,000 | ||||||
|
Third party
|
7,664,000 | 5,246,000 | 4,500,000 | |||||||||
| 8,254,000 | 5,837,000 | 4,528,000 | ||||||||||
|
Cost of product revenues
|
3,908,000 | 3,394,000 | 1,854,000 | |||||||||
|
Gross profit
|
4,346,000 | 2,443,000 | 2,674,000 | |||||||||
|
Development revenues:
|
||||||||||||
|
Development, related party
|
2,122,000 | 8,840,000 | 774,000 | |||||||||
|
Other, related party
|
— | — | 1,500,000 | |||||||||
|
Research grants and other
|
251,000 | 53,000 | 51,000 | |||||||||
| 2,373,000 | 8,893,000 | 2,325,000 | ||||||||||
|
Operating expenses:
|
||||||||||||
|
Research and development
|
9,687,000 | 12,231,000 | 17,371,000 | |||||||||
|
Sales and marketing
|
11,040,000 | 6,583,000 | 4,602,000 | |||||||||
|
General and administrative
|
12,570,000 | 10,415,000 | 11,727,000 | |||||||||
|
Change in fair value of warrants
|
(1,285,000 | ) | 4,574,000 | — | ||||||||
|
Change in fair value of option liability
|
30,000 | (920,000 | ) | 1,060,000 | ||||||||
|
Total operating expenses
|
32,042,000 | 32,883,000 | 34,760,000 | |||||||||
|
Operating loss
|
(25,323,000 | ) | (21,547,000 | ) | (29,761,000 | ) | ||||||
|
Other income (expense):
|
||||||||||||
|
Interest income
|
9,000 | 20,000 | 230,000 | |||||||||
|
Interest expense
|
(2,052,000 | ) | (1,427,000 | ) | (420,000 | ) | ||||||
|
Other income (expense), net
|
23,000 | (218,000 | ) | (40,000 | ) | |||||||
|
Equity loss from investment in joint venture
|
(151,000 | ) | (44,000 | ) | (45,000 | ) | ||||||
|
Total other income (expense)
|
(2,171,000 | ) | (1,669,000 | ) | (275,000 | ) | ||||||
|
Net loss
|
(27,494,000 | ) | (23,216,000 | ) | (30,036,000 | ) | ||||||
|
Basic and diluted net loss per common share
|
$ | (0.60 | ) | $ | (0.65 | ) | $ | (1.12 | ) | |||
|
Basic and diluted weighted average common shares
|
45,947,966 | 35,939,260 | 26,882,431 | |||||||||
THE ACCOMPANYING NOTES ARE AN INTEGRAL PART OF THESE CONSOLIDATED FINANCIAL STATEMENTS
48
CYTORI THERAPEUTICS, INC.
FOR THE YEARS ENDED DECEMBER 31, 2010, 2009 AND 2008
|
Accumulated
|
Amount due
|
|||||||||||||||||||||||||||||||||||
|
Additional
|
Other
|
From
|
||||||||||||||||||||||||||||||||||
|
Common Stock
|
Paid-in
|
Accumulated
|
Treasury Stock
|
Comprehensive
|
Exercises of
|
|||||||||||||||||||||||||||||||
|
Shares
|
Amount
|
Capital
|
Deficit
|
Shares
|
Amount
|
Income (Loss)
|
Stock Options
|
Total
|
||||||||||||||||||||||||||||
|
Balance at December 31, 2007
|
25,962,222 | $ | 26,000 | $ | 129,504,000 | $ | (132,132,000 | ) | 1,872,834 | $ | (6,794,000 | ) | $ | — | $ | (4,000 | ) | $ | (9,400,000 | ) | ||||||||||||||||
|
Stock-based compensation expense
|
— | — | 2,257,000 | — | — | — | — | — | 2,257,000 | |||||||||||||||||||||||||||
|
Issuance of common stock under stock option plan
|
388,536 | — | 790,000 | — | — | — | — | — | 790,000 | |||||||||||||||||||||||||||
|
Sale of common stock
|
4,825,517 | 5,000 | 28,099,000 | — | — | — | — | — | 28,104,000 | |||||||||||||||||||||||||||
|
Amount due from exercises of stock options
|
— | — | — | — | — | — | — | 4,000 | 4,000 | |||||||||||||||||||||||||||
|
Allocation of fair value for debt-related warrants
|
— | — | 564,000 | — | — | — | — | — | 564,000 | |||||||||||||||||||||||||||
|
Net loss for the year ended December 31, 2008
|
— | — | — | (30,036,000 | ) | — | — | — | — | (30,036,000 | ) | |||||||||||||||||||||||||
|
Balance at December 31, 2008
|
31,176,275 | 31,000 | 161,214,000 | (162,168,000 | ) | 1,872,834 | (6,794,000 | ) | — | — | (7,717,000 | ) | ||||||||||||||||||||||||
|
Cumulative effect of change in accounting for certain warrants
|
— | — | (4,578,000 | ) | 2,880,000 | — | — | — | — | (1,698,000 | ) | |||||||||||||||||||||||||
|
Stock-based compensation expense
|
— | — | 2,649,000 | — | — | — | — | — | 2,649,000 | |||||||||||||||||||||||||||
|
Issuance of common stock under stock option plan
|
203,707 | — | 410,000 | — | — | — | — | — | 410,000 | |||||||||||||||||||||||||||
|
Issuance of common stock under stock warrant agreement
|
46,154 | 121,000 | — | — | — | — | — | 121,000 | ||||||||||||||||||||||||||||
|
Sale of common stock
|
8,613,123, | 9,000 | 21,851,000 | — | — | — | — | — | 21,860,000 | |||||||||||||||||||||||||||
|
Sale of treasury stock
|
— | — | (2,861,000 | ) | — | (1,872,834 | ) | 6,794,000 | — | — | 3,933,000 | |||||||||||||||||||||||||
|
Net loss for the year ended December 31, 2009
|
— | — | — | (23,216,000 | ) | — | — | — | — | (23,216,000 | ) | |||||||||||||||||||||||||
|
Balance at December 31, 2009
|
40,039,259 | 40,000 | 178,806,000 | (182,504,000 | ) | — | — | — | — | (3,658,000 | ) | |||||||||||||||||||||||||
|
Stock-based compensation expense
|
— | — | 3,055,000 | — | — | — | — | — | 3,055,000 | |||||||||||||||||||||||||||
|
Issuance of common stock under stock option plan
|
378,705 | — | 1,393,000 | — | — | — | — | — | 1,393,000 | |||||||||||||||||||||||||||
|
Issuance of common stock under stock warrant agreement
|
2,208,730 | 2,000 | 5,733,000 | — | — | — | — | — | 5,735,000 | |||||||||||||||||||||||||||
|
Sale of common stock
|
9,328,571 | 10,000 | 43,553,000 | — | — | — | — | — | 43,563,000 | |||||||||||||||||||||||||||
|
Allocation of fair value for debt-related warrants
|
— | — | 279,000 | — | — | — | — | — | 279,000 | |||||||||||||||||||||||||||
|
Net loss for the year ended December 31, 2010
|
— | — | — | (27,494,000 | ) | — | — | — | — | (27,494,000 | ) | |||||||||||||||||||||||||
|
Balance at December 31, 2010
|
51,955,265 | $ | 52,000 | $ | 232,819,000 | $ | (209,998,000 | ) | — | $ | — | $ | — | $ | — | $ | 22,873,000 | |||||||||||||||||||
THE ACCOMPANYING NOTES ARE AN INTEGRAL PART OF THESE CONSOLIDATED FINANCIAL STATEMENTS
49
CYTORI THERAPEUTICS, INC.
|
For the Years Ended December 31,
|
||||||||||||
|
2010
|
2009
|
2008
|
||||||||||
|
Cash flows from operating activities:
|
||||||||||||
|
Net loss
|
$ | (27,494,000 | ) | $ | (23,216,000 | ) | $ | (30,036,000 | ) | |||
|
Adjustments to reconcile net loss to net cash used in operating activities:
|
||||||||||||
|
Depreciation and amortization
|
931,000 | 1,681,000 | 1,533,000 | |||||||||
|
Amortization of deferred financing costs and debt discount
|
703,000 | 709,000 | 178,000 | |||||||||
|
Warranty provision (reversal)
|
— | (23,000 | ) | (44,000 | ) | |||||||
|
Increase (reduction) in allowance for doubtful accounts
|
460,000 | 663,000 | 121,000 | |||||||||
|
Change in fair value of warrants
|
(1,285,000 | ) | 4,574,000 | — | ||||||||
|
Change in fair value of option liability
|
30,000 | (920,000 | ) | 1,060,000 | ||||||||
|
Stock-based compensation
|
3,055,000 | 2,649,000 | 2,257,000 | |||||||||
|
Equity loss from investment in joint venture
|
151,000 | 44,000 | 45,000 | |||||||||
|
Increases (decreases) in cash caused by changes in operating assets and liabilities:
|
||||||||||||
|
Accounts receivable
|
(902,000 | ) | (986,000 | ) | (1,420,000 | ) | ||||||
|
Inventories
|
(777,000 | ) | (446,000 | ) | (2,143,000 | ) | ||||||
|
Other current assets
|
36,000 | 41,000 | (147,000 | ) | ||||||||
|
Other assets
|
(110,000 | ) | 75,000 | (63,000 | ) | |||||||
|
Accounts payable and accrued expenses
|
811,000 | 413,000 | (2,217,000 | ) | ||||||||
|
Deferred revenues, related party
|
(2,122,000 | ) | (8,840,000 | ) | (2,274,000 | ) | ||||||
|
Deferred revenues
|
2,541,000 | (57,000 | ) | 66,000 | ||||||||
|
Long-term deferred rent
|
398,000 | (168,000 | ) | (305,000 | ) | |||||||
|
Net cash used in operating activities
|
(23,574,000 | ) | (23,807,000 | ) | (33,389,000 | ) | ||||||
|
Cash flows from investing activities:
|
||||||||||||
|
Proceeds from the sale and maturity of short-term investments
|
— | — | 5,739,000 | |||||||||
|
Purchases of short-term investments
|
— | — | (5,739,000 | ) | ||||||||
|
Purchases of property and equipment
|
(610,000 | ) | (221,000 | ) | (393,000 | ) | ||||||
|
Cash invested in restricted cash
|
(350,000 | ) | — | — | ||||||||
|
Investment in joint venture
|
(330,000 | ) | — | — | ||||||||
|
Net cash used in investing activities
|
(1,290,000 | ) | (221,000 | ) | (393,000 | ) | ||||||
|
Cash flows from financing activities:
|
||||||||||||
|
Principal payments on long-term obligations
|
(5,454,000 | ) | (2,053,000 | ) | (958,000 | ) | ||||||
|
Proceeds from long-term obligations
|
20,000,000 | — | 7,500,000 | |||||||||
|
Debt issuance costs and loan fees
|
(559,000 | ) | — | (513,000 | ) | |||||||
|
Proceeds from exercise of employee stock options and warrants
|
7,128,000 | 531,000 | 795,000 | |||||||||
|
Proceeds from sale of common stock
|
45,486,000 | 23,196,000 | 28,954,000 | |||||||||
|
Costs from sale of common stock
|
(1,923,000 | ) | (1,336,000 | ) | (850,000 | ) | ||||||
|
Proceeds from sale of treasury stock
|
— | 3,933,000 | — | |||||||||
|
Net cash provided by financing activities
|
64,678,000 | 24,271,000 | 34,928,000 | |||||||||
|
Net increase in cash and cash equivalents
|
39,814,000 | 243,000 | 1,146,000 | |||||||||
|
Cash and cash equivalents at beginning of year
|
12,854,000 | 12,611,000 | 11,465,000 | |||||||||
|
Cash and cash equivalents at end of year
|
$ | 52,668,000 | $ | 12,854,000 | $ | 12,611,000 | ||||||
50
|
For the Years Ended December 31,
|
||||||||||||
|
2010
|
2009
|
2008
|
||||||||||
|
Supplemental disclosure of cash flows information:
|
||||||||||||
|
Cash paid during period for:
|
||||||||||||
|
Interest
|
$ | 1,226,000 | $ | 739,000 | $ | 180,000 | ||||||
|
Final payment fee on long-term debt
|
205,000 | — | — | |||||||||
|
Supplemental schedule of non-cash investing and financing activities:
|
||||||||||||
|
Fair value of warrants allocated to additional paid-in capital
|
$ | 279,000 | $ | — | $ | 564,000 | ||||||
|
Additions to fixed assets included in accounts payable and accrued expenses
|
481,000 | — | — | |||||||||
THE ACCOMPANYING NOTES ARE AN INTEGRAL PART OF THESE CONSOLIDATED FINANCIAL STATEMENTS
51
CYTORI THERAPEUTICS, INC.
NOTES TO CONSOLIDATED FINANCIAL STATEMENTS
DECEMBER 31, 2010
|
1.
|
Organization and Operations
|
The Company
Cytori is an emerging leader in regenerative medicine, providing patients and physicians around the world with medical technologies that harness the potential of adult regenerative cells from adipose tissue. The Celution® System family of medical devices and instruments is being sold into the European and Asian cosmetic and reconstructive surgery markets but is not yet available in the United States. Our StemSource® product line is sold globally for cell banking and research applications. Additionally, we began selling our PureGraft™ System in US and Europe during 2010.
Our Thin Film product line will be marketed exclusively in Japan by Senko Medical Trading Co. (“Senko”) following regulatory approval of the product in Japan.
We have four subsidiaries located in Japan, Italy, Switzerland and India that have been established primarily to support our sales and marketing activities in these regions.
Principles of Consolidation
The consolidated financial statements include our accounts and those of our subsidiaries. All significant intercompany transactions and balances have been eliminated. Management evaluates its investments on an individual basis for purposes of determining whether or not consolidation is appropriate. In instances where we do not demonstrate control through decision-making ability and/or a greater than 50% ownership interest, we account for the related investments under the cost or equity method, depending upon management’s evaluation of our ability to exercise and retain significant influence over the investee. Our investment in the Olympus-Cytori, Inc. joint venture has been accounted for under the equity method of accounting (see note 3 for further details).
Certain Risks and Uncertainties
We have a limited operating history and our prospects are subject to the risks and uncertainties frequently encountered by companies in the early stages of development and commercialization, especially those companies in rapidly evolving and technologically advanced industries such as the biotech/medical device field. Our future viability largely depends on our ability to complete development of new products and receive regulatory approvals for those products. No assurance can be given that our new products will be successfully developed, regulatory approvals will be granted, or acceptance of these products will be achieved. The development of medical devices for specific therapeutic applications is subject to a number of risks, including research, regulatory and marketing risks. There can be no assurance that our development stage products will overcome these hurdles and become commercially viable and/or gain commercial acceptance.
Capital Availability
We incurred net losses of $27,494,000, $23,216,000 and $30,036,000 for the years ended December 31, 2010, 2009 and 2008, respectively. We have an accumulated deficit of $209,998,000 as of December 31, 2010. Additionally, we have used net cash of $23,574,000, $23,807,000 and $33,389,000 to fund our operating activities for years ended December 31, 2010, 2009 and 2008, respectively. To date, these operating losses have been funded primarily from outside sources of invested capital.
Management recognizes the need to generate positive cash flows in future periods and/or to obtain additional capital from various sources. In the continued absence of positive cash flows from operations, no assurance can be given that we can generate sufficient revenue to cover operating costs or that additional financing will be available to us and, if available, on terms acceptable to us in the future.
During 2010, we expanded our commercialization activities while simultaneously pursuing available financing sources to support operations and growth. We have had, and we may continue to have, an ongoing need to raise additional cash from outside sources to fund our operations. If we cannot do so when required, we would be required to reduce our research, development, and administrative operations, including reductions of our employee base, in order to offset lack of available funding. We continue to evaluate available financing opportunities as part of our normal course of business.
52
|
2.
|
Summary of Significant Accounting Policies
|
Use of Estimates
The preparation of consolidated financial statements in conformity with accounting principles generally accepted in the United States of America requires management to make estimates and assumptions affecting the reported amounts of assets and liabilities and disclosure of contingent assets and liabilities at the date of the financial statements, and the reported amounts of revenue and expenses during the reporting period. Our most significant estimates and critical accounting policies involve recognizing revenue, evaluating goodwill for impairment, valuing our put option arrangement with Olympus Corporation (Put option) (see notes 3 and 4), valuing warrants, determining the assumptions used in measuring share-based compensation expense, valuing our deferred tax assets, assessing how to report our investment in Olympus-Cytori, Inc., and valuing allowance for doubtful accounts and inventories.
Actual results could differ from these estimates. Current economic conditions, including illiquid credit markets and volatile equity markets, contribute to the inherent uncertainty of such estimates. Management’s estimates and assumptions are reviewed periodically, and the effects of revisions are reflected in the consolidated financial statements in the periods they are determined to be necessary.
Presentation
Certain prior period amounts have been reclassified to conform to current period presentation.
Cash and Cash Equivalents
We consider all highly liquid investments with maturities of three months or less at the time of purchase to be cash equivalents. Investments with original maturities of three months or less that were included with and classified as cash and cash equivalents totaled $39,807,000 and 10,780,000 as of December 31, 2010 and 2009, respectively. We maintain our cash at insured financial institutions. The combined account balances at each institution periodically exceed FDIC insurance coverage, and as a result, there is a concentration of credit risk related to amounts in excess of FDIC limits.
Short-term Investments
We invest excess cash in money market funds, highly liquid debt instruments of financial institutions and corporations with strong credit ratings, and in United States government obligations. We have established guidelines relative to diversification and maturities to maintain safety and liquidity. These guidelines are periodically reviewed and modified to take advantage of trends in yields and interest rates. After considering current market conditions, and in order to minimize our risk, management has elected to invest all excess funds in money market funds and other highly liquid investments that are appropriately classified as cash equivalents as of December 31, 2010 and 2009.
Proceeds from sales and maturity of short term investments for the year ended December 31, 2008 were $5,739,000. There were no gross realized losses for such sales for the year ended December 31, 2008. There were no proceeds from sales and maturity of short term investments for the years ended December 31, 2010 and 2009.
Restricted Cash and Cash Equivalents
Restricted cash consists of cash and cash equivalents held in a letter of credit account pursuant to a lease agreement entered into on April 2, 2010 for leasing of property at 3020 and 3030 Callan Road, San Diego, California. The lease agreement required us to execute a letter of credit for $350,000 naming the landlord as a beneficiary. The letter of credit was issued in July 2010 and required us to maintain $350,000 as restricted cash for the duration of the lease, which expires October 31, 2015.
Accounts Receivable
Accounts receivable are recorded at the invoiced amount and do not bear interest. Amounts collected on accounts receivable are included in net cash provided by operating activities in the consolidated statements of cash flows. The Company maintains an allowance for doubtful accounts for estimated losses inherent in its accounts receivable portfolio. In establishing the required allowance, management considers historical losses adjusted to take into account current market conditions and our customers’ financial condition, the amount of receivables in dispute, and the current receivables aging and current payment patterns. Account balances are charged off against the allowance after all means of collection have been exhausted and the potential for recovery is considered remote.
53
Inventories
Inventories include the cost of material, labor, and overhead, and are stated at the lower of cost, determined on the first-in, first-out (FIFO) method, or market. We periodically evaluate our on-hand stock and make appropriate provisions for any stock deemed excess or obsolete. Manufacturing costs resulting from lower than “normal” production levels are expensed as incurred.
Property and Equipment
Property and equipment are stated at cost, net of accumulated depreciation. Depreciation expense, which includes the amortization of capitalized leasehold improvements, is provided for on a straight-line basis over the estimated useful lives of the assets, or the life of the lease, whichever is shorter, and range from three to five years. When assets are sold or otherwise disposed of, the cost and related accumulated depreciation are removed from the accounts and the resulting gain or loss is included in operations. Maintenance and repairs are charged to operations as incurred.
Impairment
We assess certain of our long-lived assets, such as property and equipment and intangible assets other than goodwill, for potential impairment when there is a change in circumstances that indicates carrying values of assets may not be recoverable. Such long-lived assets are deemed to be impaired when the undiscounted cash flows expected to be generated by the asset (or asset group) are less than the asset’s carrying amount. Any required impairment loss would be measured as the amount by which the asset’s carrying value exceeds its fair value, and would be recorded as a reduction in the carrying value of the related asset and a charge to operating expense. We recognized no impairment losses during any of the periods presented in these financial statements.
Goodwill and Intangibles
Goodwill and indefinite-lived intangible assets are not amortized but are reviewed at least annually for impairment. Separable intangible assets that have finite useful lives will continue to be amortized over their respective useful lives.
We are required to test goodwill for impairment on at least an annual basis or whenever events or changes in circumstances indicate that the carrying value of goodwill may not be recoverable. We completed this testing as of November 30, 2010, and concluded that no impairment existed.
Intangibles, consisting of patents and core technology purchased in the acquisition of StemSource, Inc. in 2002, are being amortized on a straight-line basis over their expected lives of ten years.
The changes in the carrying amounts of other indefinite and finite-life intangible assets and goodwill for the years ended December 31, 2010 and 2009 are as follows:
|
December 31, 2010
|
||||
|
Other intangibles, net:
|
||||
|
Beginning balance
|
$ | 635,000 | ||
|
Amortization
|
(222,000 | ) | ||
|
Ending balance
|
413,000 | |||
|
Goodwill, net:
|
||||
|
Beginning balance
|
3,922,000 | |||
|
Disposal of assets
|
— | |||
|
Ending balance
|
3,922,000 | |||
|
Total goodwill and other intangibles, net
|
$ | 4,335,000 | ||
|
Cumulative amortization of other intangible assets
|
$ | 1,803,000 | ||
54
|
December 31, 2009
|
||||
|
Other intangibles, net:
|
||||
|
Beginning balance
|
$ | 857,000 | ||
|
Amortization
|
(222,000 | ) | ||
|
Ending balance
|
635,000 | |||
|
Goodwill, net:
|
||||
|
Beginning balance
|
3,922,000 | |||
|
Disposal of assets
|
— | |||
|
Ending balance
|
3,922,000 | |||
|
Total goodwill and other intangibles, net
|
$ | 4,557,000 | ||
|
Cumulative amortization of other intangible assets
|
$ | 1,581,000 | ||
As of December 31, 2010, future estimated amortization expense for these other intangible assets is expected to be as follows:
|
2011
|
$ | 222,000 | ||
|
2012
|
191,000 | |||
| $ | 413,000 |
Warrant Liability
Effective January 1, 2009, we changed our method of accounting for certain common stock purchase warrants with exercise price reset features due to the adoption of a new accounting standard. These warrants were issued in connection with our August 2008 private placement of 2,825,517 unregistered shares of common stock and 1,412,758 common stock warrants. The warrants had an original exercise price of $8.50 and expire in August 2013. Under the new standard, these warrants previously recognized in stockholders’ equity (deficit) are now accounted for as fair value liabilities, with changes in fair value included in net earnings (loss).
The cumulative effect of the adoption is to present these warrants as liabilities on the date of the adoption as if they had been accounted for as liabilities since the warrants were issued. As a result on January 1, 2009, we recognized a $1.7 million long-term warrant liability, a $2.9 million decrease in accumulated deficit and a corresponding decrease in additional paid-in capital of $4.6 million. The fair value of these warrants increased to $6.3 million as of December 31, 2009, which resulted in a $4.6 million loss from the change in fair value of warrants for the year ended December 31, 2009. The fair value of these warrants was $5.0 million as of December 31, 2010, which resulted in a $1.3 million gain from the change in fair value of warrants for the year ended December 31, 2010.
Since these warrants do not qualify for hedge accounting, all future changes in the fair value of the warrants will be recognized currently in earnings until such time as the warrants are exercised or expire. These warrants are not traded in an active securities market, and as such, we estimated the fair value of these warrants using the Black-Scholes option pricing model using the following assumptions:
|
As of
December 31, 2010
|
As of
December 31, 2009
|
|||||||
|
Expected term
|
2.61 years
|
3.61 years
|
||||||
|
Common stock market price
|
$ | 5.19 | $ | 6.10 | ||||
|
Risk-free interest rate
|
0.82 | % | 1.70 | % | ||||
|
Expected volatility
|
86.03 | % | 76.16 | % | ||||
|
Resulting fair value (per warrant)
|
$ | 2.50 | $ | 3.28 | ||||
Expected volatility is based primarily on historical volatility. Historical volatility was computed using daily pricing observations for recent periods that correspond to the expected term of the warrants. We believe this method produces an estimate that is representative of our expectations of future volatility over the expected term of these warrants. We currently have no reason to believe future volatility over the expected remaining life of these warrants is likely to differ materially from historical volatility. The expected life is based on the remaining term of the warrants. The risk-free interest rate is the interest rate for treasury constant maturity instruments published by the Federal Reserve Board that is closest to the expected term of the warrants.
55
Revenue Recognition
Product Sales
We recognize revenue from product sales when the following fundamental criteria are met: (i) persuasive evidence of an arrangement exists, (ii) delivery has occurred, (iii) the price to the customer is fixed or determinable and (iv) collection of the resulting accounts receivable is reasonably assured.
For all sales, we use a binding purchase order or a signed agreement as evidence of an arrangement. Revenue for these product sales is recognized upon delivery to the customer, as all risks and rewards of ownership have been substantively transferred to the customer at that point. For sales to customers who arrange for and manage the shipping process, we recognize revenue upon shipment from our facilities. Shipping and handling costs that are billed to our customers are classified as revenue. The customer’s obligation to pay and the payment terms are set at the time of delivery and are not dependent on the subsequent use or resale of our product.
For those sales that include multiple deliverables, we allocate revenue based on the relative fair values of the individual components. When more than one element such as product maintenance or technical support services are included in an arrangement, we allocate revenue between the elements based on each element’s relative fair value, provided that each element meets the criteria for treatment as a separate unit of accounting. An item is considered a separate unit of accounting if it has value to the customer on a standalone basis and there is objective and reliable evidence of the fair value of the undelivered items. Fair value is generally determined based upon the price charged when the element is sold separately. In the absence of fair value for a delivered element, we allocate revenue first to the fair value of the undelivered elements and allocate the residual revenue to the delivered elements. Fair values for undelivered elements are determined based on vendor-specific objective evidence as well as market participant quotes for similar services. Deferred service revenue is recognized ratably over the period the services are provided. In the absence of fair value for an undelivered element, the arrangement is accounted for as a single unit of accounting, resulting in a deferral of revenue recognition for delivered elements until all undelivered elements have been fulfilled.
Concentration of Significant Customers
Our Asia-Pacific and North America region sales accounted for 79% of our product revenue recognized for the year ended December 31, 2010. Additionally, two customers accounted for 26% of total outstanding accounts receivable as of December 31, 2010.
For the year ended December 31, 2009, our sales were concentrated with three distributors and one direct customer, which in aggregate comprised 46% of our product revenue recognized for the year ended December 31, 2009. Our Asia-Pacific, North America and Europe region sales accounted for 91% of our product revenue recognized for the year ended December 31, 2009. Additionally, one distributor and two direct customers accounted for 55% of total outstanding accounts receivable as of December 31, 2009.
Research and Development
We earn revenue for performing tasks under research and development agreements with both commercial enterprises, such as Olympus and Senko, and governmental agencies like the NIH. Revenue earned under development agreements is classified as either research grant or development revenues depending on the nature of the arrangement. Revenues derived from reimbursement of direct out-of-pocket expenses for research costs associated with grants are recorded as research grant and other within development revenues. Research grant revenue is recorded at the gross amount of the reimbursement. The costs associated with these reimbursements are reflected as a component of research and development expense in our consolidated statements of operations. Additionally, research and development arrangements we have with commercial enterprises such as Olympus and Senko are considered a key component of our central and ongoing operations. Accordingly, when recognized, the inflows from such arrangements are presented as revenues in our consolidated statements of operations.
We received funds from Olympus and Olympus-Cytori, Inc. during 2005 and 2006. We recorded upfront fees totaling $28,311,000 as deferred revenues, related party. In exchange for these proceeds, we agreed to (a) provide Olympus-Cytori, Inc. an exclusive and perpetual license to our Celution® System device technology and certain related intellectual property, and (b) provide future development contributions related to commercializing the Celution® System platform. The license and development services are not separable and, as a result, the recognition of this deferred amount requires achievement of service related milestones, under a proportional performance methodology. If and as such revenues are recognized, deferred revenue will be decreased. Proportional performance methodology was elected due to the nature of our development obligations and efforts in support of the Joint Venture, including product development activities and regulatory efforts to support the commercialization of the Joint Venture products. The application of this methodology uses the achievement of R&D milestones as outputs of value to the Joint Venture. We received up-front, non-refundable payments in connection with these development obligations, which we have broken down into specific R&D milestones that are definable and substantive in nature, and which will result in value to the Joint Venture when achieved. As our research and development efforts progress, we periodically evaluate, and modify if necessary, the milestone points in our proportional performance model to ensure that revenue recognition accurately reflects our best estimate of substantive value deliverable to the Joint Venture. Revenue will be recognized as the above mentioned R&D milestones are completed. Of the amounts received and deferred, we recognized development revenues of $2,122,000, $8,840,000 and $774,000 for the years ended December 31, 2010, 2009 and 2008, respectively. All related development costs are expensed as incurred and are included in research and development expense on the consolidated statement of operations.
56
Under a Distribution Agreement with Senko, we granted to Senko an exclusive license to sell and distribute certain Thin Film products in Japan. We have also earned or will be entitled to earn additional payments under the Distribution Agreement based on achieving the defined research and development milestones. There was no development revenue recognized during the year ended December 31, 2010, 2009 and 2008.
Warranty
For the bioresorbable spine and orthopedic products, which we sold to Kensey Nash in 2007, we provided a limited warranty under our agreements with our customers for products that fail to comply with product specifications. We had previously recorded a reserve for estimated costs we may incur under our warranty program, and as of December 31, 2010 and 2009, we no longer have a warranty accrual as the maximum period of time any warranty claim could occur has lapsed.
Beginning in March 2008, we began sales and shipments of our Celution® 800/CRS System to the European and Asia-Pacific reconstructive surgery market. In September 2008, we completed installation of our first StemSource® Cell Bank. We are selling medical device equipment for use with humans, which is subjected to exhaustive and highly controlled specification compliance and fitness testing and validation procedures before it can be approved for sale to help ensure that the products will be free of defects. We believe that the rigorous nature of the testing and compliance efforts serves to minimize the likelihood of defects in material or workmanship such that recognition of a warranty obligation is not justified at this time. Accordingly, we have not recorded a warranty reserve for our Celution® 800/CRS System and StemSource® Cell Bank product line during the years ended December 31, 2010, 2009 and 2008.
The following summarizes the movements in our warranty obligations, which is included in accounts payable and accrued expenses, at December 31, 2009 and 2008:
|
As of
January 1
|
Deductions to
expenses
|
Claims
|
As of
December 31
|
|||||||||||||
|
2009:
|
||||||||||||||||
|
Warranty obligations
|
$ | 23,000 | $ | (23,000 | ) | $ | — | $ | — | |||||||
|
2008:
|
||||||||||||||||
|
Warranty obligations
|
$ | 67,000 | $ | (44,000 | ) | $ | — | $ | 23,000 | |||||||
Research and Development
Research and development expenditures, which are charged to operations in the period incurred, include costs associated with the design, development, testing and enhancement of our products, regulatory fees, the purchase of laboratory supplies, and pre-clinical and clinical studies as well as salaries and benefits for our research and development employees.
Also included in research and development expenditures are costs incurred to support research grant reimbursement and costs incurred in connection with our development arrangements with Olympus and Senko.
Expenditures related to the Joint Venture with Olympus include costs that are necessary to support the commercialization of future generation devices based on our Celution® System platform. These development activities, which began in November 2005, include performing pre-clinical and clinical trials, seeking regulatory approval, and performing product development related to therapeutic applications for adipose stem and regenerative cells for multiple large markets. For the years ended December 31, 2010, 2009 and 2008, costs associated with the development of the device were $2,221,000, $2,713,000 and $2,546,000, respectively.
57
Our agreement with the NIH entitled us to qualifying expenditures of up to $250,000 related to research on Adipose Tissue-Derived Cells for Vascular Cell Therapy, which expired in August 2009. We incurred $49,000 of direct expenses for the year ended December 31, 2009. There were no comparable expenditures in 2008 as our work under this NIH agreement began in 2009.
Deferred Financing Costs and Other Debt-Related Costs
Deferred financing costs are capitalized and amortized to interest expense over the term of the associated debt instrument. We evaluate the terms of the debt instruments to determine if any embedded or freestanding derivatives or conversion features exist. We allocate the aggregate proceeds of the debt between the warrants and the debt based on their relative fair values. The fair value of the warrant issued to the Lenders was calculated utilizing the Black-Scholes option-pricing model. We are accreting the resultant discount over the term of the debt through maturity date using the effective interest method. If the maturity of the debt is accelerated because of default or early debt repayment, then the amortization or accretion would be accelerated.
Income Taxes
Income taxes are accounted for under the asset and liability method. Deferred tax assets and liabilities are recognized for the future tax consequences attributable to differences between the financial statement carrying amounts of existing assets and liabilities and their respective tax bases and operating loss and tax credit carry forwards. Deferred tax assets and liabilities are measured using enacted tax rates expected to apply to taxable income (loss) in the years in which those temporary differences are expected to be recovered or settled. Due to our history of loss, a full valuation allowance was recognized against our deferred tax assets.
Stock Based Compensation
We recognize the fair value method of all share-based payment awards granted after January 1, 2006, in our statements of operations over the requisite vesting period of each award. We estimate the fair value of these options using the Black-Scholes option pricing model using assumptions for expected volatility, expected term, and risk-free interest rate. Expected volatility is based primarily on historical volatility and is computed using daily pricing observations for recent periods that correspond to the expected term of the options. The expected life is based on the expected term of the options. The risk-free interest rate is the interest rate for treasury instruments with maturities that approximate the expected term.
Segment Information
In the past, we reported our financial results based on two distinct operating segments – (a) Regenerative cell technology and (b) MacroPore Biosurgery.
Our regenerative cell technology segment includes the development, manufacturing and sale of medical technologies to enable the practice of regenerative medicine with an initial focus on reconstructive surgery and cell banking. Our commercialization model is based on the sale of Celution® Systems and their related harvest and delivery instrumentation, and on generating recurring revenues from single-use consumable sets utilized during each patient procedure.
Our MacroPore Biosurgery unit developed Thin Film bioresorbable implants for sale in Japan through Senko Medical Trading Company (“Senko”), which has exclusive distribution rights to these products in Japan. Also, until after the second quarter of 2007, the MacroPore Biosurgery segment manufactured and distributed the HYDROSORBTM family of spine and orthopedic implants. During the second half of 2007, we had minimal activity in the MacroPore Biosurgery operating segment as a result of sale in May 2007 to Kensey Nash of the intellectual property rights and tangible assets related to the spine and orthopedic bioresorbable implant product line.
As a result, for the years ended December 31, 2010, 2009, and 2008, all of our financial results relate to the regenerative cell technology segment.
58
Loss Per Share
Basic per share data is computed by dividing net income or loss applicable to common stockholders by the weighted average number of common shares outstanding during the period. Diluted per share data is computed by dividing net income or loss applicable to common stockholders by the weighted average number of common shares outstanding during the period increased to include, if dilutive, the number of additional common shares that would have been outstanding as calculated using the treasury stock method. Potential common shares were related entirely to outstanding but unexercised options and warrants for all periods presented.
We have excluded all potentially dilutive securities from the calculation of diluted loss per share attributable to common stockholders for the years ended December 31, 2010, 2009 and 2008, as their inclusion would be antidilutive. Potentially dilutive common shares excluded from the calculations of diluted loss per share were 18,926,093, 20,123,889, and 9,393,574 for the years ended December 31, 2010, 2009 and 2008, respectively.
Recent Accounting Pronouncements
In June 2009, the Financial Accounting Standards Board (FASB) issued an update to the consolidation topic of the FASB Accounting Standards Codification (the ASC or the Codification). This update requires an enterprise to qualitatively assess the determination of the primary beneficiary (or “consolidator”) of a variable interest entity, or VIE, based on whether the entity (1) has the power to direct matters that most significantly impact the activities of the VIE, and (2) has the obligation to absorb losses or the right to receive benefits of the VIE that could potentially be significant to the VIE. Also, it changes the consideration of kick-out rights in determining if an entity is a VIE and requires an ongoing reconsideration of the primary beneficiary. It also amends the events that trigger a reassessment of whether an entity is a VIE. This update is effective as of the beginning of each reporting entity’s first annual reporting period that begins after November 15, 2009, interim periods within that first annual reporting period, and for interim and annual reporting periods thereafter. The adoption of this standard did not have a material impact on our consolidated financial statements.
In October 2009, the FASB issued an update to the revenue recognition topic of the Codification. The update addresses the accounting for multiple-deliverable arrangements to enable vendors to account for products or services (deliverables) separately rather than as a combined unit. This guidance establishes a selling price hierarchy for determining the selling price of a deliverable, which is based on: (a) vendor-specific objective evidence; (b) third-party evidence; or (c) estimates. This guidance also eliminates the residual method of allocation and requires that arrangement consideration be allocated at the inception of the arrangement to all deliverables using the relative selling price method. In addition, this guidance significantly expands required disclosures related to a vendor’s multiple-deliverable revenue arrangements. The update 2009-13 is effective prospectively for revenue arrangements entered into or materially modified in fiscal years beginning on or after June 15, 2010 and early adoption is permitted. We are currently evaluating the impact of the adoption of this standard on our consolidated financial statements.
In April 2010, the FASB issued additional guidance for revenue recognition to provide criteria that should be met for determining whether the milestone method of revenue recognition is appropriate. A vendor can recognize as revenue, in its entirety, consideration that is contingent upon achievement of a milestone in the period in which the milestone is achieved only if the milestone meets all criteria to be considered substantive. The guidance for milestone method of revenue recognition is effective on a prospective basis for milestones achieved in fiscal years, and interim periods within those years, beginning on or after June 15, 2010. We do not expect adoption of this guidance to have a material effect on our consolidated financial statements.
|
3.
|
Transactions with Olympus Corporation
|
Initial Investment by Olympus Corporation in Cytori
In 2005, we entered into a common stock purchase agreement (the “Purchase Agreement”) with Olympus in which we received $11,000,000 in cash proceeds. Under the Purchase Agreement, we issued 1,100,000 shares of common stock to Olympus. In addition, we also granted Olympus an immediately exercisable option to acquire 2,200,000 shares of our common stock at $10 per share, which expired on December 31, 2006. Before its expiration, we accounted for this option as a liability.
The $11,000,000 in total proceeds we received in the second quarter of 2005 exceeded the sum of (i) the market value of our stock as well as (ii) the fair value of the option at the time we entered into the share purchase agreement. The $7,811,000 difference between the proceeds received and the fair values of our common stock and option liability is recorded as a component of deferred revenues, related party in the accompanying consolidated balance sheets. This difference was recorded as deferred revenue since, conceptually, the excess proceeds represent a prepayment for future contributions and obligations of Cytori for the benefit of the Joint Venture (see below), rather than an additional equity investment in Cytori. The recognition of this deferred amount is based on achievement of related milestones, under a proportional performance methodology. As such revenues are recognized, deferred revenue is reduced (see note 2 – Revenue Recognition).
59
In a separate agreement entered into on February 23, 2006, we granted Olympus an exclusive right to negotiate a commercialization collaboration for the use of adipose regenerative cells for a specific therapeutic area outside of cardiovascular disease. In exchange for this right, we received a $1,500,000 payment from Olympus, which was non-refundable but could be applied towards a definitive commercial collaboration in the future. As part of this agreement, Olympus would conduct market research and pilot clinical studies in collaboration with us for the therapeutic area up to December 31, 2008 when this exclusive right expired. The $1,500,000 payment was received in the second quarter of 2006 and recorded as deferred revenues, related party. Accordingly, on December 31, 2008, we recognized $1,500,000 as other development revenue and reduced our deferred revenues, related party balance for the same amount.
In August 2006, we received an additional $11,000,000 from Olympus for the issuance of approximately 1,900,000 shares of our common stock at $5.75 per share under the shelf registration statement filed in May 2006. The purchase price was determined by our closing price on August 9, 2006.
On August 11, 2008, we raised approximately $17,000,000 in gross proceeds from a private placement of 2,825,517 unregistered shares of common stock and 1,412,758 common stock warrants (with an original exercise price of $8.50 per share) to a syndicate of investors including Olympus Corporation, who acquired 1,000,000 unregistered shares and 500,000 common stock warrants in exchange for $6,000,000 of the total proceeds raised.
As of December 31, 2010, Olympus holds approximately 7.72% (unaudited) of our issued and outstanding shares. Additionally, Olympus has a right, which it has not yet exercised, to designate a director to serve on our Board of Directors.
Formation of the Olympus-Cytori Joint Venture
On November 4, 2005, we entered into a joint venture and other related agreements (the “Joint Venture Agreements”) with Olympus. The Joint Venture is owned equally by Olympus and us.
Under the Joint Venture Agreements:
|
·
|
Olympus paid $30,000,000 for its 50% interest in the Joint Venture. Moreover, Olympus simultaneously entered into a License/Joint Development Agreement with the Joint Venture and us to develop a second generation commercial system and manufacturing capabilities.
|
|
·
|
We licensed our Celution® System device technology and certain related intellectual property, to the Joint Venture for use in future generation devices. These devices will process and purify regenerative cells residing in adipose tissue for various therapeutic clinical applications. In exchange for this license, we received a 50% interest in the Joint Venture, as well as an initial $11,000,000 payment from the Joint Venture; the source of this payment was the $30,000,000 contributed to the Joint Venture by Olympus. Moreover, upon receipt of a CE mark for the Celution® 600 in January 2006, we received an additional $11,000,000 development milestone payment from the Joint Venture.
|
We have determined that the Joint Venture is a variable interest entity (VIE), but that Cytori is not the VIE’s primary beneficiary. Accordingly, we have accounted for our interests in the Joint Venture using the equity method of accounting, since we can have significant influence over the Joint Venture’s operations. At December 31, 2010, the carrying value of our investment in the Joint Venture is $459,000.
We are under no obligation to provide additional funding to the Joint Venture, but may choose to do so. We contributed $330,000 during 2010. The Company made no contributions during 2009 and 2008.
60
Put/Calls and Guarantees
The Shareholders’ Agreement between Cytori and Olympus provides that in certain specified circumstances of insolvency or if we experience a change in control, Olympus will have the rights to (i) repurchase our interests in the Joint Venture at the fair value of such interests or (ii) sell its own interests in the Joint Venture to Cytori at the higher of (a) $22,000,000 or (b) the Put’s fair value.
As of November 4, 2005, the fair value of the Put was determined to be $1,500,000. At December 31, 2010 and 2009, the fair value of the Put was $1,170,000 and $1,140,000, respectively. Fluctuations in the Put value are recorded in the consolidated statements of operations as a component of change in fair value of option liabilities. The fair value of the Put has been recorded as a long-term liability in the caption option liability in our consolidated balance sheets.
The valuations of the Put were completed using an option pricing theory based simulation analysis (i.e., a Monte Carlo simulation). The valuations are based on assumptions as of the valuation date with regard to the market value of Cytori and the estimated fair value of the Joint Venture, the expected correlation between the values of Cytori and the Joint Venture, the expected volatility of Cytori and the Joint Venture, the bankruptcy recovery rate for Cytori, the bankruptcy threshold for Cytori, the probability of a change of control event for Cytori, and the risk free interest rate.
The following assumptions were employed in estimating the value of the Put:
|
December 31, 2010
|
December 31, 2009
|
November 4, 2005
|
||||||||||
|
Expected volatility of Cytori
|
73.00 | % | 72.00 | % | 63.20 | % | ||||||
|
Expected volatility of the Joint Venture
|
73.00 | % | 72.00 | % | 69.10 | % | ||||||
|
Bankruptcy recovery rate for Cytori
|
28.00 | % | 19.00 | % | 21.00 | % | ||||||
|
Bankruptcy threshold for Cytori
|
$ | 5,842,000 | $ | 11,308,000 | $ | 10,780,000 | ||||||
|
Probability of a change of control event for Cytori
|
3.43 | % | 2.95 | % | 3.04 | % | ||||||
|
Expected correlation between fair values of Cytori and the Joint Venture in the future
|
99.00 | % | 99.00 | % | 99.00 | % | ||||||
|
Risk free interest rate
|
3.30 | % | 3.85 | % | 4.66 | % | ||||||
The Put has no expiration date. Accordingly, we will continue to recognize a liability for the Put and mark it to market each quarter until it is exercised or until the arrangements with Olympus are amended.
Olympus-Cytori Joint Venture
The Joint Venture has exclusive access to our Celution® System device technology for the development, manufacture, and supply of such systems to us. Once second generation Celution® System is developed and approved by regulatory agencies, the Joint Venture will exclusively supply us with these systems at a formula-based transfer price. We have retained all marketing rights (subject to our various distribution arrangements) to sell the Celution® System devices for all therapeutic applications of adipose regenerative cells.
As part of the various agreements with Olympus, we will be required, following commercialization of the Joint Venture’s Celution® System or Systems, to provide monthly forecasts to the Joint Venture specifying the quantities of each category of devices that we intend to purchase over a rolling six-month period. Although we are not subject to any minimum purchase requirements, we are obliged to buy a minimum percentage of the products forecasted by us in such reports. Since we can effectively control the number of devices we will agree to purchase and because no commercial devices have yet been developed to trigger the forecast requirement, we estimate that the fair value of this guarantee is de minimis as of December 31, 2010.
In August 2007, we entered into a License and Royalty Agreement with the Joint Venture. This Royalty Agreement provides us the ability to commercialize the Celution® System platform earlier than we could have otherwise done so under the terms of the Joint Venture Agreements. The Royalty Agreement enables Cytori to manufacture the Cytori systems, including Celution® 800/CRS, until such time as the Joint Venture’s products are commercially available, subject to a reasonable royalty that will be payable to the Joint Venture for all such sales. During the years ended December 31, 2010, 2009 and 2008, in connection with our sales of our Celution® 800/CRS System products to the European and Asia-Pacific reconstructive surgery market, we incurred approximately $253,000, $242,000 and $157,000, respectively, in royalty cost related to our agreement with the Joint Venture. This cost is included as a component of cost of product revenues in our consolidated statements of operations.
61
During the fourth quarter of 2010, partial development was completed on the Joint Venture’s Celution® System to be used for research purposes only. Although not yet available for commercial sale, the Joint Venture sold systems to Cytori (see product revenue and cost of product revenue below) for use in an upcoming clinical trial.
Deferred revenues, related party
As of December 31, 2010, the deferred revenues, related party account primarily consists of the consideration we have received in exchange for contributions and obligations that we have agreed to on behalf of Olympus and the Joint Venture (less any amounts that we have recognized as revenues in accordance with our revenue recognition policies set out in note 2). These contributions include product development, regulatory approvals, and generally associated pre-clinical and clinical trials to support the commercialization of the Celution® System platform. Our obligations also include maintaining the exclusive and perpetual license to our device technology, including the Celution® System platform and certain related intellectual property.
Condensed financial information for the Joint Venture
A summary of the unaudited condensed financial information for the Joint Venture as of December 31, 2010 and 2009 and for the years ended December 31, 2010, 2009 and 2008 and reconciliation of net income (loss) of the joint venture to Cytori’s equity loss from investment in joint venture is as follows:
|
December 31, 2010
|
December 31, 2009
|
|||||||
|
(Unaudited)
|
(Unaudited)
|
|||||||
|
Balance Sheets
|
||||||||
|
Assets:
|
||||||||
|
Cash
|
$ | 183,000 | $ | 738,000 | ||||
|
Amounts due from related party
|
632,000 | 42,000 | ||||||
|
Prepaid insurance
|
16,000 | 9,000 | ||||||
|
Computer equipment and software, net
|
995,000 | 9,000 | ||||||
|
Total assets
|
$ | 1,826,000 | $ | 798,000 | ||||
|
Liabilities and Stockholders’ Equity:
|
||||||||
|
Accrued expenses
|
$ | 77,000 | $ | 54,000 | ||||
|
Amounts due to related party
|
509,000 | 18,000 | ||||||
|
Stockholders’ equity
|
1,240,000 | 726,000 | ||||||
|
Total liabilities and stockholders’ equity
|
$ | 1,826,000 | $ | 798,000 | ||||
62
|
Years ended December 31,
|
||||||||||||
|
2010
|
2009
|
2008
|
||||||||||
|
Statements of Operations
|
(Unaudited)
|
(Unaudited)
|
(Unaudited)
|
|||||||||
|
Product revenue
|
$ | 458,000 | $ | — | $ | — | ||||||
|
Cost of product revenue
|
458,000 | — | — | |||||||||
|
Gross profit
|
— | — | — | |||||||||
|
Royalty revenue
|
253,000 | 242,000 | 157,000 | |||||||||
|
Operating expenses:
|
||||||||||||
|
Research and development
|
144,000 | — | — | |||||||||
|
General and administrative:
|
||||||||||||
|
Accounting and other corporate services
|
88,000 | 75,000 | 75,000 | |||||||||
|
Quality system services
|
135,000 | 63,000 | 64,000 | |||||||||
|
Other
|
33,000 | 26,000 | 24,000 | |||||||||
|
Operating expenses
|
400,000 | 164,000 | 163,000 | |||||||||
|
Operating income (loss)
|
(147,000 | ) | 78,000 | (6,000 | ) | |||||||
|
Other income (expense):
|
||||||||||||
|
Interest income
|
1,000 | 1,000 | 5,000 | |||||||||
|
Net income (loss)
|
$ | (146,000 | ) | $ | 79,000 | $ | ( 1,000 | ) | ||||
|
Reconciliation of net income (loss) to equity loss from investment in joint venture
|
||||||||||||
|
Net income (loss)
|
$ | (146,000 | ) | $ | 79,000 | $ | ( 1,000 | ) | ||||
|
Intercompany eliminations
|
156,000 | 167,000 | 88,000 | |||||||||
|
Net loss after intercompany eliminations
|
(302,000 | ) | (88,000 | ) | (89,000 | ) | ||||||
|
Cytori’s percentage of interest in joint venture
|
50 | % | 50 | % | 50 | % | ||||||
|
Cytori’s equity loss from investment in joint
venture
|
$ | (151,000 | ) | $ | (44,000 | ) | $ | (45,000 | ) | |||
4. Fair Value Measurements
Fair value measurements are market-based measurements, not entity-specific measurements. Therefore, fair value measurements are determined based on the assumptions that market participants would use in pricing the asset or liability. We follow a three-level hierarchy to prioritize the inputs used in the valuation techniques to derive fair values. The basis for fair value measurements for each level within the hierarchy is described below:
· Level 1: Quoted prices in active markets for identical assets or liabilities.
· Level 2: Quoted prices for similar assets or liabilities in active markets; quoted prices for identical or similar instruments in markets that are not active; and model-derived valuations in which all significant inputs are observable in active markets.
· Level 3: Valuations derived from valuation techniques in which one or more significant inputs are unobservable in active markets.
63
The following table provides a summary of the recognized assets and liabilities that we measure at fair value on a recurring basis:
|
Balance as of
|
Basis of Fair Value Measurements
|
|||||||||||||||
|
December 31, 2010
|
Level 1
|
Level 2
|
Level 3
|
|||||||||||||
|
Assets:
|
||||||||||||||||
|
Cash equivalents
|
$ | 39,807,000 | $ | 39,807,000 | $ | — | $ | — | ||||||||
|
Liabilities:
|
||||||||||||||||
|
Put option liability
|
$ | (1,170,000 | ) | $ | — | $ | — | $ | (1,170,000 | ) | ||||||
|
Warrant liability
|
$ | (4,987,000 | ) | $ | — | $ | (4,987,000 | ) | $ | — | ||||||
|
Balance as of
|
Basis of Fair Value Measurements
|
|||||||||||||||
|
December 31, 2009
|
Level 1
|
Level 2
|
Level 3
|
|||||||||||||
|
Assets:
|
||||||||||||||||
|
Cash equivalents
|
$ | 10,780,000 | $ | 10,780,000 | $ | — | $ | — | ||||||||
|
Liabilities:
|
||||||||||||||||
|
Put option liability
|
$ | (1,140,000 | ) | $ | — | $ | — | $ | (1,140,000 | ) | ||||||
|
Warrant liability
|
$ | (6,272,000 | ) | $ | — | $ | (6,272,000 | ) | $ | — | ||||||
We use quoted market prices to determine the fair value of our cash equivalents, which consist of money market funds, and therefore, these are classified in Level 1 of the fair value hierarchy.
We value our put option liability (see note 3) using an option pricing theory based simulation analysis (i.e., a Monte Carlo simulation). Assumptions are made with regard to the market value of Cytori and the estimated fair value of the Joint Venture, the expected correlation between the values of Cytori and the Joint Venture, the expected volatility of Cytori and the Joint Venture, the bankruptcy recovery rate for Cytori, the bankruptcy threshold for Cytori, the probability of a change of control event for Cytori, and the risk free interest rate. Because some of the inputs to our valuation model are either non-observable quoted prices or are not derived principally from or corroborated by observable market data by correlation or other means, the put option liability is classified as Level 3 in the fair value hierarchy.
The following table summarizes the change in our Level 3 put option liability value:
|
Year ended
|
Year ended
|
|||||||
|
Put option liability
|
December 31, 2010
|
December 31, 2009
|
||||||
|
Beginning balance
|
$ | (1,140,000 | ) | $ | (2,060,000 | ) | ||
|
Decrease (increase) in fair value recognized in operating expenses
|
(30,000 | ) | 920,000 | |||||
|
Ending balance
|
$ | (1,170,000 | ) | $ | (1,140,000 | ) | ||
Common stock purchase warrants issued in connection with our August 2008 private equity placement do not trade in an active securities market, and as such, we estimate the fair value of these warrants using the Black-Scholes option pricing model in which all significant inputs are observable in active markets, such as common stock market price, volatility, and risk free rate; therefore the warrant liability is classified as Level 2 in the fair value hierarchy. See note 2 for further discussion of fair value for these warrants.
No other assets or liabilities are measured at fair value on a recurring basis, or have been measured at fair value on a non-recurring basis subsequent to initial recognition, on the accompanying consolidated balance sheet as of December 31, 2010.
64
5. Fair Value
Financial Instruments
We disclose fair value information about all financial instruments, whether or not recognized in the balance sheet, for which it is practicable to estimate fair value. The disclosures of estimated fair value of financial instruments at December 31, 2010 and 2009 were determined using available market information and appropriate valuation methods. Considerable judgment is necessary to interpret market data and develop estimated fair value. The use of different market assumptions or estimation methods may have a material effect on the estimated fair value amounts.
The carrying amounts for cash and cash equivalents, accounts receivable, inventories, other current assets, accounts payable, accrued expenses and other liabilities approximate fair value due to the short-term nature of these instruments.
We utilize quoted market prices to estimate the fair value of our fixed rate debt, when available. If quoted market prices are not available, we calculate the fair value of our fixed rate debt based on a currently available market rate assuming the loans are outstanding through maturity and considering the collateral. In determining the current market rate for fixed rate debt, a market spread is added to the quoted yields on federal government treasury securities with similar terms to debt.
At December 31, 2010 and 2009, the aggregate fair value and the carrying value of the Company’s fixed rate long-term debt were as follows:
|
December 31, 2010
|
December 31, 2009
|
|||||||||||||||
|
Fair Value
|
Carrying Value
|
Fair Value
|
Carrying Value
|
|||||||||||||
|
Fixed rate long-term debt
|
$ | 19,782,000 | $ | 19,679,000 | $ | 5,508,000 | $ | 5,460,000 | ||||||||
Carrying value includes $1,321,000 and $366,000 of debt discount as of December 31, 2010 and 2009, respectively.
Nonfinancial Assets and Liabilities
We apply fair value techniques on a non-recurring basis associated with: (1) valuing potential impairment losses related to goodwill which are accounted for pursuant to the authoritative guidance for intangibles—goodwill and other; and (2) valuing potential impairment losses related to long-lived assets which are accounted for pursuant to the authoritative guidance for property, plant and equipment.
All of our goodwill is associated with regenerative cell technology, and we determine the fair value based on a combination of inputs including the market capitalization of the company, as well as Level 3 inputs such as discounted cash flows which are not observable from the market, directly or indirectly. We conduct our goodwill impairment analysis annually as of November 30 each year, or upon the occurrence of certain triggering events. No such triggering events occurred during the year ended December 31, 2010. Historically, the fair value has significantly exceeded its carrying value.
We test for the impairment of our long-lived assets when triggering events occur and such impairment, if any, is measured at fair value. The inputs for fair value of our long lived assets would be based on Level 3 inputs as data used for such fair value calculations would be based on discounted cash flows using market place participant assumptions. No triggering events occurred during the year ended December 31, 2010.
6. Thin Film Japan Distribution Agreement
The Company has entered into a Distribution Agreement with Senko. Under this agreement, we granted to Senko an exclusive license to sell and distribute certain Thin Film products in Japan and are responsible for the completion of the initial regulatory application to the MHLW and commercialization of the Thin Film product line in Japan. Specifically, the license covers Thin Film products with the following indications:
|
·
|
Anti-adhesion,
|
65
|
·
|
Soft tissue support, and
|
|
·
|
Minimization of the attachment of soft tissues throughout the body.
|
The Distribution Agreement with Senko commences upon “commercialization.” Essentially, commercialization occurs when one or more Thin Film product registrations are completed with the MHLW. As of December 31, 2010 commercialization has not yet occurred. Following commercialization, the Distribution Agreement has a duration of five years and is renewable for an additional five years after reaching mutually agreed minimum purchase guarantees.
The Distribution Agreement also provides for us to supply certain products to Senko at fixed prices over the life of the agreement once we have received approval to market these products in Japan. In addition to the product price, Senko will also be obligated to make royalty payments to us of 5% of the sales value of any products Senko sells to its customers during the first three years post-commercialization. We are currently pursuing the required regulatory clearance in order to initiate commercialization.
At the inception of this arrangement, we received a $1,500,000 license fee which was recorded as deferred revenues in 2004. We have also received $1,250,000 in milestone payments from Senko. We have also earned or will be entitled to earn additional payments under the Distribution Agreement based on achieving the defined research and development milestones. We recognized no development revenue recognized during the years ended December 31, 2010, 2009 and 2008 under this agreement.
7. Composition of Certain Financial Statement Captions
Inventories, net
As of December 31, 2010 and 2009, inventories, net, were comprised of the following:
|
December 31,
|
||||||||
|
2010
|
2009
|
|||||||
|
Raw materials
|
$ | 2,311,000 | $ | 1,763,000 | ||||
|
Work in process
|
410,000 | 387,000 | ||||||
|
Finished goods
|
657,000 | 439,000 | ||||||
| $ | 3,378,000 | $ | 2,589,000 | |||||
Other Current Assets
As of December 31, 2010 and 2009, other current assets were comprised of the following:
|
December 31,
|
||||||||
|
2010
|
2009
|
|||||||
|
|
|
|||||||
|
Prepaid insurance
|
$ | 230,000 | $ | 288,000 | ||||
|
Prepaid other
|
477,000 | 350,000 | ||||||
|
Capitalized debt issuance costs, current
|
— | 153,000 | ||||||
|
Other receivables
|
127,000 | 233,000 | ||||||
| $ | 834,000 | $ | 1,024,000 | |||||
Property and Equipment, net
As of December 31, 2010 and 2009, property and equipment, net, were comprised of the following:
|
December 31,
|
||||||||
|
2010
|
2009
|
|||||||
|
|
|
|||||||
|
Manufacturing and development equipment
|
$ | 4,035,000 | $ | 3,080,000 | ||||
|
Office and computer equipment
|
2,137,000 | 2,049,000 | ||||||
|
Leasehold improvements
|
3,125,000 | 3,125,000 | ||||||
| 9,297,000 | 8,254,000 | |||||||
|
Less accumulated depreciation and amortization
|
(7,613,000 | ) | (6,940,000 | ) | ||||
| $ | 1,684,000 | $ | 1,314,000 | |||||
66
Accounts Payable and Accrued Expenses
As of December 31, 2010 and 2009, accounts payable and accrued expenses were comprised of the following:
|
December 31,
|
||||||||
|
2010
|
2009
|
|||||||
|
|
|
|||||||
|
Accrued legal fees
|
$ | 646,000 | $ | 476,000 | ||||
|
Accrued R&D studies
|
1,227,000 | 1,184,000 | ||||||
|
Accounts payable
|
601,000 | 1,145,000 | ||||||
|
Accrued vacation
|
760,000 | 716,000 | ||||||
|
Accrued bonus
|
1,045,000 | 974,000 | ||||||
|
Accrued expenses
|
2,077,000 | 579,000 | ||||||
|
Deferred rent
|
17,000 | 168,000 | ||||||
|
Accrued accounting fees
|
135,000 | 125,000 | ||||||
|
Accrued payroll
|
262,000 | 111,000 | ||||||
| $ | 6,770,000 | $ | 5,478,000 | |||||
8. Commitments and Contingencies
We have contractual obligations to make payments on leases of office, manufacturing, and corporate housing space as follows:
|
Years Ending December 31,
|
Operating Leases
|
|||
|
2011
|
$ | 1,778,000 | ||
|
2012
|
1,506,000 | |||
|
2013
|
1,371,000 | |||
|
2014
|
1,385,000 | |||
|
2015
|
1,172,000 | |||
|
Total
|
$ | 7,212,000 | ||
Rent expense, which includes common area maintenance, for the years ended December 31, 2010, 2009 and 2008 was $2,186,000, $2,198,000 and $2,015,000, respectively.
We have entered into agreements with various research organizations for pre-clinical and clinical development studies, which have provisions for cancellation. Under the terms of these agreements, the vendors provide a variety of services including conducting research, enrolling patients, recruiting patients, monitoring studies and data analysis. Payments under these agreements typically include fees for services and reimbursement of expenses. The timing of payments due under these agreements was estimated based on current schedules of pre-clinical and clinical studies in progress. As of December 31, 2010, we have pre-clinical research study obligations of $148,000 (all of which are expected to be complete within a year) and clinical research study obligations of $19,100,000 ($5,200,000 of which are expected to be complete within a year). Should the timing of the pre-clinical and clinical trials change, the timing of the payment of these obligations would also change.
During 2008, we entered into a supply agreement with a minimum purchase requirements clause. As of December 31, 2010, we have minimum purchase obligations of $1,307,000, which are expected to be paid within a year.
We are subject to various claims and contingencies related to legal proceedings. Due to their nature, such legal proceedings involve inherent uncertainties including, but not limited to, court rulings, negotiations between affected parties and governmental actions. Management assesses the probability of loss for such contingencies and accrues a liability and/or discloses the relevant circumstances, as appropriate. Management believes that any liability to us that may arise as a result of currently pending legal proceedings will not have a material adverse effect on our financial condition, liquidity, or results of operations as a whole.
Refer to note 3 for a discussion of our commitments and contingencies related to our transactions with Olympus, including (a) our obligation to the Joint Venture in future periods and (b) certain put and call rights embedded in the arrangements with Olympus.
Refer to note 6 for a discussion of our commitments and contingencies related to our arrangements with Senko.
Refer to note 9 for a discussion of our commitments and contingencies related to our long-term obligations.
67
|
9.
|
Long-term Obligations
|
On June 11, 2010, we entered into an Amended and Restated Loan and Security Agreement with General Electric Capital Corporation (GECC), Silicon Valley Bank (SVB) and Oxford Finance Corporation (together, the “Lenders”), pursuant to which the Lenders agreed to make a term loan in an aggregate principal amount of up to $20.0 million (Term Loan), subject to the terms and conditions set forth in the Term Loan. On June 14, 2010, the Lenders funded a Term Loan in the principal amount of $20.0 million. The Term Loan accrues interest at a fixed rate of 9.87% per annum. We are required to make monthly payments of interest-only, through March 1, 2011, and are required to repay the principal amount of the Term Loan over a period of twenty-seven (27) consecutive equal monthly installments of principal plus accrued interest, commencing on April 1, 2011. At maturity of the Term Loan, we will also make a final payment equal to 5% ($1,000,000) of the Term Loan. We may incur additional fees if we elect to prepay the Term Loan. In connection with the Term Loan, on June 11, 2010, we issued to the Lenders warrants to purchase up to an aggregate of 101,266 shares of our common stock at an exercise price of $3.95 per share. These warrants are immediately exercisable and will expire on June 11, 2017.
The Term Loan amended and restated the Original Term Loan, of which an aggregate balance of approximately $4.1 million remained outstanding along with a prorated final payment fee of $205,000. The net proceeds of the Term Loan, after payment of lender fees and expenses and the refinancing of the Original Term Loan, were approximately $15.3 million.
We accounted for this amendment to the Original Term Loan as debt modification since the terms of the amended Term Loan and the Original Term Loan were not substantially different and as present value of cash flows of the modified instrument (using a net method of comparing the present value of cash flows related to the lowest common principal balance between the old and the new loans) was within 10% of the original debt instrument. Accordingly, the fees associated with the amended Term Loan of $354,000 and the existing unamortized debt discount from the Original Term Loan of $242,000 will be amortized as an adjustment of interest expense over the remaining term of the Term Loan using the effective interest method.
We allocated the aggregate proceeds of the Term Loan between the warrants and the debt obligations based on their relative fair values. The fair value of the warrants issued to the Lenders is calculated utilizing the Black-Scholes option-pricing model. We are amortizing the relative fair value of the warrants as a discount of $279,000 over the term of the loan using the effective interest method, with an effective interest rate of 14.78%. If the maturity of the debt is accelerated due to an event of default, then the amortization would be accelerated. The Term Loan is collateralized by the tangible assets of the company, and we were in compliance with our financial and non-financial covenants as of December 31, 2010.
Additional details relating to the above term loan that is outstanding as of December 31, 2010, are presented in the following table:
|
Origination Date
|
Original Loan Amount
|
Interest
Rate
|
Current
Monthly
Payment*
|
Term
|
Remaining
Principal
(Face Value)
|
||||||||||||
|
June 2010
|
$ | 20,000,000 | 9.87 | % | $ | 170,000 |
37 Months
|
$ | 20,000,000 | ||||||||
________________________________________
* Current monthly payment is interest only
As of December 31, 2010, the future contractual principal and final fee payments on all of our debt obligations are as follows:
|
Years Ending December 31,
|
||||
|
2011
|
$ | 6,667,000 | ||
|
2012
|
8,889,000 | |||
|
2013
|
5,444,000 | |||
|
Total
|
$ | 21,000,000 | ||
68
|
Reconciliation of Face Value to Book Value as of December 31, 2010
|
||||
|
Total debt and lease obligations, including final payment fee (Face Value)
|
$ | 21,029,000 | ||
|
Less: Debt discount
|
(1,321,000 | ) | ||
|
Total:
|
19,708,000 | |||
|
Less: Current portion
|
(6,453,000 | ) | ||
|
Long-term obligation
|
$ | 13,255,000 | ||
Our interest expense for the years ended December 31, 2010, 2009 and 2008 (most of which related to the loan entered into June 2010 and October 2008 and promissory notes issued in connection with our Amended Master Security Agreement, which was fully repaid in 2008) was $2,052,000, $1,427,000 and $420,000, respectively. For the years ended December 31, 2010, 2009 and 2008, interest expense is calculated using the effective interest method, therefore it is inclusive of non-cash amortization in the amount of $706,000, $709,000 and $178,000, respectively, related to the amortization of the debt discount and capitalized loan fees.
|
10.
|
Income Taxes
|
Due to our net losses for the years ended December 31, 2010, 2009 and 2008, and since we have recorded a full valuation allowance against deferred tax assets, there was no provision or benefit for income taxes recorded. There were no components of current or deferred federal or state income tax provisions for the years ended December 31, 2010, 2009, and 2008.
A reconciliation of the total income tax provision tax rate to the statutory federal income tax rate of 34% for the years ended December 31, 2010, 2009 and 2008 is as follows:
|
2010
|
2009
|
2008
|
||||||||||
|
Income tax expense (benefit) at federal statutory rate
|
(34.00 | ) % | (34.00 | ) % | (34.00 | ) % | ||||||
|
Income tax expense (benefit) at state statutory rate
|
(2.62 | ) % | (2.61 | ) % | (5.21 | ) % | ||||||
|
Mark to market permanent adjustment
|
(1.71 | ) % | 7.21 | % | — | % | ||||||
|
Change in federal valuation allowance
|
40.47 | % | 8.16 | % | 38.38 | % | ||||||
|
Change in State Rate
|
0.00 | % | 24.55 | % | 2.89 | % | ||||||
|
Deferred revenue
|
(2.82 | ) % | (0.28 | ) % | 0.00 | % | ||||||
|
Other, net
|
0.68 | % | (3.03 | ) % | (2.06 | ) % | ||||||
| 0.00 | % | 0.00 | % | 0.00 | % | |||||||
The tax effects of temporary differences that give rise to significant portions of the deferred tax assets and deferred tax liabilities as of December 31, 2010 and 2009 are as follows:
|
2010
|
2009
|
|||||||
|
Deferred tax assets:
|
||||||||
|
Allowances and reserves
|
$ | 217,000 | $ | 305,000 | ||||
|
Accrued expenses
|
540,000 | 379,000 | ||||||
|
Deferred revenue
|
3,164,000 | 2,234,000 | ||||||
|
Stock based compensation
|
3,860,000 | 3,080,000 | ||||||
|
Net operating loss carryforwards
|
61,398,000 | 52,295,000 | ||||||
|
Income tax credit carryforwards
|
5,242,000 | 5,032,000 | ||||||
|
Property and equipment, principally due to differences in depreciation
|
821,000 | 856,000 | ||||||
| 75,242,000 | 64,181,000 | |||||||
|
Valuation allowance
|
(74,994,000 | ) | (63,859,000 | ) | ||||
|
Total deferred tax assets, net of allowance
|
248,000 | 322,000 | ||||||
|
Deferred tax liabilities:
|
||||||||
|
Intangibles
|
(151,000 | ) | (233,000 | ) | ||||
|
Capitalized Assets and other
|
(97,000 | ) | (89,000 | ) | ||||
|
Total deferred tax liability
|
(248,000 | ) | (322,000 | ) | ||||
|
Net deferred tax assets (liability)
|
$ | — | $ | — | ||||
69
We have established a valuation allowance against our net deferred tax assets due to the uncertainty surrounding the realization of such assets. We periodically evaluate the recoverability of the deferred tax assets. At such time as it is determined that it is more likely than not that deferred assets are realizable, the valuation allowance will be reduced. We have recorded a valuation allowance of $74,994,000 as of December 31, 2010 to reflect the estimated amount of deferred tax assets that may not be realized. We increased our valuation allowance by approximately $11,133,000 during the year ended December 31, 2010. The valuation allowance includes approximately $579,000 related to stock option deductions, the benefit of which, if realized, will eventually be credited to equity and not to income.
At December 31, 2010, we had federal and state tax loss carryforwards of approximately $163,320,000 and $123,275,000 respectively. The federal and state net operating loss carryforwards begin to expire in 2019 and 2011 respectively, if unused. At December 31, 2010, we had federal and state tax credit carryforwards of approximately $3,803,000 and $3,691,000 respectively. The federal credits will begin to expire in 2017, if unused, and $97,000 of the state credits will begin to expire in 2011 if unused. The remaining state credits carry forward indefinitely. In addition, we had a foreign tax loss carryforward of $8,636,000 in Japan, $733,000 in Italy, $187,000 in Switzerland, and $13,000 in India.
The Internal Revenue Code limits the future availability of net operating loss and tax credit carryforwards that arose prior to certain cumulative changes in a corporation’s ownership resulting in a change of our control. We have completed an ownership change analysis pursuant to IRC Section 382 through April 17, 2007. We do not have any ownership change limitations based on this study. We are in the process of updating this analysis through December 31, 2010.
We recognize tax benefits associated with the exercise of stock options directly to stockholders’ equity only when realized. Accordingly, deferred tax assets are not recognized for net operating loss carryforwards resulting from windfall tax benefits. At December 31, 2010, deferred tax assets do not include $1,136,000 of excess tax benefits from stock-based compensation.
We changed our accounting method of accounting for uncertain tax positions on January 1, 2007. We had no unrecognized tax benefits as of the date of adoption.
Following is a tabular reconciliation of the unrecognized tax benefits activity during the years ended December 31, 2010, 2009 and 2008:
|
2010
|
2009
|
2008
|
||||||||||
|
Unrecognized Tax Benefits – Beginning
|
$ | 1,115,000 | $ | 952,000 | $ | 716,000 | ||||||
|
Gross increases – tax positions in prior period
|
— | 4,000 | — | |||||||||
|
Gross decreases – tax positions in prior period
|
(49,000 | ) | — | — | ||||||||
|
Gross increase – current-period tax positions
|
100,000 | 159,000 | 236,000 | |||||||||
|
Settlements
|
— | — | — | |||||||||
|
Lapse of statute of limitations
|
— | — | — | |||||||||
|
Unrecognized Tax Benefits – Ending
|
$ | 1,166,000 | $ | 1,115,000 | $ | 952,000 | ||||||
None of the amount included in our liability for uncertain tax benefits if recognized would affect the Company’s effective tax rate, since it would be offset by an equal reduction in the deferred tax asset valuation allowance. The Company’s deferred tax assets are fully reserved.
The Company did not recognize interest related to unrecognized tax benefits in interest expense and penalties in operating expenses as of December 31, 2010.
The Company’s material tax jurisdictions are United States and California. The Company is currently not under examination by the Internal Revenue Service or any other taxing authority.
The Company’s tax years for 1999 and forward can be subject to examination by the United States and California tax authorities due to the carryforward of net operating losses and research development credits.
The Company does not foresee material changes to its liability for uncertain tax benefits within the next twelve months.
70
|
11.
|
Employee Benefit Plan
|
We implemented a 401(k) retirement savings and profit sharing plan (the “Plan”) effective January 1, 1999. We may make discretionary annual contributions to the Plan, which is allocated to the profit sharing accounts based on the number of years of employee service and compensation. At the sole discretion of the Board of Directors, we may also match the participants’ contributions to the Plan. We made no discretionary or matching contributions to the Plan in 2010, 2009 and 2008.
|
12.
|
Stockholders’ Equity (Deficit)
|
Preferred Stock
We have authorized 5,000,000 shares of $.001 par value preferred stock, with no shares outstanding as of December 31, 2010 and 2009. Our Board of Directors is authorized to designate the terms and conditions of any preferred stock we issue without further action by the common stockholders.
Common Stock
On February 8, 2008, we agreed to sell 2,000,000 shares of unregistered common stock to Green Hospital Supply, Inc., a related party, for $12,000,000 cash, or $6.00 per share in a private stock placement. On February 29, 2008, we closed the first half of the private placement with Green Hospital Supply, Inc. and received $6,000,000. We closed the second half of the private placement on April 30, 2008 and received the second payment of $6,000,000. As of December 31, 2010, Green Hospital Supply, Inc., a related party, holds approximately 5.77% (unaudited) of our issued and outstanding shares.
On August 11, 2008, we raised approximately $17,000,000 in gross proceeds from a private placement of 2,825,517 unregistered shares of common stock and 1,412,758 common stock warrants (with an original exercise price of $8.50 per share) to a syndicate of investors including Olympus Corporation, who acquired 1,000,000 unregistered shares and 500,000 common stock warrants in exchange for $6,000,000 of the total proceeds raised. Purchase price per unit was $6.00, with each unit consisting of one (1) common stock share and a half (0.5) common stock warrant. These warrants were not exercisable until six months after the date of issuance and will expire five years after the date the warrants are first exercisable. The warrants issued in August 2008 as part of our private placement of common stock are classified as a warrant liability in our consolidated balance sheet. See note 2 – Warrant Liability.
On March 10, 2009, we raised approximately $10,000,000 in gross proceeds from sale to institutional investors of a total of 4,771,174 shares of our common stock and warrants to purchase up to a total of 6,679,644 additional shares of our common stock at a purchase price of $2.10 per unit, with each unit consisting of one (1) share and one and four-tenths (1.4) warrants. The warrants will not be exercisable until six months after the date of issuance and will expire five years after the date the warrants are first exercisable. The warrants will have an exercise price of $2.59 per share, which was the consolidated closing bid price of the Company's common stock on March 9, 2009, as reported by NASDAQ. The shares and the warrants are immediately separable and will be issued separately. We have accounted for the warrants as a component of stockholders’ deficit. The warrants must be settled through a cash exercise whereby the warrant holder exchanges cash for shares of Cytori common stock, unless the exercise occurs when the related registration statement is not effective, in which case the warrantholder can only exercise through the cashless exercise feature of the warrant agreement.
On May 14, 2009, we raised approximately $4,252,000 in gross proceeds from a private placement of 1,864,783 shares of our common stock and warrants to purchase up to a total of 3,263,380 additional shares of our common stock at a purchase price of $2.28 per unit, with each unit consisting of one (1) share and one and three-fourths (1.75) warrants. The warrants are exercisable immediately and will expire five years after the date of issuance. The warrants will have an exercise price of $2.62 per share. We have accounted for the warrants as a component of stockholders’ deficit.
Additionally, on June 19, 2009, we entered into a common stock purchase agreement with Seaside 88, LP relating to the offering and sale of a total of up to 7,150,000 shares of our common stock. The agreement required us to issue and Seaside to buy 275,000 shares of our common stock once every two weeks, subject to the satisfaction of customary closing conditions. Upon completions of our scheduled closings pursuant to the agreement with Seaside 88, LP in June 2010, we raised approximately $30,172,000 in aggregate gross proceeds from this transaction from the sale of 7,150,000 shares of our common stock between June 2009 and June 2010, of which $17,314,000 in gross proceeds from the sale of 3,300,000 shares was raised during 2010. We have accounted for each of the completed closings as a component of stockholders’ deficit.
71
In October 2010, we entered into an underwriting agreement with Jefferies & Company, relating to the issuance and sale of 4,600,000 shares of our common stock. This price to the public in this offering was $4.50 per share and the underwriter has agreed to purchase the shares from us at a price of $4.23 per share. The transaction was completed on October 13, 2010 raising approximately $20,700,000 in gross proceeds before deducting underwriting discounts and commissions and other offering expenses payable by us.
On December 13, 2010 we raised $10,000,000 in gross proceeds from a sale of 1,428,571 shares of unregistered common stock to Astellas Pharma Inc. for $7.00 per share in a private stock placement. Pursuant to the terms of the purchase agreement, we granted Astellas Pharma Inc. a two year right of first refusal to enter into a development and commercialization collaboration with us regarding the use of our technology, on a worldwide basis, for the treatment of liver conditions. In addition, we have agreed to use reasonable efforts to file a registration statement with the Securities and Exchange Commission to register the shares of common stock for resale upon the request of Astellas Pharma Inc. We also granted Astellas Pharma Inc. a non-voting observer seat on our Board of Directors and the right to designate a representative member to our Scientific Advisory Board. The $10,000,000 in total proceeds we received exceeded the market value of our stock at the completion of the purchase agreement. The $2,526,000 difference between the proceeds received and the fair market values of our common stock is recorded as a component of deferred revenues in the accompanying balance sheet. This difference was recorded as deferred revenue since, conceptually, the excess proceeds represent a value paid by Astellas Pharma Inc. attributable to the scientific advisory board seat, the non-voting observer seat on our Board of Directors, and the two year right of first refusal to enter into a development and commercialization collaboration with us regarding the use of our technology, on a worldwide basis, for the treatment of liver conditions, rather than an additional equity investment in Cytori. The recognition of this deferred amount is expected to occur upon the earlier of the expiration of the two year period or the termination of the agreement.
Warrant Adjustments
Our March 2009 offering of 4,771,174 shares of our common stock and warrants to purchase up to a total of 6,679,644 additional shares of our common stock with an exercise price of $2.59 per share, our May 2009 equity offering of 1,864,783 shares of our common stock and warrants to purchase up to a total of 3,263,380 additional shares of our common stock with an exercise price of $2.62 per share, our closings with Seaside 88, LP through June 7, 2010, our October 2010 offering of 4,600,000 shares of our common stock and our December 2010 sale of 1,428,571 shares of our common stock triggered an adjustment to the exercise price and number of shares issuable under the warrants issued to investors in our August 2008 private placement financing. As a result, as of December 31, 2010, the common stock warrants issued on August 11, 2008 are currently exercisable for 1,994,758 shares of our common stock at an exercise price of $6.02 per share.
Treasury Stock
As part of our equity offering on March 10, 2009, we sold our remaining 1,872,834 shares of common stock from our treasury for $3,933,000 cash, or $2.10 per share. The cost basis of the treasury stock sold was at a weighted average purchase price, or $3.63 per share, resulting in a loss of $1.53 per share, or $2,861,000 in aggregate, and was accounted for as a reduction of additional paid-in capital.
|
13.
|
Stockholders Rights Plan
|
On May 28, 2003, the Board of Directors declared a dividend distribution of one preferred share purchase right (a “Right”) for each outstanding share of our common stock. The dividend is payable to the stockholders of record on June 10, 2003, and with respect to shares of common stock issued thereafter until the Distribution Date (as defined below) and, in certain circumstances, with respect to shares of common stock issued after the Distribution Date. Except as set forth below, each Right, when it becomes exercisable, entitles the registered holder to purchase from us one one-thousandth (1/1000th) of a share of our Series RP Preferred Stock, $0.001 par value per share (the “Preferred Stock”), at a price of $25.00 per one one-thousandth (1/1000th) of a share of Preferred Stock, subject to adjustment. Each share of the Preferred Stock would entitle the holder to our common stock with a value of twice that paid for the Preferred Stock. The description and terms of the Rights are set forth in a Rights Agreement (the “Rights Agreement”) between us and Computershare Trust Company, Inc., as Rights Agent, dated as of May 29, 2003, and as amended on May 12, 2005 and August 28, 2007.
72
The Rights attach to all certificates representing shares of our common stock outstanding, and are evidenced by a legend on each share certificate, incorporating the Rights Agreement by reference. The Rights trade with and only with the associated shares of our common stock and have no impact on the way in which holders can trade our shares. Unless the Rights Agreement was to be triggered, it would have no effect on the Company’s consolidated balance sheet or income statement and should have no tax effect on the Company or its stockholders. The Rights Agreement is triggered upon the earlier to occur of (i) a person or group of affiliated or associated persons having acquired, without the prior approval of the Board, beneficial ownership of 15% or more (20% or more for certain shareholders) of the outstanding shares of our common stock or (ii) 10 days, or such later date as the Board may determine, following the commencement of or announcement of an intention to make, a tender offer or exchange offer the consummation of which would result in a person or group of affiliated or associated persons becoming an Acquiring Person (as defined in the Rights Agreement) except in certain circumstances (the “Distribution Date”). The Rights are not exercisable until the Distribution Date and will expire at the close of business on May 29, 2013, unless we redeem them earlier.
|
14.
|
Stock-based Compensation
|
During 2004, we adopted the 2004 Equity Incentive Plan (the “2004 Plan”), which provides our employees, directors and consultants the opportunity to purchase our common stock through non-qualified stock options, stock appreciation rights, restricted stock units, or restricted stock and cash awards. The 2004 Plan initially provides for issuance of 3,000,000 shares of our common stock, which number may be cumulatively increased (subject to Board discretion) on an annual basis beginning January 1, 2005, which annual increase shall not exceed 2% of our then outstanding stock. As of December 31, 2010, there are 1,305,400 securities remaining and available for future issuances under 2004 Plan, which is exclusive of securities to be issued upon an exercise of outstanding options, warrants, and rights.
During 1997, we adopted the 1997 Stock Option and Stock Purchase Plan (the “1997 Plan”), which provides for the direct award or sale of shares and for the grant of incentive stock options (“ISOs”) and non-statutory options to employees, directors or consultants. The 1997 Plan, as amended, provides for the issuance of up to 7,000,000 shares of our common stock. The exercise price of ISOs cannot be less than the fair market value of the underlying shares on the date of grant. ISOs can be granted only to employees. The 1997 Plan expired on October 22, 2007.
Generally, awards issued under the 2004 Plan or the 1997 Plan are subject to four-year vesting, and have a contractual term of 10 years. Most awards contain one of the following two vesting provisions:
|
·
|
12/48 of a granted award will vest after one year of service, while an additional 1/48 of the award will vest at the end of each month thereafter for 36 months, or
|
|
·
|
1/48 of the award will vest at the end of each month over a four-year period.
|
A summary of activity for the year ended December 31, 2010 is as follows:
|
Options
|
Weighted Average Exercise Price
|
|||||||
|
Balance as of January 1, 2010
|
6,263,876 | $ | 4.84 | |||||
|
Granted
|
1,388,269 | $ | 6.30 | |||||
|
Exercised
|
(378,705 | ) | $ | 3.68 | ||||
|
Expired
|
(155,573 | ) | $ | 5.73 | ||||
|
Cancelled/forfeited
|
(26,909 | ) | $ | 5.78 | ||||
|
Balance as of December 31, 2010
|
7,090,958 | $ | 5.16 | |||||
|
Options
|
Weighted Average Exercise Price
|
Weighted Average Remaining Contractual Term (years)
|
Aggregate Intrinsic Value
|
|||||||||||||
|
Balance as of December 31, 2010
|
7,090,958 | $ | 5.16 | 5.59 | $ | 4,836,757 | ||||||||||
|
Vested and expected to vest at December 31, 2010
|
6,994,339 | $ | 5.16 | 5.55 | $ | 4,789,685 | ||||||||||
|
Exercisable at December 31, 2010
|
5,286,207 | $ | 5.03 | 4.53 | $ | 3,911,054 | ||||||||||
73
The following table summarizes information about options outstanding as of December 31, 2010:
|
Options Outstanding
|
Options Exercisable
|
|||||||||||||||||||||
|
Range of Exercise Price
|
Number of Shares
|
Weighted
Average
Exercise
Price
|
Weighted
Average
Remaining
Contractual Life
in Years
|
Number of Shares
|
Weighted
Average
Exercise
Price
|
|||||||||||||||||
|
Less than $2.00
|
65,269 | $ | 0.69 | 9.1 | 29,686 | $ | 0.63 | |||||||||||||||
| $ | 2.00 – 3.99 | 1,397,064 | $ | 3.07 | 4.7 | 1,117,037 | $ | 3.08 | ||||||||||||||
| $ | 4.00 – 5.99 | 3,219,000 | $ | 4.75 | 5.3 | 2,677,941 | $ | 4.72 | ||||||||||||||
| $ | 6.00 – 7.99 | 2,145,125 | $ | 6.80 | 6.4 | 1,236,824 | $ | 6.86 | ||||||||||||||
| $ | 8.00 – 9.99 | 214,500 | $ | 8.68 | 5.2 | 199,719 | $ | 8.67 | ||||||||||||||
|
More than $10.00
|
50,000 | $ | 10.00 | 8.6 | 25,000 | $ | 10.00 | |||||||||||||||
| 7,090,958 | 5,286,207 | |||||||||||||||||||||
The total intrinsic value of stock options exercised was $1,529,000, $682,000 and $1,849,000 for the years ended December 31, 2010, 2009 and 2008, respectively.
The fair value of each option awarded during the year ended December 31, 2010, 2009 and 2008 was estimated on the date of grant using the Black-Scholes-Merton option valuation model based on the following weighted-average assumptions:
|
Years ended December 31,
|
||||||||||||
|
2010
|
2009
|
2008
|
||||||||||
|
Expected term
|
5 years
|
5 years
|
5 years
|
|||||||||
|
Risk-free interest rate
|
2.22 | % | 1.94 | % | 2.83 | % | ||||||
|
Volatility
|
72.81 | % | 66.80 | % | 59.62 | % | ||||||
|
Dividends
|
— | — | — | |||||||||
|
Resulting weighted average grant date fair value
|
$ | 4.02 | $ | 2.34 | $ | 2.77 | ||||||
We calculated the expected term of our stock options based on our historical data. The expected term is calculated for and applied to all employee awards as a single group as we do not expect (nor does historical data suggest) substantially different exercise or post-vesting termination behavior amongst our employee population. The fair value of each option awarded during the year ended December 31, 2010 was estimated assuming an expected term of 5.0 years.
We estimate volatility based on the historical volatility of our daily stock price over the period preceding grant date commensurate with the expected term of the option.
The weighted average risk-free interest rate represents the interest rate for treasury constant maturity instruments published by the Federal Reserve Board. If the term of available treasury constant maturity instruments is not equal to the expected term of an employee option, we use the weighted average of the two Federal Reserve securities closest to the expected term of the employee option.
The dividend yield has been assumed to be zero as we (a) have never declared or paid any dividends and (b) do not currently anticipate paying any cash dividends on our outstanding shares of common stock in the foreseeable future.
The following summarizes the total compensation cost recognized in the accompanying financial statements:
|
Years ended December 31,
|
||||||||||||
|
2010
|
2009
|
2008
|
||||||||||
|
Total compensation cost for share-based payment arrangements recognized in the statement of operations (net of tax of $0)
|
$ | 3,055,000 | $ | 2,649,000 | $ | 2,257,000 | ||||||
As of December 31, 2010, the total compensation cost related to non-vested stock options not yet recognized for all of our plans is approximately $5,428,000. These costs are expected to be recognized over a weighted average period of 1.8 years.
Cash received from stock option and warrant exercises for the years ended December 31, 2010, 2009 and 2008 was approximately $7,128,000, $531,000 and $795,000, respectively. No income tax benefits have been recorded related to the stock option exercises as the benefits have not been realized in our income tax returns.
74
To settle stock option awards that will be exercised, we will issue new shares of our common stock. At December 31, 2010, we have an aggregate of 31,209,600 shares authorized and available to satisfy option exercises under our plans.
Non-Employee Stock Based Compensation
During the third quarter of 2009, we issued 25,000 shares of restricted common stock to a non-employee consultant. The stock is restricted in that it cannot be sold for a specified period of time. There are no vesting requirements. Because the shares issued are not subject to additional future vesting or service requirements, the stock-based compensation expense of $92,000 recorded in the third quarter of 2009 constitutes the entire expense related to this grant, and no future period charges will be incurred.
15. Related Party Transactions
During the year ended December 31, 2010, we recognized $583,000 in product revenues, related party, from our sales transactions through our distribution partner, Green Hospital Supply, Inc. During first quarter of 2009, we sold StemSource® Cell Bank in Japan through our distribution partner, Green Hospital Supply, Inc. for $600,000. The sale was completed pursuant to our Master Cell Banking and Cryopreservation Agreement, effective August 13, 2007, with Green Hospital Supply, Inc. No similar sales occurred during the year ended December 31, 2008. As of December 31, 2010, 2009 and 2008, Green Hospital, Inc. was a beneficial owner of more than five percent of our outstanding shares of common stock.
During the year ended December 31, 2010, 2009 and 2008, we incurred approximately $253,000, $242,000 and $157,000 in royalty costs in connection with our sales of our Celution® 800/CRS System products to the European and Asia-Pacific reconstructive surgery market, pursuant to our License and Royalty Agreement with the Olympus -Cytori, Inc. joint venture, respectively. As of December 31, 2010, 2009 and 2008, Olympus Corporation was a beneficial owner of more than five percent of our outstanding shares of common stock.
Additionally, refer to note 3 for a discussion of related party transactions with Olympus and note 12 for a discussion of related party transactions with Green Hospital Supply, Inc.
|
16.
|
Subsequent Events
|
We have evaluated any events or transactions occurring after December 31, 2010, the balance sheet date, and noted that there have been no such events or transactions which would effect our consolidated financial statements for the year ended December 31, 2010.
75
|
17.
|
Quarterly Information (unaudited)
|
The following unaudited quarterly financial information includes, in management’s opinion, all the normal and recurring adjustments necessary to fairly state the results of operations and related information for the periods presented.
|
For the three months ended
|
||||||||||||||||
|
March 31,
2010
|
June 30,
2010
|
September 30,
2010
|
December 31,
2010
|
|||||||||||||
|
Product revenues
|
$ | 2,266,000 | $ | 2,091,000 | $ | 1,519,000 | $ | 2,378,000 | ||||||||
|
Gross profit
|
1,336,000 | 1,208,000 | 599,000 | 1,203,000 | ||||||||||||
|
Development revenues
|
2,143,000 | 7,000 | 65,000 | 158,000 | ||||||||||||
|
Operating expenses
|
5,555,000 | 6,257,000 | 10,255,000 | 9,975,000 | ||||||||||||
|
Other income (expense)
|
(371,000 | ) | (335,000 | ) | (826,000 | ) | (639,000 | ) | ||||||||
|
Net loss
|
$ | (2,447,000 | ) | $ | (5,377,000 | ) | $ | (10,417,000 | ) | $ | (9,253,000 | ) | ||||
|
Basic and diluted net loss per share
|
$ | (0.06 | ) | $ | (0.12 | ) | $ | (0.23 | ) | $ | (0.19 | ) | ||||
|
For the three months ended
|
||||||||||||||||
|
March 31,
2009
|
June 30,
2009
|
September 30,
2009
|
December 31,
2009
|
|||||||||||||
|
Product revenues
|
$ | 1,912,000 | $ | 1,277,000 | $ | 1,386,000 | $ | 1,262,000 | ||||||||
|
Gross profit
|
825,000 | 501,000 | 604,000 | 513,000 | ||||||||||||
|
Development revenues
|
8,000 | 7,264,000 | 5,000 | 1,616,000 | ||||||||||||
|
Operating expenses
|
6,437,000 | 8,194,000 | 7,028,000 | 11,224,000 | ||||||||||||
|
Other income (expense)
|
(494,000 | ) | (397,000 | ) | (383,000 | ) | (395,000 | ) | ||||||||
|
Net loss
|
$ | (6,098,000 | ) | $ | (826,000 | ) | $ | (6,802,000 | ) | $ | (9,490,000 | ) | ||||
|
Basic and diluted net loss per share
|
$ | (0.20 | ) | $ | (0.02 | ) | $ | (0.18 | ) | $ | (0.25 | ) | ||||
Item 9. Changes in and Disagreements with Accountants on Accounting and Financial Disclosure
Not applicable.
Item 9A. Controls and Procedures
Evaluation of Disclosure Controls and Procedures
We maintain disclosure controls and procedures that are designed to ensure that information required to be disclosed in our reports filed or furnished pursuant to the Exchange Act is recorded, processed, summarized and reported within the time periods specified in the Securities and Exchange Commission’s rules and forms, and that such information is accumulated and communicated to our management, including our Chief Executive Officer and Chief Financial Officer, as appropriate, to allow for timely decisions regarding required disclosure. In designing and evaluating the disclosure controls and procedures, management recognizes that any controls and procedures, no matter how well designed and operated, can provide only reasonable assurance of achieving the desired control objectives, and management necessarily is required to apply its judgment in evaluating the cost-benefit relationship of possible controls and procedures.
As required by Rule 13a-15(b) under the Exchange Act, we carried out an evaluation, under the supervision and with the participation of our management, including our Chief Executive Officer and Chief Financial Officer, of the effectiveness of the design and operation of our disclosure controls and procedures as of the end of the period covered by this Annual Report on Form 10-K. Based on the foregoing, our Chief Executive Officer and Chief Financial Officer concluded that our disclosure controls and procedures were effective and were operating at a reasonable assurance level as of December 31, 2010.
76
Management’s Report on Internal Control Over Financial Reporting
Our management is responsible for establishing and maintaining adequate internal control over financial reporting, as such term is defined in Exchange Act Rule 13a-15(f). Under the supervision and with the participation of our management, including our Chief Executive Officer and Chief Financial Officer, we have conducted an evaluation of the effectiveness of our internal control over financial reporting based on the framework in Internal Control - Integrated Framework issued by the Committee of Sponsoring Organizations of the Treadway Commission. Because of its inherent limitations, internal control over financial reporting may not prevent or detect misstatements. Also, projections of any evaluation of effectiveness to future periods are subject to the risk that controls may become inadequate because of changes in conditions, or that the degree of compliance with the policies or procedures may deteriorate. Based on our evaluation under the framework in Internal Control - Integrated Framework, our management concluded that our internal control over financial reporting was effective as of December 31, 2010.
The effectiveness of our internal control over financial reporting as of December 31, 2010 has been audited by KPMG LLP, an independent registered public accounting firm, as stated in their report, which is included herein.
Changes in Internal Control over Financial Reporting
There have been no changes in our internal control over financial reporting during the quarter ended December 31, 2010 that have materially affected, or are reasonably likely to materially affect, our internal control over financial reporting.
Item 9B. Other Information
None.
PART III
Item 10. Directors, Executive Officers and Corporate Governance
The information called for by Item 10 is incorporated herein by reference to the material under the captions “Election of Directors” and “Directors, Executive Officers and Corporate Governance” in our proxy statement for our 2010 annual stockholders’ meeting, which will be filed with the SEC on or before April 30, 2011.
Item 11. Executive Compensation
The information called for by Item 11 is incorporated herein by reference to the material under the caption “Executive Compensation” in our proxy statement for our 2010 annual stockholders’ meeting, which will be filed with the SEC on or before April 30, 2011.
Item 12. Security Ownership of Certain Beneficial Owners and Management and Related Stockholder Matters
The information called for by Item 12 is incorporated herein by reference to the material under the caption “Security Ownership of Certain Beneficial Owners and Management” in our proxy statement for our 2010 annual stockholders’ meeting, which will be filed with the SEC on or before April 30, 2011.
Item 13. Certain Relationships and Related Transactions, and Director Independence
The information called for by Item 13 is incorporated herein by reference to the material under the caption “Information Concerning Directors and Executive Officers- Certain Relationships and Related Transactions” in our proxy statement for our 2010 annual stockholders’ meeting, which will be filed with the SEC on or before April 30, 2011.
Item 14. Principal Accountant Fees and Services
The information called for by Item 14 is incorporated herein by reference to the material under the caption “Principal Accountant Fees and Services” in our proxy statement for our 2010 annual stockholders’ meeting, which will be filed with the SEC on or before April 30, 2011.
77
PART IV
Item 15. Exhibits, Financial Statement Schedules
|
(a) (1)
|
Financial Statements
|
|
|
Reports of KPMG LLP, Independent Registered Public Accounting Firm
|
||
|
Consolidated Balance Sheets as of December 31, 2010 and 2009
|
||
|
Consolidated Statements of Operations and Comprehensive Loss for the years ended December 31, 2010, 2009 and 2008
|
||
|
Consolidated Statements of Stockholders’ Equity (Deficit) for the years ended December 31, 2010, 2009 and 2008
|
||
|
Consolidated Statements of Cash Flows for the years ended December 31, 2010, 2009 and 2008
|
||
|
Notes to Consolidated Financial Statements
|
||
(a) (2) Financial Statement Schedules
SCHEDULE II — VALUATION AND QUALIFYING ACCOUNTS
For the years ended December 31, 2010, 2009 and 2008
(in thousands of dollars)
|
Balance at
beginning of
year
|
Additions (A)
|
Deductions (B)
|
Other (C)
|
Balance at
end of year
|
||||||||||||||||
|
Allowance for doubtful accounts
|
||||||||||||||||||||
|
Year ended December 31, 2010
|
$ | 751 | $ | 460 | $ | ( 1,014 | ) | $ | 109 | $ | 306 | |||||||||
|
Year ended December 31, 2009
|
$ | 122 | $ | 663 | $ | (34 | ) | $ | — | $ | 751 | |||||||||
|
Year ended December 31, 2008
|
$ | 1 | $ | 121 | $ | — | $ | — | $ | 122 | ||||||||||
|
(A)
|
Includes increases to allowances for doubtful accounts, net of any equipment recovered
|
|
(B)
|
Includes write off of uncollectible accounts receivable, net of any equipment recovered
|
|
(C)
|
Includes collections fees incurred and product sales amounts deferred that do not meet revenue recognition criteria
|
78
Table of Contents
(a)(3) Exhibits
|
Exhibit
Number
|
Description
|
|
|
1.1
|
Underwriting Agreement, dated October 8, 2010, between Cytori Therapeutics, Inc. and Jefferies & Company (filed as Exhibit 1.1 to our Form 8-K Current Report as filed on October 8, 2010 and incorporated by reference herein).
|
|
|
2.5
|
Asset Purchase Agreement dated May 30, 2007, by and between Cytori Therapeutics, Inc. and MacroPore Acquisition Sub, Inc (filed as Exhibit 2.5 to our Form 10-Q Quarterly Report as filed on August 14, 2007 and incorporated by reference herein)
|
|
|
3.1
|
Amended and Restated Certificate of Incorporation (filed as Exhibit 3.1 to our Form 10-Q Quarterly Report as filed on August 13, 2002 and incorporated by reference herein)
|
|
|
3.2
|
Amended and Restated Bylaws of Cytori Therapeutics, Inc. (filed as Exhibit 3.2 to our Form 10-Q Quarterly Report, as filed on August 14, 2003 and incorporated by reference herein)
|
|
|
3.3
|
Certificate of Ownership and Merger (effecting name change to Cytori Therapeutics, Inc.) (filed as Exhibit 3.1.1 to our Form 10-Q, as filed on November 14, 2005 and incorporated by reference herein)
|
|
|
4.1
|
Rights Agreement, dated as of May 19, 2003, between Cytori Therapeutics, Inc. and Computershare Trust Company, Inc. as Rights Agent, which includes: as Exhibit A thereto, the Form of Certificate of Designation, Preferences and Rights of Series RP Preferred Stock of Cytori Therapeutics, Inc.; as Exhibit B thereto, the Form of Right Certificate; and, as Exhibit C thereto, the Summary of Rights to Purchase Series RP Preferred Stock (filed as Exhibit 4.1 to our Form 8-A which was filed on May 30, 2003 and incorporated by reference herein)
|
|
|
4.1.1
|
Amendment No. 1 to Rights Agreement dated as of May 12, 2005, between Cytori Therapeutics, Inc. and Computershare Trust Company, Inc. as Rights Agent (filed as Exhibit 4.1.1 to our Form 8-K, which was filed on May 18, 2005 and incorporated by reference herein).
|
|
|
4.1.2
|
Amendment No. 2 to Rights Agreement, dated as of August 28, 2007, between us and Computershare Trust Company, N.A. (as successor to Computershare Trust Company, Inc.), as Rights Agent (filed as Exhibit 4.1.1 to our Form 8-K, which was filed on September 4, 2007 and incorporated by reference herein).
|
|
|
4.2
|
Form of Warrant (filed as Exhibit 4.2 to our current report on Form 8-K filed on March 10, 2009 and incorporated by reference herein).
|
|
|
10.1#
|
Amended and Restated 1997 Stock Option and Stock Purchase Plan (filed as Exhibit 10.1 to our Form 10 registration statement, as amended, as filed on March 30, 2001 and incorporated by reference herein)
|
|
|
10.1.1#
|
Board of Directors resolution adopted November 9, 2006 regarding determination of fair market value for stock option grant purposes (incorporated by reference to Exhibit 10.10.1 filed as exhibit 10.10.1 to our Form 10-K Annual Report, as filed on March 30, 2007 and incorporated by reference herein)
|
|
|
10.2+
|
Development and Supply Agreement, made and entered into as of January 5, 2000, by and between the Company and Medtronic (filed as Exhibit 10.4 to our Form 10 registration statement, as amended, as filed on June 1, 2001 and incorporated by reference herein)
|
|
|
10.3+
|
Amendment No. 1 to Development and Supply Agreement, effective as of December 22, 2000, by and between the Company and Medtronic (filed as Exhibit 10.5 to our Form 10 registration statement, as amended, as filed on June 1, 2001 and incorporated by reference herein)
|
|
|
10.5+
|
Amendment No. 2 to Development and Supply Agreement, effective as of September 30, 2002, by and between the Company and Medtronic, Inc. (filed as Exhibit 2.4 to our Current Report on Form 8-K which was filed on October 23, 2002 and incorporated by reference herein)
|
|
|
10.7
|
Amended Master Security Agreement between the Company and General Electric Corporation, September, 2003 (filed as Exhibit 10.1 to our Form 10-Q Quarterly Report, as filed on November 12, 2003 and incorporated by reference herein)
|
|
|
10.10#
|
2004 Equity Incentive Plan of Cytori Therapeutics, Inc. (filed as Exhibit 10.1 to our Form 8-K Current Report, as filed on August 27, 2004 and incorporated by reference herein)
|
|
|
10.10.1#
|
Board of Directors resolution adopted November 9, 2006 regarding determination of fair market value for stock option grant purposes (filed as Exhibit 10.10.1 to our Form 10-K Annual Report, as filed on March 30, 2007 and incorporated by reference herein)
|
|
|
10.11
|
Exclusive Distribution Agreement, effective July 16, 2004 by and between the Company and Senko Medical Trading Co. (filed as Exhibit 10.25 to our Form 10-Q Quarterly Report, as filed on November 15, 2004 and incorporated by reference herein)
|
|
|
10.12#
|
Notice and Agreement for Stock Options Grant Pursuant to Cytori Therapeutics, Inc. 1997 Stock Option and Stock Purchase Plan; (Nonstatutory) (filed as Exhibit 10.19 to our Form 10-Q Quarterly Report, as filed on November 15, 2004 and incorporated by reference herein)
|
|
|
10.13#
|
Notice and Agreement for Stock Options Grant Pursuant to Cytori Therapeutics, Inc. 1997 Stock Option and Stock Purchase Plan; (Nonstatutory) with Cliff (filed as Exhibit 10.20 to our Form 10-Q Quarterly Report, as filed on November 15, 2004 and incorporated by reference herein)
|
|
|
10.14#
|
Notice and Agreement for Stock Options Grant Pursuant to Cytori Therapeutics, Inc. 1997 Stock Option and Stock Purchase Plan; (Incentive) (filed as Exhibit 10.21 to our Form 10-Q Quarterly Report, as filed on November 15, 2004 and incorporated by reference herein)
|
|
|
10.15#
|
Notice and Agreement for Stock Options Grant Pursuant to Cytori Therapeutics, Inc. 1997 Stock Option and Stock Purchase Plan; (Incentive) with Cliff (filed as Exhibit 10.22 to our Form 10-Q Quarterly Report, as filed on November 15, 2004 and incorporated by reference herein)
|
|
|
10.16#
|
Form of Options Exercise and Stock Purchase Agreement Relating to the 2004 Equity Incentive Plan (filed as Exhibit 10.23 to our Form 10-Q Quarterly Report, as filed on November 15, 2004 and incorporated by reference herein)
|
|
|
10.17#
|
Form of Notice of Stock Options Grant Relating to the 2004 Equity Incentive Plan (filed as Exhibit 10.24 to our Form 10-Q Quarterly Report, as filed on November 15, 2004 and incorporated by reference herein)
|
|
|
10.22
|
Common Stock Purchase Agreement dated April 28, 2005, between Olympus Corporation and the Company (filed as Exhibit 10.21 to our Form 10-Q Quarterly Report as filed on August 15, 2005 and incorporated by reference herein)
|
|
|
10.23
|
Sublease Agreement dated May 24, 2005, between Biogen Idec, Inc. and the Company (filed as Exhibit 10.21 to our Form 10-Q Quarterly Report as filed on August 15, 2005 and incorporated by reference herein)
|
|
|
10.27+
|
Joint Venture Agreement dated November 4, 2005, between Olympus Corporation and the Company (filed as Exhibit 10.27 to our Form 10-K Annual Report as filed on March 30, 2006 and incorporated by reference herein)
|
|
|
10.28+
|
License/ Commercial Agreement dated November 4, 2005, between Olympus-Cytori, Inc. and the Company (filed as Exhibit 10.28 to our Form 10-K Annual Report as filed on March 30, 2006 and incorporated by reference herein)
|
|
|
10.28.1
|
Amendment One to License/ Commercial Agreement dated November 14, 2007, between Olympus-Cytori, Inc. and the Company (filed as Exhibit 10.28.1 to our Form 10-K Annual Report as filed on March 14, 2008 and incorporated by reference herein).
|
|
|
10.29+
|
License/ Joint Development Agreement dated November 4, 2005, between Olympus Corporation, Olympus-Cytori, Inc. and the Company (filed as Exhibit 10.29 to our Form 10-K Annual Report as filed on March 30, 2006 and incorporated by reference herein)
|
|
|
10.29.1
|
Amendment No. 1 to License/ Joint Development Agreement dated May 20, 2008, between Olympus Corporation, Olympus-Cytori, Inc. and the Company (filed as Exhibit 10.29.1 to our Form 10-Q Quarterly Report as filed on August 11, 2008 and incorporated by reference herein).
|
|
|
10.30+
|
Shareholders Agreement dated November 4, 2005, between Olympus Corporation and the Company (filed as Exhibit 10.30 to our Form 10-K Annual Report as filed on March 30, 2006 and incorporated by reference herein)
|
|
|
10.32
|
Common Stock Purchase Agreement, dated August 9, 2006, by and between Cytori Therapeutics, Inc. and Olympus Corporation (filed as Exhibit 10.32 to our Form 8-K Current Report as filed on August 15, 2006 and incorporated by reference herein)
|
|
|
10.33
|
Form of Common Stock Subscription Agreement, dated August 9, 2006 (Agreements on this form were signed by Cytori and each of respective investors in the Institutional Offering) (filed as Exhibit 10.33 to our Form 8-K Current Report as filed on August 15, 2006 and incorporated by reference herein)
|
|
|
10.34
|
Placement Agency Agreement, dated August 9, 2006, between Cytori Therapeutics, Inc. and Piper Jaffray & Co. (filed as Exhibit 10.34 to our Form 8-K Current Report as filed on August 15, 2006 and incorporated by reference herein)
|
|
|
10.39+
|
Exclusive License Agreement between us and the Regents of the University of California dated October 16, 2001 (filed as Exhibit 10.10 to our Form 10-K Annual Report as filed on March 31, 2003 and incorporated by reference herein)
|
|
|
10.39.1 +
|
Amended and Restated Exclusive License Agreement, effective September 26, 2006, by and between The Regents of the University of California and Cytori Therapeutics, Inc. (filed as Exhibit 10.39 to our Form 10-Q Quarterly Report as filed on November 14, 2006 and incorporated by reference herein)
|
|
|
10.42
|
Placement Agency Agreement, dated February 23, 2007, between Cytori Therapeutics, Inc. and Piper Jaffray & Co. (filed as Exhibit 10.1 to our Form 8-K Current Report as filed on February 26, 2007 and incorporated by reference herein).
|
|
|
10.43
|
Financial services advisory engagement letter agreement, dated February 16, 2007, between Cytori Therapeutics, Inc. and WBB Securities, LLC (filed as Exhibit 10.2 to our Form 8-K Current Report as filed on February 26, 2007 and incorporated by reference herein)
|
|
|
10.44
|
Form of Subscription Agreement, dated February 23, 2007 (filed as Exhibit 10.3 to our Form 8-K Current Report as filed on February 26, 2007 and incorporated by reference herein)
|
|
|
10.45
|
Form of Warrant to be dated February 28, 2007 (filed as Exhibit 10.4 to our Form 8-K Current Report as filed on February 26, 2007 and incorporated by reference herein)
|
|
|
10.46
|
Common Stock Purchase Agreement, dated March 28, 2007, by and between Cytori Therapeutics, Inc. and Green Hospital Supply, Inc. (filed as Exhibit 10.46 to our Form 10-Q Quarterly Report as filed on May 11, 2007 and incorporated by reference herein).
|
|
|
10.47
|
Consulting Agreement, dated May 3, 2007, by and between Cytori Therapeutics, Inc. and Marshall G. Cox. (filed as Exhibit 10.47 to our Form 10-Q Quarterly Report as filed on August 14, 2007 and incorporated by reference herein).
|
|
|
10.48+
|
Master Cell Banking and Cryopreservation Agreement, effective August 13, 2007, by and between Green Hospital Supply, Inc. and Cytori Therapeutics, Inc. (filed as Exhibit 10.48 to our Form 10-Q Quarterly Report as filed on November 13, 2007 and incorporated by reference herein).
|
|
|
10.48.1
|
Amendment No. 1 to Master Cell Banking and Cryopreservation Agreement, effective June 4, 2008, by and between Green Hospital Supply, Inc. and the Company (filed as Exhibit 10.48.1 to our Form 8-K Current Report as filed on June 10, 2008 and incorporated by reference herein).
|
|
|
10.49+
|
License & Royalty Agreement, effective August 23, 2007, by and between Olympus-Cytori, Inc. and Cytori Therapeutics, Inc. (filed as Exhibit 10.49 to our Form 10-Q Quarterly Report as filed on November 13, 2007 and incorporated by reference herein).
|
|
|
10.50
|
General Release Agreement, dated August 13, 2007, between John Ransom and Cytori Therapeutics, Inc. (filed as Exhibit 10.49 to our Form 10-Q Quarterly Report as filed on November 13, 2007 and incorporated by reference herein).
|
|
|
10.51
|
Common Stock Purchase Agreement, dated February 8, 2008, by and between Green Hospital Supply, Inc. and Cytori Therapeutics, Inc. (filed as Exhibit 10.51 to our Form 8-K Current Report as filed on February 19, 2008 and incorporated by reference herein).
|
|
|
10.51.1
|
Amendment No. 1 to Common Stock Purchase Agreement, dated February 29, 2008, by and between Green Hospital Supply, Inc. and Cytori Therapeutics, Inc. (filed as Exhibit 10.51.1 to our Form 8-K Current Report as filed on February 29, 2008 and incorporated by reference herein).
|
|
|
10.52#
|
Agreement for Acceleration and/or Severance, dated January 31, 2008, by and between Christopher J. Calhoun and Cytori Therapeutics, Inc. (filed as Exhibit 10.52 to our Form 10-K Annual Report as filed on March 14, 2008 and incorporated by reference herein).
|
|
|
10.53#
|
Agreement for Acceleration and/or Severance, dated January 31, 2008, by and between Marc H. Hedrick and Cytori Therapeutics, Inc. (filed as Exhibit 10.53 to our Form 10-K Annual Report as filed on March 14, 2008 and incorporated by reference herein).
|
|
|
10.54#
|
Agreement for Acceleration and/or Severance, dated January 31, 2008, by and between Mark E. Saad and Cytori Therapeutics, Inc. (filed as Exhibit 10.54 to our Form 10-K Annual Report as filed on March 14, 2008 and incorporated by reference herein).
|
|
|
10.55
|
Common Stock Purchase Agreement, dated August 7, 2008, by and between the Company and Olympus Corporation (filed as Exhibit 10.32 to our current report on Form 8-K filed on August 8, 2008 and incorporated by reference herein).
|
|
|
10.55.1
|
Amendment No. 1 to Common Stock Purchase Agreement, dated August 8, 2008, by and between the Company and Olympus Corporation (filed as Exhibit 10.32.1 to our current report on Form 8-K filed on August 14, 2008 and incorporated by reference herein).
|
|
|
10.56
|
Securities Purchase Agreement, dated August 7, 2008, by and among the Company and the Purchasers identified on the signature pages thereto (filed as Exhibit 10.33 to our current report on Form 8-K filed on August 8, 2008 and incorporated by reference herein).
|
|
|
10.57
|
Form of Warrant to Purchase Common Stock issued on August 11, 2008 pursuant to the Securities Purchase Agreement, dated August 7, 2008, by and among the Company and the Purchasers identified on the signature pages thereto (filed as Exhibit 10.34 to our current report on Form 8-K filed on August 8, 2008 and incorporated by reference herein).
|
|
|
10.58
|
Registration Rights Agreement, dated August 7, 2008, by and among the Company and the Purchasers identified on the signature pages thereto (filed as Exhibit 10.35 to our current report on Form 8-K filed on August 8, 2008 and incorporated by reference herein).
|
|
|
10.59
|
Loan and Security Agreement, dated October 14, 2008, by and among the Company, General Electric Capital Corporation, and the other lenders signatory thereto (filed as Exhibit 10.59 to our Form 10-K Annual Report filed on March 6, 2009 and incorporated by reference herein).
|
|
|
10.60
|
Promissory Note issued by the Company in favor of General Electric Capital Corporation or any subsequent holder thereof, pursuant to the Loan and Security Agreement dated October 14, 2008 (filed as Exhibit 10.60 to our Form 10-K Annual Report filed on March 6, 2009 and incorporated by reference herein).
|
|
|
10.61
|
Warrant to Purchase Common Stock issued by the Company on October 14, 2008 in favor of GE Capital Equity Investments, Inc., pursuant to the Loan and Security Agreement dated October 14, 2008 (filed as Exhibit 10.61 to our Form 10-K Annual Report filed on March 6, 2009 and incorporated by reference herein).
|
|
|
10.62
|
Warrant to Purchase Common Stock issued by the Company on October 14, 2008 in favor of Silicon Valley Bank, pursuant to the Loan and Security Agreement dated October 14, 2008 (filed as Exhibit 10.62 to our Form 10-K Annual Report filed on March 6, 2009 and incorporated by reference herein).
|
|
|
10.63
|
Form of Subscription Agreement by and between Cytori Therapeutics, Inc. and the Purchaser (as defined therein), dated as of March 9, 2009 (filed as Exhibit 10.63 to our current report on Form 8-K filed on March 10, 2009 and incorporated by reference herein).
|
|
|
10.64
|
Placement Agency Agreement, dated March 9, 2009, between Cytori Therapeutics, Inc. and Piper Jaffray & Co. (filed as Exhibit 10.64 to our current report on Form 8-K filed on March 10, 2009 and incorporated by reference herein).
|
|
|
10.65
|
Securities Purchase Agreement, dated May 7, 2009, by and among Cytori Therapeutics, Inc. and the Purchasers identified on the signature pages thereto (filed as Exhibit 10.63 to our current report on Form 8-K filed on May 8, 2009 and incorporated by reference herein).
|
|
|
10.66
|
Form of Warrant to Purchase Common Stock to be issued on or about May 11, 2009 (filed as Exhibit 10.64 to our current report on Form 8-K filed on May 8, 2009 and incorporated by reference herein).
|
|
|
10.67
|
Registration Rights Agreement, dated May 7, 2009, by and among Cytori Therapeutics, Inc. and the Purchasers identified on the signature pages thereto (filed as Exhibit 10.65 to our current report on Form 8-K filed on May 8, 2009 and incorporated by reference herein).
|
|
|
10.68
|
Form of Common Stock Purchase Agreement by and between Cytori Therapeutics, Inc. and Seaside 88, LP, dated as of June 19, 2009 (filed as Exhibit 10.68 to our current report on Form 8-K filed on June 22, 2009 and incorporated by reference herein).
|
|
|
10.69
|
Lease Agreement entered into on April 2, 2010, between HCP Callan Rd, LLC. and Cytori Therapeutics, Inc. (filed as Exhibit 10.69 to our Form 10-Q Quarterly Report as filed on May 6, 2010 and incorporated by reference herein).
|
|
|
10.70
|
Amended and Restated Loan and Security Agreement, dated June 11, 2010, by and among the Company, General Electric Capital Corporation, and the other lenders signatory thereto (filed as Exhibit 10.70 to our current report on Form 8-K filed on June 17, 2010 and incorporated by reference herein)
|
|
|
10.71
|
Promissory Note issued by the Company in favor of General Electric Capital Corporation or any subsequent holder thereof, pursuant to the Loan and Security Agreement dated June 11, 2010 (filed as Exhibit 10.71 to our current report on Form 8-K filed on June 17, 2010 and incorporated by reference herein)
|
|
|
10.72
|
Promissory Note issued by the Company in favor of Oxford Financial Corporation or any subsequent holder thereof, pursuant to the Loan and Security Agreement dated June 11, 2010 (filed as Exhibit 10.72 to our current report on Form 8-K filed on June 17, 2010 and incorporated by reference herein)
|
|
|
10.73
|
Warrant to Purchase Common Stock issued by the Company on June 11, 2010 in favor of GE Capital Equity Investments, Inc., pursuant to the Amended and Restated Loan and Security Agreement dated June 11, 2010 (filed as Exhibit 10.73 to our current report on Form 8-K filed on June 17, 2010 and incorporated by reference herein)
|
|
|
10.74
|
Warrant to Purchase Common Stock issued by the Company on June 11, 2010 in favor of Silicon Valley Bank, pursuant to the Amended and Restated Loan and Security Agreement dated June 11, 2010 (filed as Exhibit 10.74 to our current report on Form 8-K filed on June 17, 2010 and incorporated by reference herein)
|
|
|
10.75
|
Warrant to Purchase Common Stock issued by the Company on June 11, 2010 in favor of Oxford Financial Corporation, pursuant to the Amended and Restated Loan and Security Agreement dated June 11, 2010 (filed as Exhibit 10.75 to our current report on Form 8-K filed on June 17, 2010 and incorporated by reference herein)
|
|
|
10.76
|
Common Stock Purchase Agreement, dated December 6, 2010, by and among Cytori Therapeutics, Inc. and Astellas Pharma Inc. (filed as Exhibit 10.76 to our current report on Form 8-K filed on December 9, 2010 and incorporated by reference herein)
|
|
|
10.77
|
Form of Notice and Restricted Stock Award Agreement for grants of performance-based restricted stock awards under the 2004 Equity Incentive Plan (filed as Exhibit 10.1 to our current report on Form 8-K filed on March 4, 2011 and incorporated by reference herein)
|
|
|
14.1
|
Code of Ethics (filed as Exhibit 14.1 to our Annual Report on Form 10-K which was filed on March 30, 2004 and incorporated by reference herein)
|
|
|
23.1
|
Consent of KPMG LLP, Independent Registered Public Accounting Firm (filed herewith).
|
|
|
31.1
|
Certification of Principal Executive Officer Pursuant to Securities Exchange Act Rule 13a-14(a), as adopted pursuant to Section 302 of the Sarbanes-Oxley Act of 2002 (filed herewith).
|
|
|
31.2
|
Certification of Principal Financial Officer Pursuant to Securities Exchange Act Rule 13a-14(a), as adopted pursuant to Section 302 of the Sarbanes-Oxley Act of 2002 (filed herewith).
|
|
|
32.1
|
Certifications Pursuant to 18 U.S.C. Section 1350/ Securities Exchange Act Rule 13a-14(b), as adopted pursuant to Section 906 of the Sarbanes - Oxley Act of 2002 (filed herewith).
|
_______________________________________
+ Portions of these exhibits have been omitted pursuant to a request for confidential treatment.
# Indicates management contract or compensatory plan or arrangement.
79
SIGNATURES
Pursuant to the requirements of Section 13 or 15(d) of the Securities Exchange Act of 1934, the registrant has duly caused this registration statement to be signed on its behalf by the undersigned, thereunto duly authorized.
|
CYTORI THERAPEUTICS, INC.
|
||
|
By:
|
/s/ Christopher J. Calhoun
|
|
|
Christopher J. Calhoun
|
||
|
Chief Executive Officer
|
||
|
March 11, 2011
|
||
Pursuant to the requirements of the Securities Exchange Act of 1934, this annual report has been signed below by the following persons on behalf of the registrant and in the capacities and on the dates indicated.
|
SIGNATURE
|
TITLE
|
DATE
|
||
|
/s/ Ronald D. Henriksen
|
Chairman of the Board of Directors
|
March 11, 2011
|
||
|
Ronald D. Henriksen
|
||||
|
/s/ Christopher J. Calhoun
|
Chief Executive Officer, Vice-Chairman, Director (Principal Executive Officer)
|
March 11, 2011
|
||
|
Christopher J. Calhoun
|
||||
|
/s/ Marc H. Hedrick, MD
|
President, Director
|
March 11, 2011
|
||
|
Marc H. Hedrick, MD
|
||||
|
/s/ Mark E. Saad
|
Chief Financial Officer (Principal Financial Officer)
|
March 11, 2011
|
||
|
Mark E. Saad
|
||||
|
/s/ John W. Townsend
|
Chief Accounting Officer
|
March 11, 2011
|
||
|
John W. Townsend
|
||||
|
/s/ David M. Rickey
|
Director
|
March 11, 2011
|
||
|
David M. Rickey
|
||||
|
Director
|
March 11, 2011
|
|||
|
Rick Hawkins
|
||||
|
/s/ E. Carmack Holmes, MD
|
Director
|
March 11, 2011
|
||
|
E. Carmack Holmes, MD
|
||||
|
/s/ Paul W. Hawran
|
Director
|
March 11, 2011
|
||
|
Paul W. Hawran
|
||||
|
/s/ Lloyd H. Dean
|
Director
|
March 11, 2011
|
||
|
Lloyd H. Dean
|
80