Attached files
Table of Contents
UNITED STATES
SECURITIES AND EXCHANGE COMMISSION
WASHINGTON, D.C. 20549
FORM 10-K
Annual Report Pursuant to Section 13 or 15(d) of the
Securities Exchange Act of 1934
FOR THE FISCAL YEAR ENDED DECEMBER 31, 2010
Commission No. 333-128166-10
Affinia Group Intermediate Holdings Inc.
(Exact name of registrant as specified in its charter)
Delaware
(State or other jurisdiction of incorporation or organization)
I.R.S. Employer Identification Number: 34-2022081
1101 Technology Drive
Ann Arbor, MI 48108
(734) 827-5400
Securities registered pursuant to Section 12(b) of the Act: None
Securities registered pursuant to Section 12(g) of the Act: None
Indicate by check mark if the registrant is a well-known seasoned issuer, as defined in Rule 405 of the Securities Act. Yes ¨ No x
Indicate by check mark if the registrant is not required to file reports pursuant to Section 13 or 15(d) of the Exchange Act. Yes x No ¨
Indicate by check mark whether the registrant (1) has filed all reports required to be filed by Section 13 or 15(d) of the Securities Exchange Act of 1934 during the preceding 12 months (or for such shorter period that the registrant was required to file such reports), and (2) has been subject to such filing requirements for the past 90 days. Yes ¨ No x
(Note: As a voluntary filer not subject to the filing requirements of Section 13 or 15(d) of the Exchange Act, the registrant has filed all reports required to be filed by Section 13 or 15(d) of the Exchange Act during the preceding 12 months (or for such shorter period that the registrant would have been required to file such reports) as if it were subject to such filing requirements).
Indicate by check mark whether the registrant has submitted electronically and posted on its corporate Website, if any, every Interactive Data File required to be submitted and posted pursuant to Rule 405 of Regulation S-T during the preceding 12 months (or for such shorter period that the registrant was required to submit and post such files). Yes ¨ No ¨
Indicate by check mark if disclosure of delinquent filers pursuant to Item 405 of Regulation S-K is not contained herein, and will not be contained, to the best of the registrant’s knowledge, in definitive proxy or information statements incorporated by reference in Part III of this Form 10-K or any amendment to this Form 10-K. x
Indicate by check mark whether the registrant is a large accelerated filer, an accelerated filer, a non-accelerated filer. See the definitions of “large accelerated filer”, “accelerated filer” and “smaller reporting company” in Rule 12b-2 of the Exchange Act:
| Large accelerated filer | ¨ | Accelerated Filer | ¨ | |||
| Non-accelerated filer | x (Do not check if a smaller reporting company) | Smaller Reporting Company | ¨ | |||
Indicate by check mark whether the registrant is a shell company (as defined in Rule 12b-2 of the Exchange Act). Yes ¨ No x
There were 1,000 shares outstanding of the registrant’s common stock as of March 11, 2011 (all of which are privately owned and not traded on a public market).
Table of Contents
i
Table of Contents
| Page | ||||||
| Item 8. |
Financial Statements and Supplementary Data | 43 | ||||
| Item 9. |
Changes In and Disagreements with Accountants on Accounting and Financial Disclosure | 88 | ||||
| Item 9A. |
Controls and Procedures | 88 | ||||
| Item 9B. |
Other Information | 88 | ||||
| PART III. | ||||||
| Item 10. |
Directors, Executive Officers and Corporate Governance | 89 | ||||
| Item 11. |
Executive Compensation | 93 | ||||
| Item 12. |
Security Ownership of Certain Beneficial Owners and Management and Related Stockholder Matters | 111 | ||||
| Item 13. |
Certain Relationships and Related Transactions and Director Independence | 114 | ||||
| Item 14. |
Independent Registered Public Accounting Firm Fees | 116 | ||||
| PART IV. | ||||||
| Item 15. |
Exhibits and Financial Statement Schedules | 116 | ||||
ii
Table of Contents
Cautionary Note Regarding Forward-Looking Statements
This report includes “forward-looking statements” within the meaning of Section 27A of the Securities Act of 1933, as amended (the “Securities Act”) and Section 21E of the Securities Exchange Act of 1934, as amended (the “Exchange Act”). These forward-looking statements include statements concerning our plans, objectives, goals, strategies, future events, future revenue or performance, capital expenditures, financing needs, plans or intentions relating to acquisitions, business trends and other information that is not historical information. When used in this report, the words “anticipates,” “believes,” “estimates,” “expects,” “forecasts,” “intends,” “plans,” “projects,” or future or conditional verbs, such as “could” “may,” “should,” or “will,” and variations of such words or similar expressions are intended to identify forward-looking statements. All forward-looking statements, including, without limitation, management’s examination of historical operating trends and data are based upon our current expectations and various assumptions. Our expectations, beliefs and projections are expressed in good faith and we believe there is a reasonable basis for them. However, there is no assurance that these expectations, beliefs and projections will be achieved. With respect to all forward-looking statements, we claim the protection of the safe harbor for forward-looking statements contained in the Private Securities Litigation Reform Act of 1995.
There are a number of risks and uncertainties that could cause our actual results to differ materially from the forward-looking statements contained in this report. Such risks, uncertainties and other important factors include, among others, continued volatility in and disruption to the global economy and the resulting impact on the availability and cost of credit; financial viability of key customers and key suppliers; our dependence on our largest customers; increased crude oil and gasoline prices and resulting reductions in global demand for the use of automobiles; the shift in demand from premium to economy products; pricing and pressures from imports; increasing costs for manufactured components; the expansion of return policies or the extension of payment terms; risks associated with our non-U.S. operations; risks related to our receivables factoring arrangements; product liability and warranty and recall claims; reduced inventory levels by our distributors resulting from consolidation and increased efficiency; environmental and automotive safety regulations; the availability of raw materials, manufactured components or equipment from our suppliers; challenges to our intellectual property portfolio; our ability to develop improved products; the introduction of improved products and services that extend replacement cycles otherwise reduce demand for our products; our ability to achieve cost savings from our restructuring plans; work stoppages, labor disputes or similar difficulties that could significantly disrupt our operations; our ability to successfully combine our operations with any businesses we have acquired or may acquire; risk of impairment charges to our long-lived assets; risk of impairment to intangibles and goodwill; the risk of business disruptions; risks associated with foreign exchange rate fluctuations; risks associated with our expansion into new markets; risks associated with increased levels of drug-related violence in Juarez, Mexico; the impact on our tax rate resulting from the mix of our profits and losses in various jurisdictions; reductions in the value of our deferred tax assets; difficulties in developing, maintaining or upgrading information technology systems; risks associated with doing business in corrupting environments; our substantial leverage and limitations on flexibility in operating our business contained in our debt agreements. Additionally, there may be other factors that could cause our actual results to differ materially from the forward-looking statements.
iii
Table of Contents
PART I.
| Item 1. | Business |
We are a global leader in the light and commercial vehicle replacement products and services industry, which also is referred to as the aftermarket. Our extensive aftermarket product offering consists principally of filtration, brake and chassis products. Our filtration products fit heavy and medium duty trucks, light vehicles, equipment in the off-highway market (i.e., construction, mining, forestry and agricultural) and equipment for industrial and marine applications. Our brake and chassis products fit light vehicles and heavy and medium duty trucks. In addition, we provide aftermarket products and distribution services in South America. We believe that the growth of the global aftermarket, from which we derived approximately 98% of our net sales in 2010, is predominantly driven by the size, age and use of the population of vehicles and equipment in operation. We design, manufacture, distribute and market a broad range of aftermarket products in North America, South America, Europe, Asia and Africa and generate sales in over 70 countries. Based on management estimates and certain information from third parties, we believe that we hold the #1 market position in North American aftermarket filtration and brake products and the #2 market positions in North American aftermarket chassis products and Brazilian aftermarket parts distribution by net sales for the year ended December 31, 2010.
Our aftermarket products can be classified into two primary groups:
| (1) | Routine maintenance products, such as oil, fuel, air and other filters. The regular replacement cycle for these types of products provides a stable and recurring revenue stream. For example, we estimate that the oil filter will be replaced on an average heavy duty truck eight to ten times each year and on a typical light duty vehicle three to four times each year. |
| (2) | Wear products that are designed to be replaced occasionally, such as brake and chassis products (e.g., pads, rotors, shoes, drums, shock absorbers, steering and other suspension products). For example, brake pads will be replaced multiple times over the life of a light vehicle and more frequently over the life of a typical severe use or heavy duty truck. |
We believe that these are the most attractive product groups of the aftermarket given the higher frequency of replacement for filters and brake products and the historical and expected growth in these product groups due to increasing regulatory and consumer focus on the environmental and safety benefits of these products. Our filtration products and systems are critical to the efficient operations of the engine and passenger air quality, while our brake and chassis products are essential for the safety of the vehicle.
We market our products under a variety of well-known brands, including WIX®, Raybestos®, Nakata®, Brake-Pro®, Filtron™, AIMCO® and McQuay-Norris®. Additionally, we provide private label products to large aftermarket distributors, including NAPA®, CARQUEST® and ACDelco®, as well as co-branded products for Federated and ADN. We believe that we have achieved our leading market positions due to the quality and reputation of our brands and products among professional installers, who are the primary decision makers for the purchase of the products we supply to the aftermarket. Professional installers are highly incentivized to order reliable, well-known aftermarket products when repairing a vehicle because the cost of the products is passed through to the end consumer and, once the repair is made, installers are expected to stand behind their work by replacing any malfunctioning products without charging for the replacement or for the additional labor required. We believe that the reputation of our brands and products for form, fit, function and quality promotes significant demand for our products from these installers and throughout the aftermarket supply chain. Our reputation for reliability has helped us penetrate retailers whose customers have become increasingly sophisticated about the quality of the products they install in their vehicles.
In addition to servicing the light vehicle population, we sell to medium and heavy duty truck fleets and repair facilities through many of our customers, such as NAPA, CARQUEST, the Alliance and other independent warehouse distributors. We also serve the off-highway market through our large customers and have successfully developed products for new non-vehicle related opportunities in stationary equipment and wind generation applications.
1
Table of Contents
Our principal product areas are described below:
| Product Area |
Representative Brands |
Product Description | ||
| Filtration | WIX, FILTRON, NAPA, CARQUEST and ecoLAST | Oil, air, fuel, hydraulic and other filters for light, medium and heavy duty on and off-highway vehicle, industrial and marine applications | ||
| Brakes | Raybestos, BrakePro, AIMCO, NAPA, CARQUEST and ACDelco | Drums, rotors, calipers, friction and hydraulic components | ||
| Distribution – South America | Nakata, Bosch and WIX | Steering, shock absorbers and other suspension and driveline components, brakes, fuel and water pumps and other aftermarket products | ||
| Chassis | Raybestos, Nakata, NAPA Chassis, McQuay-Norris and ACDelco |
Steering, suspension and driveline components | ||
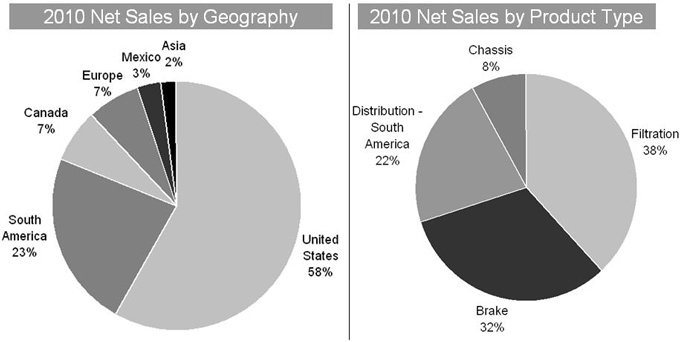
Our net sales for 2010 were approximately $2.0 billion. The following charts illustrate our net sales by geography and product type for the fiscal year ended December 31, 2010, excluding our Commercial Distribution Europe business unit, which we sold on February 2, 2010. For further information about our segments and our sales by geographic region, refer to “Note 21. Segment Information,” which is included in Item 8. Financial Statements and Supplementary Data.
The registrant is a Delaware corporation formed on October 18, 2004 and controlled by affiliates of The Cypress Group L.L.C. (“Cypress”). The registrant’s direct wholly-owned subsidiary Affinia Group Inc., a Delaware corporation formed on June 28, 2004, entered into a stock and asset purchase agreement, as amended (the “Purchase Agreement”), with Dana Corporation (“Dana”) on July 8, 2004. The Purchase Agreement provided for the acquisition by Affinia Group Inc. of substantially all of Dana’s aftermarket business operations (the “Acquisition”). The Acquisition was completed on November 30, 2004, for a purchase price of $1.0 billion.
All references in this report to “Affinia,” “Company,” “we,” “our,” and “us” mean, unless the context indicates otherwise, Affinia Group Intermediate Holdings Inc. and its subsidiaries on a consolidated basis.
As a result of the Acquisition, investment funds controlled by Cypress hold approximately 61% of the common stock of Affinia Group Holdings Inc. (“Holdings”), which directly owns 100% of our common stock, and therefore Cypress controls us. The other principal investors in Holdings are the following: OMERS Administration Corporation (formerly known as Ontario Municipal Employees Retirement Board), California State Teachers Retirement System, The Northwestern Mutual Life Insurance Company and Stockwell Capital.
2
Table of Contents
On December 15, 2005, Holdings, our parent company, entered into stockholder and other agreements with certain officers, directors and key employees (collectively, the “Executives”) of the Company, pursuant to which those Executives purchased an aggregate of 9,520 shares of Holdings common stock for $100 per Share in cash. Holdings received aggregate proceeds of $952,000 as a result of the offering, which was made pursuant to the Affinia Group Holdings Inc. 2005 Stock Incentive Plan (“2005 Stock Plan”). Since 2005, Holdings has re-purchased some of those shares and has issued a small amount of additional shares, and a shareholder ceased to be an Executive of the Company, as a result of which there were 5,463 shares of Holdings common stock held by Executives outstanding as of December 31, 2010 (excluding shares issued pursuant to our non-qualified deferred compensation plan).
On October 30, 2008, Holdings authorized 9.5% Class A Convertible preferred stock, with an initial issuance price of $1,000 per share, consisting of 150,000 shares. Holdings issued 51,475 shares of its preferred stock on October 31, 2008 to its investors and certain of our executives. As of December 31, 2010 there were 51,450 shares of Holdings preferred stock outstanding (excluding accrued dividends).
3
Table of Contents
Ownership Structure
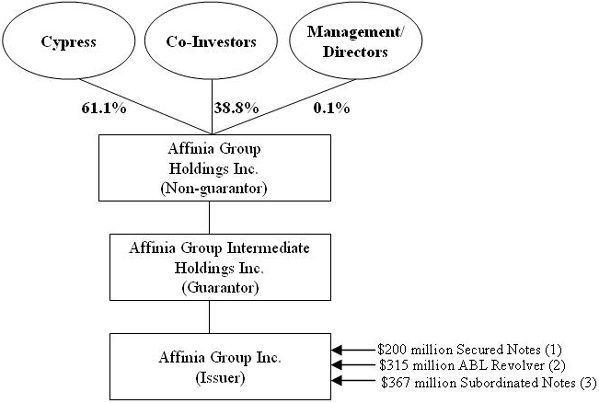
| (1) | On August 13, 2009, Affinia Group Inc. issued $225 million in aggregate principal amount of 10.75% Senior Secured Notes due 2016 (“Secured Notes”). The Secured Notes were offered at a price of 98.799% of their face value, resulting in $222 million of net proceeds. The discount, which is $2 million as of December 31, 2010, is being amortized based on the effective interest rate method and included in interest expense until the Secured Notes mature. The Secured Notes are guaranteed on a senior secured basis by Affinia Group Intermediate Holdings Inc. and certain of our current and future wholly-owned domestic subsidiaries. On December 1, 2010, Affinia Group Inc. issued an irrevocable notice of redemption to redeem $22.5 million aggregate principal amount of the Secured Notes on December 31, 2010, pursuant to their terms at a redemption price equal to 103% of the principal amount of such notes being redeemed, plus accrued and unpaid interest to the redemption date. As of December 31, 2010, $200 million of the Secured Notes were outstanding net of a $2 million discount. |
| (2) | Our asset-based revolving credit facility provides for borrowings of up to $315 million (the “ABL Revolver”). The Canadian Dollar equivalent of up to $20 million U.S. Dollars of the ABL Revolver can be made available, subject to certain collateral obligations, for borrowings by a Canadian subsidiary. As of December 31, 2010, we had $90 million of outstanding borrowings under the ABL Revolver, and approximately $191 million was available for borrowings under the ABL Revolver after giving effect to $15 million of outstanding and undrawn letters of credit and $3 million of borrowing base reserves, which reduce available borrowings. |
| (3) | On November 30, 2004, Affinia Group Inc. issued $300 million in aggregate principal amount of 9% Senior Subordinated Notes due 2014 (“Subordinated Notes”). The Subordinated Notes are guaranteed on a senior subordinated basis by Affinia Group Intermediate Holdings Inc. and certain of our current and future wholly-owned domestic subsidiaries. During the second quarter of 2009, Affinia Group Holdings Inc. purchased approximately $33 million principal amount of the Subordinated Notes in the open market and thereafter contributed such notes to Affinia Group Intermediate Holdings Inc., which contributed such notes to Affinia Group Inc. Affinia Group Inc. promptly surrendered such notes for cancellation. On December 9, 2010, we completed an offering of an additional $100 million aggregate principal amount of Subordinated Notes (the “Additional Notes”). As of December 31, 2010, $367 million in aggregate principal amount of the Subordinated Notes was outstanding. |
Our extensive product offering fits nearly every car, truck, off-highway and agricultural make and model on the road, allowing us to serve as a full line supplier to our customers for our product categories. These customers primarily comprise large aftermarket distributors and retailers selling to professional technicians or installers. Our customer base also includes original equipment service (“OES”) participants such as ACDelco. Many of our customers are leading aftermarket companies, including NAPA, CARQUEST, Aftermarket Auto Parts Alliance (“the Alliance”), Uni-Select Inc., O’Reilly Auto Parts, and Federated Auto Parts. As an active participant in the aftermarket for more than 60 years, we have many long-standing customer relationships.
4
Table of Contents
We derived approximately 98% of our 2010 net sales from the on and off-highway replacement products and services industry, which is also referred to as the aftermarket. We believe that the aftermarket will continue to grow as a result of the increase in the light vehicle population and the average age of light vehicles. According to the Automotive Aftermarket Industry Association (“AAIA”), the U.S. aftermarket decreased by 2.4% during 2009. In 2010, the industry was forecasted to increase by 3.8% and continue in 2011 with 3.4% growth.
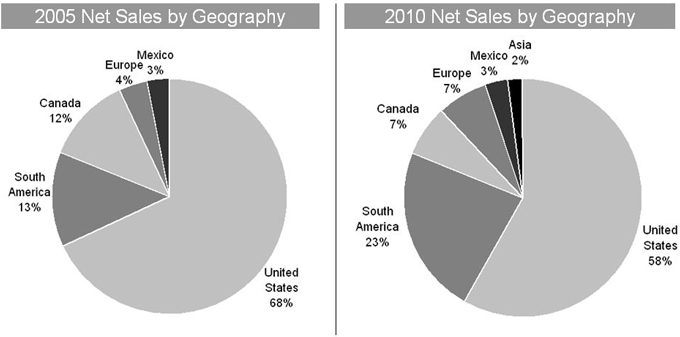
Our broad range of brake, chassis and filtration products are primarily sold in North America, Europe and South America. We are also focusing on expanding manufacturing capabilities globally to position us to take advantage of global growth opportunities. With our current operations in China and India and two additional facilities being constructed in China we believe we are well positioned in Asia. In the future we plan to sell our broad product offering in China and other Asian markets. The percentage of sales by geographic region has changed over the last five years as outlined in the chart below. For information about our segments and our sales by geographic region, refer to “Note 21. Segment Information,” which is included in Item 8. Financial Statements and Supplementary Data. Excluded from the charts is our Commercial Distribution Europe segment which is classified as a discontinued operation and was sold on February 2, 2010 (refer to Note 4 Discontinued Operation, which is included in Item 8 of this report).
On December 16, 2010, the Company, through its subsidiary Affinia Products Corp LLC, acquired substantially all the assets of North American Parts Distributors, Inc. (“NAPD”), which is located in Ramsey, New Jersey. NAPD designs and engineers chassis products, which are manufactured by contractors in low labor cost countries. The NAPD acquisition expands our product offering of chassis parts to one of the broadest in the industry. We acquired NAPD’s assets and liabilities for cash consideration of $52 million, subject to an adjustment based on the difference between targeted working capital and actual working capital at the closing date. We accounted for this acquisition under the purchase method of accounting and the results of operations are included in our consolidated financial statements from the date of acquisition. This acquisition was considered immaterial for disclosure of supplemental pro forma information and revenues and earnings of the acquiree since the acquisition date. We financed this acquisition with available borrowings under our ABL Revolver, which borrowings were repaid with the proceeds from our completed offering on December 9, 2010 of the Additional Notes.
In December 2010, the Company acquired the remaining 50% ownership interest in Affinia India Private Limited (formerly known as Affinia MAT India Braking Private Limited), the Company’s India joint venture, for $24 million in cash, increasing our ownership interest from 50% to 100%. The acquisition was not subject to any post closing purchase price adjustments or earn-outs. We had a controlling financial interest in Affinia India Private Limited prior to the purchase of the remaining 50% interest. Since we had control prior to the purchase, we accounted for the transaction as an equity transaction consistent with ASC Topic 810, “Consolidation.” We financed this acquisition with available borrowings under our ABL Revolver, which borrowings were repaid with proceeds from our completed offering on December 9, 2010 of the Additional Notes.
5
Table of Contents
Comprehensive Restructuring
In 2005, we announced two restructuring plans: (i) a restructuring plan that we announced at the beginning of 2005 as part of the Acquisition, also referred to herein as the “acquisition restructuring” and (ii) a restructuring plan that we announced at the end of 2005, also referred to herein as the “comprehensive restructuring” (collectively, the “restructuring plans”). We have completed the acquisition restructuring and we are in the process of completing the comprehensive restructuring. We have closed 36 facilities during the last five years and have shifted some of our manufacturing base to lower labor cost countries such as China, India, Ukraine and Mexico.
In connection with the comprehensive restructuring, we modified our hydraulic product offering from a premium line and a value line to one distinct product offering that most resembles the value line in cost but the premium line in product attributes. In addition, for our drum and rotor product offering, we have retained the premium line but have expanded the coverage in our value line product offering. Lastly, for our friction product offerings we have reduced the product offerings from multiple lines to three product offerings. Even with the reduction in offerings we still retain what we believe is one of our key advantages over our competitors, which is a diverse product offering.
In connection with the comprehensive restructuring, we have recorded $167 million in restructuring costs to date and we expect to record an additional $4 million in restructuring costs for the remainder of the comprehensive restructuring.
Other Restructuring
At the end of 2009, we approved the closure of our distribution operations located in Mississauga, Ontario, Canada. The operations closed at the end of the first quarter of 2010. The closure of this operation was part of the Company’s continuing effort to improve its distribution system and serve the replacement parts market effectively and efficiently. The charges were comprised of employee severance costs of approximately $1 million and other trailing liabilities of approximately $4 million. We incurred approximately $4 million in 2010 and $1 million in 2009 related to the closure of this facility. We anticipate another $2 million in restructuring costs in 2011 related to the closure of the facility.
On May 3, 2010, we announced the closure of our brake manufacturing operations located in Maracay, Edo Aragua, Venezuela. The operations closed during the second quarter of 2010. We incurred pre-tax charges of approximately $7 million, of which approximately $4 million were cash expenditures. The charges were comprised of employee severance costs of $3 million, asset impairments of $3 million, and other trailing liabilities of $1 million. We will still continue to distribute brake products in Venezuela, which we import from other low cost manufacturing sources. Our Venezuelan filter operation was unaffected by the closure of the brake manufacturing operation.
Statements regarding industry outlook, our expectations regarding the performance of our business and other non-historical statements are forward-looking statements. These forward-looking statements are subject to numerous risks and uncertainties, including, but not limited to, the risks and uncertainties described under “Forward-Looking Statements.” Our actual results may differ materially from those contained in or implied by any forward-looking statements. You should read the following discussion together with “Forward-Looking Statements,” “Item 6. Selected Consolidated and Combined Financial Data” and “Item 8. Financial Statements and Supplementary Data.”
According to JD Power, there were a total of one billion light, medium and heavy duty vehicles registered worldwide in 2009. Approximately 259 million, or 25%, of these vehicles were registered in the United States. According to the AAIA, the overall size of the U.S. aftermarket was approximately $274 billion in 2009. We are one of the largest independent participants in the global aftermarket, based on our sales in over 70 countries and offer what we believe is the broadest line within our product categories. To facilitate efficient inventory management and timely vehicle owner customer service, many of our customers and professional installers rely on larger suppliers like us to have full line product offerings, consistent value-added services and timely delivery. There are important advantages to having meaningful size and scale in the aftermarket, including the ability to support significant distribution operations, offer sophisticated supply chain management capabilities and provide a broad line of quality products.
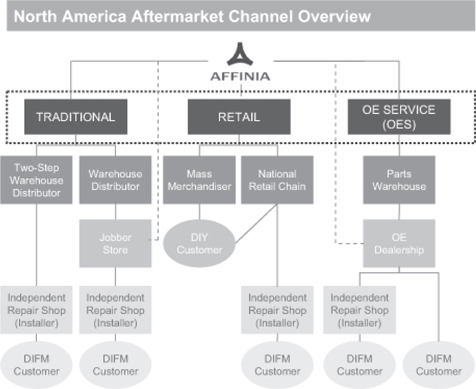
In general, aftermarket industry participants can be categorized into three major groups: (1) manufacturers of parts, (2) distributors of replacement parts (without manufacturing capabilities) and (3) installers, both professional and do-it-yourself (“DIY”) customers. Distributors purchase products from manufacturers and sell them to wholesale or retail operations, which in turn sell them to installers.
6
Table of Contents
The distribution business is comprised of the (1) traditional, (2) retail and (3) OES channels. Typically, professional installers purchase their products through the traditional channel, and DIY customers purchase products through the retail channel. The traditional channel includes such well-known distributors as NAPA, CARQUEST, Federated, the Alliance, Uni-Select and ADN. Through a network of distribution centers, these distributors sell primarily to owned or affiliated stores, which in turn supply professional installers. The retail channel includes merchants such as AutoZone, O’Reilly Auto Parts, and Canadian Tire. The OES channel consists primarily of vehicle manufacturers’ service departments at new vehicle dealerships. The distribution business is illustrated by the chart below.
We believe that future growth in aftermarket product sales will be driven by the following key factors:
Growth in global vehicle population. JD Power estimates that the world’s total vehicle population in 2009 was approximately 1.0 billion and expects it to continue to grow at a compound annual growth rate (“CAGR”) of 3.2% from 2009 to 2015. In particular, JD Power expects that the total vehicle populations of several key emerging markets will grow significantly over the next several years, as indicated by the forecasted CAGRs in vehicle population from 2009 to 2015 for the following geographic areas:
| • | Brazil – 3.0% |
| • | China – 13.7% |
| • | Eastern Europe – 2.9% |
| • | India – 10.2% |
Growth in global commercial vehicle population. JD Power estimates that there were approximately 170 million commercial vehicles registered globally in 2009 and expects the commercial vehicle population to continue to grow at a CAGR of 2.9% from 2009 to 2015. In particular, JD Power expects that the U.S. commercial vehicle population will grow at a CAGR of 1.4% from 2009 to 2015 and that the commercial vehicle populations of several key emerging markets will grow significantly over the next several years, as indicated by the forecasted CAGRs in commercial vehicle population from 2009 to 2015 for the following geographic areas:
| • | Brazil – 4.1% |
| • | China – 6.5% |
| • | Eastern Europe – 3.6% |
| • | India – 5.5% |
7
Table of Contents
Increase in total miles driven in the United States. In the United States, the total miles driven rose from 2.15 trillion in 1990 to 3.00 trillion in 2010, an increase of approximately 40%. Since 1980, annual miles driven in the United States have increased every year except for 2008.
Increase in average age of light vehicles in the United States. As of 2009, the average light vehicle age in the United States was 10.2 years, compared to an average of 8.8 years in 1999. As the average light vehicle age continues to rise, we believe that the use of aftermarket products will generally increase as well.
Increase in vehicle related regulation and legislation. Increase in environmental and safety legislation that is being adopted on a global basis has led to an increase in demand for high value filtration and brake products.
Our principal product areas are described below:
| Product |
2010 Net
Sales (Dollars in Millions) |
Percent of 2010 Net Sales |
Representative Brands | Product Description | ||||||||
| Filtration products | $ | 759 | 38 | % | WIX, FILTRON, NAPA, CARQUEST and ecoLAST |
Oil, fuel, air, hydraulic and other filters for light-, | ||||||
| Brake North America & Asia |
633 | 32 | % | Raybestos, NAPA, CARQUEST, BrakePro, AIMCO and ACDelco |
Drums, rotors, calipers, pads and shoes and hydraulic components | |||||||
| Commercial Distribution South |
430 | 22 | % | Nakata and WIX | Steering, suspension, driveline components, brakes, fuel and water pumps and other aftermarket products | |||||||
| Chassis products |
169 | 8 | % | Raybestos Chassis, NAPA Chassis, McQuay-Norris, ACDelco and Nakata |
Steering, suspension and driveline components | |||||||
| Total On and Off-Highway |
1,991 | 100 | % | |||||||||
| Brake South America products |
15 | 1 | % | |||||||||
| Corporate, Eliminations and other |
(15 | ) | (1 | )% | ||||||||
| Net sales of continuing operations |
1,991 | |||||||||||
Filtration Products. We are a leading designer, manufacturer, marketer and distributor of a broad range of filtration products for the aftermarket and we are one of the few aftermarket suppliers of both heavy duty and light duty filters. Our filtration business includes manufacturing operations in Europe and South America. Our filtration product lines include oil, air, fuel, hydraulic and other filters for light, medium and heavy duty on and off-highway vehicle, industrial and marine applications.
Brake Products. We are a leading designer, manufacturer, marketer and distributor of a broad range of brake products for the aftermarket. We have an extensive offering of high quality, premium brake products. Our brake products include master cylinders, wheel cylinders, hardware and hydraulics, drums, shoes, linings, bonded/riveted segments, rotors, brake pads, calipers and castings.
Commercial Distribution South America Products. We manufacture and/or distribute products in Brazil, Argentina, Uruguay and Venezuela, including fuel and water pumps, universal joint kits, axle sets, shocks, steering, filtration products, brake products, suspension parts and other aftermarket products.
8
Table of Contents
Chassis Products. We are a leading designer, manufacturer, marketer and distributor of a broad range of chassis products for the aftermarket. Our chassis products include steering, suspension and driveline products such as ball joints, tie rods, Pitman arms, idler arms, drag links, control arms, center links, stabilizers and other related parts.
We distribute our products across several sales channels, including traditional, retail and OES channels. Approximately 27% and 8% of our 2010 net sales from continuing operations were derived from our two largest customers, NAPA and CARQUEST, respectively. See “Risk Factors”—Our Business would be materially and adversely affected if we lost any of our larger customers.” During 2010, we derived approximately 58% of our net sales from the United States and approximately 42% of our net sales from other countries.
We have maintained long-standing relationships with many of our top customers. Some of our most significant customers include NAPA, CARQUEST, ADN, ACDelco, Federated, ADN, Uni-Select, Les Schwab, the Alliance and O’Reilly Auto Parts, each of which is a key player in the aftermarket.
The following table provides a description of the primary sales channels to which we supply our products:
| Primary Sales Channels |
Description |
Customers | ||
| Traditional | Warehouses and distribution centers that supply local distribution outlets, which sell to professional installers. | NAPA, CARQUEST, Federated, ADN, the Alliance and Uni-Select | ||
| Retail | Retail stores, including national chains that sell replacement parts directly to consumers (the DIY market) and to some professional installers. | O’Reilly Auto Parts and AutoZone | ||
| OES | Vehicle manufacturers and service departments at vehicle dealerships. | ACDelco, Robert Bosch, TRW Automotive and Chrysler | ||
The traditional channel is important to us because it is the primary source of products for professional installers. We believe that the quality and reputation of our brands for form, fit, and function promotes significant demand for our products from these installers and throughout the aftermarket supply chain. We have many long-standing relationships with leading distributors in the traditional channel such as NAPA and CARQUEST, for whom we have manufactured products for approximately 40 and 20 years, respectively.
As retailers become increasingly focused on consolidating their supplier base, we believe that our broad product offering, product quality, sales and marketing support and customer service capabilities make us more valuable to these customers.
Recently, automobile dealerships have begun providing “all-makes” service whereby dealers will service a vehicle even if they do not sell the make or model being serviced. These dealerships can choose to purchase competitive components from aftermarket suppliers. We believe the volumes generated by OES customers, especially in brakes, may provide an opportunity for sales growth.
We believe that our emphasis on customer support has been a key factor in maintaining our leading market positions. We continuously seek to improve service, order turnaround time, product coverage and order accuracy. Our ability to replenish inventory quickly is important to customers as it enables them to maximize their sales while carrying reduced inventory levels. For these reasons, we ship the vast majority of orders within 24 to 48 hours of receipt.
In order to maintain the competitiveness of our existing customers and maximize new sales opportunities, we have extensive product coverage. In turn, this has allowed our customers to develop a reputation for carrying the parts their customers need, especially for newer vehicles for which warranties may not have expired and aftermarket parts are not generally available.
In addition, as the aftermarket becomes more electronically integrated, customers often prefer to receive their application information electronically as well as in print form. We provide both printed and electronic catalog media. We also provide products which are problem solvers for professional installers, such as alignment products that allow installers to properly align a vehicle, even though the vehicle was not equipped with adjustment features. We provide many other support features, such as technical support hot lines and training and electronic systems which interface with customers and conform to aftermarket industry standards.
9
Table of Contents
We strategically manage our portfolio of patents, trade secrets, copyrights, trademarks and other intellectual property.
As of December 31, 2010, we maintain and have pending in excess of 250 patents and patent applications on a worldwide basis. These patents expire over various periods up to the year 2030. We do not materially rely on any single patent or group of patents. In addition, we believe that the expiration of any single patent or group of patents will not materially affect our business. We have proprietary trade secrets, technology, know-how, processes and other intellectual property rights that are not registered.
Trademarks are important to our business activities. We have a robust worldwide program of trademark registration and enforcement to maintain and strengthen the value of the trademarks and prevent the unauthorized use of our trademarks. The Raybestos and WIX trade names are highly recognizable to the public and are valuable assets. Additionally, we use numerous other trademarks which are registered worldwide or for which we claim common law rights. As of December 31, 2010, we had in excess of 750 active trademark registrations and applications worldwide.
Raw Materials and Manufactured Components
We use a broad range of manufactured components and raw materials in our products, including steel, steel-related components, filtration media, aluminum, brass, iron, rubber, resins, plastics, paper and packaging materials. We purchase raw materials from a wide variety of domestic and international suppliers, and we have not, in recent years, experienced any significant shortages of these items and normally do not carry inventories of these items in excess of those reasonably required to meet our production and shipping schedule. Raw materials comprise the largest component of our manufactured goods cost structure.
With our commitment to globalization, we are subject to increases in freight costs due to increased oil prices. During 2010, oil prices increased in comparison to the prior year. The increase in oil prices during 2010 increased our container costs from Asia, which mainly affected our brake product operations. Steel prices increased in 2010 which caused certain of our manufactured and purchased parts costs to increase. Commodity prices for pulp increased in 2010 which increased our costs of packaging and filtration media in 2010. We will continue to review our purchasing and sourcing strategies for opportunities to reduce costs.
In a typical year, we build inventory during the first and second quarters to accommodate our peak sales during the second and third quarters. Our working capital requirements therefore tend to be highest from March through August. In periods of weak sales, inventory can increase beyond typical levels, as our product delivery lead times are less than two days while certain components we purchase from overseas require lead times of approximately 90 days.
Substantially all of the orders on hand at December 31, 2010 are expected to be filled during 2011. We do not view our backlog as being insufficient, excessive or problematic, or a significant indication of 2011 sales.
Research and Development Activities
We provide information regarding our research and development activities in Note 7. Summary of Significant Accounting Policies to our consolidated financial statements, which is included in Item 8 of this report.
The light duty filter aftermarket is comprised of several large U.S. manufacturers that compete with us, including United Components, Inc. under the brand name Champ, Honeywell International Inc. under the brand name FRAM and Purolator Filters NA LLC under the brand name Purolator, along with several international light duty filter suppliers. The heavy duty filter aftermarket is comprised of several manufacturers that compete with us, including Cummins, Inc. under the brand name Fleetguard, CLARCOR Inc. under the brand name Baldwin and Donaldson Company Inc. under the brand name Donaldson. The brake aftermarket is comprised of several large manufacturers that compete with us, including Federal Mogul Corp. under the brand name Wagner, Honeywell International Inc. under the brand name Bendix and Cardone Industries, Inc. under the brand name A1 Cardone. The chassis aftermarket is comprised primarily of one large U.S. manufacturer that competes with us, Federal Mogul Corp. under the brand name Moog, along with some international chassis suppliers. The Commercial Distribution South America products competitors include, Dpk Distribuidora de Pecas, Ltda, Pacaembu Autopeças, Polipeças Comercial e Importadora Ltda and Comdip Comercial Distribuidora de Peças Ltda. We compete on, among other things, quality, price, service, brand reputation, delivery, technology and product offerings.
10
Table of Contents
As of December 31, 2010, we had 11,835 employees, of whom 6,041 were employed in North America, 2,976 were employed in Asia, 1,650 were employed in South America and 1,168 were employed in Europe. Approximately 22% of our employees are salaried and the remaining approximately 78% of our employees are hourly. As of December 31, 2010, approximately 3% of our 4,350 U.S. employees and approximately 2% of our 246 Canadian employees were represented by unions. We consider our relations with our employees to be good.
The U.S. collective bargaining agreement covers approximately 139 employees and expires in October 2011. The Canadian collective bargaining agreement covers approximately 5 employees and expires in March 2013.
We are subject to a variety of federal, state, local and foreign environmental laws and regulations, including those governing the discharge of pollutants into the air or water, the emission of noise and odors, the management and disposal of hazardous substances or wastes, the clean-up of contaminated sites and human health and safety. Some of our operations require environmental permits and controls to prevent or reduce air and water pollution, and these permits are subject to modification, renewal and revocation by issuing authorities. Contamination has been discovered at certain of our owned properties, which is currently being monitored and/or remediated. We are not aware of any contaminated sites which we believe will result in material liabilities; however, the discovery of additional remedial obligations at these or other sites could result in significant liabilities. ASC Topic 410, “Asset Retirement and Environmental Obligations,” requires that a liability for the fair value of an Asset Retirement Obligation (“ARO”) be recognized in the period in which it is incurred if it can be reasonably estimated, with the offsetting associated asset retirement costs capitalized as part of the carrying amount of the long-lived asset.
In addition, many of our current and former facilities are located on properties with long histories of industrial or commercial operations. Because some environmental laws can impose liability for the entire cost of clean-up upon any of the current or former owners or operators, regardless of fault, we could become liable for investigating or remediating contamination at these properties if contamination requiring such activities is discovered in the future. We have incurred environmental remediation costs associated with the comprehensive restructuring and the acquisition restructuring.
We are also subject to the U.S. Occupational Safety and Health Act and similar state and foreign laws regarding worker safety. We believe that we are in substantial compliance with all applicable environmental, health and safety laws and regulations. Historically, our costs of achieving and maintaining compliance with environmental and health and safety requirements have not been material to our operations.
Available free of charge through our internet website, www.affiniagroup.com, under the investor relations tab are our recent filings of forms 10-K, 10-Q, 8-K and amendments to those reports filed with the Securities and Exchange Commission. These reports can be found on our internet website as soon as reasonably practicable after they are electronically filed with, or furnished to, the Securities and Exchange Commission. The information contained on or connected to our website is not incorporated by reference into this Annual Report on Form 10-K and should not be considered part of this or any other report filed with the Securities and Exchange Commission (SEC).
| Item 1A. | Risk Factors |
If any of the following events discussed in the following risks were to occur, our results of operations, financial conditions, or cash flows could be materially affected. Additional risks and uncertainties not presently known by us may also constrain our business operations.
Risks Relating to Our Industry and Our Business
Continued volatility in and disruption to the global economy, including the global capital and credit markets, has affected and may continue to materially and adversely affect our business, financial condition and results of operations, as well as our ability to access credit and has affected and may continue to materially and adversely affect the financial soundness of our customers and suppliers.
11
Table of Contents
The global economy, including the global capital and credit markets, has been experiencing a period of significant uncertainty, characterized by very weak or negative economic growth, high unemployment, reduced spending by consumers and businesses, the bankruptcy, failure, collapse or sale of various financial institutions and a considerable level of intervention from the United States federal government and various foreign governments. These recessionary conditions have materially and adversely affected the demand for our products and services and, therefore, reduced purchases by our customers, which has negatively affected our revenue growth and caused a decrease in our profitability. Although many vehicle maintenance and repair expenses are non-discretionary, difficult economic conditions may reduce miles driven and thereby increase periods between maintenance and repairs. In addition, interest rate fluctuations, financial market volatility or credit market disruptions may limit our access to capital, and may also negatively affect our customers’ and our suppliers’ ability to obtain credit to finance their businesses on acceptable terms. As a result, our customers’ need for and ability to purchase our products or services may decrease, and our suppliers may increase their prices, reduce their output or change their terms of sale. If our customers’ or suppliers’ operating and financial performance deteriorates, or if they are unable to make scheduled payments or obtain credit, our customers may not be able to pay, or may delay payment of, accounts receivable owed to us, and our suppliers may restrict credit or impose different payment terms. Any inability of customers to pay us for our products and services, or any demands by suppliers for different payment terms, may materially and adversely affect our earnings and cash flow.
If these economic conditions do not improve or continue to deteriorate, our results of operations or financial condition could limit our ability to take actions pursuant to certain covenants in our debt agreements that are tied to ratios based on our financial performance. Such covenants include our ability to incur additional indebtedness, make investments or pay dividends.
Our business would be materially and adversely affected if we lost any of our larger customers.
For the year ended December 31, 2010, approximately 27% and 8% of our net sales from continuing operations were to NAPA and CARQUEST, respectively. To compete effectively, we must continue to satisfy these and other customers’ pricing, service, technology and increasingly stringent quality and reliability requirements. Additionally, our revenues may be affected by decreases in NAPA’s or CARQUEST’s business or market share. Consolidation among our customers may also negatively impact our business. We cannot provide any assurance as to the amount of future business with these or any other customers. While we intend to continue to focus on retaining and winning these and other customers’ business, we may not succeed in doing so. Although business with any given customer is typically split among numerous contracts, the loss of, or significant reduction in purchases by, one of those major customers could materially and adversely affect our business, financial condition and results of operations.
Increased crude oil and gasoline prices could reduce global demand for and use of automobiles and increase our costs, which could have a material and adverse effect on our business, financial condition and results of operations.
Material increases in the price of crude oil have historically been a contributing factor to the periodic reduction in the global demand for and use of automobiles. An increase in the price of crude oil could reduce global demand for and use of automobiles and continue to shift customer demand away from larger cars and light trucks (including sport utility vehicles (“SUVs”), which we believe have more frequent replacement intervals for our products, which could have a material and adverse effect on our business, financial condition and results of operations. Demand for traditional SUVs and vans has declined in the past due, in part, to higher gasoline prices. If this trend were to continue, or if total miles driven were to decrease for a number of years, it could have a material and adverse effect on our business, financial condition and results of operations. Further, as higher gasoline prices result in a reduction in discretionary spending for auto repair by the end users of our products, our results of operations have been, and could continue to be, impacted. Additionally, higher gasoline prices have a material and adverse impact on our freight expenses.
The shift in demand from premium to economy brands may require us to produce value products at the expense of premium products, resulting in lower prices, thereby reducing our margins and decreasing our net sales.
We estimate that a majority of our net sales are currently derived from products we consider to be premium products. There has been, and may continue to be, a shift in demand from premium products, on which we can generally command premium pricing and generate enhanced margins, to value products. If such a trend continues, we may be forced to expand our production and/or purchases of value products at competitive prices. In addition, we could be forced to further reduce our prices to remain competitive, in which case our margins will decrease unless we make corresponding reductions in our cost structure.
We are subject to increasing pricing pressure from imports, particularly from lower labor cost countries.
Price competition from other aftermarket manufacturers particularly those based in lower labor cost countries, such as China, have historically played a role and may play an increasing role in the aftermarket sectors in which we compete. Pricing pressures have historically been more prevalent with respect to our brake products than our other products. While aftermarket manufacturers in these locations have historically competed primarily in markets for less technologically advanced products and manufactured a limited number of products, many are expanding their manufacturing capabilities to produce a broad range of lower labor cost, higher quality products and provide an expanded product offering. In the future, competitors in Asia or other lower labor cost sources may be able to effectively compete in our premium markets and produce a wider range of products which may force us to move additional manufacturing capacity offshore and/or lower our prices, reducing our margins and/or decreasing our net sales.
12
Table of Contents
Increasing costs for manufactured components, raw materials and energy prices may materially and adversely affect our business, financial condition and results of operations.
We use a broad range of manufactured components and raw materials in our products, including raw steel, steel-related components, filtration media, aluminum, brass, iron, rubber, resins, plastics, paper and packaging materials. Materials comprise the largest component of our manufactured goods cost structure. Increases in the price of these items could materially increase our operating costs and materially and adversely affect our profit margins. In addition, in connection with passing through steel and other raw material price increases to our customers, there has typically been a delay of up to several months in our ability to increase prices, which has temporarily impacted profitability. In the future, it may be difficult to pass further price increases on to our customers, especially if we experience additional cost increases soon after implementing price increases. In addition, we have experienced longer than typical lead times in sourcing some of our steel-related components and certain finished products, which has caused us to buy from non-preferred vendors at higher costs.
If our customers seek more expansive return policies or practices, such as extended payment terms, our cash flows and results of operations could be materially and adversely affected.
We are subject to product returns from customers, some of which manage their excess inventory by returning product to us. Our contracts with our customers typically include provisions that permit our customers to return specified levels of their purchases. Returns have historically represented approximately 2% of our sales. If returns from our customers significantly increase, our business, financial condition and results of operations may be materially and adversely affected. In addition, some customers in the aftermarket are pursuing ways to shift their costs of working capital, including extending payment terms. To the extent customers extend payment terms, our cash flows and results of operations may be materially and adversely affected.
We are subject to other risks associated with our non-U.S. operations.
We have significant manufacturing operations outside the United States, including joint ventures and other alliances. In 2010, approximately 42% of our net sales originated outside the United States. Risks inherent in international operations include:
| • | multiple regulatory requirements that are subject to change and that could restrict our ability to manufacture, market or sell our products; |
| • | inflation, recession, fluctuations in foreign currency exchange and interest rates and discriminatory fiscal policies; |
| • | trade protection measures; including increased duties and taxes, and import or export licensing requirements; |
| • | price controls; |
| • | exposure to possible expropriation or other government actions; |
| • | differing local product preferences and product requirements; |
| • | difficulty in establishing, staffing and managing operations; |
| • | differing labor regulations; |
| • | potentially negative consequences from changes in or interpretations of tax laws; |
| • | political and economic instability and possible terrorist attacks against American interests; |
| • | enforcement of remedies in various jurisdictions; and |
| • | diminished protection of intellectual property in some countries. |
These and other factors may have a material and adverse effect on our international operations or on our business, financial condition and results of operations. In addition, we may experience net foreign exchange losses due to currency fluctuations.
We are exposed to risks related to our receivables factoring arrangements.
We have entered into agreements with third-party financial institutions to factor on a non-recourse basis certain receivables. The terms of the factoring arrangements provide for the factoring of certain U.S. Dollar-denominated or Canadian Dollar-denominated receivables, which are purchased at the face amount of the receivable discounted at the annual rate of LIBOR plus a bank-determined spread on the purchase date. The amount factored is not contractually defined by the factoring arrangements and our use will vary each month based on the amount of underlying receivables and our cash flow needs. We began factoring certain of our receivables during 2010. For the year ended December 31, 2010, the total amount of receivables factored was $156 million and the cost incurred on factoring was $2 million. Receivables factored by us will be accounted for as a sale and removed from the balance sheet at the time of factoring and the cost of the factoring will be accounted for in other income. If any of the financial institutions we have factoring arrangements with experiences financial difficulties or is otherwise unable or unwilling to honor the terms of, or otherwise terminates, our factoring arrangements, we may experience material and adverse economic losses due to the failure of such factoring arrangements and the impact of such failure on our liquidity, which could have a material and adverse effect upon our financial condition, results of operations and cash flows.
13
Table of Contents
We may incur material losses and costs as a result of product liability and warranty and recall claims that may be brought against us.
We may be exposed to product liability and warranty claims in the event that our products actually or allegedly fail to perform as expected or the use of our products results, or is alleged to result, in bodily injury and/or property damage. Accordingly, we could experience material warranty or product liability losses in the future and incur significant costs to defend these claims.
In addition, if any of our products are, or are alleged to be, defective, we may be required to participate in a recall of that product if the defect or the alleged defect relates to vehicle safety. Our costs associated with providing product warranties could be material. Product liability, warranty and recall costs may have a material and adverse effect on our business, financial condition and results of operations. Our insurance may not be sufficient to cover such costs.
As a result of the consolidation driven by improved logistics and data management, distributors have reduced their inventory levels, which have reduced and could continue to reduce our sales.
Warehouse distributors have consolidated through acquisition and rationalized inventories, while streamlining their distribution systems through more timely deliveries and better data management. The corresponding reduction in purchases by distributors has negatively impacted our sales. Further consolidation or improvements in distribution systems could have a similar material and adverse impact on our sales.
We are subject to costly regulation, particularly in relation to environmental, health and safety matters, which could materially and adversely affect our business, financial condition and results of operations.
We are subject to a substantial number of costly regulations. In particular, we are required to comply with frequently changing and increasingly stringent requirements of federal, state and local environmental and occupational safety and health laws and regulations in the United States and other countries, including those governing emissions to air, discharges to air and water, and the creation and emission of noise and odor; the generation, handling, storage, transportation, treatment and disposal of waste materials; and the cleanup of contaminated properties and occupational health and safety. We could incur substantial costs, including cleanup costs, fines and civil or criminal sanctions, third-party property damage or personal injury claims, or costs to upgrade or replace existing equipment, as a result of violations of or liabilities under environmental, health and safety laws or non-compliance with environmental permits required at our facilities. In addition, many of our current and former facilities are located on properties with long histories of industrial or commercial operations. Because some environmental laws can impose joint and several liability for the entire cost of cleanup upon any of the current or former owners or operators, regardless of fault, we could become liable for investigating and/or remediating contamination at these properties if contamination requiring such activities is discovered in the future. We cannot assure that we have been, or will at all times be, in complete compliance with all environmental requirements, or that we will not incur material costs or liabilities in connection with these requirements in excess of amounts we have reserved. In addition, environmental requirements are complex, change frequently and have tended to become more stringent over time. These requirements may change in the future in a manner that could have a material and adverse effect on our business, financial condition and results of operations. We have made and will continue to make expenditures to comply with environmental requirements. These requirements, responsibilities and associated expenses and expenditures, if they continue to increase, could have a material and adverse effect on our business and results of operations. While our costs to defend and settle claims arising under environmental laws in the past have not been material, we cannot assure you that this will remain the case in the future. For more information about our environmental compliance and potential environmental liabilities, see “Item 1. Business—Environmental Matters” and “Item 3. Business—Legal Proceedings.”
Our operations would be materially and adversely affected if we are unable to purchase raw materials, manufactured components or equipment from our suppliers.
Because we purchase from suppliers various types of raw materials, finished goods, equipment and component parts, we may be materially and adversely affected by the failure of those suppliers to perform as expected. This non-performance may consist of delivery delays or failures caused by production issues or delivery of non-conforming products. The risk of non-performance may also result from the insolvency or bankruptcy of one or more of our suppliers. Our suppliers’ ability to supply products to us is also subject to a number of risks, including availability of raw materials, such as steel, destruction of their facilities or work stoppages. In addition, our failure to promptly pay, or order sufficient quantities of inventory from, our suppliers may increase the cost of products we purchase or may lead to suppliers refusing to sell products to us at all. Our efforts to protect against and to minimize these risks may not always be effective.
14
Table of Contents
Our intellectual property portfolio could be subject to legal challenges and we may be subject to certain intellectual property claims.
We have developed and actively pursue developing a considerable amount of proprietary technology in the replacement products industry and rely on intellectual property laws of the United States and other countries to protect such technology. In doing so, we incur ongoing costs to enforce and defend our intellectual property. We have from time to time been involved in litigation regarding patents and other intellectual property. We may be subject to material intellectual property claims in the future or we may incur significant costs or losses related to such claims, including payments for licenses that may not be available on reasonable terms, if at all. Our proprietary rights may be challenged, invalidated or circumvented. Moreover, third parties may independently develop technology or other intellectual property that is comparable with or similar to our own, and we may not be able to prevent the use of it.
Our success depends in part on our development of improved products, and our efforts may fail to meet the needs of customers on a timely or cost-effective basis.
Our continued success depends on our ability to maintain advanced technological capabilities, machinery and knowledge necessary to adapt to changing market demands as well as to develop and commercialize innovative products. We cannot assure you that we will be able to develop new products as successfully as in the past or that we will be able to keep pace with technological developments by our competitors and the industry generally. In addition, we may develop specific technologies and capabilities in anticipation of customers’ demands for new innovations and technologies. If such demand does not materialize, we may be unable to recover the costs incurred in such programs. If we are unable to recover these costs or if any such programs do not progress as expected, our business, financial condition or results of operations could be materially and adversely affected.
The introduction of new and improved products and services may reduce our future sales.
Improvements in technology and product quality may extend the longevity of vehicle component parts and delay aftermarket sales. In particular, in our oil filter business the introduction of oil change indicators and the use of synthetic motor oils may further extend oil filter replacement cycles. The introduction of electric, fuel cell and hybrid automobiles may pose a long-term risk to our business because these vehicles may alter demand for our primary product lines. In addition, the introduction by OEMs of increased warranty and maintenance service initiatives, which are gaining popularity, have the potential to decrease the demand for our products in the traditional and retail sales channels.
We may not be able to achieve the cost savings that we expect from the restructuring of our operations.
At the end of 2005 we announced the comprehensive restructuring through which we seek to lower costs and improve profitability by rationalizing manufacturing operations and to focus on low-cost sourcing opportunities. We have realized approximately $98 million in cost savings as a result of the comprehensive restructuring to date. However, we may not be able to achieve the level of benefits that we expect to realize or we may not be able to realize these benefits within the timeframes we currently expect. Our expectations regarding cost savings are also predicated upon maintaining our sales levels. Changes in the amount, timing and character of charges related to the restructuring, failure to complete or a substantial delay in completing the restructuring and planned divestitures or the receipt of lower proceeds from such divestitures than currently is anticipated could have a material and adverse effect on us. We expect to record an additional $4 million in comprehensive restructuring costs for the remainder of the comprehensive restructuring.
Work stoppages, labor disputes or similar difficulties could significantly disrupt our operations.
As of December 31, 2010, 139 of our U.S. employees and 5 of our Canadian employees were represented by unions. It is possible that our workforce will become more unionized in the future. We may be subject to work stoppages and may be affected by other labor disputes. A work stoppage at one or more of our plants may have a material and adverse effect on our business. Unionization activities could also increase our costs, which could have an adverse effect on our business, financial condition and results of operations.
Additionally, a work stoppage at one of our suppliers could materially and adversely affect our operations if an alternative source of supply were not readily available. Stoppages by employees of our customers also could result in reduced demand for our products.
Any acquisitions we make could disrupt our business and materially and adversely affect our business, financial condition and results of operations.
We may, from time to time, consider acquisitions of complementary companies, products or technologies. Acquisitions involve numerous risks, including difficulties in the assimilation of the acquired businesses, the diversion of our management’s attention from other business concerns and potential adverse effects on existing business relationships with current customers and suppliers. In addition, any acquisitions could involve the incurrence of substantial additional indebtedness. We cannot assure that we will be able to successfully integrate any acquisitions that we pursue or that such acquisitions will perform as planned or prove to be beneficial to our operations and cash flow. Any such failure could materially and adversely affect our business, financial condition and results of operations.
15
Table of Contents
Cypress controls us and may have conflicts of interest with us or the holders of our notes in the future.
Cypress beneficially owns 61% of the outstanding shares of our common stock. As a result, Cypress has control over our decisions to enter into any corporate transaction and has the ability to prevent any transaction that requires the approval of stockholders regardless of whether or not other stockholders or note holders believe that any such transactions are in their own best interests. Additionally, Cypress is in the business of making investments in companies and may from time to time acquire and hold interests in businesses that compete directly or indirectly with us. Cypress may also pursue, for its own account, acquisition opportunities that may be complementary to our business, and, as a result those acquisition opportunities may not be available to us. So long as Cypress continues to own a significant amount of the outstanding shares of our common stock, even if such amount is less than 50%, it will continue to be able to strongly influence or effectively control our decisions including director and officer appointments, potential mergers and acquisitions, asset sales and other significant corporate transactions.
We may be required to recognize impairment charges for our long-lived assets.
At December 31, 2010, the net carrying value of long-lived assets (property, plant and equipment) totaled $217 million. In accordance with GAAP, we periodically assess our long-lived assets to determine if they are impaired. Significant negative industry or economic trends, disruptions to our business, unexpected significant changes or planned changes in use of the assets, divestitures and market capitalization declines may result in charges to long-lived asset impairments. Future impairment charges could significantly affect our results of operations in the periods recognized. Impairment charges would also reduce our consolidated net worth and increase our debt to total capitalization ratio, which could negatively impact our access to the public debt and equity markets.
We could be required to record a material non-cash charge to income if our recorded intangible assets or goodwill is impaired, or if we shorten intangible asset useful lives.
We have $215 million of recorded intangible assets and goodwill on our consolidated balance sheet as of December 31, 2010. These assets may become impaired with the loss of significant customers or a decline of profitability. In assessing the recoverability of goodwill, projections regarding estimated future cash flows and other factors are made to determine the fair value of the respective reporting unit. If these estimates or related projections change in the future, we may be required to record impairment charges for goodwill at that time. If our trade names carrying values exceed fair value we will be required to record an impairment charge.
While our intangibles with definite lives may not be impaired, the useful lives are subject to continual assessment, taking into account historical and expected losses of relationships that were in the base at time of acquisition. This assessment may result in a reduction of the remaining useful life of these assets, resulting in potentially significant increases to non-cash amortization expense that is charged to our consolidated statement of operations. An intangible asset or goodwill impairment charge, or a reduction of amortization lives, could have a material and adverse effect on our results of operations.
Business disruptions could materially and adversely affect our future sales and financial condition or increase our costs and expenses.
Our business may be disrupted by a variety of events or conditions, including, but not limited to, threats to physical security, acts of terrorism, raw material shortages, natural and man-made disasters, information technology failures and public health crises. Any of these disruptions could affect our internal operations or services provided to customers, and could impact our sales, increase our expenses or materially and adversely affect our reputation.
Foreign exchange rate fluctuations could cause a decline in our financial condition, results of operations and cash flows.
As a result of our international operations, we are subject to risk because we generate a significant portion of our revenues and incur a significant portion of our expenses in currencies other than the U.S. Dollar. Our international presence is most significant in Brazil, Canada, China, Mexico and Poland. To the extent that we have significantly more costs than revenues generated in a foreign currency, we are subject to risk if the foreign currency appreciates because the appreciation effectively increases our cost in that country to a greater extent than our revenues. To the extent that we are unable to match revenues received in foreign currencies with costs paid in the same currency, foreign exchange rate fluctuations in that currency could have a material and adverse effect on our financial condition, results of operations and cash flows. In addition, the financial condition, results of operations and cash flows of some of our operating entities are reported in foreign currencies and then translated into U.S. Dollars at the applicable foreign exchange rate for inclusion in our consolidated financial statements. As a result, appreciation of the U.S. Dollar against these foreign currencies generally will have a negative impact on our reported sales and profits.
For example, on January 11, 2010, the Venezuelan government devalued the country’s currency, bolivar fuerte (“VEF”), and changed to a two-tier exchange structure. The official exchange rate moved from 2.15 VEF per U.S. Dollar to 2.60 VEF for essential goods and 4.30 VEF for non-essential goods and services, with our products falling into the non-essential category. A Venezuelan currency control board is responsible for foreign exchange procedures, including approval of requests for exchanges of VEF for
16
Table of Contents
U.S. Dollars at the official, government established exchange rate. We use the parallel market rate, which ranged between 5.30 to 7.70 VEF to the U.S. Dollar, to translate the financial statements of our Venezuelan subsidiary because we expect to obtain U.S. Dollars at the parallel market rate for future dividend remittances. The one-time devaluation had a $2 million negative impact on our pre-tax net income in 2010. Further depreciation of the VEF, or depreciation of the currencies of other countries in which we do business, could materially and adversely affect our business, financial condition, results of operations and cash flows. See “Item 7. Management’s Discussion and Analysis of Financial Condition and Results of Operations—Business Environment.”
We use a combination of natural hedging techniques and financial derivatives to protect against certain foreign currency exchange rate risks. Such hedging activities may be ineffective or may not offset more than a portion of the adverse financial impact resulting from foreign currency variations. Gains or losses associated with hedging activities also may negatively impact operating results.
Entering new markets poses new competitive threats and commercial risks.
In recent years we have sought to expand our manufacturing and sales into new markets. Expanding into new markets requires investments and resources that may not be available as needed. We cannot guarantee that we will be successful in leveraging our capabilities to compete favorably in new markets or that we will be able to recoup our significant investments in expansion projects. If our customers in new markets experience reduced demand for their products or financial difficulties, our future prospects will be negatively affected as well.
We conduct significant operations at our facility in Juarez, Mexico, which could be materially and adversely affected as a result of the increased levels of drug-related violence in that city.
Recently, fighting among rival drug cartels has led to unprecedented levels of violent crime in Juarez, Mexico and elsewhere along the U.S.-Mexico border despite increased law-enforcement efforts by the Mexican and the U.S. governments. This situation presents several risks to our operations in Juarez, including, among others, that our employees may be directly affected by the violence, that our employees may elect to relocate out of the Juarez region in order to avoid the risk of violent crime to themselves or their families, and that our customers may become increasingly reluctant to visit our Juarez facility, which could delay new business opportunities and other important aspects of our business. If any of these risks materializes, our business may be materially and adversely affected.
The mix of profits and losses in various jurisdictions may have an impact on our overall tax rate, which in turn, may materially and adversely affect our profitability.
Tax expenses and benefits are determined separately for each of our taxpaying entities or groups of entities that is consolidated for tax purposes in each jurisdiction. Losses in such jurisdictions may provide no current financial statement tax benefit. As a result, changes in the mix of projected profits and losses between jurisdictions, among other factors, could have a significant impact on our overall effective tax rate.
The value of our deferred tax assets could become impaired, which could materially and adversely affect our operating results.
As of December 31, 2010, we had $85 million in net deferred income tax assets. These deferred tax assets include net operating loss carryforwards that can be used to offset taxable income in future periods and reduce income taxes payable in those future periods. We periodically determine the probability of the realization of deferred tax assets, using significant judgments and estimates with respect to, among other things, historical operating results, expectations of future earnings and tax planning strategies. If we determine in the future that there is not sufficient positive evidence to support the valuation of these assets, due to the factors described above or other factors, we may be required to further adjust the valuation allowance to reduce our deferred tax assets. Such a reduction could result in material non-cash expenses in the period in which the valuation allowance is adjusted and could have a material and adverse effect on our results of operations.
Our ability to utilize our net operating loss carryforwards may be limited and delayed. As of December 31, 2010, we had U.S. net operating loss carryforwards of $266 million. Certain provisions of the Internal Revenue Code of 1986, as amended (the “Code”) could limit our annual utilization of the net operating loss carryforwards. There can be no assurance that we will be able to utilize all of our net operating loss carryforwards and any subsequent net operating loss carryforwards in the future.
17
Table of Contents
We must successfully maintain and/or upgrade our information technology systems.
We rely on various information technology systems to manage our operations. We are currently implementing modifications and upgrades to our systems, including making changes to legacy systems, replacing legacy systems with successor systems with new functionality and acquiring new systems with new functionality. These types of activities subject us to inherent costs and risks associated with replacing and changing these systems, including impairment of our ability to fulfill customer orders, potential disruption of our internal control structure, substantial capital expenditures, additional administration and operating expenses, retention of sufficiently skilled personnel to implement and operate the new systems, demands on management time, and other risks and costs of delays or difficulties in transitioning to new systems or of integrating new systems into our current systems. Our system implementations may not result in productivity improvements at a level that outweighs the costs of implementation, or at all. In addition, the implementation of new technology systems may cause disruptions in our business operations and have an adverse effect on our business and operations, if not anticipated and appropriately mitigated.
Our international operations are subject to political and economic risks of developing countries and special risks associated with doing business in corrupting environments.
We design, manufacture, distribute and market a broad range of aftermarket products in various regions, some of which are less developed, have less stability in legal systems and financial markets and are generally recognized as potentially more corrupt business environments than the United States, and therefore present greater political, economic and operational risks. We have in place certain policies, procedures and certain ongoing training of employees with regard to business ethics and many key legal requirements, such as applicable anti-corruption laws, including the U.S. Foreign Corrupt Practices Act (the “FCPA”), which make it illegal for us to give anything of value to foreign officials in order to obtain or retain any business or other advantages; however, there can be no assurance that our employees will adhere to our code of business conduct and ethics or any other of our policies, applicable anti-corruption laws, including the FCPA, or other legal requirements. If we fail to enforce our policies and procedures properly or fail to maintain adequate record-keeping and internal accounting practices to accurately record our transactions, we may be subject to regulatory sanctions. In the event that we believe or have reason to believe that our employees have or may have violated applicable anti-corruption laws, including the FCPA, or other laws or regulations, we are required to investigate or have outside counsel investigate the relevant facts and circumstances, and if violations are found or suspected could face civil and criminal penalties, and significant costs for investigations, litigation, fees, settlements and judgments, which in turn could have a material and adverse effect on our business.
Risks Relating to Our Indebtedness
Our substantial leverage could harm our business by limiting our available cash and our access to additional capital and, to the extent of our variable rate indebtedness, exposing us to interest rate risk.
As a result of the Acquisition in 2004, the refinancing in 2009 and the issuance of additional Subordinated Notes in 2010, we are highly leveraged. This leverage may limit our ability to obtain additional financing for working capital, capital expenditures, product development, debt service requirements, acquisitions, restructuring and general corporate or other purposes, limit our ability to adjust to changing market conditions and place us at a competitive disadvantage compared to our less leveraged competitors. Further volatility in the credit markets could adversely impact our ability to obtain favorable terms on financing in the future. In addition, a substantial portion of our cash flows from operations must be dedicated to the payment of principal and interest on our indebtedness and is not available for other purposes, including our operations, capital expenditures and future business opportunities. We may be more vulnerable than a less leveraged company to a downturn in the general economic conditions or in our business, or we may be unable to carry out capital spending that is important to our growth. We may be vulnerable to interest rate increases, as certain of our borrowings, including those under our ABL Revolver, are at variable rates. We can give no assurance that our business will generate sufficient cash flow from operations, that revenue growth or operating improvements will be realized, or that future borrowings will be available under our ABL Revolver in an amount sufficient to enable us to service our indebtedness or to fund other liquidity needs.
We may not be able to generate sufficient cash to service all of our indebtedness and may be forced to take other actions to satisfy our obligations under our indebtedness, which actions may not be successful.
Our ability to make scheduled payments or to refinance our debt obligations depends on our financial and operating performance, which is subject to prevailing economic and competitive conditions and to certain financial, business and other factors beyond our control. We may not be able to maintain a level of cash flow from operating activities sufficient to permit us to pay the principal, premium, if any, and interest on our indebtedness. See “Item 7. Management’s Discussion and Analysis of Financial Condition and Results of Operations—Liquidity and Capital Resources.”
If our cash flows and capital resources are insufficient to fund our debt service obligations, we may be forced to reduce or delay capital expenditures, sell assets, seek additional capital or seek to restructure or refinance our indebtedness. These alternative measures may not be successful and may not permit us to meet our scheduled debt service obligations. In the absence of such operating results and resources, we could face substantial liquidity problems and might be required to sell material assets or operations to attempt to meet our debt service and other obligations. Our ABL Revolver and the indentures governing our notes restrict our ability to use the proceeds from asset sales. We may not be able to consummate those asset sales to raise capital or sell assets at prices that we believe are fair, and proceeds that we do receive may not be adequate to meet any debt service obligations then due.
18
Table of Contents
Despite our current indebtedness levels, we may still be able to incur substantially more debt, which could further exacerbate the risks associated with our substantial leverage.
We and our subsidiaries may be able to incur substantial additional indebtedness in the future. Although the terms of the agreements governing our debt instruments contain restrictions on the incurrence of additional indebtedness, these restrictions are subject to a number of qualifications and exceptions, and the indebtedness incurred in compliance with these restrictions could be substantial. As of December 31, 2010, we had $191 million of borrowing capacity available under the ABL Revolver after giving effect to $15 million in outstanding letters of credit, none of which was drawn against, and $3 million for borrowing base reserves. If we incur additional debt above the levels currently in effect, the risks associated with our leverage, including those described above, would increase.
The terms of our debt covenants could limit how we conduct our business and our ability to raise additional funds.
The agreements that govern the terms of our debt, including the indentures governing our notes and the credit agreement that governs our ABL Revolver, contain, and the agreements that govern our future indebtedness may contain, certain covenants that, among other things, limit or restrict our ability and the ability of our subsidiaries to (subject to certain qualifications and exceptions):
| • | incur and guarantee additional indebtedness, issue disqualified stock or issue certain preferred stock; |
| • | repay subordinated indebtedness prior to its stated maturity; |
| • | pay dividends, make other distributions on, redeem or repurchase stock or make certain other restricted payments; |
| • | make certain investments or acquisitions; |
| • | create certain liens or encumbrances; |
| • | sell assets; |
| • | enter into transactions with affiliates; |
| • | issue capital stock; |
| • | change our line of business; |
| • | consolidate, merge, sell or otherwise dispose of all or substantially all of our assets; |
| • | designate subsidiaries as unrestricted subsidiaries; |
| • | make capital expenditures; and |
| • | restrict dividends, distributions or other payments from our subsidiaries. |
There are limitations on our ability to incur the full $315 million of commitments under the ABL Revolver. The borrowers organized in the United States are limited to $295 million and the borrower organized in Canada may borrow up to the remaining $20 million. In each case, borrowings under our ABL Revolver are limited by a specified borrowing base consisting of a percentage of eligible accounts receivable and inventory, less customary reserves. Subject to certain conditions, the commitments under the ABL Revolver may be increased by up to $160 million.
In addition, under the ABL Revolver, a covenant trigger would occur if excess availability under the ABL Revolver is at any time less than the greater of 12.5% of the total revolving loan commitments at such time and $39.5 million, and shall continue until such time thereafter as excess availability shall have exceeded a threshold amount at all times during a 60 consecutive day period. If the covenant trigger were to occur, we would be required to satisfy and maintain a fixed charge coverage ratio of at least 1.10x, measured for the last twelve-month period. Our ability to meet the required fixed charge coverage ratio can be affected by events beyond our control, and we cannot assure you that we will meet this ratio. A breach of any of these covenants could result in a default under the ABL Revolver.
Moreover, the ABL Revolver provides the lenders considerable discretion to impose reserves, which could materially impair the amount of borrowings that would otherwise be available to us. There can be no assurance that the lenders under the ABL Revolver will not impose such actions during the term of the ABL Revolver.
19
Table of Contents
A breach of the covenants or restrictions under the indentures governing our notes or the credit agreement that governs the ABL Revolver could result in a default under the applicable indebtedness. Such default may allow the creditors to accelerate the related debt and may result in the acceleration of any other debt to which a cross-acceleration or cross-default provision applies. In addition, an event of default under our ABL Revolver would permit the lenders under our ABL Revolver to terminate all commitments to extend further credit under that facility. Furthermore, if we were unable to repay the amounts due and payable under our ABL Revolver, those lenders could proceed against the collateral granted to them to secure that indebtedness. In the event our lenders and noteholders accelerate the repayment of our borrowings, we cannot assure that we and our subsidiaries would have sufficient assets to repay such indebtedness. As a result of these restrictions, we may be:
| • | limited in how we conduct our business; |
| • | unable to raise additional debt or equity financing to operate during general economic or business downturns; or |
| • | unable to compete effectively or to take advantage of new business opportunities. |
These restrictions may affect our ability to grow in accordance with our plans.
Our variable rate indebtedness exposes us to interest rate risk, which could cause our debt costs to increase significantly.
A portion of our borrowings is at variable rates of interest and exposes us to interest rate risks. We are exposed to the risk of rising interest rates to the extent that we fund our operations with short-term or variable-rate borrowings. As of December 31, 2010, the Company’s $696 million of aggregate debt outstanding consisted of $105 million of floating-rate debt and $591 million of fixed-rate debt. Fixed rate debt comprised approximately 85% of our total debt as of December 31, 2010. Based on the amount of floating-rate debt outstanding at December 31, 2010 a 1% rise in interest rates would result in approximately $1 million in incremental interest expense. If the LIBOR rates increase in the future then the floating-rate debt could have a material effect on our interest expense.
| Item 1B. | Unresolved Staff Comments. |
None.
| Item 2. | Properties |
Our principal executive offices are located in Ann Arbor, Michigan; our operations include numerous manufacturing, research and development and warehousing facilities as well as offices. The table below summarizes the number of facilities by geographical region for our manufacturing, distribution and warehouse and other facilities (excluding the Commercial Distribution Europe business unit).
| Manufacturing Facilities |
Distribution and Warehouse Facilities |
Other Facilities |
||||||||||
| United States |
6 | 13 | 10 | |||||||||
| Canada |
1 | 1 | 1 | |||||||||
| Mexico |
5 | 2 | 2 | |||||||||
| Europe |
2 | 1 | 3 | |||||||||
| South America |
4 | 23 | 4 | |||||||||
| Asia |
3 | 1 | 3 | |||||||||
| Total |
21 | 41 | 23 | |||||||||
The other facilities around the globe include six facilities that have been closed as part of our restructuring programs, ten sales and administration offices, four under construction facilities, one research and development facility and two non-operational storage sites. Approximately 52% of our principal manufacturing facilities are brake production facilities, approximately 29% are filtration production facilities, approximately 5% are chassis production facilities and approximately 14% relates to other production facilities. Of the total number of principal manufacturing facilities, approximately 76% of such facilities are owned and approximately 24% are leased. The table above excludes the Commercial Distribution Europe segment that we sold on February 2, 2010, which included four manufacturing facilities, 16 distribution and warehouse facilities and one other facility.
| Item 3. | Legal Proceedings |
Various claims, lawsuits and administrative proceedings are pending or threatened against us and our subsidiaries, arising from the ordinary course of business with respect to commercial, intellectual property, product liability and environmental matters. We believe that the ultimate resolution of the foregoing matters will not have a material effect on our financial condition or results of operations.
20
Table of Contents
On March 31, 2008, a class action lawsuit was filed by S&E Quick Lube Distributors, Inc. of Utah against several auto parts manufacturers for allegedly conspiring to fix prices for replacement oil, air, fuel and transmission filters. Several auto parts companies are named as defendants, including Champion Laboratories, Inc., Purolator Filters NA LLC, Honeywell International Inc., Cummins Filtration Inc., Donaldson Company, Baldwin Filters Inc., Bosch USA., Mann + Hummel USA Inc., ArvinMeritor Inc., United Components Inc. and Wix Filtration Corp LLC (“Wix Filtration”), one of our subsidiaries. The lawsuit is currently pending as a consolidated Multi-District Litigation (“MDL”) Proceeding in Chicago, IL because of multiple “tag-along” filings in several jurisdictions. Two suits have also been filed in the Canadian provinces of Ontario and Quebec. Wix Filtration, along with other named defendants, has filed various motions to dismiss plaintiffs’ complaints, which were denied by the court in December 2009. Several defendants, including Wix Filtration, have refiled motions to dismiss based upon plaintiffs’ most recent amended complaint. The court denied those motions in September 2010. Discovery in the action continues. Despite the U.S. Department of Justice closing its investigation in this matter, the State of Washington Attorney General has also issued Civil Investigative Demands to all defendants. We believe that Wix Filtration did not have significant sales in this particular market at the relevant time periods so we do not expect the lawsuit to have a material adverse effect on our financial condition or results of operations. We intend to vigorously defend this matter.
DPH Holdings Corp., a successor to Delphi Corporation and certain of its affiliates (“Delphi”), served Affinia and certain of our other subsidiaries with a complaint to avoid over $17 million in allegedly preferential transfers, substantially all of which relate to allegedly preferential transfers involving our non-U.S. subsidiaries. On February 4, 2011, we settled with Delphi for $0.1 million.
We have various accruals for civil liability, including product liability, and other costs. If there is a range of equally probable outcomes, we accrue at the lower end of the range. The Company had $1 million and $2 million accrued as of December 31, 2009 and December 31, 2010, respectively. There are no recoveries expected from third parties.
| Item 4. | Removed and Reserved |
PART II.
| Item 5. | Market for Registrant’s Common Equity, Related Stockholder Matters and Issuer Purchases of Equity Shares |
No trading market for our common stock currently exists. As of March 11, 2011, our parent, Holdings, was the sole holder of our common stock. The Company has never declared or paid any cash dividends on its common stock. We intend to retain all current and foreseeable future earnings to support operations. Our senior credit facilities and our notes indentures restrict our ability to pay cash dividends on our common stock. For information in respect of securities authorized under our equity compensation plan, see “Item 11. Executive Compensation.”
| Item 6. | Selected Consolidated and Combined Financial Data |
The financial statements included in this report are the consolidated financial statements of Affinia Group Intermediate Holdings Inc. The selected financial data are derived from our financial statements. The financial data as of December 31, 2009 and 2010 and for the years ended December 31, 2008, 2009, and 2010 are derived from the audited financial statements contained under “Item 8. Financial Statements and Supplementary Data.” The selected financial data as of December 31, 2006, December 31, 2007 and December 31, 2008; and for the years ended December 31, 2006 and 2007, are derived from our financial statements.
21
Table of Contents
You should read the following data in conjunction with “Item 7. Management’s Discussion and Analysis of Financial Condition and Results of Operations” and “Item 8. Financial Statements and Supplementary Data.”
| Year Ended December 31, | ||||||||||||||||||||
| (Dollars in millions) | 2006 | 2007 | 2008 | 2009 | 2010 | |||||||||||||||
| Statement of income data:(1) |
||||||||||||||||||||
| Net sales |
$ | 1,892 | $ | 1,857 | $ | 1,915 | $ | 1,797 | $ | 1,991 | ||||||||||
| Cost of sales |
(1,550 | ) | (1,512 | ) | (1,546 | ) | (1,429 | ) | (1,581 | ) | ||||||||||
| Gross profit |
342 | 345 | 369 | 368 | 410 | |||||||||||||||
| Selling, general and administrative expenses |
(298 | ) | (276 | ) | (276 | ) | (267 | ) | (290 | ) | ||||||||||
| Income from settlement(2) |
— | 15 | — | — | — | |||||||||||||||
| Operating profit |
44 | 84 | 93 | 101 | 120 | |||||||||||||||
| Gain (loss) on extinguishment of debt |
— | — | — | 8 | (1 | ) | ||||||||||||||
| Other income (loss), net |
7 | 4 | (3 | ) | 5 | 3 | ||||||||||||||
| Interest expense |
(58 | ) | (59 | ) | (56 | ) | (69 | ) | (66 | ) | ||||||||||
| Income (loss) before taxes and noncontrolling interest |
(7 | ) | 29 | 34 | 45 | 56 | ||||||||||||||
| Income tax (provision) benefit |
5 | (6 | ) | (18 | ) | (22 | ) | (27 | ) | |||||||||||
| Equity in income, net of tax |
— | — | — | 1 | 1 | |||||||||||||||
| Net income (loss) from continuing operations |
(2 | ) | 23 | 16 | 24 | 30 | ||||||||||||||
| Loss from discontinued operations, net of tax |
(3 | ) | (17 | ) | (19 | ) | (61 | ) | — | |||||||||||
| Net income (loss) |
(5 | ) | 6 | (3 | ) | (37 | ) | 30 | ||||||||||||
| Less: Net income attributable to noncontrolling interest, net of tax |
— | — | — | 7 | 6 | |||||||||||||||
| Net income (loss) attributable to the Company |
$ | (5 | ) | $ | 6 | $ | (3 | ) | $ | (44 | ) | $ | 24 | |||||||
| Statement of cash flows data: |
||||||||||||||||||||
| Net cash provided by operating activities |
$ | 22 | $ | 1 | $ | 48 | $ | 55 | $ | 23 | ||||||||||
| Net cash used in investing activities |
(21 | ) | (16 | ) | (75 | ) | (36 | ) | (98 | ) | ||||||||||
| Net cash provided by (used in) financing activities |
(15 | ) | — | 51 | (35 | ) | 66 | |||||||||||||
| Other financial data: |
||||||||||||||||||||
| Capital expenditures |
$ | 24 | $ | 30 | $ | 25 | $ | 31 | $ | 52 | ||||||||||
| Depreciation and amortization(3) |
41 | 30 | 34 | 36 | 37 | |||||||||||||||
| Balance sheet data (end of period): (4) |
||||||||||||||||||||
| Cash and cash equivalents |
$ | 70 | $ | 59 | $ | 77 | $ | 65 | $ | 55 | ||||||||||
| Total current assets |
896 | 970 | 994 | 973 | 1,016 | |||||||||||||||
| Total assets |
1,381 | 1,457 | 1,515 | 1,483 | 1,589 | |||||||||||||||
| Total current liabilities |
389 | 401 | 467 | 437 | 455 | |||||||||||||||
| Total debt |
597 | 597 | 622 | 601 | 696 | |||||||||||||||
| Shareholder’s equity(5) |
383 | 434 | 416 | 437 | 448 | |||||||||||||||
| (1) | In accordance with ASC Topic 360, “Property, Plant, and Equipment,” the Commercial Distribution Europe segment is accounted for as a discontinued operation. The consolidated statements of operations for all periods presented have been adjusted to reflect this segment as a discontinued operation. |
| (2) | Affinia received a general unsecured nonpriority claim against Dana relating to a settlement in 2007. The claim was monetized for $15 million and was recorded as income from the settlement. |
| (3) | The depreciation and amortization expense excludes the Commercial Distribution Europe segment. The consolidated cash flow statement, which is included in Item 8 of this report, includes the Commercial Distribution Europe segment. |
| (4) | The various balance sheet line items as of December 31, 2006, 2007 and 2008 have not been modified to reflect the discontinued operation of the Commercial Distribution Europe segment. |
| (5) | Effective January 1, 2009, the Company changed the accounting for and reporting of minority interest (now called noncontrolling interest) in our consolidated financial statements as required under ASC Topic 810, “Consolidation.” Upon adoption, applicable prior period amounts have been retrospectively changed to conform. The noncontrolling interest was reclassified to the equity section of the balance sheet. |
22
Table of Contents
| Item 7. | Management’s Discussion and Analysis of Financial Condition and Results of Operations |
Statements in the discussion and analysis regarding industry outlook, our expectations regarding the performance of our business and other non-historical statements in the discussion and analysis are forward-looking statements. These forward-looking statements are subject to numerous risks and uncertainties, including, but not limited to, the risks and uncertainties described under “Forward-Looking Statements.” Our actual results may differ materially from those contained in or implied by any forward-looking statements. You should read the following discussion together with “Forward-Looking Statements,” “Item 6. Selected Consolidated and Combined Financial Data” and “Item 8. Financial Statements and Supplementary Data.”
We are a global leader in the light and commercial vehicle replacement products and services industry, which also is referred to as the aftermarket. Our extensive aftermarket product offering consists principally of filtration, brake and chassis products. Our filtration products fit heavy and medium duty trucks, light vehicles, equipment in the off-highway market (i.e., construction, mining, forestry and agricultural) and equipment for industrial and marine applications. Our brake and chassis products fit light vehicles and heavy and medium duty trucks. In addition, we provide aftermarket products and distribution services in South America. We believe that the growth of the global aftermarket, from which we derived approximately 98% of our net sales in 2010, is predominantly driven by the size, age and use of the population of vehicles and equipment in operation. We design, manufacture, distribute and market a broad range of aftermarket products in North America, South America, Europe and Asia and generate sales in over 70 countries. The following charts illustrate our net sales by product grouping, together with major brands and the concentration of on and off-highway replacement product sales and OEM sales for the year ended December 31, 2010.
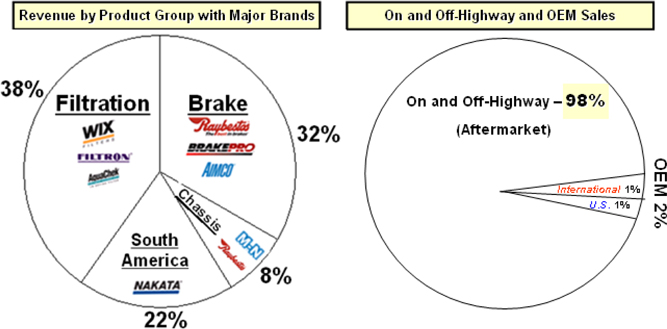
We market our products under a variety of well-known brands, including WIX®, Raybestos®, Nakata®, Brake-Pro®, Filtron™, AIMCO® and McQuay-Norris®. Additionally, we provide private label products to large aftermarket distributors, including NAPA®, CARQUEST® and ACDelco®, as well as co-branded products for Federated and ADN. We believe that we have achieved our leading market positions due to the quality and reputation of our brands and products among professional installers, who are the primary decision makers for the purchase of the products we supply to the aftermarket.
We provide our primary customers with an extensive range of services which help build customer loyalty and generate repeat business while differentiating us from our competitors. These services include detailed product catalogs, e-catalogs, technical services, electronic data interchange, direct shipments of products and point-of-sale marketing materials. The depth of our value added services has led to numerous customer awards.
23
Table of Contents
In the last five years, the diversification of our manufacturing locations has transformed us from a domestic to a global manufacturer with a significant portion of our manufacturing base in lower labor cost countries. We have accomplished this transformation by acquiring or opening new locations in low labor cost countries and closing or selling our operations (i.e. Commercial Distribution Europe) in high labor cost countries. We are continuing to focus on growing our business in emerging markets as we continue to diversify our global manufacturing and distribution capabilities. We intend to continue expanding our global capabilities as we pursue our objective of becoming a world class on and off-highway replacement products and services company.
The charts below illustrate our global change in square footage and number of locations from January 1, 2005 to December 31, 2010.
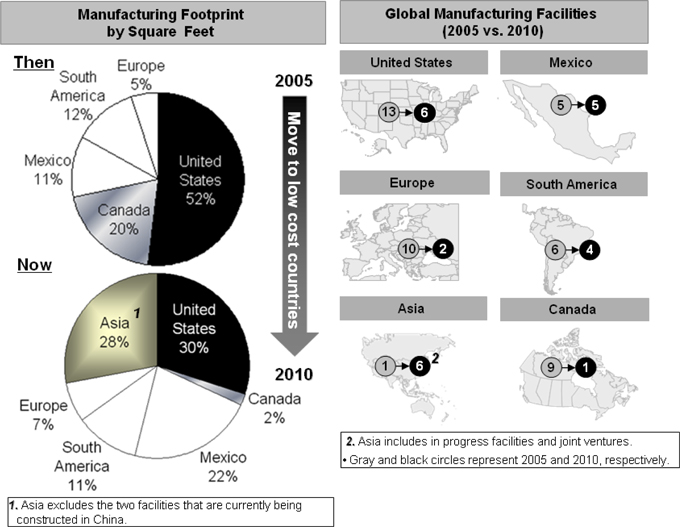
24
Table of Contents
The following are major transformation projects we have completed or in the process of completing:
| • | 2010 and 2011 – Our Brazilian distribution company opened one new branch in 2010, plans on opening two new branches in 2011, and opened a new warehouse in January 2011. The new branch has contributed to the growth in the Brazilian distribution company. |
| • | Fourth quarter of 2010 – During the fourth quarter of 2010, we purchased the remaining 50% ownership in our India joint venture. |
| • | Fourth quarter of 2010 – We purchased substantially all the assets of NAPD, a chassis distributor in the fourth quarter of 2010. |
| • | Fourth quarter of 2010 – We initiated filter product distribution capabilities in Russia during the fourth quarter of 2010. |
| • | Third quarter of 2010 – We formed a friction company in China during the third quarter of 2010, in which we have an 85% ownership interest, with the intention to manufacture products in China and distribute these products in Asia and North America. We anticipate that we will complete the manufacturing facility near the end of 2011. |
| • | First quarter of 2010 – We formed a filtration company in China during the first quarter of 2010, in which we have an 85% ownership interest, with the intention to manufacture products in China and distribute products principally in Asia. In the second quarter of 2010 we commenced construction of the filtration manufacturing facility. We anticipate that we will begin manufacturing filtration products in the first half of 2011. |
| • | Fourth quarter of 2008 – Effective October 31, 2008, we purchased an 85% controlling interest in Longkou Haimeng Machinery Company Limited (“Haimeng”), one of the world’s largest drum and rotor manufacturing companies. Haimeng has over 1 million square feet of modern manufacturing and machining capacity. |
| • | Fourth quarter of 2008 – We started production of brake products at a new facility in northern Mexico. |
| • | Fourth quarter of 2008 – We completed our 50% owned manufacturing site in India. We have ramped up to full capacity at this facility as of the end of the first quarter 2010. |
| • | Third quarter of 2007 – Our first filter manufacturing operation in Mexico opened in the third quarter of 2007. During 2008, the manufacturing operation was brought up to its full capabilities. This operation serves markets in both North America and Central America. We are expanding our distribution capabilities at this operation to increase our sales in the Mexican market. |
| • | Second quarter of 2007 – We opened a new filter manufacturing plant in Ukraine on April 1, 2007 to help meet increased demand for filtration products in Eastern Europe. The plant became fully operational in 2009. |
Comprehensive Restructuring
In 2005, we announced two restructuring plans: (i) a restructuring plan that we announced at the beginning of 2005 as part of the Acquisition, also referred to herein as the “acquisition restructuring” and (ii) a restructuring plan that we announced at the end of 2005, also referred to herein as the “comprehensive restructuring” (collectively, the “restructuring plans”). We have completed the acquisition restructuring and we are in the process of completing the comprehensive restructuring. We have closed or sold 71 facilities during the last six years and have shifted some of our manufacturing base to lower labor cost countries such as China, India, Ukraine and Mexico. Refer to the chart below for a breakout of the closed or sold facilities during the last six years.
| Closed or sold facilities since 2005 |
||||
| Acquisition restructuring |
12 | |||
| Comprehensive restructuring |
36 | |||
| Other restructuring |
2 | |||
| Quinton Hazell sale |
21 | |||
| Total |
71 | |||
25
Table of Contents
We initiated the acquisition restructuring to take advantage of opportunities that we identified prior to the Acquisition but that were difficult to actively pursue as part of Dana (i.e., consolidation of distribution facilities and manufacturing plants). Through the comprehensive restructuring we seek to lower costs and improve profitability by rationalizing manufacturing operations and to focus on low-cost sourcing opportunities. Such initiatives included the movement of manufacturing to lower cost facilities. The acquisition restructuring was completed at the end of 2005 and the comprehensive restructuring was essentially completed at the end of 2010. We anticipate $4 million additional comprehensive restructuring costs over the next couple of years related to the closure of the final facility, which was previously announced, and other costs related to closed facilities which we still own or lease. The major components of the comprehensive restructuring through 2010 were employee severance costs, asset impairment charges, and other costs (i.e. moving costs, environmental remediation, site clearance and repair costs) each of which we expect to represent approximately 41%, 18% and 41% respectively, of the total cost of the restructuring. The comprehensive restructuring will result in approximately $171 million in restructuring costs, which exceeds preliminary expectations of $152 million.
Our gross margin has grown over the last five years mainly due to the comprehensive restructuring as shown in the chart.
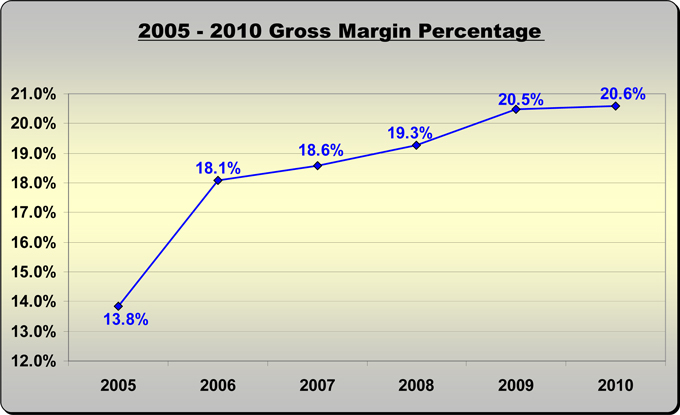
Other Restructuring
At the end of 2009, we approved the closure of our distribution operations located in Mississauga, Ontario, Canada. The operations closed at the end of the first quarter of 2010. The closure of this operation was part of the Company’s continuing effort to improve its distribution system and serve the replacement parts market effectively and efficiently. The charges were comprised of employee severance costs of $1 million and other trailing liabilities of $4 million. We incurred approximately $4 million in 2010 and $1 million in 2009 related to the closure of this facility. We anticipate another $2 million in restructuring costs in 2011 related to the closure of the facility.
On May 3, 2010, we announced the closure of our brake manufacturing operations located in Maracay, Edo Aragua, Venezuela. The operations closed during the second quarter of 2010. These actions resulted in the Company incurring pre-tax charges of approximately $7 million, of which approximately $4 million were cash expenditures. The charges were comprised of employee severance costs of $3 million, asset impairments of $3 million, and other trailing liabilities of $1 million.
26
Table of Contents
The following chart summarizes our restructuring activities for the comprehensive restructuring plan and other restructuring plans.
| (Dollars in millions) | Total Restructuring Payments |
Discontinued Operations |
Selling, General and Administrative Expenses |
Cost of Sales | Total | |||||||||||||||||
| Comprehensive Restructuring |
||||||||||||||||||||||
| 2005 |
$ | — | $ | — | $ | 2 | $ | 21 | $ | 23 | ||||||||||||
| 2006 |
32 | 1 | 38 | 1 | 40 | |||||||||||||||||
| 2007 |
37 | 12 | 23 | 3 | 38 | |||||||||||||||||
| 2008 |
29 | 12 | 27 | 1 | 40 | |||||||||||||||||
| 2009 |
15 | 2 | 10 | 1 | 13 | |||||||||||||||||
| 2010 |
13 | — | 13 | — | 13 | |||||||||||||||||
| Total Comprehensive Cost |
126 | 27 | 113 | 27 | $ | 167 | ||||||||||||||||
| Other Restructuring |
||||||||||||||||||||||
| 2009 |
— | — | 1 | — | 1 | |||||||||||||||||
| 2010 |
7 | — | 8 | 3 | 11 | |||||||||||||||||
| Total Other Restructuring Cost |
7 | — | 9 | 3 | 12 | |||||||||||||||||
| Total Restructuring Payments and Cost |
$ | 133 | $ | 27 | $ | 122 | $ | 30 | $ | 179 | ||||||||||||
Since we have essentially completed our comprehensive restructuring plan we have shifted our focus to global growth. We recently unveiled our World SmartTM business philosophy, which emphasizes a unique transformational approach to global manufacturing. The World Smart direction assures consistent product quality regardless of where a product is manufactured globally. As a World Smart company, we not only manufacture competitively priced products off-shore, but we do so in a manner that assures the highest possible quality. Our World Smart business strategy is based on four keys strategic elements: customer-centric focus, involved Affinia people, continual improvement and supplier relationships. The World Smart model vertically integrates manufacturing from product development to distribution.
Acquisitions and New Technology
On December 16, 2010, the Company, through its subsidiary Affinia Products Corp LLC, acquired substantially all the assets of NAPD, which is located in Ramsey, New Jersey. NAPD designs and engineers chassis products, which are manufactured by contractors in low labor cost countries. The NAPD acquisition expands our product offering of chassis parts to one of broadest in the industry. We acquired NAPD’s assets and liabilities for cash consideration of $52 million.
On December 3, 2010, the Company acquired the remaining 50% ownership interest in Affinia India Private Limited, the Company’s India joint venture, for $24 million in cash, increasing our ownership interest from 50% to 100%.
In January 2011, we introduced ecoLAST™ oil filters, a revolutionary line of heavy duty oil filters that has proven to double oil life. WIX ecoLAST oil filters capture dirt and soot like a traditional filter, while utilizing media to sequester the acids in the oil. WIX’s ecoLAST oil filters are a direct replacement with no changes or modification required to the vehicle. We expect the first ecoLAST oil filters to become available by April 2011.
On February 2, 2010, as part of our strategic plan, we sold our Commercial Distribution Europe business unit for approximately $12 million reduced by post-closing purchase price adjustments of $1 million. Our Commercial Distribution Europe business unit, also known as Quinton Hazell, is a diverse aftermarket manufacturer and distributor of automotive components throughout Europe. Quinton Hazell’s financial performance did not meet our strategic financial metrics, as evidenced by a 2009 pre-tax loss of $84 million, of which $75 million related to an impairment of assets.
27
Table of Contents
On November 30, 2010, we entered into an amendment to the credit agreement governing the ABL Revolver. The ABL Revolver has been amended to, among other things, (a) increase the amount of additional unsecured indebtedness that we may incur from $100 million to $300 million and provide certain conditions to any issuance of such indebtedness in excess of $100 million, (b) amend the covenants with respect to: making certain dividends, distributions, restricted payments and investments; extending, renewing and refinancing certain existing indebtedness; amending certain material documents; and issuing and disposing of certain equity interests, (c) reduce the pricing spread applicable to each type of loan by 150 basis points at each level of average aggregate availability and remove the floor formerly applicable to the LIBOR rate and the BA rate, (d) extend the maturity date from August 13, 2013 to November 30, 2015 (subject to early termination under certain limited circumstances), (e) allow for prepayments of certain outstanding indebtedness with the proceeds of an initial public offering (if Holdings undertakes an initial public offering) and permit the merger of Affinia Group Intermediate Holdings Inc. with and into Holdings upon satisfaction of certain preconditions to such merger and (f) modify certain other provisions thereof.
Issuance of Senior Subordinated Notes
On December 9, 2010, we completed an offering of the Additional Notes. The Additional Notes have been issued at a price equal to 100% of their face value. The Additional Notes were issued pursuant to the Indenture, dated November 30, 2004, relating to our then outstanding $267 million aggregate principal amount of 9% Senior Subordinated Notes due 2014 (the “Initial Notes”). Other than with respect to the date of issuance and issue price, the Additional Notes have the same terms as, and are treated as a single class with, the Initial Notes. Affinia Group Inc.’s obligations under the Additional Notes are guaranteed on an unsecured senior subordinated basis by Affinia Group Intermediate Holdings Inc. and certain of our current and future wholly-owned domestic subsidiaries. The outstanding balance of the Subordinated Notes at December 31, 2010 was $367 million. We utilized the ABL Revolver to finance our purchase of the NAPD business and the remaining 50% interest in Affinia India Private Limited but subsequently used the proceeds of this note offering to repay the ABL Revolver borrowings that we incurred to finance these acquisitions. The proceeds of the note offering were also used to redeem $22.5 million in Secured Notes.
On December 31, 2010, we redeemed $22.5 million in aggregate principal amount of our Secured Notes, pursuant to their terms at a redemption price equal to 103% of the principal amount of such notes being redeemed, plus accrued and unpaid interest to the redemption date.
We typically conduct business with our customers pursuant to short-term contracts and purchase orders. However, our business is not characterized by frequent customer turnover due to the critical nature of long-term relationships in our industry. The expectation of quick turnaround times for car repairs and the broad proliferation of available part numbers require a large investment in inventory and strong fulfillment capabilities in order to deliver high fill rates and quick cycle times. Large aftermarket distributors typically source their product lines at a particular price point and product category with one “full-line” supplier, such as us, which covers substantially all of their product requirements. Switching to a new supplier typically requires that a distributor or supplier make a substantial investment to purchase, or “changeover” to, the new supplier’s products. In addition, the end user of our products, who is most frequently a professional installer, requires consistently high quality products because it is industry practice to replace, free of any labor or service charge, malfunctioning parts.
Our Markets. We believe that future growth in aftermarket product sales will be driven by the following key factors: (1) growth in global vehicle population; (2) growth in global commercial vehicle population; (3) increase in total miles driven in the United States and other key countries around the world; (4) increase in average age of light vehicles in the United States and other key countries around the world and (5) increase in vehicle related regulation and legislation. Growth in sales in the aftermarket does not always have a direct correlation to sales growth for aftermarket suppliers like us. For example, as automotive parts distributors have consolidated during the past several years, they have reduced purchases from manufacturers as they focused on reducing their combined inventories. The automotive distributors are also focused on reducing inventories due to the recent decline in miles driven.
Raw Materials and Manufactured Components. Our variable costs are proportional to sales volume and mix and are comprised primarily of raw materials and labor and certain overhead costs. Our fixed costs are not significantly influenced by volume in the short term and consist principally of selling, general and administrative expenses, depreciation and other facility-related costs.
We use a broad range of manufactured components and raw materials in our products, including raw steel, steel-related components, filtration media, aluminum, brass, iron, rubber, resins, plastics, paper and packaging materials. We purchase raw materials from a wide variety of domestic and international suppliers, and we have not, in recent years, experienced any significant shortages of these items and normally do not carry inventories of these items in excess of those reasonably required to meet our production and shipping schedules.
28
Table of Contents
Seasonality. Our working capital requirements are significantly impacted by the seasonality of the aftermarket. In a typical year, we build inventory during the first and second quarters to accommodate our peak sales during the second and third quarters. Our working capital requirements therefore tend to be highest from March through August. In periods of weak sales, inventory can increase beyond typical seasonal levels, as our product delivery lead times are less than two days while certain components we purchase from overseas require lead times of approximately 90 days.
Global Developments. The aftermarket has also experienced increased price competition from manufacturers based in China and other lower labor cost countries. We responded to this challenge by acquiring an 85% controlling interest in Haimeng, one of the largest drum and rotor manufacturers in the world and by expanding our manufacturing capacity in China, India, Mexico, Poland and Ukraine. Additionally, we are meeting this challenge through restructuring and outsourcing initiatives, as well as through ongoing cost reduction programs.
29
Table of Contents
In accordance with ASC Topic 360, “Property, Plant, and Equipment,” the Commercial Distribution Europe segment qualified as a discontinued operation. Previously reported consolidated statements of operations for all periods presented have been adjusted to reflect this segment as a discontinued operation.
Year Ended December 31, 2009 Compared to the Year Ended December 31, 2010
Net sales. Consolidated net sales increased by $194 million in 2010 in comparison to 2009 due mainly to favorable foreign currency translation effects of $26 million, improved market conditions and increased business from new and existing customers. The following table summarizes the consolidated net sales results for the years ended December 31, 2009 and December 31, 2010:
| (Dollars in millions) | Consolidated Year Ended December 31, 2009 |
Consolidated Year Ended December 31, 2010 |
Dollar Change |
Percent Change |
Currency Effect(1) |
|||||||||||||||
| Net sales |
||||||||||||||||||||
| Filtration products |
$ | 713 | $ | 759 | $ | 46 | 6 | % | $ | (21 | ) | |||||||||
| Brake North America and Asia products |
593 | 633 | 40 | 7 | % | 9 | ||||||||||||||
| Commercial Distribution South America products |
333 | 430 | 97 | 29 | % | 45 | ||||||||||||||
| Chassis products |
153 | 169 | 16 | 10 | % | 3 | ||||||||||||||
| On and Off-highway segment |
1,792 | 1,991 | 199 | 11 | % | 36 | ||||||||||||||
| Brake South America segment |
22 | 15 | (7 | ) | -32 | % | (10 | ) | ||||||||||||
| Corporate, eliminations and other |
(17 | ) | (15 | ) | 2 | 12 | % | — | ||||||||||||
| Total net sales |
$ | 1,797 | $ | 1,991 | $ | 194 | 11 | % | $ | 26 | ||||||||||
| (1) | The currency effect was calculated by comparing the local currency net sales for all international locations for both periods, each at the current year exchange rate to determine the impact of the currency between periods. These currency effects provide a more clear understanding of the operating results of our foreign entities because they exclude the varying effects that changes in foreign currency exchange rates may have on those results. |
On and Off-highway segment products sales increased due to the following:
| (1) | Filtration products sales increased in 2010 in comparison to 2009 due in part to increased sales in our Polish operation and due to improving markets. Sales increased $43 million due to the improving U.S. and Canadian markets, $23 million due to our Polish operation gaining market share in Western and Eastern Europe and due to $1 million in additional volumes in other countries. The increased sales were offset by $21 million of unfavorable currency translations which were comprised of unfavorable currency translation effects in Venezuela of $31 million, favorable currency translation effects of $4 million related to Poland and an additional $6 million of favorable currency effects in three other countries. |
| (2) | Brake North America and Asia products sales increased in 2010 in comparison to 2009 due to favorable currency translation effects of $9 million, improvement in market conditions and new business from new customers or existing customers. Additionally our Chinese operations increased sales by $14 million to third party customers in China and other countries in 2010 compared to 2009. |
| (3) | Commercial Distribution South America products sales increased in 2010 in comparison to 2009 partially due to favorable foreign currency translation effects of $45 million. The Brazilian Real weakened significantly in the first half of 2009 and then strengthened in the last half of the year and has remained strong in 2010. Excluding currency effects, sales grew by 16% in 2010 in comparison to 2009. This growth was due to improved market conditions, growth in our Brazilian distribution company and the introduction of motorcycle applications, heavy duty applications and related accessories. Our Brazilian distribution company sales grew significantly in 2010 and have grown since 2005 by 135%. |
| (4) | Chassis products sales increased in 2010 in comparison to 2009 due to an improvement in general market conditions, new business and favorable currency translation effects of $3 million related to the Canadian Dollar. Additionally, sales increased due to new business with new customers and existing customers. During the fourth quarter we began shipping premium Chassis product to one of our largest customers, which accounted for an $8 million increase in sales in 2010. |
Brake South America segment products sales for 2010 decreased in comparison to 2009 due to the devaluation of the Venezuelan currency, which resulted in a decrease in sales of $10 million for 2010, offset partially by additional volumes in Venezuela and Uruguay.
30
Table of Contents
The following table summarizes the consolidated results for the years ended December 31, 2009 and December 31, 2010:
| (Dollars in millions) | Consolidated Year Ended December 31, 2009 |
Consolidated Year Ended December 31, 2010 |
Dollar Change |
Percent Change |
||||||||||||
| Net sales |
$ | 1,797 | $ | 1,991 | $ | 194 | 11 | % | ||||||||
| Cost of sales(1) |
(1,429 | ) | (1,581 | ) | (152 | ) | 11 | % | ||||||||
| Gross profit |
368 | 410 | 42 | 11 | % | |||||||||||
| Gross margin |
20 | % | 21 | % | ||||||||||||
| Selling, general and administrative expenses(2) |
(267 | ) | (290 | ) | (23 | ) | 9 | % | ||||||||
| Selling, general and administrative expenses as a percent of sales |
15 | % | 15 | % | ||||||||||||
| Operating profit (loss) |
||||||||||||||||
| On and Off-highway segment |
153 | 167 | 14 | 9 | % | |||||||||||
| Brake South America segment |
(3 | ) | (8 | ) | (5 | ) | -167 | % | ||||||||
| Corporate, eliminations and other |
(49 | ) | (39 | ) | 10 | 20 | % | |||||||||
| Operating profit |
101 | 120 | 19 | 19 | % | |||||||||||
| Operating margin |
6 | % | 6 | % | ||||||||||||
| Gain (loss) on extinguishment of debt |
8 | (1 | ) | (9 | ) | NM | ||||||||||
| Other income, net |
5 | 3 | (2 | ) | -40 | % | ||||||||||
| Interest expense |
(69 | ) | (66 | ) | 3 | -4 | % | |||||||||
| Income from continuing operations before income tax provision, equity in income and noncontrolling interest |
45 | 56 | 11 | 24 | % | |||||||||||
| Income tax provision |
(22 | ) | (27 | ) | (5 | ) | 23 | % | ||||||||
| Equity in income, net of tax |
1 | 1 | — | NM | ||||||||||||
| Net income from continuing operations, net of tax |
24 | 30 | 6 | 25 | % | |||||||||||
| Loss from discontinued operations, net of tax(3) |
(61 | ) | — | 61 | NM | |||||||||||
| Net income (loss) |
(37 | ) | 30 | 67 | NM | |||||||||||
| Less: net income attributable to noncontrolling interest, net of tax |
7 | 6 | (1 | ) | NM | |||||||||||
| Net income (loss) attributable to the Company |
$ | (44 | ) | $ | 24 | $ | 68 | NM | ||||||||
| (1) | We recorded $1 million and $3 million of restructuring costs in cost of sales for 2009 and 2010, respectively. |
| (2) | We recorded $11 million and $21 million of restructuring costs in selling, general and administrative expenses for 2009 and 2010, respectively. |
| (3) | We recorded in our discontinued operations $2 million of restructuring costs in 2009 and no restructuring costs in 2010. |
NM (Not Meaningful)
Gross profit/Gross margin. Gross profit increased by $42 million during 2010 in comparison to 2009. The gross profit in 2010 increased despite a 24% increase in freight costs. The increase in gross profit in during 2010 was primarily due to an increase in sales volume, currency effects and the effects of our comprehensive restructuring. The comprehensive restructuring began at the end of 2005 and was essentially completed by the end of 2010. Due to the comprehensive restructuring, the operating costs as a percentage of sales decreased in 2010 in comparison to 2009. The improvement in gross profit includes $13 million of favorable currency translation effects.
Selling, general and administrative expenses. Our selling, general and administrative expenses for 2010 increased $23 million from 2009 due to restructuring expenses, payroll related costs, insurance related expenses, advertising, travel costs and professional fees. The restructuring costs increased $10 million in 2010 in comparison to 2009, which was mainly related to our Brake North America and Venezuela operations. The payroll, advertising and travel costs increased $8 million related to improved market and economic conditions of the Company. The remaining increase relates to an increase in insurance costs and legal and professional fees. Offsetting these increases in 2010 was a reduction in the management fee charged by Cypress from $3 million in 2009 to no charge in 2010.
31
Table of Contents
Operating profit/Operating margin. Our operating profit increased in 2010 in comparison to 2009 due to an improvement in gross profit and an increase in sales volume. On and Off-highway segment operating profit increased in 2010 in comparison to 2009 due to the improved gross profit and increased sales. Brake South America segment operating loss increased in 2010 due to the restructuring costs related to the closure of our Maracay, Venezuela manufacturing plant. In 2010, Corporate, eliminations and other operating loss decreased by $10 million due to lower general and administrative expenses and due to Cypress not charging us a management fee.
Gain (loss) on extinguishment of debt. In June of 2009 Affinia Group Holdings Inc. purchased in the open market approximately $33 million principal amount of the Subordinated Notes and thereafter contributed such notes to Affinia Group Intermediate Holdings Inc., who contributed such notes to Affinia Group Inc. Affinia Group Inc. promptly surrendered such purchased notes for cancellation which resulted in a pre-tax gain on the extinguishment of debt of $8 million in 2009. The retirement of $22.5 million of Secured Notes on December 31, 2010 resulted in a pre-tax loss on extinguishment of debt of $1 million.
Interest expense. Interest expense decreased by $3 million in 2010 in comparison to 2009 due to lower refinancing costs in 2010 and offset by higher interest rates on our new debt structure. During 2009, we recognized $10 million in refinancing costs related to replacing our former term loan facility, revolving credit facility and accounts receivable facility and the termination of our interest rate swap agreements. The refinancing consisted of the ABL Revolver and the Secured Notes, the proceeds of which were used to repay outstanding borrowings under our former term loan facility, revolving credit facility and accounts receivable facility, as well as to settle interest rate derivatives and to pay fees and expenses related to the refinancing. During 2010, we issued additional notes and amended the ABL Revolver, which resulted in payment of deferred financing costs of $5 million.
Income tax provision. The income tax provision increased by $5 million for 2010 in comparison to 2009 due mainly to a higher level of income from continuing operations. The effective tax rate was similar for both 2010 and 2009.
Loss from discontinued operations, net of tax. As part of our strategic plan we committed to a plan to sell our Commercial Distribution Europe business unit during the fourth quarter of 2009. Subsequently, on February 2, 2010, we sold the business unit for approximately $12 million. Commercial Distribution Europe incurred a loss of $61 million in 2009 of which $10 million related to loss on operations, $75 million related to an impairment charge to reduce the carrying value of the business to expected realizable value, and offsetting these amounts was $24 million which related to a tax benefit to us resulting from this transaction. In 2010, the estimated loss was decreased $2 million offset by one month of operating losses of $1 million and a $1 million loss on post closing adjustments.
Net income (loss). Net income increased in 2010 in comparison to 2009 due mainly to the decrease in the loss from discontinued operations, net of tax and the increase in gross profit in 2010.
Net income attributable to noncontrolling interest, net of tax. Our net income attributable to noncontrolling interest, net of tax decreased due to our increase in ownership of our two most significant noncontrolling interests. We increased our ownership in Affinia Acquisition LLC from 5% to 40% effective on June 1, 2009 and to 100% effective on September 1, 2010. We acquired the remaining 50% interest in Affinia India Private Limited on December 3, 2010.
32
Table of Contents
Year Ended December 31, 2008 Compared to the Year Ended December 31, 2009
Net sales. Consolidated net sales decreased by $118 million in 2009 in comparison to 2008 due mainly to unfavorable foreign currency translation effects of $96 million. The following table summarizes the consolidated net sales results for the years ended December 31, 2008 and December 31, 2009:
| (Dollars in millions) | Consolidated Year Ended December 31, 2008 |
Consolidated Year Ended December 31, 2009 |
Dollar Change |
Percent Change |
Currency Effect(1) |
|||||||||||||||
| Net sales |
||||||||||||||||||||
| Filtration products |
$ | 727 | $ | 713 | $ | (14 | ) | -2 | % | $ | (47 | ) | ||||||||
| Brake North America and Asia products |
658 | 593 | (65 | ) | -10 | % | (14 | ) | ||||||||||||
| Commercial Distribution South America products |
368 | 333 | (35 | ) | -10 | % | (35 | ) | ||||||||||||
| Chassis products |
155 | 153 | (2 | ) | -1 | % | (2 | ) | ||||||||||||
| On and Off-highway segment |
1,908 | 1,792 | (116 | ) | -6 | % | (98 | ) | ||||||||||||
| Brake South America segment |
26 | 22 | (4 | ) | -15 | % | — | |||||||||||||
| Corporate, eliminations and other |
(19 | ) | (17 | ) | 2 | 11 | % | 2 | ||||||||||||
| Total net sales |
$ | 1,915 | $ | 1,797 | $ | (118 | ) | -6 | % | $ | (96 | ) | ||||||||
| (1) | The currency effect was calculated by comparing the local currency net sales for all international locations for both periods, each at the current year exchange rate to determine the impact of the currency between periods. These currency effects provide a more clear understanding of the operating results of our foreign entities because they exclude the varying effects that changes in foreign currency exchange rates may have on those results. |
On and Off-highway segment products sales decreased due to the following:
| (1) | Filtration products sales decreased in 2009 in comparison to 2008 due to unfavorable foreign currency translation effects of $47 million, which were related to the weakening of the Polish Zloty, the Canadian Dollar, Ukraine Hryvnia and the Mexican Peso against the U.S. Dollar. Offsetting the translation effects were increased sales in our Polish and Venezuelan operations. |
| (2) | Brake North America and Asia products sales decreased in 2009 in comparison to 2008 partially due to $14 million in unfavorable foreign currency translation effects. The decrease is also attributable to a decline in volume, which is related to the general softness in the aftermarket business relating to our branded products. Additionally, one of our customers ceased orders of certain of our brake products and as a result our sales decreased by $21 million. The same customer has increased its filtration orders so we anticipate only a marginal effect on our consolidated net sales. OES channels, which consist primarily of new vehicle manufacturers’ service departments at new vehicle dealerships, have also decreased orders due to recessionary pressures. In 2006, we began to discontinue OEM and co-manufacturing contracts, which were not profitable. The sales relating to these contracts have decreased since 2006 by approximately $100 million. The decrease relating to these contracts in 2009 in comparison 2008 was $9 million. |
| (3) | Commercial Distribution South America products sales decreased in 2009 in comparison to 2008 due to unfavorable foreign currency translation effects of $35 million. The general softness of the South American economies led to a decline in sales in most of our South American operations. However, our Brazilian distribution company offset the decline in sales as it continued to grow its market share even in unfavorable market conditions. |
| (4) | Chassis products sales decreased in 2009 in comparison to 2008 due to unfavorable foreign currency translation effects of $2 million, which were related to the weakening of the Canadian Dollar against the U.S. Dollar. |
Brake South America segment products sales for 2009 decreased in comparison to 2008 due to the closure of a facility in Argentina in 2008. The closed facility had approximately $7 million in sales in 2008. The closed facility mainly manufactured product for our Brake North America operations and Commercial Distribution South America operations. On a consolidated basis, the closure did not result in a significant loss of sales.
33
Table of Contents
The following table summarizes the consolidated results for the years ended December 31, 2008 and December 31, 2009:
| (Dollars in millions) | Consolidated Year Ended December 31, 2008 |
Consolidated Year Ended December 31, 2009 |
Dollar Change |
Percent Change |
||||||||||||
| Net sales |
$ | 1,915 | $ | 1,797 | $ | (118 | ) | -6 | % | |||||||
| Cost of sales(1) |
(1,546 | ) | (1,429 | ) | 117 | -8 | % | |||||||||
| Gross profit |
369 | 368 | (1 | ) | — | |||||||||||
| Gross margin |
19 | % | 20 | % | ||||||||||||
| Selling, general and administrative expenses(2) |
(276 | ) | (267 | ) | 9 | –3 | % | |||||||||
| Selling, general and administrative expenses as a percent of sales |
14 | % | 15 | % | ||||||||||||
| Operating profit (loss) |
||||||||||||||||
| On and Off-highway segment |
141 | 153 | 12 | 9 | % | |||||||||||
| Brake South America segment |
(11 | ) | (3 | ) | 8 | 73 | % | |||||||||
| Corporate, eliminations and other |
(37 | ) | (49 | ) | (12 | ) | -32 | % | ||||||||
| Operating profit |
93 | 101 | 8 | 9 | % | |||||||||||
| Operating margin |
5 | % | 6 | % | ||||||||||||
| Gain on extinguishment of debt |
— | 8 | 8 | NM | ||||||||||||
| Other income (loss), net |
(3 | ) | 5 | 8 | 267 | % | ||||||||||
| Interest expense |
(56 | ) | (69 | ) | (13 | ) | 23 | % | ||||||||
| Income from continuing operations before income tax provision, equity in income and noncontrolling interest |
34 | 45 | 11 | 32 | % | |||||||||||
| Income tax provision |
(18 | ) | (22 | ) | (4 | ) | 22 | % | ||||||||
| Equity in income, net of tax |
— | 1 | 1 | NM | ||||||||||||
| Net income from continuing operations, net of tax |
16 | 24 | 8 | 50 | % | |||||||||||
| Loss from discontinued operations, net of tax(3) |
(19 | ) | (61 | ) | (42 | ) | NM | |||||||||
| Net loss |
(3 | ) | (37 | ) | (34 | ) | NM | |||||||||
| Less: net income attributable to noncontrolling interest, net of tax |
— | 7 | 7 | NM | ||||||||||||
| Net loss attributable to the Company |
$ | (3 | ) | $ | (44 | ) | $ | (41 | ) | NM | ||||||
| (1) | We recorded $1 million in restructuring costs in cost of sales in 2008 and 2009. |
| (2) | We recorded $27 million and $11 million of restructuring costs in selling, general and administrative expenses for 2008 and 2009, respectively. |
| (3) | We recorded in our discontinued operations $12 million and $2 million in restructuring costs in 2008 and 2009, respectively. |
NM (Not Meaningful)
Cost of sales/Gross margin. Gross margin improved to 20% in 2009 in comparison to 19% in 2008. In 2005 we embarked on the comprehensive restructuring to transform our brake operations from a domestic manufacturer to a global manufacturer and distributor. We have completed a significant portion of the comprehensive restructuring and as a result our gross margin improved due to cost savings realized in 2009. This improvement was offset by the strengthening of the U.S. Dollar which decreased the gross margin in 2009 in comparison to 2008 by $27 million.
Selling, general and administrative expenses. Our selling, general and administrative expenses for 2009 decreased from 2008 due mainly to a reduction in restructuring costs of $16 million. The higher restructuring expenses in 2008 were related to announcing the closure of six facilities in 2008 and, in contrast, we approved the closure of one facility in 2009. Offsetting the decrease in expense was a $3 million management fee charged by Cypress for services related to the refinancing and other advisory services.
Operating profit. Operating profit increased in 2009 in comparison to 2008 due to the increase in gross margin resulting from cost savings generated from the comprehensive restructuring offset by the strengthening of the U.S. Dollar as discussed above and the reduction in selling, general and administrative expenses. On and Off-highway segment operating profit increased in 2009 in comparison to 2008 despite a 6% decrease in sales. Operating profit increased due to an increase in gross margin percentage and a reduction in our selling, general and administrative costs. Brake South America segment operating loss decreased in 2009 due to the reduction in operating costs from the closure of an Argentina facility in the middle of 2008.
34
Table of Contents
Gain on extinguishment of debt. In June of 2009 Affinia Group Holdings Inc. purchased in the open market approximately $33 million principal amount of the Subordinated Notes and thereafter contributed such notes to Affinia Group Intermediate Holdings Inc., who contributed such notes to Affinia Group Inc. Affinia Group Inc. promptly surrendered such purchased notes for cancellation which resulted in a pre-tax gain on the extinguishment of debt of $8 million in 2009.
Interest expense. Interest expense increased by $13 million during 2009 in comparison to 2008. On August 13, 2009 we refinanced our former term loan facility, revolving credit facility and accounts receivable facility. The refinancing consisted of the ABL Revolver and the Secured Notes, the proceeds of which were used to repay outstanding borrowings under our former term loan facility, revolving credit facility and accounts receivable facility, as well as to settle interest rate derivatives and to pay fees and expenses related to the refinancing. We recorded a write-off of $5 million to interest expense for unamortized debt issue costs associated with the former term loan facility, revolving credit facility and the accounts receivable facility. We also recorded $4.4 million in settlement costs and $0.2 million of accrued interest related to the termination of our interest rate swap agreements. The remaining increase in interest expense related to higher borrowing levels and rates.
Income tax provision. The income tax provision increased by $4 million for 2009 in comparison to 2008 due mainly to a higher level of income from continuing operations. The effective tax rates were comparable for both periods.
Loss from discontinued operations, net of tax. As part of our strategic plan we committed to a plan to sell our Commercial Distribution Europe business unit during the fourth quarter of 2009. Subsequently, on February 2, 2010, we sold the business unit for approximately $12 million, subject to post closing adjustments. Commercial Distribution Europe incurred a loss of $61 million in 2009 of which $10 million relates to loss on operations, $75 million relates to an impairment charge to reduce the carrying value of the business to expected realizable value, and offsetting these amounts is $24 million which relates to a tax benefit to us resulting from this transaction.
Net loss. Net income from continuing operations increased in 2009 in comparison to 2008. However, the net loss increased due to the increased loss in our discontinued operation.
Net income attributable to noncontrolling interest, net of tax. The noncontrolling interest mainly relates to Affinia Acquisition LLC, which is further described in Note 5 Variable Interest Entity, which is included in Item 8 of this report. We started consolidating Affinia Acquisition LLC, a variable interest entity (“VIE”), during the fourth quarter of 2008. We increased our ownership from 5% to 40% effective on June 1, 2009. Therefore our noncontrolling interest related to Affinia Acquisition LLC, net of tax, eliminates 95% of the VIE’s consolidated income for January through May and 60% starting June 1, 2009, resulting in net income attributable to noncontrolling interest of $7 million in 2009.
Liquidity and Capital Resources
The Company’s primary source of liquidity is cash flow from operations and available borrowings from our ABL Revolver. Our primary liquidity requirements are expected to be for debt servicing, working capital, restructuring obligations and capital spending. Our liquidity requirements are significant, primarily due to debt service requirements, restructuring and expected capital expenditures.
We are significantly leveraged as a result of the Acquisition in 2004, refinancing that occurred in 2009 and the issuance of Additional Notes in 2010. As of December 31, 2010, the Company had $696 million in aggregate indebtedness. As of December 31, 2010, we had an additional $191 million of borrowing capacity available under our ABL Revolver after giving effect to $15 million in outstanding letters of credit, none of which was drawn against, and $3 million for borrowing base reserves. In addition, we had cash and cash equivalents of $65 million and $55 million as of December 31, 2009 and December 31, 2010, respectively.
We spent $31 and $52 million on capital expenditures during 2009 and 2010, respectively. Based on the current level of operations, the Company believes that cash flow from operations and available cash, together with available borrowings under its ABL Revolver, will be adequate to meet our short-term and long-term liquidity needs.
ABL Revolver. Our ABL Revolver consists of a revolving credit facility. Our ABL Revolver provides for loans in a total principal amount of up to $315 million of which $90 million was outstanding at December 31, 2010, and it matures in 2015.
Subordinated Notes and Senior Secured Notes Indenture. The indentures governing the notes limit our (and most or all of our subsidiaries’) ability to incur additional indebtedness, pay dividends on or make other distributions or repurchase our capital stock, make certain investments, enter into certain types of transactions with affiliates, use assets as security in other transactions and sell certain assets or merge with or into other companies. Subject to certain exceptions and limitations, Affinia and its restricted subsidiaries are permitted to incur additional indebtedness, including secured indebtedness, under the terms of the notes.
35
Table of Contents
Net cash provided by operating activities
In 2010, the cash flow from operating activities was a $23 million source of cash in comparison to a $55 million source of cash in 2009 and a $48 million source of cash during 2008. There were significant changes in the following operating activities:
| (Dollars in millions) | Year Ended December 31, 2008 |
Year Ended December 31, 2009 |
Year Ended December 31, 2010 |
|||||||||
| Summary of significant changes in operating activities: |
||||||||||||
| Net income (loss) |
$ | (3 | ) | $ | (37 | ) | $ | 30 | ||||
| Loss (gain) on extinguishment of debt |
— | (8 | ) | 1 | ||||||||
| Write off of unamortized deferred financing costs |
— | 5 | 1 | |||||||||
| Change in trade accounts receivable |
31 | 3 | (14 | ) | ||||||||
| Change in inventories |
(39 | ) | 42 | (77 | ) | |||||||
| Impairment of assets |
2 | 75 | — | |||||||||
| Change in other current operating liabilities |
57 | (42 | ) | 39 | ||||||||
| Subtotal |
48 | 38 | (20 | ) | ||||||||
| Other changes in operating activities |
— | 17 | 43 | |||||||||
| Net cash provided by operating activities |
$ | 48 | $ | 55 | $ | 23 | ||||||
Net income (loss) – Net income increased in 2010 in comparison to 2009 due to the decrease in the loss from discontinued operations, net of tax. We recorded a $75 million impairment related to our Commercial Distribution Europe segment in 2009, which was sold on February 2, 2010.
Loss (gain) on extinguishment of debt – The retirement of $33 million of Subordinated Notes during the second quarter of 2009 resulted in a pre-tax gain on the extinguishment of debt of $8 million. The retirement of $22.5 million of Secured Notes during the fourth quarter of 2010 resulted in a pre-tax loss on the extinguishment of debt of $1 million.
Write-off of debt issuance costs – We recorded a write-off of $5 million in 2009 to interest expense for unamortized deferred financing costs associated with the retirement of the term loan facility, revolving credit facility and the accounts receivable facility. We wrote off $1 million in deferred costs in 2010 related to the extinguishment of $22.5 million of Secured Notes during the fourth quarter of 2010.
Change in trade accounts receivable – Our accounts receivable decreased in 2008 and 2009 and increased in 2010 mainly due to the timing of payments in the United States.
Change in inventories – The change in inventories was a $77 million use of cash in 2010 and a $42 million source of cash in 2009. The reduction in inventory in 2009 was due to a concerted effort to reduce inventories due to the economic downturn. In 2008, our inventory increased mainly due to increases in Brazil and other international locations. Our Brazilian operations were experiencing record sales in 2008 and, as a result, built up inventory to keep up with demand. In 2010, we built up inventory to keep up with increased demand, which was due to improving market conditions in the aftermarket industry, new business with new customers and additional business with existing customers.
Change in other current operating liabilities – The change in other current operating liabilities was a $39 million source of cash during 2010, a $42 million use of cash in the 2009 and a $57 million source of cash in 2008. The changes over the last three years were primarily due to accounts payable, which was a $38 million source of cash in 2010, a $54 million use of cash in 2009 and a $45 million source of cash in 2008. Accounts payable fluctuates from quarter to quarter due to the timing of payments.
36
Table of Contents
Net cash used in investing activities
The following table summarizes investing activities:
| (Dollars in millions) | Year Ended December 31, 2008 |
Year Ended December 31, 2009 |
Year Ended December 31, 2010 |
|||||||||
| Investing activities |
||||||||||||
| Proceeds from sales of assets |
$ | 1 | $ | — | $ | 1 | ||||||
| Investments in companies, net of cash acquired |
(50 | ) | — | (51 | ) | |||||||
| Proceeds from sales of affiliates |
6 | — | 11 | |||||||||
| Investment in affiliate |
(6 | ) | — | — | ||||||||
| Change in restricted cash |
(1 | ) | (5 | ) | (3 | ) | ||||||
| Additions to property, plant and equipment |
(25 | ) | (31 | ) | (52 | ) | ||||||
| Other investing activities |
— | — | (4 | ) | ||||||||
| Net cash used in investing activities |
$ | (75 | ) | $ | (36 | ) | $ | (98 | ) | |||
Net cash used in investing activities is summarized in the table above for the years ended 2008, 2009 and 2010. The changes in investing activities are mainly comprised of the following:
Investments in companies, net of cash acquired – Affinia Hong Kong Limited was acquired in 2008 for $50 million. The NAPD business was acquired for an original payment of $51 million in 2010 and a $1 million payment in 2011 for a working capital settlement.
Additions to property, plant and equipment – The additions increased significantly in 2010 due to the expansion in China for new friction and filtration facilities and for the expansion of our Polish and Brazilian operations. The total additions to property, plant and equipment in China, Poland and Brazil increased $21 million in 2010 from 2009.
Net cash provided by (used in) financing activities
| (Dollars in millions) | Year Ended December 31, 2008 |
Year Ended December 31, 2009 |
Year Ended December 31, 2010 |
|||||||||
| Financing activities |
||||||||||||
| Net increase in other short-term debt |
$ | — | $ | — | $ | 13 | ||||||
| Proceeds from Subordinated Notes |
— | — | 100 | |||||||||
| Repayment on Secured Notes |
— | — | (23 | ) | ||||||||
| Payments on senior term loan facility |
— | (297 | ) | — | ||||||||
| Capital contribution |
50 | — | 3 | |||||||||
| Payment of deferred financing costs |
— | (22 | ) | (5 | ) | |||||||
| Proceeds from Secured Notes |
— | 222 | — | |||||||||
| Net proceeds from ABL Revolver |
— | 90 | — | |||||||||
| Purchase of noncontrolling interest |
— | (25 | ) | (24 | ) | |||||||
| Other |
1 | (3 | ) | 2 | ||||||||
| Net cash provided by (used in) financing activities |
$ | 51 | $ | (35 | ) | $ | 66 | |||||
Net cash provided by (used in) financing activities is summarized in the table above for the years ended 2008, 2009 and 2010. The changes in financing activities are mainly comprised of the following:
On December 9, 2010, we completed an offering of the Additional Notes. The issuance of the Additional Notes and the amendment of the ABL Revolver in 2010 resulted in payment of deferred financing costs of $5 million. We utilized the ABL Revolver to finance our purchase of the NAPD business and the remaining 50% interest in Affinia India Private Limited but subsequently we used the proceeds of this note offering to repay the ABL Revolver borrowings that we incurred to finance these acquisitions. The proceeds of the note offering were also used to redeem $22.5 million in Secured Notes on December 31, 2010.
In the third quarter of 2009, we refinanced a portion of our then-existing debt. We settled the former term loan facility by paying $287 million. The refinancing included sources of cash of $222 million from the Secured Notes. We also had $90 million of net borrowings on the new ABL Revolver and $22 million of fees and other associated financing costs.
37
Table of Contents
Effective June 1, 2009, Affinia Group Inc. acquired an additional 35% ownership interest in Affinia Acquisition LLC for a purchase price of $25 million, which increased its ownership to 40%. The $25 million reduced our noncontrolling interest balance in 2009. During the fourth quarter of 2010, we acquired the remaining 50% ownership interest in Affinia India Private Limited, our India joint venture, for $24 million in cash, increasing our ownership interest from 50% to 100%. The $24 million reduced our noncontrolling interest balance in 2010.
Contributions - The source of cash in 2008 was mainly comprised of a $50 million contribution to Affinia Acquisition LLC from Affinia Group Holdings Inc., which was used to purchase 85% of Affinia Hong Kong Limited. The $3 million source of cash in 2010 related to a contribution from Mr. Zhang Haibo, who owns 15% of Affinia Hong Kong Limited. The contribution was used to facilitate the purchase of land for a new filtration company in China with the intention to manufacture products in China and distribute filtration products principally in Asia.
Contractual Obligations and Commitments
Cash obligations. Under various agreements, we are obligated to make future cash payments in fixed amounts. These include payments under debt obligations at maturity, under operating lease agreements, and under purchase commitments for property, plant, and equipment. The following table summarizes our fixed cash obligations over various future periods as of December 31, 2010:
| Payments Due By Period | ||||||||||||||||||||
| Contractual Cash Obligations* |
Total | Less than 1 year |
1 – 3 Years |
4 – 5 years |
After 5 Years |
|||||||||||||||
| (Dollars in Millions) | ||||||||||||||||||||
| Debt obligations** |
$ | 698 | $ | 27 | $ | 12 | $ | 457 | $ | 202 | ||||||||||
| Interest on Subordinated Notes |
129 | 33 | 66 | 30 | — | |||||||||||||||
| Interest on Secured Notes |
122 | 22 | 44 | 43 | 13 | |||||||||||||||
| Interest on ABL Revolver*** |
19 | 4 | 8 | 7 | — | |||||||||||||||
| Operating leases |
66 | 12 | 24 | 16 | 14 | |||||||||||||||
| Post employment obligations |
3 | 2 | — | — | 1 | |||||||||||||||
| Purchase commitments for property, plant, and equipment |
13 | 13 | — | — | — | |||||||||||||||
| Total contractual obligations |
$ | 1,050 | $ | 113 | $ | 154 | $ | 553 | $ | 230 | ||||||||||
| * | Excludes the $2 million reserve for income taxes under ASC Topic 740, “Income Taxes," as we are unable to reasonably predict the ultimate timing of settlement of our reserves for income taxes. |
| ** | Excludes $2 million discount on the Secured Notes. |
| *** | The ABL Revolver includes a margin on LIBOR borrowings that varies from 2.25% to 2.75% based on availability under the facility. At December 31, 2010, the margin was 2.50%. |
We are party to various pending judicial and administrative proceedings arising in the ordinary course of business. These include, among others, proceedings based on product liability claims and alleged violations of environmental laws.
We have various accruals for contingent liability costs associated with pending judicial and administrative proceedings (excluding environmental liabilities described below). We had $1 million and $2 million accrued at December 31, 2009 and 2010, respectively. There are no recoveries expected from third parties. If there is a range of equally probable outcomes, we accrue the lower end of the range.
The fair value of an ARO is required to be recognized in the period in which it is incurred if it can be reasonably estimated, with the offsetting associated asset retirement costs capitalized as part of the carrying amount of the long-lived asset. The ARO is subsequently allocated to expense using a systematic and rational method over its useful life. Changes in the ARO liability resulting from the passage of time are recognized as an increase in the carrying amount of the liability and an accretion to expense. Changes resulting from revisions to the timing or amount of the original estimate of cash flows are recognized as an increase or a decrease in both the asset and liability. Our ARO liability recorded at December 31, 2009 and December 31, 2010 was $2 million and the accretion for 2009 and 2010 was less than $1 million.
The critical accounting estimates that affect our financial statements and that use judgments and assumptions are listed below. These estimates are subject to a range of amounts because of inherent imprecision that may result from applying judgment to the estimation process. The expenses and accrued liabilities or allowances related to certain of these policies are initially based on our best estimate at the time of original entry in our accounting records. Adjustments are recorded when actual results differ from the expected forecasts underlying the estimates. These adjustments could be material if our results were to change significantly in a short period of time. We make frequent comparisons of actual results and expected forecasts in order to mitigate the likelihood of material adjustments.
38
Table of Contents
Asset impairment. We perform impairment analyses, which are based on the guidance found in ASC Topic 350, “Intangibles -Goodwill and Other” and ASC Topic 360, “Property, Plant, and Equipment.” Management also evaluates the carrying amount of our inventories on a recurring basis for impairment due to lower of cost or market issues, and for excess or obsolete quantities. Goodwill and intangibles with indefinite lives are tested for impairment as of December 31 of each year or more frequently as necessary. The factors that would cause a more frequent test for impairment include, among other things, a significant negative change in the estimated future cash flows of the reporting unit that has goodwill or other intangibles because of an event or a combination of events. If the carrying amount of the asset is determined not to be recoverable, a write-down to fair value is recorded. Fair values are determined based on quoted market values, discounted cash flows, or external appraisals, as applicable. We review long-lived assets for impairment at the individual asset or the asset group level for which the lowest level of independent cash flows can be identified.
Goodwill. The impairment test involves a two-step process. First, a comparison of the fair value of the applicable reporting unit with the aggregate carrying values, including goodwill, is performed. If the carrying amount of a reporting unit exceeds the reporting unit’s fair value, we perform the second step of the goodwill impairment test to determine the amount of impairment loss. The second step includes comparing the implied fair value of the affected reporting unit’s goodwill with the carrying value of that goodwill. The reporting unit’s current fair value is substantially in excess of the reporting unit’s carrying value.
We primarily determine the fair value of our reporting units using a discounted cash flow model (“DCF model”), and supplement this with observable valuation multiples for comparable companies, as applicable. The completion of the DCF model requires that we make a number of significant assumptions to produce an estimate of future cash flows. These assumptions include projections of future revenue, costs and working capital changes. In addition, we make assumptions about the estimated cost of capital and other relevant variables, as required, in estimating the fair value of our reporting units. The projections that we use in our DCF model are updated annually and will change over time based on the historical performance and changing business conditions for each of our reporting units. The determination of whether goodwill is impaired involves a significant level of judgment in these assumptions, and changes in our business strategy, or economic or market conditions could significantly impact these judgments. We will continue to monitor market conditions and other factors to determine if interim impairment tests are necessary in future periods. If impairment indicators are present in future periods, the resulting impairment charges could have a material impact on our results of operations.
Trade names. The fair value for each trade name is estimated based upon management’s estimates using a royalty savings approach, which is based on the principle that, if the business did not own the asset, it would have to license it in order to earn the returns that it was earning. The fair value is calculated based on the present value of the royalty stream that the business was saving by owning the asset. The projections that we use in our model are updated annually and will change over time based on the historical performance and changing business conditions for each of our reporting units. The determination of whether trade names are impaired involves a significant level of judgment in these assumptions, and changes in our business strategy, or economic or market conditions could significantly impact these judgments.
Other intangibles. Finite-lived intangibles are amortized over their estimated useful lives. Impairment tests for these intangible assets are only performed when a triggering event occurs that indicates that the carrying value of the intangible may not be recoverable based on the undiscounted future cash flows of the intangible. If the carrying amount of the intangible is determined not to be recoverable, a write-down to fair value is recorded. Fair values are determined based on a DCF model.
Inventories. Inventories are valued at the lower of cost or market. Cost is determined on the FIFO basis for all inventories or average cost basis for non-U.S. inventories. Where appropriate, standard cost systems are utilized for purposes of determining cost; the standards are adjusted as necessary to ensure they approximate actual costs. Estimates of inventory value are determined on a product line basis. These estimates are based upon current economic conditions, historical sales quantities and patterns and, in some cases, the specific risk of loss on specifically identified inventories.
We also evaluate inventories on a regular basis to identify inventory on hand that may be obsolete or in excess of current and future projected market demand principally based on historical market demand. For inventory deemed to be obsolete, we provide a reserve on the full value of the inventory. Inventory that is in excess of current and projected use, which is generally defined as inventory quantities in excess of 24 months of historical sales, is adjusted for certain allowances such as new part number introductions and product repacking opportunities.
39
Table of Contents
Revenue recognition. Sales are recognized when products are shipped or received depending on terms and whether risk of loss has transferred to the customer. The Company estimates and records provisions for warranty costs, sales returns and other allowances based on experience when sales are recognized. The Company assesses the adequacy of its recorded warranty and sales returns and allowances liabilities on a regular basis and adjusts the recorded amounts as necessary. While management believes that these estimates are reasonable, actual returns and allowances and warranty costs may differ from estimates. Inter-company sales have been eliminated.
Sales returns and rebates. The amount of sales returns accrued at the time of sale is estimated on the basis of the history of the customer and the history of products returned. Other factors considered in establishing the accrual include consideration of current economic conditions and changes in trends in returns, as well as adjusting for the impact of extraordinary returns that may result from individual negotiations with a customer in an unusual situation. The level of sales returns are recorded as a reduction of gross sales in our financial statements at the time of sale. In addition, we periodically perform studies to determine a scrap factor to be applied to the returns on a product-by-product basis, since a portion of the goods historically returned by customers have not been in saleable condition. Estimates of returned goods that are not in saleable condition are included in cost of sales.
We customize rebate programs with individual customers. Under certain rebate programs, a customer may earn a rebate that will increase as a percentage of the sale amount based on the achievement of specified sales levels. In order to estimate the amount of a rebate under this type of arrangement, we project the amount of sales that the customer will make over the specified rebate period in order to calculate an overall rebate to be accrued at the time that each sale is made. Gross sales are reduced at the time of sale. These estimates may need to be adjusted based on actual customer purchases compared to the projected purchases. Adjustments to the accrual are made as new information becomes available. In other cases a customer may earn a specific rebate for a specific period of time, based upon the sales of certain product types within the specified timeframe. Rebates are recorded as a reduction of gross sales.
Warranty. Estimated costs related to product warranty are accrued at the time of sale and included in cost of sales. Estimated costs are based upon past warranty claims and sales history. In certain situations the estimated cost of the warranty includes a salvage factor where a portion of the inventory returned proves to be saleable. These costs are then adjusted, as required, to reflect subsequent experience.
Pensions. We have defined benefit plans related to Canadian employees with fair value of assets of approximately $2 million and liabilities of approximately $3 million as of December 31, 2010.
Under the defined benefit plans, annual net periodic expense and benefit liabilities are determined on an actuarial basis. Each year, actual experience is compared to the more significant assumptions used and, if warranted, we make adjustments to the assumptions. Discount rates are based upon an expected benefit payments duration analysis and the equivalent average yield rate for high-quality fixed-income investments. Pension benefits are funded through deposits with trustees and the expected long-term rates of return on fund assets are based upon actual historical returns modified for known changes in the market and any expected changes in investment policy.
Income taxes. We account for income taxes using the asset and liability method. Deferred tax assets and liabilities are recognized for the future tax consequences attributable to differences between the financial statement carrying amounts of existing assets and liabilities and their respective tax basis. Deferred tax assets and liabilities are measured using enacted tax rates expected to be in effect for the year in which those temporary differences are expected to be recovered or settled. Deferred tax assets are recognized for temporary differences that will result in deductible amounts in future years and for carryforwards. A valuation allowance is recognized if, based on the weight of available evidence, it is more likely than not that some portion or all of a deferred tax asset will not be realized. All available evidence, both positive and negative, is considered when determining the need for a valuation allowance. Judgment is used in considering the relative impact of negative and positive evidence. The weight given to the potential effect of negative and positive evidence is commensurate with the extent to which it can be objectively verified. Accounting for income taxes involves matters that require estimates and the application of judgment. Our income tax estimates are adjusted in light of changing circumstances, such as the progress of tax audits and our evaluation of the realizability of our tax assets.
Contingency reserves. We have historically been subject to a number of loss exposures, such as environmental claims, product liability and litigation. Establishing loss reserves for these matters requires the use of estimates and judgment with regard to risk exposure and ultimate liability. We expect to estimate losses relating to such contingent liabilities using consistent and appropriate methods. Changes to assumptions we use could materially affect the recorded liabilities.
Restructuring. The company defines restructuring charges to include costs related to business operation consolidation and exit and disposal activities. In 2005, we announced two restructuring plans: (i) a restructuring plan that we announced at the beginning of 2005 as part of the Acquisition, also referred to as the acquisition restructuring and (ii) a restructuring plan that we announced at the end of 2005, also referred to as the comprehensive restructuring. We have completed the acquisition restructuring and we have essentially completed the comprehensive restructuring. We currently estimate that we will incur in the aggregate approximately $171 million of cash and non cash restructuring costs for the comprehensive restructuring. With the comprehensive restructuring coming to a close we anticipate from time to time further refinement to the Company through continued restructuring. Establishing a reserve requires the estimate and judgment of management with respect to employee termination benefits, environmental costs and other exit costs. We had a $7 million and $4 million reserve recorded as of December 31, 2009 and 2010, respectively.
40
Table of Contents
Recent Accounting Pronouncements
In January 2010, the FASB issued ASU 2010-6, “Improving Disclosures about Fair Value Measurements.” This update requires additional disclosure within the roll forward of activity for assets and liabilities measured at fair value on a recurring basis, including transfers of assets and liabilities between Level 1 and Level 2 of the fair value hierarchy and the separate presentation of purchases, sales, issuances and settlements of assets and liabilities within Level 3 of the fair value hierarchy. In addition, the update requires enhanced disclosures of the valuation techniques and inputs used in the fair value measurements within Levels 2 and 3. The new disclosure requirements are effective for interim and annual periods beginning after December 15, 2009. We adopted this guidance on disclosures in the first quarter of 2010. There are also additional new disclosure requirements for purchases, sales, issuances and settlements of Level 3 measurements, which are effective for interim and annual periods beginning after December 15, 2010. The adoption of ASU 2010-6 did not have a material impact on the Company’s consolidated financial statements.
In July 2010, the FASB amended ASC 310, “Receivables,” with ASU 2010-20, “Receivables (Topic 310): Disclosures about the Credit Quality of Financing Receivables and the Allowance for Credit Losses,” to require additional information related to financing receivables, including loans and trade accounts receivable with contractual maturities exceeding one year. With the exception of disclosures related to activity occurring during a reporting period, which are effective for fiscal years beginning after December 15, 2010, the provisions of this update are effective as of December 31, 2010. The Company does not expect the effects of adoption to have a material impact on our financial condition, results of operations and disclosures.
| Item 7A. | Quantitative and Qualitative Disclosures about Market Risk |
We are exposed to various market risks, such as currency exchange and interest rate fluctuation. Where necessary to minimize such risks we may enter into financial derivative transactions, however we do not enter into derivatives or other financial instruments for trading or speculative purposes.
Currency risk
We conduct business throughout the world. Although we manage our businesses in such a way as to reduce a portion of the risks associated with operating internationally, changes in currency exchange rates may adversely impact our results of operations and financial position.
The results of operations and financial position of each of our operations are measured in their respective local (functional) currency. Business transactions denominated in currencies other than an operation’s functional currency produce foreign exchange gains and losses, as a result of the re-measurement process, as described in ASC Topic 830, “Foreign Currency Matters.” To the extent that our business activities create monetary assets or liabilities denominated in a non-local currency, changes in an entity’s functional currency exchange rate versus each currency in which an entity transacts business have a varying impact on an entity’s results of operations and financial position, as reported in functional currency terms. Therefore, for entities that transact business in multiple currencies, we seek to minimize the net amount of cash flows and balances denominated in non-local currencies. However, in the normal course of conducting international business, some amount of non-local currency exposure will exist. Therefore, management monitors these exposures and may engage in business activities or execute financial hedge transactions intended to mitigate the potential financial impact due to changes in the respective exchange rates.
Our consolidated results of operations and financial position, as reported in U.S. Dollars, are also affected by changes in currency exchange rates. The results of operations of non-U.S. Dollar functional entities are translated into U.S. Dollars for consolidated reporting purposes each period at the average currency exchange rate experienced during the period. To the extent that the U.S. Dollar may appreciate or depreciate over time, the contribution of non-U.S. Dollar denominated results of operations to our U.S. Dollar reported consolidated earnings will vary accordingly. Therefore, changes in the various local currency exchange rates, as applied to the revenue and expenses of our non-U.S. Dollar operations may have a significant impact on our sales and, to a lesser extent, consolidated net income trends. In addition, a significant portion of our consolidated financial position is maintained at foreign locations and is denominated in functional currencies other than the U.S. Dollar. The non-U.S. Dollar denominated monetary assets and liabilities are translated into U.S. Dollars at each respective currency’s exchange rate then in effect at the end of each reporting period. The financial impact of the translation process is reflected within the other comprehensive income component of shareholder’s equity. Accordingly, the amounts shown in our consolidated shareholder’s equity account will fluctuate depending upon the cumulative appreciation or depreciation of the U.S. Dollar versus each of the respective functional currencies in which we conduct business. Management seeks to lessen the potential financial impact upon the our consolidated results of operations due to exchange rate changes by engaging in business activities or by executing financial derivative transactions intended to mitigate specific transactional underlying currency exposures. We do not engage in activities solely intended to counteract the impact that changes in currency exchange rates may have upon our U.S. Dollar reported statement of financial condition nor do we engage in currency transactions for speculative purposes.
41
Table of Contents
Our foreign currency exchange rate risk management efforts primarily focus upon operationally managing the net amount of non-functional currency denominated monetary assets and liabilities. In addition, we routinely execute short-term currency exchange rate forward contracts intended to mitigate the earnings impact related to the re-measurement process. At December 31, 2010, we had currency exchange rate derivatives with an aggregate notional value of $121 million and fair values of $1 million in assets and less than $1 million in liabilities.
Interest rate risk
We are exposed to the risk of rising interest rates to the extent that we fund operations with short-term or variable-rate borrowings. At December 31, 2010, the Company’s $696 million of aggregate debt outstanding consisted of $105 million of floating-rate debt and $591 million of fixed-rate debt.
Pursuant to our written interest rate risk management policy we actively monitor and manage our fixed versus floating rate debt composition within a specified range. At year-end, fixed rate debt comprised approximately 85% of our total debt. Based on the amount of floating-rate debt outstanding at December 31, 2010 a 1% rise in interest rates would result in approximately $1 million in incremental interest expense.
Commodity Price Risk Management
We are exposed to adverse price movements or surcharges related to commodities that are used in the normal course of business operations. Management actively seeks to negotiate contractual terms with our customers and suppliers to limit the potential financial impact related to these exposures.
42
Table of Contents
| Item 8. | Financial Statements and Supplementary Data |
Report of Independent Registered Public Accounting Firm
To the Board of Directors and Shareholder of
Affinia Group Intermediate Holdings Inc.
Ann Arbor, Michigan
We have audited the accompanying consolidated balance sheets of Affinia Group Intermediate Holdings Inc. and subsidiaries (the “Company”) as of December 31, 2010 and 2009, and the related consolidated statements of operations, shareholder’s equity, and cash flows for each of the three years in the period ended December 31, 2010. Our audits also included the financial statement schedule listed in the Index at Item 15. These financial statements and financial statement schedule are the responsibility of the Company’s management. Our responsibility is to express an opinion on the financial statements and financial statement schedule based on our audits.
We conducted our audits in accordance with the standards of the Public Company Accounting Oversight Board (United States). Those standards require that we plan and perform the audit to obtain reasonable assurance about whether the financial statements are free of material misstatement. The Company is not required to have, nor were we engaged to perform, an audit of its internal control over financial reporting. Our audits included consideration of internal control over financial reporting as a basis for designing audit procedures that are appropriate in the circumstances, but not for the purpose of expressing an opinion on the effectiveness of the Company’s internal control over financial reporting. Accordingly, we express no such opinion. An audit also includes examining, on a test basis, evidence supporting the amounts and disclosures in the financial statements, assessing the accounting principles used and significant estimates made by management, as well as evaluating the overall financial statement presentation. We believe that our audits provide a reasonable basis for our opinion.
In our opinion, such consolidated financial statements present fairly, in all material respects, the financial position of Affinia Group Intermediate Holdings Inc. and subsidiaries as of December 31, 2010 and 2009, and the results of their operations and their cash flows for each of the three years in the period ended December 31, 2010, in conformity with accounting principles generally accepted in the United States of America. Also, in our opinion, such financial statement schedule, when considered in relation to the basic consolidated financial statements taken as a whole, presents fairly in all material respects the information set forth therein.
| /s/ DELOITTE & TOUCHE LLP |
| Detroit, Michigan |
| March 11, 2011 |
43
Table of Contents
Affinia Group Intermediate Holdings Inc.
Consolidated Statements of Operations
| (Dollars in millions) | Year Ended December 31, 2008 |
Year Ended December 31, 2009 |
Year Ended December 31, 2010 |
|||||||||
| Net sales |
$ | 1,915 | $ | 1,797 | $ | 1,991 | ||||||
| Cost of sales |
(1,546 | ) | (1,429 | ) | (1,581 | ) | ||||||
| Gross profit |
369 | 368 | 410 | |||||||||
| Selling, general and administrative expenses |
(276 | ) | (267 | ) | (290 | ) | ||||||
| Operating profit |
93 | 101 | 120 | |||||||||
| Gain (loss) on extinguishment of debt |
— | 8 | (1 | ) | ||||||||
| Other income (loss), net |
(3 | ) | 5 | 3 | ||||||||
| Interest expense |
(56 | ) | (69 | ) | (66 | ) | ||||||
| Income from continuing operations before income tax provision, equity in income and noncontrolling interest |
34 | 45 | 56 | |||||||||
| Income tax provision |
(18 | ) | (22 | ) | (27 | ) | ||||||
| Equity in income, net of tax |
— | 1 | 1 | |||||||||
| Net income from continuing operations |
16 | 24 | 30 | |||||||||
| Loss from discontinued operations, net of tax |
(19 | ) | (61 | ) | — | |||||||
| Net income (loss) |
(3 | ) | (37 | ) | 30 | |||||||
| Less: net income attributable to noncontrolling interest, net of tax |
— | 7 | 6 | |||||||||
| Net income (loss) attributable to the Company |
$ | (3 | ) | $ | (44 | ) | $ | 24 | ||||
The accompanying notes are an integral part of the consolidated financial statements.
44
Table of Contents
Affinia Group Intermediate Holdings Inc.
Consolidated Balance Sheets
| (Dollars in millions) | December 31, 2009 |
December 31, 2010 |
||||||
| Assets |
||||||||
| Current assets: |
||||||||
| Cash and cash equivalents |
$ | 65 | $ | 55 | ||||
| Restricted cash |
9 | 12 | ||||||
| Trade accounts receivable, less allowances of $3 million for 2009 and $2 million for 2010 |
293 | 316 | ||||||
| Inventories, net |
430 | 520 | ||||||
| Current deferred taxes |
50 | 40 | ||||||
| Prepaid taxes |
50 | 55 | ||||||
| Other current assets |
21 | 18 | ||||||
| Current assets of discontinued operations |
55 | — | ||||||
| Total current assets |
973 | 1,016 | ||||||
| Property, plant, and equipment, net |
199 | 217 | ||||||
| Goodwill |
43 | 59 | ||||||
| Other intangible assets, net |
149 | 156 | ||||||
| Deferred financing costs |
24 | 23 | ||||||
| Deferred income taxes |
68 | 85 | ||||||
| Investments and other assets |
27 | 33 | ||||||
| Total assets |
$ | 1,483 | $ | 1,589 | ||||
| Liabilities and shareholder’s equity |
||||||||
| Current liabilities: |
||||||||
| Accounts payable |
$ | 201 | $ | 244 | ||||
| Notes payable |
12 | 27 | ||||||
| Other accrued expenses |
154 | 151 | ||||||
| Accrued payroll and employee benefits |
27 | 33 | ||||||
| Current liabilities of discontinued operations |
43 | — | ||||||
| Total current liabilities |
437 | 455 | ||||||
| Long-term debt |
589 | 669 | ||||||
| Deferred employee benefits and other noncurrent liabilities |
20 | 17 | ||||||
| Total liabilities |
1,046 | 1,141 | ||||||
| Contingencies and commitments |
||||||||
| Common stock, $.01 par value, 1,000 shares authorized, issued and outstanding |
— | — | ||||||
| Additional paid-in capital |
434 | 454 | ||||||
| Accumulated deficit |
(81 | ) | (57 | ) | ||||
| Accumulated other comprehensive income |
38 | 39 | ||||||
| Total shareholder’s equity of the Company |
391 | 436 | ||||||
| Noncontrolling interest in consolidated subsidiaries |
46 | 12 | ||||||
| Total shareholder’s equity |
437 | 448 | ||||||
| Total liabilities and shareholder’s equity |
$ | 1,483 | $ | 1,589 | ||||
The accompanying notes are an integral part of the consolidated financial statements.
45
Table of Contents
Affinia Group Intermediate Holdings Inc.
Consolidated Statements of Shareholder’s Equity
| (Dollars in millions) |
Common stock |
Additional paid-in capital |
Accumu- lated deficit |
Pension adjustments |
Foreign currency translation adjustment |
Interest rate swap |
Accum- ulated other Comprehen- sive income (loss) |
Total share- holder’s equity of the company |
Noncon- trolling Interest |
Total equity |
||||||||||||||||||||||||||||||
| Balance at December 31, 2007 |
$ | — | $ | 408 | $ | (34 | ) | $ | (3 | ) | $ | 63 | $ | (2) | $ | 432 | $ | 2 | 434 | |||||||||||||||||||||
| Stock-based compensation |
— | — | — | — | — | — | — | — | — | |||||||||||||||||||||||||||||||
| Capital contribution |
— | 3 | — | — | — | — | 3 | — | 3 | |||||||||||||||||||||||||||||||
| Noncontrolling interest related to acquisitions |
— | — | — | — | — | — | — | 58 | 58 | |||||||||||||||||||||||||||||||
| Net loss |
— | — | (3 | ) | — | — | — | (3 | ) | (3 | ) | — | (3 | ) | ||||||||||||||||||||||||||
| Other comprehensive income (loss): |
||||||||||||||||||||||||||||||||||||||||
| Interest rate swap – net of tax of $1 million |
— | — | — | — | — | (2 | ) | (2 | ) | (2 | ) | — | (2 | ) | ||||||||||||||||||||||||||
| Minimum pension liability adjustment |
— | — | — | (1 | ) | — | — | (1 | ) | (1 | ) | — | (1 | ) | ||||||||||||||||||||||||||
| Currency translation – net of tax of $1 million |
— | — | — | — | (73 | ) | — | (73 | ) | (73 | ) | — | (73 | ) | ||||||||||||||||||||||||||
| Comprehensive loss |
— | — | — | — | — | — | (79 | ) | ||||||||||||||||||||||||||||||||
| Balance at December 31, 2008 |
$ | — | $ | 411 | $ | (37 | ) | $ | (4 | ) | $ | (10 | ) | $ | (4 | ) | $ | 356 | 60 | 416 | ||||||||||||||||||||
| Stock-based compensation |
— | 1 | — | — | — | — | 1 | — | 1 | |||||||||||||||||||||||||||||||
| Capital contribution |
— | 25 | — | — | — | — | 25 | — | 25 | |||||||||||||||||||||||||||||||
| Noncontrolling interest decrease due to acquisition of additional ownership |
— | (3 | ) | — | — | — | — | (3 | ) | (21 | ) | (24 | ) | |||||||||||||||||||||||||||
| Net (loss) income |
— | — | (44 | ) | — | — | — | (44 | ) | (44 | ) | 7 | (37 | ) | ||||||||||||||||||||||||||
| Other comprehensive income (loss): |
||||||||||||||||||||||||||||||||||||||||
| Interest rate swap – net of tax of $2 |
— | — | — | — | — | 4 | 4 | 4 | — | 4 | ||||||||||||||||||||||||||||||
| Minimum pension liability adjustment |
— | — | — | — | — | — | — | — | — | — | ||||||||||||||||||||||||||||||
| Currency translation – net of tax of $2 million |
— | — | — | — | 52 | — | 52 | 52 | — | 52 | ||||||||||||||||||||||||||||||
| Comprehensive income |
— | — | — | — | — | — | 12 | |||||||||||||||||||||||||||||||||
| Balance at December 31, 2009 |
$ | — | $ | 434 | $ | (81 | ) | $ | (4 | ) | $ | 42 | $ | — | $ | 391 | 46 | 437 | ||||||||||||||||||||||
| Stock-based compensation |
— | 1 | — | — | — | — | 1 | — | 1 | |||||||||||||||||||||||||||||||
| Capital contribution |
— | 3 | — | — | — | — | 3 | — | 3 | |||||||||||||||||||||||||||||||
| Noncontrolling interest decrease due to acquisition of additional ownership |
— | 16 | — | — | — | — | 16 | (40 | ) | (24 | ) | |||||||||||||||||||||||||||||
| Net income |
— | — | 24 | — | — | — | 24 | 24 | 6 | 30 | ||||||||||||||||||||||||||||||
| Other comprehensive income: |
||||||||||||||||||||||||||||||||||||||||
| Loss on settlement pension obligations |
— | — | — | 3 | — | — | 3 | 3 | — | 3 | ||||||||||||||||||||||||||||||
| Currency translation – net of tax of less than $1 million |
— | — | — | — | (2 | ) | — | (2 | ) | (2 | ) | — | (2 | ) | ||||||||||||||||||||||||||
| Comprehensive income |
— | — | — | — | — | — | 25 | |||||||||||||||||||||||||||||||||
| Balance at December 31, 2010 |
$ | — | $ | 454 | $ | (57 | ) | $ | (1 | ) | $ | 40 | $ | — | $ | 436 | $ | 12 | $ | 448 | ||||||||||||||||||||
The accompanying notes are an integral part of the consolidated financial statements.
46
Table of Contents
Affinia Group Intermediate Holdings Inc.
Consolidated Statements of Cash Flows
| (Dollars in millions) | Year Ended December 31, 2008 |
Year Ended December 31, 2009 |
Year Ended December 31, 2010 |
|||||||||
| Operating activities |
||||||||||||
| Net income (loss) |
$ | (3 | ) | $ | (37 | ) | $ | 30 | ||||
| Adjustments to reconcile net income (loss) to net cash provided by operating activities: |
||||||||||||
| Depreciation and amortization |
36 | 38 | 37 | |||||||||
| Impairment of assets |
2 | 75 | — | |||||||||
| Stock-based compensation |
1 | 1 | 1 | |||||||||
| Loss on disposition of affiliate |
1 | — | — | |||||||||
| Loss (gain) on extinguishment of debt |
— | (8 | ) | 1 | ||||||||
| Write-off of unamortized deferred financing costs |
— | 5 | 1 | |||||||||
| Provision for deferred income taxes |
14 | (9 | ) | (16 | ) | |||||||
| Change in trade accounts receivable |
31 | 3 | (14 | ) | ||||||||
| Change in inventories |
(39 | ) | 42 | (77 | ) | |||||||
| Change in other current operating assets |
(49 | ) | (33 | ) | 12 | |||||||
| Change in other current operating liabilities |
57 | (42 | ) | 39 | ||||||||
| Change in other |
(3 | ) | 20 | 9 | ||||||||
| Net cash provided by operating activities |
48 | 55 | 23 | |||||||||
| Investing activities |
||||||||||||
| Proceeds from sales of assets |
1 | — | 1 | |||||||||
| Investments in companies, net of cash acquired |
(50 | ) | — | (51 | ) | |||||||
| Proceeds from sale of affiliates |
6 | — | 11 | |||||||||
| Investments in affiliates |
(6 | ) | — | — | ||||||||
| Change in restricted cash |
(1 | ) | (5 | ) | (3 | ) | ||||||
| Additions to property, plant, and equipment |
(25 | ) | (31 | ) | (52 | ) | ||||||
| Other investing activities |
— | — | (4 | ) | ||||||||
| Net cash used in investing activities |
(75 | ) | (36 | ) | (98 | ) | ||||||
| Financing activities |
||||||||||||
| Net increase in other short-term debt |
— | — | 13 | |||||||||
| Proceeds from other debt |
— | — | 2 | |||||||||
| Proceeds from Subordinated Notes |
— | — | 100 | |||||||||
| Repayment on Secured Notes |
— | — | (23 | ) | ||||||||
| Payments on senior term loan facility |
— | (297 | ) | — | ||||||||
| Proceeds from senior term loan facility |
1 | — | — | |||||||||
| Capital contribution |
50 | — | 3 | |||||||||
| Net decrease in debt of noncontrolling interest |
— | (3 | ) | — | ||||||||
| Payment of deferred financing costs |
— | (22 | ) | (5 | ) | |||||||
| Proceeds from Secured Notes |
— | 222 | — | |||||||||
| Net proceeds from ABL Revolver |
— | 90 | — | |||||||||
| Purchase of noncontrolling interest |
— | (25 | ) | (24 | ) | |||||||
| Net cash provided by (used in) financing activities |
51 | (35 | ) | 66 | ||||||||
| Effect of exchange rates on cash |
(6 | ) | 4 | (1 | ) | |||||||
| Increase (decrease) in cash and cash equivalents |
18 | (12 | ) | (10 | ) | |||||||
| Cash and cash equivalents at beginning of the period |
59 | 77 | 65 | |||||||||
| Cash and cash equivalents at end of the period |
$ | 77 | $ | 65 | $ | 55 | ||||||
| Supplemental cash flows information |
||||||||||||
| Cash paid during the period for: |
||||||||||||
| Interest |
$ | 52 | $ | 53 | $ | 60 | ||||||
| Income taxes |
$ | 22 | $ | 14 | $ | 30 | ||||||
The accompanying notes are an integral part of the consolidated financial statements.
47
Table of Contents
Affinia Group Intermediate Holdings Inc.
Notes to Consolidated Financial Statements
Note 1. Organization and Description of Business
Affinia Group Intermediate Holdings Inc. is a global leader in the light and commercial vehicle replacement products and services industry. We derive approximately 98% of our sales from this industry and, as a result, are not directly affected by the market cyclicality of the automotive original equipment manufacturers. Our broad range of brake, filtration, chassis and other products are sold in North America, Europe, South America and Asia. Our brands include WIX®, Raybestos®, Nakata®, Brake-Pro®, FiltronTM AIMCO® and McQuay-Norris®. Additionally, we provide private label products for NAPA, CARQUEST and ACDelco and other customers and co-branded offerings for Federated Auto Parts and Automotive Distribution Network. Affinia Group Inc. is wholly-owned by Affinia Group Intermediate Holdings Inc., which, in turn, is wholly-owned by Affinia Group Holdings Inc., a company controlled by affiliates of The Cypress Group L.L.C.
Affinia Group Inc., the Company’s direct, wholly-owned subsidiary and a Delaware corporation formed on June 28, 2004, entered into a stock and asset purchase agreement on November 30, 2004, as amended (the “Purchase Agreement”), with Dana Corporation (“Dana”). The Purchase Agreement provided for the acquisition by Affinia Group Inc. of substantially all of Dana’s aftermarket business operations (the “Acquisition”).
The accompanying Consolidated Financial Statements include the accounts of the Company and its subsidiaries. In these Notes to the Consolidated Financial Statements, the terms “the Company,” “we,” “our” and “us” refer to Affinia Group Intermediate Holdings Inc. and its subsidiaries on a consolidated basis.
Note 2. Acquisition
On December 16, 2010, the Company, through its subsidiary Affinia Products Corp LLC, acquired substantially all the assets of North American Parts Distributors, Inc. (“NAPD”). NAPD, located in Ramsey, New Jersey, was an automobile parts and supplies wholesaler. The NAPD acquisition expands our product offering of chassis parts to one of the broadest in the industry. NAPD’s purchased assets and assumed liabilities were acquired for cash consideration of $52 million. The initial purchase price was $51 million and was paid in 2010. Subsequently, in 2011 the working capital adjustment was settled for $1 million. The working capital adjustment was based on the difference between targeted working capital and working capital at the closing date. This acquisition was considered immaterial for disclosure of supplemental pro forma information and revenues and earnings of the acquiree since the acquisition date. We financed this acquisition with the available borrowings under our ABL Revolver, which borrowings were repaid with our completed offering on December 9, 2010 of the Additional Notes.
The aforementioned acquisition has been accounted for under the purchase method of accounting, in accordance with ASC Topic 805, “Business Combinations.” We engaged independent appraisers to assist in determining the fair values of inventory and intangible assets acquired; including non-competition agreements, developed technology and customer relationships. Purchase price allocations are subject to adjustment until all pertinent information regarding the acquisition is obtained and fully evaluated. Based on our preliminary valuations and purchase accounting adjustments, we recorded $22 million as goodwill at the end of 2010. The Company, however, has not completely finalized the allocation of the purchase price as of December 31, 2010. We have made a preliminary allocation of the purchase price on the basis of its current estimate of the fair value of the underlying assets acquired and liabilities assumed. We expect the goodwill will be deductible for tax purposes. During 2011, we may make further adjustments to these preliminary allocations.
The following table summarizes the estimated fair values of the assets acquired and liabilities assumed at the date of the Acquisition:
| (Dollars in millions) | Preliminary Allocation |
|||
| Inventory |
$ | 10 | ||
| Trade accounts receivable |
7 | |||
| Customer relationships |
8 | |||
| Non-competition agreement |
1 | |||
| Unpatented technology (i.e, tooling) |
5 | |||
| Goodwill |
22 | |||
| Total acquired assets |
$ | 53 | ||
| Current liabilities |
1 | |||
| Net assets acquired |
$ | 52 | ||
48
Table of Contents
Cash and cash equivalents, trade accounts receivable, accounts payable, accrued expenses and other current liabilities were recorded at historical carrying values, given the short-term nature of these assets and liabilities. Customer relationships with estimated useful lives ranging from 10 to 20 years have been valued using an income approach, which utilized a discounted cash flow method. The unpatented technology with an estimated useful life of 10 years was valued utilizing a relief from royalty method. The non-competition agreement with an estimated useful life of 5 years was valued utilizing a form of the discounted cash flow method to determine the value of lost income.
Note 3. Joint Venture Acquisition
In December 2010, we acquired the remaining 50% ownership interest in Affinia India Private Limited, the Company’s India joint venture, for $24 million in cash, increasing our ownership interest from 50% to 100%. The acquisition is not subject to any post closing purchase price adjustments or earn-outs. We had a controlling financial interest in Affinia India Private Limited prior to the purchase of the remaining 50% interest. Since we had control prior to the purchase, the transaction has been accounted for as an equity transaction consistent with ASC Topic 810, “Consolidation.” As a result of the transaction the noncontrolling interest balance was decreased by $8 million and the additional paid-in capital was decreased by $16 million. We financed this acquisition with the available borrowings under our ABL Revolver, which borrowings were repaid with the use of proceeds from our completed offering on December 9, 2010 of the Additional Notes.
Note 4. Discontinued Operation
In the fourth quarter of 2009 we committed to a plan to sell the Commercial Distribution Europe segment. In accordance with ASC Topic 360, “Property, Plant, and Equipment”, the Commercial Distribution Europe segment qualified as a discontinued operation. The consolidated statements of operations for all periods presented have been adjusted to reflect this segment as a discontinued operation. The consolidated statements of cash flows for all periods presented were not adjusted to reflect this segment as a discontinued operation. The table below summarizes the Commercial Distribution Europe segment’s net sales, loss before income tax provision, income tax provision and loss from discontinued operations, net of tax.
| (Dollars in millions) | 2008 | 2009 | 2010 | |||||||||
| Net sales |
$ | 263 | $ | 237 | $ | 18 | ||||||
| Loss before income tax provision |
(17 | ) | (84 | ) | — | |||||||
| Income tax provision |
(2 | ) | 23 | — | ||||||||
| Loss from discontinued operations, net of tax |
$ | (19 | ) | $ | (61 | ) | $ | — | ||||
We entered into a Sale and Purchase Agreement with Klarius Group Limited (“KGL”) and Auto Holding Paris S.A.S. (“AHP”) (collectively, the “Purchaser”) on February 2, 2010 (the “Agreement”), pursuant to which KGL purchased the shares of Quinton Hazell Automotive Limited and Quinton Hazell Italia SpA and AHP purchased the shares of Quinton Hazell Deutschland GmbH and Affinia Holding S.A.S. (collectively, the “Group Companies”) for $12 million as of the end of 2009. We settled with KGL on a working capital adjustment in February 2011 and as a result the purchase price was lowered by $1 million effective for 2010. Consequently, the net purchase price after the settlement was $11 million. The Agreement also called for the Purchaser to assume debt of $2.6 million. We also retained the cash in the Group Companies. The business of the Group Companies and their subsidiaries consist of manufacturing and distribution facilities in eight countries in Europe.
In accordance with ASC Topic 360, “Property, Plant, and Equipment,” intangibles and other long-lived assets are assessed for recoverability whenever events or changes in circumstances indicate that their carrying value may not be recoverable through the estimated undiscounted future cash flows resulting from the use of the assets. The Company determined that the net carrying value of the Commercial Distribution Europe segment may not be recoverable through the sales process. As a result, an impairment charge of $75 million was recorded within discontinued operations in 2009 to reduce the carrying value of the business to expected realizable value. A tax benefit to the Company of $24 million was recorded resulting from this transaction. The sale was consummated on February 2, 2010 and the estimated loss has subsequently decreased $2 million offset by the one month of operating losses of $1 million resulting in net income from discontinued operations and $1 million loss on post closing adjustments.
49
Table of Contents
The following table shows an analysis of assets and liabilities held for sale as of December 31, 2009:
| (Dollars in millions) | ||||
| Accounts receivable |
$ | 34 | ||
| Inventory |
67 | |||
| Other current assets |
6 | |||
| Property, plant and equipment |
18 | |||
| Long-term assets |
5 | |||
| Impairment of assets |
(75 | ) | ||
| Total assets of discontinued operations |
55 | |||
| Current liabilities |
41 | |||
| Long-term liabilities |
2 | |||
| Total liabilities of discontinued operations |
$ | 43 | ||
Note 5. Variable Interest Entity
Effective October 31, 2008, Affinia Acquisition LLC completed the purchase of 85% of the equity interests (the “Acquired Shares”) in HBM Investment Limited (“HBM”). HBM was the sole owner of Longkou Haimeng Machinery Company Limited (“Haimeng”), a drum and rotor manufacturing company located in Longkou City, China. The purchase price was $50 million and included $25 million in current and long term debt on Haimeng’s books. Affinia Group Holdings Inc. received $51 million in return for preferred stock from Cypress, co-investors and management. Affinia Group Holdings Inc. contributed $50 million to Affinia Acquisition LLC to purchase 85% of the equity interests in HBM.
HBM subsequently changed its name to Affinia Hong Kong Limited. Affinia Group Holdings Inc. owned 95% of Affinia Acquisition LLC and Affinia Group Inc. owned the remaining 5% interest. Effective June 1, 2009, Affinia Group Inc. acquired an additional 35% ownership interest in Affinia Acquisition LLC for a purchase price of $25 million, which increased its ownership to 40%. ASC Topic 810 requires the “primary beneficiary” of a variable interest entities (“VIE”) to include the VIE’s assets, liabilities and operating results in its consolidated financial statements. Based on the criteria for consolidation of VIEs, we determined that Affinia Group Inc. was deemed the primary beneficiary of Affinia Acquisition LLC. Therefore, our consolidated financial statements include Affinia Acquisition LLC and its subsidiaries.
On September 1, 2010, our parent company, Affinia Group Holdings Inc., contributed the remaining 60% interest in Affinia Acquisition LLC to Affinia Group Intermediate Holdings Inc. and Affinia Group Intermediate Holdings Inc. contributed such interest to Affinia Group Inc. Consequently, the noncontrolling interest balance was decreased by $32 million and the additional paid-in capital was increased by $32 million. Affinia Group Inc. remains the primary beneficiary of Affinia Acquisition LLC. The net income attributable to the noncontrolling interest owned in Affinia Acquisition LLC and Affinia India Private Limited was less than $1 million in 2008, $7 million for 2009 and $6 million for 2010.
The aforementioned acquisition has been accounted for under the purchase method of accounting, in accordance with Statement of Financial Accounting Standards No. 141, Business Combinations. The Company engaged independent appraisers to assist in determining the fair values of property, plant and equipment and intangible assets acquired; including trade names, trademarks, developed technology and customer relationships. Purchase price allocations are subject to adjustment until all pertinent information regarding the acquisition is obtained and fully evaluated. Based on our preliminary valuations and purchase accounting adjustments, we recorded $30 million as goodwill at the end of 2008. In 2009 goodwill was reduced by $7 million related to certain purchase accounting adjustments.
Affinia Hong Kong Limited is reporting its financial results on a one-month reporting lag. There are no arrangements between the primary beneficiary, Affinia Group Inc., and the VIE, Affinia Acquisition LLC, that would require financial support be provided to the VIE. Additionally, the primary beneficiary has not imposed any restrictions on the VIE and there are no recourse provisions in the acquisition agreement. Affinia Acquisition LLC received a contribution of $50 million for the purchase of Affinia Hong Kong Limited in the fourth quarter of 2008. Noncontrolling interest decreased to $46 million as of December 31, 2009 from $60 million as of December 31, 2008. The noncontrolling interest decreased $21 million following Affinia Group Inc.’s acquisition of an additional 35% ownership interest in Affinia Acquisition LLC offset by a $7 million increase related to the net income attributable to noncontrolling interest in Afffinia Acquisition LLC and our joint venture in India.
50
Table of Contents
The following table summarizes the estimated fair values of the assets acquired and liabilities assumed at the date of the acquisition:
| (Dollars in millions) | Preliminary Allocation |
Adjustments | Final Allocation |
|||||||||
| Current assets |
$ | 36 | $ | — | $ | 36 | ||||||
| Property, plant and equipment |
38 | 1 | 39 | |||||||||
| Customer relationships |
7 | — | 7 | |||||||||
| Non-competition agreement |
2 | — | 2 | |||||||||
| Goodwill |
30 | (7 | ) | 23 | ||||||||
| Total acquired assets |
$ | 113 | $ | (6 | ) | $ | 107 | |||||
| Current liabilities |
42 | (8 | ) | 34 | ||||||||
| Other liabilities |
12 | 2 | 14 | |||||||||
| Total liabilities assumed |
54 | (6 | ) | 48 | ||||||||
| Net assets acquired |
$ | 59 | $ | — | $ | 59 | ||||||
Cash and cash equivalents, trade accounts receivable, other current assets, accounts payable, accrued expenses and other current liabilities were recorded at historical carrying values, given the short-term nature of these assets and liabilities. Inventory, other non-current assets, long-term debt, and other non-current liabilities outstanding as of the effective date of the acquisition have been allocated based on management’s estimate of fair market value which approximates book value. Customer relationships with estimated useful lives ranging from 10 to 15 years have been valued using an income approach, which utilized a discounted cash flow method. The non-competition agreement with an estimated useful life of 6 years was valued utilizing a form of the discounted cash flow method to determine the value of lost income.
Note 6. Venezuelan Operations
As required by U.S. GAAP, effective January 1, 2010, we accounted for Venezuela as a highly inflationary economy because the three-year cumulative inflation rate for Venezuela using the blended Consumer Price Index (which is associated with the city of Caracas) and the National Consumer Price Index (developed commencing in 2008 and covering the entire country of Venezuela) exceeded 100%.
Effective January 1, 2010, our Venezuelan subsidiary uses the U.S. Dollar as its functional currency. The financial statements of our subsidiary must be re-measured into the Company’s reporting currency (U.S. Dollar) and future exchange gains and losses from the re-measurement of monetary assets and liabilities are reflected in current earnings, rather than exclusively in the equity section of the balance sheet, until such time as the economy is no longer considered highly inflationary. The local currency in Venezuela is the bolivar fuerte (“VEF”).
On January 11, 2010, the Venezuelan government devalued the country’s currency and changed to a two-tier exchange structure. The official exchange rate moved from 2.15 VEF per U.S. Dollar to 2.60 for essential goods and 4.30 for non-essential goods and services, with our products falling into the non-essential category. A Venezuelan currency control board is responsible for foreign exchange procedures, including approval of requests for exchanges of VEF for U.S. Dollars at the official (government established) exchange rate. Our business in Venezuela has been unsuccessful in obtaining U.S. Dollars at the official exchange rate. An unregulated parallel market existed for exchanging VEF for U.S. Dollars through securities transactions; and our Venezuelan subsidiary had been able to enter into such exchange transactions until May 2010, as discussed further below. The Company used the unregulated parallel market rate to translate the financial statements of its Venezuelan subsidiary through May 2010 because we expected to obtain U.S. Dollars at the unregulated parallel market rate for future dividend remittances. During the second quarter of 2010, the unregulated parallel market was suspended and the Central Bank of Venezuela began regulating the parallel market. The Central Bank of Venezuela has also imposed volume restrictions on the regulated parallel market. We will use the regulated parallel market rate to translate the financial statements of our Venezuelan subsidiary to comply with the regulations of Venezuela and are analyzing the impact of the volume restrictions on our business. The currency exchange limitations to date have not had a material effect on our 2010 earnings and cash flow.
Effective January 1, 2010, we changed the rate used to translate our Venezuelan subsidiary’s transactions and balances from the official exchange rate of 2.15 VEF to the U.S. Dollar to the parallel market rate, which ranged between 5.30 and 7.70 VEF to the U.S. Dollar during 2010. The one-time devaluation had a $2 million negative impact on our pre-tax net income. For 2010, our Venezuela subsidiary represented approximately 1% of our consolidated net sales and it had a net loss attributable to the Company of $8 million. The Venezuelan subsidiary also had $8 million of total assets and $7 million of total liabilities as of December 31, 2010.
51
Table of Contents
Note 7. Summary of Significant Accounting Policies
Principles of Consolidation
In accordance with ASC Topic 810, “Consolidation,” the consolidated financial statements include the accounts of Affinia and its wholly owned subsidiaries, majority-owned subsidiaries and variable interest entities (“VIE”) for which Affinia (or one of its subsidiaries) is the primary beneficiary. All intercompany transactions have been eliminated. Equity investments in which we exercise significant influence but do not control are accounted for using the equity method. Investments in which we are not able to exercise significant influence over the investee are accounted for under the cost method. Affinia Hong Kong Limited and Affinia India Private Limited are reporting their financial results on a one-month reporting lag.
Use of Estimates
The preparation of these consolidated financial statements requires estimates and assumptions that affect the amounts reported in these consolidated financial statements and accompanying notes. Some of the more significant estimates include valuation of deferred tax assets and inventories; workers compensation; sales return, rebate and warranty accruals; restructuring, environmental and product liability accruals; valuation of postemployment and postretirement benefits and allowances for doubtful accounts. Actual results may differ from these estimates and assumptions.
Concentration of Credit Risk
The primary type of financial instruments that potentially subject the Company to concentrations of credit risk are trade accounts receivable. The Company limits its credit risk by performing ongoing credit evaluations of its customers and, when deemed necessary, requires letters of credit, guarantees or collateral. The majority of the Company’s accounts receivable is due from replacement parts wholesalers and retailers serving the aftermarket.
The Company’s net sales to its two largest customers as a percentage of total net sales from continuing operations for the year ended December 31, 2010, were 27%, and 8%; for the year ended December 31, 2009, were 29% and 8%; and for the year ended December 31, 2008, were 27% and 8%. Net sales represent the amounts invoiced to customers after adjustments related to rebates, returns and discounts. The Company provides reserves for rebates, returns and discounts at the time of sale which are subsequently applied to the account of specific customers based upon actual activity including the attainment of targeted volumes. The Company’s two largest customers’ accounts receivable as of December 31, 2010 represented approximately 37% and 10%, and as of December 31, 2009 represented 39% and 12% of the total accounts receivable.
Foreign Currency Translation
Assets and liabilities recorded in foreign currencies are translated at the exchange rate on the balance sheet date. Revenue and expenses are translated at average rates of exchange prevailing during the year. Translation adjustments resulting from this process are charged or credited to Other Comprehensive Income.
Included in net income (loss) are the gains and losses arising from foreign currency transactions. The impact on income from continuing operations before income tax provision, equity in income and noncontrolling interest of foreign currency transactions including the results of our foreign currency hedging activities amounted to a loss of $10 million, $1 million and $4 million in 2008, 2009 and 2010, respectively.
Cash and Cash Equivalents
Cash and cash equivalents include all cash balances and highly liquid investments with original maturities of three months or less.
Restricted Cash
Restricted cash relates to deposits requested by banks for notes payables issued to Haimeng’s suppliers in relation to its purchases.
Accounts receivable
We record trade accounts receivable when revenue is recorded in accordance with our revenue recognition policy and relieves accounts receivable when payments are received from customers. Generally, we do not require collateral for our accounts receivable.
52
Table of Contents
Allowance for doubtful accounts
The allowance for doubtful accounts is established through charges to the provision for bad debts. We evaluate the adequacy of the allowance for doubtful accounts on a periodic basis. The evaluation includes historical trends in collections and write-offs, management’s judgment of the probability of collecting accounts, and management’s evaluation of business risk. This evaluation is inherently subjective, as it requires estimates that are susceptible to revision as more information becomes available. The allowance for doubtful accounts was $3 million and $2 million at December 31, 2009 and 2010, respectively.
Inventories
Inventories are valued at the lower of cost or market. Cost is determined on the FIFO basis for all domestic inventories or average cost basis for non-U.S. inventories.
Goodwill
Goodwill is not amortized, but instead the Company evaluates goodwill for impairment, as of December 31 of each year, unless conditions arise that would require a more frequent evaluation. In assessing the recoverability of goodwill, projections regarding estimated future cash flows and other factors are made to determine the fair value of the respective reporting unit. If these estimates or related projections change in the future, we may be required to record impairment charges for goodwill at that time.
Intangibles
We have trade names with indefinite lives and other intangibles with definite lives. In lieu of amortization, we test trade names for impairment on an annual basis as of December 31 of each year, unless conditions arise that would require a more frequent evaluation. Trade names are tested for impairment by comparing the fair value to their carrying values.
Our intangibles with definite lives consist of customer relationships, patents and developed technology. These assets are amortized on a straight-line basis over estimated useful lives ranging from 5 to 20 years. Certain conditions may arise that could result in a change in useful lives or require us to perform a valuation to determine if the definite lived intangibles are impaired.
Deferred Financing Costs
Deferred financing costs are incurred to obtain long-term financing and are amortized using the effective interest method over the term of the related debt. The amortization of deferred financing costs is classified in interest expense in the statement of operations.
Properties and Depreciation
Fixed assets are being depreciated over their estimated remaining lives using primarily the straight-line method for financial reporting purposes and accelerated depreciation methods for federal income tax purposes. Major additions and improvements are capitalized and depreciated over their estimated useful lives, and repairs and maintenance are charged to expense in the period incurred. We review long-lived assets for impairment and general accounting principles require recognition of an impairment loss only if the carrying amount of a long-lived asset is not recoverable from its undiscounted cash flows. If the long-lived asset is not recoverable, we measure an impairment loss as the difference between the carrying amount and fair value of the asset.
Useful lives for buildings and building improvements, machinery and equipment, tooling and office equipment, furniture and fixtures principally range from 20 to 30 years, five to ten years, three to five years and three to ten years, respectively. Upon retirement or other disposal of fixed assets, the cost and related accumulated depreciation are eliminated from the asset and accumulated depreciation accounts, respectively. The difference, if any, between the net asset value and the proceeds is recorded as a gain or loss on disposition.
Revenue Recognition
Sales are recognized when products are shipped or received, depending on the contractual terms, and risk of loss has transferred to the customer. The Company estimates and records provisions for warranty costs, sales returns, rebates and other allowances based on experience and other relevant factors, when sales are recognized. The Company assesses the adequacy of its recorded warranty, sales returns, rebates and allowances liabilities on a regular basis and adjusts the recorded amounts as necessary. While management believes that these estimates are reasonable, warranty costs, actual returns, rebates and allowances may differ from estimates. Shipping and handling fees billed to customers are included in sales and the costs of shipping and handling are included in cost of sales. Inter-company sales have been eliminated.
53
Table of Contents
Income Taxes
Income taxes are recognized during the period in which transactions enter into the determination of financial statement income, with deferred income taxes being provided for the tax effect of temporary differences between the carrying amount of assets and liabilities and their tax basis. Deferred income taxes are provided on the undistributed earnings of foreign subsidiaries and affiliated companies except to the extent such earnings are considered to be permanently reinvested in the subsidiary or affiliate. In cases where foreign tax credits will not offset U.S. income taxes, appropriate provisions are included in the combined or consolidated statement of operations.
The Company accounts for uncertain tax positions in accordance with ASC Topic 740, “Income Taxes.” The Company adopted the provisions of general accounting principles relating to uncertain tax positions (referred to as FIN 48) on January 1, 2007. Accordingly, the Company reports a liability for unrecognized tax benefits resulting from uncertain tax positions taken or expected to be taken in a tax return. The Company recognizes interest and penalties, if any, related to unrecognized tax benefits in income tax expense.
Financial Instruments
The reported fair values of financial instruments, consisting of cash and cash equivalents, trade accounts receivable and long-term debt, are based on a variety of factors. Where available, fair values represent quoted market prices for identical or comparable instruments. Where quoted market prices are not available, fair values are estimated based on assumptions concerning the implied market volatilities, amount and timing of estimated future cash flows and assumed discount rates reflecting varying degrees of credit and market risk. Fair values may not represent actual values of the financial instruments that could be realized as of the balance sheet date or that will be realized in the future. As of December 31, 2009 and 2010, the book value of some of our financial instruments, consisting of cash and cash equivalents and trade accounts receivable, approximated their fair values. The fair value of long-term debt is disclosed in “Note 11. Debt. ”
Environmental Compliance and Remediation
Environmental expenditures that relate to current operations are expensed or capitalized as appropriate. Expenditures that relate to existing conditions caused by past operations which do not contribute to current or future revenue generation are expensed. Liabilities are recorded when environmental assessments and/or remedial efforts are probable and the costs can be reasonably estimated. Estimated costs are based upon current laws and regulations, existing technology and the most probable method of remediation. The costs are not discounted and exclude the effects of inflation. If the cost estimates result in a range of equally probable amounts, the lower end of the range is accrued.
Pension Plans
The Company maintains six defined benefit pension plans associated with its Canadian operations. The annual net periodic pension costs are determined on an actuarial basis.
Advertising Costs
Advertising expenses included in continuing operations were $26, $25 and $27 million for the years 2008, 2009, and 2010, respectively. The advertising expenses included in discontinued operations, were $2, $1 and nil for the years 2008, 2009, and 2010, respectively. Advertising costs are recognized as selling expenses at the time advertising is incurred.
Promotional Programs
Cooperative advertising programs conducted with customers that promote the Company’s products are accrued as a rebate based on anticipated total amounts to be rebated to customers over the period of the agreement with the customer. Aftermarket distributors typically source their product lines at a particular price point and product category with one “full-line” supplier, such as our company, which covers substantially all of their product requirements. Switching to a new supplier typically requires that a distributor or supplier make a substantial investment to purchase, or “changeover” to, the new supplier’s products. The changeover costs and other incentives incurred in connection with obtaining new business are recognized as selling expense in the period in which the changeover from a competitor’s product to the Company’s product occurs. Infrequently, we enter into a contract with a customer for a set period of time that requires the reimbursement of the incentive by the customer if the future conditions of the contract are not met. In these infrequent cases the incentive is recorded as a reduction of revenue over the life of the contract.
Insurance
We use a combination of insurance and self-insurance for a number of risks, including workers’ compensation, general liability, vehicle liability and the company-funded portion of employee-related health care benefits. Liabilities associated with these risks are estimated in part by considering historical claims experience, demographic factors, severity factors and other actuarial assumptions.
54
Table of Contents
Research and Development Costs
Research and development expenses are charged to operations as incurred. The Company incurred $3 million, $4 million and $5 million for the years ended 2008, 2009 and 2010, respectively.
Free-Standing Derivatives
The Company is subject to various financial risks during the normal course of business operations, including but not limited to, adverse changes to interest rates, currency exchange rates, counterparty creditworthiness, and commodity prices. Pursuant to prudent risk management principles, the Company may utilize appropriate financial derivative instruments in order to mitigate the potential impact of these factors. The Company’s policies strictly prohibit the use of derivatives for speculative purposes.
In 2010, the Company’s derivative instrument usage was limited to standard currency forward transactions intended to offset the earnings impact related to the periodic revaluation of specific non-functional currency denominated monetary working capital accounts and intercompany financing arrangements.
The Company does not seek hedge accounting treatment for its currency derivative transactions because the earnings impact from both the underlying exposures and the hedge transactions are recognized in each accounting period.
Stock-Based Compensation
We account for the employee stock options under the fair value method of accounting using a Black-Scholes model to measure stock-based compensation expense at the date of grant. The compensation expense for the year was less than $1 million for 2008, $1 million in 2009 and less than $1 million in 2010.
On July 20, 2005, Affinia Group Holdings Inc. adopted the 2005 Stock Plan. The 2005 Stock Plan was amended on August 25, 2010 and on December 2, 2010 to increase the maximum shares of common stock that may be subject to awards. The 2005 Stock Plan permits the grant of non-qualified stock options, incentive stock options, stock appreciation rights, restricted stock and other stock-based awards to employees, directors or consultants of the Company and its affiliates. A maximum of 350,000 shares of common stock may be subject to awards under the 2005 Stock Plan. The number of shares issued or reserved pursuant to the 2005 Stock Plan (or pursuant to outstanding awards) is subject to adjustment on account of mergers, consolidations, reorganizations, stock splits, stock dividends and other dilutive changes in the common stock. Shares of common stock covered by awards that terminate or lapse and shares delivered by a participant or withheld to pay the minimum statutory withholding rate, in each case, will again be available for grant under the 2005 Stock Plan. Refer to “Note 13. Stock Incentive Plan” for further information on and discussion of our stock options.
On August 25, 2010, Affinia Group Holdings Inc. commenced an offer to certain eligible holders of stock options to exchange their existing options to purchase shares of Affinia Group Holdings Inc. common stock for restricted stock unit awards (“RSUs”). The RSUs granted in connection with the option exchange are governed by the 2005 Stock Plan and a new Restricted Stock Unit Agreement. The RSUs are subject to performance-based and market-based vesting restrictions, which differ from the performance and time-based vesting restrictions applicable to the exchanged stock options. We will estimate the fair value of restricted stock unit awards using the value of Affinia Group Holdings Inc.’s common stock on the date of grant, reduced by the present value of Affinia Group Holdings Inc.’s common stock prior to vesting. The fair value of the RSUs will be expensed either pro rata over the requisite service term or in full if the requisite service period has passed when the RSUs vest in accordance with the performance conditions listed above. Stock-based compensation expense, which would be recorded in selling, general and administrative expenses, and tax related income tax benefits was not recorded for 2010 as the performance condition has not been met.
Deferred Compensation Plan
Affinia Group Holdings Inc. started a deferred compensation plan in 2008 that permits executives to defer receipt of all or a portion of the amounts payable under Affinia Group Holdings Inc.’s non-equity incentive compensation plan. All amounts deferred will be treated solely for purposes of the plan to have been notionally invested in the common stock of Affinia Group Holdings Inc. As such, the accounts under the plan will reflect investment gains and losses associated with an investment in the Affinia Group Holdings Inc.’s common stock. Affinia Group Holdings Inc. matches 25% of the deferral with additional restricted stock units, which are subject to vesting as provided in the plan.
New Accounting Pronouncements
In January 2010, the FASB issued ASU 2010-6, “Improving Disclosures about Fair Value Measurements.” This update requires additional disclosure within the roll forward of activity for assets and liabilities measured at fair value on a recurring basis, including transfers of assets and liabilities between Level 1 and Level 2 of the fair value hierarchy and the separate presentation of purchases, sales, issuances and settlements of assets and liabilities within Level 3 of the fair value hierarchy. In addition, the update requires enhanced disclosures of the valuation techniques and inputs used in the fair value measurements within Levels 2 and 3. The new disclosure requirements are effective for interim and annual periods beginning after December 15, 2009. We adopted this guidance on disclosures in the first quarter of 2010. There are also additional new disclosure requirements for purchases, sales, issuances and settlements of Level 3 measurements, which are effective for interim and annual periods beginning after December 15, 2010. The adoption of ASU 2010-6 did not have a material impact on the Company’s consolidated financial statements.
55
Table of Contents
In July 2010, the FASB amended ASC 310, “Receivables,” with ASU 2010-20, “Receivables (Topic 310): Disclosures about the Credit Quality of Financing Receivables and the Allowance for Credit Losses,” to require additional information related to financing receivables, including loans and trade accounts receivable with contractual maturities exceeding one year. With the exception of disclosures related to activity occurring during a reporting period, which are effective for fiscal years beginning after December 15, 2010, the provisions of this update are effective as of December 31, 2010. The adoption of ASU 2010-20 did not have a material impact on the Company’s consolidated financial statements.
Note 8. Inventories, net
Inventories are valued at the lower of cost or market. Cost is determined on the FIFO basis for all domestic inventories or average cost basis for non-U.S. inventories. Inventories are reduced by an allowance for slow-moving and obsolete inventories based on management’s review of on-hand inventories compared to historical and estimated future sales and usage. A summary of inventories, net is provided in the table below:
| (Dollars in millions) | At December
31, 2009(1) |
At December 31, 2010 |
||||||
| Raw materials |
$ | 103 | $ | 120 | ||||
| Work-in-process |
26 | 34 | ||||||
| Finished goods |
301 | 366 | ||||||
| $ | 430 | $ | 520 | |||||
| (1) | The inventory as of December 31, 2009 excludes $67 million of inventory in our Commercial Distribution Europe segment, which is classified in current assets of discontinued operations. |
During 2009, we had a change in estimate that adjusted the carrying amount of finished goods inventory. The change results from new information as defined in ASC Topic 250-10. Due to the recent addition of new processes related to certain remanufactured inventory components, we were able to determine the cost of these components. The financial impact of this change in estimate increased inventory and decreased cost of sales by $3 million in 2009.
Note 9. Goodwill
Goodwill is not amortized, but instead the Company evaluates goodwill for impairment, as of December 31 of each year, unless conditions arise that would require a more frequent evaluation. In assessing the recoverability of goodwill, projections regarding estimated future cash flows and other factors are made to determine the fair value of the respective reporting unit. We have tested goodwill for impairment as of the end of the year, and concluded no impairment existed.
In conjunction with the acquisition of the NAPD business, we determined the fair value of intangibles, property, plant and equipment, other assets and liabilities. Based on our valuations and purchase accounting adjustments, we recorded $22 million as goodwill.
In conjunction with the acquisition of Affinia Hong Kong Limited, we determined the fair value of intangibles, property, plant and equipment, other assets and liabilities. Based on our valuations and purchase accounting adjustments, we recorded $30 million as goodwill at the end of 2008 and we have decreased goodwill by $7 million in 2009 for purchase accounting adjustments.
The goodwill also relates to the initial acquisition in 2004 and a minor acquisition in the second quarter of 2008. For the 2004 acquisition, in accordance with ASC Topic 805-740 the tax benefit for the excess of tax-deductible goodwill over the reported amount of goodwill is applied to first reduce the goodwill related to the Acquisition. The tax benefit for the excess of tax deductible goodwill reduced reported goodwill by approximately $8 million during 2009 and 2010. The amount of goodwill remaining at the end of December 31, 2010 relating to the initial 2004 acquisition is $11 million. Once the reported amount of goodwill for the 2004 acquisition is reduced to zero, the remaining tax benefit reduces the basis of intangible assets purchased in the 2004 acquisition. Any remaining tax benefit reduces the income tax provision.
56
Table of Contents
The following table summarizes our goodwill activity, which is related to the On and Off-highway segment, during 2009 and 2010:
| (Dollars in millions) | ||||
| Balance at December 31, 2008 |
$ | 58 | ||
| Tax benefit reductions |
(8 | ) | ||
| Affinia Hong Kong Limited acquisition adjustments |
(7 | ) | ||
| Balance at December 31, 2009 |
$ | 43 | ||
| Goodwill related to acquisition of NAPD business |
22 | |||
| Tax benefit reductions |
(8 | ) | ||
| Currency and other adjustments |
2 | |||
| Balance at December 31, 2010 |
$ | 59 | ||
Note 10. Other Intangible Assets
As of December 31, 2009 and 2010, the Company’s other intangible assets primarily consisted of trade names, customer relationships, and developed technology. The Company recorded approximately $8 million, $9 million and $8 million of intangible asset amortization in 2008, 2009 and 2010, respectively. We anticipate $9 million in amortization in each of the next four years and $8 million in 2015. In 2010, we acquired the NAPD business and as a result we increased our customer relationships by $8 million, unpatented technology by $5 million and non-competition agreement by $1 million. Amortization expense is calculated on a straight line basis over 5 to 20 years. We determine on a periodic basis whether the lives and the method for amortization are accurate.
Trade names are tested for impairment annually as of December 31 of each year by comparing their fair value to their carrying values. The fair value for each trade name was established based upon a royalty savings approach. We determined that there were impairments of other intangible assets of $2 million, $4 million and nil in 2008, 2009 and 2010, respectively.
Due to the downturn in the credit markets and intensified competition in the United Kingdom and other Western European countries, the Commercial Distribution Europe segment trade name was impaired $2 million in 2008. In 2009, the Commercial Distribution Europe segment was impaired $4 million due to the decrease in carrying value of the intangibles which were not recoverable through the sales process. The impairments in 2008 and 2009 were recorded in discontinued operations. A rollforward of the other intangibles and trade names for 2009 and 2010 is shown below:
| (Dollars in millions) | December 31, 2008 |
Amortization | Impairment | Other | December 31, 2009 |
Amortization | Impairment | Other | December 31, 2010 |
|||||||||||||||||||||||||||
| Trade names |
$ | 48 | $ | — | $ | — | $ | — | $ | 48 | $ | — | $ | — | $ | — | $ | 48 | ||||||||||||||||||
| Customer relationships |
100 | (7 | ) | (3 | ) | — | 90 | (6 | ) | — | 8 | 92 | ||||||||||||||||||||||||
| Developed technology/Other |
15 | (2 | ) | (1 | ) | (1 | ) | 11 | (2 | ) | — | 7 | 16 | |||||||||||||||||||||||
| Total |
$ | 163 | $ | (9 | ) | $ | (4 | ) | $ | (1 | ) | $ | 149 | $ | (8 | ) | $ | — | $ | 15 | $ | 156 | ||||||||||||||
Accumulated amortization for the intangibles was $43 million and $51 million as of December 31, 2009 and 2010, respectively. The weighted average amortization period by class of intangible was the following: 19 years for customer relationships and 12 years for developed technology and other intangibles.
Note 11. Debt
On August 13, 2009, we refinanced our former term loan facility, revolving credit facility and accounts receivable facility. The refinancing consisted of the ABL Revolver and the Secured Notes, the proceeds of which were used to repay outstanding borrowings under our former term loan facility, revolving credit facility and accounts receivable facility, as well as to settle interest rate derivatives and to pay fees and expenses related to the refinancing. The ABL Revolver and the Secured Notes replaced our revolving credit facility, which would have otherwise matured on November 30, 2010, our former term loan facility, which would have otherwise matured on November 30, 2011, and our accounts receivables facility, which would have otherwise matured on November 30, 2009.
On December 1, 2010, we issued an irrevocable notice of redemption to redeem $22.5 million aggregate principal amount of our Secured Notes on December 31, 2010, pursuant to their terms at a redemption price equal to 103% of the principal amount of such notes being redeemed, plus accrued and unpaid interest to the redemption date.
57
Table of Contents
On December 9, 2010, we completed an offering of an additional $100 million of Additional Notes. The Additional Notes have been issued at a price equal to 100% of their face value. The Additional Notes were issued pursuant to the Indenture, dated November 30, 2004, pursuant to which Affinia Group Inc. issued its existing outstanding $267 million aggregate principal amount of the Initial Notes. Other than with respect to the date of issuance and issue price, the Additional Notes have the same terms as, and are treated as a single class with, the Initial Notes. Affinia Group Inc.’s obligations under the Additional Notes are guaranteed on an unsecured senior subordinated basis by Affinia Intermediate Holdings Inc. and certain of Affinia Groups Inc.’s current and future wholly-owned domestic subsidiaries. The Company used the proceeds from the offering of the Additional Notes to finance its $24 million acquisition of the remaining 50% interest of Affinia India Private Limited and to finance our $52 million acquisition of the NAPD business on December 16, 2010. Debt consists of the following:
| At December 31, | ||||||||
| (Dollars in millions) | 2009 | 2010 | ||||||
| 9% Senior subordinated notes, due November 2014 |
$ | 267 | $ | 367 | ||||
| 10.75% Senior secured notes, due August 2016 |
222 | 200 | ||||||
| ABL revolver, due November 2015 |
90 | 90 | ||||||
| Affiliate debt with rates of 2.9% to 5.4% |
22 | 39 | ||||||
| 601 | 696 | |||||||
| Less: Current portion |
(12 | ) | (27 | ) | ||||
| $ | 589 | $ | 669 | |||||
Scheduled maturities of debt for each of the next five years and thereafter are as follows:
| (Dollars in millions) Year |
Amount | |||
| 2011 |
$ | 27 | ||
| 2012 |
12 | |||
| 2013 |
— | |||
| 2014 |
367 | |||
| 2015 |
90 | |||
| 2016 and thereafter |
200 | |||
| Total debt |
$ | 696 | ||
The fair value of debt is as follows:
Fair Value of Debt at December 31, 2009
| (Dollars in millions) | Book Value of Debt |
Fair Value Factor |
Fair Value of Debt |
|||||||||
| Senior subordinated notes, due November 2014 |
$ | 267 | 98.75 | % | $ | 264 | ||||||
| Senior secured notes, due August 2016 |
222 | 107.63 | % | 239 | ||||||||
| ABL revolver, due November 2015 |
90 | 100 | % | 90 | ||||||||
| Affiliate debt |
22 | 100 | % | 22 | ||||||||
| Total fair value of debt at December 31, 2009 |
$ | 615 | ||||||||||
58
Table of Contents
Fair Value of Debt at December 31, 2010
| (Dollars in millions) | Book Value of Debt |
Fair Value Factor |
Fair Value of Debt |
|||||||||
| Senior subordinated notes, due November 2014 |
$ | 367 | 102.75 | % | $ | 377 | ||||||
| Senior secured notes, due August 2016 |
200 | 111.00 | % | 222 | ||||||||
| ABL revolver, due November 2015 |
90 | 100 | % | 90 | ||||||||
| Affiliate debt |
39 | 100 | % | 39 | ||||||||
| Total fair value of debt at December 31, 2010 |
$ | 728 | ||||||||||
The carrying value of fixed rate short-term debt approximates fair value because of the short term nature of these instruments, and the carrying value of the Company’s current floating rate debt instruments approximates fair value because of the variable interest rates pertaining to those instruments. The fair value of the long-term debt was estimated based on quoted market prices.
Asset based credit facilities. On August 13, 2009, Affinia Group Inc. and certain of its subsidiaries entered into a four-year $315 million ABL Revolver that includes (i) a revolving credit facility (the “U.S. Facility”) of up to $295 million for borrowings solely to the U.S. domestic borrowers, including (a) a $40 million sub-limit for letters of credit and (b) a $30 million swingline facility, and (ii) a revolving credit facility (the “Canadian Facility”) of up to $20 million for Canadian Dollar denominated revolving loans solely to a Canadian borrower. Availability under the ABL Revolver is based upon monthly (or more frequent under certain circumstances) borrowing base valuations of Affinia Group Inc.’s eligible inventory and accounts receivable and is reduced by certain reserves in effect from time to time. The ABL Collateral consists of all accounts receivable, inventory, cash (other than certain cash proceeds of Notes Collateral (as defined in the indenture governing the Secured Notes)) and proceeds of the foregoing and certain assets related thereto, in each case held by Affinia Group Intermediate Holdings Inc., Affinia Group Inc. and certain of their subsidiaries.
On November 30, 2010, we entered into an amendment to the credit agreement governing the ABL Revolver. The ABL Revolver has been amended to, among other things, (a) increase the amount of additional unsecured indebtedness that we may incur from $100 million to $300 million and provide certain conditions to any issuance of such indebtedness in excess of $100 million, (b) amend the covenants with respect to: making certain dividends, distributions, restricted payments and investments; extending, renewing and refinancing certain existing indebtedness; amending certain material documents; and issuing and disposing of certain equity interests, (c) reduce the pricing spread applicable to each type of loan by 150 basis points at each level of average aggregate availability and remove the floor formerly applicable to the LIBOR rate and the BA rate, (d) extend the maturity date from August 13, 2013 to November 30, 2015 (subject to early termination under certain limited circumstances), (e) allow for prepayments of certain outstanding indebtedness with the proceeds of an initial public offering (if Affinia Group Holdings Inc. undertakes an initial public offering) and permit the merger of Affinia Group Intermediate Holdings Inc. with and into Affinia Group Holdings Inc. upon satisfaction of certain preconditions to such merger and (f) modify certain other provisions thereof.
At December 31, 2010, we had $90 million outstanding under the ABL Revolver. During the year, we borrowed funds at a weighted average interest rate of approximately 5.5% under this facility. We had an additional $191 million of availability after giving effect to $15 million in outstanding letters of credit and $3 million for borrowing base reserves as of December 31, 2010.
Mandatory Prepayments. If at any time the outstanding borrowings under the ABL Revolver (including outstanding letters of credit and swingline loans) exceed the lesser of (i) the borrowing base as in effect at such time and (ii) the aggregate revolving commitments as in effect at such time, we will be required to prepay an amount equal to such excess and/or cash collateralize outstanding letters of credit.
The maturity date of the ABL Revolver is November 30, 2015, subject to early termination if our senior subordinated notes which mature less than six months after such date are not refinanced, renewed or extended, or fully redeemed, fully cash defeased, paid in full or fully cash collateralized, prior to the date which is 91 days before the earlier of November 30, 2015 and the maturity date of the senior subordinated notes.
Voluntary Prepayments. Subject to certain conditions, the ABL Revolver allows us to voluntarily reduce the amount of the revolving commitments and to prepay the loans without premium or penalty other than customary breakage costs for LIBOR rate contracts.
Covenants. The ABL Revolver contains affirmative and negative covenants that, among other things, limit or restrict our ability to create liens and encumbrances; incur debt; merge, dissolve, liquidate or consolidate; make acquisitions and investments; dispose of or transfer assets; pay dividends or make other payments in respect of our capital stock; amend certain material documents; change the nature of our business; make certain payments of debt; engage in certain transactions with affiliates; change our fiscal periods; and enter into certain restrictive agreements, in each case, subject to certain qualifications and exceptions.
59
Table of Contents
In addition, if availability under the ABL Revolver is less than the greater of 12.5% of the total revolving loan commitments and $39.5 million, we will be required to maintain a fixed charge coverage ratio, which is defined in the ABL Revolver, of at least 1.10x measured for the last twelve-month period.
Interest Rates and Fees. Outstanding borrowings under the U.S. Facility accrue interest at an annual rate of interest equal to (i) a base rate plus the applicable spread or (ii) a LIBOR rate plus the applicable spread. Outstanding borrowings under the Canadian Facility accrue interest at an annual rate of interest equal to (i) the Canadian prime rate plus the applicable spread or (ii) the BA rate (the average discount rate of bankers’ acceptances as quoted on the Reuters Screen CDOR page) plus the applicable spread. We pay a commission on letters of credit issued under the U.S. Facility at a rate equal to the applicable spread for loans based upon the LIBOR rate. The ABL Revolver, as amended on November 30, 2010, revises the applicable spread, as set forth below, for purposes of calculating the annual rate of interest applicable to outstanding borrowings under the U.S. Facility and the Canadian Facility. In addition, the 1.50% floor formerly applicable to the LIBOR rate and the BA rate was eliminated.
| Level |
Average Aggregate Availability |
Base Rate Loans and Canadian Prime Rate Loans |
LIBOR Loans and Canadian BA Rate Loans |
|||||||
| I |
£$105,000,000 | 1.75 | % | 2.75 | % | |||||
| II |
> $105,000,000 but £ $210,000,000 |
1.50 | % | 2.50 | % | |||||
| III |
> $210,000,000 | 1.25 | % | 2.25 | % | |||||
We pay certain fees with respect to the ABL Revolver, including (i) an unused commitment fee of 0.50% per annum on the undrawn portion of the credit facility (subject to a step-down to 0.375% in the event more than 50% of the commitments (excluding swingline loans) under the credit facility are utilized) and (ii) customary annual administration fees and fronting fees in respect of letters of credit equal to 0.125% per annum on the stated amount of each letter of credit outstanding during each month. During an event of default, the fee payable under clause (i) shall be increased by 2% per annum.
Secured Notes. On August 13, 2009, Affinia Group Inc. issued $225 million of Secured Notes as part of the refinancing. The Secured Notes were offered at a price of 98.799% of their face value, resulting in approximately $222 million of net proceeds. The approximately $3 million discount will be amortized based on the effective interest rate method and included in interest expense until the Secured Notes mature. Subject to Affinia Group Inc.’s compliance with the covenants described in the indenture securing the Secured Notes, Affinia Group Inc. is permitted to issue more Secured Notes from time to time under the Indenture. The Secured Notes and the additional notes, if any, will be treated as a single class for all purposes of the indenture governing the Secured Notes, including waivers, amendments, redemptions and offers to purchase. The Secured Notes mature in 2016 and accrue interest at rate of 10.75% per annum payable semiannually. The Secured Notes are senior obligations of Affinia Group Inc.
On December 1, 2010, we issued an irrevocable notice of redemption to redeem $22.5 million aggregate principal amount of our Secured Notes on December 31, 2010, pursuant to their terms at a redemption price equal to 103% of the principal amount of such notes being redeemed, plus accrued and unpaid interest to the redemption date. The Secured Notes outstanding balance net of the discount was $200 million as of December 31, 2010.
Subordinated Notes. On November 30, 2004, Affinia Group Inc. issued $300 million of Subordinated Notes. The Subordinated Notes and the additional notes, if any, will be treated as a single class for all purposes of the indenture governing the Subordinated Notes, including waivers, amendments, redemptions and offers to purchase. The Subordinated Notes mature in 2014 and accrue interest at rate of 9% per annum payable semiannually. The Subordinated Notes are senior obligations of Affinia Group Inc.
In June of 2009, Affinia Group Holdings Inc. purchased in the open market approximately $33 million in principal amount of the Subordinated Notes and thereafter contributed such notes to Affinia Group Intermediate Holdings Inc., which contributed such notes to Affinia Group Inc. Affinia Group Inc. promptly surrendered such purchased notes for cancellation, which resulted in a pre-tax gain on the extinguishment of debt of $8 million in 2009.
On December 9, 2010, Affinia Group Inc. completed an offering of $100 million of Additional Notes. The Additional Notes have been issued at a price equal to 100% of their face value. The Additional Notes were issued pursuant to the Indenture, dated November 30, 2004, pursuant to which the Company issued its existing outstanding $267 million aggregate principal amount of Initial Notes. Other than with respect to the date of issuance and issue price, the Additional Notes have the same terms as, and are treated as a single class with, the Initial Notes. Affinia Group Inc.’s obligations under the Additional Notes are guaranteed on an unsecured senior subordinated basis by Affinia Group Intermediate Holdings Inc. and certain of our current and future wholly-owned domestic subsidiaries. The outstanding balance of the Subordinated Notes at December 31, 2010 was $367 million. Subject to Affinia Group Inc.’s compliance with the covenants described in the indenture securing the Subordinated Notes, Affinia Group Inc. is permitted to issue more Subordinated Notes from time to time under the indenture.
60
Table of Contents
Indenture Provisions. The indentures governing the Secured Notes and the Subordinated Notes limit Affinia Group Inc.’s (and its restricted subsidiaries’) ability to incur and guarantee additional indebtedness, issue disqualified stock or issue certain preferred stock; pay dividends on, make other distributions on, redeem or repurchase our capital stock or make certain other restricted payments; create certain liens or encumbrances; issue capital stock; make certain investments or acquisitions; make capital expenditures; pay dividends, make distributions or make other payments from its subsidiaries; changes their lines of business; enter into certain types of transactions with affiliates; use assets as security in other transactions; sell certain assets or merge with or into other companies and designate subsidiaries as unrestricted subsidiaries. Subject to certain exceptions, Affinia Group Inc. and its restricted subsidiaries are permitted to incur additional indebtedness, including secured indebtedness, under the terms of the indentures governing the Secured Notes and the Subordinated Notes.
During 2009, we recorded a write-off of $5 million to interest expense for unamortized deferred financing costs associated with the term loan facility, revolving credit facility and the accounts receivable facility. Additionally, we recorded $22 million in total deferred financing costs related to the new ABL Revolver and the issuance of the Secured Notes.
During 2010, we recorded a write-off of $1 million to interest expense for unamortized deferred financing costs associated with the redemption of $22.5 million of the Secured Notes. Additionally, we recorded $5 million in total deferred financing costs related to the amendment to ABL Revolver and the issuance of additional $100 million in Senior Subordinated Notes. The unamortized deferred financing will be charged to interest expense over the next five years for the ABL Revolver, six years for the Secured Notes and four years for the Subordinated Notes. The following table summarizes the deferred financing activity from December 31, 2008 to December 31, 2010:
| (Dollars in millions) | ||||
| As of December 31, 2008 |
11 | |||
| Amortization |
(4 | ) | ||
| Write-off of unamortized deferred financing costs |
(5 | ) | ||
| Deferred financing costs |
22 | |||
| Balance at December 31, 2009 |
$ | 24 | ||
| Amortization |
(5 | ) | ||
| Write-off of unamortized deferred financing costs |
(1 | ) | ||
| Deferred financing costs |
5 | |||
| Balance at December 31, 2010 |
$ | 23 | ||
Note 12. Accounts Receivable Factoring
We have agreements with third party financial institutions to factor certain receivables on a non-recourse basis. The terms of the factoring arrangements provide for the factoring of certain U.S. Dollar-denominated or Canadian Dollar-denominated receivables, which are purchased at the face value amount of the receivable discounted at the annual rate of LIBOR plus a spread on the purchase date. The amount factored is not contractually defined by the factoring arrangements and our use will vary each month based on the amount of underlying receivables and the cash flow needs of the Company.
We began factoring our accounts receivable during the third quarter of 2010. During 2010, the total accounts receivable factored was $156 million and the cost incurred on factoring was $2 million. Accounts receivable factored by us are accounted for as a sale and removed from the balance sheet at the time of factoring and the cost of the factoring is accounted for in other income.
Note 13. Stock Incentive Plan
On July 20, 2005, Affinia Group Holdings Inc. adopted the Affinia Group Holdings Inc. 2005 Stock Incentive Plan, which we refer to as our 2005 Stock Plan. The 2005 Stock Plan permits the grant of non-qualified stock options, incentive stock options, stock appreciation rights, restricted stock and other stock-based awards to employees, directors or consultants of Affinia Group Holdings Inc. and its affiliates. A maximum of 350,000 shares of Affinia Group Holdings Inc. common stock may be subject to awards under the 2005 Stock Plan. The number of shares issued or reserved pursuant to the 2005 Stock Plan (or pursuant to outstanding awards) is subject to adjustment on account of mergers, consolidations, reorganizations, stock splits, stock dividends and other dilutive changes in the common stock. Shares of common stock covered by awards that terminate or lapse and shares delivered by a participant or withheld to pay the minimum statutory withholding rate, in each case, will again be available for grant under the 2005 Stock Plan.
61
Table of Contents
Administration. The 2005 Stock Plan is administered by the compensation committee of Affinia Group Holdings Inc.’s Board of Directors. The committee has full power and authority to make, and establish the terms and conditions of any award, and to waive any such terms and conditions at any time (including, without limitation, accelerating or waiving any vesting conditions or payment dates). The committee is authorized to interpret the plan, to establish, amend and rescind any rules and regulations relating to the plan and to make any other determinations that it, in good faith, deems necessary or desirable for the administration of the plan and may delegate such authority as it deems appropriate. The committee may correct any defect or supply an omission or reconcile any inconsistency in the plan in the manner and to the extent the committee deems necessary or desirable and any decision of the committee in the interpretation and administration of the plan shall lie within its sole and absolute good faith discretion and shall be final, conclusive and binding on all parties concerned.
Options. The committee determines the option price for each option; however, the stock options must have an exercise price that is at least equal to the fair market value of the common stock on the date the option is granted. An option holder may exercise an option by written notice and payment of the option price (i) in cash or its equivalent, (ii) by the surrender of a number of shares of common stock already owned by the option holder for at least six months (or such other period established by the committee) with a fair market value equal to the exercise price, (iii) if there is a public market for the shares, subject to rules established by the committee, through the delivery of irrevocable instructions to a broker to sell shares obtained upon the exercise of the option and to deliver to Affinia Group Holdings Inc. an amount out of the proceeds of the sale equal to the aggregate option price for the shares being purchased or (iv) by another method approved by the committee.
Stock Appreciation Rights. The committee may grant stock appreciation rights independent of or in connection with an option. The exercise price per share of a stock appreciation right shall be an amount determined by the committee. Generally, each stock appreciation right shall entitle a participant upon exercise to an amount equal to (i) the excess of (1) the fair market value on the exercise date of one share of common stock over (2) the exercise price, multiplied by (ii) the number of shares of common stock covered by the stock appreciation right. Payment shall be made in common stock or in cash, or partly in common stock and partly in cash, all as shall be determined by the committee.
Other Stock-Based Awards. The committee may grant awards of restricted stock units, rights to purchase stock, restricted stock and other awards that are valued in whole or in part by reference to, or are otherwise based on the fair market value of, shares of common stock. The other stock-based awards will be subject to the terms and conditions established by the committee.
Transferability. Unless otherwise determined by the committee, awards granted under the 2005 Stock Plan are not transferable other than by will or by the laws of descent and distribution.
Change of Control. In the event of a change of control (as defined in the 2005 Stock Plan), the committee may provide for (i) the termination of an award upon the consummation of the change of control, but only if the award has vested and been paid out or the participant has been permitted to exercise an option in full for a period of not less than 30 days prior to the change of control, (ii) the acceleration of all or any portion of an award, (iii) payment in exchange for the cancellation of an award and/or (iv) the issuance of substitute awards that would substantially preserve the terms of any awards.
Amendment and Termination. Affinia Group Holdings Inc.’s Board of Directors may amend, alter or discontinue the 2005 Stock Plan in any respect at any time, but no amendment may diminish any of the rights of a participant under any awards previously granted, without his or her consent.
Management Stockholders Agreement. All shares issued under the plan will be subject to a management stockholders agreement or a director stockholders agreement, as applicable.
Restrictive Covenant Agreement. Unless otherwise determined by Affinia Group Holdings Inc.’s Board of Directors, all award recipients will be obligated to sign the standard Confidentiality, Non-Competition and Proprietary Information Agreement which includes restrictive covenants regarding confidentiality, proprietary information and a one year period restricting competition and solicitation of our clients, customers or employees. In the event a participant breaches these restrictive covenants, any exercise of, or payment or delivery pursuant to, an award may be rescinded by the committee in its discretion in which event the participant may be required to pay to us the amount of any gain realized in connection with, or as a result of, the rescinded exercise, payment or delivery.
Amendment. On November 14, 2006, the Compensation Committee of Affinia Group Holdings Inc. revised the vesting terms applicable to options previously awarded by the Committee to its named executive officers, as well as all other employees, under the Plan. One-half of these options vest in equal portions at the end of each year beginning with the year of the grant and ending December 31, 2009 (the “Vesting Period”), 40% are eligible for vesting in equal portions upon the Company’s achievement of certain specified annual EBITDA performance targets over the Vesting Period and 10% are eligible for vesting in equal portions upon the Company’s achievement of certain net working capital performance targets over the Vesting Period. The Committee has not modified the time-vesting options or the working capital performance options. The Committee elected to modify the vesting terms for the EBITDA performance options so that these options were eligible for vesting in equal portions at the end of each of the years 2007, 2008, and 2009. The Committee also modified the performance targets for those years. The fair value of the modified award was slightly higher than the grant date fair value.
62
Table of Contents
2005 Stock Plan
On July 20, 2005, Affinia Group Holdings Inc. adopted the 2005 Stock Plan with a maximum of 227,000 shares of common stock subject to awards. On August 25, 2010, Affinia Group Holdings Inc. increased the number of shares of common stock subject to awards from 227,000 to 300,000, and Affinia Group Holdings Inc. commenced an offer to certain eligible holders of stock options to exchange their existing options to purchase shares of Affinia Group Holdings Inc.’s common stock for RSUs with new vesting terms (the “Option Exchange”). The RSUs granted in connection with the Option Exchange are governed by the 2005 Stock Plan and the new Restricted Stock Unit Award Agreement. On December 2, 2010, Affinia Group Holdings Inc. increased the number of shares of common stock subject to awards from 300,000 to 350,000.
A table of the 2005 Stock Plan balances for the restricted stock units, stock options, deferred compensation shares and stock awards is summarized below.
| At December 31, | ||||||||
| 2009 | 2010 | |||||||
| Restricted stock units* |
— | 239,000 | ||||||
| Stock options* |
175,638 | 34,062 | ||||||
| Deferred compensation shares |
7,153 | 19,967 | ||||||
| Stock award |
— | 163 | ||||||
| Shares available |
44,209 | 56,808 | ||||||
| Number of shares of common stock subject to awards |
227,000 | 350,000 | ||||||
| * | The Option election period commenced on August 25, 2010 and expired on September 24, 2010. The completion of the Option Exchange for the RSUs occurred on October 18, 2010 and 100% of the eligible option holders elected to participate. A total of 24 eligible employees and directors participated in the Option Exchange. In addition, three eligible employees and directors who did not have vested options received RSUs. Affinia Group Holdings Inc. accepted for exchange options to purchase a total of 61,868 shares of Affinia Group Holdings Inc.’s common stock. All surrendered options were cancelled in exchange for RSUs. The options had been fully expensed by the exchange date. The total RSUs issued on October 18, 2010 and December 1, 2010 covered 235,000 and 4,000 shares, respectively, of Affinia Group Holdings Inc.’s common stock. |
Stock Options
The option holders who were not eligible for the Option Exchange had 34,062 stock options outstanding as of December 31, 2010, which included vested options of 34,062 and no unvested options. Pursuant to the terms of the 2005 Stock Plan, each option expires August 1, 2015. The exercise price is $100 per option.
We account for our employee stock options under the fair value method of accounting using a Black-Scholes model to measure stock-based compensation expense at the date of grant. Dividend yields were not a factor because there were no cash dividends declared during 2008, 2009, and 2010. Our weighted-average Black-Scholes fair value assumptions include:
| 2008 | 2009 | 2010 | ||||||||||
| Weighted-average effective term |
5.2 years | 5.2 years | 5.2 years | |||||||||
| Weighted-average risk free interest rate |
4.35 | % | 4.33 | % | 4.38 | % | ||||||
| Weighted-average expected volatility |
40.1 | % | 40.8 | % | 40.4 | % | ||||||
| Weighted-average fair value of options |
||||||||||||
| (Dollars in millions) |
$ | 7 | $ | 7 | $ | 1 | ||||||
63
Table of Contents
The fair value of the stock option grants is amortized to expense over the vesting period. The Company reduces the overall compensation expense by a turnover rate consistent with historical trends. Stock-based compensation expense, which was recorded in selling, general and administrative expenses, and tax related income tax benefits were less than $1 million for 2008, $1 million for 2009 and less than $1million for 2010.
| Options | ||||
| Outstanding at January 1, 2008 |
217,510 | |||
| Granted |
9,500 | |||
| Forfeited/expired |
(45,225 | ) | ||
| Outstanding at December 31, 2008 |
181,785 | |||
| Granted |
1,500 | |||
| Forfeited/expired |
(7,647 | ) | ||
| Outstanding at December 31, 2009 |
175,638 | |||
| Granted |
2,000 | |||
| Exercised |
(1,000 | ) | ||
| Exchanged |
(61,868 | ) | ||
| Forfeited/expired |
(80,708 | ) | ||
| Outstanding at December 31, 2010 |
34,062 | |||
Restricted Stock Units
The RSUs granted in connection with the Option Exchange are governed by the 2005 Stock Plan and a new Restricted Stock Unit Award Agreement.
The RSUs are subject to performance-based and market-based vesting restrictions, which differ from the performance and time-based vesting restrictions applicable to the exchanged stock options. The RSUs will vest if (i) the RSU holder remains employed with Affinia Group Holdings Inc. on the date that either of the following vesting conditions occurs and (ii) either of the following vesting conditions occurs on or prior to the date on which Cypress ceases to hold any remaining Affinia Group Holdings Inc. common stock:
| • | Cypress Scenario - Cypress has received aggregate transaction proceeds in cash or marketable securities (not subject to escrow, lock-up, trading restrictions or claw-back) with respect to the disposition of more than 50% of its common equity interests in Affinia Group Holdings Inc. in an amount that represents a per-share equivalent value that is greater than or equal to two times the average per share price paid by Cypress for its aggregate common equity investment in Affinia Group Holdings Inc.; or |
| • | IPO Scenario - Affinia Group Holdings Inc.’s common stock trades on a public stock exchange at an average closing price of $225 (as adjusted for stock splits) over a 60 consecutive trading day period. |
As part of the Option Exchange, the total RSUs granted on October 18, 2010 covered 235,000 shares of Affinia Group Holdings Inc. common stock. As of December 31, 2010, 239,000 shares had been awarded, none of which have vested. We estimate the fair value of market-based restricted stock units using a Monte Carlo simulation model on the date of grant. Our weighted-average Monte Carlo fair value assumptions include:
| Cypress Scenario | IPO Scenario | |||||||
| Effective term |
0.6 years | 1.4 years | ||||||
| Risk free interest rate |
1.1 | % | 1.1 | % | ||||
| Expected volatility |
70 | % | 70 | % | ||||
| Fair value of an RSU |
$ | 107.72 | $ | 124.25 | ||||
| Expected expense (Dollars in millions) |
$ | 26 | $ | 30 | ||||
64
Table of Contents
In the event that either of the performance-based conditions (Cypress Scenario or IPO Scenario) are met, the fair value of the RSUs will be recognized in stock-based compensation expense either 1) pro rata over the requisite service term including a cumulative catch-up related to service provided through the date the performance condition is met or 2) in full once the respective market-based condition is met or 3) in full if the requisite service period has already passed when the performance condition is met. Stock-based compensation expense, which would be recorded in selling, general and administrative expenses, and tax related income tax benefits was not recorded for 2010 as neither of the performance conditions have been met. If the RSUs do not vest prior to ten years from the date of grant then the RSUs will expire. If the performance condition is met on the 239,000 RSUs the amount of expense we would have to record is $30 million under the IPO scenario or $26 million under the Cypress scenario.
| RSUs | ||||
| Outstanding at December 31, 2009 |
— | |||
| Issued per Option Exchange |
235,000 | |||
| Granted |
4,000 | |||
| Forfeited/expired |
— | |||
| Outstanding at December 31, 2010 |
239,000 | |||
Note 14. Pension and Other Postretirement Benefits
The Company provides defined contribution and defined benefit, qualified and nonqualified, pension plans for certain employees.
Under the terms of the defined contribution retirement plans, employee and employer contributions may be directed into a number of diverse investments. Expenses related to these defined contribution plans were $8 million for the year ended December 31, 2008, $1 million for the year ended December 31, 2009 and $5 million for the year ended December 31, 2010.
The Company has Canadian defined benefit pension plans (the assets of which are referred to as the “Fund”). These plans are managed in accordance with applicable legal requirements relating to the investment of registered pension plans. The responsibility for the investment of the Fund lies with the Investment Committee of ITT Industries of Canada Ltd. (the “Committee”). The Committee is composed of representatives of ITT and of the participating companies, which includes our Company. The investments objectives of the plans are to maximize long-term total investment returns while assuming a prudent level of risk deemed appropriate by the Committee. The Fund may not engage in certain investments that are not permitted for a pension plan pursuant to applicable provincial pension benefits legislation and the Income Tax Act of Canada. Additionally, the Fund may not invest more than 10% of the assets in any single public issue of securities except where the security is issued by or guaranteed by the government of Canada or a Canadian province. This investment policy permits plan assets to be invested in a number of diverse investment categories such as demand or term deposits, short term notes, treasury bills, bankers acceptances, commercial paper, investment certificates issued by banks, insurance companies or trust companies, bonds and non-convertible debentures, mortgages and other asset-backed securities, convertible debentures, real estate, preferred and common stocks that are traded publicly, including both Canadian and foreign stocks, resource properties, venture capital, insured contracts, pooled funds, segregated funds, trusts, closed-end investment companies, limited partnerships and other structured vehicles invested directly or indirectly in, or in interests.
65
Table of Contents
We did not terminate any plans in 2010; however, we settled $20 million of the assets in the pension plans. During the year we purchased annuities for many of the participants of the pension plans. We are in the process of winding down the plans. How quickly we settle all of the pension plan assets is subject to approval from a Canadian regulatory agency. The following tables provide a reconciliation of the changes in the Company’s defined benefit pension plans’ and the fair value of assets for the years ended December 31, 2009 and December 31, 2010, as well as the statements of the funded status and schedules of the net amounts recognized in the balance sheet at December 31, 2009 and 2010. The measurement date for the amounts in these tables was December 31 of each year presented:
| Pension Benefits | ||||||||
| Year
Ended December 31, 2009 |
Year
Ended December 31, 2010 |
|||||||
| (Dollars in millions) | ||||||||
| Reconciliation of benefit obligation |
||||||||
| Obligation at beginning of period |
$ | 18 | $ | 22 | ||||
| Service cost |
— | — | ||||||
| Interest cost |
1 | 1 | ||||||
| Plan amendment |
— | — | ||||||
| Actuarial (gain) loss |
1 | 1 | ||||||
| Benefit payments |
(1 | ) | (1 | ) | ||||
| Settlement |
— | (20 | ) | |||||
| Translation adjustments |
3 | — | ||||||
| Obligation at end of period |
$ | 22 | $ | 3 | ||||
| Accumulated benefit obligation |
$ | 22 | $ | 3 | ||||
66
Table of Contents
| Pension Benefits | ||||||||
| (Dollars in millions) | Year
Ended December 31, 2009 |
Year
Ended December 31, 2010 |
||||||
| Reconciliation of fair value of plan assets |
||||||||
| Fair value, beginning of period |
$ | 13 | $ | 20 | ||||
| Actual return on plan assets |
3 | 1 | ||||||
| Employer contributions |
3 | 2 | ||||||
| Benefit payments |
(1 | ) | (2 | ) | ||||
| Settlement |
— | (20 | ) | |||||
| Translation adjustments |
2 | 1 | ||||||
| Fair value, end of period |
$ | 20 | $ | 2 | ||||
| Pension Benefits | ||||||||
| (Dollars in millions) | Year
Ended December 31, 2009 |
Year
Ended December 31, 2010 |
||||||
| Funded Status |
$ | (2 | ) | $ | (1 | ) | ||
| Unrecognized net actuarial loss |
4 | 1 | ||||||
| Accrued benefit cost |
$ | 2 | $ | — | ||||
The weighted average asset allocations of the pension plans at December 31, 2009 and December 31, 2010 were as follows:
| December 31, 2009 |
December 31, 2010 |
|||||||
| Asset Category |
||||||||
| Equity securities |
61 | % | 68 | % | ||||
| Controlled-risk debt securities |
38 | % | 28 | % | ||||
| Cash and short-term obligations |
1 | % | 4 | % | ||||
| Total |
100 | % | 100 | % | ||||
The target asset allocations of the pension plans for equity securities, controlled-risk debt securities, absolute return strategies investments and cash and other assets at December 31, 2009 and December 31, 2010 were 70%, 30%, 0% and 0%.
The following table presents the funded status of the Company’s pension plans and the amounts recognized in the balance sheet as of December 31, 2009 and 2010:
| (Dollars in millions) | December 31, 2009 |
December 31, 2010 |
||||||
| Accumulated benefit obligation at beginning of period |
$ | 18 | $ | 22 | ||||
| Projected benefit obligation |
22 | 3 | ||||||
| Fair value of assets |
20 | 2 | ||||||
| Accrued cost |
$ | (2 | ) | $ | (1 | ) | ||
| Amounts recognized in balance sheet: |
||||||||
| Accrued benefit liability |
$ | (2 | ) | $ | (1 | ) | ||
| Intangible asset |
— | — | ||||||
| Accumulated other comprehensive income |
4 | 1 | ||||||
| Net amount recognized |
$ | 2 | $ | — | ||||
The Company’s projected benefit payments by the pension plans subsequent to December 31, 2010 are expected to be $2 million in 2011 and $1 million over the next nine years.
Projected contributions to be made to the Company’s defined benefit pension plans are expected to be in aggregate $1 million over the next ten years.
67
Table of Contents
Components of net periodic benefit costs for the Company’s defined benefit plans for the years ended December 31, 2008, December 31, 2009 and December 31, 2010 are as follows:
| Pension Benefits | ||||||||||||
| Year
Ended December 31, 2008 |
Year
Ended December 31, 2009 |
Year
Ended December 31, 2010 |
||||||||||
| (Dollars in millions) | ||||||||||||
| Service cost |
$ | — | $ | — | $ | — | ||||||
| Interest cost |
1 | 1 | 1 | |||||||||
| Settlement |
— | — | 4 | |||||||||
| Expected return on plan assets |
(1 | ) | (1 | ) | (1 | ) | ||||||
| Amortization of transition obligation |
— | — | — | |||||||||
| Amortization of prior service cost |
— | — | — | |||||||||
| Recognized net actuarial loss |
2 | 2 | 1 | |||||||||
| Net periodic benefit cost |
$ | 2 | $ | 2 | $ | 5 | ||||||
| December 31, 2008 |
December 31, 2009 |
December 31, 2010 |
||||||||||
| Discount rate |
5.3 | % | 5.1 | % | 5.5 | % | ||||||
| Expected return on plan assets |
6.1 | % | 6.1 | % | 6.6 | % | ||||||
The discount rate and expected return on plan assets for the Company’s plans presented in the tables above are used to determine pension expense for the succeeding year.
Fair Value Measurements. The following tables present our plan assets using the fair value framework as of December 31, 2010 and 2009. The fair value framework requires the categorization of our plan assets into three levels based upon the assumptions (inputs) used to price the plan assets. Level 1 provides the most reliable measure of fair value, whereas Level 3 generally requires significant management judgment. The three levels are defined as follows:
| • | Level 1: Unadjusted quoted prices in active markets for identical assets and liabilities. |
| • | Level 2: Observable inputs other than those included in Level 1. For example, quoted prices for similar assets or liabilities in active markets or quoted prices for identical assets or liabilities in inactive markets. |
| • | Level 3: Unobservable inputs reflecting management’s own assumptions about the inputs used in pricing the asset or liability. |
The following table presents our plan assets using the fair value framework as of December 31, 2010.
| (Dollars in millions) |
Quoted prices in active markets (Level 1) |
Significant other observable inputs (Level 2) |
Significant unobservable inputs (Level 3) |
Total | ||||||||||||
| Cash and cash equivalents |
||||||||||||||||
| Cash and cash equivalents |
$ | — | $ | — | $ | — | $ | — | ||||||||
| Equity securities: |
||||||||||||||||
| Canadian equities |
1 | — | — | 1 | ||||||||||||
| Other equities |
— | — | — | — | ||||||||||||
| Fixed income securities |
||||||||||||||||
| Canadian Government Securities |
— | 1 | — | 1 | ||||||||||||
| Corporate bonds |
— | — | — | — | ||||||||||||
| Total plan assets |
$ | 1 | $ | 1 | $ | — | $ | 2 | ||||||||
68
Table of Contents
The following table presents our plan assets using the fair value framework as of December 31, 2009.
| (Dollars in millions) |
Quoted prices in active markets (Level 1) |
Significant other observable inputs (Level 2) |
Significant unobservable inputs (Level 3) |
Total | ||||||||||||
| Cash and cash equivalents |
||||||||||||||||
| Cash and cash equivalents |
$ | — | $ | — | $ | — | $ | — | ||||||||
| Equity Securities: |
||||||||||||||||
| Canadian equities |
8 | 1 | — | 9 | ||||||||||||
| Other equities |
2 | 2 | — | 4 | ||||||||||||
| Fixed income securities |
||||||||||||||||
| Canadian Government Securities |
— | 1 | — | 1 | ||||||||||||
| Corporate bonds |
— | 6 | — | 6 | ||||||||||||
| Total plan assets |
$ | 10 | $ | 10 | $ | — | $ | 20 | ||||||||
Note 15. Income Tax
The components of the income tax provision (benefit) are as follows:
| (Dollars in millions) | Year
Ended December 31, 2008 |
Year
Ended December 31, 2009 |
Year
Ended December 31, 2010 |
|||||||||
| Current: |
||||||||||||
| U.S. federal |
$ | — | $ | — | $ | — | ||||||
| U.S. state and local |
— | 1 | 1 | |||||||||
| Non-United States |
25 | 21 | 24 | |||||||||
| Total current |
25 | 22 | 25 | |||||||||
| Deferred: |
||||||||||||
| U.S. federal & state |
(3 | ) | — | 1 | ||||||||
| Non-United States |
(4 | ) | — | 1 | ||||||||
| Total deferred |
(7 | ) | — | 2 | ||||||||
| Income tax provision |
$ | 18 | $ | 22 | $ | 27 | ||||||
The income tax provision was calculated based upon the following components of income from continuing operations before income tax provision, equity in income and noncontrolling interest:
| (Dollars in millions) | Year
Ended December 31, 2008 |
Year
Ended December 31, 2009 |
Year
Ended December 31, 2010 |
|||||||||
| United States |
$ | (38 | ) | $ | (39 | ) | $ | (45 | ) | |||
| Non-United States |
72 | 84 | 101 | |||||||||
| Earnings (loss) before income taxes |
$ | 34 | $ | 45 | $ | 56 | ||||||
69
Table of Contents
Deferred tax assets (liabilities) consisted of the following:
| (Dollars in millions) | At December
31, 2009 |
At December
31, 2010 |
||||||
| Deferred tax assets: |
||||||||
| Net operating loss carryforwards |
$ | 96 | $ | 111 | ||||
| Inventory reserves |
16 | 17 | ||||||
| Expense accruals |
34 | 29 | ||||||
| Other |
18 | 20 | ||||||
| Subtotal |
164 | 177 | ||||||
| Valuation allowance |
(23 | ) | (23 | ) | ||||
| Deferred tax assets |
141 | 154 | ||||||
| Deferred tax liabilities: |
||||||||
| Depreciation & amortization |
20 | 21 | ||||||
| Foreign earnings |
1 | 7 | ||||||
| Deferred tax liabilities |
21 | 28 | ||||||
| Net deferred tax assets |
$ | 120 | $ | 126 | ||||
| Balance Sheet Presentation: |
||||||||
| Current deferred taxes |
$ | 50 | $ | 40 | ||||
| Deferred income taxes |
68 | 85 | ||||||
| Other accrued expenses |
— | — | ||||||
| Deferred employee benefits & other noncurrent liabilities |
2 | 1 | ||||||
| Net deferred tax assets |
$ | 120 | $ | 126 | ||||
Valuation allowances are provided for deferred tax assets whenever the realization of the assets is not deemed to meet a more likely than not standard. Accordingly, valuation allowances have been provided for net operating losses in certain non-U.S. countries and U.S. states. U.S. income and foreign withholding taxes have not been recognized on the excess of the amount for financial reporting over the tax basis of investments in foreign subsidiaries that are essentially permanent in duration. This amount becomes taxable upon a repatriation of assets from the subsidiary or a sale or liquidation of the subsidiary. The amount of such temporary differences totaled $117 million at December 31, 2010. Determination of the amount of any unrecognized deferred income tax liability on this temporary difference is not practicable.
The effective income tax rate differs from the U.S. federal income tax rate for the following reasons:
| Year
Ended December 31, 2008 |
Year
Ended December 31, 2009 |
Year
Ended December 31, 2010 |
||||||||||
| U.S. federal income tax rate |
35.0 | % | 35.0 | % | 35.0 | % | ||||||
| Increases (reductions) resulting from: |
||||||||||||
| State and local income taxes, net of federal income tax benefit |
-0.8 | 0.5 | 1.4 | |||||||||
| Valuation allowance |
15.1 | 1.8 | ||||||||||
| Non-U.S. income |
-6.8 | -23.4 | -16.1 | |||||||||
| U.S. Permanent Differences* |
11.1 | 9.9 | 22.2 | |||||||||
| Unremitted Earnings |
8.8 | 5.8 | 4.2 | |||||||||
| Miscellaneous items |
4.3 | 5.0 | 0.6 | |||||||||
| Effective income tax rate |
51.6 | % | 47.9 | % | 49.1 | % | ||||||
| * | The U.S. Permanent Differences affecting the tax rate are a result of a deemed distribution and nondeductible expenses. |
70
Table of Contents
At the end of 2010, federal domestic net operating loss carryforwards were $266 million. Of these, $12 million expire in 2024, $13 million expire in 2025, $37 million expire in 2026, $35 million expire in 2027, $76 million expire in 2028, $62 million expire in 2029 and $31 million expire in 2030. At the end of 2010, state domestic net operating loss carryforwards were estimated to be $185 million, the majority of which expire between 2020 and 2030. At the end of 2010, foreign net operating loss carryforwards were $24 million and expire as follows: $1 million in 2012, $6 million in 2013, $3 million in 2014, $0.5 million in 2015, $2 million in 2016, $1 million in 2018, $3 million in 2019, $5 million in 2026, $0.5 million in 2029 and $2 million in 2030. Realization of the tax benefits associated with loss carryforwards is dependent on generating sufficient taxable income prior to their expiration.
The following table summarizes the activity related to our unrecognized tax benefits:
| (Dollars in millions) | ||||
| Balance at January 1, 2008 |
$ | 2 | ||
| Increases to tax positions |
— | |||
| Decreases to tax positions |
— | |||
| Balance at January 1, 2009 |
$ | 2 | ||
| Increases to tax positions |
— | |||
| Decreases to tax positions |
— | |||
| Balance at January 1, 2010 |
$ | 2 | ||
| Increases to tax positions |
— | |||
| Decreases to tax positions |
— | |||
| Balance at December 31, 2010 |
$ | 2 | ||
Included in the balance of unrecognized tax benefits at December 31, 2010, are $2 million of tax benefits that, if recognized, would affect the effective tax rate. The Company recognizes interest related to unrecognized tax benefits in interest expense and penalties as part of the income tax provision. As of December 31, 2010 the Company’s accrual for interest and penalties is less than $1 million.
The Company is subject to taxation in the U.S. and various state and foreign jurisdictions. For jurisdictions in which the Company transacts significant business, tax years ending December 31, 2004 and later remain subject to examination by tax authorities. We do not anticipate any material change in the total amount of unrecognized tax benefits to occur within the next twelve months.
71
Table of Contents
Note 16. Property, Plant and Equipment
The following table breaks out the property, plant and equipment in further detail:
| December 31, | ||||||||
| (Dollars in millions) | 2009 | 2010 | ||||||
| Property, plant and equipment |
||||||||
| Land and improvements to land |
$ | 25 | $ | 29 | ||||
| Buildings and building fixtures |
80 | 80 | ||||||
| Machinery and equipment |
179 | 193 | ||||||
| Software |
26 | 28 | ||||||
| Other |
1 | — | ||||||
| Construction in progress |
12 | 31 | ||||||
| 323 | 361 | |||||||
| Less: Accumulated depreciation |
(124 | ) | (144 | ) | ||||
| $ | 199 | $ | 217 | |||||
The property, plant and equipment as of December 31, 2009 excludes our Commercial Distribution Europe segment property, plant and equipment, of $18 million, which was impaired. Depreciation is recognized on a straight-line basis over an asset’s estimated useful life. The depreciation expense from continuing operations was $25 million, $27 million, and $29 million for 2008, 2009, and 2010, respectively.
Note 17. Other Accrued Expenses
The following table breaks out the other accrued expenses in further detail:
| December 31, | ||||||||
| (Dollars in millions) | 2009 | 2010 | ||||||
| Return reserve |
$ | 17 | $ | 17 | ||||
| Accrued promotions and defective product |
10 | 10 | ||||||
| Core deposit liability |
9 | 9 | ||||||
| Taxes other than income taxes |
41 | 37 | ||||||
| Tax deposit payable |
14 | 9 | ||||||
| Interest payable |
12 | 11 | ||||||
| Accrued restructuring |
7 | 4 | ||||||
| Accrued workers compensation |
6 | 6 | ||||||
| Accrued freight |
4 | 11 | ||||||
| Other |
34 | 37 | ||||||
| $ | 154 | $ | 151 | |||||
The other accrued expenses primarily consist of accrued selling and marketing expenses, accrued utilities, accrued legal and professional fees and other miscellaneous accruals.
A reconciliation of the changes in our return reserves is as follows beginning with January 1, 2008:
| December 31, | ||||||||||||
| (Dollars in millions) | 2008 | 2009 | 2010 | |||||||||
| Beginning balance January 1 |
$ | 20 | $ | 18 | $ | 17 | ||||||
| Amounts charged to revenue |
58 | 56 | 43 | |||||||||
| Returns processed |
(60 | ) | (57 | ) | (43 | ) | ||||||
| Ending balance December 31 |
$ | 18 | $ | 17 | $ | 17 | ||||||
72
Table of Contents
Note 18. Commitments and Contingencies
At December 31, 2010, the Company had purchase commitments for property, plant and equipment of approximately $13 million.
The Company had future minimum rental commitments under non-cancelable operating leases of $66 million at December 31, 2010, with future rental payments of:
| (Dollars in millions) | Operating Leases |
|||
| 2011 |
$ | 12 | ||
| 2012 |
13 | |||
| 2013 |
11 | |||
| 2014 |
10 | |||
| 2015 |
6 | |||
| Thereafter |
14 | |||
| Total |
$ | 66 | ||
The leases do not contain restrictions on future borrowings. There are no significant lease escalation clauses or purchase options. Rent expense from continuing operations was $20 million, $19 million and $18 million in 2008, 2009 and 2010, respectively.
Various claims, lawsuits and administrative proceedings are pending or threatened against us and our subsidiaries, arising from the ordinary course of business with respect to commercial, intellectual property, product liability and environmental matters. We believe that the ultimate resolution of the foregoing matters will not have a material effect on our financial condition or results of operations or liquidity.
On March 31, 2008, a class action lawsuit was filed by S&E Quick Lube Distributors, Inc. of Utah against several auto parts manufacturers for allegedly conspiring to fix prices for replacement oil, air, fuel and transmission filters. Several auto parts companies are named as defendants, including Champion Laboratories, Inc., Purolator Filters NA LLC, Honeywell International Inc., Cummins Filtration Inc., Donaldson Company, Baldwin Filters Inc., Bosch USA., Mann + Hummel USA Inc., ArvinMeritor Inc., United Components Inc. and Wix Filtration Corp LLC (“Wix Filtration”), one of our subsidiaries. The lawsuit is currently pending as a consolidated Multi-District Litigation (“MDL”) Proceeding in Chicago, IL because of multiple “tag-along” filings in several jurisdictions. Two suits have also been filed in the Canadian provinces of Ontario and Quebec. Wix Filtration, along with other named defendants, have filed various motions to dismiss plaintiffs’ complaints, which were denied by the court in December 2009. Several defendants, including Wix Filtration, refiled motions to dismiss based upon plaintiff’s most recent amended complaint. The court denied those motions in September 2010. Discovery in the action continues. Despite the U.S. Department of Justice closing its investigation in this matter, the State of Washington Attorney General issued Civil Investigative Demands to all defendants. We believe that Wix Filtration did not engage in any improper conduct and in any event did not have significant sales in this particular market at the relevant time periods so we do not expect the lawsuit to have a material adverse effect on our financial condition or results of operations. We intend to vigorously defend this matter.
DPH Holdings Corp., a successor to Delphi Corporation and certain of its affiliates (“Delphi”), served Affinia and certain of our other subsidiaries with a complaint to avoid over $17 million in allegedly preferential transfers, substantially all of which relate to allegedly preferential transfers involving our non-U.S. subsidiaries. On February 4, 2011, we settled with Delphi for $0.1 million.
The Company has various accruals for civil liability, including product liability, and other costs. If there is a range of equally probable outcomes, we accrue at the lower end of the range. The Company had $1 million and $2 million accrued as of December 31, 2009 and December 31, 2010, respectively. In addition, we have various other claims that are not probable of occurrence that range from less than $1 million to $12 million. There are no recoveries expected from third parties.
During the first quarter of 2007 we signed a letter of credit in connection with a real estate lease. ASC 460, “Guarantees”, requires that this letter of credit be accounted for as a guarantee. The fair value of this guarantee as of December 31, 2010 was $1 million and is included in other noncurrent liabilities and other long-term assets.
73
Table of Contents
Note 19. Restructuring of Operations
In 2005, we announced two restructuring plans: (i) a restructuring plan that we announced at the beginning of 2005 as part of the Acquisition, also referred to as the acquisition restructuring and (ii) a restructuring plan that we announced at the end of 2005, also referred to herein as the comprehensive restructuring. We have completed the acquisition restructuring and we are in process of completing the comprehensive restructuring.
Comprehensive Restructuring
The comprehensive restructuring was announced in December 2005 and has resulted in the closure of 36 facilities. Additionally, we previously announced the closure of our Litchfield, Illinois plant but the closure date has been delayed until 2011. Once this plant is closed in 2011 the comprehensive restructuring will be completed. We anticipate that we will incur over the next couple of years approximately $4 million additional comprehensive restructuring costs related to the closure of the final facility and other costs related to closed facilities which we still own or lease. The major components of the comprehensive restructuring through 2010 were employee severance costs, asset impairment charges, and other costs (i.e. moving costs, environmental remediation, site clearance and repair costs) each of which we expect to represent approximately 41%, 18% and 41% respectively, of the total cost of the restructuring.
The comprehensive restructuring will result in approximately $171 million in restructuring costs, which exceeds preliminary expectations of $152 million.
In connection with the comprehensive restructuring, we recorded $13 million in restructuring costs in 2010. The comprehensive and other restructuring costs are disclosed by period in the chart below and were recorded in selling, general and administrative expense, cost of sales and as part of discontinued operations.
Other Restructuring
At the end of 2009, we approved the closure of our distribution operations located in Mississauga, Ontario, Canada. The operations closed at the end of the first quarter of 2010. The closure of this operation is part of the Company’s continuing effort to improve its distribution system and serve the replacement parts market effectively and efficiently. The charges were comprised of employee severance costs of $1 million and other trailing liabilities of $4 million. We incurred approximately $4 million in 2010 and $1 million in 2009 related to the closure of this facility. We anticipate another $2 million in restructuring costs in 2011 related to the closure of the facility.
74
Table of Contents
On May 3, 2010, we announced the closure of our brake manufacturing operations located in Maracay, Edo Aragua, Venezuela. The operations closed during the second quarter of 2010. These actions resulted in the Company incurring pre-tax charges of approximately $7 million, of which approximately $4 million were cash expenditures. The charges were comprised of employee severance costs of $3 million, asset impairments of $3 million, and other trailing liabilities of $1 million.
| (Dollars in millions) |
Discontinued Operations |
Selling, General and Administrative Expenses |
Cost of Sales | Total | ||||||||||||
| Comprehensive Restructuring |
||||||||||||||||
| 2005 |
$ | — | $ | 2 | $ | 21 | $ | 23 | ||||||||
| 2006 |
1 | 38 | 1 | 40 | ||||||||||||
| 2007 |
12 | 23 | 3 | 38 | ||||||||||||
| 2008 |
12 | 27 | 1 | 40 | ||||||||||||
| 2009 |
2 | 10 | 1 | 13 | ||||||||||||
| 2010 |
— | 13 | — | 13 | ||||||||||||
| Total Comprehensive Cost |
27 | 113 | 27 | $ | 167 | |||||||||||
| Other Restructuring |
||||||||||||||||
| 2009 |
— | 1 | — | 1 | ||||||||||||
| 2010 |
— | 8 | 3 | 11 | ||||||||||||
| Total Other Restructuring Cost |
— | 9 | 3 | 12 | ||||||||||||
| Total Restructuring Cost |
$ | 27 | $ | 122 | $ | 30 | $ | 179 | ||||||||
The restructuring charges for the comprehensive restructuring and further restructuring consist of employee termination costs, other exit costs and impairment costs. Severance costs are being accounted for in accordance with ASC Topic 420, “Exit or Disposal Cost Obligations” and ASC Topic 712, “Compensation—Nonretirement Postemployment Benefits.” The following summarizes the restructuring charges and activity for all the Company’s restructuring programs:
Accrued Restructuring
| (Dollars in millions) | Comprehensive | Other | Total | |||||||||
| Balance at December 31, 2008 |
$ | 11 | — | $ | 11 | |||||||
| Charges to expense: |
||||||||||||
| Employee termination benefits |
4 | 1 | 5 | |||||||||
| Asset write-offs expense |
1 | — | 1 | |||||||||
| Other expenses |
8 | — | 8 | |||||||||
| Total restructuring expenses |
13 | 1 | 14 | |||||||||
| Cash payments and asset write-offs: |
||||||||||||
| Cash payments |
(15 | ) | — | (15 | ) | |||||||
| Asset retirements and other |
(3 | ) | — | (3 | ) | |||||||
| Balance at December 31, 2009 |
$ | 6 | 1 | $ | 7 | |||||||
| Charges to expense: |
||||||||||||
| Employee termination benefits |
— | 4 | 4 | |||||||||
| Asset write-offs expense |
1 | 3 | 4 | |||||||||
| Other expenses |
12 | 4 | 16 | |||||||||
| Total restructuring expenses |
13 | 11 | 24 | |||||||||
| Cash payments and asset write-offs: |
||||||||||||
| Cash payments |
(13 | ) | (7 | ) | (20 | ) | ||||||
| Asset retirements and other |
(3 | ) | (4 | ) | (7 | ) | ||||||
| Balance at December 31, 2010 |
$ | 3 | 1 | $ | 4 | |||||||
75
Table of Contents
At December 31, 2010, $4 million of restructuring charges remained in accrued liabilities, relating to wage and healthcare continuation for severed employees and other termination costs. These remaining benefits are expected to be paid during 2011. The following table shows the restructuring expenses by segment:
| (Dollars in millions) | 2008 | 2009 | 2010 | |||||||||
| On and Off-highway segment |
$ | 19 | $ | 8 | $ | 13 | ||||||
| Brake South America segment |
7 | 1 | 7 | |||||||||
| Corporate, eliminations and other |
2 | 3 | 4 | |||||||||
| $ | 28 | $ | 12 | $ | 24 | |||||||
| Commercial Distribution Europe segment |
12 | 2 | — | |||||||||
| Total |
$ | 40 | $ | 14 | $ | 24 | ||||||
Note 20. Related Party Transactions
Mr. John M. Riess, an Affinia Group Inc. Board member, is the parent of, J. Michael Riess, who is currently employed with Genuine Parts Company (NAPA) as president of a distribution facility. NAPA is the Company’s largest customer as a percentage of total net sales from continuing operations. NAPA accounted for 27%, 29% and 27% of our total net sales for the years ended December 31, 2008, 2009 and 2010, respectively.
Mr. Zhang Haibo, 15% owner of Affinia Hong Kong Limited (“AHK”), loaned $1.4 million to AHK to facilitate the establishment of a new subsidiary, Affinia Qingdao Braking Systems Co. Ltd., a new friction company in China with the intention of manufacturing friction products and distributing these products in Asia and North America. AHK owns 100% of the subsidiary. The contribution agreement has not been finalized as of December 31, 2010, but the cash has been received by AHK, as such we have recorded the $1.4 million as related party debt.
Mr. Zhang Haibo, contributed $2.5 million to AHK to facilitate the purchase of land for a new filtration company in China with the intention of manufacturing and distributing filtration products principally in Asia. The contribution did not change the ownership percentage and as a consequence the noncontrolling interest did not change but property, plant and equipment did increase.
The Company is controlled by affiliates of Cypress. Cypress charged Affinia Group Inc. $3 million in 2009, which consisted of a management fee for services related to the refinancing and other advisory services. This amount was included in selling, general, and administrative expenses.
Effective January 1, 2011, we, along with Affinia Group Holdings Inc. and Affinia Group Inc., entered into an Advisory Agreement with Torque Capital Group LLC for services related to corporate strategy, finance, investments and such other services as we may request from time to time. Mr. Joseph E. Parzick, one of our directors, is a managing partner of Torque Capital Group LLC. In connection with the Advisory Agreement, we, along with Affinia Group Holdings Inc. and Affinia Group Inc., have agreed to pay a quarterly fee of $400,000 for six calendar quarters expiring June 30, 2012, and have further agreed to pay a success fee of up to $3.0 million in the event Affinia Group Holdings Inc.’s shareholders realize a specified return on their investment. A copy of the Advisory Agreement is attached as an Exhibit hereto.
Effective January 1, 2011, we, along with Affinia Group Holdings Inc. and Affinia Group Inc., entered into an Advisory Agreement with Cypress Advisors, Inc. for services related to corporate strategy, finance, investments and such other services as we may request from time to time. Mr. James A. Stern, one of our directors, is a managing director of Cypress Advisors, Inc. In connection with the Advisory Agreement, we, along with Affinia Group Holdings Inc. and Affinia Group Inc., have agreed to pay a quarterly fee of $100,000 for six calendar quarters expiring June 30, 2012, and have further agreed to pay a success fee of up to $2.0 million in the event Affinia Group Holdings Inc.’s shareholders realize a specified return on their investment. A copy of the Advisory Agreement is attached as an Exhibit hereto.
76
Table of Contents
Note 21. Segment Information
The products, customer base, distribution channel, manufacturing process, procurement are similar throughout all of the Company’s operations. However, due to different economic characteristics in the Company’s operations and in conformity with ASC Topic 280, “Segment Reporting,” the Company was previously presented as three separate reporting segments: (1) the On and Off-highway segment, which is composed of Filtration, Brake North America and Asia, Chassis and Commercial Distribution South America, (2) Brake South America segment and (3) Commercial Distribution Europe segment. All three segments are in the On and Off-highway industry but for segment reporting purposes we refer to the first segment as the On and Off-highway segment. Because of the sale of our Commercial Distribution Europe segment, the Commercial Distribution Europe segment was classified as discontinued operations and, as such is not presented in the net sales and operating profit segment tables below. See “Note 4. Discontinued Operation.” Segment net sales, operating profit, total assets, depreciation and amortization and capital expenditures were as follows:
| (Dollars in millions) | Net Sales | Operating Profit | ||||||||||||||||||||||
| 2008 | 2009 | 2010 | 2008 | 2009 | 2010 | |||||||||||||||||||
| On and Off-highway segment |
$ | 1,908 | $ | 1,792 | $ | 1,991 | $ | 141 | $ | 153 | $ | 167 | ||||||||||||
| Brake South America segment |
26 | 22 | 15 | (11 | ) | (3 | ) | (8 | ) | |||||||||||||||
| Corporate, eliminations and other |
(19 | ) | (17 | ) | (15 | ) | (37 | ) | (49 | ) | (39 | ) | ||||||||||||
| $ | 1,915 | $ | 1,797 | $ | 1,991 | $ | 93 | $ | 101 | $ | 120 | |||||||||||||
| (Dollars in millions) | Total Assets | |||||||
| 2009 | 2010 | |||||||
| On and Off-highway segment |
$ | 1,318 | $ | 1,417 | ||||
| Brake South America segment |
8 | — | ||||||
| Corporate, eliminations and other |
102 | 172 | ||||||
| Assets of discontinued operations |
55 | — | ||||||
| $ | 1,483 | $ | 1,589 | |||||
| (Dollars in millions) | Depreciation and Amortization |
Capital Expenditures | ||||||||||||||||||||||
| 2008 | 2009 | 2010 | 2008 | 2009 | 2010 | |||||||||||||||||||
| On and Off-highway segment |
$ | 22 | $ | 24 | $ | 27 | $ | 20 | $ | 27 | $ | 50 | ||||||||||||
| Brake South America segment |
1 | 1 | — | 1 | 1 | — | ||||||||||||||||||
| Corporate, eliminations and other |
11 | 11 | 10 | 2 | — | 2 | ||||||||||||||||||
| Total from continuing operations |
34 | 36 | 37 | 23 | 28 | 52 | ||||||||||||||||||
| Discontinued operations |
2 | 2 | — | 2 | 3 | — | ||||||||||||||||||
| $ | 36 | $ | 38 | $ | 37 | $ | 25 | $ | 31 | $ | 52 | |||||||||||||
Net sales by geographic region were as follows:
| (Dollars in millions) | Year Ended December 31, 2008 |
Year Ended December 31, 2009 |
Year Ended December 31, 2010 |
|||||||||
| Brazil |
$ | 356 | $ | 321 | $ | 414 | ||||||
| Canada |
143 | 145 | 142 | |||||||||
| Poland |
109 | 118 | 140 | |||||||||
| Other Countries |
167 | 139 | 143 | |||||||||
| Total Other Countries |
775 | 723 | 839 | |||||||||
| United States |
1,140 | 1,074 | 1,152 | |||||||||
| $ | 1,915 | $ | 1,797 | $ | 1,991 | |||||||
77
Table of Contents
Long-lived assets by geographic region were as follows:
| (Dollars in millions) | December 31, 2009 |
December 31, 2010 |
||||||
| Canada |
$ | 11 | $ | 15 | ||||
| China |
71 | 76 | ||||||
| Brazil |
10 | 13 | ||||||
| Other Countries |
51 | 66 | ||||||
| Total other countries |
143 | 170 | ||||||
| United States |
272 | 285 | ||||||
| $ | 415 | $ | 455 | |||||
Net sales by geographic area were determined based on origin of sale. Geographic data on long-lived assets are comprised of property, plant and equipment, goodwill, other intangible assets and deferred financing costs.
We offer primarily three types of products: brake products, which include brake drums, rotors, pads and shoes and hydraulic brake system components; filtration products, which include oil, fuel, air and other filters; and chassis products, which include steering, suspension and driveline components. Additionally, we have Commercial Distribution South America products, which offer brake, chassis, filtration and other products. The Company’s sales by group of similar products are as follows:
| (Dollars in millions) | Year Ended December 31, 2008 |
Year Ended December 31, 2009 |
Year Ended December 31, 2010 |
|||||||||
| Brake products |
$ | 684 | $ | 615 | $ | 648 | ||||||
| Filtration products |
727 | 713 | 759 | |||||||||
| Chassis products |
155 | 153 | 169 | |||||||||
| Commercial Distribution South America products |
368 | 333 | 430 | |||||||||
| Corporate, eliminations and other |
(19 | ) | (17 | ) | (15 | ) | ||||||
| $ | 1,915 | $ | 1,797 | $ | 1,991 | |||||||
Note 22. Asset Retirement Obligations
We account for the fair value of an ARO in the period in which it is incurred if it can be reasonably estimated, with the offsetting associated asset retirement costs capitalized as part of the carrying amount of the long-lived assets. The asset retirement cost is subsequently allocated to expense using a systematic and rational method over its useful life. Changes in the ARO resulting from the passage of time are recognized as an increase in the carrying amount of the liability and as accretion expense, which is included in depreciation and amortization expense in the consolidated statements of operations. Changes resulting from revisions to the timing or amount of the original estimate of cash flows are recognized as an increase or a decrease in the asset retirement cost and ARO. The ARO recorded at December 31, 2009 and December 31, 2010 was $2 million.
Note 23. Derivatives
The Company’s financial derivative assets and liabilities consist of standard currency forward contracts. The fair value framework requires the categorization of assets and liabilities into three levels based upon the assumptions (inputs) used to price the assets or liabilities. Level 1 provides the most reliable measure of fair value, whereas Level 3 generally requires significant management judgment. The three levels are defined as follows:
| • | Level 1: Unadjusted quoted prices in active markets for identical assets and liabilities. |
| • | Level 2: Observable inputs other than those included in Level 1. For example, quoted prices for similar assets or liabilities in active markets or quoted prices for identical assets or liabilities in inactive markets. |
| • | Level 3: Unobservable inputs reflecting management’s own assumptions about the inputs used in pricing the asset or liability. |
78
Table of Contents
All derivative instruments are recognized on our balance sheet at fair value. The fair value measurements of our currency derivatives are based upon Level 2 inputs consisting of observable market data pertaining to relevant currency exchange rates, as reported by a recognized independent third-party financial information provider. Based upon the Company’s periodic assessment of our own creditworthiness, and of the counterparties to our derivative instruments’ fair value measurements are not adjusted for nonperformance risk.
Currency Rate Derivatives
Our currency derivative contracts are valued using then-current spot and forward market data as provided by external financial institutions. We enter into short-term hedging transactions with banking institutions of only the highest tiered credit ratings and thus the counterparty credit risk associated with these contracts is not considered significant.
Our currency derivatives are undesignated hedges of specific monetary asset balances subject to currency revaluation. Changes in the fair value of these hedging transactions are recognized in income each accounting period. At December 31, 2010, the aggregate notional amount of our currency derivatives was $121 million having a fair market value of $1 million in assets and less than $1 million in liabilities.
The Company’s outstanding currency forward contracts are recorded in the Consolidated Balance Sheets as “Other current assets” or “Other accrued expenses,” accordingly. Currency derivative gains and losses are recognized in “Other income, net” in the Consolidated Statements of Operations in the reporting period of occurrence. The Company has not recorded currency derivative gains (losses) to other comprehensive income (loss) nor has it reclassified prior period currency derivative results from other comprehensive income (loss) to earning during the last twelve months. The Company does not anticipate that it will record any currency derivative gains or losses to other comprehensive income (loss) or that it will reclassify prior period currency derivative results from other comprehensive income (loss) to earnings in the next twelve months.
The notional amount and fair value of our outstanding currency forward contracts were as follows:
| (Dollars in millions) | Notional Amount |
Asset Derivative |
Liability Derivative |
|||||||||
| As of December 31, 2010 |
$ | 121 | $ | 1 | $ | — | ||||||
| As of December 31, 2009 |
$ | 133 | $ | — | $ | — | ||||||
Note 24. Financial Information for Guarantors and Non-Guarantors
Affinia Group Intermediate Holdings Inc. (presented as Parent in the following schedules), through its 100%-owned subsidiary, Affinia Group Inc. (presented as Issuer in the following schedules), issued the Secured Notes on August 13, 2009 in the principal amount of $225 million and Subordinated Notes on November 30, 2004 in the principal amount of $300 million with an additional $100 million in principal amount issued December 9, 2010. As of December 31, 2010 there were $367 million and $200 million of Subordinated Notes and Secured Notes outstanding, respectively. The notes were offered only to qualified institutional buyers and certain persons in offshore transactions.
The Secured Notes are fully, unconditionally and jointly and severally guaranteed on a senior secured basis and the Subordinated Notes are fully, unconditionally and jointly and severally guaranteed on an unsecured senior subordinated basis. The Subordinated Notes are general obligations of Affinia Group Inc. and guaranteed by the Parent and all of Affinia Group Inc.’s wholly owned current and future domestic subsidiaries (the “Guarantors”). Affinia Group Inc.’s obligations under the Secured Notes are guaranteed by the Guarantors and are secured by first-priority liens, subject to permitted liens and exceptions for excluded assets, on substantially all of Affinia Group Inc.’s and the Guarantors’ tangible and intangible assets (excluding the ABL Collateral as defined below), including real property, fixtures and equipment owned or acquired in the future by Affinia Group Inc. and the Guarantors (the “Non-ABL Collateral”) and are secured by second-priority liens on all accounts receivable, inventory, cash, deposit accounts, securities accounts and proceeds of the foregoing and certain assets related thereto held by Affinia Group Inc. and the Guarantors, which constitute collateral under the ABL Revolver on a first-priority basis (the “ABL Collateral”).
The following information presents Condensed Consolidating Statements of Operations for the years ended December 31, 2008, December 31, 2009, December 31, 2010, Condensed Consolidating Balance Sheets as of December 31, 2009 and December 31, 2010 and Condensed Consolidating Statements of Cash Flows for the years ended December 31, 2008, December 31, 2009, December 31, 2010 and of (1) Affinia Group Intermediate Holdings Inc., (2) Affinia Group Inc., (3) the Guarantors, (4) the Non-Guarantors, and (5) eliminations to arrive at the information for the Company on a consolidated basis. Other separate financial statements and other disclosures concerning the Parent and the Guarantors are not presented because management does not believe that such information is material to investors.
79
Table of Contents
Affinia Group Intermediate Holdings Inc.
Supplemental Guarantor
Consolidating Statement of Operations
For the Year Ended December 31, 2008
| (Dollars in millions) | Parent | Issuer | Guarantor | Non- Guarantor |
Eliminations | Consolidated total |
||||||||||||||||||
| Net sales |
$ | — | $ | — | $ | 1,269 | $ | 941 | $ | (295 | ) | $ | 1,915 | |||||||||||
| Cost of sales |
— | — | (1,072 | ) | (769 | ) | 295 | (1,546 | ) | |||||||||||||||
| Gross profit |
— | — | 197 | 172 | — | 369 | ||||||||||||||||||
| Selling, general, and administrative expenses |
— | (29 | ) | (147 | ) | (100 | ) | — | (276 | ) | ||||||||||||||
| Operating (loss) profit |
— | (29 | ) | 50 | 72 | — | 93 | |||||||||||||||||
| Other income (loss), net |
— | 23 | (25 | ) | (1 | ) | — | (3 | ) | |||||||||||||||
| Interest expense |
— | (55 | ) | — | (1 | ) | — | (56 | ) | |||||||||||||||
| Income from continuing operations before income tax provision, equity in income and noncontrolling interest |
— | (61 | ) | 25 | 70 | — | 34 | |||||||||||||||||
| Income tax benefit (provision) |
— | 5 | — | (23 | ) | — | (18 | ) | ||||||||||||||||
| Income (loss) from continuing operations |
— | (56 | ) | 25 | 47 | — | 16 | |||||||||||||||||
| Equity in income, net of tax |
(3 | ) | 53 | 28 | — | (78 | ) | — | ||||||||||||||||
| Net income from continuing operations |
(3 | ) | (3 | ) | 53 | 47 | (78 | ) | 16 | |||||||||||||||
| (Loss) from discontinued operations, net of tax |
— | — | — | (19 | ) | — | (19 | ) | ||||||||||||||||
| Net (loss) income |
(3 | ) | (3 | ) | 53 | 28 | (78 | ) | (3 | ) | ||||||||||||||
| Less: Net loss attributable to noncontrolling interest, net of tax |
— | — | — | — | — | — | ||||||||||||||||||
| Net (loss) income attributable to the company |
$ | (3 | ) | $ | (3 | ) | $ | 53 | $ | 28 | $ | (78 | ) | $ | (3 | ) | ||||||||
80
Table of Contents
Affinia Group Intermediate Holdings Inc.
Supplemental Guarantor
Consolidating Statement of Operations
For the Year Ended December 31, 2009
| (Dollars in millions) | Parent | Issuer | Guarantor | Non- Guarantor |
Eliminations | Consolidated total |
||||||||||||||||||
| Net sales |
$ | — | $ | — | $ | 1,181 | $ | 943 | $ | (327 | ) | $ | 1,797 | |||||||||||
| Cost of sales |
— | — | (987 | ) | (769 | ) | 327 | (1,429 | ) | |||||||||||||||
| Gross profit |
— | — | 194 | 174 | — | 368 | ||||||||||||||||||
| Selling, general and administrative expenses |
— | (43 | ) | (132 | ) | (92 | ) | — | (267 | ) | ||||||||||||||
| Operating (loss) profit |
— | (43 | ) | 62 | 82 | — | 101 | |||||||||||||||||
| Gain on extinguishment of debt |
— | 8 | — | — | — | 8 | ||||||||||||||||||
| Other income (loss), net |
— | 18 | (16 | ) | 3 | — | 5 | |||||||||||||||||
| Interest expense |
— | (67 | ) | — | (2 | ) | — | (69 | ) | |||||||||||||||
| Income from continuing operations before income tax provision, equity in income and noncontrolling interest |
— | (84 | ) | 46 | 83 | — | 45 | |||||||||||||||||
| Income tax provision |
— | (10 | ) | — | (12 | ) | — | (22 | ) | |||||||||||||||
| Equity in income, net of tax |
(44 | ) | 54 | 11 | 1 | (21 | ) | 1 | ||||||||||||||||
| Net income from continuing operation |
(44 | ) | (40 | ) | 57 | 72 | (21 | ) | 24 | |||||||||||||||
| (Loss) from discontinued operations, net of tax |
— | — | — | (61 | ) | — | (61 | ) | ||||||||||||||||
| Net (loss) income |
$ | (44 | ) | $ | (40 | ) | $ | 57 | $ | 11 | $ | (21 | ) | $ | (37 | ) | ||||||||
| Less: net income attributable to noncontrolling interest, net of tax |
— | 4 | 3 | — | — | 7 | ||||||||||||||||||
| Net income (loss) attributable to the Company |
$ | (44 | ) | $ | (44 | ) | $ | 54 | $ | 11 | $ | (21 | ) | $ | (44 | ) | ||||||||
81
Table of Contents
Affinia Group Intermediate Holdings Inc.
Supplemental Guarantor
Consolidating Statement of Operations
For the Year Ended December 31, 2010
| (Dollars in millions) | Parent | Issuer | Guarantor | Non- Guarantor |
Eliminations | Consolidated total |
||||||||||||||||||
| Net sales |
$ | — | $ | — | $ | 1,255 | $ | 1,078 | $ | (342 | ) | $ | 1,991 | |||||||||||
| Cost of sales |
— | — | (1,059 | ) | (864 | ) | 342 | (1,581 | ) | |||||||||||||||
| Gross profit |
— | — | 196 | 214 | — | 410 | ||||||||||||||||||
| Selling, general and administrative expenses |
— | (32 | ) | (145 | ) | (113 | ) | — | (290 | ) | ||||||||||||||
| Operating (loss) profit |
— | (32 | ) | 51 | 101 | — | 120 | |||||||||||||||||
| Loss on extinguishment of debt |
— | (1 | ) | — | — | — | (1 | ) | ||||||||||||||||
| Other income (loss), net |
— | 17 | (15 | ) | 1 | — | 3 | |||||||||||||||||
| Interest expense |
— | (64 | ) | — | (2 | ) | — | (66 | ) | |||||||||||||||
| Income from continuing operations before income tax provision, equity in income and noncontrolling interest |
— | (80 | ) | 36 | 100 | — | 56 | |||||||||||||||||
| Income tax provision |
— | (3 | ) | — | (24 | ) | — | (27 | ) | |||||||||||||||
| Equity in income, net of tax |
24 | 109 | 77 | 1 | (210 | ) | 1 | |||||||||||||||||
| Net income from continuing operation |
24 | 26 | 113 | 77 | (210 | ) | 30 | |||||||||||||||||
| Loss from discontinued operations, net of tax |
— | — | — | — | — | — | ||||||||||||||||||
| Net income |
$ | 24 | $ | 26 | $ | 113 | $ | 77 | $ | (210 | ) | $ | 30 | |||||||||||
| Less: net income attributable to noncontrolling interest, net of tax |
— | 2 | 4 | — | — | 6 | ||||||||||||||||||
| Net income attributable to the Company |
$ | 24 | $ | 24 | $ | 109 | $ | 77 | $ | (210 | ) | $ | 24 | |||||||||||
82
Table of Contents
Affinia Group Intermediate Holdings Inc.
Supplemental Guarantor
Consolidating Balance Sheet
December 31, 2009
| (Dollars in millions) |
Parent | Issuer | Guarantor | Non-Guarantor | Eliminations | Consolidated Total |
||||||||||||||||||
| Assets |
||||||||||||||||||||||||
| Current assets: |
||||||||||||||||||||||||
| Cash and cash equivalents |
$ | — | $ | 9 | $ | — | $ | 56 | $ | — | $ | 65 | ||||||||||||
| Restricted cash |
— | — | — | 9 | — | 9 | ||||||||||||||||||
| Accounts receivable |
— | 1 | 168 | 124 | — | 293 | ||||||||||||||||||
| Inventories |
— | — | 256 | 174 | — | 430 | ||||||||||||||||||
| Other current assets |
— | 51 | 4 | 66 | — | 121 | ||||||||||||||||||
| Current assets of discontinued operations |
— | — | — | 55 | — | 55 | ||||||||||||||||||
| Total current assets |
— | 61 | 428 | 484 | — | 973 | ||||||||||||||||||
| Investments and other assets |
— | 228 | 20 | 63 | — | 311 | ||||||||||||||||||
| Intercompany investments |
391 | 1,147 | 278 | — | (1,816 | ) | — | |||||||||||||||||
| Intercompany receivables |
— | (366 | ) | 497 | (131 | ) | — | — | ||||||||||||||||
| Property, plant and equipment, net |
— | 5 | 91 | 103 | — | 199 | ||||||||||||||||||
| Total assets |
$ | 391 | $ | 1,075 | $ | 1,314 | $ | 519 | $ | (1,816 | ) | $ | 1,483 | |||||||||||
| Liabilities and Equity |
||||||||||||||||||||||||
| Current liabilities: |
||||||||||||||||||||||||
| Accounts payable |
$ | — | $ | 15 | $ | 109 | $ | 77 | $ | — | $ | 201 | ||||||||||||
| Notes payable |
— | — | — | 12 | — | 12 | ||||||||||||||||||
| Accrued payroll and employee benefits |
— | 11 | 5 | 11 | — | 27 | ||||||||||||||||||
| Other accrued liabilities |
— | 22 | 53 | 79 | — | 154 | ||||||||||||||||||
| Current liabilities of discontinued operations |
— | — | — | 43 | — | 43 | ||||||||||||||||||
| Total current liabilities |
— | 48 | 167 | 222 | — | 437 | ||||||||||||||||||
| Deferred employee benefits and noncurrent liabilities |
— | 11 | — | 9 | — | 20 | ||||||||||||||||||
| Long-term debt |
— | 579 | — | 10 | — | 589 | ||||||||||||||||||
| Total liabilities |
— | 638 | 167 | 241 | — | 1,046 | ||||||||||||||||||
| Total shareholder’s equity |
391 | 437 | 1,147 | 278 | (1,816 | ) | 437 | |||||||||||||||||
| Total liabilities and equity |
$ | 391 | $ | 1,075 | $ | 1,314 | $ | 519 | $ | (1,816 | ) | $ | 1,483 | |||||||||||
83
Table of Contents
Affinia Group Intermediate Holdings Inc.
Supplemental Guarantor
Consolidating Balance Sheet
December 31, 2010
| (Dollars in millions) |
Parent | Issuer | Guarantor | Non-Guarantor | Eliminations | Consolidated Total |
||||||||||||||||||
| Assets |
||||||||||||||||||||||||
| Current assets: |
||||||||||||||||||||||||
| Cash and cash equivalents |
$ | — | $ | 9 | $ | 3 | $ | 43 | $ | — | $ | 55 | ||||||||||||
| Restricted cash |
— | — | — | 12 | — | 12 | ||||||||||||||||||
| Accounts receivable |
— | — | 177 | 139 | — | 316 | ||||||||||||||||||
| Inventories |
— | — | 323 | 197 | — | 520 | ||||||||||||||||||
| Other current assets |
— | 34 | 4 | 75 | — | 113 | ||||||||||||||||||
| Total current assets |
— | 43 | 507 | 466 | — | 1,016 | ||||||||||||||||||
| Investments and other assets |
— | 254 | 38 | 64 | — | 356 | ||||||||||||||||||
| Intercompany investments |
436 | 1,209 | 345 | — | (1,990 | ) | — | |||||||||||||||||
| Intercompany receivables |
— | (349 | ) | 446 | (97 | ) | — | — | ||||||||||||||||
| Property, plant and equipment, net |
— | 3 | 90 | 124 | — | 217 | ||||||||||||||||||
| Total assets |
$ | 436 | $ | 1,160 | $ | 1,426 | $ | 557 | $ | (1,990 | ) | $ | 1,589 | |||||||||||
| Liabilities and Equity |
||||||||||||||||||||||||
| Current liabilities: |
||||||||||||||||||||||||
| Accounts payable |
$ | — | $ | 15 | $ | 149 | $ | 80 | $ | — | $ | 244 | ||||||||||||
| Notes payable |
— | — | — | 27 | — | 27 | ||||||||||||||||||
| Accrued payroll and employee benefits |
— | 10 | 7 | 16 | — | 33 | ||||||||||||||||||
| Other accrued liabilities |
— | 21 | 60 | 70 | — | 151 | ||||||||||||||||||
| Total current liabilities |
— | 46 | 216 | 193 | — | 455 | ||||||||||||||||||
| Deferred employee benefits and noncurrent liabilities |
— | 8 | — | 9 | — | 17 | ||||||||||||||||||
| Long-term debt |
— | 658 | — | 11 | — | 669 | ||||||||||||||||||
| Total liabilities |
— | 712 | 216 | 213 | — | 1,141 | ||||||||||||||||||
| Total shareholder’s equity |
436 | 448 | 1,210 | 344 | (1,990 | ) | 448 | |||||||||||||||||
| Total liabilities and equity |
$ | 436 | $ | 1,160 | $ | 1,426 | $ | 557 | $ | (1,990 | ) | $ | 1,589 | |||||||||||
84
Table of Contents
Affinia Group Intermediate Holdings Inc.
Supplemental Guarantor
Consolidating Statement of Cash Flows
For the Year Ended December 31, 2008
| (Dollars in millions) |
Parent | Issuer | Guarantor | Non-Guarantor | Elimination | Consolidated Total |
||||||||||||||||||
| Operating activities |
||||||||||||||||||||||||
| Net cash (used in) provided by operating activities |
— | 37 | 16 | (5 | ) | — | 48 | |||||||||||||||||
| Investing activities |
||||||||||||||||||||||||
| Proceeds from sale of assets |
— | — | — | 1 | — | 1 | ||||||||||||||||||
| Investments in companies, net of cash acquired |
— | (50 | ) | — | — | — | (50 | ) | ||||||||||||||||
| Proceeds from sale of affiliates |
— | 3 | — | 3 | — | 6 | ||||||||||||||||||
| Investments in affiliates |
— | — | (6 | ) | — | — | (6 | ) | ||||||||||||||||
| Change in restricted cash |
— | — | — | (1 | ) | — | (1 | ) | ||||||||||||||||
| Additions to property, plant and equipment, net |
— | (1 | ) | (11 | ) | (13 | ) | — | (25 | ) | ||||||||||||||
| Other investing activities |
— | — | — | — | — | — | ||||||||||||||||||
| Net cash used in investing activities |
— | (48 | ) | (17 | ) | (10 | ) | — | (75 | ) | ||||||||||||||
| Financing activities |
||||||||||||||||||||||||
| Short-term debt, net |
— | — | — | — | — | — | ||||||||||||||||||
| Proceeds from long-term debt |
— | — | — | 1 | — | 1 | ||||||||||||||||||
| Payment of long-term debt |
— | — | — | — | — | — | ||||||||||||||||||
| Capital contribution |
— | 50 | — | — | — | 50 | ||||||||||||||||||
| Net transactions with Parent |
— | — | — | — | — | — | ||||||||||||||||||
| Net cash provided by (used in) financing activities of continuing operations |
— | 50 | — | 1 | — | 51 | ||||||||||||||||||
| Net cash used in financing activities of discontinued operations |
— | — | — | — | — | — | ||||||||||||||||||
| Net cash provided by (used in) financing activities |
— | 50 | — | 1 | — | 51 | ||||||||||||||||||
| Effect of exchange rates on cash |
— | — | — | (6 | ) | — | (6 | ) | ||||||||||||||||
| Change in cash and cash equivalents |
— | 39 | (1 | ) | (20 | ) | — | 18 | ||||||||||||||||
| Cash and cash equivalents at beginning of period |
— | 20 | 1 | 38 | — | 59 | ||||||||||||||||||
| Cash and cash equivalents at end of period |
$ | — | $ | 59 | $ | — | $ | 18 | $ | — | $ | 77 | ||||||||||||
85
Table of Contents
Affinia Group Intermediate Holdings Inc.
Supplemental Guarantor
Consolidating Statement of Cash Flows
For the Year Ended December 31, 2009
| (Dollars in millions) |
Parent | Issuer | Guarantor | Non-Guarantor | Elimination | Consolidated Total |
||||||||||||||||||
| Operating activities |
||||||||||||||||||||||||
| Net cash (used in) provided by operating activities |
— | (18 | ) | 15 | 58 | — | 55 | |||||||||||||||||
| Investing activities |
||||||||||||||||||||||||
| Proceeds from sale of assets |
— | — | — | — | — | — | ||||||||||||||||||
| Investments in companies, net of cash acquired |
— | — | — | — | — | — | ||||||||||||||||||
| Proceeds from sale of affiliates |
— | — | — | — | — | — | ||||||||||||||||||
| Investments in affiliates |
— | — | — | — | — | — | ||||||||||||||||||
| Change in restricted cash |
— | — | — | (5 | ) | — | (5 | ) | ||||||||||||||||
| Additions to property, plant and equipment, net |
— | — | (15 | ) | (16 | ) | — | (31 | ) | |||||||||||||||
| Net cash used in investing activities |
— | — | (15 | ) | (21 | ) | — | (36 | ) | |||||||||||||||
| Financing activities |
||||||||||||||||||||||||
| Short-term debt, net |
— | — | — | — | — | — | ||||||||||||||||||
| Net decrease in debt of noncontrolling interest |
— | — | — | (3 | ) | — | (3 | ) | ||||||||||||||||
| Payments on senior term loan facility |
— | (297 | ) | — | — | — | (297 | ) | ||||||||||||||||
| Payment of deferred financing costs |
— | (22 | ) | — | — | — | (22 | ) | ||||||||||||||||
| Proceeds from Secured Notes |
— | 222 | — | — | — | 222 | ||||||||||||||||||
| Net proceeds from ABL Revolver |
— | 90 | — | — | — | 90 | ||||||||||||||||||
| Purchase of noncontrolling interest |
— | (25 | ) | — | — | — | (25 | ) | ||||||||||||||||
| Net cash provided by (used in) financing activities of continuing operations |
— | (32 | ) | — | (3 | ) | — | (35 | ) | |||||||||||||||
| Effect of exchange rates on cash |
— | — | — | 4 | — | 4 | ||||||||||||||||||
| Change in cash and cash equivalents |
— | (50 | ) | — | 38 | — | (12 | ) | ||||||||||||||||
| Cash and cash equivalents at beginning of period |
— | 59 | — | 18 | — | 77 | ||||||||||||||||||
| Cash and cash equivalents at end of period |
$ | — | $ | 9 | $ | — | $ | 56 | $ | — | $ | 65 | ||||||||||||
86
Table of Contents
Affinia Group Intermediate Holdings Inc.
Supplemental Guarantor
Consolidating Statement of Cash Flows
For the Year Ended December 31, 2010
| (Dollars in millions) |
Parent | Issuer | Guarantor | Non-Guarantor | Elimination | Consolidated Total |
||||||||||||||||||
| Operating activities |
||||||||||||||||||||||||
| Net cash (used in) provided by operating activities |
— | (57 | ) | 75 | 5 | — | 23 | |||||||||||||||||
| Investing activities |
||||||||||||||||||||||||
| Proceeds from sales of assets |
— | — | — | 1 | — | 1 | ||||||||||||||||||
| Investments in companies, net of cash acquired |
— | — | (51 | ) | — | — | (51 | ) | ||||||||||||||||
| Proceeds from sale of affiliates |
— | 11 | — | — | — | 11 | ||||||||||||||||||
| Change in restricted cash |
— | — | — | (3 | ) | — | (3 | ) | ||||||||||||||||
| Additions to property, plant, and equipment |
— | (2 | ) | (17 | ) | (33 | ) | — | (52 | ) | ||||||||||||||
| Other investing activities |
— | — | (4 | ) | — | — | (4 | ) | ||||||||||||||||
| Net cash provided by (used in) investing activities |
— | 9 | (72 | ) | (35 | ) | — | (98 | ) | |||||||||||||||
| Financing activities |
||||||||||||||||||||||||
| Net increase in other short-term debt |
— | — | — | 13 | — | 13 | ||||||||||||||||||
| Proceeds from other debt |
— | — | — | 2 | — | 2 | ||||||||||||||||||
| Proceeds from Subordinated Notes |
— | 100 | — | — | — | 100 | ||||||||||||||||||
| Repayment on Secured Notes |
— | (23 | ) | — | — | — | (23 | ) | ||||||||||||||||
| Capital contribution |
— | — | — | 3 | — | 3 | ||||||||||||||||||
| Payment of deferred financing costs |
— | (5 | ) | — | — | — | (5 | ) | ||||||||||||||||
| Purchase of noncontrolling interest |
— | (24 | ) | — | — | — | (24 | ) | ||||||||||||||||
| Net cash provided by financing activities |
— | 48 | — | 18 | — | 66 | ||||||||||||||||||
| Effect of exchange rates on cash |
— | — | — | (1 | ) | — | (1 | ) | ||||||||||||||||
| Change in cash and cash equivalents |
— | — | 3 | (13 | ) | — | (10 | ) | ||||||||||||||||
| Cash and cash equivalents at beginning of period |
— | 9 | — | 56 | — | 65 | ||||||||||||||||||
| Cash and cash equivalents at end of period |
$ | — | $ | 9 | $ | 3 | $ | 43 | $ | — | $ | 55 | ||||||||||||
87
Table of Contents
| Item 9. | Changes in and Disagreements With Accountants on Accounting and Financial Disclosure. |
Not applicable.
| Item 9A. | Controls and Procedures |
Conclusion Regarding the Effectiveness of Disclosure Controls and Procedures
We maintain disclosure controls and procedures that are designed to ensure that information required to be disclosed in our reports under the Securities Exchange Act of 1934, as amended (the “Exchange Act”) is recorded, processed, summarized and reported within the time periods specified in the Securities and Exchange Commission’s rules and forms, and that such information is accumulated and communicated to our management, including our principal executive officer and principal financial officer, as appropriate, to allow timely decisions regarding required disclosures. Any controls and procedures, no matter how well designed and operated, can provide only reasonable assurance of achieving the desired control objectives. Under the supervision and with the participation of our management, including our principal executive officer and principal financial officer, we conducted an evaluation of our disclosure controls and procedures, as such term is defined under Rule 13a-15(e) promulgated under the Exchange Act. Based on this evaluation, our principal executive officer and our principal financial officer concluded that our disclosure controls and procedures were effective at the reasonable assurance level as of December 31, 2010, the end of the period covered by this annual report.
Management’s Report on Internal Control over Financial Reporting
Management of the Company is responsible for establishing and maintaining adequate internal control over financial reporting, as such term is defined in Exchange Act Rule 13a-15(f), and for the assessment of the effectiveness of internal control over financial reporting. As defined by the Securities and Exchange Commission, internal control over financial reporting is a process designed by, or under the supervision of, the Company’s principal executive and principal financial officers and effected by the Company’s Board of Directors, management, and other personnel, to provide reasonable assurance regarding the reliability of financial reporting and the preparation of the consolidated financial statements in accordance with U.S. generally accepted accounting principles.
The Company’s internal control over financial reporting is supported by written policies and procedures that: (1) pertain to the maintenance of records that, in reasonable detail, accurately and fairly reflect the Company’s transactions and dispositions of the Company’s assets; (2) provide reasonable assurance that transactions are recorded as necessary to permit preparation of the consolidated financial statements in accordance with U.S. generally accepted accounting principles, and that receipts and expenditures of the Company are being made only in accordance with authorizations of the Company’s management and directors; and (3) provide reasonable assurance regarding prevention or timely detection of unauthorized acquisition, use or disposition of the Company’s assets that could have a material effect on the consolidated financial statements.
Because of its inherent limitations, internal control over financial reporting may not prevent or detect misstatements. Also, projections of any evaluation of effectiveness to future periods are subject to the risk that controls may become inadequate because of changes in conditions, or that the degree of compliance with the policies or procedures may deteriorate.
In connection with the preparation of the Company’s annual consolidated financial statements, management has undertaken an assessment of the effectiveness of the Company’s internal control over financial reporting as of December 31, 2010, based on criteria established in Internal Control-Integrated Framework issued by the Committee of Sponsoring Organizations of the Treadway Commission (the “COSO Framework”). Management’s assessment included an evaluation of the design of the Company’s internal control over financial reporting and testing of the operational effectiveness of those controls.
Based on this assessment, management has concluded that as of December 31, 2010, the Company’s internal control over financial reporting was effective to provide reasonable assurance regarding the reliability of financial reporting and the preparation of financial statements for external purposes in accordance with U.S. generally accepted accounting principles.
Changes in Internal Control over Financial Reporting. There were no changes in our internal control over financial reporting during our fourth quarter of 2010 that have materially affected, or are reasonably likely to materially affect, our internal control over financial reporting.
| Item 9B. | Other Information |
None.
88
Table of Contents
PART III
Item 10. Directors, Executive Officers and Corporate Governance
Set forth below is certain information concerning the individuals serving as our executive officers and members of our Board, including their ages as of March 11, 2011.
| Name |
Age | Position |
||||||
| Terry R. McCormack |
60 | President, Chief Executive Officer and Director | ||||||
| Thomas H. Madden |
61 | Senior Vice President and Chief Financial Officer | ||||||
| H. David Overbeeke |
49 | President, Global Brake & Chassis Group | ||||||
| Keith A. Wilson |
49 | President, Global Filtration Group | ||||||
| Jorge C. Schertel |
59 | President, Affinia Group S.A. | ||||||
| Steven E. Keller |
52 | Senior Vice President, General Counsel and Secretary | ||||||
| Timothy J. Zorn |
58 | Vice President, Human Resources | ||||||
| Patrick M. Manning |
38 | Vice President, Business Development | ||||||
| Kathleen G. Mehall |
59 | Vice President, Information Technology | ||||||
| William M. Lasky |
63 | Director | ||||||
| James S. McElya |
63 | Director | ||||||
| Donald J. Morrison |
50 | Director | ||||||
| Joseph A. Onorato |
62 | Director | ||||||
| Joseph E. Parzick |
55 | Director | ||||||
| John M. Riess |
68 | Director | ||||||
| James A. Stern |
60 | Director | ||||||
Terry R. McCormack has served as our President, Chief Executive Officer and a Director on our Board since December 1, 2004. He held a variety of positions at Dana from 1974 through July 2000, when he was named President of Dana’s Aftermarket Group, a position he held until November 30, 2004. Mr. McCormack holds a B.S. degree in Psychology from Ball State University. He has completed the Harvard Advanced Management Program. Mr. McCormack serves as Chairman of the board of directors of MEMA. He is also a member of the Automotive Presidents’ Group. Mr. McCormack formerly served on the boards of the University of North Carolina at Charlotte’s Belk College School of Business and Blue Persuasion, a non-profit organization.
Thomas H. Madden has served as our Senior Vice President and Chief Financial Officer since January 1, 2007. Mr. Madden previously served as our Vice President and Chief Financial Officer from December 1, 2004 until December 31, 2006. Mr. Madden formerly served as Vice President and Group Controller for the Aftermarket Group of Dana since 1998. He earned a B.B.A. in Accounting from the University of Toledo. He also attended the University of Michigan Executive Business School.
H. David Overbeeke has served as our President, Global Brake & Chassis Group since July 14, 2008, having previously served as a Director of Affinia Group Inc. from April 1, 2008 until July 13, 2008. From April 2006 until February 2010 Mr. Overbeeke served as Operating Advisor for Oak Hill Capital Partners, a private equity firm and prior to that he spent over 20 years with General Electric (“GE”) in various roles including Executive Vice President and CIO Digital Media of NBC Universal, and General Manager of Fleet Operations at GE Aviation until departing GE in December, 2005.Mr. Overbeeke earned a BSe degree in Mechanical Engineering with a minor in Business from the University of Waterloo. Mr. Overbeeke serves on the board of directors of Wilton Re, a life reinsurance company, Torque Medical Holdings, Inc. and Torque Medical, LLC, where he is also Chairman of the compensation committee. Mr. Overbeeke formerly served on the board of directors of Republic National Cabinet Corporation.
Keith A. Wilson has served as our President, Global Filtration Group since January 1, 2008, having previously served as President, Under Hood Group from January 1, 2007 until December 31, 2007. Mr. Wilson served as Vice President and General Manager of our Under Hood Group from December 1, 2004 until December 31, 2006. Prior to that, Mr. Wilson had served as Vice President and division manager of Wix Filtration Products Division of Dana. Mr. Wilson earned a B.A. in Marketing and Management from Ball State University and he is a graduate of Dana’s M.B.A. Program. He also served as Chairman of Dana’s Global Environmental Health & Safety Advisory Council.
Jorge C. Schertel has served as our President, Affinia Group S.A. since January 1, 2011, having previously served as our Vice President, Commercial Distribution, South America from January 1, 2008 until December 31, 2010. Mr. Schertel served as our Vice President and General Manager South America from June 1, 2006 to December 31, 2007 and from December 1, 2004 to May 31, 2006 as our Vice President and General Manager Brazil. Mr. Schertel earned a B.A. in Business Administration from PUC-RGS, Brazil. He also attended the Executive Management Program at Penn State University and the Executive Development Program at the University of Michigan Business School. Mr. Schertel serves on the Council Director of SINDIPECAS (Brazilian Association for Autoparts Manufacturers).
89
Table of Contents
Steven E. Keller has served as our Senior Vice President, General Counsel and Secretary since January 1, 2007. Mr. Keller served as our General Counsel and Secretary from December 1, 2004 until December 31, 2006. Prior to that, Mr. Keller served as Managing Attorney and a member of the Dana Law Department’s Operating Committee. Mr. Keller earned a B.A. in Financial Administration from Michigan State University and a J.D. from the Marshall-Wythe School of Law at the College of William and Mary. He also attended the University of Michigan Executive Business School. He is a member of the Virginia Bar.
Timothy J. Zorn has served as our Vice President, Human Resources since December 1, 2004. Mr. Zorn held the same position with the Aftermarket Group of Dana from May 16, 2003 until November 30, 2004 and was previously the Human Resources Manager of Dana’s Wix division from May 1999 until May 2003. Mr. Zorn earned his B.A. in Economics from Ohio Wesleyan University. He is a certified Senior Professional Human Resources and has served terms on the boards of directors of several charitable and educational organizations.
Patrick M. Manning has served as our Vice President, Business Development since January 1, 2009. Mr. Manning previously served as our Director, Business Development from December 1, 2004 until December 31, 2008. Mr. Manning was a Manager of Corporate Development in 2003 and Director of Business Development in 2004 at Dana. Mr. Manning earned a B.S. in Industrial Engineering from the University of Pittsburgh and an M.B.A. from Southern Connecticut State University.
Kathleen G. Mehall was recently announced as our Vice President, Information Technology. Mrs. Mehall previously worked as an independent information technology consultant in 2010, and also served as Vice President of Technology for Urban Science from 2008 until 2009. Prior to that, Mrs. Mehall served as Vice President and CIO Corporate Services for General Motors Acceptance Corporation from 2006 to 2008 and Director of CIO Planning for General Motors from 2004 to 2006. Mrs. Mehall earned a B.S. in Computer Science from Pennsylvania State University.
William M. Lasky has served as a director on our Board since January 1, 2011. Mr. Lasky is currently Chairman of the Board of Accuride Corporation. He has served as a member of Accuride Corporation’s Board of Directors since 2007 and as Chairman since 2009. In addition to his board service, Mr. Lasky served as President and Chief Executive Officer of Accuride Corporation from September 2008 until February 2011. Mr. Lasky is also Chairman of the Board for Stoneridge, Inc. Previously, he served as Chairman, President & Chief Executive Officer of JLG Industries and spent much of his career with Dana Corporation. Mr. Lasky is a graduate of both Norwich University and Harvard Business School. He has served in the United States Army as a Pilot Captain and is a member of the Board of Trustees for Norwich University.
James S. McElya has served as a director on our Board since January 1, 2011. Mr. McElya is currently Chairman and Chief Executive Officer of Cooper Standard Holdings Inc. and its principal operating company, Cooper Standard Automotive. Cooper Standard filed for protection under Chapter 11 of the United States Bankruptcy Code in August 2009 and emerged from the Chapter 11 proceedings in May 2010. Previously, he had served as Corporate Vice President of Cooper Tire & Rubber Company, the parent company of Cooper Standard, until 2004. Mr. McElya has also served as President of Siebe Automotive Worldwide and over a 22-year period held various senior management positions with Handy & Harman. Mr. McElya is a past chairman of the Motor Equipment Manufacturers Association (MEMA) and Original Equipment Supplier Association (OESA).
Donald J. Morrison has served as a Director on our Board since December 1, 2004. Mr. Morrison is a Senior Managing Director with OMERS Private Equity, which makes private equity investments on behalf of OMERS, one of Canada’s largest pension funds. Before joining OMERS, Mr. Morrison spent over ten years with PricewaterhouseCoopers LLP in Corporate Finance focusing on restructurings and turnarounds and eight years as Senior Vice President and member of the Senior Management Investment Committee with one of Canada’s largest venture capital funds originating and structuring expansion and buyout investments. Mr. Morrison has served on the boards of directors of over 20 public and private companies. Mr. Morrison earned a B. Commerce degree from the University of Toronto, is a Chartered Accountant, Chartered Insolvency and Restructuring Practitioner, and a Chartered Director.
Joseph A. Onorato has served as a Director on our Board since December 1, 2004. Mr. Onorato also serves as Chairman of the Audit Committee of our Board. Mr. Onorato was Chief Financial Officer of Echlin, Inc., where he spent 19 years. He served as Treasurer from 1990 to 1994, as Vice President and Treasurer from 1994 to 1997 and as Vice President and Chief Financial Officer from 1997 until the company was acquired by Dana in July 1998. Mr. Onorato served as Senior Vice President and Chief Financial Officer for the Aftermarket Group of Dana from July 1998 until his retirement in September 2000. Mr. Onorato previously worked for PricewaterhouseCoopers LLP. Mr. Onorato also serves on the board of directors of Mohawk Industries Inc.
90
Table of Contents
Joseph E. Parzick has served as a Director on our Board since August 12, 2008. Mr. Parzick also serves as Chairman of the Nominating Committee of our Board. Mr. Parzick is the Managing Partner of the Torque Capital Group LLC which he co-founded in 2011. From June 2003 until December 2010 he was a Managing Director of Cypress Advisors, Inc. Prior to joining Cypress, he spent the previous four years as a Managing Director in Morgan Stanley’s financial sponsor group. Immediately prior to this, he was a professional employee of EXOR America Inc., a merchant banking affiliate of the Agnelli Group and Lehman Brothers, where he was a Managing Director and co-head of the financial sponsors group. He earned a B.S. degree from the University of Virginia and an M.B.A. from the University of Pennsylvania’s Wharton School. Mr. Parzick also serves on the boards of directors of Financial Guaranty Insurance Company, Republic National Cabinet Group, and Q.bel Foods, LLC, and is Chairman of the board of directors of Torque Medical Holdings, Inc. and Torque Medical, LLC. Mr. Parzick formerly served on the boards of Danka Business Systems PLC and Stone Canyon Entertainment Corporation.
John M. Riess has served as a Director on our Board since December 1, 2004. Mr. Riess was elected Lead Director on December 2, 2010. He formerly served as Chairman and Chief Executive Officer of Breed Technologies, Inc. from 2000 to 2003 when he retired. Prior to this, Mr. Riess held various management and executive positions within the Gates Rubber Company, serving as Chairman of the Board of Directors and Chief Executive Officer from 1997 to 1999. Mr. Riess also serves on the board of directors of Formed Fiber Technologies, Inc. where he is Chairman of the audit committee and a member of the compensation committee. He formerly served as chairman of the board of directors of Breed Technologies, Inc.
James A. Stern has served as a Director on our Board since December 1, 2004. On December 2, 2010, Mr. Stern was elected Chairman of our Board. Mr. Stern also serves as Chairman of the Compensation Committee of our Board. Mr. Stern is Chairman and Chief Executive Officer of Cypress, a position he has held since 1994. Mr. Stern headed Lehman Brothers’ Merchant Banking Group before leaving that firm to help found Cypress. During his 20-year tenure with Lehman, he held senior management positions where he was responsible for the high yield and primary capital markets groups. He also served as co-head of investment banking and was a member of Lehman’s operating committee. Before graduating from Harvard Business School, Mr. Stern earned a B.S. from Tufts University, where he is Chairman of the Board of Trustees. Mr. Stern formerly served on the boards of Lear Corporation, AMTROL, Inc., Med Pointe, Inc., and Cooper-Standard Automotive Inc.
Section 16(a) Beneficial Ownership Reporting Compliance
Not Applicable.
Board Composition and Director Qualifications
Our Board currently consists of one class of eight directors who serve until resignation or removal. The Board seeks to ensure that it is composed of members whose particular experience, qualifications, attributes and skills, when taken together, will allow the Board to satisfy its oversight responsibilities effectively. In that regard, the Nominating Committee is responsible for recommending candidates for all directorships to be filled by the Board. In identifying candidates for membership on the Board, the Nominating Committee takes into account (1) minimum individual qualifications, such as high ethical standards, integrity, maturity, careful judgment, industry knowledge or experience and an ability to work collegially with the other members of the Board and (2) all other factors that it considers appropriate, including alignment with our stockholders, especially Cypress, OMERS and others.
When considering whether the Board’s directors and nominees have the experience, qualifications, attributes and skills, taken as a whole, to enable the Board to satisfy its oversight responsibilities effectively in light of Company’s business and structure, the Board focused primarily on the information discussed in each of the Board members’ or nominees’ biographical information set forth above.
Each of the Company’s directors possesses high ethical standards, acts with integrity and exercises careful, mature judgment. Each is committed to employing his skills and abilities to aid the long-term interests of the stakeholders of the Company. In addition, our directors are knowledgeable and experienced in one or more business endeavors which further qualifies them for service as members of the Board.
Pursuant to the Stockholders Agreement dated as of November 30, 2004, among Affinia Group Holdings Inc., various Cypress funds, OMERS, The Northwestern Mutual Life Insurance Company, California State Teachers’ Retirement System and Stockwell Fund, L.P., the number of directors serving on the Board of Directors will be no less than seven and no more than eleven. The Stockholders Agreement entitles Cypress to designate three directors. Cypress currently has appointed, Mr. Stern, Mr. Parzick and Mr. McElya. As long as OMERS members own at least 50 percent in the aggregate number of shares owned by them on November 30, 2004, OMERS is entitled to designate one director, who currently is Mr. Morrison. Cypress is entitled to designate three directors not affiliated with any of the parties to the Stockholders Agreement, who currently are Mr. Onorato, Mr. Riess and Mr. Lasky. Additionally, the Stockholders Agreement entitles the individual serving as CEO, currently Mr. McCormack, and another individual serving as one of our senior officers, currently vacant, to seats on the Board of Directors. The Stockholders Agreement also provides that the nominating committee of the Board of Directors may from time to time select two additional individuals who must be independent to serve as Directors.
91
Table of Contents
Each of Messrs. Stern, Parzick and Morrison possesses experience as a private equity investor in owning and managing enterprises like the Company and is familiar with corporate finance, strategic business planning activities and issues involving stakeholders more generally. In particular, Mr. Stern has significant experience in high yield and primary capital markets activities, having served as Chairman and Chief Executive Officer of Cypress since 1994 and as the head of Lehman Brothers’ Merchant Banking Group prior to 1994. Mr. Parzick has significant experience in management, having been involved in numerous investments as a managing director of Cypress from 2003 to 2011. Mr. Morrison has significant experience in accounting and management, having spent over ten years with PricewaterhouseCoopers LLP in corporate finance focusing on restructurings and turnarounds and having served on the boards of directors of over 20 public and private companies.
Each of Messrs. Lasky, McElya, Onorato, Reiss and McCormack possesses substantial expertise in advising and managing companies related to the aftermarket replacement parts industry. Mr. Onorato has significant experience in finance and accounting within the aftermarket industry, having served as Senior Vice President and Chief Financial Officer for the Aftermarket Group at Dana Corporation from 1998 to 2000 and prior to that as an officer at Echlin Inc., in financial positions of increasing responsibility over 19 years, including as Chief Financial Officer. Mr. Riess has extensive business experience in the aftermarket replacement parts industry and has experience in management, having served as Chairman and Chief Executive Officer of Breed Technologies, Inc. and Gates Rubber Company. Mr. McCormack has extensive knowledge of our business and the aftermarket replacement parts industry generally, having served as President and Chief Executive Officer of the Company since 2004 with responsibility for the day-to-day oversight of the Company’s business operations. Mr. Lasky has extensive business experience in the manufacturing industry and in the aftermarket replacement parts industry, having served in management roles in our filtration business when it was owned by Dana, as well as substantial experience in management having served as Chairman and Chief Executive Officer of both Accuride Corporation and JLG Industries. Mr. McElya has substantial manufacturing experience and experience in management, having served as Chairman and Chief Executive Officer of Cooper Standard Holdings Inc. and in management positions of increasing responsibility over his prior career.
Board Committees
Audit Committee
We have an Audit Committee, consisting of Mr. Onorato, Mr. Lasky, Mr. Morrison and Mr. Riess. Mr. Onorato, the chairman of our Audit Committee, is our “audit committee financial expert” as such term is defined in Item 407(d)(5) of Regulation S-K.
The purpose of the Audit Committee is to assist our Board in overseeing and monitoring: (1) the quality and integrity of our financial statements; (2) our compliance with legal and regulatory requirements; (3) our independent registered public accounting firm’s qualifications and independence; (4) the performance of our internal audit function and (5) the performance of our independent registered public accounting firm.
The written charter for the Audit Committee is available on our website.
Compensation Committee
We have a Compensation Committee, consisting of Mr. Stern (Chairman), Mr. Riess, Mr. Onorato and Mr. McElya. The purpose of the Compensation Committee is to assist our Board in discharging its responsibility relating to: (1) setting our compensation program and compensation of our executive officers and directors; (2) monitoring our incentive and equity-based compensation plans and (3) preparing the compensation committee report required to be included in our annual report on Form 10-K following the completion of this offering under the rules and regulations of the SEC.
The written charter for the Compensation Committee is available on our website.
Nominating Committee
We have a Nominating Committee, consisting of Mr. Parzick (Chairman), Mr. Onorato and Mr. Morrison.
The purpose of our Nominating Committee is to assist our Board in discharging its responsibilities relating to: (1) developing and recommending criteria for selecting new directors; (2) screening and recommending to the Board individuals qualified to become executive officers and (3) handling such other matters as are specifically delegated to the Nominating Committee by the Board.
The written charter for the Nominating Committee is available on our website.
Code of Business Conduct and Ethics
We have adopted a code of business conduct and ethics that applies to all of our employees, officers and directors, including those officers responsible for financial reporting. The code of business conduct and ethics is available on our website at www.affiniagroup.com. We will make any legally required disclosures regarding amendments to, or waivers of, our code of business conduct on our website.
92
Table of Contents
Item 11. Executive Compensation
COMPENSATION DISCUSSION AND ANALYSIS
Executive Summary
The primary objectives of our compensation program are to attract and retain talented executives to lead our company and promote our short- and long-term growth. Our compensation program establishes a link between sustained corporate performance and individual rewards, such as ownership opportunities for our executives and key employees. We believe that this link ensures a balance between delivering near-term results and creating long-term value for our investors.
We foster a performance-oriented culture that aligns individual efforts with organizational objectives. Company performance and accomplishments are the primary measures of success upon which we structure our compensation programs. We evaluate and reward our executive officers based upon their contributions to the achievement of our goals.
We reinforce our overall compensation objectives by compensating our executive officers primarily through base salary, non-equity incentive awards, long-term equity incentive awards, competitive benefits packages and perquisites.
Our named executive officers (the “Named Executive Officers”) for the fiscal year ended December 31, 2010 were: Terry R. McCormack (President and Chief Executive Officer), Thomas H. Madden (Senior Vice President and Chief Financial Officer), H. David Overbeeke (President, Global Brake & Chassis Group), Keith A. Wilson (President, Global Filtration Group) and Jorge C. Schertel (President, Affinia Group S.A.).
Compensation Committee Role
The Compensation Committee, composed entirely of non-management directors, administers our executive compensation program. The role of the Compensation Committee is to oversee our compensation and benefit plans and policies, administer our parent company’s 2005 Stock Plan (including reviewing and approving equity grants to executive officers), establish annual goals and objectives for our Chief Executive Officer, and review and approve annually all compensation decisions relating to executive officers, including our Named Executive Officers. The Compensation Committee recognizes the importance of maintaining sound principles for the development and administration of compensation and benefit programs, as well as ensuring that we maintain strong links between executive pay and performance. The Compensation Committee’s charter details the Compensation Committee’s specific responsibilities and functions. The Compensation Committee annually reviews its charter, with the most recent review occurring at the Compensation Committee’s August 24, 2010 meeting. The full text of the Compensation Committee’s charter is available on our website at www.affiniagroup.com. The Compensation Committee’s membership is determined by our Board of Directors and its meeting agendas are established by the Committee Chair. Our Chief Executive Officer, Chief Financial Officer, General Counsel and Vice President of Human Resources generally attend meetings of the Compensation Committee, but do not attend executive sessions and do not participate in determining their specific compensation. There were four formal meetings of the Compensation Committee in 2010, all of which included an executive session. Executive sessions are held with the Compensation Committee members only. The Compensation Committee holds meetings in person, by telephone and also considers and takes action by written consent.
General Compensation Philosophy and Elements of Compensation
The Compensation Committee believes that compensation paid to executive officers should be closely aligned with our performance on both a short-term and long-term basis, and that such compensation should enable us to attract, motivate and retain key executives critical to our long-term success. Total compensation should be structured to ensure that a significant portion of compensation opportunity will be directly related to factors that drive future financial and operating performance and align our executive officers’ long-term interests with those of our investors. To that end, the Compensation Committee has determined that the total compensation program for executive officers should consist of the following elements:
| (A) | Base Salaries |
We pay each executive officer a base salary based on the rate of pay that the executive has received in the past, whether the executive’s position or responsibilities associated with his or her position have changed, whether the complexity or scope of his or her responsibilities has increased, and how his or her position relates to other executives and their rate of base salary. While a significant portion of each executive officer’s compensation is “at risk” in the form of non-equity incentive awards (annual cash performance bonuses) and long-term equity incentive awards, the Compensation Committee believes that executive officers should also have the stability and predictability of fixed base salary payments.
93
Table of Contents
| (B) | Non-Equity Incentive Awards |
We provide our executive officers the opportunity to earn annual non-equity incentive awards (cash performance bonuses) to encourage and reward exceptional contributions to our overall financial, operational and strategic success. Amounts payable under the cash incentive award program depend on our overall EBITDA performance, the EBITDA performance of our business units and, for Mr. Madden (and other key corporate office employees), our achievement of business plan net expenses. We established the performance targets for our 2010 non-equity incentive awards such that the threshold performance level (adjusted EBITDA of $160 million) was reasonably likely to be achieved, while the target performance level (adjusted EBITDA of $190 million), which required significant improvement over actual 2009 performance, was substantially more challenging to achieve.
Our overall EBITDA performance for fiscal 2010, as adjusted by the Compensation Committee, was $181 million. The discussion of how the non-equity incentive plan awards for fiscal 2010 were calculated appears below under “—Narrative Disclosure to Summary Compensation Table and Grants of Plan-Based Awards in 2010 Table.” Adjusted EBITDA for this purpose was calculated as follows ($ millions):
| Net income attributable to the Company |
$ | 24 | ||
| Income tax provision |
27 | |||
| Depreciation and amortization |
37 | |||
| Interest expense |
66 | |||
| EBITDA |
154 | |||
| Equity in income, net of tax |
(1 | ) | ||
| Net income attributable to noncontrolling interest, net of tax |
6 | |||
| Restructuring expenses |
24 | |||
|
Other(1) |
(2 | ) | ||
| Adjusted EBITDA for Compensation Purposes |
$ | 181 | ||
| (1) | Consists of adjustments for certain non-recurring items, non-controlling interest adjustments and a reduction for the discontinued operation depreciation and operating loss. |
We have also adopted a non-qualified deferred compensation program pursuant to which our executive officers can elect to defer all or a portion of their non-equity incentive awards. Any deferred amount is notionally invested in Holdings’ common stock and a portion is matched in the form of an additional notional investment in Holdings’ common stock. The principal terms of the non-qualified deferred compensation program appear below under “—Non-Qualified Deferred Compensation.”
| (C) | Long-Term Equity Incentive Awards |
We provide long-term equity incentive awards in the form of stock options or restricted stock units to each of our executive officers. The Compensation Committee believes that these awards align the interests of our executive officers with those of our investors and provide an effective incentive for our executive officers to remain with us. The principal terms of the restricted stock unit grants are described below under “—Outstanding Equity Awards at 2010 Fiscal Year-End.”
| (D) | Certain Other Benefits |
We provide our executive officers with those benefits and perquisites that we believe assist us in retaining their services. Some of these benefits are available to our employees generally (e.g., contributions to a defined contribution (401(k)) plan, health care coverage and paid vacation days) and some are available to a more limited number of key employees, including our Named Executive Officers (e.g., car allowances and tax preparation services). The specific benefits provided to each Named Executive Officer are described in the “All Other Compensation” column of the “Summary Compensation Table” and in the “Incremental Cost of Perquisites and Other Compensation Table.”
94
Table of Contents
Our executive compensation decisions are based primarily upon our assessment of each executive’s leadership and operational performance and potential to enhance long-term shareholder value. We rely on our judgment about each individual (and not on rigid formulas or temporary fluctuations in business performance) in determining the optimal magnitude and mix of compensation elements and whether each payment or award provides an appropriate incentive for performance that sustains and enhances long-term shareholder value. Key factors affecting our judgment include the executive officer’s performance compared to the financial, operational and strategic goals established for the executive at the beginning of the year; nature, scope and level of responsibilities; contribution to our financial results, particularly with respect to key metrics such as EBITDA, net working capital and cash flow; effectiveness in leading our restructuring plans and contribution to our commitment to corporate responsibility, including success in creating a culture of integrity and compliance with applicable laws and our ethics policies. The importance of each factor varies by individual. We also consider each executive’s current salary and prior-year bonus, the recommendations of our Chief Executive Officer regarding compensation for the executives he directly supervises, the appropriate balance between incentives for long-term and short-term performance, the compensation paid to the executive’s peers within the Company. From time to time, the Compensation Committee also receives independent advice on competitive practices from Towers Perrin. When using peer data to evaluate executive compensation, the Compensation Committee may consider ranges of compensation paid by others for a particular position, both by reference to comparative groups of companies of similar size and stature and, more particularly, a group comprised of our direct competitors, as one point of reference when making compensation decisions regarding total compensation or particular elements of compensation under consideration. The Compensation Committee does not typically use information with respect to our peer companies and other comparable public companies to establish targets for total compensation, or any element of compensation, or otherwise numerically benchmark its compensation decisions. For example, the Compensation Committee has in prior years reviewed pay data for a range of companies in connection with the review of base salaries for our Named Executive Officers. The Compensation Committee did not, however, use third-party data in establishing fiscal 2010 compensation for our Named Executive Officers. None of our Named Executive Officers (including our Chief Executive Officer) participate in determining their specific compensation. In addition, we review the total compensation potentially payable to, and the benefits accruing to, the executive, including (1) current value of outstanding equity incentive awards and (2) potential payments under each executive’s employment agreement upon termination of employment or a change in control.
Given the uncertain economic conditions during 2008 and 2009, the Compensation Committee, on the recommendation of our Chief Executive Officer, maintained our Named Executive Officers’ compensation (including base salary) without change for the 2008, 2009 and 2010 calendar years (with the exception of Mr. Wilson’s salary which was increased to $425,000 with effect from April 1, 2010).
Employment, Severance and Change in Control Agreements
On July 21, 2005, we entered into employment agreements with Messrs. McCormack, Madden and Wilson, with substantially identical terms, except as noted below. On December 15, 2008, we entered into Amended and Restated Employment Agreements with each of those executives to effectuate certain non-material amendments for compliance with Section 409A of the Internal Revenue Code and, on August 11, 2010, we entered into an amendment to each of the Amended and Restated Employment Agreements to effectuate certain non-material clarifications to the termination provisions thereof.
Each employment agreement has an initial employment term which commenced as of May 1, 2005 and is automatically extended for successive one-year periods on each December 31 unless either party provides the other 90 days prior written notice that the employment term will not be so extended. Under the employment agreements, Messrs. McCormack, Wilson and Madden are each entitled to a specified base salary, subject to increases, if any, as determined by the Compensation Committee. Currently, the base salaries for Messrs. McCormack, Wilson and Madden pursuant to their employment agreements are $650,000, $425,000 and $300,000, respectively, as the same may be increased from time to time. In addition, the employment agreements provide that these Named Executive Officers are eligible to earn target annual cash incentive awards as a percentage of base salary (100% for Messrs. McCormack and Wilson and 80% for Mr. Madden) upon the achievement of performance goals established by the Compensation Committee. Messrs. McCormack, Wilson and Madden are entitled to higher awards for performance in excess of targeted performance goals, lower awards for performance that does not meet targeted performance goals and no award for performance that does not meet threshold performance goals.
On June 28, 2008, we entered into a letter agreement with Mr. Overbeeke, outlining the principal terms of his employment relationship with us. The letter agreement provides that Mr. Overbeeke is entitled to a base salary of $600,000 per year, subject to annual adjustment, and is eligible to earn a target annual cash incentive award of 100% of base salary upon the achievement of performance goals established by the Compensation Committee. As with the other executives, Mr. Overbeeke is entitled to a higher award for performance in excess of targeted performance goals, lower awards for performance that does not meet targeted performance goals and no award for performance that does not meet threshold performance goals. Mr. Overbeeke also received a signing bonus of $750,000 and is entitled to other benefits commensurate with the benefits available to our other executive officers.
95
Table of Contents
Each executive (including Mr. Schertel) has agreed, either in his employment agreement or separately, to certain post-termination restrictions, and each executive is entitled to certain payments and benefits depending on the reason for termination. A description of these provisions, together with a table detailing amounts payable to our Named Executive Officers upon certain termination events, appears below under “—Potential Payments Upon Termination or Change in Control.”
Adjustments to Compensation for Financial Restatements
It is the Board’s policy that the Compensation Committee will, to the extent permitted by governing law, have the sole and absolute authority to make retroactive adjustments to any cash or equity-based incentive compensation paid to executive officers and certain other employees where the payment was predicated upon the achievement of certain financial results that were subsequently the subject of a restatement. Where applicable, we will seek to recover any amount determined to have been inappropriately received by any executive.
Option Exchange Program
On August 25, 2010, Holdings commenced an offer to certain eligible option holders, including our Named Executive Officers, to exchange their existing options to purchase shares of Holdings’ common stock for restricted stock unit awards with new vesting terms (the “Option Exchange”). As part of a review of our executive compensation and employee benefit arrangements on behalf of and under the supervision of our Board, and in light of the economic conditions in which we operate, it was determined that the restricted stock units may be better suited than the existing options to meet our objectives to motivate, retain and reward the eligible option holders.
The Option Exchange was completed on October 18, 2010 and all of the option holders who were eligible for the Option Exchange elected to participate in the exchange. The restricted stock units granted in connection with the Option Exchange are governed by 2005 Stock Plan and a new Restricted Stock Unit Agreement entered into by each grantee, including each of our Named Executive Officers. The restricted stock units granted in connection with the Option Exchange are subject to performance-based vesting restrictions, which have been modified from the performance and time-based vesting restrictions applicable to the options for which they were issued in the Option Exchange. The RSUs will vest if (i) the RSU holder remains employed with Affinia Group Holdings Inc. on the date that either of the following vesting conditions occurs and (ii) either of the following vesting conditions occurs on or prior to the date on which Cypress ceases to hold any remaining Affinia Group Holdings Inc. common stock:
| • | Cypress has received aggregate transaction proceeds in cash or marketable securities (not subject to escrow, lock-up, trading restrictions or claw-back) with respect to the disposition of more than 50% of its common equity interests in Holdings in an amount that represents a per-share equivalent value that is greater than or equal to two times the average per share price paid by Cypress for its common equity investment in Holdings; or |
| • | Holdings’ common stock trades on a public stock exchange at an average closing price of $225 (as adjusted for stock splits) over a 60 consecutive trading day period. |
Following a “qualifying termination” of the holder’s employment due to an involuntary termination by us without cause or due to the holder’s death, disability or retirement, the restricted stock units granted in connection with the Option Exchange will also vest if either of the performance conditions described above is met upon or prior to the first to occur of (1) a final exit by Cypress of its equity investment in Holdings or (2) one year following the termination date.
See Note 13. “Stock Incentive Plan” of our Consolidated Financial Statements contained in Item 8. “Financial Statements and Supplementary Data” of this Annual Report on Form 10-K for more information about the Option Exchange.
The following table sets forth certain information concerning the options surrendered by, and the restricted stock units granted to, each of our Named Executive Officers in connection with the Option Exchange.
| Name and Principal Position |
Exchanged Options | Restricted Stock Units Received |
||||||||||
| Number of Shares |
Exercise Price |
|||||||||||
| Terry R. McCormack, |
12,467 | $ | 100 | 50,000 | ||||||||
| Thomas H. Madden, |
5,827 | $ | 100 | 15,000 | ||||||||
| H. David Overbeeke, |
3,300 | $ | 100 | 50,000 | ||||||||
| Keith A. Wilson, |
6,800 | $ | 100 | 30,000 | ||||||||
| Jorge C. Schertel, |
2,213 | $ | 100 | 10,000 | ||||||||
96
Table of Contents
Summary Compensation Table
The following table provides summary information concerning compensation paid or accrued by us to or on behalf of our President and Chief Executive Officer, our Senior Vice President and Chief Financial Officer, and each of our three other most highly compensated executive officers serving as of December 31, 2010. We collectively refer to these five individuals herein as the Named Executive Officers. Mr. McCormack also served as a Director but received no separate remuneration in that capacity. Mr. Overbeeke served as one of our Directors in 2008 until becoming one of our executive officers.
| Name and Principal Position |
Year | Salary ($) |
Bonus ($) |
Stock Awards(1) ($) |
Option Awards(2) ($) |
Non-Equity Incentive Plan Compensation(3) ($) |
Change in Pension Value and Nonqualified Deferred Compensation Earnings ($) |
All Other Compensation(4) ($) |
Total ($) |
|||||||||||||||||||||||||||
| Terry R. McCormack |
2010 | 650,000 | -0- | 4,372,958 | -0- | 557,050 | -0- | 102,800 | 5,682,808 | |||||||||||||||||||||||||||
| 2009 | 650,000 | -0- | -0- | -0- | 360,050 | -0- | 90,131 | 1,100,181 | ||||||||||||||||||||||||||||
| 2008 | 650,000 | -0- | -0- | -0- | -0- | -0- | 33,938 | 683,938 | ||||||||||||||||||||||||||||
| Thomas H. Madden |
2010 | 300,000 | -0- | 1,142,325 | -0- | 222,720 | -0- | 50,155 | 1,715,200 | |||||||||||||||||||||||||||
| 2009 | 300,000 | -0- | -0 | -0- | 171,540 | -0- | 38,538 | 510,078 | ||||||||||||||||||||||||||||
| 2008 | 300,000 | -0- | -0- | -0- | 165,120 | -0- | 49,083 | 514,203 | ||||||||||||||||||||||||||||
| H. David Overbeeke |
2010 | 600,000 | -0- | 5,117,842 | -0- | 182,400 | -0- | 134,023 | 6,034,265 | |||||||||||||||||||||||||||
| 2009 | 600,000 | -0- | -0- | -0- | 125,000 | -0- | 154,260 | 879,260 | ||||||||||||||||||||||||||||
| 2008 | 279,615 | 750,000 | (5) | -0- | 91,500 | 312,246 | -0- | 76,676 | 1,510,037 | |||||||||||||||||||||||||||
| Keith A. Wilson |
2010 | 412,500 | -0- | 2,679,032 | -0- | 569,250 | -0- | 75,643 | 3,736,425 | |||||||||||||||||||||||||||
| 2009 | 375,000 | -0- | -0- | -0- | 508,125 | -0- | 82,500 | 965,625 | ||||||||||||||||||||||||||||
| 2008 | 375,000 | -0- | -0- | -0- | -0- | -0- | 31,455 | 406,455 | ||||||||||||||||||||||||||||
| Jorge C. Schertel |
2010 | 360,447 | (6) | -0- | 897,345 | -0- | 225,885 | -0- | 124,857 | 1,608,534 | ||||||||||||||||||||||||||
| 2009 | 342,203 | -0- | -0- | -0- | 134,638 | -0- | 105,575 | 582,416 | ||||||||||||||||||||||||||||
| 2008 | 249,858 | -0- | -0- | -0- | 250,640 | -0- | 189,403 | 689,901 | ||||||||||||||||||||||||||||
| (1) | The amounts reported for 2010 reflect the incremental fair value of restricted stock units granted during the fiscal year in connection with the Option Exchange in accordance with FASB ASC Topic 718, “Compensation – Stock Compensation” (“ASC Topic 718”). This is not the value actually received. The actual value the Named Executive Officers may receive will depend on whether the performance criteria are met and, if so, the fair market value of our Holdings’ common stock at that time. The incremental fair value under ASC Topic 718 was determined by calculating the fair value of the restricted stock units on October 18, 2010, the closing date of the Option Exchange, minus the fair value of the outstanding options on October 18, 2010. The fair value of each Named Executive Officer’s outstanding options on October 18, 2010, immediately preceding the Option Exchange was as follows: McCormack: $1,013,042; Madden: $473,475; Overbeeke: $268,158; Wilson: $552,568; and Schertel: $179,855. The fair value of the restricted stock units received in connection with the Option Exchange was calculated by multiplying the number of restricted stock units awarded by the fair market value of the restricted stock units on the date of the grant, immediately following the Option Exchange, assuming that the restricted stock units vest on satisfaction of the vesting condition described as the “Cypress Scenario” in Note 13. “Stock Incentive Plan – Restricted Stock Units” of our Consolidated Financial Statements contained in Item 8. “Financial Statements and Supplementary Data” of this Annual Report on Form 10-K. Assuming the restricted stock units vest on satisfaction of the vesting condition described as the “IPO Scenario” in Note 13 to our Consolidated Financial Statements, the fair market value of the restricted stock units would be increased and the incremental fair value amounts reported would change as follows: McCormack: $5,199,458; Madden: $1,390,275; Overbeeke: $5,944,342; Wilson: $3,174,932; and Schertel: $1,062,645. |
| (2) | Represents the aggregate grant date fair value calculated in accordance with ASC Topic 718 (excluding the effect of estimated forfeitures) with respect to stock options granted in 2008. As described above under “Compensation Discussion and Analysis—Option Exchange Program,” all stock options previously granted to our Named Executive Officers have been exchanged for restricted stock units. |
| (3) | We report non-equity incentive plan compensation for the year in which such compensation is determined against annual performance metrics, regardless of whether it is paid in that year, or the following year, or is deferred under our non-qualified deferred compensation plan. Amounts for 2008 reflect payments made in September 2009, which payments were made following reinstatement of our previously canceled 2008 non-equity incentive compensation program. |
97
Table of Contents
| (4) | The components of this column for 2010 are detailed in the “Incremental Cost of Perquisites and Other Compensation Table” below. |
| (5) | Represents the amount of Mr. Overbeeke’s signing bonus paid in accordance with his letter agreement. |
| (6) | Reflects Mr. Schertel’s base salary ($335,390) and an additional payment in respect of vacation ($25,057) as required under Brazilian law. Amounts for Mr. Schertel for 2008 have been converted from Brazilian Reals to U.S. Dollars at an exchange rate of .4279 U.S. Dollars for each Brazilian Real, which was the exchange rate in effect on December 31, 2008 (with the exception of Mr. Schertel’s non-equity incentive plan compensation which was converted at a rate of .54697 U.S. Dollars for each Brazilian Real), for 2009 at a rate of .5716 U.S. Dollars for each Brazilian Real, which was the exchange rate in effect on December 31, 2009 and for 2010 at a rate of .6020 U.S. Dollars for each Brazilian Real, which was the exchange rate in effect on December 31, 2010. |
98
Table of Contents
Incremental Cost of Perquisites and Other Compensation in 2010 Table
| Name and Principal Position |
Tax Preparation ($) |
Vehicle Allowance ($) |
Life Insurance Premium ($) |
401(k) Basic Contribution(1) ($) |
Tax Gross-Up(2) ($) |
Deferred Compensation Matching Contribution ($)(3) |
Other(4) ($) |
Total ($) |
||||||||||||||||||||||||
| Terry R. McCormack |
1,640 | 18,000 | 1,872 | 7,350 | 1,954 | 69,233 | 2,751 | 102,800 | ||||||||||||||||||||||||
| President and Chief Executive Officer |
||||||||||||||||||||||||||||||||
| Thomas H. Madden |
340 | 15,000 | 864 | 7,350 | 28 | 26,573 | -0- | 50,155 | ||||||||||||||||||||||||
| Senior Vice President and Chief Financial Officer |
||||||||||||||||||||||||||||||||
| H. David Overbeeke |
2,500 | 18,000 | 1,215 | 7,350 | 27,340 | 15,599 | 62,019 | 134,023 | ||||||||||||||||||||||||
| President, Global Brake & Chassis Group |
||||||||||||||||||||||||||||||||
| Keith A. Wilson |
268 | 18,000 | 1,080 | 7,350 | 129 | 48,816 | -0- | 75,643 | ||||||||||||||||||||||||
| President, Global Filtration Group |
||||||||||||||||||||||||||||||||
| Jorge C. Schertel |
-0- | -0- | 2,079 | -0- | -0- | 28,352 | 94,426 | 124,857 | ||||||||||||||||||||||||
| President, Affinia Group S.A. |
||||||||||||||||||||||||||||||||
| (1) | We contribute 3% of a U.S. employee’s earnings to the employee’s 401(k) account, subject to Internal Revenue Service limitations. |
| (2) | The amounts in this column constitute the tax gross-up expense incurred in respect of tax preparation costs shown in the table and, for Mr. Overbeeke, the tax gross-up expense ($7,591) incurred in respect of health insurance costs and the tax gross-up expense ($18,705) incurred in respect of our reimbursement of certain travel and living expenses shown in the “Other” column of the table and, for Mr. McCormack, the tax gross-up expense ($1,224) incurred in respect of our reimbursement of certain spousal travel expenses. |
| (3) | Represents the amount of the matching contribution made by us in accordance with our non-qualified deferred compensation plan. Matching contributions are reported for the year in which the non-equity incentive compensation, against which the applicable deferral election is applied, has been earned (regardless of whether such matching contribution is actually credited to the Named Executive Officer’s non-qualified deferred compensation account in that year or the following year). The amount of the matching contribution we made to Mr. Schertel has been converted from Brazilian Reals to U.S. Dollars at an exchange rate of 0.60449 U.S. Dollars for each Brazilian Real. All matching contributions are unvested and will vest as described in “— Non-Qualified Deferred Compensation for 2010.” |
| (4) | The amount in this column for Mr. McCormack reflects certain spousal travel expenses reimbursed by us. The amount in this column for Mr. Overbeeke reflects expenses incurred to continue the health insurance coverage Mr. Overbeeke maintained prior to becoming our employee ($17,209) and our reimbursement of Mr. Overbeeke’s expenses incurred in commuting from his primary residence in Connecticut to our McHenry, IL offices and his living expenses while in McHenry, IL ($44,810). The amount in this column for Mr. Schertel is composed of a Brazilian government mandated severance fund payment in Mr. Schertel’s name ($28,836), a company contribution to a defined contribution plan on Mr. Schertel’s behalf ($39,509), a meal allowance at our cafeteria ($2,545), dues for a social club ($7,947) and operating costs for Mr. Schertel’s vehicle ($15,589). |
99
Table of Contents
Grants of Plan-Based Awards in 2010 Table
| Estimated Future Payouts Under Non-Equity Incentive Plan Awards |
Estimated Future Payouts Under Equity Incentive Plan Awards(1) |
All Other Stock Awards: Number of Shares of Stock Units (#) |
All Other Option Awards: Number of Securities Underlying Options ($) |
Exercise or Base Price of Option Awards ($/Sh) |
Grant Date Fair Value of Stock and Option Awards(2) ($) |
|||||||||||||||||||||||||||||||||||||||
| Name |
Grant Date | Threshold ($) |
Target ($) |
Maximum ($) |
Threshold (#) |
Target (#) |
Maximum (#) |
|||||||||||||||||||||||||||||||||||||
| Terry R. McCormack |
81,250 | 650,000 | 1,137,500 | |||||||||||||||||||||||||||||||||||||||||
| President and Chief Executive Officer |
Oct. 18, 2010 | 50,000 | 50,000 | 4,372,958 | ||||||||||||||||||||||||||||||||||||||||
| Thomas H. Madden |
6,000 | 240,000 | 420,000 | |||||||||||||||||||||||||||||||||||||||||
| Senior Vice President and Chief Financial Officer |
Oct. 18, 2010 | 15,000 | 15,000 | 1,142,325 | ||||||||||||||||||||||||||||||||||||||||
| H. David Overbeeke |
45,000 | 600,000 | 1,050,000 | |||||||||||||||||||||||||||||||||||||||||
| President, Global Brake & Chassis Group |
Oct. 18. 2010 | 50,000 | 50,000 | 5,117,842 | ||||||||||||||||||||||||||||||||||||||||
| Keith A. Wilson |
51,563 | 412,500 | 721,875 | |||||||||||||||||||||||||||||||||||||||||
| President, Global Filtration Group |
Oct. 18, 2010 | 30,000 | 30,000 | 2,679,032 | ||||||||||||||||||||||||||||||||||||||||
| Jorge C. Schertel |
20,962 | 167,695 | 293,466 | |||||||||||||||||||||||||||||||||||||||||
| President, |
||||||||||||||||||||||||||||||||||||||||||||
| Affinia Group S.A. |
Oct. 18, 2010 | 10,000 | 10,000 | 897,345 | ||||||||||||||||||||||||||||||||||||||||
| (1) | Reflects performance-based restricted stock units that were granted in connection with the Named Executive Officer’s election to participate in the Option Exchange (see “Compensation Discussion Analysis—Option Exchange Program” above). |
| (2) | The amounts reported reflect the incremental fair value of restricted stock units granted during the fiscal year in connection with the Option Exchange in accordance with ASC Topic 718. This is not the value actually received. The actual value the Named Executive Officers may receive will depend on whether the performance criteria are met and, if so, the fair market value of our Holdings’ common stock at that time. The incremental fair value under ASC Topic 718 was determined by calculating the fair value of the restricted stock units on October 18, 2010, the closing date of the Option Exchange, minus the fair value of the outstanding options on October 18, 2010. The fair value of the restricted stock units received in connection with the Option Exchange was calculated by multiplying the number of restricted stock units awarded by the fair market value of the restricted stock units on the date of the grant, immediately following the Option Exchange, assuming that the restricted stock units vest on satisfaction of the vesting condition described as the “Cypress Scenario” in Note 13. “Stock Incentive Plan – Restricted Stock Units” of our Consolidated Financial Statements contained in Item 8. “Financial Statements and Supplementary Data” of this Annual Report on Form 10-K. |
100
Table of Contents
Narrative Disclosure to Summary Compensation Table and Grants of Plan-Based Awards in 2010 Table
Non-Equity Incentive Plan Awards
The Compensation Committee provides for non-equity incentive plan awards in the form of an annual cash incentive award plan. Amounts payable under this plan are a function of our full-year EBITDA performance (either overall or for specified business units), individual performance (taking into consideration, among other things, providing strategic leadership and direction, including with respect to corporate governance matters, and increasing operational efficiency) and, for Mr. Madden, also our achievement of business plan net expenses. Under the non-equity incentive plan, if EBITDA is above a specified level, then participants in the plan have the opportunity to earn cash incentive awards based on our (or a particular business unit’s) achievement of specified EBITDA performance levels. The plan establishes certain threshold performance levels for EBITDA, below which no cash incentive award is payable. At the threshold performance levels, participants are entitled to payouts equal to 50% of their target cash incentive award opportunities (being a specified percentage of base salary ranging from 10% to 100% which, in the case of our Named Executive Officers, is 100% for Messrs. McCormack, Overbeeke and Wilson, 80% for Mr. Madden, and 50% for Mr. Schertel). At the target performance level, the participant would be entitled to a payment equal to 100% of his target cash incentive award. Performance above the target level entitles a participant to an award in excess of his target cash incentive award, up to a maximum of 175% of the target cash incentive award. Non-equity incentive plan awards for actual results that fall between the specified performance levels are adjusted on a linear basis. The following table illustrates the operation of our cash incentive award program for 2010:
| Percent of Bonus Opportunity | ||||||||||||||||||||||||
| Name |
Bonus Opportunity as Percent of Salary and Dollar Value |
Performance Factor |
Threshold | Target | Maximum | Percent Achieved |
Actual Dollar Value Awarded Based on Percent Achieved ($) |
|||||||||||||||||
| Terry R. McCormack |
100% -$650,000 | Company EBITDA |
37.5 | % | 75 | % | 131.25 | % | 64.275 | % | 417,788 | |||||||||||||
| Individual Performance |
12.5 | % | 25 | % | 43.75 | % | 21.425 | % | 139,262 | |||||||||||||||
| 85.700 | % | 557,050 | ||||||||||||||||||||||
| H. David Overbeeke |
100% -$600,000 | Company EBITDA |
12.5 | % | 25 | % | 43.75 | % | 21.425 | % | 128,550 | |||||||||||||
| Business Unit A EBITDA |
30.0 | % | 60 | % | 105.00 | % | 0.0 | % | -0- | |||||||||||||||
| Business Unit B EBITDA |
7.5 | % | 15 | % | 26.25 | % | 8.975 | % | 53,850 | |||||||||||||||
| Individual Performance |
— | — | — | — | -0- | |||||||||||||||||||
| 30.400 | % | 182,400 | ||||||||||||||||||||||
| Keith A. Wilson |
100% -$412,500 | Company EBITDA |
12.5 | % | 25 | % | 43.75 | % | 21.425 | % | 88,378 | |||||||||||||
| Business Unit EBITDA |
37.5 | % | 75 | % | 131.25 | % | 116.575 | % | 480,872 | |||||||||||||||
| Individual Performance |
— | — | — | — | -0- | |||||||||||||||||||
| 138.000 | % | 569,250 | ||||||||||||||||||||||
| Thomas H. Madden |
80% -$240,000 | Company EBITDA |
20.0 | % | 40.0 | % | 70.00 | % | 34.28 | % | 82,272 | |||||||||||||
| Business Unit A EBITDA |
9.0 | % | 18.0 | % | 31.50 | % | 0.0 | % | -0- | |||||||||||||||
| Business Unit B EBITDA |
10.0 | % | 20.0 | % | 35.00 | % | 31.08 | % | 74,592 | |||||||||||||||
| Business Unit C EBITDA |
3.5 | % | 7.0 | % | 12.25 | % | 4.19 | % | 10,056 | |||||||||||||||
| Business Unit D EBITDA |
2.5 | % | 5.0 | % | 8.75 | % | 7.55 | % | 18,120 | |||||||||||||||
| Business Plan Net Expenses |
5.0 | % | 10.0 | % | 17.50 | % | 15.70 | % | 37,680 | |||||||||||||||
| Individual Performance |
— | — | — | — | -0- | |||||||||||||||||||
| 92.80 | % | 222,720 | ||||||||||||||||||||||
| Jorge C. Schertel |
50% -$167,695 | Company EBITDA |
12.5 | % | 25 | % | 43.75 | % | 21.425 | % | 35,929 | |||||||||||||
| Business Unit EBITDA |
37.5 | % | 75 | % | 131.25 | % | 113.275 | % | 189,956 | |||||||||||||||
| Individual Performance |
— | — | — | — | -0- | |||||||||||||||||||
| 134.700 | % | 225,885 | ||||||||||||||||||||||
101
Table of Contents
Equity Incentive Plan Awards
The Compensation Committee grants equity incentive awards periodically, as and when appropriate in the Compensation Committee’s judgment. On July 20, 2005, we adopted the 2005 Stock Plan, which was subsequently amended on November 14, 2006, January 1, 2007, August 25, 2010 and December 2, 2010. The 2005 Stock Plan, as amended, permits the grant of non-qualified stock options, incentive stock options, stock appreciation rights, restricted stock and other stock-based awards to our employees, directors or consultants. The Compensation Committee has granted stock options and restricted stock units pursuant to the 2005 Stock Plan and has not granted any other stock-based awards.
Administration. The 2005 Stock Plan is administered by the Compensation Committee; provided, that our Board may take any action designated to the Compensation Committee. The Compensation Committee has full power and authority to make, and to establish the terms and conditions of, any award and to waive any such terms and conditions at any time (including, without limitation, accelerating or waiving any vesting conditions or payment dates). The Compensation Committee is authorized to interpret the plan, to establish, amend and rescind any rules and regulations relating to the plan and to make any other determinations that it, in good faith, deems necessary or desirable for the administration of the plan and may delegate such authority as it deems appropriate.
Options. The Compensation Committee determines the exercise price for each option; provided, however, that incentive stock options must have an exercise price that is at least equal to the fair market value of our common stock on the date the option is granted. An option holder may exercise an option by written notice and payment of the exercise price (1) in cash or its equivalent, (2) by the surrender of a number of shares of common stock already owned by the option holder for at least six months (or such other period established by the Compensation Committee) with a fair market value equal to the exercise price, (3) if there is a public market for the shares, subject to rules established by the Compensation Committee, through the delivery of irrevocable instructions to a broker to sell shares obtained upon the exercise of the option and to deliver to Holdings an amount out of the proceeds of the sale equal to the aggregate exercise price for the shares being purchased or (4) by another method approved by the Compensation Committee.
Stock Appreciation Rights. The Compensation Committee may grant stock appreciation rights independent of or in connection with an option. The exercise price per share of a stock appreciation right shall be an amount determined by the Compensation Committee provided that the exercise price is at least equal to the fair market value of our common stock on the date the stock appreciation right is granted. Generally, each stock appreciation right shall entitle a participant upon exercise to an amount equal to (1) the excess of (a) the fair market value on the exercise date of one share of common stock over (b) the exercise price, multiplied by (2) the number of shares of common stock covered by the stock appreciation right. Payment shall be made in common stock or in cash, or partly in common stock and partly in cash, all as shall be determined by the Compensation Committee.
Other Stock-Based Awards. The Compensation Committee may grant awards of restricted stock units, rights to purchase stock, restricted stock and other awards that are valued in whole or in part by reference to, or are otherwise based on the fair market value of, shares of common stock. The other stock-based awards will be subject to the terms and conditions established by the Compensation Committee.
Transferability. Unless otherwise determined by the Compensation Committee, awards granted under the 2005 Stock Plan are not transferable other than by will or by the laws of descent and distribution.
Change of Control. In the event of a “change of control” (as defined in the 2005 Stock Plan), the Compensation Committee may provide for (1) the termination of an award upon the consummation of the change of control, but only if the award has vested and been paid out or the participant has been permitted to exercise an option in full for a period of not less than 30 days prior to the change of control, (2) the acceleration of all or any portion of an award, (3) payment in exchange for the cancellation of an award and/or (4) the issuance of substitute awards that would substantially preserve the terms of any awards.
Amendment and Termination. Our Board may amend, alter or discontinue the 2005 Stock Plan in any respect at any time, but no amendment may diminish any of the rights of a participant under any awards previously granted, without his or her consent.
Management or Director Stockholders Agreement. All shares issued under the 2005 Stock Plan will be subject to the management stockholders’ agreement or directors stockholders’ agreement, as applicable. The stockholders’ agreements impose restrictions on transfers of the shares by the individuals and also provide for various put and call rights with respect to the shares. These put and call rights include the individual’s right to require that Holdings purchases the shares on death or disability at the then-fair market value of the shares and Holdings’ right to repurchase the shares upon specified events, including termination of service or employment, at a price equal to the then-fair market value or, in certain circumstances, at a price per share equal to the lesser of $100.00 and the then-fair market value. The individuals have also agreed to a 180-day lock up period (during which the sale of shares not covered by a registration statement is prohibited) in the case of an initial public offering of the shares and have been granted limited “piggyback” registration rights with respect to the shares. Certain individuals also entered into confidentiality and non-competition agreements in connection with the shares they purchased. The forms of the various agreements are referenced under “Item 15. Exhibits and Financial Statement Schedules.” The forms of the agreements for directors are substantially similar to the forms for management.
102
Table of Contents
Restrictive Covenant Agreement. Unless otherwise determined by our Board, all award recipients are obligated to sign our standard confidentiality, non-competition and proprietary information agreement, which includes restrictive covenants regarding confidentiality, proprietary information and a one-year period restricting competition and solicitation of our clients, customers or employees. If a participant breaches these restrictive covenants, the Compensation Committee has discretion to rescind any exercise of, or payment or delivery pursuant to, an award under the 2005 Stock Plan, in which case the participant may be required to pay to Holdings the amount of any gain realized in connection with, or as a result of, the rescinded exercise, payment or delivery.
103
Table of Contents
Outstanding Equity Awards at 2010 Fiscal Year-End
| Stock Awards | ||||||||||||||||
| Name |
Number of Shares or Units of Stock That Have Not Vested (#) |
Market Value of Shares or Units of Stock That Have Not Vested ($) |
Equity Incentive Plan Awards; Number of Unearned Shares, Units or Other Rights That Have Not Vested (#)(1) |
Equity Incentive Plan Awards; Market or Payout Value of Unearned Shares, Units or Other Rights That Have Not Vested ($)(2) | ||||||||||||
| Terry R. McCormack |
50,000 | 7,816,500 | ||||||||||||||
| President and Chief Executive Officer |
||||||||||||||||
| Thomas H. Madden |
15,000 | 2,344,950 | ||||||||||||||
| Senior Vice President and Chief Financial Officer |
||||||||||||||||
| H. David Overbeeke |
50,000 | 7,816,500 | ||||||||||||||
| President, Global Brake & Chassis Group |
||||||||||||||||
| Keith A. Wilson |
30,000 | 4,689,900 | ||||||||||||||
| President, Global Filtration Group |
||||||||||||||||
| Jorge C. Schertel |
10,000 | 1,563,300 | ||||||||||||||
| President, Affinia Group S.A. |
||||||||||||||||
| (1) | As of December 31, 2010, all outstanding equity awards granted to our Named Executive Officers were in the form of performance-based restricted stock units granted pursuant to our 2005 Stock Plan in connection with the Option Exchange. The restricted stock units are subject to the vesting criteria described above under “Compensation Discussion and Analysis—Option Exchange Program.” |
| (2) | Because Holdings’ common stock is not publicly traded, the market value of the outstanding restricted stock units is based on the value of Holdings’ common stock as of December 31, 2010 of $156.33. |
Option Exercises and Stock Vested in 2010
None of our Named Executive Officers exercised any stock options in 2010, nor have any of them received any restricted stock, or other awards of shares of stock which have vested.
Pension Benefits for 2010
We do not sponsor a defined benefit plan for our U.S. employees. However, we do offer a defined contribution (401(k)) plan for our U.S. employees pursuant to which we contribute 3% of an employee’s earnings (which contributions were postponed for 2009 until October 1, 2009), all subject to applicable Internal Revenue Service limitations. We also maintain a defined contribution plan for certain of our employees in Brazil, including Mr. Schertel, pursuant to which we contribute 12.5% of Mr. Schertel’s base salary each year.
Although we maintain defined benefit plans for our employees in Canada, none of our Named Executive Officers participate in or are entitled to receive benefits pursuant to any defined benefit plan sponsored by us.
104
Table of Contents
Non-Qualified Deferred Compensation for 2010
On March 6, 2008, we adopted a non-qualified deferred compensation program pursuant to which certain of our senior employees, including our Named Executive Officers, are permitted to elect to defer all or a portion of their annual cash-based incentive awards which are then credited to the participant’s deferral account. The Company makes matching contributions of 25% of the amount of an employee’s deferral which vest on December 31 of the second calendar year following the calendar year in which such matching contributions were credited to an employee’s account. Employee deferrals and Company matching contributions are notionally invested under this plan in Holdings’ common stock, and once vesting of the Company matching contributions has occurred, distributions will be paid in the form of such shares of common stock (or cash, in certain circumstances) on the payment date elected by the participant or the participant’s separation from service (or the date that is six months following the date of such separation from service in the case of a “specified employee” within the meaning of Section 409A of the Internal Revenue Code), if earlier. In the event a “change in control” (as defined in the non-qualified deferred compensation plan) or an initial public offering occurs prior to a participant’s separation from service, the participant will be fully vested in his or her entire account, including any Company matching contributions.
105
Table of Contents
Non-qualified Deferred Compensation
| Name |
Executive Contributions in Last Fiscal Year(1) ($) |
Registrant Contributions in Last Fiscal Year(1) (2) ($) |
Aggregate Earnings in Last Fiscal Year(3) ($) |
Aggregate Withdrawals/ Distributions ($) |
Aggregate Balance at Last Fiscal Year End(4) ($) | |||||||
| Terry R. McCormack |
276,932 | 69,233 | 162,479 | -0- | 775,588 | |||||||
| Thomas H. Madden |
106,294 | 26,573 | 166,776 | -0- | 501,832 | |||||||
| H. David Overbeeke |
62,396 | 15,599 | 32,021 | -0- | 162,626 | |||||||
| Keith A. Wilson |
195,265 | 48,816 | 183,719 | -0- | 729,640 | |||||||
| Jorge C. Schertel |
113,409 | 28,352 | 180,141 | -0- | 529,316 | |||||||
| (1) | All executive contributions and registrant contributions reported in the non-qualified deferred compensation table have been reported in the Summary Compensation Table as compensation in fiscal 2010. |
| (2) | Represents the amount of the matching contribution made by us in accordance with our non-qualified deferred compensation plan. Matching contributions are reported for the year in which the non-equity incentive compensation, against which the applicable deferral election is applied, has been earned (regardless of whether such matching contribution is actually credited to the Named Executive Officer’s non-qualified deferred compensation account in that year or the following year). The amount of the matching contribution we made to Mr. Schertel has been converted from Brazilian Reals to U.S. Dollars at an exchange rate of 0.60449 U.S. Dollars for each Brazilian Real. All matching contributions are unvested and will vest as described above in “—Non-Qualified Deferred Compensation for 2010.” |
| (3) | Aggregate earnings reflects the earnings on executive and registrant contributions based on the increase in value of Holdings’ common stock during 2010 or from the date of the contribution, as applicable. The amounts reported are not considered compensation reportable in the Summary Compensation Table. |
| (4) | Aggregate balance includes contributions made by the Named Executive Officer in prior fiscal years and the matching contribution made by the Company in prior fiscal years which were reported in the Summary Compensation Table for previous years as follows: McCormack: $213,555 and $53,389, respectively; Madden: $161,751 and $40,438, respectively; Overbeeke: $42,088 and $10,522, respectively; Wilson: $241,472 and $60,368, respectively; and Schertel: $165,931 and $41,483, respectively. |
Potential Payments Upon Termination or Change in Control
Termination Provisions of Employment Agreements
Each of our Named Executive Officers (other than Mr. Overbeeke and Mr. Schertel) has entered into an employment agreement with us. Under the employment agreements and Mr. Overbeeke’s letter agreement, each Named Executive Officer (other than Mr. Schertel) is entitled to the following payments and benefits in the event of a termination by us “without cause” (as defined in the employment agreements) or in the case of Messrs. McCormack, Wilson and Madden, by the executive for “good reason” (as defined in the employment agreements) during the employment term: (1) subject to the executive’s compliance with the restrictive covenants described below, an amount equal to the “severance multiple” (2.0 for each of Messrs. McCormack, Overbeeke and Wilson; 1.5 for Mr. Madden) times the sum of base salary and the “average annual bonus” paid under the agreement for the preceding two years (the “Multiplier”), payable as follows: an amount equal to 1 times the Multiplier to be paid in equal monthly installments for 12 months following termination of employment and the balance to be paid in a lump sum on the first anniversary of the termination of the executive’s employment; (2) a pro-rata annual bonus for the year of termination; and (3) continued medical and dental coverage at our cost, on the same basis made available for active employees for a period of years corresponding with the severance multiple; provided that, if such coverage is not available for any portion of such period under our medical plans, we must arrange for alternate comparable coverage. In addition, if the executive (other than Mr. Overbeeke and Mr. Schertel) is terminated by us without cause or the executive resigns for good reason within two years following a change in control, the executive shall be entitled to a supplemental payment equal to the excess, if any, of (X) the product of the severance multiple times the executive’s target annual bonus, over (Y) the product of the severance multiple times the average annual bonus described above.
106
Table of Contents
In addition, under the terms of the employment agreements, in the event the employment term ends due to election by either party not to extend the employment term, then the executive shall be entitled, subject to the executive’s compliance with the restrictive covenants described below, to (x) if we elect not to extend the employment term or, in the case of Messrs. McCormack and Wilson, if the executive elects not to extend the employment term, an amount equal to the “severance multiple” times the base salary, payable as follows: an amount equal to one times the base salary to be paid in 12 equal monthly installments following termination of employment and the balance to be paid in a lump sum on the first anniversary of the termination of the executive’s employment and (y) if, in the case of Mr. Madden, the executive elects not to extend the employment term, an amount equal to one times the base salary paid in equal monthly installments over 12 months.
107
Table of Contents
Each executive (including Mr. Overbeeke and Mr. Schertel) is restricted (either pursuant to their employment agreement or a separate agreement), for a period following termination of employment (24 months for Messrs. McCormack, Overbeeke and Wilson; 18 months for Mr. Madden (or 12 months for Mr. Madden if his employment agreement expires due to his election not to extend the term); 12 months for Mr. Schertel), from (1) soliciting in competition certain of our customers, (2) competing with us or entering the employment or providing services to entities who compete with us or (3) soliciting or hiring our employees. The specific agreement containing these restrictions also provides that the Company may cease further payments and pursue its other rights and remedies in the event of a breach by the executive. Mr. Schertel’s contract containing the foregoing restrictions includes our agreement to pay him an amount equal to his annual base salary to be paid in 12 equal monthly installments if we terminate his employment without cause.
Total Potential Payout Assuming Termination Event Occurred on December 31, 2010
| Termination by Company Without Cause or by Executive for Good Reason(1) |
Termination Due to Non-Renewal of Employment Agreement |
|||||||||||||||||||||||||||||
| Name |
Benefit(2) |
Normally ($) |
After Change in Control ($) |
Termination by Company for Cause ($) |
By Company ($) |
By Executive ($) |
Voluntary Resignation by Executive ($) |
Retirement, Death or Disability(3) ($) |
||||||||||||||||||||||
| Terry R. McCormack |
• Severance |
1,660,050 | 2,600,000 | N/A | 1,300,000 | 1,300,000 | N/A | N/A | ||||||||||||||||||||||
| President and Chief Executive Officer |
• Continued health coverage |
20,860 | 20,860 | N/A | N/A | N/A | N/A | N/A | ||||||||||||||||||||||
| • 2010 non-equity incentive plan payment |
557,050 | 557,050 | 557,050 | 557,050 | 557,050 | 557,050 | 557,050 | |||||||||||||||||||||||
| • Accelerated vesting of matching contribution(4) |
53,389 | 53,389 | ||||||||||||||||||||||||||||
| Total |
2,237,960 | 3,231,299 | 557,050 | 1,857,050 | 1,857,050 | 557,050 | 610,439 | |||||||||||||||||||||||
| Thomas H. Madden |
• Severance |
702,495 | 810,000 | N/A | 450,000 | 300,000 | N/A | N/A | ||||||||||||||||||||||
| Senior Vice President and Chief Financial Officer |
• Continued health coverage |
15,645 | 15,645 | N/A | N/A | N/A | N/A | N/A | ||||||||||||||||||||||
| • 2010 non-equity incentive plan payment |
222,720 | 222,720 | 222,720 | 222,720 | 222,720 | 222,720 | 222,720 | |||||||||||||||||||||||
| • Accelerated vesting of matching contribution(4) |
40,438 | 40,438 | ||||||||||||||||||||||||||||
| Total |
940,860 | 1,088,803 | 222,720 | 672,720 | 522,720 | 222,720 | 263,158 | |||||||||||||||||||||||
| H. David Overbeeke |
• Severance |
1,637,246 | 1,637,246 | N/A | N/A | N/A | N/A | N/A | ||||||||||||||||||||||
| President, Global Brake & Chassis Group |
• Continued health coverage |
N/A | N/A | N/A | N/A | N/A | N/A | N/A | ||||||||||||||||||||||
| • 2010 non-equity incentive plan payment |
182,400 | 182,400 | 182,400 | 182,400 | 182,400 | 182,400 | 182,400 | |||||||||||||||||||||||
| • Accelerated vesting of matching contribution(4) |
10,522 | 10,522 | ||||||||||||||||||||||||||||
| Total |
1,819,646 | 1,830,168 | 182,400 | 182,400 | 182,400 | 182,400 | 192,922 | |||||||||||||||||||||||
| Keith A. Wilson |
• Severance |
1,333,125 | 1,650,000 | N/A | 825,000 | 825,000 | N/A | N/A | ||||||||||||||||||||||
| President, Global Filtration Group |
• Continued health coverage |
30,604 | 30,604 | N/A | N/A | N/A | N/A | N/A | ||||||||||||||||||||||
| • 2010 non-equity incentive plan payment |
569,250 | 569,250 | 569,250 | 569,250 | 569,250 | 569,250 | 569,250 | |||||||||||||||||||||||
| • Accelerated vesting of matching contribution(4) |
60,368 | 60,368 | ||||||||||||||||||||||||||||
| Total |
1,932,979 | 2,310,222 | 569,250 | 1,394,250 | 1,394,250 | 569,250 | 629,618 | |||||||||||||||||||||||
| Jorge C. Schertel |
• Severance |
360,447 | 360,447 | N/A | N/A | N/A | N/A | N/A | ||||||||||||||||||||||
| President, Affinia Group S.A. |
• Continued health coverage |
N/A | N/A | N/A | N/A | N/A | N/A | N/A | ||||||||||||||||||||||
| • 2010 non-equity incentive plan payment |
225,885 | 225,885 | 225,885 | 225,885 | 225,885 | 225,885 | 225,885 | |||||||||||||||||||||||
| • Accelerated vesting of matching contribution(4) |
41,483 | 41,483 | ||||||||||||||||||||||||||||
| Total |
586,332 | 627,815 | 225,885 | 225,885 | 225,885 | 225,885 | 267,368 | |||||||||||||||||||||||
108
Table of Contents
| (1) | The ability of an executive to terminate for good reason applies only to Messrs. McCormack, Madden and Wilson. |
| (2) | Amounts payable under our non-equity incentive plan (annual cash incentive plan) are earned on the last day of the applicable calendar year. |
| (3) | Upon retirement, death or disability, the Named Executive Officer (or his estate) is entitled to receive any earned but unpaid cash incentive award plus a pro-rata portion of any annual cash incentive award that the Named Executive Officer would have earned had his employment not terminated. In addition, on death, each of our Named Executive Officer’s designated beneficiaries would be entitled to receive life insurance proceeds equal to 1.5 times the Named Executive Officer’s base salary (with the exception of Mr. Schertel whose life insurance policy has a face amount of $410,323). |
| (4) | In accordance with the terms of our deferred compensation plan, any unvested matching contributions made by us will vest immediately upon the retirement, death or disability of the participant or upon any change-in-control or initial public offering of Holdings common stock. If any of the foregoing events had occurred on December 31, 2010, then our prior unvested matching contributions in the following amounts would have vested on such date: Mr. McCormack: $53,389; Mr. Madden: $40,438; Mr. Overbeeke: $10,522; Mr. Wilson: $60,368; and Mr. Schertel: $41,483. |
109
Table of Contents
Director Compensation for 2010
The annual retainer for non-management directors is $50,000. The Chairman of the Board is paid an additional $15,000 annually. The chair of our Audit Committee is paid an additional $50,000 annually in recognition of the Audit Committee chair’s expanded responsibilities as we implement our efforts to comply with Sarbanes-Oxley. Also, each non-management director is paid an additional $1,500 for each meeting of the Board attended and an additional $1,500 for each committee meeting attended.
Each of our non-management Directors has also been granted equity awards as part of their director compensation. Messrs. Finley, Morrison, Onorato, Parzick, Riess and Stern were previously granted options to purchase shares of Holdings’ common stock. On October 18, 2010 each of these Directors (other than Mr. Finley, who had previously exercised his options to purchase Holdings’ common stock) elected to exchange their existing options for restricted stock units with new performance-based vesting terms in connection with the Option Exchange. Mr. Finley received a grant of restricted stock units without having to exchange any options, all of which options were previously exercised. The restricted stock units are subject to the same vesting criteria as all other restricted stock units granted in connection with the Option Exchange (see “Compensation Discussion and Analysis—Option Exchange Program”). The following table sets forth certain information concerning the options surrendered by, and the restricted stock units granted to, each of our non-employee Directors in connection with the Option Exchange.
| Name |
Exchanged Options | Restricted Stock Units Received |
||||||||||
| Number of Shares |
Exercise Price |
|||||||||||
| Michael F. Finley |
0 | N/A | 2,500 | |||||||||
| Donald J. Morrison |
1,000 | $ | 100 | 3,000 | ||||||||
| Joseph A. Onorato |
2,000 | $ | 100 | 3,000 | ||||||||
| Joseph E. Parzick |
1,000 | $ | 100 | 3,000 | ||||||||
| John M. Riess |
2,000 | $ | 100 | 3,000 | ||||||||
| James A. Stern |
1,000 | $ | 100 | 3,000 | ||||||||
The following table summarizes compensation for our non-employee directors for 2010.
| Name(1) |
Fees Earned or Paid in Cash ($) |
Stock Awards(2) ($) |
Option Awards($) |
Non-Equity Incentive Plan Compensation ($) |
Change in Pension Value and Nonqualified Deferred Compensation Earnings ($) |
All Other Compensation ($) |
Total ($) |
|||||||||||||||||||||
| Michael F. Finley |
72,500 | 269,300 | -0- | -0- | -0- | -0- | 341,800 | |||||||||||||||||||||
| Larry W. McCurdy(3) |
37,000 | -0- | -0- | -0- | -0- | -0- | 37,000 | |||||||||||||||||||||
| Donald J. Morrison(4) |
69,500 | 241,900 | -0- | -0- | -0- | -0- | 311,400 | |||||||||||||||||||||
| Joseph A. Onorato |
125,500 | 160,640 | -0- | -0- | -0- | -0- | 286,140 | |||||||||||||||||||||
| Joseph E. Parzick |
60,500 | 241,900 | -0- | -0- | -0- | -0- | 302,400 | |||||||||||||||||||||
| John M. Riess |
74,000 | 160,640 | -0- | -0- | -0- | -0- | 234,640 | |||||||||||||||||||||
| James A. Stern |
62,000 | 241,900 | -0- | -0- | -0- | -0- | 303,900 | |||||||||||||||||||||
| (1) | Mr. Finley resigned from our Board effective March 1, 2011. Mr. William M. Lasky and Mr. James S. McElya did not serve on our Board during 2010 and earned no fees or other compensation from the Company. |
| (2) | Other than with respect to Mr. Finley, the amounts reported for 2010 reflect the incremental fair value of restricted stock units granted during the fiscal year in connection with the Option Exchange in accordance with FASB ASC Topic 718, “Compensation – Stock Compensation” (“ASC Topic 718”). Amount reported for Mr. Finley for 2010 reflects the grant date fair value of the restricted stock units granted to him on October 18, 2010 in connection with the Option Exchange in accordance with ASC Topic 718. These are not the values actually received. The actual value Directors may receive will depend on whether the performance criteria are met and, if so, the fair market value of Holdings’ common stock at that time. The incremental fair value under ASC Topic 718 was determined by calculating the fair value of the restricted stock units on October 18, 2010, the closing date of the Option Exchange, minus the fair value of the outstanding options on October 18, 2010. The fair value of each Director’s (other than Mr. Finley, who had previously exercised his options to purchase Holdings common stock) outstanding options on October 18, 2010, immediately preceding the Option Exchange was as follows: Morrison: $81,260; Onorato: $162,520; Parzick: $81,260; Riess: $162,520; and Stern: $81,260. The fair value of the restricted stock units received in connection with the Option Exchange was calculated by multiplying the number of restricted stock units awarded by the fair market value of the restricted stock units on the date of the grant, immediately following the Option Exchange, assuming that the restricted stock units vest on satisfaction of the vesting condition described as the “Cypress Scenario” in Note 13. “Stock Incentive Plan – Restricted Stock Units” of our Consolidated Financial Statements contained in Item 8. “Financial Statements and Supplementary Data” of this Annual Report on Form 10-K. Assuming the restricted stock units vest on satisfaction of the vesting condition described as the “IPO Scenario” in Note 13 to our Consolidated Financial Statements, the fair market value of the restricted stock units would be increased and the incremental fair value amounts (or, with respect to Mr. Finley, the grant date fair value) reported would change as follows: Finley: $310,625; Morrison: $291,490; Onorato: $210,230; Parzick: $291,490; Riess: $210,230; and Stern: $291,490. |
110
Table of Contents
| (3) | Mr. McCurdy served as a Director on our Board in 2010 and until his death on August 3, 2010. |
| (4) | Mr. Morrison’s fees were paid directly to his employer in accordance with his employer’s policies regarding employee participation on boards of directors of the employer’s investment portfolio companies. Mr. Morrison’s restricted stock units were granted directly to his employer in accordance with his employer’s policies regarding employee participation on boards of directors of the employer’s investment portfolio companies. |
Compensation Committee Interlocks and Insider Participation
No member of the Compensation Committee was at any time during 2010, or at any other time, one of our officers or employees or had any relationship requiring disclosure by us under any paragraph of Item 404 of Regulation S-K. None of our executive officers served on the compensation committee or Board of Directors of another entity whose executive officer(s) served on our Compensation Committee or Board of Directors.
Compensation Committee Report
The Compensation Committee has reviewed and discussed the foregoing Compensation Discussion and Analysis with management and, based on that review and discussion, the Compensation Committee recommended to the Board of Directors that the Compensation Discussion and Analysis be included in our annual report on Form 10-K.
The Compensation Committee
James A. Stern, Chairman
James S. McElya
Joseph A. Onorato
John M. Riess
| Item 12. | Security Ownership of Certain Beneficial Owners and Management and Related Stockholder Matters |
(a) Equity Compensation Plan Information
The following table sets forth information about our common stock that may be issued under all of our existing equity compensation plans as of December 31, 2010, including the 2005 Stock Plan (a description of which may be found above under the heading “Equity Incentive Plan Awards”).
| Plan Category |
Number of securities to be issued upon exercise of outstanding options, warrants and rights |
Weighted average exercise price of outstanding options, warrants and rights |
Number
of securities remaining available for future issuance (excluding securities reflected in column (a)) |
|||||||||
| Equity compensation plans approved by security holders |
N/A | N/A | N/A | |||||||||
| Equity compensation plans not approved by security holders: |
293,192 | (1) | $ | 100.00 | (2) | 56,808 | (3) | |||||
| Total |
293,192 | $ | 100.00 | 56,808 | ||||||||
| (1) | Consists of 34,062 shares of Holding’s common stock issuable upon the exercise of outstanding options and 239,000 shares of Holdings’ common stock issuable upon the vesting of restricted stock units awarded under the Affinia Group Holdings Inc. 2005 Stock Incentive (the “2005 Stock Plan”). Also includes 19,967 shares of Holdings’ common stock that may be issued under the Affinia Group Senior Executive Deferred Compensation and Stock Award Plan and 163 shares that were issued as a stock award. |
| (2) | Weighted-average exercise price does not include restricted stock units or shares issuable under the Affinia Group Senior Executive Deferred Compensation and Stock Award Plan, which by their nature do not have an exercise price. |
111
Table of Contents
| (3) | Consists of shares of Holdings’ common stock issuable under the 2005 Stock Plan pursuant to various awards the compensation committee of the Board of Directors may make, including non-qualified stock options, incentive stock options, restricted and unrestricted stock, restricted stock units and other equity-based awards. See “Item 11. Executive Compensation” for a description of the 2005 Stock Plan. |
(b) Security Ownership of Certain Beneficial Owners and Management
Affinia Group Holdings Inc. owns 100% of the issued and outstanding common stock of Affinia Group Intermediate Holdings Inc. Affinia Group Intermediate Holdings Inc. owns 100% of the issued and outstanding common stock of Affinia Group Inc.
The following table and accompanying footnotes show information regarding the beneficial ownership of the common stock of Affinia Group Holdings Inc. as of March 11, 2011 by (1) each person known by us, based on information available to us, to beneficially own more than 5% of the issued and outstanding common stock of Affinia Group Holdings Inc., (2) each of our directors and nominees, (3) each named executive officer and (4) all directors and executive officers as a group.
The amounts and percentages of common stock beneficially owned are reported on the basis of regulations of the SEC governing the determination of beneficial ownership of securities. Under the SEC rules, a person is deemed to be a beneficial owner of a security if that person has or shares voting power, which includes the power to vote or to direct the voting of such security, or investment power, which includes the power to dispose of or to direct the disposition of such security. Unless otherwise indicated below, each beneficial owner named in the table below has sole voting and sole investment power with respect to all shares beneficially owned, subject to community property laws where applicable.
Except as otherwise indicated in the footnotes below, each of the beneficial owners has, to our knowledge, sole voting and investment power with respect to the indicated shares of common stock. Unless otherwise noted, the address of each beneficial owner is 1101 Technology Drive, Ann Arbor, Michigan 48108.
| Names and addresses of beneficial owner |
Amount and Nature of Beneficial Ownership(1) |
Percentage of Class |
||||||
| The Cypress Group L.L.C. |
2,175,000 | (2) | 61.1 | % | ||||
| The address of each of the Cypress Funds and Cypress Side-By-Side L.L.C. is c/o The Cypress Group L.L.C., 437 Madison Avenue, 33rd Floor, New York, NY 10022 |
||||||||
| OMERS Administration Corporation |
700,000 | 19.7 | % | |||||
| The address of OMERS Administration Corporation is c/o Omers Capital, Royal Bank Plaza, South Tower, 200 Bay Street, Suite 2010, Box 6, Toronto, Ontario, Canada M5J 2J2. |
||||||||
| The Northwestern Mutual Life Insurance Company |
400,000 | 11.2 | % | |||||
| The address of The Northwestern Mutual Life Insurance Company is 720 East Wisconsin Avenue, Milwaukee, WI 53202. |
||||||||
| California State Teachers’ Retirement System |
200,000 | 5.6 | % | |||||
| The address of California State Teachers’ Retirement System is 7667 Folsom Blvd., Sacramento, CA 95826. |
||||||||
112
Table of Contents
| Common Stock Ownership |
||||||||||||
| Name of beneficial owner |
Common Stock Owned |
Common Stock Acquirable in 60 days |
Total | |||||||||
| Lasky |
-0- | -0- | -0- | |||||||||
| McElya |
-0- | -0- | -0- | |||||||||
| Morrison |
-0- | -0- | -0- | |||||||||
| Onorato |
-0- | -0- | -0- | |||||||||
| Parzick |
-0- | -0- | -0- | |||||||||
| Riess |
250.00 | -0- | 250.00 | |||||||||
| Stern |
-0- | -0- | -0- | |||||||||
| McCormack |
1,500.00 | -0- | 1,500.00 | |||||||||
| Madden |
750.00 | -0- | 750.00 | |||||||||
| Wilson |
550.00 | -0- | 550.00 | |||||||||
| Schertel |
250.00 | -0- | 250.00 | |||||||||
| Overbeeke |
-0- | -0- | -0- | |||||||||
| Keller |
500.00 | -0- | 500.00 | |||||||||
| Zorn |
250.00 | -0- | 250.00 | |||||||||
| Mehall |
-0- | -0- | -0- | |||||||||
| Manning |
-0- | -0- | -0- | |||||||||
| All Directors and Executive officers* |
4,050.00 | -0- | 4,050.00 | |||||||||
| * | The executive officers or members of the Board of Directors of Affinia Group Inc. currently hold 0.1138% of shares of the outstanding common stock of Affinia Group Holdings Inc. The amount of ownership for each Named Executive Officer or member of the Board is shown above and each of the executive officers or members of the Board own less than 1.0% of outstanding shares. |
| (1) | Applicable percentage of ownership is based on 3,558,463 shares of common stock outstanding as of March 11, 2011 plus, as to any person, shares are deemed to be beneficially owned by such person if the person has the right to acquire the shares (for example, upon exercise of an option) within 60 days of the date as of which the information is provided. In computing the percentage ownership of any person, the amount of shares outstanding is deemed to include the amount of shares beneficially owned by such person (and only such person) by reason of these acquisition rights. |
| (2) | Includes 2,063,038 shares of common stock owned by Cypress Merchant Banking Partners II L.P., 87,703 shares of common stock owned by Cypress Merchant Banking II C.V., 19,909 shares of common stock owned by 55th Street Partners II L.P. (collectively, the “Cypress Funds”) and 4,350 shares of common stock owned by Cypress Side-by-Side LLC. Cypress Associates II L.L.C. is the managing general partner of Cypress Merchant Banking II C.V. and the general partner of Cypress Merchant Banking Partners II L.P. and 55th Street Partners II L.P., and has voting and investment power over the shares held or controlled by each of these funds. Certain executives of The Cypress Group L.L.C., including Messrs. Jeffrey Hughes and James Stern, may be deemed to share beneficial ownership of the shares shown as beneficially owned by the Cypress Funds. Each of such individuals disclaims beneficial ownership of such shares. Cypress Side-By-Side L.L.C. is a sole member-L.L.C. of which Mr. James Stern is the sole member. |
The following table and accompanying footnotes show information regarding the beneficial ownership of the preferred stock of Affinia Group Holdings Inc. as of March 11, 2011 by (1) each person known by us to beneficially own more than 5% of the issued and outstanding preferred stock of Affinia Group Holdings Inc., (2) each of our directors and nominees, (3) each named executive officer and (4) all directors and executive officers as a group. The preferred stock was issued at $1,000 per share and, among other things, is convertible to common stock at a conversion price of $100 per share and earns a dividend of 9.5% per annum. A complete description of the rights of preferred stockholders may be found in the certificate of designations on file with the Delaware Secretary of State.
113
Table of Contents
| Names and addresses of beneficial owner |
Nature and Amount of Beneficial Ownership(1) |
Percentage of Class |
||||||
| The Cypress Group L.L.C. |
49,684 | 77.745 | % | |||||
| The address of each of the Cypress Funds and Cypress Side-By-Side L.L.C. is c/o The Cypress Group L.L.C., 437 Madison Avenue, 33rd Floor, New York, NY 10022. |
||||||||
| OMERS Administration Corporation |
12,421 | 19.436 | % | |||||
| The address of OMERS Administration Corporation is c/o Omers Capital, Royal Bank Plaza, South Tower, 200 Bay Street, Suite 2010, Box 6, Toronto, Ontario, Canada M5J 2J2. |
||||||||
| Name of Individual or Identity of Group |
||||||||
| Terry R. McCormack |
124 | 0.194 | % | |||||
| Thomas H. Madden |
124 | 0.194 | % | |||||
| H. David Overbeeke |
93 | 0.146 | % | |||||
| Keith A. Wilson |
31 | 0.049 | % | |||||
| John M. Riess |
31 | 0.049 | % | |||||
| All executive officers and directors as a group |
403 | 0.632 | % | |||||
| (1) | Applicable percentage of ownership is based on 63,906 shares of preferred stock outstanding as of March 11, 2011. |
| Item 13. | Certain Relationships and Related Person Transactions and Director Independence |
Director Independence
The members of our Board of Directors are James A. Stern, William M. Lasky, Terry R. McCormack, James S. McElya, Donald J. Morrison, Joseph A. Onorato, Joseph E. Parzick and John M. Riess. Though not formally considered by our Board of Directors, given that our securities are not registered or traded on any national securities exchange, based upon the listing standards of the New York Stock Exchange, we do not believe that Mr. Stern, Mr. McCormack or Mr. Parzick would be considered independent either because they serve as members of our management team or because of their relationships with various Cypress funds or certain affiliates of Affinia Group Holdings Inc. or other entities that hold significant interests in Affinia Group Holdings Inc. We do believe that Mr. Lasky, Mr. McElya, Mr. Morrison, Mr. Onorato and Mr. Riess would qualify as “independent” based on the New York Stock Exchange’s director independence standards for listed companies.
Investor Stockholders Agreement
Pursuant to the Stockholders Agreement dated as of November 30, 2004, among Affinia Group Holdings Inc., various Cypress funds, OMERS, The Northwestern Mutual Life Insurance Company, California State Teachers’ Retirement System and Stockwell Fund, L.P., the number of directors serving on the Board of Directors will be no less than seven and no more than eleven. The Stockholders Agreement entitles Cypress to designate three directors. Cypress has currently appointed Mr. Stern, Mr. Parzick and Mr. McElya. As long as OMERS members own at least 50 percent in the aggregate of the number of shares owned by them on November 30, 2004, OMERS is entitled to designate one director, who currently is Mr. Morrison. Cypress is entitled to designate three directors who are not affiliated with any of the parties to the Stockholders Agreement, who currently are Mr. Lasky, Mr. Onorato and Mr. Riess. Additionally, the Stockholders Agreement entitles the individual serving as CEO, currently Mr. McCormack, and another individual serving as one of our senior officers, currently vacant, to seats on the Board of Directors. The Stockholders Agreement also provides that the nominating committee of the Board of Directors may from time to time select two additional individuals who must be independent to serve as Directors.
Other Related Person Transactions
We describe below the transactions that have occurred since the beginning of fiscal 2010, and any currently proposed transactions, that involve the Company or a subsidiary and exceed $120,000, and in which a related party had or has a direct or indirect material interest.
Mr. John M. Riess, a Board member, is the parent of J. Michael Riess, who is currently employed with Genuine Parts Company (NAPA) as president of a distribution facility. NAPA is the Company’s largest customer as a percentage of total net sales from continuing operations. NAPA accounted for $519 million, $523 million and $535 million, which represented 27%, 29% and 27% of our total net sales for the years ended December 31, 2008, 2009 and 2010, respectively.
114
Table of Contents
Effective January 1, 2011, we, along with Affinia Group Holdings Inc. and Affinia Group Inc., entered into an Advisory Agreement with Torque Capital Group LLC for services related to corporate strategy, finance, investments and such other services as we may request from time to time. Mr. Joseph E. Parzick, one of our directors, is a managing partner of Torque Capital Group LLC. In connection with the Advisory Agreement, we, along with Affinia Group Holdings Inc. and Affinia Group Inc., have agreed to pay a quarterly fee of $400,000 for six calendar quarters expiring June 30, 2012, and have further agreed to pay a success fee of up to $3.0 million in the event Affinia Group Holdings Inc.’s shareholders realize a specified return on their investment. A copy of the Advisory Agreement is attached as an Exhibit hereto.
Effective January 1, 2011, we, along with Affinia Group Holdings Inc. and Affinia Group Inc.,
entered into an Advisory Agreement with Cypress Advisors, Inc. for services related to corporate strategy, finance, investments and such other services as we may request from time to time. Mr. James A. Stern, one of our directors, is a
managing director of Cypress Advisors, Inc. In connection with the Advisory Agreement, we, along with Affinia Group Holdings Inc. and Affinia Group Inc., have agreed to pay a quarterly fee of $100,000 for six calendar quarters expiring June 30,
2012, and have further agreed to pay a success fee of up to
$2.0 million in the event Affinia Group Holdings Inc.’s shareholders realize a specified return on their investment. A copy of the Advisory Agreement is attached as an Exhibit
hereto.
Related Person Transactions Policy
Our Board has adopted a written statement of policy for the evaluation of and the approval, disapproval and monitoring of transactions involving us and “related persons.” For the purposes of the policy, “related persons” include our executive officers, directors and director nominees or their immediate family members, or stockholders owning five percent or more of our outstanding common stock.
Our related person transactions policy requires:
| • | that any transaction in which a related person has a material direct or indirect interest and which exceeds $120,000, such transaction referred to as a “related person transaction,” and any material amendment or modification to a related person transaction, be evaluated and approved or ratified by our Audit Committee or by the disinterested members of the Audit Committee; and |
| • | that any employment relationship or transaction involving an executive officer and any related compensation solely resulting from that employment relationship or transaction must be approved by the Compensation Committee of the Board or recommended by the Compensation Committee to the Board for its approval. |
In connection with the review and approval or ratification of a related person transaction:
| • | management must disclose to the Audit Committee or the disinterested members of the Audit Committee, as applicable, the material terms of the related person transaction, including the approximate dollar value of the amount involved in the transaction, and all the material facts as to the related person’s direct or indirect interest in, or relationship to, the related person transaction; |
| • | management must advise the Audit Committee or the disinterested members of the Audit Committee, as applicable, as to whether the related person transaction complies with the terms of our agreements governing our material outstanding indebtedness; |
| • | management must advise the Audit Committee or the disinterested members of the Audit Committee, as applicable, as to whether the related person transaction complies with the terms of our agreements governing our material outstanding indebtedness; |
| • | management must advise the Audit Committee or the disinterested members of the Audit Committee, as applicable, as to whether the related person transaction will be required to be disclosed in our SEC filings. To the extent it is required to be disclosed, management must ensure that the related person transaction is disclosed in accordance with SEC rules; and |
| • | management must advise the Audit Committee or the disinterested members of the Audit Committee, as applicable, as to whether the related person transaction constitutes a “personal loan” for purposes of Section 402 of Sarbanes-Oxley. |
In addition, the related person transaction policy provides that the Audit Committee, in connection with any approval or ratification of a related person transaction involving a non-employee director or director nominee, should consider whether such transaction would compromise the director or director nominee’s status as an “independent,” “outside,” or “non-employee” director, as applicable, under the rules and regulations of the SEC, The New York Stock Exchange and the Code. Subsequent to the adoption of the written procedures above, the Company has followed these procedures regarding all reportable related person transactions.
115
Table of Contents
| Item 14. | Independent Registered Public Accounting Firm Fees |
For services rendered in 2009 and 2010 by Deloitte and Touche LLP, our independent public accounting firm, we incurred the following fees:
| 2009 | 2010 | |||||||
| Audit Fees (1) |
$ | 3.8 | $ | 3.6 | ||||
| Tax Fees (2) |
$ | 1.0 | $ | 0.5 | ||||
| All Other Fees (3) |
$ | 1.6 | $ | 0.4 | ||||
| (1) | Represents fees incurred for the annuals audits of the consolidated financial statements, quarterly reviews of interim financial statements, statutory audits of foreign subsidiaries and SEC registration statements. |
| (2) | Represents fees incurred for U.S. and foreign income tax compliance, acquisition related tax services and state tax planning services. |
| (3) | Represents fees primarily incurred for services related to acquisitions and other professional services. |
The Audit Committee, as required by its Charter, approves in advance any audit or permitted non-audit engagement or relationship between the Company and the Company’s independent auditors. The Audit Committee has adopted an Audit and Non-Audit Services Pre-Approval Policy which provides that the Company’s independent auditors are only permitted to provide services to the Company that have been specifically approved by the Audit Committee or entered into pursuant to the pre-approval provisions of the Policy. All tax services to be performed by the independent auditors that fall within certain categories and certain designated dollar thresholds have been pre-approved under the Policy. All tax services that exceed the dollar thresholds and any other services must be approved in advance by the Audit Committee. The Audit Committee also has delegated approval authority, subject to certain dollar limitations, to the Chairman of the Audit Committee, who is an independent director. Pursuant to this delegation, the Chairman is required to present at each scheduled meeting, and as of the date of this report has presented, all approval decisions to the full Audit Committee.
PART IV.
| Item 15. | Exhibits and Financial Statement Schedules |
| (a) | The following documents are filed as part of this report: |
| 1. | Financial Statements: |
See Item 8 above.
| 2. | Financial Statement Schedules: |
Schedule II—Valuation and Qualifying Accounts
The allowance for doubtful accounts is summarized below for the period ending December 31, 2008, December 31, 2009, and December 31, 2010:
| (Dollars in millions) | Balance at beginning of period |
Amounts charged to income |
Trade accounts receivable “written off” net of recoveries |
Adjustments arising from change in currency exchange rates and other items |
Balance at end of period |
|||||||||||||||
| Year ended December 31, 2008 |
$ | 4 | $ | 1 | $ | (1 | ) | $ | — | $ | 4 | |||||||||
| Year ended December 31, 2009 |
$ | 4 | $ | 4 | $ | (4 | ) | $ | (1 | ) | $ | 3 | ||||||||
| Year ended December 31, 2010 |
$ | 3 | $ | — | $ | — | $ | (1 | ) | $ | 2 | |||||||||
All other financial statement schedules are not required under the relevant instructions or are inapplicable and therefore have been omitted.
| 3. | Exhibits |
The agreements and other documents filed as exhibits to this report are not intended to provide factual information or other disclosure other than with respect to the terms of the agreements or other documents themselves and you should not rely on them for that purpose. In particular, any representations and warranties made by us in these agreements or other documents were made solely within the specific context of the relevant agreement or document and may not describe the actual state of affairs as of the date they were made or at any other time.
116
Table of Contents
| Exhibit |
Description of Exhibit | |
| 3.5 | Certificate of Incorporation of Affinia Group Intermediate Holdings Inc., which is incorporated herein by reference from Exhibit 3.5 of the Registration Statement on Form S-4 of Affinia Group Intermediate Holdings Inc. filed on September 8, 2005. | |
| 3.6 | By-laws of Affinia Group Intermediate Holdings Inc., which is incorporated herein by reference from Exhibit 3.6 of the Registration Statement on Form S-4 of Affinia Group Intermediate Holdings Inc. filed on September 8, 2005. | |
| 4.1 | Indenture, dated as of November 30, 2004, among Affinia Group Inc., the Guarantors named therein and Wilmington Trust Company, as Trustee, which is incorporated herein by reference from Exhibit 4.1 of the Registration Statement on Form S-4 of Affinia Group Intermediate Holdings Inc. filed on September 8, 2005. | |
| 4.4 | 9% Senior Subordinated Notes due 2014, Rule 144A Global Note, which is incorporated herein by reference from Exhibit 4.4 of the Registration Statement on Form S-4 of Affinia Group Intermediate Holdings Inc. filed on September 8, 2005. | |
| 4.5 | 9% Senior Subordinated Notes due 2014, Regulation S Global Note, which is incorporated herein by reference from Exhibit 4.5 of the Registration Statement on Form S-4 of Affinia Group Intermediate Holdings Inc. filed on September 8, 2005. | |
| 4.6 | Registration Rights Agreement with respect to 9% Senior Subordinated Notes due 2014 among the Company, the Guarantors and J.P. Morgan Securities LLC, as representative of the initial purchasers named therein, dated December 9, 2010, which is incorporated herein by reference from Exhibit 4.4 on Form 8-K of Affinia Group Intermediate Holdings Inc. filed on December 15, 2010. | |
| 4.7 | Indenture, dated August 13, 2009, among the Company, the Guarantors and Wilmington Trust FSB, as trustee and noteholder collateral agent, which is incorporated herein by reference from Exhibit 4.1 on Form 8-K of Affinia Group Intermediate Holdings Inc. filed on August 19, 2009. | |
| 4.8 | Form of 10.75% Senior Secured Note Due 2016, which is incorporated herein by reference from Exhibit 4.2 on Form 8-K of Affinia Group Intermediate Holdings Inc. filed on August 19, 2009. | |
| 10.9# | Affinia Group Senior Executive Deferred Compensation and Stock Award Plan, dated as of March 6, 2008, which is incorporated herein by reference from Exhibit 10.9 on Form 10-K/A of Affinia Group Intermediate Holdings Inc. filed on March 14, 2008. | |
| 10.10 | Settlement Agreement dated as of November 20, 2007 by and between Dana Corporation and Affinia Group Inc. , which is incorporated herein by reference from Exhibit 10.10 on Form 10-K/A of Affinia Group Intermediate Holdings Inc. filed on March 14, 2008. | |
| 10.11 | Stockholders Agreement, dated as of November 30, 2004, among Affinia Group Holdings Inc., various Cypress funds, Ontario Municipal Employees Retirement Board, The Northwestern Mutual Life Insurance Company, California State Teachers’ Retirement System and Stockwell Fund, L.P., which is incorporated herein by reference from Exhibit 10.10 of the Registration Statement on Form S-4 of Affinia Group Intermediate Holdings Inc. filed on September 8, 2005. | |
| 10.12* | Amendment to Stockholders Agreement, dated January 24, 2005, among Affinia Group Holdings Inc., various Cypress funds, Ontario Municipal Employees Retirement Board, The Northwestern Mutual Life Insurance Company, California State Teachers’ Retirement System and Stockwell Fund, L.P. | |
| 10.13# | Amended and Restated Employment Agreement, dated December 15, 2008, by and between Affinia Group Inc. and Terry R. McCormack, which is incorporated herein by reference from Exhibit 10.12 on Form 10-K of Affinia Group Intermediate Holdings Inc. filed on March 6, 2009. | |
| 10.14# | Amendment No. 1 to the Amended and Restated Employment Agreement, dated August 12, 2010, by and between Affinia Group Inc. and Terry R. McCormack, which is incorporated herein by reference from Exhibit 10.24 of Amendment No. 1 to the Registration Statement on Form S-1 of Affinia Group Holdings Inc. filed on August 12, 2010. | |
| 10.15# | Amended and Restated Employment Agreement, dated December 15, 2008, by and between Affinia Group Inc. and Keith A. Wilson, which is incorporated herein by reference from Exhibit 10.13 on Form 10-K of Affinia Group Intermediate Holdings Inc. filed on March 6, 2009. | |
| 10.16# | Amendment No. 1 to the Amended and Restated Employment Agreement, dated August 12, 2010, by and between Affinia Group Inc. and Keith A. Wilson, which is incorporated herein by reference from Exhibit 10.25 of Amendment No. 1 to the Registration Statement on Form S-1 of Affinia Group Holdings Inc. filed on August 12, 2010. | |
117
Table of Contents
| Exhibit |
Description of Exhibit | |
| 10.17# | Amended and Restated Employment Agreement, dated December 15, 2008, by and between Affinia Group Inc. and Thomas H. Madden, which is incorporated herein by reference from Exhibit 10.15 on Form 10-K of Affinia Group Intermediate Holdings Inc. filed on March 6, 2009. | |
| 10.18# | Amendment No. 1 to the Amended and Restated Employment Agreement, dated August 12, 2010, by and between Affinia Group Inc. and Thomas H. Madden, which is incorporated herein by reference from Exhibit 10.23 of Amendment No. 1 to the Registration Statement on Form S-1 of Affinia Group Holdings Inc. filed on August 12, 2010. | |
| 10.19# | Amended and Restated Employment Agreement, dated December 15, 2008, by and between Affinia Group Inc. and Steven E. Keller, which is incorporated herein by reference from Exhibit 10.16 on Form 10-K of Affinia Group Intermediate Holdings Inc. filed on March 6, 2009. | |
| 10.20# | Amendment No. 1 to the Amended and Restated Employment Agreement, dated August 12, 2010, by and between Affinia Group Inc. and Steven E. Keller, which is incorporated herein by reference from Exhibit 10.22 of Amendment No. 1 to the Registration Statement on Form S-1 of Affinia Group Holdings Inc. filed on August 12, 2010. | |
| 10.21# | Affinia Group Holdings Inc. 2005 Stock Incentive Plan amended as of November 14, 2006 and January 1, 2007, which is incorporated herein by reference from Exhibit 10.18 on Form 10-K of Affinia Group Intermediate Holdings Inc. filed on March 6, 2009. | |
| 10.22# | Amendment to Affinia Group Holdings Inc. 2005 Stock Incentive Plan, dated August 25, 2010, which is incorporated herein by reference from Exhibit 10.28 on Form 10-Q of Affinia Group Intermediate Holdings Inc. filed November 12, 2010. | |
| 10.23#* | Amendment to Affinia Group Holdings Inc. 2005 Stock Incentive Plan, dated December 2, 2010. | |
| 10.24# | Form of Nonqualified Stock Option Agreement, which is incorporated herein by reference from Exhibit 10.17 of the Registration Statement on Form S-4 of Affinia Group Intermediate Holdings Inc. filed on September 8, 2005. | |
| 10.25 | Form of Management Stockholder’s Agreement, which is incorporated herein by reference from Exhibit 10.11 of Amendment No. 3 to the Registration Statement on Form S-1 of Affinia Group Holdings Inc. filed on November 22, 2010. | |
| 10.26 | Form of Sale Participation Agreement, which is incorporated herein by reference from Exhibit 10.12 of Amendment No. 3 to the Registration Statement on Form S-1 of Affinia Group Holdings Inc. filed on November 22, 2010. | |
| 10.27 | Form of Supplemental Agreement to the Management Stockholder’s Agreement and the Sale Participation Agreement, which is incorporated herein by reference from Exhibit 10.26 on Form 10-Q of Affinia Group Intermediate Holdings Inc. filed on November 12, 2010. | |
| 10.28 | Form of Management Confidentiality, Non-Competition and Proprietary Information Agreement, which is incorporated herein by reference from Exhibit 10.27 on Form 10-Q of Affinia Group Intermediate Holdings Inc. filed on November 12, 2010. | |
| 10.29 | Form of Restricted Stock Unit Agreement, which is incorporated herein by reference from Exhibit 10.29 of Amendment No. 3 to the Registration Statement on Form S-1 of Affinia Group Holdings Inc. filed on November 22, 2010. | |
| 10.30 | Shares Transfer Agreement, dated as of June 30, 2008, between Zhang Haibo and Affinia Group Inc., which is incorporated herein by reference from Exhibit 10.1 on Form 8-K of Affinia Group Intermediate Holdings Inc. filed on July 2, 2008. | |
| 10.31 | Shareholders’ Agreement, dated October 31, 2008, among Zhang Haibo, Affinia Acquisition LLC and HBM Investment Limited, which is incorporated herein by reference from Exhibit 10.14 of the Registration Statement on Form S-1 of Affinia Group Holdings Inc. filed on June 25, 2010. | |
| 10.32 | ABL Credit Agreement, dated August 13, 2009, which is incorporated herein by reference from Exhibit 10.1 on the Registration Statement on Form S-1 of Affinia Group Holdings Inc. filed on August 12, 2010. | |
| 10.33 | Omnibus Amendment to ABL Credit Agreement, dated September 15, 2009, which is incorporated herein by reference from Exhibit 10.16 of Amendment No. 1 to the Registration Statement on Form S-1 of Affinia Group Holdings Inc. filed on August 12, 2010. | |
| 10.34 | Second Amendment to ABL Credit Agreement, dated March 8, 2010, which is incorporated herein by reference from Exhibit 10.17 of Amendment No. 1 to the Registration Statement on Form S-1 of Affinia Group Holdings Inc. filed on August 12, 2010. | |
118
Table of Contents
| Exhibit |
Description of Exhibit | |
| 10.35 | Third Amendment to ABL Credit Agreement, dated November 30, 2010, which is incorporated by reference from Exhibit 1.01 on Form 8-K of Affinia Group Holdings Inc. filed on December 6, 2010. | |
| 10.36 | Collateral Agreement, dated August 13, 2009, among the Company, the Guarantors, and Wilmington Trust FSB, as collateral agent, which is incorporated herein by reference from Exhibit 4.4 on Form 8-K of Affinia Group Intermediate Holdings Inc. filed on August 19, 2009. | |
| 10.37 | U.S. Security Agreement, dated August 13, 2009, among the Company, the Guarantors, and Bank of America, N.A., as collateral agent, which is incorporated herein by reference from Exhibit 4.5 on Form 8-K of Affinia Group Intermediate Holdings Inc. filed on August 19, 2009. | |
| 10.38 | Lien Subordination and Intercreditor Agreement, dated August 13, 2009, among the Company, the Guarantors, and Bank of America, N.A., as collateral agent and Wilmington Trust FSB, as noteholder collateral agent, which is incorporated herein by reference from Exhibit 4.6 on Form 8-K of Affinia Group Intermediate Holdings Inc. filed on August 19, 2009. | |
| 10.39 | Agreement between Brake Parts Inc. and Klarius Group Limited and Bank of America, N.A.S. dated February 2, 2010, which is incorporated herein by reference from Exhibit 10.1 on Form 8-K of Affinia Group Intermediate Holdings Inc. filed on February 8, 2010. | |
| 10.40* | Advisory Agreement, dated January 1, 2011, among Affinia Group Inc., Affinia Group Intermediate Holdings Inc., Affinia Group Holdings Inc. and Cypress Advisors, Inc. | |
| 10.41* | Advisory Agreement, dated January 1, 2011, among Affinia Group Inc., Affinia Group Intermediate Holdings Inc., Affinia Group Holdings Inc. and Torque Capital Group LLC. | |
119
Table of Contents
| Exhibit |
Description of Exhibit | |
| 21.1* | List of Subsidiaries. | |
| 31.1* | Certification of the Chief Executive Officer pursuant to Rule 13a-14(a) of Securities Exchange Act of 1934, as adopted pursuant to Section 302 of the Sarbanes-Oxley Act of 2002. | |
| 31.2* | Certification of the Chief Financial Officer pursuant to Rule 13a-14(a) of Securities Exchange Act of 1934, as adopted pursuant to Section 302 of the Sarbanes-Oxley Act of 2002. | |
| 32.1* | Certification of Terry R. McCormack, our Chief Executive Officer, President and Director, and Thomas H. Madden, our Senior Vice President and Chief Financial Officer, pursuant to 18 U.S.C. Section 1350, as adopted pursuant to Section 906 of the Sarbanes-Oxley Act of 2002. | |
| * | filed herewith |
| # | management contract or compensatory plan or arrangement |
120
Table of Contents
SIGNATURES
Pursuant to the requirements of section 13 or 15(d) of the Securities Exchange Act of 1934, the registrant has duly caused this report to be signed on its behalf by the undersigned, thereunto duly authorized.
| AFFINIA GROUP INTERMEDIATE HOLDINGS INC. | ||
| By: | /S/ TERRY R. MCCORMACK | |
| Terry R. McCormack | ||
|
President, Chief Executive Officer, and Director (Principal Executive Officer) | ||
Date: March 11, 2011
Pursuant to the requirements of the Securities Exchange Act of 1934, this report has been signed below by the following persons on behalf of the registrant and in the capacities indicated on March 11, 2011.
| Signature |
Title | |||
| By: | /S/ TERRY R. MCCORMACK Terry R. McCormack |
President, Chief Executive Officer, and Director (Principal Executive Officer) | ||
| By: | /S/ THOMAS H. MADDEN Thomas H. Madden |
Senior Vice President and Chief Financial Officer (Principal Financial Officer) | ||
| By: | /S/ THOMAS H. MADDEN Thomas H. Madden |
Senior Vice President and Chief Financial Officer (Principal Accounting Officer) | ||
| By: | /s/ James A. Stern James A. Stern |
Chairman of the Board of Directors | ||
| By: | /s/ William M. Lasky William M. Lasky |
Director | ||
| By: | /s/ James S. McElya James S. McElya |
Director | ||
| By: | /S/ DONALD J. MORRISON Donald J. Morrison |
Director | ||
| By: | /S/ JOSEPH A. ONORATO Joseph A. Onorato |
Director | ||
| By: | /s/ Joseph E. Parzick Joseph E. Parzick |
Director | ||
| By: | /S/ JOHN M. RIESS John M. Riess |
Director | ||
121