Attached files
| file | filename |
|---|---|
| 8-K - ALLIANCEBERNSTEIN L.P. 8-K 3-10-2011 - ALLIANCEBERNSTEIN L.P. | form8k.htm |
| EX-99.01 - EXHIBIT 99.01 - ALLIANCEBERNSTEIN L.P. | ex99_01.htm |
| EX-99.03 - EXHIBIT 99.03 - ALLIANCEBERNSTEIN L.P. | ex99_03.htm |
EXHIBIT 99.02

AllianceBernstein: Tradition and Change
Citigroup Financial Services Conference
March 10, 2011
David A. Steyn
Chief Operating Officer

1
AllianceBernstein.com
Certain statements provided by management in this news release are “forward-looking statements” within the meaning of the Private Securities Litigation Reform Act
of 1995. Such forward-looking statements are subject to risks, uncertainties, and other factors that could cause actual results to differ materially from future results
expressed or implied by such forward-looking statements. The most significant of these factors include, but are not limited to, the following: the performance of
financial markets, the investment performance of sponsored investment products and separately-managed accounts, general economic conditions, industry trends,
future acquisitions, competitive conditions, and current and proposed government regulations, including changes in tax regulations and rates and the manner in
which the earnings of publicly-traded partnerships are taxed. AllianceBernstein cautions readers to carefully consider such factors. Further, such forward-looking
statements speak only as of the date on which such statements are made; AllianceBernstein undertakes no obligation to update any forward-looking statements to
reflect events or circumstances after the date of such statements. For further information regarding these forward-looking statements and the factors that could
cause actual results to differ, see “Risk Factors” and “Cautions Regarding Forward-Looking Statements” in AllianceBernstein’s Form 10-K for the year ended
December 31, 2010. Any or all of the forward-looking statements made in this news release, Form 10-K, other documents AllianceBernstein files with or furnishes to
the SEC, and any other public statements issued by AllianceBernstein, may turn out to be wrong. It is important to remember that other factors besides those listed
in “Risk Factors” and “Cautions Regarding Forward-Looking Statements”, and those listed below, could also adversely affect AllianceBernstein’s financial condition,
results of operations and business prospects.
The forward-looking statements referred to in the preceding paragraph include statements regarding:
<The pipeline of new institutional mandates not yet funded: Before they are funded, institutional mandates do not represent legally binding commitments to fund
and, accordingly, the possibility exists that not all mandates will be funded in the amounts and at the times currently anticipated.
and, accordingly, the possibility exists that not all mandates will be funded in the amounts and at the times currently anticipated.
<Our confidence that we will outperform in equities in the months ahead which, combined with an improved risk appetite on the part of investors, will lead
to improved flows: We cannot predict the timing or degree of global market growth, nor our absolute or relative investment performance for our clients. The actual
performance of the capital markets and other factors beyond our control will affect our investment success for clients and asset flows. Furthermore, improved flows
depend on a number of factors, including our ability to deliver consistent, competitive investment performance, which cannot be assured, conditions of financial
markets, changes and volatility in political, economic, capital market or industry conditions, consultant recommendations, and changes in our clients’ investment
preferences, risk tolerances and liquidity needs.
<The degree to which the $89.6 million real estate charge we recorded during the third quarter of 2010 will reduce occupancy costs on existing real estate
in 2011 and subsequent years: The charge we recorded during the third quarter and our estimates of reduced occupancy costs in future years are based on
existing sub-leases, as well as our current assumptions of when we can sub-lease the remaining space and current market rental rates, which are factors largely
beyond our control. If our assumptions prove to be incorrect, we may be forced to take an additional charge and/or our estimated occupancy cost reductions may be
less than we currently anticipate.
<Our intention to continue to engage in open market purchases of Holding Units, from time to time, to help fund anticipated obligations under our
incentive compensation award program: The number of Holding Units needed in future periods to make incentive compensation awards is dependent upon
various factors, some of which are beyond our control, including fluctuation in the price of a Holding Unit.
incentive compensation award program: The number of Holding Units needed in future periods to make incentive compensation awards is dependent upon
various factors, some of which are beyond our control, including fluctuation in the price of a Holding Unit.
<Our confidence that we will deliver consistent, long-term value to all of our stakeholders: Changes and volatility in political, economic, capital market or
industry conditions can result in changes in demand for our products and services or impact the value of our assets under management, all of which may
significantly hinder our ability to execute on our strategy.
industry conditions can result in changes in demand for our products and services or impact the value of our assets under management, all of which may
significantly hinder our ability to execute on our strategy.
Cautions Regarding Forward-Looking Statements
2
AllianceBernstein.com
By Client Domicile
Firm-Wide Diversification
On Annualized Fee Base of $2.1 Billion
US
Non-US
By Channel
Institutions
Retail
Private
Client
As of December 31, 2010
Source: AllianceBernstein
December 31, 2010 AUM: $478 Billion
Breadth and Balance Across Channel and Geography

3
AllianceBernstein.com
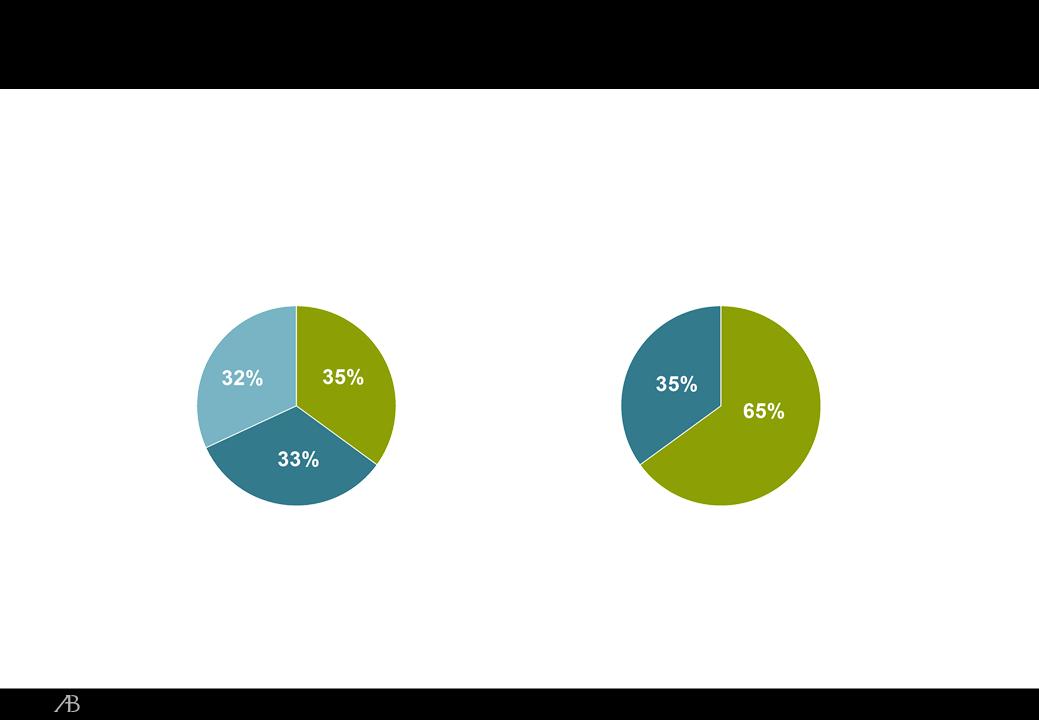
Institutional AUM
$272 Billion
Value
As of December 31, 2010
Source: AllianceBernstein
32%
12%
10%
45%
Growth
Fixed
Income
Income
Index
The Institutions Channel:
Significant Share of Global Institutional Assets
Significant Share of Global Institutional Assets
4
AllianceBernstein.com
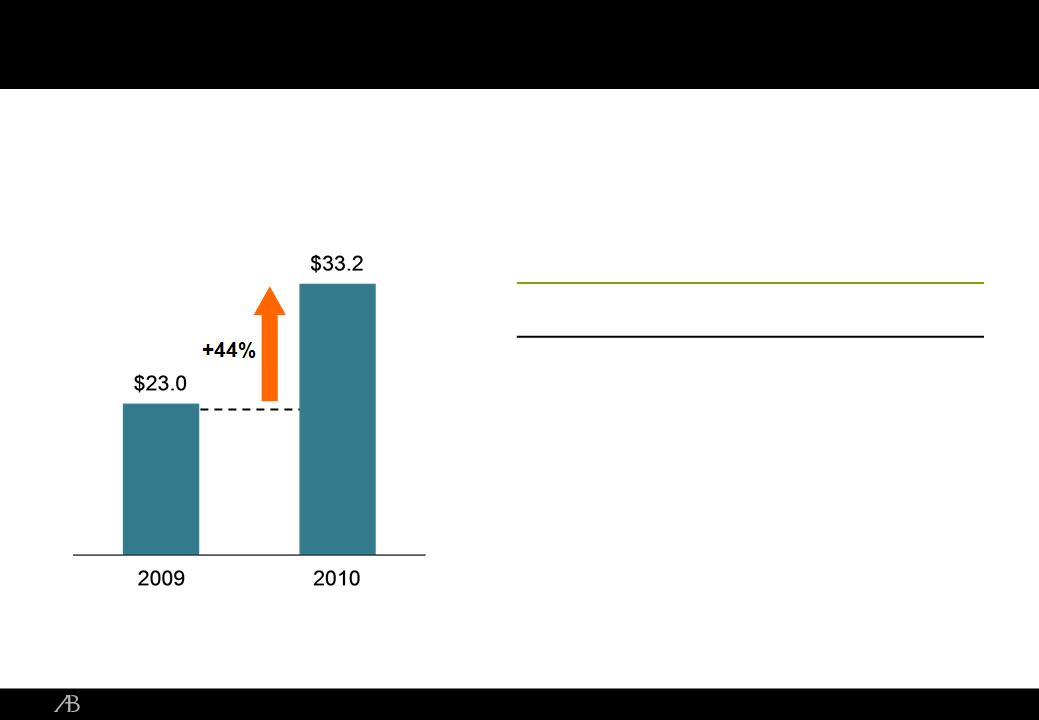
Retail Sales Growth in 2010
In US$ Billions
Retail Fixed Income
Global High Yield $7.3 $11.1 52%
American Income 1.7 3.3 94
US Municipal
Bond Funds 0.8 1.8 125
Bond Funds 0.8 1.8 125
Emerging Markets
Debt 0.0 0.5 —
Debt 0.0 0.5 —
Breadth and Velocity of Sales Momentum
2009 2010 % Change
As of December 31, 2010
Source: AllianceBernstein
The Retail Business:
Sales Growth and Product Momentum
Sales Growth and Product Momentum
5
AllianceBernstein.com
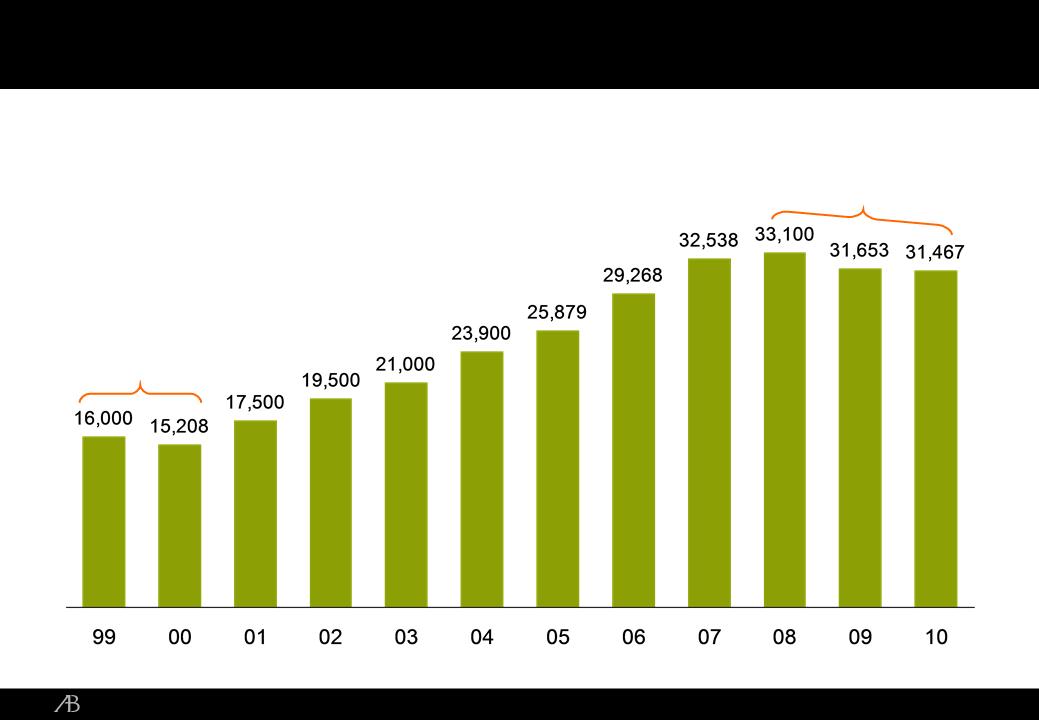
Private Client Relationships
Source: AllianceBernstein
(5)%
(5)%
Private Client:
A History of Growing Long-Term Relationships
A History of Growing Long-Term Relationships
6
AllianceBernstein.com
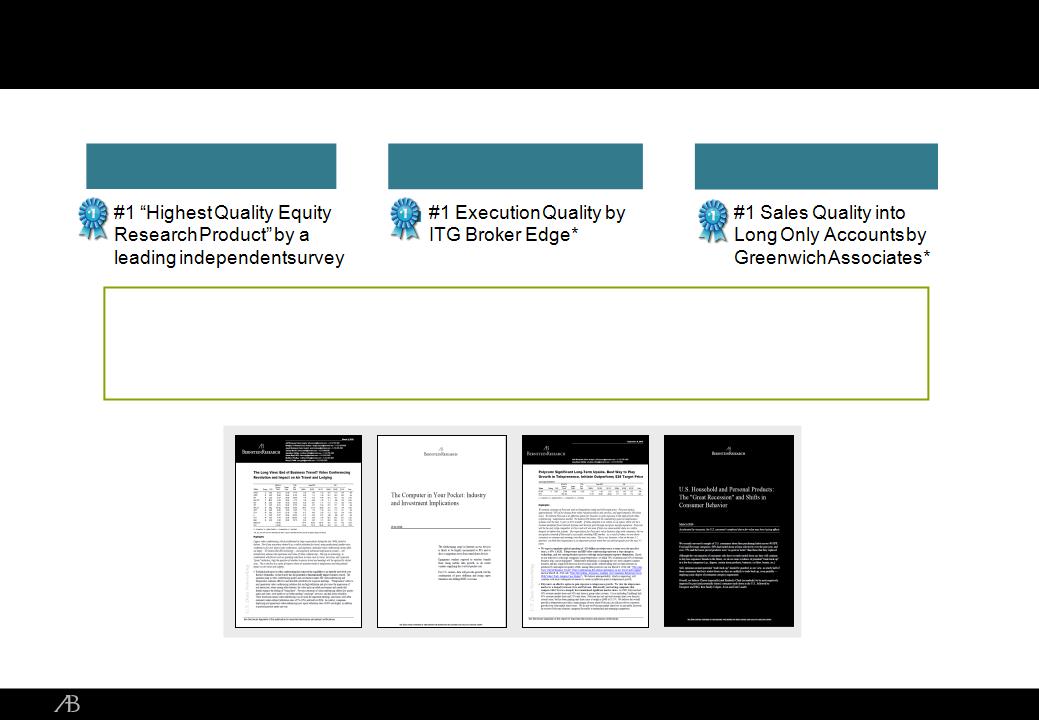
Sanford C. Bernstein:
Industry Leading Research and Trading Platform
Industry Leading Research and Trading Platform
Research
Trading
Sales
< A leader in research for nearly 40 years; known for insight, independence, integrity
< Today, 375 employees with seven offices in the US, Europe and Asia
< Growth driven by expansion of geographic footprint, trading capabilities, research product suite
*ITG Survey as of 2009; Greenwich Associates ranking as of 2010.
Source: AllianceBernstein

7
AllianceBernstein.com
üSolving the DB/DC Dilemma
üRisk Reduction Strategies (volatility and inflation risk)
üHolistic Exposure to Liquid and Illiquid Alternatives
üAppetite for Emerging Market Services
üUnconstrained, Cross-Sector Investing
üThe Move to Passive
üThe Rise of the Global Investor
AllianceBernstein and the Future of Money Management

8
Integrated
Multi-Insurer
Guarantees
Guarantees
Auto-Enrollment
and Participant
Communications
and Participant
Communications
Research-
Driven
Driven
Target-Date
Construction
Open-
Architecture
Target-Date
Fund Structure
Architecture
Target-Date
Fund Structure
DB Plan Benefits
AUM: Over $30 Billion*
*Includes won but not yet funded mandates as of December 31, 2010.
Bringing the Best of DB to DC:
ABDC Innovation in the Retirement Space
ABDC Innovation in the Retirement Space
9
AllianceBernstein.com
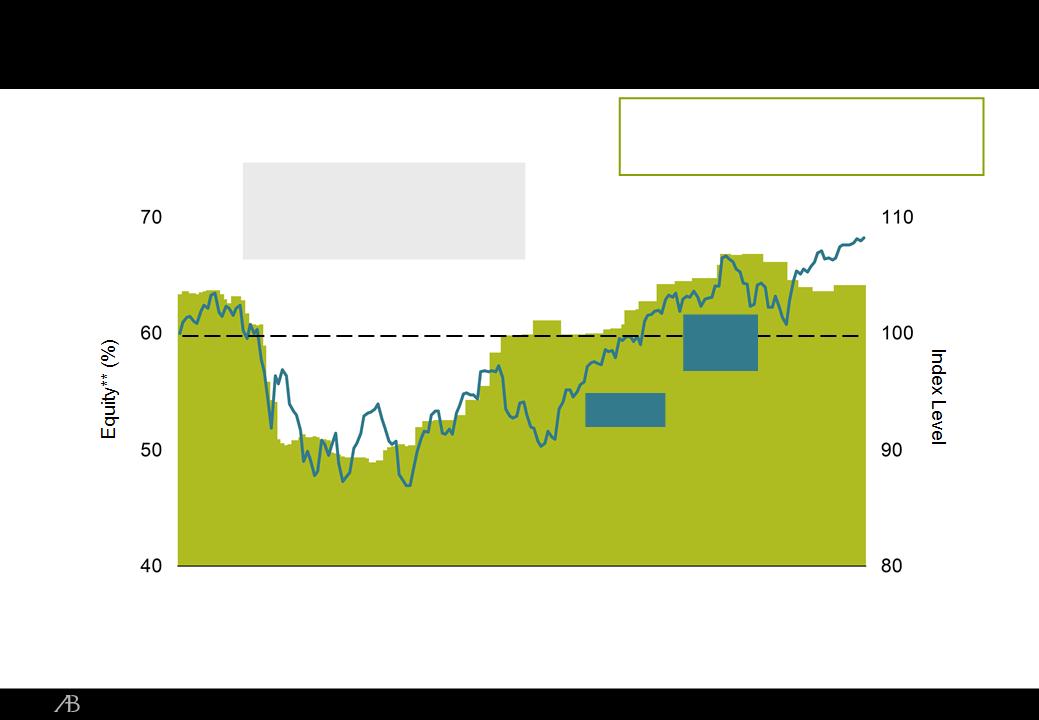
Strategic Allocation
Equity Weight
MSCI World Index
Apr
May
Jun
Jul
Aug
Sep
Oct
Nov
Dec
*Includes eligible private client assets serviced with an overlay of Dynamic Asset Allocation, as of December 31, 2010.
**“Equity” here refers to a 70% US equity and 30% international-equity allocation. The index is the Morgan Stanley Capital International (MSCI) World Index indexed to 100 on March 31, 2010.
MSCI makes no express or implied warranties or representations and shall have no liability whatsoever with respect to any MSCI data contained herein. The MSCI data may not be further
redistributed or used as a basis for other indexes or any securities or financial products. This document is not approved, reviewed or produced by MSCI.
Source: MSCI and AllianceBernstein
Greek Debt Crisis
“QE2”
Irish
Crisis
Crisis
Benefit of DAA:
1.3% Return Enhancement
90 bps Lower Volatility
AUM: Over $19 Billion*
üRisk Reduction Strategies
(Volatility)
(Volatility)
Smoothing the Investment Ride:
A Year in the Life of Dynamic Asset Allocation
A Year in the Life of Dynamic Asset Allocation

10
AllianceBernstein.com
Cash
Diversified
Bonds
Diversified
Stocks
Stocks
Cash
Diversified
Stocks
Stocks
Real Cash
Real
Assets
Assets
“Traditional” vs. Inflation-Protected Allocation
Diversified
Bonds
Real Assets represents the total return of a real asset portfolio (comprising one-third Commodity Stocks, one-third REITs, and one-third Commodity Futures fully collateralized by 10-year TIPS).
10-year Treasury Inflation-Protected Securities (TIPS) are calculated from synthetic AllianceBernstein real yields estimated from actual inflation and nominal yield curve variables before 1999 and
from Federal Reserve real yields thereafter. REITs (Real Estate) are sourced from the Ken French Data Library prior to 1972; they are represented by the NAREIT Equity REIT Index thereafter.
Commodity Stocks are sourced from the Ken French Data Library and are weighted by market-capitalization. Commodity Futures and Precious Metals Futures prior to 1990 are on a US
consumption-weighted basis and are sourced from AllianceBernstein series prior to 1970 and from the MJK Commodity Futures Database between 1970 and 1990; they are represented by the
Dow Jones-UBS Commodity Futures Index (DJ-UBS) thereafter. All futures returns are fully collateralized by T-bills unless otherwise indicated.
Source: AllianceBernstein
Commodity
Futures (incl.
TIPS and
Precious Metals),
Commodity
Stocks, REITs
Futures (incl.
TIPS and
Precious Metals),
Commodity
Stocks, REITs
Intermediate-Term
Inflation-Linked
Bonds (Taxable
and Muni)
Inflation-Linked
Bonds (Taxable
and Muni)
Short-Term
Inflation-Linked
Bonds
Inflation-Linked
Bonds
Real
Bonds
üRisk Reduction Strategies
(Inflation)
(Inflation)
A Comprehensive Inflation Suite:
Real Investments Complement Traditional Portfolio
Real Investments Complement Traditional Portfolio

11
AllianceBernstein.com
Comprehensive
< Single solution for gaining alternatives exposure through a strategic blend of third-party and proprietary
hedge fund strategies and private capital opportunities with diversification across strategy, manager
and vintage***
hedge fund strategies and private capital opportunities with diversification across strategy, manager
and vintage***
Integrated
< Allocation to alternatives customized to align with your traditional portfolio and risk tolerance; ability to
maintain appropriate mix of alternatives based on target allocations; cash flow management
maintain appropriate mix of alternatives based on target allocations; cash flow management
Transparent
< Capital markets and wealth management research; reporting on performance attribution and portfolio
exposures; manager commentary; risk analysis; consolidated tax reporting
exposures; manager commentary; risk analysis; consolidated tax reporting
Bernstein Alternative Investment Strategies
Fund of Funds
Fund of Funds
Hedge Fund Strategies
Private Capital**
*Includes SunAmerica acquisition and proprietary AllianceBernstein alternative funds.
**Private capital investments are expected to be available by 2012.
***Diversification by vintage will require a client to invest in a new Private Capital series year by year.
Source: AllianceBernstein
AUM: Over $12 Billion*
üHolistic Exposure
to Liquid and Illiquid Alts
to Liquid and Illiquid Alts
Integrated Approach to Alternative Investments:
Leading Research Influences Innovative Product Design
Leading Research Influences Innovative Product Design

12
AllianceBernstein.com
As of June 30, 2010
Source: AllianceBernstein
US$ Denominated 88%
Local Currency 12%
Growth 29%
Blend 30%
AUM: Over $40 Billion
üAppetite for Emerging Markets
Dedicated
Multisector
49%
51%
Dedicated
Global/
International
37%
63%
Emerging Strengths:
Significant Emerging Market Investment Focus
Significant Emerging Market Investment Focus

13
AllianceBernstein.com
Global
Cross-
Sector
Sector
Disruptive
Thematic
Alpha
Generation
Alpha
Generation
Web 2.0
Energy
Transformation
Transformation
(re) Emerging
Middle Class
Middle Class
Genomic Age
Financial Reformation
ü Unconstrained, Cross-Sector Investing
As of December 31, 2010
Source: AllianceBernstein
Unconstrained, “Thematic” Investing:
Catching the Next Wave
Catching the Next Wave

14
AllianceBernstein.com
Objectives
What Are the Client’s Needs?
< Standard indices
< Customized indices (i.e.; Fundamental, SRI, Green Indices)
< Restricted securities
Implementation
How Do We Meet Those Needs?
< Index replication
< Stratified sampling
< Derivatives
How Do We Execute Those Strategies?
< Global trading platform
< Integrated trade analytics
< Constituent change management
Execution
Over $30 Billion*
*As of December 31, 2010
üThe Move to Passive
AB Index Strategies:
Customized to Client Objectives
Customized to Client Objectives

15
AllianceBernstein.com
Countries and Regions with AUM Over $1 Billion
As of December 31, 2010
Source: AllianceBernstein
üThe Rise of the Global Investor
Growing Abroad:
Non-US Domiciled AUM of Almost $170 Billion
Non-US Domiciled AUM of Almost $170 Billion
16
AllianceBernstein.com
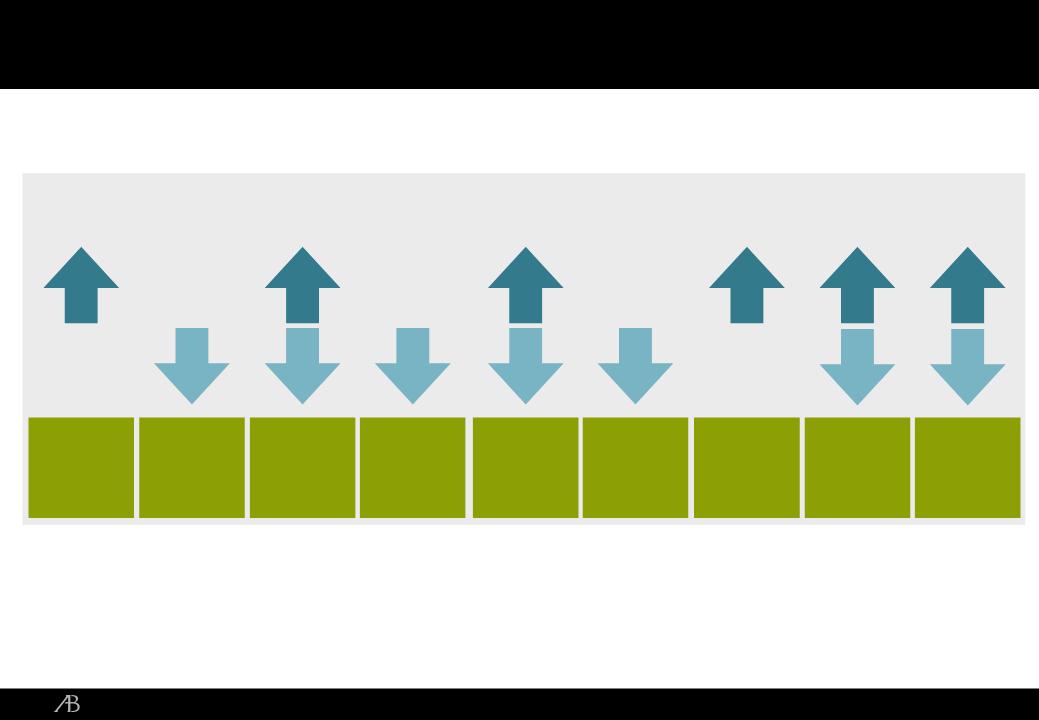
Market Direction
Long
Equities
Equities
Fixed
Income
Income
Alternatives
DAA
Target
Date/DC
Date/DC
Inflation
Services
Services
Thematic
Investing
Investing
Source: AllianceBernstein
Emerging
Index
Building an All-Weather Firm
17
AllianceBernstein.com
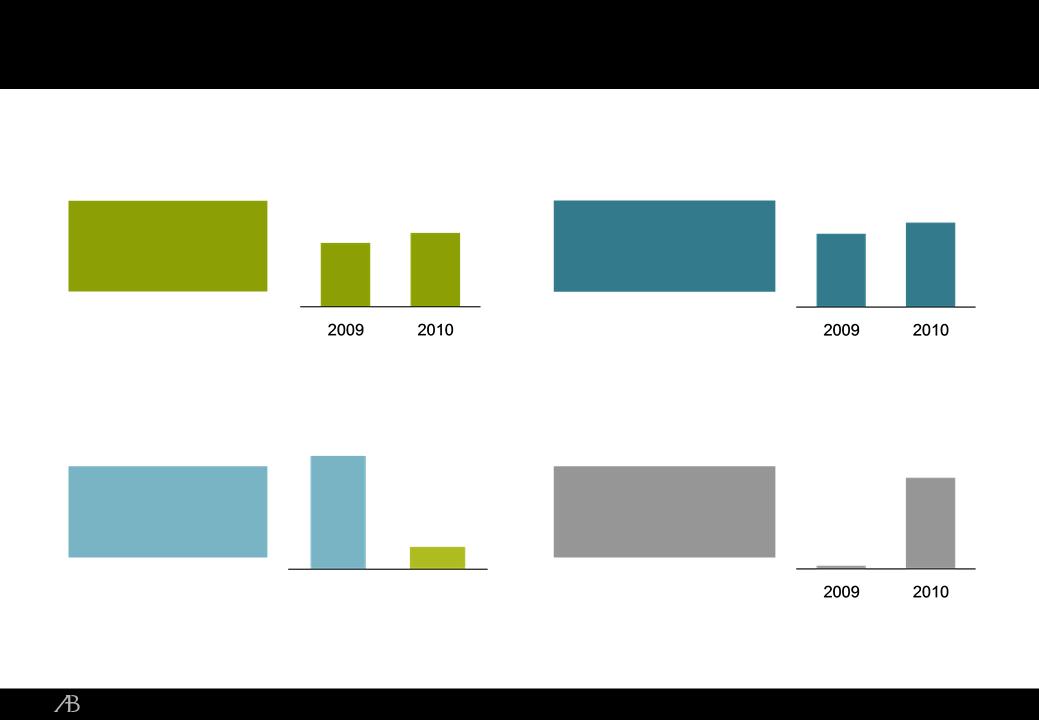
Adjusted
EPU
EPU
18.4%
21.3%
5%
1%
Adjusted
Revenues
Revenues
Adjusted
Expenses
Expenses
% Change
2010 vs. 2009
2010 vs. 2009
$1.38
$1.60
Adjusted
Operating Margins
Operating Margins
Adjusted Revenue/
Expense Trends
Expense Trends
7.0
226.4
Share Repurchases
($ Millions)
($ Millions)
Source: AllianceBernstein
February 28, 2011 AUM: $487 Billion
Financial Highlights: Progress in 2010

18
AllianceBernstein.com
Q & A

19
AllianceBernstein.com
Appendix

20
AllianceBernstein.com
AllianceBernstein L.P.
Notes to Condensed Consolidated Statements of Income and Supplemental Information
(Unaudited)
Adjusted Net Revenues
Adjusted net revenues exclude investment gains and losses and dividends and interest on deferred compensation-related investments, and 90% of the investment gains and
losses of our consolidated venture capital fund attributable to non-controlling interests. In addition, adjusted net revenues offset distribution-related payments to third parties as well
as amortization of deferred sales commissions against distribution revenues. We believe the offset of distribution-related payments from net revenues is useful for our investors
and other users of our financial statements because such presentation appropriately reflects the nature of these costs as pass-through payments to third parties who perform
functions on behalf of our sponsored mutual funds and/or shareholders of these funds. Amortization of deferred sales commissions is offset against net revenues because such
costs, over time, offset distribution revenues earned by the company.
Adjusted Operating Income
Adjusted operating income represents operating income on a GAAP basis (1) excluding the impact on net revenues and compensation expense of the mark-to-market gains and
losses (as well as the dividends and interest) associated with employee deferred compensation-related investments, (2) excluding real estate charges, and (3) including the net
loss or income of consolidated entities attributable to non-controlling interests.
losses (as well as the dividends and interest) associated with employee deferred compensation-related investments, (2) excluding real estate charges, and (3) including the net
loss or income of consolidated entities attributable to non-controlling interests.
(1) Prior to 2009, a large proportion of employee compensation was in the form of deferred awards that were notionally invested in AllianceBernstein investment services and
generally vested over a period of four years. AllianceBernstein has economically hedged the exposure to market movements by purchasing and holding these investments on its
balance sheet. The full value of the investments’ appreciation (depreciation) is recorded within investment gains and losses on the income statement in the current period. US
GAAP requires the appreciation (depreciation) in the compensation liability to be expensed over the award vesting period in proportion to the vested amount of the award as part of
compensation expense. This creates a timing difference between the recognition of the compensation expense and the investment gain or loss impacting operating income, which
will fluctuate over the life of the award and net to zero at the end of the multi-year vesting period. Although during periods of high market volatility these timing differences have an
impact on operating income and operating margin, over the life of the award any impact is ultimately offset. Because these plans are economically hedged, management believes
it is useful to reflect the offset ultimately achieved from hedging the investments’ market exposure in the calculation of adjusted operating income, adjusted operating margin and
adjusted diluted net income per Holding Unit, which will produce core operating results from period to period. The non-GAAP measures exclude gains and losses and dividends
and interest on deferred compensation-related investments included in revenues and compensation expense, thus eliminating the timing differences created by different treatment
under US GAAP of the market movement on the expense and the investments.
(2) Real estate charges have been excluded because they are not considered part of our core operating results when comparing financial results from period to period and to
industry peers.
industry peers.
(3) Most of the net income or loss of consolidated entities attributable to non-controlling interests relates to the 90% limited partner interests held by third parties in our
consolidated venture capital fund. We own a 10% limited partner interest in the fund. Because we are the general partner of the venture capital fund and are deemed to have a
controlling interest, US GAAP requires us to consolidate the financial results of the fund. However, recognizing 100% of the gains or losses in operating income while only retaining
10% is not reflective of our underlying financial results at the operating income level. As a result, we are excluding the 90% limited partner interests we do not own from our
adjusted operating income. Similarly, net income of joint ventures attributable to non-controlling interests, although not significant, is excluded because it does not reflect the
economic interest attributable to AllianceBernstein.
Adjusted Operating Margin
Adjusted operating margin allows us to monitor our financial performance and efficiency from period to period and to compare our performance to industry peers without the
volatility noted above in our discussion of adjusted operating income. Adjusted operating margin is derived by dividing adjusted operating income by adjusted net revenues.
volatility noted above in our discussion of adjusted operating income. Adjusted operating margin is derived by dividing adjusted operating income by adjusted net revenues.
AllianceBernstein Adjusted Financial Results Reconciliation