Attached files
| file | filename |
|---|---|
| EX-3.1 - EX-3.1 - B456 SYSTEMS, INC. | a2202572zex-3_1.htm |
| EX-32.2 - EX-32.2 - B456 SYSTEMS, INC. | a2202572zex-32_2.htm |
| EX-21.1 - EX-21.1 - B456 SYSTEMS, INC. | a2202572zex-21_1.htm |
| EX-31.1 - EX-31.1 - B456 SYSTEMS, INC. | a2202572zex-31_1.htm |
| EX-31.2 - EX-31.2 - B456 SYSTEMS, INC. | a2202572zex-31_2.htm |
| EX-32.1 - EX-32.1 - B456 SYSTEMS, INC. | a2202572zex-32_1.htm |
| EX-23.1 - EX-23.1 - B456 SYSTEMS, INC. | a2202572zex-23_1.htm |
| EX-10.31 - EX-10.31 - B456 SYSTEMS, INC. | a2202572zex-10_31.htm |
| EX-10.32 - EX-10.32 - B456 SYSTEMS, INC. | a2202572zex-10_32.htm |
| EX-10.33 - EX-10.33 - B456 SYSTEMS, INC. | a2202572zex-10_33.htm |
UNITED STATES
SECURITIES AND EXCHANGE COMMISSION
Washington, D.C. 20549
FORM 10-K
| (Mark One) | ||
ý |
ANNUAL REPORT PURSUANT TO SECTION 13 OR 15(d) OF THE SECURITIES EXCHANGE ACT OF 1934 |
|
For the fiscal year ended December 31, 2010 |
||
OR |
||
o |
TRANSITION REPORT PURSUANT TO SECTION 13 OR 15(d) OF THE SECURITIES EXCHANGE ACT OF 1934 |
|
For the transition period from to |
||
Commission file number: 001-33463
A123 Systems, Inc.
(Exact name of registrant as specified in its charter)
| Delaware (State or other jurisdiction of incorporation or organization) |
04-3583876 (I.R.S. Employer Identification No.) |
|
A123 Systems, Inc. Arsenal on the Charles 321 Arsenal Street Watertown, Massachusetts (Address of principal executive offices) |
02472 (Zip Code) |
617-778-5700
(Registrant's telephone number, including area code)
Securities issued pursuant to Section 12(b) of the Act:
| Title of each class | Name of each exchange on which registered | |
|---|---|---|
| Common Stock, Par Value $0.001 | NASDAQ Global Select Market |
Securities issued pursuant to Section 12(g) of the Act: None
Indicate by check mark if the registrant is a well-known seasoned issuer, as defined in Rule 405 of the Securities Act. Yes ý No o
Indicate by check mark if the registrant is not required to file reports pursuant to Section 13 or Section 15(d) of the Act. Yes o No ý
Indicate by check mark whether the registrant (1) has filed all reports required to be filed by Section 13 or 15(d) of the Securities Exchange Act of 1934 during the preceding 12 months (or for such shorter period that the registrant was required to file such reports), and (2) has been subject to such filing requirements for the past 90 days. Yes ý No o
Indicate by check mark whether the registrant has submitted electronically and posted on its corporate Web site, if any, every Interactive Data File required to be submitted and posted pursuant to Rule 405 of Regulation S-T during the preceding 12 months (or for such shorter period that the registrant was required to submit and post such files). Yes o No o
Indicate by check mark if disclosure of delinquent filers pursuant to Item 405 of Regulation S-K is not contained herein, and will not be contained, to the best of registrant's knowledge, in definitive proxy or information statements incorporated by reference in Part III of this Form 10-K or any amendment to this Form 10-K. ý
Indicate by check mark whether the registrant is a large accelerated filer, an accelerated filer, a non-accelerated filer, or a smaller reporting company. See the definitions of "large accelerated filer," "accelerated filer" and "smaller reporting company" in Rule 12b-2 of the Exchange Act. (Check one):
| Large accelerated filer ý | Accelerated filer o | Non-accelerated filer o (Do not check if a smaller reporting company) |
Smaller reporting company o |
Indicate by check mark whether the registrant is a shell company (as defined in Rule 12b-2 of the Act). Yes o No ý
The aggregate market value of the voting and non-voting common equity held by non-affiliates computed at $9.43 per share, the price at which the common equity was last sold on the NASDAQ Global Select Market on June 30, 2010, the last business day of the registrant's most recently completed second fiscal quarter, was $767,183,544.
Number of shares outstanding of the registrant's Common Stock, $0.001 par value, as of March 10, 2011: 105,679,002.
Documents incorporated by reference:
Portions of our definitive proxy statement to be filed with the Securities and Exchange Commission for our 2011 annual meeting of stockholders to be held on May 25, 2011 are incorporated by reference into Part II and Part III of this Report.
A123 Systems, Inc.
Annual Report on Form 10-K
For the Fiscal Year Ended December 31, 2010
INDEX
| |
Page Number |
|
|---|---|---|
PART I. |
||
ITEM 1: Business |
1 | |
ITEM 1A: Risk Factors |
27 | |
ITEM 1B: Unresolved Staff Comments |
55 | |
ITEM 2: Properties |
55 | |
ITEM 3: Legal Proceedings |
55 | |
ITEM 4: [Reserved] |
57 | |
|
||
ITEM 5: Market for Registrant's Common Equity, Related Stockholder Matters and Issuer Purchases of Equity Securities |
58 | |
ITEM 6: Selected Financial Data |
60 | |
ITEM 7: Management's Discussion and Analysis of Financial Condition and Results of Operations |
62 | |
ITEM 7A: Quantitative and Qualitative Disclosures About Market Risk |
83 | |
ITEM 8: Financial Statements and Supplementary Data |
84 | |
ITEM 9: Changes in and Disagreements With Accountants on Accounting and Financial Disclosure |
126 | |
ITEM 9A: Controls and Procedures |
126 | |
ITEM 9B: Other Information |
132 | |
|
||
ITEM 10: Directors, Executive Officers and Corporate Governance |
133 | |
ITEM 11: Executive Compensation |
136 | |
ITEM 12: Security Ownership of Certain Beneficial Owners and Management and Related Stockholder Matters |
136 | |
ITEM 13: Certain Relationships and Related Transactions, and Director Independence |
136 | |
ITEM 14: Principal Accountant Fees and Services |
136 | |
|
||
ITEM 15: Exhibits and Financial Statement Schedules |
137 | |
Signatures |
138 | |
EX-3.1 Restated Certificate of Incorporation of the Registrant, as amended September 29, 2009. |
||
EX-10.31 Lease Agreement, dated May 12, 2009, by and between 39000 Associates LLC and the Registrant |
||
EX-10.32 Term Loan and Security Agreement, dated August 2, 2006, among Silicon Valley Bank, Gold Hill Venture Lending 03, L.P. and the Registrant, as amended by the First Loan Modification Agreement, dated July 10, 2007, the Second Loan Modification Agreement, dated September 24, 2008, the Third Loan Modification Agreement, dated March 16, 2009, the Fourth Loan Modification Agreement, dated March 31, 2009, the Fifth Loan Modification Agreement, dated September 24, 2010, and the Sixth Loan Modification Agreement, dated December 23, 2010. |
||
EX-10.33 Form of Executive Retention Agreement, as amended |
||
EX-21.1 Subsidiaries of the Registrant |
||
EX-23.1 Consent of Deloitte & Touche LLP, Independent Registered Accounting Firm |
||
EX-31.1 CEO Certification pursuant to Section 302 of the Sarbanes-Oxley Act |
||
EX-31.2 CFO Certification pursuant to Section 302 of the Sarbanes-Oxley Act |
||
EX-32.1 CEO Certification pursuant to Section 906 of the Sarbanes-Oxley Act |
||
EX-32.2 CFO Certification pursuant to Section 906 of the Sarbanes-Oxley Act |
||
NOTE ABOUT FORWARD LOOKING STATEMENTS
Certain statements in this report contain "forward-looking statements" within the meaning of Section 21E of the Securities Exchange Act of 1934, as amended, or the Exchange Act. These statements are often identified by the use of words such as "may," "will," "expect," "believe," "anticipate," "intend," "could," "estimate," or "continue," and similar expressions or variations. All statements other than statements of historical fact are statements that could be deemed forward-looking statements, including without limitation statements regarding industry trends, management's expectations, competitive strengths or market position, market expectations, business opportunities, projections of revenue, expenses, profits, management's confidence in our strategies and other matters that do not relate strictly to historical facts. Such forward-looking statements are subject to risks, uncertainties and other factors that could cause actual results and the timing of certain events to differ materially from future results expressed or implied by such forward-looking statements. Factors that could cause or contribute to such differences include, but are not limited to, those discussed in the section titled "Risk Factors," set forth in Part I, Item 1A of this Annual Report on Form 10-K and elsewhere in this Annual Report on Form 10-K. The forward-looking statements in this Annual Report on Form 10-K represent our views as of the date of this Annual Report on Form 10-K. We anticipate that subsequent events and developments will cause our views to change. We undertake no obligation to update these forward-looking statements except to the extent required by applicable law. You should, therefore, not rely on these forward-looking statements as representing our views as of any date subsequent to the date of this Annual Report on Form 10-K.
Overview
We design, develop, manufacture and sell advanced, rechargeable lithium-ion batteries and energy storage systems. We believe that lithium-ion batteries will play an increasingly important role in facilitating a shift toward cleaner forms of energy. Using our innovative approach to materials science and battery engineering and our systems integration and manufacturing capabilities, we have developed a broad family of high-power lithium-ion batteries and battery systems. This family of products, combined with our strategic partner relationships in the transportation, electric grid services and commercial markets, positions us well to address these markets for next-generation energy storage solutions.
In our largest target market, the transportation industry, we are working with major global automotive manufacturers and tier 1 suppliers to develop batteries and battery systems for hybrid electric vehicles, or HEVs, plug-in hybrid electric vehicles, or PHEVs, and electric vehicles, or EVs. For example, we are designing and developing batteries and battery systems for BAE Systems, BMW, Daimler, Delphi, Eaton, Fisker Automotive, Inc., or Fisker, GM, Magna, Navistar and Shanghai Automotive Industry Corp., or SAIC, and other customers, for multiple vehicle models.
Our transportation business is divided into two categories: heavy-duty and passenger. In the heavy-duty market, we are engaged in design and development activities with multiple heavy-duty vehicle manufacturers and tier 1 suppliers regarding their HEV, PHEV and EV development efforts for trucks and buses, and we have been selected to co-develop battery systems for several of them. For example, pursuant to our supply agreement with Magna Steyr, we are providing batteries for use in battery systems developed by Magna Steyr for deployment in a heavy-duty HEV application. In addition, we have a development and supply agreement with BAE Systems, pursuant to which we are in volume production for battery systems for BAE Systems' HybriDrive propulsion system, which is currently being deployed in Daimler's Orion VII hybrid electric buses. Our battery systems include both roof mount and cabin mount designs for use in a number of different heavy-duty vehicles. We are
1
supplying Navistar battery systems for eStar electric vehicles. We also have been selected to develop the battery system for an additional Daimler hybrid electric bus program and to supply battery systems for production of hybrid power systems to be installed on a Ford F550 based PHEV for Eaton.
In the market for passenger vehicles, we have entered into a supply agreement with Fisker, pursuant to which we will supply advanced automotive battery systems over a multi-year period for the Fisker Karma PHEV. We have been selected to develop battery packs for a new, 2012 model year electric passenger car from SAIC, the largest automaker in China and we are currently providing the development work related to this agreement. We have also established a joint venture with SAIC which will assemble battery packs for subsequent sale to SAIC. The joint venture agreement provides that we will supply the joint venture with battery cells for its production of packs. Additionally, we currently supply battery technology to SAIC for several of its other electric drive-train vehicles in development, including the Roewe 750 hybrid electric sedan and the Roewe 550 plug-in hybrid electric sedan.
In addition to the development activities described above, we have entered into development programs with other major passenger original equipment manufacturers, or OEMs, and are bidding for programs with several other vehicle manufacturers to develop and/or supply batteries and battery systems for HEVs, PHEVs and EVs.
Our cylindrical batteries are in volume production and are commercially available for use in automotive and heavy duty vehicles. Our next-generation prismatic batteries are currently being produced in our Livonia, Michigan facility, which officially opened on September 13, 2010. This 291,000 square foot facility is designed to enable the complete production process, including research and development, manufacturing of high-value components, cell fabrication, module fabrication and the final assembly of complete battery packs ready for vehicle integration. When fully operational, it is expected to expand our overall manufacturing capabilities by up to 600 megawatt hours per year, contributing to our plan to expand our manufacturing capabilities to more than 760 megawatt hours annually by the end of 2011. As part of our continuing U.S. manufacturing ramp-up, we also plan to open a coating plant in Romulus, Michigan, expected to come on line during the first half of 2011.
We also provide energy storage solutions that improve the reliability and efficiency of the electric power grid and help to integrate renewable sources of power generation. We have leveraged our patented Nanophosphate® technology to deliver dynamic energy storage solutions for power generation, transmission and distribution. We design, manufacture and install multi-megawatt battery systems with integrated power electronics and smart grid control systems that provide electric and ancillary services such as standby reserve capacity and regulation services. Our products provide standby reserve capacity, by delivering power quickly in order to offset supply shortages caused by generator or transmission outages, and regulation, by regulating the minute-to-minute frequency fluctuations in the grid that are caused by instantaneous changes in supply and demand. Our systems can also be used to smooth the intermittent output from wind and solar generation facilities which is important, especially as these resources become a larger percentage of total generating capacity. We have shipped systems to a number of sites, totaling 40 megawatts with several new projects planned for 2011. The AES Gener Los Andes substation in the Atacama Desert is a frequency regulation and spinning reserve project helping to improve the reliability of the electric grid in Northern Chile. AES Gener is receiving additional revenue for its increased output capacity enabled by our battery system installed there. AES has also recently announced that they have 8 megawatts currently online in New York with an additional 12 megawatts expected to come online in early 2011 that were designed and developed by us. In August 2010, AES ordered 44 additional megawatts for deployment in various new projects, including a project that will add the capability to supply frequency regulation while also being available to help manage the rapid rate of change of output that can occur with fluctuates in wind conditions. In addition, we have delivered two systems to Edison Material Company, a Southern California Edison Company, or SCE, for use in a pilot program.
2
Over the past three months, grid operators in New England (ISONE), the Mid-Atlantic (PJM), and California (CAISO) have proposed or approved rules that will allow storage to participate in their respective electricity markets. On February 17, 2011, the Federal Energy Regulatory Commission (FERC) proposed pay-for-performance rules in all organized electricity markets. The 'pay for performance' principle recognizes that faster and more accurate resources provide greater benefits to the grid, and those resources should be compensated for that additional capability. Our batteries can respond nearly instantaneously to commands to increase or decrease output. As more markets recognize the value of grid energy storage and develop market structures that compensate these fast-responding resources, we believe it will benefit us and our customers by creating a higher value sub-portion of the market where we have a technical advantage. The end result is that through proper design, the market will provide the most efficient and least-cost mix of resources for regulation service.
We are also focusing on the commercial market. We first commercialized our battery technologies for use in cordless power tools. We also have agreements with The Gillette Company, a wholly-owned subsidiary of The Procter & Gamble Company, to supply Gillette with materials and technology for use in their consumer products. In October 2009, we entered into a Supply and License Agreement with Tianjin Lishen Battery Joint-Stock Co. Ltd., or Lishen, under which Lishen licenses our proprietary manufacturing process and cell design for the 18650 cells on a non-exclusive basis for a three-year term. Under the terms of the agreement, Lishen must purchase from us all of the cathode materials required to produce the 18650 cells and can produce these cells only for designated consumer applications. In other commercial areas, we believe our products are well-suited to applications in telecommunications, IT infrastructure, medical systems, auxiliary power units, or APU's, material handling equipment and industrial controls.
During 2008, 2009 and 2010, 19%, 59% and 59% of our product revenue was derived from sales in the transportation market, 5%, 15% and 18% was derived from sales in the electric grid market, and 76%, 26% and 23% was derived from sales in the commercial market, respectively.
Our proprietary technology includes nanoscale materials initially developed at and exclusively licensed from the Massachusetts Institute of Technology. We are developing new generations of this core Nanophosphate® technology, as well as other battery technologies, to achieve additional performance improvements and to expand the range of applications for our batteries. For example, for the 2009 Formula One racing season, we developed an ultra high power battery for Mercedes-Benz HighPerformanceEngines for use by the Vodafone McLaren Mercedes team that provided more than ten times the power density (W/kg) as compared to a standard Prius battery. In 2010, the Ohio State Buckeye Bullet established a new world land speed record for electric vehicles, using our production 32113 cylindrical cells.
Our research and development team comprises over 324 employees and has significant expertise in battery materials science, process engineering and battery-package engineering, as well as battery system design and integration. We own or exclusively license 53 issued patents and more than 325 pending patents in the United States and internationally.
We are taking advantage of U.S. Federal government and various State government programs established to stimulate the economy and increase domestic investment in the battery industry and we intend to continue doing so. Access to these State and Federal government funds offsets some of our capital expenditure and operating cash needs. For additional details of these government programs see the Government Initiatives and Contract Research section in Item I of this Annual Report on Form 10-K.
We perform most of our manufacturing at our facilities using our proprietary, high-volume process technologies. Our internal manufacturing operations allow us to directly control product quality and minimize the risks associated with disclosing proprietary technology to outside parties during production. We control every stage in the manufacture of our products except for the final assembly of one battery cell model and certain battery systems. Over the past several years, we have developed
3
high-volume production expertise and replicable manufacturing processes that we believe we can scale to meet increasing demands for our products. Our manufacturing processes can be modified to manufacture battery products for different applications and can be replicated to meet increasing customer demands. As of December 31, 2010, our annual manufacturing capacity was approximately 345.3 million watt hours. We have over 1.2 million square feet of manufacturing facilities in China, Korea, Livonia, Michigan, Romulus, Michigan and Hopkinton, Massachusetts where we produce or intend to produce batteries and battery systems. As of December 31, 2010, approximately 540,000 square feet are available for active manufacturing use. In conjunction with receiving federal and state incentive funding, we are currently expanding our domestic battery manufacturing capacity. This expansion would complement our existing manufacturing facilities in Asia.
We were incorporated in 2001. We began selling our first products commercially in the first quarter of 2006. We have approximately 2,000 employees worldwide. Our revenue has grown from $68.5 million for the year ended December 31, 2008 to $91.0 million for the year ended December 31, 2009 and to $97.3 million for year ended December 31, 2010. We experienced net losses of $80.5 million, $86.6 million and $152.9 million for the years ended December 31, 2008, 2009 and 2010, respectively.
Watt Hours Operating Metric
We measure our product shipments in Wh, which refers to the aggregate amount of energy that could be delivered in a single complete discharge by a battery. We calculate Wh for each of our battery models by multiplying the battery's amp hour, or Ah, storage capacity by the battery's voltage rating. For example, our 26650 battery is a 2.3 Ah battery that operates at 3.3 V, resulting in a 7.6 Wh rating. We determine a battery's Ah storage capacity at a specific discharge rate and a specific depth of discharge. We do this by charging the battery to its top voltage and by discharging it to zero capacity (2 volt charge level). The Wh metric allows us and our investors to measure our manufacturing capacity and shipments, regardless of battery voltages and Ah specifications, utilizing a uniform and consistent metric.
Industry Background
The world economy is undergoing a transformation driven by rising demands for high-output, fuel-efficient energy solutions that are less harmful to the environment. Global economic growth, geo-political conflict in oil-producing regions and escalating exploration and production costs are increasing market demand for innovative energy alternatives that can help reduce dependence on oil. Meanwhile, heightened concerns about global warming and climate change are giving rise to stricter environmental standards and stronger regulatory support for energy sources that are not harmful to the environment. As a result, clean energy technologies are experiencing increasing popularity and greater adoption which is fueling continued innovation and improving the economic viability of such technologies. We believe these clean energy trends are contributing to a growing demand for advanced battery technologies in end markets such as transportation, electric grid services and commercial.
Transportation
We believe consumers are shifting away from conventional gasoline engines to HEVs, PHEVs and EVs because of the high prices of conventional fuel, greater awareness of environmental issues and government regulation. These vehicles offer improved gas mileage and reduced carbon emissions, and may ultimately provide a vehicle alternative that eliminates the need for conventional gasoline engines. Industry experts project that by 2020, almost half of U.S. vehicles will require some form of battery technology to meet new Corporate Average Fuel Economy, or CAFE, regulatory standards. President Obama has announced national standards to cut emissions and increase gas mileage, mandating that U.S. passenger vehicles and light trucks must average 35.5 miles per gallon by 2016. In addition,
4
governments continue to implement economic incentives related to fuel efficiency. For example, in February 2009, the U.S. government enacted ARRA, which, among other things, provides for a tax credit of between $2,500 and $7,500 for the purchase of plug-in electric vehicles depending on the battery capacity. Moreover, governments across the globe are considering or have already implemented policies which similarly support vehicle electrification. While the mix between regulatory constraints and incentives vary by country, we believe the overall effect is increasing demand for greener vehicle technologies including advanced batteries.
On a cost per mile driven basis, electricity is a more economical source of energy than gasoline. However, the vehicle operating savings of using electricity have been historically more than offset by the cost of the corresponding electrical storage systems. With the advancement of battery technologies, the use of battery systems to deliver energy to hybrid powertrains is becoming more economically viable. We believe this trend will lead to increased adoption of HEVs, PHEVs and EVs and, as a result, create significant opportunities for battery suppliers with the necessary technology, experience and manufacturing capabilities to develop high performance batteries. We expect that if consumers begin realizing more immediate cost savings by switching away from gasoline powered vehicles to hybrid vehicles, the resulting increased adoption of HEVs, PHEVs and EVs will significantly contribute to the growth of the next-generation battery market.
Similar industry dynamics are creating a demand for new battery technology applications in the heavy-duty transportation market, particularly in buses, trucks and other industrial vehicles. The higher fuel consumption rate of these large vehicles makes the potential fuel cost savings derived from the use of batteries even greater. Several government authorities and corporations are evaluating battery technologies for their large fleets of heavy-duty vehicles. For example, the City of London has announced plans to convert its fleet of buses to HEVs, with a goal that by 2012 all new buses entering the fleet will be HEVs.
Electric Grid Services
Applications in the electric grid market present another significant opportunity for the use of advanced battery systems. Performance and reliability are essential to electric transmission and distribution grids. To preserve electric grid integrity, grid operators often need to call on resources to provide critical ancillary services such as standby reserve capacity and frequency regulation services. Resources required for standby reserve capacity services must ramp up and down quickly to offset sudden, short-term generator or transmission line outages. Resources for frequency regulation services are called upon to adjust for minute-to-minute frequency fluctuations in the grid due to demand and supply changes. Traditionally, these grid services are provided by running select power plants on the grid below their full load capability so they can be called on and ramped up quickly as needed. Advanced batteries capable of providing rapid charge and discharge cycles as well as high power over a long period provide these services more cost effectively and efficiently than running power plants at sub-optimal operating levels. Through the use of batteries, the portion of power plant capacity normally reserved for ancillary services to provide standby reserve capacity and frequency regulation can be freed up to operate at full capacity and produce more electricity and associated revenue.
We believe the escalating demand for renewable energy technologies will serve as an additional catalyst for the adoption of advanced batteries in electric grid applications. Wind and solar energy facilities are expected to be important sources of new electricity generation in the future. However, wind and solar are intermittent power sources that put additional demands on grid stabilization. Advanced batteries can be used to supplement these new generation technologies by smoothing their output providing regulation services and excess energy storage during periods of high transmission line usage or low customer demand.
5
The ARRA provides for $4.5 billion in direct spending on the U.S. electric grid, including funds to modernize the grid with so-called "Smart Grid" technologies, which are intended to stimulate investment by utilities in a smarter, more efficient grid and cleaner, renewable electricity generation technology. Emerging Smart Grid practices and technologies, such as the deployment and integration of advanced energy storage technologies, are designed to modernize the electric power grid. We believe utility companies that benefit from the ARRA's Smart Grid initiative will increase spending on advanced batteries and battery systems.
Commercial
Commercial applications represent another attractive market for advanced batteries. There are two types of batteries for commercial applications: high-energy batteries and high-power batteries. High-energy batteries are designed to store large amounts of energy for long periods, but are not required to release this energy at a high rate. These batteries are used in certain portable consumer electronics such as laptop computers, PDAs and cell phones, which require gradual, consistent delivery of energy in low-power form. High-power batteries, on the other hand, are designed not only to store large amounts of energy, but also to deliver it at a very high rate, or in high-power form. While the battery market for high energy, low-power portable consumer products is mature and well supplied by several vendors, a market opportunity exists for advanced batteries that can deliver high-power in a light-weight and portable package.
High-power batteries can transform appliances, tools and equipment traditionally powered from electric outlets into more convenient, portable devices. These batteries are currently being used in cordless power tools with additional potential applications in home appliances and commercial cleaning equipment. Consumers in these initial applications continue to demand high-power batteries for portable applications that are smaller, lighter and longer lasting than those currently used. In addition, with escalating environmental concerns around battery disposal, the market is also increasingly focused on replacing the battery technologies which utilize toxic metals such as nickel or lead. High-power batteries may also replace small internal combustion engines that power widely available lawn and garden equipment such as hedge trimmers or lawn mowers, possibly providing size and weight advantages, eliminating the need for expensive fuel, reducing hydrocarbon emissions and reducing noise.
Challenges in Battery and Battery System Design
The performance and specific characteristics of rechargeable batteries depend on the properties of their materials, the design of the batteries and the battery systems and the manufacturing process. Providers of rechargeable batteries face a number of challenges in addressing the requirements of transportation, electric grid services and commercial applications:
- •
- Delivery of sufficient power for target applications. A
battery must be able to deliver the electrical power required by the application. Electrical power, measured in watts, is the rate at which electrical energy is delivered. Having adequate power is
particularly important in applications such as EVs, where acceleration is an essential component of performance.
- •
- Ability to operate for sufficient duration between
charges. A battery can provide a certain total amount of electrical energy to the application. Energy is the product of power and time,
measured in watt hours. Batteries with higher energy can function for longer periods when used at a certain power than those of lower energy. Thus, in PHEV and EV applications, the energy of the
battery determines the automobile's mileage range while it is running only on electricity.
- •
- Delivery of sufficient energy at high power. The total energy that a battery can deliver also depends on the power requirements of the application being addressed. When a battery is used at higher power, the usable energy of the battery is less than it is at lower power. Battery types
6
- •
- Ability to operate safely. Safety is a primary concern for
batteries used in commercial products, transportation vehicles and electric grid applications. For example, battery types differ in their susceptibility to thermal runaway, which is the internal
generation of significant heat leading to battery damage and potential combustion.
- •
- Sufficient cycle and calendar life. The cycle life of a
battery is the number of times it can be recharged without significantly reducing its ability to accept a charge. The calendar life is the total time in service before the battery can no longer
deliver the energy or power required by the application.
- •
- Ability to be rapidly charged. Batteries differ in the
time required to charge before use or in their ability to be partially-charged using a high power pulse. For example, HEVs require a battery that can be charged quickly in order to take advantage of
the energy savings provided by regenerative braking.
- •
- Minimizing size and weight while delivering sufficient power and
energy. Size and weight are critical considerations for many battery applications, including automobiles and power tools. For a specific
application, batteries with higher energy and power per unit of size and weight can be made smaller and lighter. This is especially important for portable and transportation applications.
- •
- Maintenance of charge when stored. All batteries
experience some self discharge, which is a slow loss of energy from the battery during storage. The rate of self discharge may be affected by battery chemistry, battery design or manufacturing
quality. Self discharge tends to occur more rapidly when batteries are stored at high temperatures.
- •
- Power and energy degradation over life. Batteries will
lose some of their ability to deliver power and store energy throughout their normal usage life. The degradation typically increases with repeated charge and discharge and if the battery is exposed to
high temperatures. The rate of power and energy degradation can determine the cycle life or calendar life of the battery.
- •
- Delivering maximum performance for the lowest
cost. Batteries are typically evaluated based on their performance in relation to their cost. The cost of raw materials and components
and the battery's design are key factors affecting this evaluation. Other attributes such as manufacturing efficiency, battery system design and electronic control circuitry can also impact a battery
system's cost.
- •
- Availability of raw materials. For applications such as
transportation and electric grid services, if widespread adoption occurs, the large expected volume will require batteries based on raw materials that are in abundant, readily available supply.
- •
- Requirements for environmentally-friendly disposal. Nickel-cadmium and lead-acid rechargeable batteries contain toxic metals that raise environmental concerns in disposal. Consumer awareness and government regulations are contributing to the need for rechargeable batteries that contain materials that can be disposed of with the least harmful impact on the environment.
vary widely in the amount of energy that can be delivered when the battery is used at high power.
7
The most prevalent battery technologies currently available that address the transportation, electric grid services or commercial markets include:
- •
- Lead-acid batteries. Lead acid is one of the
oldest and most developed battery technologies. It is an inexpensive and popular storage choice that is generally reliable and relatively simple to manufacture. Most automobile manufacturers use lead
acid in automotive starter batteries. Lead-acid batteries have also traditionally been used in electric grid services applications. However, lead-acid batteries are heavier per
unit of stored energy than some other battery technologies and are therefore not practical for use in many commercial applications. They also have long charge times and low power output for their
mass. In addition, lead can be hazardous to the environment.
- •
- Nickel-based batteries. Nickel-based batteries come in
two main forms: nickel cadmium, or NiCd, and nickel metal hydride, or NiMH. NiCd batteries are inexpensive and durable and have high power, making them suitable for commercial applications. However,
cadmium metal is toxic and can cause several acute and chronic health effects in humans and NiCd batteries are hazardous to the environment. NiMH batteries, which provide a less toxic alternative to
NiCd, have greater energy than lead-acid batteries and have been used in automotive applications, such as the Toyota Prius HEV model. Some NiMH batteries are light and have a fast charge
rate, which makes them appropriate for use in portable products. However, NiMH batteries lack the energy density to make them practical for many PHEV and EV applications.
- •
- Conventional Lithium-ion
Technologies. Lithium-ion batteries have higher energy density than lead-acid, NiCd or NiMH batteries and can be
made smaller and lighter than these batteries. After their commercial introduction in the early 1990s, lithium-ion batteries were adopted quickly for small portable electronics
applications such as cell phones and laptop computers. However, until recently, lithium-ion technology was not widely used other than for small portable device applications due to
limitations on their power, safety and life. Furthermore, the world's supply of cobalt, a metal used in most conventional lithium-ion batteries, is more limited than the supply of other
metals used in advanced lithium-ion batteries.
- •
- Advanced Lithium-ion Batteries. In the late
1990s, a new generation of lithium-ion chemistries capable of delivering improved performance emerged. Some of these technologies offered greater power. Other technologies introduced
improvements in safety and battery life relative to conventional lithium-ion batteries. In addition, the development of lithium-ion polymer technology, utilizing modified
chemistries and manufacturing methods, allowed a range of flat, or prismatic, battery shapes to be manufactured. However, existing limitations in the areas of safety and life prevented the widespread
use of lithium-ion in large, high-power applications. Though some advanced lithium-ion batteries are safer than conventional lithium-ion, protective
measures to prevent overcharge-related safety issues remain necessary. Furthermore, battery systems such as those being developed for HEV, PHEV and EV powertrains require not only higher levels of
power and/or energy, but also the ability to function over a wide range of temperatures and a longer calendar life. For example, portable electronic devices only require about 300 to 400 recharge
cycles and a calendar life of about three years, whereas typical vehicle applications require several hundred thousand shallow recharge cycles for HEV applications and several thousand deep cycles for
PHEV and EV applications, with a calendar life of approximately ten years.
- •
- Other Technologies. Other technologies such as ultra capacitors and fuel cells have been considered as potential alternatives to batteries. Ultra capacitors are energy storage devices that deliver high power and have a long cycle and calendar life. However, they lack sufficient energy density to meet the needs of most battery applications. Fuel cells generate energy locally by consuming a fuel, usually hydrogen. Fuel cell systems currently offer similar energy density to
8
advanced lithium-ion batteries, and may eventually be capable of greater energy density, but fuel cell systems typically have lower power and shorter calendar life. Moreover, hydrogen must be replenished after use, is difficult to store and distribute, and is currently produced in energy-inefficient ways.
Our Solution
We believe our batteries and battery systems overcome the limitations of other currently available lithium-ion formulations and non-lithium-ion battery technologies. Our solution is based on proprietary Nanophosphate® chemistry originally developed by one of our founders, along with others, at the Massachusetts Institute of Technology and exclusively licensed to us. We continue to innovate our battery chemistry by improving our existing Nanophosphate® chemistry and exploring new material chemistries. Our battery chemistry is supplemented with innovative battery designs as well as systems and pack technologies that increase the performance and scalability of battery systems used for high-power applications. As a result, while other battery technologies offer competitive performance in some metrics, we believe our batteries and battery systems deliver superior performance by combining the following key characteristics:
- •
- High power. Our proprietary battery chemistry and design
enable high electric power comparable to that available from ultra capacitor technology. For example, for the 2009 Formula One racing season, we developed an ultra high power battery for
Mercedes-Benz HighPerformanceEngines for use by the Vodafone McLaren Mercedes team that delivered more than ten times the power density (W/kg) as compared to the power delivered by the
battery used in a standard Prius. Additionally, in 2010, the Ohio State Buckeye Bullet established a new world land speed record for electric vehicles, using production 32113 cylindrical cells from
A123.
- •
- High useable energy. Because our batteries maintain high
power over a wide range of charge levels, our batteries provide more useable energy for a given size than many batteries based on other chemistries.
- •
- Improved safety. Our batteries are more resistant than
conventional and other advanced lithium-ion batteries to failures such as fire and explosion under certain conditions, including overcharge, overheating and physical damage.
- •
- Long cycle and calendar life. Our batteries are designed
to retain their power and energy over thousands of recharge cycles and for up to ten years of calendar life, allowing them to meet or exceed customer requirements in our target markets.
- •
- Fast charge capability. Our proprietary battery chemistry
and design enable some of our batteries to reach 90% charge from a fully discharged state in as few as six minutes.
- •
- Reduced size and weight. The high power and high usable
energy exhibited by our batteries allow us to design smaller and lighter battery systems using fewer batteries to meet an application's power and energy needs. In addition, our stable battery
chemistry reduces the need for control electronics that add to the battery system's size and weight.
- •
- Low power degradation over life. Our batteries lose less
storage capacity than many competing batteries after repeated charging and exposure to high operating temperatures. As a result, we have to add less excess capacity to our battery systems in order to
account for power degradation over calendar life and still meet minimum end-of-life power requirements.
- •
- Compelling balance of cost and performance. Our batteries are cost efficient in multiple areas. Lithium and other key materials used in our batteries are in readily available supply. Furthermore, our batteries' higher power and energy density and lower power degradation can result in deployment of fewer batteries to meet specified application requirements.
9
- •
- Environmental benefits. Unlike many other batteries, the active materials in our Nanophosphate® batteries do not contain nickel or manganese compounds which are classified as toxic by the U.S. Environmental Protection Agency in the Toxics Release Inventory. In addition, at the end of their useful life for a particular application, it may be possible to re-purpose our batteries for other applications, which maximizes the use of raw materials and resources. In addition, a significant portion of our battery's materials can be recycled when the battery is no longer in use.
Our Competitive Strengths
We believe the following combination of capabilities distinguishes us from our competitors and positions us to compete effectively and benefit from the expected growth in the advanced energy storage market:
- •
- Materials science and development expertise. Our
proprietary materials formulations and coating techniques allow us to adjust the characteristics of our battery components to meet different energy and power requirements across our many applications.
For example, we have developed new battery components that operate in temperature environments ranging from -30°C to over 60°C. Our core materials science has been
successfully taken from the research laboratory to the mass market, where it has been validated in high-volume production. We plan to continue to commercialize products based on our core
materials and to explore a variety of next generation chemistries that are intended to provide even higher energy and power combinations without sacrificing battery safety or life.
- •
- Battery design capabilities. We have been an innovator in
the packaging of lithium-ion batteries. For example, we believe we were the world's first mass producer of cylindrical, aluminum, laser-welded packaged batteries. Prior to this
development, most cylindrical batteries used crimped steel cans and internal mechanical designs that are heavier, have more difficulty delivering high currents, and are more permeable to humidity than
our design. These capabilities allow us to introduce optimal packages in various forms and sizes designed to deliver our technology into many different applications. We have introduced or are
developing several new cylindrical battery cell models for diverse applications as well as several new prismatic, or flat rectangular, battery cell models targeted at the transportation and grid
markets. Prismatic batteries offer improved energy density, by minimizing the amount of inert materials, which add to the weight and size of the battery.
- •
- Battery systems engineering and integration expertise. A
battery system typically includes a battery management system, battery supervisory circuits, state of charge algorithms, thermal management and power electronics. We have developed systems engineering
and integration expertise in all of these areas. These capabilities allow us to customize our batteries and deliver fully-integrated systems, which are necessary to compete successfully in certain end
markets. In addition, our system integration expertise allows us to understand system level requirements and inform our chemistry development process. It also provides us with the necessary expertise
to partner with leading system integrators, understand their design requirements and assist them in developing solutions that take advantage of our battery products. We believe our system engineering
capabilities accelerate the adoption of our technology across our target markets by reducing the development and integration efforts of our system integration partners and end customers. We have two
groups with integration capabilities located in Massachusetts (electric grid and commercial services) and in Michigan (transportation). In addition, our St. Louis office supports our electric
grid business, especially in the area of software controls.
- •
- Vertical integration from battery chemistry to battery system design services. We provide a broad spectrum of highly customized solutions to our partners and customers. Our vertical integration
10
- •
- Industry-leading partners in focused markets. We work with
leaders in each of our target markets, such as AES, BAE Systems, BMW, Daimler, Fisker, Gillette, Navistar and SAIC. We have entered into agreements relating to joint design and development efforts
with several major passenger vehicle manufacturers and tier 1 suppliers, including BMW for its HEV program, Fisker for its PHEV program, Navistar for its EV program and SAIC for its HEV and
PHEV programs. We also continue to work with General Electric to draw on their research and technology development expertise in our target markets. We believe our experience with our development
partners provides us with a significant research and development advantage, greater access to end customers, market credibility and additional avenues to secure supply contracts.
- •
- High-quality, volume manufacturing facilities and proprietary process
technologies. We have over 1.2 million square feet of manufacturing facilities in China, Korea, Michigan and Massachusetts. As of
December 31, 2010, approximately 540,000 square feet are available for active manufacturing use. Our internal manufacturing operations provide us with direct control over the quality of our
products and improve the protection of our materials science, systems and production process intellectual property. In addition, we believe our manufacturing control allows us to rapidly modify and
adapt standard equipment for our particular production requirements, thereby reducing our overall development time to market. Over the past several years, we have developed high-volume
production expertise and replicable manufacturing processes that we believe we can scale to meet increasing demands for our products. We are compliant with ISO 9001:2000 certification and
received TS16949 certification for our cylindrical cell design and manufacturing operations worldwide. We are the first major U.S.-based battery manufacturer to receive this automotive certification
for cylindrical lithium-ion cells, which validates that our product design and manufacturing process meet the highest standards for manufacturing excellence in the automotive industry.
- •
- Cells with proven capabilities across multiple transportation applications. Through our supply agreements in the transportation market, we have demonstrated the ability to compete in all transportation markets, including heavy-duty, both EV and HEV, as well as passenger car, EV, PHEV and HEV. Also, we have demonstrated our ability to compete in markets across all regions of the globe. These programs demonstrate and validate the price to performance of our cells, modules and systems in the marketplace.
from batteries to battery systems has allowed us to develop flexible technology modules at every step of battery development, including a patent-pending scalable prismatic battery system architecture that allows common modules to be configured according to varied transportation customer requirements. The ability to work with partners and customers across the design process provides us with a better understanding of customer needs and allows us to customize our modules and design steps to their specific requirements. This understanding of our customer needs often reduces our development time because we can address design requirements at the chemistry, battery or battery system levels. Furthermore, by managing each design step from battery to battery system, we can better protect our intellectual property.
Our Strategy
Our goal is to utilize our materials science expertise, our systems engineering expertise and our manufacturing process technologies to provide advanced energy storage solutions. We intend to pursue the following strategies to attain this goal:
- •
- Pursue markets and customers where our technologies create a competitive advantage. We will continue to focus our efforts in markets where customers place a premium on high-quality batteries, innovation and differentiated performance. We believe our battery technologies, our design and systems expertise and manufacturing processes, provide us with a competitive edge in
11
- •
- Partner with industry leaders to adapt and commercialize our products to best meet the requirements of our target
markets. In each of our target markets, we have entered into joint development and supply agreements with industry-leading companies.
These relationships provide us insight into the performance requirements of that market, allow us to share product development costs, and position our products to serve as a key strategic element for
our partner's success. We intend to continue to pursue partnerships in our target markets to enhance our product offerings and to facilitate expansion into new geographies.
- •
- Actively pursue federal and state incentive funding for battery development, facility expansion and job
creation. We intend to take advantage of U.S. government and state programs established to increase domestic investment in the battery
industry. To date, we have been awarded a $249.1 million grant under the DOE Battery Initiative and have applied for a federal loan of up to $233 million to support our manufacturing
expansion in the United States. We have been awarded loans, tax and other credits from the State of Michigan as well as the Commonwealth of Massachusetts. We are also pursuing other funding
opportunities.
- •
- Expand our manufacturing capacity in the United States. As
we receive sufficient federal and state incentive funding and the actual and anticipated future demand for our products increases as expected, we plan to further expand our domestic battery
manufacturing capacity. Our plan involves building vertically integrated manufacturing plants in the United States that encompass the full production process, including the manufacturing of our
proprietary cathode powder, electrode coating, battery fabrication and the assembly of complete battery systems ready for vehicle integration.
- •
- Pursue opportunities globally. Many potential customers
exist outside of the United States. China, for example, is the largest and fastest growing automotive market in the world. Growing awareness among governments around the world has also led to
increased interest in vehicle manufacturers, both for passenger and commercial vehicles. In addition to the opportunities in the transportation sector, the electric grid is also a growing market for
energy storage systems. Plans to modernize power delivery infrastructure and integrate renewable sources of power, such as wind and solar, also are creating numerous opportunities globally.
- •
- Remain on the forefront of innovation and commercialization of new battery and system
technologies. We intend to continue to innovate in materials science and product design to enhance the benefits of our product
offerings. This innovation will be derived from our internal research and development efforts, from our close development partnerships with our customers and from licensing or acquiring new
technologies developed by third parties. We maintain relationships with top industry leaders, government labs and universities to advance research and to track promising developments and technologies.
- •
- Reduce costs through manufacturing improvements, supply chain efficiencies and innovation in materials. We intend to lower our manufacturing costs by improving our manufacturing performance and lowering our materials cost. As we continue to grow, we are focused on increasing the yield in our manufacturing and improving our margins as production volumes increase. We also manage our working capital requirements in manufacturing through inventory management and additional supply chain efficiencies. In addition, we continuously evaluate how to improve our product offerings and lower costs through further materials innovation. We are actively developing new materials with properties we believe will allow us to build batteries that require fewer control and electronic components and enable our battery systems to maintain or improve performance at a lower cost.
enabling new battery applications that address challenging design constraints and demanding performance requirements.
12
Our Products
Our current product offerings include batteries in various sizes and forms as well as packaged modules and fully-tested battery systems. The platform for battery and battery system development is our patented Nanophosphate® material, which can be engineered to meet the strict requirements of a broad set of applications in our target markets.
Energy Storage
Our batteries based on our Nanophosphate® technology for application development in the transportation, electric grid services and commercial markets, as summarized below:
| |
|
|
|

|
||||
|---|---|---|---|---|---|---|---|---|
| |
||||||||
Cell Product Model Number |
ANR26650 |
APR18650 |
AHR32113 |
AMP20 |
||||
Nominal capacity* (Ah) |
2.3 Ah | 1.1 Ah | 4.4 Ah | 20 Ah | ||||
Energy (Wh) |
7.6 Wh | 3.6 Wh | 14.5 Wh | 64 Wh | ||||
Power to energy ratio |
High | Medium | Ultra High | Medium | ||||
Electrode type** |
M1 | M1 | M1 Ultra | M1 HD | ||||
Status |
Volume production |
Volume production |
Volume production |
Volume production |
||||
Applications |
Consumer and Professional, Hybrid Transit Buses, Electric Vehicles, Electric Grid Services |
Consumer and Professional Applications | Hybrid Electric Vehicles, Hybrid Transit Buses and Heavy Duty Hybrid Electric Vehicles |
Extended Range Electric Vehicles, Plug-In Hybrid and Electric Vehicles |
||||
- *
- The
capacity of a battery is the amount of charge it can store, typically given in units of amp hours, or Ah.
- **
- We have developed several electrode technologies based on our Nanophosphate® chemistry for our batteries depending on their application. M1 offers a combination of energy and power. M1 Ultra is designed for high power applications. M1 HD is designed for high energy applications.
- •
- ANR26650. We originally developed the ANR26650 (26 mm in
diameter, 65 mm in height) for DeWalt's 36V series of professional power tools. This battery offers a combination of power and energy that allows it to be used in a diverse set of applications,
including power tools, BAE Systems' Hybridrive® propulsion system for the Daimler Orion VII hybrid-electric bus and AES's Smart Grid Stabilization Systems.
- •
- APR18650. The APR18650 (18 mm in diameter, 65 mm in
height) has a similar design as the ANR26650, but comes in a smaller, industry-standard package. This battery is currently used in DeWalt's 18V Nano line of power tools. We are producing this battery
through partnerships with third-party suppliers rather than building our own production capacity.
- •
- AHR32113. The AHR32113 (32 mm in diameter, 113 mm in height) is designed for high-power HEV applications and to offer significantly higher power than our other cells. The cell is designed to address markets where power is the main requirement and where cost per unit of power is the key metric. We have recently completed the upgrade of this cell resulting in higher capacity and power, and further optimization for high volume manufacturing. Currently in production, the AHR32113 has been sourced for HEV programs including those produced by BMW, Magna Steyr and Delphi for SAIC.
13
- •
- AMP20. The APM20 (7.2 mm thick, 161 mm wide, 227 mm in height) is designed for high-power PHEV and EV applications. Our 20Ah building block for PHEV and EV applications is currently in production. This prismatic cell is an advanced high power and long-life lithium-ion energy storage solution for next-generation applications and is being used in the Fisker Karma PHEV, among other applications.
Battery Systems
Our energy solutions group offers a variety of fully-packaged systems as well as sub-module building blocks for battery system development. Our development of integrated systems includes not only the packaging of our batteries, but also power electronics, safety systems, thermal management, testing, production and qualification. We design standard systems as well as custom systems using a modular design based on standard building blocks. We manufacture a variety of battery systems, in which cells or modules are connected in various configurations to meet the design requirements of specific applications. The following are examples of a modular building block based on our 32113 HEV cylindrical cells and various module designs using our scalable 20Ah prismatic cells.
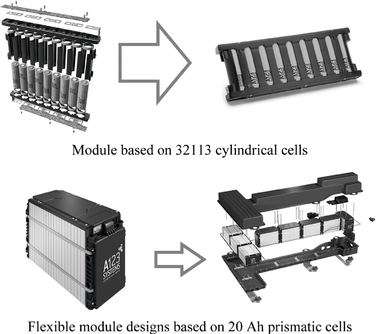
Our prismatic battery system's design allows for various battery configurations, providing pack design versatility for the automotive market. This design reduces retooling time when reconfiguring our assembly lines for different customers. Our battery systems are highly engineered to incorporate safety and control features that extend life and improve performance. Module-level fusing, temperature sensing and other safety controls provide additional containment safeguards to isolate and protect against cell-level failure. Active overvoltage protection provides monitoring and balancing of individual series elements to protect cells from abuse and to extend life. These battery systems are designed to accommodate either liquid or air-cooled thermal management systems, and have mechanical structures designed to withstand the harsh vibration and mechanical shock environment of automotive applications.
14
Current product offerings include the following:
- •
- BAE Systems Energy Storage Solution. We produce energy
storage solutions for BAE Systems' HybriDrive drive train for the Daimler Orion VII hybrid-electric bus. The 180 kW system incorporates our ANR26650 batteries into sub-modules that include
a redundant, fault-tolerant design. Air-cooled with safety systems designed in, this energy storage solution reached volume production in 2008 as a replacement for a lead-acid
solution that weighs approximately three times as much as our solution, with half the expected life.
- •
- Hymotion L5 Battery Range Extender Module. Our Hymotion
conversion module augments the performance of a standard Toyota Prius HEV through the 2009 model year, turning it into a PHEV capable of over 100 miles per gallon. This module provides fleets and
consumers with a PHEV option.
- •
- Grid Service System. We have developed and installed
multi-megawatt battery systems, for AES, Southern California Edison and other companies capable of performing ancillary electric grid services, including standby reserve capacity and frequency
regulation services.
- •
- Prismatic Battery Systems. We are working with Fisker and
other manufacturers such as Navistar, Eaton and Daimler to develop and supply prismatic battery systems.
- •
- Starter Battery Systems. We have developed starter
batteries to replace the standard lead acid batteries that are currently used. Our starter batteries offer higher power in a lighter package, in addition to a longer life.
- •
- Lead acid replacement batteries. Our ALM line of lead acid replacement batteries use our Nanophosphate® technology packaged in widely-used lead acid form factors. These batteries offer superior life and lighter weight than traditional lead acid batteries, making them well-suited to applications such as IT, telecom, material handling, auxiliary power units, and medical systems.
Technology Overview
Lithium-ion batteries are rechargeable batteries in which lithium is reversibly transported through a nonaqueous liquid electrolyte, or ionically conductive medium, between positive and negative electrodes that store lithium in the solid state. Lithium-ion batteries are distinguished from disposable lithium batteries, or rechargeable lithium metal batteries, by not utilizing metallic lithium as a negative electrode material. Instead, both electrodes utilize compounds in which lithium atoms may be stored at relatively high concentrations without forming lithium metal, an attribute that is key to safe and prolonged recharging. The non-aqueous electrolyte in lithium-ion batteries allows operation at a high voltage (about 2.5-4.4 V for current technology) without suffering electrolyte decomposition. The combination of a high voltage and high charge storage capacity in both the positive and negative electrodes provides for the high specific energy (50-230 Wh/kg) and energy density (100-450 Wh/liter) of current lithium-ion batteries. These energy values span a wide range for several reasons. Batteries designed for high power typically utilize thin electrode coatings which result in lower overall active materials content and therefore lower energy. The energy per mass and per volume also varies with form factor, cylindrical batteries typically having higher values than prismatic batteries, and battery size, smaller batteries typically having lower values due to higher packaging factor. Importantly, the choice of positive and negative electrode materials has a large impact on the energy that can be stored and the power that can be delivered using a specific battery.
We are primarily focused on developing a new generation of lithium-ion batteries and battery systems to serve applications and markets outside the historical domain of lithium-ion. These applications include HEVs, PHEVs and EVs, electric grid services, and commercial products. These applications frequently require battery systems having much higher total energy or power outputs than
15
required by previous lithium-ion applications, and place a premium on one or more of the attributes of high energy, high power, improved safety, and long life. We also maintain an active research and development effort to develop future generations of materials for several key components of battery systems, and improved battery and battery systems designs to take advantage of the attributes of those materials.
Customers
Our primary customers are industry-leading companies that value and require high battery performance. Our customers and development partners span multiple industries and include the following organizations, in addition to others, in our target markets:
- •
- Transportation. We are currently working under
non-exclusive arrangements with major global automotive manufacturers and tier 1 suppliers to develop batteries and battery systems for the HEV, PHEV and EV markets. We have entered
into a supply agreement with BMW to supply HEV batteries, Navistar to supply EV batteries and we have entered into a development agreement with Delphi to develop battery systems for a
mass-produced HEV by SAIC Motor Co. Ltd., or SAIC, in China. We have also entered into development agreements with SAIC to develop a demonstration battery system for an EV
and a battery system for a PHEV. To assist us in getting penetration into China's transportation industry, our wholly-owned subsidiary, A123 Systems Hong Kong Limited, entered into a joint venture
agreement in December 2009 with SAIC for the development, production and sale of the vehicle battery systems in China for use in HEVs and EVs. Additionally, we entered into a supply agreement with
Fisker in January 2010. Under the terms of the agreement, we were designated as the supplier of the battery systems for Fisker's Karma PHEV programs. Our other automotive development partners include
tier 1 suppliers, such as Magna Steyr and Eaton, major automobile manufacturers, and EV manufacturers, which provides EVs with lithium-ion battery systems that can be easily
recharged or switched through a network of charge locations and battery switch stations. Our March 2009 supply agreement with Magna Steyr provides for an initial seven-year term during
which Magna Steyr may order batteries from us based on a monthly forecasts over a rolling three-month period. In the heavy-duty vehicle market, we are supplying battery systems to BAE
Systems pursuant to a May 2007 development and supply contract. BAE Systems is initially using our battery systems in its HybriDrive propulsion system, which is currently being deployed in Daimler's
Orion VII hybrid electric buses. We have also been selected by, Daimler to supply battery systems for use in systems developed by Daimler's EvoBus subsidiary.
- •
- Electric Grid Services. We have developed multi-megawatt battery systems for AES capable of performing ancillary electric grid services, including standby reserve capacity and frequency regulation services. The first of the AES systems, a two megawatt system housed in a 53-foot trailer, was installed at an AES facility in California, and we have shipped additional units for AES, totaling 12 megawatts that have been installed and commissioned at AES Gener's Los Andes substation in the Atacama Desert in Chile. Another 8 megawatts have been installed and commissioned for AES in New York with 12 additional megawatts expected to be commissioned in 2011. We received an additional AES order for 44 megawatts to be installed in various projects including an energy storage project in the PJM Interconnection market, which coordinates the movement of electricity in all or part of 13 states and the District of Columbia. In September 2010, we shipped a large battery system to Vestas Wind Systems A/S to be integrated with a wind farm in Europe. In December 2009, we shipped 4 megawatts of battery systems for use in a pilot program. In addition, we have been selected as the battery supplier to three Smart Grid projects funded by DOE ARRA funding awards to SCE and The Detroit Edison Company, or DTE, to demonstrate the viability of advanced Smart Grid technologies. SCE will use our advanced battery technology and DOE funding to implement a $53.5 million
16
- •
- Commercial. We have entered into license and materials supply agreements with Gillette pursuant to which we granted Gillette an exclusive license to certain of our technology and are supplying materials to Gillette for use in their consumer products (excluding power tools and certain other consumer products). We are also considering opportunities in emerging applications, including telecommunications, IT infrastructure, medical systems, auxiliary power units, or APU's, material handling equipment, and industrial controls. In addition, we are developing and selling products for consumer applications, selling primarily through a network of global distributors.
Tehachapi Wind Energy Storage Project. DTE is expected to use our battery technology in its plan to implement Community Energy Storage systems in its Michigan service territory.
We also sell our batteries and battery systems directly to end-user customers as well as through reseller and distributor channels.
Our contracts with customers include the purchase of our products, and in some cases, engineering and design work, maintenance and support services. These contracts include terms and conditions, including payment, delivery and termination that we believe are customary and standard in our industry. The majority of our customers are not contractually committed to purchase any minimum quantities of products from us and orders are generally cancelable prior to shipment. In addition, government entities may terminate their contracts with any party at any time. As a result, we do not disclose our order backlog, since we believe that our order backlog at any particular date is not necessarily indicative of actual revenue for any future period.
Development Partners and Joint Ventures
Pursuant to our joint venture agreement with SAIC, we will invest $4.7 million into the joint venture in return for a 49% ownership interest in the joint venture. The agreement provides that our subsidiary is responsible for supplying the joint venture with our battery cells according to the joint venture's production plan and for providing certain services and granting technology licenses to the joint venture under terms and conditions, including fees and royalties, to be agreed upon. Both parties agreed not to establish any new joint venture or any new business in China that would compete with the joint venture's activities in China. The agreement is for a twenty-year term and may be extended by mutual agreement of the joint venture parties and approval of the relevant Chinese authorities. In connection with the agreement, we irrevocably and unconditionally guaranteed to SAIC the full and prompt performance by our subsidiary of its obligations under the agreement.
Under our exclusive license agreement with Gillette, Gillette paid us an up-front, support and additional license fees totaling $28.0 million. In addition, the agreement requires Gillette to pay us royalty fees on net sales of products that include our technology. We have agreed with Gillette that if, during a certain period following execution of the license agreement, we enter into an agreement with a third party that materially restricts Gillette's license rights under the license agreement, then we may be required to refund to Gillette all license and support fees paid to us by Gillette under the license agreement, plus, in certain cases, an additional amount to cover Gillette's capital and other expenses paid and/or committed by Gillette in reliance upon its rights under the license agreement.
In January 2010, we entered into an agreement to purchase preferred stock of Fisker, an automaker of PHEV and EV vehicles. We invested $13.0 million in cash, and 479,282 shares of our common stock, which, when transferred to Fisker, had a fair market value of $7.5 million. We also entered into a supply agreement with Fisker to supply prismatic batteries to be used in the Fisker Karma PHEV.
17
In August 2010, we entered into an agreement with 24M Technologies, Inc., or 24M, a company focused on battery development to improve on energy storage capabilities, to transfer certain patents in return for a minority ownership interest in 24M.
Government Initiatives and Contract Research
Federal Government
In February 2009, the U.S. government enacted the ARRA, which provides for $2 billion in grants under the DOE Battery Initiative to support the construction and capacity expansion of U.S. manufacturing plants to produce batteries and electric drive components for HEV, PHEV and EV vehicles. We were selected to receive a $249.1 million grant award under the DOE Battery Initiative to support our manufacturing expansion and in December 2009 we completed an agreement on the grant's terms and conditions. We are required to spend one dollar of our own funds for every incentive dollar we receive under the DOE Battery Initiative. We have incurred allowable costs entitling us to receive approximately $89.0 million in reimbursements which we have reported to DOE.
We have also applied for direct loans under the DOE ATVM Program to support our manufacturing expansion. Based on the amount of our grant award under the DOE Battery Initiative and the guidelines associated with the ATVM Program, we believe we will be permitted to borrow up to $233 million under the ATVM Program. We expect we will be required to spend one dollar of our own funds for every four dollars we borrow under the ATVM Program. The timing and the amount of any loan we may receive under the ATVM Program, as well as the specific terms and conditions applicable to any loan we may receive are currently not known by us, and, once disclosed to us, are subject to change and negotiation with the federal government.
State of Michigan
The State of Michigan has awarded us a $10.0 million grant as an incentive to establish a lithium-ion battery manufacturing plant. We received $3.0 million of the $10.0 million grant in March, 2009 and $6.0 million in July 2010, with the remainder to be paid based on the achievement of certain milestones in our facility development. We have used $8.2 million of these funds and intend to continue to use these funds to support the expansion of our facilities in Livonia and Romulus, Michigan.
In October 2009, we entered into a High-Tech Credit agreement with the Michigan Economic Growth Authority, or MEGA, pursuant to which we are eligible for a 15-year tax credit, beginning with payments made for the 2011 fiscal year. This credit has an estimated value of up to $25.3 million, depending on the number of jobs we create in Michigan. In November 2009, we entered into a Cell Manufacturing Credit agreement with MEGA pursuant to which we are eligible for a credit equal to 50% of our capital investment expenses commencing January 2009, up to a maximum of $100 million over a four-year period related to the construction of our integrated battery cell manufacturing plant. The tax credit shall not exceed $25 million per year beginning with the tax year of 2012. The tax credit may be claimed under the Michigan Business Tax, or MBT, Act which states that an election may be made on each year's MBT return where the credit is claimed, to either have the amount of the credit that exceeds the respective year's MBT liability to be refunded or carried forward for ten years. We are required to create 300 jobs no later than December 31, 2016 in order for the tax credit proceeds to be non-refundable. The tax credit is subject to a repayment provision in the event we relocate 51% or more of the 300 jobs outside of the State of Michigan within three years after the last year we received the tax credit. Through December 31, 2010, we have incurred expenses of $151.6 million related to the construction of our Livonia and Romulus facilities. When we have met the filing requirements for the tax year ending December 31, 2012, we expect to receive approximately $75.8 million in proceeds related to these expenditures.
18
The State of Michigan has also offered us a low interest forgivable loan of up to $4.0 million effective August 2009 with the objective of conducting advance vehicle technology operations to promote and enhance job creation within the State of Michigan. To receive advances from the loan, we are required to achieve certain key milestones related to the development of our manufacturing facility. We met the first milestone for the loan in the first quarter of 2011 and in February 2011 we received the initial advance of $1.2 million under this loan. We expect to receive the remainder of the loan upon achieving certain milestones. If we create 350 full time jobs by August 2012, this milestone will trigger complete forgiveness of the debt.
In December 2009, the State of Michigan offered us a $2.0 million grant to develop and improve the quality of application of energy efficient technologies and to create or expand the market for such technologies. We are required to demonstrate a smart grid stabilization system combined with renewable power sources such as solar and wind that will help power our Livonia plant to produce the batteries that will electrify transportation and stabilize the grid. We have received an initial advance of $0.9 million, and we will receive the remainder upon submitting for funding from the State of Michigan. In addition, we entered into an agreement with the City of Livonia which provides us a complete exemption from personal property taxes incurred in Livonia, on all new personal property during the exemption period commencing on December 31, 2009. The exemption will continue through December 31, 2023 provided we invest at least $24.0 million in personal property and create or locate 350 new jobs in the eligible district.
In May 2010, we entered into a Renaissance Zone Development agreement with the Michigan Strategic Fund and the property owners for the site we lease in Romulus, Michigan. We may receive exemptions, deductions, credits or other benefits if we invest a certain amount of capital and create a certain number of jobs related to the facility in Romulus, Michigan. As of December 2010, we have not yet met the conditions to be eligible to receive any of the Renaissance Zone benefits.
Massachusetts
In October 2010, we entered into a forgivable loan agreement with the Massachusetts Clean Energy Technology Center for $5.0 million for the purpose of funding working capital, capital expenses, and leasehold improvements for our new corporate headquarters and primary research and development center in Waltham, Massachusetts and Energy Solutions Group engineering and manufacturing facilities in Westborough, Massachusetts. If we create 263 new jobs in Massachusetts between January 1, 2010 and December 31, 2014 and maintain at least 513 jobs in Massachusetts from January 1, 2015 to October 2017, $2.5 million of the outstanding principal and accrued interest on the loan will be forgiven. If we spend, or commit to spend, at least $12.5 million in capital expenses or leasehold improvements within one year form the closing of the loan, $2.5 million of the outstanding principal and accrued interest on the loan will be forgiven in October 2011. As of December 31, 2010, we have borrowed the full $5.0 million under this agreement, $2.5 million of which we expect to be forgiven as we are reasonably assured we will comply with the conditions related to the capital expenditure target. The remaining $2.5 million is recorded in long-term debt until we have reasonable assurance that we will comply with the conditions of the grant for the forgiveness related to the creation of new jobs in Massachusetts.
Contract Research
We have received awards from the Department of Energy's collaboration with the United States Advanced Battery Consortium, or USABC. In December 2006, we commenced the HEV battery development program with the USABC. This first program is a $15.0 million program, with a 50-50 cost share whereby the USABC provided us up to $7.5 million, designed to accelerate development of a high-performance, low cost HEV battery. This program was completed in 2010. The second program we commenced with USABC is a $12.5 million program, also with a 50-50 cost share, with a goal of
19
developing high-energy, low cost PHEV batteries. Under this program, we are targeting the development of two different kinds of PHEV batteries, one with ten miles of electric equivalent range and the other with 40 miles of electric equivalent range. As of December 31, 2010, we expect to spend an additional $1.4 million for the USABC program of which we expect to be reimbursed for $0.7 million. In February 2011, we were awarded a new USABC program for $8.0 million, also with a 50-50 cost share, to improve upon high-power prismatic cells. We expect to receive $4.0 million in reimbursements under this program.
Manufacturing
Our global supply chain and manufacturing infrastructure can produce millions of batteries and hundreds of metric tons of active materials per year. We measure our product shipments in watt hours, which is the energy capacity of a single battery for a single complete discharge.
Watt hours, or Wh, are the amp hour storage capacity of a battery multiplied by its voltage. The average battery voltage for our 26650 battery is 3.3 volts, or 3.3 V. We determine amp hour storage capacity at a specific discharge rate and a specific depth of discharge. We do this by charging the battery to its top voltage and discharging it to zero capacity (2 volt charge level). A battery's usable energy capacity is determined at the application level. For example, our 26650 battery has a nominal capacity of 2.3 Ah and operates at 3.3 V, resulting in 7.59 Wh.
As of December 31, 2010, we estimate that our annual manufacturing capacity was approximately 345.3 million watt hours.
We have over 1.2 million square feet of manufacturing facilities worldwide where we produce or intend to produce our batteries, from raw powder to finished batteries and battery systems using both our facilities and third party contractors. Our manufacturing facilities are located in Livonia and Romulus, Michigan, Changzhou, China in an export processing zone and at our facilities in Korea. Risks attendant to our foreign operations are discussed in Item 1A of this Annual Report on Form 10-K under the heading Risks Associated with Doing Business Internationally and Specifically in China and Korea. We also have the capability to manufacture and assemble low volume, high value-add battery modules and systems at our energy solutions group facility in Westborough, Massachusetts.
We commenced commercial production of powder in the third quarter of 2005 and outsourced the coating and battery and battery system assembly. Initial battery production ramp-up commenced in the third quarter of 2005 and our first commercial batteries began shipping in February 2006. During 2007, we commenced construction of two additional plants for the expansion of powder production and new coating production and signed a lease for a third plant for new battery assembly at our Changzhou location. We completed the qualification of these plants for full volume production in 2007. In 2009, we expanded the operations in Changzhou, China to include pack assembly operations.
While our concentration of manufacturing facilities has historically been in Asia, we expanded our domestic battery manufacturing capacity in 2010 by establishing vertically-integrated manufacturing plants in the United States that would perform all of the stages of the manufacture of batteries and battery systems. The first phase of this expansion is taking place in Livonia, Michigan, where during the third quarter of 2010, we opened our new manufacturing facility. In Livonia, we intend to produce prismatic cells and pack systems using the same processes and equipment we currently use in our Asian factories. We also entered into a lease in December 2009 for an additional facility in Romulus, Michigan, which is expected to begin qualification for production in the first quarter of 2011. Our planned U.S. expansion depends upon the continued receipt of sufficient federal and state incentive funding and is intended to complement our existing manufacturing facilities in Asia. The goal of this expansion, which would occur gradually and over several years, is to significantly improve specific operational output in powder, coating and cell and pack assembly.
20
The manufacturing of our batteries and systems requires several integrated stages: powder synthesis, cathode and anode coating, battery and battery system assembly. We continue to augment the degree of automation in each of these stages, transitioning from semi-automated production lines, to production lines with fully automated process bays and high volume equipment, where the only manual steps consist of loading and monitoring equipment and performing certain quality control processes.
Our manufacturing operations allow us to directly control product quality and minimize the risks associated with having to disclose proprietary technology to outside parties during production. In Asia, to further protect our intellectual property, we use separate manufacturing facilities for each phase of battery production. We control every stage in the manufacture of our products except for the final assembly of our 18650 batteries where we are producing this battery through partnerships with third-party suppliers rather than building our own production capacity.
Our powder, coating and assembly facilities incorporate environmental control and processing systems in a modular design geared for easy and rapid capacity expansion. To complete each new production line, we plan to use a systematic replication process designed to enable us to add production lines rapidly and efficiently and achieve operating metrics in new production environments that offer comparable performance to that of our current plants.
We also are seeking to lower our manufacturing costs and to improve our cost per Wh manufactured by refining processes and intermediate quality control to improve manufacturing yields, obtaining raw material and component volume discounts, consolidating sub-contractors, substituting certain raw materials, managing inventory and optimizing shipping costs. While our manufacturing philosophy is designed to achieve low cost in order to maintain sustainable competitive advantage, it is also focused on providing world class quality. We are compliant with ISO 9001:2000 certification TS16949 certification.
An important consideration as we grow our revenue stream is to ensure that we have access to the various components and raw materials we need to manufacture and assemble our various products. As we plan larger orders, establishing multiple sources for key components is important to our operations.
We source our raw materials from many suppliers globally. Our goal is to multiple source raw materials and components. If we are not able to qualify multiple sources, we monitor our supplier scalability and capacity very closely.
Key components of our cells that are currently single sourced include:
- •
- Graphite materials which is sourced from a large U.S. based company which is increasing their capacity to meet our demand
and we are confident in their ability to meet our requirements. We monitor supplier scale-up regularly. We have a contract in place with this supplier and have committed to a minimum
purchase volume for each year thru December 31, 2013.
- •
- Iron phosphate and lithium carbonate are currently sourced from China. We are in the process of qualifying second sources
and expect these qualifications to be completed by mid-year 2011. Additionally, there are other potential suppliers we are reviewing and will proceed as necessary.
- •
- Certain materials used in our prismatic cells are single sourced from suppliers located in Korea and Japan. We have
identified alternative sources for each of these materials and will complete qualification in 2011, or as required.
- •
- Other materials are sourced from a variety of global suppliers and their ability to meet our demand is monitored carefully
and we implement back-up plans as necessary. Many of these other components are available from a multitude of suppliers.
- •
- Some components used are single sourced and have extended lead times. We manage this carefully and order long lead time parts to minimize the risk.
As of December 31, 2010, we had 1,493 employees in manufacturing operations and supply chain.
21
Sales and Marketing
We market and sell our products primarily through a direct sales force, consisting of individuals who have backgrounds in either electrical or mechanical engineering and who generally have experience selling batteries and battery systems into the specific market segments to which they are assigned. In November 2009, we created two focused business groups—one dedicated to the transportation market and the other to cell design and development—to best serve customers across all of our vertical markets. The newly formed business organizations are the Automotive Solutions Group and the Cell Products Group. These groups operate alongside the existing Energy Solutions Group, which serves electric grid and commercial markets. The Automotive Solutions Group is comprised of dedicated engineering and product development experts and sales and marketing professionals with extensive automotive experience and locations in Michigan, Massachusetts, Asia and Germany. In the transportation market, we are focusing sales of our batteries and battery systems to automotive manufacturers either directly or through tier 1 suppliers. We are working with automotive manufacturers directly to educate and inform them about the benefits of our technology for use in HEVs, PHEVs and EVs. At the same time, we are working with tier 1 suppliers who are developing integrated solutions using our batteries.
In the electric grid market, our initial sales have been made directly through our sales force. In the commercial market, our sales are made both directly and indirectly through distributors with key accounts managed by our sales personnel. We also have value added partners in the United States, Europe, and Asia who integrate our products into consumer applications. Our indirect channel sales are made primarily through these value-added distributors and sales representatives in North America, Europe and Asia which focus on non-major customer accounts.
Our direct sales force is based in the United States, Asia and Europe. We are expanding our sales presence in the United States and Europe and are seeking to expand our presence in Asia as our business in those regions continues to develop. We expect international markets to provide increased opportunities for our products.
We have entered into strategic relationships with business partners based in Europe, China and Japan who have complementary technologies for, and experience in, the transportation, electric grid and other markets and we may enter into strategic relationships with business partners based in other countries. We entered into a joint marketing agreement with IHI Corporation in October 2009 to assess market opportunities in Japan and to serve potential customers in the Japanese transportation, industrial and marine markets. Under the terms of the agreement, we will investigate market opportunities, train IHI employees on our product offerings, and pursue new energy storage business opportunities with IHI in the Japanese market.
We believe that forming such relationships could help to achieve cost economies in product development and manufacturing, provide us with the ability to take advantage of any available local government stimulus funding and related incentives, result in optimized products and provide advantages in marketing and selling our products in the geographic markets where our partners are based.
Our sales cycles vary by market segment and typically follow a lengthy development and qualification period prior to commercial production. We expect that the total time from customer introduction to commercial production may range up to five years depending on the specific product and market served. For example, total time in the transportation market includes a customer's preliminary technology review which generally ranges from three to twelve months and product development which generally ranges from twelve to eighteen months. In the electric grid services market time to production includes, a customer's preliminary technical assessment typically takes three to six months followed by an additional six to twelve months of permitting the utility interconnection process. In the grid market, we have developed a flexible product architecture that allows various sized
22
products to be manufactured, shipped and installed within six to twelve months. In the commercial market, the time from introduction to commercial production can take up to three years or more.
We focus our marketing efforts on increasing brand awareness, communicating product advantages and generating qualified leads for our sales force and channel partners. We rely on a variety of marketing vehicles, including participation in industry conferences and trade shows, to share our technical message with customers, as well as public relations, industry research and our collaborative relationships with our strategic investors and business partners.
As of December 31, 2010, we had 43 employees in sales and marketing, including 26 sales professionals.
Research, Development and Engineering
Our research, development and engineering efforts are focused on developing new products and continuously improving the performance of existing products. We design our products for performance metrics such as energy density (the amount of energy per volume of the battery), specific energy (the amount of energy per mass of the battery), power density (the amount of power per volume of the battery) and specific power (the amount of power per mass of the battery), cycle life, calendar life and numerous safety and abuse-tolerance metrics. We focus our research and development efforts on the following areas:
- •
- Improving the energy, power, life and safety of key electrode-active
materials. At our Massachusetts and Michigan facilities we devote substantial efforts to developing new compositions and structures of
cathode and anode materials and low-cost processes for synthesizing these materials. These compositions and processes are validated at laboratory and pilot-plant scales before being
transitioned to our high-volume manufacturing facilities.
- •
- Developing battery component formulations and
chemistries. The optimization of lithium-ion batteries requires consideration of interrelated electrical, chemical and
mechanical phenomena that occur within batteries during field use. We develop proprietary cathode and anode formulations and coating procedures, as well as proprietary electrolyte compositions that
are evaluated along with other critical components to arrive at complete battery designs.
- •
- Electrical, mechanical, and thermal design. Physical
battery design is an important consideration for the sealability, durability, cooling and abuse-tolerance of lithium-ion batteries, especially those used in large high-power
battery systems. We have and continue to develop innovative constructions for our cylindrical and prismatic battery products. This development work takes place across several of the company's research
and development and manufacturing facilities in the United States, China and Korea.
- •
- Battery systems-level design. We develop battery systems that can be used by a number of customers, and we work with our customers to develop customized battery systems for specific applications. We have also developed a modular and highly scalable battery system design for our prismatic battery systems. This work takes place primarily within our energy systems group, at facilities located in Westborough and Hopkinton, Massachusetts and Livonia, Michigan.
We believe that our ability to deliver higher performance batteries and battery systems depends upon the rapid and effective transfer of the technology developed in our research and development laboratories into high volume manufacturing. Therefore, we maintain pilot plant capabilities and we reserve a portion of our production capacity for structured experiments related to manufacturing process development.
23
As of December 31, 2010, we had 324 research and development employees worldwide. Research, development and engineering expenses totaled $37.0 million in 2008, $48.3 million in 2009 and $60.7 million in 2010.
Universities and National Laboratories
An important part of our overall research activities are our relationships with universities and national laboratories. We maintain active collaborations with the Massachusetts Institute of Technology relating to electrode materials for batteries used in transportation applications, the University of Michigan relating to the development of manufacturing technology designed to support transportation applications, Michigan State University relating to the development of materials technology designed to support next generation battery cell products, and The University of Texas relating to electrochemical and thermal cell modeling designed to support transportation and grid applications, as well as several U.S. Department of Energy laboratories, including Lawrence Berkeley National Laboratory relating to investigating the life of lithium-ion batteries, Argonne National Laboratory and Sandia National Laboratory relating to validating cell performance and abuse test results conducted for USABC in transportation applications and the National Renewable Energy Laboratory relating to validating thermal cell testing activity and module level thermal modeling. Some of these collaborations take place under the auspices of the USABC, which is comprised of Chrysler, Ford and GM. For the year ended December 31, 2010, we invested $65.7 million into our research and development activities of which we have been reimbursed through government contracts for $4.9 million. We also received $12.0 million of services revenue from U.S. government agencies for research and development services for the year ended December 31, 2010.
Competition
Competition in the battery industry is intense and rapidly evolving. Our markets are subject to changing technology trends, shifting customer needs and expectations and frequent introduction of new technologies. We believe the primary competitive factors in our markets are:
- •
- product performance, reliability and safety;
- •
- integrated solutions;
- •
- product price; and
- •
- manufacturing capabilities.
We face competition from joint venture companies in our industry. For example, in 2008, Bosch and Samsung formed LiMotive to focus on the development, production and marketing of lithium-ion battery systems for use in HEVs and other electric vehicles. Dow Chemical established a joint venture with Kokam America and others, to build a facility in Michigan for the manufacture of lithium polymer batteries for use in HEVs and other electric vehicles.
In the rechargeable battery market, the principal competitive technologies currently marketed are lead-acid, nickel-cadmium, nickel metal hydride and lithium-ion batteries. Our primary competitors who have announced the availability of either lithium-ion or other competing rechargeable battery products include Panasonic, Sanyo, BYD, LG, Lithium Energy Japan (Mitsubishi-GS Yuasa), Blue Energy Company (Honda-GS Yuasa), and SB LiMotive (Samsung-Bosch) among others.
Within each of our target markets, we encounter the organizations named above as well as other competitors:
- •
- Transportation. In the transportation market, we compete with various battery companies, many of which are large or formed by large companies, including, Panasonic, SB LiMotive, Automotive Energy Supply Corporation, Johnson Controls-Saft Advanced Power Solutions, Toshiba, Kokam,
24
- •
- Electric Grid Services. In the electric grid services
market, we compete with Saft and Altairnano. Several other lithium-ion battery companies such as Samsung, Sanyo and Enerdel have stated that they also plan to enter the grid services
market. We also expect competition from manufacturers of other battery technologies, such as sodium-sulphur from NGK Insulators, Ltd. in Japan, lead acid batteries from Xtreme Battery and redox
flow batteries under development from companies including Prudent Energy. Finally, we may encounter competition from developers of flywheel technologies, such as Beacon Power Corp. A flywheel electric
grid energy storage system draws electrical energy from the utility grid and stores it in a rotating flywheel, making it available when needed at a later time through a motor-generator system.
- •
- Commercial. Our principal competitors in this market are Panasonic, Sony, Samsung, LG, Valence and E-One Moli Energy Corp. We also are aware of other vendors making batteries in China under a variety of different manufacturing labels for this market.
Hitachi, Ltd., LG, GS Yuasa, Sony, Lithium Energy Japan, EnerDel Inc., Valence and MES-DEA S.A.
Many of our competitors have greater market presence, longer operating histories, stronger name recognition, larger customer bases and significantly greater financial, technical, sales and marketing, manufacturing and other resources than we have. Moreover, if one or more of our competitors were to merge or partner with another of our competitors, the change in the competitive landscape could adversely affect our customer relationships and competitive position or otherwise affect our ability to compete effectively.
Intellectual Property
Our success depends in part upon our ability to obtain and maintain proprietary protection for our products, technology and know-how, to operate without infringing the proprietary rights of others and to prevent others from infringing our proprietary rights. Our policy is to seek to protect our proprietary position by, among other methods, filing United States and foreign patent applications related to our proprietary technology, inventions and improvements that are important to the development and conduct of our business. We also rely on trademarks, trade secrets, know-how, continuing technological innovation and in-licensing opportunities to develop and maintain our proprietary position.
As of December 31, 2010, we owned or exclusively licensed a total of 23 United States patents, with 97 United States pending patent applications and 30 foreign issued patents, with 228 pending foreign patent applications.
The patent positions of companies like ours are generally uncertain and involve complex legal and factual questions. Our ability to maintain and solidify our proprietary position for our technology will depend on our success in obtaining effective patent claims and enforcing those claims once granted. We do not know whether any of our patent applications or those patent applications that we license will result in the issuance of any patents. Our issued patents and those that may issue in the future, or those licensed to us, may be challenged, invalidated or circumvented, which could limit our ability to stop competitors from marketing related products or shorten the term of patent protection that we may have for our products. In addition, the rights granted under any issued patents may not provide us with competitive advantages against competitors with similar technology. Furthermore, our competitors may independently develop similar technologies or duplicate any technology developed by us. Because of the extensive time required for development, testing and regulatory review of a potential product, it is possible that, before any of our products under development can be commercialized, any related patent may expire or remain in force for only a short period following commercialization, thereby reducing any advantage of the patent.
25
We rely, in some circumstances, on trade secrets to protect our technology. Trade secrets, however, are difficult to protect. We seek to protect our proprietary technology and processes, in part, by confidentiality agreements with our employees, consultants, scientific advisors and other contractors. These agreements may be breached, and we may not have adequate remedies for any breach. In addition, our trade secrets may otherwise become known or be independently discovered by competitors. To the extent that our employees, consultants or contractors use intellectual property owned by others in their work for us, disputes may arise as to the rights in related or resulting know-how and inventions.
We use trademarks on some of our products and believe that having distinctive marks may be an important factor in marketing our products. We have registered our A123® and A123 Systems® marks in the United States and internationally. Our other trademarks include the A123 Systems logo. We have also registered some of our marks in a number of foreign countries. Although we have a foreign trademark registration program for selected marks, we may not be able to register or use such marks in each foreign country in which we seek registration.
We often enter into research and development arrangements with the federal government or other government agencies that require us to provide pure research, in which we investigate design techniques on new battery technologies. Generally, our research and development arrangements provide that all pre-existing or newly created intellectual property remains under the ownership of the respective party, and that all jointly-created intellectual property be owned by both parties without a duty to account for or pay royalties to the other party.
With respect to the research and development awards we have received to date from the USABC for HEV and PHEV battery development, our contracts provide that we own all intellectual property rights we acquire or develop during our research and development activities so long as we agree to contribute at least a 50% share of the total program costs under each program's 50-50 cost share arrangement. If we do not make our 50% cost share contribution, then we are required to grant the USABC a nonexclusive, fully paid, worldwide, irrevocable license to our intellectual property rights to any application of the relevant technology, under reasonable terms and conditions.
Employees
As of December 31, 2010, we had 2,032 full-time employees, with 324 in research and development, 1,493 in manufacturing operations/supply chain, 43 in sales and marketing and 172 in general and administration.
Of our full-time employees, 717 are located in the United States and 1,315 are abroad. We consider our current relationship with our employees to be good.
None of our employees are represented by labor unions or have collective bargaining agreements, except for certain employees in our Changzhou, China facilities who established a Labor Union Commission in 2007.
Segments and Geographic Information
We have determined that we have one operating segment. For more information about our segments, and for financial information about geographic areas, see Note 2 to our consolidated financial statements in this Annual Report on the Form 10-K under the heading Summary of Significant Accounting Policies—Segment, Geographic and Significant Customer Information.
Additional Information
Our annual reports on Form 10-K, quarterly reports on Form 10-Q, periodic reports on Form 8-K and amendments thereto are available to the public, free of charge, on our website,
26
www.a123systems.com, as soon as reasonably practicable after they have been filed with the Securities and Exchange Commission, or SEC, and through the SEC's website, www.sec.gov. We are not including the information contained on our website as part of, or incorporating it by reference into, this Annual Report on Form 10-K.
Our business is subject to numerous risks, including those discussed below. We caution you that the following important factors, among others, could cause our actual results to differ materially from those described in this Annual Report and expressed in forward-looking statements made by us or on our behalf in filings with the SEC, press releases, communications with investors and oral statements. Any or all of our forward-looking statements in this Annual Report on Form 10-K and in any other public statements we make may turn out to be wrong. They can be affected by inaccurate assumptions we might make or by known or unknown risks and uncertainties. We refer you to the section above entitled "Note About Forward Looking Statements," which identified forward-looking statements in this report. We undertake no obligation to update any forward-looking statements, whether as a result of new information, future events or otherwise.
Risks Related to Our Business
We have had a history of losses, and we may be unable to achieve or sustain profitability.
We have never been profitable. We experienced net losses of $80.5 million for 2008, $86.6 million for 2009 and $152.9 million for 2010. We expect we will continue to incur net losses for the near term. We expect to incur significant future expenses as we develop and expand our business and our manufacturing capacity. In addition, as a public company, we incur additional significant legal, accounting and other expenses that we did not incur as a private company. These increased expenditures will make it harder for us to achieve and maintain future profitability. We may incur significant losses in the future for a number of reasons, including the other risks described in this section, and we may encounter unforeseen expenses, difficulties, complications, delays and other unknown events. Accordingly, we may not be able to achieve or maintain profitability.
We have yet to achieve positive cash flow, and our ability to generate positive cash flow is uncertain.
To rapidly develop and expand our business, we have made significant up-front investments in our manufacturing capacity and incurred research, development and engineering, sales and marketing, general and administrative and production start-up expenses. In addition, our growth has required a significant investment in working capital over the last several years. We have had negative cash flow before financing activities of $76.0 million for 2008, $114.7 million for 2009 and $250.4 million for 2010. We anticipate that we will continue to have negative cash flow for the foreseeable future as we continue to make significant future capital expenditures to expand our manufacturing capacity and incur increased research, development and engineering, sales and marketing, general and administrative and production start-up expenses. Our business will also require significant amounts of working capital to support our growth. Therefore, we will need to raise additional capital from investors to achieve our expected growth, and we may not achieve sufficient revenue growth to generate positive future cash flow. An inability to generate positive cash flow for the foreseeable future or raise additional capital on reasonable terms may decrease our long-term viability.
Our failure to raise additional capital necessary to expand our operations and invest in our products and manufacturing facilities could reduce our ability to compete successfully.
We will require additional capital in the future to fund our growth and expansion plans and we may not be able to obtain additional debt or equity financing on favorable terms, if at all. If we raise
27
additional equity financing, our stockholders may experience significant dilution of their ownership interests, and the per-share value of our common stock could decline. If we engage in debt financing, we may be required to accept terms that restrict our ability to incur additional indebtedness and force us to maintain specified liquidity or other ratios. We are also seeking federal and state grants, loans and tax incentives some of which we intend to use to expand our operations. We may not be successful in obtaining these funds or incentives. If we need additional capital and cannot raise or otherwise obtain it on acceptable terms, we may not be able to, among other things:
- •
- develop or enhance our products or introduce new products;
- •
- continue to expand our development, sales and marketing and general and administrative organizations and manufacturing
operations;
- •
- attract top-tier companies as customers or as our technology and product development partners;
- •
- acquire complementary technologies, products or businesses;
- •
- expand our operations, in the United States or internationally;
- •
- expand and maintain our manufacturing capacity;
- •
- hire, train and retain employees; or
- •
- respond to competitive pressures or unanticipated working capital requirements.
Our limited operating history makes it difficult to evaluate our current business and future prospects.
We have been in existence since 2001, but much of our growth has occurred in recent years. Our limited operating history may make it difficult to evaluate our current business and our future prospects. We have encountered and will continue to encounter risks and difficulties frequently experienced by growing companies in rapidly changing industries, including increasing expenses as we continue to grow our business. If we do not manage these risks successfully, our business will be harmed.
In addition, we are targeting new and emerging markets for our batteries and battery systems. However, historically, a significant portion of the products that we have sold were designed for the consumer tool market, which is a more mature market with different growth prospects than our other target markets. Several of our products are still under development, including a battery in prismatic form and related battery systems designed for use in the transportation and electric grid industries, and the timing of the ultimate release, if any, of new production quality products is not determinable. Our efforts to expand beyond our existing markets may never result in new products that achieve market acceptance, create additional revenue or become profitable. Therefore, our recent historical growth trajectory may not provide an accurate representation of the market dynamics we may be exposed to in the future, making it difficult to evaluate our future prospects.
The demand for batteries in the transportation and other markets depends on the continuation of current trends resulting from dependence on fossil fuels. Extended periods of low gasoline prices could adversely affect demand for electric and hybrid electric vehicles.
We believe that much of the present and projected demand for advanced batteries in the transportation and other markets results from increases in the cost of oil over the last several years, the dependency of the United States on oil from unstable or hostile countries, government regulations and economic incentives promoting fuel efficiency and alternate forms of energy, as well as the belief that climate change results in part from the burning of fossil fuels. If the cost of oil decreased significantly, the outlook for the long-term supply of oil to the United States improved, the government eliminated or modified its regulations or economic incentives related to fuel efficiency and alternate forms of
28
energy, or if there is a change in the perception that the burning of fossil fuels negatively impacts the environment, the demand for our batteries could be reduced, and our business and revenue may be harmed.
Gasoline prices have been extremely volatile, and this continuing volatility is expected to persist. Lower gasoline prices over extended periods of time may lower the perception in government and the private sector that cheaper, more readily available energy alternatives should be developed and produced. If gasoline prices remain at deflated levels for extended periods of time, the demand for hybrid and electric vehicles may decrease, which would have a material adverse effect on our business.
If we are unable to develop, manufacture and market products that improve upon existing battery technology and gain market acceptance, our business may be adversely affected. In addition, many factors outside of our control may affect the demand for our batteries and battery systems.
We are researching, developing, manufacturing and selling lithium-ion batteries and battery systems. The market for advanced rechargeable batteries is at a relatively early stage of development, and the extent to which our lithium-ion batteries will be able to meet our customers' requirements and achieve significant market acceptance is uncertain. Rapid and ongoing changes in technology and product standards could quickly render our products less competitive, or even obsolete if we fail to continue to improve the performance of our battery chemistry and systems. Other companies that are seeking to enhance traditional battery technologies have recently introduced or are developing batteries based on nickel metal-hydride, liquid lithium-ion and other emerging and potential technologies. These competitors are engaged in significant development work on these various battery systems. One or more new, higher energy rechargeable battery technologies could be introduced which could be directly competitive with, or superior to, our technology. The capabilities of many of these competing technologies have improved over the past several years. Competing technologies that outperform our batteries could be developed and successfully introduced, and as a result, our products may not compete effectively in our target markets. If our battery technology is not adopted by our customers, or if our battery technology does not meet industry requirements for power and energy storage capacity in an efficient and safe design, our batteries will not gain market acceptance.
In addition, the market for our products depends upon third parties creating or expanding markets for their end-user products that utilize our batteries and battery systems. If such end-user products are not developed, if we are unable to have our products designed into these end user products, if the cost of these end-user products is too high, or the market for such end-user products contracts or fails to develop, the market for our batteries and battery systems would be expected similarly to contract or collapse. Our customers operate in extremely competitive industries, and competition to supply their needs focuses on delivering sufficient power and capacity in a cost, size and weight efficient package. The ability of our customers to adopt new battery technologies will depend on many factors outside of our control. For example, in the automotive industry, we depend on our customers' ability to develop HEV, PHEV and EV platforms that gain broad appeal among end users.
Many other factors outside of our control may also affect the demand for our batteries and battery systems and the viability of widespread adoption of advanced battery applications, including:
- •
- performance and reliability of battery power products compared to conventional and other non-battery energy
sources and products;
- •
- success of alternative battery chemistries, such as nickel-based batteries, lead-acid batteries and conventional lithium-ion batteries and the success of other alternative energy technologies, such as fuel cells and ultra capacitors;
29
- •
- end-users' perceptions of advanced batteries as relatively safe and reliable energy storage solutions, which
could change over time if alternative battery chemistries prove unsafe or become the subject of significant product liability claims and negative publicity is generated on the battery industry as a
whole;
- •
- cost-effectiveness of our products compared to products powered by conventional energy sources and alternative
battery chemistries;
- •
- availability of government subsidies and incentives to support the development of the battery power industry;
- •
- fluctuations in economic and market conditions that affect the cost of energy stored by batteries, such as increases or
decreases in the prices of electricity;
- •
- continued investment by the federal government and our customers in the development of battery powered applications;
- •
- heightened awareness of environmental issues and concern about global warming and climate change; and
- •
- regulation of energy industries.
Our principal competitors have, and any future competitors may have, greater financial and marketing resources than we do, and they may therefore develop batteries or other technologies similar or superior to ours or otherwise compete more successfully than we do.
Competition in the battery industry is intense. The industry consists of major domestic and international companies, most of which have existing relationships in the markets into which we sell as well as financial, technical, marketing, sales, manufacturing, scaling capacity, distribution and other resources and name recognition substantially greater than ours. These companies may develop batteries or other technologies that perform as well as or better than our batteries. We believe that our primary competitors are existing suppliers of cylindrical lithium-ion, nickel cadmium, nickel metal-hydride and in some cases, non-starting/lighting/ignition lead-acid batteries. A number of our competitors have existing and evolving relationships with our target customers. For example, Bosch and Samsung formed SB LiMotive to focus on the development, production and marketing of lithium-ion battery systems for application in hybrid and other electric vehicles, and Dow Chemical has entered into a joint venture with Kokam America and others, to build a facility in Michigan for the manufacture of lithium polymer batteries for use in HEVs and EVs. In addition, NEC Corporation and Nissan entered into a joint venture to develop lithium-ion batteries in prismatic form, Sanyo and Volkswagen agreed to develop lithium-ion batteries for HEVs, Sanyo already provides nickel metal hydride batteries for Ford and Honda, and Toyota and Panasonic are engaged in a joint venture to make batteries for HEVs and EVs. LG Chem and its subsidiary, Compact Power, have also developed lithium-ion battery systems for hybrid and other electric vehicles. These competitors may be able to offer lower prices for their batteries than we can offer, and may even sell their batteries at below their production costs in order to compete with us, particularly in the transportation market. In addition, we expect new competitors will enter the markets for our products in the future. Potential customers may choose to do business with our more established competitors, because of their perception that our competitors are more stable, are more likely to complete various projects, can scale operations more quickly, have greater manufacturing capacity, are more likely to continue as a going concern and lend greater credibility to any joint venture. If we are unable to compete successfully against manufacturers of other batteries or technologies in any of our targeted applications, our business could suffer, and we could lose or be unable to gain market share.
30
Adverse business or financial conditions affecting the automobile industry may have a material adverse effect on our development and marketing partners and our battery business.
Much of our business depends on and is directly affected by the general economic state of the United States and global automobile industry. The effect of the continued economic difficulties of the major automobile manufacturers on our business is unclear. Two major auto manufacturers have emerged from bankruptcy, and it is possible that more of these companies may encounter financial difficulties. The impact of any such financial difficulties on the automobile industry and its suppliers is unclear and difficult to predict. Possible effects could include reduced spending on alternative energy systems for automobiles, a delay in the introduction of new, or the cancellation of new and existing, hybrid and electric vehicles and programs, and a delay in the conversion of existing batteries to lithium-ion batteries, each of which would have a material adverse effect on our business.
We have entered into agreements relating to joint design and development efforts with several automotive manufacturers and tier 1 suppliers regarding their HEV, PHEV and EV development efforts. Certain of these manufacturers and suppliers have in recent years experienced static or reduced revenues, increased costs, net losses, loss of market share, bankruptcy, labor issues and other business and financial challenges. As a result, these or other automotive manufacturers may discontinue or delay their planned introduction of HEVs, PHEVs or EVs as a result of adverse changes in their financial condition or other factors. Automotive manufacturers may also seek alternative battery systems from other suppliers which may be more cost-effective or require fewer modifications in standard manufacturing processes than our products. We may also experience delays or losses with respect to the collection of payments due from customers in the automotive industry experiencing financial difficulties.
We have experienced rapid growth in recent periods. If we fail to manage our growth effectively, we may be unable to execute our business plan, maintain high levels of service or address competitive challenges adequately.
We increased our number of full-time employees from 904 at January 1, 2008 to 2,032 at December 31, 2010, and our revenue increased from $68.5 million in 2008 to $97.3 million in 2010. Our growth has placed, and may continue to place, a significant strain on our managerial, administrative, operational, financial, information technology and other resources. We intend to further expand our overall business, customer base, headcount and operations both domestically and internationally. Expanding a global organization and managing a geographically dispersed workforce will require substantial management effort and significant additional investment in our infrastructure. We will be required to continue to improve our operational, financial and management controls and our reporting procedures and we may not be able to do so effectively. As such, we may be unable to manage our expenses effectively in the future, which may negatively impact our operating results in any particular quarter.
Because we build our manufacturing capacity based on our projection of future design wins and supply agreements, our business revenue and profits will depend upon our ability to enter into and complete these agreements, successfully complete these expansion projects, achieve competitive manufacturing yields and drive volume sales consistent with our demand expectations.
In order to fulfill the anticipated demand for our products, we invest in capital expenditures in advance of actual customer orders, based on estimates of future demand. We plan to continue the expansion of our manufacturing capacity across multiple product lines. The build-up of our internal manufacturing capabilities, such as the current expansions in Livonia and Romulus, Michigan, exposes us to significant up-front fixed costs. If market demand for our products does not increase as quickly as we have anticipated and align with our expanded manufacturing capacity, or if we fail to enter into and complete projected development and supply agreements, we may be unable to offset these costs and to achieve economies of scale, and our operating results may be adversely affected as a result of high
31
operating expenses, reduced margins, underutilization of capacity and asset impairment charges. Alternatively, if we experience demand for our products in excess of our estimates, our installed capital equipment may be insufficient to support higher production volumes, which could harm our customer relationships and overall reputation. In addition, we may not be able to expand our workforce and operations in a timely manner, procure adequate resources, or locate suitable third-party suppliers, to respond effectively to changes in demand for our existing products or to the demand for new products requested by our customers, and our current or future business could be materially and adversely affected. Our ability to meet such excess customer demand could also depend on our ability to raise additional capital and effectively scale our manufacturing operations.
We utilize standard manufacturing equipment that we modify and customize in order to meet our production needs. While this equipment may be available from various suppliers, its procurement requires long lead times. Therefore, we may experience delays, additional or unexpected costs and other adverse events in connection with our capacity expansion projects, including those associated with potential delays in the procurement and customization of manufacturing equipment and various components required for our products.
If we are unable to achieve and maintain satisfactory production yields and quality as we expand our manufacturing capabilities, our relationships with certain customers and overall reputation may be harmed, and our sales could decrease.
We expect to rely on our supply agreement with Fisker to represent a significant portion of our revenue in future periods. If Fisker is unable to fulfill its commitment under the supply agreement our revenues could be materially lower than our forecasts and we may have under-utilized manufacturing capacity.
We have a supply agreement with Fisker pursuant to which we are providing Fisker Automotive with advanced automotive battery systems over a multi-year period. If Fisker is not successful in executing on its strategic plan or does not meet the anticipated demand for our products, our revenues and profitability may be materially impacted. As we invest in capital expenditures and build our manufacturing capacity in anticipation of demand, including anticipated demand from Fisker under the supply agreement, our operating results may be adversely affected by underutilization of capacity, failure to achieve economies of scale, and reduced margins if actual orders are less than expected.
We may not be able to obtain, or to agree on acceptable terms and conditions for, all or a significant portion of the government grants, loans and other incentives for which we have applied and may in the future apply. Our customers and potential customers applying for government grants, loans and other incentives may condition purchases of our products upon their receipt of these funds or delay purchases of our products until their receipt of these funds.
We have applied for federal and state grants, loans and tax incentives under government programs designed to stimulate the economy and support the production of electric vehicles and advanced battery technologies, including a loan under the DOE ATVM Program. Much of our planned domestic manufacturing capacity expansion depends on receipt of these funds and other incentives, and the failure to obtain these funds or other incentives could materially and adversely affect our ability to expand our manufacturing capacity and meet planned production levels. We anticipate that in the future there will be new opportunities for us to apply for grants, loans and other incentives from the United States, state and foreign governments. Our ability to obtain funds or incentives from government sources is subject to the availability and continued availability of funds under applicable government programs and approval of our applications to participate in such programs. The application process for these funds and other incentives is and will be highly competitive. While we have received a grant under the DOE Battery Initiative and have received some state incentives, we cannot assure you that we will be successful in obtaining additional grants, loans and other incentives. Moreover, we may not be able to satisfy or continue to satisfy the requirements and milestones imposed by the granting
32
authority as conditions to receipt of the funds or other incentives, the timing of the receipt of the funds may not meet our needs and we nevertheless may be unable to successfully execute on our business plan. Moreover, not all of the terms and conditions associated with these incentive funds have been disclosed to us, and once disclosed, there may be terms and conditions with which we are unable to comply or which are commercially unacceptable to us. In addition, the DOE Battery initiative grant and any other federal government programs which may make additional awards to us will require us to spend a portion of our own funds for every incentive dollar we receive or are permitted to borrow from the government and will impose time limits during which we must use the funds awarded to us. If we are unable to raise sufficient additional capital so that we are able to receive all of the amounts which have and may be awarded to us in a timely manner, our ability to expand our manufacturing capacity could be materially adversely affected. In addition, less than expected actual and anticipated future demand for our products may cause us to slow the pace of the expansion of our manufacturing capacity such that we are not able to use the government incentive funds awarded or made available to us in the time periods required by the granting authorities.
Our customers and potential customers applying for these government grants, loans and other incentives may condition purchases of our products upon receipt of these funds or delay purchases of our products until receipt of these funds, and if our customers and potential customers do not receive these funds or the receipt of these funds is significantly delayed, our results of operations could suffer.
We are subject to government audits related to the government grants, loans and other incentives we have received. If the findings of the audit determine we have not met the requirements of the grant, loan or other incentive, we may be required to repay all or part of the amount received to the government authority.
We have received funds under federal and state grant and loan programs. Under the terms and conditions of the programs, we are subject to governmental audits of the amounts submitted for reimbursement of costs incurred. Although we expect to satisfy the requirements of the grants, loans, and other incentives received, we cannot assure that the government audits will not result in determining that a portion of the costs submitted for reimbursement do not comply with the conditions of the grant. If we do not meet the conditions of the grants, loans or other incentives, we may be required to repay all or a portion of the proceeds received to date from the federal or state agencies.
We rely on a limited number of customers for a significant portion of our revenue, and the loss of, or delay in the production process, of one or both of our two most significant customers, or several of our smaller customers, or one of our existing supply agreements with customers for significant future revenues, could materially harm our business.
A significant portion of our revenue is generated from a limited number of customers. For the years ended December 31, 2009 and 2010, revenue from BAE represented 35% and 28% of our revenue, respectively. For the years ended December 31, 2009 and 2010, revenue from AES accounted for 9% and 13% of our revenue, respectively. Although the composition of our significant customers will vary from period to period, we expect that most of our revenue will continue, for the foreseeable future, to come from a relatively small number of customers. In addition, our contracts with our customers generally do not include long-term commitments or minimum volumes that ensure future sales of our products. Consequently, our financial results may fluctuate significantly from period-to-period based on the actions of one or more significant customers. A customer may take actions that affect us for reasons that we cannot anticipate or control, such as reasons related to the customer's financial condition, changes in the customer's business strategy or operations, the introduction of alternative competing products, or as the result of the perceived quality or cost-effectiveness of our products. Our agreements with these customers may be cancelled if we fail to meet certain product specifications or materially breach the agreement or for other reasons outside of our control. In addition, our customers may seek to renegotiate the terms of current agreements or
33
renewals. The loss of or a reduction in sales or anticipated sales to our most significant or several of our smaller customers could have a material adverse effect on our business, financial condition and results of operations. Additionally, if one of our significant customers, several of our smaller customers, or one of our existing supply agreements with customers for significant future revenues experiences a delay in production, or their product is not successful, our business, financial condition and results of operations could be materially harmed.
Our financial results may vary significantly from period-to-period due to the long and unpredictable sales cycles for some of our products, the seasonality of certain end markets into which we sell our products, and changes in the mix of products we sell during a period, which may lead to volatility in our stock price.
The size and timing of our revenue from sales to our customers is difficult to predict and is market dependent. Our sales efforts often require us to educate our customers about the use and benefits of our products, including their technical and performance characteristics. Customers typically undertake a significant evaluation process that has in the past resulted in a lengthy sales cycle for us, typically many months and possibly up to five years. In some markets such as the transportation market, there is usually a significant lag time between the design phase and commercial production. We spend substantial amounts of time and money on our sales efforts and there is no assurance that these investments will produce any sales within expected time frames or at all. For example, we have previously spent substantial time and money on several designs with auto manufacturers that were ultimately awarded to another supplier. Given the potentially large size of battery development and supply contracts, the loss of or delay in the signing of a contract or a customer order could significantly reduce our revenue in any period. Since most of our operating and capital expenses are incurred based on the estimated number of design wins and their timing, they are difficult to adjust in the short term. As a result, if our revenue falls below our expectations or is delayed in any period, we may not be able to reduce proportionately our operating expenses or manufacturing costs for that period, and any reduction of manufacturing capacity could have long-term implications on our ability to accommodate future demand.
Our profitability from period-to-period may also vary significantly due to the mix of products that we sell in different periods. While we have sold most of our products to date into the commercial market, we are also focusing our sales efforts on applications in the transportation and electric grid markets. Products in these other markets have different cost profiles and are governed by different business dynamics. Consequently, sales of individual products may not necessarily be consistent across periods, which could affect product mix and cause gross and operating profits to vary significantly.
In addition, since our batteries and battery systems are incorporated into our customers' products for sale into their respective end markets, our business is exposed to the seasonal demand that may characterize some of our customers' own product sales. Because many of our expenses are based on anticipated levels of annual revenue, our business and operating results could also suffer if we do not achieve revenue consistent with our expectations for this seasonal demand.
As a result of these factors, we believe that quarter-to-quarter comparisons of our operating results are not necessarily meaningful and that these comparisons cannot be relied upon as indicators of future performance. Moreover, our operating results may not meet expectations of equity research analysts or investors. If this occurs, the trading price of our common stock could fall substantially either suddenly or over time.
If our products fail to perform as expected, or have technical issues, we could lose existing and future business, and our ability to develop, market and sell our batteries and battery systems could be harmed.
Our products are complex and could have unknown defects or errors, which may give rise to claims against us, diminish our brand or divert our resources from other purposes. Despite testing, new
34
and existing products have contained defects and errors and may in the future contain manufacturing or design defects, errors or performance problems when first introduced, when new versions or enhancements are released, or even after these products have been used by our customers for a period of time. These problems could result in expensive and time-consuming design modifications or warranty charges, delays in the introduction of new products or enhancements, significant increases in our service and maintenance costs, exposure to liability for damages, damaged customer relationships and harm to our reputation, any of which may adversely affect our business and our operating results. For example, in 2010, we identified several significant technical issues in the manufacturing scale-up of our prismatic batteries. Although we identified and have taken corrective actions for these issues, the problems encountered resulted in a higher yield loss in ramp-up production, temporary halts in the production process and the distraction of personnel, some or all of which could re-occur.
Our success in the transportation market depends, in part, on our ability to design, develop and commercially manufacture lithium-ion batteries in prismatic form for use in HEVs, PHEVs and EVs currently being developed and that may be developed in the future. The design and development of a lithium-ion battery in prismatic form for use in the transportation industry is complex, expensive, time-consuming and subject to rigorous quality and performance requirements. If we are unable to design, develop and commercially manufacture lithium-ion batteries in prismatic form in a timely fashion and that are accepted for use in the transportation industry, our business and operating results may be adversely affected.
We entered into a strategic investment agreement with an early stage entity with which we have a commercial relationship.
In January 2010, we entered into an agreement with Fisker Automotive, Inc., or Fisker, a privately-held company, to invest $13.0 million in cash and 479,282 shares of our common stock, which when transferred to Fisker had a value of approximately $7.5 million. In exchange, we received shares of convertible preferred stock in Fisker which are not liquid, and we do not expect that they will be liquid for some time. Our investment in Fisker exposes us to equity price risk; if Fisker does not execute on its strategic plan, our investment may not be recovered. This investment is subject to risk of changes in fair value, which could result in a material realized impairment loss.
We have identified material weaknesses in our internal control over financial reporting which are unremediated and if we fail to remediate these weaknesses and maintain proper and effective internal controls, our ability to produce accurate and timely financial statements could be impaired, which could harm our operating results, our ability to operate our business and investors' views of us.
Ensuring that we have adequate internal financial and accounting controls and procedures in place so that we can produce accurate financial statements on a timely basis is a costly and time-consuming effort that needs to be evaluated frequently. We have identified material weaknesses in our internal control over financial reporting. A material weakness is defined as a deficiency, or combination of deficiencies, in internal control over financial reporting, such that there is a reasonable possibility that a material misstatement of the company's annual or interim financial statements will not be prevented or detected on a timely basis by the company's internal controls.
Management identified material weaknesses in our internal control over internal controls and information technology controls over the financial statement close and reporting process for the year ended December 31, 2010. Also, our former Chief Financial Officer left the company in January 2011 and, as a result, on an interim basis, our Vice President of Finance and Corporate Controller is also fulfilling the role as the interim Chief Financial Officer. Consequently, we had a lack of continuity of senior financial management during the preparation of our annual report for the year ended December 31, 2010. For a detailed discussion of the material weakness, see "Controls and Procedures" section within Part II, Item 9A.
35
We are in the process of taking the necessary steps to remediate the material weaknesses that we identified and have made enhancements to our control procedures; however, the material weaknesses will not be remediated until the necessary controls have been implemented and are determined to be operating effectively. We do not know the specific time frame needed to fully remediate the material weaknesses identified.
We cannot assure you that our efforts to fully remediate these internal control weaknesses will be successful or that similar material weaknesses will not recur.
Implementing any appropriate changes to our internal controls may distract our officers and employees, entail substantial costs to implement new processes and modify our existing processes and take significant time to complete. Moreover, these changes do not guarantee that we will be effective in maintaining the adequacy of our internal controls, and any failure to maintain that adequacy, or consequent inability to produce accurate financial statements on a timely basis, could increase our operating costs and harm our business. In addition, investors' perceptions that our internal controls are inadequate or that we are unable to produce accurate financial statements on a timely basis may harm our stock price and make it more difficult for us to effectively market and sell our products to new and existing customers.
If our warranty expense estimates differ materially from our actual claims, or if we are unable to estimate future warranty expense for new products, our business and financial results could be harmed.
Our warranty for our products ranges from one to eight years from the date of sale, depending on the type of product and its application. We expect that in the future some of our warranties could extend beyond eight years. In the commercial market, we typically provide a warranty against certain potential manufacturing defects, which may cause high rates of self-discharge, inaccurate voltage, and other product irregularities. In the electric grid services and transportation markets, we may also provide a warranty against a certain percentage decline in the initial power and energy density specifications of a particular product and for a warranty for system availability. Since we began selling our first products in the commercial market in the first quarter of 2006, in the transportation market in the first quarter of 2007 and in the electric grid services market in the third quarter of 2009, we have a limited product history on which to base our warranty estimates. Because of the limited operating history of our batteries and battery systems, our management is required to make assumptions and to apply judgment regarding a number of factors, including anticipated rate of warranty claims, the durability and reliability of our products, and service delivery costs. Our assumptions could prove to be materially different from the actual performance of our batteries and battery systems, which could cause us to incur substantial expense to repair or replace defective products in the future and may exceed expected levels against which we have reserved. If our estimates prove incorrect, we could be required to accrue additional expenses from the time we realize our estimates are incorrect and also face a significant unplanned cash burden at the time our customers make a warranty claim, which could harm our operating results.
In addition, with our new products and products that remain under development, we will be required to base our warranty estimates on historical experience of similar products testing of our batteries and performance information learned during our development activities with the customer. If we are unable to estimate future warranty costs for any new product, we will be required to defer recognizing revenue for that product until we are reasonably able to estimate the associated warranty expense. As a result, our financial results could vary significantly from period-to-period.
Product liability or other claims could cause us to incur losses or damage our reputation.
The risk of product liability claims and associated adverse publicity is inherent in the development, manufacturing, marketing and sale of batteries and battery systems. Certain materials we use in our
36
batteries, as well as our batteries and battery systems, could, if used improperly, cause injuries to others. Improperly charging or discharging our batteries could cause fires. Any accident involving our batteries or other products could decrease or even eliminate demand for our products. Because some of our batteries are designed to be used in vehicles, and because vehicle accidents can cause injury to persons and damage to property, we are subject to a risk of claims for such injuries and damages. In addition, we could be harmed by adverse publicity resulting from problems or accidents caused by third party products that incorporate our batteries. For example, our business and operating results could be harmed by adverse publicity resulting from injury to persons or damage to property caused by a defective electronic system on a battery system manufactured by a third party that incorporates our batteries.
Although we have product liability insurance for our products, this may be inadequate to cover all potential product liability claims. In addition, while we often seek to limit our product liability in our contracts, such limits may not be enforceable or may be subject to exceptions. Any product recall or lawsuit seeking significant monetary damages either in excess of our coverage, or outside of our coverage, may have a material adverse affect on our business and financial condition. We may not be able to secure additional product liability insurance coverage on acceptable terms or at reasonable costs when needed. If we were to experience a large insured loss, it might exceed our coverage limits, or our insurance carriers could decline to further cover us or raise our insurance rates to unacceptable levels, any of which could impair our financial position and results of operations. A successful product liability claim against us could require us to pay a substantial monetary award. We cannot be assured that such claims will not be made in the future.
We are subject to financial and reputational risks due to product recalls resulting from product quality and liability issues.
The risk of product recalls, and associated adverse publicity, is inherent in the development, manufacturing, marketing, and sale of batteries and battery systems. Our products and the products of third parties in which our products are a component are becoming increasingly sophisticated and complicated as rapid advancements in technologies occur, and as demand increases for lighter and more powerful rechargeable batteries. At the same time, product quality and liability issues present significant risks. Product quality and liability issues may affect not only our own products but also the third-party products in which our batteries and battery systems are a component. Our efforts and the efforts of our development partners to maintain product quality may not be successful, and if they are not, we may incur expenses in connection with, for example, product recalls and lawsuits, and our brand image and reputation as a producer of high-quality products may suffer. Any product recall or lawsuit seeking significant monetary damages could have a material adverse effect on our business and financial condition. A product recall could generate substantial negative publicity about our products and business, interfere with our manufacturing plans and product delivery obligations as we seek to replace or repair affected products, and inhibit or prevent commercialization of other future product candidates. Although we do have product liability insurance, we do not have insurance to cover the costs associated with a product recall and the expenses we would incur in connection with a product recall could have a material adverse affect on our operating results.
We depend on third parties to deliver raw materials, parts, components and services in adequate quality and quantity in a timely manner and at a reasonable price.
Our manufacturing operations depend on obtaining raw materials, parts and components, manufacturing equipment and other supplies including services from reliable suppliers in adequate quality and quantity in a timely manner. It may be difficult for us to substitute one supplier for another, increase the number of suppliers or change one component for another in a timely manner or at all due to the interruption of supply or increased industry demand. This may adversely affect our
37
operations. The prices of raw materials, parts and components and manufacturing equipment may increase due to changes in supply and demand. In addition, currency fluctuations and a weakening of the U.S. dollar against foreign currencies may adversely affect our purchasing power for raw materials, parts and components and manufacturing equipment from foreign suppliers.
We depend on sole source suppliers or a limited number of suppliers for certain key raw materials and component parts used in manufacturing and developing our products. We generally purchase raw materials pursuant to purchase orders placed from time to time and if we deem necessary, we will enter into long-term contracts or other guaranteed supply arrangements with our sole or limited source suppliers. Therefore, our operating margins may be impacted by price fluctuations in the commodities we use as raw materials in our batteries. As a result, our suppliers may not be able to meet our requirements relative to specifications and volumes for key raw materials, and we may not be able to locate alternative sources of supply at an acceptable cost. In the past, we have experienced delays in product development due to the delivery of raw materials from our suppliers that do not meet our specifications. In addition, if a sole source supplier ceased to continue to produce a component with little or no notice to us, our business could be harmed. Any future inability to obtain high quality raw materials or manufacturing equipment in sufficient quantities on competitive pricing terms and on a timely basis, due to global supply and demand or a dispute with a supplier, may delay battery production, impede our ability to fulfill existing or future purchase orders and harm our reputation and profitability.
Our inability to obtain federal and state government environmental permits and approvals for our planned U.S. manufacturing facilities could negatively impact our ability to obtain federal and state incentive funding and materially harm our business.
Pursuant to applicable environmental and safety laws and regulations, we are required to obtain and maintain certain governmental permits and approvals and to comply with applicable federal and state environmental laws and regulations. There is no guarantee that required determinations, permits and approvals will ultimately be obtained; the failure to obtain and/or maintain required federal and state environmental permits could have an adverse effect on our financial results and could also delay or prevent us from obtaining matching fund reimbursement from the $249.1 million grant we were awarded under the DOE Battery Initiative, as well as funding under the DOE ATVM loan program.
If obtained, permits and approvals may be subject to revocation, modification or denial under certain circumstances. Our operations or activities could result in administrative or private actions, revocation of required permits or licenses, or fines, penalties or damages, which could have an adverse effect on us. In addition, environmental laws will likely become more stringent over time, thereby requiring new capital expenditures and increases in operating costs.
Our working capital requirements involve estimates based on demand expectations and may decrease or increase beyond those currently anticipated, which could harm our operating results and financial condition.
In order to fulfill the product delivery requirements of our customers, we plan for working capital needs in advance of customer orders. As a result, we base our funding and inventory decisions on estimates of future demand. If demand for our products does not increase as quickly as we have estimated or drops off sharply, our inventory and expenses could rise, and our business and operating results could suffer. Alternatively, if we experience sales in excess of our estimates, our working capital needs may be higher than those currently anticipated. Our ability to meet this excess customer demand depends on our ability to arrange for additional financing for any ongoing working capital shortages, since it is likely that cash flow from sales will lag behind these investment requirements.
38
Credit market volatility and illiquidity may affect our ability to raise capital to finance our operations, plant expansion and growth.
The credit markets have experienced extreme volatility in recent years, and worldwide credit markets have remained unstable despite injections of capital by the federal government and foreign governments. Despite the capital injections and government actions, banks and other lenders, such as equipment leasing companies, have significantly increased credit requirements and reduced the amounts available to borrowers. Companies with low credit ratings may not have access to the debt markets until the liquidity improves, if at all. If current credit market conditions do not improve, we may not be able to access debt or leasing markets to finance our plant expansion plans.
We may be unable to successfully implement or manage our planned manufacturing expansion of capability or realize the expected benefits of an expansion.
We expect to aggressively expand our battery manufacturing capacity to meet expected demand for our product. Much of our planned domestic expansion, such as our current expansion in Livonia and Romulus, Michigan, depends upon our receipt of sufficient federal and state incentive funding and our ability to successfully ramp our manufacturing operations, particularly in the production of prismatic batteries. We may not receive the federal and state funding necessary for our planned expansion at all or on a timely basis. In addition, such funding could be subject to conditions that are commercially unacceptable to us or for which we are unable to comply. Even if we succeed in aggressively expanding our manufacturing capacity, we may not have enough demand for our products to justify the increased capacity.
Any such expansion will place a significant strain on our senior management team and our financial and other resources. Any expansion will expose us to greater overhead and support costs and other risks associated with the manufacture and commercialization of new products. Our ability to manage our growth effectively will require us to continue to improve our operations and our financial and management information systems and to train, motivate and manage our employees. Difficulties in effectively managing the budgeting, forecasting and other process control issues presented by such a rapid expansion could harm our business, prospects, results of operations and financial condition.
We may not be able to successfully recruit and retain skilled employees, particularly scientific, technical and management professionals.
We believe that our future success will depend in large part on our ability to attract and retain highly skilled technical, managerial and marketing personnel who are familiar with our key customers and experienced in the battery industry. Currently, we are actively interviewing for a chief financial officer as our former chief financial officer resigned in January 2011. Additionally, we plan to continue to expand our work force both domestically and internationally. Industry demand for such employees, especially employees with experience in battery chemistry and battery manufacturing processes, however, exceeds the number of personnel available, and the competition for attracting and retaining these employees is intense. This competition will intensify if the advanced battery market continues to grow, possibly requiring increases in compensation for current employees over time. We compete in the market for personnel against numerous companies, including larger, more established competitors who have significantly greater financial resources than we do and may be in a better financial position to offer higher compensation packages to attract and retain human capital. We cannot be certain that we will be successful in attracting and retaining the skilled personnel necessary to operate our business effectively in the future. Because of the highly technical nature of our batteries and battery systems, the loss of any significant number of our existing engineering and project management personnel could have a material adverse effect on our business and operating results.
39
Our future success depends on our ability to retain key personnel.
Our success will depend to a significant extent on the continued services of our senior management team, and in particular David Vieau, our chief executive officer, and Gilbert N. Riley, Jr., our chief technical officer. The loss or unavailability of either of these individuals could harm our ability to execute our business plan, maintain important business relationships and complete certain product development initiatives, which could harm our business. We do not have agreements requiring any of our senior management team to remain with our company. In addition, each of these individuals could terminate his or her relationship with us at any time, and we may be unable to enforce any applicable employment or non-compete agreements.
If we do not continue to form and maintain economic arrangements with original equipment manufacturers, or OEMs, to commercialize our products, our profitability could be impaired.
Our business strategy requires us to integrate the design of our products into products being developed by OEMs, and therefore to identify acceptable OEMs and enter into agreements with them. In addition, we will need to meet their requirements and specifications by developing and introducing new products and enhanced or modified versions of our existing products on a timely basis. OEMs often require unique configurations or custom designs for batteries or battery systems which must be developed and integrated into a product well before the product is launched. This development process requires not only substantial lead time between the commencement of design efforts for a customized battery system and the commencement of volume shipments of the battery systems to the customer, but also the cooperation and assistance of the OEMs in order to determine the requirements for each specific application. Technical problems may arise that affect the acceptance of our product by OEMs. If we are unable to design and develop products that meet OEMs' requirements, we may lose opportunities to obtain purchase orders, and our reputation may be damaged. In addition, we may not receive adequate assistance from OEMs to successfully commercialize our products, which could impair our profitability.
Declines in product prices may adversely affect our financial results.
Our business is subject to intense price competition worldwide, which makes it difficult for us to maintain product prices and achieve adequate profits. Such intense price competition may adversely affect our ability to achieve profitability, especially during periods of decreases in demand. In addition, because of their purchasing size, our larger automotive customers can influence market participants to compete on price terms. If we are not able to offset pricing reductions resulting from these pressures by improved operating efficiencies and reduced expenditures, those pricing reductions may have an adverse impact on our business.
Implementations of new software platforms or modifications to existing platforms may disrupt our business and operations and could harm our operating results.
The implementation of new software management platforms and the addition of these platforms at new locations, especially overseas, require significant management time, support and cost. As our business continues to develop, we expect to add and enhance existing management platforms in the areas of financial, inventory control, engineering, and customer support and warranty management. We cannot be sure that these platforms will be fully or effectively implemented on a timely basis, if at all. If we do not successfully implement or modify these platforms, our operations may be disrupted and our operating expenses could be harmed. In addition, the new systems may not operate as we expect them to, and we may be required to expend significant resources to correct problems or find alternative sources for performing these functions.
40
Our inability to effectively and quickly transfer, replicate and scale our new product manufacturing processes from low volume prototype production to high volume manufacturing facilities, could adversely affect our results of operations.
Under our manufacturing model, we develop and establish manufacturing processes and systems for the low volume prototype production of our new products. As demand increases for a product, we transfer these processes and systems to, and replicate and scale these processes and systems in our high volume manufacturing facilities. If we are unable to effectively and quickly transfer, replicate and scale these manufacturing processes and systems, such as replicating our prismatic pilot facility in Korea to our new facilities in Livonia and Romulus, Michigan, we may be unable to meet our customers' product quality and quantity requirements and lower our costs of goods sold and our results of operations could be adversely affected.
In addition, our costs of goods sold for some of our new products exceed the purchase price for that product paid to us by our customers. If we are unable to decrease unit production costs for these products by increasing volumes, improving the manufacturing process, reducing transportation and handling costs or obtaining lower cost raw materials or component parts, we will not realize a profit from these products and our business will be harmed.
Problems in our manufacturing and assembly processes could limit our ability to produce sufficient batteries to meet the demands of our customers.
Regardless of the process technology used, the manufacturing and assembly of safe, high-power batteries and battery systems is a highly complex process that requires extreme precision and quality control throughout a number of production stages. Any defects in battery packaging, impurities in the electrode materials used, contamination of the manufacturing environment, incorrect welding, excess moisture, equipment failure or other difficulties in the manufacturing process could cause batteries to be rejected, thereby reducing yields and affecting our ability to meet customer expectations.
As we have scaled up our production capacity, we have experienced production problems that limited our ability to produce a sufficient number of batteries to meet the demands of certain customers. For example, in 2010, we identified several significant technical issues in the manufacturing scale-up of our prismatic batteries. Although we identified and have taken corrective actions for these issues, the problems encountered resulted in a higher yield loss in ramp-up production, temporary halts in the production process and distraction of personnel. If these or other production problems recur and we are unable to resolve them in a timely fashion, our business could suffer and our reputation may be harmed.
Our failure to cost-effectively manufacture our batteries and battery systems in quantities which satisfy our customers' demand and product specifications and their expectations for product quality and reliable delivery could damage our customer relationships and result in significant lost business opportunities for us.
We manufacture a substantial percentage of our products rather than relying upon third-party outsourcing. To be successful, we must cost-effectively manufacture commercial quantities of our complex batteries and battery systems that meet our customer specifications for quality and timely delivery. To facilitate the commercialization of our products, we will need to further reduce our manufacturing costs, which we intend to do by working with manufacturing partners and by improving our manufacturing and development operations in our wholly-owned operations in China. We manufacture our batteries and assemble our products in China, Korea, Massachusetts and Michigan. We depend on the performance of our manufacturing partners, as well as our own manufacturing operations, to manufacture and deliver our products to our customers. If we or any of our manufacturing partners are unable to manufacture products in commercial quantities on a timely and cost-effective basis, we could lose our customers and be unable to attract future customers.
41
In addition, we are shifting most of our battery assembly and all of our battery system manufacturing from contract manufacturing to in-house manufacturing, so our in-house experience with battery assembly and battery system manufacturing is limited.
We may be unable to complete or integrate acquisitions effectively, which may adversely affect our growth, profitability and results of operations.
We may pursue acquisitions as part of our business strategy. However, we cannot be certain that we will be able to identify attractive acquisition targets, obtain financing for acquisitions on satisfactory terms or successfully acquire identified targets. Additionally, we may not be successful in integrating acquired businesses into our existing operations and achieving projected synergies. Competition for acquisition opportunities in the various industries in which we operate may rise, thereby increasing our costs of making acquisitions or causing us to refrain from making further acquisitions. These and other acquisition-related factors could negatively and adversely impact our growth, profitability and results of operations.
We entered into a joint venture in China that, if not successful, could adversely impact our business, business prospects and operating results.
In December 2009, we formed a joint venture with SAIC, a leading automaker in China. We will have a 49 percent minority interest in the joint venture, Shanghai Advanced Traction Battery Systems Co., Ltd., or ATBS, which is domiciled in Shanghai, China. Pursuant to the joint venture agreements, we will supply ATBS with battery cells and, as requested by ATBS, we have granted necessary advanced technology licenses to ATBS for the development, manufacture and service of battery systems. As of December 31, 2010, we have made the first capital contributions to ATBS in the amount of $1.9 million and expect to fund the remaining $2.8 million of required capital contribution over approximately the next twelve months.
The business of ATBS is subject to all the operational risks that normally arise for a technology company with global operations pertaining to research and development, manufacturing, sales, service, marketing and corporate functions. In addition, there could be disagreements between us and SAIC with respect to important strategic and operational decisions. Operating a business as a joint venture often requires additional organizational formalities as well as time-consuming procedures for sharing information and making decisions. We may be required to pay more attention to our relationship with SAIC, as the co-owner of ATBS, and if SAIC ceases to be the co-owner of ATBS, our relationship with ATBS may be adversely affected. Additionally, as we are sharing intellectual property with ATBS, we face the risks that we may not be able to maintain or enforce the rights to our intellectual property.
If the joint venture terminates, the joint venture could retain technical knowhow relating to battery systems transferred by us as part of the agreement. Additionally, we would have to find new partners or separately pursue market opportunities in China which could cause us to incur additional time and expense.
Laws regulating the manufacture or transportation of batteries may be enacted which could result in a delay in the production of our batteries or the imposition of additional costs that could harm our ability to be profitable.
Laws and regulations exist today, and additional laws and regulations may be enacted in the future, which impose environmental, health and safety controls on the storage, use and disposal of certain chemicals and metals used in the manufacture of lithium-ion batteries. Complying with any laws or regulations could require significant time and resources from our technical staff and possible redesign of one or more of our products, which may result in substantial expenditures and delays in the production of one or more of our products, all of which could harm our business and reduce our future
42
profitability. The transportation of lithium and lithium-ion batteries is regulated both domestically and internationally. Compliance with these regulations, when applicable, increases the cost of producing and delivering our products.
We depend on contracts with the U.S. government and its agencies or on subcontracts with the U.S. government's prime contractors for revenue and research grants to fund or partially fund our research and development programs, and our failure to retain current or obtain additional contracts could preclude us from achieving our anticipated levels of revenue growth and profitability, increase our research, development and engineering expenses and delay or halt certain research and development programs.
Our ability to develop and market some of our products depends upon maintaining our U.S. government contract revenue and research grants obtained, which are recorded as incremental revenue and an offset to our research, development and engineering expenses, respectively. Many of our U.S. government contracts are funded incrementally, with funding decisions made on an annual basis. Approximately 12.3% of our total revenue and 7.5% of our research, development and engineering expenses during the year ended December 31, 2010 were derived from or funded by government contracts and subcontracts. Changes in government policies, priorities or programs that result in budget reductions could cause the government to cancel existing contracts or eliminate follow-on phases in the future which would severely inhibit our ability to successfully complete the development and commercialization of some of our products. In addition, there can be no assurance that, once a government contract is completed, it will lead to follow-on contracts for additional research and development, prototype build and test or production. Furthermore, there can be no assurance that our U.S. government contracts or subcontracts will not be terminated or suspended in the future. A reduction or cancellation of these contracts, or of our participation in these programs, would increase our research, development and engineering expenses, which could materially and adversely affect our results of operations and could delay or impair our ability to develop new technologies and products.
If we are unable to develop manufacturing facilities for our products in the United States, we may lose business opportunities and our customer relationships may suffer.
We believe that developing manufacturing facilities for our products in the United States is important, in order to address national security and economic imperatives, such as job creation, as well as to more efficiently address the needs of our U.S.-based customers. This expansion depends upon our receiving federal and state financial incentives, primarily in the form of direct grants and loans, to provide the necessary capital for facilities and equipment. If we are unable to obtain this government assistance on a timely basis and in the amounts requested, we will not be able to scale our capacity to meet current and future customer demand for our products.
Because of the funding we receive from U.S. government entities and our government business initiatives, we are subject to U.S. federal government audits and other regulation, and our failure to satisfy audit requirements or comply with applicable regulations could subject us to material adjustments or penalties that could negatively impact our business.
The accuracy and appropriateness of our direct and indirect costs and expenses under our contracts with the U.S. government are subject to extensive regulation and audit by appropriate agencies of the U.S. government. These agencies have the right to challenge our cost estimates or allocations with respect to any such contract. Additionally, substantial portions of the payments to us under U.S. government contracts are provisional payments that are subject to potential adjustment upon audit by such agencies. Adjustments that result from inquiries or audits of our contracts could have a material adverse impact on our financial condition or results of operations. Since our inception, we have not experienced any material adjustments as a result of any inquiries or audits, but there can be no assurance that our contracts will not be subject to material adjustments in the future.
43
As we grow our government business, we may also need to comply with U.S. laws regulating the export of our products, particularly in our government business. We cannot be certain of our ability to obtain any licenses required to export our products or to receive authorization from the U.S. federal government for international sales or domestic sales to foreign persons. Moreover, the export regimes and the governing policies applicable to our business are subject to change. Our failure to comply with these and other applicable regulations, rules and approvals could result in the imposition of penalties, the loss of our government contracts or our suspension or debarment from contracting with the federal government generally, any of which would harm our business, financial condition and results of operations.
Our ability to sell our products to our direct, OEM and tier 1 supplier customers depends in part on the quality of our engineering and customization capabilities, and our failure to offer high quality engineering support and services could have a material adverse effect on our sales and operating results.
A high level of support is critical for the successful marketing and sale of our products. The sale of our batteries and battery systems is characterized by significant co-development and customization work in certain applications. This development process requires not only substantial lead time between the commencement of design efforts for a customized battery system and the commencement of volume shipments of the battery systems to the customer, but also the cooperation and assistance of the OEMs to determine the requirements for each specific application. Once our products are designed into an OEM or tier 1 supplier customer's products or systems, the OEM or tier 1 supplier customer depends on us to resolve issues relating to our products. If we do not effectively assist our OEM or tier 1 supplier customers in customizing, integrating and deploying our products in their own systems or products, or if we do not succeed in helping them quickly resolve post-deployment issues and provide effective ongoing technical support, our ability to sell our products would be adversely affected.
In addition, while we have supply and co-development agreements with customers located in different regions of the world, we do not have a globally distributed engineering support and services organization. Currently, any issue resolution related to our products, system deployment or integration is channeled back to our responsible business units in Massachusetts and in Michigan, from which engineers and support personnel are deployed. As we grow our business with our existing customers and beyond the markets into which we currently sell our battery technologies, we may need to increase the size of our engineering support teams and deploy them closer to our customers. Our inability to deliver a consistent level of engineering support and overall service as we expand our operations could have a material adverse effect on our business and operating results. Moreover, despite our internal quality testing, our products may contain manufacturing or design defects or exhibit performance problems at any stage of their lifecycle. These problems could result in expensive and time-consuming design modifications and impose additional needs for engineering support and maintenance services as well as significant warranty charges.
Our past and future operations may lead to substantial environmental liability.
The handling and use of some of the materials used in the development and manufacture of our products are subject to federal, state and local environmental laws, as well as environmental laws in other jurisdictions in which we operate. Under applicable environmental laws, we may be jointly and severally liable with prior property owners for the treatment, cleanup, remediation and/or removal of any hazardous substances discovered at any property we use. In addition, courts or government agencies may impose liability for, among other things, the improper release, discharge, storage, use, disposal or transportation of hazardous substances. If we incur any significant environmental liabilities, our ability to execute our business plan and our financial condition would be harmed. Our facilities or operations could be damaged or adversely affected as a result of disasters or unpredictable events, including widespread public health problems.
44
Our headquarters, including administrative offices and research and development centers, is located in Massachusetts. We also operate manufacturing, logistics, sales and research and development facilities in Michigan, Missouri, China, Korea, Germany and Japan. If major disasters such as earthquakes, fires, floods, hurricanes, wars, terrorist attacks, computer viruses, pandemics or other events occur, or our information system or communications network breaks down or operates improperly, our facilities may be seriously damaged, or we may have to stop or delay production and shipment of our products. We may incur expenses relating to such damages. In addition, a renewed outbreak of a widespread public health problem in China or the United States could have a negative effect on our operations.
Risks Related to Intellectual Property
Third parties have asserted that they own or control patents that are infringed by our products.
We are presently involved in patent litigation with Hydro-Québec and the University of Texas, or UT, involving certain patents Hydro- Québec has licensed from UT, related to electrode materials used in lithium-ion batteries. After discussions with Hydro-Québec about the relevance of two of these patents to our products, we brought an action in the Federal District Court of Massachusetts seeking a declaratory judgment that our products do not infringe these two UT patents. In response, Hydro-Québec and the UT countersued us in the Federal Courts in Texas. The Texas judge requested a status hearing with the parties on May 14, 2010 and entered a schedule for the case leading to a claim construction hearing which was held in December 2010. For a more detailed discussion of our patent litigation, see Item 3 of Part I: "Legal Proceedings."
We believe that we have valid non-infringement defenses against both of these patents and that at least one of the patents is invalid. If we were to challenge the validity of any issued United States patent in court, we would need to overcome a presumption of validity that attaches to every patent. This burden is high and would require us to present clear and convincing evidence as to the invalidity of the patent's claims. There is no assurance that a court would find in our favor on infringement or validity and, if this case is not resolved in our favor, we may be required to pay substantial damages. In addition, an adverse ruling could cause us, and our customers, development partners and licensees, to stop, modify or delay activities in the United States such as research, development, manufacturing and sales of products based on technologies covered by these patents. We would need to develop products and technologies that design around these patents or obtain a license to the appropriate patent. There is no certainty that such design-arounds exist or if they exist that they would be commercially competitive, and there is no certainty that a license from the appropriate parties could be obtained. Also, the mere existence, and the uncertainty with respect to the ultimate outcome, of this patent litigation or any other patent litigation that we may become involved with, could cause our current and potential customers, development partners, the federal or state governments and licensees to stop, delay or avoid doing business with us or modify the extent to which they are willing to do business with us, and this loss or delay of business could harm our operating results and our ability to execute on our business plan. Additionally, we have agreed to defend and indemnify the other named business partner for its legal costs in defending this litigation and any damages that may be awarded.
Other parties may also bring intellectual property infringement claims against us which would be time-consuming and expensive to defend, and if any of our products or processes is found to be infringing, we may not be able to procure licenses to use patents necessary to our business at reasonable terms, if at all.
Our success depends in part on avoiding the infringement of other parties' patents and proprietary rights. We may inadvertently infringe existing third-party patents or third-party patents issued on existing patent applications. In the United States and most other countries, patent applications are published 18 months after filing. As a result, there may be third-party pending patent applications of which we are unaware, and which we may infringe once they issue. These third parties could bring
45
claims against us that, even if resolved in our favor, could cause us to incur substantial expenses and, if resolved against us, could cause us to pay substantial damages. Under some circumstances in the United States, these damages could be triple the actual damages the patent holder incurs. If we have supplied infringing products to third parties for marketing or licensed third parties to manufacture, use or market infringing products, we may be obligated to indemnify these third parties for any damages they may be required to pay to the patent holder and for any losses the third parties may sustain themselves as the result of lost sales or damages paid to the patent holder. In addition, we may have, and may be required to, make representations as to our right to supply and/or license intellectual property and to our compliance with laws. Such representations are usually supported by indemnification provisions requiring us to defend our customers and otherwise make them whole if we license or supply products that infringe on third party technologies or violate government regulations. Further, if a patent infringement suit were brought against us, we and our customers, development partners and licensees could be forced to stop or delay research, development, manufacturing or sales of products based on our technologies in the country or countries covered by the patent we infringe, unless we can obtain a license from the patent holder. Such a license may not be available on acceptable terms, or at all, particularly if the third party is developing or marketing a product competitive with products based on our technologies. Even if we were able to obtain a license, the rights may be nonexclusive, which would give our competitors access to the same intellectual property.
Any successful infringement action brought against us may also adversely affect marketing of products based on our technologies in other markets not covered by the infringement action. Furthermore, we may suffer adverse consequences from a successful infringement action against us even if the action is subsequently reversed on appeal, nullified through another action or resolved by settlement with the patent holder. As a result, any infringement action against us would likely harm our competitive position, be costly and require significant time and attention of our key management and technical personnel.
We may be involved in lawsuits to protect or enforce our patents, which could be expensive and time consuming.
Competitors or others may infringe our patents. To counter infringement or unauthorized use, we may be required to file patent infringement claims, which can be expensive and time-consuming. In addition, in an infringement proceeding, a court may decide that a patent of ours is not valid or is unenforceable, or may refuse to stop the other party from using the technology at issue on the grounds that our patents do not cover that technology. An adverse determination of any litigation or defense proceedings could put one or more of our patents at risk of being invalidated or interpreted narrowly and could put our patent applications at risk of not issuing.
Interference proceedings brought by the United States Patent and Trademark Office may be necessary to determine the priority of inventions with respect to our patent applications. Litigation or interference proceedings may fail and, even if successful, may result in substantial costs and be a distraction to our management. We may not be able to prevent misappropriation of our proprietary rights, particularly in countries where the laws may not protect such rights as fully as in the United States.
Furthermore, because of the substantial amount of discovery required in connection with intellectual property litigation, there is a risk that some of our confidential information could be compromised by disclosure. In addition, during the course of this litigation, there could be public announcements of the results of hearings, motions or other interim proceedings or developments. If securities analysts or investors perceive these results to be negative, it could have a substantial adverse effect on the price of our common stock.
46
We may not prevail in any litigation or interference proceeding in which we are involved. Even if we do prevail, these proceedings can be expensive and distract our management.
Our patent applications may not result in issued patents, which may have a material adverse effect on our ability to prevent others from commercially exploiting products similar to ours.
Patent applications in the United States are maintained in secrecy until the patents are published or are issued. Since publication of discoveries in the scientific or patent literature tends to lag behind actual discoveries by several months, we cannot be certain that we are the first creator of inventions covered by pending patent applications or the first to file patent applications on these inventions. We also cannot be certain that our pending patent applications will result in issued patents or that any of our issued patents will afford protection against a competitor. In addition, patent applications filed in foreign countries are subject to laws, rules and procedures that differ from those of the United States, and thus we cannot be certain that foreign patent applications related to issued U.S. patents will be issued. Furthermore, if these patent applications issue, some foreign countries provide significantly less effective patent enforcement than in the United States.
The status of patents involves complex legal and factual questions and the breadth of claims allowed is uncertain. Accordingly, we cannot be certain that the patent applications that we file will result in patents being issued, or that our patents and any patents that may be issued to us in the near future will afford protection against competitors with similar technology. In addition, patents issued to us may be infringed upon or designed around by others and others may obtain patents that we need to license or design around, either of which would increase costs and may adversely affect our operations.
Our patents and other protective measures may not adequately protect our proprietary intellectual property.
We regard our intellectual property, particularly our proprietary rights in our battery and battery system technology, as critical to our success. We have received a number of patents, and filed other patent applications, for various applications and aspects of our technology or processes and other intellectual property. In addition, we generally enter into confidentiality and invention agreements with our employees and consultants. Such patents and agreements and various other measures we take to protect our intellectual property from use by others may not be effective for various reasons, including the following:
- •
- our pending patent applications may not be granted for various reasons, including the existence of conflicting patents or
defects in our applications;
- •
- the patents we have been granted may be challenged, invalidated or circumvented because of the pre-existence
of similar patented or unpatented intellectual property rights or for other reasons;
- •
- parties to the confidentiality and invention agreements may have such agreements declared unenforceable or, even if the
agreements are enforceable, may breach such agreements;
- •
- the costs associated with enforcing patents, confidentiality and invention agreements or other intellectual property
rights may make aggressive enforcement prohibitive;
- •
- even if we enforce our rights aggressively, injunctions, fines and other penalties may be insufficient to deter violations
of our intellectual property rights; and
- •
- other persons may independently develop proprietary information and techniques that are functionally equivalent or superior to our intellectual proprietary information and techniques but do not breach our patented or unpatented proprietary rights.
47
We may be unable to adequately prevent disclosure of trade secrets and other proprietary information.
We rely on trade secrets to protect our proprietary technologies, especially where we do not believe patent protection is appropriate or obtainable. However, trade secrets are difficult to protect. We rely in part on confidentiality agreements with our employees, former employees contractors, consultants, outside scientific collaborators and other advisors to protect our trade secrets and other proprietary information. These agreements may not effectively prevent disclosure of confidential information and may not provide an adequate remedy in the event of unauthorized disclosure of confidential information. In addition, others may independently discover our trade secrets or independently develop processes or products that are similar or identical to our trade secrets, and courts outside the United States may be less willing to protect trade secrets. Costly and time-consuming litigation could be necessary to enforce and determine the scope of our proprietary rights, and failure to obtain or maintain trade secret protection could adversely affect our competitive business position.
Risks Associated With Doing Business Internationally and Specifically in China and Korea
Our substantial international operations subject us to a number of risks, including unfavorable political, regulatory, labor and tax conditions.
We have significant manufacturing facilities and operations in China and Korea that are subject to the legal, political, regulatory and social requirements and economic conditions in these jurisdictions. In addition, we expect to sell a significant portion of our products to customers located outside the United States. Risks inherent to international operations and sales, include, but are not limited to, the following:
- •
- difficulty in enforcing agreements, judgments and arbitration awards in foreign legal systems;
- •
- fluctuations in exchange rates may affect product demand and may adversely affect our profitability in U.S. dollars to the
extent the cost of raw materials and labor is denominated in a foreign currency;
- •
- impediments to the flow of foreign exchange capital payments and receipts due to exchange controls instituted by certain
foreign governments and the fact that the local currencies of these countries are not freely convertible;
- •
- inability to obtain, maintain or enforce intellectual property rights;
- •
- changes in general economic and political conditions;
- •
- changes in foreign government regulations and technical standards, including additional regulation of rechargeable
batteries, power technology, or the transport of lithium or phosphate, which may reduce or eliminate our ability to sell or license in certain markets;
- •
- requirements or preferences of foreign nations for domestic products could reduce demand for our products;
- •
- trade barriers such as export requirements, tariffs, taxes and other restrictions and expenses, which could increase the
prices of our products and make us less competitive; and
- •
- longer payment cycles typically associated with international sales and potential difficulties in collecting accounts receivable, which may reduce the future profitability of foreign sales.
Our business in foreign jurisdictions requires us to respond to rapid changes in market conditions in these countries. Our overall success as a global business depends on our ability to succeed in different legal, regulatory, economic, social and political situations and conditions. We may not be able to develop and implement effective policies and strategies in each foreign jurisdiction where we do
48
business. Also, each of the foregoing risks will likely take on increased significance as we implement plans to expand foreign manufacturing operations.
Since many of our products are manufactured in China, we own and lease manufacturing facilities in China and the Chinese market is of growing importance for our products, we face risks if China loses normal trade relations status with the United States or if US-China trade relations are otherwise adversely impacted.
We manufacture and export our products from China and own and lease manufacturing facilities in China. We also sell our products in China. Our products sold in the United States have normal trade relations status and are currently not subject to United States import duties. As a result of opposition to certain policies of the Chinese government and China's growing trade surpluses with the United States, there has been, and in the future may be, opposition to normal trade relations status with China. The United States Congress may also introduce China trade legislation targeting currency manipulation, which may adversely affect our business in China. The loss of normal trade relations status for China, changes in current tariff structures or adoption in the United States of other trade policies adverse to China, and any retaliatory measures that impact our products in the Chinese market, could have an adverse effect on our business.
A change in exchange rates mandated by legislation could negatively impact the cost of imported raw materials and products.
Furthermore, our business and operations may be adversely affected by deterioration of the diplomatic and political relationships between the United States and China. If the relationship between the United States and China were to materially deteriorate, it could negatively impact our ability to control our operations and relationships in China, enforce any agreements we have with Chinese partners or otherwise deal with any assets or investments we may have in China.
Our ongoing manufacturing operations in China are complex and having these remote operations may divert management's attention, lead to disruptions in operations, delay implementation of our business strategy and make it difficult to establish adequate management and financial controls in China. Our plans to grow our business to include sales to Chinese customers may necessitate additional management attention to establishing and maintaining one or more joint venture relationships with Chinese parties.
Currently, we have significant manufacturing operations in China, including a joint venture. We may not be able to find or retain suitable employees in China and we may have to train personnel to perform necessary functions for our manufacturing, senior management and development operations. This may divert management's attention, lead to disruptions in operations and delay implementation of our business strategy, all of which could negatively impact our profitability.
China has only recently begun to adopt management and financial reporting concepts and practices like those with which investors in the United States are familiar. We may have difficulty in hiring and retaining employees in China who have the experience necessary to implement the kind of management and financial controls that are expected of a United States public company. If we cannot establish and implement such controls, we may experience difficulty in collecting financial data and preparing financial statements, books of account and corporate records and instituting business practices that meet U.S. standards.
In order to grow our business and sales to Chinese customers we have entered into a Chinese-foreign joint venture with a Chinese partner. A Chinese-foreign joint venture can be a complex business arrangement requiring substantial management attention to the joint venture relationship. The joint venture will also require capital contributions and due to China's foreign exchange controls, uncertainty as to the ability to repatriate profits and principal out of China.
49
Because of the relative weakness of the Chinese legal system in general, and the intellectual property regime in particular, we may not be able to enforce intellectual property rights in China.
The legal regime protecting intellectual property rights in China is weak. Because the Chinese legal system in general, and the intellectual property regime in particular, are relatively weak, it is often difficult to create and enforce intellectual property rights in China. Accordingly, we may not be able to effectively protect our intellectual property rights in China.
Enforcing agreements and laws in China is difficult and may be impossible because China does not have a comprehensive system of laws.
We depend on our relationships with our Chinese manufacturing partners and suppliers. In China, enforcement of contractual agreements may be sporadic, and implementation and interpretation of laws may be inconsistent. The Chinese judiciary is relatively inexperienced in interpreting agreements and enforcing China's laws, leading to a higher than usual degree of uncertainty as to the outcome of any litigation. Even where adequate law exists in China, it may not be possible to obtain swift and equitable enforcement of such law, or to obtain enforcement of a judgment or an arbitration award by a court of another jurisdiction.
The government of China may change or even reverse its policies of promoting private industry and foreign investment, in which case our assets and operations may be at risk.
Our existing and planned operations in China are subject to risks related to the business, economic and political conditions in China, which include the possibility that the central government of China will change or even reverse its policies of promoting private industry and foreign investment in China. The government of China has exercised and continues to exercise substantial control over virtually every section of the Chinese economy through regulation and state ownership. Many of the current reforms which support private business in China are of recent origin or provisional in nature. Other political, economic and social factors, such as political changes, changes in the rates of economic growth, unemployment or inflation, or in the disparities of per capita wealth among citizens of China and between regions within China, could also lead to further readjustment of the government's reform measures. It is not possible to predict whether the Chinese government will continue to be as supportive of private business in China, nor is it possible to predict how any future reforms will affect our business. For example, if the government were to limit the number of foreign personnel who could work in the country, substantially increase taxes on foreign businesses, eliminate export processing zones, restrict the transportation of goods in and out of the country, adopt policies favoring competitors or impose other restrictions on our operations, the impact may be significant.
Significantly, a reversal of current liberalizations of foreign exchange controls by the Chinese government could be disruptive and costly to our cross-border operations and our business as a whole.
Business practices in China and Korea may entail greater risk and dependence upon the personal relationships of senior management than is common in North America, and therefore some of our agreements with other parties in China and Korea could be difficult or impossible to enforce.
The business cultures of China and Korea are, in some respects, different from the business cultures in Western countries and may present some difficulty for Western investors reviewing contractual relationships among companies in China and Korea and evaluating the merits of an investment. Personal and family relationships among business principals of companies and business entities in China and Korea are very significant in their business cultures. In some cases, because so much reliance is based upon personal relationships, written contracts among businesses in China and Korea may be less detailed and specific than is commonly accepted for similar written agreements in Western countries. In some cases, material terms of an understanding are not contained in the written
50
agreement but exist as oral agreements only. In other cases, the terms of transactions which may involve material amounts of money are not documented at all. In addition, in contrast to Western business practices where a written agreement specifically defines the terms, rights and obligations of the parties in a legally-binding and enforceable manner, the parties to a written agreement in China or Korea may view that agreement more as a starting point for an ongoing business relationship which will evolve and require ongoing modification. As a result, written agreements in China or Korea may appear to the Western reader to look more like outline agreements that precede a formal written agreement. While these documents may appear incomplete or unenforceable to a Western reader, the parties to the agreement in China or Korea may feel that they have a more complete understanding than is apparent to someone who is only reading the written agreement without having attended the negotiations. As a result, contractual arrangements in China and Korea may be more difficult to review and understand.
China has introduced sweeping reforms to its income tax, turnover tax and other tax laws and regulations. Some of the changes increase the taxes for foreign-invested and other businesses in China will incur on specific types of transactions as well as arising from operations generally in China. Our earnings may be affected by tax adjustments to reflect such changes in the law.
Pursuant to a comprehensive reform of China's tax system that took effect on January 1, 2008, income tax incentives granted to foreign-invested enterprises, and geographically-based incentives, have largely been eliminated and have been replaced with incentives designed to encourage enterprises, domestic and foreign-invested alike, in selected industries. For example, dividends paid by foreign-invested enterprises to foreign shareholders are no longer exempt from withholding tax. A 10% withholding tax applies to dividends, although the rate is reduced to 5% by certain tax treaties. The tax holidays and tax reduction periods and the reduced national income tax rate that foreign-invested enterprises engaged in production used to enjoy have also been removed. The tax incentives promised to our wholly foreign-owned subsidiaries located in export processing zones at the time of inception will be phased-out by the end of 2012. At that time, these subsidiaries and any new foreign-invested enterprises we might establish as part of our strategy to expand the market for our products will no longer have income tax advantages over Chinese domestic businesses.
China's turnover tax system consists of VAT, consumption tax and business tax. VAT is primarily imposed on import and sales of goods and certain services, such as repairing, processing and replacement. Export sales are exempt under VAT rules, and an exporter who incurs VAT on the purchase or manufacture of goods should be able to claim a refund from Chinese tax authorities. Depending on whether VAT export refund rates are raised or reduced for relevant goods, exporters might bear part of the VAT they incurred in conjunction with producing the exported goods. To mitigate the effects of the global economic downturn on China's export industry, the PRC Ministry of Finance and the State Administration of Taxation have raised VAT rebates on numerous exported labor-intensive and high-value-added products. However, the Chinese government may also lower rebate rates in future in response to different economic and policy objectives.
China has also introduced sweeping VAT policy reforms with effect from January 1, 2009, which facilitate China's shift from a production-based VAT scheme to a consumption-based system. Generally, the new system reduces the total output VAT of production enterprises as fixed-asset investment costs related to VAT-eligible output are no longer subject to VAT. However, our VAT costs will depend on our ability to pass on input VAT to our local suppliers and customers. As the relevant VAT law and implementing regulations are new, there may be a period of adjustment before any cost-savings are realized.
51
Business tax is usually a fee of 3-5 percent levied on services—such as transport, construction, education, finance, and insurance—transfer of intangible assets, and sales of fixed assets, none of which are generally eligible for VAT. Business tax regulations, which took effect January 1, 2009, may impose business on services exchanged among China- and foreign-based entities which previously were not subject to business tax, and the potential overall impact is to increase the tax burden of cross-border service transactions.
Frequent changes to China's tax laws can result in uncertainty and unpredictability in financial results of our operations in China. China's tax laws are supplemented with detailed implementation rules and circulars. However, the interpretation of the rules may vary among local tax authorities.
Risks Related to Ownership of Our Common Stock
We are incurring increased costs and demands upon management as a result of complying with the laws and regulations affecting public companies, which could harm our operating results.
As a public company, we are incurring significant additional legal, accounting and other expenses that we did not incur as a private company, including costs associated with public company reporting requirements. We also have incurred and will incur costs associated with current corporate governance requirements, including requirements under Section 404 and other provisions of the Sarbanes-Oxley Act, as well as rules implemented by the Securities and Exchange Commission, or SEC, and the Nasdaq Global Select Market. The expenses incurred by public companies for reporting and corporate governance purposes have increased dramatically in recent years. These rules and regulations to increase our legal and financial compliance costs and to make some activities more time-consuming and costly. These new rules and regulations also make it more difficult and more expensive for us to obtain and maintain director and officer liability insurance, and we may be required to accept reduced policy limits and coverage or incur higher costs to obtain the same or similar coverage previously available. As a result, it may be more difficult for us to attract and retain qualified individuals to serve on our board of directors or as our executive officers.
An active trading market for our common stock may not be sustained, and you may not be able to resell your shares at or above the price at which you purchased them.
We have a limited history as a public company. An active trading market for our shares may not be sustained. In the absence of an active trading market for our common stock, investors may not be able to sell their common stock at or above the price they paid or at the time that they would like to sell.
Our stock price may be volatile.
The market price of our common stock could be subject to significant fluctuations, and it may decline below the price at which you purchased it. Market prices for securities of early stage companies have historically been particularly volatile. As a result of this volatility, you may not be able to sell your common stock at or above the price you paid. Some of the factors that may cause the market price of our common stock to fluctuate include:
- •
- fluctuations in our quarterly financial results or the quarterly financial results of companies perceived to be similar to
us;
- •
- fluctuations in our recorded revenue, even during periods of significant sales order activity;
- •
- changes in estimates of our financial results or recommendations by securities analysts;
- •
- failure of any of our products to achieve or maintain market acceptance;
- •
- product liability issues involving our products or our competitors' products;
52
- •
- changes in market valuations of similar companies;
- •
- success of competitive products or technologies;
- •
- changes in our capital structure, such as future issuances of securities or the incurrence of debt;
- •
- announcements by us or our competitors of significant services, contracts, acquisitions or strategic alliances;
- •
- developments or announcements related to our application for government stimulus funds;
- •
- regulatory developments in the United States, foreign countries or both;
- •
- litigation involving us, our general industry or both;
- •
- additions or departures of key personnel;
- •
- investors' general perception of us; and
- •
- changes in general economic, industry and market conditions.
In addition, if the market for technology stocks or the stock market in general experiences a loss of investor confidence, the trading price of our common stock could decline for reasons unrelated to our business, financial condition or results of operations. If any of the foregoing occurs, it could cause our stock price to fall and may expose us to class action lawsuits that, even if unsuccessful, could be costly to defend and a distraction to management.
A significant portion of our total outstanding shares may be sold into the public market at any time, which could cause the market price of our common stock to drop significantly, even if our business is doing well.
Sales of a substantial number of shares of our common stock in the public market could occur at any time. These sales, or the market perception that the holders of a large number of shares intend to sell shares, could reduce the market price of our common stock.
In addition, as of December 31, 2010, there were 10,782,724 shares subject to outstanding options and 202,829 shares subject to outstanding restricted stock units that are eligible for sale in the public market to the extent permitted by any applicable vesting requirements and Rule 144 under the Securities Act of 1933, as amended. Moreover, certain holders of our common stock have rights, subject to some conditions, to require us to file registration statements covering their shares and to include their shares in registration statements that we may file for ourselves or other stockholders. Additional holders of our common stock have rights, subject to some conditions, to include their shares in registration statements that we may file for ourselves or other stockholders. We have also registered all shares of common stock that we may issue under our equity incentive plans, including 5,071,395 shares reserved for future issuance under our equity incentive plans, pursuant to a registration statement that was filed and became immediately effective on March 31, 2010. Once we issue these shares, they can be freely sold in the public market upon issuance.
Upon the closing of a private placement in connection with a strategic transaction on January 14, 2010, we issued 479,282 shares of common stock to Fisker Automotive Inc., or Fisker. The issuance of these shares resulted in dilution to stockholders who held our common stock prior to the private placement. As of December 31, 2010 all of the shares of common stock are freely tradable pursuant to a registration statement filed with the SEC that was declared effective by the SEC on March 29, 2010.
Additionally, we expect to raise additional capital in the future which would result in dilution to current shareholders and could reduce the market price of our common stock.
53
If securities or industry analysts do not publish or cease publishing research or reports about us, our business or our market, or if they change their recommendations regarding our stock adversely, our stock price and trading volume could decline.
The trading market for our common stock will be influenced by the research and reports that industry or securities analysts may publish about us, our business, our market or our competitors. If any of the analysts who may cover us change their recommendation regarding our stock adversely, or provide more favorable relative recommendations about our competitors, our stock price would likely decline. If any analyst who may cover us were to cease coverage of our company or fail to regularly publish reports on us, we could lose visibility in the financial markets, which in turn could cause our stock price or trading volume to decline.
Our management has broad discretion over the use of our cash reserves and any government grants and loans we may recieve, if any, and might not apply this cash in ways that increase the value of your investment.
Our management has broad discretion to use our cash reserves, if any, and you will be relying on the judgment of our management regarding the application of this cash. Our management might not apply our cash in ways that increase the value of your investment. We expect to use our cash reserves for capital expenditures, including capital expenditures related to the expansion of our manufacturing capacity in Michigan, working capital, and other general corporate purposes, which may in the future include investments in, or acquisitions of, complementary businesses, joint ventures, partnerships, services or technologies. Our management might not be able to yield a significant return, if any, on any investment of this cash. You will not have the opportunity to influence our decisions on how to use our cash reserves.
We do not expect to declare any dividends in the foreseeable future.
We do not anticipate declaring any cash dividends to holders of our common stock in the foreseeable future. Consequently, investors may need to rely on sales of their common stock after price appreciation, which may never occur, as the only way to realize any future gains on their investment. Investors seeking cash dividends should not purchase our common stock.
Anti-takeover provisions contained in our certificate of incorporation and bylaws, as well as provisions of Delaware law, could impair a takeover attempt.
Our certificate of incorporation, bylaws and Delaware law contain provisions that could have the effect of rendering more difficult or discouraging an acquisition deemed undesirable by our board of directors. Our corporate governance documents include provisions:
- •
- authorizing blank check preferred stock, which could be issued with voting, liquidation, dividend and other rights
superior to our common stock;
- •
- limiting the liability of, and providing indemnification to, our directors and officers;
- •
- limiting the ability of our stockholders to call and bring business before special meetings and to take action by written
consent in lieu of a meeting;
- •
- requiring advance notice of stockholder proposals for business to be conducted at meetings of our stockholders and for
nominations of candidates for election to our board of directors;
- •
- controlling the procedures for the conduct and scheduling of board of directors and stockholder meetings;
- •
- providing the board of directors with the express power to postpone previously scheduled annual meetings and to cancel previously scheduled special meetings;
54
- •
- establishing a classified board of directors so that not all members of our board are elected at one time;
- •
- limiting the determination of the number of directors on our board of directors and the filling of vacancies or newly
created seats on the board to our board of directors then in office; and
- •
- providing that directors may be removed by stockholders only for cause.
These provisions, alone or together, could delay hostile takeovers and changes in control of our company or changes in our management.
As a Delaware corporation, we are also subject to provisions of Delaware law, including Section 203 of the Delaware General Corporation Law, which prevents some stockholders holding more than 15% of our outstanding common stock from engaging in certain business combinations without approval of the holders of substantially all of our outstanding common stock. Any provision of our amended and restated certificate of incorporation or bylaws or Delaware law that has the effect of delaying or deterring a change in control could limit the opportunity for our stockholders to receive a premium for their shares of our common stock, and could also affect the price that some investors are willing to pay for our common stock.
Item 1B. Unresolved Staff Comments.
None.
Our corporate headquarters are located in Watertown, Massachusetts, where we occupy three facilities totaling approximately 36,000 square feet. In December 2009, we amended our existing leases for space in Watertown, Massachusetts to extend the terms through April 30, 2011. We use these facilities for administration, sales and marketing, supply chain, and research and development activities. We also lease approximately 44,000 square feet in Hopkinton, Massachusetts that we use for research and development, system integration and assembly activities. In July, 2010, we entered into a lease for approximately 67,000 square feet in Westborough, Massachusetts for office, research and development, assembly, fabrication and warehouse space. We have also entered into a lease, which is expected to commence in March 2011, for approximately 97,000 square feet in Waltham, Massachusetts for office, research, lab and light manufacturing space. We also lease research and development facilities in Ann Arbor, Michigan of approximately 17,000 square feet. We also lease a facility in Livonia, Michigan, totaling approximately 291,000 square feet for our new lithium-ion battery manufacturing plant. We also lease approximately 287,300 square feet of office, warehouse and manufacturing space in Romulus, Michigan, which we are in the process of outfitting for manufacturing. We lease approximately 1,500 square feet of office space in St. Louis, Missouri. We also own and lease buildings in Changzhou, Zhenjiang, and Changchun, China, Icheon, Korea, and Schorndorf, Germany. These facilities total approximately 625,000 square feet. We believe that our current facilities are sufficient for our current needs. We intend to add new facilities and expand our existing facilities as we add employees and expand our markets, and we believe that suitable additional or substitute space will be available as needed to accommodate any such expansion of our operations.
In 2005 and 2006, we received communications from Hydro-Quebec, a Canadian utility company, alleging that the cathode material of our batteries infringes U.S. Patent No. 5,910,382 and U.S. Patent No. 6,514,640 that had been granted to The University of Texas, or UT, and that relate to certain electrode materials used in lithium-ion batteries. We refer to these patents by the last three digits of the patent number. The '382 and '640 patents include claims that claim to cover battery cathode
55
material having a particular crystal structure and chemical formula. We contend that our cathode material has a different crystal structure and chemical formula.
We believe that UT subsequently licensed the patents to Hydro-Quebec, which in turn licensed the technology to companies that make and sell electrode materials for batteries. On April 7, 2006, we commenced an action in the United States District Court for the District of Massachusetts seeking a declaratory judgment that our products do not infringe these patents and that the patents are invalid. On September 8, 2006, we also requested ex parte reexamination of the two patents by the U.S. Patent & Trademark Office, or PTO, to determine whether the subject matter they claim is patentable. The reexamination process does not result in findings of infringement. In order to have a patent reexamined, the party of interest must submit prior art that raises a "substantial new question of patentability". If the PTO determines that there is a substantial new question of patentability, it will order a reexamination. In an ex parte reexamination, a third party requesting reexamination does not participate further in the reexamination proceedings. Once a reexamination is ordered, a new examiner is assigned to the case and the patent goes through another examination similar in procedure to the examination it received leading up to the issuance of the patent in the first instance. If any claims are rejected in light of the new questions raised, then the patent owner can narrow or cancel the rejected claims to try to avoid rejection of the claims. The patent owner can also submit new claims, provided they are not broader than the claims in the original patent. Once the reexamination has been concluded and if any claims are considered patentable, a "Certificate of Reexamination" is issued.
On September 11, 2006, Hydro-Quebec and UT commenced an action in the United States District Court for the Northern District of Texas against us, one of our customers, Black & Decker, whom we have agreed to indemnify, and one of our suppliers alleging infringement of the two patents and, in a later amended complaint, false advertising. The plaintiffs' complaint alleges infringement of various claims of the '382 Patent and various claims of the '640 Patent and that we and Black & Decker have engaged in false advertising by making representations about the source and nature of our technology. The complaint seeks injunctive relief, including against making, using or selling any product containing the patented technology, actual damages in an unspecified amount, increased and/or treble damages, interest, costs and attorney fees.
In October 2006 and January 2007, the PTO granted our requests for reexamination of the two patents. In January and February 2007, the two litigations in Massachusetts and Texas were stayed pending the PTO reexaminations. Various motions to dismiss, filed by parties on both sides of the dispute, remain undecided.
During the reexamination, the PTO rejected all of the original claims of the '382 Patent as unpatentable. UT then amended the claims of the '382 Patent to make them narrower than the original claims in order to distinguish the claimed invention from the prior art and added two new and narrower claims. The PTO determined that the narrower amended and new claims of the '382 Patent submitted during reexamination are patentable and concluded the reexamination of the '382 Patent. On April 15, 2008, the PTO issued a reexamination certificate with the amended claims and the two new claims. During the reexamination of the '640 Patent, the PTO rejected all of the original claims of the '640 Patent as unpatentable. UT then amended the claims of the '640 Patent to make them narrower than the original claims in order to distinguish the claimed invention from the prior art.
On December 22, 2008, the parties jointly requested that the stay of the litigation continue pending resolution of the reexamination of the '640 Patent. On May 12, 2009, the PTO issued a Certificate of Reexamination for the '640 Patent with the amended narrower claims, thus removing the last condition for staying this litigation. As a result, while Hydro-Quebec and UT may assert the narrower claims of the Certificate of Reexamination against any alleged infringer, including us, they are unable to continue to assert the original claims of the '382 Patent and the '640 Patent against us. On June 11, 2009, we filed a motion to reopen the lawsuit in Massachusetts pursuant to the court's
56
deadline to file within 30 days of the conclusion of the PTO's reexamination. On September 28, 2009, the Massachusetts court entered an order denying that motion, which we appealed on October 27, 2009 to the United States Court of Appeals for the Federal Circuit. The United States Court of Appeals for the Federal Circuit upheld the Massachusetts court's decision on November 10, 2010. On July 22, 2009, Hydro-Quebec and UT sent us a proposed Second Amended Complaint in the Texas litigation, which was filed with the Texas court on August 27, 2009 and the company was granted several unopposed extensions to file its response. The Texas court re-opened the case and lifted the stay on October 26, 2009. The Texas court held a hearing with the parties on May 14, 2010 and extended a schedule for the case leading to a claim construction hearing, which was held on December 2, 2010.
We expect that the Texas litigation could take as much as one year or more to reach trial, if at all. We believe that we do not infringe either UT patent, including the '382 Patent and the '640 Patent following reexamination, and that we have other meritorious defenses, and we intend to continue to vigorously defend our products and intellectual property rights. The '382 and '640 Patents include claims that claim to cover battery cathode material having a particular crystal structure and chemical formula, which Hydro-Quebec and UT claim our cathode material infringes. We believe, and contend in the lawsuits, that our cathode material has a different crystal structure and chemical formula that is not covered by the '382 and '640 patents. However, due to the nature of the litigation, we cannot determine the total expense or possible loss, if any, that may ultimately be incurred either in the context of a trial or as a result of a negotiated settlement. Although Hydro-Quebec and UT have not specified in their complaint the nature or extent of their damages, they have asked for injunctive relief and we believe that they would likely seek substantial damages that could involve both one-time payments and on-going amounts. Regardless of the ultimate outcome of the litigation, it could result in significant legal expenses and diversion of time by our technical and managerial personnel. Additionally, we have agreed to defend and indemnify the other named business partner for its legal costs in defending this litigation and any damages that may be awarded. The results of these proceedings are uncertain, and there can be no assurance that they will not have a material adverse effect on our business, operating results, and financial condition.
57
Item 5. Market for Registrant's Common Equity, Related Stockholder Matters and Issuer Purchases of Equity Securities.
Our common stock began trading on the NASDAQ Global Select Market under the symbol "AONE" on September 24, 2009. The following table sets forth the high and low sale prices as reported on the NASDAQ Global Select Market during each of the previous six quarters.
Quarter Ended
|
March 31, | June 30, | September 30, | December 31, | Fiscal Year | ||||||||||||
|---|---|---|---|---|---|---|---|---|---|---|---|---|---|---|---|---|---|
2010 |
|||||||||||||||||
High |
$ | 22.80 | $ | 14.61 | $ | 11.00 | $ | 10.19 | $ | 22.80 | |||||||
Low |
$ | 13.64 | $ | 7.59 | $ | 6.54 | $ | 7.70 | $ | 6.54 | |||||||
2009 |
|||||||||||||||||
High(1) |
— | — | $ | 22.10 | $ | 28.20 | $ | 28.20 | |||||||||
Low(1) |
— | — | $ | 16.56 | $ | 14.31 | $ | 14.31 | |||||||||
- (1)
- Beginning September 24, 2009 for quarter ended September 30, 2009 and the fiscal year ended December 31, 2009.
As of March 10, 2011, we had approximately 179 stockholders of record. We have not paid any cash dividends since inception and do not anticipate paying cash dividends in the foreseeable future. Our term loan and security agreement, with Silicon Valley Bank and Gold Hill Venture Lending 03, L.P. restricts our ability to pay cash dividends.
Information regarding our equity compensation plans and the securities authorized for issuance thereunder is set forth in our definitive proxy statement to be filed with the Securities and Exchange Commission for our 2011 annual meeting of stockholders under the headings "Security Ownership of Certain Beneficial Owners and Management" and "Securities Authorized for Issuance Under Equity Compensation Plans" and is incorporated herein by reference.
Recent Sales of Unregistered Securities; Use of Proceeds from Registered Securities
(a) Sales of Unregistered Securities
None.
(b) Use of Proceeds from Public Offering of Common Stock
On September 29, 2009, we closed our initial public offering, or IPO, in which 32,407,576 shares of common stock were sold at a price to the public of $13.50 per share. The offer and sale of all of the shares in the IPO were registered under the Securities Act pursuant to a registration statement on Form S-1 (File No. 333-152871), which was declared effective by the SEC on September 23, 2009, and a registration statement on Form S-1 (File No. 333-162090) filed pursuant to Rule 424(b) of the Securities Act. We raised approximately $391.8 million in net proceeds after deducting underwriting discounts and commissions of $30.0 million and other estimated offering costs of $6.7 million. There has been no material change in the planned use of proceeds from our IPO as described in our final prospectus filed with the SEC pursuant to Rule 424(b). From the effective date of the registration statement through December 31, 2010, we used approximately $277.2 million of the net proceeds primarily to fund our operations and the expansion of our facilities to support the anticipated growth of our business. We have invested the remainder of the funds in registered money market funds and short-term investments with original maturities of less than 90 days.
58
Corporate Performance Graph
The following Performance Graph and related information shall not be deemed to be "soliciting material" or to be "filed" with the SEC, nor shall such information be incorporated by reference into any future filing under the Securities Act of 1933 or Securities Exchange Act of 1934, each as amended, except to the extent that we specifically incorporate it by reference into such filing.
The graph below matches the cumulative 15-month total return of holders of A123 Systems, Inc.'s common stock with the cumulative total returns of the NASDAQ Composite index and the Dow Jones US Electrical Components & Equipment TSM index. The graph assumes that the value of the investment in the company's common stock and in each of the indexes (including reinvestment of dividends) was $100 on 9/24/2009 and tracks it through 12/31/2010.
COMPARISON OF 15 MONTH CUMULATIVE TOTAL RETURN*
Among A123 Systems, Inc., the NASDAQ Composite Index
and the Dow Jones US Electrical Components & Equipment TSM Index
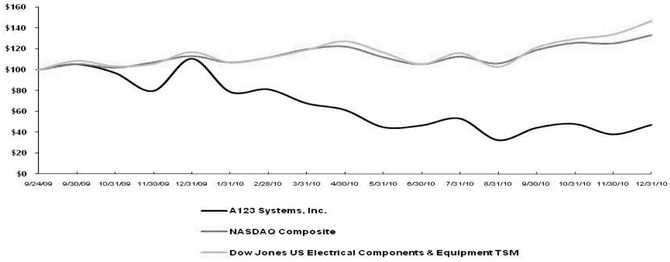
*$100
invested on 9/24/09 in stock or 8/31/09 in index, including reinvestment of dividends.
Fiscal year ending December 31.
Copyright© 2011 Dow Jones & Co. All rights reserved.
| |
9/24/2009 | 12/31/2009 | 12/31/2010 | |||||||
|---|---|---|---|---|---|---|---|---|---|---|
A123 Systems, Inc. |
100 | 110.6 | 47.02 | |||||||
NASDAQ Composite |
100 | 113.11 | 132.97 | |||||||
Dow Jones US Electrical Components & Equipment TSM |
100 | 116.9 | 146.34 | |||||||
The stock price performance included in this graph is not necessarily indicative of future stock price performance.
59
Item 6. Selected Financial Data.
You should read the following selected financial data together with our consolidated financial statements and the related notes contained in Item 8 of Part II of this Annual Report on Form 10-K. We have derived the consolidated statements of operations data for each of the three years ended December 31, 2008, 2009 and 2010 and the consolidated balance sheets data as of December 31, 2009 and 2010 from the audited consolidated financial statements contained in Item 8 of Part II of this Form 10-K. The selected consolidated balance sheet data as of December 31, 2006, 2007 and 2008 and the statement of operations data for the year ended 2006 and 2007 have been derived from the audited consolidated financial statements for such years not included in this Form 10-K.
The historical financial information set forth below may not be indicative of our future performance and should be read together with Management's Discussion and Analysis of Financial Condition and Results of Operations and our historical consolidated financial statements and notes to those statements included in Item 7 of Part II and Item 8 of Part II, respectively, of this Annual Report on Form 10-K.
| |
Year Ended December 31, | |||||||||||||||||
|---|---|---|---|---|---|---|---|---|---|---|---|---|---|---|---|---|---|---|
| |
2006 | 2007 | 2008 | 2009 | 2010 | |||||||||||||
| |
(in thousands) |
|||||||||||||||||
Revenue: |
||||||||||||||||||
Product |
$ | 28,346 | $ | 35,504 | $ | 53,514 | $ | 76,519 | $ | 73,826 | ||||||||
Services |
6,002 | 5,845 | 15,011 | 14,530 | 23,486 | |||||||||||||
Total revenue |
34,348 | 41,349 | 68,525 | 91,049 | 97,312 | |||||||||||||
Cost of revenue: |
||||||||||||||||||
Product |
28,960 | 38,320 | 70,474 | 83,778 | 94,277 | |||||||||||||
Services |
4,417 | 4,499 | 10,295 | 9,963 | 20,474 | |||||||||||||
Total cost of revenue |
33,377 | 42,819 | 80,769 | 93,741 | 114,751 | |||||||||||||
Gross profit (loss) |
971 | (1,470 | ) | (12,244 | ) | (2,692 | ) | (17,439 | ) | |||||||||
Operating expenses: |
||||||||||||||||||
Research, development and engineering |
8,851 | 13,241 | 36,953 | 48,286 | 60,723 | |||||||||||||
Sales and marketing |
1,537 | 4,307 | 8,851 | 8,455 | 14,111 | |||||||||||||
General and administrative |
6,129 | 13,336 | 21,544 | 24,480 | 36,053 | |||||||||||||
Production start-up |
— | — | — | 1,524 | 21,064 | |||||||||||||
Total operating expenses |
16,517 | 30,884 | 67,348 | 82,745 | 131,951 | |||||||||||||
Operating loss |
(15,546 | ) | (32,354 | ) | (79,592 | ) | (85,437 | ) | (149,390 | ) | ||||||||
Other income (expense): |
||||||||||||||||||
Interest income |
871 | 1,729 | 1,258 | 165 | 135 | |||||||||||||
Interest expense |
(641 | ) | (716 | ) | (812 | ) | (1,206 | ) | (1,430 | ) | ||||||||
Gain (loss) on foreign exchange |
— | 502 | (724 | ) | 682 | (560 | ) | |||||||||||
Unrealized loss on preferred stock warrant liability |
(362 | ) | (57 | ) | (286 | ) | (515 | ) | — | |||||||||
Other income |
— | — | — | — | (849 | ) | ||||||||||||
Other (expense) income, net |
(132 | ) | 1,458 | (564 | ) | (874 | ) | (2,704 | ) | |||||||||
Loss from operations, before tax |
(15,678 | ) | (30,896 | ) | (80,156 | ) | (86,311 | ) | (152,094 | ) | ||||||||
Provision for income taxes |
40 | 97 | 275 | 278 | 843 | |||||||||||||
Loss from operations, net of tax |
(15,718 | ) | (30,993 | ) | (80,431 | ) | (86,589 | ) | (152,937 | ) | ||||||||
Cumulative effect of change in accounting principle |
(57 | ) | — | — | — | — | ||||||||||||
Net loss |
(15,775 | ) | (30,993 | ) | (80,431 | ) | (86,589 | ) | (152,937 | ) | ||||||||
Less: Net loss (income) attributable to the noncontrolling interest |
— | 27 | (39 | ) | 810 | 377 | ||||||||||||
Net loss attributable to A123 Systems, Inc. |
(15,775 | ) | (30,966 | ) | (80,470 | ) | (85,779 | ) | (152,560 | ) | ||||||||
Accretion to preferred stock |
(26 | ) | (35 | ) | (42 | ) | (45 | ) | — | |||||||||
Net loss attributable A123 Systems, Inc. common stockholders |
$ | (15,801 | ) | $ | (31,001 | ) | $ | (80,512 | ) | $ | (85,824 | ) | $ | (152,560 | ) | |||
60
| |
Year Ended December 31, | |||||||||||||||
|---|---|---|---|---|---|---|---|---|---|---|---|---|---|---|---|---|
| |
2006 | 2007 | 2008 | 2009 | 2010 | |||||||||||
| |
(in thousands) |
|||||||||||||||
Net loss per share attributable to common stockholders—basic and diluted: |
$ | (2.65 | ) | $ | (4.88 | ) | $ | (9.04 | ) | $ | (2.55 | ) | $ | (1.46 | ) | |
Weighted average number of common shares outstanding—basic and diluted |
5,971 | 6,351 | 8,904 | 33,669 | 104,364 | |||||||||||
Other Operating Data: |
||||||||||||||||
Shipments (in watt hours, or Wh) (in thousands)(1) |
20,016 | 32,010 | 44,900 | 66,461 | 62,883 | |||||||||||
- (1)
- We measure our product shipments in watt hours, or Wh, which refers to the aggregate amount of energy that could be delivered in a single complete discharge of a battery. We calculate watt hours for each of our battery models by multiplying the battery's amp hour, or Ah, storage capacity by the battery's voltage rating. For example, our 26650 battery is a 2.3 Ah battery that operates at 3.3 V, resulting in a 7.6 Wh rating. The Wh metric allows us and our investors to measure our manufacturing capacity and shipments, regardless of battery voltages and Ah specifications, utilizing a uniform and consistent metric.
| |
As of December 31, | ||||||||||||||||
|---|---|---|---|---|---|---|---|---|---|---|---|---|---|---|---|---|---|
| |
2006 | 2007 | 2008 | 2009 | 2010 | ||||||||||||
| |
(in thousands) |
||||||||||||||||
Consolidated Balance Sheet Data: |
|||||||||||||||||
Cash and cash equivalents |
$ | 9,484 | $ | 23,359 | $ | 70,510 | $ | 457,122 | $ | 216,841 | |||||||
Working capital |
14,314 | 30,727 | 69,345 | 470,424 | 191,892 | ||||||||||||
Total assets |
47,668 | 105,146 | 208,960 | 618,090 | 576,158 | ||||||||||||
Preferred stock warrant liability |
694 | 664 | 950 | — | — | ||||||||||||
Long-term debt, including current portion |
5,404 | 6,071 | 10,522 | 13,894 | 9,982 | ||||||||||||
Capital lease obligations, including current portion |
1,120 | 1,121 | 684 | 604 | 20,226 | ||||||||||||
Redeemable convertible preferred stock |
62,884 | 132,914 | 234,954 | — | — | ||||||||||||
Redeemable common stock |
— | — | 11,500 | — | — | ||||||||||||
Total A123 Systems, Inc. stockholders' (deficit) equity |
(34,032 | ) | (62,603 | ) | (133,428 | ) | 528,220 | 398,198 | |||||||||
61
Item 7. Management's Discussion and Analysis of Financial Condition and Results of Operations.
The following discussion and analysis of our financial condition and results of operations should be read in conjunction with our consolidated financial statements and the related notes thereto and other financial information included elsewhere in this Annual Report on Form 10-K.
Overview
We design, develop, manufacture and sell advanced, rechargeable lithium-ion batteries and battery systems. Our target markets are the transportation, electric grid services and commercial markets.
We market and sell our products primarily through a direct sales force. In the transportation market, we are focusing sales of our batteries and battery systems to automotive and heavy duty vehicle manufacturers either directly or through tier 1 suppliers. We work with automotive and heavy duty vehicle manufacturers directly to educate and inform them about the benefits of our technology for use in hybrid electric vehicles, or HEVs, plug-in hybrid electric vehicles, or PHEVs and electric vehicles, or EVs, and are engaged in design and development efforts with several automotive and heavy duty vehicle manufacturers and tier 1 suppliers. At the same time, we work with tier 1 suppliers who are developing integrated solutions using our batteries. In the electric grid services market, our sales have been initiated directly by our sales force. In the commercial market, our sales are made both directly and indirectly through distributors with key accounts managed by our sales personnel. We have entered into an exclusive agreement to license certain of our technology in the field of commercial electronic devices (excluding power tools and certain other consumer products) and expect to receive royalty fees on net sales of licensed products that include our technology. We expect to continue to expand our sales presence in Europe and Asia as our business in those regions continues to grow. We expect international markets to provide increased opportunities for our products.
Our sales cycles vary by product and market segment. Most of our batteries and battery systems typically undergo a lengthy development and qualification period prior to commercial production. We expect that the total time from customer introduction to commercial production will range up to five years depending on the specific product and market served. Our long and unpredictable sales cycles and the potential large size of battery supply and development contracts cause our period-to-period financial results to be susceptible to significant variability. Since most of our operating and capital expenses are incurred up-front based on the anticipated timing of estimated design wins and customer orders, the loss or delay of any such orders could have a material adverse effect on our results of operations for any particular period. The variability in our period-to-period results will also be driven by likely period-to-period variations in product mix and by the seasonality experienced by some of the end markets into which we sell our products. In the electric grid market, revenue recognition will be volatile due to the timing of deployment, delivery, and commissioning. As such, the timing of these events will significantly affect the comparison of period-to-period revenues.
We have been expanding our manufacturing capacity since inception, including the current expansion of our Livonia and Romulus, Michigan facilities, and we intend to further expand our manufacturing capacity by constructing more manufacturing lines, primarily in Michigan. We are currently in transition as we are expanding capacity in anticipation of increased demand for our prismatic cells as we expect transportation product revenues to increase in future periods. We intend to further accelerate the expansion of our manufacturing capacity subject to actual and anticipated future demand for our products and the receipt of additional stimulus funds from the U.S. and state governments. In the first quarter of 2010, we began making investments against plans to further expand the final assembly capacity of our Michigan facilities. Based on new design wins and our demand estimates, we have approved plans to increase our capacity in Michigan, resulting in a worldwide capacity of over 760MWh. We believe that increases in production capacity have had, and will continue to have, a significant effect on our financial condition and results of operations. We have made and
62
continue to make significant up-front investments in our manufacturing capacity, which negatively impact earnings and cash balances, but we expect these investments will increase our revenue in the long term.
Our research and development efforts are focused on developing new products and improving the performance of existing products. We fund our research and development initiatives both from internal and external sources. As part of our development strategy, certain customers fund or partially fund research and development efforts to design and customize batteries and battery systems for their specific application.
We have continued to experience significant losses since inception, as we have continued to invest significantly to support the anticipated growth in our business. In particular, we have invested in product development and sales and marketing in order to meet product requirements of our target markets and to secure design wins that may lead to strong revenue growth and general and administrative overhead to develop the infrastructure to support the business. We have also invested in the expansion of our manufacturing capacity to meet anticipated demand and our battery systems capabilities to provide battery systems solutions to our customers. As our business grows, the key factors to improving our financial performance will be revenue growth and revenue diversification into the transportation and electric grid services markets. Our revenue growth and revenue diversification will depend on our ability to secure design wins in the transportation and electric grid services markets. Higher revenue will also increase gross margin, as higher production volumes will provide for increased absorption of manufacturing overhead and will reduce, on a percentage basis, the costs associated with our production capacity.
In December 2009, we executed an agreement with the DOE regarding the terms and conditions of the $249.1 million grant awarded under the DOE's Battery Initiative to fund the construction of new lithium-ion battery manufacturing facilities in Michigan. Under the DOE Battery Initiative, we are required to spend up to one dollar of our funds for every incentive dollar received. Through December 31, 2010, we have received $86.9 million in reimbursement for costs incurred. As of December 31, 2010, we have incurred additional allowable costs entitling us to receive $2.1 million in reimbursements, which has been recorded as a receivable
We are also negotiating a loan under the Advanced Technology Vehicles Manufacturing Loan Program, or the ATVM Program, to support this manufacturing expansion. Based on the amount of our grant award under the DOE Battery Initiative and the guidelines associated with the ATVM Program, we believe we will be permitted to borrow up to $233 million under the ATVM Program. We expect we will be required to spend one dollar of our own funds for every four dollars we borrow under the ATVM Program. The timing and the amount of any loan we may receive under the ATVM Program, as well as the specific terms and conditions applicable to any loan we may receive are currently not known by us, and, once disclosed to us, are subject to change and negotiation with the federal government.
In October 2009, we entered into a High-Tech Credit agreement with the Michigan Economic Growth Authority, or MEGA, pursuant to which we are eligible for a 15-year tax credit, beginning with payments made for the 2011 fiscal year. This credit has an estimated value of up to $25.3 million, depending on the number of jobs we create in Michigan. In November 2009, we entered into a Cell Manufacturing Credit agreement with MEGA pursuant to which we are eligible for a credit equal to 50% of our capital investment expenses commencing January 2009, up to a maximum of $100 million over a four-year period related to the construction of our integrated battery cell manufacturing plant. The tax credit proceeds shall not exceed $25 million per year beginning with the tax year of 2012. We are required to create 300 jobs no later than December 31, 2016 in order for the tax credit proceeds to be non-refundable. The tax credit is subject to a repayment provision in the event we relocate 51% or more of the 300 jobs outside of the State of Michigan within three years after the last year we received
63
the tax credit. Through December 31, 2010 we have incurred expenses of $151.6 million in qualified expenses related to the construction of the Livonia and Romulus facilities. When we have met the filing requirements for the tax year ending December 31, 2012, we expect to begin receiving $75.8 million in proceeds related to these expenses limited to $25.0 million per year over a four year period. We have recorded a receivable of $75.8 million, as it is reasonably assured that we will comply with the conditions of the tax credit and will receive proceeds. Upon recording the receivable in the fourth quarter of 2010, we reduced the basis in the fixed assets acquired in accordance with the tax credit and this will be recognized in the consolidated statements of operations over their estimated useful lives of the depreciable asset as reduced depreciation expense.
Financial Operations Overview
Revenue
We derive revenue from product sales and providing services.
Product Revenue. Product revenue is derived from the sale of our batteries and battery systems. For the years ended December 31, 2009 and 2010, product revenue represented 84% and 76% of our total revenue, respectively.
A significant portion of our revenue is generated from a limited number of customers. Our two largest customers (BAE Systems, or BAE, and AES Energy Storage, LLC, or AES) accounted for approximately 28% and 13% of our total revenue during the year ended December 31, 2010, respectively, and we expect that most of our revenue will continue to come from a relatively small number of customers for the foreseeable future. As we increase our focus on the transportation and electric grid markets, BAE and AES will continue to represent a significant portion of our revenue in the near term, and the loss of BAE or AES as a customer could have a material adverse effect on our short-term revenue. We expect the transportation market and the electric grid market to represent the largest portion of our revenue in the near and long term.
Services Revenue. Services revenue is primarily derived from contracts awarded by the U.S. federal government, other government agencies and commercial customers. These activities range from pure research, in which we investigate design techniques on new battery technologies at the request of a government agency or commercial customer, to custom development projects in which we are paid to enhance or modify an existing product or develop a new product to meet a customer's specifications. We expect to continue to perform funded research and development work and to use the technology developed to advance our new product development efforts. We expect that revenue from services will vary period-to-period depending on the timing of cash payments received and, if applicable, the achievement of milestones. We expect that services revenue will decrease as a percentage of our total revenue due to the expected increase in product revenue over the long-term.
Deferred Revenue. We record deferred revenue for product sales and services in several different circumstances. These circumstances include (i) the products have been delivered or services have been performed but other revenue recognition criteria have not been satisfied (ii) payments have been received in advance of products being delivered or services being performed and (iii) when all other revenue recognition criteria have been met, but we are not able to reasonably estimate the warranty expense. Deferred revenue includes customer deposits and up-front fees associated with service arrangements. Deferred revenue expected to be recognized as revenue more than one year subsequent to the balance sheet date is classified as long-term deferred revenue. Deferred revenue will vary depending on the timing and amount of cash receipts from customers and can vary significantly depending on specific contractual terms. As a result, deferred revenue is likely to fluctuate from period-to-period. We have received and recorded as deferred revenue a total of $28.0 million in up-front, support and additional payments in connection with our license agreement with Gillette. In
64
addition, the agreement requires Gillette to pay us royalty fees on net sales of products that include our technology. We have agreed with Gillette that if, during a certain period following execution of the license agreement, we enter into an agreement with a third party that materially restricts Gillette's license rights under the license agreement, then we may be required to refund to Gillette all license and support fees paid to us by Gillette under the license agreement, plus, in certain cases, an additional amount to cover Gillette's capital and other expenses paid and/or committed by Gillette in reliance upon its rights under the license agreement. Revenue recognition is expected to commence upon successful transfer of technology know how to Gillette. The license and support fee will be recognized on a straight-line basis over the longer of the patent term or the expected customer relationship.
Factors that May Affect Comparability
Public Company Expenses. In September 2009, we completed an initial public offering of shares of our common stock. As a result, we are subject to laws, regulations, and requirements that we were not required to comply with as a private company, including the Sarbanes-Oxley Act of 2002, other SEC regulations and the requirements of the NASDAQ Global Select Market. Compliance with these requirements required us to increase our general and administrative expenses in order to pay consultants, legal counsel and independent registered public accountants to assist us in, among other things, instituting and monitoring a more comprehensive compliance and board governance function, establishing and maintaining internal control over financial reporting in accordance with Section 404 of the Sarbanes-Oxley Act of 2002 and preparing and distributing periodic public reports in compliance with our obligations under the federal securities laws. In addition, as a public company, it is more expensive for us to obtain and maintain directors' and officers' liability insurance.
Cost of Revenue and Gross Profit
Cost of product revenue includes the cost of raw materials, labor and components that are required for the production of our products, as well as manufacturing overhead costs (including depreciation), inventory obsolescence charges, and warranty costs. Raw material costs, which are our most significant cost item over the past two years, have historically been stable, but increasing energy costs for some of our materials are expected to increase this cost. This increase may be partially offset by process innovation, dual sourcing of materials and increased volume if we achieve better economies of scale. We incur costs associated with unabsorbed manufacturing expenses prior to a factory operating at normal operating capacity. We expect these unabsorbed manufacturing costs, which include certain personnel, rent, utilities, materials, testing and depreciation costs, to increase in absolute dollars and as a percentage of revenue in the near term.
Cost of services revenue includes the direct labor costs of engineering resources committed to funded service contracts, as well as third-party consulting, and associated direct material and equipment costs. Additionally, we include overhead expenses such as occupancy costs associated with the project resources, engineering tools and supplies and program management expense.
Our gross profit/(loss) is affected by a number of factors, including the mix of products sold, customer diversification, the mix between product revenue and services revenue, average selling prices, foreign exchange rates, our actual manufacturing costs and costs associated with increasing production capacity until full production is achieved. As we continue to grow and build out our manufacturing capacity, and as new product designs come into production, our gross profit will continue to fluctuate from period-to-period.
We are rapidly expanding our capacity to meet anticipated customer demand, including building out additional manufacturing capacity at our Livonia and Romulus, Michigan facilities. During 2010, we more than doubled our worldwide manufacturing capacity from 169 MWh to approximately 345 MWh. This expansion is part of our plan to support annual manufacturing capacity of 760 MWh. During
65
December 2010, we qualified the first production line at our Livonia facility and we expect to qualify our Romulus facility during the first half of 2011. Also, we have put into place manufacturing overhead, including supply chain and quality organizations, which are sized to support significantly higher production volumes than we are currently producing. Increasing our production volume will allow us to reduce per-unit cell costs, improve the absorption of manufacturing overhead costs, and improve our gross margins.
However, pending the qualification and production ramp-up at our Michigan facilities, we are currently producing cells in a low-volume pilot production plant. Utilizing a pilot production plant imposes capacity constraints, limiting our ability to produce at higher volumes and decrease our per-unit cost of goods sold, thereby contributing to our negative gross margins. As we ramp-up production at our Michigan facilities, we anticipate a significant increase in production volumes and therefore lower per-unit costs.
Our long-term financial objective is to achieve and support sustained profitable growth. To meet this objective, we are currently focusing on completing the expansion of our manufacturing capacity and increasing production volumes to achieve lower material costs due to volume purchase discounts and improved absorption of our manufacturing overhead costs, thereby reducing per-unit production cost.
Operating Expenses
Operating expenses consist of research, development and engineering, sales and marketing, general and administrative and production start-up expenses. Personnel-related expenses comprise the most significant component of these expenses. We expect to hire a significant number of new employees in order to support our anticipated growth. In any particular period, the timing of additional hires could materially affect our operating expenses, both in absolute dollars and as a percentage of revenue. During the third quarter of 2010, we opened our manufacturing facility in Livonia, Michigan, and our Livonia facility was qualified for production in December 2010. The Romulus facility is expected to begin qualification for production in the first quarter of 2011. We anticipate increases in operating expenses, specifically, facility-related expenses and personnel-related expenses due to an increase in headcount at our Livonia and Romulus facilities, in future periods as we ramp to full production in both locations.
Research, Development and Engineering Expenses. Research, development and engineering expenses consist primarily of expenses for personnel engaged in the development of new products and the enhancement of existing products, as well as lab materials, quality assurance activities and facilities costs and other related overhead. These expenses also include pre-production costs related to long-term supply agreements unless reimbursement from the customer is contractually guaranteed. Pre-production costs consist of engineering, design and development costs for products sold under long-term supply arrangements. We expense all of our research, development and engineering costs as they are incurred. In the near term, we expect research, development and engineering expenses to increase in large part due to personnel-related expenses as we seek to hire additional employees, as well as contract-related expenses as we continue to invest in the development of our products. Research, development and engineering expense is reported net of any funding received under contracts with governmental agencies and commercial customers that are considered to be cost sharing arrangements with no contractually committed deliverable. Accordingly, we expect that our research, development and engineering expenses will continue to increase in absolute dollars but decrease as a percentage of revenue in the long term.
Sales and Marketing Expenses. Sales and marketing expenses consist primarily of personnel-related expenses, travel and other out-of-pocket expenses for marketing programs, such as trade shows, industry conferences, marketing materials and corporate communications, and facilities costs and other related overhead. We intend to hire additional sales personnel, initiate additional marketing programs
66
and build additional relationships with resellers, systems integrators and strategic partners on a global basis. Accordingly, we expect that our sales and marketing expenses will continue to increase in absolute dollars but decrease as a percentage of revenue in the long term.
General and Administrative Expenses. General and administrative expenses consist primarily of personnel-related expenses related to our executive, legal, finance, human resource and information technology functions, as well as fees for professional services and allocated facility overhead expenses. Professional services consist principally of external legal, accounting, tax, audit and other consulting services. We expect to continue to incur general and administrative expenses related to operating as a publicly-traded company, including increased audit and legal fees, costs of compliance with securities, corporate governance and other regulations, investor relations expenses and higher insurance premiums, particularly those related to director and officer insurance. In addition, we expect to incur additional costs as we hire personnel and enhance our infrastructure to support the anticipated growth of our business. Accordingly, we expect that our general and administrative expenses will continue to increase in absolute dollars but decrease as a percentage of revenue in the long term.
Production Start-up Expenses. Production start-up expenses consist of salaries and personnel-related costs, site selection costs, including legal and regulatory costs, rent and the cost of operating a production line before it is qualified for production, including the cost of raw materials run through the production line during the qualification phase. We expect to incur additional production start-up expenses related to our facilities in Romulus, Michigan in the near term. The Livonia facility began qualification for production in the third quarter of 2010. The Romulus facility is expected to begin qualification for production in the first quarter of 2011.
Other Income (Expense), Net. Other income (expense), net consists primarily of interest income on cash balances, interest expense on borrowings, change in fair value of preferred stock warrants, foreign currency-related gains and losses, equity earnings and gain on long-term investment. We have historically invested our cash in money market investments. Our interest income will vary each reporting period depending on our average cash balances during the period and the current level of interest rates. Similarly, our foreign currency-related gains and losses will also vary depending upon movements in underlying exchange rates. Upon the closing of our IPO, all preferred stock warrants were converted to common stock warrants and we do not expect any gains or losses related to the change in the fair value of preferred stock warrants going forward. Other income includes equity losses related of our proportional share of earnings in investments accounted for under the equity method and will vary each reporting period depending on the earnings or losses of these entities and gains or losses on long-term investments will vary each reporting period depending on the timing of any joint ventures or other equity investments we may enter into, the investment made by us, and the ongoing operations of the investee.
Provision for Income Taxes. Through December 31, 2010, we incurred net losses since inception and have not recorded provisions for U.S. federal income taxes since the tax benefits of our net losses have been offset by valuation allowances.
We have recorded a tax provision for foreign taxes associated with our foreign subsidiaries and state income taxes where our net operating loss deductions are limited by statutes.
Certain Trends and Uncertainties
The following represents a summary of certain trends and uncertainties, which could have a significant impact on our financial condition and results of operations. This summary is not intended to be a complete list of potential trends and uncertainties that could impact our business in the long or short term. The summary, however, should be considered along with the factors identified in the
67
section titled Risk Factors set forth in Part I, Item 1A of this Annual Report on Form 10-K and elsewhere in this report.
- •
- We believe that our future revenues depend on our ability to develop, manufacture and market products that improve upon
existing battery technology and gain market acceptance. If our battery technology is not adopted by our customers, or if our battery technology does not meet industry requirements for power and energy
storage capacity in an efficient and safe design, our batteries will not gain market acceptance.
- •
- We build our manufacturing capacity based on estimated demand from existing supply agreements, from our projection of
future development and supply agreement wins and from anticipated timelines of customer orders. Increases in production capacity, have had, and will continue to have, an effect on our financial
condition and results of operations. Our business revenues and profits will depend upon our ability to enter into and complete development and supply agreements, successfully complete these capacity
expansion projects, achieve competitive manufacturing yields and drive volume sales consistent with our demand expectations.
- •
- Our revenues are expected to continue to come from a relatively small number of customers for the foreseeable future. The loss of one of our two most significant customers, several of our smaller customers, or one of our existing supply agreements for significant future revenues, could materially harm our business.
Application of Critical Accounting Policies and Estimates
Our discussion and analysis of our financial condition and results of operations are based upon our consolidated financial statements, which have been prepared in accordance with accounting principles generally accepted in the United States of America. The preparation of these financial statements requires us to make estimates and assumptions that affect the reported amounts of assets, liabilities, revenue, expense and related disclosures. We base our estimates and assumptions on historical experience and on various other factors that we believe to be reasonable under the circumstances. We evaluate our estimates and assumptions on an ongoing basis. Our actual results may differ from these estimates under different assumptions or conditions.
We believe the following critical accounting policies affect our more significant judgments and estimates used in the preparation of our financial statements.
Revenue Recognition
We recognize revenue once it is realized or realizable and earned when all of the following criteria are met: persuasive evidence of an arrangement exists, delivery has occurred or services have been rendered, the price to the buyer is fixed or determinable, and collectability is reasonably assured. In instances where final acceptance of the product is specified by the customer, revenue is deferred until all acceptance criteria have been met.
Product revenue is generally recognized upon transfer of title and risk of loss, which is generally upon shipment, unless an acceptance period or other contingency exists. In general, our customary shipping terms are FOB shipping point or free carrier. In instances where customer acceptance of a product is required, revenue is either recognized upon the shipment when we are able to demonstrate the customer specific objective criteria have been met or the earlier of customer acceptance or expiration of the acceptance period.
Services revenue is recognized as services are performed consistent with the performance requirements of the contract using the proportional performance method. Where arrangements include milestones or governmental approval that impact the fees payable to us, revenue is limited to those amounts whereby collectability is reasonably assured. We recognize revenue earned under time and
68
materials contracts as services are provided based upon actual costs incurred plus a contractually agreed-upon profit margin. We recognize revenue from fixed-price contracts, using the proportional performance method based on the ratio of costs incurred to estimates of total expected project costs in order to determine the amount of revenue earned to date. Project costs are based on the direct salary and associated fringe benefits of the employees on the project plus all direct expenses incurred to complete the project that are not reimbursed by the client. The proportional performance method is used since reasonably dependable estimates of the revenues and costs applicable to various stages of a contract can be made. These estimates are based on historical experience and deliverables identified in the contract and are indicative of the level of benefit provided to our clients. There are no costs that are deferred and amortized over the contract term.
If sales arrangements contain multiple elements, we determine if separate units of accounting exist within the arrangement. If separate units of accounting exist within an arrangement, we allocate revenue to each element based on the relative fair value of each of the elements.
Fees to license the use of our proprietary and licensed technologies are recognized only after both the license period has commenced and the technology has been delivered to the customer. Royalty revenue is recognized when it becomes determinable and collectability is reasonably assured; otherwise we recognize revenue upon receipt of payment. To date, we have not recognized any material license or royalty revenue.
Because of the nature of our products, revenue recognition is based on a number of quantitative and qualitative factors. This can lead to significant fluctuations in our quarterly and annual revenues.
Product Warranty Obligations
We accrue for product warranty costs at the time revenue is recognized based on the historical rate of claims and costs to provide warranty services. Our standard warranty period extends one to eight years from the date of sale, depending on the type of product purchased and its application. Our estimates of the amounts necessary to settle warranty claims are based primarily on our past experience. For our new products and products that remain under development, we will be required to base our warranty estimates on historical experience of similar products, testing of our batteries and battery systems, and performance information learned during our development activities with the customer. Although we believe our estimates are adequate and that the judgment we apply is appropriate, actual warranty costs could differ materially from our estimates. If we experience an increase in warranty claims above historical experience or our costs to provide warranty services increase, we would be required to increase our warranty accrual, and our cost of revenue would increase. If we are unable to estimate warranty costs we would defer recognizing revenue until we can make that determination.
Inventory
We carry our inventory at the lower of historical cost or net realizable value assuming inventory items are consumed on a first-in, first-out basis. We recognize inventory losses based on obsolescence and levels in excess of forecasted demand. In these cases, inventory is written down to the estimated realizable value based on historical usage and expected demand. Inherent in our estimates of market value in determining inventory valuation are estimates related to economic trends, future demand for our products and technical obsolescence of our products. If future demand or market conditions are less favorable than our projections, additional inventory write-downs could be required and would be reflected in the cost of revenue in the period the revision is made.
69
Impairment of Long-Lived Assets
We periodically evaluate our long-lived assets for events and circumstances that indicate a potential impairment. We review long-lived assets for impairment whenever events or changes in business circumstances indicate that the carrying amount of the assets may not be fully recoverable or that the useful lives of these assets are no longer appropriate. Each impairment test is based on a comparison of the estimated undiscounted cash flows of the asset as compared to the recorded value of the asset. If these estimates or their related assumptions change in the future, we may be required to record impairment charges against these assets in the reporting period in which the impairment is determined.
As a result of the decline in revenue from our Korean subsidiary and the termination of the supply agreement with its largest customer, we concluded that impairment indicators existed. As a result, we reviewed our long-lived assets associated with the production of small prismatic batteries and recorded $1.7 million, $0, and $0.3 million of impairment charges in the years ended December 31, 2008, 2009 and 2010, respectively. During the years ended December 31, 2008, 2009 and 2010, we recorded $0, $0.7 million and a $0.1 million, respectively, of impairment charges related to impaired equipment at our China facility.
Government Grants
We recognize government grants when there is a reasonable assurance that we will comply with the conditions attached to the grant arrangement and the grant will be received. For reimbursements of expenses, the government grants are recognized as reduction of the related expense. For reimbursements of capital expenditures, the grants are recognized as a reduction of the basis of the asset. The grant is recognized in profit or loss over the life of a depreciable asset as reduced depreciation expense. We record government grant receivables in current or long-term assets depending on when the amounts are expected to be received from the government agency. We do not discount long-term grant receivables. When funding is received in advance of complying with certain conditions, we recognize a liability and restricted cash on the consolidated balance sheets until such time as the funding has been spent.
Investments in Non-Public Companies
Our investments held in non-public companies are considered a critical accounting policy because these investments expose us to equity price risk. As of December 31, 2010, non-publicly traded investments of $20.5 million are accounted for using the cost method and $1.0 million are accounted for using the equity method. Strategic investments in third parties are subject to risk of changes in market value, which if determined to be other-than-temporary, could result in realized impairment losses, which could be material. We generally do not attempt to reduce or eliminate our market exposure in cost or equity method investments. We regularly monitor these non-publicly traded investments for impairment and record reductions in the carrying values when necessary. Circumstances that indicate an other-than-temporary decline include valuation ascribed to the issuing company in subsequent financing rounds, decreases in quoted market price and declines in operations of the issuer. There can be no assurance that cost or equity method investments will not face risks of loss.
70
Results of Consolidated Operations
The following table sets forth selected consolidated statements of operations data for each of the periods (in thousands):
| |
Year Ended December 31, | |||||||||||
|---|---|---|---|---|---|---|---|---|---|---|---|---|
| |
2008 | 2009 | 2010 | |||||||||
Revenue: |
||||||||||||
Product |
$ | 53,514 | $ | 76,519 | $ | 73,826 | ||||||
Services |
15,011 | 14,530 | 23,486 | |||||||||
Total revenue |
68,525 | 91,049 | 97,312 | |||||||||
Cost of revenue: |
||||||||||||
Product |
70,474 | 83,778 | 94,277 | |||||||||
Services |
10,295 | 9,963 | 20,474 | |||||||||
Total cost of revenue |
80,769 | 93,741 | 114,751 | |||||||||
Gross loss |
(12,244 | ) | (2,692 | ) | (17,439 | ) | ||||||
Operating expenses: |
||||||||||||
Research, development and engineering |
36,953 | 48,286 | 60,723 | |||||||||
Sales and marketing |
8,851 | 8,455 | 14,111 | |||||||||
General and administrative |
21,544 | 24,480 | 36,053 | |||||||||
Production start-up |
— | 1,524 | 21,064 | |||||||||
Total operating expenses |
67,348 | 82,745 | 131,951 | |||||||||
Operating loss |
(79,592 | ) | (85,437 | ) | (149,390 | ) | ||||||
Other income (expense): |
||||||||||||
Interest income |
1,258 | 165 | 135 | |||||||||
Interest expense |
(812 | ) | (1,206 | ) | (1,430 | ) | ||||||
Gain (loss) on foreign exchange |
(724 | ) | 682 | (560 | ) | |||||||
Unrealized loss on preferred stock warrant liability |
(286 | ) | (515 | ) | — | |||||||
Other income |
— | — | (849 | ) | ||||||||
Other expense, net |
(564 | ) | (874 | ) | (2,704 | ) | ||||||
Loss from operations, before tax |
(80,156 | ) | (86,311 | ) | (152,094 | ) | ||||||
Provision for income taxes |
275 | 278 | 843 | |||||||||
Net loss |
(80,431 | ) | (86,589 | ) | (152,937 | ) | ||||||
Less: Net (income) loss attributable to the noncontrolling interest |
(39 | ) | 810 | 377 | ||||||||
Net loss attributable to A123 Systems, Inc. |
(80,470 | ) | (85,779 | ) | (152,560 | ) | ||||||
Accretion to preferred stock |
(42 | ) | (45 | ) | — | |||||||
Net loss attributable A123 Systems, Inc. common stockholders |
$ | (80,512 | ) | $ | (85,824 | ) | $ | (152,560 | ) | |||
Other Operating Data: |
||||||||||||
Shipments (in watt hours, or Wh) (in thousands) |
44,900 | 66,461 | 62,883 | |||||||||
71
Years Ended December 31, 2009 and 2010
Revenue
| |
Year Ended December 31, | |
|
|||||||||||
|---|---|---|---|---|---|---|---|---|---|---|---|---|---|---|
| |
2009 | 2010 | $ Change | % Change | ||||||||||
| |
(Dollars in thousands) |
|||||||||||||
Revenue |
||||||||||||||
Product |
||||||||||||||
Transportation |
$ | 45,298 | $ | 43,673 | $ | (1,625 | ) | -3.6 | % | |||||
Commercial |
20,141 | 16,596 | (3,545 | ) | -17.6 | % | ||||||||
Electric grid |
11,080 | 13,557 | 2,477 | 22.4 | % | |||||||||
Total product |
76,519 | 73,826 | (2,693 | ) | -3.5 | % | ||||||||
Services |
14,530 | 23,486 | 8,956 | 61.6 | % | |||||||||
Total revenue |
$ | 91,049 | $ | 97,312 | $ | 6,263 | 6.9 | % | ||||||
Product Revenue. The decrease in sales in the transportation industry of $1.6 million for the year ended December 31, 2010 compared to the year ended December 31, 2009 was primarily due to a decrease in sales to Mercedes-Benz HighPerformanceEngines of $6.0 million. This decrease was partially offset by an increase of $4.4 million in sales to other transportation customers. The decrease in sales in the commercial industry of $3.5 million for the year ended December 31, 2010 compared to the year ended December 31, 2009 was primarily due to a decrease in sales to a commercial customer and its affiliates of $9.1 million, partially offset by an increase in sales to other customers in the commercial industry of $5.6 million. Sales to customers in the electric grid industry increased by $2.5 million due to increased shipments of electric grid storage systems.
Services Revenue. The increase in services revenue was related to the increase in revenue from government agency research contracts, which was primarily due to a new project award granted.
Cost of Revenue and Gross Profit (Loss)
| |
Year Ended December 31, | |
|
||||||||||
|---|---|---|---|---|---|---|---|---|---|---|---|---|---|
| |
2009 | 2010 | $ Change | % Change | |||||||||
| |
(Dollars in thousands) |
||||||||||||
Cost of revenue |
|||||||||||||
Product |
$ | 83,778 | $ | 94,277 | $ | 10,499 | 12.5 | % | |||||
Services |
9,963 | 20,474 | 10,511 | 105.5 | % | ||||||||
Total cost of revenue |
$ | 93,741 | $ | 114,751 | $ | 21,010 | 22.4 | % | |||||
Gross profit (loss) |
|||||||||||||
Product |
$ | (7,259 | ) | $ | (20,451 | ) | $ | (13,192 | ) | 181.7 | % | ||
Services |
4,567 | 3,012 | (1,555 | ) | -34.0 | % | |||||||
Total gross profit (loss) |
$ | (2,692 | ) | $ | (17,439 | ) | $ | (14,747 | ) | 547.8 | % | ||
Cost of Product Revenue. The increase in cost of product revenue was primarily due to an unfavorable change in the mix of products sold in the year ended December 31, 2010 which included a higher ratio of prismatic cell products to cylindrical cell products, as compared to the year ended December 31, 2009. In addition, due to low factory utilization, unabsorbed manufacturing expenses
72
were $21.7 million for the year ended December 31, 2009, compared to $20.6 million for the year ended December 31, 2010.
Cost of Services Revenues. The increase in costs of services revenue resulted from the increase in services revenues in addition to the mix of government and non-government contracts for the year ended December 31, 2010 as compared to the year ended December 31, 2009.
Product Gross Profit (Loss). We experienced a product gross loss during the year ended December 31, 2010, primarily due to low factory utilization. Our future gross profit will be affected by numerous factors, including the build-out of our manufacturing capacity, the timing of the production of new product designs, and our ability to reduce cell costs. For example, unabsorbed manufacturing expenses were $20.6 million during the year ended December 31, 2010. As a result, our gross profit or loss will vary significantly from period-to period going forward. In addition, gross profit decreased due to an unfavorable change in the mix of products sold in the year ended December 31, 2010 as the year ended December 31, 2010 included a higher ratio of prismatic cell products to cylindrical cell products, as compared to the year ended December 31, 2009.
Services Gross Profit. Services gross profit decreased due to the mix of government and non-government contracts in the year ended December 31, 2010, as the year ended December 31, 2009 included a greater percentage of higher margin contracts.
Operating Expenses
| |
Year Ended December 31, | |
|
||||||||||
|---|---|---|---|---|---|---|---|---|---|---|---|---|---|
| |
2009 | 2010 | $ Change | % Change | |||||||||
| |
(Dollars in thousands) |
||||||||||||
Operating expenses |
|||||||||||||
Research, development and engineering |
$ | 48,286 | $ | 60,723 | $ | 12,437 | 25.8 | % | |||||
Sales and marketing |
8,455 | 14,111 | 5,656 | 66.9 | % | ||||||||
General and administrative |
24,480 | 36,053 | 11,573 | 47.3 | % | ||||||||
Production start-up |
1,524 | 21,064 | 19,540 | N/M | |||||||||
Total operating expenses |
$ | 82,745 | $ | 131,951 | $ | 49,206 | 59.5 | % | |||||
Research, Development and Engineering Expenses. A portion of research, development and engineering expenses was offset by cost-sharing funding. Our research, development and engineering expenditures are summarized as follows:
| |
Year Ended December 31, | |
|
||||||||||
|---|---|---|---|---|---|---|---|---|---|---|---|---|---|
| |
2009 | 2010 | $ Change | % Change | |||||||||
| |
(Dollars in thousands) |
||||||||||||
Research, development and engineering expenses |
|||||||||||||
Aggregated research, development and engineering expenditures |
$ | 51,050 | $ | 65,666 | $ | 14,616 | 28.6 | % | |||||
Research, development and engineering reimbursements |
(2,764 | ) | (4,943 | ) | (2,179 | ) | 78.8 | % | |||||
Research, development and engineering expenses |
$ | 48,286 | $ | 60,723 | $ | 12,437 | 25.8 | % | |||||
73
The increase in research, development and engineering expenses for the year ended December 31, 2010 compared to the year ended December 31, 2009 was primarily attributable to an increase of $13.5 million in personnel-related expenses associated with an increase in research, development and engineering personnel who primarily focus on process improvement, material science chemistry and battery and battery systems technology and an increase of $1.1 million in other research, development and engineering costs. This increase was partially offset by an increase in research, development and engineering reimbursements of $2.2 million. Research, development and engineering expense was 53% of revenue for the year ended December 31, 2009, compared to 62% for the year ended December 31, 2010.
Sales and Marketing Expenses. The increase in sales and marketing expenses for the year ended December 31, 2010 compared to the year ended December 31, 2009 was primarily attributable to an increase of $4.2 million in personnel-related expenses associated with an increase in sales and marketing headcount, in addition to an increase in marketing expenses related to trade shows, public relations, advertising, and other sales and marketing related expenses of $1.5 million. Sales and marketing expense was 9% of revenue for the year ended December 31, 2009, compared to 15% for the year ended December 31, 2010.
General and Administrative Expenses. The increase in general and administrative expenses for the year ended December 31, 2010 compared to the year ended December 31, 2009 was primarily due to an increase in personnel-related expenses of $5.8 million, associated with an increase in general and administrative headcount, an increase in legal expenses of $1.7 million and an increase in other general and administrative expenses of $4.1 million. General and administrative expense was 27% of revenue for the year ended December 31, 2009, compared to 37% for the year ended December 31, 2010.
Production Start-up Expenses. A portion of production start-up expenses was offset primarily by government grant funding. Our production start-up expenditures are summarized as follows:
| |
Year Ended December 31, | |
|
||||||||
|---|---|---|---|---|---|---|---|---|---|---|---|
| |
2009 | 2010 | $ Change | % Change | |||||||
| |
(Dollars in thousands) |
||||||||||
Production start-up expenditures |
|||||||||||
Aggregated production start-up expenditures |
$ | 1,524 | $ | 26,685 | $ | 25,161 | N/M | ||||
Production start-up reimbursements |
— | (5,621 | ) | (5,621 | ) | 100.0% | |||||
Production start-up expenses |
$ | 1,524 | $ | 21,064 | $ | 19,540 | N/M | ||||
The increase in production start-up expenses for the year ended December 31, 2010 compared to the year ended December 31, 2009 was primarily due to increased production start-up expenses related to our manufacturing expansion at our Livonia and Romulus, Michigan facilities. In addition, during the year ended December 31, 2010, we incurred $12.7 million of production start-up expenses related to materials, labor and overhead costs incurred in the qualification of the prismatic cell production line. This increase was partially offset by cost offsets from government grant funding totaling $5.6 million. There was no offset to production start-up expenses during the year ended December 31, 2009.
74
Other Income (Expense), Net
| |
Year Ended December 31, | |
|
||||||||||
|---|---|---|---|---|---|---|---|---|---|---|---|---|---|
| |
2009 | 2010 | $ Change | % Change | |||||||||
| |
(Dollars in thousands) |
||||||||||||
Other income (expense), net |
|||||||||||||
Interest income |
$ | 165 | $ | 135 | $ | (30 | ) | -18.2 | % | ||||
Interest expense |
(1,206 | ) | (1,430 | ) | (224 | ) | -18.6 | % | |||||
Gain (loss) on foreign exchange |
682 | (560 | ) | (1,242 | ) | 182.1 | % | ||||||
Unrealized loss on preferred stock warrant liability |
(515 | ) | — | 515 | -100.0 | % | |||||||
Other income |
— | (849 | ) | (849 | ) | 100.0 | % | ||||||
Total other expense, net |
$ | (874 | ) | $ | (2,704 | ) | $ | (1,830 | ) | 209.4 | % | ||
The change in interest expense for the year ended December 31, 2010 was due to an increase in total debt and capital lease balances outstanding. The decrease in net foreign exchange gains for the year ended December 31, 2010 is due to the effect of currency exchange rate changes, in particular changes in the U.S. Dollar—Korean Won exchange rate. The decrease in unrealized loss on preferred stock warrant liability was due to the conversion of the preferred stock warrants to common stock warrants in connection with our IPO. Other income is due to losses recognized on our Chinese joint venture and our investment in 24M Technologies, Inc., or 24M, a privately-held company, both accounted for under the equity method. These losses are partially offset by a gain on long-term investment due to the excess of the fair value of the ownership 24M, over the carrying value of the patents transferred to 24M.
Provision for Income Taxes. The provision for income taxes for the years ended December 31, 2009 and 2010 was primarily related to foreign and state income taxes. We did not report a benefit for federal income taxes in the consolidated financial statements as the deferred tax asset generated from our net operating loss has been offset by a full valuation allowance because it is more likely than not that the tax benefits of the net operating loss carry forward may not be realized.
Years Ended December 31, 2008 and 2009
Revenue
| |
Year Ended December 31, | |
|
|||||||||||
|---|---|---|---|---|---|---|---|---|---|---|---|---|---|---|
| |
2008 | 2009 | $ Change | % Change | ||||||||||
| |
(Dollars in thousands) |
|||||||||||||
Revenue |
||||||||||||||
Product |
||||||||||||||
Transportation |
$ | 9,862 | $ | 45,298 | $ | 35,436 | 359.3 | % | ||||||
Commercial |
40,752 | 20,141 | (20,611 | ) | -50.6 | % | ||||||||
Electric grid |
2,900 | 11,080 | 8,180 | 282.1 | % | |||||||||
Total Product |
53,514 | 76,519 | 23,005 | 43.0 | % | |||||||||
Services |
15,011 | 14,530 | (481 | ) | -3.2 | % | ||||||||
Total revenue |
$ | 68,525 | $ | 91,049 | $ | 22,524 | 32.9 | % | ||||||
Product Revenue. The increase in product revenue was primarily due to an increase in sales to customers in the transportation industry of $35.4 million and in the electric grid industry of
75
$8.2 million. These increases were partially offset by a decrease of $17.5 million in sales to Black & Decker and its affiliates and a decrease of $6.0 million related to the decline in demand for our radio controlled products. Sales to other commercial customers increased by $2.9 million.
Services Revenue. Revenue related to government agency research contracts increased by $2.5 million, and revenue related to commercial projects decreased by $3.0 million. The increase in government agency research contract revenue was due to new project awards. The decrease in revenue from commercial projects was due to the timing of project milestones and revenue recognition on active projects.
Cost of Revenue and Gross Profit (Loss)
| |
Year Ended December 31, | |
|
||||||||||
|---|---|---|---|---|---|---|---|---|---|---|---|---|---|
| |
2008 | 2009 | $ Change | % Change | |||||||||
| |
(Dollars in thousands) |
||||||||||||
Cost of revenue |
|||||||||||||
Product |
$ | 70,474 | $ | 83,778 | $ | 13,304 | 18.9 | % | |||||
Services |
10,295 | 9,963 | (332 | ) | -3.2 | % | |||||||
Total cost of revenue |
$ | 80,769 | $ | 93,741 | $ | 12,972 | 16.1 | % | |||||
Gross profit (loss) |
|||||||||||||
Product |
$ | (16,960 | ) | $ | (7,259 | ) | $ | 9,701 | -57.2 | % | |||
Services |
4,716 | 4,567 | (149 | ) | -3.2 | % | |||||||
Total gross loss |
$ | (12,244 | ) | $ | (2,692 | ) | $ | 9,552 | -78.0 | % | |||
Cost of Product Revenue. The increase in cost of product revenue was primarily due to the increase in product revenue.
Cost of Services Revenues. The decrease in costs of services revenue resulted from the decrease in research and development services revenues.
Product Gross Profit (Loss). We experienced a product gross loss during the year ended December 31, 2009, primarily due to low factory utilization. Our future gross profit will be affected by numerous factors, including the build-out of our manufacturing capacity and the timing of the production of new product designs. For example, unabsorbed manufacturing expenses were $21.7 million during the year ended December 31, 2009. As a result, our gross profit or loss will vary significantly from period-to period going forward.
Services Profit. Services gross profit decreased due to the decrease in services revenue and the timing of project milestones.
76
Operating Expenses
| |
Year Ended December 31, |
|
|
||||||||||
|---|---|---|---|---|---|---|---|---|---|---|---|---|---|
| |
2008 | 2009 | $ Change | % Change | |||||||||
| |
(Dollars in thousands) |
||||||||||||
Operating expenses |
|||||||||||||
Research, development and engineering |
$ | 36,953 | $ | 48,286 | $ | 11,333 | 30.7 | % | |||||
Sales and marketing |
8,851 | 8,455 | (396 | ) | -4.5 | % | |||||||
General and administrative |
21,544 | 24,480 | 2,936 | 13.6 | % | ||||||||
Production start-up |
— | 1,524 | 1,524 | 100.0 | % | ||||||||
Total operating expenses |
$ | 67,348 | $ | 82,745 | $ | 15,397 | 22.9 | % | |||||
Research and Development Expenses. A portion of research and development expenses was offset by cost-sharing funding. Our research and development expenditures are summarized as follows:
| |
Year Ended December 31, | |
|
||||||||||
|---|---|---|---|---|---|---|---|---|---|---|---|---|---|
| |
2008 | 2009 | $ Change | % Change | |||||||||
| |
(Dollars in thousands) |
||||||||||||
Research, development and engineering expenses |
|||||||||||||
Aggregated research, development and engineering expenditures |
$ | 41,778 | $ | 51,050 | $ | 9,272 | 22.2 | % | |||||
Research, development and engineering reimbursements |
(4,825 | ) | (2,764 | ) | 2,061 | -42.7 | % | ||||||
Research, development and engineering expenses |
$ | 36,953 | $ | 48,286 | $ | 11,333 | 30.7 | % | |||||
The increase in research, development and engineering expenses for the year ended December 31, 2009 compared to the year ended December 31, 2008 was primarily attributable to an increase of $4.4 million in personnel-related expenses associated with an increase in research and development personnel who primarily focus on manufacturing process alternatives, material science chemistry and battery and battery systems technology, in addition to an increase in general product development and other research and development expenses of $6.9 million. Research, development and engineering expense as a percentage of revenue was 54% in the year ended December 31, 2008, compared to 53% in the year ended December 31, 2009.
Sales and Marketing Expenses. The decrease in sales and marketing expenses for the year ended December 31, 2009 compared to the year ended December 31, 2008 was primarily attributable to a decrease of $1.1 million in amortization of intangible assets primarily related to an asset impairment charge taken in the year ended December 31, 2008 and a decrease of $0.2 million in other sales and marketing expenses. These amounts were partially offset by an increase of $0.9 million in personnel-related expenses associated with an increase in sales and marketing personnel. Sales and marketing expense was 13% of revenue for the year ended December 31, 2008, compared to 9% for the year ended December 31, 2009.
General and Administrative Expenses. The increase in general and administrative expenses for the year ended December 31, 2009 compared to the year ended December 31, 2008 was primarily due to an increase in professional fees of $4.5 million and personnel-related expenses of $3.2 million. Professional fees were higher compared to the year ended December 31, 2008 primarily due to legal and consulting fees associated with the application process of the Department of Energy's ATVM loan
77
and grant programs. These amounts were partially offset by a decrease due to a $1.3 million payment related to a termination agreement with a customer which is included in the year ended December 2008 and a decrease in other general and administrative expenses of $3.5 million. General and administrative expense was 31% of revenue for the year ended December 31, 2008, compared to 27% for the year ended December 31, 2009.
Production Start-up Expenses. Production start-up expenses for the year ended December 31, 2009 related to our manufacturing expansion at our Livonia and Romulus, Michigan facilities. There were no production start-up expenses recorded during the year ended December 31, 2008. Production start-up expense was 2% of revenue for the year ended December 31, 2009.
Other Income (Expense), Net
| |
Year Ended December 31, | |
|
||||||||||
|---|---|---|---|---|---|---|---|---|---|---|---|---|---|
| |
2008 | 2009 | $ Change | % Change | |||||||||
| |
(Dollars in thousands) |
||||||||||||
Other income (expense), net |
|||||||||||||
Interest income |
$ | 1,258 | $ | 165 | $ | (1,093 | ) | -86.9 | % | ||||
Interest expense |
(812 | ) | (1,206 | ) | (394 | ) | -48.5 | % | |||||
Gain (loss) on foreign exchange |
(724 | ) | 682 | 1,406 | -194.2 | % | |||||||
Unrealized loss on preferred stock warrant liability |
(286 | ) | (515 | ) | (229 | ) | 80.1 | % | |||||
Total other expense, net |
$ | (564 | ) | $ | (874 | ) | $ | (310 | ) | 55.0 | % | ||
The decrease in interest income for the year ended December 31, 2009 was primarily due to lower prevailing interest rates combined with a greater use of money market funds to limit our exposure to loss and to preserve principle. The increase in interest expense was primarily due to the total debt outstanding and additional borrowings which occurred between December 31, 2008 and December 31, 2009. The increase in net foreign exchange gains for the year ended December 31, 2009 is due to the effect of currency exchange rate changes on transactions that are non U.S. Dollar denominated and charged or credited to earnings, particularly the favorable change in Korean Won to U.S. Dollar foreign exchange rates. The increase in unrealized loss on preferred stock warrant liability was due to the increase in the fair market value of our stock. As of December 31, 2009, all preferred stock warrants have been converted to common stock warrants and we do not expect any gains or losses on the change in fair value of preferred stock warrants in future periods.
Provision for Income Taxes. The provision for income taxes for the years ended December 31, 2008 and 2009 was primarily related to foreign and state income taxes. We did not report a benefit for federal income taxes in the consolidated financial statements as the deferred tax asset generated from our net operating loss has been offset by a full valuation allowance because it is more likely than not that the tax benefits of the net operating loss carry forward may not be realized.
Liquidity and Capital Resources
Sources of Liquidity
Since inception, we have funded our operations primarily through private placements of preferred stock, common stock, convertible promissory notes, demand notes, term loans, credit facilities and our initial public offering. During the year ended December 31, 2010, we received $100.1 million from government grant proceeds. As of December 31, 2010, we had cash and cash equivalents of $216.8 million and accounts receivable of $28.1 million.
78
The Company's available sources of cash primarily include the cash and cash equivalents and proceeds from government grants. To fund our growth and expansion plans, including anticipated future losses, purchase commitments, and capital expenditures, we will need to raise additional capital in the next twelve months. We make investments in manufacturing capacity up to 15 months prior to the time we need it to meet customer demand and therefore must plan funding accordingly. However, if customer demand exceeds our current plans, we may need to raise further capital, beyond current expectations, to achieve our expected growth. We believe that we will be able to raise the capital necessary to implement our current expansion plans in 2011. However, if we are unable to raise additional capital, our growth potential may be adversely affected and we will have to modify our plans. If we were to reduce the pace of implementing our expansion plans, we believe that our available cash and cash equivalents would be sufficient to fund our operations for the next twelve months.
We have also applied for various State and Federal loan and grant programs, as discussed in detail in the Government Initiatives and Contract Research section in Item 1 of this annual report on Form 10-K, including the $249.1 million DOE grant we were awarded to fund the construction of our lithium-ion battery manufacturing facilities in Michigan. We also believe we will be permitted to borrow up to $233 million under the ATVM Program to support this manufacturing expansion. Under the DOE Battery Initiative, we are required to spend up to one dollar of our own funds for every incentive dollar we receive, and we expect we will be required to spend one dollar of our own funds for every four dollars we borrow under the ATVM Program. The timing and the amount of any loan we may receive under the ATVM Program, as well as the specific terms and conditions applicable to any loan we may receive, are currently not known by us, and, once disclosed to us, are subject to change and negotiation with the federal government. Access to these funds could offset some of our future capital needs. The future capital requirements that may be required to support expanded manufacturing capacity, product testing capabilities, and working capital could be significant over the next several years. If we are unable to access additional capital, our growth will be limited due to the inability to invest in additional manufacturing capacity.
Capital Expenditures
Our capital expenditures were $41.4 million in 2008, $39.4 million for 2009 and $177.2 million for 2010. In 2011 and beyond, we expect to use a significant portion of our cash for capital expenditures to increase manufacturing capacity in anticipation of increased demand for our products, including the current expansion of our manufacturing facilities in Michigan.
Cash Flows
The following table sets forth the major sources and uses of cash for each of the periods set forth below (in thousands):
| |
Year Ended December 31, | |||||||||
|---|---|---|---|---|---|---|---|---|---|---|
| |
2008 | 2009 | 2010 | |||||||
Net cash used in operating activities |
$ | (34,945 | ) | $ | (73,559 | ) | $ | (127,835 | ) | |
Net cash used in investing activities |
(41,088 | ) | (41,173 | ) | (122,543 | ) | ||||
Net cash provided by financing activities |
123,018 | 501,436 | 9,893 | |||||||
Effect of foreign exchange rates on cash and cash equivalents |
166 | (92 | ) | 204 | ||||||
Net increase (decrease) in cash and cash equivalents |
$ | 47,151 | $ | 386,612 | $ | (240,281 | ) | |||
79
Cash Flows From Operating Activities
Operating activities used $127.8 million of net cash during the year ended December 31, 2010. We incurred a net loss of $152.9 million in 2010, which included non-cash share-based compensation expense of $11.8 million and depreciation and amortization of $17.0 million. Changes in assets and liabilities used $6.3 million of net cash during the year ended December 31, 2010.
Operating activities used $73.6 million of net cash during the year ended December 31, 2009. We incurred a net loss of $86.6 million in 2009, which included non-cash share-based compensation expense of $8.6 million and depreciation and amortization of $13.2 million. Changes in asset and liability accounts used $9.9 million of net cash during the year ended December 31, 2009.
Operating activities used $34.9 million of net cash during the year ended December 31, 2008. We incurred a net loss of $80.4 million in the 2008, which included non-cash share-based compensation expense of $4.5 million, an impairment of long-lived assets and intangibles of $3.1 million, and depreciation and amortization of $8.2 million. Changes in asset and liability accounts generated $28.2 million of net cash during the year ended December 31, 2008, primarily due to $25.0 million in deferred revenue we received from Gillette.
We anticipate negative cash flow from operations in the near future as we continue to support the anticipated growth of our business.
Cash Flows From Investing Activities
Cash flows from investing activities primarily relate to capital expenditures to support our growth.
Cash used in investing activities totaled $122.5 million during the year ended December 31, 2010 and consisted of capital expenditures of $177.2 million, primarily related to the purchase of manufacturing equipment, proceeds from government grants of $78.2 million, cash paid for investments of $14.9 million and an increase in restricted cash that used $8.6 million of cash.
Cash used in investing activities totaled $41.2 million during the year ended December 31, 2009 and consisted of capital expenditures of $39.4 million primarily related to the purchase of manufacturing equipment and an increase in restricted cash $1.8 million.
Cash used in investing activities totaled $41.1 million during the year ended December 31, 2008 and consisted of capital expenditures of $41.4 million primarily related to the purchase of manufacturing equipment and an increase in restricted cash used $0.2 million of cash. These expenditures were partially offset by the proceeds from disposal of equipment totaling $0.5 million.
We anticipate additional capital expenditure in future periods as we continue to fund the expansion of our facilities to support the anticipated growth of our business. As of December 31, 2010, we have contractual obligations, which include agreements or purchase orders to purchase goods, related to capital expenditure purchases of $44.6 million, of which, $14.3 million is anticipated to be reimbursed under government grant programs within the next twelve months. Additionally, in future periods, we anticipate investing cash in joint ventures and other equity investments in order to establish strategic relationships.
Cash Flows From Financing Activities
Cash flows from financing activities totaled $9.9 million during the year ended December 31, 2010 and included proceeds from government grants of $9.8 million, proceeds from exercise of stock options of $4.3 million, proceeds from issuance of long-term debt of $2.5 million and contribution from noncontrolling interests of $0.5 million. These proceeds were partially offset by repayments on long-term debt of $6.5 million, and repayments on capital lease obligations of $0.7 million. In future
80
periods, we expect financing activities such as proceeds from grants, equity offerings and debt issuances to be a significant source of cash.
Cash flows from financing activities totaled $501.4 million during the year ended December 31, 2009 and included net proceeds from the initial public issuance of common stock of $395.8 million, proceeds of $99.6 million from the issuance of series F redeemable convertible preferred stock, proceeds from government grants of $3.9 million, proceeds from issuance of long-term debt of $8.6 million and proceeds from exercise of stock options of $0.4 million. These proceeds were partially offset by repayments on long-term debt of $6.2 million, and repayments on capital lease obligations of $0.7 million.
Cash flows from financing activities totaled $123.0 million during the year ended December 31, 2008 and included proceeds of $102.0 million from the issuance of series E convertible preferred stock, $11.5 million from the issuance of redeemable common stock, proceeds of $5.0 million from the issuance of common stock, $9.1 million in proceeds from the issuance of long-term debt and $4.3 million from advances under credit lines. These proceeds were partially offset by repayments on long-term debt of $4.0 million and deferred offering costs of $3.8 million.
Credit Facilities
As of December 31, 2010, the following credit facilities were outstanding:
Lender
|
Date | Type of Facility | Interest Rate (per annum) |
Principal Amount |
Amount Outstanding |
Maturity Date |
|||||||||
|---|---|---|---|---|---|---|---|---|---|---|---|---|---|---|---|
| |
|
|
|
(In Thousands) |
|
||||||||||
Silicon Valley Bank |
Sep-08 | Term Loan | Prime +0.75% | 7,500 | 2,917 | Jan-12 | |||||||||
Silicon Valley Bank |
Apr-09 | Term Loan | Prime +0.75% | 2,500 | 1,319 | Jul-12 | |||||||||
Silicon Valley Bank |
May-09 | Term Loan | Prime +0.75% | 3,000 | 1,667 | Aug-12 | |||||||||
Silicon Valley Bank |
Jun-09 | Term Loan | Prime +0.75% | 1,000 | 583 | Sep-12 | |||||||||
Silicon Valley Bank |
Aug-09 | Term Loan | Prime +0.75% | 1,000 | 583 | Aug-12 | |||||||||
Silicon Valley Bank |
Sep-08 | Operating Line of Credit | Prime | 8,000 | 8,000 | Mar-11 | |||||||||
Massachusetts Clean Energy Technology Center |
Oct-10 | Forgivable Loan | 6% | 5,000 | 5,000 | * | Oct-17 | ||||||||
Korean Government |
Various | Refundable Grant | 0% | 447 | 335 | Milestone-based | |||||||||
Small Business Corporation |
Aug-06 | Term Loan | Variable | 156 | 44 | Aug-11 | |||||||||
- *
- The forgivable loan from the Massachusetts Clean Energy Technology Center is forgivable upon meeting certain capital expenditure and employment targets. As of December 31, 2010, $2.5 million of the loan is recorded as an offset to property, plant and equipment as it is reasonably assured that we will comply with the conditions for the forgiveness of the $2.5 million related to the capital expenditure target.
Contractual Obligations
Our contractual obligations relate primarily to borrowings under long-term debt obligations, capital leases, operating leases, and purchase obligations which include agreements or purchase orders to purchase goods or services that are enforceable and legally binding.
81
The following is a summary of our contractual obligations as of December 31, 2010:
| |
|
Payments Due in | ||||||||||||||
|---|---|---|---|---|---|---|---|---|---|---|---|---|---|---|---|---|
| |
Total | Less than 1 Year |
1-3 Years | 3-5 Years | More than 5 Years |
|||||||||||
| |
(in thousands) |
|||||||||||||||
Long-term debt, including current portion |
$ | 9,982 | $ | 5,379 | $ | 2,069 | $ | — | $ | 2,534 | ||||||
Interest related to debt payments(1) |
1,529 | 230 | 32 | — | 1,267 | |||||||||||
Capital lease obligations |
20,226 | 1,571 | 3,054 | 3,065 | 12,536 | |||||||||||
Operating lease obligations |
28,869 | 4,617 | 6,601 | 6,506 | 11,145 | |||||||||||
Purchase obligations(2) |
133,714 | 96,714 | 37,000 | — | — | |||||||||||
|
$ | 194,320 | $ | 108,511 | $ | 48,756 | $ | 9,571 | $ | 27,482 | ||||||
- (1)
- Interest
related to debt payments is based on the Silicon Valley Bank prime rate as of December 31, 2010, of 4.00%. The prime rate may fluctuate in
future periods and may impact our interest payment obligations.
- (2)
- Purchase obligations include agreements or purchase orders to purchase goods or services that are enforceable and legally binding and specify all significant terms. Purchase obligations exclude agreements that are cancelable without penalty. Obligations related to capital expenditures may partially reimbursable under out various government grants.
In addition, as discussed in Note 12 to our consolidated financial statements, we have approximately $0.7 million associated with uncertain tax positions and related interest and penalties. These liabilities are included as a component of "other long-term liabilities" in our consolidated balance sheet, as we do not anticipate that settlement of the liabilities will require payment of cash within the next twelve months. We are not able to reasonably estimate when we would make any cash payments required to settle these liabilities, but do not believe that the ultimate settlement of our obligations will materially affect our liquidity. Additionally, we have a line of credit with an outstanding balance of $8.0 million as of December 31, 2010.
Off-Balance Sheet Arrangements
In June 2010, we entered into a supply agreement under which we committed to minimum purchase volumes for each of the years ending December 31, 2010 through December 31, 2013 for a raw material component. If our purchase volumes during any year fail to meet the minimum purchase commitments, we are required to pay the seller a variance payment for the difference between the amount actually purchased in that calendar year and the annual minimum purchase commitment for that calendar year. We will receive a credit for the amount of the variance payment to be applied to purchases in the following year and we will have until April 1, 2015 to reclaim any variance payment resulting from the minimum purchase commitments for calendar years 2012 or 2013. The table shown above in the section titled "Purchase Obligations" shows the amount of our purchase commitments payable by year inclusive of our commitment under the supply agreement described above. For the year ended December 31, 2010, we have purchased $4.8 million under this supply agreement.
During the periods presented, we did not have and do not currently have, any off-balance sheet arrangements, as defined under SEC rules, such as relationships with unconsolidated entities or financial partnerships, which are often referred to as structured finance or special purpose entities, established for the purpose of facilitating financing transactions that are not required to be reflected on our balance sheet, other than the arrangement described above.
82
Item 7A. Quantitative and Qualitative Disclosures about Market Risk
Foreign Currency Exchange Risk. As a result of our foreign operations, we have significant expenses, assets and liabilities that are denominated in foreign currencies. A significant number of our employees are located in Asia. Therefore, a substantial portion of our payroll as well as certain other operating expenses are paid in the China RMB and South Korean Won. Additionally, we purchase materials and components from suppliers in Asia. While we pay these suppliers in U.S. dollars, their costs are typically based upon the local currency of the country in which they operate. All of our revenues are received in U.S. dollars because our customer contracts generally provide that our customers will pay us in U.S. dollars.
As a consequence, our gross profit, operating results, profitability and cash flows are adversely impacted when the dollar depreciates relative to other foreign currencies. We have a particularly significant currency rate exposure to changes in the exchange rate between the RMB and South Korean Won to the U.S. dollar. For example, to the extent that we need to convert U.S. dollars for our operations, appreciation of the RMB or South Korean Won against the U.S. dollar would have an adverse effect on the amount we receive from the conversion.
We have not used any forward contracts or currency borrowings to hedge our exposure to foreign currency exchange risk.
Interest Rate Sensitivity. We had cash and cash equivalents totaling $216.8 million as of December 31, 2010, and $457.1 million as of December 31, 2009. Our exposure to interest rate risk primarily relates to the interest income generated by excess cash invested in highly liquid investments with maturities of three months or less from the original dates of purchase. The cash and cash equivalents are held for working capital purposes. We have not used derivative financial instruments in our investment portfolio. We have not been exposed, nor do we anticipate being exposed, to material risks due to changes in market interest rates. Declines in interest rates, however, will reduce future investment income. If overall interest rates had declined by up to 100 basis points during the years ended December 31, 2009 and 2010, our interest income would have decreased by approximately $0.2 million and $0.1 million, respectively, assuming consistent investment levels.
Interest rate risk also refers to our exposure to movements in interest rates associated with our interest bearing liabilities. The interest bearing liabilities are denominated in U.S. dollars and the interest expense is based on the prime interest rate plus an additional margin, depending on the respective lending institutions. If the prime rate had increased by 100 basis points during the years ended December 31, 2009 and 2010, our interest expense would have increased by approximately $0.2 million each period, assuming consistent borrowing levels.
83
Item 8. Financial Statements and Supplementary Data.
A123 Systems, Inc.
Index to Consolidated Financial Statements
84
REPORT OF INDEPENDENT REGISTERED PUBLIC ACCOUNTING FIRM
To
the Board of Directors and Stockholders of
A123 Systems, Inc.
Watertown, Massachusetts
We have audited the accompanying consolidated balance sheets of A123 Systems, Inc. and subsidiaries (the "Company") as of December 31, 2009 and 2010, and the related consolidated statements of operations, stockholders' (deficit) equity, and cash flows for each of the three years in the period ended December 31, 2010. These financial statements are the responsibility of the Company's management. Our responsibility is to express an opinion on these financial statements based on our audits.
We conducted our audits in accordance with the standards of the Public Company Accounting Oversight Board (United States). Those standards require that we plan and perform the audit to obtain reasonable assurance about whether the financial statements are free of material misstatement. An audit includes examining, on a test basis, evidence supporting the amounts and disclosures in the financial statements. An audit also includes accessing the accounting principles used and significant estimates made by management, as well as evaluating the overall financial statement presentation. We believe that our audits provide a reasonable basis for our opinion.
In our opinion, such consolidated financial statements present fairly, in all material respects, the financial position of A123 Systems, Inc. and subsidiaries as of December 31, 2009 and 2010, and the results of their operations and their cash flows for each of the three years in the period ended December 31, 2010, in conformity with accounting principles generally accepted in the United States of America.
We have also audited, in accordance with the standards of the Public Company Accounting Oversight Board (United States), the Company's internal control over financial reporting as of December 31, 2010, based on the criteria established in Internal Control—Integrated Framework issued by the Committee of Sponsoring Organizations of the Treadway Commission and our report dated March 11, 2011 expressed an adverse opinion on the Company's internal control over financial reporting because of a material weakness.
/s/ Deloitte & Touche LLP
Boston,
Massachusetts
March 11, 2011
85
A123 Systems, Inc.
Consolidated Balance Sheets
(in thousands, except share and per share data)
| |
December 31, 2009 |
December 31, 2010 |
|||||||
|---|---|---|---|---|---|---|---|---|---|
ASSETS |
|||||||||
Current assets: |
|||||||||
Cash and cash equivalents |
$ | 457,122 | $ | 216,841 | |||||
Restricted cash and cash equivalents |
1,742 | 9,367 | |||||||
Accounts receivable, net |
17,718 | 28,106 | |||||||
Inventory |
37,438 | 48,787 | |||||||
Prepaid expenses and other current assets |
8,895 | 8,006 | |||||||
Total current assets |
522,915 | 311,107 | |||||||
Property, plant and equipment, net |
71,662 |
143,998 |
|||||||
Goodwill |
9,581 | 9,581 | |||||||
Intangible assets, net |
1,254 | 413 | |||||||
Long-term grant receivable |
— | 75,790 | |||||||
Deposits and other assets |
11,698 | 11,768 | |||||||
Restricted cash and cash equivalents, net of current portion |
980 | 1,993 | |||||||
Investments |
— | 21,508 | |||||||
Total assets |
$ | 618,090 | $ | 576,158 | |||||
LIABILITIES AND STOCKHOLDERS' EQUITY |
|||||||||
Current liabilities: |
|||||||||
Revolving credit lines |
$ | 8,000 | $ | 8,000 | |||||
Current portion of long-term debt |
6,456 | 5,379 | |||||||
Current portion of capital lease obligations |
411 | 1,571 | |||||||
Accounts payable |
16,475 | 43,523 | |||||||
Accrued expenses |
11,689 | 48,179 | |||||||
Other current liabilities |
1,859 | 1,322 | |||||||
Deferred revenue |
7,543 | 11,109 | |||||||
Deferred rent |
58 | 132 | |||||||
Total current liabilities |
52,491 | 119,215 | |||||||
Long-term debt, net of current portion |
7,438 |
4,603 |
|||||||
Capital lease obligations, net of current portion |
193 | 18,655 | |||||||
Deferred revenue, net of current portion |
26,142 | 29,836 | |||||||
Deferred rent, net of current portion |
630 | 1,452 | |||||||
Other long-term liabilities |
2,866 | 3,865 | |||||||
Total liabilities |
89,760 | 177,626 | |||||||
Commitments and contingencies (Note 10) |
|||||||||
Stockholders' equity: |
|||||||||
Preferred stock, $0.001 par value—5,000,000 shares authorized; 0 shares issued and outstanding at December 31, 2009 and 2010 |
— | — | |||||||
Common stock, $0.001 par value—250,000,000 shares authorized; 102,606,088 and 105,194,073 shares issued and outstanding at December 31, 2009 and 2010, respectively |
103 | 105 | |||||||
Additional paid-in capital |
767,694 | 790,256 | |||||||
Accumulated deficit |
(238,668 | ) | (391,228 | ) | |||||
Accumulated other comprehensive loss |
(909 | ) | (935 | ) | |||||
Total A123 Systems, Inc. stockholders' equity |
528,220 | 398,198 | |||||||
Noncontrolling interest |
110 | 334 | |||||||
Total stockholders' equity |
528,330 | 398,532 | |||||||
Total liabilities and stockholders' equity |
$ | 618,090 | $ | 576,158 | |||||
See notes to consolidated financial statements.
86
A123 Systems, Inc.
Consolidated Statements of Operations
(in thousands, except per share data)
| |
Year Ended December 31, | |||||||||||
|---|---|---|---|---|---|---|---|---|---|---|---|---|
| |
2008 | 2009 | 2010 | |||||||||
Revenue: |
||||||||||||
Product |
$ | 53,514 | $ | 76,519 | $ | 73,826 | ||||||
Services |
15,011 | 14,530 | 23,486 | |||||||||
Total revenue |
68,525 | 91,049 | 97,312 | |||||||||
Cost of revenue: |
||||||||||||
Product |
70,474 | 83,778 | 94,277 | |||||||||
Services |
10,295 | 9,963 | 20,474 | |||||||||
Total cost of revenue |
80,769 | 93,741 | 114,751 | |||||||||
Gross loss |
(12,244 | ) | (2,692 | ) | (17,439 | ) | ||||||
Operating expenses: |
||||||||||||
Research, development and engineering |
36,953 | 48,286 | 60,723 | |||||||||
Sales and marketing |
8,851 | 8,455 | 14,111 | |||||||||
General and administrative |
21,544 | 24,480 | 36,053 | |||||||||
Production start-up |
— | 1,524 | 21,064 | |||||||||
Total operating expenses |
67,348 | 82,745 | 131,951 | |||||||||
Operating loss |
(79,592 | ) | (85,437 | ) | (149,390 | ) | ||||||
Other income (expense): |
||||||||||||
Interest income |
1,258 | 165 | 135 | |||||||||
Interest expense |
(812 | ) | (1,206 | ) | (1,430 | ) | ||||||
Gain (loss) on foreign exchange |
(724 | ) | 682 | (560 | ) | |||||||
Unrealized loss on preferred stock warrant liability |
(286 | ) | (515 | ) | — | |||||||
Other income |
— | — | (849 | ) | ||||||||
Other expense, net |
(564 | ) | (874 | ) | (2,704 | ) | ||||||
Loss from operations, before tax |
(80,156 | ) | (86,311 | ) | (152,094 | ) | ||||||
Provision for income taxes |
275 | 278 | 843 | |||||||||
Net loss |
(80,431 | ) | (86,589 | ) | (152,937 | ) | ||||||
Less: Net (income) loss attributable to the noncontrolling interest |
(39 | ) | 810 | 377 | ||||||||
Net loss attributable to A123 Systems, Inc. |
(80,470 | ) | (85,779 | ) | (152,560 | ) | ||||||
Accretion to preferred stock |
(42 | ) | (45 | ) | — | |||||||
Net loss attributable to A123 Systems, Inc. common stockholders |
$ | (80,512 | ) | $ | (85,824 | ) | $ | (152,560 | ) | |||
Net loss per share attributable to common stockholders—basic and diluted: |
$ | (9.04 | ) | $ | (2.55 | ) | $ | (1.46 | ) | |||
Weighted average number of common shares outstanding—basic and diluted |
8,904 | 33,669 | 104,364 | |||||||||
See notes to consolidated financial statements.
87
Consolidated Statements of Stockholders' (Deficit) Equity
(in thousands, except per share data)
| |
Series B-1 Convertible Preferred Stock, $0.001 Par Value |
|
|
|
|
|
|
|
|
|||||||||||||||||||||||
|---|---|---|---|---|---|---|---|---|---|---|---|---|---|---|---|---|---|---|---|---|---|---|---|---|---|---|---|---|---|---|---|---|
| |
Common Stock, $0.001 Par Value |
|
|
|
|
|
|
|||||||||||||||||||||||||
| |
|
|
Accumulated Other Comprehensive Loss |
Total Stockholders' (Deficit) Equity |
|
|
||||||||||||||||||||||||||
| |
Additional Paid-in Capital |
Accumulated Deficit |
Noncontrolling Interest |
Comprehensive Loss |
||||||||||||||||||||||||||||
| |
Shares | Amount | Shares | Amount | ||||||||||||||||||||||||||||
BALANCE—January 1, 2008 |
1,493 | $ | 1 | 6,587 | $ | 6 | $ | 9,681 | $ | (72,419 | ) | $ | 128 | $ | (62,603 | ) | $ | 997 | ||||||||||||||
Accretion of redeemable convertible preferred stock to redemption value |
— | — | — | — | (42 | ) | — | — | (42 | ) | — | |||||||||||||||||||||
Stock-based compensation |
— | — | — | — | 4,508 | — | — | 4,508 | — | |||||||||||||||||||||||
Issuance of common stock |
— | — | 1,075 | 2 | 5,136 | — | — | 5,138 | — | |||||||||||||||||||||||
Issuance of common stock warrant |
— | — | — | — | 366 | — | — | 366 | — | |||||||||||||||||||||||
Comprehensive loss: |
||||||||||||||||||||||||||||||||
Net loss |
— | — | — | — | — | (80,470 | ) | — | (80,470 | ) | 39 | $ | (80,431 | ) | ||||||||||||||||||
Foreign currency translation adjustment |
— | — | — | — | — | — | (325 | ) | (325 | ) | (165 | ) | (490 | ) | ||||||||||||||||||
Total comprehensive loss |
— | — | — | — | — | — | — | — | — | $ | (80,921 | ) | ||||||||||||||||||||
BALANCE—December 31, 2008 |
1,493 | $ | 1 | 7,662 | $ | 8 | $ | 19,649 | $ | (152,889 | ) | $ | (197 | ) | $ | (133,428 | ) | $ | 871 | |||||||||||||
Accretion of redeemable convertible preferred stock to redemption value |
— | — | — | — | (45 | ) | — | — | (45 | ) | — | |||||||||||||||||||||
Stock-based compensation |
— | — | — | — | 8,553 | — | — | 8,553 | — | |||||||||||||||||||||||
Exercise of stock options |
— | — | 141 | — | 369 | — | — | 369 | — | |||||||||||||||||||||||
Common stock issued in public offering, net of issuance costs |
— | — | 109 | — | — | — | — | — | — | |||||||||||||||||||||||
Exercise of common stock warrant |
— | — | 31,727 | 32 | 391,742 | — | — | 391,774 | — | |||||||||||||||||||||||
Conversion of redeemable common stock and convertible preferred stock to common stock and conversion of preferred stock warrant to common stock warrant |
(1,493 | ) | (1 | ) | 62,967 | 63 | 347,426 | — | — | 347,488 | — | |||||||||||||||||||||
Comprehensive loss: |
||||||||||||||||||||||||||||||||
Net loss |
— | — | — | — | — | (85,779 | ) | — | (85,779 | ) | (810 | ) | $ | (86,589 | ) | |||||||||||||||||
Foreign currency translation adjustment |
— | — | — | — | — | — | (712 | ) | (712 | ) | 49 | (663 | ) | |||||||||||||||||||
Total comprehensive loss |
— | — | — | — | — | — | — | — | — | $ | (87,252 | ) | ||||||||||||||||||||
BALANCE—December 31, 2009 |
— | $ | — | 102,606 | $ | 103 | $ | 767,694 | $ | (238,668 | ) | $ | (909 | ) | $ | 528,220 | $ | 110 | ||||||||||||||
Stock-based compensation |
— | — | — | — | 11,762 | — | — | 11,762 | — | |||||||||||||||||||||||
Exercise of stock options |
— | — | 2,156 | 2 | 4,299 | — | — | 4,301 | — | |||||||||||||||||||||||
Issuance of common stock |
— | — | 432 | — | 6,501 | — | — | 6,501 | — | |||||||||||||||||||||||
Purchase of subsidiary shares by noncontrolling interest holder |
— | — | — | — | — | — | — | — | 532 | |||||||||||||||||||||||
Comprehensive loss: |
||||||||||||||||||||||||||||||||
Net loss |
— | — | — | — | — | (152,560 | ) | — | (152,560 | ) | (377 | ) | $ | (152,937 | ) | |||||||||||||||||
Foreign currency translation adjustment |
— | — | — | — | — | — | (26 | ) | (26 | ) | 69 | 43 | ||||||||||||||||||||
Total comprehensive loss |
— | — | — | — | — | — | — | — | — | $ | (152,894 | ) | ||||||||||||||||||||
BALANCE—December 31, 2010 |
— | $ | — | 105,194 | $ | 105 | $ | 790,256 | $ | (391,228 | ) | $ | (935 | ) | $ | 398,198 | $ | 334 | ||||||||||||||
See notes to consolidated financial statements.
88
A123 Systems, Inc.
Consolidated Statements of Cash Flows
(in thousands)
| |
Year Ended December 31, | |||||||||||||
|---|---|---|---|---|---|---|---|---|---|---|---|---|---|---|
| |
2008 | 2009 | 2010 | |||||||||||
Cash flows from operating activities: |
||||||||||||||
Net loss |
$ | (80,431 | ) | $ | (86,589 | ) | $ | (152,937 | ) | |||||
Adjustments to reconcile net loss to net cash used in operating activities: |
||||||||||||||
Depreciation and amortization |
8,156 | 13,230 | 17,036 | |||||||||||
Noncash rent |
(127 | ) | 506 | 896 | ||||||||||
Noncash foreign exchange (gain) loss on intercompany loan |
1,232 | (883 | ) | (424 | ) | |||||||||
Noncash loss on equity investments |
— | — | 849 | |||||||||||
Impairment of long-lived and intangible assets |
3,097 | 931 | 758 | |||||||||||
Unrealized loss on preferred stock warrant liability |
286 | 515 | — | |||||||||||
Loss on disposal of property and equipment |
20 | 49 | 250 | |||||||||||
Amortization of debt issuance costs and noncash interest expense |
142 | 65 | 306 | |||||||||||
Stock-based compensation |
4,508 | 8,553 | 11,762 | |||||||||||
Changes in current assets and liabilities: |
||||||||||||||
Accounts receivable |
(6,582 | ) | 17 | (9,401 | ) | |||||||||
Inventory |
(15,805 | ) | (1,646 | ) | (11,220 | ) | ||||||||
Prepaid expenses and other assets |
(1,740 | ) | 1,975 | (2,598 | ) | |||||||||
Accounts payable |
11,168 | (4,339 | ) | 9,199 | ||||||||||
Accrued expenses |
8,029 | (474 | ) | 2,568 | ||||||||||
Deferred revenue |
32,899 | (5,487 | ) | 6,283 | ||||||||||
Other liabilities |
203 | 18 | (1,162 | ) | ||||||||||
Net cash used in operating activities |
(34,945 | ) | (73,559 | ) | (127,835 | ) | ||||||||
Cash flows from investing activities: |
||||||||||||||
Increase in restricted cash |
(175 | ) | (1,762 | ) | (8,635 | ) | ||||||||
Purchases of and deposits on property, plant and equipment |
(41,397 | ) | (39,430 | ) | (177,233 | ) | ||||||||
Proceeds from sale of property and equipment |
476 | 19 | — | |||||||||||
Proceeds from government grant |
— | — | 78,187 | |||||||||||
Repayments on notes receivable |
8 | — | — | |||||||||||
Purchase of investments |
— | — | (14,862 | ) | ||||||||||
Net cash used in investing activities |
(41,088 | ) | (41,173 | ) | (122,543 | ) | ||||||||
Cash flows from financing activities: |
||||||||||||||
Net proceeds from initial public offering of common stock and issuance costs |
(3,817 | ) | 395,812 | — | ||||||||||
Proceeds from government grant |
— | 3,900 | 9,750 | |||||||||||
Proceeds from issuance of common stock |
5,001 | — | — | |||||||||||
Proceeds from exercise of stock options |
137 | 369 | 4,301 | |||||||||||
Advances under revolving credit lines |
4,300 | — | — | |||||||||||
Proceeds from issuance of long-term debt |
9,144 | 8,584 | 2,500 | |||||||||||
Payments on long-term debt |
(3,994 | ) | (6,166 | ) | (6,484 | ) | ||||||||
Payments on capital lease obligations |
(1,251 | ) | (653 | ) | (706 | ) | ||||||||
Contributions from noncontrolling interest |
— | — | 532 | |||||||||||
Net proceeds from issuance of redeemable common stock |
11,500 | — | — | |||||||||||
Net proceeds from issuance of redeemable convertible preferred stock |
101,998 | 99,590 | — | |||||||||||
Net cash provided by financing activities |
123,018 | 501,436 | 9,893 | |||||||||||
Effect of foreign exchange rates on cash and cash equivalents |
166 | (92 | ) | 204 | ||||||||||
Net increase (decrease) in cash and cash equivalents |
47,151 | 386,612 | (240,281 | ) | ||||||||||
Cash and cash equivalents at beginning of period |
23,359 | 70,510 | 457,122 | |||||||||||
Cash and cash equivalents at end of period |
$ | 70,510 | $ | 457,122 | $ | 216,841 | ||||||||
Supplemental cash flow information—cash paid for interest |
$ | 586 | $ | 1,189 | $ | 1,033 | ||||||||
Noncash investing and financing activities: |
||||||||||||||
Issuance of a common stock warrant in settlement of a liability |
$ | 366 | $ | — | $ | — | ||||||||
Issuance of note for consulting services |
$ | — | $ | 830 | $ | — | ||||||||
Purchase of equipment under capital leases |
$ | 813 | $ | 572 | $ | 20,022 | ||||||||
Equipment purchases included in accounts payable and accrued expenses |
$ | 762 | $ | 1,939 | $ | 53,257 | ||||||||
Deferred offering costs included in accounts payable and accrued expenses |
$ | 715 | $ | 221 | $ | — | ||||||||
Issuance of common stock for investment |
$ | — | $ | — | $ | 7,495 | ||||||||
Fulfillment of government grants with advance proceeds |
$ | — | $ | — | $ | 12,790 | ||||||||
See notes to consolidated financial statements.
89
A123 Systems, Inc.
Notes to Consolidated Financial Statements
1. Nature of the Business
A123 Systems, Inc. (the "Company") was incorporated in Delaware on October 19, 2001 and has its corporate offices in Watertown, Massachusetts. The Company designs, develops, manufactures and sells advanced rechargeable lithium-ion batteries and battery systems and provides research and development services to government agencies and commercial customers.
Management Plan Note—The Company's available sources of cash primarily include the cash and cash equivalents and proceeds from government grants. To fund the Company's growth and expansion plans, including anticipated future losses, purchase commitments, and capital expenditures, the Company will need to raise additional capital in the next twelve months. The Company makes investments in manufacturing capacity up to fifteen months prior to the time it is needed in order to meet customer demand and therefore must plan funding accordingly. However, if customer demand exceeds current plans, the Company may need to raise further capital, beyond current expectations, to achieve expected growth. The Company believes that it will be able to raise in 2011 the capital necessary to implement its current expansion plans though 2011 and into 2012. However, if it is unable to raise additional capital, the Company's growth potential may be adversely affected and the Company will have to modify its plans. If the Company were to reduce the pace of implementing expansion plans, the Company's management believes that the available cash and cash equivalents would be sufficient to fund operations for the next twelve months.
2. Summary of Significant Accounting Polices
Principles of Consolidation—The accompanying consolidated financial statements include the accounts of the Company and its subsidiaries. All inter-company balances and transactions have been eliminated in consolidation. The Company's investment in a variable interest entity ("VIE"), of which the Company is the primary beneficiary, is consolidated.
Consolidation of Variable Interest Entity—The Company has an equity interest in a joint venture with a quasi governmental entity in the Peoples Republic of China ("PRC"). The jointly-owned enterprise was established under the laws of the PRC to manufacture components of rechargeable batteries. The joint venture enterprise is a VIE with the Company as its primary beneficiary. Accordingly, the Company consolidates the joint venture enterprise and accounts for the portion not owned by the Company as a noncontrolling interest. The total assets of the joint venture enterprise represented less than 1% of the Company's total consolidated assets as of December 31, 2010.
Use of Estimates—The preparation of consolidated financial statements in conformity with accounting principles generally accepted in the United States of America ("GAAP") requires management to make estimates and assumptions that affect the reported amounts of assets, liabilities, revenue, expense and related disclosures. The Company bases estimates and assumptions on historical experience and on various other factors that it believes to be reasonable under the circumstances. The Company evaluates its estimates and assumptions on an ongoing basis. The Company's actual results may differ from these estimates under different assumptions or conditions.
Revisions to Amounts Previously Presented—Certain prior period amounts have been reclassified to conform to the current period presentation. Production start-up expenses for the year ended December 31, 2009, relating to the Company's facility in Livonia, Michigan, have been reclassified from general and administrative expenses to production start-up expenses in the consolidated statements of operations.
90
A123 Systems, Inc.
Notes to Consolidated Financial Statements (Continued)
2. Summary of Significant Accounting Polices (Continued)
Foreign Currency Translation and Remeasurement—The Company's foreign operations are subject to exchange rate fluctuations and foreign currency transaction costs. The majority of the Company's sales are denominated in U.S. dollars. For foreign operations with the local currency as the functional currency, local currency denominated assets and liabilities are translated at the period-end exchange rates, and sales, costs and expenses are translated at the average exchange rates during the period. Gains or losses resulting from foreign currency translation attributable to the Company are included as a component of accumulated other comprehensive loss in the consolidated balance sheets. For foreign operations with the U.S. dollar as the functional currency, foreign currency denominated assets and liabilities are remeasured at the period-end exchange rates and related gains or losses are reflected as other expense in the consolidated statements of operations, except for nonmonetary assets (e.g., inventories, and property, plant, and equipment) and related income statement accounts (e.g., cost of sales and depreciation) which are remeasured at historical exchange rates. During the years ended December 31, 2008, 2009 and 2010, the Company recognized net gains (losses) on foreign exchange of $(0.7) million, $0.7 million, and $(0.6) million, respectively.
Cash and Cash Equivalents—Cash equivalents include short-term, highly-liquid instruments, consisting of money market accounts and short-term investments with original maturities of less than 90 days. The majority of cash and cash equivalents are maintained with major financial institutions in North America. Deposits with these financial institutions may exceed the amount of insurance provided on such deposits; however, these deposits typically may be redeemed upon demand and, therefore, bear minimal risk.
Restricted Cash and Cash Equivalents—Cash and cash equivalent accounts with any type of restriction are classified as restricted cash and cash equivalents. If the restriction is expected to be lifted in more than twelve months or will be used for the purchase of property, plant and equipment, the restricted cash and cash equivalent account is classified as non-current. The Company maintained compensating cash balances for letters of credit as security for facility leases and contracts in the amount of $1.0 million and $10.4 million at December 31, 2009 and 2010, respectively. These letters of credit can be reduced upon the Company attaining certain milestones.
The Company classifies cash received from government grants as restricted cash when the funding is received in advance of using it for qualified expenditures. For the year ended December 31, 2010, the Company received $100.1 million under government grant arrangements, of which $0.8 million remains classified as restricted cash at December 31, 2010.
Government Grants—The Company recognizes government grants when there is reasonable assurance that the Company will comply with the conditions attached to the grant arrangement and the grant will be received. Government grants are recognized in the consolidated statements of operations on a systematic basis over the periods in which the Company recognizes the related costs for which the government grant is intended to compensate. Specifically, when government grants are related to reimbursements for cost of revenues or operating expenses, the government grants are recognized as a reduction of the related expense in the consolidated statements of operations over the period that the grant has conditions and future expenditures associated with the grant. For government grants related to reimbursements of capital expenditures, the government grants are recognized as a reduction of the basis of the asset and recognized in the consolidated statements of operations over the estimated useful life of the depreciable asset as reduced depreciation expense.
91
A123 Systems, Inc.
Notes to Consolidated Financial Statements (Continued)
2. Summary of Significant Accounting Polices (Continued)
The Company records government grant receivables in the consolidated balance sheets in prepaid expenses and other current assets or long-term grant receivable, depending on when the amounts are expected to be received from the government agency. The Company does not discount long-term grant receivables. Proceeds received from government grants prior to expenditures being incurred are recorded as restricted cash and other current liabilities or other long-term liabilities, depending on when the Company expects to use the proceeds.
The Company classifies in the consolidated statements of cash flows grant proceeds received in advance of spending for qualified expenditures as a cash flow from financing activities, as the proceeds are used to assist in funding future expenditures. Grant proceeds received as reimbursements for capital expenditures previously incurred are classified in cash flows from investing activities and grant proceeds received as reimbursements for operating expenditures previously incurred are classified in cash flows from operating activities.
Accounts Receivable and Concentrations of Credit Risks—Accounts receivable are stated net of an allowance for contractual adjustments and uncollectible accounts, which are determined by establishing reserves for specific accounts and consideration of historical and estimated probable losses. The following table sets forth the activity in the allowance for each of the periods set forth below (in thousands):
| |
December 31, 2008 |
December 31, 2009 |
December 31, 2010 |
|||||||
|---|---|---|---|---|---|---|---|---|---|---|
Beginning balance |
$ | 199 | $ | 1,486 | $ | 1,661 | ||||
Provision |
1,472 | 13 | 228 | |||||||
Write-offs and adjustments |
(185 | ) | 162 | 26 | ||||||
Ending balance |
$ | 1,486 | $ | 1,661 | $ | 1,915 | ||||
The unbilled portion of accounts receivable from certain government research and development contracts included in the accounts receivable balance was $0.7 million and $0.8 million at December 31, 2009 and 2010, respectively. The unbilled portion of the accounts receivable are periodically invoiced based on the terms of the government research and development contract.
At December 31, 2009, the Company had three customers who accounted for 17%, 16% and 13% of total accounts receivable, individually. At December 31, 2010, the Company had one customer who accounted for 32% of total accounts receivable, individually.
During the year ended December 31, 2008, one customer of the Company, together with its affiliates, represented 44% of the Company's revenue. During the year ended December 31, 2009, one customer of the Company, together with its affiliates, and a second customer represented 14% and 35% of the Company's revenue, respectively. During the year ended December 31, 2010, two customers of the Company represented 28% and 13% of the Company's revenue, respectively.
The U.S. government and its agencies, departments and subcontractors comprised the following percentages of research and development services revenue for the years ended December 31, 2008, 2009 and 2010: 13%, 23% and 51%, respectively.
Inventory—Inventories are stated at the lower of cost or market. Cost is determined on a first-in, first-out basis and includes material costs, labor and applicable overhead. The Company reviews
92
A123 Systems, Inc.
Notes to Consolidated Financial Statements (Continued)
2. Summary of Significant Accounting Polices (Continued)
inventory for excess quantities and obsolescence based on its best estimates of future demand, product lifecycle and product development plans. The Company uses historical information along with future estimates to reserve for obsolete and potentially obsolete inventory. The Company includes in finished goods inventory products that have been delivered to customers for which the related revenue has been deferred until the customer has accepted the product or the evaluation period has expired.
Property, Plant and Equipment—Property, plant and equipment are stated at cost. Assets held under capital leases are stated at the lesser of the present value of future minimum payments, using the Company's incremental borrowing rate at the inception of the lease, or the fair value of the property at the inception of the lease. Expenditures for maintenance and repairs are charged to expense as incurred, whereas major betterments are capitalized as additions to property, plant and equipment. The Company capitalizes interest costs as part of the historical cost of constructing manufacturing facilities. Depreciation and amortization is provided using the straight-line method over the following estimated useful lives:
Asset Classification
|
Estimated Useful Life | |
|---|---|---|
Computer equipment and software |
3 years | |
Furniture and fixtures |
5 years | |
Automobiles |
5 years | |
Machinery and equipment |
5-7 years | |
Buildings |
10-20 years | |
Leasehold improvements |
Lesser of useful life or lease term |
Goodwill and Indefinite-Lived Intangible Assets—Goodwill is comprised of the cost of business acquisitions in excess of the fair value assigned to the net tangible and identifiable intangible assets acquired. Indefinite-lived intangible assets are not subject to amortization and consist of trademarks and trade names the Company has acquired through business acquisitions. Goodwill and indefinite-lived intangible assets are not amortized but are reviewed for impairment annually and more frequently if events or changes in circumstances indicate that the asset might be impaired. If an impairment exists, a loss is recorded to write-down the value of goodwill or indefinite-lived intangible assets to their implied fair value. As a result of the decline in revenue from the Company's Korean subsidiary the Company evaluated the trade name intangible for impairment which resulted in a $0.2 million and $0.3 million intangible asset impairment charges in the years ended December 31, 2009 and 2010, respectively, which were recorded in sales and marketing expenses in the Company's consolidated statements of operations.
The Company performed the annual impairment test for goodwill and indefinite-lived intangible assets as of October 1, 2010. Based on the results of the test, there was no change in the carrying value of goodwill and the Company did not record any material impairment charge related to indefinite-lived intangible assets. There have been no events since October 1, 2010 that would require the Company to perform an additional assessment of goodwill or indefinite-lived assets.
Intangible Assets Subject to Amortization—The Company amortizes its intangible assets with definitive lives over their estimated useful lives, which range from less than a year to 17 years, based on the same pattern as the Company expects to receive the economic benefit from these assets.
93
A123 Systems, Inc.
Notes to Consolidated Financial Statements (Continued)
2. Summary of Significant Accounting Polices (Continued)
As a result of the decline in revenue from the Company's Korean subsidiary and termination of a supply agreement with its most significant customer, the Company evaluated the intangible asset associated with the customer relationships for impairment which resulted in a $1.4 million intangible asset impairment charge in the year ended December 31, 2008, which was recorded in sales and marketing expenses in the Company's consolidated statement of operations. No impairment charge was recorded in the years ended December 31, 2009 and 2010 related to intangible assets subject to amortization.
Impairment of Long-Lived Assets—The Company's long-lived assets include property, plant and equipment and intangible assets subject to amortization (i.e., patented technology, contractual backlog, specially-trained workforce and customer relationships). The Company evaluates long-lived assets for recoverability whenever events or changes in circumstances indicate that an asset may have been impaired. In evaluating an asset for recoverability, the Company estimates the future cash flow expected to result from the use of the asset and eventual disposition. If the expected future undiscounted cash flow is less than the carrying amount of the asset, an impairment loss, equal to the excess of the carrying amount over the fair value of the asset, is recognized. With the decline in revenue from the Company's Korean subsidiary and termination of the supply agreement with its most significant customer, during the year ended December 31, 2008, the Company reviewed its long-lived assets associated with the production of small prismatic batteries and recorded a $1.7 million impairment charge, which was recorded in product cost of sales in the Company's consolidated statement of operations. During the years ended December 31, 2009 and 2010, the Company recorded a $0.7 million and a $0.4 million charge, respectively, related to impaired equipment at its China and Korea facilities, which were recorded in product cost of sales in the Company's consolidated statements of operations.
Investments—The Company's investments include investments in non-publicly traded companies which are accounted for using the cost method or the equity method, depending on the level of influence the Company has over the investment. The Company evaluates investments for impairment whenever events or changes in circumstances indicate that the market value may be less than the carrying value, which if determined to be other-than-temporary, could result in an impairment loss. As of December 31, 2010, the Company had a $20.5 million of investment accounted for under the cost method and an investment of $1.0 million accounted under the equity method. For the year ended December 31, 2010, the Company recorded equity method losses of $1.0 million in the consolidated statement of operations. Through December 31, 2010, no events or circumstances have been noted which would indicate the carrying value of these investments might be impaired.
Segment, Geographic and Significant Customer Information—Operating segments are defined as components of an enterprise about which discrete financial information is available that is evaluated regularly by the chief operating decision maker, or decision making group, in making decisions on how to allocate resources and assess performance. The Company's chief decision maker is the Chief Executive Officer. The Company's chief decision maker reviews consolidated operating results to make decisions about allocating resources and assessing performance for the entire Company. The Company views its operations and manages its business as one operating segment.
94
A123 Systems, Inc.
Notes to Consolidated Financial Statements (Continued)
2. Summary of Significant Accounting Polices (Continued)
Information about the Company's operations in different geographic regions is presented in the tables below (in thousands):
| |
Year Ended December 31, | ||||||||||
|---|---|---|---|---|---|---|---|---|---|---|---|
| |
2008 | 2009 | 2010 | ||||||||
Geographic revenues (based on shipment destination or services location) |
|||||||||||
United States |
$ | 24,101 | $ | 48,876 | $ | 70,856 | |||||
Germany |
1,455 | 6,023 | 7,933 | ||||||||
China |
24,788 | 8,391 | 6,875 | ||||||||
United Kingdom |
8,788 | 7,494 | 1,688 | ||||||||
Czech Republic |
2,287 | 3,086 | 1,633 | ||||||||
Mexico |
757 | 4,185 | 1,024 | ||||||||
Korea |
840 | 669 | 333 | ||||||||
Chile |
— | 8,505 | 233 | ||||||||
Malaysia |
3,883 | 75 | 204 | ||||||||
Other |
1,626 | 3,745 | 6,533 | ||||||||
|
$ | 68,525 | $ | 91,049 | $ | 97,312 | |||||
| |
December 31, 2009 |
December 31, 2010 |
||||||
|---|---|---|---|---|---|---|---|---|
Property, plant and equipment (based on location of asset) |
||||||||
United States |
$ | 18,190 | $ | 72,778 | ||||
China |
45,383 | 61,830 | ||||||
Korea |
8,089 | 9,390 | ||||||
|
$ | 71,662 | $ | 143,998 | ||||
The Company groups its revenues into four revenue categories. Revenue for these categories is as follows (in thousands):
| |
Year Ended December 31, | |||||||||
|---|---|---|---|---|---|---|---|---|---|---|
| |
2008 | 2009 | 2010 | |||||||
Transportation |
$ | 9,862 | $ | 45,298 | $ | 43,673 | ||||
Electric grid |
2,900 | 11,080 | 13,557 | |||||||
Commercial |
40,752 | 20,141 | 16,596 | |||||||
Services |
15,011 | 14,530 | 23,486 | |||||||
|
$ | 68,525 | $ | 91,049 | $ | 97,312 | ||||
Revenue Recognition—The Company recognizes revenue from the sale of products and delivery of services, including governmental contracts. Revenue is recognized when all of the following criteria are met: persuasive evidence of an arrangement exists, delivery has occurred or services have been provided, the price to the buyer is fixed or determinable, and collectability is reasonably assured. If
95
A123 Systems, Inc.
Notes to Consolidated Financial Statements (Continued)
2. Summary of Significant Accounting Polices (Continued)
sales arrangements contain multiple elements, the Company evaluates the agreements to determine if separate units of accounting exist within the arrangement. If separate units of accounting exist within an arrangement, the Company allocates revenue to each element based on the relative selling price of each of the elements.
Effective January 1, 2010, the Company early adopted the new accounting standards for revenue recognition related to multiple-deliverable revenue arrangements. The Company's multiple element arrangements typically include prototypes, production units and/or engineering and design work. Generally, provided all other revenue recognition criteria have been met, the Company recognizes revenue from prototype and production units upon shipment to the customer and revenue from engineering and design work upon the completion of milestones based on the proportional performance method. The Company's customers may generally cancel orders at any time prior to product shipment.
During the year ended December 31, 2010, the adoption of this guidance had no material impact on the Company's consolidated financial statements. The new accounting standards for revenue recognition, if applied in the same manner to the years ended December 31, 2008 and 2009, would not have had a material impact on total net revenue for that fiscal year.
Under the new authoritative guidance, each deliverable within a multiple-element revenue arrangement is accounted for as a separate unit of accounting if both of the following criteria are met: (1) the delivered item or items have value to the customer on a standalone basis, and (2) for an arrangement that includes a general right of return relative to the delivered item(s), delivery or performance of the undelivered item(s) is considered probable and substantially in the Company's control. The Company considers a deliverable to have standalone value if the Company sells this item separately, if the item is sold by another vendor, or if the item could be resold by the customer. Further, the Company's revenue arrangements generally do not include a general right of return relative to delivered products. Deliverables not meeting the criteria for being a separate unit of accounting are combined with a deliverable that does meet that criterion. The appropriate allocation of arrangement consideration and recognition of revenue is then determined for the combined unit of accounting.
In accordance with the new authoritative guidance, the Company allocates arrangement consideration to each deliverable in an arrangement based on its relative selling price. The Company determines selling price using vendor-specific objective evidence ("VSOE"), if it exists; otherwise, the Company uses third-party evidence ("TPE"). If neither VSOE nor TPE of selling price exists for a unit of accounting, the Company uses estimated selling price ("ESP").
VSOE is generally limited to the price charged when the same or similar product is sold separately. If a product or service is seldom sold separately, it is unlikely that the Company can determine VSOE for the product or service. In most cases, VSOE of selling price is an average price of recent actual transactions that are priced within a reasonable range. TPE is determined based on the prices charged by the Company's competitors for a similar deliverable when sold separately. It may be difficult for the Company to obtain sufficient information on competitor pricing to substantiate TPE and, therefore, the Company may not always be able to use TPE.
If the Company is unable to establish selling price using VSOE or TPE, and the new or materially modified arrangement was entered into after the implementation date of January 1, 2010, the Company will use ESP in the allocation of arrangement consideration. The objective of ESP is to determine the
96
A123 Systems, Inc.
Notes to Consolidated Financial Statements (Continued)
2. Summary of Significant Accounting Polices (Continued)
price at which the Company would transact if the product or service were sold on a standalone basis. The Company's determination of ESP involves a weighting of several factors based on the specific facts and circumstances of the arrangement. Because of the nature of the business and history with providing services and manufacturing products for various applications, the Company performs an initial assessment on the nature of the services that will be provided by estimating the cost to provide those services plus an estimated profit margin. The Company performs the same assessment on new products by estimating the per unit cost to manufacture the product plus an estimated profit margin. The estimated profit margins initially used in the assessment are based on the Company's profit objectives which will be adjusted based on other considerations such as pricing of similar products and services, characteristics of the specific market, ongoing pricing strategy and policies and value of any enhancements in functionality included in the deliverable.
The Company plans to analyze the selling prices used in the allocation of arrangement consideration at a minimum on an annual basis. Selling prices will be analyzed on a more frequent basis if a significant change in the business necessitates a more timely analysis or if the Company experiences significant variances in selling prices.
Product Revenue
Product revenue is generally recognized upon transfer of title and risk of loss, which is generally upon shipment, unless an acceptance period exists. In general, the Company's customary shipping terms are FOB shipping point or free carrier. In instances where customer acceptance of a product is required, revenue is either recognized (i) upon shipment when the Company is able to demonstrate that the customer specific objective criteria have been met or (ii) upon the earlier of customer acceptance or expiration of the acceptance period.
The Company provides warranties for its products and records the estimated costs as a cost of revenue in the period the revenue is recorded. The Company's standard warranty period extends one to eight years from the date of delivery, depending on the type of product purchased and its application. The warranties provide that the Company's products will be free from defects in material and workmanship and will, under normal use, conform to the specifications for the product. The warranties further provide that the Company will repair the product or provide replacement parts at no charge to the customer. The Company's warranty liability is based on projected product failure rates and estimated costs of fulfilling warranty claims. Projections are based on the Company's actual warranty experience and other known factors. The Company monitors its warranty liability and adjusts the amounts as necessary. When the Company is unable to reasonably determine its obligation for warranty of new products, revenue from the sale of the products is deferred until expiration of the warranty period or until such time as the warranty obligation can be reasonably estimated.
In instances where the Company has deferred revenue under various arrangements, the Company also defers the associated costs of revenue until such time that it is able to recognize the revenue. Deferred costs of revenue are classified in the consolidated balance sheets in inventory as all deferred costs are expected to be recognized as cost of revenue in the consolidated statement of operations within one year. As of December 31, 2009 and 2010, the Company had deferred cost of revenue, primarily related to finished goods inventory, of $0.4 million and $1.3 million, respectively.
97
A123 Systems, Inc.
Notes to Consolidated Financial Statements (Continued)
2. Summary of Significant Accounting Polices (Continued)
Services Revenue
Revenue from services is recognized as the services are performed consistent with the performance requirements of the contract using the proportional performance method. Where arrangements include milestones or governmental approval that impact the fees payable to the Company, revenue is limited to those amounts whereby collectability is reasonably assured. The Company recognizes revenue earned under time and materials contracts as services are provided based upon actual costs incurred plus a contractually agreed-upon profit margin. The Company recognizes revenue from fixed-price contracts using the proportional performance method based on the ratio of costs incurred to estimates of total expected project costs in order to determine the amount of revenue earned to date. Project costs are based on the direct salary and associated fringe benefits of the employees on the project plus all direct expenses incurred to complete the project including sub-contractual and equipment costs where the Company is the principal in the arrangement. The proportional performance method is used since reasonably dependable estimates of the revenues and costs applicable to various stages of a contract can be made. These estimates are based on historical experience and deliverables identified in the contract and are indicative of the level of benefit provided to the Company's clients. There are no costs that are deferred and amortized over the contract term.
Service revenue includes revenue derived from the execution of contracts awarded by the U.S. federal government, other government agencies and commercial customers. The Company's research and development arrangements with the federal government or other government agencies typically require the Company to provide pure research, in which the Company investigates design techniques on new battery technologies. The Company's arrangements with commercial customers consist of arrangements where the Company is paid to enhance or modify an existing product or to develop or jointly develop a new product to meet a customer's specifications.
Other Revenue
Fees to license the use of the Company's proprietary and licensed technologies are recognized only after both the license period has commenced and the technology has been delivered to the customer. Royalty revenue is recognized when it becomes determinable and collectability is reasonably assured; otherwise the Company recognizes revenue upon receipt of payment. To date, the Company has not recognized any significant license or royalty revenue.
Deferred Revenue—The Company records deferred revenue for product sales and services revenue in several different circumstances. These circumstances include when (i) the Company has delivered products or performed services but other revenue recognition criteria have not been satisfied, (ii) payments have been received in advance of products being delivered or services being performed and (iii) all other revenue recognition criteria have been met, but the Company is not able to reasonably estimate the warranty expense. Deferred revenue includes customer deposits and up-front fees associated with services arrangements. Deferred revenue expected to be recognized as revenue more than one year subsequent to the balance sheet date is classified as long-term deferred revenue. Deferred revenue will vary depending on the timing and amount of cash receipts from customers and can vary significantly depending on specific contractual terms.
On November 17, 2008, the Company entered into an exclusive agreement to license certain of its technology in the field of consumer electronics devices (excluding power tools and certain other
98
A123 Systems, Inc.
Notes to Consolidated Financial Statements (Continued)
2. Summary of Significant Accounting Polices (Continued)
consumer products). In connection with the license agreement and modification, the Company has received and recorded as deferred revenue an up-front license, support and additional fees totaling $28.0 million. In addition, the agreement provides that the Company will be paid royalty fees on net sales of licensed products that include its technology. The Company has agreed to the terms of the license agreement that if, during a certain period following execution of the license agreement, the Company enters into an agreement with a third party that materially restricts the licensee's rights under the license agreement or fails to provide the necessary support to enable the licensee to practice the Company's technology, then the Company may be required to refund the licensee all license and support fees paid to cover the licensee's capital and other expenses paid and/or committed by the licensee in reliance upon its rights under the license agreement. Revenue recognition is expected to upon the successful transfer of technology know how to the customer. The license and support fee will be recognized on a straight-line basis over the longer of the patent term or the expected customer relationship.
Shipping and Handling Costs—Shipping and handling costs are classified as a component of cost of revenue. Customer payments of shipping and handling costs are recorded as product revenue.
Research, Development and Engineering Costs—Costs incurred in the research, development and engineering of the Company's products are expensed as incurred and include salaries, third-party contractors, materials, and supplies. Research, development and engineering costs directly associated with services revenue are classified as cost of research, development and engineering services. Additionally, a portion of research, development and engineering costs were offset by cost-sharing funding. For the years ended December 31, 2008, 2009 and 2010, the research and development costs that were offset by cost-sharing funding were $4.8 million, $2.8 million and $4.9 million, respectively.
Pre-production engineering, design and development costs for products sold under long-term supply arrangements are expensed as incurred in research, development and engineering expenses in the consolidated statement of operations, unless the Company has a contractual guarantee for reimbursement from the customer. Costs that have a contractual guarantee for reimbursement are capitalized and amortized as a cost of sales over the applicable term. For the year ended December 31, 2010, the Company expensed $2.1 million of pre-production costs related to long-term supply arrangements as research, development and engineering expense. There was no expense recorded for the years ended December 31, 2008 and 2009.
Production start-up—Production start-up expenses consist of manufacturing salaries and personnel-related costs, site selection costs, including legal and regulatory costs, rent and the cost of operating a production line before it has been qualified for production, including the cost of raw materials run through the production line during the qualification phase. During the years ended December 31, 2009 and 2010, the Company incurred production start-up expenses related to its facilities in Livonia and Romulus, Michigan. The Livonia facility began qualification for production in the third quarter of 2010 and was qualified December 2010. Since qualification, expenses related to the Livonia facility are no longer included in production start-up expenses. The Romulus facility is expected to begin qualification for production in the first quarter of 2011 and the Company expects to continue to incur production start-up expenses related to the Romulus facility in the near term. Within production start-up expenses, the Company recorded $12.7 million related to materials, labor and overhead costs incurred in the qualification process of the prismatic cell production line for the year ended December 31, 2010. A portion of production start-up expenses was offset primarily by government grant funding. The
99
A123 Systems, Inc.
Notes to Consolidated Financial Statements (Continued)
2. Summary of Significant Accounting Polices (Continued)
following table presents production start-up expenditures included in the Company's consolidated statements of operations (in thousands):
| |
Year Ended December 31, | ||||||
|---|---|---|---|---|---|---|---|
Production start-up expenditures
|
2009 | 2010 | |||||
| |
(Dollars in thousands) |
||||||
Aggregated production start-up expenditures |
$ | 1,524 | $ | 26,685 | |||
Production start-up reimbursements |
— | (5,621 | ) | ||||
Production start-up expenses |
$ | 1,524 | $ | 21,064 | |||
Income Taxes—Deferred tax assets and liabilities are recognized based on temporary differences between the financial reporting and income tax basis of assets and liabilities using rates anticipated to be in effect when such temporary differences reverse. A valuation allowance against net deferred tax assets is required if, based upon the available evidence, it is more likely than not that some or all of the deferred tax assets will not be realized. The Company provides reserves for potential payments of tax to various tax authorities related to uncertain tax positions and other issues. Reserves are based on a determination of whether and how much of a tax benefit taken by the Company in its tax filings or positions is more likely than not to be realized following resolution of any potential contingencies present related to the tax benefit. Potential interest and penalties associated with such uncertain tax positions are recorded as a component of income tax expense.
Guarantees and Indemnifications—Upon issuance of a guarantee, the Company must disclose and recognize a liability for the fair value of the obligation assumed under the guarantee.
As permitted under Delaware law, the Company indemnifies its officers and directors for certain events or occurrences while the officer or director is, or was, serving at the Company's request in such capacity. The term of the indemnification is for the officer's or director's lifetime. The maximum potential amount of future payments the Company could be required to make is unlimited. The Company has directors' and officers' insurance coverage that limits its exposure and enables it to recover a portion of any future amounts paid.
In connection with certain loan agreements, the Company has agreed to indemnify the lender and its representatives against all obligations, demands, claims, and liabilities claimed or asserted by any other party in connection with the loan and all losses incurred by the indemnified party in connection with the execution, delivery, enforcement, performance, and administration of the loan. The term of these indemnification agreements are perpetual. The maximum potential amount of future payments the Company could be required to make under these indemnification agreements is unlimited.
In connection with the ongoing patent litigation, the Company has agreed to defend and indemnify the other named business partner for its legal costs in defending the litigation. The indemnification is for the term legal costs are incurred by the business partner related to the litigation. The maximum potential amount of future payment the Company could be required to make under this indemnification agreement is unlimited.
The Company leases office space under a noncancelable operating lease. The Company has agreed under the lease to indemnify the landlord against all costs, expenses, fines, suits, claims, demands, liabilities, and actions arising from or related to the omission, fault, act, negligence, or misconduct
100
A123 Systems, Inc.
Notes to Consolidated Financial Statements (Continued)
2. Summary of Significant Accounting Polices (Continued)
(whether under the lease or otherwise) of the Company or of any employee, agent, contractor, licensee, or visitor of the Company; or arising from any accident, injury, or damage whatsoever resulting to any person or property while on or about the Company's premises except to the extent arising from any omission, fault, negligence, or other misconduct of landlord or of landlord's agents, contractors, or employees.
The Company generally agrees to indemnify customers from costs resulting from the products' deviations from specifications, delivery and performance requirements, and any third-party claims arising from the product or violations of specified laws and safety regulations. The amount of indemnification generally is limited to the amount of fees paid to the Company.
The Company has not experienced any losses related to these indemnification obligations, and no claims with respect thereto were outstanding. The Company does not expect significant claims related to these indemnification obligations, and, consequently, concluded that the fair value of these obligations is negligible and no related liabilities were established.
Accumulated Other Comprehensive Loss—Accumulated other comprehensive loss consists of foreign currency translation adjustments attributable to A123 Systems, Inc. The largest portion of the cumulative translation adjustment relates to the Company's Asian operations and reflects the changes in the Chinese RMB and Korean Won exchange rates relative to the U.S. Dollar.
Fair Value of Financial Instruments—The carrying amount of cash, cash equivalents, restricted cash and cash equivalents, accounts receivable, accounts payable and accrued expenses approximates fair value due to the short-term nature of these items. Management believes that the Company's debt obligations and the Company's capital lease obligations accrue interest at rates which approximate prevailing market rates for instruments with similar characteristics and, accordingly, the carrying values for these instruments approximate fair value.
Fair value is an exit price, representing the amount that would be received from the sale of an asset or paid to transfer a liability in an orderly transaction between market participants. As such, fair value is a market-based measurement that should be determined based on assumptions that market participants would use in pricing an asset or liability. As a basis for considering such assumptions, GAAP establishes a three-tier value hierarchy, which prioritizes the inputs used in measuring fair value as follows: (Level 1) observable inputs such as quoted prices in active markets; (Level 2) inputs other than the quoted prices in active markets that are observable either directly or indirectly; and (Level 3) unobservable inputs in which there is little or no market data, which requires the Company to develop its own assumptions. This hierarchy requires the Company to use observable market data, when available, and to minimize the use of unobservable inputs when determining fair value. On a recurring basis, the Company measures certain financial assets and liabilities at fair value, including the Company's cash equivalents.
The Company did not have any material items that are measured at fair value on a non-recurring basis under this requirement as of December 31, 2009 or 2010.
101
A123 Systems, Inc.
Notes to Consolidated Financial Statements (Continued)
2. Summary of Significant Accounting Polices (Continued)
The following tables show assets measured at fair value on a recurring basis and the input categories associated with those assets (in thousands):
| |
|
As of December 31, 2009 | |||||||||||
|---|---|---|---|---|---|---|---|---|---|---|---|---|---|
| |
Fair Value at December 31, 2009 |
Quoted Prices in Active Markets for Identical Assets (Level 1) |
Significant Other Observable Inputs (Level 2) |
Significant Unobservable Inputs (Level 3) |
|||||||||
Asset: |
|||||||||||||
Money market funds |
$ | 447,368 | $ | 447,368 | $ | — | $ | — | |||||
| |
|
As of December 31, 2010 | |||||||||||
|---|---|---|---|---|---|---|---|---|---|---|---|---|---|
| |
Fair Value at December 31, 2010 |
Quoted Prices in Active Markets for Identical Assets (Level 1) |
Significant Other Observable Inputs (Level 2) |
Significant Unobservable Inputs (Level 3) |
|||||||||
Assets: |
|||||||||||||
Money market funds |
$ | 174,603 | $ | 174,603 | $ | — | $ | — | |||||
U.S. Treasury and government agency securities |
17,333 | — | 17,333 | — | |||||||||
The Company's holds money market fund investments that are classified as cash equivalents and are measured at fair value on a recurring basis based on quoted prices in active markets for identical assets. The Company's holds investments in U.S. Treasury and government agency securities that are classified as either cash equivalents or restricted cash equivalents and are measured at fair value based on inputs (other than quoted prices) that are observable for securities, either directly or indirectly.
Stock-Based Compensation—The Company accounts for all awards, including employee and director awards, by recognizing compensation expense based on the fair value of share-based transactions in the consolidated financial statements. The Company recognizes compensation expense over the vesting period using a ratable method (providing the minimum amount of compensation recorded is equal to the vested portion of the award, requiring a ratable method when necessary) and classifies these amounts in the consolidated statements of operations based on the department to which the related employee reports. The Company uses the Black-Scholes valuation model to calculate the fair value of stock options, utilizing various assumptions.
The Company records equity instruments issued to non-employees as expense at their fair value over the related service period and periodically revalues the equity instruments as they vest.
Net Loss Per Share—Basic net loss per share is computed by dividing net loss by the weighted-average number of common shares outstanding during the relevant period. Diluted net loss per share is computed by dividing net loss by the weighted-average number of dilutive common shares outstanding during the relevant period. Dilutive shares outstanding are calculated by adding to the weighted shares outstanding any potential (unissued) shares of common stock and warrants based on the treasury stock method.
102
A123 Systems, Inc.
Notes to Consolidated Financial Statements (Continued)
2. Summary of Significant Accounting Polices (Continued)
The following potentially dilutive securities were excluded from the calculation of diluted net loss per share, as the effect would have been anti-dilutive (in thousands):
| |
December 31, 2008 |
December 31, 2009 |
December 31, 2010 |
|||||||
|---|---|---|---|---|---|---|---|---|---|---|
Convertible preferred stock upon conversion to common stock |
48,164 | — | — | |||||||
Warrants to purchase redeemable convertible preferred stock |
126 | — | — | |||||||
Warrants to purchase common stock |
45 | 45 | 45 | |||||||
Options to purchase common stock |
8,205 | 10,640 | 10,783 | |||||||
Unvested restricted stock units |
— | — | 203 | |||||||
|
56,540 | 10,685 | 11,031 | |||||||
New Accounting Pronouncements—In April 2010, an update was issued to the accounting and reporting guidance for milestone based revenue arrangements. This update provides guidance on defining a milestone and determining when it may be appropriate to apply the milestone method of revenue recognition for research or development transactions. Research or development arrangements frequently include payment provisions whereby a portion or all of the consideration is contingent upon the achievement of milestone events. Consideration that is contingent on achievement of a milestone in its entirety may be recognized as revenue in the period in which the milestone is achieved only if the milestone is judged to meet certain criteria to be considered substantive. Milestones should be considered substantive in their entirety and may not be bifurcated. An arrangement may contain both substantive and non-substantive milestones, and each milestone should be evaluated individually to determine if it is substantive. This update is effective prospectively for milestones achieved in fiscal years beginning on or after June 15, 2010. The Company does not expect that the adoption of this update will have a material impact on its financial position, results of operations, or cash flows.
3. Government Grants
Center of Energy and Excellence Grant
In February 2009, the State of Michigan awarded the Company a $10.0 million Center of Energy and Excellence grant. Under the agreement, the State of Michigan will provide cost reimbursement for 100% of qualified expenditures incurred through November 30, 2011. There are no substantive conditions attached to this award that will require repayment of amounts received, if those conditions are not met. The Company received $3.0 million of this grant in March 2009 and $6.0 million of this grant in July 2010, with additional payments to be made based on the achievement of certain milestones in the facility development. The Company used $2.2 million of these funds in the year ended December 31, 2009. During the year ended December 31, 2010, the Company incurred allowable costs of $5.7 million and $0.3 million, which were recorded as offsets to property, plant, and equipment and operating expenses, respectively. As of December 31, 2009 and 2010, $0.8 million of these funds are recorded in short-term restricted cash and other current liabilities on the consolidated balance sheet.
103
A123 Systems, Inc.
Notes to Consolidated Financial Statements (Continued)
3. Government Grants (Continued)
Michigan Economic Growth Authority
In April 2009, Michigan Economic Growth Authority ("MEGA") offered the Company certain tax incentives, which can be used to offset the Michigan Business Tax owed in a tax year, carried forward for the number of years specified by the agreement, or be paid to the Company in cash at the time claimed to the extent the Company does not owe a tax. The terms and conditions of the High-Tech Credit were established in October 2009 and the Cell Manufacturing Credit in November 2009.
High Tech Credit—The High-Tech Credit agreement provides the Company with a 15-year tax credit, based on qualified wages and benefits multiplied by the Michigan personal income tax rate beginning with payments made for the 2011 fiscal year. The tax credit has an estimated value of up to $25.3 million, depending on the number of jobs created in Michigan. The proceeds to be received by the Company will be based on the number of jobs created, qualified wages paid and tax rates in effect over the 15 year period. The tax credit is subject to a repayment provision in the event the Company relocates a substantial portion of the jobs outside the state of Michigan within 15 years from the date the Company first receives the credit. The accounting for this credit had no impact to the consolidated financial statements as of December 31, 2009 or 2010.
Cell Manufacturing Credit—The Cell Manufacturing Credit agreement authorizes a tax credit or cash for the Company equal to 50% of capital investment expenses related to the construction of the Company's integrated battery cell manufacturing facilities in Michigan, commencing with costs incurred from January 1, 2009, up to a maximum of $100.0 million over a four year period. The tax credit shall not exceed $25.0 million per year and can be submitted for reimbursement beginning in tax year 2012. The Company is required to create 300 jobs no later than December 31, 2016 for the tax credit to be non-refundable. The tax credit is subject to a repayment provision in the event the Company relocates 51% or more of the 300 jobs outside of the state of Michigan within three years after the last year the tax credit is received. Through December 31, 2010, the Company has incurred $151.6 million in qualified expenses related to the construction of the Livonia and Romulus facilities. When the Company has met the filing requirements for the tax year ending December 31, 2012, the Company expects to begin receiving $75.8 million in proceeds related to these expenses. The Company has recorded the receivable of $75.8 million, as it is reasonably assured that the Company will comply with the conditions of the tax credit and will receive the proceeds. Upon recording the receivable in the fourth quarter of 2010, the Company reduced the basis in the fixed assets acquired in accordance with the tax credit and this will be recognized in the consolidated statements of operations over their estimated useful lives of the depreciable asset as reduced depreciation expense.
Michigan Economic Growth Authority Loan
The State of Michigan also granted the Company a low interest forgivable loan of up to $4.0 million effective August 2009 with the objective of conducting advance vehicle technology operations to promote and enhance job creation within the State of Michigan. To receive advances under the loan, the Company is required to achieve certain key milestones related to the development of the manufacturing facility. The Company met the first milestone for the loan in the first quarter of 2011 and in February 2011 received the initial advance of $1.2 million under this loan. The remainder of the loan is expected to be received upon achieving certain milestones. The note will accrue interest of 1% per annum from the date of the initial advance, and the Company will have no obligation to pay any principal or interest until August 2012. If the Company creates 350 full time jobs by August 2012
104
A123 Systems, Inc.
Notes to Consolidated Financial Statements (Continued)
3. Government Grants (Continued)
and maintains the jobs in the State of Michigan for three years after the end of the loan, the entire debt will be forgiven. There is no impact to the consolidated financial statements as of December 31, 2009 or 2010.
U.S. Department of Energy Battery Initiative
In December 2009, the Company entered into an agreement establishing the terms and conditions of a $249.1 million grant awarded under the Department of Energy ("DOE") Battery Initiative to support manufacturing expansion of new lithium-ion battery manufacturing facilities in Michigan. Under the agreement, the DOE will provide cost reimbursement for 50% of qualified expenditures incurred from December 1, 2009 to November 30, 2012. The agreement also provides for reimbursement of pre-award costs incurred from June 1, 2009 to November 30, 2009. There are no substantive conditions attached to this award that will require repayment of amounts received if those conditions are not met. For the year ended December 31, 2010, the Company received $6.1 million in reimbursement for costs incurred in 2009, of which $5.7 million related to offsets to property, plant and equipment and $0.4 million related to offsets to operating expenses. For the year ended December 31, 2010, the Company received $80.8 million in reimbursement for costs incurred in 2010, of which $72.4 million related to offsets to property, plant and equipment and $8.4 million related to operating expenses. The Company has incurred additional allowable costs in the years ended December 31, 2009 and 2010, entitling the Company to receive $6.1 million and $2.1 million in reimbursements, respectively, which are recorded in prepaid expenses and other current assets in the consolidated balance sheets. For the year ended December 31, 2010, $1.3 million of the receivable relates to offsets to property, plant, and equipment and $0.8 million relates to offsets to operating expenses.
Department of Energy, Labor and Economic Growth ("DELEG")
In December 2009, the State of Michigan awarded the Company $2.0 million to assist in funding the Company's smart grid stabilization project, the purpose of which is to develop and improve the quality of application of energy efficient technologies and to create or expand the market for such technologies. The Company received the initial advance of $0.9 million in December 2009, and through December 31, 2010, the Company incurred $0.9 million in allowable costs, which was recorded as an offset to operating expenses. The Company will receive the remainder of the grant upon submitting for funding from the State of Michigan.
City of Livonia Personal Property Tax Exemption
The Company entered into an agreement with the City of Livonia allowing 100% exemption from personal property taxes by Livonia on all new personal property during the exemption period commencing on December 31, 2009 and continuing for fourteen years through December 31, 2023. The Company is required to invest at least $24.0 million in personal property and create or locate 350 new jobs in the eligible district to receive the exemption. If the Company relocates operations, jobs or activities outside the City of Livonia on or before May 31, 2016 such that employment is 175 jobs or less, the Company is required to repay all or a portion of the property taxes exempted. There is no impact to the consolidated financial statements as of December 31, 2009 as a result of this agreement. For the year ended December 31, 2010, the agreement did not have a material impact on the consolidated financial statements of the Company.
105
A123 Systems, Inc.
Notes to Consolidated Financial Statements (Continued)
3. Government Grants (Continued)
Michigan Strategic Fund Renaissance Zone Development
In May 2010, the Company entered into a Renaissance Zone Development agreement with the Michigan Strategic Fund and the property owners for the site leased by the Company in Romulus, Michigan. Under the terms of the agreement, the Company may receive exemptions, deductions, credits or other benefits if it invests a certain amount of capital and creates a certain number of jobs related to its facility in Romulus, Michigan. As of December 31, 2010, the Company has not yet met the conditions to be eligible to receive any of the Renaissance Zone benefits. There is no impact to the consolidated financial statements as of December 31, 2010 as a result of this agreement.
Massachusetts Clean Energy Technology Center
In October 2010, the Company entered into a forgivable loan agreement with Massachusetts Clean Energy Technology Center for $5.0 million for the purpose of funding working capital, capital expenses, and leasehold improvements for the Company's new corporate headquarters and primary research and development center in Waltham, Massachusetts and Energy Solution Group engineering and manufacturing facilities in Westborough, Massachusetts. Amounts borrowed under this agreement will accrue interest of 6% from the date of the advance and mature in October 2017. The loan is collateralized by certain designated equipment and a subordinated lien on certain other assets of the Company. If the Company creates 263 new jobs in Massachusetts between January 1, 2010 and December 31, 2014 and maintains at least 513 jobs in Massachusetts from January 1, 2015 to the maturity date, $2.5 million of the outstanding principal and accrued interest on the loan will be forgiven. If the Company spends, or commits to spend, at least $12.5 million in capital expenses or leasehold improvements within one year from closing the loan, $2.5 million of the outstanding principal and accrued interest on the loan will be forgiven in October 2011. As of December 31, 2010, the Company has borrowed the full $5.0 million under this agreement, $2.5 million of which is recorded as an offset to property, plant and equipment in the consolidated balance sheet to reduce the basis in the fixed assets acquired under the grant as it is reasonably assured that the Company will comply with the conditions for the forgiveness of $2.5 million related to the capital expenditure target. The offset to property, plant and equipment will be recognized in the consolidated statements of operations over the estimated useful lives of the depreciable assets as reduced depreciation expense. The remaining $2.5 million is recorded in long-term debt until the Company is reasonably assured that it will comply with the conditions of the grant for the forgiveness related to the creation of new jobs in Massachusetts.
4. Inventory
Inventory consists of the following (in thousands):
| |
December 31, 2009 |
December 31, 2010 |
|||||
|---|---|---|---|---|---|---|---|
Raw materials |
$ | 7,726 | $ | 18,929 | |||
Work-in-process |
25,139 | 27,226 | |||||
Finished goods |
4,573 | 2,632 | |||||
|
$ | 37,438 | $ | 48,787 | |||
106
A123 Systems, Inc.
Notes to Consolidated Financial Statements (Continued)
5. Property, Plant and Equipment
For government grants related to capital expenditures, the Company recognizes the reimbursement as a reduction of the basis of the asset and a reduction to depreciation expense over the useful life of the asset. Property, plant and equipment consists of the following (in thousands):
| |
December 31, 2009 |
December 31, 2010 |
||||||
|---|---|---|---|---|---|---|---|---|
Computer equipment and software |
$ | 7,005 | $ | 11,913 | ||||
Furniture and fixtures |
1,585 | 3,415 | ||||||
Automobiles |
385 | 404 | ||||||
Machinery and equipment |
66,934 | 122,187 | ||||||
Buildings |
6,900 | 26,810 | ||||||
Leasehold improvements |
9,224 | 34,540 | ||||||
Equipment not in service |
9,126 | 154,357 | ||||||
Property, plant and equipment, basis |
101,159 | 353,626 | ||||||
Less reduction for costs reimbursable under government grants |
1,100 | 164,999 | ||||||
Property, plant and equipment, carrying value |
100,059 | 188,627 | ||||||
Less net accumulated depreciation and amortization |
28,397 | 44,629 | ||||||
Property, plant and equipment, net |
$ | 71,662 | $ | 143,998 | ||||
The Company has deposits for equipment not yet received of $17.0 million and $11.6 million at December 31, 2009 and 2010, respectively, included within deposits and other assets in the consolidated balance sheets. These deposits are reported net of contra deposit balances related to reimbursements under government grants of $6.7 million and $1.7 million at December 31, 2009 and 2010, respectively.
Property, plant and equipment under capital lease consists of the following (in thousands):
| |
December 31, 2009 |
December 31, 2010 |
|||||
|---|---|---|---|---|---|---|---|
Computer equipment and software, at cost |
$ | 1,624 | $ | 2,758 | |||
Buildings, at cost |
— | 16,446 | |||||
Leasehold improvements, at cost |
— | 2,091 | |||||
Accumulated depreciation and amortization |
(855 | ) | (1,631 | ) | |||
Property, plant and equipment under capital lease, net |
$ | 769 | $ | 19,664 | |||
Net depreciation expense for the years ended December 31, 2008, 2009 and 2010 was $7.2 million, $12.3 million, and $16.5 million, respectively. For the year ended December 31, 2010, the Company recorded $2.0 million as a reduction to depreciation expense related to reduced carrying value due to government grant reimbursements. No reduction to depreciation expense for government grant reimbursements was recorded in 2008 or 2009.
6. Goodwill and Intangible Assets
There was no change in the carrying value of goodwill during the years ended December 31, 2009 and 2010.
107
A123 Systems, Inc.
Notes to Consolidated Financial Statements (Continued)
6. Goodwill and Intangible Assets (Continued)
Intangible assets consist of the following (in thousands):
| |
|
December 31, 2009 | December 31, 2010 | ||||||||||||||||||
|---|---|---|---|---|---|---|---|---|---|---|---|---|---|---|---|---|---|---|---|---|---|
Intangible Asset Class
|
Useful Life (Years) |
Gross | Accumulated Amortization |
Net | Gross | Accumulated Amortization |
Net | ||||||||||||||
Contractual backlogs |
1-3 | $ | 497 | $ | 497 | $ | — | $ | 497 | $ | 497 | $ | — | ||||||||
Customer relationships |
5-17 | 640 | 394 | 246 | 647 | 428 | 219 | ||||||||||||||
Patented technology |
4-5 | 2,473 | 1,855 | 618 | 2,526 | 2,333 | 193 | ||||||||||||||
Specialty-trained workforce |
4 | 60 | 44 | 16 | 60 | 59 | 1 | ||||||||||||||
Trademarks and trade names |
Indefinite | 374 | — | 374 | — | — | — | ||||||||||||||
|
$ | 4,044 | $ | 2,790 | $ | 1,254 | $ | 3,730 | $ | 3,317 | $ | 413 | |||||||||
Amortization expense for intangible assets totaled $0.8 million, $0.9 million, and $0.5 million for years ended December 31, 2008, 2009 and 2010, respectively. The remaining net book value of the intangible assets will be amortized over a weighted-average period of approximately 4.20 years as of December 31, 2010. Future amortization expense consisted of the following at December 31, 2010 (in thousands):
| |
Amortization | |||
|---|---|---|---|---|
2011 |
$ | 217 | ||
2012 |
20 | |||
2013 |
19 | |||
2014 |
17 | |||
2015 |
14 | |||
Thereafter |
126 | |||
|
$ | 413 | ||
7. Investments
Cost-Method Investments
In January 2010, the Company entered into an agreement to purchase preferred stock of a maker of plug-in hybrid electric vehicles in the United States (the "Automaker"). The Company agreed to invest cash of $13.0 million and shares of the Company's common stock, which, when transferred to the Automaker, had a fair market value of $7.5 million. As of December 31, 2010, all cash and stock consideration had been transferred to the Automaker in return for preferred stock of the Automaker and the Company has recorded an investment of $20.5 million in the consolidated balance sheet. The Company is accounting for its investment under the cost method. Through December 31, 2010, there have been no changes in circumstances that may have a significant adverse effect on the fair value of the investment.
Equity-Method Investments
In December 2009, the Company entered into a joint venture agreement with an automaker in China to assist the Company in growing the Company's business and sales in China's transportation industry and created Shanghai Advanced Traction Battery Systems, Co. Ltd. (the "Joint Venture").
108
A123 Systems, Inc.
Notes to Consolidated Financial Statements (Continued)
7. Investments (Continued)
Under the terms of the joint venture agreement, the Company is required to invest $4.7 million into the Joint Venture over a period of approximately 15 months, in return for a 49% interest in the Joint Venture. During the year ended December 31, 2010, the Company made the first capital contribution of $1.9 million to the Joint Venture. As of December 31, 2010, no other capital contributions have been required under the terms of the agreement. The Company is accounting for its investment under the equity method.
In August 2010, the Company entered into an agreement to transfer certain patents held by the Company to a privately-held company, 24M Technologies, Inc. ("24M"), in return for a 12% ownership interest in 24M. The Company has recorded the investment on the consolidated balance sheet at the fair value of the ownership interest received of approximately $0.2 million. The Company is accounting for its investment under the equity method as it has determined it has significant influence over the operating and financial decisions of the third party. In connection with the investment, the Company recognized a gain of $0.2 million in the consolidated statement of operations equal to the excess of the fair value of the ownership interest received over the carrying value of the patents.
8. Employee Benefit Plan
The Company has established a defined contribution savings plan under Section 401(k) of the Internal Revenue Code (the "401(k) Plan"). The 401(k) Plan covers substantially all employees who meet minimum age and service requirements and allows participants to defer a portion of their annual compensation on a pretax basis, subject to legal limitations. Company contributions to the 401(k) Plan may be made at the discretion of the Board of Directors. The Company has made no contributions to the 401(k) Plan.
Employees of the Company's Korean subsidiary with one year or more of service are entitled to receive a lump-sum payment upon termination of their employment with the Company based on the length of service and rate of pay at the time of termination. The annual severance benefits expense charged to operations is calculated based upon the net change in the accrued severance benefits payable at the balance sheet date. As of December 31, 2009 and 2010, the balance of the severance benefit was $0.9 million and $1.1 million, respectively, and is included in other long-term liabilities on the Company's consolidated balance sheets.
9. Accrued Expenses
Accrued expenses consists of the following (in thousands):
| |
December 31, 2009 |
December 31, 2010 |
|||||
|---|---|---|---|---|---|---|---|
Capital Expenditures |
$ | — | $ | 30,618 | |||
Payroll and related benefits |
4,410 | 7,263 | |||||
Legal, audit, tax and professional fees |
2,165 | 3,138 | |||||
Product warranty, current |
2,313 | 2,988 | |||||
Taxes |
454 | 1,052 | |||||
Other |
2,347 | 3,120 | |||||
Total accrued expenses |
$ | 11,689 | $ | 48,179 | |||
109
A123 Systems, Inc.
Notes to Consolidated Financial Statements (Continued)
10. Commitments and Contingencies
Capital Leases—The Company has entered into certain capital lease agreements for software, computer, other equipment and buildings. The leases are payable in monthly installments through March 2021.
The recorded balance of capital lease obligations as of December 31, 2009 and December 31, 2010 was $0.6 million and $20.2 million, respectively. The Company recorded interest expense in connection with its capital leases of $0.1 million, $0.1 million and $0.5 million for each of the years ended December 31, 2008 and 2009 and 2010, respectively.
Future minimum payments under capital leases at December 31, 2010, are as follows (in thousands):
Years Ending December 31,
|
Capital Lease Obligations |
|||
|---|---|---|---|---|
2011 |
$ | 3,374 | ||
2012 |
3,315 | |||
2013 |
2,903 | |||
2014 |
2,848 | |||
2015 |
2,840 | |||
Thereafter |
15,811 | |||
|
31,091 | |||
Less portion representing interest |
10,865 | |||
Present value of future minimum payments |
20,226 | |||
Less current portion |
1,571 | |||
Long-term obligations |
$ | 18,655 | ||
In May 2010, the Company entered into a long-term lease for a facility in Waltham, Massachusetts. The lease is for approximately 97,000 square feet and has an initial term of ten years, which is expected to commence during the first quarter of 2011, with the option to extend for an additional five years. The Company's minimum payments under this lease are expected to be $25.3 million over the initial term. In addition to base rent, the Company is also responsible for its share of electricity cost and its pro rata share of increases in operating expenses. The landlord has agreed to provide the Company with an allowance for certain tenant improvement costs, up to $2.1 million. In connection with the Waltham Lease, the Company provided the landlord a security deposit of $1.0 million in the form of an irrevocable letter of credit. The Company is accounting for this lease as a capital lease.
In July 2010, the Company entered into a long-term lease for a facility in Westborough, Massachusetts. The lease is for approximately 67,000 square feet. The lease term is from July 2010 through January 2021, and provides for the option to extend for one additional term of five years and the option for the Company to terminate the Westborough lease in February 2016. The Company's minimum payments under this lease are expected to be $4.4 million over the initial term. In addition to the base rent, the Company is also responsible for its share of operating expenses and taxes, including, but not limited to, insurance, real estate taxes, and common area maintenance costs. In connection with the lease, the Company provided a security deposit of approximately $0.2 million to the landlord in the form of an irrevocable, unconditional, negotiable letter of credit. The landlord has agreed to provide
110
A123 Systems, Inc.
Notes to Consolidated Financial Statements (Continued)
10. Commitments and Contingencies (Continued)
the Company with allowances totaling approximately $0.6 million for certain upgrades and repairs to be made by the Company. The Company is accounting for this lease as a capital lease.
Operating Leases—The Company has non-cancelable operating lease agreements for office, research and development and manufacturing space in the United States, China, Korea and Japan. The Company also has operating leases for certain equipment and automobiles. These lease agreements expire at various dates through 2019 and certain of them contain provisions for extension on substantially the same terms as are in effect. Where leases contain escalation clauses, rent abatements, and/or concessions, such as rent holidays and landlord or tenant incentives or allowances, the Company applies them in the determination of straight-line rent expense over the lease term.
Future minimum payments under operating leases consisted of the following at December 31, 2010 (in thousands):
Years Ending December 31,
|
Operating Leases |
|||
|---|---|---|---|---|
2011 |
$ | 4,617 | ||
2012 |
3,363 | |||
2013 |
3,238 | |||
2014 |
3,248 | |||
2015 |
3,258 | |||
Thereafter |
11,145 | |||
Total minimum lease payments |
$ | 28,869 | ||
The Company incurred rent expense under all operating leases of $2.1 million, $4.3 million, and $5.0 million for the years ended December 31, 2008, 2009 and 2010, respectively.
Royalty Obligations—In December 2001, the Company entered into an exclusive worldwide license agreement with a university for certain technology developed by the university. As part of this agreement, the Company has agreed to pay royalties for sales of products using the licensed technology. The royalty payments include minimum guaranteed payments of $50,000 per year. In addition, as payment for this license, the Company issued 200,000 shares of the Company's common stock in December 2001. The term of the agreement shall remain in effect until the expiration of all issued patents. During the years ended December 31, 2008, 2009 and 2010, the Company paid royalties of $0.2 million, $0.3 million, and $0.4 million, respectively.
Additionally, under the terms of the license agreement, the Company is required to reimburse the university for certain legal fees related to the maintenance of the patents. The Company paid the university $0.1 million for each of the years ended December 31, 2008, 2009, and 2010, for patent legal fees and other related expenses, all of which are included in research and development expense in the accompanying consolidated statements of operations.
111
A123 Systems, Inc.
Notes to Consolidated Financial Statements (Continued)
10. Commitments and Contingencies (Continued)
Purchase Obligations—Purchase obligations include agreements or purchase orders to purchase goods or services that are enforceable and legally binding and specify all significant terms. Purchase obligations exclude agreements that are cancelable without penalty. As of December 31, 2010, the total outstanding purchase obligations, inclusive of the supply agreement described below, were $133.7 million, of which $96.7 million will be settled within the next twelve months. Purchase obligations related to capital equipment purchases may be partially reimbursable under the Company's various government grants.
In June 2010, the Company entered into a supply agreement for a raw material component which included commitments to purchase minimum product volumes for each of the years ending December 31, 2010 through December 31, 2013. If the Company's purchase volumes during any year fail to meet the minimum purchase commitments, it is required to pay the seller a variance payment for the difference between the amount actually purchased in that calendar year and the annual minimum purchase commitment for that calendar year. The Company will receive a credit for the amount of the variance payment to be applied to purchases in the following year and will have until April 1, 2015 to reclaim any variance payments resulting from the minimum purchase commitments for calendar years 2012 or 2013. This arrangement qualifies as a normal purchase and normal sales contract. For the year ended December 31, 2010, the Company has purchased $4.8 million under this supply agreement. The amounts of purchase commitments by year are as follows (in thousands):
| |
Purchase Commitment |
|||
|---|---|---|---|---|
2011 |
$ | 12,950 | ||
2012 |
18,500 | |||
2013 |
18,500 | |||
Total future purchase commitments |
$ | 49,950 | ||
Litigation—In November 2005, the Company received a letter asserting that it was infringing upon certain U.S. patents. In April 2006, the Company commenced an action in the United States District Court for the District of Massachusetts seeking a declaratory judgment that the patents in question were not infringed by the Company's products and that the patents claiming to be infringed upon are invalid. On September 11, 2006, a countersuit was filed against the Company and two of its business partners in the United States District Court for the Northern District of Texas alleging infringement of these patents. In October 2006 and January 2007, the U.S. Patent and Trademark Office ("PTO") granted the Company's request for reexamination of the two patents. In January and February 2007, the two suits were stayed pending the reexamination. The reexaminations of the two patents were concluded on April 15, 2008 and May 12, 2009, respectively. As a result, the scope of the claims in each patent were narrowed from those of the original claims made. The Company filed a motion to re-open the litigation in the United States District Court for the District of Massachusetts on June 11, 2009. On September 28, 2009, the Massachusetts court entered an order denying that motion, which the Company appealed on October 27, 2009 to the United States Court of Appeals for the Federal Circuit. The United States Court of Appeals for the Federal Court upheld the Massachusetts Court's decision on November 10, 2010. On July 22, 2009, the Company was sent a proposed Second Amended Complaint which the complainants intend to seek leave to file with the Texas court in light of the PTO's reexaminations. On August 27, 2009, Hydro-Quebec and UT filed a Motion for Leave to File
112
A123 Systems, Inc.
Notes to Consolidated Financial Statements (Continued)
10. Commitments and Contingencies (Continued)
Second Amended Complaint and Jury Demand in the United States District Court for the Northern District of Texas and the Company was granted several unopposed extensions to file its response. Hydro-Quebec and UT filed for leave to file an Amended Motion for Leave to File Second Amended Complaint and Jury Demand on April 1, 2010 and the Company filed its opposition to this application on April 22, 2010. The judge held a status hearing with the parties on May 14, 2010 and has entered a schedule for the case leading to a claim construction hearing which was held in December 2010. The Company has agreed to defend and indemnify the other named business partner for its legal costs in defending this litigation and any damages that may be awarded. The Company is unable to predict the outcome of this matter, and therefore no accrual has been established for this contingency.
11. Product Warranties
The Company provides for the estimated costs to fulfill customer warranty obligations upon the recognition of the related revenue. While the Company engages in extensive product quality programs and processes, including actively monitoring and evaluating the quality of its component suppliers, the Company's warranty obligation is affected by product failure rates, utilization levels, material usage, and supplier warranties on parts delivered to the Company. Should actual product failure rates, utilization levels, material usage, or supplier warranties on parts differ from the Company's estimates, revisions to the estimated warranty liability would be required.
Product warranty activity, which is recorded in accrued expenses and other long-term liabilities on the consolidated balance sheets, was as follows (in thousands):
| |
December 31, 2009 |
December 31, 2010 |
||||||
|---|---|---|---|---|---|---|---|---|
Product warranty liability—beginning of period |
$ | 1,813 | $ | 3,341 | ||||
Accruals for new warranties issued (warranty expense) |
1,834 | 1,924 | ||||||
Payments made (in cash or in kind) |
(306 | ) | (764 | ) | ||||
Product warranty liability—end of period |
3,341 | 4,501 | ||||||
Less amounts classified as current |
2,313 | 2,988 | ||||||
Long-term warranty liability |
$ | 1,028 | $ | 1,513 | ||||
12. Income Taxes
The provision for income taxes consists of the following components (in thousands):
| |
Year Ended December 31, | |||||||||
|---|---|---|---|---|---|---|---|---|---|---|
| |
2008 | 2009 | 2010 | |||||||
Current tax expense |
$ | 254 | $ | 290 | $ | 875 | ||||
Deferred tax expense/(benefit) |
21 | (12 | ) | (32 | ) | |||||
|
$ | 275 | $ | 278 | $ | 843 | ||||
The Company's provision for income taxes consists primarily of foreign taxes.
113
A123 Systems, Inc.
Notes to Consolidated Financial Statements (Continued)
12. Income Taxes (Continued)
Reconciling items from income tax computed at the statutory federal rate were as follows:
| |
Year Ended December 31, | |||||||||
|---|---|---|---|---|---|---|---|---|---|---|
| |
2008 | 2009 | 2010 | |||||||
Federal income tax at statutory rate |
34.0 | % | 34.0 | % | 34.0 | % | ||||
State income taxes, net of federal benefits |
4.2 | 2.8 | 2.6 | |||||||
Permanent adjustments |
(1.2 | ) | (2.3 | ) | 0.3 | |||||
Net research and development and other tax credits |
0.8 | 1.6 | 0.2 | |||||||
Valuation allowance |
(34.9 | ) | (35.8 | ) | (36.0 | ) | ||||
Foreign |
(2.8 | ) | (1.1 | ) | 0.1 | |||||
Other |
(0.4 | ) | 0.5 | (1.8 | ) | |||||
|
(0.3 | )% | (0.3 | )% | (0.6 | )% | ||||
Significant components of the Company's deferred tax assets and liabilities are as follows (in thousands):
| |
December 31, 2009 |
December 31, 2010 |
|||||
|---|---|---|---|---|---|---|---|
Net operating losses |
$ | 54,955 | $ | 101,872 | |||
Accruals and other |
9,218 | 17,304 | |||||
Deferred revenue |
11,650 | 10,688 | |||||
Credit carryforwards |
3,394 | 3,899 | |||||
Depreciation and amortization |
2,858 | 2,714 | |||||
Deferred tax assets before valuation allowance |
82,075 | 136,477 | |||||
Valuation allowance |
(81,880 | ) | (136,243 | ) | |||
Net deferred tax assets |
$ | 195 | $ | 234 | |||
At December 31, 2010, the Company had $283.4 million of federal net operating losses, $198.6 million of state net operating losses and $3.9 million of credit carryforwards that expire at various dates through 2030. The valuation allowance increased by $29.2 million and $54.4 million during 2009 and 2010, respectively, due to the increase in the net deferred tax assets by the same amounts (primarily due to the increased net operating losses). The net deferred tax assets are classified as other assets in the Company's consolidated balance sheet.
Under the provisions of the Internal Revenue Code, certain substantial changes in the Company's ownership, including a sale of the Company or significant changes in ownership due to sales of equity, may have limited, or may limit in the future, the amount of net operating loss carryforwards which could be used annually to offset future taxable income. The amount of any annual limitation is determined based upon the Company's value prior to an ownership change. The Company has not determined whether there has been such a cumulative change in ownership or the impact on the utilization of the loss carryforwards if such change has occurred.
The Company and its subsidiaries file income tax returns in the U.S. federal jurisdiction, and various states and foreign jurisdictions. With few exceptions, all tax years 2003 through 2010 remain open to examination by U.S. federal, state and local, or non-U.S. tax jurisdictions.
114
A123 Systems, Inc.
Notes to Consolidated Financial Statements (Continued)
12. Income Taxes (Continued)
As of December 31, 2010, the Company has provided a liability for $0.7 million for uncertain tax positions related to various foreign income tax matters which are classified as other long-term liabilities in the Company's consolidated balance sheets. The uncertain tax positions as of December 31, 2010 exclude interest and penalties of $0.2 million which are classified as other long-term liabilities on the Company's consolidated balance sheets. These uncertain tax positions would impact the Company's effective tax rate, if recognized. The Company does not expect that the amounts of uncertain tax positions will change significantly within the next 12 months.
A reconciliation of the beginning and ending amount of uncertain tax positions is as follows (in thousands):
| |
Year Ended December 31, | |||||||||
|---|---|---|---|---|---|---|---|---|---|---|
| |
2008 | 2009 | 2010 | |||||||
Balance at beginning of year |
$ | 860 | $ | 630 | $ | 631 | ||||
Settlements |
(24 | ) | (43 | ) | — | |||||
Fluctuation in foreign exchange rates |
(206 | ) | 44 | 38 | ||||||
Balance at end of year |
$ | 630 | $ | 631 | $ | 669 | ||||
The Company recognizes interest and penalties accrued related to uncertain tax positions in the provision for income taxes. During the years ended December 31, 2008, 2009, and 2010, the Company recognized approximately $0.1 million in penalties and interest, each year. The Company had approximately $0.2 million for the payment of penalties and interest included in other long-term liabilities at December 31, 2010.
13. Financing Arrangements
Long-Term Debt—Long-term debt consists of the following (in thousands):
| |
December 31, 2009 |
December 31, 2010 |
||||||
|---|---|---|---|---|---|---|---|---|
Term loan |
$ | 12,069 | $ | 7,069 | ||||
Mass Clean Energy loan |
— | 2,534 | ||||||
Korean subsidiary debt |
||||||||
Term loan 2 |
1,289 | — | ||||||
Technology funds loan |
107 | 44 | ||||||
Korean government loans |
429 | 335 | ||||||
Total |
13,894 | 9,982 | ||||||
Less amounts classified as current |
6,456 | 5,379 | ||||||
Long-term debt |
$ | 7,438 | $ | 4,603 | ||||
Term Loan—The Company has a term loan agreement with a financial institution that has a term loan facility for $15.0 million. The term loan facility is repayable over a 36-month period and accrues interest at the financial institution's prime rate (which was 4.0% at December 31, 2010) plus 0.75%. This term loan facility matures in September 2012.
115
A123 Systems, Inc.
Notes to Consolidated Financial Statements (Continued)
13. Financing Arrangements (Continued)
The term loan agreement requires the Company to comply with certain financial covenants, which include a minimum liquidity ratio calculation. As of December 31, 2010, the Company is in compliance with the financial covenants. The term loan agreement is collateralized by substantially all assets of the Company, excluding intellectual property, property and equipment owned as of December 31, 2005 and certain equipment located in China.
Mass Clean Energy Loan—The Company has a forgivable loan from the Massachusetts Clean Energy Technology Center for $5.0 million. If the Company complies with certain capital expenditure conditions, $2.5 million of the loan will be forgiven and if the Company complies with certain employment conditions and additional $2.5 million will be forgiven. As of December 31, 2010,$ 2.5 million is recorded as an offset to property, plant and equipment in the consolidated balance sheet as the Company is reasonably assured that the Company will comply with the conditions for the forgiveness related to the capital expenditure condition. As of December 31, 2010, the remaining $2.5 million is recorded as long-term debt. The loan has a fixed interest rate of 6.0% and all funds borrowed under the agreement and accrued interest is due upon maturity in October 2017 if the Company has not complied with the forgiveness conditions.
Korean debt—The Company has the following outstanding obligations for its Korean subsidiary:
• Term loan 2—On March 5, 2008, the Company entered into two loan agreements with a financial institution in the amounts of $1.3 million and $0.3 million, which matured in 2010. The loans had a variable interest rate. Term loan 2 was paid off during February 2010.
• Technology funds loan—The Company has a technology funds loan agreement amounting to $44.2 thousand with a variable interest rate. The weighted average interest rate for the loan as of December 31, 2010 was 4.79%. The loan matures in August 2011.
• Korean government loans—As a part of the Korean government's initiative to promote and encourage the development of start-up companies in certain high technology industries, high technology start-up companies with industry leading technology or products are eligible for government loans. Certain grants are refundable, depending on the successful development and commercialization of the technology or products, and a company receiving such government grants is required to refund between 20% and 30% of the grants received for such development.
116
A123 Systems, Inc.
Notes to Consolidated Financial Statements (Continued)
13. Financing Arrangements (Continued)
Future principal payments due under the long-term debt agreements at December 31, 2010 are as follows (in thousands):
Years Ending December 31,
|
Long-Term Debt Obligations |
|||
|---|---|---|---|---|
2011 |
$ | 5,379 | ||
2012 |
2,069 | |||
2013 |
— | |||
2014 |
— | |||
2015 |
— | |||
Thereafter |
2,534 | |||
Total future principal payments |
9,982 | |||
Less current portion |
5,379 | |||
Long-term portion |
$ | 4,603 | ||
Revolving Credit Facilities—The Company entered into a line of credit ("LOC") for $8.0 million with a financial institution. The Company entered into a loan modification agreement, effective December 23, 2010, with the financial institution to extend the maturity date of the LOC to March 22, 2011. The line of credit accrues interest at prime. The outstanding balance at December 31, 2009 and December 31, 2010 was $8.0 million. The Company is required to comply with the same financial covenants required under the Term Loan mentioned above.
14. Stock-Based Compensation
Stock Incentive Plans and Stock-Based Compensation—During 2009, the Company's Board of Directors approved the 2009 Stock Incentive Plan (the "2009 Plan"), which became effective on the closing of the Company's initial public offering ("IPO") on September 24, 2009. The 2009 Plan provides for the grant of qualified incentive stock options, nonqualified stock options, stock appreciation rights, restricted stock, restricted stock units, and other stock-based awards for the purchase of shares of the Company's common stock to the Company's employees, officers, directors, and outside consultants. Originally, an aggregate of 3,000,000 shares of Company's common stock, subject to increase on an annual basis, were reserved for future issuance under the 2009 Plan. Shares of common stock reserved for issuance under the Company's 2001 Stock Incentive Plan (the "2001 Plan") that remained available for issuance immediately prior to closing of the IPO and any shares of common stock subject to awards under the 2001 Plan that expired, terminated, or were otherwise forfeited, canceled or repurchased by the Company prior to being fully exercised were added to the number of shares available under the 2009 Plan, up to a maximum of 500,000 shares. During the years ended December 31, 2009 and 2010, 378,792 and 121,208 shares from the 2001 Plan were added to the number of shares available under the 2009 Plan, respectively. No additional shares from the 2001 Plan will be added to the 2009 Plan. On January 1, 2010, 5,000,000 shares were added to the 2009 Plan in connection with the annual increase. At December 31, 2010, stock awards outstanding under the 2009 Plan included stock options and restricted stock units. As of December 31, 2010, the Company had 5,071,395 stock-based awards available for future grant under the 2009 Plan, and no stock-based awards available for future grant under the 2001 Plan.
117
A123 Systems, Inc.
Notes to Consolidated Financial Statements (Continued)
14. Stock-Based Compensation (Continued)
Stock-based compensation cost is measured at the grant date, based on the calculated fair value of the award, and is recognized as an expense over the service period (generally the vesting period of the equity grant). The Company estimates forfeitures at the time of grant and revises the estimates, if necessary, in subsequent periods if actual forfeitures differ from those estimates. The following table presents stock-based compensation expense included in the Company's consolidated statements of operations (in thousands):
| |
Year Ended December 31, | |||||||||
|---|---|---|---|---|---|---|---|---|---|---|
| |
2008 | 2009 | 2010 | |||||||
Cost of sales |
$ | 485 | $ | 1,469 | $ | 1,898 | ||||
Research, development and engineering |
2,493 | 3,808 | 4,647 | |||||||
Sales and marketing |
437 | 849 | 1,311 | |||||||
General and administrative |
1,093 | 2,427 | 3,906 | |||||||
Total |
$ | 4,508 | $ | 8,553 | $ | 11,762 | ||||
The Company has capitalized an immaterial amount of stock-based compensation as a component of inventory.
As of December 31, 2010, there was approximately $31.6 million of total unrecognized compensation cost related to non-vested stock-based compensation arrangements granted under the plans, which is expected to be recognized over a weighted-average period of 2.70 years.
Stock Options—Stock options generally vest over a four-year period and expire 10 years from the date of grant. Upon option exercise, the Company issues shares of common stock.
The following table summarizes stock option activity for the year ended December 31, 2010:
| |
Shares | Weighted Average Exercise Price |
Weighted Average Remaining Contractual Term |
Aggregate Intrinsic Value |
|||||||||
|---|---|---|---|---|---|---|---|---|---|---|---|---|---|
| |
(In thousands) |
|
|
(In thousands) |
|||||||||
Outstanding—January 1, 2010 |
10,640 | $ | 5.98 | 7.40 | $ | 175,122 | |||||||
Granted |
3,043 | 9.74 | |||||||||||
Exercised |
(2,156 | ) | 2.00 | ||||||||||
Forfeited |
(744 | ) | 8.89 | ||||||||||
Outstanding—December 31, 2010 |
10,783 | $ | 7.64 | 7.41 | $ | 27,743 | |||||||
Vested or expected to vest—December 31, 2010 |
10,295 | $ | 7.53 | 7.32 | $ | 27,462 | |||||||
Options exercisable—December 31, 2010 |
5,385 | $ | 5.55 | 6.05 | $ | 23,595 | |||||||
The Company estimates the fair value of stock options granted using the Black-Scholes option-pricing model and assumptions as to the fair value of the common stock on the grant date, expected term, expected volatility, risk-free rate of interest and an assumed dividend yield.
Prior to the Company's IPO, in determining the exercise prices for awards and options granted, the Company's Board of Directors has considered the fair value of the common stock as of the date of
118
A123 Systems, Inc.
Notes to Consolidated Financial Statements (Continued)
14. Stock-Based Compensation (Continued)
grant. The Board of Directors determined the fair value of the common stock after considering a broad range of factors, including, but not limited to, the prices for the Company's redeemable convertible preferred stock sold to outside investors in arm's-length transactions, the rights, preferences and privileges of that redeemable convertible preferred stock relative to those of the Company's common stock, the Company's operating and financial performance, the hiring of key personnel, the introduction of new products, the Company's stage of development and revenue growth, the lack of an active public market for common and preferred stock, industry information such as market growth and volume, the performance of similarly-situated companies in the Company's industry, the execution of strategic and development agreements, the risks inherent in the development and expansion of our products and services, the prices of our common stock sold to outside investors in arm's-length transactions, and the likelihood of achieving a liquidity event, such as an initial public offering or a sale of the Company given prevailing market conditions and the nature and history of the Company's business. For awards granted subsequent to the Company's IPO, the fair value of the common stock is generally determined based on the closing price of the stock on the Nasdaq Global Select Market on the grant date.
The Black-Scholes model assumptions for each of the periods set forth below are as follows:
| |
Year Ended December 31, | |||||||||
|---|---|---|---|---|---|---|---|---|---|---|
| |
2008 | 2009 | 2010 | |||||||
Risk-free interest rate |
3.0 - 3.4 | % | 2.7 - 3.2 | % | 1.9 - 3.3 | % | ||||
Expected life |
6.14 years | 6.25 years | 6.25 years | |||||||
Expected volatility |
66 | % | 73 | % | 74 | % | ||||
Expected dividends |
0 | % | 0 | % | 0 | % | ||||
The Company derived the risk-free interest rate assumption from the U.S. Treasury's rates for U.S. Treasury zero-coupon bonds with maturities similar to those of the expected term of the awards being valued. The Company based the assumed dividend yield on its expectation of not paying dividends in the foreseeable future. The Company calculated the weighted average expected life of options using the simplified method as prescribed by the Stock Compensation Subtopic of the Codification. This decision was based on the lack of relevant historical data due to the Company's limited operating experience. In addition, due to the Company's limited historical data, the estimated volatility also reflects the application of the Stock Compensation Subtopic, incorporating the historical volatility of comparable companies with publicly-available share prices.
The weighted average grant date fair value of options granted during the years ended December 31, 2008, 2009 and 2010 was $9.10, $7.24 and $6.55, respectively. The intrinsic value of options exercised during the years ended December 31, 2008, 2009 and 2010 was $3.7 million, $1.7 million and $26.1 million, respectively.
The Company received $0.1 million, $0.4 million, and $4.3 million in cash from option exercises during the years ended December 31, 2008, 2009 and 2010, respectively.
During the year ended December 31, 2008, the Company granted stock options to purchase 10,000 shares of common stock to certain advisors (non-employees) of the Company in consideration of services being performed. These options vested immediately when granted, and had a fair value of $14,000, which was immediately expensed.
119
A123 Systems, Inc.
Notes to Consolidated Financial Statements (Continued)
14. Stock-Based Compensation (Continued)
Restricted Stock Units—During the year ended December 31, 2010, the Company granted restricted stock unit awards to certain executives. The restricted stock unit awards generally vest over a four-year period and upon vesting the Company issues shares of common stock. The following table summarizes the Company's restricted stock unit award activity for the year ended December 31, 2010:
| |
Shares | Weighted Average Fair Value |
|||||
|---|---|---|---|---|---|---|---|
| |
(In thousands) |
|
|||||
Non-vested—January 1, 2010 |
— | $ | — | ||||
Granted |
203 | 10.13 | |||||
Vested |
— | — | |||||
Forfeited |
— | — | |||||
Non-vested—December 31, 2010 |
203 | $ | 10.13 | ||||
The fair value of restricted stock unit awards is determined based on the closing price of the Company's common stock on the Nasdaq Global Select Market on the grant date.
During the year ended December 31, 2008, the Company issued five restricted stock awards for a total of 24,000 shares of restricted common stock to certain advisors (non-employees) of the Company in consideration of services being performed. These awards were fully vested upon grant, and the Company recognized $0.3 million of stock-based compensation expense related to these awards during the year ended December 31, 2008.
120
A123 Systems, Inc.
Notes to Consolidated Financial Statements (Continued)
15. Redeemable Convertible Preferred Stock
The following is the activity of the Company's redeemable convertible preferred stock for the years ended December 31, 2008 and 2009 (in thousands):
| |
Redeemable Convertible Preferred Stock | |||||||||||||||||||||||||||||||||||||||||||||
|---|---|---|---|---|---|---|---|---|---|---|---|---|---|---|---|---|---|---|---|---|---|---|---|---|---|---|---|---|---|---|---|---|---|---|---|---|---|---|---|---|---|---|---|---|---|---|
| |
Series A | Series A-1 | Series B | Series C | Series D | Series E | Series F | |
||||||||||||||||||||||||||||||||||||||
| |
Shares | Amount | Shares | Amount | Shares | Amount | Shares | Amount | Shares | Amount | Shares | Amount | Shares | Amount | Total | |||||||||||||||||||||||||||||||
Balance—January 1, 2008 |
8,312 | $ | 8,373 | 2,925 | $ | 4,344 | 9,624 | $ | 19,995 | 8,988 | $ | 30,276 | 10,670 | $ | 69,926 | — | $ | — | — | $ | — | $ | 132,914 | |||||||||||||||||||||||
Sale of series E redeemable convertible preferred stock, net of issuance costs of $88 |
— | — | — | — | — | — | — | — | — | — | 6,153 | 101,998 | — | — | 101,998 | |||||||||||||||||||||||||||||||
Accretion of redeemable convertible preferred stock to redemption value |
— | 2 | — | 8 | — | 1 | — | 5 | — | 15 | — | 11 | — | — | 42 | |||||||||||||||||||||||||||||||
Balance—December 31, 2008 |
8,312 | 8,375 | 2,925 | 4,352 | 9,624 | 19,996 | 8,988 | 30,281 | 10,670 | 69,941 | 6,153 | 102,009 | — | — | 234,954 | |||||||||||||||||||||||||||||||
Sale of series F redeemable convertible preferred stock, net of issuance costs of $262 |
— | — | — | — | — | — | — | — | — | — | — | — | 10,862 | 99,590 | 99,590 | |||||||||||||||||||||||||||||||
Accretion of redeemable convertible preferred stock to redemption value |
— | 1 | — | 5 | — | 1 | — | 2 | — | 8 | — | 11 | — | 17 | 45 | |||||||||||||||||||||||||||||||
Conversion of redeemable convertible preferred stock to common stock |
(8,312 | ) | (8,376 | ) | (2,925 | ) | (4,357 | ) | (9,624 | ) | (19,997 | ) | (8,988 | ) | (30,283 | ) | (10,670 | ) | (69,949 | ) | (6,153 | ) | (102,020 | ) | (10,862 | ) | (99,607 | ) | (334,589 | ) | ||||||||||||||||
Balance—December 31, 2009 |
— | $ | — | — | $ | — | — | $ | — | — | $ | — | — | $ | — | — | $ | — | — | $ | — | $ | — | |||||||||||||||||||||||
During 2008, the Company issued 6.2 million shares of Series E at $16.59 per share, for gross proceeds of $102.1 million. The total direct costs related to the issuance of Series E were $0.1 million.
During 2009, the Company authorized and issued 10.9 million shares of Series F at $9.20 per share, for gross proceeds of $99.9 million. The total direct costs related to the issuance of Series F was approximately $0.3 million.
On September 29, 2009, in conjunction with the closing of the Company's IPO, all of the Company's 57,533,713 outstanding redeemable convertible preferred shares automatically converted on a one-for-one basis, except for Series E redeemable convertible preferred stock, which converted on a one-for-1.38 basis, into 59,881,160 shares of common stock. At December 31, 2009 and 2010, the Company had no redeemable convertible preferred shares outstanding.
16. Redeemable Common Stock
In January and February 2008, the Company issued 693,000 and 900,000 shares of common stock to investors, respectively, at $7.22 per share, for gross proceeds of $11.5 million. The issuance of the common stock was pursuant to a subscription agreement. Under certain circumstances, purchasers could redeem this common stock from the Company at the original issuance price of $7.22 per share. At any time following the later of January 24, 2013 and the date on which all shares of the Company's Preferred Stock, $.001 par value per share, have been either redeemed by the Company or converted into shares of the Company's common stock, a holder of the redeemable common stock could make a request for redemption. If the Company did not have sufficient funds legally available to redeem all of the redeemable common stock, the Company would redeem the maximum shares of redeemable common stock permissible out of funds legally available and would redeem the remaining shares of redeemable as soon as practicable. The redemption right of the redeemable common stock would
121
A123 Systems, Inc.
Notes to Consolidated Financial Statements (Continued)
16. Redeemable Common Stock (Continued)
terminate upon an effective registration statement filed by the Company under the Securities Act of 1933 in connection with a public stock offering.
The redemption rights of the redeemable common stock terminated on September 29, 2009 in connection with the IPO. At December 31, 2010, the 1,592,797 shares previously classified as redeemable common stock are included in common stock on the consolidated balance sheets.
17. Stockholders' (Deficit) Equity
Series B-1 Convertible Preferred Stock—In January 2006, the Company issued 1.5 million shares of Series B-1 in connection with the acquisition of T/J Technologies, Inc. with a fair value at the date of acquisition of $5.2 million. Series B-1 was not redeemable.
On September 29, 2009, in conjunction with the closing of the Company's IPO, all of the Company's 1.5 million outstanding shares of convertible preferred stock automatically converted on a one-for-one basis, into shares of common stock. At December 31, 2009, the Company had no convertible preferred shares outstanding.
Issuance of Common Stock—On September 29, 2009, the Company closed its initial public offering of common stock of 32,407,576 shares of common stock at an offering price of $13.50 per share, of which 31,727,075 shares were sold by the Company and 680,501 shares were sold by selling stockholders, resulting in net proceeds to the Company of approximately $391.8 million, after deducting underwriting discounts and offering costs.
During the year ended December 31, 2010, the Company issued 479,282 shares of its common stock in conjunction with cash to the Automaker as consideration for an investment in the Automaker's preferred stock.
18. Related Party Transactions
Transactions with Holders of Common Stock—The Company has a business relationship with a stockholder and certain of its affiliates who are also holders of the Company's common stock. The relationship consists of professional services to assist the Company in the design and development of various battery systems for the transportation sector. Payments made by the Company to the affiliate of the stockholder for the professional services amounted to $4.8 million for the year ended December 31, 2008. The Company made no payments to the affiliate of the stockholder for the years ended December 31, 2009 and 2010. The balance due to the affiliate of the stockholder for the professional services agreement as of December 31, 2009 and 2010 was $0.4 million.
Transactions with Joint Venture Partner's Affiliate—In December 2009, the Company entered into a joint venture with an automaker in China (the "Chinese Automaker") to assist the Company in growing business and sales in China's transportation industry. The Company entered into two development agreements with the Chinese Automaker. During the years ended December 31, 2009 and 2010, the Company recorded revenue related to the development and supply agreements with the Chinese Automaker of $0.1 and $2.2 million, respectively. As of December 31, 2009 and 2010, $0.7 million and $0.5 million is recorded in deferred revenue on the consolidated balance sheets, respectively, related to the development and supply agreements, which will be recognized upon completion and acceptance of the deliverables. As of December 31, 2009 and 2010, the balance due from the automaker was
122
A123 Systems, Inc.
Notes to Consolidated Financial Statements (Continued)
18. Related Party Transactions (Continued)
$0.8 million and $1.9 million, respectively, which is included within accounts receivable on the consolidated balance sheets.
Transactions with Cost-Method Investment—In January, 2010, the Company has entered into a supply agreement with the Automaker in which the Company also holds an investment of preferred stock. The Company recognizes revenue on product shipments to the Automaker, within the consolidated statements of operations, when all revenue recognition criteria are met. During the year ended December 31, 2010, the Company recorded $1.7 million of revenue from the Automaker. No revenue from the Automaker was recorded in 2008 or 2009. The balance due from the Automaker as of December 31, 2010, of $0.6 million, is included within accounts receivable on the consolidated balance sheet.
Transactions with Equity-Method Investment—During March 2010, the Company entered into a technology license contract to license certain patents and technology to the Company's Joint Venture for the term of the Joint Venture, which extends to April 28, 2030. In conjunction with the license agreement, the Joint Venture paid the Company the first payment of the license fee of $1.0 million during the year ended December 31, 2010. Revenue on the license fee will be amortized over the term of the license. Revenue recognition is expected to commence upon the successful completion of training provided to employees of the Joint Venture. As of December 31, 2010, the $1.0 million of the license fee is recorded in deferred revenue on the consolidated balance sheets. During December 2010, the Company entered into a service agreement to provide technical development, design, analysis and consultation services to the Joint Venture. Additionally, the Company entered into an agreement to provide sample battery system packs to the Joint Venture. Through December 31, 2010, the Company has recognized $0.2 million of service revenue and has deferred $0.2 million of service and product revenue related to the service agreement and initial sample shipments. As of December 31, 2010, $0.5 million is included within accounts receivable on the consolidated balance sheet for amounts due from the Joint Venture.
123
A123 Systems, Inc.
Notes to Consolidated Financial Statements (Continued)
19. Quarterly Information (Unaudited)
The following information has been derived from unaudited consolidated financial statements that, in the opinion of management, include all recurring adjustments necessary for a fair statement of such information (in thousands, except per share amounts):
Quarter Ended
|
March 31, | June 30, | September 30, | December 31, | Total | |||||||||||
|---|---|---|---|---|---|---|---|---|---|---|---|---|---|---|---|---|
Fiscal year 2010 |
||||||||||||||||
Revenue |
$ | 24,468 | $ | 22,608 | $ | 26,218 | $ | 24,018 | $ | 97,312 | ||||||
Gross loss |
(2,041 | ) | (2,949 | ) | (3,075 | ) | (9,374 | ) | (17,439 | ) | ||||||
Net loss |
(29,102 | ) | (34,287 | ) | (43,735 | ) | (45,813 | ) | (152,937 | ) | ||||||
Net loss attributable to A123 Systems, Inc. common stockholders |
(29,025 | ) | (34,218 | ) | (43,656 | ) | (45,661 | ) | (152,560 | ) | ||||||
Net loss per share attributable to A123 Systems, Inc. common stockholders—basic and diluted |
$ | (0.28 | ) | $ | (0.33 | ) | $ | (0.42 | ) | $ | (0.43 | ) | $ | (1.46 | ) | |
Fiscal year 2009 |
||||||||||||||||
Revenue |
$ | 23,220 | $ | 19,702 | $ | 23,597 | $ | 24,530 | $ | 91,049 | ||||||
Gross profit (loss) |
1,806 | (2,575 | ) | (1,875 | ) | (48 | ) | (2,692 | ) | |||||||
Net loss |
(18,884 | ) | (22,340 | ) | (22,891 | ) | (22,474 | ) | (86,589 | ) | ||||||
Net loss attributable to A123 Systems, Inc. common stockholders |
(18,748 | ) | (21,930 | ) | (22,815 | ) | (22,331 | ) | (85,824 | ) | ||||||
Net loss per share attributable to A123 Systems, Inc. common stockholders—basic and diluted |
$ | (2.02 | ) | $ | (2.36 | ) | $ | (1.78 | ) | $ | (0.20 | ) | $ | (2.55 | ) | |
Fiscal year 2008 |
||||||||||||||||
Revenue |
$ | 10,298 | $ | 11,636 | $ | 22,942 | $ | 23,649 | $ | 68,525 | ||||||
Gross profit (loss) |
(1,507 | ) | (3,234 | ) | 1,020 | (8,523 | ) | (12,244 | ) | |||||||
Net loss |
(13,975 | ) | (18,957 | ) | (18,943 | ) | (28,556 | ) | (80,431 | ) | ||||||
Net loss attributable to A123 Systems, Inc. common stockholders |
(13,908 | ) | (19,107 | ) | (18,981 | ) | (28,516 | ) | (80,512 | ) | ||||||
Net loss per share attributable to A123 Systems, Inc. common stockholders—basic and diluted |
$ | (1.71 | ) | $ | (2.12 | ) | $ | (2.06 | ) | $ | (3.08 | ) | $ | (9.04 | ) | |
124
A123 Systems, Inc.
Notes to Consolidated Financial Statements (Continued)
20. Subsequent Events
In February 2011, the Company entered into an agreement to transfer certain of its assets held by its wholly owned Korean subsidiary to its joint venture with a quasi governmental entity in the PRC in return for cash consideration totaling $0.2 million. For the years ended December 31, 2009 and 2010, the joint venture was consolidated as a variable-interest entity. Subsequent to the transfer, the Company will no longer be significantly involved in the operations of the joint venture and therefore will no longer consolidate the joint venture; however, the Company will retain a minority ownership stake in the entity. For the years ended December 31, 2008, 2009, and 2010, the consolidated operations of the joint venture did not have a material impact on the Company's consolidated financial operations and did not represent a material portion of the Company's total consolidated assets.
The Company has evaluated the period from December 31, 2010, the date of the consolidated financial statements, through the date of the issuance and filing of the consolidated financial statements, and has determined that no material subsequent events have occurred that would affect the information presented in these consolidated financial statements or require additional disclosure.
125
Item 9. Changes in and Disagreements With Accountants on Accounting and Financial Disclosure.
None.
Item 9A. Controls and Procedures.
Evaluation of Disclosure Controls and Procedures.
Our management, with the participation and supervision of our Chief Executive Officer and interim Chief Financial Officer, is responsible for our disclosure controls and procedures pursuant to Rules 13a-15(e) and 15d-15(e) under the Securities Exchange Act of 1934, as amended (the "Exchange Act"). Disclosure controls and procedures are controls and other procedures that are designed to ensure that information required to be disclosed in our reports filed or submitted under the Exchange Act is recorded, processed, summarized and reported, within the time periods specified under the Securities and Exchange Commission's rules and forms. Disclosure controls and procedures included controls and procedures designed to ensure that information required to be disclosed in our reports filed under the Exchange Act is accumulated and communicated to our principal executive officer and our principal financial officer, as appropriate, to allow timely decisions regarding required disclosure.
Our management, including the Chief Executive Officer and the interim Chief Financial Officer, carried out an evaluation of the effectiveness of our disclosure controls and procedures as of December 31, 2010. Based on this evaluation, our management concluded that as of December 31, 2010, that these disclosure controls and procedures were not operating effectively at the reasonable assurance level as a result of the material weakness in our internal control over financial reporting, which we view as an integral part of our disclosure controls and procedures, discussed in further detail below.
Management's Annual Report on Internal Control over Financial Reporting.
Our management is responsible for establishing and maintaining adequate internal control over our financial reporting, as defined in Rule 13a-15(f) under the Exchange Act. Internal control over financial reporting is a process designed by, or under the supervision of, the company's principal executive and principal financial officers, or persons performing similar functions, and effected by the company's board of directors, management, and other personnel, to provide reasonable assurance regarding the reliability of financial reporting and the preparation of financial statements for external purposes in accordance with GAAP and includes those policies and procedures that:
(1) Pertain to the maintenance of records that, in reasonable detail, accurately and fairly reflect the transactions and dispositions of the assets of the company;
(2) Provide reasonable assurance that transactions are recorded as necessary to permit preparation of financial statements in accordance with GAAP, and that receipts and expenditures of the company are being made only in accordance with authorizations of management and directors of the company; and
(3) Provide reasonable assurance regarding prevention or timely detection of unauthorized acquisition, use or disposition of the company's assets that could have a material effect on the financial statements.
Because of inherent limitations, no matter how well designed and operated, internal control over financial reporting may not prevent or detect misstatements and can only provide reasonable assurance of achieving the desired control objectives. In addition, the design of internal control over financial reporting must reflect the fact that there are resource constraints and that management is required to apply its judgment in evaluating the benefits of possible controls and procedures relative to their costs.
126
Our Chief Executive Officer and interim Chief Financial Officer have performed an evaluation of our internal control over financial reporting under the framework in Internal Control—Integrated Framework, issued by the Committee of Sponsoring Organizations of the Treadway Commission. The objective of this assessment was to determine whether our internal control over financial reporting was effective at December 31, 2010.
A material weakness is a deficiency, or combination of deficiencies, in internal control over financial reporting such that there is a reasonable possibility that a material misstatement of our annual or interim consolidated financial statements will not be prevented or detected on a timely basis. In our assessment of the effectiveness of internal control over financial reporting at December 31, 2010, we identified the following material weakness:
We have not designed or maintained effective internal controls and information technology controls over the financial statement close and reporting process. Such controls are necessary to ensure the accurate and timely preparation of financial statements in accordance with Generally Accepted Accounting Principles. The following deficiencies contribute to the material weakness:
- •
- our design and implementation of certain controls are incomplete or overly reliant on manual reviews and we had
insufficient time to determine if controls developed throughout 2010 were implemented and operating effectively,
- •
- we have not been able to hire and integrate staff as quickly as necessary, and the departure of our former CFO in January
2011 further stretched our limited accounting and finance resources, and
- •
- we have not yet formalized information technology control policies in certain manufacturing locations.
This results in a possibility that a material misstatement in the financial statements may not be prevented or detected on a timely basis.
Based on our assessment, and because of the material weakness described above, we have concluded that our internal control over financial reporting was not effective at December 31, 2010.
Our independent registered public accounting firm, Deloitte & Touche, LLP, has audited our consolidated financial statements and has issued an attestation report on our internal controls over financial reporting as of December 31, 2010, which report is included herein.
Material Weakness Discussion and Remediation.
Over the past several years, our business has been in transition as we are expanding our internal infrastructure to support future growth and more complex business operations. This overall growth and increase in complexity of our business and its operations has strained our control structure, including the structure that supports the effective operation of internal controls over accounting and financial reporting processes. In response to this, we have implemented a number of manual controls, analyses and other post-closing procedures designed to mitigate the risks of a material misstatement to our financial statements occurring and not being detected. However, these manual controls alone may not be sufficient to prevent and detect all potential material misstatements that could occur. As a result, our control environment is more prone to misstatements occurring without being detected.
As disclosed in our Annual Report on Form 10-K for the year ended December 31, 2009, filed with the SEC on March 15, 2010, we previously identified two material weaknesses related to our
127
internal control over financial reporting. During the year ended December 31, 2010, we made extensive improvements in our internal control over our financial reporting including:
- •
- adding accounting and finance resources with technical accounting and financial reporting experience,
- •
- documenting our internal control processes over financial reporting including applicable general computer controls,
- •
- implementing improved financial reporting disclosure controls and procedures,
- •
- formalizing our process for review and approval of journal entries and account reconciliations,
- •
- further restricting access within our information technology systems to appropriate personnel and implementing a process
to periodically review access to the information technology systems, and
- •
- implementing new information technology components to more effectively utilize our information technology systems, eliminating some manual controls over financial reporting.
After taking our remediation activities into account, the Company has considered and evaluated the remaining control deficiencies that were components of the two previously identified material weaknesses and has determined as of December 31, 2010 that they aggregate into the one material weakness described in management's report above. Overall, the steps described above have enhanced the overall effectiveness of our internal control over financial reporting. However, certain controls designed and implemented during the year to address the previously identified material weakness in the period-end financial reporting process, have not been operational for a sufficient period of time to allow management to conclude that they are operating effectively. In addition due to the overall growth in our business and increased complexity, we have not fully designed and implemented all controls at a level of precision necessary for management to conclude that a material misstatement in the financial statements would be prevented or detected on a timely basis. As such, management determined that our internal controls do not effectively mitigated the risk that a material misstatement in our financial statements could occur and not be prevented or detected.
Further, our former Chief Financial Officer left the company in January 2011 and, as a result, on an interim basis, our Vice President of Finance and Corporate Controller is also fulfilling the role as the interim Chief Financial Officer. Consequently, we had a lack of continuity of senior financial management during the preparation of our annual report for the year ended December 31, 2010. It should be noted that we added additional resources to supplement the Vice President of Finance and Corporate Controller's role in the financial close and reporting process during our year-end reporting period.
To address the material weakness in our internal control over financial reporting described above, we performed additional analyses and other post-closing procedures designed to provide reasonable assurance that our consolidated financial statements were prepared in accordance with GAAP. As a result of these procedures, we believe that the consolidated financial statements included in this Annual Report on Form 10-K for the year ended December 31, 2010 fairly present, in all material respects, our financial position, results of operations and cash flow for the periods presented in conformity with GAAP.
128
We intend to continue to take appropriate and reasonable steps to make necessary improvements tour internal control over financial reporting, including:
- •
- completing the implementation of a production planning and inventory management information systems which we plan to fully
integrate into our accounting process in future periods to significantly reduce the manual processes and controls over our production and inventory processes,
- •
- more fully deploying our existing information systems to improve efficiency and effectiveness of gathering data, thereby
reducing our reliance on manual processes and controls,
- •
- implementing steps to improve information flow between our finance department and other functional areas within our
company to ensure that information that could affect the financial statements is identified and appropriately considered, and
- •
- hiring an additional member of senior management within the finance department, and other resources as needed to enhance our internal control environment.
We expect that our remediation efforts, including design, implementation and testing will continue throughout fiscal year 2011. As we scale our operations to support a larger and more complex business, and concurrently adapt our control environment to these changes, we plan to increase our utilization of information systems and automated controls.
We believe that the remediation measures described above will strengthen our internal control over financial reporting and remediate the material weakness we have identified. We are committed to continuing to improve our internal control processes and will continue to diligently review our financial controls and procedures. As we continue to evaluate and work to improve our internal control over financial reporting, we may take additional measures to address control deficiencies and upgrade or enhance existing internal controls as our business grows.
Changes in Internal Control over Financial Reporting.
There were no changes in our internal control over financial reporting, other than those stated above, during our most recent fiscal quarter that have materially affected, or are reasonably likely to materially affect, our internal control over financial reporting.
129
REPORT OF INDEPENDENT REGISTERED PUBLIC ACCOUNTING FIRM
To
the Board of Directors and Stockholders of
A123 Systems, Inc.
Watertown, Massachusetts
We have audited A123 Systems, Inc.'s and subsidiaries' (the "Company's") internal control over financial reporting as of December 31, 2010, based on the criteria established in Internal Control—Integrated Framework issued by the Committee of Sponsoring Organizations of the Treadway Commission. The Company's management is responsible for maintaining effective internal control over financial reporting and for its assessment of the effectiveness of internal control over financial reporting, including the accompanying Management's Annual Report on Internal Control over Financial Reporting. Our responsibility is to express an opinion on the Company's internal control over financial reporting based on our audit.
We conducted our audit in accordance with the standards of the Public Company Accounting Oversight Board (United States). Those standards require that we plan and perform the audit to obtain reasonable assurance about whether effective internal control over financial reporting was maintained in all material respects. Our audit included obtaining an understanding of internal control over financial reporting, assessing the risk that a material weakness exists, testing and evaluating the design and operating effectiveness of internal control based on that risk, and performing such other procedures as we considered necessary in the circumstances. We believe our audit provide a reasonable basis for our opinion.
A company's internal control over financial reporting is a process designed by, or under the supervision of, the company's principal executive and principal financial officers, or persons performing similar functions, and effected by the company's board of directors, management, and other personnel to provide reasonable assurance regarding the reliability of financial reporting and the preparation of financial statements for external purposes in accordance with generally accepted accounting principles. A company's internal control over financial reporting includes those policies and procedures that (1) pertain to the maintenance of records that, in reasonable detail, accurately and fairly reflect the transactions and dispositions of the assets of the company; (2) provide reasonable assurance that transactions are recorded as necessary to permit preparation of financial statements in accordance with generally accepted accounting principles, and that receipts and expenditures of the company are being made only in accordance with authorizations of management and directors of the company; and (3) provide reasonable assurance regarding prevention or timely detection of unauthorized acquisition, use, or disposition of the company's assets that could have a material effect on the financial statements.
Because of the inherent limitations of internal control over financial reporting, including the possibility of collusion or improper management override of controls, material misstatements due to error or fraud may not be prevented or detected on a timely basis. Also, projections of any evaluation of the effectiveness of the internal control over financial reporting to future periods are subject to the risk that the controls may become inadequate because of changes in conditions, or that the degree of compliance with the policies or procedures may deteriorate.
A material weakness is a deficiency, or a combination of deficiencies, in internal control over financial reporting, such that there is a reasonable possibility that a material misstatement of the company's annual or interim financial statements will not be prevented or detected on a timely basis. The following material weakness has been identified and included in management's assessment: The Company has not designed or maintained effective internal controls over the financial statement close and reporting process. The following deficiencies contribute to the material weakness: i) the Company's design and implementation of certain controls are incomplete or overly reliant on manual reviews and the Company had insufficient time to determine if controls developed throughout 2010 were implemented or operating effectively, ii) the Company has not been able to hire and integrate staff as
130
quickly as necessary, and the departure of the Company's CFO in January 2011 further stretched its limited financial resources, and iii) the Company has not formalized information technology control policies in certain manufacturing locations. This results in a reasonable possibility that a material misstatement in the Company's interim or annual financial statements may not be prevented or detected on a timely basis. This material weakness was considered in determining the nature, timing, and extent of audit tests applied in our audit of the consolidated financial statements as of and for the year ended December 31, 2010, of the Company and this report does not affect our report on such financial statements.
In our opinion, because of the effect of the material weakness identified above on the achievement of the objectives of the control criteria, the Company has not maintained effective internal control over financial reporting as of December 31, 2010, based on the criteria established in Internal Control—Integrated Framework issued by the Committee of Sponsoring Organizations of the Treadway Commission.
We have also audited, in accordance with the standards of the Public Company Accounting Oversight Board (United States), the consolidated financial statements as of and for the year ended December 31, 2010, of the Company and our report dated March 11, 2011 expressed an unqualified opinion on those financial statements.
/s/ Deloitte & Touche LLP
Boston,
Massachusetts
March 11, 2011
131
None.
132
Item 10. Directors, Executive Officers and Corporate Governance.
The following table sets forth information regarding our executive officers and directors, including their ages as of December 31, 2010.
Name
|
Age | Position | |||
|---|---|---|---|---|---|
David P. Vieau |
60 | President, Chief Executive Officer, Director |
|||
John Granara |
42 | Interim Chief Financial Officer, Vice President of Finance and Corporate Controller |
|||
Andrew Cole |
45 | Vice President of Human Resources and Organizational Development |
|||
Louis M. Golato |
55 | Vice President of Operations |
|||
Robert J. Johnson |
44 | Vice President and General Manager of Energy Solutions Group |
|||
Gilbert N. Riley, Jr. |
47 | Chief Technology Officer, Vice President of Research and Development, Director |
|||
Jason M. Forcier |
39 | Vice President, Automotive Solutions Group |
|||
Gururaj Deshpande(2)(3) |
60 | Director |
|||
Arthur L. Goldstein(1)(3) |
75 | Director |
|||
Gary E. Haroian(1)(2) |
59 | Director |
|||
Paul E. Jacobs(3) |
48 | Director |
|||
Mark M. Little |
58 | Director |
|||
Jeffrey P. McCarthy(1)(2) |
56 | Director |
|||
- (1)
- Member
of audit committee
- (2)
- Member
of compensation committee
- (3)
- Member of the nominating and corporate governance committee
The following paragraphs provide information about our directors and executive officers. For each director, the information presented includes information each director has given us about the positions they hold, their principal occupation and business experience for the past five years, and the names of other publicly-held companies of which they currently serves as a director or has served as a director during the past five years. In addition to the information presented below regarding each director's specific experience, qualifications, attributes and skills that led our board of directors to the conclusion that they should serve as a director, we also believe that all of our directors have a reputation for integrity, honesty and adherence to high ethical standards. They each have demonstrated business acumen and an ability to exercise sound judgment, as well as a commitment of service. Finally, we value their significant experience on other public company boards of directors and board committees.
David P. Vieau has served as our President and Chief Executive Officer and as a director since March 2002. Mr. Vieau served as a director of Avocent Corporation, an information technology infrastructure management company, from 2001 to December 2009. Mr. Vieau holds a B.S. in Mechanical Engineering from Syracuse University. We believe that Mr. Vieau's qualifications to sit on our board of directors include his 30 years of experience managing high technology and component businesses, including his eight years as our Chief Executive Officer.
John Granara has served as our interim Chief Financial Officer since January 2011. Mr. Granara has served as our Vice President of Finance and Corporate Controller since January 2010. From November 2007 to December 2009, Mr. Granara served as our Corporate Controller. Mr. Granara
133
served as Vice President of Finance and Corporate Controller for Authorize.Net Holdings, Inc. (formerly Lightbridge, Inc.), a provider of transaction and payment processing services, from July 2005 to November 2007.
Andrew Cole has served as our Vice President of Human Resources and Organizational Development since August 2008. From May 2008 to August 2008, Mr. Cole served as Global Seminis Human Resources Lead at the Monsanto Company, an agricultural company. From February 2007 to February 2008, Mr. Cole served as Senior Vice President for Human Resources at The Power and Cooling Division of Schneider Electric AS, or Schneider Electric, an energy management company. Prior to this role, Mr. Cole served as the Executive Vice President for Human Resources and Organizational Development at American Power Conversion Corp., or APC, an energy management company, from April 2003 until the acquisition of APC by Schneider Electric in February 2007. Mr. Cole holds a B.A. and an M.S.M from Regis University, Colorado.
Louis M. Golato has served as our Vice President of Operations since February 2006. From February 2004 to December 2005, Mr. Golato served as Wafer Fabrication and Probe Site Manager of Texas Instruments Incorporated, a semiconductor company. Mr. Golato holds a B.S. in Accounting from Bryant College.
Robert J. Johnson has served as our Vice President and General Manager of our Energy Solutions Group since January 2008. From February 2007 to January 2008, Mr. Johnson served as Senior Vice President, President North America of APC-MGE Systems, a business unit of Schneider Electric and a global provider of critical power and cooling services. From February 1997 to February 2007, Mr. Johnson served in various roles at American Power Conversion Corp., or APC, including President/CEO and Vice President of APC's Availability Enhancement Group. Mr. Johnson holds a Bachelor of Engineering Management degree from The Missouri University of Science and Technology.
Gilbert N. Riley, Jr. co-founded A123 and has served as our Chief Technology Officer and Vice President of Research and as a director since October 2001. Dr. Riley holds a B.A. in Physics and Geology from Middlebury College and an M.S. and a Ph.D. in Materials Science and Engineering from Cornell University. We believe that Mr. Riley's qualifications to sit on our board of directors include his experience in technology development and commercialization, including his nine years as our Chief Technology and Vice President of Research.
Jason M. Forcier has served as our Vice President, Automotive Solutions Group since August 2009. From August 2008 to August 2009, Mr. Forcier served as Vice President & General Manager for Lear Corporation, a global supplier of automotive seating systems, electrical distribution systems and electronics. Prior to Lear, Mr. Forcier worked at Robert Bosch LLC, a supplier of automobile components, from 1997 through 2008 in various management positions in the United States and Europe. His last position at Bosch was President for North America, Automotive Electronics Division. In addition, Mr. Forcier held engineering positions at General Motors, Delphi Division. Mr. Forcier holds an MBA from the University of Michigan and a Bachelor of Mechanical Engineering from Kettering University.
Gururaj Deshpande has served as a director since December 2001. Since February 1998, Dr. Deshpande has served as Chairman of the board of directors of Sycamore Networks, Inc., a telecommunications equipment manufacturer. Dr. Deshpande also serves as a director of Airvana, Inc., a provider of network infrastructure products. Dr. Deshpande co-founded Cascade Communications Corp., or Cascade, a provider of wide area network switches, and has been a member of the board of directors of Cascade since its inception and was Chairman of the board of directors of Cascade from 1996 to 1997. Dr. Deshpande holds a B.S. in Electrical Engineering from the Indian Institute of Technology, an M.E. in Electrical Engineering from the University of New Brunswick and a Ph.D. in Data Communications from Queens University. We believe that Mr. Deshpande's qualifications to sit on our board of directors include his vast experience as an entrepreneur and in the various executive management positions he has held.
134
Arthur L. Goldstein has served as a director since February 2008. Mr. Goldstein has served as a trustee, director and/or advisor for various for-profit and non-profit organizations. From May 1991 to May 2004, Mr. Goldstein served as the Chairman of the board of directors of Ionics, Inc., or Ionics, a water treatment and purification company. From May 1971 to June 2003, Mr. Goldstein served as the President and Chief Executive Officer of Ionics. Mr. Goldstein also serves as a director of Cabot Corporation, a chemical manufacturer. From 1995 to 2008, Mr. Goldstein served as a member of the board of directors of State Street Corporation, a financial services company, and is a member of the National Academy of Engineering. Mr. Goldstein holds a B.S. in Chemical Engineering from Rensselaer Polytechnic Institute, an M.S. in Chemical Engineering from the University of Delaware and an M.B.A. from Harvard Business School. We believe that Mr. Goldstein's qualifications to sit on our board of directors include his years of executive experience in the chemical manufacturing and solutions industries.
Gary E. Haroian has served as a director since July 2006. Since December 2002, Mr. Haroian has provided consulting and advisory services to various technology companies. Mr. Haroian also serves as a director of Aspen Technology Inc., a provider of software and services to the process industries, Network Engines, Inc., a provider of server appliance software solutions, and Phase Forward Incorporated, a provider of data collection and management solutions for clinical trials and drug safety and Unica Corp, a provider of enterprise marketing management software. Until 2007, Mr. Haroian also served as a director of Authorize.net, a transaction and payment processing company, and Embarcadero Technologies, Inc., a provider of data lifecycle management software. Mr. Haroian holds a B.S. in Economics and Accounting from the University of Massachusetts, Amherst. We believe that Mr. Haroian's qualifications to sit on our board of directors include his extensive advisory experience to various emerging technology companies and his financial and accounting expertise.
Paul E. Jacobs has served as a director since November 2002. Since February 2000, Dr. Jacobs has held a number of executive positions with QUALCOMM Incorporated, or Qualcomm, including Group President of the Qualcomm Wireless & Internet Group, Executive Vice President and Chief Executive Officer. Dr. Jacobs also serves as a director and as Chairman of Qualcomm. Dr. Jacobs holds a B.S. in Electrical Engineering and Computer Science, an M.S. in Electrical Engineering and a Ph.D. in Electrical Engineering and Computer Science from the University of California, Berkeley. We believe Mr. Jacobs' qualifications to sit on our board of directors include his experience as director and Chairman of a mobile communication company and his expertise in strategic leadership.
Mark M. Little has served as a director since April 2009. Since October 2005, Dr. Little has served as Senior Vice President and Director of GE Global Research, a division of General Electric Company, a diversified technology, media and financial services company. From February 1997 to October 2005, Dr. Little served as Vice President of the power-generation segment of GE Energy, another division of General Electric. Dr. Little holds a B.S. in Mechanical Engineering from Tufts University, an M.S. in Mechanical Engineering from Northeastern University and a Ph.D. from in Mechanical Engineering from Rensselaer Polytechnic Institute. We believe Mr. Little's qualifications to sit on our board of directors include his management experience in the industrial research and technology industries.
Jeffrey P. McCarthy has served as a director since December 2001. Since December 1998, Mr. McCarthy has served as a general partner of North Bridge Venture Partners, a venture capital firm. Mr. McCarthy holds a B.S. in Business Administration from Northeastern University and an M.B.A. from Bentley College. We believe Mr. McCarthy qualifications to sit on our board of directors include his business development experience as a partner for a venture capital firm.
Code of Business Conduct and Ethics
We have adopted a written code of business conduct and ethics that applies to our directors, officers and employees, including our principal executive officer, principal financial officer, principal
135
accounting officer or controller, or persons performing similar functions. A current copy of the code is posted on the Corporate Governance section of our website, which is located at www.a123systems.com.
Audit Committee
The members of our audit committee are Messrs. Goldstein, Haroian and McCarthy. Mr. Haroian chairs the audit committee. Our board of directors has determined that each audit committee member satisfies (i) the requirements for financial literacy and (ii) the independence standards for audit committee membership under the current requirements of the Nasdaq Marketplace Rules. Mr. Haroian is an "audit committee financial expert," as defined by SEC rules and satisfies the financial sophistication requirements of The NASDAQ Global Select Market. Our audit committee assists our board of directors in its oversight of our accounting and financial reporting process and the audits of our financial statements.
Section 16(a) Beneficial Ownership Reporting Compliance
Section 16(a) of the Securities Exchange Act of 1934 requires our directors, executive officers and the holders of more than 10% of our common stock to file with the SEC initial reports of ownership of our common stock and other equity securities on a Form 3 and reports of changes in such ownership on a Form 4 or Form 5. Officers, directors and 10% stockholders are required by SEC regulations to furnish us with copies of all Section 16(a) forms they file. To our knowledge, based solely on our review of copies of reports filed by our directors and executive officers pursuant to Section 16(a) or written representations by the persons required to file these reports, we believe that during 2010 all filing requirements of Section 16(a) were satisfied.
Item 11. Executive Compensation.
The information under "Compensation and Other Information Concerning Directors and Officers" from our definitive proxy statement filed with the Securities and Exchange Commission for our 2011 annual meeting of stockholders is hereby incorporated by reference.
Item 12. Security Ownership of Certain Beneficial Owners and Management and Related Stockholder Matters.
The information under "Security Ownership of Certain Beneficial Owners and Management" and "Securities Authorized for Issuance Under Equity Compensation Plans" from our definitive proxy statement filed with the Securities and Exchange Commission for our 2011 annual meeting of stockholders is incorporated herein by reference.
Item 13. Certain Relationships and Related Transactions, and Director Independence.
The information under "Certain Relationships and Related Transactions" from our definitive proxy statement filed with the Securities and Exchange Commission for our 2011 annual meeting of stockholders is incorporated herein by reference.
Information required by this item pursuant to Item 407(a) of SEC Regulation S-K relating to director independence is contained in our definitive proxy statement filed with the Securities and Exchange Commission for our 2011 annual meeting of stockholders under "Corporate Governance" and is incorporated herein by reference.
Item 14. Principal Accountant Fees and Services.
The information under "Independent Auditor Fees and Other Matters" from our definitive proxy statement filed with the Securities and Exchange Commission for our 2011 annual meeting of stockholders is incorporated herein by reference.
136
Item 15. Exhibits and Financial Statement Schedules.
(1) Financial Statements
The following financial statements and supplementary data are included in Part II of Item 8 filed of this Annual Report on Form 10-K:
Report of Independent Registered Public Accounting Firm |
||||
Consolidated Balance Sheets—December 31, 2009 and 2010 |
||||
Consolidated Statements of Operations—For the years ended December 31, 2008, 2009 and 2010 |
||||
Consolidated Statements of Stockholders' (Deficit) Equity—For the years ended December 31, 2008, 2009 and 2010 |
||||
Consolidated Statements of Cash Flows—For the years ended December 31, 2008, 2009 and 2010 |
||||
Notes to Consolidated Financial Statements |
||||
(2) Financial Statement Schedules
All financial statement schedules have been omitted because they are not applicable or are not required, or because the information required to be set forth therein is included in the consolidated financial statements or notes thereto.
(3) Exhibits
The exhibits filed as part of this Annual Report on Form 10-K are listed on the exhibit index immediately preceding such exhibits, and is incorporated herein by reference.
137
Pursuant to the requirements of the Securities Exchange Act of 1934, the Registrant has duly caused this report to be signed on its behalf by the undersigned, thereunto duly authorized.
| A123 SYSTEMS, INC. | ||||
Date: March 11, 2011 |
By: |
/s/ DAVID P. VIEAU David P. Vieau Chief Executive Officer (Principal Executive Officer) |
||
Pursuant to the requirements of the Securities Exchange Act of 1934, this report has been signed below by the following persons on behalf of the registrant and in the capacities and on the dates indicated.
Signature
|
Title
|
Date
|
||
|---|---|---|---|---|
| /s/ DAVID P. VIEAU David P. Vieau |
Chief Executive Officer and Director (principal executive officer) | March 11, 2011 | ||
/s/ JOHN GRANARA John Granara |
Interim Chief Financial Officer and Vice President of Finance (principal financial and accounting officer) |
March 11, 2011 |
||
/s/ GURURAJ DESHPANDE Gururaj Deshpande |
Director |
March 11, 2011 |
||
/s/ ARTHUR L. GOLDSTEIN Arthur L. Goldstein |
Director |
March 11, 2011 |
||
/s/ GARY E. HAROIAN Gary E. Haroian |
Director |
March 11, 2011 |
||
/s/ PAUL E. JACOBS Paul E. Jacobs |
Director |
March 11, 2011 |
||
/s/ MARK M. LITTLE Mark M. Little |
Director |
March 11, 2011 |
138
Signature
|
Title
|
Date
|
||
|---|---|---|---|---|
| /s/ JEFFREY P. MCCARTHY Jeffrey P. McCarthy |
Director | March 11, 2011 | ||
/s/ GILBERT NEAL RILEY, JR. Gilbert Neal Riley, Jr. |
Director |
March 11, 2011 |
139
Listed and indexed below are all Exhibits filed as part of this report.
| |
|
Incorporated by Reference | |
|
|||||||||||||||
|---|---|---|---|---|---|---|---|---|---|---|---|---|---|---|---|---|---|---|---|
Exhibit Number |
Exhibit Description |
Form | File Number |
Date of First Filing |
Exhibit Number |
Filed Herewithin |
|||||||||||||
| 3.1 | Restated Certificate of Incorporation of the Registrant, as amended September 29, 2009. | — | — | — | — | X | |||||||||||||
3.2 |
Second Amended and Restated By-laws of the Registrant. |
S-1 |
333-152871 |
10/9/2008 |
3.4 |
||||||||||||||
4.1 |
Specimen Stock Certificate evidencing the shares of common stock. |
S-1 |
333-152871 |
8/9/2008 |
4.1 |
||||||||||||||
10.1 |
2009 Stock Incentive Plan. |
S-1/A |
333-152871 |
8/19/2009 |
10.5 |
||||||||||||||
10.2 |
Form of Management Incentive Stock Option Agreement under 2009 Stock Incentive Plan. |
S-1/A |
333-152871 |
8/19/2009 |
10.6 |
||||||||||||||
10.3 |
Form of Management Nonstatutory Stock Option Agreement under 2009 Stock Incentive Plan. |
S-1/A |
333-152871 |
8/19/2009 |
10.7 |
||||||||||||||
10.4 |
Lease Agreement, dated September 15, 2008, between Jijun Company and Enerland Co., Ltd. |
S-1/A |
333-152871 |
9/9/2009 |
10.8 |
||||||||||||||
10.5 |
Lease, dated June 1, 2004, between President and Fellows of Harvard College and the Registrant, as amended by the First Amendment to Lease, dated February 9, 2007. |
S-1 |
333-152871 |
8/9/2008 |
10.9 |
||||||||||||||
10.6 |
Lease Agreements, dated July 30, 2007, between O'Brien Investment Partners, LLC and the Registrant. |
S-1 |
333-152871 |
8/9/2008 |
10.10 |
||||||||||||||
10.7 |
Lease Contract, dated March 2, 2008, between Changzhou Wujin Materials Recovery Co., Ltd. and A123 Systems (China) Co., Ltd. |
S-1 |
333-152871 |
8/9/2008 |
10.11 |
||||||||||||||
10.8 |
Lease Contract, dated December 31, 2008, between Jiangsu Dagang Co., Ltd. and A123 Systems (Zhenjiang) Co., Ltd. |
S-1/A |
333-152871 |
9/9/2009 |
10.12 |
||||||||||||||
10.9 |
Lease Contract of Workshop, dated March 1, 2009, between Changzhou Hi-Tech District EP2 Investment & Development Co., Ltd. and A123 Systems (China) Materials Co., Ltd. |
S-1/A |
333-152871 |
9/9/2009 |
10.13 |
||||||||||||||
10.10 |
Lease Agreement, dated February 13, 2009, between Hyundai J. Comm Co., Ltd. and Enerland Co., Ltd. |
S-1/A |
333-152871 |
9/9/2009 |
10.14 |
||||||||||||||
10.11 |
Seventh Amended and Restated Investor Rights Agreement among the Registrant, the Founders and the Purchasers, dated as of April 3, 2009. |
S-1/A |
333-152871 |
6/23/2009 |
10.15 |
||||||||||||||
140
| |
|
Incorporated by Reference | |
|
|||||||||||||||
|---|---|---|---|---|---|---|---|---|---|---|---|---|---|---|---|---|---|---|---|
Exhibit Number |
Exhibit Description |
Form | File Number |
Date of First Filing |
Exhibit Number |
Filed Herewithin |
|||||||||||||
| 10.12 | † | Agreement, dated May 16, 2007, between BAE Systems Controls Inc. and the Registrant. | S-1/A | 333-152871 | 6/23/2009 | 10.16 | |||||||||||||
10.13 |
Warrant to Purchase 45,000 shares of Common Stock, dated February 8, 2008, issued to Skadden, Arps, Slate, Meagher & Flom LLP by the Registrant. |
S-1 |
333-152871 |
8/9/2008 |
10.23 |
||||||||||||||
10.14 |
† |
Joint Development and Supply Agreement, dated February 6, 2008, between AES Energy Storage, LLC and the Registrant, as amended March 14, 2008 and July 2, 2008. |
S-1/A |
333-152871 |
10/31/2008 |
10.24 |
|||||||||||||
10.15 |
† |
Contract Manufacturing Agreement, dated March 1, 2006, as amended March 30, 2007, between Black & Decker Macao Commercial Offshore Limited and the Registrant. |
S-1 |
333-152871 |
8/9/2008 |
10.25 |
|||||||||||||
10.16 |
† |
Exclusive Patent License Agreement, dated December 4, 2001, between Massachusetts Institute of Technology and the Registrant, as amended by the First Amendment, dated February 1, 2003, and the Second Amendment, dated July 25, 2008. |
S-1 |
333-152871 |
8/9/2008 |
10.28 |
|||||||||||||
10.17 |
† |
Purchase Orders, dated November 27, 2006 and March 6, 2008, between the United States Advanced Battery Consortium and the Registrant. |
S-1 |
333-152871 |
8/9/2008 |
10.29 |
|||||||||||||
10.18 |
† |
Exclusive License Agreement, dated November 17, 2008, between the Registrant and The Gillette Company. |
S-1/A |
333-152871 |
11/25/2008 |
10.30 |
|||||||||||||
10.19 |
† |
Purchase Agreement, dated November 17, 2008, between the Registrant and The Gillette Company. |
S-1/A |
333-152871 |
11/25/2008 |
10.31 |
|||||||||||||
10.20 |
Joint Venture Contract dated December 16, 2009 by and between SAIC Motor Co. LTD. and A123 Systems Hong Kong Limited. |
8-K |
001-34463 |
12/17/2009 |
10.1 |
||||||||||||||
10.21 |
MEGA Tax Credit Agreement dated as of November 20, 2009, by and between the Michigan Economic Growth Authority and the Registrant, a Delaware corporation. |
8-K |
001-34463 |
11/25/2009 |
10.1 |
||||||||||||||
10.22 |
Lease Agreement, dated December 4, 2009, between Welsh Romulus, LLC, BPE Exchange, LLC, and BPW Exchange, LLC and the Registrant. |
10-K |
001-34463 |
3/15/2010 |
10.25 |
||||||||||||||
141
| |
|
Incorporated by Reference | |
|
|||||||||||||||
|---|---|---|---|---|---|---|---|---|---|---|---|---|---|---|---|---|---|---|---|
Exhibit Number |
Exhibit Description |
Form | File Number |
Date of First Filing |
Exhibit Number |
Filed Herewithin |
|||||||||||||
| 10.23 | Third Amendment, dated December 28, 2009, to the Lease between President and Fellows of Harvard College and the Registrant, dated June 1, 2004. | 10-K | 001-34463 | 3/15/2010 | 10.26 | ||||||||||||||
10.24 |
Grant and Cooperative Agreement dated December 4, 2009 by and between the U.S. Department of Energy and the Registrant. |
10-K |
001-34463 |
3/15/2010 |
10.27 |
||||||||||||||
10.25 |
Lease Agreement, dated May 19, 2010, by and between Boston Properties Limited Partnership and the Registrant. |
10-Q |
001-34463 |
8/11/2010 |
10.1 |
||||||||||||||
10.26 |
Form of Restricted Stock Unit Agreement under 2009 Stock Incentive Plan. |
10-Q |
001-34463 |
8/11/2010 |
10.2 |
||||||||||||||
10.27 |
Supply Agreement, dated June 23, 2010, by and between ConocoPhillips Specialty Products, Inc. and the Registrant. |
10-Q |
001-34463 |
8/11/2010 |
10.3 |
||||||||||||||
10.28 |
First Amendment to Lease, dated May 19, 2010, by and between Boston Properties Limited Partnership and the Registrant dated July 23, 2010. |
10-Q |
001-34463 |
11/10/2010 |
10.1 |
||||||||||||||
10.29 |
Lease Agreement, dated July 16, 2010, by and between 155 Flanders LLC and the Registrant. |
10-Q |
001-34463 |
11/10/2010 |
10.2 |
||||||||||||||
10.30 |
Supply Agreement, dated January 13, 2010, by and between Fisker Automotive, Inc. and the Registrant. |
10-Q |
001-34463 |
11/10/2010 |
10.3 |
||||||||||||||
10.31 |
Lease Agreement, dated May 12, 2009, by and between 39000 Associates LLC and the Registrant. |
— |
— |
— |
— |
X |
|||||||||||||
10.32 |
Term Loan and Security Agreement, dated August 2, 2006, among Silicon Valley Bank, Gold Hill Venture Lending 03, L.P. and the Registrant, as amended by the First Loan Modification Agreement, dated July 10, 2007, the Second Loan Modification Agreement, dated September 24, 2008, the Third Loan Modification Agreement, dated March 16, 2009, the Fourth Loan Modification Agreement, dated March 31, 2009, the Fifth Loan Modification Agreement, dated September 24, 2010, and the Sixth Loan Modification Agreement, dated December 23, 2010. |
— |
— |
— |
— |
X |
|||||||||||||
10.33 |
Form of Executive Retention Agreement as amended. |
— |
— |
— |
— |
X |
|||||||||||||
21.1 |
Subsidiaries of the Registrant. |
— |
— |
— |
— |
X |
|||||||||||||
142
| |
|
Incorporated by Reference | |
|
|||||||||||||||
|---|---|---|---|---|---|---|---|---|---|---|---|---|---|---|---|---|---|---|---|
Exhibit Number |
Exhibit Description |
Form | File Number |
Date of First Filing |
Exhibit Number |
Filed Herewithin |
|||||||||||||
| 23.1 | Consent of Deloitte & Touche LLP, Independent Registered Accounting Firm. | — | — | — | — | X | |||||||||||||
31.1 |
Certification of Chief Executive Officer pursuant to Section 302 of the Sarbanes-Oxley Act of 2002 by Chief Executive Officer. |
— |
— |
— |
— |
X |
|||||||||||||
31.2 |
Certification of Chief Financial Officer pursuant to Section 302 of the Sarbanes-Oxley Act of 2002 by Chief Financial Officer. |
— |
— |
— |
— |
X |
|||||||||||||
32.1 |
* |
Certification pursuant to 18 U.S.C. Section 1350, as adopted pursuant to Section 906 of the Sarbanes-Oxley Act of 2002, by Chief Executive Officer. |
— |
— |
— |
— |
X |
||||||||||||
32.2 |
* |
Certification pursuant to 18 U.S.C. Section 1350, as adopted pursuant to Section 906 of the Sarbanes-Oxley Act of 2002, by Chief Financial Officer. |
— |
— |
— |
— |
X |
||||||||||||
- *
- This
certification shall not be deemed "filed" for purposes of Section 18 of the Securities Exchange Act of 1934, or otherwise subject to the liability
of that Section, nor shall it be deemed to be incorporated by reference into any filing under the Securities Act of 1933 or the Securities Exchange Act of 1934.
- †
- Confidential treatment requested as to certain portions, which portions have been omitted and filed separately with the Securities and Exchange Commission.
143