Attached files
As filed with the Securities and Exchange Commission on March 10, 2011
UNITED STATES
SECURITIES AND EXCHANGE COMMISSION
Washington, D.C. 20549
FORM 10-K
(Mark One)
|
[ x ] ANNUAL REPORT PURSUANT TO SECTION 13 OR 15(d) OF THE SECURITIES EXCHANGE ACT OF 1934
|
|
For the fiscal year ended December 31, 2010
|
|
or
|
|
[ ] TRANSITION REPORT PURSUANT TO SECTION 13 OR 15(d) OF THE SECURITIES EXCHANGE ACT OF 1934
|
|
For the transition period from to
|
|
Commission File Number 000-50266
|

TRINITY CAPITAL CORPORATION
(Exact name of registrant as specified in its charter)
|
New Mexico
|
85-0242376
|
|
|
(State or other jurisdiction of incorporation or
organization)
|
(I.R.S. Employer Identification No.)
|
|
|
1200 Trinity Drive
Los Alamos, New Mexico
|
87544
|
|
|
(Address of principal executive offices)
|
(Zip Code)
|
|
|
Registrant’s telephone number, including area code (505) 662-5171
|
||
|
Securities registered pursuant to Section 12(b) of the Act: None
|
||
|
Securities registered pursuant to Section 12(g) of the Act:
|
||
|
Common Stock
|
||
|
20,000,000 authorized shares
|
||
|
(Title of class)
|
||
Indicate by check mark if the registrant is a well-known seasoned issuer, as defined in Rule 405 of the Securities Act. [ ] Yes [ x ] No
Indicate by check mark if the registrant is not required to file reports pursuant to Section 13 or Section 15(d) of the Act. [ ] Yes [ x ] No
Indicate by check mark whether the registrant (1) has filed all reports required to be filed by Section 13 or 15(d) of the Securities Exchange Act of 1934 during the preceding 12 months (or for such shorter period that the registrant was required to file such reports), and (2) has been subject to such filing requirements for the past 90 days. [ x ] Yes [ ] No
Indicate by check mark whether the registrant has submitted electronically and posted on its corporate Web site, if any, every Interactive Data File required to be submitted and posted pursuant to Rule 405 of Regulation S-T during the preceding 12 months (or for such shorter period that the registrant was required to submit and post such files).[ ] Yes [ ] No
Indicate by check mark if disclosure of delinquent filers pursuant to Item 405 of Regulation S-K (§ 229.405 of this chapter) is not contained herein, and will not be contained, to the best of registrant’s knowledge, in definitive proxy or information statements incorporated by reference in Part III of this Form 10-K or any amendment to this Form 10-K.[ ] Yes [ x ] No
Indicate by check mark whether registrant is a large accelerated filer, an accelerated filer, a non-accelerated filer, or a smaller reporting company. See the definitions of “large accelerated filer,” “accelerated filer” and “smaller reporting company” in Rule 12b-2 of the Act.
Large accelerated filer [ ] Accelerated filer [ x ]
Non-accelerated filer [ ] (do not check if a smaller reporting company) Smaller reporting company [ ]
Indicate by check mark whether the registrant is a shell company (as defined in Rule 12b-2 of the Act).
[ ] Yes [ x ] No
The aggregate market value of the registrant’s common stock (“Common Stock”) held by non-affiliates as of June 30, 2010, the last business day of the registrant’s most recently completed second fiscal quarter, was approximately $64,238,000 (based on the last sale price of the Common Stock at June 30, 2010 of $14.50 per share).
As of March 10, 2011, there were 6,449,726 shares of Common Stock outstanding.
DOCUMENTS INCORPORATED BY REFERENCE
|
Document of the Registrant
|
Form 10-K Reference Location
|
|
|
Portions of the 2011 Proxy Statement
|
PART III
|
|
|
|
|
|
|
|
|
|
|
|
|
|
|
|
|
|
|
|
|
|
|
|
|
|
|
|
|
|
|
|
|
|
|
|
|
|
|
|
|
|
|
|
|
|
|
|
|
|
|
|
|
|
|
|
|
|
|
|
|
|
|
|
|
|
|
|
|
|
|
|
|
|
|
[THIS PAGE INTENTIONALLY LEFT BLANK]
Please note: Unless the context clearly suggests otherwise, references in this Form 10-K to “us,” “we”, “our” or “the Company” include Trinity Capital Corporation and its wholly owned subsidiaries, including Los Alamos National Bank, TCC Advisors Corporation, TCC Funds, FNM Investment Fund IV and Title Guaranty & Insurance Company.
Trinity Capital Corporation
General. Trinity Capital Corporation (“Trinity”), a financial holding company organized under the laws of the State of New Mexico, is the sole shareholder of Los Alamos National Bank (the “Bank”) and the sole shareholder of Title Guaranty & Insurance Company (“Title Guaranty”). The Bank is the sole shareholder of TCC Advisors Corporation (“TCC Advisors”) as well as the sole shareholder of Finance New Mexico Investment Fund IV, LLC, a Delaware Limited Liability Company (“FNM Investment Fund IV”). The Bank is also a member of Cottonwood Technology Group, LLC (“Cottonwood”), a management consulting and counseling company for technology start up companies, which is also designed to manage venture capital funds. FNM Investment Fund IV is a member of Finance New Mexico—Investor Series IV, LLC, a New Mexico Limited Liability Company (“FNM CDE IV”), an entity created to fund loans and investments in a New Market Tax Credit project. In September of 2010, the Bank joined Southwest Medical Technologies (“SWMT”) as a 20% member. SWMT is focused on assisting new medical and life science technologies identify investment and financing opportunities. The Bank's capital investment will be $250 thousand, of which approximately $36 thousand has been funded.
Trinity is located in Los Alamos, New Mexico, a small community in the Jemez Mountains of Northern New Mexico. Los Alamos has approximately 18,000 residents and enjoys worldwide recognition as the birthplace of the atomic bomb. Today, Los Alamos National Laboratory (the “Laboratory”) remains a pre-eminent research facility for scientific and technological development in numerous scientific fields. The Laboratory employs (directly and indirectly) approximately 11,782 residents of Northern New Mexico, making it the largest employer in Los Alamos County. The Laboratory remains the cornerstone of the community and has attracted numerous other scientific businesses to the area.
The Bank was founded in 1963 by local investors to provide convenient, full-service banking to the unique scientific community that developed around the Laboratory and continues to expand its market share and customer-base. Los Alamos National Bank is a full-service commercial banking institution with six bank offices in Los Alamos, White Rock, Santa Fe and Albuquerque, New Mexico. The Bank provides a broad range of banking products and services, including credit, cash management, deposit, asset management and trust and investment services to our targeted customer base of individuals and small and medium-sized businesses. As of December 31, 2010, the Bank had total assets of $1.6 billion, net loans of $1.2 billion and deposits (net of deposits of affiliates) of $1.4 billion.
In 1999, the Bank established its first office in Santa Fe after acquiring a substantial number of customers based in Santa Fe. In 2004, the Bank added a second office in Santa Fe to better serve its growing customer-base and continue to attract new customers. Trinity acquired a ground lease covering additional land in Santa Fe where a third Santa Fe Bank office was opened in October 2009. The Bank opened its third Santa Fe office to better serve our customers on the southern side of Santa Fe and attract additional commercial and consumer customers in this area. Based upon the Federal Deposit Insurance Corporation’s Summary of Deposits (“SOD”) Report containing data as of June 30 of each year, the Bank held the largest share of deposits in Santa Fe County in 2007, 2008, 2009 and 2010. In 2005, the Bank determined the need for an additional site in Albuquerque, New Mexico to serve our commercial loan customers and established a Loan Production Office. The Bank expanded its charter at the end of 2007 to provide for the ability to provide full banking services out of its Albuquerque office.
Trinity acquired Title Guaranty in May 2000, making it the only title company in New Mexico to be owned by a financial institution. Title Guaranty is a title insurance company organized under the laws of the State of New Mexico doing business in Los Alamos and Santa Fe Counties. Title Guaranty opened its Santa Fe office in the Bank’s downtown Santa Fe facility in February 2005. The services provided by Title Guaranty complement those provided by Trinity’s other subsidiaries. Title Guaranty provides title insurance, closing services, escrow and notary service, title searches and title reports for Los Alamos and Santa Fe Counties.
The Bank created TCC Advisors in February 2006 to enable us to manage certain assets. In April 2010, the Bank activated TCC Advisors as a business unit operating one of the Bank's foreclosed properties, Santa Fe Equestrian Park, in Santa Fe, New Mexico, while seeking a sale of the property. In February 2006, TCC Funds, a Delaware statutory trust was created with Trinity as its sponsor, to allow for the creation of a mutual fund. TCC Funds remains dormant with no planned use at this time. In August of 2008, the Bank joined Cottonwood as a 26% member. Cottonwood assists in the management of, and counsels, start up companies involved in technology transfer from research institutions in New Mexico, as well as establishing and managing venture funds. The Bank currently holds a 24% interest in Cottonwood as described below. Additionally, the Bank is participating in a venture capital fund managed by Cottonwood. In 2009, the Bank created FNM Investment Fund IV to acquire a 99.99% interest in FNM CDE IV. Both of these entities were created for the sole purpose of funding loans to and investments in a New Market Tax Credit project located in downtown Albuquerque, New Mexico. In September of 2010, the Bank joined Southwest Medical Technologies, LLC (“SWMT”) as a 20% member. Participation in this entity is part of the Bank's venture capital investments. This entity is owned by the Bank (20%), Southwest Medical Ventures, Inc. (60%), and New Mexico Co-Investment Fund II, L.P. (20%). SWMT is focused on assisting new medical and life science technologies identify investment and financing opportunities. The Bank’s capital investment will be $250 thousand of which approximately $36 thousand has been funded.
Corporate Structure. Trinity was organized in 1975 as a bank holding company, as defined in the Bank Holding Company Act of 1956, as amended (“BHCA”), and in 2000 elected to become a financial holding company, as defined in the BHCA. Trinity acquired the stock of the Bank in 1977 and serves as the holding company for the Bank. In 2000, Trinity purchased Title Guaranty. Title Guaranty and the Bank are wholly-owned subsidiaries of Trinity. The Bank created both TCC Advisors and TCC Funds in February 2006. In addition, Trinity owns all the common shares of four business trusts, created by Trinity for the sole purpose of issuing trust preferred securities which had an aggregate outstanding balance of $37.1 million at December 31, 2010. Trinity’s sole business is the ownership of the outstanding shares of the Bank, Title Guaranty and the administration of the Trusts. The address of our headquarters is 1200 Trinity Drive, Los Alamos, New Mexico 87544, our main telephone number is (505) 662-5171 and our general email address is tcc@lanb.com.
Trinity maintains a website at http://www.lanb.com/TCC-Investor-Relations.aspx. We make available free of charge on or through our website, the annual report on Form 10-K, proxy statements, quarterly reports on Form 10-Q, current reports on Form 8-K and amendments to those reports filed or furnished pursuant to Section 13(a) or 15(d) of the Exchange Act as soon as reasonably practicable after the Company electronically files such material with, or furnishes it to, the Securities and Exchange Commission. The Company will also provide copies of its filings free of charge upon written request to: TCC Stock Representative, Trinity Capital Corporation, Post Office Box 60, Los Alamos, New Mexico 87544. In addition, any materials we filed with the SEC can be read and copied at the SEC’s Public Reference Room at 450 Fifth Street, N.W., Washington, D.C. 20549. Information on the operation of the Public Reference Room can be obtained by calling the SEC at 1-800-SEC-0330. The SEC also maintains an Internet site that contains reports, proxy and information statements, and other information regarding issuers such as Trinity. Trinity’s filings are available free of charge on the SEC’s website at http://www.sec.gov.
Regulation and Supervision
General. Financial institutions, their holding companies and their affiliates are extensively regulated under federal and state law. As a result, the growth and earnings performance of Trinity may be affected not only by management decisions and general economic conditions, but also by requirements of federal and state statutes and by the regulations and policies of various bank regulatory authorities, including the Office of the Comptroller of the Currency (the “OCC”), the Board of Governors of the Federal Reserve System (the “Federal Reserve”) and the Federal Deposit Insurance Corporation (the “FDIC”). Furthermore, taxation laws administered by the Internal Revenue Service and state taxing authorities, accounting rules developed by the Financial Accounting Standards Board (the “FASB”) and securities laws administered by the Securities and Exchange Commission (the “SEC”) and state securities authorities have an impact on the business of Trinity. The effect of these statutes, regulations, regulatory policies and accounting rules may be significant, and cannot be predicted with a high degree of certainty.
Federal and state banking laws impose a comprehensive system of supervision, regulation and enforcement on the operations of financial institutions, their holding companies and affiliates that is intended primarily for the protection of the FDIC-insured deposits and depositors of banks, rather than shareholders. These federal and state laws, and the regulations of the bank regulatory authorities issued under them, affect, among other things, the scope of business, the kinds and amounts of investments banks may make, reserve requirements, capital levels relative to operations, the nature and amount of collateral for loans, the establishment of branches, the ability to merge, consolidate and acquire, dealings with insiders and affiliates and the payment of dividends. In addition, turmoil in the credit markets in recent years prompted the enactment of unprecedented legislation that has allowed the U.S. Treasury Department to make equity capital available to qualifying financial institutions to help restore confidence and stability in the U.S. financial markets, which imposes additional requirements on institutions in which the U.S. Treasury Department invests.
The following is a summary of the material elements of the supervisory and regulatory framework applicable to Trinity and the Bank. It does not describe all of the statutes, regulations and regulatory policies that apply, nor does it restate all of the requirements of those that are described. Moreover, Congress recently enacted fundamental reforms to our bank regulatory framework, the majority of which will be implemented over time by various regulatory agencies, making their impact difficult to predict. See “Financial Regulatory Reform” below.
Financial Regulatory Reform. On July 21, 2010, President Obama signed the Dodd-Frank Wall Street Reform and Consumer Protection Act (the “Dodd-Frank Act”) into law. The Dodd-Frank Act represents a sweeping reform of the supervisory and regulatory framework applicable to financial institutions and capital markets in the United States, certain aspects of which are described below in more detail. The Dodd-Frank Act creates new federal governmental entities responsible for overseeing different aspects of the U.S. financial services industry, including identifying emerging systemic risks. It also shifts certain authorities and responsibilities among federal financial institution regulators, including the supervision of holding company affiliates and the regulation of consumer financial services and products. In particular, and among other things, the Dodd-Frank Act: creates a Bureau of Consumer Financial Protection authorized to regulate providers of consumer credit, savings, payment and other consumer financial products and services; narrows the scope of federal preemption of state consumer laws enjoyed by national banks and federal savings associations and expands the authority of state attorneys general to bring actions to enforce federal consumer protection legislation; imposes more stringent capital requirements on bank holding companies and subjects certain activities, including interstate mergers and acquisitions, to heightened capital conditions; significantly expands underwriting requirements applicable to loans secured by 1-4 family residential real property; restricts the interchange fees payable on debit card transactions for issuers with $10 billion in assets or greater; requires the originator of a securitized loan, or the sponsor of a securitization, to retain at least 5% of the credit risk of securitized exposures unless the underlying exposures are qualified residential mortgages or meet certain underwriting standards to be determined by regulation; creates a Financial Stability Oversight Council as part of a regulatory structure for identifying emerging systemic risks and improving interagency cooperation; provides for enhanced regulation of advisers to private funds and of the derivatives markets; enhances oversight of credit rating agencies; and prohibits banking agency requirements tied to credit ratings.
Numerous provisions of the Dodd-Frank Act are required to be implemented through rulemaking by the appropriate federal regulatory agencies over the next few years. It is not clear what form such regulations will ultimately take or if certain provisions of the Dodd-Frank Act will be amended prior to their implementation. Furthermore, while the reforms primarily target systemically important financial service providers, their influence is expected to filter down in varying degrees to smaller institutions over time. As a result, in many respects, the ultimate impact of the Dodd-Frank Act will not be fully known for years, and no current assurance may be given that the Dodd-Frank Act, or any other new legislative changes, will not have a negative impact on the results of operations and financial condition of Trinity and the Bank.
The Increasing Importance of Capital. While capital has historically been one of the key measures of the financial health of both holding companies and depository institutions, its role is becoming fundamentally more important in the wake of the financial crisis. Not only will capital requirements increase, but the type of instruments that constitute capital will also change, and, as a result of the Dodd-Frank Act, after a phase-in period, bank holding companies will have to hold capital under rules as stringent as those for insured depository institutions. Moreover, the actions of the International Basel Committee on Banking Supervision, a committee of central banks and bank supervisors, to reassess the nature and uses of capital in connection with an initiative called “Basel III,” discussed below, will likely have a significant impact on the capital requirements applicable to U.S. bank holding companies and depository institutions.
Required Capital Levels. As indicated above, the Dodd-Frank Act mandates the Federal Reserve to establish minimum capital levels for bank holding companies on a consolidated basis that are as stringent as those required for insured depository institutions. The components of Tier 1 Capital will be restricted to capital instruments that are currently considered to be Tier 1 Capital for insured depository institutions. As a result, the proceeds of trust preferred securities will be excluded from Tier 1 Capital unless such securities were issued prior to May 19, 2010 by bank holding companies with less than $15 billion of assets. As Trinity has assets of less than $15 billion, it will be able to maintain its trust preferred proceeds as capital but it will have to comply with new capital mandates in other respects, and it will not be able to raise Tier 1 Capital in the future through the issuance of trust preferred securities.
Under current federal regulations, the Bank is subject to, and, after a phase-in period, Trinity will be subject to, the following minimum capital standards: (i) a leverage requirement consisting of a minimum ratio of Tier 1 Capital to total assets of 3% for the most highly-rated banks with a minimum requirement of at least 4% for all others; and (ii) a risk-based capital requirement consisting of a minimum ratio of total capital to total risk-weighted assets of 8% and a minimum ratio of Tier 1 Capital to total risk-weighted assets of 4%. For this purpose, Tier 1 Capital consists primarily of common stock, noncumulative perpetual preferred stock and related surplus less intangible assets (other than certain loan servicing rights and purchased credit card relationships). Total capital consists primarily of Tier 1 Capital plus Tier 2 Capital, which includes other non-permanent capital items such as certain other debt and equity instruments that do not qualify as Tier 1 Capital and a portion of the Bank’s allowance for loan and lease losses.
The capital requirements described above are minimum requirements. Federal law and regulations provide various incentives for banking organizations to maintain regulatory capital at levels in excess of minimum regulatory requirements. For example, a banking organization that is “well-capitalized” may qualify for exemptions from prior notice or application requirements otherwise applicable to certain types of activities; may qualify for expedited processing of other required notices or applications; and may accept brokered deposits. Additionally, one of the criteria that determines a bank holding company’s eligibility to operate as a financial holding company (see “Acquisitions, Activities and Changes in Control” below) is a requirement that all of its depository institution subsidiaries be “well-capitalized.” Under the Dodd-Frank Act, that requirement is extended such that, as of July 21, 2011, bank holding companies, as well as their depository institution subsidiaries, will have to be well-capitalized in order to operate as financial holding companies. Under the capital regulations of the Federal Reserve, in order to be “well-capitalized” a banking organization must maintain a ratio of total capital to total risk-weighted assets of 10% or greater, a ratio of Tier 1 Capital to total risk-weighted assets of 6% or greater and a ratio of Tier 1 Capital to total assets of 5% or greater.
Higher capital levels may also be required if warranted by the particular circumstances or risk profiles of individual banking organizations. For example, the Federal Reserve’s capital guidelines contemplate that additional capital may be required to take adequate account of, among other things, interest rate risk, or the risks posed by concentrations of credit, nontraditional activities or securities trading activities. Further, any banking organization experiencing or anticipating significant growth would be expected to maintain capital ratios, including tangible capital positions (i.e., Tier 1 capital less all intangible assets), well above the minimum levels.
It is important to note certain provisions of the Dodd-Frank Act and Basel III, discussed below, will ultimately establish strengthened capital standards for banks and bank holding companies, will require more capital to be held in the form of common stock and will disallow certain funds from being included in a Tier 1 Capital determination. Once fully implemented, these provisions may represent regulatory capital requirements which are meaningfully more stringent than those outlined above.
Prompt Corrective Action. A banking organization’s capital plays an important role in connection with regulatory enforcement as well. Federal law provides the federal banking regulators with broad power to take prompt corrective action to resolve the problems of undercapitalized institutions. The extent of the regulators’ powers depends on whether the institution in question is “adequately capitalized,” “undercapitalized,” “significantly undercapitalized” or “critically undercapitalized,” in each case as defined by regulation. Depending upon the capital category to which an institution is assigned, the regulators’ corrective powers include: (i) requiring the institution to submit a capital restoration plan; (ii) limiting the institution’s asset growth and restricting its activities; (iii) requiring the institution to issue additional capital stock (including additional voting stock) or to be acquired; (iv) restricting transactions between the institution and its affiliates; (v) restricting the interest rate the institution may pay on deposits; (vi) ordering a new election of directors of the institution; (vii) requiring that senior executive officers or directors be dismissed; (viii) prohibiting the institution from accepting deposits from correspondent banks; (ix) requiring the institution to divest certain subsidiaries; (x) prohibiting the payment of principal or interest on subordinated debt; and (xi) ultimately, appointing a receiver for the institution.
As of December 31, 2010: (i) the Bank was not subject to a directive from the OCC to increase its capital; (ii) the Bank exceeded its minimum regulatory capital requirements under OCC capital adequacy guidelines; and (iii) the Bank was “well-capitalized,” as defined by OCC regulations. However, due to a formal written agreement with the OCC, as discussed below, the Bank cannot be considered to be “well-capitalized” as long as the agreement is in effect. As of December 31, 2010, Trinity had regulatory capital in excess of the Federal Reserve’s minimum requirements.
Basel III. The current risk-based capital guidelines that apply to the Bank and will apply to Trinity are based upon the 1988 capital accord of the International Basel Committee on Banking Supervision, a committee of central banks and bank supervisors, as implemented by the U.S. federal banking agencies on an interagency basis. In 2008, the banking agencies collaboratively began to phase-in capital standards based on a second capital accord, referred to as “Basel II,” for large or “core” international banks (generally defined for U.S. purposes as having total assets of $250 billion or more or consolidated foreign exposures of $10 billion or more). Basel II emphasized internal assessment of credit, market and operational risk, as well as supervisory assessment and market discipline in determining minimum capital requirements.
On September 12, 2010, the Group of Governors and Heads of Supervision, the oversight body of the Basel Committee on Banking Supervision, announced agreement to a strengthened set of capital requirements for banking organizations in the United States and around the world, known as Basel III. The agreement is currently supported by the U.S. federal banking agencies. As agreed to, Basel III is intended to be fully-phased in on a global basis on January 1, 2019. However, the ultimate timing and scope of any U.S. implementation of Basel III remains uncertain. As agreed to, Basel III would require, among other things: (i) an increase in minimum required common equity to 7% of total assets; (ii) an increase in the minimum required amount of Tier 1 Capital from the current level of 4% of total assets to 8.5% of total assets; (iii) an increase in the minimum required amount of Total Capital, from the current level of 8% to 10.5%. Each of these increased requirements includes 2.5% attributable to a capital conservation buffer to be phased in from January 2016 until January 1, 2019. The purpose of the conservation buffer is to ensure that banks maintain a buffer of capital that can be used to absorb losses during periods of financial and economic stress. There will also be a required countercyclical buffer to achieve the broader goal of protecting the banking sector from periods of excess aggregate credit growth.
Pursuant to Basel III, certain deductions and prudential filters, including minority interests in financial institutions, mortgage servicing rights and deferred tax assets from timing differences, would be deducted in increasing percentages beginning January 1, 2014, and would be fully deducted from common equity by January 1, 2018. Certain instruments that no longer qualify as Tier 1 Capital, such as trust preferred securities, also would be subject to phase-out over a 10-year period beginning January 1, 2013.
The Basel III agreement calls for national jurisdictions to implement the new requirements beginning January 1, 2013. At that time, the U.S. federal banking agencies, including the Federal Reserve and OCC, will be expected to have implemented appropriate changes to incorporate the Basel III concepts into U.S. capital adequacy standards. Although the Basel III changes, as implemented in the United States, will likely result in generally higher regulatory capital standards, it is difficult at this time to predict how any new standards will ultimately be applied to Trinity and the Bank.
General. Trinity, as the sole shareholder of the Bank, is a bank holding company. As a bank holding company, Trinity is registered with, and is subject to regulation by, the Federal Reserve under the Bank Holding Company Act of 1956, as amended (the “BHCA”). In accordance with Federal Reserve policy, and as now codified by the Dodd-Frank Act, Trinity is legally obligated to act as a source of financial strength to the Bank and to commit resources to support the Bank in circumstances where Trinity might not otherwise do so. Under the BHCA, Trinity is subject to periodic examination by the Federal Reserve. Trinity is required to file with the Federal Reserve periodic reports of Trinity’s operations and such additional information regarding Trinity and its subsidiaries as the Federal Reserve may require.
Acquisitions, Activities and Change in Control. The primary purpose of a bank holding company is to control and manage banks. The BHCA generally requires the prior approval of the Federal Reserve for any merger involving a bank holding company or any acquisition by a bank holding company of another bank or bank holding company. Subject to certain conditions (including deposit concentration limits established by the BHCA and the Dodd-Frank Act), the Federal Reserve may allow a bank holding company to acquire banks located in any state of the United States. In approving interstate acquisitions, the Federal Reserve is required to give effect to applicable state law limitations on the aggregate amount of deposits that may be held by the acquiring bank holding company and its insured depository institution affiliates in the state in which the target bank is located (provided that those limits do not discriminate against out-of-state depository institutions or their holding companies) and state laws that require that the target bank have been in existence for a minimum period of time (not to exceed five years) before being acquired by an out-of-state bank holding company. Furthermore, in accordance with the Dodd-Frank Act, as of July 21, 2011, bank holding companies must be well-capitalized in order to effect interstate mergers or acquisitions. For a discussion of the capital requirements, see “The Increasing Importance of Capital” above.
The BHCA generally prohibits Trinity from acquiring direct or indirect ownership or control of more than 5% of the voting shares of any company that is not a bank and from engaging in any business other than that of banking, managing and controlling banks or furnishing services to banks and their subsidiaries. This general prohibition is subject to a number of exceptions. The principal exception allows bank holding companies to engage in, and to own shares of companies engaged in, certain businesses found by the Federal Reserve prior to November 11, 1999 to be “so closely related to banking ... as to be a proper incident thereto.” This authority would permit Trinity to engage in a variety of banking-related businesses, including the ownership and operation of a savings association, or any entity engaged in consumer finance, equipment leasing, the operation of a computer service bureau (including software development), and mortgage banking and brokerage. The BHCA generally does not place territorial restrictions on the domestic activities of non-bank subsidiaries of bank holding companies.
Additionally, bank holding companies that meet certain eligibility requirements prescribed by the BHCA and elect to operate as financial holding companies may engage in, or own shares in companies engaged in, a wider range of nonbanking activities, including securities and insurance underwriting and sales, merchant banking and any other activity that the Federal Reserve, in consultation with the Secretary of the Treasury, determines by regulation or order is financial in nature or incidental to any such financial activity or that the Federal Reserve determines by order to be complementary to any such financial activity and does not pose a substantial risk to the safety or soundness of depository institutions or the financial system generally. Trinity has elected (and the Federal Reserve has accepted Trinity’s election) to operate as a financial holding company.
Federal law also prohibits any person or company from acquiring “control” of an FDIC-insured depository institution or its holding company without prior notice to the appropriate federal bank regulator. “Control” is conclusively presumed to exist upon the acquisition of 25% or more of the outstanding voting securities of a bank or bank holding company, but may arise under certain circumstances between 10% and 24.99% ownership.
Capital Requirements. Bank holding companies are required to maintain minimum levels of capital in accordance with Federal Reserve capital adequacy guidelines, as affected by the Dodd-Frank Act and Basel III. For a discussion of capital requirements, see “The Increasing Importance of Capital” above.
Emergency Economic Stabilization Act of 2008. Events in the U.S. and global financial markets over the past several years, including deterioration of the worldwide credit markets, have created significant challenges for financial institutions throughout the country. In response to this crisis affecting the U.S. banking system and financial markets, on October 3, 2008, the U.S. Congress passed, and the President signed into law, the Emergency Economic Stabilization Act of 2008 (the “EESA”). The EESA authorized the Secretary of the United States Department of Treasury (“Treasury”) to implement various temporary emergency programs designed to strengthen the capital positions of financial institutions and stimulate the availability of credit within the U.S. financial system. Financial institutions participating in certain of the programs established under the EESA are required to adopt Treasury’s standards for executive compensation and corporate governance.
The TARP Capital Purchase Program. On October 14, 2008, Treasury announced a program that provided Tier 1 capital (in the form of perpetual preferred stock) to eligible financial institutions. This program, known as the TARP Capital Purchase Program (the “CPP”), allocated $250 billion from the $700 billion authorized by the EESA to Treasury for the purchase of senior preferred shares from qualifying financial institutions (the “CPP Preferred Stock”). Eligible institutions were able to sell equity interests to Treasury in amounts equal to between 1% and 3% of the institution’s risk-weighted assets. Trinity determined participation in CPP to be in its best interests based upon the economic uncertainties of the deep recession, the benefits of holding additional capital and the relatively low cost of participation.
As part of this program, on March 27, 2009, the Company issued 35,500 shares of the Company’s Series A Preferred Stock to Treasury for a purchase price of $35.5 million in cash and issued warrants which were immediately exercised by Treasury for 1,777 shares of the Company's Series B Preferred Stock. The Series A Preferred Stock is non-voting and pays dividends at the rate of 5% per annum for the first five years and thereafter at a rate of 9% per annum. The Series B Preferred Stock is also non-voting and pays dividends at the rate of 9% per annum from the date of the transaction.
Participating financial institutions are required to adopt Treasury’s standards for executive compensation and corporate governance for the period during which Treasury holds equity issued under the CPP. These requirements are discussed in more detail in the Compensation Discussion and Analysis section in Trinity’s 2011 Proxy statement, which is incorporated by reference in this Form 10-K.
Dividends. Trinity’s ability to pay dividends to its shareholders may be affected by both general corporate law considerations and policies of the Federal Reserve applicable to bank holding companies. New Mexico law prohibits Trinity from paying dividends if, after giving effect to the dividend: (i) Trinity would be unable to pay its debts as they become due in the usual course of its business; or (ii) Trinity’s total assets would be less than the sum of its total liabilities and (unless Trinity’s articles of incorporation otherwise permit) the maximum amount that then would be payable, in any liquidation, in respect of all outstanding shares having preferential rights in liquidation. Additionally, policies of the Federal Reserve caution that a bank holding company should not pay cash dividends unless its net income available to common shareholders over the past year has been sufficient to fully fund the dividends and the prospective rate of earnings retention appears consistent with its capital needs, asset quality, and overall financial condition. The Federal Reserve also possesses enforcement powers over bank holding companies and their non-bank subsidiaries to prevent or remedy actions that represent unsafe or unsound practices or violations of applicable statutes and regulations. Among these powers is the ability to proscribe the payment of dividends by banks and bank holding companies. Given recent developments concerning the Bank described further below, the Federal Reserve has notified Trinity that it will place restrictions on its ability to pay dividends. Notwithstanding the availability of funds for dividends, however, the OCC may prohibit the payment of dividends by the Bank if it determines such payment would constitute an unsafe or unsound practice. By virtue of express restrictions set forth in the Agreement, the Bank may not pay any dividend unless it complies with certain provisions of the Agreement and receives a prior written determination of no supervisory objection from the OCC.
Further, with respect to Trinity’s participation in the CPP, the terms of the CPP Preferred Stock provide that no dividends on any common or preferred stock that ranks equal to or junior to the CPP Preferred Stock may be paid unless and until all accrued and unpaid dividends for all past dividend periods on the CPP Preferred Stock have been fully paid. Furthermore, with respect to Trinity’s participation in the CPP, the terms of the CPP Preferred Stock provides that no dividends on any common or preferred stock that ranks equal to or junior to the CPP Preferred Stock may be paid unless and until all accrued and unpaid dividends for all past dividend periods on the CPP Preferred Stock have been fully paid. Additionally, Trinity is prohibited from paying a semi-annual dividend in excess of the amount paid in the last dividend paid prior to participating in CPP during the first three years. This means that Trinity may not pay in excess of $0.40/share as a semi-annual dividend on its common stock without the prior permission from Treasury until March 27, 2012. From March 28, 2012 to March 27, 2019, if Trinity has not yet redeemed Preferred Shares held by Treasury, Trinity may increase its dividends on its common stock by no more than 3% per year. Thereafter, Trinity may not pay any dividends on its common stock until it redeems all Preferred Shares held by Treasury. Trinity anticipates redeeming all such shares prior to March 27, 2019. Finally, the ability of Trinity to pay dividends to its common shareholders is largely dependent upon receiving dividends from the Bank as further discussed in “Market for Registrant's Common Equity, Related Stockholder Matters and Issuer Purchases of Equity Securities” in Item 5 of this Form 10-K. In addition, during the term of its participation in the CPP, the Company may not repurchase outstanding common shares or redeem any of the trust preferred securities without the prior approval of Treasury.
Additionally, the Company may not pay any dividends on our common stock unless all accrued dividends on the Preferred Stock have been paid in full. Beginning in August 2010, the Company has deferred the payments of dividends on the Preferred Stock in accordance with the terms of the Preferred Stock issuances. The dividends deferred are listed in Note 17 of this Form 10-K. Pursuant to the written Agreement with the OCC, the Bank must obtain prior approval for payment of dividends. Finally, because of the Agreement and the circumstances leading to its issuance by the OCC, we will need to seek the approval of the Federal Reserve prior to the holding company paying dividends on its common stock or distributions on the trust preferred securities and the Preferred Stock.
Incentive Compensation. On October 22, 2009, the Federal Reserve issued a comprehensive proposal on incentive compensation policies (the “Incentive Compensation Proposal”) intended to ensure that the incentive compensation policies of banking organizations do not undermine the safety and soundness of such organizations by encouraging excessive risk-taking. The Incentive Compensation Proposal, which covers all employees that have the ability to materially affect the risk profile of an organization, either individually or as part of a group, is based upon the key principles that a banking organization’s incentive compensation arrangements should (i) provide incentives that do not encourage risk-taking beyond the organization’s ability to effectively identify and manage risks, (ii) be compatible with effective internal controls and risk management, and (iii) be supported by strong corporate governance, including active and effective oversight by the organization’s board of directors. Banking organizations were instructed to begin an immediate review of their incentive compensation policies to ensure that they do not encourage excessive risk-taking and implement corrective programs as needed. Deficiencies in the incentive compensation arrangements must be immediately addressed.
Federal Securities Regulation. Trinity’s common stock is registered with the SEC under the Securities Act of 1933, as amended, and the Securities Exchange Act of 1934, as amended (the “Exchange Act”). Consequently, Trinity is subject to the information, proxy solicitation, insider trading and other restrictions and requirements of the SEC under the Exchange Act.
Corporate Governance. The Dodd-Frank Act addresses many matters related to investor protection, corporate governance and executive compensation that will affect most U.S. publicly traded companies. The Dodd-Frank Act will increase stockholder influence over boards of directors by requiring companies to give stockholders a non-binding vote on executive compensation and so-called “golden parachute” payments, and authorizing the SEC to promulgate rules that would allow stockholders to nominate and solicit voters for their own candidates using a company’s proxy materials. The legislation also directs the Federal Reserve to promulgate rules prohibiting excessive compensation paid to bank holding company executives, regardless of whether Trinity is publicly traded.
Los Alamos National Bank
General. Los Alamos National Bank (“Bank”) is a national banking organization created under the laws of the United States of America. The Bank is regulated primarily by the OCC, a branch of the Department of Treasury. The Bank currently has six full-service bank offices. In February 2006, the Bank created TCC Advisors as a wholly owned subsidiary of the Bank. In August of 2008, the Bank joined Cottonwood and currently holds a 24% interest. Cottonwood works with local start up companies involved in technology transfer from research institutions. The Bank is also the sole member of FNM Investment Fund IV which holds a 99.99% interest in FNM CDE IV, created to fund loans and investments in a New Market Tax Credit Project in Albuquerque, New Mexico. In September of 2010, the Bank joined SWMT as a 20% member. SWMT is focused on assisting new medical and life science technologies identify investment and financing opportunities. The Bank’s capital investment will be $250 thousand of which approximately $36 thousand has been funded.
Products and Services. The Bank provides a full range of financial services for deposit customers and we lend money to creditworthy borrowers at competitive interest rates. Our strategy has been to position ourselves in the market as a low-fee, high-value community bank. Our products include certificates of deposits, checking and saving accounts, on-line banking, Individual Retirement Accounts, loans, mortgage loan servicing, trust and investment services, international services and safe deposit boxes. These business activities make up our three key processes: investment of funds, generation of funds and service-for-fee income. We achieved our success in part by minimizing charges relating to the investment and generation of funds processes, i.e. loans, credit cards, checking and savings accounts. The profitability of our operations depends primarily on our net interest income, which is the difference between total interest earned on interest-earning assets and total interest paid on interest-bearing liabilities, and our ability to maintain efficient operations. In addition to our net interest income, we produce income through our mortgage servicing operations and other income processes, such as trust and investment services. A more complete description of our products and services makeup can be found under “Management’s Discussion and Analysis of Financial Condition and Results of Operations” in Item 7 in this Form 10-K.
Lending Activities.
General. We provide a broad range of commercial and retail lending services to corporations, partnerships, individuals and government agencies. We actively market our services to qualified borrowers. Lending officers build relationships with new borrowers entering our market areas as well as long-standing members of the local business community. We have established lending policies which include a number of underwriting factors to be considered in making a loan, including location, loan to value ratio, cash flow and the credit history of the borrower. Our current maximum legal lending limit to one borrower is approximately $27.6 million; however, the Bank may impose additional limitations on the amount it is willing to lend to one borrower as part of its credit risk management policies. Our loan portfolio is comprised primarily of loans in the areas of commercial real estate, residential real estate, construction, general commercial and consumer lending. As of December 31, 2010, residential mortgages made up approximately 33.6% of our loan portfolio; commercial real estate loans comprised approximately 35.7%; construction lending comprised 13.8%; general commercial loans comprised 12.6%; and consumer lending comprised 4.3%. The Bank is currently working to diversify its loan portfolio by growing loans outside of the residential and commercial real estate categories. In addition, the Bank originates residential mortgage loans for sale to third parties, primarily the Federal National Mortgage Association ("Fannie Mae"), and services many of these loans for the buyers.
Commercial Real Estate Loans. The largest portion of our loan portfolio is comprised of commercial real estate loans. Our focus in commercial real estate lending concentrates on loans to building contractors and developers. The primary repayment risk for a commercial real estate loan is the failure of the business due to economic events or governmental regulations outside of the control of the borrower or lender that negatively impact the future cash flow and market values of the affected properties. We have collateralized these loans and, in most cases, taken personal guarantees to help assure repayment. Our commercial real estate loans are primarily made based on the identified cash flow of the borrower and secondarily on the underlying real estate collateral. Credit support provided by the borrower for most of these loans and the probability of repayment is based on the liquidation of the real estate and enforcement of a personal guarantee, if any exists.
Residential Real Estate Loans. Residential mortgage lending has been an important part of our business since our formation in 1963. The majority of the residential mortgage loans we originate and retain are in the form of 15- and 30-year variable rate loans. We also originate 15- to 30-year fixed rate residential mortgages and sell most of these loans to outside investors. In 2010, we originated approximately $225.7 million in residential mortgage loans sold to third parties. We retain the servicing of almost all of the residential mortgages we originate. We believe the retention of mortgage servicing provides us with a relatively steady source of fee income as compared to fees generated solely from mortgage origination operations. Moreover, the retention of such servicing rights allows us to continue to have regular contact with mortgage customers and solidify relationships with those customers. As of December 31, 2010, the total sold residential mortgage loan portfolio we service on behalf of third parties was $1.0 billion. We do not engage in financing sub-prime loans nor do we participate in any sub-prime lending programs. We participate in the current Treasury programs, including Home Affordable Modification Program, to work with borrowers who are in danger of or who have defaulted on residential mortgage loans.
Construction Loans. We have been active in financing construction of residential and commercial properties in New Mexico, primarily in Northern New Mexico. This type of lending has decreased in the past twenty-four months because of the current economic downturn and the effect it has had on real estate sales. We manage the risk of construction lending through the use of underwriting and construction loan guidelines and require the work be done by reputable contractors. Construction loans are structured either to be converted to permanent loans at the end of the construction phase or to be paid off upon receiving financing from another financial institution. The amount financed on construction loans is based on the appraised value of the property, as determined by an independent appraiser, and an analysis of the potential marketability and profitability of the project and the costs of construction. Construction loans generally have terms that do not exceed 24 months. Loan proceeds are typically disbursed on a percentage of completion basis, as determined by inspections, with all construction required to be completed prior to the final disbursement of funds.
Construction loans afford us the opportunity to increase the interest rate sensitivity of our loan portfolio and to receive yields higher than those obtainable on adjustable rate mortgage loans secured by existing residential properties. These higher yields correspond to the higher risks associated with construction lending.
Commercial Loans. The Bank is an active commercial lender. Our focus in commercial lending concentrates on loans to business services companies and retailers. The Bank provides various credit products to our commercial customers, including lines of credit for working capital and operational purposes and term loans for the acquisition of equipment and other purposes. Collateral on commercial loans typically includes accounts receivable, furniture, fixtures, inventory and equipment. In addition, almost all commercial loans have personal guarantees to assure repayment. The terms of most commercial loans range from one to seven years. A significant portion of our commercial business loans reprice within one year or have floating interest rates.
Consumer Loans. We also provide all types of consumer loans, including motor vehicle, home improvement, student loans, credit cards, signature loans and small personal credit lines. Consumer loans typically have shorter terms and lower balances with higher yields as compared to our other loans, but generally carry higher risks of default. Consumer loan collections are dependent on the borrower’s continuing financial stability, and thus are more likely to be affected by adverse personal circumstances.
Additional information on the risks associated with our banking activities and products and concentrations can be found under “Risk Factors” in Section 1A of this Form 10-K.
Market Area.
General. In recent years, the economy in Northern New Mexico has seen significant increases in unemployment and has experienced slower than historical levels of activity in both real estate and retail segments of the economy. Unemployment in New Mexico in December 2010 remained lower than the national average with an unemployment rate of 8.5% (seasonally adjusted) compared to a national unemployment rate of 9.4% (seasonally adjusted); with 2010 averages of 8.4% for New Mexico and 9.6% nationally. New Mexico’s unemployment rate in December 2010 increased by 0.3% from December 2009 but has lowered from its peak of 8.8% reached in March 2010. Although New Mexico has seen lower than national levels of unemployment in recent years, during 2010 New Mexico experienced one half of the national unemployment rate decrease of 0.6%. Foreclosure rates in New Mexico during 2010 remained lower than the national average. New Mexico saw a change in governor in January 2011 which resulted in some uncertainty regarding previous lobbying for new businesses to move to the state; however, there remains a high percentage of federal government spending in the state which allows the economy to stay relatively steady in times of volatility. As the national economy improves, tourism is expected to begin recovering, one of the primary industries within the state.
Los Alamos. The Bank’s customers are concentrated in Northern and Central New Mexico, particularly in Santa Fe and Los Alamos Counties. The city of Los Alamos, the base of our operations, lies within Los Alamos County. Los Alamos County has approximately 18,000 residents. As of December 31, 2010, the Bank had approximately $34.0 million in commercial loans, $170.9 million in commercial real estate loans, $189.4 in residential loans, $35.5 million in construction loans, $25.6 in consumer and other loans and $767.0 million in deposits in Los Alamos County. The stability of the Los Alamos market has provided a solid base for the Company throughout its history. As virtually all communities suffered from the economic downturn in recent years, the effect in Los Alamos County has been minimized by federal government spending, primarily in the form of providing approximately $2.2 billion toward funding Laboratory projects and operations; however, there is no guarantee that such funding will ultimately be approved. Los Alamos County has the lowest unemployment rate in the state at a 2010 average rate of 3.9%, and consistently has the state’s highest personal per capita and median family income levels.
Los Alamos County experienced minimal growth in its population of 0.2% from 1990 to 2000 and an estimated decrease of 1.5% from April 1, 2000 to July 1, 2009, due to the aging population and the lack of significant parcels of land for development. The primary employer in Los Alamos County is the Laboratory, one of the world’s premier national security and scientific research and development institutions. The Laboratory is operated by Los Alamos National Security, LLC for the Department of Energy. The Laboratory employs approximately 11,782 employees. Most of the employees are scientists, engineers and technicians working in the areas of national security, bio-sciences, chemistry, computer science, earth and environmental sciences, materials science and physics, contributing to Los Alamos County’s exceptional percentages of the population with high school diplomas or equivalents (96.3%) and those with bachelor or higher degrees (60.5%) compared with national averages of 80.4% and 24.4% respectively (based upon 2000 census data). The concentration of highly skilled and highly educated residents provides the Bank with a sophisticated customer base and supports a median household income approximately 197% of the national average and an unemployment rate (3.9%) almost one-third the national average (9.6%) and less than one-half of the state average (8.4%). Median home values (based upon 2000 data) in Los Alamos County are well above average, $228,300 compared to $119,600 nationally, as is homeownership, at 78.6% compared to a national average of 66.2%.
Santa Fe. In 1999, the Bank opened its first full-service office in Santa Fe, New Mexico and opened a second full-service office in Downtown Santa Fe in August of 2004. The Bank opened a third full-service office in south Santa Fe in October of 2009. The Bank’s continued expansion into Santa Fe has permitted the convenient provision of products and services to our existing customer base in Santa Fe as well as attracting new customers. As of December 31, 2010, the Bank had approximately $67.2 million in commercial loans, $160.1 million in commercial real estate loans, $181.4 in residential loans, $87.3 million in construction loans, $17.4 in consumer and other loans and $536.3 million in deposits in the greater Santa Fe area. As of June 30, 2010, the Bank was the largest depository in Santa Fe according to the FDIC’s SOD Report for the fourth year in a row. The Santa Fe market has provided a solid base for the Company over the past several years. Santa Fe County is home to the state capital and the state government. The state and federal government are the area’s largest employers but is also heavily reliant upon tourism. The result is an elevated unemployment rate.
Santa Fe serves as the capital of New Mexico and is located approximately 35 miles southeast of Los Alamos. Santa Fe County has approximately 147,500 residents with its local economy based primarily on government and tourism. We expanded to the Santa Fe market, in part, to take advantage of the population growth, which has been higher than the state and national averages. Santa Fe County is one of the fastest growing counties in the state, with an estimated increase in population of 45.5% from 1990 to 2008 compared to 31.0% for the state and 22.3% for the country as a whole; and 14.1% between April 1, 2000 and July 1, 2009, compared to 10.5% for the state and 9.1% for the country as a whole. Santa Fe County also has higher than average percentages of its population with high school diplomas or equivalents (84.5%) and those with bachelor or higher degrees (36.9%) (based upon 2000 Census data). The median household income in Santa Fe County is slightly higher (1.26%) than the national average and compared to the state average (8.4%) and national average (9.6%). The Santa Fe Metropolitan Statistical Area (“MSA”) had the lowest unemployment rate for the three largest MSAs in the state at 7.1% as the average for 2010. Median home values in Santa Fe County (based upon 2000 data) are 55.36% above the national average, at $189,400 compared to $119,600 nationally, and homeownership is slightly higher at 68.6% compared to a national average of 66.2%.
Albuquerque. The Bank opened a Loan Production Office in the Uptown area of Albuquerque, New Mexico in 2005. The Bank received approval from the OCC on December 31, 2007 to provide full-services at this location. The Bank is currently evaluating its present and future opportunities in the Albuquerque area and incorporating these into our business strategy. As of December 31, 2010, the Bank had approximately $48.8 million in commercial loans, $94.2 million in commercial real estate loans, $29.9 in residential loans, $41.9 million in construction loans, $8.6 in consumer and other loans and $55.0 million in deposits in the greater Albuquerque area. Albuquerque is a city of approximately 505,000 residents and is located approximately 60 miles south of Los Alamos. The Albuquerque economy is more varied than either Los Alamos or Santa Fe, with no predominant industry or employer.
Albuquerque had an estimated increase in population of 15.9% from April 1, 2000 to July 1, 2009 compared to 10.5% for the state and 9.1% for the country as a whole. Albuquerque and its surrounding areas are some of the fastest growing in the state: the City of Rio Rancho, on the northern limits of Albuquerque grew 51.0% from 2000 to 2008; Sandoval County to the north of Albuquerque, which includes the City of Rio Rancho, grew 93.1% from 1990 to 2008 and 39.1% from April 1, 2000 to July 1, 2009; and Bernalillo County, which includes Albuquerque, grew 32.2% from 1990 to 2008 and 15.6% from April 1, 2000 to July 1, 2009. Albuquerque has higher than national and state averages in the percentage of its population with high school diplomas or equivalents (85.9%) and those with bachelor or higher degrees (31.8%). The median household income in Albuquerque is 26.4% lower than the national average and the unemployment rate was an average of 8.8% in 2010, 0.8% lower than the national average (9.6%). Albuquerque’s unemployment rate increased from 7.9% in December 2009 to 8.4% in December 2010. Median home values in Albuquerque (based upon 2000 data) are 6.68% above the national average, at $127,600 compared to $119,600 nationally, but homeownership is slightly lower at 60.4% compared to a national average of 66.2%.
Competition. We face strong competition both in originating loans and in attracting deposits. Competition in originating real estate loans comes primarily from other commercial banks, savings institutions and mortgage bankers making loans secured by real estate located in our market area. Commercial banks and finance companies, including finance company affiliates of automobile manufacturers, provide vigorous competition in consumer lending. We compete for real estate and other loans principally on the basis of the interest rates and loan fees we charge, the types of loans we originate and the quality and speed of services we provide to borrowers. Insurance companies and internet-based financial institutions present growing areas of competition both for loans and deposits.
There is substantial competition in attracting deposits from other commercial banks, savings institutions, money market and mutual funds, credit unions and other investment vehicles. Our ability to attract and retain deposits depends on our ability to provide investment opportunities that satisfy the requirements of investors as to rate of return, liquidity, risk and other factors. Under the Gramm-Leach-Bliley Act enacted in 2000, securities firms and insurance companies that elect to become financial holding companies may acquire banks and other financial institutions. This has significantly changed the competitive environment in which we conduct business. The financial services industry has also become more competitive as technological advances enable companies to provide financial services to customers outside their traditional geographic markets and provide alternative methods for financial transactions. These technological advances may diminish the importance of depository institutions and other financial intermediaries in the transfer of funds between parties.
Employees. As of December 31, 2010, the Bank had approximately 310 full time-equivalent employees. We are not a party to any collective bargaining agreements. Employee relations are excellent as evidenced by the results of our annual employee satisfaction surveys. Over the last nine years, the results of the employee satisfaction survey have consistently shown satisfaction levels exceeding our peers according to the independent consultant hired to administer and evaluate our surveys.
Regulation and Supervision
General. The Bank is a national bank, chartered by the OCC under the National Bank Act. The deposit accounts of the Bank are insured by the FDIC’s Deposit Insurance Fund (the “DIF”) to the maximum extent provided under federal law and FDIC regulations, and the Bank is a member of the Federal Reserve System. As a national bank, the Bank is subject to the examination, supervision, reporting and enforcement requirements of the OCC, the chartering authority for national banks. The FDIC, as administrator of the DIF, also has regulatory authority over the Bank. The Bank is also a member of the Federal Home Loan Bank System, which provides a central credit facility primarily for member institutions.
Regulatory Proceedings Against the Bank. On January 26, 2010, the Bank and the OCC entered into a written agreement (the “Agreement”). In the Agreement, the Bank was cited for an excessive level of classified assets and concentrations of credit. The Agreement contains, among other things, directives for the Bank to take specific actions, within time frames specified therein, to address risk management and capital matters that, in the view of the OCC, may impact the Bank’s overall safety and soundness. Specifically, the Bank is required to, among other things: (i) continue to develop, implement and ensure adherence to written programs designed to reduce the level of credit risk in the Bank’s loan portfolio; (ii) review, revise and ensure adherence to a written capital program; (iii) comply with its approved capital program; (iv) maintain higher minimum capital ratios; and (v) obtain prior OCC approval before paying dividends.
The Bank cannot be deemed to be “well capitalized” so long as the Agreement is in effect. If the OCC is not satisfied with the corrective actions that are taken in order to address the deficiencies, the OCC could take further enforcement actions, including requiring the sale or liquidation of the Bank. In such case, there can be no assurance that the proceeds of any such sale or liquidation would result in a full return of capital to investors.
In addition, because the Bank entered into the Agreement, it also is required to: (i) obtain prior approval for the appointment of new directors and the hiring or promotion of senior executive officers; (ii) comply with restrictions on severance payments and indemnification payments to institution-affiliated parties; and (iii) refrain from accepting or renewing brokered deposits. At December 31, 2010, the Bank believed that it has substantially addressed the provisions of the Agreement, and at March 10, 2011, the Bank believed that it had fully addressed the provisions of the Agreement. The Bank will continue taking the necessary actions to satisfy all requirements in the Agreement. A copy of the Agreement was filed as part of the Company’s Current Report on Form 8-K filed on February 1, 2010 with the SEC. The filing is available on the SEC’s website and the Company’s website.
Deposit Insurance. As an FDIC-insured institution, the Bank is required to pay deposit insurance premium assessments to the FDIC. The FDIC has adopted a risk-based assessment system whereby FDIC-insured depository institutions pay insurance premiums at rates based on their risk classification. An institution’s risk classification is assigned based on its capital levels and the level of supervisory concern the institution poses to the regulators.
On November 12, 2009, the FDIC adopted a final rule that required insured depository institutions to prepay on December 30, 2009, their estimated quarterly risk-based assessments for the fourth quarter of 2009 and for all of 2010, 2011, and 2012. On December 31, 2009, the Bank paid the FDIC $8.1 million in prepaid assessments. An institution’s prepaid assessments were calculated based on the institution’s actual September 30, 2009 assessment base, adjusted quarterly by an estimated 5% annual growth rate through the end of 2012. Of the $8.1 million, $517 thousand was expensed in 2009 and $3.1 million in 2010 with the remaining $4.5 million to be expensed over the remaining two year period. The FDIC also used the institution’s total base assessment rate in effect on September 30, 2009, increasing it by an annualized 3 basis points beginning in 2011. The FDIC began to offset prepaid assessments on March 30, 2010, representing payment of the regular quarterly risk-based deposit insurance assessment for the fourth quarter of 2009. Any prepaid assessment not exhausted after collection of the amount due on June 30, 2013, will be returned to the institution.
Amendments to the Federal Deposit Insurance Act also revise the assessment base against which an insured depository institution’s deposit insurance premiums paid to the DIF will be calculated. Under the amendments, the assessment base will no longer be the institution’s deposit base, but rather its average consolidated total assets less its average tangible equity. This may shift the burden of deposit insurance premiums toward those large depository institutions that rely on funding sources other than U.S. deposits. Additionally, the Dodd-Frank Act makes changes to the minimum designated reserve ratio of the DIF, increasing the minimum from 1.15% to 1.35% of the estimated amount of total insured deposits, and eliminating the requirement that the FDIC pay dividends to depository institutions when the reserve ratio exceeds certain thresholds. The FDIC is given until September 3, 2020 to meet the 1.35 reserve ratio target. Several of these provisions could increase the Bank’s FDIC deposit insurance premiums.
The Dodd-Frank Act permanently increases the maximum amount of deposit insurance for banks, savings institutions and credit unions to $250,000 per insured depositor, retroactive to January 1, 2009. Furthermore, the legislation provides that non-interest bearing transaction accounts have unlimited deposit insurance coverage through December 31, 2013. This temporary unlimited deposit insurance coverage replaces the Transaction Account Guarantee Program (“TAGP”) that expired on December 31, 2010. It covers all depository institution noninterest-bearing transaction accounts, but not low interest-bearing accounts. Unlike TAGP, there is no special assessment associated with the temporary unlimited insurance coverage, nor may institutions opt-out of the unlimited coverage.
FICO Assessments. The Financing Corporation (“FICO”) is a mixed-ownership governmental corporation chartered by the former Federal Home Loan Bank Board pursuant to the Competitive Equality Banking Act of 1987 to function as a financing vehicle for the recapitalization of the former Federal Savings and Loan Insurance Corporation. FICO issued 30-year noncallable bonds of approximately $8.1 billion that mature in 2017 through 2019. FICO’s authority to issue bonds ended on December 12, 1991. Since 1996, federal legislation has required that all FDIC-insured depository institutions pay assessments to cover interest payments on FICO’s outstanding obligations. These FICO assessments are in addition to amounts assessed by the FDIC for deposit insurance. During the year ended December 31, 2010, the FICO assessment rate was approximately 0.01% of deposits.
Supervisory Assessments. National banks are required to pay supervisory assessments to the OCC to fund the operations of the OCC. The amount of the assessment is calculated using a formula that takes into account the bank’s size and its supervisory condition. During the years ended December 31, 2010 and 2009, the Bank paid supervisory assessments to the OCC totaling $490 thousand and $301 thousand, respectively.
Capital Requirements. Banks are generally required to maintain capital levels in excess of other businesses. For a discussion of capital requirements, see “—The Increasing Importance of Capital” above.
Dividend Payments. The primary source of funds for Trinity is dividends from the Bank. Under the National Bank Act, a national bank may pay dividends out of its undivided profits in such amounts and at such times as the bank’s board of directors deems prudent. Without prior OCC approval, however, a national bank may not pay dividends in any calendar year that, in the aggregate, exceed the bank’s year-to-date net income plus the bank’s retained net income for the two preceding years.
The payment of dividends by any financial institution is affected by the requirement to maintain adequate capital pursuant to applicable capital adequacy guidelines and regulations, and a financial institution generally is prohibited from paying any dividends if, following payment thereof, the institution would be undercapitalized. The Bank exceeded its minimum capital requirements under applicable guidelines as of December 31, 2010. As of December 31, 2010, approximately $50.5 million was available to be paid as dividends by the Bank. Notwithstanding the availability of funds for dividends, however, the OCC may prohibit the payment of dividends by the Bank if it determines such payment would constitute an unsafe or unsound practice.
By virtue of express restrictions set forth in the Agreement, the Bank may not pay any dividend unless it complies with certain provisions of the Agreement and receives a prior written determination of no supervisory objection from the OCC.
Insider Transactions. The Bank is subject to certain restrictions imposed by federal law on “covered transactions” between the Bank and its “affiliates.” Trinity is an affiliate of the Bank for purposes of these restrictions, and covered transactions subject to the restrictions include extensions of credit to Trinity, investments in the stock or other securities of Trinity and the acceptance of the stock or other securities of Trinity as collateral for loans made by the Bank. The Dodd-Frank Act enhances the requirements for certain transactions with affiliates as of July 21, 2011, including an expansion of the definition of “covered transactions” and an increase in the amount of time for which collateral requirements regarding covered transactions must be maintained.
Certain limitations and reporting requirements are also placed on extensions of credit by the Bank to its directors and officers, to directors and officers of Trinity and its subsidiaries, to principal shareholders of Trinity and to “related interests” of such directors, officers and principal shareholders. In addition, federal law and regulations may affect the terms upon which any person who is a director or officer of Trinity or the Bank or a principal shareholder of Trinity may obtain credit from banks with which the Bank maintains a correspondent relationship.
Safety and Soundness Standards. The federal banking agencies have adopted guidelines that establish operational and managerial standards to promote the safety and soundness of federally insured depository institutions. The guidelines set forth standards for internal controls, information systems, internal audit systems, loan documentation, credit underwriting, interest rate exposure, asset growth, compensation, fees and benefits, asset quality and earnings.
In general, the safety and soundness guidelines prescribe the goals to be achieved in each area, and each institution is responsible for establishing its own procedures to achieve those goals. If an institution fails to comply with any of the standards set forth in the guidelines, the institution’s primary federal regulator may require the institution to submit a plan for achieving and maintaining compliance. If an institution fails to submit an acceptable compliance plan, or fails in any material respect to implement a compliance plan that has been accepted by its primary federal regulator, the regulator is required to issue an order directing the institution to cure the deficiency. Until the deficiency cited in the regulator’s order is cured, the regulator may restrict the institution’s rate of growth, require the institution to increase its capital, restrict the rates the institution pays on deposits or require the institution to take any action the regulator deems appropriate under the circumstances. Noncompliance with the standards established by the safety and soundness guidelines may also constitute grounds for other enforcement action by the federal banking regulators, including cease and desist orders and civil money penalty assessments.
Branching Authority. National banks headquartered in New Mexico, such as the Bank, have the same branching rights in New Mexico as banks chartered under New Mexico law, subject to OCC approval. New Mexico law grants New Mexico-chartered banks the authority to establish branches anywhere in the State of New Mexico, subject to receipt of all required regulatory approvals.
Federal law permits state and national banks to merge with banks in other states subject to: (i) regulatory approval; (ii) federal and state deposit concentration limits; and (iii) state law limitations requiring the merging bank to have been in existence for a minimum period of time (not to exceed five years) prior to the merger. The establishment of new interstate branches or the acquisition of individual branches of a bank in another state (rather than the acquisition of an out-of-state bank in its entirety) has historically been permitted only in those states the laws of which expressly authorize such expansion. However, the Dodd-Frank Act permits well-capitalized banks to establish branches across state lines without these impediments effective as of the day after its enactment, July 22, 2010.
Financial Subsidiaries. Under federal law and OCC regulations, national banks are authorized to engage, through “financial subsidiaries,” in any activity that is permissible for a financial holding company and any activity that the Secretary of the Treasury, in consultation with the Federal Reserve, determines is financial in nature or incidental to any such financial activity, except (i) insurance underwriting, (ii) real estate development or real estate investment activities (unless otherwise permitted by law), (iii) insurance company portfolio investments and (iv) merchant banking. The authority of a national bank to invest in a financial subsidiary is subject to a number of conditions, including, among other things, requirements that the bank must be well-managed and well-capitalized (after deducting from capital the bank’s outstanding investments in financial subsidiaries). The Bank has not applied for approval to establish any financial subsidiaries.
Transaction Account Reserves. Federal Reserve regulations, as presently in effect, require depository institutions to maintain reserves against their transaction accounts (primarily NOW and regular checking accounts), as follows: for transaction accounts aggregating more than $10.7 million to $58.8 million, the reserve requirement is 3% of total transaction accounts; and for transaction accounts aggregating in excess of $58.8 million, the reserve requirement is $1.443 million plus 10% of the aggregate amount of total transaction accounts in excess of $58.8 million. The first $10.7 million of otherwise reservable balances are exempted from the reserve requirements. These reserve requirements are subject to annual adjustment by the Federal Reserve. The Bank is in compliance with the foregoing requirements.
Consumer Financial Services. There are numerous developments in federal and state laws regarding consumer financial products and services that impact the Bank’s business. Importantly, the current structure of federal consumer protection regulation applicable to all providers of consumer financial products and services will change on July 21, 2011. In this regard, the Dodd-Frank Act creates a new Consumer Financial Protection Bureau (the “Bureau”) with extensive powers to supervise and enforce consumer protection laws. The Bureau has broad rule-making authority for a wide range of consumer protection laws that apply to all providers of consumer products and services, including the Bank, as well as the authority to prohibit “unfair, deceptive or abusive” acts and practices. The Bureau has examination and enforcement authority over providers with more than $10 billion in assets. Banks and savings institutions with $10 billion or less in assets, like the Bank, will continue to be examined by their applicable bank regulators. The Dodd-Frank Act also generally weakens the federal preemption available for national banks and federal savings associations, and gives state attorneys general the ability to enforce applicable federal consumer protection laws. It is unclear what changes will be promulgated by the Bureau and what effect, if any, such changes would have on the Bank.
The Dodd-Frank Act contains provisions that affect consumer mortgage lending. First, the new law significantly expands underwriting requirements applicable to loans secured by 1-4 residential real property and augments federal law combating predatory lending practices. In addition to numerous new disclosure requirements, the Dodd-Frank Act imposes new standards for mortgage loan originations on all lenders, including banks and savings associations, in an effort to strongly encourage lenders to verify a borrower’s ability to repay. Most significantly, the new standards limit the total points and fees that the Bank and/or a broker may charge on conforming and jumbo loans to 3% of the total loan amount. Also, the Dodd-Frank Act, in conjunction with the Federal Reserve’s final rule on loan originator compensation effective April 1, 2011, prohibits certain compensation payments to loan originators and prohibits steering consumers to loans not in their interest because it will result in greater compensation for a loan originator. These standards may result in a myriad of new systems, pricing and compensation controls in order to ensure compliance and to decrease repurchase requests and foreclosure defenses. The Dodd-Frank Act generally requires lenders or securitizers to retain an economic interest in the credit risk relating to loans the lender sells and other asset-backed securities that the securitizer issues if the loans have not complied with the ability to repay standards. The risk retention requirement generally will be 5%, but could be increased or decreased by regulation.
Federal and state laws further impact foreclosures and loan modifications, many of which laws have the effect of delaying or impeding the foreclosure process. The New Mexico Attorney General has been active in preventing foreclosure abuses and has filed suit against several large mortgage lenders to stop foreclosure proceedings and to seek civil penalties and restitution for mortgage fraud and violations of law. Legislation has been introduced in the state legislature that would establish pre-foreclosure loss mitigation obligations, and the New Mexico courts have already established voluntary foreclosure mediation processes. Moreover, legislation has been introduced in the U.S. Senate that would amend the Bankruptcy Code to permit bankruptcy courts to compel servicers and homeowners to enter mediation before initiating foreclosure. While legislation compelling loan modifications in Chapter 13 bankruptcies was approved by the House in 2010, the legislation was not approved by the Senate, and the requirement was not included in the Dodd-Frank Act or any other legislative or regulatory reforms. The scope, duration and terms of potential future legislation with similar effect continue to be discussed. The Bank cannot predict whether any such legislation will be passed or the impact, if any, it would have on the Bank’s business.
Title Guaranty & Insurance Company
General. Title Guaranty is a title insurance company organized under the laws of New Mexico and doing business in Los Alamos and Santa Fe Counties. Trinity acquired Title Guaranty in May of 2000 to provide services related to the lending activities of the Bank. Title Guaranty has provided services to the Los Alamos community since its founding in 1963 and handled approximately 71% of the mortgages recorded in Los Alamos County in 2010 and 78% in 2009. Title Guaranty has one competitor in Los Alamos County, which handled approximately 29% of the mortgages recorded in Los Alamos County in 2010. Title Guaranty opened a second office in the Bank’s Downtown Santa Fe facility in February 2005, and currently leases a title plant for Santa Fe County to provide title services and products. Title Guaranty faces strong competition in Santa Fe County from nine other title companies. In 2010, Title Guaranty handled approximately 14% of the mortgages recorded in Santa Fe County and 10% in 2009. Title Guaranty is regulated by the New Mexico Public Regulation Commission’s Department of Insurance with which Title Guaranty is required to file annual experience reports and who audits Title Guaranty annually. The annual experience report requires that Title Guaranty be audited annually by a certified public accountant.
Products and Services. The products and services offered by Title Guaranty include: title insurance; closings, including purchase/sale, commercial, construction, refinance, tax deferred exchange, relocation, and courtesy; escrow and notary services; title searches; and title reports. Title insurance covers lenders, investors, and property owners from potential losses that can arise in real estate ownership and is typically required for loans collateralized by real property. To streamline its processes, Title Guaranty employs current technology allowing customers to view the status of their file online. Title Guaranty’s national underwriters are Chicago Title Insurance Company, Commonwealth Land Title Insurance Company, Fidelity National Title Insurance Company, First American Title Company and Lawyers Title Insurance Corporation.
Employees. As of December 31, 2010, Title Guaranty had 12 full time-equivalent employees. Title Guaranty is not a party to any collective bargaining agreements. Employee relations are excellent as evidenced by the results of our annual employee satisfaction surveys.
Cottonwood Technology Group, LLC
In August 2008, the Bank obtained a 26% interest in Cottonwood. This entity is owned by the Bank, the Los Alamos Commerce & Development Corporation and an individual not otherwise associated with the Company. Cottonwood is focused on assisting new technologies, primarily those developed at New Mexico’s research and educational institutions, reach the market by providing management advice and capital consulting. Cottonwood is also engaged in the management and solicitation of funds for a venture capital fund, Cottonwood Technology Fund, in which the Bank is an investor. The Bank currently holds a 24% interest in Cottonwood. The Bank has fully funded its $150 thousand capital investment in Cottonwood.
FNM Investment Fund IV, LLC and FNM CDE IV, LLC
In 2009, the Bank created Finance New Mexico Investment Fund IV, LLC, a Delaware Limited Liability Company (“FNM Investment Fund IV”) to acquire a 99.99% interest in Finance New Mexico—Investor Series IV, LLC, a New Mexico Limited Liability Company (“FNM CDE IV”). Both entities were created to facilitate loans to, and to participate in, investments in a New Market Tax Credit project in downtown Albuquerque, New Mexico. The other member of FNM CDE IV is the New Mexico Finance Authority, a state instrumentality, which serves as manager.
Southwest Medical Technologies, LLC
In September of 2010, the Bank joined Southwest Medical Technologies, LLC ("SWMT") as a 20% member. Participation in this entity is part of the Bank's venture capital investments. This entity is owned by the Bank (20%), Southwest Medical Ventures, Inc. (60%), and New Mexico Co-Investment Fund II, L.P. (20%). SWMT is focused on assisting new medical and life science technologies identify investment and financing opportunities. The Bank’s capital investment will be $250 thousand of which approximately $36 thousand had been paid, as of December 31, 2010.
Trinity Capital Trust I, III, IV and V
Trinity Capital Trust I, Trinity Capital Trust III, Trinity Capital Trust IV, and Trinity Capital Trust V (the “Trusts”) are Delaware statutory business trusts formed in 2000, 2004, 2005, and 2006, for the purpose of issuing $10 million, $6 million, $10 million, and $10 million in trust preferred securities and lending the proceeds to Trinity. Trinity redeemed all amounts due under Trinity Capital Trust II in December 2006 and dissolved the entity. Trinity guarantees, on a limited basis, payments of distributions on the trust preferred securities and payments on redemption of the trust preferred securities. All trust preferred securities are currently included in the Tier 1 Capital of Trinity for regulatory capital purposes.
In addition to the other information in this Annual Report on Form 10-K, shareholders or prospective investors should carefully consider the following risk factors:
Difficult economic and market conditions have adversely affected our industry. Dramatic declines in the housing market over the past few years, with decreasing home prices and increasing delinquencies and foreclosures, have negatively impacted the credit performance of mortgage and construction real estate loans and resulted in significant write-downs of assets by many financial institutions across the United States. General downward economic trends, reduced availability of commercial credit and historically elevated unemployment have negatively impacted the credit performance of commercial and consumer credit, resulting in additional write-downs. Concerns over the stability of the financial markets and the economy have resulted in decreased lending by many financial institutions to their customers and to each other. These conditions have led to increased commercial and consumer deficiencies, lack of customer confidence, increased market volatility and widespread reductions in general business activity. The resulting economic pressure on consumers and businesses has adversely affected our industry and may adversely affect our business, results of operations and financial condition. A worsening of these conditions would likely exacerbate the adverse effects of these difficult market conditions on us and others in the financial institutions industry. In particular, we may face the following risks in connection with these events:
|
·
|
We may face further increased regulation of our industry especially as a result of increased rule making called for by the Dodd-Frank Act and compliance with such regulation may increase our costs and limit our ability to pursue business opportunities.
|
|
·
|
Customer demand for loans secured by real estate could be reduced due to weaker economic conditions, an increase in unemployment, a decrease in real estate values or an increase in interest rates.
|
|
·
|
The process we use to estimate losses inherent in our credit exposure requires difficult, subjective and complex judgments, including forecasts of economic conditions and how these economic conditions might impair the ability of our borrowers to repay their loans. The level of uncertainty concerning economic conditions may adversely affect the accuracy of our estimates which may, in turn, impact the reliability of the process.
|
|
·
|
The value of the portfolio of investment securities that we hold may be adversely affected.
|
|
·
|
Our ability to assess the creditworthiness of our customers may be impaired if the models and approaches we use to select, manage and underwrite the loans become less predictive of future behaviors.
|
|
·
|
Our ability to borrow from other financial institutions or to engage in sales of mortgage loans to third parties on favorable terms, or at all, could be adversely affected by further disruptions in the capital markets or other events, including deteriorating investor expectations.
|
|
·
|
We expect to face increased capital requirements, both at the Trinity level and at the Bank level. In this regard, the Collins Amendment to the Dodd-Frank Act requires the federal banking agencies to establish minimum leverage and risk-based capital requirements that will apply to both insured banks and their holding companies. Furthermore, the Group of Governors and Heads of Supervision, the oversight body of the Basel Committee on Banking Supervision, recently announced an agreement to a strengthened set of capital requirements for internationally active banking organizations, known as Basel III. We expect U.S. banking authorities to follow the lead of Basel III and require all U.S. banking organizations to maintain significantly higher levels of capital, which may limit our ability to pursue business opportunities and adversely affect our results of operations and growth prospects.
|
Our profitability is dependent upon the health of the markets in which we operate. We operate our banking offices in Los Alamos, White Rock, Santa Fe and Albuquerque, New Mexico. In recent years, the United States has suffered from historically difficult economic conditions. While the effects of these conditions have not been as bad in our markets as other parts of the country, our markets have still experienced significant difficulties due to the downturn in the national economy. If the overall economic climate in the United States, generally, and our market areas, specifically, fails to improve, this could result in a decrease in demand for our products and services, an increase in loan delinquencies and defaults and high or increased levels of problem assets and foreclosures. Moreover, because of our geographic concentration, we are less able than other regional or national financial institutions to diversify our credit risks across multiple markets.
As the largest employer in Northern New Mexico, the health of the Laboratory is central to the economic health of both Northern and Central New Mexico. The main indicator of the Laboratory’s health is its funding. The Laboratory’s 2011 fiscal budget is currently on a continuing resolution. The President’s initial 2012 fiscal budget proposals shows significantly increased levels of funding for the Laboratory, including the costs of new infrastructure. Any material decrease in the Laboratory’s funding may affect our customers’ business and financial interests, adversely affect economic conditions in our market area, affect the ability of our customers to repay their loans to us and generally affect our financial condition and results of operations.
Interest rates and other conditions impact our results of operations. Our profitability is in part a function of net interest margin. Like most banking institutions, our net interest margin will be affected by general economic conditions and other factors, including fiscal and monetary policies of the federal government, that influence market interest rates and our ability to respond to changes in such rates. At any given time, our assets and liabilities will be such that they are affected differently by a given change in interest rates. As a result, an increase or decrease in rates, the length of loan terms or the mix of adjustable and fixed rate loans in our portfolio could have a positive or negative effect on our net income, capital and liquidity. We measure interest rate risk under various rate scenarios and using specific criteria and assumptions. A summary of this process, along with the results of our net interest income simulations is presented at “Quantitative and Qualitative Disclosures About Market Risk” included under Item 7A of Part II of this report. Although we believe our current level of interest rate sensitivity is reasonable and effectively managed, significant fluctuations in interest rates may have an adverse effect on our business, financial condition and results of operations.
Changes in future rules applicable to CPP participants could adversely affect our business, results of operations and financial condition. On March 27, 2009, we issued $35.5 million of our Fixed Rate Cumulative Perpetual Preferred Stock, Series A, to the U.S. Treasury pursuant to the Capital Purchase Program (“CPP”), along with warrants to purchase 1,777 shares of our Fixed Rate Cumulative Perpetual Preferred Stock, Series B, which the Treasury immediately exercised. The rules and policies applicable to recipients of capital under the CPP have evolved since we first elected to participate in the program and their scope, timing and effect may continue to evolve in the future. Any redemption of the securities sold to the U.S. Treasury to avoid these restrictions would require prior OCC, Federal Reserve and U.S. Treasury approval. Based on guidelines recently issued by the Federal Reserve, institutions seeking to redeem CPP preferred stock must demonstrate an ability to access the long-term debt markets, successfully demonstrate access to public equity markets and meet a number of additional requirements and considerations before such institutions can redeem any securities sold to the U.S. Treasury.
Our ability to attract and retain management and key personnel may affect future growth and earnings, and legislation imposing compensation restrictions could adversely affect our ability to do so. Much of our success and growth has been influenced strongly by our ability to attract and retain management experienced in banking and financial services and familiar with the communities in our market areas. Our ability to retain executive officers, the current management teams, branch managers and loan officers of our bank subsidiary will continue to be important to the successful implementation of our strategy. It is also critical, as we grow, to be able to attract and retain qualified additional management and loan officers with the appropriate level of experience and knowledge about our market areas to implement our community-based operating strategy. The unexpected loss of services of any key management personnel, or the inability to recruit and retain qualified personnel in the future, could have an adverse effect on our business, results of operations and financial condition.
Further, we are subject to extensive restrictions on our ability to pay retention awards, bonuses and other incentive compensation during the period in which we have any outstanding securities held by the U.S. Treasury that were issued under the CPP. Many of the restrictions are not limited to our senior executives and could cover other employees whose contributions to revenue and performance can be significant. The limitations may adversely affect our ability to recruit and retain these key employees in addition to our senior executive officers, especially if we are competing for talent against institutions that are not subject to the same restrictions. The Dodd-Frank Act also directed the Federal Reserve to promulgate rules prohibiting excessive compensation paid to bank holding company executives. These rules, if adopted, may make it more difficult to attract and retain the people we need to operate our businesses and limit our ability to promote our objectives through our compensation and incentive programs.
We must effectively manage our credit risk, including risks specific to real estate value due to the large concentration of real estate loans in our loan portfolio. There are risks inherent in making any loan, including risks of nonpayment, risks resulting from uncertainties as to the future value of collateral and risks resulting from changes in economic and industry conditions. We attempt to minimize our credit risk through prudent loan underwriting procedures, careful monitoring of the concentration of our loans within specific industries, monitoring of our collateral values and market conditions, and periodic independent reviews of outstanding loans by our audit department, a third-party loan review as well as external auditors. However, we cannot assure such approval and monitoring procedures will eliminate these credit risks. If the overall economic climate in the United States, generally, and our market areas, specifically, fails to improve, or even if it does, our borrowers may experience difficulties in repaying their loans, and the level of nonperforming loans, charge-offs and delinquencies could rise and require further increases in the provision for loan losses, which would cause our net income and return on equity to decrease.
Further, the majority of the Bank’s loan portfolio is invested in commercial real estate, residential real estate, construction, general commercial and consumer lending. The maximum amount we can loan to any one customer and their related entities (our “legal lending limit”) is smaller than the limits of our national and regional competitors with larger lending limits. While there is little demand for loans over our legal lending limit ($27.6 million), we can and have engaged in participation loans with other financial institutions to respond to customer requirements. However, there are some loans and relationships that we cannot effectively compete for due to our size.
Real estate lending (including commercial, construction and residential) is a large portion of our loan portfolio. These categories constitute $990.6 million, or approximately 83.1% of our total loan portfolio as of December 31, 2010. The market value of real estate can fluctuate significantly in a short period of time as a result of market conditions in the geographic area in which the real estate is located. Although a significant portion of such loans is secured by real estate as a secondary form of collateral, adverse developments affecting real estate values in one or more of our markets could increase the credit risk associated with our loan portfolio. Additionally, commercial real estate lending typically involves larger loan principal amounts and the repayment of the loans generally is dependent, in large part, on sufficient income from the properties securing the loans to cover operating expenses and debt service. Economic events or governmental regulations outside of the control of the borrower or lender could negatively impact the future cash flow and market values of the affected properties.
The Bank’s residential mortgage loan operations include origination, sale and servicing. The Bank’s residential mortgage loan portfolio does not include subprime mortgages and contains a limited number of non-traditional residential mortgages. The Bank employs prudent underwriting standards in making residential mortgage loans. The majority of the residential mortgage loans originated by the Bank are sold to third-party investors, primarily to the Federal National Mortgage Association (“Fannie Mae”). The Bank continues to service the majority of loans that are sold to third-party investors, to build on our relationship with the customers and provide a continuing source of income through mortgage servicing right fees. The Bank purchased mortgage-backed securities in 2009 and 2010 based upon the returns and quality of these assets. Neither Trinity nor the Bank engaged in the packaging and selling of loan pools, such as CDOs, SIVs, or other instruments which contain subprime mortgage loans and have seen significant losses in value. As such, Trinity does not foresee any charge-offs, write-downs or other losses outside the ordinary course of business with respect to our residential mortgage operations.
The current real estate market in New Mexico has slowed, but not to the same extent as other areas of the nation. Residential real estate time on-the-market has increased and home values have generally declined during 2010 in our market areas. If loans collateralized by real estate become troubled during a time when market conditions are declining or have declined, we may not be able to realize the amount of security anticipated at the time of originating the loan, which could cause us to increase our provision for loan losses and adversely affect our operating results and financial condition. To mitigate such risk, we employ the use of independent third parties to conduct appraisals on our real estate collateral and adhere to limits set on the percentages for the loan amount to the appraised value of the collateral. We continually monitor the real estate markets and economic conditions in the areas in which our loans are concentrated.
Our construction and development loans are based upon estimates of costs and value associated with the complete project. These estimates may be inaccurate and we may be exposed to more losses on these projects than on other loans. At December 31, 2010, construction loans, including land acquisition and development, totaled $164.7 million, or 13.8%, of our total loan portfolio. Construction, land acquisition and development lending involve additional risks because funds are advanced based upon the value of the project, which is of uncertain value prior to its completion. Because of the uncertainties inherent in estimating construction costs, as well as the market value of the completed project and the effects of governmental regulation of real property and the general effects of the national and local economies, it is relatively difficult to evaluate accurately the total funds required to complete a project and the related loan-to-value ratio. As a result, construction loans often involve the disbursement of substantial funds with repayment dependent, in part, on the success of the ultimate project and the ability of the borrower to sell or lease the property, rather than the ability of the borrower or guarantor to repay principal and interest. If our appraisal of the value of the completed project proves to be overstated, we may have inadequate security for the repayment of the loan upon completion of construction of the project. If we are forced to foreclose on a project prior to or at completion due to a default, there can be no assurance that we will be able to recover all of the unpaid balance of, and accrued interest on, the loan as well as related foreclosure, sale and holding costs. In addition, we may be required to fund additional amounts to complete the project and may have to hold the property for an unspecified period of time. We have attempted to address these risks through our underwriting procedures, compliance with applicable regulations, requiring that advances typically be made on a percentage of completion basis as determined by independent third party inspectors, and by limiting the amount of construction development lending.
Our allowance for loan losses may prove to be insufficient to absorb losses in our loan portfolio. Lending money is a substantial part of our business. Every loan carries a certain risk that it will not be repaid in accordance with its terms or that any underlying collateral will not be sufficient to assure repayment. This risk is affected by, among other things:
|
·
|
cash flow of the borrower and/or the project being financed;
|
|
·
|
the changes and uncertainties as to the future value of the collateral, in the case of a collateralized loan;
|
|
·
|
the credit history of a particular borrower;
|
|
·
|
changes in economic and industry conditions; and
|
|
·
|
the duration of the loan.
|
We maintain an allowance for loan losses, which is a reserve established through a provision for loan losses charged to expense, which we believe is appropriate to provide for probable losses in our loan portfolio. The amount of this allowance is determined by our management through a periodic review and consideration of several factors, including, but not limited to:
|
·
|
our general reserve, based on our historical default and loss experience;
|
|
·
|
our specific reserve, based on our evaluation of non-performing loans and their underlying collateral; and
|
|
·
|
current macroeconomic factors and model imprecision factors.
|
The determination of the appropriate level of the allowance for loan losses inherently involves a high degree of subjectivity and requires us to make significant estimates of current credit risks and future trends, all of which may undergo material changes. Continuing deterioration in economic conditions affecting borrowers, new information regarding existing loans, identification of additional problem loans and other factors, both within and outside of our control, may require an increase in the allowance for loan losses. In addition, bank regulatory agencies periodically review our allowance for loan losses and may require an increase in the provision for possible loan losses or the recognition of further loan charge-offs, based on judgments different than those of management. In addition, if charge-offs in future periods exceed the allowance for loan losses, we will need additional provisions to increase the allowance for loan losses. Any increases in the allowance for loan losses will result in a decrease in net income and, possibly, capital, and may have a material negative effect on our financial condition and results of operations.
Our pace of growth may be limited due to current economic conditions in the United States in general and the financial services industry specifically. We anticipate that our existing capital resources will satisfy our capital requirements for the foreseeable future and will support our ability to increase our lending and grow. However, our ability to support continued growth in the future, both internally and through acquisitions, may be dependent on our ability to raise additional capital. Due to current conditions in the U.S. economy in general, and the financial services industry specifically, it may be difficult to raise inexpensive capital in the near future. Accordingly, until economic conditions in the United States, particularly for financial services companies, improve significantly, our ability to further expand our operations through internal growth and acquisitions may be limited.
We may need to raise additional capital in the future, which may not be available when it is needed. We are required by federal and state regulatory authorities to maintain adequate levels of capital to support our operations. We manage our growth rate and risk profile to ensure that our existing capital resources will satisfy our capital requirements for the foreseeable future. However, regulatory requirements, growth in assets outpacing growth in capital or our growth strategy may present conditions that would create a need for additional capital from the capital markets. Our ability to raise additional capital depends on conditions in the capital markets, general economic conditions and a number of other factors, including investor perceptions regarding the banking industry, market conditions and governmental activities, and on our financial condition and performance. There may not always be capital available or available on favorable terms. These conditions may alter our strategic direction and require us to manage our growth to remain within capital limits relying solely on our earnings for capital formation, thereby materially reducing our growth rate.
Our growth must be effectively managed and our growth strategy involves risks that may impact our net income. As part of our general growth strategy, we may expand into additional communities or attempt to strengthen our position in our current markets to take advantage of expanding market share by opening new offices. To the extent that we undertake additional office openings, we are likely to experience the effects of higher operating expenses relative to operating income from the new operations for a period of time, which may have an adverse effect on our levels of reported net income, return on average equity and return on average assets. Our current growth strategies involve internal growth from our current offices. The newest office (opened in October 2009) is approximately 15,000 square feet. Our experience has been rapid absorption of our Santa Fe offices, with our existing Santa Fe offices becoming profitable well ahead of budget; however, such rapid absorption is not guaranteed in the future.
We must compete with other banks and financial institutions in all lines of business. The banking and financial services business in our market is highly competitive. Our competitors include large regional banks, local community banks, savings institutions, securities and brokerage companies, mortgage companies, insurance companies, finance companies, money market mutual funds, credit unions and other non-bank financial service providers. Many of these competitors are not subject to the same regulatory restrictions and may therefore enable them to provide customers with an alternative to traditional banking services.
Increased competition in our market and market changes, such as interest rate changes, force management to better control costs in order to absorb any resultant narrowing of our net interest margin, i.e., the spread between the interest rates earned on investments and loans and the interest rates paid on deposits and other interest-bearing liabilities. Without effective management and cost controls, net income may be adversely impacted by changing conditions and competition. Our efficiency leads to a decreased cost of operation that allows us to effectively anticipate and respond to market and competitive changes without adversely affecting net income.
In January of 2010, the Bank entered into an Agreement with the OCC as described in Item 1 above. The Agreement is focused on reducing our classified loans and reducing our loan concentration in commercial real estate. As part of the Agreement, we agreed to develop and maintain a number of initiatives and policies, most of which were already implemented or are in the process of being implemented. If we are unable to comply with, or adhere to, all of the provisions in the Agreement, we could become subject to further regulatory enforcement actions, which could affect our business and operations and our ability to remain eligible for financial holding company status.
Technology is continually changing and we must effectively implement new innovations in providing services to our customers. The financial services industry is undergoing rapid technological changes with frequent innovations in technology-driven products and services. In addition to better serving customers, the effective use of technology increases our efficiency and enables us to reduce costs. Our future success will depend, in part, upon our ability to address the needs of our customers using innovative methods, processes and technology to provide products and services that will satisfy customer demands for convenience as well as to create additional efficiencies in our operations as we continue to grow and expand our market areas. In order to anticipate and develop new technology, we employ a full staff of internal information system developers and consider this area a core part of our business. In the past, we have been able to respond to technological changes faster and with greater flexibility than our competitors. However, we must continue to make substantial investments in technology, which may affect our net income.
There is a limited trading market for our common shares and, as with all companies, shareholders may not be able to resell shares at or above the price shareholders paid for them. Our common stock is not listed on any automated quotation system or securities exchange and no firm makes a market in our stock. The trading in our common shares has less liquidity than many other companies quoted on the national securities exchanges or markets. A public trading market having the desired characteristics of depth, liquidity and orderliness depends on the presence in the market of willing buyers and sellers of our common shares at any given time. This presence depends on the individual decisions of investors and general economic and market conditions over which we have no control. We cannot insure volume of trading in our common shares will increase in the future.
System failure or breaches of our network security could subject us to increased operating costs, damage to our reputation, litigation and other liabilities. The computer systems and network infrastructure we use could be vulnerable to unforeseen problems. Our operations are dependent upon our ability to protect our computer equipment against damage from physical theft, fire, power loss, telecommunications failure or a similar catastrophic event, as well as from security breaches, denial of service attacks, viruses, worms and other disruptive problems caused by hackers. Any damage or failure that causes an interruption in our operations could have a material adverse effect on our financial condition and results of operations. Computer break-ins, phishing and other disruptions could also jeopardize the security of information stored in, and transmitted through, our computer systems and network infrastructure, which may result in significant liability to us and may cause existing and potential customers to refrain from doing business with us, as well as damage to our reputation in general.
The Federal Financial Institutions Examination Council (FFIEC) issued guidance for “Strong Authentication/Two Factor Authentication” in the Internet banking environment. All financial institutions were required to make changes to their online banking systems to meet the new FFIEC requirements. In response to this guidance, Trinity incorporated multiple layers of security to protect our customers’ financial data. We further employ external information technology auditors to conduct extensive auditing and testing for any weaknesses in our systems, controls, firewalls and encryption to reduce the likelihood of any security failures or breaches. Although we, with the help of third-party service providers and auditors, intend to continue implementing security technology and establish operational procedures to prevent such damage, there can be no assurance that these security measures will be successful. In addition, advances in computer capabilities, new discoveries in the field of cryptography or other developments could result in a compromise or breach of the algorithms we, and our third-party service providers, use to encrypt and protect customer transaction data. A failure of such security measures could have a material adverse affect on our financial condition and results of operations.
We are subject to certain operational risks, including, but not limited to, customer or employee fraud and data processing system failures and errors. Employee errors and employee and customer misconduct could subject us to financial losses or regulatory sanctions and seriously harm our reputation. Employee errors could include data processing system failures and errors. Misconduct by our employees could include hiding unauthorized activities from us, improper or unauthorized activities on behalf of our customers or improper use of confidential information. It is not always possible to prevent employee errors and misconduct, and the precautions we take to prevent and detect this activity may not be effective in all cases. Employee errors could also subject us to financial claims for negligence. To mitigate operational risks, we maintain a system of internal controls and insurance coverage. Should our internal controls fail to prevent or detect an occurrence, or if any resulting loss is not insured or exceeds applicable insurance limits, it could have a material adverse affect on our business, financial condition and results of operations.
Our ability to pay dividends is limited. In August 2010 we began to defer the interest payments on $37.1 million of junior subordinated debentures that are held by four business trusts that we control. Pursuant to the respective indentures governing the subordinated debentures, we have the right to defer interest payments up to 20 consecutive quarters for a portion of the debentures and up to 10 consecutive semi-annual periods for the remaining portion; however, interest payments on the debentures, including all such deferred interest payments, must be paid before we pay dividends on our capital stock, including our common stock and the preferred stock issued to Treasury pursuant to the CPP. The total amount of such deferred interest as of December 31, 2010 was $1.4 million. Further detail with respect to the deferred payments may be found in Note 10 to our consolidated financial statements provided in Item 8 of this Form 10-K. On March 10, 2011, the Company elected to pay all of the deferred interest payments on the junior subordinated debentures, and the Company expects to make the payments in the first or second quarter of 2011. However, there is no guarantee the Company will not have to defer future interest payments.
In August 2010, we also began to defer the payment of dividends on the preferred stock we issued to Treasury in accordance with the terms of the CPP. Pursuant to the terms of the CPP, we may not pay any dividends on our common stock unless all accrued dividends on the Preferred Stock have been paid in full. Further detail with respect to the dividends deferred may be found in Note 16 to our consolidated financial statements provided in this Form 10-K. Furthermore, even should all accrued payments be paid in full, we may not increase the dividends payable on our common stock beyond the $0.40 semi-annual dividend that we had most recently declared prior to Treasury’s investment until March of 2012 without the consent of Treasury, provided Treasury still holds the Preferred Stock.
Finally, dividends from the Bank have traditionally served as a major source of the funds with which Trinity pays dividends and interest payments due. However, pursuant to the written Agreement with the OCC, the Bank may not pay dividends to Trinity without first obtaining prior regulatory approval.
Legislative and regulatory actions taken now or in the future may increase our costs and impact our business, governance structure, financial condition or results of operations. Trinity and the Bank are subject to extensive regulation by multiple regulatory bodies. These regulations may affect the manner and terms of delivery of our services. If we do not comply with governmental regulations, we may be subject to fines, penalties, lawsuits or material restrictions on our businesses in the jurisdiction where the violation occurred, which may adversely affect our business operations. Changes in these regulations can significantly affect the services that we provide as well as our costs of compliance with such regulations. In addition, adverse publicity and damage to our reputation arising from the failure or perceived failure to comply with legal, regulatory or contractual requirements could affect our ability to attract and retain customers.
Current economic conditions, particularly in the financial markets, have resulted in government regulatory agencies and political bodies placing increased focus and scrutiny on the financial services industry. The U.S. government has intervened on an unprecedented scale by temporarily enhancing the liquidity support available to financial institutions, establishing a commercial paper funding facility, temporarily guaranteeing money market funds and certain types of debt issuances and increasing insurance on bank deposits.
These programs have subjected financial institutions to additional restrictions, oversight and costs. In addition, new proposals for legislation continue to be introduced in the U.S. Congress that could further substantially increase regulation of the financial services industry, impose restrictions on the operations and general ability of firms within the industry to conduct business consistent with historical practices, including in the areas of compensation, interest rates, financial product offerings and disclosures, and have an effect on bankruptcy proceedings with respect to consumer residential real estate mortgages, among other things. Federal and state regulatory agencies also frequently adopt changes to their regulations or change the manner in which existing regulations are applied.
In recent years, regulatory oversight and enforcement have increased substantially, imposing additional costs and increasing the potential risks associated with our operations. If these regulatory trends continue, they could adversely affect our business and, in turn, our consolidated results of operations.
Monetary policies and regulations of the Federal Reserve could adversely affect our business, financial condition and results of operations. In addition to being affected by general economic conditions, our earnings and growth are affected by the policies of the Federal Reserve. An important function of the Federal Reserve is to regulate the money supply and credit conditions. Among the instruments used by the Federal Reserve to implement these objectives are open market operations in U.S. government securities, adjustments of the discount rate and changes in reserve requirements against bank deposits. These instruments are used in varying combinations to influence overall economic growth and the distribution of credit, bank loans, investments and deposits. Their use also affects interest rates charged on loans or paid on deposits.
The monetary policies and regulations of the Federal Reserve have had a significant effect on the operating results of commercial banks in the past and are expected to continue to do so in the future. The effects of such policies upon our business, financial condition and results of operations cannot be predicted.
Legislative and regulatory reforms applicable to the financial services industry may, if enacted or adopted, have a significant impact on our business, financial condition and results of operations. On July 21, 2010, the Dodd-Frank Act was signed into law, which significantly changes the regulation of financial institutions and the financial services industry. The Dodd-Frank Act, together with the regulations to be developed thereunder, includes provisions affecting large and small financial institutions alike, including several provisions that will affect how community banks, thrifts and small bank and thrift holding companies will be regulated in the future.
The Dodd-Frank Act, among other things, imposes new capital requirements on bank holding companies; changes the base for FDIC insurance assessments to a bank’s average consolidated total assets minus average tangible equity, rather than upon its deposit base, and permanently raises the current standard deposit insurance limit to $250,000; and expands the FDIC’s authority to raise insurance premiums. The legislation also calls for the FDIC to raise the ratio of reserves to deposits from 1.15% to 1.35% for deposit insurance purposes by September 30, 2020 and to “offset the effect” of increased assessments on insured depository institutions with assets of less than $10 billion. The Dodd-Frank Act also authorizes the Federal Reserve to limit interchange fees payable on debit card transactions, establishes the Bureau of Consumer Financial Protection as an independent entity within the Federal Reserve, which will have broad rulemaking, supervisory and enforcement authority over consumer financial products and services, including deposit products, residential mortgages, home-equity loans and credit cards, and contains provisions on mortgage-related matters, such as steering incentives, determinations as to a borrower’s ability to repay and prepayment penalties. The Dodd-Frank Act also includes provisions that affect corporate governance and executive compensation at all publicly-traded companies.
The Collins Amendment to the Dodd-Frank Act, among other things, eliminates certain trust preferred securities from Tier 1 capital, but certain trust preferred securities issued prior to May 19, 2010 by bank holding companies with total consolidated assets of $15 billion or less will continue to be includible in Tier 1 capital. This provision also requires the federal banking agencies to establish minimum leverage and risk-based capital requirements that will apply to both insured banks and their holding companies. Regulations implementing the Collins Amendment must be issued within 18 months of July 21, 2010.
These provisions, or any other aspects of current or proposed regulatory or legislative changes to laws applicable to the financial industry, if enacted or adopted, may impact the profitability of our business activities or change certain of our business practices, including the ability to offer new products, obtain financing, attract deposits, make loans, and achieve satisfactory interest spreads, and could expose us to additional costs, including increased compliance costs. These changes also may require us to invest significant management attention and resources to make any necessary changes to operations in order to comply, and could therefore also materially and adversely affect our business, financial condition and results of operations. Our management is actively reviewing the provisions of the Dodd-Frank Act, many of which are to be phased-in over the next several months and years, and assessing its probable impact on our operations. However, the ultimate effect of the Dodd-Frank Act on the financial services industry in general, and us in particular, is uncertain at this time.
The U.S. Congress has also recently adopted additional consumer protection laws such as the Credit Card Accountability Responsibility and Disclosure Act of 2009, and the Federal Reserve has adopted numerous new regulations addressing banks’ credit card, overdraft and mortgage lending practices. Additional consumer protection legislation and regulatory activity is anticipated in the near future.
Such proposals and legislation, if finally adopted, would change banking laws and our operating environment and that of our subsidiaries in substantial and unpredictable ways. We cannot determine whether such proposals and legislation will be adopted, or the ultimate effect that such proposals and legislation, if enacted, or regulations issued to implement the same, would have upon our business, financial condition or results of operations.
None
As of March 10, 2011, the Company conducted operations through six locations as shown below. Trinity is headquartered in the main Bank office in Los Alamos, New Mexico. Four banking offices are owned by the Bank and are not subject to any mortgages or material encumbrances. The Bank’s Albuquerque office is in leased office space and the Cerrillos Road office is subject to a Ground Lease as further discussed in Note 12 – “Description of Leasing Arrangements”. In addition to our offices, the Bank operates 30 automatic teller machines (“ATMs”) throughout Northern New Mexico. The ATMs are housed either on bank properties or on leased property.
|
Properties
|
Address
|
Entity
|
||
|
Company Headquarters
|
1200 Trinity Drive
Los Alamos, New Mexico 87544
|
Trinity
|
||
|
Los Alamos Office
|
1200 Trinity Drive
Los Alamos, New Mexico 87544
|
Bank, Title Guaranty
|
||
|
White Rock Office
|
77 Rover
White Rock, New Mexico 87544
|
Bank
|
||
|
Santa Fe Office I (Galisteo)
|
2009 Galisteo Street
Santa Fe, New Mexico 87505
|
Bank
|
||
|
Santa Fe Office II (Downtown)
|
301 Griffin Street
Santa Fe, New Mexico 87501
|
Bank, Title Guaranty
|
||
|
Albuquerque Office
|
6301 Indian School Road N.E.
Albuquerque, New Mexico 87110
|
Bank
|
||
|
Santa Fe Office III (Cerrillos Road)
|
3674 Cerrillos Road
Santa Fe, New Mexico 87507
|
Bank
|
The Company and its subsidiaries are not involved in any pending legal proceedings, other than routine legal proceedings occurring in the normal course of business and those otherwise specifically stated herein, which, in the opinion of management, are material to our consolidated financial condition.
Market Information
Trinity’s common stock is not listed on any automated quotation system or securities exchange. No firm makes a market in our stock. As of March 10, 2011, there were 6,449,726 shares of common stock outstanding and approximately 1,554 shareholders of record. The most recent reported sale price of Trinity’s stock as of December 31, 2010 was $9.75 per share.
The tables below show the reported high and low sales prices of the common stock during the periods indicated. The prices below are only the trades where the price was disclosed to the Company. Sales where the value of the shares traded were not given to us are not included. The following figures have been adjusted for all stock splits:
|
Quarter ending
|
High sales price
|
Low sales price
|
||||||
|
December 31, 2010
|
$ | 10.00 | $ | 8.50 | ||||
|
September 30, 2010
|
14.50 | 10.00 | ||||||
|
June 30, 2010
|
17.00 | 13.50 | ||||||
|
March 31, 2010
|
20.00 | 17.75 | ||||||
|
December 31, 2009
|
$ | 22.50 | $ | 20.00 | ||||
|
September 30, 2009
|
23.00 | 21.00 | ||||||
|
June 30, 2009
|
22.40 | 21.50 | ||||||
|
March 31, 2009
|
22.50 | 21.50 | ||||||
A table presenting the shares issued and available to be issued under stock-based benefit plans and arrangements can be found under Item 12—“Security Ownership of Certain Beneficial Owners and Management and Related Stockholder Matters” of this Form 10-K.
Dividend Policy
Since January 2009, Trinity paid dividends on our common stock as follows:
|
Date paid
|
Amount per share
|
|||
|
January 15, 2010
|
$ | 0.27 | ||
|
July 10, 2009
|
0.40 | |||
|
January 9, 2009
|
0.40 | |||
Trinity’s ability to pay dividends to shareholders is largely dependent upon the dividends it receives from the Bank and the Bank is subject to regulatory limitations on the amount of cash dividends it may pay. The Bank’s ability to pay dividends is subject to the prior approval of the OCC under the terms of the Agreement entered into on January 26, 2010. Please see “Business—Trinity Capital Corporation—Supervision and Regulation—Dividends” and “Business—Los Alamos National Bank—Supervision and Regulation—Dividend Payments” under Item 1 of this Form 10-K for a more detailed description of these limitations.
We have the right to, and may from time to time, enter into borrowing arrangements or issue other debt instruments, the provisions of which may contain restrictions on payment of dividends and other distributions on Trinity common stock and Trinity preferred stock. We have issued in the aggregate approximately $37.1 million in junior subordination debentures to Trinity Capital Trust I, Trinity Capital Trust III, Trinity Capital Trust IV and Trinity Capital Trust V. All of the common stock of the trusts is owned by Trinity and the debentures are the only assets of the trusts. In August 2010 we began to defer the interest payments on the junior subordinated debentures. Pursuant to the respective indentures governing the subordinated debentures, we have the right to defer interest payments up to 20 consecutive quarters for a portion of the debentures and up to 10 consecutive semi-annual periods for the remaining portion; however, interest payments on the debentures, including all such deferred interest payments, must be paid before we pay dividends on our capital stock, including our common stock and the preferred stock issued to Treasury pursuant to the CPP. Therefore, we may not pay dividends until all accrued interest payments on the junior subordinated debentures have been paid in full.
The terms of the CPP Preferred Stock issued in March of 2009 also place certain restrictions on the Trinity’s ability to pay dividends on its common stock. First, no dividends on Trinity’s common stock can be paid unless all accrued dividends on Treasury’s CPP Preferred Stock have been paid in full. In August 2010, we also began to defer the payments of dividends on the CPP Preferred Stock. Therefore, we may not pay dividends on common stock until all accrued interest payments on the preferred stock have been paid in full. Second, until the third anniversary of the date of Treasury’s investment, Trinity may not increase the dividends paid on its common stock above a semi-annual dividend of $0.40 per share without first obtaining the consent of Treasury. After the third anniversary date, Trinity may increase dividends on common stock no more than 3% per year without first obtaining the consent of Treasury. After the tenth anniversary date, Trinity may not pay dividends on common stock until Treasury’s investment is repaid.
Finally, due to the Agreement and the circumstances leading to its issuance by the OCC, we must seek approval from the Federal Reserve and the OCC prior to the Company and the Bank paying dividends on its common stock or distributions by the Company on the trust preferred securities and the CPP Preferred Stock.
Issuer Purchases of Equity Securities
During the fourth quarter of 2010, we made no repurchases of any class of our equity securities.
Shareholder Return Performance Graph
The following graph and related information shall not be deemed to be filed, but rather furnished to the SEC by inclusion herein.
The following graph shows a comparison of cumulative total returns for Trinity, the NASDAQ Stock Market, an index of all bank stocks followed by SNL, an index of bank stock for banks with $1 billion to $5 billion in total assets followed by SNL, and an index of bank stocks for banks in asset size over $500 million that are quoted on the Pink Sheets followed by SNL. The cumulative total shareholder return computations assume the investment of $100.00 on December 31, 2005 and the reinvestment of all dividends. Figures for Trinity’s common stock represent inter-dealer quotations, without retail markups, markdowns or commissions and do not necessarily represent actual transactions. The graph was prepared using data provided by SNL Securities LC, Charlottesville, Virginia.
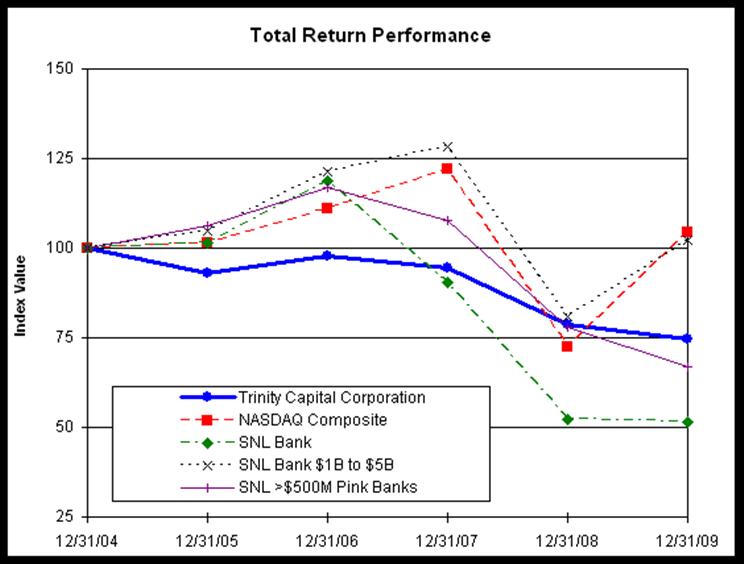
|
Period Ending
|
||||||||||||||||||||||||
|
Index
|
12/31/05
|
12/31/06
|
12/31/07
|
12/31/08
|
12/31/09
|
12/31/10
|
||||||||||||||||||
|
Trinity Capital Corporation
|
$
|
100.00
|
$
|
105.20
|
$
|
101.46
|
$
|
84.63
|
$
|
80.32
|
$
|
39.16
|
||||||||||||
|
NASDAQ Composite
|
100.00
|
109.52
|
121.27
|
70.32
|
103.90
|
120.75
|
||||||||||||||||||
|
SNL Bank
|
100.00
|
116.98
|
90.59
|
50.42
|
50.92
|
57.49
|
||||||||||||||||||
|
SNL Bank $1B to $5B
|
100.00
|
115.72
|
84.36
|
67.88
|
49.93
|
57.38
|
||||||||||||||||||
|
SNL >$500M Pink Banks
|
100.00
|
109.72
|
100.64
|
72.69
|
62.55
|
66.60
|
||||||||||||||||||
The following table sets forth certain consolidated financial and other data of Trinity at the dates and for the periods indicated.
|
Year Ended December 31,
|
||||||||||||||||||||
|
2010
|
2009
|
2008
|
2007
|
2006
|
||||||||||||||||
|
(Dollars in thousands, except per share data)
|
||||||||||||||||||||
|
Statement of Income Data:
|
||||||||||||||||||||
|
Interest income
|
$
|
72,497
|
$
|
77,768
|
$
|
83,200
|
$
|
96,989
|
$
|
85,034
|
||||||||||
|
Interest expense
|
17,815
|
23,977
|
35,936
|
47,998
|
39,216
|
|||||||||||||||
|
Net interest income
|
54,682
|
53,791
|
47,264
|
48,991
|
45,818
|
|||||||||||||||
|
Provision for loan losses
|
20,258
|
26,024
|
8,183
|
4,200
|
5,172
|
|||||||||||||||
|
Net interest income after provision for loan losses
|
34,424
|
27,767
|
39,081
|
44,791
|
40,646
|
|||||||||||||||
|
Other income
|
16,125
|
20,489
|
11,544
|
10,508
|
10,287
|
|||||||||||||||
|
Other expense
|
48,606
|
43,317
|
38,043
|
34,605
|
33,794
|
|||||||||||||||
|
Income before provision for income taxes
|
1,943
|
4,939
|
12,582
|
20,694
|
17,139
|
|||||||||||||||
|
Provision for income taxes
|
260
|
1,763
|
4,583
|
7,365
|
6,828
|
|||||||||||||||
|
Net income
|
1,683
|
3,176
|
7,999
|
13,329
|
10,311
|
|||||||||||||||
|
Dividends and discount accretion on preferred shares
|
2,127
|
1,604
|
-
|
-
|
-
|
|||||||||||||||
|
Net (loss) income available to common shareholders
|
$
|
(444
|
)
|
$
|
1,572
|
$
|
7,999
|
$
|
13,329
|
$
|
10,311
|
|||||||||
|
Common Share Data:
|
||||||||||||||||||||
|
Earnings per common share
|
$
|
(0.07
|
)
|
$
|
0.24
|
$
|
1.23
|
$
|
2.05
|
$
|
1.57
|
|||||||||
|
Diluted (loss) earnings per common share
|
(0.07
|
)
|
0.24
|
1.23
|
2.03
|
1.56
|
||||||||||||||
|
Book value per common share (1)
|
13.58
|
13.54
|
14.16
|
13.58
|
12.35
|
|||||||||||||||
|
Shares outstanding at end of period
|
6,449,726
|
6,440,784
|
6,448,548
|
6,482,650
|
6,532,898
|
|||||||||||||||
|
Weighted average common shares outstanding
|
6,445,542
|
6,444,268
|
6,478,395
|
6,514,613
|
6,572,770
|
|||||||||||||||
|
Diluted weighted average common shares outstanding
|
6,445,542
|
6,449,134
|
6,498,211
|
6,555,865
|
6,612,324
|
|||||||||||||||
|
Dividend payout ratio (2)
|
N/A
|
279.17
|
%
|
65.04
|
%
|
36.59
|
%
|
43.95
|
%
|
|||||||||||
|
Cash dividends declared per common share (3)
|
$
|
-
|
$
|
0.67
|
$
|
0.80
|
$
|
0.75
|
$
|
0.69
|
||||||||||
_________________________
|
(1)
|
Computed by dividing total stockholders’ equity, including net stock owned by Employee Stock Ownership Plan (“ESOP”), by shares outstanding at end of period.
|
|
|
(2)
|
Computed by dividing dividends declared per common share by earnings per common share.
|
|
|
(3)
|
Computed by dividing dividends on consolidated statements of changes in stockholders’ equity by weighted average common shares outstanding.
|
The following table reconciles net interest income on a fully tax-equivalent basis for the periods presented:
|
Year Ended December 31,
|
||||||||||||||||||||
|
2010
|
2009
|
2008
|
2007
|
2006
|
||||||||||||||||
|
(In thousands)
|
||||||||||||||||||||
|
Net interest income
|
$
|
54,682
|
$
|
53,791
|
$
|
47,264
|
$
|
48,991
|
$
|
45,818
|
||||||||||
|
Tax-equivalent adjustment to net interest income
|
721
|
634
|
441
|
558
|
486
|
|||||||||||||||
|
Net interest income, fully tax-equivalent basis
|
$
|
55,403
|
$
|
54,425
|
$
|
47,705
|
$
|
49,549
|
$
|
46,304
|
||||||||||
|
As of or for the year ended December 31,
|
||||||||||||||||||||
|
2010
|
2009
|
2008
|
2007
|
2006
|
||||||||||||||||
|
(Dollars in thousands)
|
||||||||||||||||||||
|
Balance Sheet Data:
|
||||||||||||||||||||
|
Investment securities
|
$
|
183,033
|
$
|
157,760
|
$
|
117,577
|
$
|
116,129
|
$
|
106,854
|
||||||||||
|
Loans, gross
|
1,189,938
|
1,239,786
|
1,230,534
|
1,171,106
|
1,131,724
|
|||||||||||||||
|
Allowance for loan losses
|
28,722
|
24,504
|
15,230
|
13,533
|
12,167
|
|||||||||||||||
|
Total assets
|
1,565,442
|
1,676,741
|
1,417,727
|
1,379,723
|
1,359,279
|
|||||||||||||||
|
Deposits
|
1,358,345
|
1,468,445
|
1,251,594
|
1,175,458
|
1,162,741
|
|||||||||||||||
|
Short-term and long-term borrowings, including ESOP borrowings and capital lease obligations
|
35,663
|
35,704
|
25,743
|
66,051
|
67,238
|
|||||||||||||||
|
Junior subordinated debt owed to unconsolidated trusts
|
37,116
|
37,116
|
37,116
|
37,116
|
37,116
|
|||||||||||||||
|
Stock owned by ESOP participants, net of unearned ESOP shares
|
6,132
|
12,541
|
13,105
|
16,656
|
17,438
|
|||||||||||||||
|
Stockholders' equity
|
117,323
|
110,361
|
78,180
|
71,371
|
63,240
|
|||||||||||||||
|
Performance Ratios:
|
||||||||||||||||||||
|
Return on average assets (1)
|
0.11
|
%
|
0.20
|
%
|
0.57
|
%
|
0.96
|
%
|
0.81
|
%
|
||||||||||
|
Return on average equity (2)
|
1.37
|
%
|
2.62
|
%
|
8.76
|
%
|
15.56
|
%
|
12.86
|
%
|
||||||||||
|
Return on average common equity (3)
|
-0.51
|
%
|
1.72
|
%
|
8.76
|
%
|
15.56
|
%
|
12.86
|
%
|
||||||||||
|
Net interest margin on a fully tax-equivalent basis (4)
|
3.66
|
%
|
3.64
|
%
|
3.52
|
%
|
3.73
|
%
|
3.81
|
%
|
||||||||||
|
Loans to deposits
|
87.60
|
%
|
84.43
|
%
|
98.32
|
%
|
99.63
|
%
|
97.33
|
%
|
||||||||||
|
Efficiency ratio (5)
|
68.65
|
%
|
58.32
|
%
|
64.69
|
%
|
58.16
|
%
|
60.23
|
%
|
||||||||||
_________________________
|
(1)
|
Calculated by dividing net income by average assets.
|
|
|
(2)
|
Calculated by dividing net income by the average stockholders’ equity, including stock owned by ESOP participants, net of unearned ESOP shares, during the year.
|
|
|
(3)
|
Calculated by dividing net income by the average stockholders’ equity, including stock owned by ESOP participants, net of unearned ESOP shares, during the year, less preferred stock and associated amortization and accretion.
|
|
|
(4)
|
Calculated by dividing net interest income (adjusted to a fully tax-equivalent basis, adjusting for federal and state exemption of interest income and certain other permanent income tax differences) by average earning assets.
|
|
|
(5)
|
Calculated by dividing operating expense by the sum of net interest income and other income.
|
|
Year Ended December 31,
|
||||||||||||||||||||
|
2010
|
2009
|
2008
|
2007
|
2006
|
||||||||||||||||
|
(Dollars in thousands)
|
||||||||||||||||||||
|
Asset Quality Ratios:
|
||||||||||||||||||||
|
Non-performing loans to total loans
|
4.19
|
%
|
5.24
|
%
|
2.71
|
%
|
1.01
|
%
|
0.77
|
%
|
||||||||||
|
Non-performing assets to total assets
|
4.62
|
%
|
4.90
|
%
|
2.57
|
%
|
0.95
|
%
|
0.66
|
%
|
||||||||||
|
Allowance for loan losses to total loans
|
2.41
|
%
|
1.97
|
%
|
1.24
|
%
|
1.15
|
%
|
1.07
|
%
|
||||||||||
|
Allowance for loan losses to non-performing loans
|
57.48
|
%
|
37.68
|
%
|
45.62
|
%
|
114.79
|
%
|
138.77
|
%
|
||||||||||
|
Net loan charge-offs to average loans
|
1.33
|
%
|
1.34
|
%
|
0.54
|
%
|
0.24
|
%
|
0.17
|
%
|
||||||||||
|
Capital Ratios: (1)
|
||||||||||||||||||||
|
Tier 1 capital (to risk-weighted assets)
|
13.23
|
%
|
12.90
|
%
|
10.08
|
%
|
10.32
|
%
|
9.60
|
%
|
||||||||||
|
Total capital (to risk-weighted assets)
|
14.50
|
%
|
14.16
|
%
|
11.80
|
%
|
12.11
|
%
|
11.50
|
%
|
||||||||||
|
Tier 1 capital (to average assets)
|
9.82
|
%
|
9.58
|
%
|
8.35
|
%
|
8.19
|
%
|
7.97
|
%
|
||||||||||
|
Average equity, including junior subordinated debt owed to unconsolidated trusts, to average assets
|
9.96
|
%
|
10.15
|
%
|
9.12
|
%
|
8.81
|
%
|
9.09
|
%
|
||||||||||
|
Average equity, excluding junior subordinated debt owed to unconsolidated trusts, to average assets
|
7.64
|
%
|
7.78
|
%
|
6.48
|
%
|
6.15
|
%
|
6.27
|
%
|
||||||||||
|
Other:
|
||||||||||||||||||||
|
Banking facilities
|
6
|
6
|
5
|
4
|
4
|
|||||||||||||||
|
Full-time equivalent employees
|
322
|
315
|
280
|
283
|
284
|
|||||||||||||||
_________________________
|
(1)
|
Ratios presented are for Trinity on a consolidated basis. See Item 7. “Management’s Discussion and Analysis of Financial Condition and Results of Operations—Capital Resources.”
|
Our summary consolidated financial information and other financial data contain information determined by methods other than in accordance with accounting principles generally accepted in the United States of America (GAAP). These measures include net interest margin on a fully tax-equivalent basis and average equity including junior subordinated debt owed to unconsolidated trusts to average assets. Management uses these non-GAAP measures in its analysis of the Company’s performance. The tax-equivalent adjustment to net interest margin recognizes the income tax savings when comparing taxable and tax-exempt assets and adjusting for federal and state exemption of interest income and certain other permanent income tax differences. Reconciliations of net interest income on a fully tax-equivalent basis to net interest income and net interest margin on a fully tax-equivalent basis to net interest margin are contained in tables under “Net interest income.” Banking and financial institution regulators include junior subordinated debt owed to unconsolidated trusts when assessing capital adequacy. Management believes the presentation of the financial measures excluding the impact of these items provides useful supplemental information that is helpful in understanding our financial results, as they provide a method to assess management’s success in utilizing non-equity sources of capital. Management also believes that it is a standard practice in the banking industry to present net interest income and net interest margin on a fully tax-equivalent basis, and accordingly believes the presentation of the financial measures may be useful for peer comparison purposes. This disclosure should not be viewed as a substitute for the results determined to be in accordance with GAAP, nor is it necessarily comparable to non GAAP performance measures that may be presented by other companies.
This discussion is intended to focus on certain financial information regarding Trinity and the Bank and is written to provide the reader with a more thorough understanding of its financial statements. The following discussion and analysis of Trinity’s financial position and results of operations should be read in conjunction with the information set forth in Item 7A, “Quantitative and Qualitative Disclosures about Market Risk” and the consolidated financial statements and notes thereto appearing under Item 8 of this report.
Special Note Concerning Forward-Looking Statements
This document (including information incorporated by reference) contains, and future oral and written statements of the Company and its management may contain, forward-looking statements, within the meaning of such term in the Private Securities Litigation Reform Act of 1995, with respect to the financial condition, results of operations, plans, objectives, future performance and business of the Company. Forward-looking statements, which may be based upon beliefs, expectations and assumptions of the Company’s management and on information currently available to management, are generally identifiable by the use of words such as “believe,” “expect,” “anticipate,” “plan,” “intend,” “estimate,” “may,” “will,” “would,” “could,” “should” or other similar expressions. Additionally, all statements in this document, including forward-looking statements, speak only as of the date they are made, and the Company undertakes no obligation to update any statement in light of new information or future events.
The Company’s ability to predict results or the actual effect of future plans or strategies is inherently uncertain. The factors which could have a material adverse effect on the operations and future prospects of the Company and its subsidiaries are detailed in the “Risk Factors” section included under Item 1A of Part I of this Form 10-K. In addition to the risk factors described in that section, there are other factors that may impact any public company, including ours, which could have a material adverse effect on the operations and future prospects of the Company and its subsidiaries. These risks and uncertainties should be considered in evaluating forward-looking statements and undue reliance should not be placed on such statements.
Critical Accounting Policies
Allowance for Loan Losses: The allowance for loan losses is that amount which, in management’s judgment, is considered appropriate to provide for probable losses in the loan portfolio. In analyzing the adequacy of the allowance for loan losses, management uses a comprehensive loan grading system to determine risk potential in the portfolio, and considers the results of periodic internal and external loan reviews. Historical loss experience factors and specific reserves for impaired loans, combined with other considerations, such as delinquency, non-accrual, trends on criticized and classified loans, economic conditions, concentrations of credit risk, and experience and abilities of lending personnel, are also considered in analyzing the adequacy of the allowance. Management uses a systematic methodology, which is applied at least quarterly, to determine the amount of allowance for loan losses and the resultant provisions for loan losses it considers adequate to provide for probable loan losses. In the event that different assumptions or conditions were to prevail, and depending upon the severity of such changes, the possibility of materially different financial condition or results of operations is a reasonable likelihood.
Three methods are used to evaluate the adequacy of the allowance for loan losses: (1) specific identification, based on management’s assessment of loans in our portfolio and the probability that a charge-off will occur in the upcoming quarter; (2) losses probable in the loan portfolio besides those specifically identified, based upon a migration analysis of the percentage of loans currently performing that have probable losses; and (3) qualitative adjustments based on management’s assessment of certain risks such as delinquency trends, watch-list and classified trends, changes in concentrations, economic trends, industry trends, non-accrual trends, exceptions and loan-to-value guidelines, management and staff changes and policy or procedure changes.
While management uses the best information available to make its evaluation, future adjustments to the allowance may be necessary if there are significant changes in economic conditions. In addition, as an integral part of their examination process regulatory agencies periodically review our allowance for loan losses and may require us to make additions to the allowance based on their evaluation of information available at the time of their examinations.
During 2010, the Company experienced some improvement in its asset quality when compared to the prior year, as measured by non-performing assets and classified loans to those that are still performing. Management remains concerned about possible losses in its real estate loan portfolios. Management deemed the allocations during 2010 to be a necessary and prudent step to reserve against probable losses. Management will continue to closely monitor asset quality in general, and real estate loan quality in particular, and is committed to act aggressively to minimize further losses.
Mortgage Servicing Right (MSR) Assets: Servicing residential mortgage loans for third-party investors represents a significant business activity of the Bank. As of December 31, 2010, mortgage loans serviced for others totaled $1.0 billion. The net carrying amount of the MSRs on these loans totaled $8.0 million as of December 31, 2010. The expected and actual rates of mortgage loan prepayments are the most significant factors driving the value of MSRs. Increases in mortgage loan prepayments reduce estimated future net servicing cash flows because the life of the underlying loan is reduced. In determining the fair value of the MSRs, mortgage interest rates, which are used to determine prepayment rates and discount rates, are held constant over the estimated life of the portfolio. Fair values of the MSRs are calculated on a monthly basis. The values are based upon current market conditions and assumptions, which incorporate the expected life of the loans, estimated costs to service the loans, servicing fees to be received and other factors. MSRs are carried at the lower of the initial capitalized amount, net of accumulated amortization, or fair value.
An analysis of changes in mortgage servicing rights assets follows:
|
2010
|
2009
|
2008
|
||||||||||
|
(In thousands)
|
||||||||||||
|
Balance at beginning of period
|
$
|
8,525
|
$
|
6,908
|
$
|
8,250
|
||||||
|
Servicing rights originated and capitalized
|
2,161
|
4,116
|
1,398
|
|||||||||
|
Amortization
|
(1,656
|
)
|
(2,499
|
)
|
(2,740
|
)
|
||||||
|
$
|
9,030
|
$
|
8,525
|
$
|
6,908
|
|||||||
Below is an analysis of changes in the mortgage servicing right assets valuation allowance:
|
2010
|
2009
|
2008
|
||||||||||
|
(In thousands)
|
||||||||||||
|
Balance at beginning of period
|
$
|
(878
|
)
|
$
|
(1,637
|
)
|
$
|
(184
|
)
|
|||
|
Aggregate reductions credited to operations
|
1,556
|
2,144
|
1,347
|
|||||||||
|
Aggregate additions charged to operations
|
(1,748
|
)
|
(1,385
|
)
|
(2,800
|
)
|
||||||
|
$
|
(1,070
|
)
|
$
|
(878
|
)
|
$
|
(1,637
|
)
|
||||
The aggregate fair values of the MSRs were $8.6 million, $8.8 million and $5.7 million on December 31, 2010, 2009 and 2008, respectively.
The primary risk characteristics of the underlying loans used to stratify the servicing assets for the purposes of measuring impairment are interest rate and original term.
Our valuation allowance is used to recognize impairments of our MSRs. An MSR is considered impaired when the market value of the MSR is below the amortized book value of the MSR. The MSRs are accounted by risk tranche, with the interest rate and term of the underlying loan being the primary strata used in distinguishing the tranches. Each tranche is evaluated separately for impairment.
We have our MSRs analyzed for impairment on a monthly basis. The underlying loans on all serviced loans are analyzed and, based upon the value of MSRs that are traded on the open market, a current market value for each risk tranche in our portfolio is assigned. We then compare that market value to the current amortized book value for each tranche. The change in market value (up to the amortized value of the MSR) is recorded as an adjustment to the MSR valuation allowance, with the offset being recorded as an addition or a reduction to income.
The impairment is analyzed for other than temporary impairment on a quarterly basis. The MSRs would be considered other than temporarily impaired if there is likelihood that the impairment would not be recovered before the expected maturity of the asset. If the underlying mortgage loans have been amortized at a rate greater than the amortization of the MSR, the MSR may be other than temporarily impaired. As of December 31, 2010, none of the MSRs were considered other than temporarily impaired.
The following assumptions were used to calculate the market value of the MSRs as of December 31, 2010, 2009 and 2008:
|
At December 31,
|
||||||||||||
|
2010
|
2009
|
2008
|
||||||||||
|
Prepayment Standard Assumption (PSA) speed
|
233.33
|
%
|
232.00
|
%
|
390.00
|
%
|
||||||
|
Discount rate
|
10.75
|
10.76
|
10.76
|
|||||||||
|
Earnings rate
|
2.17
|
2.75
|
3.50
|
|||||||||
Overview. Despite a weak national recovery in 2010, the Company remained profitable. We remained the largest single market-share holder in our two markets (Santa Fe and Los Alamos Counties), as measured by the SOD reports compiled by the FDIC as of June 30, 2010. While earnings were significantly lower in 2010 as compared to recent years, Trinity was able to end the year with income of approximately $1.7 million before the required dividends on preferred shares issued under the CPP. Such income was after a provision for loan losses in 2010 of $20.3 million. As a prudent measure against probable losses in our loan portfolio, allowance for loan losses was raised by $4.2 million (representing a 17.2% increase over the allowance as of December 31, 2009).
The national and state economies continue to be depressed relative to historical comparisons. The Company continues to experience challenges in its loan portfolio, with higher than typically experienced levels of non-performing loans and foreclosed properties. In response to these challenges, and to proactively position the Company to meet these challenges, we have continued to reduce our concentrations in the commercial real estate and construction real estate portfolios, increased capital by managing growth and restrict dividends and have taken other steps in compliance with the Agreement with the OCC.
Regulatory Proceedings Against the Bank. As previously disclosed, the Bank and the OCC entered into a written agreement (the “Agreement”) on January 26, 2010. The Agreement contains, among other things, directives for the Bank to take specific actions, within time frames specified therein, to address risk management and capital matters that, in the view of the OCC, may impact the Bank’s overall safety and soundness. Specifically, the Bank is required to, among other things: (i) continue to develop, implement and ensure adherence to written programs designed to reduce the level of credit risk in the Bank’s loan portfolio; (ii) review, revise and ensure adherence to a written capital program; (iii) comply with its approved capital program, which calls for maintaining higher than the regulatory minimum capital ratios; and (iv) obtain prior OCC approval before paying dividends.
At December 31, 2010, the Bank believed that it has substantially addressed the provisions of the Agreement, and at March 10, 2011, the Bank believed that it had fully addressed the provisions of the Agreement. The Bank will continue taking the necessary actions to satisfy all requirements in the Agreement. A copy of the Agreement was filed as part of the Company’s Current Report on Form 8-K filed on February 1, 2010 with the SEC. The filing is available on the SEC’s website and the Company’s website.
Income Statement Analysis
Net Income-General. Trinity’s net income (loss) available to common shareholders for the year ended December 31, 2010, totaled $(444) thousand, or a diluted loss of $(0.07) per common share, compared to income for the year ended December 31, 2009 of $1.6 million, or $0.24 diluted earnings per common share, a decrease of $2.0 million in net income available to common shareholders and a decrease of $0.31 in diluted earnings per common share. This decrease in net income available to common shareholders was primarily due to an increase in the non-interest expense of $5.3 million and a decrease in non-interest income of $4.4 million. The increase in non-interest expense was primarily due to an increase in the loss on sale of other real estate owned, an increase in collection expenses and an increase in salaries and employee benefits. The increase in the loss on sale of other real estate owned was a direct result of increased foreclosures on property and continued weaknesses in the real estate market, resulting in continued write-downs in values on foreclosed property. The increase in collection expenses was primarily due to expenses directly related to collection efforts on nonperforming loans. The increase in salaries and employee benefits was due to increased staff costs associated with the opening of our newest office in Santa Fe during the fourth quarter of 2009. Non-interest income decreased primarily due to a decrease in the gain on sale of securities and the gain on sale of loans. The gain on sale of securities declined primarily due to a lower volume of securities sold in 2010 compared to 2009. The decline in the gain on sale of loans was primarily due to a decline in the volume of loans in 2010 from the volume sold in 2009. In addition, the provision for loan losses decreased $5.8 million from 2009 to 2010 and net interest income increased $891 thousand during the same period. The decrease in the provision for loan losses was due to management’s analysis of the improvement in asset quality over the two periods. Net interest income increased slightly due to a decrease in interest expense due to lower interest rates in 2010 than compared to 2009. Income tax expenses decreased $1.5 million from 2009 to 2010 mainly due to lower pre-tax income.
The profitability of the Company’s operations depends primarily on its net interest income, which is the difference between total interest earned on interest-earning assets and total interest paid on interest-bearing liabilities. The Company’s net income is also affected by its provision for loan losses as well as other income and other expenses. The provision for loan losses reflects the amount management believes to be adequate to cover probable credit losses in the loan portfolio. Non-interest income or other income consists of mortgage loan servicing fees, trust fees, loan and other fees, service charges on deposits, gain on sale of loans, gain on sale of securities, title insurance premiums and other operating income. Other expenses include salaries and employee benefits, occupancy expenses, data processing expenses, marketing, amortization and valuation of mortgage servicing rights, amortization and valuation of other intangible assets, supplies expense, loss on other real estate owned, postage, bankcard and ATM network fees, legal, professional and accounting fees, FDIC insurance premiums, collection expenses and other expenses.
The amount of net interest income is affected by changes in the volume and mix of interest-earning assets, the level of interest rates earned on those assets, the volume and mix of interest-bearing liabilities, and the level of interest rates paid on those interest-bearing liabilities. The provision for loan losses is dependent on changes in the loan portfolio and management’s assessment of the collectability of the loan portfolio, as well as economic and market conditions. Other income and other expenses are impacted by growth of operations and growth in the number of accounts through both acquisitions and core banking business growth. Growth in operations affects other expenses as a result of additional employees, branch facilities and promotional marketing expenses. Growth in the number of accounts affects other income including service fees as well as other expenses such as computer services, supplies, postage, telecommunications and other miscellaneous expenses.
Net Interest Income. The following tables present, for the periods indicated, the total dollar amount of interest income from average interest earning assets and the resultant yields, as well as the interest expense on average interest bearing liabilities, and the resultant costs, expressed both in dollars and rates:
|
Year Ended December 31,
|
||||||||||||||||||||||||||||||||||||
|
2010
|
2009
|
2008
|
||||||||||||||||||||||||||||||||||
|
Average
Balance
|
Interest
|
Yield/
Rate
|
Average
Balance
|
Interest
|
Yield/
Rate
|
Average
Balance
|
Interest
|
Yield/
Rate
|
||||||||||||||||||||||||||||
|
(Dollars in thousands)
|
||||||||||||||||||||||||||||||||||||
|
Interest-earning Assets:
|
||||||||||||||||||||||||||||||||||||
|
Loans(1)
|
$
|
1,208,892
|
$
|
68,512
|
5.67
|
%
|
$
|
1,247,073
|
$
|
73,297
|
5.88
|
%
|
$
|
1,201,093
|
$
|
78,713
|
6.55
|
%
|
||||||||||||||||||
|
Taxable investment securities
|
139,001
|
2,384
|
1.72
|
81,018
|
2,999
|
3.70
|
96,294
|
2,922
|
3.03
|
|||||||||||||||||||||||||||
|
Investment securities exempt from federal income taxes (2)
|
34,937
|
1,882
|
5.39
|
31,489
|
1,690
|
5.37
|
14,842
|
1,185
|
7.98
|
|||||||||||||||||||||||||||
|
Federal funds sold
|
276
|
-
|
0.12
|
865
|
1
|
0.12
|
11,930
|
169
|
1.42
|
|||||||||||||||||||||||||||
|
Other interest-bearing deposits
|
131,414
|
357
|
0.27
|
134,969
|
332
|
0.25
|
29,794
|
565
|
1.90
|
|||||||||||||||||||||||||||
|
Investment in unconsolidated trust subsidiaries
|
1,116
|
83
|
7.44
|
1,116
|
83
|
7.44
|
1,116
|
87
|
7.80
|
|||||||||||||||||||||||||||
|
Total interest-earning assets
|
1,515,636
|
73,218
|
4.83
|
1,496,530
|
78,402
|
5.24
|
1,355,069
|
83,641
|
6.17
|
|||||||||||||||||||||||||||
|
Non-interest-earning assets
|
85,943
|
63,770
|
53,453
|
|||||||||||||||||||||||||||||||||
|
Total assets
|
$
|
1,601,579
|
$
|
1,560,300
|
$
|
1,408,522
|
||||||||||||||||||||||||||||||
|
Interest-bearing Liabilities:
|
||||||||||||||||||||||||||||||||||||
|
Deposits:
|
||||||||||||||||||||||||||||||||||||
|
NOW deposits
|
$
|
120,522
|
$
|
269
|
0.22
|
$
|
109,035
|
$
|
425
|
0.39
|
%
|
$
|
96,336
|
$
|
1,157
|
1.20
|
%
|
|||||||||||||||||||
|
Money market deposits
|
214,819
|
476
|
0.22
|
193,200
|
801
|
0.41
|
196,058
|
2,474
|
1.26
|
|||||||||||||||||||||||||||
|
Savings deposits
|
360,805
|
932
|
0.26
|
348,593
|
1,371
|
0.39
|
290,164
|
5,051
|
1.74
|
|||||||||||||||||||||||||||
|
Time deposits over $100,000
|
385,147
|
7,852
|
2.04
|
396,197
|
11,234
|
2.84
|
317,825
|
13,651
|
4.30
|
|||||||||||||||||||||||||||
|
Time deposits under $100,000
|
215,226
|
4,103
|
1.91
|
211,623
|
5,601
|
2.65
|
213,424
|
8,554
|
4.01
|
|||||||||||||||||||||||||||
|
Short-term borrowings, including ESOP borrowings under 1 year
|
5,558
|
269
|
4.84
|
26,523
|
735
|
2.77
|
21,792
|
707
|
3.24
|
|||||||||||||||||||||||||||
|
Long-term borrowings, including ESOP borrowings over 1 year
|
27,923
|
887
|
3.18
|
17,210
|
762
|
4.43
|
23,549
|
1,154
|
4.90
|
|||||||||||||||||||||||||||
|
Long-term capital lease obligations
|
2,211
|
268
|
12.12
|
2,211
|
268
|
12.12
|
2,211
|
268
|
12.12
|
|||||||||||||||||||||||||||
|
Junior subordinated debt owed to unconsolidated trusts
|
37,116
|
2,759
|
7.43
|
37,116
|
2,780
|
7.49
|
37,116
|
2,920
|
7.87
|
|||||||||||||||||||||||||||
|
Total interest-bearing liabilities
|
1,369,327
|
17,815
|
1.30
|
1,341,708
|
23,977
|
1.79
|
1,198,475
|
35,936
|
3.00
|
|||||||||||||||||||||||||||
|
Demand deposits--non-interest-bearing
|
$
|
48,706
|
$
|
42,837
|
$
|
44,968
|
||||||||||||||||||||||||||||||
|
Other non-interest-bearing liabilities
|
61,119
|
54,437
|
73,776
|
|||||||||||||||||||||||||||||||||
|
Stockholders' equity, including stock owned by ESOP
|
122,427
|
121,318
|
91,303
|
|||||||||||||||||||||||||||||||||
|
Total liabilities and stockholders equity
|
$
|
1,601,579
|
$
|
1,560,300
|
$
|
1,408,522
|
||||||||||||||||||||||||||||||
|
Net interest income on a fully tax-equivalent basis/interest rate spread(3)
|
$
|
55,403
|
3.53
|
%
|
$
|
54,425
|
3.45
|
%
|
$
|
47,705
|
3.17
|
%
|
||||||||||||||||||||||||
|
Net interest margin on a fully tax-equivalent basis(4)
|
3.66
|
%
|
3.64
|
%
|
3.52
|
%
|
||||||||||||||||||||||||||||||
|
Net interest margin(4)
|
3.61
|
%
|
3.59
|
%
|
3.49
|
%
|
||||||||||||||||||||||||||||||
_________________________
|
(1)
|
Average loans include non-accrual loans of $59.3 million, $53.8 million and $26.5 million for 2010, 2009 and 2008. Interest income includes loan origination fees of $2.0 million, $2.8 million and $2.6 million for the years ended December 31, 2010, 2009 and 2008.
|
|
(2)
|
Non-taxable investment income is presented on a fully tax-equivalent basis, adjusting for federal and state exemption of interest income and certain other permanent income tax differences.
|
|
(3)
|
Interest rate spread represents the difference between the average yield on interest-earning assets and the average cost of interest-bearing liabilities and is presented on a fully tax-equivalent basis.
|
|
|
|
|
(4)
|
Net interest margin represents net interest income as a percentage of average interest-earning assets.
|
In 2010, net interest income on a fully tax-equivalent basis increased $978 thousand (1.8%) to $55.4 million from $54.4 million in 2009. This increase resulted from a decrease in interest expense of $6.2 million (25.7%), which was partially offset by a decrease in interest income on a fully tax-equivalent basis of $5.2 million (6.6%). The decrease in interest expense was primarily due to a decrease in the cost of interest-bearing liabilities of 49 basis points, which accounted for a $5.7 million decrease in interest expense. There was an increase in average interest-bearing liabilities of $27.6 million (2.1%), though lower cost deposits increased while higher cost deposits decreased, making the mix of deposits lower cost overall. This accounted for a $464 thousand decrease in interest expense. Interest income decreased primarily due to a decrease in the yield on interest-earning assets of 41 basis points, which accounted for a decrease of $4.6 million in interest income on a fully tax-equivalent basis. There was an increase in average interest-earning assets of $19.1 million (1.3%), though lower earning assets (investment securities) increased, while higher earning assets (loans) decreased, having a net overall effect of lowering the yield on interest earning assets in the mix. This accounted for a decrease of $543 thousand in interest income on a fully tax-equivalent basis. The net interest margin expressed on a fully tax-equivalent basis increased 2 basis points to 3.66% in 2010 from 3.64% in 2009.
In 2009, net interest income on a fully tax-equivalent basis increased $6.7 million (14.1%) to $54.4 million from $47.7 million in 2008. This increase resulted from a decrease in interest expense of $11.9 million (33.3%), which was partially offset by a decrease in interest income on a fully tax-equivalent basis of $5.2 million (6.3%). The decrease in interest expense was primarily due to a decrease on the cost on interest-bearing liabilities of 121 basis points, which accounted for a $15.5 million decrease in interest expense. This was partially offset by an increase in average interest-bearing liabilities of $143.2 million (12.0%), which accounted for a $3.6 million increase in interest expense. Interest income decreased primarily due to a decrease in the yield on interest-earning assets of 93 basis points, which accounted for a decrease of $9.1 million in interest income on a fully tax-equivalent basis. This was partially offset by an increase in average interest-earning assets of $141.5 million (10.4%), accounting for an increase of $3.9 million in interest income on a fully tax-equivalent basis. The net interest margin expressed in a fully tax-equivalent basis increased 12 basis points to 3.64% in 2009 from 3.52% in 2008.
Volume, Mix and Rate Analysis of Net Interest Income. The following table presents the extent to which changes in volume and interest rates of interest-earning assets and interest-bearing liabilities have affected our interest income and interest expense during the periods indicated. Information is provided on changes in each category due to (i) changes attributable to changes in volume (change in volume times the prior period interest rate) and (ii) changes attributable to changes in interest rate (changes in rate times the prior period volume). Changes attributable to the combined impact of volume and rate have been allocated proportionally to the changes due to volume and the changes due to rate.
|
2010 Compared to 2009
|
2009 Compared to 2008
|
|||||||||||||||||||||||
|
Change Due
to Volume
|
Change Due
to Rate
|
Total
Change
|
Change Due
to Volume
|
Change Due
to Rate
|
Total
Change
|
|||||||||||||||||||
|
Interest-earning Assets:
|
||||||||||||||||||||||||
|
Loans
|
$
|
(2,207
|
)
|
$
|
(2,578
|
)
|
$
|
(4,785
|
)
|
$
|
2,929
|
$
|
(8,345
|
)
|
$
|
(5,416
|
)
|
|||||||
|
Taxable investment securities
|
1,488
|
(2,103
|
)
|
(615
|
)
|
(507
|
)
|
584
|
77
|
|||||||||||||||
|
Investment securities exempt from federal income taxes(1)
|
186
|
6
|
192
|
992
|
(487
|
)
|
505
|
|||||||||||||||||
|
Federal funds sold
|
(1
|
)
|
-
|
(1
|
)
|
(85
|
)
|
(83
|
)
|
(168
|
)
|
|||||||||||||
|
Other interest bearing deposits
|
(9
|
)
|
34
|
25
|
602
|
(835
|
)
|
(233
|
)
|
|||||||||||||||
|
Investment in unconsolidated trust subsidiaries
|
-
|
-
|
-
|
-
|
(4
|
)
|
(4
|
)
|
||||||||||||||||
|
Total increase (decrease) in interest income
|
$
|
(543
|
)
|
$
|
(4,641
|
)
|
$
|
(5,184
|
)
|
$
|
3,931
|
$
|
(9,170
|
)
|
$
|
(5,239
|
)
|
|||||||
|
Interest-bearing Liabilities:
|
||||||||||||||||||||||||
|
Now deposits
|
$
|
41
|
$
|
(197
|
)
|
$
|
(156
|
)
|
$
|
136
|
$
|
(868
|
)
|
$
|
(732
|
)
|
||||||||
|
Money market deposits
|
82
|
(407
|
)
|
(325
|
)
|
(35
|
)
|
(1,638
|
)
|
(1,673
|
)
|
|||||||||||||
|
Savings deposits
|
47
|
(486
|
)
|
(439
|
)
|
855
|
(4,535
|
)
|
(3,680
|
)
|
||||||||||||||
|
Time deposits over $100,000
|
(305
|
)
|
(3,077
|
)
|
(3,382
|
)
|
2,885
|
(5,302
|
)
|
(2,417
|
)
|
|||||||||||||
|
Time deposits under $100,000
|
93
|
(1,591
|
)
|
(1,498
|
)
|
(71
|
)
|
(2,882
|
)
|
(2,953
|
)
|
|||||||||||||
|
Short-term borrowings, including ESOP borrowings under 1 year
|
(804
|
)
|
338
|
(466
|
)
|
140
|
(112
|
)
|
28
|
|||||||||||||||
|
Long-term borrowings, including ESOP borrowings over 1 year
|
382
|
(257
|
)
|
125
|
(289
|
)
|
(103
|
)
|
(392
|
)
|
||||||||||||||
|
Junior subordinated debt owed to unconsolidated trusts
|
-
|
(21
|
)
|
(21
|
)
|
-
|
(140
|
)
|
(140
|
)
|
||||||||||||||
|
Total increase (decrease) in interest expense
|
$
|
(464
|
)
|
$
|
(5,698
|
)
|
$
|
(6,162
|
)
|
$
|
3,620
|
$
|
(15,579
|
)
|
$
|
(11,959
|
)
|
|||||||
|
Increase (decrease) in net interest income
|
$
|
(79
|
)
|
$
|
1,057
|
$
|
978
|
$
|
311
|
$
|
6,409
|
$
|
6,720
|
|||||||||||
|
(1)
|
Non-taxable investment income is presented on a fully tax-equivalent basis, adjusting for federal and state exemption of interest income and certain other permanent income tax differences.
|
|
|
|
Other Income. Changes in other income between 2010 and 2009 and between 2009 and 2008 were as follows:
|
Year Ended December 31,
|
Year Ended December 31,
|
|||||||||||||||||||||||
|
2010
|
2009
|
Net difference
|
2009
|
2008
|
Net difference
|
|||||||||||||||||||
|
Other income:
|
||||||||||||||||||||||||
|
Mortgage loan servicing fees
|
$
|
2,630
|
$
|
2,519
|
$
|
111
|
$
|
2,519
|
$
|
2,467
|
$
|
52
|
||||||||||||
|
Trust fees
|
1,722
|
1,463
|
259
|
1,463
|
1,092
|
371
|
||||||||||||||||||
|
Loan and other fees
|
2,998
|
2,699
|
299
|
2,699
|
2,605
|
94
|
||||||||||||||||||
|
Service charges on deposits
|
1,638
|
1,718
|
(80
|
)
|
1,718
|
1,720
|
(2
|
)
|
||||||||||||||||
|
Gain on sale of loans
|
5,473
|
7,766
|
(2,293
|
)
|
7,766
|
2,027
|
5,739
|
|||||||||||||||||
|
Gain on sale of securities
|
109
|
2,543
|
(2,434
|
)
|
2,543
|
555
|
1,988
|
|||||||||||||||||
|
Title insurance premiums
|
1,096
|
1,364
|
(268
|
)
|
1,364
|
815
|
549
|
|||||||||||||||||
|
Other operating income
|
459
|
417
|
42
|
417
|
263
|
154
|
||||||||||||||||||
|
$
|
16,125
|
$
|
20,489
|
$
|
(4,364
|
)
|
$
|
20,489
|
$
|
11,544
|
$
|
8,945
|
||||||||||||
In 2010, other income decreased $4.4 million (21.3%) to $16.1 million from $20.5 million in 2009. Gain on sale of securities decreased $2.4 million (95.7%) mainly due to a decrease in the volume of securities sold in 2010 compared to 2009. These security sales were based upon interest rate risk and liquidity management decisions, as management increased liquidity by moving these securities into cash and reduced their rate sensitivity to a rising interest rate environment. Gain on sale of loans decreased $2.3 million (29.5%) mainly due to a decrease in volume of loans sold in 2010 compared to 2009. Though there was continued mortgage loan refinance volume in 2010, it was at a lower level than in 2009. Loan and other fees increased $299 thousand (11.1%) mainly due to an increase in ATM fee income.
In 2009, other income increased $8.9 million (77.5%) to $20.5 million from $11.5 million in 2008. Gain on sale of loans increased $5.7 million (283.1%) mainly due to an increase in the volume of loans sold in 2009 compared to 2008. The increased volume of loan sales was due to a high volume of mortgage loan refinances due to a historically low mortgage loan interest environment. Gain on sale of securities increased $2.0 million (358.2%) mainly due to an increase in volume of securities sold in 2009 compared to 2008. These security sales were based upon interest rate risk and liquidity management decisions, as management increased liquidity by moving these securities into cash and reduced their rate sensitivity to a rising interest rate environment. Title insurance premiums increased $549 thousand (67.4%) due to a higher volume of policies sold due to the high mortgage loan refinance activity in 2009. Trust fees increased $371 thousand (34.0%) largely due to fees on additional assets under management obtained through the Allocca and Brunett acquisition which closed in October 2008 (discussed in the notes to the financial statements below).
Other Expenses. Changes in other expenses between 2010 and 2009 and between 2009 and 2008 are as follows:
|
Year Ended December 31,
|
Year Ended December 31,
|
|||||||||||||||||||||||
|
2010
|
2009
|
Net difference
|
2009
|
2008
|
Net difference
|
|||||||||||||||||||
|
Other expenses:
|
||||||||||||||||||||||||
|
Salaries and employee benefits
|
$
|
20,922
|
$
|
20,055
|
$
|
867
|
$
|
20,055
|
$
|
18,870
|
$
|
1,185
|
||||||||||||
|
Occupancy
|
4,118
|
3,517
|
601
|
3,517
|
3,310
|
207
|
||||||||||||||||||
|
Data processing
|
3,164
|
2,854
|
310
|
2,854
|
2,295
|
559
|
||||||||||||||||||
|
Marketing
|
1,317
|
1,564
|
(247
|
)
|
1,564
|
2,056
|
(492
|
)
|
||||||||||||||||
|
Amortization and valuation of mortgage servicing rights
|
1,848
|
1,740
|
108
|
1,740
|
4,193
|
(2,453
|
)
|
|||||||||||||||||
|
Amortization and valuation of other intangible assets
|
478
|
296
|
182
|
296
|
44
|
252
|
||||||||||||||||||
|
Supplies
|
438
|
698
|
(260
|
)
|
698
|
440
|
258
|
|||||||||||||||||
|
Loss on sale of other real estate owned
|
3,886
|
1,128
|
2,758
|
1,128
|
132
|
996
|
||||||||||||||||||
|
Postage
|
626
|
567
|
59
|
567
|
623
|
(56
|
)
|
|||||||||||||||||
|
Bankcard and ATM network fees
|
1,221
|
1,343
|
(122
|
)
|
1,343
|
1,241
|
102
|
|||||||||||||||||
|
Legal, professional and accounting fees
|
2,983
|
3,023
|
(40
|
)
|
3,023
|
1,538
|
1,485
|
|||||||||||||||||
|
FDIC insurance premiums
|
3,265
|
3,285
|
(20
|
)
|
3,285
|
682
|
2,603
|
|||||||||||||||||
|
Collection expenses
|
1,806
|
608
|
1,198
|
608
|
364
|
244
|
||||||||||||||||||
|
Other
|
2,534
|
2,639
|
(105
|
)
|
2,639
|
2,255
|
384
|
|||||||||||||||||
|
$
|
48,606
|
$
|
43,317
|
$
|
5,289
|
$
|
43,317
|
$
|
38,043
|
$
|
5,274
|
|||||||||||||
Other expenses increased $5.3 million (12.2%) to $48.6 million in 2010 from $43.3 million in 2009. Loss on sale of other real estate owned increased $2.8 million (244.5%) due to a higher volume of foreclosed assets sold and otherwise written down in value during 2010 as compared to 2009. Collection expenses increased $1.2 million (197.0%) due to the higher volume of collection efforts during 2010 compared to 2009. Salaries and employee benefits increased $867 thousand (4.3%) mainly due to normal salary raises and an increase in the number of full-time equivalent staff of 2.2%. Occupancy expenses increased $601 thousand (17.1%) mainly due to a full year of operation of the Cerrillos Road office in Santa Fe in 2010 compared to only three months of operation in 2009.
Other expenses increased $5.3 million (13.9%) to $43.3 million in 2009 from $38.0 million in 2008. FDIC insurance premiums increased $2.6 million (381.7%) reflecting an increase which was experienced industry-wide. Legal, professional and accounting fees increased $1.5 million (96.6%) largely due to additional expenses incurred in the collection of nonperforming loans. Salaries and employee benefits increased $1.2 million (6.3%) largely due to additional staffing required for the new office in Santa Fe. Loss on the sale of other real estate owned increased $996 thousand (754.5%) due to the increased volume of foreclosed real estate transactions in 2009. Data processing expenses increased $559 thousand (24.4%) largely due to an increase in software maintenance expenses due to the completion of a data processing backup site in the new office in Santa Fe. Amortization and valuation of mortgage servicing rights decreased $2.5 million (58.5%) largely due to a decrease in the valuation allowance for mortgage servicing rights, caused by a higher interest rate environment at December 2009 compared to December 2008. (Though interest rates during 2009 were typically lower than in 2008, the valuation allowance is based upon the calculated market values as of the end of the year.)
Income Taxes. In 2010, provision for income tax expense decreased by $1.5 million (85.3%) from the previous year to a total of $260 thousand, and the effective tax rate decreased from 35.7% in 2009 to 13.4% in 2010. The decrease in the effective tax rate was mainly attributable to the larger effect of permanent tax differences (such as interest on tax-exempt investments) on a smaller pool of pre-tax income.
In 2009, provision for income tax expense decreased by $2.8 million (61.5%) from the previous year to a total of $1.8 million, and the effective tax rate decreased from 36.4% in 2008 to 35.7% in 2009. The decrease in the effective tax rate was mainly attributable to the effect of tax credits obtained by the Company in 2009.
Balance Sheet Analysis
Balance Sheet-General. Total assets at December 31, 2010, were $1.6 billion, a decrease in $111.3 million (6.6%) from December 31, 2009. Cash and cash equivalents decreased $101.3 million (48.8%) and loans net of allowance decreased $54.1 million (4.4%). The decrease in cash and cash equivalents was due to a decision by management to allow the higher levels of liquidity built up in the prior year to roll off. Investment securities increased $25.3 million (16.0%) as some of the cash and cash equivalents were invested in securities. During the same period, total liabilities decreased $111.9 million (7.2%), decreasing to $1.4 billion. The decrease in total liabilities was primarily due to a decrease in total deposits of $110.1 million (7.5%). This decrease was a decision by management to lower excess liquidity and to increase the Company’s capital ratios. Stockholders’ equity (including stock owned by the Employee Stock Ownership Plan) increased $553 thousand (0.4%) to $123.5 million on December 31, 2010, compared to $122.9 million on December 31, 2009. This increase was primarily due to the increase of accumulated other comprehensive income, which represented the unrealized gain in the market value of investment securities.
Investment Securities. The primary purposes of the investment portfolio are to provide a source of earnings for the purpose of managing liquidity, to provide collateral to pledge against public deposits and to control interest rate risk. In managing the portfolio, the Company seeks to obtain the objectives of safety of principal, liquidity, diversification and maximized return on funds. For an additional discussion with respect to these matters, see “Sources of Funds” and “Asset Liability Management” under Item 7A.
The following tables set forth the amortized cost and fair value of our securities by accounting classification category and by type of security as indicated:
|
At December 31,
|
||||||||||||||||||||||||
|
2010
|
2009
|
2008
|
||||||||||||||||||||||
|
Amortized
Cost
|
Fair
Value
|
Amortized
Cost
|
Fair
Value
|
Amortized
Cost
|
Fair
Value
|
|||||||||||||||||||
|
(In thousands)
|
||||||||||||||||||||||||
|
Securities Available for Sale:
|
||||||||||||||||||||||||
|
U.S. government sponsored agencies
|
$
|
42,551
|
$
|
42,735
|
$
|
68,502
|
$
|
68,382
|
$
|
87,890
|
$
|
90,187
|
||||||||||||
|
States and political subdivisions
|
20,263
|
20,584
|
26,112
|
26,519
|
12,771
|
12,820
|
||||||||||||||||||
|
Residential mortgage-backed securities
|
98,692
|
99,272
|
41,906
|
41,855
|
-
|
-
|
||||||||||||||||||
|
Equity securities
|
-
|
-
|
-
|
-
|
1
|
-
|
||||||||||||||||||
|
Total securities available for sale
|
$
|
161,506
|
$
|
162,591
|
$
|
136,520
|
$
|
136,756
|
$
|
100,662
|
$
|
103,007
|
||||||||||||
|
Securities Held to Maturity:
|
||||||||||||||||||||||||
|
States and political subdivisions
|
$
|
11,107
|
$
|
10,951
|
$
|
11,436
|
$
|
10,808
|
$
|
8,927
|
$
|
9,780
|
||||||||||||
|
Total securities held to maturity
|
$
|
11,107
|
$
|
10,951
|
$
|
11,436
|
$
|
10,808
|
$
|
8,927
|
$
|
9,780
|
||||||||||||
|
Other securities:
|
||||||||||||||||||||||||
|
Non-marketable equity securities (including FRB and FHLB stock)
|
$
|
8,219
|
$
|
8,219
|
$
|
8,452
|
$
|
8,452
|
$
|
4,527
|
$
|
4,527
|
||||||||||||
|
Investment in unconsolidated trusts
|
1,116
|
1,116
|
1,116
|
1,116
|
1,116
|
1,116
|
||||||||||||||||||
|
Total other securities
|
$
|
9,335
|
$
|
9,335
|
$
|
9,568
|
$
|
9,568
|
$
|
5,643
|
$
|
5,643
|
||||||||||||
U.S. government sponsored agency securities generally consist of fixed rate securities with maturities from 18 to 36 months. States and political subdivision investment securities consist of investment grade and local non-rated issues with maturities from six months to 25 years.
The Company had a total of $98.7 million in Collateralized Mortgage Obligations (“CMOs”) as of December 31, 2010. All of these CMOs were private label issues or issued by U.S. Government-sponsored agencies. At the time of purchase, the ratings of these securities ranged from AAA to Aaa. As of December 31, 2010, the ratings of these securities ranged from AAA to Baa3, all of which are considered “Investment Grade” (rating of “BBB” or higher). At the time of purchase and on a monthly basis, the Company reviews these securities for impairment on an other than temporary basis. As of December 31, 2010, none of these securities were deemed to have other than temporary impairment. The Company continues to closely monitor the performance and ratings of these securities.
As of December 31, 2010, securities of no single issuer exceeded 10% of stockholders’ equity, except for U.S. government sponsored agency securities.
The following table sets forth certain information regarding contractual maturities and the weighted average yields of our securities portfolio as of December 31, 2010:
|
Due in One Year or Less
|
Due after One Year through Five Years
|
Due after Five Years through Ten Years
|
Due after Ten Years or no stated Maturity
|
|||||||||||||||||||||||||||||
|
Balance
|
Weighted Average Yield
|
Balance
|
Weighted Average Yield
|
Balance
|
Weighted Average Yield
|
Balance
|
Weighted Average Yield
|
|||||||||||||||||||||||||
|
(Dollars in thousands)
|
||||||||||||||||||||||||||||||||
|
Securities Available for Sale:
|
||||||||||||||||||||||||||||||||
|
U.S. government sponsored agencies
|
$
|
-
|
-
|
$
|
16,006
|
1.02
|
%
|
$
|
26,729
|
1.12
|
%
|
$
|
-
|
-
|
||||||||||||||||||
|
States and political subdivision (1)
|
3,766
|
2.97
|
%
|
7,768
|
3.91
|
%
|
7,921
|
5.37
|
%
|
1,129
|
5.98
|
%
|
||||||||||||||||||||
|
Residential mortgage-backed securities
|
-
|
-
|
4,463
|
0.71
|
%
|
29,797
|
0.38
|
%
|
65,012
|
3.58
|
%
|
|||||||||||||||||||||
|
Total
|
$
|
3,766
|
$
|
28,237
|
$
|
64,447
|
$
|
66,141
|
||||||||||||||||||||||||
|
Securities Held to Maturity:
|
||||||||||||||||||||||||||||||||
|
States and political subdivision (1)
|
$
|
-
|
-
|
$
|
-
|
-
|
$
|
8,394
|
9.23
|
%
|
$
|
2,713
|
7.15
|
%
|
||||||||||||||||||
|
Total
|
$
|
-
|
$
|
-
|
$
|
8,394
|
$
|
2,713
|
||||||||||||||||||||||||
|
Other securities:
|
||||||||||||||||||||||||||||||||
|
Non-marketable equity securities (including FRB and FHLB stock) (2)
|
$
|
150
|
0.00
|
%
|
$
|
-
|
-
|
$
|
1,474
|
6.70
|
%
|
$
|
6,595
|
0.68
|
%
|
|||||||||||||||||
|
Investment in unconsolidated trusts
|
-
|
-
|
-
|
-
|
-
|
-
|
1,116
|
7.33
|
%
|
|||||||||||||||||||||||
|
Total
|
$
|
150
|
$
|
-
|
$
|
1,474
|
$
|
7,711
|
||||||||||||||||||||||||
_________________________
|
(1)
|
Yield is reflected on a fully tax-equivalent basis, adjusting for federal and state exemption of interest income and certain other permanent income tax differences.
|
|
(2)
|
Non-marketable equity securities include a $150 thousand investment in the New Mexico Community Development Loan Fund, a tax-exempt non-profit corporation, which the Company made at 0.00% interest as a donation of interest to this corporation. Also included is a $1.5 million tax credit purchased as part of a commercial real estate loan.
|
Loan Portfolio. The following tables set forth the composition of the loan portfolio:
|
At December 31,
|
||||||||||||||||||||||||||||||||||||||||
|
2010
|
2009
|
2008
|
2007
|
2006
|
||||||||||||||||||||||||||||||||||||
|
Amount
|
Percent
|
Amount
|
Percent
|
Amount
|
Percent
|
Amount
|
Percent
|
Amount
|
Percent
|
|||||||||||||||||||||||||||||||
|
(Dollars in thousands)
|
||||||||||||||||||||||||||||||||||||||||
|
Commercial
|
$
|
149,987
|
12.58
|
%
|
$
|
137,684
|
11.08
|
%
|
$
|
116,588
|
9.46
|
%
|
$
|
118,670
|
10.12
|
%
|
$
|
127,950
|
11.29
|
%
|
||||||||||||||||||||
|
Commercial real estate
|
425,172
|
35.66
|
452,235
|
36.41
|
412,184
|
33.43
|
382,909
|
32.65
|
388,149
|
34.23
|
||||||||||||||||||||||||||||||
|
Residential real estate
|
400,713
|
33.61
|
399,588
|
32.17
|
388,776
|
31.54
|
360,934
|
30.77
|
324,051
|
28.58
|
||||||||||||||||||||||||||||||
|
Construction real estate
|
164,721
|
13.82
|
194,179
|
15.63
|
254,444
|
20.64
|
249,284
|
21.26
|
235,534
|
20.78
|
||||||||||||||||||||||||||||||
|
Installment and other
|
51,632
|
4.33
|
58,456
|
4.71
|
60,746
|
4.93
|
61,028
|
5.20
|
58,045
|
5.12
|
||||||||||||||||||||||||||||||
|
Total loans
|
1,192,225
|
100.00
|
1,242,142
|
100.00
|
1,232,738
|
100.00
|
1,172,825
|
100.00
|
1,133,729
|
100.00
|
||||||||||||||||||||||||||||||
|
Unearned income
|
(2,287
|
)
|
(2,356
|
)
|
(2,204
|
)
|
(1,719
|
)
|
(2,005
|
)
|
||||||||||||||||||||||||||||||
|
Gross loans
|
1,189,938
|
1,239,786
|
1,230,534
|
1,171,106
|
1,131,724
|
|||||||||||||||||||||||||||||||||||
|
Allowance for loan losses
|
(28,722
|
)
|
(24,504
|
)
|
(15,230
|
)
|
(13,533
|
)
|
(12,167
|
)
|
||||||||||||||||||||||||||||||
|
Net loans
|
$
|
1,161,216
|
$
|
1,215,282
|
$
|
1,215,304
|
$
|
1,157,573
|
$
|
1,119,557
|
||||||||||||||||||||||||||||||
Net loans decreased $54.1 million (4.4%) from December 31, 2009 to December 31, 2010, remaining at $1.2 billion. There were decreases in the construction real estate portfolio of $29.5 million, commercial real estate portfolio of $27.1 million and installment and other loans portfolio of $6.8 million. These decreases were partially offset by increases in the commercial non-real estate portfolio of $12.3 million and residential real estate portfolio of $1.1 million.
The Bank has been actively reducing its loan concentrations in the commercial real estate and construction real estate categories. We have adopted as policy certain internal limits on these concentrations, based upon the Bank’s risk profile and the current economic environment. The Bank began this planned reduction in concentrations in 2009 and has agreed to continue its plan in the Agreement with the OCC.
Loan Maturities. The following table sets forth the maturity or repricing information for commercial and construction real estate loans outstanding at December 31, 2010:
|
Due in One Year Or Less
|
Due after one Year Through Five Years
|
Due after Five Years
|
||||||||||||||||||||||||||
|
Fixed Rate
|
Floating Rate
|
Fixed Rate
|
Floating Rate
|
Fixed Rate
|
Floating Rate
|
Total
|
||||||||||||||||||||||
|
(In thousands)
|
||||||||||||||||||||||||||||
|
Commercial loans and construction real estate loans
|
$
|
43,830
|
$
|
235,582
|
$
|
20,860
|
$
|
8,745
|
$
|
5,462
|
$
|
229
|
$
|
314,708
|
||||||||||||||
Asset Quality. The tables below present several analyses of non-performing loans, classified loans and other non-performing assets.
The following table sets forth the amounts of non-performing loans and non-performing assets at the dates indicated:
|
At December 31,
|
||||||||||||||||||||
|
2010
|
2009
|
2008
|
2007
|
2006
|
||||||||||||||||
|
(Dollars in thousands)
|
||||||||||||||||||||
|
Non-accruing loans
|
$
|
49,968
|
$
|
65,035
|
$
|
33,387
|
$
|
11,789
|
$
|
8,767
|
||||||||||
|
Loans 90 days or more past due, still accruing interest
|
-
|
-
|
-
|
-
|
1
|
|||||||||||||||
|
Total non-performing loans
|
49,968
|
65,035
|
33,387
|
11,789
|
8,768
|
|||||||||||||||
|
Other real estate owned
|
21,860
|
16,750
|
2,354
|
1,358
|
165
|
|||||||||||||||
|
Other repossessed assets
|
420
|
406
|
692
|
4
|
60
|
|||||||||||||||
|
Total non-performing assets
|
$
|
72,248
|
$
|
82,191
|
$
|
36,433
|
$
|
13,151
|
$
|
8,993
|
||||||||||
|
Restructured loans, still accruing interest
|
5,588
|
2,513
|
940
|
521
|
393
|
|||||||||||||||
|
Total non-performing loans to total loans
|
4.19
|
%
|
5.24
|
%
|
2.71
|
%
|
1.01
|
%
|
0.77
|
%
|
||||||||||
|
Allowance for loan losses to non-performing loans
|
57.48
|
%
|
37.68
|
%
|
45.62
|
%
|
114.79
|
%
|
138.77
|
%
|
||||||||||
|
Total non-performing assets to total assets
|
4.62
|
%
|
4.90
|
%
|
2.57
|
%
|
0.95
|
%
|
0.66
|
%
|
||||||||||
The following table presents data related to non-performing loans by dollar amount and category at December 31, 2010:
|
Commercial loans
|
Commercial real estate loans
|
Residential real estate loans
|
Construction real estate loans
|
Installment & other loans
|
Total loans
|
|||||||||||||||||||||||||||||||||||
|
Dollar Range
|
Number of Borrowers
|
Amount
|
Number of Borrowers
|
Amount
|
Number of Borrowers
|
Amount
|
Number of Borrowers
|
Amount
|
Amount
|
Amount
|
||||||||||||||||||||||||||||||
|
(Dollars in thousands)
|
||||||||||||||||||||||||||||||||||||||||
|
$5.0 million or more
|
-
|
$
|
-
|
1
|
$
|
16,000
|
-
|
$
|
-
|
-
|
$
|
-
|
$
|
-
|
$
|
16,000
|
||||||||||||||||||||||||
|
$3.0 million to $4.9 million
|
-
|
-
|
-
|
-
|
-
|
-
|
2
|
7,645
|
-
|
7,645
|
||||||||||||||||||||||||||||||
|
$1.5 million to $2.9 million
|
-
|
-
|
-
|
-
|
-
|
-
|
-
|
-
|
2,964
|
2,964
|
||||||||||||||||||||||||||||||
|
Under $1.5 million
|
17
|
2,598
|
11
|
3,029
|
62
|
10,951
|
21
|
6,263
|
518
|
23,359
|
||||||||||||||||||||||||||||||
|
Total
|
17
|
$
|
2,598
|
12
|
$
|
19,029
|
62
|
$
|
10,951
|
23
|
$
|
13,908
|
$
|
3,482
|
$
|
49,968
|
||||||||||||||||||||||||
|
Percentage of individual loan category
|
1.73
|
%
|
4.48
|
%
|
2.73
|
%
|
8.44
|
%
|
6.74
|
%
|
4.19
|
%
|
||||||||||||||||||||||||||||
The following table presents data related to non-performing loans by dollar amount and category at December 31, 2009:
|
Commercial loans
|
Commercial real estate loans
|
Residential real estate loans
|
Construction real estate loans
|
Installment & other loans
|
Total loans
|
|||||||||||||||||||||||||||||||||||
|
Dollar Range
|
Number of Borrowers
|
Amount
|
Number of Borrowers
|
Amount
|
Number of Borrowers
|
Amount
|
Number of Borrowers
|
Amount
|
Amount
|
Amount
|
||||||||||||||||||||||||||||||
|
(Dollars in thousands)
|
||||||||||||||||||||||||||||||||||||||||
|
$5.0 million or more
|
-
|
$
|
-
|
1
|
$
|
16,000
|
-
|
$
|
-
|
-
|
$
|
-
|
$
|
-
|
$
|
16,000
|
||||||||||||||||||||||||
|
$3.0 million to $4.9 million
|
-
|
-
|
-
|
-
|
-
|
-
|
1
|
4,245
|
3,515
|
7,760
|
||||||||||||||||||||||||||||||
|
$1.5 million to $2.9 million
|
1
|
2,077
|
3
|
6,434
|
1
|
1,550
|
2
|
3,663
|
-
|
13,724
|
||||||||||||||||||||||||||||||
|
Under $1.5 million
|
19
|
2,345
|
14
|
3,407
|
66
|
8,184
|
39
|
13,522
|
93
|
27,551
|
||||||||||||||||||||||||||||||
|
Total
|
20
|
$
|
4,422
|
18
|
$
|
25,841
|
67
|
$
|
9,734
|
42
|
$
|
21,430
|
$
|
3,608
|
$
|
65,035
|
||||||||||||||||||||||||
|
Percentage of individual loan category
|
3.21
|
%
|
5.71
|
%
|
2.44
|
%
|
11.04
|
%
|
6.17
|
%
|
5.24
|
%
|
||||||||||||||||||||||||||||
Non-performing Loans. Non-performing loans include (i) loans accounted for on a non-accrual basis and (ii) accruing loans contractually past due 90 days or more as to interest and principal. Troubled debt restructurings that are performing in accordance with modified terms are not included with non-performing loans, although they are presented in the table above. Management reviews the loan portfolio for problem loans on an ongoing basis. During the ordinary course of business, management may become aware of borrowers who may not be able to meet the contractual requirements of loan agreements. Such loans are placed under close supervision with consideration given to placing the loan on a non-accrual status, increasing the allowance for loan losses, and (if appropriate) partial or full charge-off. After a loan is placed on non-accrual status, any interest previously accrued, but not yet collected, is reversed against current income. When payments are received on non-accrual loans, such payments will be applied to principal and any interest portion included in the payments are not included in income, but rather are applied to the principal balance of the loan. Loans will not be placed back on accrual status unless all back interest and principal payments are made. If interest on non-accrual loans had been accrued, such income would have amounted to $4.4 million and $3.4 million for the years ended December 31, 2010 and 2009, respectively. None of these amounts were included in interest income during these periods. Our policy is to place loans 90 days past due on non-accrual status. An exception is made when management believes a loan is well secured and in the process of collection. No exceptions have been made in the last four years. We consider a loan to be impaired when, based on current information and events, we determine that we will not be able to collect all amounts due according to the original terms of the note, including interest payments. When management identifies a loan as impaired, impairment is measured based on the present value of expected future cash flows, discounted at the loan’s effective interest rates, except when the sole remaining source of repayment for the loan is the liquidation of the collateral. In these cases management uses the current fair value of the collateral, less selling costs when foreclosure is probable, instead of discounted cash flows. If management determines that the value of the impaired loan is less than the recorded investment in the loan, an impairment is recognized through a charge off to the allowance.
Non-performing assets also consist of other repossessed assets and other real estate owned (“OREO”). OREO represents properties acquired through foreclosure or other proceedings and are recorded at the fair value less the estimated cost of disposal. OREO is evaluated regularly to ensure that the recorded amount is supported by its current fair value. Valuation allowances to reduce the carrying amount to fair value less estimated costs of disposal are recorded as necessary. Revenues and expenses from the operations of OREO and changes in the valuation are included in other income and other expenses on the income statement.
At December 31, 2010, total non-performing assets decreased $9.9 million to $72.2 million from $82.2 million at December 31, 2009 mainly due to a decrease in non-accruing loans of $15.1 million, which was partially offset by an increase in other real estate owned of $5.1 million. The decrease in non-accruing loans was mainly due to a decrease in non-accruing construction real estate loans of $7.5 million, a decrease in non-accruing commercial real estate loans by $6.8 million and a decrease of $1.8 million in commercial non-real estate loans. Residential real estate loans on non-accrual status increased by $1.2 million. There were no specifically identified losses in the non-accrual loans that have not already been charged-off. As of December 31, 2010, all collateral-dependent impaired loans have been charged down to the collateral value, less selling costs.
The following table presents a summary of other real estate owned activity for the years ended December 31, 2010 and 2009:
|
Year Ended December 31,
|
||||||||
|
2010
|
2009
|
|||||||
|
(In thousands)
|
||||||||
|
Balance at beginning of year
|
$
|
16,750
|
$
|
2,354
|
||||
|
Transfers in at fair value less estimated costs to sell
|
25,163
|
24,956
|
||||||
|
Fair value adjustments
|
(1,931
|
)
|
(283
|
)
|
||||
|
Net (losses) gains on sales of other real estate owned
|
(1,994
|
)
|
(721
|
)
|
||||
|
Cash received upon disposition
|
(16,128
|
)
|
(9,556
|
)
|
||||
|
Balance at end of year
|
$
|
21,860
|
$
|
16,750
|
||||
As of the December 31, 2010 and 2009, total other real estate owned consisted of:
|
As of December 31,
|
||||||||
|
2010
|
2009
|
|||||||
|
(In thousands)
|
||||||||
|
Construction property
|
$
|
14,872
|
$
|
12,782
|
||||
|
Residential real estate
|
3,427
|
3,337
|
||||||
|
Commercial real estate
|
3,561
|
631
|
||||||
|
Total
|
$
|
21,860
|
$
|
16,750
|
||||
As of December 31, 2010, there were a total of 50 properties in other real estate owned. Of these, 35 were construction properties, 11 were residential real estate properties and 4 were commercial real estate properties.
The following table presents an analysis of the allowance for loan losses for the periods presented:
|
Year Ended December 31,
|
||||||||||||||||||||
|
2010
|
2009
|
2008
|
2007
|
2006
|
||||||||||||||||
|
(Dollars in thousands)
|
||||||||||||||||||||
|
Balance at beginning of year
|
$
|
24,504
|
$
|
15,230
|
$
|
13,533
|
$
|
12,167
|
$
|
8,842
|
||||||||||
|
Provision for loan losses
|
20,258
|
26,024
|
8,183
|
4,200
|
5,172
|
|||||||||||||||
|
Charge-offs:
|
||||||||||||||||||||
|
Commercial
|
4,477
|
5,310
|
4,021
|
1,766
|
1,846
|
|||||||||||||||
|
Commercial real estate
|
1,460
|
360
|
104
|
246
|
-
|
|||||||||||||||
|
Residential real estate
|
5,944
|
3,484
|
1,219
|
363
|
113
|
|||||||||||||||
|
Construction real estate
|
5,762
|
5,971
|
585
|
-
|
-
|
|||||||||||||||
|
Installment and other
|
1,903
|
2,254
|
1,087
|
771
|
369
|
|||||||||||||||
|
Total charge-offs
|
19,546
|
17,379
|
7,016
|
3,146
|
2,328
|
|||||||||||||||
|
Recoveries:
|
||||||||||||||||||||
|
Commercial
|
3,076
|
173
|
263
|
84
|
42
|
|||||||||||||||
|
Commercial real estate
|
5
|
11
|
-
|
-
|
-
|
|||||||||||||||
|
Residential real estate
|
181
|
65
|
16
|
56
|
1
|
|||||||||||||||
|
Construction real estate
|
91
|
73
|
42
|
64
|
332
|
|||||||||||||||
|
Installment and other
|
153
|
307
|
209
|
108
|
106
|
|||||||||||||||
|
Total recoveries
|
3,506
|
629
|
530
|
312
|
481
|
|||||||||||||||
|
Net charge-offs
|
16,040
|
16,750
|
6,486
|
2,834
|
1,847
|
|||||||||||||||
|
Balance at end of year
|
$
|
28,722
|
$
|
24,504
|
$
|
15,230
|
$
|
13,533
|
$
|
12,167
|
||||||||||
|
Gross loans at end of year
|
$
|
1,189,938
|
$
|
1,239,786
|
$
|
1,230,534
|
$
|
1,171,106
|
$
|
1,131,724
|
||||||||||
|
Ratio of allowance to total loans
|
2.41
|
%
|
1.97
|
%
|
1.24
|
%
|
1.15
|
%
|
1.07
|
%
|
||||||||||
|
Ratio of net charge-offs to average loans
|
1.33
|
%
|
1.34
|
%
|
0.54
|
%
|
0.24
|
%
|
0.17
|
%
|
||||||||||
Net charge-offs for 2010 totaled $16.0 million, a decrease of $710 thousand (4.2%) from 2009. The decrease in net charge-offs was mainly due to an increase in recoveries on commercial non-real estate loans of $2.9 million (1,678.0%), which was partially offset by an increase in the charge-offs for residential real estate loans of $2.5 million (70.6%). The increase in commercial non-real estate loan recoveries was mainly due to a single large recovery on a commercial loan due to a favorable legal settlement. The increase in charge-offs on residential real estate loans was mainly due to an increase in charge-offs associated with home equity loans along with residential second mortgages. The provision for loan losses decreased $5.8 million (22.2%) based upon management’s estimate of the adequacy of the allowance for loan losses.
The following table sets forth the allocation of the allowance for loan losses for the years presented and the percentage of loans in each category to total loans. An allocation for a loan classification is only for internal analysis of the adequacy of the allowance and is not an indication of expected or anticipated losses:
|
At December 31,
|
||||||||||||||||||||||||||||||||||||||||
|
2010
|
2009
|
2008
|
2007
|
2006
|
||||||||||||||||||||||||||||||||||||
|
Amount
|
Percent
|
Amount
|
Percent
|
Amount
|
Percent
|
Amount
|
Percent
|
Amount
|
Percent
|
|||||||||||||||||||||||||||||||
|
(Dollars in thousands)
|
||||||||||||||||||||||||||||||||||||||||
|
Commercial
|
$
|
5,857
|
12.58
|
%
|
$
|
4,371
|
11.08
|
%
|
$
|
2,200
|
9.46
|
%
|
$
|
4,535
|
10.12
|
%
|
$
|
4,191
|
11.29
|
%
|
||||||||||||||||||||
|
Commercial and residential real estate
|
11,102
|
69.27
|
8,416
|
68.58
|
5,215
|
64.97
|
4,293
|
63.42
|
4,684
|
62.81
|
||||||||||||||||||||||||||||||
|
Construction real estate
|
7,322
|
13.82
|
8,637
|
15.63
|
6,512
|
20.64
|
3,691
|
21.26
|
2,364
|
20.78
|
||||||||||||||||||||||||||||||
|
Installment and other
|
4,122
|
4.33
|
3,080
|
4.71
|
1,303
|
4.93
|
1,014
|
5.20
|
928
|
5.12
|
||||||||||||||||||||||||||||||
|
Unallocated
|
319
|
N/A
|
-
|
N/A
|
-
|
N/A
|
-
|
N/A
|
-
|
N/A
|
||||||||||||||||||||||||||||||
|
Total
|
$
|
28,722
|
100.00
|
%
|
$
|
24,504
|
100.00
|
%
|
$
|
15,230
|
100.00
|
%
|
$
|
13,533
|
100.00
|
%
|
$
|
12,167
|
100.00
|
%
|
||||||||||||||||||||
The allowance for loan losses increased $4.2 million (17.2%) from December 31, 2009 to December 31, 2010. There were increases in allocations for every class of loan, with the exception of the allocation for construction real estate loans. The allocation for commercial and residential real estate increased by $2.7 million (31.9%) mainly due to an increase in historical loss experience (based on migration analysis) of $2.5 million. The allocation for commercial non-real estate loans increased by $1.5 million (34.0%), mainly due to an increase in historical loss experience (based on migration analysis) of $1.0 million. The allocation for installment and other loans increased $1.0 million (33.8%) mainly due to an increase in historical loss experience (based on migration analysis) of $1.0 million. The allocation for construction loans decreased $1.3 million (15.2%) from December 31, 2009 to December 31, 2010, mainly due to a decrease historical loss experience (based on migration analysis) of $991 thousand. For further information, please see discussion in “Critical Accounting Policies—Allowance for Loan Losses” above.
A loan is considered impaired when, based on current information and events, it is probable that the Bank will be unable to collect all amounts due according to the original contractual terms of the loan agreement, including both principal and interest. The impairment amount of the loan is equal to the recorded investment in the loan less the net fair value. The Bank generally uses one of three methods to measure impairment: the fair value of the collateral less disposition costs, the present value of expected future cash flows method, or the observable market price of a loan method. The impairment amount above collateral value is normally charged to the allowance for loan and lease losses in the quarter it is identified. Total loans which were deemed to have been impaired, including both performing and non-performing loans, as of December 31, 2010 were $62.0 million. Collateral values associated with these impaired loans (less estimated selling costs), based upon the most recent valuations, exceeded this amount, so there are no specifically identified losses allocated in the allowance for loan losses.
Restructured loans are defined as those loans whose terms have been modified, because of a deterioration in the financial condition of the borrower, to provide for a reduction of either interest or principal, regardless of whether such loans are secured or unsecured, regardless of whether such credits are guaranteed by the government or others, and regardless of the effective interest rate on such credits. Such a loan is considered restructured until paid in full. However, a loan that is restructured with an interest rate similar to current market interest rates and is in compliance with the modified terms need not be reported as restructured beginning the year after the year in which it was restructured. Total loans which were considered restructured as of December 31, 2010 was $6.5 million. Of these, $5.6 million is still performing in accordance with modified terms and are considered performing loans.
The Bank anticipates the volume of outstanding commercial real estate and construction loans to continue to decline in accordance with the Bank’s established policy. Overall, management’s outlook for the New Mexico economy for 2011 is expected to be a weaker recovery than originally anticipated by economists. Nonfarm employment growth was a negative 0.3 % in 2010, but is expected to be at 0.7 in 2011 increasing to 1.3% in 2012. Housing construction overall has remained depressed throughout 2010 and is expected to remain so for 2011. The construction sector is expected to see improvement in 2012 with a 0.8% boost in employment.
Additions to the allowance for loan losses, which are charged to earnings through the provision for loan losses, are determined based on a variety of factors, as indicated above. Although the Company believes the allowance for loan losses is sufficient to cover probable losses inherent in the loan portfolio, there can be no assurance that the allowance will prove sufficient to cover actual loan losses.
Potential Problem Loans. We utilize an internal asset classification system as a means of reporting problem and potential problem assets. At our scheduled meetings of the board of directors of the Bank, a watch list is presented, showing significant loan relationships listed as “Special Mention,” “Substandard,” “Doubtful” and “Loss.” Substandard assets include those characterized by the distinct possibility that we will sustain some loss if the deficiencies are not corrected. Assets classified as Doubtful have all the weaknesses inherent in those classified Substandard with the added characteristic that the weaknesses present make collection or liquidation in full, on the basis of currently existing facts, conditions and values, highly questionable and improbable. Assets classified as Loss are those considered uncollectible and viewed as valueless assets and have been charged-off. Assets that do not currently expose us to sufficient risk to warrant classification in one of the aforementioned categories, but possess weaknesses that deserve management’s close attention are deemed to be Special Mention.
Our determination as to the classification of our assets and the amount of our valuation allowances is subject to review by the OCC, which can order the establishment of additional general or specific loss allowances. There can be no assurance that regulators, in reviewing our loan portfolio, will not request us to materially adjust our allowance for loan losses. The OCC, in conjunction with the other federal banking agencies, has adopted an interagency policy statement on the allowance for loan losses. The policy statement provides guidance for financial institutions on both the responsibilities of management for the assessment and establishment of adequate allowances and guidance for banking agency examiners to use in determining the adequacy of general valuation guidelines. Generally, the policy statement recommends that: (1) institutions have effective systems and controls to identify, monitor and address asset quality problems; (2) management has analyzed all significant factors that affect the collectability of the portfolio in a reasonable manner; and (3) management has established acceptable allowance evaluation processes that meet the objectives set forth in the policy statement. Management believes it has established an adequate allowance for probable loan losses. We analyze our process regularly, with modifications made if needed, and report those results four times per year at meetings of our Audit Committee. However, there can be no assurance that regulators, in reviewing our loan portfolio, will not request us to materially adjust our allowance for loan losses at the time of their examination.
Although management believes that adequate specific and general loan loss allowances have been established, actual losses are dependent upon future events and, as such, further additions to the level of specific and general loan loss allowances may become necessary.
We define potential problem loans as performing loans rated Substandard that do not meet the definition of a non-performing loan. See discussion in “Asset Quality” for additional discussion of the impacts of the economic environment on the loan portfolio.
The following table shows the amounts of performing but adversely classified assets and special mention loans as of the periods indicated:
|
At December 31,
|
||||||||||||||||||||
|
2010
|
2009
|
2008
|
2007
|
2006
|
||||||||||||||||
|
(In thousands)
|
||||||||||||||||||||
|
Performing loans classified as:
|
||||||||||||||||||||
|
Substandard
|
$
|
25,667
|
$
|
30,648
|
$
|
38,815
|
$
|
9,890
|
$
|
6,334
|
||||||||||
|
Doubtful
|
-
|
-
|
-
|
17
|
-
|
|||||||||||||||
|
Total performing adversely classified loans
|
$
|
25,667
|
$
|
30,648
|
$
|
38,815
|
$
|
9,907
|
$
|
6,334
|
||||||||||
|
Special mention loans
|
$
|
1,091
|
$
|
5,269
|
$
|
24,836
|
$
|
30,715
|
$
|
9,044
|
||||||||||
Total performing adversely classified assets as of December 31, 2010 were $25.7 million. This was a decrease of $5.0 million (16.3%) from December 31, 2009 to December 31, 2010. The main reason for the decrease was a decrease in classified commercial real estate loans of $11.0 million, which was partially offset by an increase in classified construction real estate loans of $6.6 million. The overall decrease was mainly due to loans being placed in non-accrual status or foreclosed, and fewer loans being downgraded to replace them. In addition, special mention loans decreased $4.2 million (79.3%) from $5.3 million on December 31, 2009 to $1.1 million on December 31, 2010. The main reason for the decrease was a decrease in special mention commercial real estate loans of $2.8 million and a decrease in special mention construction real estate loans of $1.2 million. These decreases were mainly due to loans being further downgraded in classification, moved into non-accrual status or foreclosed, with fewer loans being placed on the watch list to replace them.
Management carefully monitors the adversely classified assets it has in its portfolio. Management believes the increase in classified assets in 2008 was a result of current national and regional economic difficulties, particularly in the area of real estate sales. The levels of classified assets have been declining in the subsequent two years, although they continue to be higher than historical experience in years prior to 2008. Although we do not have direct exposure from subprime mortgages, we have significant concentrations in real estate lending (through construction, residential and commercial loans), and while the New Mexico real estate environment is currently more favorable than many areas of the nation, real estate values have fallen and there are concerns that such values will stagnate or continue to fall within our market areas. As a result, we will continue to closely monitor market conditions, our loan portfolio and make any adjustments to our allowance for loan losses deemed necessary to adequately provide for probable losses in these areas.
Sources of Funds
General. Deposits, short-term and long-term borrowings, loan and investment security repayments and prepayments, proceeds from the sale of securities, and cash flows generated from operations are the primary sources of our funds for lending, investing and other general purposes. Loan repayments are a relatively predictable source of funds except during periods of significant interest rate declines, while deposit flows tend to fluctuate with prevailing interests rates, money markets conditions, general economic conditions and competition.
Deposits. We offer a variety of deposit accounts with a range of interest rates and terms. Our core deposits consist of checking accounts, Negotiable Order of Withdrawal (NOW) accounts, Money Market Deposit Accounts (MMDA), savings accounts and non-public certificates of deposit. These deposits, along with public fund deposits and short-term and long-term borrowings are used to support our asset base. Our deposits are obtained predominantly from our market areas. We rely primarily on competitive rates along with customer service and long-standing relationships with customers to attract and retain deposits; however, market interest rates and rates offered by competing financial institutions significantly affect our ability to attract and retain deposits.
The following table sets forth the maturities of time deposits $100 thousand and over:
|
At December 31, 2010
|
||||
|
(In thousands)
|
||||
|
Time deposits $100,000 and over:
|
||||
|
Maturing within three months
|
$
|
106,745
|
||
|
After three but within six months
|
78,463
|
|||
|
After six but within twelve months
|
94,141
|
|||
|
After twelve months
|
48,834
|
|||
|
Total time deposits $100,000 and over
|
$
|
328,183
|
||
Borrowings. We have access to a variety of borrowing sources and use short-term and long-term borrowings to support our asset base. Short-term borrowings include federal funds purchased, securities sold under agreements to repurchase and advances from the Federal Home Loan Bank (“FHLB”) with remaining maturities under one year. Long-term borrowings are advances from the FHLB with remaining maturities over one year. Total short-term and long-term borrowings decreased $41 thousand at December 31, 2010, compared to December 31, 2009 due to scheduled payments on existing borrowings.
In addition to short- and long-term borrowings made by us, the ESOP has used borrowings, which the Company guarantees, to facilitate its ability to acquire stock for the benefit of all employees who participate in the ESOP. For further information, please see “Financial Statements and Supplemental Data—Notes to Consolidated Financial Statements—Note 13, ‘Retirement Plans” in Item 8 of this Form 10-K below.
The following table sets forth certain information regarding our borrowings for the periods indicated:
|
At December 31,
|
||||||||||||
|
2010
|
2009
|
2008
|
||||||||||
|
(Dollars in thousands)
|
||||||||||||
|
Short-term borrowings:
|
||||||||||||
|
Average balance outstanding
|
$
|
5,558
|
$
|
26,523
|
$
|
21,783
|
||||||
|
Maximum outstanding at any month-end during the period
|
20,000
|
40,000
|
40,000
|
|||||||||
|
Balance outstanding at end of period
|
1,152
|
20,000
|
-
|
|||||||||
|
Weighted average interest rate during the period
|
4.84
|
%
|
2.77
|
%
|
3.24
|
%
|
||||||
|
Weighted average interest rate at end of the period
|
6.03
|
%
|
4.67
|
%
|
0.00
|
%
|
||||||
|
Long-term borrowings:
|
||||||||||||
|
Average balance outstanding
|
$
|
27,923
|
$
|
17,210
|
$
|
23,549
|
||||||
|
Maximum outstanding at any month-end during the period
|
32,300
|
33,529
|
23,566
|
|||||||||
|
Balance outstanding at end of period
|
32,300
|
13,493
|
23,532
|
|||||||||
|
Weighted average interest rate during the period
|
3.18
|
%
|
4.43
|
%
|
4.90
|
%
|
||||||
|
Weighted average interest rate at end of the period
|
3.13
|
%
|
3.68
|
%
|
4.90
|
%
|
||||||
|
Borrowings made by Employee Stock Ownership Plan (ESOP) to outside parties:
|
||||||||||||
|
Average balance outstanding
|
$
|
-
|
$
|
-
|
$
|
9
|
||||||
|
Maximum outstanding at any month-end during the period
|
-
|
-
|
-
|
|||||||||
|
Balance outstanding at end of period
|
-
|
-
|
-
|
|||||||||
|
Weighted average interest rate during the period
|
0.00
|
%
|
0.00
|
%
|
7.27
|
%
|
||||||
|
Weighted average interest rate at end of the period
|
0.00
|
%
|
0.00
|
%
|
0.00
|
%
|
||||||
|
Junior subordinated debt owed to unconsolidated trusts:
|
||||||||||||
|
Average balance outstanding
|
$
|
37,116
|
$
|
37,116
|
$
|
37,116
|
||||||
|
Maximum outstanding at any month-end during the period
|
37,116
|
37,116
|
37,116
|
|||||||||
|
Balance outstanding at end of period
|
37,116
|
37,116
|
37,116
|
|||||||||
|
Weighted average interest rate during the period
|
7.43
|
%
|
7.49
|
%
|
7.87
|
%
|
||||||
|
Weighted average interest rate at end of the period
|
7.33
|
%
|
7.32
|
%
|
7.64
|
%
|
||||||
Liquidity
Bank Liquidity. Liquidity management is monitored by the Asset/Liability Management Committee and Board of Directors of the Bank, who review historical funding requirements, current liquidity position, sources and stability of funding, marketability of assets, options for attracting additional funds, and anticipated future funding needs, including the level of unfunded commitments.
Our primary sources of funds are retail and commercial deposits, borrowings, public funds and funds generated from operations. Funds from operations include principal and interest payments received on loans and securities. While maturities and scheduled amortization of loans and securities provide an indication of the timing of the receipt of funds, changes in interest rates, economic conditions and competition strongly influence mortgage prepayment rates and deposit flows, reducing the predictability of the timing on sources of funds.
We adhere to a liquidity policy, approved by the Board of Directors, which requires that we maintain the following liquidity ratios:
|
|
•
|
Net on-hand liquidity to total assets (defined as interest-bearing short-term investments plus securities not needed for collateral less short-term borrowings divided by total assets) should be greater than 0%.
|
|
|
•
|
Wholesale funding to total assets (defined as state deposits plus short and long-term borrowings divided by total assets) should be less than 20%.
|
|
|
•
|
Unused funding lines to total assets (defined as unused borrowings lines available from FHLB and other banks divided by total assets) should be greater than 10%.
|
|
|
•
|
Loans to deposits less than 110%.
|
|
|
•
|
Unused commitments to fund loans to total assets (defined as unused lines of credit likely to be funded divided by total assets) should be less than 5%.
|
|
|
|
At December 31, 2010 and 2009, we were in compliance with the foregoing policy.
At December 31, 2010, we had outstanding loan origination commitments and unused commercial and retail lines of credit of $164.9 million and standby letters of credit of $14.1 million. We anticipate we will have sufficient funds available to meet current origination and other lending commitments. Certificates of deposit scheduled to mature within one year totaled $465.4 million at December 31, 2010. Based upon our historical experience, we expect to retain a substantial majority of these certificates of deposit when they mature.
In the event that additional short-term liquidity is needed, we have established relationships with several large regional banks to provide short-term borrowings in the form of federal funds purchases. We have borrowed at various points of time $50.0 million for a short period (15 to 60 days) from these banks on a collective basis. Management believes that we will be able to continue to borrow federal funds from our correspondent banks in the future. Additionally, we are a member of the FHLB and, as of December 31, 2010, we had the ability to borrow from the FHLB up to a total of $231.4 million in additional funds. We also may borrow through the Federal Reserve Bank’s discount window up to a total of $106.2 million on a short-term basis. As a contingency plan for significant funding needs, the Asset/Liability Management Committee may also consider the sale of investment securities, selling securities under agreement to repurchase, sale of certain loans and/or the temporary curtailment of lending activities. Based upon the current economic conditions and uncertainties, the Company has adjusted its policies on administering its balance sheet to adjust to these changes.
Company Liquidity. Trinity’s main sources of liquidity at the holding company level are dividends from the Bank.
The Bank is subject to various regulatory capital requirements administered by federal and state banking agencies, which affect its ability to pay dividends to Trinity. See “Business—Trinity Capital Corporation—Supervision and Regulation—Dividends” and “Business—Los Alamos National Bank—Supervision and Regulation—Dividends” in Item 1 of this Form 10-K. Failure to meet minimum capital requirements can initiate certain mandatory and discretionary actions by regulators that, if undertaken, could have a direct material effect on our financial statements. The minimum ratios required for the Bank to be considered “well capitalized” for regulatory purposes are 10%, 6% and 5%. At December 31, 2010, the Bank could pay a total of $50.5 million in dividends and still meet these minimum regulatory capital ratio requirements for “well-capitalized” status. However, the Bank has established an internal Capital Plan which provides for certain ranges and internal minimum capital levels based upon certain risk factors. The Capital Plan also identifies potential sources for additional capital should it be deemed necessary. For more information, please see “Capital Resources” and Item 8, “Financial Statements and Supplemental Data—Notes to Consolidated Financial Statements—Note 20, ‘Regulatory Matters’” below.
Contractual Obligations, Commitments, Contingent Liabilities and Off-balance Sheet Arrangements
We have various financial obligations, including contractual obligations and commitments, which may require future cash payments.
Contractual Obligations. The following table presents, as of December 31, 2010, significant fixed and determinable contractual obligations to third parties by payment date. For further discussion of the nature of each obligation, please see Item 8, “Financial Statements and Supplemental Data—Notes to Consolidated Financial Statements” for more information on each line item.
|
Payments Due by Period
|
||||||||||||||||||||
|
Total
|
One year or less
|
1-3 years
|
3-5 years
|
After 5 years
|
||||||||||||||||
|
(in thousands)
|
||||||||||||||||||||
|
Deposits without a stated maturity (1)
|
$
|
819,055
|
$
|
819,055
|
$
|
-
|
$
|
-
|
$
|
-
|
||||||||||
|
Time deposits (1)
|
539,290
|
465,354
|
28,084
|
39,352
|
6,500
|
|||||||||||||||
|
Short-term borrowings (1)
|
1,152
|
1,152
|
-
|
-
|
-
|
|||||||||||||||
|
Long-term borrowings (1)
|
32,300
|
-
|
10,000
|
20,000
|
2,300
|
|||||||||||||||
|
Operating leases
|
364
|
364
|
-
|
-
|
-
|
|||||||||||||||
|
Capital leases
|
2,211
|
-
|
-
|
2,211
|
-
|
|||||||||||||||
|
Junior subordinated debt owed to unconsolidated trusts (1)
|
37,116
|
-
|
-
|
- |
37,116
|
|||||||||||||||
|
Total contractual long term cash obligations
|
$
|
1,431,488
|
$
|
1,285,925
|
$
|
38,084
|
$
|
61,563
|
$
|
45,916
|
||||||||||
_________________________
|
(1)
|
Excludes interest.
|
|
|
|
Deposits without a stated maturity and time deposits do not necessarily represent future cash requirements. While these deposits contractually can be withdrawn by the customer on the dates indicated in the above table, historical experience has shown these deposits to have low volatility. Operating leases represent rental payments for office and storage property, as well as space for ATM installation in various locations. The capital lease was acquired in 2006 for the land on which our third office in Santa Fe was constructed. The lease contains a purchase option in 2014 that we expect to exercise, the cost of which is largely offset by a loan held on the property.
Commitments. The following table details the amounts and expected maturities of significant commitments as of December 31, 2010. Further discussion of these commitments is included in Note 16 in Item 8, “Financial Statements and Supplementary Data” of this report.
|
Payments Due by Period
|
||||||||||||||||||||
|
Total
|
One year or less
|
1-3 years
|
3-5 years
|
After 5 years
|
||||||||||||||||
|
(in thousands)
|
||||||||||||||||||||
|
Commitments to extend credit:
|
||||||||||||||||||||
|
Commercial
|
$
|
57,972
|
$
|
45,463
|
$
|
12,509
|
$
|
-
|
$
|
-
|
||||||||||
|
Commercial real estate
|
1,625
|
1,625
|
-
|
-
|
-
|
|||||||||||||||
|
Residential real estate
|
718
|
718
|
-
|
-
|
-
|
|||||||||||||||
|
Construction real estate
|
21,462
|
16,677
|
4,785
|
-
|
-
|
|||||||||||||||
|
Revolving home equity and credit card lines
|
73,868
|
36,137
|
4,902
|
12,069
|
20,760
|
|||||||||||||||
|
Other
|
9,205
|
9,194
|
10
|
1
|
-
|
|||||||||||||||
|
Standby letters of credit
|
14,051
|
13,752
|
62
|
237
|
-
|
|||||||||||||||
|
Total commitments to extend credit
|
178,901
|
123,566
|
22,268
|
12,307
|
20,760
|
|||||||||||||||
|
Commitments to sell mortgage loans
|
33,241
|
33,241
|
-
|
-
|
-
|
|||||||||||||||
|
ESOP liquidity put
|
6,132
|
1,226
|
2,453
|
2,453
|
-
|
|||||||||||||||
|
Total commitments
|
$
|
218,274
|
$
|
158,033
|
$
|
24,721
|
$
|
14,760
|
$
|
20,760
|
||||||||||
Commitments to extend credit, including loan commitments and standby letters of credit, do not necessarily represent future cash requirements, as these commitments often expire without being drawn upon. Commitments to sell mortgage loans are offset by commitments from customers to enter into a mortgage loan. The Bank’s contract with customers specifically requires the customer to pay any fees incurred in the event that we cannot deliver a mortgage to the buyer according to the contract with the buyer of the mortgage. The ESOP liquidity put is described in Note 13 in Item 8, “Financial Statements and Supplementary Data,” of this report.
Capital Resources
The Bank is subject to the risk based capital regulations administered by the banking regulatory agencies. The risk based capital guidelines are designed to make regulatory capital requirements more sensitive to differences in risk profiles among banks, to account for off-balance sheet exposure and to minimize disincentives for holding liquid assets. Under the regulations, assets and off-balance sheet items are assigned to broad risk categories, each with appropriate weights. The resulting capital ratios represent capital as a percentage of total risk weighted assets and off-balance sheet items. Under the prompt corrective action regulations, to be adequately capitalized a bank must maintain minimum ratios of total capital to risk-weighted assets of 8%, Tier 1 capital to risk-weighted assets of 4%, and Tier 1 capital to total assets of 4%. Failure to meet these capital requirements can initiate certain mandatory and possibly additional discretionary actions by regulators, which, if undertaken, could have a direct material effect on the Bank’s financial statements. A “well–capitalized” institution must maintain a minimum ratio of total capital to risk-weighted assets of at least 10%, a minimum ratio of Tier 1 capital to risk weighted assets of at least 6%, a minimum ratio of Tier 1 capital to total assets of at least 5% and must not be subject to any written order, agreement or directive requiring it to meet or maintain a specific capital level. As of December 31, 2010, the Bank had maintained capital in excess of these ratios. The Bank remains strongly capitalized with its total capital to risk-weighted assets exceeding the statutory requirements for “well-capitalized” status at 14.26%, over 140% of the statutory requirements as of December 31, 2010. In connection with the current economic environment, the Bank has a Capital Plan to maintain its total capital to risk-weighted assets at 12% or above and its Tier 1 capital to total assets at 9% or above.
In order for the Company to be considered “adequately capitalized” on a consolidated basis, it must maintain a minimum ratio of Tier 1 capital to total assets of 4%, and a minimum ratio of total capital to risk-weighted assets of 8%. However, the Company maintains and follows its own internal Capital Plan that may require higher minimum capital ratios based upon certain risk factors in the area of asset quality. See Item 1. “Business—Supervision and Regulation—--The Increasing Importance of Capital—Required Capital Levels.”
A certain amount of both the Company and the Bank’s Tier 1 Capital was in the form of Trust Preferred Securities. Please see Note 11, ”Junior Subordinated Debt Owed to Unconsolidated Trusts” in Item 8, “Financial Statements and Supplementary Data” in this report for details on the effect these have on risk based capital. Please see “Risk Factors” in Item 1A of this Form 10-K for further information regarding changes in the regulatory environment affecting capital.
Trinity and the Bank were in full compliance with all capital adequacy requirements to which they are subject as of December 31, 2010. The required and actual amounts and ratios for Trinity and the Bank as of December 31, 2010 are presented below:
|
Actual
|
For Capital
Adequacy Purposes
|
To be "Well
Capitalized" Under
Prompt Corrective
Action Provisions
|
||||||||||||||||
|
Amount
|
Ratio
|
Amount
|
Ratio
|
Amount
|
Ratio
|
|||||||||||||
|
(Dollars in thousands)
|
||||||||||||||||||
|
As of December 31, 2010
|
||||||||||||||||||
|
Total capital (to risk-weighted assets):
|
||||||||||||||||||
|
Consolidated
|
$
|
173,086
|
14.50
|
%
|
$
|
95,516
|
8.00
|
%
|
N/A
|
N/A
|
||||||||
|
Bank only
|
169,209
|
14.26
|
94,938
|
8.00
|
$
|
118,672
|
10.00
|
%
|
||||||||||
|
Tier 1 capital (to risk-weighted assets):
|
||||||||||||||||||
|
Consolidated
|
157,985
|
13.23
|
%
|
47,758
|
4.00
|
%
|
N/A
|
N/A
|
||||||||||
|
Bank only
|
154,197
|
12.99
|
47,469
|
4.00
|
71,203
|
6.00
|
||||||||||||
|
Tier 1 capital (to average assets):
|
||||||||||||||||||
|
Consolidated
|
157,985
|
9.82
|
%
|
64,340
|
4.00
|
%
|
N/A
|
N/A
|
||||||||||
|
Bank only
|
154,197
|
9.64
|
63,995
|
4.00
|
79,994
|
5.00
|
||||||||||||
_________________________
N/A—not applicable
Statement of Cash Flows
Our cash flows are comprised of three classifications: cash flows from operating activities, cash flows from investing activities and cash flows from financing activities. Net cash provided by operating activities was $14.3 million, $18.5 million and $21.0 million for 2010, 2009 and 2008. Net cash provided by operating activities decreased $4.2 million from 2009 primarily due to a decrease in cash provided by sales of loans held for sale, net of origination of loans held for sale, of $15.5 million. This was partially offset by an increase in cash provided by net income, less adjustments for non-cash items, of $11.3 million. From 2008 to 2009, net cash provided by operating activities decreased $2.5 million primarily due to a decrease in cash provided by net income, less adjustments for non-cash items, of $3.3 million. This was partially offset by an increase in cash provided by sales of loans held for sale, net of origination of loans held for sale, of $810 thousand.
Net cash provided by (used in) investing activities was ($2.8) million, ($92.0) million and ($70.5) million for 2010, 2009 and 2008. Net cash provided by (used in) investing activities decreased $89.2 million between 2009 and 2010 mainly due to an increase in cash provided from the maturities and paydowns of investment securities of $115.1 million and a decrease in cash used by the funding of loans, net of repayments, of $58.5 million. These items were partially offset by a decrease in cash provided from the sale of investment securities of $91.8 million. From 2008 to 2009, net cash used in investing activities increased $21.5 million primarily due to a decrease of cash provided from the maturities and paydowns of securities of $57.1 million and an increase in cash used for the purchase of investment securities of $30.0 million. These items were partially offset by an increase in cash provided by the sale of investment securities of $46.9 million and a decrease in cash used for the funding of loans, net of repayments, of $19.1 million.
Net cash provided by (used in) financing activities was $(112.7) million, $255.8 million and $29.2 million for 2010, 2009 and 2008. From 2009 to 2010, net cash provided by financing activities decreased $368.5 million mainly due to a decrease in cash provided by the net decrease in deposits of $327.0 million and a decrease in cash provided by the issuance of preferred stock of $35.5 million. Between 2008 and 2009, net cash provided by financing activities increased $226.6 million primarily due to an increase of cash provided by the net increase in deposits of $140.7 million, an increase in cash provided from the issuance of borrowings, net of repayments, of $50.0 million, and an increase in cash provided by the issuance of preferred stock of $35.5 million.
The most significant decrease in deposits from December 31, 2009 to December 31, 2010, occurred in savings accounts ($130.5 million) and time deposits over $100,000 ($77.9 million), with a small decrease in other time deposits ($3.6 million). There was growth in MMDA deposits ($55.9 million), NOW accounts ($37.4 million) and DDA deposits ($8.6 million). This decrease in total deposits was due to a decision by management to decrease the amount of public deposits in order to decrease excess liquidity and increase capital ratios.
Asset Liability Management
Our net interest income is subject to “interest rate risk” to the extent that it can vary based on changes in the general level of interest rates. It is our policy to maintain an acceptable level of interest rate risk over a range of possible changes in interest rates while remaining responsive to market demand for loan and deposit products. The strategy we employ to manage our interest rate risk involves measuring our risk using an asset/liability simulation model and adjusting the maturity of securities in our investment portfolio to manage that risk.
Interest rate risk is also measured by analyzing the extent to which the repricing of assets and liabilities are mismatched to create an interest sensitivity “gap.” An asset or liability is considered to be interest rate sensitive within a specific time period if it will mature or reprice within that time period. The interest rate sensitivity gap is defined as the difference between the amount of interest earning assets maturing or repricing within a specific time period and the amount of interest bearing liabilities maturing or repricing within that same time period. A gap is considered positive when the amount of interest rate sensitive assets exceeds the amount of interest rate sensitive liabilities. A gap is considered negative when the amount of interest rate sensitive liabilities exceeds the amount of interest rate sensitive assets. During a period of rising interest rates, therefore, a negative gap would tend to adversely affect net interest income. Conversely, during a period of falling interest rates, a negative gap position would tend to result in an increase in net interest income.
The following tables set forth the amounts of interest earning assets and interest bearing liabilities outstanding at December 31, 2010, which we anticipate, based upon certain assumptions, to reprice or mature in each of the future time periods shown. Except as stated below, the amount of assets and liabilities shown which reprice or mature during a particular period was determined based on the earlier of the term to repricing or the term to repayment of the asset or liability. These tables are intended to provide an approximation of the projected repricing of assets and liabilities at December 31, 2010 on the basis of contractual maturities and scheduled rate adjustments within a three-month period and subsequent selected time intervals. The loan amounts in the table reflect principal balances expected to be reinvested and/or repriced as a result of contractual amortization and rate adjustments on adjustable-rate loans. The contractual maturities and amortization of loans and investment securities reflect modest prepayment assumptions. While NOW, money market and savings deposit accounts have adjustable rates, it is assumed that the interest rates on these accounts will not adjust immediately to changes in other interest rates. Therefore, the table is calculated assuming that these accounts will reprice based upon an historical analysis of decay rates of these particular accounts, with repricing assigned to these accounts from 1 to 10 months.
|
Time to Maturity or Repricing
|
||||||||||||||||||||
|
As of December 31, 2010:
|
0-90 Days
|
91-365 Days
|
1-5 Years
|
Over 5 Years
|
Total
|
|||||||||||||||
|
(Dollars in thousands)
|
||||||||||||||||||||
|
Interest-earning Assets:
|
||||||||||||||||||||
|
Loans
|
$
|
347,400
|
$
|
220,568
|
$
|
561,717
|
$
|
60,253
|
$
|
1,189,938
|
||||||||||
|
Loans held for sale
|
25,080
|
-
|
-
|
-
|
25,080
|
|||||||||||||||
|
Investment securities
|
18,465
|
31,683
|
55,473
|
76,296
|
181,917
|
|||||||||||||||
|
Securities purchased under agreements to resell
|
110
|
-
|
-
|
-
|
110
|
|||||||||||||||
|
Interest-bearing deposits with banks
|
85,833
|
3,483
|
-
|
-
|
89,316
|
|||||||||||||||
|
Investment in unconsolidated trusts
|
186
|
-
|
-
|
930
|
1,116
|
|||||||||||||||
|
Total interest-earning assets
|
$
|
477,074
|
$
|
255,734
|
$
|
617,190
|
$
|
137,479
|
$
|
1,487,477
|
||||||||||
|
Interest-bearing Liabilities:
|
||||||||||||||||||||
|
NOW deposits
|
$
|
68,299
|
$
|
122,619
|
$
|
-
|
$
|
-
|
$
|
190,918
|
||||||||||
|
Money market deposits
|
88,419
|
122,881
|
-
|
-
|
211,300
|
|||||||||||||||
|
Savings deposits
|
124,818
|
182,128
|
-
|
-
|
306,946
|
|||||||||||||||
|
Time deposits over $100,000
|
106,745
|
172,604
|
42,334
|
6,500
|
328,183
|
|||||||||||||||
|
Time deposits under $100,000
|
65,073
|
120,932
|
25,102
|
-
|
211,107
|
|||||||||||||||
|
Short-term borrowings
|
-
|
1,152
|
-
|
-
|
1,152
|
|||||||||||||||
|
Long-term borrowings
|
-
|
-
|
30,000
|
2,300
|
32,300
|
|||||||||||||||
|
Capital lease obligations
|
-
|
-
|
2,211
|
-
|
2,211
|
|||||||||||||||
|
Junior subordinated debt owed to unconsolidated trusts
|
6,186
|
-
|
-
|
30,930
|
37,116
|
|||||||||||||||
|
Total interest-bearing liabilities
|
$
|
459,540
|
$
|
722,316
|
$
|
99,647
|
$
|
39,730
|
$
|
1,321,233
|
||||||||||
|
Rate sensitive assets (RSA)
|
$
|
477,074
|
$
|
732,808
|
$
|
1,349,998
|
$
|
1,487,477
|
1,487,477
|
|||||||||||
|
Rate sensitive liabilities (RSL)
|
459,540
|
1,181,856
|
1,281,503
|
1,321,233
|
1,321,233
|
|||||||||||||||
|
Cumulative GAP (GAP=RSA-RSL)
|
17,534
|
(449,048
|
)
|
68,495
|
166,244
|
166,244
|
||||||||||||||
|
RSA/Total assets
|
30.48
|
%
|
46.81
|
%
|
86.24
|
%
|
95.02
|
%
|
95.02
|
%
|
||||||||||
|
RSL/Total assets
|
29.36
|
%
|
75.50
|
%
|
81.86
|
%
|
84.40
|
%
|
84.40
|
%
|
||||||||||
|
GAP/Total assets
|
1.12
|
%
|
-28.69
|
%
|
4.38
|
%
|
10.62
|
%
|
10.62
|
%
|
||||||||||
|
GAP/RSA
|
3.68
|
%
|
-61.28
|
%
|
5.07
|
%
|
11.18
|
%
|
11.18
|
%
|
||||||||||
Certain shortcomings are inherent in the method of analysis presented in the foregoing table. For example, although certain assets and liabilities may have similar maturities or periods to repricing, they may react in different degrees to changes in market interest rates. Also, the interest rates on certain types of assets and liabilities may fluctuate in advance of changes in market interest rates, while interest rates on other types of assets may lag behind changes in market rates. Additionally, in the event of a change in interest rates, prepayment and early withdrawal levels would likely deviate significantly from those assumed in calculating the table. Therefore, we do not rely solely on a gap analysis to manage our interest rate risk, but rather we use what we believe to be the more reliable simulation model relating to changes in net interest income.
Based on simulation modeling at December 31, 2010 and December 31, 2009, our net interest income would change over a one-year time period due to changes in interest rates as follows:
Change in Net Interest Income Over One Year Horizon
|
At December 31, 2010
|
At December 31, 2009
|
|||||||||||||||||
|
Changes in Levels of Interest Rates
|
Dollar Change
|
Percent Change
|
Dollar Change
|
Percent Change
|
||||||||||||||
|
(Dollars in thousands)
|
||||||||||||||||||
|
+2.00
|
%
|
$
|
(5,253
|
)
|
(9.95
|
)%
|
$
|
(6,584
|
)
|
(11.71
|
)%
|
|||||||
|
+1.00
|
(3,363
|
)
|
(6.37
|
)
|
(3,329
|
)
|
(5.92
|
)
|
||||||||||
|
(1.00
|
)
|
(1,711
|
)
|
(3.24
|
)
|
(281
|
)
|
(0.50
|
)
|
|||||||||
|
(2.00
|
)
|
(3,426
|
)
|
(6.49
|
)
|
(394
|
)
|
(0.70
|
)
|
|||||||||
Our simulations used assume the following:
1. Changes in interest rates are immediate.
2. It is our policy that interest rate exposure due to a 2% interest rate rise or fall be limited to 15% of our annual net interest income, as forecasted by the simulation model. As demonstrated by the table above, our interest rate risk exposure was within this policy at December 31, 2010.
|
|
|
Changes in net interest income between the periods above reflect changes in the composition of interest earning assets and interest bearing liabilities, related interest rates, repricing frequencies, and the fixed or variable characteristics of the interest earning assets and interest bearing liabilities. Projections of income given by the model are not actual predictions, but rather show our relative interest rate risk. Actual interest income may vary from model projections.
TRINITY CAPITAL CORPORATION AND SUBSIDIARIES
FINANCIAL STATEMENTS
Audited Financial Statements December 31, 2010, 2009, and 2008
INDEX
|
|
|
|
|
|
|
|
|
|
|
|
|
|
|
|
|
|
|
|
|
|
|
Management is responsible for establishing and maintaining adequate internal control over financial reporting, and for performing an assessment of the effectiveness of internal control over financial reporting as of December 31, 2010. Internal control over financial reporting is a process designed to provide reasonable assurance regarding the reliability of financial reporting and the preparation of financial statements for external purposes in accordance with generally accepted accounting principles. The Company’s system of internal control over financial reporting includes those policies and procedures that (i) pertain to the maintenance of records that, in reasonable detail, accurately and fairly reflect the transactions and dispositions of the assets of the Company; (ii) provide reasonable assurance that transactions are recorded as necessary to permit preparation of financial statements in accordance with generally accepted accounting principles, and that receipts and expenditures of the company are being made only in accordance with authorizations of management and directors of the Company; and (iii) provide reasonable assurance regarding prevention or timely detection of unauthorized acquisition, use or disposition of the Company’s assets that could have a material effect on the financial statements.
Management performed an assessment of the effectiveness of the Company’s internal control over financial reporting as of December 31, 2010, based upon criteria in Internal Control - Integrated Framework issued by the Committee of Sponsoring Organizations of the Treadway Commission (“COSO”). Based on our assessment, management determined that the Company’s internal control over financial reporting was effective as of December 31, 2010.
The Company’s independent Registered Public Accounting firm has issued an attestation report on management’s assessment of the Company's internal control over financial reporting.
The Board of Directors and Stockholders
Trinity Capital Corporation
We have audited the accompanying consolidated balance sheets of Trinity Capital Corporation and subsidiaries (the “Company”) as of December 31, 2010 and 2009, and the related consolidated statements of income, changes in stockholders’ equity, and cash flows for each of the three years in the period ended December 31, 2010. We also have audited the Company’s internal control over financial reporting as of December 31, 2010, based on criteria established in Internal Control - Integrated Framework issued by the Committee of Sponsoring Organizations of the Treadway Commission. The Company’s management is responsible for these financial statements, for maintaining effective internal control over financial reporting, and for its assessment of the effectiveness of internal control over financial reporting, included in the accompanying Management’s Report on Internal Control over Financial Reporting. Our responsibility is to express an opinion on these consolidated financial statements and an opinion on the Company’s internal control over financial reporting based on our audits.
We conducted our audits in accordance with the standards of the Public Company Accounting Oversight Board (United States). Those standards require that we plan and perform the audits to obtain reasonable assurance about whether the consolidated financial statements are free of material misstatement and whether effective internal control over financial reporting was maintained in all material respects. Our audits of the consolidated financial statements included examining, on a test basis, evidence supporting the amounts and disclosures in the consolidated financial statements, assessing the accounting principles used and significant estimates made by management, and evaluating the overall consolidated financial statement presentation. Our audit of internal control over financial reporting included obtaining an understanding of internal control over financial reporting, assessing the risk that a material weakness exists, and testing and evaluating the design and operating effectiveness of internal control based on the assessed risk. Our audits also included performing such other procedures as we considered necessary in the circumstances. We believe that our audits provide a reasonable basis for our opinions.
A company’s internal control over financial reporting is a process designed to provide reasonable assurance regarding the reliability of financial reporting and the preparation of financial statements for external purposes in accordance with generally accepted accounting principles. A company’s internal control over financial reporting includes those policies and procedures that (1) pertain to the maintenance of records that, in reasonable detail, accurately and fairly reflect the transactions and dispositions of the assets of the company; (2) provide reasonable assurance that transactions are recorded as necessary to permit preparation of financial statements in accordance with generally accepted accounting principles, and that receipts and expenditures of the company are being made only in accordance with authorizations of management and directors of the company; and (3) provide reasonable assurance regarding prevention or timely detection of unauthorized acquisition, use, or disposition of the company’s assets that could have a material effect on the financial statements.
Because of its inherent limitations, internal control over financial reporting may not prevent or detect misstatements. Also, projections of any evaluation of effectiveness to future periods are subject to the risk that controls may become inadequate because of changes in conditions, or that the degree of compliance with the policies or procedures may deteriorate.
In our opinion, the consolidated financial statements referred to above present fairly, in all material respects, the consolidated financial position of Trinity Capital Corporation and subsidiaries as of December 31, 2010 and 2009, and the consolidated results of their operations and their cash flows each of the three years in the period ended December 31, 2010, in conformity with generally accepted accounting principles in the United States of America. Also in our opinion, Trinity Capital Corporation maintained, in all material respects, effective internal control over financial reporting as of December 31, 2010, based on criteria established in Internal Control - Integrated Framework issued by the Committee of Sponsoring Organizations of the Treadway Commission.
/s/ Moss Adams, LLP
Albuquerque, NM
March 10, 2011
December 31, 2010 and 2009
(Amounts in thousands, except share data)
|
2010
|
2009
|
|||||||
|
ASSETS
|
||||||||
|
Cash and due from banks
|
$
|
16,765
|
$
|
18,761
|
||||
|
Interest-bearing deposits with banks
|
89,316
|
188,114
|
||||||
|
Federal funds sold and securities purchased under resell agreements
|
110
|
620
|
||||||
|
Cash and cash equivalents
|
106,191
|
207,495
|
||||||
|
Investment securities available for sale
|
162,591
|
136,756
|
||||||
|
Investment securities held to maturity, at amortized cost (fair value of $10,951 at December 31, 2010 and $10,808 at December 31, 2009)
|
11,107
|
11,436
|
||||||
|
Other investments
|
9,335
|
9,568
|
||||||
|
Loans (net of allowance for loan losses of $28,722 at December 31, 2010 and $24,504 at December 31, 2009)
|
1,161,216
|
1,215,282
|
||||||
|
Loans held for sale
|
25,080
|
9,245
|
||||||
|
Premises and equipment, net
|
30,264
|
31,949
|
||||||
|
Leased property under capital leases, net
|
2,211
|
2,211
|
||||||
|
Accrued interest receivable
|
6,736
|
6,840
|
||||||
|
Mortgage servicing rights, net
|
7,960
|
7,647
|
||||||
|
Other intangible assets
|
546
|
830
|
||||||
|
Other real estate owned
|
21,860
|
16,750
|
||||||
|
Prepaid expenses
|
6,076
|
8,648
|
||||||
|
Net deferred tax assets
|
5,587
|
4,979
|
||||||
|
Other assets
|
8,682
|
7,105
|
||||||
|
Total assets
|
$
|
1,565,442
|
$
|
1,676,741
|
||||
|
LIABILITIES AND STOCKHOLDERS' EQUITY
|
||||||||
|
Liabilities
|
||||||||
|
Deposits:
|
||||||||
|
Noninterest-bearing
|
$
|
109,891
|
$
|
87,238
|
||||
|
Interest-bearing
|
1,248,454
|
1,381,207
|
||||||
|
Total deposits
|
1,358,345
|
1,468,445
|
||||||
|
Short-term borrowings
|
1,152
|
20,000
|
||||||
|
Long-term borrowings
|
32,300
|
13,493
|
||||||
|
Long-term capital lease obligations
|
2,211
|
2,211
|
||||||
|
Junior subordinated debt owed to unconsolidated trusts
|
37,116
|
37,116
|
||||||
|
Accrued interest payable
|
4,873
|
5,038
|
||||||
|
Other liabilities
|
5,990
|
7,536
|
||||||
|
Total liabilities
|
1,441,987
|
1,553,839
|
||||||
(Continued on following page)
TRINITY CAPITAL CORPORATION & SUBSIDIARIES
CONSOLIDATED BALANCE SHEETS
December 31, 2010 and 2009
(Amounts in thousands, except share data)
(Continued from previous page)
|
2010
|
2009
|
|||||||
|
Stock owned by Employee Stock Ownership Plan (ESOP) participants; 628,914 shares and 627,030 shares at December 31, 2010 and 2009, respectively, at fair value
|
$
|
6,132
|
$
|
12,541
|
||||
|
Commitments and contingencies (Note 16)
|
||||||||
|
Stockholders' equity
|
||||||||
|
Preferred stock, no par, authorized 1,000,000 shares
|
||||||||
|
Series A, 5% cumulative perpetual, 35,539 shares issued and outstanding at December 31, 2010and 2009, respectively, $1,000 liquidation value, at amortized cost
|
33,808
|
33,597
|
||||||
|
Series B, 9% cumulative perpetual, 1,777 shares issued and outstanding at December 31, 2010 and 2009, respectively, $1,000 liquidation value, at amortized cost
|
2,044
|
2,077
|
||||||
|
Common stock, no par, authorized 20,000,000 shares; issued 6,856,800 shares, shares outstanding 6,449,726 and 6,440,784 at December 31, 2010 and 2009, respectively
|
6,836
|
6,836
|
||||||
|
Additional paid-in capital
|
1,899
|
1,869
|
||||||
|
Retained earnings
|
83,018
|
77,054
|
||||||
|
Accumulated other comprehensive income
|
692
|
142
|
||||||
|
Total stockholders' equity before treasury stock
|
128,297
|
121,575
|
||||||
|
Treasury stock, at cost, 407,074 shares and 416,016 shares at December 31, 2010 and 2009, respectively
|
(10,974
|
)
|
(11,214
|
)
|
||||
|
Total stockholders' equity
|
117,323
|
110,361
|
||||||
|
Total liabilities and stockholders' equity
|
$
|
1,565,442
|
$
|
1,676,741
|
||||
The accompanying notes are an integral part of these consolidated financial statements.
Years Ended December 31, 2010, 2009 and 2008
(Amounts in thousands except per share data)
|
2010
|
2009
|
2008
|
||||||||||
|
Interest income:
|
||||||||||||
|
Loans, including fees
|
$
|
68,512
|
$
|
73,297
|
$
|
78,713
|
||||||
|
Investment securities:
|
||||||||||||
|
Taxable
|
2,384
|
2,999
|
2,922
|
|||||||||
|
Nontaxable
|
1,161
|
1,056
|
744
|
|||||||||
|
Federal funds sold
|
-
|
1
|
169
|
|||||||||
|
Other interest-bearing deposits
|
357
|
332
|
565
|
|||||||||
|
Investment in unconsolidated trusts
|
83
|
83
|
87
|
|||||||||
|
Total interest income
|
72,497
|
77,768
|
83,200
|
|||||||||
|
Interest expense:
|
||||||||||||
|
Deposits
|
13,632
|
19,432
|
30,887
|
|||||||||
|
Short-term borrowings
|
269
|
735
|
707
|
|||||||||
|
Long-term borrowings
|
887
|
762
|
1,154
|
|||||||||
|
Long-term capital lease obligations
|
268
|
268
|
268
|
|||||||||
|
Junior subordinated debt owed to unconsolidated trusts
|
2,759
|
2,780
|
2,920
|
|||||||||
|
Total interest expense
|
17,815
|
23,977
|
35,936
|
|||||||||
|
Net interest income
|
54,682
|
53,791
|
47,264
|
|||||||||
|
Provision for loan losses
|
20,258
|
26,024
|
8,183
|
|||||||||
|
Net interest income after provision for loan losses
|
34,424
|
27,767
|
39,081
|
|||||||||
|
Other income:
|
||||||||||||
|
Mortgage loan servicing fees
|
2,630
|
2,519
|
2,467
|
|||||||||
|
Trust fees
|
1,722
|
1,463
|
1,092
|
|||||||||
|
Loan and other fees
|
2,998
|
2,699
|
2,605
|
|||||||||
|
Service charges on deposits
|
1,638
|
1,718
|
1,720
|
|||||||||
|
Gain on sale of loans
|
5,473
|
7,766
|
2,027
|
|||||||||
|
Gain on sale of securities
|
109
|
2,543
|
555
|
|||||||||
|
Title insurance premiums
|
1,096
|
1,364
|
815
|
|||||||||
|
Other operating income
|
459
|
417
|
263
|
|||||||||
|
Total other income
|
16,125
|
20,489
|
11,544
|
|||||||||
(Continued on following page)
TRINITY CAPITAL CORPORATION & SUBSIDIARIES
CONSOLIDATED STATEMENTS OF INCOME
Years Ended December 31, 2010, 2009 and 2008
(Amounts in thousands except per share data)
(Continued from previous page)
|
2010
|
2009
|
2008
|
||||||||||
|
Other expenses:
|
||||||||||||
|
Salaries and employee benefits
|
$
|
20,922
|
$
|
20,055
|
$
|
18,870
|
||||||
|
Occupancy
|
4,118
|
3,517
|
3,310
|
|||||||||
|
Data processing
|
3,164
|
2,854
|
2,295
|
|||||||||
|
Marketing
|
1,317
|
1,564
|
2,056
|
|||||||||
|
Amortization and valuation of mortgage servicing rights
|
1,848
|
1,740
|
4,193
|
|||||||||
|
Amortization and valuation of other intangible assets
|
478
|
296
|
44
|
|||||||||
|
Supplies
|
438
|
698
|
440
|
|||||||||
|
Loss on sale of other real estate owned
|
3,886
|
1,128
|
132
|
|||||||||
|
Postage
|
626
|
567
|
623
|
|||||||||
|
Bankcard and ATM network fees
|
1,221
|
1,343
|
1,241
|
|||||||||
|
Legal, professional and accounting fees
|
2,983
|
3,023
|
1,538
|
|||||||||
|
FDIC insurance premiums
|
3,265
|
3,285
|
682
|
|||||||||
|
Collection expenses
|
1,806
|
608
|
364
|
|||||||||
|
Other
|
2,534
|
2,639
|
2,255
|
|||||||||
|
Total other expense
|
48,606
|
43,317
|
38,043
|
|||||||||
|
Income before provision for income taxes
|
1,943
|
4,939
|
12,582
|
|||||||||
|
Provision for income taxes
|
260
|
1,763
|
4,583
|
|||||||||
|
Net income
|
$
|
1,683
|
$
|
3,176
|
$
|
7,999
|
||||||
|
Dividends and discount accretion on preferred shares
|
2,127
|
1,604
|
-
|
|||||||||
|
Net (loss) income available to common shareholders
|
$
|
(444
|
)
|
$
|
1,572
|
$
|
7,999
|
|||||
|
Basic earnings per common share
|
$
|
(0.07
|
)
|
$
|
0.24
|
$
|
1.23
|
|||||
|
Diluted earnings per common share
|
$
|
(0.07
|
)
|
$
|
0.24
|
$
|
1.23
|
|||||
The accompanying notes are an integral part of these consolidated financial statements.
CONSOLIDATED STATEMENTS OF CHANGES IN STOCKHOLDERS’ EQUITY
Years Ended December 31, 2010, 2009 and 2008
(Amounts in thousands except share and per share data)
|
Common Stock
|
Preferred Stock
|
Additional Paid-In Capital
|
Retained Earnings
|
Accumulated Other Comprehensive Income (Loss)
|
Total
|
|||||||||||||||||||||||
|
Issued
|
Held in Treasury
|
|||||||||||||||||||||||||||
|
Balance,
December 31, 2007
|
$
|
6,836
|
$
|
(9,667
|
)
|
$
|
0
|
$
|
1,520
|
$
|
72,610
|
$
|
72
|
$
|
71,371
|
|||||||||||||
|
Comprehensive income
|
||||||||||||||||||||||||||||
|
Net income
|
7,999
|
|||||||||||||||||||||||||||
|
Net change in unrealized gain on investment securities, available-for-sale, net of taxes of $1,086
|
1,698
|
|||||||||||||||||||||||||||
|
Reclassification of unrealized gains to realized gains, net of taxes of $204
|
(351
|
)
|
||||||||||||||||||||||||||
|
Total comprehensive income
|
9,346
|
|||||||||||||||||||||||||||
|
Dividends
|
(14
|
)
|
(5,156
|
)
|
(5,170
|
)
|
||||||||||||||||||||||
|
Treasury shares purchased
|
(1,802
|
)
|
(1,802
|
)
|
||||||||||||||||||||||||
|
Treasury shares issued
|
364
|
(84
|
)
|
280
|
||||||||||||||||||||||||
|
Tax benefit from the exercise of stock options
|
43
|
43
|
||||||||||||||||||||||||||
|
Decrease in stock owned by ESOP participants, 23,088 shares
|
623
|
623
|
||||||||||||||||||||||||||
|
Net change in the fair value of stock owned by ESOP participants
|
3,157
|
3,157
|
||||||||||||||||||||||||||
|
Allocation of ESOP shares
|
112
|
112
|
||||||||||||||||||||||||||
|
Stock options and stock appreciation rights expensed
|
220
|
220
|
||||||||||||||||||||||||||
|
Balance,
December 31, 2008
|
$
|
6,836
|
$
|
(11,105
|
)
|
$
|
0
|
$
|
1,797
|
$
|
79,233
|
$
|
1,419
|
$
|
78,180
|
|||||||||||||
(Continued on following page)
TRINITY CAPITAL CORPORATION & SUBSIDIARIES
CONSOLIDATED STATEMENTS OF CHANGES IN STOCKHOLDERS’ EQUITY
Years Ended December 31, 2010, 2009 and 2008
(Amounts in thousands except share and per share data)
(Continued from previous page)
|
Common Stock
|
Preferred Stock
|
Additional Paid-In Capital
|
Retained Earnings
|
Accumulated Other Comprehensive Income (Loss)
|
Total
|
|||||||||||||||||||||||
|
Issued
|
Held in Treasury
|
|||||||||||||||||||||||||||
|
Balance,
December 31, 2008
|
$
|
6,836
|
$
|
(11,105
|
)
|
$
|
0
|
$
|
1,797
|
$
|
79,233
|
$
|
1,419
|
$
|
78,180
|
|||||||||||||
|
Comprehensive income
|
||||||||||||||||||||||||||||
|
Net income
|
3,176
|
|||||||||||||||||||||||||||
|
Net change in unrealized gain on investment securities, available-for-sale, net of taxes of $137
|
210
|
|||||||||||||||||||||||||||
|
Reclassification of unrealized gains to realized gains, net of taxes of $1,056
|
(1,487
|
)
|
||||||||||||||||||||||||||
|
Total comprehensive income
|
1,899
|
|||||||||||||||||||||||||||
|
Dividends declared on common shares
|
(4,315
|
)
|
(4,315
|
)
|
||||||||||||||||||||||||
|
Dividends declared on preferred shares
|
(1,469
|
)
|
(1,469
|
)
|
||||||||||||||||||||||||
|
Issuance of preferred stock, series A
|
33,437
|
33,437
|
||||||||||||||||||||||||||
|
Issuance of preferred stock, series B
|
2,102
|
2,102
|
||||||||||||||||||||||||||
|
Amortization of preferred stock issuance costs
|
135
|
(135
|
)
|
0
|
||||||||||||||||||||||||
|
Treasury shares purchased
|
(473
|
)
|
(473
|
)
|
||||||||||||||||||||||||
|
Treasury shares issued
|
364
|
(85
|
)
|
279
|
||||||||||||||||||||||||
|
Tax benefit from the exercise of stock options
|
10
|
10
|
||||||||||||||||||||||||||
|
Increase in stock owned by ESOP participants, 24,516
|
(533
|
)
|
(533
|
)
|
||||||||||||||||||||||||
|
Net change in the fair value of stock owned by ESOP participants
|
1,097
|
1,097
|
||||||||||||||||||||||||||
|
Stock options and stock appreciation rights expensed
|
147
|
147
|
||||||||||||||||||||||||||
|
Balance,
December 31, 2009
|
$
|
6,836
|
$
|
(11,214
|
)
|
$
|
35,674
|
$
|
1,869
|
$
|
77,054
|
$
|
142
|
$
|
110,361
|
|||||||||||||
(Continued on following page)
TRINITY CAPITAL CORPORATION & SUBSIDIARIES
CONSOLIDATED STATEMENTS OF CHANGES IN STOCKHOLDERS’ EQUITY
Years Ended December 31, 2010, 2009 and 2008
(Amounts in thousands except share and per share data)
(Continued from previous page)
|
Common Stock
|
Preferred Stock
|
Additional Paid-In Capital
|
Retained Earnings
|
Accumulated Other Comprehensive Income (Loss)
|
Total
|
|||||||||||||||||||||||
|
Issued
|
Held in Treasury
|
|||||||||||||||||||||||||||
|
Balance,
December 31, 2009
|
$
|
6,836
|
$
|
(11,214
|
)
|
$
|
35,674
|
$
|
1,869
|
$
|
77,054
|
$
|
142
|
$
|
110,361
|
|||||||||||||
|
Comprehensive income
|
||||||||||||||||||||||||||||
|
Net income
|
1,683
|
|||||||||||||||||||||||||||
|
Net change in unrealized gain on investment securities, available-for-sale, net of taxes of $314
|
644
|
|||||||||||||||||||||||||||
|
Reclassification of unrealized gains to realized gains, net of taxes of $15
|
(94
|
)
|
||||||||||||||||||||||||||
|
Total comprehensive income
|
2,233
|
|||||||||||||||||||||||||||
|
Dividends declared on preferred shares
|
(1,949
|
)
|
(1,949
|
)
|
||||||||||||||||||||||||
|
Amortization of preferred stock issuance costs
|
178
|
(178
|
)
|
0
|
||||||||||||||||||||||||
|
Treasury shares purchased
|
(9
|
)
|
(9
|
)
|
||||||||||||||||||||||||
|
Treasury shares issued
|
249
|
(115
|
)
|
134
|
||||||||||||||||||||||||
|
Increase in stock owned by ESOP participants, 1,884
|
(38
|
)
|
(38
|
)
|
||||||||||||||||||||||||
|
Net change in the fair value of stock owned by ESOP participants
|
6,446
|
6,446
|
||||||||||||||||||||||||||
|
Stock options and stock appreciation rights expensed
|
145
|
145
|
||||||||||||||||||||||||||
|
Balance,
December 31, 2010
|
$
|
6,836
|
$
|
(10,974
|
)
|
$
|
35,852
|
$
|
1,899
|
$
|
83,018
|
$
|
692
|
$
|
117,323
|
|||||||||||||
The accompanying notes are an integral part of these consolidated financial statements.
Years Ended December 31, 2010, 2009 and 2008
(Amounts in thousands)
|
2010
|
2009
|
2008
|
||||||||||
|
Cash Flows From Operating Activities
|
||||||||||||
|
Net income
|
$
|
1,683
|
$
|
3,176
|
$
|
7,999
|
||||||
|
Adjustments to reconcile net income to net cash provided by operating activities:
|
||||||||||||
|
Depreciation and amortization
|
3,040
|
2,660
|
2,409
|
|||||||||
|
Net amortization of:
|
||||||||||||
|
Mortgage servicing rights
|
1,656
|
2,499
|
2,740
|
|||||||||
|
Other intangible assets
|
493
|
296
|
44
|
|||||||||
|
Premium and discounts on investment securities, net
|
1,174
|
29
|
1,176
|
|||||||||
|
Junior subordinated debt owed to unconsolidated trusts issuance costs
|
14
|
14
|
14
|
|||||||||
|
Provision for loan losses
|
20,258
|
26,024
|
8,183
|
|||||||||
|
Change in mortgage servicing rights valuation allowance
|
192
|
(759
|
)
|
1,453
|
||||||||
|
Loss on disposal of premises and equipment
|
13
|
3
|
1
|
|||||||||
|
Gain on sale of investment securities
|
(109
|
)
|
(2,543
|
)
|
(555
|
)
|
||||||
|
Federal Home Loan Bank (FHLB) stock dividends received
|
(10
|
)
|
(6
|
)
|
(102
|
)
|
||||||
|
Loss on venture capital investments
|
554
|
286
|
113
|
|||||||||
|
Gain on sale of loans
|
(5,473
|
)
|
(7,766
|
)
|
(2,027
|
)
|
||||||
|
Loss on disposal of other real estate owned
|
1,994
|
721
|
71
|
|||||||||
|
Write-down of value of other real estate owned
|
1,931
|
283
|
80
|
|||||||||
|
Decrease (increase) in other assets
|
177
|
(10,774
|
)
|
(2,260
|
)
|
|||||||
|
(Decrease) increase in other liabilities
|
(953
|
)
|
1,183
|
(1,061
|
)
|
|||||||
|
Release of Employee Stock Ownership Plan (ESOP) shares
|
-
|
-
|
340
|
|||||||||
|
Stock options and stock appreciation rights expenses
|
145
|
147
|
220
|
|||||||||
|
Tax benefit recognized for exercise of stock options
|
-
|
(10
|
)
|
(43
|
)
|
|||||||
|
Net cash provided by operating activities before originations and gross sales of loans
|
26,779
|
15,463
|
18,795
|
|||||||||
|
Gross sales of loans held for sale
|
213,177
|
400,072
|
131,165
|
|||||||||
|
Origination of loans held for sale
|
(225,700
|
)
|
(397,064
|
)
|
(128,967
|
)
|
||||||
|
Net cash provided by operating activities
|
14,256
|
18,471
|
20,993
|
|||||||||
(Continued on following page)
TRINITY CAPITAL CORPORATION & SUBSIDIARIES
CONSOLIDATED STATEMENTS OF CASH FLOWS
Years Ended December 31, 2010, 2009 and 2008
(Amounts in thousands)
(Continued from previous page)
|
2010
|
2009
|
2008
|
||||||||||
|
Cash Flows From Investing Activities
|
||||||||||||
|
Proceeds from maturities and paydowns of investment securities, available for sale
|
$
|
126,828
|
$
|
11,241
|
$
|
67,313
|
||||||
|
Proceeds from maturities and paydowns of investment securities, held to maturity
|
329
|
258
|
232
|
|||||||||
|
Proceeds from maturities and paydowns of investment securities, other
|
171
|
731
|
1,829
|
|||||||||
|
Proceeds from sale of investment securities, available for sale
|
4,115
|
95,894
|
48,980
|
|||||||||
|
Purchase of investment securities available for sale
|
(156,993
|
)
|
(140,480
|
)
|
(118,102
|
)
|
||||||
|
Purchase of investment securities held to maturity
|
-
|
(2,766
|
)
|
-
|
||||||||
|
Purchase of investment securities other
|
(482
|
)
|
(4,936
|
)
|
(103
|
)
|
||||||
|
Proceeds from sale of other real estate owned
|
16,128
|
9,556
|
1,890
|
|||||||||
|
Loans funded, net of repayments
|
8,645
|
(49,857
|
)
|
(68,951
|
)
|
|||||||
|
Purchases of loans
|
-
|
(1,101
|
)
|
-
|
||||||||
|
Purchases of premises and equipment
|
(1,368
|
)
|
(10,206
|
)
|
(2,745
|
)
|
||||||
|
Acquisition of intangible assets
|
(209
|
)
|
(367
|
)
|
(800
|
)
|
||||||
|
Net cash (used in) investing activities
|
(2,836
|
)
|
(92,033
|
)
|
(70,457
|
)
|
||||||
|
Cash Flows From Financing Activities
|
||||||||||||
|
Net (decrease) increase in demand deposits, NOW accounts and savings accounts
|
(28,622
|
)
|
124,730
|
85,182
|
||||||||
|
Net (decrease) increase in time deposits
|
(81,478
|
)
|
92,121
|
(9,046
|
)
|
|||||||
|
Proceeds from issuances of borrowings
|
20,000
|
30,000
|
-
|
|||||||||
|
Repayment of borrowings
|
(20,041
|
)
|
(20,039
|
)
|
(40,037
|
)
|
||||||
|
Repayment of ESOP debt
|
-
|
-
|
(271
|
)
|
||||||||
|
Purchase of treasury stock
|
(9
|
)
|
(473
|
)
|
(1,802
|
)
|
||||||
|
Issuance of common stock for stock option plan and employee stock ownership plan
|
134
|
289
|
323
|
|||||||||
|
Issuance of preferred stock
|
-
|
35,539
|
-
|
|||||||||
|
Common shares dividend payments
|
(1,739
|
)
|
(5,155
|
)
|
(5,190
|
)
|
||||||
|
Preferred shares dividend payments
|
(969
|
)
|
(1,227
|
)
|
-
|
|||||||
|
Tax benefit recognized for exercise of stock options
|
-
|
10
|
43
|
|||||||||
|
Net cash (used in) provided by financing activities
|
(112,724
|
)
|
255,795
|
29,202
|
||||||||
|
Net (decrease) increase in cash and cash equivalents
|
(101,304
|
)
|
182,233
|
(20,262
|
)
|
|||||||
|
Cash and cash equivalents:
|
||||||||||||
|
Beginning of period
|
207,495
|
25,262
|
45,524
|
|||||||||
|
End of period
|
$
|
106,191
|
$
|
207,495
|
$
|
25,262
|
||||||
(Continued on following page)
TRINITY CAPITAL CORPORATION & SUBSIDIARIES
CONSOLIDATED STATEMENTS OF CASH FLOWS
Years Ended December 31, 2010, 2009 and 2008
(Amounts in thousands)
(Continued from previous page)
|
2010
|
2009
|
2008
|
||||||||||
|
Supplemental Disclosures of Cash Flow Information
|
||||||||||||
|
Cash payments for:
|
||||||||||||
|
Interest
|
$
|
17,980
|
$
|
24,760
|
$
|
36,836
|
||||||
|
Income taxes
|
441
|
4,797
|
7,758
|
|||||||||
|
Non-cash investing and financing activities:
|
||||||||||||
|
Transfers from loans to other real estate owned
|
25,163
|
24,956
|
3,037
|
|||||||||
|
Dividends declared, not yet paid
|
1,223
|
1,981
|
2,579
|
|||||||||
|
Change in unrealized gain on investment securities, net of taxes
|
550
|
(1,277
|
)
|
2,229
|
||||||||
The accompanying notes are an integral part of these consolidated financial statements.
Note 1. Significant Accounting Policies
Consolidation: The accompanying consolidated financial statements include the consolidated balances and results of operations of Trinity Capital Corporation (“Trinity”) and its wholly owned subsidiaries: Los Alamos National Bank (the “Bank”), Title Guaranty & Insurance Company (“Title Guaranty”), TCC Advisors Corporation (“TCC Advisors”) and TCC Funds, collectively referred to as the “Company.” Trinity Capital Trust I (“Trust I”), Trinity Capital Trust III (“Trust III”), Trinity Capital Trust IV (“Trust IV”) and Trinity Capital Trust V (“Trust V”), collectively referred to as the “Trusts,” are trust subsidiaries of Trinity but are not consolidated in these financial statements (see “Consolidation” accounting policy below). The Bank holds a 24% interest in Cottonwood Technology Group, LLC (“Cottonwood”). Cottonwood is owned by the Bank, the Los Alamos Commerce & Development Corporation and an individual not otherwise associated with Trinity or the Bank. Cottonwood completed the initial close on a pre-seed and seed stage investment fund in October 2009 and is focused on assisting new technologies, primarily those developed at New Mexico’s research and educational institutions, reach the market by providing management advice and capital consulting. The Bank’s full capital investment of $150 thousand was made in July 2009 and is reflected in these financial statements. In October 2008, the Bank purchased the assets of Allocca & Brunett, Inc., an investment advisory company in Santa Fe, New Mexico. As of December 31, 2010, all assets have been transferred to the Bank. In 2009, the Bank created Finance New Mexico Investment Fund IV, LLC (“FNM Investment Fund IV”) and is the only member. FNM Investment Fund IV was created to acquire a 99.99% interest in FNM Investor Series IV, LLC (“FNM Investor Series IV”), 0.01% interest in which is held by Finance New Mexico, a governmental instrumentality. These entities were both created to enable the funding of loans to, and investments in, a New Market Tax Credit project. The initial value of these tax credits was $1.9 million. As of December 31, 2010, the amortized amount of the new market tax credit was $1.5 million and is included in “other investments” on the balance sheet. The initial amount of the loan was $5.2 million. As of December 31, 2010, the current outstanding loan amount was $5.2 million and is included in “loans, net” on the balance sheet. In April 2010, the Bank activated TCC Advisors as a business unit operating one of the Bank’s foreclosed properties, Santa Fe Equestrian Park, in Santa Fe, New Mexico. The size of the initial investment was $322 thousand. As of December 31, 2010, the total investment was $572 thousand and is included in “other investments” on the balance sheet. In September of 2010, the Bank joined Southwest Medical Technologies, LLC (“SWMT”) as a 20% member. Participation in this entity is part of the Bank's venture capital investments. This entity is owned by the Bank (20%), Southwest Medical Ventures, Inc. (60%), and New Mexico Co-Investment Fund II, L.P. (20%). SWMT is focused on assisting new medical and life science technologies identify investment and financing opportunities. The Bank’s total capital investment will be $250 thousand. As of December 31, 2010, the investment in SWMT was $36 thousand and is included in “other investments” on the balance sheet.
Basis of financial statement presentation: The consolidated financial statements include the accounts of the Company and its subsidiaries. Significant intercompany items and transactions have been eliminated in consolidation. The accounting and reporting policies of the Company conform to accounting principles generally accepted in the United States of America and general practices within the financial services industry. In accordance with applicable accounting standards, the Company does not consolidate statutory trusts established for the sole purpose of issuing trust preferred securities and related trust common securities. See Note 11 below for more detail. In preparing the financial statements, management is required to make estimates and assumptions that affect the reported amounts of assets and liabilities as of the date of the balance sheet and revenues and expenses for the year. Actual results could differ from those estimates. Areas involving the use of management’s estimates and assumptions, which are more susceptible to change in the near term, include the allowance for loan losses, initial recording and subsequent valuation for impairment of mortgage servicing rights, income tax accounting, and other intangible asset impairment analysis.
Nature of operations: The Company provides a variety of financial services to individuals, businesses and government organizations through its offices in Los Alamos, Santa Fe and Albuquerque, New Mexico. Its primary deposit products are term certificate, NOW and savings accounts and its primary lending products are commercial, residential and construction real estate loans. The Company also offers trust and wealth management services and title insurance products.
The Bank conducts its operations from its main office in Los Alamos and separate office locations in Albuquerque, Santa Fe and White Rock, New Mexico. The Bank also operates drive-up facilities and 30 automatic teller machines (ATM’s) in Los Alamos, Santa Fe and surrounding geographic areas. Title Guaranty conducts its operations from its offices in Los Alamos and Santa Fe.
Deposits with banks, federal funds sold and securities purchased under resell agreements: For purposes of reporting cash flows, cash and cash equivalents includes cash on hand, amounts due from banks (including cash items in process of clearing), interest-bearing deposits with banks and federal funds sold.
Investment securities available for sale: Securities classified as available for sale are debt securities the Bank intends to hold for an indefinite period of time, but not necessarily to maturity. Any decision to sell a security classified as available for sale would be based on various factors, including significant movements in interest rates, changes in the maturity mix of the Bank's assets and liabilities, liquidity needs, regulatory capital considerations and other similar factors. Securities available for sale are reported at fair value with unrealized gains or losses reported as other comprehensive income, net of the related deferred tax effect. Realized gains or losses, determined on the basis of the cost of specific securities sold, are included in earnings.
Purchase premiums and discounts are generally recognized in interest income using the interest method over the term of the securities. For mortgage-backed securities, estimates of prepayments are considered in the constant yield calculations.
Declines in the fair value of individual securities classified as available for sale below their amortized cost that are determined to be other than temporary (OTTI) result in write-downs of the individual securities to their fair value with the resulting write-downs included in current earnings as realized losses. Impairment is assessed at the individual security level. An investment security is impaired if the fair value of the security is less than its amortized cost basis. Once the security is impaired, a determination must be made to see if it is OTTI.
In determining OTTI losses, management considers many factors, including: current market conditions, fair value in relationship to cost; extent and nature of the change in fair value; issuer rating changes and trends; whether it intends to sell the security before recovery of the amortized cost basis of the investment, which may be maturity; and other factors. For debt securities, if management intends to sell the security or it is likely that the Bank will be required to sell the security before recovering its cost basis, the entire impairment loss would be recognized in earnings as an OTTI. If management does not intend to sell the security and it is not likely that the Bank will be required to sell the security, but management does not expect to recover the entire amortized cost basis of the security, only the portion of the impairment loss representing credit losses would be recognized in earnings. The credit loss on a security is measured as the difference between the amortized cost basis and the present value of the cash flows expected to be collected. Project cash flows are discounted by the original or current effective interest rate depending on the nature of the security being measured for potential OTTI. The remaining impairment related to all other factors, i.e., the difference between the present value of the cash flows expected to be collected and fair value, is recognized as a charge to other comprehensive income. Impairment losses related to all other factors are presented as separate categories within other comprehensive income.
Investment securities held to maturity: Securities classified as held to maturity are those securities that the Company has the ability and positive intent to hold until maturity. These securities are reported at amortized cost. Sales of investment securities held to maturity within three months of maturity are treated as maturities.
Other investments: The Bank, as a member of the Federal Home Loan Bank of Dallas (the “FHLB”), is required to maintain an investment in capital stock of the FHLB based upon borrowings made from the FHLB and based upon various classes of loans in the Bank’s portfolio. FHLB and Federal Reserve Bank stock do not have readily determinable fair values as ownership is restricted and it lacks a market. As a result, these stocks are carried at cost and evaluated periodically by management for impairment.
The Company’s investment in the unconsolidated trusts is also reported as an investment in this line of the balance sheet. Also included is the Bank’s investment in certain venture capital funds. In addition, the Bank has other non-marketable investments that are carried at cost and evaluated periodically by management for impairment. Investments with fair values that are less than amortized cost are considered impaired. Impairment may result from either a decline in the financial condition of the issuing entity or, in the case of fixed rate investments, from rising interest rates. At each financial statement date, management assesses each investment to determine if impaired investments are temporarily impaired or if the impairment is other than temporary based upon the evidence available. Evidence evaluated includes (if applicable), but is not limited to, industry analyst reports, credit market conditions, and interest rate trends. If negative evidence outweighs positive evidence that the carrying amount is recoverable within a reasonable period of time, the impairment is deemed to be other-than-temporary and the security is written down in the period in which such determination is made.
Loans held for sale: Loans held for sale are those loans the Company intends to sell. They are carried at the lower of aggregate cost or market value. Gains and losses on sales of loans are recognized at settlement dates and are determined by the difference between the sales proceeds plus the value of the mortgage servicing rights compared to the carrying value of the loans. These are generally sold within 30 to 60 days of origination.
Loans: Loans are stated at the amount of unpaid principal reduced by the allowance for loan losses and unearned income.
Loan origination and commitment fees and certain direct loan origination costs are deferred and the net amount amortized as an adjustment of the related loan’s yield. The Company is amortizing these amounts over the estimated life of the loan. Commitment fees based upon a percentage of a customer’s unused line of credit and fees related to standby letters of credit are recognized over the commitment period. Net deferred fees on real estate loans sold in the secondary market reduce the cost basis in such loans.
Interest on loans is accrued and reported as income using the interest method on daily principal balances outstanding. The Bank generally discontinues accruing interest on loans when the loan becomes 90 days or more past due or when management believes that the borrower’s financial condition is such that collection of interest is doubtful. Cash collections on nonaccrual loans are credited to the loan balance, and no interest income is recognized on those loans until the principal balance has been determined to be collectible.
A loan is classified as a troubled debt restructuring when a borrower is experiencing financial difficulties that leads to a restructuring of the loan, and the Company grants concessions to the borrower in the restructuring that it would not otherwise consider. These concessions may include rate reductions, principal forgiveness, extension of maturity date and other actions intended to minimize potential losses. A loan that is modified at a market rate of interest may no longer be classified as troubled debt restructuring in the calendar year subsequent to the restructuring if it is in compliance with the modified terms. Performance prior to the restructuring is considered when assessing whether the borrower can meet the new terms and may result in the loan being returned to accrual at the time of the restructuring or after a shorter performance period.
Loans, other than those included in large groups of smaller-balance homogeneous loans, are considered impaired when it is probable the Company will be unable to collect all contractual principal and interest payments due in accordance with the terms of the loan agreement. Impaired loans are measured based on the present value of expected future cash flows discounted at the loan’s effective interest rate or, as a practical expedient, at the loan’s observable market price or the fair value of the collateral if the loan is collateral dependent. The amount of impairment (if any) and any subsequent changes are included in the allowance for loan losses.
The allowance for loan losses is established through a provision for loan losses charged to expense. Loans are charged against the allowance for loan losses when management believes that collectability of the principal is unlikely. The allowance is an amount that management believes will be adequate to absorb probable losses on existing loans, based on an evaluation of the collectability of loans in the portfolio and prior loss experience. The allowance for loan losses is based on management’s evaluation of the loan portfolio giving consideration to the nature and volume of the loan portfolio, the value of underlying collateral, overall portfolio quality, review of specific problem loans, and prevailing economic conditions that may affect the borrower’s ability to pay. While management uses the best information available to make its evaluation, future adjustments to the allowance may be necessary if there are significant changes in economic conditions. In addition, regulatory agencies, as an integral part of their examination process, periodically review the subsidiary Bank’s allowance for loan losses, and may require the subsidiary bank to recognize additions to its allowance based on their judgments of information available to them at the time of their examinations.
Premises and equipment: Premises and equipment are carried at cost less accumulated depreciation and amortization. Depreciation and amortization is computed by the straight-line method for buildings and computer equipment over their estimated useful lives. Leasehold improvements are amortized over the term of the related lease or the estimated useful lives of the improvements, whichever is shorter. For owned and capitalized assets, estimated useful lives range from three to 39 years. Maintenance and repairs are charged to expense as incurred, while major improvements are capitalized and amortized to operating expense over their identified useful life. Generally, the useful life on software is three years; on computer and office equipment, five years; on furniture, 10 years; and on building and building improvements, 10 to 39 years.
Other real estate owned (“OREO”): OREO includes real estate assets that have been received in full or partial satisfaction of debt. OREO is initially recorded at fair value, less estimated selling costs, establishing a new cost basis and subsequently carried at lower of cost basis or fair value less estimated selling costs. Any valuation adjustments required at the date of transfer are charged to the allowance for loan losses. Subsequently, unrealized losses and realized gains and losses on sale are included in other non-interest income. Operating results from OREO are recorded in other non-interest expense.
Mortgage servicing rights: The Bank recognizes, as separate assets, rights to service mortgage loans for others, whether the rights are acquired through purchase or after origination and sale of mortgage loans. In cases where the mortgage loan is originated and sold, the total cost of the mortgage loan is allocated to the mortgage servicing right and to the loan based on their relative fair values.
The carrying amount of mortgage servicing rights, and the amortization thereon, is periodically evaluated in relation to estimated fair value. The Bank stratifies the underlying mortgage loan portfolio by certain risk characteristics, such as loan type, interest rate and maturity, for purposes of measuring impairment. The Bank estimates the fair value of each stratum by calculating the discounted present value of future net servicing income based on management’s best estimate of remaining loan lives. The Bank has determined that the primary risk characteristic of the mortgage servicing rights is the contractual interest rate of the underlying mortgage loans.
The carrying value of mortgage servicing rights is amortized in proportion to, and over the period of, estimated net servicing revenues.
Other intangible assets. The Company may obtain intangible assets other than mortgage servicing rights from time to time. In certain cases, these assets have no definite life and are not amortized. Other intangible assets may have an expected useful life and are amortized over this life. All intangible assets are tested periodically for impairment and, if deemed impaired, the assets are written down to the current value, with the impairment amount being charged to current earnings.
Prepaid expenses. The Company may pay certain expenses before the actual costs are incurred. In this case, these expenses are recognized as an asset. These expenses are amortized as expense over the period of time in which the costs are incurred. The original term of these prepaid expenses generally range from three months to five years. The most significant single prepaid expense as of December 31, 2010, was a $4.5 million prepaid FDIC insurance premium to be amortized over a period of two years ending in 2012.
Earnings per common share: Basic earnings per share represent income available to common stockholders divided by the weighted-average number of common shares outstanding during the period. Diluted earnings per common share were determined assuming that all stock options were exercised at the beginning of the years presented. Unearned shares owned by the Employee Stock Ownership Plan (ESOP) are treated as not outstanding for the purposes of computing basic earnings per common share.
Average number of shares used in calculation of earnings per common share and diluted earnings per common share are as follows:
|
2010
|
2009
|
2008
|
||||||||||
|
(In thousands, except share and per share data)
|
||||||||||||
|
Net income
|
$
|
1,683
|
$
|
3,176
|
$
|
7,999
|
||||||
|
Dividends and discount accretion on preferred shares
|
2,127
|
1,604
|
-
|
|||||||||
|
Net income available to common shareholders
|
$
|
(444
|
)
|
$
|
1,572
|
$
|
7,999
|
|||||
|
Weighted average common shares issued
|
6,856,800
|
6,856,800
|
6,856,800
|
|||||||||
|
LESS: Weighted average treasury stock shares
|
(411,258
|
)
|
(412,532
|
)
|
(377,803
|
)
|
||||||
|
LESS: Weighted average unearned Employee Stock Ownership Plan (ESOP) stock shares
|
-
|
-
|
(602
|
)
|
||||||||
|
Weighted average common shares outstanding, net
|
6,445,542
|
6,444,268
|
6,478,395
|
|||||||||
|
Basic (loss) earnings per common share
|
$
|
(0.07
|
)
|
$
|
0.24
|
$
|
1.23
|
|||||
|
Weighted average dilutive shares from stock option plan
|
-
|
4,866
|
19,816
|
|||||||||
|
Weighted average common shares outstanding including derivative shares
|
6,445,542
|
6,449,134
|
6,498,211
|
|||||||||
|
Diluted (loss) earnings per common share
|
$
|
(0.07
|
)
|
$
|
0.24
|
$
|
1.23
|
|||||
Certain stock options were not included in the above calculation, as these stock options would have an anti-dilutive effect as the exercise price is greater than current market prices. The total number of shares excluded was 384,500, 356,500 and 314,500 as of December 31, 2010, 2009 and 2008, respectively.
Comprehensive income: Comprehensive income includes net income, as well as the change in net unrealized gain on investment securities available for sale, net of tax. Comprehensive income is presented in the following table:
|
2010
|
2009
|
2008
|
||||||||||
|
(In thousands)
|
||||||||||||
|
Net income
|
$
|
1,683
|
$
|
3,176
|
$
|
7,999
|
||||||
|
Securities available for sale:
|
||||||||||||
|
Net change in unrealized gains
|
958
|
347
|
2,784
|
|||||||||
|
Related income tax expense
|
(314
|
)
|
(137
|
)
|
(1,086
|
)
|
||||||
|
Net securities gains reclassified into earnings
|
(109
|
)
|
(2,543
|
)
|
(555
|
)
|
||||||
|
Related income tax benefit
|
15
|
1,056
|
204
|
|||||||||
|
Net effect on other comprehensive income for the period
|
550
|
(1,277
|
)
|
1,347
|
||||||||
|
Comprehensive income
|
$
|
2,233
|
$
|
1,899
|
$
|
9,346
|
||||||
Segment reporting: The Company is managed as one unit and does not have separate operating segments. The Company’s chief operating decision-makers use consolidated results to make operating and strategic decisions.
Transfers of financial assets: Transfers of financial assets are accounted for as sales only when the control over the financial assets has been surrendered. Control over transferred assets is deemed surrendered when (1) the assets have been isolated from the Company, (2) the transferee obtains the right (free of conditions that constrain it from taking advantage of the right) to pledge or exchange the transferred assets, and (3) the Company does not maintain effective control over the transferred assets through an agreement to repurchase them before their maturity.
Impairment of long-lived assets: Management periodically reviews the carrying value of its long-lived assets to determine if impairment has occurred or whether changes in circumstances have occurred that would require a revision to the remaining useful life. In making such determination, management evaluates the performance, on an undiscounted basis, of the underlying operations or assets which give rise to such amount.
Income taxes: Deferred taxes are provided on a liability method whereby deferred tax assets are recognized for deductible temporary differences and operating loss carryforwards, and tax credit carryforwards and deferred tax liabilities are recognized for taxable temporary differences. Temporary differences are the differences between the reported amounts of assets and liabilities and their tax bases. Deferred tax assets are reduced by a valuation allowance when, in the opinion of management, it is more likely than not that some portion or all of the deferred tax assets will not be realized. Deferred tax assets and liabilities are adjusted for the effects of changes in tax laws and rates on the date of enactment. A valuation allowance is provided when it is more likely than not that some portion or all of the net deferred tax assets will not be realized. The Company files a consolidated U.S. federal and New Mexico income tax return.
ASC Topic 740, “Accounting for Income Taxes” provides the Company should recognize the tax benefit from uncertain tax positions if it is more likely than not that the tax positions will be sustained on examination by the tax authorities, based on the technical merits of the position. The tax benefit is measured based on the largest benefit that has a greater than 50% likelihood of being realized upon ultimate settlement.
Stock-based compensation: The Company’s 1998 Stock Option Plan (“1998 Plan”) and Trinity Capital Corporation 2005 Stock Incentive Plan (“2005 Plan”) were created for the benefit of key management and select employees. Under the 1998 Plan, 400,000 shares (as adjusted for the stock split of December 19, 2002) from shares held in treasury or authorized but unissued common stock are reserved for granting options. Under the 2005 Plan, 500,000 shares from shares held in treasury or authorized but unissued common stock are reserved for granting stock-based incentive awards. Both of these plans were approved by the Company’s shareholders. The Board of Directors determines vesting and pricing of the awards. All stock options granted through December 31, 2005 were granted at or above the market value of the stock at the date of the grant, with the exception of the July 1998 stock option grant which was granted at $0.25 below the last reported sale price on the date of grant. All stock options vest in equal amounts over a three year period and must be exercised within ten years of the date of grant. Stock appreciation rights granted after December 31, 2005 were also granted at or above the market value of the stock at the date of the grant, with the exception of the January 1, 2006 stock appreciation right grants which were approved on December 15, 2005 and granted at the December 31, 2005 closing price to take advantage of accounting changes favorable to Trinity; all mature at five years.
Preferred stock: Preferred stock callable at the option of the Company is initially recorded at the amount of proceeds received. Any discount from the liquidation value is accreted to the preferred stock and charged to retained earnings. The accretion is recorded using the level-yield method. Preferred dividends paid (declared and accrued) and any accretion is deducted from net income for computing income available to common shareholders and earnings per share computations.
Recent accounting pronouncements:
ASC Topic 810, “Consolidation.” New authoritative accounting guidance under ASC Topic 810, “Consolidation,” amended prior guidance to change how a company determines when an entity that is insufficiently capitalized or is not controlled through voting (or similar rights) should be consolidated. The determination of whether a company is required to consolidate an entity is based on, among other things, an entity’s purpose and design and a company’s ability to direct the activities of the entity that most significantly impact the entity’s economic performance. The new authoritative accounting guidance requires additional disclosures about the reporting entity’s involvement with variable-interest entities and any significant changes in risk exposure due to that involvement as well as its effect on the entity’s financial statements. The new authoritative accounting guidance under ASC Topic 810 became effective for the Company on January 1, 2010, and did not have an impact on the Company’s financial statements.
ASC Topic 820, “Fair Value Measurements and Disclosures.” New authoritative accounting guidance under ASC Topic 820, “Fair Value Measurements and Disclosures,” amends prior accounting guidance to amend and expand disclosure requirements about transfers in and out of Levels 1 and 2, clarified existing fair value disclosure requirements about the appropriate level of disaggregation, and clarified that a description of valuation techniques and inputs used to measure fair value was required for recurring and nonrecurring Level 2 and 3 fair value measurements. The new authoritative accounting guidance under ASC Topic 820 became effective for the Company on January 1, 2010, except for the disclosures about purchases, sales, issuances, and settlements in the roll forward of activity in Level 3 fair value measurements. Those disclosures are effective for fiscal years beginning after December 15, 2010, and for interim periods within those fiscal years. The new required disclosures are included in Note 21 – Fair Value Measurements.
ASC Topic 860, “Transfers and Servicing.” New authoritative accounting guidance under ASC Topic 860, “Transfers and Servicing,” amends prior accounting guidance to enhance reporting about transfers of financial assets, including securitizations, and where companies have continuing exposure to the risks related to transferred financial assets. The new authoritative accounting guidance eliminates the concept of a “qualifying special-purpose entity” and changes the requirements for derecognizing financial assets. The new authoritative accounting guidance also requires additional disclosures about all continuing involvements with transferred financial assets including information about gains and losses resulting from transfers during the period. The new authoritative accounting guidance under ASC Topic 860 became effective January 1, 2010, and did not have a significant impact on the Company’s financial statements.
ASC Topic 310 “Receivables.” New authoritative accounting guidance under ASC Topic 310, “Receivables,” amended prior guidance to provide a greater level of disaggregated information about the credit quality of loans and leases and the Allowance for Loan and Lease Losses (the “Allowance”). The new authoritative guidance also requires additional disclosures related to credit quality indicators, past due information, and information related to loans modified in a troubled debt restructuring. The new authoritative guidance amends only the disclosure requirements for loans and leases and the allowance. The Company adopted the period end disclosures of the guidance under ASC Topic 310 in the reporting period ending December 31, 2010. Adoption of the new guidance did not have an impact on the Company’s statements of income and financial condition. The disclosures about activity that occurs will be effective for reporting periods after January 31, 2011 and will have no impact on the Company’s statements of income and financial condition.
Note 2. Restrictions on Cash and Due From Banks
The Bank is required to maintain reserve balances in cash or on deposit with the Federal Reserve Bank, based on a percentage of deposits. As of December 31, 2010, the reserve requirement was $2.9 million. As of December 31, 2009, the Bank had sufficient balances in cash and there was no reserve balance requirement at the Federal Reserve Bank.
The Company maintains some of its cash in bank deposit accounts at financial institutions other than its subsidiaries that, at times, may exceed federally insured limits. The Company has not experienced any losses in such accounts. The Company believes it is not exposed to any significant credit risk on cash and cash equivalents.
Note 3. Investment Securities
Amortized cost and fair values of investment securities are summarized as follows:
|
AVAILABLE FOR SALE
|
Amortized Cost
|
Gross Unrealized Gains
|
Gross Unrealized Losses
|
Fair Value
|
||||||||||||
|
(In thousands)
|
||||||||||||||||
|
December 31, 2010
|
||||||||||||||||
|
U.S. government sponsored agencies
|
$
|
42,551
|
$
|
184
|
$
|
-
|
$
|
42,735
|
||||||||
|
States and political subdivisions
|
20,263
|
402
|
(81
|
)
|
20,584
|
|||||||||||
|
Residential mortgage-backed securities
|
98,692
|
1,194
|
(614
|
)
|
99,272
|
|||||||||||
|
Totals
|
$
|
161,506
|
$
|
1,780
|
$
|
(695
|
)
|
$
|
162,591
|
|||||||
|
December 31, 2009
|
||||||||||||||||
|
U.S. government sponsored agencies
|
$
|
68,502
|
$
|
23
|
$
|
(143
|
)
|
$
|
68,382
|
|||||||
|
States and political subdivisions
|
26,112
|
494
|
(87
|
)
|
26,519
|
|||||||||||
|
Residential mortgage-backed securities
|
41,906
|
563
|
(614
|
)
|
41,855
|
|||||||||||
|
Totals
|
$
|
136,520
|
$
|
1,080
|
$
|
(844
|
)
|
$
|
136,756
|
|||||||
|
HELD TO MATURITY
|
Amortized Cost
|
Gross Unrealized Gains
|
Gross Unrealized Losses
|
Fair Value
|
||||||||||||
|
(In thousands)
|
||||||||||||||||
|
December 31, 2010
|
||||||||||||||||
|
States and political subdivisions
|
$
|
11,107
|
$
|
91
|
$
|
(247
|
)
|
$
|
10,951
|
|||||||
|
Totals
|
$
|
11,107
|
$
|
91
|
$
|
(247
|
)
|
$
|
10,951
|
|||||||
|
December 31, 2009
|
||||||||||||||||
|
States and political subdivisions
|
$
|
11,436
|
$
|
-
|
$
|
(628
|
)
|
$
|
10,808
|
|||||||
|
Totals
|
$
|
11,436
|
$
|
-
|
$
|
(628
|
)
|
$
|
10,808
|
|||||||
|
OTHER INVESTMENTS
|
Amortized Cost
|
Gross Unrealized Gains
|
Gross Unrealized Losses
|
Fair Value
|
||||||||||||
|
(In thousands)
|
||||||||||||||||
|
December 31, 2010
|
||||||||||||||||
|
Non-marketable equity securities (including FRB and FHLB stock)
|
$
|
8,219
|
$
|
-
|
$
|
-
|
$
|
8,219
|
||||||||
|
Investment in unconsolidated trusts
|
1,116
|
-
|
-
|
1,116
|
||||||||||||
|
Totals
|
$
|
9,335
|
$
|
-
|
$
|
-
|
$
|
9,335
|
||||||||
|
December 31, 2009
|
||||||||||||||||
|
Non-marketable equity securities (including FRB and FHLB stock)
|
$
|
8,452
|
$
|
-
|
$
|
-
|
$
|
8,452
|
||||||||
|
Investment in unconsolidated trusts
|
1,116
|
-
|
-
|
1,116
|
||||||||||||
|
Totals
|
$
|
9,568
|
$
|
-
|
$
|
-
|
$
|
9,568
|
||||||||
Realized net gains on sale of securities available for sale are summarized as follows:
|
For the Years Ended December 31,
|
||||||||||||
|
2010
|
2009
|
2008
|
||||||||||
|
(In thousands)
|
||||||||||||
|
Gross realized gains
|
$
|
109
|
$
|
2,543
|
$
|
555
|
||||||
|
Gross realized losses
|
-
|
-
|
-
|
|||||||||
|
Net gains
|
$
|
109
|
$
|
2,543
|
$
|
555
|
||||||
A summary of unrealized loss information for investment securities, categorized by security type, at December 31, 2010 and 2009 was as follows:
|
Less than 12 Months
|
12 Months or Longer
|
Total
|
||||||||||||||||||||||
|
AVAILABLE FOR SALE
|
Fair Value
|
Unrealized Losses
|
Fair Value
|
Unrealized Losses
|
Fair Value
|
Unrealized Losses
|
||||||||||||||||||
|
(In thousands)
|
||||||||||||||||||||||||
|
December 31, 2010
|
||||||||||||||||||||||||
|
States and political subdivisions
|
$
|
3,682
|
$
|
(81
|
)
|
$
|
-
|
$
|
-
|
$
|
3,682
|
$
|
(81
|
)
|
||||||||||
|
Residential mortgage-backed securities
|
38,796
|
(614
|
)
|
-
|
-
|
38,796
|
(614
|
)
|
||||||||||||||||
|
Totals
|
$
|
42,478
|
$
|
(695
|
)
|
$
|
-
|
$
|
-
|
$
|
42,478
|
$
|
(695
|
)
|
||||||||||
|
December 31, 2009
|
||||||||||||||||||||||||
|
Government sponsored agencies
|
$
|
25,855
|
$
|
(143
|
)
|
$
|
-
|
$
|
-
|
$
|
25,855
|
$
|
(143
|
)
|
||||||||||
|
States and political subdivisions
|
4,540
|
(87
|
)
|
-
|
-
|
4,540
|
(87
|
)
|
||||||||||||||||
|
Residential mortgage-backed securities
|
20,579
|
(527
|
)
|
1,481
|
(87
|
)
|
22,060
|
(614
|
)
|
|||||||||||||||
|
Totals
|
$
|
50,974
|
$
|
(757
|
)
|
$
|
1,481
|
$
|
(87
|
)
|
$
|
52,455
|
$
|
(844
|
)
|
|||||||||
|
Less than 12 Months
|
12 Months or Longer
|
Total
|
||||||||||||||||||||||
|
HELD TO MATURITY
|
Fair Value
|
Unrealized Losses
|
Fair Value
|
Unrealized Losses
|
Fair Value
|
Unrealized Losses
|
||||||||||||||||||
|
(In thousands)
|
||||||||||||||||||||||||
|
December 31, 2010
|
||||||||||||||||||||||||
|
States and political subdivisions
|
$
|
-
|
$
|
-
|
$
|
1,089
|
$
|
(247
|
)
|
$
|
1,089
|
$
|
(247
|
)
|
||||||||||
|
Totals
|
$
|
-
|
$
|
-
|
$
|
1,089
|
$
|
(247
|
)
|
$
|
1,089
|
$
|
(247
|
)
|
||||||||||
|
December 31, 2009
|
||||||||||||||||||||||||
|
States and political subdivisions
|
$
|
9,937
|
$
|
(297
|
)
|
$
|
1,499
|
$
|
(331
|
)
|
$
|
11,436
|
$
|
(628
|
)
|
|||||||||
|
Totals
|
$
|
9,937
|
$
|
(297
|
)
|
$
|
1,499
|
$
|
(331
|
)
|
$
|
11,436
|
$
|
(628
|
)
|
|||||||||
At December 31, 2010, $44.5 million in debt securities had unrealized losses with aggregate depreciation of 2.1% of the Company’s amortized cost basis. Of these securities, $1.3 million had a continuous unrealized loss position for twelve months or longer with an aggregate depreciation of 18.5%. The unrealized losses relate principally to the general change in interest rates and illiquidity, and not credit quality, that has occurred since the securities purchase dates, and such unrecognized losses or gains will continue to vary with general interest rate level fluctuations in the future. As management does not intend to sell the securities, and it is likely that it will not be required to sell the securities before their anticipated recovery, no declines are deemed to be other-than-temporary.
The amortized cost and fair value of investment securities, as of December 31, 2010, by contractual maturity are shown below. Maturities may differ from contractual maturities because borrowers may have the right to call or prepay obligations with or without penalties.
|
Available for Sale
|
Held to Maturity
|
Other Investments
|
||||||||||||||||||||||
|
Amortized Cost
|
Fair Value
|
Amortized Cost
|
Fair Value
|
Amortized Cost
|
Fair Value
|
|||||||||||||||||||
|
(In thousands)
|
||||||||||||||||||||||||
|
One year or less
|
$
|
19,673
|
$
|
19,773
|
$
|
-
|
$
|
-
|
$
|
150
|
$
|
150
|
||||||||||||
|
One to five years
|
38,663
|
38,959
|
-
|
-
|
-
|
-
|
||||||||||||||||||
|
Five to ten years
|
37,507
|
37,717
|
1,337
|
1,089
|
-
|
-
|
||||||||||||||||||
|
Over ten years
|
65,663
|
66,142
|
9,770
|
9,862
|
1,116
|
1,116
|
||||||||||||||||||
|
Equity investments with no stated maturity
|
-
|
-
|
-
|
-
|
8,069
|
8,069
|
||||||||||||||||||
|
$
|
161,506
|
$
|
162,591
|
$
|
11,107
|
$
|
10,951
|
$
|
9,335
|
$
|
9,335
|
|||||||||||||
Securities with carrying amounts of $36.9 million and $49.5 million at December 31, 2010 and 2009, respectively, were pledged as collateral on public deposits and for other purposes as required or permitted by law.
Note 4. Loans
Loans consisted of:
|
December 31,
|
||||||||
|
2010
|
2009
|
|||||||
|
(In thousands)
|
||||||||
|
Commercial
|
$
|
149,987
|
$
|
138,684
|
||||
|
Commercial real estate
|
425,172
|
452,235
|
||||||
|
Residential real estate
|
400,713
|
399,588
|
||||||
|
Construction real estate
|
164,721
|
194,179
|
||||||
|
Installment and other
|
51,632
|
58,456
|
||||||
|
Total loans
|
1,192,225
|
1,242,142
|
||||||
|
Unearned income
|
(2,287
|
)
|
(2,356
|
)
|
||||
|
Gross loans
|
1,189,938
|
1,239,786
|
||||||
|
Allowance for loan losses
|
(28,722
|
)
|
(24,504
|
)
|
||||
|
Net loans
|
$
|
1,161,216
|
$
|
1,215,282
|
||||
Loan Origination/Risk Management. The Company has certain lending policies and procedures in place that are designed to maximize loan income within an acceptable level of risk. Management and the board of directors reviews and approves these policies and procedures on a regular basis. A reporting system supplements the review process by providing management with frequent reports related to loan production, loan quality, concentrations of credit, loan delinquencies and non-performing and potential problem loans.
Commercial loans are underwritten after evaluating and understanding the borrower’s ability to operate profitably and prudently expand its business. Underwriting standards are designed to promote relationship banking rather than transactional banking. Once it is determined that the borrower’s management possesses sound ethics and solid business acumen, the Company’s management examines current and projected cash flows to determine the ability of the borrower to repay their obligations as agreed. Commercial loans are primarily made based on the identified cash flows of the borrower and secondarily on the underlying collateral provided by the borrower. The cash flows of borrowers, however, may not be as expected and the collateral securing these loans may fluctuate in value. Most commercial and industrial loans are secured by the assets being financed or other business assets such as accounts receivable or inventory and may incorporate a personal guarantee; however, some short-term loans may be made on an unsecured basis. In the case of loans secured by accounts receivable, the availability of funds for the repayment of these loans may be substantially dependent on the ability of the borrower to collect amounts due from its customers.
Commercial real estate loans are subject to underwriting standards and processes similar to commercial non-real estate loans, in addition to those of other real estate loans. These loans are viewed primarily as cash flow loans and secondarily as loans secured by real estate. Commercial real estate lending typically involves higher loan principal amounts and the repayment of these loans is generally largely dependent on the successful operation of the property securing the loan or the business conducted on the property securing the loan. Commercial real estate loans may be more adversely affected by conditions in the real estate markets or in the general economy. The properties securing the Company’s commercial real estate portfolio are geographically concentrated in the markets in which the Company operates. Management monitors and evaluates commercial real estate loans based on collateral, location and risk grade criteria. The Company also utilizes third-party sources to provide insight and guidance about economic conditions and trends affecting market areas it serves. In addition, management tracks the level of owner-occupied commercial real estate loans versus non-owner occupied loans. At December 31, 2010, approximately 33.7% of the outstanding principal balance of the Company’s commercial real estate loans were secured by owner-occupied properties.
With respect to loans to developers and builders that are secured by non-owner occupied properties that the Company may originate from time to time, the Company generally requires the borrower to have had an existing relationship with the Company and have a proven record of success. Construction loans are underwritten utilizing feasibility studies, independent appraisal reviews, sensitivity analysis of absorption and lease rates and financial analysis of the developers and property owners. Construction loans are generally based upon estimates of costs and value associated with the complete project. These estimates may be inaccurate. Construction loans often involve the disbursement of substantial funds with repayment substantially dependent on the success of the ultimate project. Sources of repayment for these types of loans may be pre-committed permanent loans from approved long-term lenders, sales of developed property or an interim loan commitment from the Company until permanent financing is obtained. These loans are closely monitored by on-site inspections and are considered to have higher risks than other real estate loans due to their ultimate repayment being sensitive to interest rate changes, governmental regulation of real property, general economic conditions and the availability of long-term financing.
The Company originates consumer loans utilizing a credit scoring analysis to supplement the underwriting process. To monitor and manage consumer loan risk, policies and procedures are developed and modified, as needed, jointly by line and staff personnel. This activity, coupled with relatively small loan amounts that are spread across many individual borrowers, minimizes risk. Additionally, trend and outlook reports are reviewed by management on a regular basis. Underwriting standards for residential real estate and home equity loans are heavily influenced by statutory requirements, which include, but are not limited to, maximum loan-to-value levels, debt-to-income levels, collection remedies, the number of such loans a borrower can have at one time and documentation requirements.
The Company maintains an independent loan review department that reviews and validates the credit risk program on a periodic basis. Results of these reviews are presented to management. The loan review process complements and reinforces the risk identification and assessment decisions made by lenders and credit personnel, as well as the Company’s policies and procedures. In addition, the Company utilizes a third-party to periodically review loans to supplement the Company’s internal review process.
There have been no significant changes in the Company’s credit policy in 2010, other than the establishment of a Senior Loan Officer whose responsibilities include (but are not limited to) managing and monitoring compliance with the Company’s credit policies and procedures. The Company established this position in order to better ensure compliance with it’s policies and establish more consistency in it’s application of these policies.
The following table presents the contractual aging of the recorded investment in current and past due loans by class of loans as of December 31, 2010, including non-performing loans:
|
Current
|
30-59 Days Past Due
|
60-89 Days Past Due
|
Loans past due 90 days or more
|
Total Past Due
|
Total
|
|||||||||||||||||||
|
(In thousands)
|
||||||||||||||||||||||||
|
Commercial
|
$
|
146,875
|
$
|
759
|
$
|
83
|
$
|
2,270
|
$
|
3,112
|
$
|
149,987
|
||||||||||||
|
Commercial real estate
|
405,393
|
808
|
-
|
18,971
|
19,779
|
425,172
|
||||||||||||||||||
|
Residential real estate
|
388,898
|
2,422
|
1,038
|
8,355
|
11,815
|
400,713
|
||||||||||||||||||
|
Construction real estate
|
141,126
|
717
|
9,628
|
13,250
|
23,595
|
164,721
|
||||||||||||||||||
|
Installment and other
|
47,974
|
156
|
38
|
3,464
|
3,658
|
51,632
|
||||||||||||||||||
|
Total loans
|
$
|
1,130,266
|
$
|
4,862
|
$
|
10,787
|
$
|
46,310
|
$
|
61,959
|
$
|
1,192,225
|
||||||||||||
|
Nonperforming loan classification
|
$
|
1,772
|
$
|
600
|
$
|
1,286
|
$
|
46,310
|
$
|
48,196
|
$
|
49,968
|
||||||||||||
The following table presents the recorded investment in nonaccrual loans and loans past due ninety days or more and still accruing by class of loans as of December 31, 2010:
|
Nonaccrual
|
Loans past due 90 days or more
|
|||||||
|
(In thousands)
|
||||||||
|
Commercial
|
$
|
2,598
|
$
|
-
|
||||
|
Commercial real estate
|
19,419
|
-
|
||||||
|
Residential real estate
|
10,951
|
-
|
||||||
|
Construction real estate
|
13,908
|
-
|
||||||
|
Installment and other
|
3,092
|
-
|
||||||
|
Total
|
$
|
49,968
|
$
|
-
|
||||
There were no loans past due more than 90 days and still accruing interest at the end of 2009. Nonaccrual loans were $65.0 million as of December 31, 2009. The reduction in interest income associated with loans on non-accrual status was $4.4 million, $3.4 million and $2.3 million for the years ended December 31, 2010, 2009 and 2008, respectively.
The Company utilizes an internal asset classification system as a means of reporting problem and potential problem loans. Under the Company’s risk rating system, the Company classifies problem and potential problem loans as “Special Mention,” “Substandard,” and “Doubtful”. Substandard loans include those characterized by the distinct possibility that the Company will sustain some loss if the deficiencies are not corrected. Loans classified as Doubtful have all the weaknesses inherent in those classified Substandard with the added characteristic that the weaknesses present make collection or liquidation in full, on the basis of currently existing facts, conditions and values, highly questionable and improbable. Loans that do not currently expose the Company to sufficient risk to warrant classification in one of the aforementioned categories, but possess weaknesses that deserve management’s close attention are deemed to be Special Mention. Risk ratings are updated any time the situation warrants.
Loans not meeting the criteria above that are analyzed individually as part of the above described process are considered to be pass-rated loans. Loans listed as not rated are included in groups of homogeneous loans with similar risk and loss characteristics. The following tables present the risk category of loans by class of loans based on the most recent analysis performed and the contractual aging as of December 31, 2010:
|
Pass
|
Special Mention
|
Substandard
|
Doubtful
|
Total
|
||||||||||||||||
|
(In thousands)
|
||||||||||||||||||||
|
Commercial
|
$
|
146,162
|
$
|
682
|
$
|
3,143
|
$
|
-
|
$
|
149,987
|
||||||||||
|
Commercial real estate
|
394,673
|
258
|
30,241
|
-
|
425,172
|
|||||||||||||||
|
Residential real estate
|
387,636
|
151
|
12,926
|
-
|
400,713
|
|||||||||||||||
|
Construction real estate
|
138,624
|
-
|
26,097
|
-
|
164,721
|
|||||||||||||||
|
Installment and other
|
48,404
|
-
|
3,228
|
-
|
51,632
|
|||||||||||||||
|
Total
|
$
|
1,115,499
|
$
|
1,091
|
$
|
75,635
|
$
|
-
|
$
|
1,192,225
|
||||||||||
The following table shows all loans, including non-performing loans, by classification and aging, as of December 31, 2010:
|
Pass
|
Special Mention
|
Substandard
|
Doubtful
|
Total
|
||||||||||||||||
|
(In thousands)
|
||||||||||||||||||||
|
Current
|
$
|
1,111,092
|
$
|
1,091
|
$
|
18,083
|
$
|
-
|
$
|
1,130,266
|
||||||||||
|
Past due 30-59 days
|
3,903
|
-
|
959
|
-
|
4,862
|
|||||||||||||||
|
Past due 60-89 days
|
504
|
-
|
10,283
|
-
|
10,787
|
|||||||||||||||
|
Past due 90 days or more
|
-
|
-
|
46,310
|
-
|
46,310
|
|||||||||||||||
|
Total
|
$
|
1,115,499
|
$
|
1,091
|
$
|
75,635
|
$
|
-
|
$
|
1,192,225
|
||||||||||
Information about impaired loans as of and for the years ended December 31, 2010, 2009 and 2008, is as follows:
As of December 31, 2010, all non-performing loans (a total of $50.0 million) were classified Substandard and included in the Substandard column in the above tables.
The following table shows the total balance of impaired loans, including non-performing loans and other impaired loans, as of the date indicated:
|
December 31,
|
||||||||||||
|
2010
|
2009
|
2008
|
||||||||||
|
(In thousands)
|
||||||||||||
|
Loans for which there was a related allowance for loan losses
|
$
|
4,749
|
$
|
-
|
$
|
-
|
||||||
|
Other restructured loans, still accruing interest
|
839
|
2,513
|
940
|
|||||||||
|
Other impaired loans
|
56,437
|
57,767
|
39,373
|
|||||||||
|
Total impaired loans
|
$
|
62,025
|
$
|
60,280
|
$
|
40,313
|
||||||
|
Average monthly balance of impaired loans
|
$
|
62,934
|
$
|
51,884
|
$
|
37,127
|
||||||
|
Related allowance for loan losses
|
$
|
478
|
$
|
-
|
$
|
-
|
||||||
|
Interest income recognized on an accrual basis
|
$
|
502
|
$
|
-
|
$
|
-
|
||||||
|
Interest income recognized on a cash basis
|
$
|
1,395
|
$
|
320
|
$
|
47
|
||||||
Total troubled debt restructures, both those in accrual and non-accrual status, were $6.5 million, $8.2 million and $3.3 million as of December 31, 2010, 2009 and 2008, respectively.
The following table presents loans individually evaluated for impairment by class of loans as of December 31, 2010, showing the amount of principal charged-off (if any); the amount of allowance for loan losses specifically allocated for these impaired loans (if any); the average recorded investment; and the interest income recognized in 2010:
|
Unpaid Principal Balance
|
Recorded Investment
|
Partial Charge-offs
|
Allowance for Loan Losses Allocated
|
Average Recorded Investment
|
Interest Income Recognized
|
|||||||||||||||||||
|
(In thousands)
|
||||||||||||||||||||||||
|
With no related allowance recorded:
|
||||||||||||||||||||||||
|
Commercial
|
$
|
4,484
|
$
|
2,606
|
$
|
1,878
|
$
|
-
|
$
|
3,411
|
$
|
1,415
|
||||||||||||
|
Commercial real estate
|
24,442
|
23,901
|
541
|
-
|
24,003
|
208
|
||||||||||||||||||
|
Residential real estate
|
12,381
|
11,734
|
647
|
-
|
11,086
|
35
|
||||||||||||||||||
|
Construction real estate
|
19,124
|
15,918
|
3,206
|
-
|
16,542
|
97
|
||||||||||||||||||
|
Installment and other
|
4,460
|
3,117
|
1,343
|
-
|
3,494
|
-
|
||||||||||||||||||
|
With an allowance recorded:
|
||||||||||||||||||||||||
|
Commercial
|
479
|
479
|
-
|
15
|
591
|
7
|
||||||||||||||||||
|
Commercial real estate
|
380
|
380
|
-
|
45
|
232
|
10
|
||||||||||||||||||
|
Residential real estate
|
3,429
|
3,429
|
-
|
338
|
3,196
|
109
|
||||||||||||||||||
|
Construction real estate
|
-
|
-
|
-
|
-
|
-
|
-
|
||||||||||||||||||
|
Installment and other
|
461
|
461
|
-
|
80
|
379
|
16
|
||||||||||||||||||
|
Total
|
$
|
69,640
|
$
|
62,025
|
$
|
7,615
|
$
|
478
|
$
|
62,934
|
$
|
1,897
|
||||||||||||
As of December 31, 2009, there was a total of $60.3 million in impaired loans with an average balance of $51.9 million during the year. There was no related allowance for credit losses on these loans. A total of $320 thousand in interest income was recognized on these loans during 2009.
Allowance for Loan Losses: The Company has established an internal policy to estimate the allowance for loan losses. This policy is periodically reviewed by management and the board of directors. No significant changes have been made in this policy during 2010.
The allowance for loan losses is that amount which, in management’s judgment, is considered appropriate to provide for probable losses in the loan portfolio. In analyzing the adequacy of the allowance for loan losses, management uses a comprehensive loan grading system to determine risk potential in the portfolio, and considers the results of periodic internal and external loan reviews. Historical loss experience factors and specific reserves for impaired loans, combined with other considerations, such as delinquency, non-accrual, trends on criticized and classified loans, economic conditions, concentrations of credit risk, and experience and abilities of lending personnel, are also considered in analyzing the adequacy of the allowance. Management uses a systematic methodology, which is applied at least quarterly, to determine the amount of allowance for loan losses and the resultant provisions for loan losses it considers adequate to provide for probable loan losses. In the event that different assumptions or conditions were to prevail, and depending upon the severity of such changes, the possibility of materially different financial condition or results of operations is a reasonable likelihood.
Three methods are used to evaluate the adequacy of the allowance for loan losses: (1) specific identification, based on management’s assessment of loans in our portfolio and the probability that a charge-off will occur in the upcoming quarter; (2) losses probable in the loan portfolio besides those specifically identified, based upon a migration analysis of the percentage of loans currently performing that have probable losses; and (3) qualitative adjustments based on management’s assessment of certain risks such as delinquency trends, watch-list and classified trends, changes in concentrations, economic trends, industry trends, non-accrual trends, exceptions and loan-to-value guidelines, management and staff changes and policy or procedure changes.
While management uses the best information available to make its evaluation, future adjustments to the allowance may be necessary if there are significant changes in economic conditions. In addition, as an integral part of their examination process regulatory agencies periodically review our allowance for loan losses and may require us to make additions to the allowance based on their evaluation of information available at the time of their examinations.
During 2010, the Company experienced some improvement in its asset quality when compared to the prior year, as measured by non-performing assets and classified loans to those that are still performing. Management remains concerned about possible losses in its real estate loan portfolios. Management deemed the allocations during 2010 to be a necessary and prudent step to reserve against probable losses. A higher level of allowance for loan losses by the end of 2010 (than compared to the end of 2009) was deemed prudent in light of the continued level of charge-offs, non-performing loans and classified loans. Historical losses, as measured by net charge-offs, was relatively unchanged from the prior year, and is higher than historically experienced in years prior to 2009. In addition, general economic conditions remain relatively weak, especially in the real estate markets. Since the majority of the Company’s loans are in commercial and residential real estate, a level in the allowance for loan losses that reflects this weakness and the historical losses was deemed appropriate.
Activity in the allowance for loan losses was as follows:
|
Year Ended December 31,
|
||||||||||||
|
2010
|
2009
|
2008
|
||||||||||
|
(Dollars in thousands)
|
||||||||||||
|
Balance at beginning of year
|
$
|
24,504
|
$
|
15,230
|
$
|
13,533
|
||||||
|
Provision for loan losses
|
20,258
|
26,024
|
8,183
|
|||||||||
|
Charge-offs:
|
||||||||||||
|
Commercial
|
(4,477
|
)
|
(5,310
|
)
|
(4,021
|
)
|
||||||
|
Commercial real estate
|
(1,460
|
)
|
(360
|
)
|
(104
|
)
|
||||||
|
Residential real estate
|
(5,944
|
)
|
(3,484
|
)
|
(1,219
|
)
|
||||||
|
Construction real estate
|
(5,762
|
)
|
(5,971
|
)
|
(585
|
)
|
||||||
|
Installment and other
|
(1,903
|
)
|
(2,254
|
)
|
(1,087
|
)
|
||||||
|
Total charge-offs
|
(19,546
|
)
|
(17,379
|
)
|
(7,016
|
)
|
||||||
|
Recoveries:
|
||||||||||||
|
Commercial
|
3,076
|
173
|
263
|
|||||||||
|
Commercial real estate
|
5
|
11
|
-
|
|||||||||
|
Residential real estate
|
181
|
65
|
16
|
|||||||||
|
Construction real estate
|
91
|
73
|
42
|
|||||||||
|
Installment and other
|
153
|
307
|
209
|
|||||||||
|
Total recoveries
|
3,506
|
629
|
530
|
|||||||||
|
Net charge-offs
|
(16,040
|
)
|
(16,750
|
)
|
(6,486
|
)
|
||||||
|
Balance at end of year
|
$
|
28,722
|
$
|
24,504
|
$
|
15,230
|
||||||
The following table presents the balance in the allowance for loan losses and the recorded investment in loans by portfolio segment and based on impairment method as of December 31, 2010:
|
Commercial
|
Commercial Real Estate
|
Residential Real Estate
|
Construction Real Estate
|
Installment and Other
|
Total
|
|||||||||||||||||||
|
(In thousands)
|
||||||||||||||||||||||||
|
Allowance for loan losses:
|
||||||||||||||||||||||||
|
Ending allowance balance attributable to loans:
|
||||||||||||||||||||||||
|
Individually evaluated for impairment
|
$
|
15
|
$
|
45
|
$
|
338
|
$
|
-
|
$
|
80
|
$
|
478
|
||||||||||||
|
Collectively evaluated for impairment
|
5,889
|
7,045
|
3,912
|
7,335
|
4,063
|
28,244
|
||||||||||||||||||
|
Total ending allowance balance
|
$
|
5,904
|
$
|
7,090
|
$
|
4,250
|
$
|
7,335
|
$
|
4,143
|
$
|
28,722
|
||||||||||||
|
Loans:
|
||||||||||||||||||||||||
|
Individual evaluated for impairment
|
$
|
3,085
|
$
|
24,281
|
$
|
15,163
|
$
|
15,918
|
$
|
3,578
|
$
|
62,025
|
||||||||||||
|
Collectively evaluated for impairment
|
146,902
|
400,891
|
385,550
|
148,803
|
48,054
|
1,130,200
|
||||||||||||||||||
|
Total ending loans balance
|
$
|
149,987
|
$
|
425,172
|
$
|
400,713
|
$
|
164,721
|
$
|
51,632
|
$
|
1,192,225
|
||||||||||||
Loans outstanding to executive officers and directors of the Company, including companies in which these individuals have management control or beneficial ownership, at December 31, 2010 and 2009, were approximately $4.0 million and $5.0 million. In the opinion of management, these loans have similar terms to other customer loans. An analysis of the activity related to these loans for the years ended December 31, 2010 and 2009 is as follows:
|
December 31,
|
||||||||
|
2010
|
2009
|
|||||||
|
(In thousands)
|
||||||||
|
Balance, beginning
|
$
|
5,021
|
$
|
4,244
|
||||
|
Additions
|
353
|
1,787
|
||||||
|
Principal payments and other reductions
|
(1,407
|
)
|
(1,010
|
)
|
||||
|
Balance ending
|
$
|
3,967
|
$
|
5,021
|
||||
Note 5. Loan Servicing and Mortgage Servicing Rights
Mortgage loans serviced for others are not included in the accompanying consolidated balance sheets. The unpaid balance of these loans as of December 31, 2010 and 2009 is summarized as follows:
|
December 31,
|
||||||||
|
2010
|
2009
|
|||||||
|
(In thousands)
|
||||||||
|
Mortgage loan portfolios serviced for:
|
||||||||
|
Federal National Mortgage Association (FNMA)
|
$
|
1,002,348
|
$
|
1,019,584
|
||||
|
Federal Home Loan Mortgage Corporation (FHLMC)
|
-
|
1,091
|
||||||
|
Other investors
|
237
|
307
|
||||||
|
$
|
1,002,585
|
$
|
1,020,982
|
|||||
During 2010, 2009 and 2008, substantially all of the loans serviced for others had a contractual servicing fee of 0.25% per annum of unpaid principal balance. These servicing fees totaled $2.6 million, $2.5 million and $2.5 million during 2010, 2009, and 2008, respectively. These fees are recorded as “Mortgage loan servicing fees” under “Other income” on the Consolidated Statements of Income.
During 2010, 2009 and 2008, late fees on the loans serviced for others totaled $235 thousand, $254 thousand and $293 thousand during 2010, 2009, and 2008, respectively. These fees are recorded included in “Other operating income” under “Other income” on the Consolidated Statements of Income.
Custodial balances on deposit at the Bank in connection with the foregoing loan servicing were approximately $5.2 million and $4.9 million as of December 31, 2010 and 2009. There were no custodial balances on deposit with other financial institutions during 2010 and 2009.
An analysis of changes in mortgage servicing rights asset follows:
|
2010
|
2009
|
2008
|
||||||||||
|
(In thousands)
|
||||||||||||
|
Balance at beginning of period
|
$
|
8,525
|
$
|
6,908
|
$
|
8,250
|
||||||
|
Servicing rights originated and capitalized
|
2,161
|
4,116
|
1,398
|
|||||||||
|
Amortization
|
(1,656
|
)
|
(2,499
|
)
|
(2,740
|
)
|
||||||
|
Balance at end of period
|
$
|
9,030
|
$
|
8,525
|
$
|
6,908
|
||||||
Below is an analysis of changes in the mortgage servicing right asset valuation allowance:
|
2010
|
2009
|
2008
|
||||||||||
|
(In thousands)
|
||||||||||||
|
Balance at beginning of period
|
$
|
(878
|
)
|
$
|
(1,637
|
)
|
$
|
(184
|
)
|
|||
|
Aggregate reductions credited to operations
|
1,556
|
2,144
|
1,347
|
|||||||||
|
Aggregate additions charged to operations
|
(1,748
|
)
|
(1,385
|
)
|
(2,800
|
)
|
||||||
|
Balance at end of period
|
$
|
(1,070
|
)
|
$
|
(878
|
)
|
$
|
(1,637
|
)
|
|||
The fair values of the MSRs were $8.6 million, $8.8 million and $5.7 million on December 31, 2010, 2009 and 2008, respectively.
The primary risk characteristics of the underlying loans used to stratify the servicing assets for the purposes of measuring impairment are interest rate and original term.
Our valuation allowance is used to recognize impairments of our MSRs. An MSR is considered impaired when the market value of the MSR is below the amortized book value of the MSR. The MSRs are accounted by risk tranche, with the interest rate and term of the underlying loan being the primary strata used in distinguishing the tranches. Each tranche is evaluated separately for impairment.
Our MSRs are analyzed for impairment on a monthly basis. The underlying loans on all serviced loans are analyzed and, based upon the value of MSRs that are traded on the open market, a current market value for each risk tranche in our portfolio is assigned. We then compare that market value to the current amortized book value for each tranche. The change in market value (up to the amortized value of the MSR) is recorded as an adjustment to the MSR valuation allowance, with the offset being recorded as an addition or a reduction to income.
The following assumptions were used to calculate the market value of the MSRs as of December 31, 2010, 2009 and 2008:
|
At December 31,
|
||||||||||||
|
2010
|
2009
|
2008
|
||||||||||
|
Prepayment Standard Assumption (PSA) speed
|
233.33
|
%
|
232.00
|
%
|
390.00
|
%
|
||||||
|
Discount rate
|
10.75
|
10.76
|
10.76
|
|||||||||
|
Earnings rate
|
2.17
|
2.75
|
3.50
|
|||||||||
Note 6. Other Intangible Assets
In October 2008, the Bank purchased a customer list from Allocca & Brunett, Inc., an investment advisory company in Santa Fe, New Mexico, for $800 thousand, with subsequent payments made in 2009 and 2010 as noted below. The purpose of this acquisition was to broaden our customer base and increase assets under management in the Bank’s trust operations. This customer list is considered an intangible asset under ASC Topic 350, "Intangibles—Goodwill and Other." Under ASC Topic 350, an intangible asset with a finite life shall be amortized over the useful life of the asset. Where the useful life is not known, estimates are permissible.
The useful life of the purchased customer list has been estimated at three years, based upon the purchase agreement entered into between the Bank and Allocca & Brunett, Inc. This intangible asset is to be amortized to a residual value of zero at the end of the period using a straight-line amortization method.
The value of the asset is primarily derived from the expectation that the customers of Allocca & Brunett, Inc. will be substantially acquired by the Bank during the amortization period. Additional payments of $352 thousand and $209 thousand, respectively, were made on the anniversary date of the closing date in 2009 and 2010 per the acquisition contract. This additional cost is being amortized over the remaining year of estimated useful life of the original asset. Additional payments to Allocca & Brunett, Inc. may be required on the basis of the assets held by the Bank on the final anniversary of the closing date in 2011. The conversion of these accounts shall be monitored and, if the conversion rate falls below expectations, this asset may be deemed impaired. The customer list would be reviewed for impairment under FASB ASC Topic 350, "Intangibles—Goodwill and Other." This impairment will be realized as an expense in the period in which it is recognized. Management has integrated the assets of Allocca & Brunett into the Bank’s existing Investment Services Department.
During the years ended December 31, 2010, 2009 and 2008, $478 thousand, $296 thousand and $44 thousand were amortized, respectively. The expected amortization of other intangible assets over the next five years at December 31, 2010 is as follows:
|
(In thousands)
|
||||
|
2011
|
$
|
543
|
||
|
2012
|
—
|
|||
|
2013
|
—
|
|||
|
2014
|
—
|
|||
|
2015
|
—
|
|||
|
Thereafter
|
—
|
|||
|
Total
|
$
|
543
|
||
In addition to the acquired customer list, the Company had $3 thousand in trademarks as non-amortizing intangible assets outstanding as of December 31, 2010 and 2009.
Note 7. Other Real Estate Owned
Other real estate owned consists of property acquired due to foreclosure on real estate loans. Total other real estate owned consisted of:
|
As of December 31,
|
||||||||
|
2010
|
2009
|
|||||||
|
(In thousands)
|
||||||||
|
Construction property
|
$
|
14,872
|
$
|
12,782
|
||||
|
Residential real estate
|
3,427
|
3,337
|
||||||
|
Commercial real estate
|
3,561
|
631
|
||||||
|
Total
|
$
|
21,860
|
$
|
16,750
|
||||
Note 8. Premises and Equipment
Premises and equipment consisted of:
|
December 31,
|
||||||||
|
2010
|
2009
|
|||||||
|
(In thousands)
|
||||||||
|
Land and land improvements
|
$
|
3,820
|
$
|
3,820
|
||||
|
Buildings
|
22,624
|
23,653
|
||||||
|
Furniture and equipment
|
29,337
|
27,276
|
||||||
|
Total
|
55,781
|
54,749
|
||||||
|
Accumulated depreciation
|
(25,517
|
)
|
(22,800
|
)
|
||||
|
Total less depreciation
|
$
|
30,264
|
$
|
31,949
|
||||
Depreciation on premises and equipment totaled $3.0 million, $2.7 million and $2.4 million for the years ended December 31, 2010, 2009 and 2008.
Note 9. Deposits
Deposits consisted of:
|
At December 31,
|
||||||||
|
2010
|
2009
|
|||||||
|
(In thousands)
|
||||||||
|
Demand deposits, noninterest bearing
|
$
|
62,622
|
$
|
54,066
|
||||
|
NOW and money market accounts
|
449,475
|
356,144
|
||||||
|
Savings deposits
|
306,958
|
437,468
|
||||||
|
Time certificates, $100,000 or more
|
328,183
|
406,033
|
||||||
|
Other time certificates
|
211,107
|
214,734
|
||||||
|
Total
|
$
|
1,358,345
|
$
|
1,468,445
|
||||
At December 31, 2010, the scheduled maturities of time certificates were as follows:
|
(In thousands)
|
||||
|
2011
|
$
|
465,354
|
||
|
2012
|
16,214
|
|||
|
2013
|
11,870
|
|||
|
2014
|
17,954
|
|||
|
2015
|
21,398
|
|||
|
Thereafter
|
6,500
|
|||
|
Total
|
$
|
539,290
|
||
As of December 31, 2010 and 2009, the Company had $4.1 million and $5.7 million, respectively, in certificates of deposit held under the Certificate of Deposit Registry Service (CDARS). Under the service agreements, customer certificates of deposit in excess of the FDIC insurance limits are exchanged with deposits at other financial institutions, resulting in no net change in total deposits but resulting in increased FDIC insurance coverage. Under regulatory guidelines and certain conditions, these may be considered brokered deposits. The Company had no non-CDARS brokered deposits at December 31, 2010 or 2009.
Notes payable to the Federal Home Loan Bank (FHLB) at December 31, 2010 and 2009, were secured by a blanket assignment of mortgage loans or other collateral acceptable to FHLB, and generally had a fixed rate of interest, interest payable monthly and principal due at end of term, unless otherwise noted. The total value of loans under the blanket assignment, as of December 31, 2010, was $494.3 million.
|
Maturity Date
|
Rate
|
Type
|
Principal due
|
2010
|
2009
|
|||||||||
|
(In thousands)
|
||||||||||||||
|
03/22/2010
|
4.667
|
Fixed
|
At maturity
|
$
|
-
|
$
|
20,000
|
|||||||
|
01/03/2011
|
6.031
|
Fixed
|
Monthly Amortization
|
1,152
|
1,193
|
|||||||||
|
01/26/2012
|
2.565
|
Fixed
|
At maturity
|
10,000
|
10,000
|
|||||||||
|
03/23/2015
|
3.050
|
Fixed
|
At maturity
|
20,000
|
-
|
|||||||||
|
04/27/2021
|
6.343
|
Fixed
|
At maturity
|
2,300
|
2,300
|
|||||||||
|
$
|
33,452
|
$
|
33,493
|
|||||||||||
The following is a summary of debt payments required for years after 2010.
|
(In thousands)
|
||||
|
2011
|
$
|
1,152
|
||
|
2012
|
10,000
|
|||
|
2013
|
-
|
|||
|
2014
|
-
|
|||
|
2015
|
20,000
|
|||
|
Thereafter
|
2,300
|
|||
|
Total
|
$
|
33,452
|
||
Note 11. Junior Subordinated Debt Owed to Unconsolidated Trusts
The following table presents details on the junior subordinated debt owed to unconsolidated trusts as of December 31, 2010:
|
Trust I
|
Trust III
|
Trust IV
|
Trust V
|
|||||||||||||
|
(Dollars in thousands)
|
||||||||||||||||
|
Date of Issue
|
March 23, 2000
|
May 11, 2004
|
June 29, 2005
|
September 21, 2006
|
||||||||||||
|
Amount of trust preferred securities issued
|
$
|
10,000
|
$
|
6,000
|
$
|
10,000
|
$
|
10,000
|
||||||||
|
Rate on trust preferred securities
|
10.875
|
%
|
3.00% (variable)
|
6.88
|
%
|
6.83
|
%
|
|||||||||
|
Maturity
|
March 8, 2030
|
September 8, 2034
|
November 23, 2035
|
December 15, 2036
|
||||||||||||
|
Date of first redemption
|
March 8, 2010
|
September 8, 2009
|
August 23, 2010
|
September 15, 2011
|
||||||||||||
|
Common equity securities issued
|
$
|
310
|
$
|
186
|
$
|
310
|
$
|
310
|
||||||||
|
Junior subordinated deferrable interest debentures owed
|
$
|
10,310
|
$
|
6,186
|
$
|
10,310
|
$
|
10,310
|
||||||||
|
Rate on junior subordinated deferrable interest debentures
|
10.875
|
%
|
3.00% (variable)
|
6.88
|
%
|
6.83
|
%
|
|||||||||
On the dates of issue indicated above, the Trusts, being Delaware statutory business trusts, issued trust preferred securities (the “trust preferred securities”) in the amount and at the rate indicated above. These securities represent preferred beneficial interests in the assets of the Trusts. The trust preferred securities will mature on the dates indicated, and are redeemable in whole or in part at the option of Trinity at any time after the date of first redemption indicated above, with the approval of the Federal Reserve Board and in whole at any time upon the occurrence of certain events affecting their tax or regulatory capital treatment. The Trusts also issued common equity securities to Trinity in the amounts indicated above. The Trusts used the proceeds of the offering of the trust preferred securities to purchase junior subordinated deferrable interest debentures (the “debentures”) issued by Trinity, which have terms substantially similar to the trust preferred securities. Trinity has the right to defer payments of interest on the debentures at any time or from time to time for a period of up to ten consecutive semi-annual periods (or twenty consecutive quarterly periods in the case of Trusts with quarterly interest payments) with respect to each interest payment deferred. Under the terms of the debentures, under certain circumstances of default or if Trinity has elected to defer interest on the debentures, Trinity may not, with certain exceptions, declare or pay any dividends or distributions on its capital stock or purchase or acquire any of its capital stock. Trinity used the majority of the proceeds from the sale of the debentures to add to Tier 1 and Tier 2 capital in order to support its growth and to purchase treasury stock.
Trinity owns all of the outstanding common securities of the Trusts. The Trusts are considered variable interest entities (VIEs) under ASC Topic 810, "Consolidation." Because Trinity is not the primary beneficiary of the Trusts, the financial statements of the Trusts are not included in the consolidated financial statements of the Company.
In March 2005, the Board of Governors of the Federal Reserve System issued a final rule allowing bank holding companies to continue to include qualifying trust preferred securities in their Tier 1 Capital for regulatory capital purposes, subject to a 25% limitation to all core (Tier I) capital elements, net of goodwill less any associated deferred tax liability. The final rule provides a five-year transition period, ending March 31, 2009, for application of the aforementioned quantitative limitation. In April 2009, this five-year transition period was extended. As of December 31, 2010, 100% of the trust preferred securities noted in the table above qualified as Tier 1 capital under the final rule adopted in March 2005.
Payments of distributions on the trust preferred securities and payments on redemption of the trust preferred securities are guaranteed by Trinity on a limited basis. Trinity also entered into an agreement as to expenses and liabilities with the Trusts pursuant to which it agreed, on a subordinated basis, to pay any costs, expenses or liabilities of the Trusts other than those arising under the trust preferred securities. The obligations of Trinity under the junior subordinated debentures, the related indenture, the trust agreement establishing the Trusts, the guarantee and the agreement as to expenses and liabilities, in the aggregate, constitute a full and unconditional guarantee by Trinity of the Trusts’ obligations under the trust preferred securities.
Issuance costs of $615 thousand related to Trust I and Trust III were deferred and are being amortized over the period until mandatory redemption of the securities in March 2030 and September 2034, respectively. During 2010, 2009 and 2008, $14 thousand of these issuance costs were amortized each year. Unamortized issuance costs were $270 thousand, $283 thousand and $297 thousand at December 31, 2010, 2009 and 2008, respectively. There were no issuance costs associated with the other trust preferred security issues.
Dividends accrued and unpaid to securities holders totaled $1.9 million and $478 thousand on December 31, 2010 and 2009, respectively.
Under the terms of the securities purchase agreement between the Company and the U.S. Treasury pursuant to which the Company issued its Series A and Series B Preferred Stock as part of the TARP Capital Purchase Program, prior to the earlier of (i) March 27, 2012 and (ii) the date on which all of the shares of the Series A and Series B Preferred Stock have been redeemed by us or transferred by Treasury to third parties, we may not redeem our trust preferred securities (or the related junior subordinated notes), without the consent of Treasury.
In August 2010 we began to defer the interest payments on $37.1 million of junior subordinated debentures that are held by four business trusts that we control. Pursuant to the respective indentures governing the subordinated debentures, we have the right to defer interest payments up to 20 consecutive quarters for a portion of the debentures and up to 10 consecutive semi-annual periods for the remaining portion; however, interest payments on the debentures, including all such deferred interest payments, must be paid before we pay dividends on our capital stock, including our common stock and the preferred stock issued to Treasury pursuant to the CPP. The total amount of such deferred interest as of December 31, 2010 was $1.4 million. Further detail with respect to the deferred payments may be found in Note 10 to our consolidated financial statements provided in Item 8 of this Form 10-K. On March 10, 2011, the Company elected to pay all of the deferred interest payments on the junior subordinated debentures, and the Company expects to make the payments in the first or second quarter of 2011. However, there is no guarantee the Company will not have to defer future interest payments.
Note 12. Description of Leasing Arrangements
The Company is leasing land in Santa Fe on which it has built a banking office. The construction of the office was completed in 2009. The lease has an original 8 year term and expires in 2014, and contains an option to purchase the land at a set price at the termination of the initial term of the lease. This lease is classified as a capital lease. The Company also holds a note and mortgage on this land, and the interest payments received on the note are approximately equal to the payments made on the lease and the principal due at maturity (simultaneous with the lease maturity) will largely offset the option purchase price.
In addition, the Company leases certain equipment, ATM location space, office space and storage space from other parties under operating leases expiring through 2011. Lease payments for the years ended December 31, 2010, 2009 and 2008 totaled $370 thousand, $402 thousand and $370 thousand, respectively.
The following is a schedule by years of future minimum lease payments under capital leases together with the present value of the net minimum lease payments as of December 31, 2010:
Lease Payments under Capital Leases
|
(In thousands)
|
||||
|
2011
|
$
|
185
|
||
|
2012
|
185
|
|||
|
2013
|
185
|
|||
|
2014
|
3,040
|
|||
|
2015
|
—
|
|||
|
Thereafter
|
—
|
|||
|
Total minimum lease payments
|
3,595
|
|||
|
Less: Amount representing estimated executory costs (such as taxes, maintenance and insurance), including profit thereon, included in total minimum lease payments
|
—
|
|||
|
Net minimum lease payments
|
3,595
|
|||
|
Less: Amount representing interest
|
(1,384
|
)
|
||
|
Present value of net minimum lease payments
|
$
|
2,211
|
||
Commitments for minimum future rentals under the operating leases were as follows at December 31, 2010:
Lease Payments Under Operating Leases:
|
(In thousands)
|
||||
|
2011
|
$
|
364
|
||
|
2012
|
—
|
|||
|
2013
|
—
|
|||
|
2014
|
—
|
|||
|
2015
|
—
|
|||
|
Thereafter
|
—
|
|||
|
Total
|
$
|
364
|
||
Note 13. Retirement Plans
The Company has a qualified Employee Stock Ownership Plan (“ESOP”) for the benefit of all employees who are at least 18 years of age and have completed 1,000 hours of service during the Plan year. The employee’s interest in the ESOP vests over a period of six years. The ESOP was established in January 1989 and is a defined contribution plan subject to the requirements of the Employee Retirement Income Security Act of 1974.
The ESOP is funded by annual discretionary contributions by the Company as determined by its Board of Directors. The Company’s discretionary contributions to the ESOP in 2010, 2009 and 2008 were approximately $134 thousand, $342 thousand and $564 thousand, respectively.
All shares held by the ESOP, acquired prior to the issuance of ASC 718-40, "Compensation—Stock Compensation-Employee Stock Ownership Plans” are included in the computation of average common shares and common share equivalents. This accounting treatment is grandfathered for shares purchased prior to December 31, 1992. As permitted by ASC 718-40, compensation expense for shares released is equal to the original acquisition cost of the shares if acquired prior to December 31, 1992. As shares acquired after ASC 718-40 were released from collateral, the Company reported compensation expense equal to the current fair value of the shares, and the shares became outstanding for earnings-per-share computations.
Shares of the Company held by the ESOP acquired prior to December 31, 1992 totaled 227,018 and 229,787 shares at December 31, 2010 and 2009, respectively.
Shares of the Company held by the ESOP acquired after December 31, 1992 are as follows:
|
December 31,
|
|||||
|
2010
|
2009
|
||||
|
Allocated shares
|
401,896
|
397,243
|
|||
|
Total shares acquired after December 31, 1992
|
401,896
|
397,243
|
|||
There was no compensation expense recognized for ESOP shares acquired prior to December 31, 1992 during the years 2010, 2009 and 2008. Compensation expense recognized for ESOP shares acquired after December 31, 1992 during 2010, 2009 and 2008 was $134 thousand, $341 thousand and $611 thousand, respectively.
Under federal income tax regulations, the employer securities that are held by the Plan and its participants and that are not readily tradable on an established market or that are subject to trading limitations include a put option (liquidity put). The liquidity put is a right to demand that the Company buy shares of its stock held by the participant for which there is no readily available market. The put price is representative of the fair value of the stock. The Company may pay the purchase price over a five-year period. The purpose of the liquidity put is to ensure that the participant has the ability to ultimately obtain cash. The fair value of the allocated shares subject to repurchase was $6.1 million and $12.5 million as of December 31, 2010 and 2009.
The Company’s employees may also participate in a tax-deferred savings plan (401(k)) to which the Company does not contribute.
Note 14. Stock Incentives
The Company’s 1998 Stock Option Plan (“1998 Plan”) and Trinity Capital Corporation 2005 Stock Incentive Plan (“2005 Plan”) were created for the benefit of key management and select employees. Under the 1998 Plan, 400,000 shares (as adjusted for the stock split of December 19, 2002) from shares held in treasury or authorized but unissued common stock are reserved for granting options. Under the 2005 Plan, 500,000 shares from shares held in treasury or authorized but unissued common stock are reserved for granting stock-based incentive awards. Both of these plans were approved by the Company’s shareholders. The Board of Directors determine vesting and pricing of the awards. All stock options granted through December 31, 2005 were granted at or above the market value of the stock at the date of the grant, with the exception of the July 1998 stock option grant which was granted at $0.25 below the last reported sale price on the date of grant. All stock options vest in equal amounts over a three year period and must be exercised within ten years of the date of grant. No stock options were granted after December 31, 2008. Stock appreciation rights granted after December 31, 2005 were also granted at or above the market value of the stock at the date of the grant, with the exception of the January 1, 2006 stock appreciation right grants which were approved on December 15, 2005 and granted at the December 31, 2005 closing price to take advantage of accounting changes favorable to Trinity. All stock appreciation rights vest and mature at five years.
The Company is required by ASC Topic 718, "Compensation" to recognize compensation expense for share-based compensation. The Company uses the Black-Scholes model to value the stock options and stock appreciation rights on the date of the grant, and recognizes this expense over the remaining vesting term for the stock options or stock appreciation rights. Expected term from grant date is based upon the historical time from grant to exercise experienced by the Company. Because share-based compensation vesting in the current periods was granted on a variety of dates, the assumptions are presented as weighted averages in those assumptions.
There were no stock incentives granted during 2010, 2009 or 2008.
A summary of stock option and stock appreciation right activity under the 1998 Plan and the 2005 Plan as of December 31, 2010, and changes during the year is presented below:
|
Shares
|
Weighted-Average Exercise Price
|
Weighted-Average Remaining Contractual Term, in years
|
Aggregate Intrinsic Value (in thousands)
|
|||||||||||||
|
Outstanding at January 1, 2010
|
412,500
|
$
|
27.03
|
|||||||||||||
|
Granted
|
-
|
-
|
||||||||||||||
|
Exercised
|
-
|
-
|
||||||||||||||
|
Forfeited or expired
|
(28,000
|
)
|
20.00
|
|||||||||||||
|
Outstanding at December 31, 2010
|
384,500
|
$
|
27.55
|
1.95
|
$
|
1,605
|
||||||||||
|
Exercisable at December 31, 2010
|
201,000
|
$
|
27.72
|
2.96
|
$
|
871
|
||||||||||
There were no stock options exercised in 2010. Steve W. Wells exercised 14,000 non-qualified stock options at $20.00 per share in June of 2009. The total intrinsic value of options exercised during 2009 and 2008 was $52 thousand and $62 thousand, respectively.
As of December 31, 2010, there was $110 thousand of total unrecognized compensation cost related to non-vested share-based compensation arrangements granted under the 2005 Plan. There was no unrecognized compensation cost related to non-vested share-based compensation arrangements granted under the 1998 plan. That cost is expected to be recognized over a weighted-average vesting period of 0.9 years. During 2010, we expensed $145 thousand for stock appreciation rights that will vest in 2011 and 2012.
Note 15. Income Taxes
The Company has adopted the provisions of Accounting Standards Codification (“ASC”) 740-10, Income Taxes. ASC 740 sets forth the criterion an individual tax position should meet for some or all of the income tax benefit to be recognized in a taxable entity’s financial statements. Under the guidelines of ASC 740, an entity should recognize the financial statement benefit of a tax position if it determines that it is more likely than not that the position will be sustained on examination. The term, “more likely than not”, means a likelihood of more than 50 percent. In assessing whether the more-likely-than-not criterion is met, the Company should assume that the tax position will be reviewed by the applicable taxing authority and all available information is known to the taxing authority. Management has analyzed ASC 740, relating to “Uncertain Tax Positions” for tax years after 2005 and continues to believe there is no financial statement impact to the Company. The Company is no longer subject to income tax examinations by taxing authorities for years before 2007 for its federal and New Mexico filings.
The current and deferred components of the provision for income tax expense for the years 2010, 2009 and 2008 are as follows:
|
Years Ended December 31,
|
||||||||||||
|
2010
|
2009
|
2008
|
||||||||||
|
(In thousands)
|
||||||||||||
|
Current provision for income tax expense:
|
||||||||||||
|
Federal
|
$ | 858 | $ | 3,459 | $ | 5,284 | ||||||
|
State
|
309 | 624 | 875 | |||||||||
|
Deferred provision for income tax (benefit) expense:
|
||||||||||||
|
Federal
|
(352 | ) | (2,051 | ) | (1,393 | ) | ||||||
|
State
|
(555 | ) | (269 | ) | (183 | ) | ||||||
|
Total provision for income tax expense
|
$ | 260 | $ | 1,763 | $ | 4,583 | ||||||
Income taxes related to changes in the unrealized gains and losses on available for sale securities are recorded directly to other comprehensive income in stockholder’s equity and is not included above. The deferred tax liability as of December 31, 2010 and 2009, was approximately $394 thousand and $93 thousand, respectively.
A deferred tax asset or liability is recognized to reflect the net tax effects of temporary differences between the carrying amounts of existing assets and liabilities for financial reporting purposes and the amounts used for income tax purposes. Significant temporary differences that gave rise to the deferred tax assets and liabilities as of December 31, 2010 and 2009 were as follows:
|
2010 Deferred
|
2009 Deferred
|
||||||||||||
|
Asset
|
Liability
|
Asset
|
Liability
|
||||||||||
|
(In thousands)
|
|||||||||||||
|
Prepaid expenses
|
$
|
—
|
415
|
$
|
—
|
$
|
379
|
||||||
|
Allowance for loan losses
|
10,590
|
—
|
9,701
|
—
|
|||||||||
|
Mortgage servicing rights
|
—
|
2,887
|
—
|
3,028
|
|||||||||
|
Investment securities
|
—
|
1
|
—
|
—
|
|||||||||
|
Premises and equipment
|
—
|
2,192
|
—
|
1,798
|
|||||||||
|
Stock dividends on FHLB stock
|
—
|
155
|
—
|
166
|
|||||||||
|
Loans
|
52
|
—
|
9
|
—
|
|||||||||
|
Unrealized gain on securities available for sale
|
—
|
394
|
—
|
93
|
|||||||||
|
Accrued compensation
|
293
|
—
|
336
|
||||||||||
|
Stock options and stock appreciation rights expensed
|
377
|
—
|
354
|
—
|
|||||||||
|
Other real estate owned (OREO)
|
319
|
—
|
43
|
—
|
|||||||||
|
Total deferred taxes
|
$
|
11,631
|
6,044
|
$
|
10,443
|
$
|
5,464
|
||||||
The net deferred tax asset of $5.6 million and $4.9 million in 2010 and 2009, respectively, was reported in net deferred tax assets on the balance sheet.
A valuation allowance is established when it is more likely than not that all or a portion of a deferred tax will not be realized. Although realization is not assured, management believes it is more likely than not that all of the deferred tax asset will be realized. The amount of the deferred tax asset considered realizable could be reduced as the Company's circumstances change.
Items causing differences between the Federal statutory tax rate and the effective tax rate are summarized as follows:
|
Year ended December 31,
|
|||||||||||||||||
|
2010
|
2009
|
2008
|
|||||||||||||||
|
Amount
|
Rate
|
Amount
|
Rate
|
Amount
|
Rate
|
||||||||||||
|
(In thousands)
|
|||||||||||||||||
|
Federal statutory tax rate
|
$
|
661
|
34.00
|
%
|
$
|
1,729
|
35.00
|
%
|
$
|
4,404
|
35.00
|
%
|
|||||
|
Net tax exempt interest income
|
(360
|
)
|
(18.53
|
)
|
(337
|
)
|
(6.81
|
)
|
(255
|
)
|
(2.03
|
)
|
|||||
|
Interest disallowance
|
21
|
1.08
|
31
|
0.62
|
25
|
0.20
|
|||||||||||
|
Nondeductible expenses
|
203
|
10.45
|
38
|
0.77
|
50
|
0.40
|
|||||||||||
|
Tax benefit from exercise of stock options
|
—
|
—
|
(9
|
)
|
(0.18
|
)
|
(38
|
)
|
(0.30
|
)
|
|||||||
|
Other, net
|
—
|
—
|
489
|
9.91
|
(53
|
)
|
(0.42
|
)
|
|||||||||
|
State income tax net of federal benefit
|
141
|
7.26
|
228
|
4.61
|
450
|
3.58
|
|||||||||||
|
Tax credits
|
(406
|
)
|
(20.88
|
)
|
(406
|
)
|
(8.22
|
)
|
—
|
—
|
|||||||
|
Provision for income taxes
|
$
|
260
|
13.38
|
%
|
$
|
1,763
|
35.70
|
%
|
$
|
4,583
|
36.43
|
%
|
|||||
The Company files a consolidated U.S. federal return and New Mexico tax return. The Company does not have nexus in any other state. The Company is no longer subject to income tax examinations by the authorities for years before 2007 for federal and New Mexico purposes..
The Company has no reserves associated with uncertain tax positions at December 31, 2009 and 2010. The Company does not anticipate providing a income tax reserve in the next twelve months. During the years ended December 31, 2009 and 2010 the Company did not record an accrual for interest and penalties associated with uncertain tax positions.
Credit-related financial instruments: The Company is a party to credit-related commitments with off-balance-sheet risk in the normal course of business to meet the financing needs of its customers. These credit-related commitments include commitments to extend credit, standby letters of credit and commercial letters of credit. Such credit-related commitments involve, to varying degrees, elements of credit and interest rate risk in excess of the amount recognized in the consolidated balance sheets.
The Company’s exposure to credit loss is represented by the contractual amount of these credit-related commitments. The Company follows the same credit policies in making credit-related commitments as it does for on-balance-sheet instruments.
At December 31, 2010 and 2009, the following credit-related commitments were outstanding:
|
Contract Amount
|
||||||||
|
December 31,
|
||||||||
|
2010
|
2009
|
|||||||
|
(In thousands)
|
||||||||
|
Unfunded commitments under lines of credit
|
$
|
164,850
|
$
|
155,535
|
||||
|
Commercial and standby letters of credit
|
14,051
|
14,628
|
||||||
Commitments to extend credit are agreements to lend to a customer as long as there is no violation of any condition established in the contract. Commitments generally have fixed expiration dates or other termination clauses and may require a payment of a fee. The commitments for equity lines of credit may expire without being drawn upon. Therefore, the total commitment amounts do not necessarily represent future cash requirements. The amount of collateral obtained, if deemed necessary by the Bank, is based on management’s credit evaluation of the customer. Unfunded commitments under commercial lines of credit, revolving credit lines and overdraft protection agreements are commitments for possible future extensions of credit to existing customers. Overdraft protection agreements are uncollateralized, but most other unfunded commitments have collateral. These unfunded lines of credit usually do not contain a specified maturity date and may not necessarily be drawn upon to the total extent to which the Bank is committed.
Outstanding Letters of Credit: In addition to short and long term borrowings from the Federal Home Loan Bank (FHLB), the FHLB has issued letters of credit to various public entities with deposits at the Bank. These letters of credit are issued to collateralize the deposits of these entities at the Bank as required or allowed under law. The total value of these letters of credit was $229.5 million and $292.1 million as of December 31, 2010 and December 31, 2009, respectively. As of December 31, 2010, all letters of credit had original terms of approximately one year. These letters are secured under the blanket assignment of mortgage loans or other collateral acceptable to the FHLB that also secures our short and long term borrowings from FHLB.
Commercial and standby letters of credit are conditional credit-related commitments issued by the Bank to guarantee the performance of a customer to a third party. Those letters of credit are primarily issued to support public and private borrowing arrangements. Essentially all letters of credit issued have expiration dates within one year. The credit risk involved in issuing letters of credit is the same as that involved in extending loans to customers. The Bank generally holds collateral supporting those credit-related commitments, if deemed necessary. In the event the customer does not perform in accordance with the terms of the agreement with the third party, the Bank would be required to fund the credit-related commitment. The maximum potential amount of future payments the Bank could be required to make is represented by the contractual amount shown in the summary above. If the credit-related commitment is funded, the Bank would be entitled to seek recovery from the customer. At December 31, 2010 and 2009, no amounts have been recorded as liabilities for the Company’s potential obligations under these credit-related commitments. The fair value of these credit-related commitments is approximately equal to the fees collected when granting these letters of credit. These fees collected were $13 thousand and $24 thousand as of December 31, 2010 and 2009, respectively, and are included in “other liabilities” on the Company’s balance sheet.
Concentrations of credit risk: The majority of the loans, commitments to extend credit, and standby letters of credit have been granted to customers in Los Alamos, Santa Fe and surrounding communities. Although the Bank has a diversified loan portfolio, a substantial portion of its loans are made to businesses and individuals associated with, or employed by, Los Alamos National Laboratory (“the Laboratory”). The ability of such borrowers to honor their contracts is predominately dependent upon the continued operation and funding of the Laboratory. Investments in securities issued by state and political subdivisions involve governmental entities within the state of New Mexico. The distribution of commitments to extend credit approximates the distribution of loans outstanding. Standby letters of credit are granted primarily to commercial borrowers.
On March 27, 2009, the Company issued two series of preferred shares to the Treasury under the Capital Purchase Program (“CPP”). Below is a table disclosing the information on these two series:
|
Number
of shares issued
|
Dividend rate
|
Liquidation value per share
|
Original cost, in thousands
|
|||||||
|
Series A cumulative perpetual preferred shares
|
35,539
|
5 % for the first 5 years, thereafter 9%
|
$
|
1,000
|
$
|
33,437
|
||||
|
Series B cumulative perpetual preferred shares
|
1,777
|
9%
|
1,000
|
2,102
|
||||||
Dividends are paid quarterly to Treasury, and the amount of any unpaid dividends outstanding at the end of the quarter is an outstanding liability in “other liabilities” on the balance sheet. The amount of dividends accrued and unpaid as of December 31, 2010 and 2009 was $1.2 million and $242 thousand, respectively.
The difference between the liquidation value of the preferred shares and the original cost is accreted (for Series B) or amortized (for Series A) over 10 years. The net difference of this amortization and accretion is posted directly to capital. For 2010 and 2009, a net amount of $178 thousand and $135 thousand, respectively, was accreted to equity.
Both the dividends and net accretion on the preferred shares reduce the amount of net income available to common shareholders. For 2010 and 2009, the total of these two amounts was $2.1 million and $1.6 million, respectively.
On August 13, 2010, the Company elected to exercise the option to defer the payment of dividends on the Preferred Stock issues, as provided by the agreements under which the stock was issued, which was due for the quarterly period ending on August 16, 2010. On November 8, 2010, the Company again elected to exercise the option to defer the payment of dividends on the Preferred Stock issues due for the quarterly periods ending on November 15, 2010 and February 15, 2011. The dividend payments would normally be paid in the amount of $444,238 for Series A Preferred Stock and $39,983 for Series B Preferred Stock for each of the quarterly periods.
The deferral of the dividends on the Preferred Stock will continue to accrue as dividends payable. Further, the Company is prohibited from declaring or paying any dividends on its common stock while dividend payments on the Preferred Stock are in arrears.
Note 18. Litigation
The Company and its subsidiaries are not involved in any pending legal proceedings, other than routine legal proceedings occurring in the normal course of business and those otherwise specifically stated herein, which, in the opinion of management, are material to our consolidated financial condition.
Note 19. Derivative Financial Instruments
In the normal course of business, the Bank uses a variety of financial instruments to service the financial needs of customers and to reduce its exposure to fluctuations in interest rates. Derivative instruments that the Bank uses as part of its interest rate risk management strategy include mandatory forward delivery commitments and rate lock commitments.
As a result of using over-the-counter derivative instruments, the Bank has potential exposure to credit loss in the event of nonperformance by the counterparties. The Bank manages this credit risk by selecting only well established, financially strong counterparties, spreading the credit risk amongst many such counterparties and by placing contractual limits on the amount of unsecured credit risk from any single counterparty. The Bank’s exposure to credit risk in the event of default by counterparty is the current cost of replacing the contracts net of any available margins retained by the Bank. However, if the borrower defaults on the commitment the Bank requires the borrower to cover these costs.
The Company’s derivative instruments outstanding at December 31, 2010, included commitments to fund loans held for sale. The interest rate lock commitment was valued at fair market value at inception. The rate locks will continue to be adjusted for changes in value resulting from changes in market interest rates.
The Company originates single-family residential loans for sale pursuant to programs with the Federal National Mortgage Association (“FNMA”). At the time the interest rate is locked in by the borrower, the Bank concurrently enters into a forward loan sale agreement with respect to the sale of such loan at a set price in an effort to manage the interest rate risk inherent in the locked loan commitment. Any change in the fair value of the loan commitment after the borrower locks in the interest rate is substantially offset by the corresponding change in the fair value of the forward loan sale agreement related to such loan. The period from the time the borrower locks in the interest rate to the time the Bank funds the loan and sells it to FNMA is generally 60 days. The fair value of each instrument will rise or fall in response to changes in market interest rates subsequent to the dates the interest rate locks and forward loan sale agreements are entered into. In the event that interest rates rise after the Bank enters into an interest rate lock, the fair value of the loan commitment will decline. However, the fair value of the forward loan sale agreement related to such loan commitment should increase by substantially the same amount, effectively eliminating the Company’s interest rate and price risk.
At December 31, 2010, the Company had notional amounts of $8.1 million in contracts with customers and $33.2 million in contracts with FNMA for interest rate lock commitments outstanding related to loans being originated for sale. The related fair values of these commitments were an asset of $567 thousand and a liability of $25 thousand as of December 31, 2010. At December 31, 2009 the Company had notional amounts of $5.0 million in contracts with customers and $14.3 million in contracts with FNMA for interest rate lock commitments outstanding related to loans being originated for sale. The related fair values of these commitments were an asset of $251 thousand and a liability of $1 thousand as of December 31, 2009.
The Company has outstanding loan commitments, excluding undisbursed portion of loans in process and equity lines of credit, of approximately $137.0 million and $123.0 million as of December 31, 2010 and 2009, respectively. Of these commitments outstanding, the breakdown between fixed- and adjustable-rate loans is as follows:
|
At December 31,
|
||||||||
|
2010
|
2009
|
|||||||
|
(In thousands)
|
||||||||
|
Fixed-rate (ranging from 2.2% to 11.0%)
|
$ | 17,805 | $ | 5,258 | ||||
|
Adjustable-rate
|
119,170 | 117,716 | ||||||
|
Total
|
$ | 136,975 | $ | 122,974 | ||||
Note 20. Regulatory Matters
The Company’s primary source of cash is dividends from the Bank. Generally, the Bank is subject to certain restrictions on dividends that it may declare without prior regulatory approval, including as a result of the Agreement with the OCC as described in the Company’s Form 10-K, as amended, filed on August 9, 2010. Generally, the Company cannot pay dividends that exceed its net income or which may weaken its financial health. The Bank cannot pay dividends in any calendar year that, in the aggregate, exceed the Bank’s year-to-date net income plus its retained income for the two proceeding years. Additionally, the Bank cannot pay dividends that are in excess of the amount which would cause the Bank to fall below the minimum required for capital adequacy purposes. The Company is subject to additional dividend restrictions due to its participation in the CPP.
The Company and the Bank are subject to various regulatory capital requirements administered by the federal banking agencies. Failure to meet minimum capital requirements can initiate certain mandatory—and additional discretionary—actions by regulators that, if undertaken, could have a direct material effect on the Company’s financial statements. Under capital adequacy guidelines and the regulatory framework for prompt corrective action, the Company’s and the Bank’s assets, liabilities, and certain off-balance-sheet items are calculated under regulatory accounting practices. The Company’s and the Bank’s capital amounts and classification are also subject to qualitative judgments by the regulators about components, risk weightings, and other factors. Prompt corrective action provisions are not applicable to bank holding companies.
Quantitative measures established by regulation to ensure capital adequacy require the Company and the Bank to maintain minimum amounts and ratios (set forth in the table below) of total and Tier 1 capital (as defined in the regulations) to risk-weighted assets (as defined), and of Tier 1 capital (as defined) to average assets (as defined). The Company and the Bank met all capital adequacy requirements to which they were subject as of December 31, 2010.
As of December 31, 2010: (i) the Bank was not subject to a directive from the OCC to increase its capital; (ii) the Bank exceeded its minimum regulatory capital requirements under OCC capital adequacy guidelines; and (iii) the Bank was “well-capitalized,” as defined by OCC regulations. However, due to a formal written agreement with the OCC, the Bank cannot be considered to be “well-capitalized” as long as the agreement is in effect. As of December 31, 2010, Trinity had regulatory capital in excess of the Federal Reserve’s minimum requirements.
The required and actual amounts and ratios for the Company and the Bank are presented below:
|
Actual
|
For Capital
Adequacy Purposes
|
To be "Well
Capitalized" Under
Prompt Corrective
Action Provisions
|
||||||||||||||||||
|
Amount
|
Ratio
|
Amount
|
Ratio
|
Amount
|
Ratio
|
|||||||||||||||
|
(Dollars in thousands)
|
||||||||||||||||||||
|
As of December 31, 2010
|
||||||||||||||||||||
|
Total capital (to risk-weighted assets):
|
||||||||||||||||||||
|
Consolidated
|
$
|
173,086
|
14.50
|
%
|
$
|
95,516
|
8.00
|
%
|
N/A
|
N/A
|
||||||||||
|
Bank only
|
169,209
|
14.26
|
94,938
|
8.00
|
$
|
118,672
|
10.00
|
%
|
||||||||||||
|
Tier 1 capital (to risk-weighted assets):
|
||||||||||||||||||||
|
Consolidated
|
157,985
|
13.23
|
%
|
47,758
|
4.00
|
%
|
N/A
|
N/A
|
||||||||||||
|
Bank only
|
154,197
|
12.99
|
47,469
|
4.00
|
71,203
|
6.00
|
||||||||||||||
|
Tier 1 capital (to average assets):
|
||||||||||||||||||||
|
Consolidated
|
157,985
|
9.82
|
%
|
64,340
|
4.00
|
%
|
N/A
|
N/A
|
||||||||||||
|
Bank only
|
154,197
|
9.64
|
63,995
|
4.00
|
79,994
|
5.00
|
||||||||||||||
|
Actual
|
For Capital
Adequacy Purposes
|
To be "Well
Capitalized" Under
Prompt Corrective
Action Provisions
|
||||||||||||||||||
|
Amount
|
Ratio
|
Amount
|
Ratio
|
Amount
|
Ratio
|
|||||||||||||||
|
(Dollars in thousands)
|
||||||||||||||||||||
|
As of December 31, 2009
|
||||||||||||||||||||
|
Total capital (to risk-weighted assets):
|
||||||||||||||||||||
|
Consolidated
|
$
|
173,370
|
14.16
|
%
|
$
|
97,955
|
8.00
|
%
|
N/A
|
N/A
|
||||||||||
|
Bank only
|
165,868
|
13.63
|
97,376
|
8.00
|
$
|
121,721
|
10.00
|
%
|
||||||||||||
|
Tier 1 capital (to risk-weighted assets):
|
||||||||||||||||||||
|
Consolidated
|
157,945
|
12.90
|
%
|
48,978
|
4.00
|
%
|
N/A
|
N/A
|
||||||||||||
|
Bank only
|
150,532
|
12.37
|
48,688
|
4.00
|
73,032
|
6.00
|
||||||||||||||
|
Tier 1 capital (to average assets):
|
||||||||||||||||||||
|
Consolidated
|
157,945
|
9.58
|
%
|
65,945
|
4.00
|
%
|
N/A
|
N/A
|
||||||||||||
|
Bank only
|
150,532
|
9.18
|
65,614
|
4.00
|
82,017
|
5.00
|
||||||||||||||
_________________________
N/A—not applicable
Note 21. Fair Value Measurements
ASC Topic 820 defines fair value as the price that would be received to sell an asset or paid to transfer a liability in an orderly transaction between market participants. A fair value measurement assumes that the transaction to sell the asset or transfer the liability occurs in the principal market for the asset or liability or, in the absence of a principal market, the most advantageous market for the asset or liability. The price in the principal (or most advantageous) market used to measure the fair value of the asset or liability shall not be adjusted for transaction costs. An orderly transaction is a transaction that assumes exposure to the market for a period prior to the measurement date to allow for marketing activities that are usual and customary for transactions involving such assets and liabilities; it is not a forced transaction. Market participants are buyers and sellers in the principal market that are (i) independent, (ii) knowledgeable, (iii) able to transact and (iv) willing to transact.
ASC Topic 820 requires the use of valuation techniques that are consistent with the market approach, the income approach and/or the cost approach. The market approach uses prices and other relevant information generated by market transactions involving identical or comparable assets and liabilities. The income approach uses valuation techniques to convert expected future amounts, such as cash flows or earnings, to a single present value amount on a discounted basis. The cost approach is based on the amount that currently would be required to replace the service capacity of an asset (replacement cost). Valuation techniques should be consistently applied. Inputs to valuation techniques refer to the assumptions that market participants would use in pricing the asset or liability. Inputs may be observable, meaning those that reflect the assumptions market participants would use in pricing the asset or liability developed based on market data obtained from independent sources, or unobservable, meaning those that reflect the reporting entity's own assumptions about the assumptions market participants would use in pricing the asset or liability developed based on the best information available in the circumstances. In that regard, ASC Topic 820 establishes a fair value hierarchy for valuation inputs that gives the highest priority to quoted prices in active markets for identical assets or liabilities and the lowest priority to unobservable inputs. The fair value hierarchy is as follows:
|
·
|
Level 1: Quoted prices (unadjusted) for identical assets or liabilities in active markets that the entity has the ability to access as of the measurement date.
|
|
·
|
Level 2: Significant other observable inputs other than Level 1 prices such as quoted prices for similar assets or liabilities; quoted prices in markets that are not active; or other inputs that are observable or can be corroborated by observable market data.
|
|
·
|
Level 3: Significant unobservable inputs that reflect a reporting entity’s own assumptions about the assumptions that market participants would use in pricing an asset or liability.
|
A description of the valuation methodologies used for instruments measured at fair value, as well as the general classification of such instruments pursuant to the valuation hierarchy, is set forth below.
In general, fair value is based upon quoted market prices, where available. If such quoted market prices are not available, fair value is based upon internally developed models that primarily use observable market-based parameters as inputs. Valuation adjustments may be made to ensure that financial instruments are recorded at fair value. These adjustments may include amounts to reflect counterparty credit quality, the Company's creditworthiness, among other things, as well as unobservable parameters. Any such valuation adjustments are applied consistently over time. Our valuation methodologies may produce a fair value calculation that may not be indicative of net realizable value or reflective of future fair values. While management believes the Company’s valuation methodologies are appropriate and consistent with other market participants, the use of different methodologies or assumptions to determine the fair value of certain financial instruments could result in a different estimate of fair value at the reporting date. Transfers between levels of the fair value hierarchy are recognized on the actual date of the event or circumstances that caused the transfer, which generally coincides with the Company’s monthly and/or quarterly valuation process.
Financial Instruments Recorded at Fair Value on a Recurring Basis
Securities Available for Sale. The fair values of securities available for sale are determined by quoted prices in active markets, when available. If quoted market prices are not available, the fair value is determined by a matrix pricing, which is a mathematical technique, widely used in the industry to value debt securities without relying exclusively on quoted prices for the specific securities but rather by relying on the securities’ relationship to other benchmark quoted securities.
Derivatives. Derivative assets and liabilities represent interest rate contracts between the Company and loan customers, and between the Company and outside parties to whom we have made a commitment to sell residential mortgage loans at a set interest rate. These are valued based upon the differential between the interest rates upon the inception of the contract and the current market interest rates for similar products. Changes in market value are recorded in current earnings.
The following table summarizes financial assets and financial liabilities measured at fair value on a recurring basis as of December 31, 2010 and 2009, segregated by the level of the valuation inputs within the fair value hierarchy utilized to measure fair value (in thousands):
|
2010
|
Total
|
Quoted Prices in Active Markets for Identical Assets (Level 1)
|
Significant Other Observable Inputs (Level 2)
|
Significant Unobservable Inputs
(Level 3)
|
||||||||||||
|
(In thousands)
|
||||||||||||||||
|
Financial Assets:
|
||||||||||||||||
|
Investment securities available for sale:
|
||||||||||||||||
|
U.S. Government sponsored agencies
|
$
|
42,735
|
$
|
-
|
$
|
42,735
|
$
|
-
|
||||||||
|
States and political subdivisions
|
20,584
|
-
|
20,584
|
-
|
||||||||||||
|
Residential mortgage-backed securities
|
99,272
|
-
|
99,272
|
-
|
||||||||||||
|
Interest rate lock commitments, mandatory forward delivery commitments and pair offs
|
567
|
-
|
567
|
-
|
||||||||||||
|
Financial Liabilities:
|
||||||||||||||||
|
Interest rate lock commitments, mandatory forward delivery commitments and pair offs
|
$
|
25
|
$
|
-
|
$
|
25
|
$
|
-
|
||||||||
|
Off-balance-sheet instruments:
|
||||||||||||||||
|
Loan commitments and standby letters of credit
|
$
|
13
|
$
|
-
|
$
|
13
|
$
|
-
|
||||||||
|
2009
|
||||||||||||||||
|
Financial Assets:
|
||||||||||||||||
|
Investment securities available for sale:
|
||||||||||||||||
|
Government sponsored agencies
|
$
|
68,382
|
$
|
-
|
$
|
68,382
|
$
|
-
|
||||||||
|
States and political subdivisions
|
26,519
|
-
|
26,519
|
-
|
||||||||||||
|
Residential mortgage-backed securities
|
41,855
|
-
|
41,855
|
-
|
||||||||||||
|
Interest rate lock commitments, mandatory forward delivery commitments and pair offs, net asset
|
251
|
-
|
251
|
-
|
||||||||||||
|
Financial Liabilities:
|
||||||||||||||||
|
Interest rate lock commitments, mandatory forward delivery commitments and pair offs, net liability
|
$
|
1
|
$
|
-
|
$
|
1
|
$
|
-
|
||||||||
|
Off-balance-sheet instruments:
|
||||||||||||||||
|
Loan commitments and standby letters of credit
|
$
|
24
|
$
|
-
|
$
|
24
|
$
|
-
|
||||||||
There were no financial assets measured at fair value on a recurring basis for which the Company used significant unobservable inputs (Level 3) during the periods presented in these financial statements. There were no transfers between the levels used on any asset classes during the year.
Financial Instruments Recorded at Fair Value on a Nonrecurring Basis
The Company may be required, from time to time, to measure certain financial assets and financial liabilities at fair value on a nonrecurring basis in accordance with U.S. generally accepted accounting principles. These include assets that are measured at the lower of cost or market value that were recognized at fair value below cost at the end of the period.
Impaired Loans. Loans for which it is probable that payment of interest and principal will not be made in accordance with the contractual terms of the loan agreement are considered impaired. Once a loan is identified as impaired, management measures the amount of that impairment in accordance with ASC Topic 310. The fair value of impaired loans is estimated using one of several methods, including collateral value, market value of similar debt, enterprise value, liquidation value and discounted cash flows. Those impaired loans not requiring an allowance represent loans for which the fair value of the expected repayments or collateral exceed the recorded investments in such loans. At December 31, 2010, substantially all of the total impaired loans were evaluated based on the fair value of the collateral. In accordance with ASC Topic 820, impaired loans where an allowance is established based on the fair value of collateral require classification in the fair value hierarchy. Collateral values are estimated using Level 3 inputs based on customized discounting criteria. For a majority of impaired loans, the Company obtains a current independent appraisal of loan collateral. Other valuation techniques are used as well, including internal valuations, comparable property analysis and contractual sales information. For substantially all impaired loans with an appraisal more than one year old, the Company further discounts market prices by 10% to 30% and in some cases, up to an additional 50%. This discount is based on our evaluation of related market conditions and is in addition to a reduction in value for potential sales costs and discounting that has been incorporated in the independent appraisal.
Loans held for sale. Loans held for sale are valued based upon open market quotes obtained from the Federal National Mortgage Association (FNMA). Market pricing is based upon mortgage loans with similar terms and interest rates. The change in market value (up to the amortized value of the loans held for sale) is recorded as an adjustment to the loans held for sale valuation allowance, with the offset being recorded as an addition or a reduction to current earnings.
Mortgage Servicing Rights. Mortgage servicing rights (MSRs) are valued based upon the value of MSRs that are traded on the open market and a current market value for each risk tranche in our portfolio is assigned. We then compare that market value to the current amortized book value for each tranche. The change in market value (up to the amortized value of the MSR) is recorded as an adjustment to the MSR valuation allowance, with the offset being recorded as an addition or a reduction to current earnings. Only the tranches deemed impaired are included in the table found under “Non-Financial Assets and Non-Financial Liabilities Recorded at Fair Value” below.
Non-Financial Assets and Non-Financial Liabilities Recorded at Fair Value
Application of ASC Topic 820 to non-financial assets and non-financial liabilities became effective January 1, 2009. The Company has no non-financial assets or non-financial liabilities measured at fair value on a recurring basis. Certain non-financial assets and non-financial liabilities measured at fair value on a non-recurring basis include foreclosed assets.
Other Real Estate and Other Repossessed Assets (Foreclosed Assets). Foreclosed assets, upon initial recognition, are measured and reported at fair value through a charge-off to the allowance for possible loan losses based upon the fair value of the foreclosed asset. The fair value of foreclosed assets, upon initial recognition, are estimated using Level 3 inputs based on customized discounting criteria.
During 2010 and 2009, certain foreclosed assets, upon initial recognition, were remeasured and reported at fair value through a charge-off to the allowance for loan losses based upon the fair value of the foreclosed asset, less estimated costs of disposal. The fair value of foreclosed asset, upon initial recognition, is estimated using Level 2 inputs based on observable market data or Level 3 inputs based on customized discounting criteria. Foreclosed assets measured at fair value (less estimated disposal costs) upon initial recognition totaled $25.2 million and $25.0 million (utilizing Level 3 valuation inputs) during 2010 and 2009, respectively. Of these, $13.8 million and $16.8 million, respectively, were written down upon initial recognition or subsequent revaluation. In connection with the measurement and initial recognition of the foregoing foreclosed assets, the Company recognized charge-offs of the allowance for loan losses totaling $1.8 million and $3.7 million, during 2010 and 2009, respectively. Other than foreclosed assets measured at fair value (less estimated disposal costs) upon initial recognition, a total of $13.2 million and $2.0 million in foreclosed assets were remeasured at fair value during 2010 and 2009, respectively, resulting in a charge of $1.9 million and $283 thousand to current earnings, respectively.
Assets measured at fair value on a nonrecurring basis as December 31, 2010 and 2009 are included in the table below (in thousands):
|
2010
|
Total
|
Quoted Prices in Active Markets for Identical Assets (Level 1)
|
Significant Other Observable Inputs (Level 2)
|
Significant Unobservable Inputs (Level 3)
|
||||||||||||
|
(In thousands)
|
||||||||||||||||
|
Financial Assets:
|
||||||||||||||||
|
Impaired loans
|
$
|
13,971
|
$
|
-
|
$
|
-
|
$
|
13,971
|
||||||||
|
Loans held for sale
|
12,786
|
-
|
12,786
|
-
|
||||||||||||
|
Mortgage servicing rights
|
2,182
|
-
|
-
|
2,182
|
||||||||||||
|
Non-Financial Assets:
|
||||||||||||||||
|
Foreclosed assets
|
13,794
|
-
|
-
|
13,794
|
||||||||||||
|
2009
|
||||||||||||||||
|
Financial Assets:
|
||||||||||||||||
|
Impaired loans
|
$
|
14,954
|
$
|
-
|
$
|
-
|
$
|
14,954
|
||||||||
|
Loans held for sale
|
3,522
|
-
|
3,522
|
-
|
||||||||||||
|
Mortgage servicing rights
|
3,049
|
-
|
-
|
3,049
|
||||||||||||
|
Non-Financial Assets:
|
||||||||||||||||
|
Foreclosed assets
|
16,750
|
-
|
-
|
16,750
|
||||||||||||
ASC Topic 825 requires disclosure of the fair value of financial assets and financial liabilities, including those financial assets and financial liabilities that are not measured and reported at fair value on a recurring basis or non-recurring basis. The methodologies for estimating the fair value of financial assets and financial liabilities that are measured at fair value on a recurring or non-recurring basis are discussed above. The estimated fair value approximates carrying value for cash and cash equivalents and accrued interest. The methodologies for other financial assets and financial liabilities are discussed below:
The following methods and assumptions were used by the Company in estimating the fair values of its other financial instruments:
Cash and due from banks and interest bearing deposits with banks: The carrying amounts reported in the balance sheet approximate fair value.
Non-marketable securities, including FHLB and FRB Stock: The carrying amounts reported in the balance sheet approximate fair value.
Federal funds sold and securities purchased under resell agreements: The carrying amounts reported in the balance sheet approximate fair value.
Loans: Most commercial loans and some real estate mortgage loans are made on a variable rate basis. For those variable-rate loans that reprice frequently with no significant change in credit risk, fair values are based on carrying values. The fair values for fixed rate and all other loans are estimated using discounted cash flow analyses, using interest rates currently being offered for loans with similar terms to borrowers with similar credit quality.
Non-interest bearing deposits: The fair values disclosed are equal to their balance sheet carrying amounts, which represent the amount payable on demand.
Interest bearing deposits: The fair values disclosed for deposits with no defined maturities are equal to their carrying amounts, which represent the amounts payable on demand. The carrying amounts for variable-rate, fixed-term money market accounts and certificates of deposit approximate their fair values at the reporting date. Fair values for fixed-rate certificates of deposit are estimated using a discounted cash flow calculation that applies interest rates currently being offered on similar certificates to a schedule of aggregated expected monthly maturities on time deposits.
Short-term borrowings: The carrying amounts of federal funds purchased, borrowings under repurchase agreements and other short-term borrowings with maturities of 90 days or less approximate their fair values. The fair value of short-term borrowings greater than 90 days is based on the discounted value of contractual cash flows.
Long-term borrowings: The fair values of the Company's long-term borrowings (other than deposits) are estimated using discounted cash flow analyses, based on the Company's current incremental borrowing rates for similar types of borrowing arrangements.
Junior subordinated notes issued to capital trusts: The fair values of the Company’s junior subordinated notes issued to capital trusts are estimated based on the quoted market prices, when available, of the related trust preferred security instruments, or are estimated based on the quoted market prices of comparable trust preferred securities.
Off-balance-sheet instruments: Fair values for the Company's off-balance-sheet lending commitments in the form of letters of credit are based on fees currently charged to enter into similar agreements, taking into account the remaining terms of the agreements.
Accrued interest: The carrying amounts reported in the balance sheet approximate fair value.
The estimated fair values of financial instruments are as follows:
|
December 31,
|
||||||||||||||||
|
2010
|
2009
|
|||||||||||||||
|
Carrying amount
|
Fair value
|
Carrying amount
|
Fair value
|
|||||||||||||
|
(In thousands)
|
||||||||||||||||
|
Financial assets:
|
||||||||||||||||
|
Cash and due from banks
|
$
|
16,765
|
$
|
16,765
|
$
|
18,761
|
$
|
18,761
|
||||||||
|
Interest-bearing deposits with banks
|
89,316
|
89,316
|
188,114
|
188,114
|
||||||||||||
|
Federal funds sold and securities purchased under resell agreements
|
110
|
110
|
620
|
620
|
||||||||||||
|
Investments:
|
||||||||||||||||
|
Available for sale
|
162,591
|
162,591
|
136,756
|
136,756
|
||||||||||||
|
Held to maturity
|
11,107
|
10,951
|
11,436
|
10,808
|
||||||||||||
|
Other investments
|
9,335
|
9,335
|
9,568
|
9,568
|
||||||||||||
|
Loans, net
|
1,161,216
|
1,170,701
|
1,215,282
|
1,203,138
|
||||||||||||
|
Loans held for sale
|
25,080
|
25,223
|
9,245
|
9,268
|
||||||||||||
|
Accrued interest receivable
|
6,736
|
6,736
|
6,840
|
6,840
|
||||||||||||
|
Mortgage servicing rights
|
7,960
|
8,585
|
7,647
|
8,754
|
||||||||||||
|
Derivative financial instruments
|
567
|
567
|
251
|
251
|
||||||||||||
|
Financial liabilities:
|
||||||||||||||||
|
Non-interest bearing deposits
|
$
|
109,891
|
$
|
109,891
|
$
|
87,238
|
$
|
87,238
|
||||||||
|
Interest bearing deposits
|
1,248,454
|
1,253,836
|
1,381,207
|
1,385,968
|
||||||||||||
|
Short-term borrowings
|
1,152
|
1,155
|
20,000
|
20,182
|
||||||||||||
|
Long-term borrowings
|
32,300
|
33,886
|
13,493
|
14,620
|
||||||||||||
|
Junior subordinated debt owed to unconsolidated trusts
|
37,116
|
18,506
|
37,116
|
18,118
|
||||||||||||
|
Accrued interest payable
|
4,873
|
4,873
|
5,038
|
5,038
|
||||||||||||
|
Derivative financial instruments
|
25
|
25
|
1
|
1
|
||||||||||||
|
Off-balance sheet instruments:
|
||||||||||||||||
|
Standby letters of credit
|
$
|
13
|
$
|
13
|
$
|
24
|
$
|
24
|
||||||||
Note 22. Condensed Parent Company Financial Information
The condensed financial statements of Trinity Capital Corporation (parent company only) are presented below:
Balance Sheets
|
December 31,
|
||||||||
|
2010
|
2009
|
|||||||
|
(In thousands)
|
||||||||
|
Assets
|
||||||||
|
Cash
|
$
|
2,073
|
$
|
5,209
|
||||
|
Investments in subsidiaries
|
158,148
|
153,459
|
||||||
|
Other assets
|
7,960
|
8,389
|
||||||
|
Total assets
|
$
|
168,181
|
$
|
167,057
|
||||
|
Liabilities and Stockholders' Equity
|
||||||||
|
Dividends payable
|
$
|
1,223
|
$
|
1,981
|
||||
|
Junior subordinated debt owed to unconsolidated trusts
|
37,116
|
37,116
|
||||||
|
Other liabilities
|
6,387
|
5,058
|
||||||
|
Stock owned by Employee Stock Ownership Plan (ESOP) participants
|
6,132
|
12,541
|
||||||
|
Stockholders' equity
|
117,323
|
110,361
|
||||||
|
Total liabilities and stockholders' equity
|
$
|
168,181
|
$
|
167,057
|
||||
Statements of Income
|
Year Ended December 31,
|
||||||||||||
|
2010
|
2009
|
2008
|
||||||||||
|
(In thousands)
|
||||||||||||
|
Dividends from subsidiaries
|
$
|
41
|
$
|
9,083
|
$
|
8,816
|
||||||
|
Interest and other income
|
512
|
253
|
246
|
|||||||||
|
Interest and other expense
|
(3,292
|
)
|
(3,297
|
)
|
(3,536
|
)
|
||||||
|
Income before income tax benefit and equity in undistributed net income of subsidiaries
|
(2,739
|
)
|
6,039
|
5,526
|
||||||||
|
Income tax benefit
|
796
|
819
|
1,262
|
|||||||||
|
Income before equity in undistributed net income of subsidiaries
|
(1,943
|
)
|
6,858
|
6,788
|
||||||||
|
Equity in undistributed net income of subsidiaries
|
3,626
|
(3,682
|
)
|
1,211
|
||||||||
|
Net income
|
$
|
1,683
|
$
|
3,176
|
$
|
7,999
|
||||||
|
Dividends and discount accretion on preferred shares
|
2,127
|
1,604
|
-
|
|||||||||
|
Net income available to common shareholders
|
$
|
(444
|
)
|
$
|
1,572
|
$
|
7,999
|
|||||
Statements of Cash Flows
|
Year Ended December 31,
|
||||||||||||
|
2010
|
2009
|
2008
|
||||||||||
|
(In thousands)
|
||||||||||||
|
Cash Flows From Operating Activities
|
||||||||||||
|
Net income
|
$
|
1,683
|
$
|
3,176
|
$
|
7,999
|
||||||
|
Adjustments to reconcile net income to net cash (used in ) operating activities
|
||||||||||||
|
Amortization of junior subordinated debt owed to unconsolidated trusts issuance costs
|
14
|
14
|
14
|
|||||||||
|
Equity in undistributed net income of subsidiaries
|
(3,626
|
)
|
3,682
|
(1,211
|
)
|
|||||||
|
(Increase) decrease in taxes receivable from subsidiaries
|
335
|
(1,083
|
)
|
73
|
||||||||
|
Decrease (increase) in other assets
|
415
|
(600
|
)
|
(2,217
|
)
|
|||||||
|
Increase (decrease) in other liabilities
|
(453
|
)
|
2,164
|
1,282
|
||||||||
|
(Decrease) increase in TPS accrued dividend payable
|
1,344
|
(8
|
)
|
(13
|
)
|
|||||||
|
Tax benefit recognized for exercise of stock options
|
-
|
(10
|
)
|
(43
|
)
|
|||||||
|
Net cash (used in) provided by operating activities
|
(288
|
)
|
7,335
|
5,884
|
||||||||
|
Cash Flows From Investing Activities
|
||||||||||||
|
Investments in and advances to subsidiaries
|
(410
|
)
|
(35,686
|
)
|
(220
|
)
|
||||||
|
Net cash (used in) investing activities
|
(410
|
)
|
(35,686
|
)
|
(220
|
)
|
||||||
|
Cash Flows from Financing Activities
|
||||||||||||
|
Purchase of treasury stock
|
(9
|
)
|
(473
|
)
|
(1,802
|
)
|
||||||
|
Issuance of treasury stock
|
280
|
436
|
543
|
|||||||||
|
Issuance of preferred stock
|
-
|
35,539
|
-
|
|||||||||
|
Common shares dividend payments
|
(1,739
|
)
|
(5,155
|
)
|
(5,176
|
)
|
||||||
|
Preferred shares dividend payments
|
(970
|
)
|
(1,227
|
)
|
-
|
|||||||
|
Dividends paid on unearned Employee Stock Ownership Plan (ESOP) stock
|
-
|
-
|
(14
|
)
|
||||||||
|
Tax benefit recognized for exercise of stock options
|
-
|
10
|
43
|
|||||||||
|
Net cash provided by (used in) financing activities
|
(2,438
|
)
|
29,130
|
(6,406
|
)
|
|||||||
|
Net increase (decrease) in cash
|
(3,136
|
)
|
779
|
(742
|
)
|
|||||||
|
Cash:
|
||||||||||||
|
Beginning of year
|
5,209
|
4,430
|
5,172
|
|||||||||
|
End of year
|
$
|
2,073
|
$
|
5,209
|
$
|
4,430
|
||||||
Note 23. Income by Quarter (Unaudited)
Presented in the table below is the income of the Company by quarter:
|
Three Months Ended 2010
|
Three Months Ended 2009
|
|||||||||||||||||||||||||||||||
|
December 31
|
September 30
|
June 30
|
March 31
|
December 31
|
September 30
|
June 30
|
March 31
|
|||||||||||||||||||||||||
|
(Thousands of dollars, except per share data)
|
||||||||||||||||||||||||||||||||
|
Interest income
|
$
|
17,270
|
$
|
19,090
|
$
|
17,809
|
$
|
18,328
|
$
|
18,894
|
$
|
19,131
|
$
|
20,305
|
$
|
19,438
|
||||||||||||||||
|
Interest expense
|
3,819
|
4,313
|
4,626
|
5,057
|
5,649
|
6,079
|
6,183
|
6,066
|
||||||||||||||||||||||||
|
Net interest income
|
13,451
|
14,777
|
13,183
|
13,271
|
13,245
|
13,052
|
14,122
|
13,372
|
||||||||||||||||||||||||
|
Provision for loan losses
|
4,400
|
500
|
11,101
|
4,257
|
5,231
|
4,000
|
12,632
|
4,161
|
||||||||||||||||||||||||
|
Net interest income after provision for loan losses
|
9,051
|
14,277
|
2,082
|
9,014
|
8,014
|
9,052
|
1,490
|
9,211
|
||||||||||||||||||||||||
|
Other income
|
5,277
|
4,328
|
3,464
|
3,056
|
4,795
|
4,239
|
4,961
|
6,494
|
||||||||||||||||||||||||
|
Other expenses
|
11,736
|
13,208
|
12,677
|
10,985
|
12,328
|
10,853
|
9,647
|
10,489
|
||||||||||||||||||||||||
|
Income before income taxes
|
2,592
|
5,397
|
(7,131
|
)
|
1,085
|
481
|
2,438
|
(3,196
|
)
|
5,216
|
||||||||||||||||||||||
|
Income taxes
|
201
|
1,947
|
(2,537
|
)
|
649
|
54
|
1,116
|
(1,392
|
)
|
1,985
|
||||||||||||||||||||||
|
Net income
|
$
|
2,391
|
$
|
3,450
|
$
|
(4,594
|
)
|
$
|
436
|
$
|
427
|
$
|
1,322
|
$
|
(1,804
|
)
|
$
|
3,231
|
||||||||||||||
|
Dividends and discount accretion on preferred shares
|
$
|
538
|
$
|
532
|
$
|
528
|
$
|
529
|
$
|
523
|
$
|
529
|
$
|
529
|
$
|
23
|
||||||||||||||||
|
Net income available to common shareholders
|
$
|
1,853
|
$
|
2,918
|
$
|
(5,122
|
)
|
$
|
(93
|
)
|
$
|
(96
|
)
|
$
|
793
|
$
|
(2,333
|
)
|
$
|
3,208
|
||||||||||||
|
Basic earnings per common share
|
$
|
0.29
|
$
|
0.45
|
$
|
(0.80
|
)
|
$
|
(0.01
|
)
|
$
|
(0.02
|
)
|
$
|
0.12
|
$
|
(0.36
|
)
|
$
|
0.50
|
||||||||||||
|
Diluted earnings per common share
|
$
|
0.29
|
$
|
0.45
|
$
|
(0.80
|
)
|
$
|
(0.01
|
)
|
$
|
(0.02
|
)
|
$
|
0.12
|
$
|
(0.36
|
)
|
$
|
0.50
|
||||||||||||
None.
Evaluation of Disclosure Controls and Procedures
We have established disclosure controls and procedures to ensure that material information relating to the Company, including its consolidated subsidiaries, is made known to the officers who certify our financial reports and to other members of senior management and the board of directors and to ensure that information that is required to be disclosed in reports we file with the SEC is properly and timely recorded, processed, summarized and reported. A review and evaluation was performed by our management, including the Company’s Chief Executive Officer (the “CEO”) and Chief Financial Officer (the “CFO”), of the effectiveness of the design and operation of our disclosure controls and procedures as of December 31, 2010 pursuant to Rule 13a-15(b) under the Securities Exchange Act of 1934. Based upon and as of the date of that review and evaluation, the CEO and CFO have concluded that our current disclosure controls and procedures were effective as of December 31, 2010.
Management’s Report on Internal Control Over Financial Reporting
Management’s Report on Internal Control over Financial Reporting appears under Item 8, “Financial Statements and Supplemental Data” of this Form 10-K.
Changes in Internal Control over Financial Reporting
There have been no changes to our internal control over financial reporting during the last fiscal quarter that have affected, or are reasonably likely to affect, our internal control over financial reporting.
None
The following information is incorporated herein by reference to Trinity’s Proxy Statement for the 2011 Annual Meeting of Shareholders under the headings indicated: information with respect to Trinity’s directors, under the heading “Election of Directors;” information regarding Trinity’s audit committee and its designation of an audit committee financial expert, under the heading “Board of Directors and Corporate Governance – Audit Committee;” information regarding compliance with Section 16(a) of the Securities Exchange Act, under the heading “Section 16(a) Beneficial Ownership Reporting Compliance;” and information regarding Trinity’s executive officers, under the heading “Named Executive Officers.”
Trinity’s Code of Business Conduct and Business Ethics (the “Code”) exemplifies Trinity’s history of requiring adherence to high standards of ethical conduct and business practices. Trinity’s Code is available on Trinity’s website at www.lanb.com/TCC-BCE-Charter.aspx. All of Trinity’s employees, officers, including the Chief Executive Officer, the Chief Financial Officer, and all directors are required to fully comply with the Code. If Trinity’s Code is amended or a waiver is granted, such modification or waiver will be posted promptly on the website in accordance with SEC rules.
The information regarding executive compensation appears in Trinity’s Proxy Statement for the 2011 Annual Meeting of Shareholders under the headings: “Compensation Discussion and Analysis,” “Executive Compensation” and “Director Compensation” and is incorporated herein by reference; provided, however, that the Compensation Committee Report is deemed furnished in this report and will not be deemed incorporated by reference into any filing under the Securities Act or the Exchange Act as a result of furnishing the disclosure in this manner.
The information regarding security ownership of certain beneficial owners and management appears in the Company’s Proxy Statement for the 2011 Annual Meeting of Shareholders under the heading “Security Ownership of Certain Beneficial Owners, Directors and Management” and is incorporated herein by reference.
Aggregated Equity Plan Information. Our current stock-based benefit plans and arrangements consist of the 1998 Stock Option Plan that was approved by shareholders at the 1998 Annual Meeting and the Trinity Capital Corporation 2005 Stock Incentive Plan that was approved by shareholders at the 2005 Annual Meeting. The following table provides information regarding the plans as of December 31, 2010.
|
Plan category
|
Number of securities to be issued upon exercise of outstanding options
|
Weighted-average exercise price of outstanding options
|
Number of securities remaining available for future issuance
|
|
Equity compensation plans approved by security holders
|
384,500
|
$ 27.55
|
333,500
|
|
Equity compensation plans not approved by security holders
|
—
|
—
|
—
|
|
Total
|
384,500
|
$ 27.55
|
333,500
|
The information regarding certain relationships and related transactions appears in the Company’s Proxy Statement for the 2011 Annual Meeting of Shareholders under the headings “Board of Directors and Corporate Governance – Director Independence” and “Board of Directors and Corporate Governance – Related Party Transactions” and is incorporated herein by reference.
The information regarding the principal accounting fees and services appears in the Company’s Proxy Statement for the 2011 Annual Meeting of Shareholders under the heading “Approval of Independent Registered Public Accountants” and is hereby incorporated by reference.
Financial Statements. All financial statements of Trinity are set forth under Item 8 of this Form 10-K.
Exhibits. The following exhibits are filed as part of this Form 10-K:
|
3.1 (1)
|
Articles of Incorporation of Trinity Capital Corporation
|
||
|
3.2 (1)
|
Amended and Restated By-Laws of Trinity Capital Corporation
|
||
|
3.3 (9)
|
Amendment to the Articles of Incorporation establishing the CPP Preferred Shares, effective on March 25, 2009
|
||
|
3.4 (9)
|
Amendment to the Articles of Incorporation establishing the Warrant Preferred Shares, effective on March 25, 2009
|
||
|
4.1 (1)
|
Indenture dated as of March 23, 2000 among Trinity Capital Corporation, Trinity Capital Trust I and The Bank of New York
|
||
|
4.3 (6)
|
Indenture dated as of May 11, 2004 between Trinity Capital Corporation, Trinity Capital Trust III and Wells Fargo Bank, National Association
|
||
|
4.4 (4)
|
Indenture dated as of June 29, 2005 between Trinity Capital Corporation, Trinity Capital Trust IV and Wilmington Trust Company
|
||
|
4.5 (5)
|
Indenture dated as of September 21, 2006 between Trinity Capital Corporation, Trinity Capital Trust V and Wilmington Trust Company.
|
||
|
4.6 (9)
|
Warrant to Purchase up to 1,777.01777 shares of Fixed Rate Cumulative Perpetual Preferred Stock, Series B, dated March 27, 2009
|
||
|
10.1 (1)
|
Los Alamos National Bank Employee Stock Ownership Plan
|
||
|
10.2 (1)
|
Trinity Capital Corporation 1998 Stock Option Plan
|
||
|
10.4 (2)
|
Form of stock option grant agreement
|
||
|
10.5 (3)
|
Trinity Capital Corporation 2005 Stock Incentive Plan
|
||
|
10.6 (3)
|
Trinity Capital Corporation 2005 Deferred Income Plan
|
||
|
10.7 (6)
|
Director fee schedule
|
||
|
10.8 (2)
|
Form of stock appreciation right grant agreement
|
||
|
10.9 (7)
|
Employment Agreement dated January 16, 2007 between Trinity Capital Corporation, Los Alamos National Bank and William C. Enloe
|
||
|
10.10 (7)
|
Employment Agreement dated January 16, 2007 between Trinity Capital Corporation, Los Alamos National Bank and Steve W. Wells
|
||
|
10.11 (8)
|
Amendment to Employment Agreement dated January 16, 2007 between Trinity Capital Corporation, Los Alamos National Bank and William C. Enloe dated March 13, 2008.
|
||
|
10.12 (8)
|
Amendment to Employment Agreement dated January 16, 2007 between Trinity Capital Corporation, Los Alamos National Bank and Steve W. Wells dated March 13, 2008.
|
|
|
10.13 (12)
|
Amendment to Trinity Capital Corporation 1998 Stock Option Plan
|
|
|
10.14 (12)
|
Amendment to Trinity Capital Corporation 2005 Deferred Compensation Plan
|
|
|
10.15 (9)
|
Letter Agreement, dated March 27, 2009, including the Securities Purchase Agreement attached thereto, between Trinity and the United States Department of the Treasury
|
|
|
10.16 (9)
|
Form of Waiver, executed by each of the Senior Executive Officers and the two other highest compensated employees
|
|
|
10.17 (10)
|
Trinity Capital Corporation Employee Stock Ownership Plan and Trust (As Amended and Restated Effective January 1, 2009) adopted on April 23, 2009
|
|
|
10.18 (11)
|
Agreement by and between Los Alamos National Bank and The Comptroller of the Currency, dated January 26, 2010
|
|
|
10.19 (9)
|
Form of Omnibus Compensation Amendment executed by each of the Senior Executive Officers and the two other highest compensated employees
|
|
|
10.20 (9)
|
Side Letter Agreement, dated March 27, 2009, between Trinity and the United States Department of the Treasury
|
|
_________________________
(1) Incorporated by reference to the Company’s Form 10 filed on April 30, 2003, as amended.
(2) Incorporated by reference to the Company’s Form 8-K filed August 22, 2005
(3) Incorporated by reference to the Company’s Form S-8 filed on July 28, 2005
(4) Incorporated by reference to the Company’s Form 10-Q filed on August 9, 2005
(5) Incorporated by reference to the Company’s Form 10-Q filed on November 9, 2006
(6) Incorporated by reference to the Company’s Form 10-K for the fiscal year ended December 31, 2004
(7) Incorporated by reference to the Company’s Form 10-K for the fiscal year ended December 31, 2006
(8) Incorporated by reference to the Company’s Form 10-K for the fiscal year ended December 31, 2007
(9) Incorporated by reference to the Company’s Form 8-K filed on March 27, 2009
(10) Incorporated by reference to the Company’s Form 10-Q filed on May 11, 2009
(11) Incorporated by reference to the Company’s Form 8-K filed on February 1, 2010
(12) Incorporated by reference to the Company’s Form 10-K for the fiscal year ended December 31, 2008
Pursuant to the requirements of Section 12 of the Securities Exchange Act of 1934, the registrant has duly caused this registration statement to be signed on its behalf by the undersigned, thereunto duly authorized.
|
Date: March 10, 2011
|
TRINITY CAPITAL CORPORATION
|
||
|
By:
|
/s/ William C. Enloe
|
||
|
William C. Enloe
President and Chief Executive Officer
|
|||
Pursuant to the requirements of the Securities Exchange Act of 1934, this report has been signed by the following persons on behalf of the Registrant and in the capacities and on the dates indicated.
|
Name
|
Title
|
Date
|
||
|
/s/ William C. Enloe
|
President, Chief Executive Officer
|
March 10, 2011
|
||
|
William C. Enloe
|
and Director
|
|||
|
/s/ Daniel R. Bartholomew
|
Chief Financial Officer
|
March 10, 2011
|
||
|
Daniel R. Bartholomew
|
and Principal Accounting Officer
|
|||
|
/s/ Robert P. Worcester
|
||||
|
Robert P. Worcester
|
Chairman of the Board and Director
|
March 10, 2011
|
||
|
/s/ Jeffrey F. Howell
|
||||
|
Jeffrey F. Howell
|
Director
|
March 10, 2011
|
||
|
/s/ Deborah U. Johnson
|
||||
|
Deborah U. Johnson
|
Director
|
March 10, 2011
|
||
|
/s/ Jerry Kindsfather
|
||||
|
Jerry Kindsfather
|
Director
|
March 10, 2011
|
||
|
/s/ Arthur B. Montoya, Jr.
|
||||
|
Arthur B. Montoya, Jr.
|
Director
|
March 10, 2011
|
||
|
/s/ Stanley D. Primak
|
||||
|
Stanley D. Primak
|
Vice-Chairman and Director
|
March 10, 2011
|
||
|
/s/ Charles A. Slocomb
|
||||
|
Charles A. Slocomb
|
Director
|
March 10, 2011
|
||
|
/s/ Steve W. Wells
|
||||
|
Steve W. Wells
|
Secretary and Director
|
March 10, 2011
|
||