Attached files
| file | filename |
|---|---|
| 8-K - FORM 8-K - MOSAIC CO | d8k.htm |
Exhibit 99.1

Long Term P&K Outlook
Robust Demand Growth

Market Mosaic is a quarterly newsletter published for our customers, suppliers and stakeholders by the Market and Strategic Analysis group of The Mosaic Company. The spring and fall issues recap our assessment of the near term outlook for agricultural and crop nutrient markets. The summer and winter issues provide an in-depth look at a topic of special interest to our readers. This special-topic issue examines the long term outlook for agricultural, phosphate and potash markets.
Michael R. Rahm
Vice President Market and Strategic Analysis
mike.rahm@mosaicco.com
Luis F. Dowling
Manager Market and Strategic Analysis
luis.dowling@mosaicco.com
Joseph Fung
Sr. Market Analyst
joseph.fung@mosaicco.com
Mathew Philippi
Data Analyst
matt.philippi@mosaicco.com
The prospect of robust demand growth is the showcase feature of the long term outlook for crop nutrient markets. Our analysis concludes that farmers will have to plant record area and reap ever increasing yields in order to meet the accelerating demand for agricultural commodities during this decade. An increasingly sophisticated bundle of crop inputs including next generation seed technologies as well as the right prescription of crop nutrients will be needed to achieve such productivity gains.
Given this upbeat demand outlook, the next question is whether new phosphate (P) and potash (K) capacity under construction or planned will result in too little, too much or just the right amount of additional supply to meet projected demand. This issue of Market Mosaic examines this Goldilocks question and provides our assessment of the long term outlook for global P&K markets.
In the case of phosphate, pundits have long warned of an impending oversupply due to the development of the high profile Ma’aden project in Saudi Arabia, the expected completion of several hubs at OCP’s Jorf Lasfar complex in Morocco and further expansions in China. We have a different view. Our analysis indicates that significant net additions to supply are needed to keep pace with projected demand growth this decade. In fact, this analysis concludes that the global operating rate will remain at relatively high levels even with the completion of several large projects during the next 10 years.
In the case of potash, producers are investing profits back into the business and large brownfield expansions by nearly all of the major producers look sufficient to meet bullish demand forecasts this decade. Our analysis indicates that a price of about $600 per tonne at the mine is required to generate a return on invested capital that meets even modest corporate thresholds for a greenfield project in Saskatchewan. The corollary is greenfield projects developed this decade likely will proceed for other reasons. This analysis concludes that the global operating rate will range from about 80% to 85% throughout the decade. Those are high rates by mining standards but they are less than the extraordinarily high rates from 2004 to 2008 when producers and distributors scrambled to meet demand and drained inventories throughout the supply chain. These projected rates would facilitate more timely and efficient movement of product through the supply chain and provide a cushion if demand grows at faster rates or some projects included in this analysis are delayed or cancelled.
Our answer to the Goldilocks question is that long term P&K demand prospects make these look like awfully big bowls of porridge and, from our supply perspective, the porridge appears neither too hot nor too cold.
– continued inside
The Food Story by the Numbers
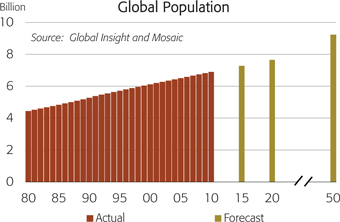
The prospect of robust demand growth is underpinned by the basic materials story in general and the food and energy stories in particular. Everyone knows the food story. Global food demand is increasing at a faster pace as a result of steady population growth and impressive gains in per capita income, especially in the large and rapidly developing Asian countries (see insert). Rising incomes are creating a larger and more affluent middle class who are upgrading diets with more protein-rich and grain-intensive foods such as meat, eggs and dairy products. As a consequence, farmers around the world will need to harvest record area and reap ever increasing yields in order for food supplies to keep pace with accelerating demand.
Analysts (including us) sometimes struggle to find creative ways to re-tell this story. We simply are going to let the numbers tell it. A statistical model was used to estimate the relationship between global grain and oilseed use and population and income. The
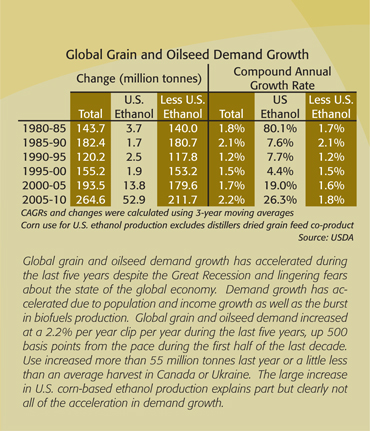
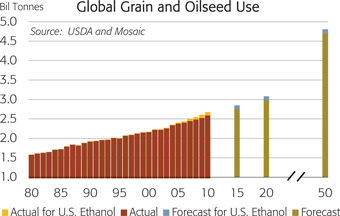
results indicate a tight relationship between these variables – changes in population and income explained more than 99% of the variation in global grain and oilseed use between 1980 and 2010. World population currently increases more than 75 million people per year or the equivalent of adding another Turkey to the world each year. Based on model estimates, population growth today causes grain and oilseed use to increase 19 million tonnes per year (or 250 kg per additional person). Real per capita GDP growth of 2.5% or $185 per year (2005 dollars) causes grain and oilseed use to increase 26 million tonnes per year.
Global population is projected to increase from 6.9 billion today to 7.6 billion by the end of the decade and to 9.1 billion by 2050.


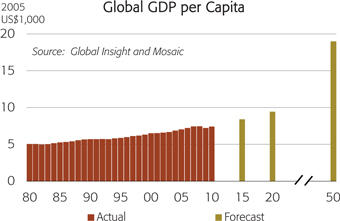
Recent IHS Global Insight forecasts indicate that global GDP per capita is expected to increase from the Great Recession low of about $7,200 in 2009 to more than $9,300 in 2020 and to about $18,900 by 2050. Based on these population and GDP forecasts as well as estimates for the net amount of corn required to meet U.S. ethanol mandates, demand for the leading grain and oilseed crops is projected to increase from 2.7 billion tonnes today to 3.1 billion tonnes in 2020 and to 4.8 billion tonnes in 2050.
These results imply that farmers will have to boost annual production of these crops by 420 million tonnes by the end of this decade in order to meet projected demand. That is equal to the combined harvests of Canada, Argentina, Brazil, Russia and Ukraine today. The forecast for 2050 is up more than 75% from current use and is in line with most long term projections from agencies such as the Food and Agricultural Organization of the United Nations.
Crop Production Implications
So, how will the world grow the food it needs? Most of it will come from yield increases. Net area under cultivation is expected to expand slightly assuming crop prices remain at elevated levels throughout the decade. The chart illustrates that global grain and oilseed area has expanded and contracted modestly with the ups and downs of the price cycle. Harvested area for the leading grain and oilseed crops climbed to a record 900 million hectares in 2010 and this analysis assumes that it will trend slowly upward to 910 million hectares by 2020. Farmers are expected to bring more land into production in regions such as South America, Africa and the former Soviet Union than is lost to urbanization and other uses in other parts of the world.
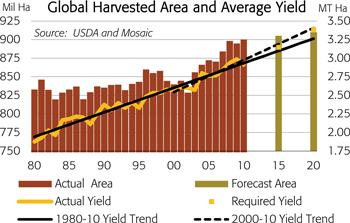
Yields have trended steadily upward over time and have accounted for more than 90% of the increase in global grain and oilseed production since 1980. If the harvested area assumptions are on target, then the average global yield for these crops will need to increase from a three-year average of 2.95 tonnes per hectare today to 3.13 tonnes per hectare in 2015 and to 3.37 tonnes per hectare in 2020 in order to meet projected grain and oilseed demand. This pace of productivity growth exceeds the 30-year trend but is slightly less than the 10-year trend.
Crop Nutrient Demand Implications
The need to harvest record area and achieve ever increasing yields has bullish implications for crop nutrient demand this decade. Global nutrient demand has rebounded from the steep decline in 2008 and now is on a new growth trajectory. In fact, the latest estimates from the International Fertilizer Industry Association (IFA) indicate that global nutrient use jumped to a record 171.7 million tonnes in 2010 and is projected to climb to 178.3 million tonnes in 2011, up 10 million tonnes from the previous peak in 2007 and up 22 million tonnes from the low level in 2008.
Underpinned by the food story and supported by large biofuels programs in Brazil, Europe and the United States, long term nutrient demand prospects look positive. We utilize both top-down and bottom-up methodologies to forecast long term demand. The top-down approach is based on the statistical model that forecasts global grain and oilseed demand from expected population and per capita GDP growth. Another model then forecasts application rates required to achieve the yields needed to meet projected grain and oilseed demand.
The bottom-up approach utilizes a detailed survey of nutrient use for more than a dozen countries that account for about 75% of global demand. Nutrient demand forecasts are built from area and application rate estimates for a dozen major crops or crop categories including not only the leading grain and oilseed crops but also fruits, vegetables and other important local crops such as coffee in Brazil. The survey is completed by subject matter experts from our international distribution offices around the globe who may draw on local resources to complete the survey.
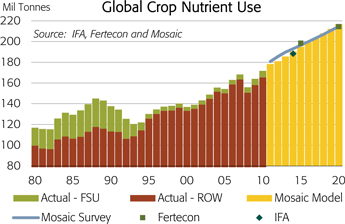
The chart shows our long term model and survey forecasts as well as recent forecasts from IFA and Fertecon as points of reference. All of these forecasts indicate that global nutrient use will increase 2.0% to 2.3% per year during the decade or from 171.7 million tonnes (N+P2O5 +K2O) in 2010 to 210 to 215 million tonnes in 2020. Global nitrogen demand is projected to increase 1.1% to 1.4% per year or from 104.4 million tonnes N in 2010 to 117 to 120 million tonnes by 2020. Global phosphate demand is projected to increase 2.7% to 3.0% per year or from 39.8 million tonnes P2O5 in 2010 to 52 to 54 million tonnes in 2020. Global potash demand is forecast to increase 3.9% to 4.4% per year or from 27.4 million tonnes K2O in 2010 to 40 to 42 million tonnes by 2020.
P: Will Supply Keep Pace With Demand?
How will phosphate supply match up with these demand forecasts? To put projected growth in perspective, it would take eight to nine Phase I Ma’aden projects (1.5 million tonne P2O5 plants) running at 100% of capacity or 24 to 27 hubs at Jorf Lasfar (500,000 tonne P2O5 plants) running at 100% of capacity to meet the projected increase in phosphate demand by 2020. Our analysis concludes that significant additional supply

is needed from both higher operating rates at existing facilities as well as from new capacity to meet projected demand this decade.
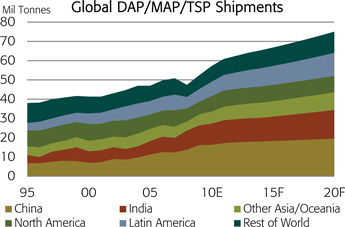
High analysis solid products (DAP/MAP/TSP) are expected to capture about 75% of the growth in phosphate demand this decade. As a result, shipments of these products are forecast to increase from about 57 million tonnes in 2010 to 75 to 79 million tonnes by the end of the decade. NPK compounds are expected to capture the bulk of the remaining increase. Most of the projected increase in NPK use is in India where domestic producers manufacture these products from imported phosphoric acid, ammonia and potash.
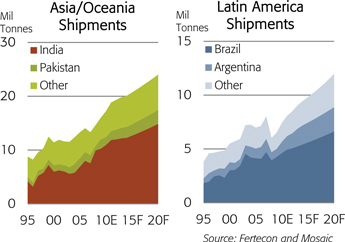
Asia and Latin America are expected to register the largest gains. In Asia/Oceania, DAP/MAP/TSP use is projected to climb from 17 million tonnes today to 24 million tonnes in 2020. India is projected to remain the lead engine. Here the demand for high analysis products is forecast to climb from more than 11 million tonnes in 2010 to around 15 million tonnes in 2020 and imports are projected to reach almost 11 million tonnes by the end of the decade. DAP is expected to account for about 95% of high analysis products.
India is not the only game in town, however, and other Asian countries are expected to post significant gains as well. For example, in Pakistan the use of high analysis products is projected to jump from 1.4 million tonnes in 2010 to 2.6 million tonnes in 2020 and imports are forecast to more than double from 800,000 tonnes in 2010 to 2.0 million tonnes by the end of the decade.
In Latin America, demand is forecast to climb from more than 7 million tonnes of DAP/MAP/TSP today to around 12 million tonnes in 2020. Brazil is expected to notch the biggest gain. The use of high analysis products is projected to climb from 4.5 million tonnes in 2010 to 6.6 million tonnes in 2020, but imports are forecast to climb modestly from 2.8 million tonnes in 2010 to 3.1 million tonnes in 2020 due to expected increases in domestic production.
Other countries in Latin America also are expected to register strong gains. For example, Argentina is projected to more than double phosphate shipments and imports from 1.0 million tonnes in 2010 to 2.2 million tonnes in 2020.
On the supply side, several assumptions about how much and when new capacity comes online are made in this analysis. Our assessment is that phosphate supply is best measured at the phosphoric acid stage of processing because this intermediate product is used to produce the downstream products that are projected to account for nearly all of the demand growth. We assume that global phosphoric acid capacity increases 11 million tonnes P2O5 from 48 million tonnes in 2010 to 59 million tonnes in 2020. All of the growth is from four regions – the Mideast, North Africa, China and Latin America.
In the Mideast, we assume Phase I of the Ma’aden project in Saudi Arabia begins commercial production during the last half of 2011. Phase II is expected to double capacity at the Al Jalamid mine to 10 million tonnes and at the Ras Az Zawr chemical complex to 3.0 million tonnes P2O5 by 2017. The 500,000 tonne P2O5 JPMC-IFFCO joint venture plant in Jordan is assumed to start up in late 2012.
In North Africa, we assume OCP will build four hubs at Jorf Lasfar in Morocco during the forecast period and GCT will complete the Skhira II and Skhira III joint venture projects in Tunisia. However, we do not expect other potential projects in Tunisia or Algeria to move forward during this forecast period.
In Latin America, we assume Vale will complete the Phase II and III expansions at Tapira/Uberaba as well as develop a greenfield mine and chemical complex at Salitre by 2015. In Peru, the second phase of the Bayovar mine is expected on line by 2013 but no chemical processing plants are included by the end of the decade.
In China, another wave of expansions is factored into our analysis. Phosphoric acid capacity is projected to increase 3.0 million tonnes P2O5 this decade. However, much of this increase is expected to meet projected growth in domestic demand for crop nutrient, feed, food and industrial uses. In addition, the restructuring of the Chinese phosphate sector is expected to continue with high analysis products that are produced at integrated world-scale facilities displacing low analysis products such as fused magnesium phosphate, SSP and NPKs that are produced at non-integrated small-scale facilities. Finally, the Renminbi Yuan is expected to appreciate steadily during the decade, making Chinese exports less competitive in the global market. As a consequence, assuming no further crackdown by the central government to preserve non-renewable mineral resources, conserve energy and reduce emissions, China is projected to export of 4.5 to 5.0 million tonnes of DAP/MAP/ TSP each year in this analysis. Nevertheless, China remains a wild card.
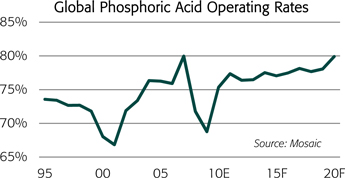
Assuming all of these supply and demand assumptions are on target (or all of the forecasting errors at least are unbiased or evenly distributed around zero), the global phosphoric acid operating rate is projected to range from 75% to 80% of capacity throughout the decade. The mean is 77%, up 300 basis points from the five-year Olympic average. The projected rate trends upward throughout the decade and shows no sharp or prolonged drop through 2020. These estimates assume DAP/MAP/TSP shipments of 75 million tonnes in 2020 or the low end of the projected range.
K: Will Demand Keep Pace With Supply?
In the case of potash, large brownfield expansions by nearly all of the major producers appear sufficient to meet projected demand this decade. On the demand side of the ledger, potassium chloride (KCl), also referred to as Muriate of Potash (MOP), is expected to capture 93% of the projected growth in overall potash demand. As a consequence, MOP shipments are forecast to increase from about 51million tonnes in 2010 to 70 to 73 million tonnes by the end of the decade. Potassium sulphate and potassium magnesium sulphate are expected to capture the remaining increase.
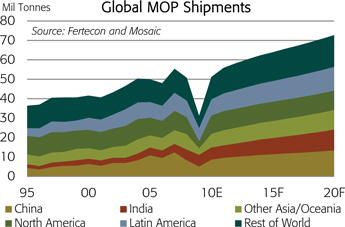
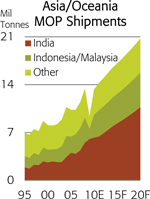
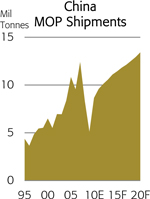
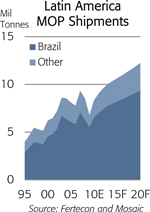
MOP demand is projected to increase in all regions, but Asia/Oceania, Latin America and China are expected to register the largest absolute increases during the next 10 years. In Asia/Oceania, MOP demand is projected to climb from 13 million tonnes today to 21 million tonnes in 2020. Like phosphate, India is expected to lead the race. Indian MOP use and imports are projected to increase from 6.3 million tonnes in 2010 to more than 10 million tonnes in 2020. MOP use and imports by Indonesia and Malaysia, the two other large consumers in this region, are projected to increase from about 3.4 million tonnes today to 5 million tonnes in 2020. Other countries in the region such as Vietnam and Thailand also are expected to post significant gains this decade. In China, MOP shipments are forecast to increase from 9 million tonnes today to almost 14 million tonnes in 2020 and imports are forecast to grow from 5.3 million tonnes in 2010 to about 9 million tonnes in 2020. Further expansions of domestic capacity and higher operating rates meet about 30% of the projected growth in MOP demand. In addition, significant increases in potassium sulphate and potassium magnesium sulphate production are projected during the next 10 years and these gains account for about one-quarter of the projected growth in overall potash use this decade. In Latin America, MOP demand is forecast to grow from 8.4 million tonnes today to almost 13 million tonnes in 2020. In Brazil, MOP use is projected to climb from 6.5 million tonnes in 2010 to 10 million tonnes in 2020 and imports are forecast to increase from 6.0 last year to 9 million tonnes in 2020. However, a significant portion of the projected increase is expected to come from Vale’s Potassio Rio Colorado project in Argentina by 2020. Several other countries in Latin America including Mexico, Chile, Uruguay and Paraguay also are expected to register significant gains.
On the supply side of the ledger, we assume that global MOP operational capacity will increase from 63 million tonnes in 2010 to 86 million tonnes in 2020. Brownfield expansions are expected to account for almost three-fourths or 17 million tonnes of the projected increase this decade. Only two greenfield projects are included in our analysis – Vale’s Potassio Rio Colorado project in Argentina and Eurochem’s Volgograd project in Russia.
Current producers are plowing profits into large mine expansions and improvements. That is especially the case in Canada where expansions by the three producers are expected to account for almost 75% of the new brownfield capacity this decade. Expansions by producers in the former Soviet Union account for another 20%.

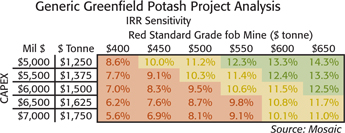
Only two greenfield projects are included for one reason – our analysis indicates these projects do not generate returns on invested capital that meet even modest thresholds based on reasonable price and capital cost assumptions. The table shows internal rates of return for a generic greenfield project in Saskatchewan for different combinations of capital costs and fob mine prices. This calculation assumes a 4.0 million tonne mine, six years construction and three years to reach full capacity. Based on realistic capital costs, our take away is that a price of about $600 per tonne at the mine is required in perpetuity to achieve even a modest threshold return on invested capital.
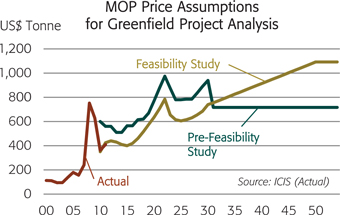
The chart shows price assumptions used in pre-feasibility and feasibility studies for a proposed greenfield project in Saskatchewan. In addition to these lofty prices, the estimated capital cost used in the studies looked low to us.
Again, assuming all of these supply and demand assumptions are on target, the global MOP operating rate is projected to range from 80% to 85% of capacity throughout the decade. These projected rates assume that global MOP shipments will climb to almost 73 million tonnes by 2020 or the high end of the forecast range.
Based on our estimates of operational capacity, the global operating rate averaged 90% of capacity from 2004 to 2008 and peaked at 93% in both 2005 and 2007. However, producers and distributors scrambled to meet demand during this period and drained inventories throughout the supply chain. These projected rates would facilitate more timely and efficient movement of product through the supply chain and provide a cushion if demand grows at faster rates or some projects included in this analysis are delayed or cancelled.