Attached files
| file | filename |
|---|---|
| EX-23 - CONSENT - CASS INFORMATION SYSTEMS INC | v214144_ex23.htm |
| EX-21 - SUBSIDIARIES - CASS INFORMATION SYSTEMS INC | v214144_ex21.htm |
| EX-31.2 - CERTIFICATION - CASS INFORMATION SYSTEMS INC | v214144_ex31-2.htm |
| EX-32.1 - CERTIFICATION - CASS INFORMATION SYSTEMS INC | v214144_ex32-1.htm |
| EX-32.2 - CERTIFICATION - CASS INFORMATION SYSTEMS INC | v214144_ex32-2.htm |
| EX-31.1 - CERTIFICATION - CASS INFORMATION SYSTEMS INC | v214144_ex31-1.htm |
UNITED STATES
SECURITIES AND EXCHANGE COMMISSION
Washington, D.C. 20549
FORM 10-K
(Mark One)
|
|
x
|
ANNUAL REPORT PURSUANT TO SECTION 13 OR 15(d) OF THE SECURITIES EXCHANGE ACT OF 1934
|
For the fiscal year ended December 31, 2010
|
|
o
|
TRANSITION REPORT PURSUANT TO SECTION 13 OR 15(d) OF THE SECURITIES EXCHANGE ACT OF 1934
|
For the transition period from to
Commission file number 000-20827
|
CASS INFORMATION SYSTEMS, INC.
|
|
(Exact name of registrant as specified in its charter)
|
|
Missouri
|
43-1265338
|
|
|
(State or other jurisdiction of incorporation or organization)
|
(I.R.S. Employer Identification No.)
|
|
13001 Hollenberg Drive, Bridgeton, Missouri
|
63044
|
(314) 506-5500
|
||
|
(Address of principal executive offices)
|
|
(Zip Code)
|
|
(Telephone Number, incl. area code)
|
Securities registered pursuant to Section 12(b) of the Act:
|
Title of each Class
|
Name of each exchange on which registered
|
|
|
Common Stock, par value $.50
|
|
The Nasdaq Global Select Market
|
Securities registered pursuant to Section 12(g) of the Act:
|
Title of each Class
|
|
None
|
Indicate by checkmark if the registrant is a well-known seasoned issuer, as defined in Rule 405 of the Securities Act.
Yes o No x
Indicate by checkmark if the registrant is not required to file reports pursuant to Section 13 or Section 15(d) of the Act.
Yes o No x
Indicate by check mark whether the registrant (1) has filed all reports required to be filed by Section 13 or 15(d) of the Securities Exchange Act of 1934 during the preceding 12 months (or for such shorter period that the registrant was required to file such reports), and (2) has been subject to such filing requirements for the past 90 days.
Yes x No o
Indicate by checkmark whether the registrant has submitted electronically and posted on its corporate Web site, if any, every Interactive Data File required to be submitted and posted pursuant to Rule 405 of Regulation S-T (§232.405 of this chapter) during the preceding 12 months (or for such shorter period that the registrant was required to submit and post such files).
Yes ¨ No ¨
Indicate by check mark if disclosure of delinquent filers pursuant to Item 405 of Regulation S-K is not contained herein, and will not be contained, to the best of registrant’s knowledge, in definitive proxy or information statements incorporated by reference in Part III of this Form 10-K or any amendment to this Form 10-K. o
Indicate by check mark whether the registrant is a large accelerated filer, an accelerated filer, a non-accelerated filer, or a smaller reporting company. See definitions of “large accelerated filer,” “accelerated filer” and “smaller reporting company” in Rule 12b-2 of the Exchange Act. (Check one) Large accelerated filer: o Accelerated filer: x Non-accelerated filer: o
Smaller reporting company: o
Indicate by checkmark whether the registrant is a shell company (as defined in Rule 12b-2 of the Exchange Act).
Yes ¨ No x
The aggregate market value of the common stock held by non-affiliates of the Registrant was approximately $297,540,000 based on the closing price of the common stock of $34.25 on June 30, 2010, as reported by The Nasdaq Global Select Market. As of March 4, 2011, the Registrant had 9,407,294 shares outstanding of common stock.
DOCUMENTS INCORPORATED BY REFERENCE
Certain information required for Part III of this report is incorporated by reference from the Registrant’s Proxy Statement for the 2011 Annual Meeting of Shareholders.
CASS INFORMATION SYSTEMS, INC.
FORM 10-K ANNUAL REPORT
TABLE OF CONTENTS
|
PART I.
|
|||
|
Item 1.
|
BUSINESS
|
1
|
|
|
Item 1A.
|
RISK FACTORS
|
3
|
|
|
Item 1B.
|
UNRESOLVED STAFF COMMENTS
|
7
|
|
|
Item 2.
|
PROPERTIES
|
7
|
|
|
Item 3.
|
LEGAL PROCEEDINGS
|
7
|
|
|
Item 4.
|
REMOVED AND RESERVED
|
7
|
|
|
PART II.
|
|||
|
Item 5.
|
MARKET FOR REGISTRANT’S COMMON EQUITY, RELATED STOCKHOLDER MATTERS AND ISSUER PURCHASES OF EQUITY SECURITIES
|
8
|
|
|
Item 6.
|
SELECTED FINANCIAL DATA
|
9
|
|
|
Item 7.
|
MANAGEMENT’S DISCUSSION AND ANALYSIS OF FINANCIAL CONDITION AND RESULTS OF OPERATIONS
|
9
|
|
|
Item 7A.
|
QUANTITATIVE AND QUALITATIVE DISCLOSURES ABOUT MARKET RISK
|
23
|
|
|
Item 8.
|
FINANCIAL STATEMENTS AND SUPPLEMENTARY DATA
|
26
|
|
|
Item 9.
|
CHANGES IN AND DISAGREEMENTS WITH ACCOUNTANTS ON ACCOUNTING AND FINANCIAL DISCLOSURE
|
51
|
|
|
Item 9A.
|
CONTROLS AND PROCEDURES
|
51
|
|
|
Item 9B.
|
OTHER INFORMATION
|
53
|
|
|
PART III.
|
|||
|
Item 10.
|
DIRECTORS, EXECUTIVE OFFICERS AND CORPORATE GOVERNANCE
|
53
|
|
|
Item 11.
|
EXECUTIVE COMPENSATION
|
53
|
|
|
Item 12.
|
SECURITY OWNERSHIP OF CERTAIN BENEFICIAL OWNERS AND MANAGEMENT
|
||
|
AND RELATED STOCKHOLDER MATTERS
|
53
|
||
|
Item 13.
|
CERTAIN RELATIONSHIPS AND RELATED TRANSACTIONS, AND DIRECTOR INDEPENDENCE
|
54 | |
|
Item 14.
|
PRINCIPAL ACCOUNTANT FEES AND SERVICES
|
54
|
|
|
PART IV.
|
|||
|
Item 15.
|
EXHIBITS AND FINANCIAL STATEMENT SCHEDULES
|
54
|
|
|
SIGNATURES
|
56
|
Forward-looking Statements - Factors That May Affect Future Results
This report may contain or incorporate by reference forward-looking statements made pursuant to the safe harbor provisions of Section 27A of the Securities Act of 1933, as amended, and Section 21E of the Securities Exchange Act of 1934, as amended. Although we believe that, in making any such statements, our expectations are based on reasonable assumptions, forward-looking statements are not guarantees of future performance and involve risks, uncertainties, and other factors beyond our control, which may cause future performance to be materially different from expected performance summarized in the forward-looking statements. These risks, uncertainties and other factors are discussed in the section Part I, Item 1A, “Risk Factors”. We undertake no obligation to
publicly update or revise any forward-looking statements to reflect changed assumptions, the occurrence of anticipated or unanticipated events, or changes to future results over time.
PART I.
ITEM 1. BUSINESS
Description of Business
Cass Information Systems, Inc. (“Cass” or “the Company”) is a leading provider of payment and information processing services to large manufacturing, distribution and retail enterprises across the United States. The Company provides transportation invoice rating, payment, audit, accounting and transportation information to many of the nation’s largest companies. It is also a processor and payer of utility invoices, including electricity, gas, and other facility related expenses. Additionally, Cass competes in the telecommunications expense management market which includes bill processing, audit and payment services for telephone, data line, cellular and communication equipment expense. Also the Company, through its wholly owned bank
subsidiary, Cass Commercial Bank (“the Bank”), provides commercial banking services. The Bank’s primary focus is to support the Company’s payment operations and provide banking services to its target markets, which include privately owned businesses and churches and church-related ministries. Services include commercial and commercial real estate loans, checking, savings and time deposit accounts and other cash management services. The principal offices of the Company are at 13001 Hollenberg Drive, Bridgeton, Missouri 63044. Other operating locations are in Columbus, Ohio, Boston, Massachusetts, Greenville, South Carolina and Wellington, Kansas. The Bank’s headquarters are also located at the Bridgeton location, and the Bank operates five other branches, four in the St. Louis metropolitan area and one in southern California.
Company Strategy and Core Competencies
Cass is an information services company with a primary focus on processing payables and payables-related transactions for large corporations located in the United States. Cass possesses four core competencies that encompass most of its processing services.
Data acquisition – This refers to the gathering of data elements from diverse, heterogeneous sources and the building of complete databases for our customers. Data is the raw material of the information economy. Cass gathers vital data from complex and diverse input documents, electronic media, proprietary databases and data feeds, including data acquired from vendor invoices as well as customer procurement and sales systems. Through its numerous methods of obtaining streams and pieces of raw data, Cass is able to assemble vital data into centralized data management systems and warehouses, thus producing an engine to create the power of information for managing critical corporate functions and processing systems.
Data management – Once data is assembled, Cass is able to utilize the power from derived information to produce significant savings and benefits for its clients. This information is integrated into customers’ unique financial and accounting systems, eliminating the need for internal accounting processing and providing internal and external support for these critical systems. Information is also used to produce management and exception reporting for operational control, feedback, planning assistance and performance measurement.
Business Intelligence – Receiving information in the right place at the right time and in the required format is paramount for business survival. Cass’ information delivery solutions provide reports, digital images, data files and retrieval capabilities through the Internet or directly into customer internal systems. Cass’ proprietary Internet management delivery system is the foundation for driving these critical functions. Transaction, operational, control, status and processing exception information are all delivered through this system creating an efficient, accessible and highly reliable asset for Cass customers.
Financial exchange – Since Cass is unique among its competition in that it owns a commercial bank, it is also able to manage the movement of funds from its customers to their suppliers. This is a distinguishing factor, which clearly requires the processing capability, operating systems and financial integrity of a banking organization. Cass provides immediate, accurate, controlled and protected funds management and transfer system capabilities for all of its customers. Old and costly check processing and delivery mechanisms are replaced with more efficient electronic cash management and funds transfer systems.
Cass’ core competencies allow it to perform the highest levels of transaction processing in an integrated, efficient and systematic approach. Not only is Cass able to process the transaction, it is also able to collect the data defining the transaction and effect the financial payment governing its terms.
Cass’ shared business processes – Accounting, Human Resources and Technology – support its core competencies. Cass’ accounting function provides the internal control systems to ensure the highest levels of accountability and protection for customers. Cass’ human resources department provides experienced people dedicated to streamlining business procedures and reducing expenses. Cass’ technology is proven and reliable. The need to safeguard data and secure the efficiency, speed and timeliness that govern its business is a priority within the organization. The ability to
1
leverage technology over its strategic units allows Cass the advantage of deploying technology in a proven and reliable manner without hindering clients’ strategic business and system requirements.
These core competencies, enhanced through shared business processes, drive Cass’ strategic business units. Building upon these foundations, Cass continues to explore new business opportunities that leverage these competencies and processes.
Marketing, Customers and Competition
The Company, through its Transportation Information Services business unit, is one of the largest firms in the transportation bill processing and payment industry in the United States based on the total dollars of transportation bills paid and items processed. Competition consists of a few primary competitors and numerous small transportation bill audit firms located throughout the United States. While offering transportation payment services, few of these audit firms compete on a national basis. These competitors compete mainly on price, functionality and service levels. The Company, through its Utility Information Services business unit, also competes with other companies, located throughout the United States, that pay utility bills and provide management
reporting. Available data indicates that the Company is one of the largest providers of utility information processing and payment services. Cass’ Utility Information Services is unique among these competitors in that it is not exclusively affiliated with any one energy service provider (“ESP”). The ESPs market the Company’s services adding value with their unique auditing, consulting and technological capabilities. Many of Cass’ services are customized for the ESPs, providing a full-featured solution without any development costs to the ESP. Also the Company, through its Telecom Information Services business unit, is a leader in the growing telecom expense management market, and competes with other companies located throughout the United States in this market.
The Bank is organized as a Missouri trust company with banking powers and was founded in 1906. Due to its ownership of a federally insured commercial bank, the Company is a bank holding corporation and was originally organized in 1982 as Cass Commercial Corporation under the laws of Missouri. It was approved by the Board of Governors of the Federal Reserve System (the “Federal Reserve”) in February 1983. The Company changed its name to Cass Information Systems, Inc. in January 2001. The Company’s bank subsidiary encounters competition from numerous banks and financial institutions located throughout the St. Louis, Missouri metropolitan area and other areas in which the Bank competes. The Bank’s principal competitors, however, are large
bank holding companies that are able to offer a wide range of banking and related services through extensive branch networks. The Bank targets its services to privately held businesses located in the St. Louis, Missouri area and church and church-related institutions located in St. Louis, Missouri, Orange County, California and other selected cities located throughout the United States.
The Company holds several trademarks for the payment and rating services it provides. These include: FreightPayÒ, TransdataÒ, TransInqÒ, RatemakerÒ, Rate AdviceÒ, First RateÒ, Best RateÒ, Rate ExchangeÒ and CassPortÒ. The
Company and its subsidiaries are not dependent on any one customer for a significant portion of their businesses. The Company and its subsidiaries have a varied client base with no individual client exceeding 10% of total revenue.
Employees
The Company and its subsidiaries had 671 full-time and 247 part-time employees as of March 4, 2011. Of these employees, the Bank had 60 full-time and one part-time employee.
Supervision and Regulation
The Company and its bank subsidiary are extensively regulated under federal and state law. These laws and regulations are intended to protect depositors, not shareholders. These laws also include the recently enacted Dodd-Frank Wall Street Reform and Consumer Protection Act (The Dodd-Frank Act). The regulations related to the Dodd-Frank Act are currently being written, and accordingly, the full implication of this new law will not be known for some time. The Bank is subject to regulation and supervision by the Missouri Division of Finance, the Federal Reserve Bank (the “FRB”) and the Federal Deposit Insurance Corporation (the “FDIC”). The Company is a bank holding company within the meaning of the Bank Holding Company Act of 1956, as amended, and
as such, it is subject to regulation, supervision and examination by the FRB. The Company is required to file quarterly and annual reports with the FRB and to provide to the FRB such additional information as the FRB may require, and it is subject to regular inspections by the FRB. Bank regulatory agencies use Capital Adequacy Guidelines in their examination and regulation of bank holding companies and banks. If the capital falls below the minimum levels established by these guidelines, the agencies may force certain remedial action to be taken. The Capital Adequacy Guidelines are of several types and include risk-based capital guidelines, which are designed to make capital requirements more sensitive to various risk profiles and account for off-balance sheet exposure; guidelines that consider market risk, which is the risk of loss due to change in value of assets and liabilities due to changes in interest rates; and guidelines that use a
leverage ratio which places a constraint on the maximum degree of risk to which a bank holding company may leverage its equity capital base. For further discussion of the capital adequacy guidelines and ratios, please refer
2
to Item 7 “Management’s Discussion and Analysis of Financial Condition and Results of Operations” and Item 8, Note 2 of this report.
The FRB also has extensive enforcement authority over bank holding companies, including, among other things, the ability to assess civil money penalties, to issue cease and desist or removal orders and to require that a holding company divest subsidiaries (including its bank subsidiaries). In general, enforcement actions may be initiated for violations of law or regulations or for unsafe or unsound practices. Both the FRB and Missouri Division of Finance also have restrictions on the amount of dividends that banks and bank holding companies may pay.
As a bank holding company, the Company must obtain prior approval from the FRB before acquiring ownership or control of more than 10% of the voting shares of another bank or bank holding company or acquiring all or substantially all of the assets of such a company. In many cases, prior approval is also required for the Company to engage in similar acquisitions involving a non-bank company or to engage in new non-bank activities. Any change in applicable laws or regulations may have a material effect on the business and prospects of the Company.
Website Availability of SEC Reports
Cass files annual, quarterly and current reports with the Securities and Exchange Commission (the “SEC”). Cass will, as soon as reasonably practicable after they are electronically filed with or furnished to the SEC, make available free of charge on its website each of its Annual Reports on Form 10-K, Quarterly Reports on Form 10-Q, Current Reports on Form 8-K, all amendments to those reports, and its definitive proxy statements. The address of Cass’ website is: www.cassinfo.com. All reports filed with the SEC are available for reading and copying at the SEC’s Public Reference Room at 100 F Street, NE, Washington, DC 20549-0213 or for more information call the Public Reference Room at 1-800-SEC-0330. The SEC also makes all filed reports, proxy
statements and information statements available on its website at www.sec.gov.
The reference to our website address does not constitute incorporation by reference of the information contained on the website and should not be considered part of this report.
Financial Information about Segments
The services provided by the Company are classified in two reportable segments: Information Services and Banking Services. The revenues from external customers, net income and total assets by segment as of and for the three years ended December 31, 2010, are set forth in Item 8, Note 16 of this report.
Statistical Disclosure by Bank Holding Companies
For the statistical disclosure by bank holding companies refer to Item 7 “Management’s Discussion and Analysis of Financial Condition and Results of Operations.”
ITEM 1A. RISK FACTORS
This section highlights specific risks that could affect the Company’s business. Although this section attempts to highlight key factors, please be aware that other risks may prove to be important in the future. New risks may emerge at any time, and Cass cannot predict such risks or estimate the extent to which they may affect the Company’s financial performance. In addition to the factors discussed elsewhere or incorporated by reference in this report, the identified risks that could cause actual results to differ materially include the following:
General political, economic or industry conditions may be less favorable than expected.
Local, domestic, and international economic, political and industry-specific conditions and governmental monetary and fiscal policies affect the industries in which the Company competes, directly and indirectly. Conditions such as inflation, recession, unemployment, volatile interest rates, tight money supply, real estate values, international conflicts and other factors outside of Cass’ control may adversely affect the Company. Economic downturns could result in the delinquency of outstanding loans, which could have a material adverse impact on Cass’ earnings.
Unfavorable developments concerning customer credit quality could affect Cass’ financial results.
Although the Company regularly reviews credit exposure related to its customers and various industry sectors in which it has business relationships, default risk may arise from events or circumstances that are difficult to detect or foresee. Under such circumstances, the Company could experience an increase in the level of provision for credit losses, delinquencies, nonperforming assets, net charge-offs and allowance for credit losses.
3
The Company has lending concentrations, including, but not limited to, churches and church-related entities located in selected cities and privately-held businesses located in or near St. Louis, Missouri, that could suffer a significant decline which could adversely affect the Company.
Cass’ customer base consists, in part, of lending concentrations in several segments and geographical areas. If any of these segments or areas is significantly affected by weak economic conditions, the Company could experience increased credit losses, and its business could be adversely affected.
Fluctuations in interest rates could affect Cass’ net interest income and balance sheet.
The operations of financial institutions such as the Company are dependent to a large degree on net interest income, which is the difference between interest income from loans and investments and interest expense on deposits and borrowings. Prevailing economic conditions, the fiscal and monetary policies of the federal government and the policies of various regulatory agencies all affect market rates of interest, which in turn significantly affect financial institutions’ net interest income. Fluctuations in interest rates affect Cass’ financial statements, as they do for all financial institutions. Volatility in interest rates can also result in disintermediation, which is the flow of funds away from financial institutions into direct investments, such as federal
government and corporate securities and other investment vehicles, which, because of the absence of federal insurance premiums and reserve requirements, generally pay higher rates of return than financial institutions. As discussed in greater detail in Item 7A, “Quantitative and Qualitative Disclosures about Market Risk,” a continuation of the current low level of interest rates would have a negative impact on the Company’s net interest income.
Methods of reducing risk exposures might not be effective.
Instruments, systems and strategies used to hedge or otherwise manage exposure to various types of credit, interest rate, market and liquidity, operational, regulatory/compliance, business risks and enterprise-wide risks could be less effective than anticipated. As a result, the Company may not be able to effectively mitigate its risk exposures in particular market environments or against particular types of risk.
Customer borrowing, repayment, investment, deposit, and payable processing practices may be different than anticipated.
The Company uses a variety of financial tools, models and other methods to anticipate customer behavior as part of its strategic and financial planning and to meet certain regulatory requirements. Individual, economic, political, industry-specific conditions and other factors outside of Cass’ control could alter predicted customer borrowing, repayment, investment, deposit, and payable processing practices. Such a change in these practices could adversely affect Cass’ ability to anticipate business needs, including cash flow and its impact on liquidity, and to meet regulatory requirements.
Cass must respond to rapid technological changes and these changes may be more difficult or expensive than anticipated.
If competitors introduce new products and services embodying new technologies, or if new industry standards and practices emerge, the Company’s existing product and service offerings, technology and systems may become obsolete. Further, if Cass fails to adopt or develop new technologies or to adapt its products and services to emerging industry standards, Cass may lose current and future customers, which could have a material adverse effect on its business, financial condition and results of operations. The payment processing and financial services industries are changing rapidly and in order to remain competitive, Cass must continue to enhance and improve the functionality and features of its products, services and technologies. These changes may be more difficult or
expensive than the Company anticipates.
Operational difficulties or security problems could damage Cass’ reputation and business.
The Company depends on the reliable operation of its computer operations and network connections from its clients to its systems. Any operational problems or outages in these systems would cause Cass to be unable to process transactions for its clients, resulting in decreased revenues. In addition, any system delays, failures or loss of data, whatever the cause, could reduce client satisfaction with the Company’s products and services and harm Cass’ financial results. Cass also depends on the security of its systems. Company networks may be vulnerable to unauthorized access, computer viruses and other disruptive problems. A material security problem affecting Cass could damage its reputation, deter prospects from purchasing its products, deter
customers from using its products or result in liability to Cass.
4
Cass’ stock price can become volatile and fluctuate widely in response to a variety of factors.
The Company’s stock price can fluctuate based on factors that can include actual or anticipated variations in Cass’ quarterly results; new technology or services by competitors; unanticipated losses or gains due to unexpected events, including losses or gains on securities held for investment purposes; significant acquisitions or business combinations, strategic partnerships, joint ventures or capital commitments by or involving the Company or its competitors; changes in accounting policies or practices; failure to integrate acquisitions or realize anticipated benefits from acquisitions; or changes in government regulations.
General market fluctuations, industry factors and general economic and political conditions, such as economic slowdowns or recessions, governmental intervention, interest rate changes, credit loss trends, low trading volume or currency fluctuations also could cause Cass’ stock price to decrease regardless of the Company’s operating results.
Competitive product and pricing pressure within Cass’ markets may change.
The Company operates in a very competitive environment, which is characterized by competition from a number of other vendors and financial institutions in each market in which it operates. The Company competes with large payment processors and national and regional financial institutions and also smaller auditing companies and banks in terms of products and pricing. If the Company is unable to compete effectively in products and pricing in its markets, business could decline.
Management’s ability to maintain and expand customer relationships may differ from expectations.
The industries in which the Company operates are very competitive. The Company not only competes for business opportunities with new customers, but also competes to maintain and expand the relationships it has with its existing customers. The Company continues to experience pressures to maintain these relationships as its competitors attempt to capture its customers.
The introductions, withdrawal, success and timing of business initiatives and strategies, including, but not limited to, the expansion of payment and processing activities to new markets, the expansion of products and services to existing markets and opening of new bank branches, may be less successful or may be different than anticipated. Such a result could adversely affect Cass’ business.
The Company makes certain projections as a basis for developing plans and strategies for its payment processing and banking products. If the Company does not accurately determine demand for its products and services, it could result in the Company incurring significant expenses without the anticipated increases in revenue, which could result in an adverse effect on its earnings.
Management’s ability to retain key officers and employees may change.
Cass’ future operating results depend substantially upon the continued service of Cass’ executive officers and key personnel. Cass’ future operating results also depend in significant part upon Cass’ ability to attract and retain qualified management, financial, technical, marketing, sales, and support personnel. Competition for qualified personnel is intense, and the Company cannot ensure success in attracting or retaining qualified personnel. There may be only a limited number of persons with the requisite skills to serve in these positions, and it may be increasingly difficult for the Company to hire personnel over time. Cass’ business, financial condition and results of operations could be materially adversely affected by the loss of
any of its key employees, by the failure of any key employee to perform in his or her current position, or by Cass’ inability to attract and retain skilled employees.
Changes in regulation or oversight may have a material adverse impact on Cass’ operations.
The Company is subject to extensive regulation, supervision and examination by the Missouri Division of Finance, the FDIC, the FRB, the SEC and other regulatory bodies. Such regulation and supervision governs the activities in which the Company may engage. Regulatory authorities have extensive discretion in their supervisory and enforcement activities, including the imposition of restrictions on Cass’ operations, investigations and limitations related to Cass’ securities, the classification of Cass’ assets and determination of the level of Cass’ allowance for loan losses. Any change in such regulation and oversight, whether in the form of regulatory policy, regulations, legislation or supervisory action, may have a material adverse impact on Cass’
operations.
Legal and regulatory proceedings and related matters with respect to the financial services industry, including those directly involving the Company and its subsidiaries, could adversely affect Cass or the financial services industry in general.
5
The Company is subject to various legal and regulatory proceedings. It is inherently difficult to assess the outcome of these matters, and there can be no assurance that the Company will prevail in any proceeding or litigation. Any such matter could result in substantial cost and diversion of Cass’ efforts, which by itself could have a material adverse effect on Cass’ financial condition and operating results. Further, adverse determinations in such matters could result in actions by Cass’ regulators that could materially adversely affect Cass’ business, financial condition or results of operations. Please refer to Item 3, “Legal Proceedings.”
The Company’s accounting policies and methods are the basis of how Cass reports its financial condition and results of operations, and they require management to make estimates about matters that are inherently uncertain. In addition, changes in accounting policies and practices, as may be adopted by the regulatory agencies, the Financial Accounting Standards Board, or other authoritative bodies, could materially impact Cass’ financial statements.
The Company’s accounting policies and methods are fundamental to how Cass records and reports its financial condition and results of operations. Management must exercise judgment in selecting and applying many of these accounting policies and methods in order to ensure that they comply with generally accepted accounting principles and reflect management’s judgment as to the most appropriate manner in which to record and report Cass’ financial condition and results of operations. In some cases, management must select the accounting policy or method to apply from two or more alternatives, any of which might be reasonable under the circumstances yet might result in the Company reporting materially different amounts than would have been reported under a different
alternative.
Cass has identified four accounting policies as being “critical” to the presentation of its financial condition and results of operations because they require management to make particularly subjective and/or complex judgments about matters that are inherently uncertain and because of the likelihood that materially different amounts would be reported under different conditions or using different assumptions. More information on Cass’ critical accounting policies is contained in Item 7, “Management’s Discussion and Analysis of Financial Condition and Results of Operations.”
From time to time, the regulatory agencies, the Financial Accounting Standards Board (“FASB”), and other authoritative bodies change the financial accounting and reporting standards that govern the preparation of the Company’s financial statements. These changes can be hard to predict and can materially impact how management records and reports the Company’s financial condition and results of operations.
Cass is subject to examinations and challenges by tax authorities, which, if not resolved in the Company’s favor, could adversely affect the Company’s financial condition and results of operations.
In the normal course of business, Cass and its affiliates are routinely subject to examinations and challenges from federal and state tax authorities regarding the amount of taxes due in connection with investments it has made and the businesses in which it is engaged. Recently, federal and state taxing authorities have become increasingly aggressive in challenging tax positions taken by financial institutions. These tax positions may relate to tax compliance, sales and use, franchise, gross receipts, payroll, property and income tax issues, including tax base, apportionment and tax credit planning. The challenges made by tax authorities may result in adjustments to the timing or amount of taxable income or deductions or the allocation of income among tax
jurisdictions. If any such challenges are made and are not resolved in the Company’s favor, they could have an adverse effect on Cass’ financial condition and results of operations.
There could be terrorist activities or other hostilities, which may adversely affect the general economy, financial and capital markets, specific industries, and the Company.
The terrorist attacks in September 2001 in the United States and ensuing events, as well as the resulting decline in consumer confidence, had a material adverse effect on the economy. Any similar future events may disrupt Cass’ operations or those of its customers. In addition, these events had and may continue to have an adverse impact on the U.S. and world economy in general and consumer confidence and spending in particular, which could harm Cass’ operations. Any of these events could increase volatility in the U.S. and world financial markets, which could harm Cass’ stock price and may limit the capital resources available to its customers and the Company. This could have a significant impact on Cass’ operating results, revenues and costs and
may result in increased volatility in the market price of Cass’ common stock.
There could be natural disasters, including, but not limited to, hurricanes, tornadoes, earthquakes, fires and floods, which may adversely affect the general economy, financial and capital markets, specific industries, and the Company.
The Company has significant operations and customer base in Missouri, California, Ohio, Massachusetts, South Carolina, and other regions where natural disasters may occur. These regions are known for being vulnerable to
6
natural disasters and other risks, such as tornadoes, hurricanes, earthquakes, fires and floods. These types of natural disasters at times have disrupted the local economy, Cass’ business and customers and have posed physical risks to Cass’ property. A significant natural disaster could materially affect Cass’ operating results.
|
ITEM 1B.
|
UNRESOLVED STAFF COMMENTS
|
None.
|
ITEM 2.
|
PROPERTIES
|
The Company’s headquarters are located at 13001 Hollenberg Drive, Bridgeton, Missouri. This location is owned by the Company, and includes a building with approximately 61,500 square feet of office space. The Company also owns a production facility of approximately 45,500 square feet located at 2675 Corporate Exchange Drive, Columbus, Ohio. Additional facilities are located in Lowell, Massachusetts where approximately 25,800 square feet of office space is leased through March 2011, Greenville, South Carolina where approximately 8,500 square feet of office space is leased through November 2013, Wellington, Kansas where approximately 2,000 square feet of office space is leased through July 2011 and Columbus, Ohio where approximately 8,500 square feet of office space is leased
through March 2013. During January 2011, the Company opened an office in Breda, Netherlands to help service its multinational customers in the future. Total space leased is less than 200 square feet and it is leased through December 2011.
The Bank’s headquarters are also located at 13001 Hollenberg Drive, Bridgeton, Missouri. The Bank occupies approximately 20,500 square feet of the 61,500 square foot building. In addition, the Bank owns a banking facility near downtown St. Louis, Missouri that consists of approximately 1,750 square feet with adjoining drive-up facilities. The Bank has additional leased facilities in Maryland Heights, Missouri (2,500 square feet), Fenton, Missouri (2,000 square feet), Chesterfield, Missouri (2,850 square feet) and Santa Ana, California (3,400 square feet).
Management believes that these facilities are suitable and adequate for the Company’s operations.
|
ITEM 3.
|
LEGAL PROCEEDINGS
|
The Company is the defendant in a proceeding pending in the United States Bankruptcy Court for the District of Delaware, which proceeding was initiated by Chapter 11 debtor LNT Services, Inc. ("LNT"), an affiliate of Linens N' Things, on December 19, 2009. The LNT Chapter 11 bankruptcy proceeding was subsequently converted to a Chapter 7 proceeding. Pursuant to Section 547 of the United States Bankruptcy Code, the LNT bankruptcy trustee, on behalf of LNT, seeks to avoid and recover $33,825,773.71 in allegedly preferential payments (the "Payments") made to the Company. The Payments were received by the Company in the normal course of providing services to Linens N' Things. The Company had been engaged under contract with Linens N' Things to audit, process and pay its freight carrier
invoices. Accordingly, the Payments made to the Company were subsequently paid to the appropriate Linens N' Things freight carriers as specified in the contract.
On September 28, 2010, Asentinel LLC ("Asentinel") filed a lawsuit in the United States District Court for the Western District of Tennessee against the Company, AnchorPoint, Inc. ("AnchorPoint") and Veramark Technologies, Inc. ("Veramark"). The suit alleges infringement of two Asentinel patents by the Company, AnchorPoint and Veramark. Cass vigorously denies infringing any valid claim of either patent. Asentinel has requested an order enjoining the Company from infringing the two patents at issue, damages for the alleged infringement, interest and costs, treble damages for willful infringement, and attorneys' fees.
While there is some uncertainty relating to any litigation, management is of the opinion that the Company has valid defenses to both these claims. All other legal proceedings and actions involving the Company are of an ordinary and routine nature and are incidental to the operations of the Company. Management believes the outcome of these proceedings, including the LNT and Asentinel proceedings, will not have a material effect on the businesses or financial conditions of the Company or its subsidiaries.
|
ITEM 4.
|
(REMOVED AND RESERVED)
|
7
PART II.
|
ITEM 5.
|
MARKET FOR REGISTRANT’S COMMON EQUITY AND RELATED STOCKHOLDER MATTERS
|
The Company’s common stock is quoted on The Nasdaq Global Select MarketÒ under the symbol “CASS.” As of March 1, 2011, there were 158 holders of record of the Company’s common stock. High and low sale prices, as reported by The Nasdaq Global Select Market for each quarter of 2010 and 2009 were as follows:
|
2010
|
2009
|
|||||||||||||||
|
High
|
Low
|
High
|
Low
|
|||||||||||||
|
1st Quarter
|
$ | 31.70 | $ | 29.15 | $ | 33.60 | $ | 23.20 | ||||||||
|
2nd Quarter
|
35.00 | 30.11 | 35.35 | 29.75 | ||||||||||||
|
3rd Quarter
|
35.29 | 31.62 | 36.19 | 29.51 | ||||||||||||
|
4th Quarter
|
40.49 | 33.51 | 31.39 | 27.46 | ||||||||||||
The Company has continuously paid regularly scheduled cash dividends since 1934 and expects to continue to pay quarterly cash dividends in the future. Cash dividends paid per share by the Company during the two most recent fiscal years were as follows:
|
2010
|
2009
|
|||||||
|
March
|
$ | .14 | $ | .13 | ||||
|
June
|
.14 | .13 | ||||||
|
September
|
.14 | .13 | ||||||
|
December
|
.16 | .14 | ||||||
The Company maintains a treasury stock buyback program pursuant to which the Board of Directors has authorized the repurchase of up to 300,000 shares of the Company’s common stock. The Company repurchased 12,000 shares for an aggregate purchase price of $467,000 in 2010 and 0 shares in 2009. As of December 31, 2010, 168,000 shares remained available for repurchase under the program. A portion of the repurchased shares may be used for the Company's employee benefit plans, and the balance will be available for other general corporate purposes. The stock repurchase authorization does not have an expiration date and the pace of repurchase activity will depend on factors such as levels of cash generation from operations, cash requirements for investments, repayment of debt,
current stock price, and other factors. The Company may repurchase shares from time to time on the open market or in private transactions, including structured transactions. The stock repurchase program may be modified or discontinued at any time.
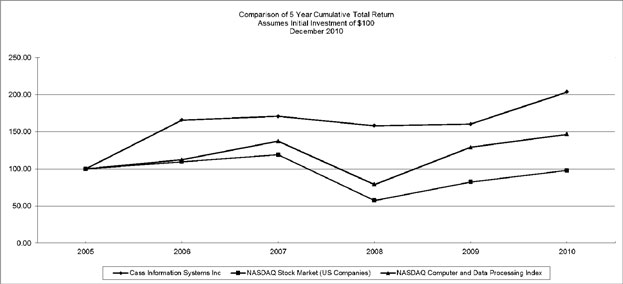
Performance Quoted on The Nasdaq Stock Market for the Last Five Fiscal Years
The following graph compares the cumulative total returns over the last five fiscal years of a hypothetical investment of $100 in shares of common stock of the Company with a hypothetical investment of $100 in The Nasdaq Stock Market (US) (“Nasdaq”) and in the index of Nasdaq computer and data processing stocks. The graph assumes $100 was invested on December 31, 2005, with dividends reinvested. Returns are based on period end prices.
8
|
ITEM 6.
|
SELECTED FINANCIAL DATA
|
The following table presents selected financial information for each of the five years ended December 31. The selected financial data should be read in conjunction with the Company’s consolidated financial statements and accompanying notes included in Item 8 of this report.
|
(Dollars in thousands except per share data)
|
2010
|
2009
|
2008
|
2007
|
2006
|
|||||||||||||||
|
Fee revenue and other income
|
$ | 56,146 | $ | 51,238 | $ | 53,170 | $ | 48,200 | $ | 42,821 | ||||||||||
|
Interest income on loans
|
39,785 | 36,003 | 34,204 | 36,288 | 36,164 | |||||||||||||||
|
Interest income on debt and equity securities
|
8,747 | 7,611 | 7,716 | 5,531 | 3,627 | |||||||||||||||
|
Other interest income
|
514 | 170 | 2,218 | 7,527 | 7,262 | |||||||||||||||
|
Total interest income
|
49,046 | 43,784 | 44,138 | 49,346 | 47,053 | |||||||||||||||
|
Interest expense on deposits
|
4,875 | 4,924 | 3,179 | 7,728 | 6,414 | |||||||||||||||
|
Interest expense on short-term borrowings
|
0 | 23 | 12 | 6 | 7 | |||||||||||||||
|
Interest on debentures and other
|
0 | 106 | 187 | 230 | 198 | |||||||||||||||
|
Total interest expense
|
4,875 | 5,053 | 3,378 | 7,964 | 6,619 | |||||||||||||||
|
Net interest income
|
44,171 | 38,731 | 40,760 | 41,382 | 40,434 | |||||||||||||||
|
Provision for loan losses
|
4,100 | 2,050 | 2,200 | 900 | 1,150 | |||||||||||||||
|
Net interest income after provision
|
40,071 | 36,681 | 38,560 | 40,482 | 39,284 | |||||||||||||||
|
Operating expense
|
68,284 | 66,385 | 65,564 | 62,739 | 58,277 | |||||||||||||||
|
Income before income tax expense
|
27,933 | 21,534 | 26,166 | 25,943 | 23,828 | |||||||||||||||
|
Income tax expense
|
7,623 | 5,405 | 7,160 | 8,148 | 8,367 | |||||||||||||||
|
Income from continuing operations
|
$ | 20,310 | $ | 16,129 | $ | 19,006 | $ | 17,795 | $ | 15,461 | ||||||||||
|
Net loss from discontinued operations
|
— | — | — | — | (395 | ) | ||||||||||||||
|
Net income
|
20,310 | 16,129 | 19,006 | 17,795 | 15,066 | |||||||||||||||
|
Diluted earnings per share from continuing operations
|
$ | 2.15 | $ | 1.73 | $ | 2.03 | $ | 1.90 | $ | 1.65 | ||||||||||
|
Diluted earnings per share
|
2.15 | 1.73 | 2.03 | 1.90 | 1.61 | |||||||||||||||
|
Dividends per share
|
.580 | .530 | .490 | .447 | .400 | |||||||||||||||
|
Dividend payout ratio
|
26.82 | % | 30.54 | % | 24.14 | % | 23.53 | % | 24.84 | % | ||||||||||
|
Average total assets
|
$ | 1,157,257 | $ | 978,171 | $ | 922,471 | $ | 891,734 | $ | 839,208 | ||||||||||
|
Average net loans
|
666,202 | 606,304 | 546,110 | 508,621 | 516,164 | |||||||||||||||
|
Average debt and equity securities
|
222,249 | 193,393 | 197,273 | 141,363 | 91,555 | |||||||||||||||
|
Average total deposits
|
470,096 | 375,572 | 241,844 | 279,831 | 278,546 | |||||||||||||||
|
Average subordinated convertible debentures
|
— | 1,984 | 3,669 | 3,699 | 3,700 | |||||||||||||||
|
Average total shareholders’ equity
|
137,748 | 117,663 | 104,185 | 89,427 | 79,736 | |||||||||||||||
|
Return on average total assets
|
1.76 | % | 1.65 | % | 2.06 | % | 2.00 | % | 1.80 | % | ||||||||||
|
Return on average equity
|
14.74 | 13.71 | 18.24 | 19.90 | 18.89 | |||||||||||||||
|
Average equity to assets ratio
|
11.90 | 12.03 | 11.29 | 10.03 | 9.50 | |||||||||||||||
|
Equity to assets ratio at year-end
|
11.96 | 12.79 | 12.00 | 11.01 | 9.78 | |||||||||||||||
|
Net interest margin
|
4.61 | 4.79 | 5.34 | 5.45 | 5.50 | |||||||||||||||
|
Allowance for loan losses to loans at year-end
|
1.68 | 1.29 | 1.09 | 1.26 | 1.31 | |||||||||||||||
|
Nonperforming assets to loans and foreclosed assets
|
.35 | .55 | .57 | .77 | .16 | |||||||||||||||
|
Net loan charge-offs to average loans outstanding
|
.07 | .04 | .37 | .24 | .16 | |||||||||||||||
|
ITEM 7.
|
MANAGEMENT'S DISCUSSION AND ANALYSIS OF FINANCIAL CONDITION AND RESULTS OF OPERATIONS
|
The following discussion and analysis provides information about the financial condition and results of operations of the Company for the years ended December 31, 2010, 2009 and 2008. This discussion and analysis should be read in conjunction with the Company’s consolidated financial statements and accompanying notes and other selected financial data presented elsewhere in this report.
Executive Overview
Cass provides payment and information processing services to large manufacturing, distribution and retail enterprises from its offices/locations in St. Louis, Missouri, Columbus, Ohio, Boston, Massachusetts, Greenville, South Carolina and Wellington, Kansas. The Company’s services include freight invoice rating, payment processing, auditing, and the generation of accounting and transportation information. Cass also processes and pays utility invoices, which
9
include electricity, gas and telecommunications expenses, and is a provider of telecom expense management solutions. Cass extracts, stores, and presents information from freight, utility and telecommunication invoices, assisting its customers’ transportation, energy, and information technology managers in making decisions that will enable them to improve operating performance. The Company receives data from multiple sources, electronic and otherwise, and processes the data to accomplish the specific operating requirements of its customers. It then provides the data in a central repository for access and archiving. The data is finally transformed into information through the Company’s databases that allow client interaction as required and provide
Internet-based tools for analytical processing. The Company also, through Cass Commercial Bank, its St. Louis, Missouri based bank subsidiary (the “Bank”), provides banking services in the St. Louis metropolitan area, Orange County, California, and other selected cities in the United States. In addition to supporting the Company’s payment operations, the Bank provides banking services to its target markets, which include privately-owned businesses and churches and church-related ministries.
The specific payment and information processing services provided to each customer are developed individually to meet each customer’s requirements, which can vary greatly. In addition, the degree of automation such as electronic data interchange, imaging, and web-based solutions varies greatly among customers and industries. These factors combine so that pricing varies greatly among the customer base. In general, however, Cass is compensated for its processing services through service fees and investment of account balances generated during the payment process. The amount, type, and calculation of service fees vary greatly by service offering, but generally follow the volume of transactions processed. Interest income from the balances generated during
the payment processing cycle is affected by the amount of time Cass holds the funds prior to payment and the dollar volume processed. Both the number of transactions processed and the dollar volume processed are therefore key metrics followed by management. Other factors will also influence revenue and profitability, such as changes in the general level of interest rates, which have a significant effect on net interest income. The funds generated by these processing activities are invested in overnight investments, investment grade securities, and loans generated by the Bank. The Bank earns most of its revenue from net interest income, or the difference between the interest earned on its loans and investments and the interest paid on its deposits and other borrowings. The Bank also assesses fees on other services such as cash management services.
Industry-wide factors that impact the Company include the willingness of large corporations to outsource key business functions such as freight, utility, and telecommunication payment and audit. The benefits that can be achieved by outsourcing transaction processing and the management information generated by Cass’ systems can be influenced by factors such as the competitive pressures within industries to improve profitability, the general level of transportation costs, deregulation of energy costs, and consolidation of telecommunication providers. Economic factors that impact the Company include the general level of economic activity that can affect the volume and size of invoices processed, the ability to hire and retain qualified staff, and the growth and quality of the loan
portfolio. As lower levels of economic activity are encountered, such as those experienced in 2009, the number and total dollar amount of transactions processed by the Company may decline, thereby reducing fee revenue, interest income, and possibly liquidity. Conversely, improving economic conditions, such as those experienced in 2010, will tend to increase fee revenue, interest income, and liquidity. The general level of interest rates also has a significant effect on the revenue of the Company. As discussed in greater detail in Item 7A, “Quantitative and Qualitative Disclosures about Market Risk,” a decline in the general level of interest rates can have a negative impact on net interest income.
In 2010, total fee revenue and other income increased $4,908,000, or 10%, net interest income after provision for loan losses increased $3,390,000, or 9%, and total operating expenses increased $1,899,000, or 3%. These results were driven by a 3,916,000, or 11%, increase in items processed and $3,708,885,000, or 16%, increase in dollars processed. The asset quality of the Company’s loans and investments as of December 31, 2010 appeared strong.
Currently, management views Cass’ major opportunity as the continued expansion of its payment and information processing service offerings and customer base. Management intends to accomplish this by maintaining the Company’s lead in applied technology, which when combined with the security and processing controls of the Bank, makes Cass unique in the industry.
Impact of New and Not Yet Adopted Accounting Pronouncements
In July 2010, the FASB issued Accounting Standards Update (ASU) “Disclosures about the Credit Quality of Financing Receivables and the Allowance for Credit Losses.” This guidance requires a greater level of disaggregated information about the credit quality of financing receivables and reserves for credit losses, including increased disclosure of credit quality indicators, past due information, and modifications of financing receivables. Disclosures regarding activity during a reporting period are effective for interim and annual reporting periods beginning on or after December 15, 2010. Adoption of this ASU is not expected to have a material impact on the Company’s consolidated financial position or results of operations.
10
Critical Accounting Policies
The Company has prepared the consolidated financial statements in this report in accordance with the FASB Accounting Standards Codification (“ASC”). In preparing the consolidated financial statements, management makes estimates and assumptions that affect the reported amount of assets and liabilities, disclosure of contingent assets and liabilities at the date of the financial statements, and the reported amounts of revenue and expenses during the reporting period. These estimates have been generally accurate in the past, have been consistent and have not required any material changes. There can be no assurances that actual results will not differ from those estimates. Certain accounting policies that require significant management estimates and are deemed
critical to our results of operations or financial position have been discussed with the Audit Committee of the Board of Directors and are described below.
Allowance for Loan Losses. The Company performs periodic and systematic detailed reviews of its loan portfolio to assess overall collectability. The level of the allowance for loan losses reflects management’s estimate of the collectability of the loan portfolio. Although these estimates are based on established methodologies for determining allowance requirements, actual results can differ significantly from estimated results. These policies affect both segments of the Company. The impact and associated risks related to these policies on the Company’s business operations are discussed in the “Provision and Allowance for Loan Losses” section of this report. The
Company’s estimates have been materially accurate in the past, and accordingly, the Company expects to continue to utilize the present processes.
Impairment of Assets. The Company periodically evaluates certain long-term assets such as intangible assets including goodwill, foreclosed assets and assets held for sale for impairment. Generally, these assets are initially recorded at cost, and recognition of impairment is required when events and circumstances indicate that the carrying amounts of these assets will not be recoverable in the future. If impairment occurs, various methods of measuring impairment may be called for depending on the circumstances and type of asset, including quoted market prices, estimates based on similar assets, and estimates based on valuation techniques such as discounted projected cash flows. The Company had no impairment of
goodwill and intangible assets for fiscal years ended December 31, 2010, 2009 and 2008 and management does not anticipate any future impairment loss. Investment securities available-for-sale are measured at fair value as calculated by an independent research firm. The market evaluation utilizes several sources which include “observable inputs” rather than “significant unobservable inputs.” These policies affect both segments of the Company and require significant management assumptions and estimates that could result in materially different results if conditions or underlying circumstances change.
Income Taxes. The objectives of accounting for income taxes are to recognize the amount of taxes payable or refundable for the current year and deferred tax liabilities and assets for the future tax consequences of events that have been recognized in an entity's financial statements or tax returns. Judgment is required in addressing the future tax consequences of events that have been recognized in the Company’s financial statements or tax returns such as the realization of deferred tax assets or changes in tax laws or interpretations thereof. In addition, the Company is subject to the continuous examination of its income tax returns by the Internal Revenue Service and other taxing authorities. In accordance
with FASB ASC 740, “Income Taxes,” the Company has unrecognized tax benefits related to tax positions taken or expected to be taken. See Note 13 to the consolidated financial statements. The audit of the Company’s federal consolidated tax returns conducted by the Internal Revenue Service for fiscal years 2004 and 2005 resulted in no significant material adjustments.
Pension Plans. The amounts recognized in the consolidated financial statements related to pension plans are determined from actuarial valuations. Inherent in these valuations are assumptions including expected return on plan assets, discount rates at which the liabilities could be settled at December 31, 2010, rate of increase in future compensation levels and mortality rates. These assumptions are updated annually and are disclosed in Note 10 to the consolidated financial statements. There have been no significant changes in the Company’s long-term rate of return assumptions for the past three fiscal years ended December 31 and management believes they are not reasonably likely to change in the
future. Pursuant to FASB ASC 715, “Compensation – Retirement Benefits,” the Company has recognized the funded status of its defined benefit postretirement plan in its consolidated balance sheet and has recognized changes in that funded status through comprehensive income. The funded status is measured as the difference between the fair value of the plan assets and the projected benefit obligation as of the date of its fiscal year-end.
Summary of Results
|
For the Years Ended December 31,
|
% Change
|
|||||||||||||||||||
|
(In thousands except per share data)
|
2010
|
2009
|
2008
|
2010 v. 2009 | 2009 v. 2008 | |||||||||||||||
|
Total processing volume
|
38,534 | 34,619 | 36,416 | 11.3 | % | (4.9 | )% | |||||||||||||
|
Total processing dollars
|
$ | 27,426,336 | $ | 23,717,451 | $ | 26,900,535 | 15.6 | (11.8 | ) | |||||||||||
|
Payment and processing fees
|
$ | 54,183 | $ | 48,665 | $ | 50,721 | 11.3 | (4.1 | ) | |||||||||||
|
Net interest income after provision for loan losses
|
$ | 40,071 | $ | 36,681 | $ | 38,560 | 9.2 | (4.9 | ) | |||||||||||
|
Total net revenue
|
$ | 96,217 | $ | 87,919 | $ | 91,730 | 9.4 | (4.2 | ) | |||||||||||
|
Average earning assets
|
$ | 1,060,559 | $ | 894,951 | $ | 841,367 | 18.5 | 6.4 | ||||||||||||
|
Net interest margin*
|
4.61 | % | 4.79 | % | 5.34 | % | ||||||||||||||
|
Net income
|
$ | 20,310 | $ | 16,129 | $ | 19,006 | 25.9 | (15.1 | ) | |||||||||||
|
Diluted earnings per share
|
$ | 2.15 | $ | 1.73 | $ | 2.03 | 24.3 | (14.8 | ) | |||||||||||
|
Return on average assets
|
1.76 | % | 1.65 | % | 2.06 | % | ||||||||||||||
|
Return on average equity
|
14.74 | % | 13.71 | % | 18.24 | % | ||||||||||||||
*Presented on a tax-equivalent basis
11
The results of 2010 compared to 2009 include the following significant items:
Payment and processing fee revenue increased as the number of transactions processed increased. This increase was due to increased activity from both base and new customers.
Net interest income after provision for loan losses increased $3,390,000, or 9%, primarily due to the 18% growth in average earning assets. The net interest margin on a tax equivalent basis was 4.61% in 2010 compared to 4.79% in 2009. The growth in average earning assets was funded mainly by the increase in deposits.
Gains from the sale of securities were $0 in 2010 and $697,000 in 2009. Bank service fees were up $86,000, or 6%, and other income was approximately the same in 2010 and 2009. Operating expenses increased $1,899,000, or 3%, primarily in response to the increase in business volume, as well as higher professional fees as the Company invests for future growth.
The results of 2009 compared to 2008 include the following significant items:
Payment and processing fee revenue decreased as the number of transactions processed decreased. This decrease was driven mainly by the decline in the transportation base customer volumes as the global economic slowdown continued.
Net interest income after provision for loan losses decreased $1,879,000 primarily due to a decline in the general level of interest rates and a less favorable mix of funding sources. The net interest margin on a tax equivalent basis was 4.79% in 2009, compared to 5.34% in 2008. The growth in average earning assets was funded mainly by the increase in deposits.
Gains from the sale of securities were $697,000 in 2009 and $552,000 in 2008. Bank service fees and other income were approximately the same in 2009 and 2008. Operating expenses increased $821,000, or 1%.
Fee Revenue and Other Income
The Company’s fee revenue is derived mainly from transportation and utility payment and processing fees. As the Company provides its processing and payment services, it is compensated by service fees which are typically calculated on a per-item basis and by the accounts and drafts payable balances generated in the payment process which can be used to generate interest income. Processing volumes, fee revenue and other income were as follows:
|
December 31,
|
% Change
|
|||||||||||||||||||
|
(In thousands)
|
2010
|
2009
|
2008
|
2010 v. 2009 | 2009 v. 2008 | |||||||||||||||
|
Transportation invoice transaction volume
|
26,287 | 23,137 | 25,854 | 13.6 | % | (10.5 | )% | |||||||||||||
|
Transportation invoice dollar volume
|
$ | 16,966,003 | $ | 14,047,342 | $ | 17,482,520 | 20.8 | (19.6 | ) | |||||||||||
|
Utility transaction volume
|
12,247 | 11,482 | 10,562 | 6.7 | 8.7 | |||||||||||||||
|
Utility transaction dollar volume
|
$ | 10,460,333 | $ | 9,670,109 | $ | 9,418,015 | 8.2 | 2.7 | ||||||||||||
|
Payment and processing revenue
|
$ | 54,183 | $ | 48,665 | $ | 50,721 | 11.3 | (4.1 | ) | |||||||||||
|
Bank service fees
|
$ | 1,410 | $ | 1,324 | $ | 1,330 | 6.5 | (0.5 | ) | |||||||||||
|
Gains on sales of investment securities
|
$ | 0 | $ | 697 | $ | 552 | (100.0 | ) | 26.3 | |||||||||||
|
Other
|
$ | 553 | $ | 552 | $ | 567 | 0.2 | (2.6 | ) | |||||||||||
Fee revenue and other income in 2010 compared to 2009 include the following significant pre-tax components:
Transportation dollar volume increased by 21% during the past year. This increase was due to the increased activity from both base and new customers. Utility transaction dollar volume was up a solid 8%. Overall, revenues for the year were up 11%.
Fee revenue and other income in 2009 compared to 2008 include the following significant pre-tax components:
12
Transportation volume decreased by 2,717,000 transactions during the past year. This decrease was due mainly to the impact of the general economic slow-down on existing customer processing activity. Utility volume experienced solid growth, adding more than 920,000 transactions in 2009. This growth was due mainly to new business. The reduction in transportation transaction volume drove the $2,056,000 decrease in payment and processing revenue.
Net Interest Income
Net interest income is the difference between interest earned on loans, investments, and other earning assets and interest expense on deposits and other interest-bearing liabilities. Net interest income is a significant source of the Company’s revenues. The following table summarizes the changes in tax-equivalent net interest income and related factors:
|
December 31,
|
% Change
|
|||||||||||||||||||
|
(In thousands)
|
2010
|
2009
|
2008
|
2010 v. 2009 | 2009 v. 2008 | |||||||||||||||
|
Average earning assets
|
$ | 1,060,559 | $ | 894,951 | $ | 841,366 | 18.5 | % | 6.4 | % | ||||||||||
|
Net interest income*
|
$ | 48,891 | $ | 42,869 | $ | 44,966 | 14.0 | (4.7 | ) | |||||||||||
|
Net interest margin*
|
4.61 | % | 4.79 | % | 5.34 | % | ||||||||||||||
|
Yield on earning assets*
|
5.07 | % | 5.35 | % | 5.75 | % | ||||||||||||||
|
Rate on interest bearing liabilities
|
1.37 | % | 1.81 | % | 2.16 | % | ||||||||||||||
*Presented on a tax-equivalent basis using a tax rate of 35% in 2010, 34% in 2009, and 35% in 2008.
Net interest income in 2010 compared to 2009:
The increase in net interest income was caused by the increase in average earning assets, partially offset by a decrease in net interest margin. The increase in earning assets was funded mainly by the increase in deposits and accounts and drafts payable. The decrease in net interest margin was due to the continued low interest rate environment. More information is contained in the tables below and in Item 7A of this report.
Total average loans increased $62,642,000, or 10%, to $675,901,000. Loans have a positive effect on interest income and the net interest margin due to the fact that loans are one of the Company’s highest yielding earning assets for any given maturity.
Total average investment in securities increased $28,856,000, or 15%, to $222,249,000. The investment portfolio will expand and contract over time as the interest rate environment changes and the Company manages its liquidity and interest rate position. All purchases were made in accordance with the Company’s investment policy. Total average federal funds sold and other short-term investments increased $68,280,000, or 117%.
The Bank’s average interest-bearing deposits increased $83,063,000, or 30%, compared to the prior year. This increase in deposits, along with the $73,729,000, or 16% increase in accounts and drafts payable, funded the increase in earning assets. Average rates paid on interest-bearing liabilities decreased from 1.81% to 1.37% as a result of the continued low interest rate environment experienced during 2010.
Net interest income in 2009 compared to 2008:
The decrease in net interest income was caused by the decrease in net interest margin, partially offset by an increase in average earning assets. The increase in earning assets was funded mainly by the increase in deposits. The decrease in net interest margin was due mainly to the reduction in the general level of interest rates and a less favorable mix of funding sources.
Total average loans increased $60,926,000, or 11%, to $613,259,000. Loans have a positive effect on interest income and the net interest margin due to the fact that loans are one of the Company’s highest yielding earning assets for any given maturity.
Total average investment in securities decreased $3,880,000, or 2%, to $193,393,000. The investment portfolio will expand and contract over time as the interest rate environment changes and the Company manages its liquidity and interest rate position. All purchases were made in accordance with the Company’s investment policy. Total average federal funds sold and other short-term investments decreased $16,090,000, or 22%. This decrease offset the previously mentioned increase in loans.
The Bank’s average interest-bearing deposits increased $121,362,000, or 80%, compared to the prior year. The increase in deposits was required to offset the $99,342,000, or 18%, decrease in accounts and drafts
13
payable that resulted from a lower level of transportation invoice dollar volume. Average rates paid on interest-bearing liabilities decreased from 2.16% to 1.81% as a result of an overall decline in the interest rate environment during 2009.
Distribution of Assets, Liabilities and Shareholders' Equity; Interest Rate and Interest Differential
The following table contains condensed average balance sheets for each of the periods reported, the tax-equivalent interest income and expense on each category of interest-earning assets and interest-bearing liabilities, and the average yield on such categories of interest-earning assets and the average rates paid on such categories of interest-bearing liabilities for each of the periods reported:
|
2010
|
2009
|
2008
|
||||||||||||||||||||||||||||||||||
|
(In thousands)
|
Average
Balance
|
Interest
Income/
Expense
|
Yield/
Rate
|
Average
Balance
|
Interest
Income/
Expense
|
Yield/
Rate
|
Average
Balance
|
Interest
Income/
Expense
|
Yield/
Rate
|
|||||||||||||||||||||||||||
|
Assets1
|
||||||||||||||||||||||||||||||||||||
|
Earning assets
|
||||||||||||||||||||||||||||||||||||
|
Loans2, 3:
|
||||||||||||||||||||||||||||||||||||
|
Taxable
|
$ | 674,026 | $ | 39,723 | 5.89 | % | $ | 610,171 | $ | 35,872 | 5.88 | % | $ | 548,500 | $ | 34,030 | 6.20 | % | ||||||||||||||||||
|
Tax-exempt4
|
1,875 | 95 | 5.07 | 3,088 | 202 | 6.54 | 3,833 | 268 | 6.97 | |||||||||||||||||||||||||||
|
Debt and equity securities5:
|
||||||||||||||||||||||||||||||||||||
|
Taxable
|
885 | 43 | 4.86 | 3,373 | 58 | 1.72 | 2,758 | 78 | 2.83 | |||||||||||||||||||||||||||
|
Tax-exempt4
|
221,364 | 13,391 | 6.05 | 190,020 | 11,620 | 6.12 | 194,515 | 11,750 | 6.04 | |||||||||||||||||||||||||||
|
Interest-bearing deposits in other financial institutions
|
35,655 | 139 | .39 | 29,825 | 72 | 0.24 | 17,196 | 375 | 2.18 | |||||||||||||||||||||||||||
|
Federal funds sold and other short-term investments
|
126,754 | 375 | .30 | 58,474 | 98 | 0.17 | 74,564 | 1,843 | 2.47 | |||||||||||||||||||||||||||
|
Total earning assets
|
1,060,559 | 53,766 | 5.07 | 894,951 | 47,922 | 5.35 | 841,366 | 48,344 | 5.75 | |||||||||||||||||||||||||||
|
Non-earning assets
|
||||||||||||||||||||||||||||||||||||
|
Cash and due from banks
|
10,794 | 9,541 | 11,607 | |||||||||||||||||||||||||||||||||
|
Premise and equipment, net
|
9,979 | 11,171 | 12,393 | |||||||||||||||||||||||||||||||||
|
Bank owned life insurance
|
13,924 | 13,376 | 12,802 | |||||||||||||||||||||||||||||||||
|
Goodwill and other intangibles
|
7,795 | 7,942 | 8,216 | |||||||||||||||||||||||||||||||||
|
Other assets
|
63,905 | 48,145 | 42,310 | |||||||||||||||||||||||||||||||||
|
Allowance for loan losses
|
(9,699 | ) | (6,955 | ) | (6,223 | ) | ||||||||||||||||||||||||||||||
|
Total assets
|
$ | 1,157,257 | $ | 978,171 | $ | 922,471 | ||||||||||||||||||||||||||||||
|
Liabilities and Shareholders’ Equity1
|
||||||||||||||||||||||||||||||||||||
|
Interest-bearing liabilities
|
||||||||||||||||||||||||||||||||||||
|
Interest-bearing demand deposits
|
$ | 182,869 | $ | 2,082 | 1.14 | % | $ | 127,952 | $ | 1,798 | 1.41 | % | $ | 77,835 | $ | 1,086 | 1.40 | % | ||||||||||||||||||
|
Savings deposits
|
28,137 | 321 | 1.14 | 25,268 | 334 | 1.32 | 21,434 | 290 | 1.35 | |||||||||||||||||||||||||||
|
Time deposits >=$100
|
52,510 | 814 | 1.55 | 43,590 | 1,063 | 2.44 | 32,052 | 1,102 | 3.44 | |||||||||||||||||||||||||||
|
Other time deposits
|
92,942 | 1,658 | 1.78 | 76,585 | 1,729 | 2.26 | 20,712 | 701 | 3.38 | |||||||||||||||||||||||||||
|
Total interest-bearing deposits
|
356,458 | 4,875 | 1.37 | 273,395 | 4,924 | 1.80 | 152,033 | 3,179 | 2.09 | |||||||||||||||||||||||||||
|
Short-term borrowings
|
33 | — | — | 3,759 | 23 | 0.61 | 876 | 12 | 1.37 | |||||||||||||||||||||||||||
|
Subordinated debentures
|
— | — | — | 1,984 | 106 | 5.34 | 3,669 | 187 | 5.10 | |||||||||||||||||||||||||||
|
Total interest bearing liabilities
|
356,491 | 4,875 | 1.37 | 279,138 | 5,053 | 1.81 | 156,578 | 3,378 | 2.16 | |||||||||||||||||||||||||||
|
Non-interest bearing liabilities
|
||||||||||||||||||||||||||||||||||||
|
Demand deposits
|
113,638 | 102,177 | 89,811 | |||||||||||||||||||||||||||||||||
|
Accounts and drafts payable
|
533,617 | 459,888 | 559,230 | |||||||||||||||||||||||||||||||||
|
Other liabilities
|
15,763 | 19,305 | 12,667 | |||||||||||||||||||||||||||||||||
|
Total liabilities
|
1,019,509 | 860,508 | 818,286 | |||||||||||||||||||||||||||||||||
|
Shareholders’ equity
|
137,748 | 117,663 | 104,185 | |||||||||||||||||||||||||||||||||
|
Total liabilities and share- holders’ equity
|
$ | 1,157,257 | $ | 978,171 | $ | 922,471 | ||||||||||||||||||||||||||||||
|
Net interest income
|
$ | 48,891 | $ | 42,869 | $ | 44,966 | ||||||||||||||||||||||||||||||
|
Net interest margin
|
4.61 | % | 4.79 | % | 5.34 | % | ||||||||||||||||||||||||||||||
|
Interest spread
|
3.70 | % | 3.54 | % | 3.59 | % | ||||||||||||||||||||||||||||||
|
1
|
Balances shown are daily averages.
|
|
2
|
For purposes of these computations, nonaccrual loans are included in the average loan amounts outstanding. Interest on nonaccrual loans is recorded when received as discussed further in Item 8, Note 1 of this report.
|
|
3
|
Interest income on loans includes net loan fees of $372,000, $409,000 and $310,000 for 2010, 2009 and 2008, respectively.
|
14
|
4
|
Interest income is presented on a tax-equivalent basis assuming a tax rate of 35% in 2010, 34% for 2009, and 35% for 2008. The tax-equivalent adjustment was approximately $4,720,000, $4,138,000 and $4,206,000 for 2010, 2009 and 2008, respectively.
|
|
5
|
For purposes of these computations, yields on investment securities are computed as interest income divided by the average amortized cost of the investments.
|
Analysis of Net Interest Income Changes
The following table presents the changes in interest income and expense between years due to changes in volume and interest rates.
|
2010 Over 2009
|
2009 Over 2008
|
|||||||||||||||||||||||
|
(In thousands)
|
Volume1
|
Rate1
|
Total
|
Volume1
|
Rate1
|
Total
|
||||||||||||||||||
|
Increase (decrease) in interest income:
|
||||||||||||||||||||||||
|
Loans2,3:
|
||||||||||||||||||||||||
|
Taxable
|
$ | 3,763 | $ | 88 | $ | 3,851 | $ | 3,689 | $ | (1,847 | ) | $ | 1,842 | |||||||||||
|
Tax-exempt4
|
(68 | ) | (39 | ) | (107 | ) | (49 | ) | (17 | ) | (66 | ) | ||||||||||||
|
Debt and equity securities:
|
||||||||||||||||||||||||
|
Taxable
|
(65 | ) | 50 | (15 | ) | 15 | (35 | ) | (20 | ) | ||||||||||||||
|
Tax-exempt4
|
1,897 | (126 | ) | 1,771 | (274 | ) | 144 | (130 | ) | |||||||||||||||
|
Interest-bearing deposits in other financial institutions
|
16 | 51 | 67 | 165 | (468 | ) | (303 | ) | ||||||||||||||||
|
Federal funds sold and other short-term investments
|
167 | 110 | 277 | (328 | ) | (1,417 | ) | (1,745 | ) | |||||||||||||||
|
Total interest income
|
$ | 5,710 | $ | 134 | $ | 5,844 | $ | 3,218 | $ | (3,640 | ) | $ | (422 | ) | ||||||||||
|
Interest expense on:
|
||||||||||||||||||||||||
|
Interest-bearing demand deposits
|
$ | 670 | $ | (386 | ) | $ | 284 | $ | 704 | $ | 8 | $ | 712 | |||||||||||
|
Savings deposits
|
36 | (49 | ) | (13 | ) | 51 | (7 | ) | 44 | |||||||||||||||
|
Time deposits >=$100
|
189 | (438 | ) | (249 | ) | 333 | (372 | ) | (39 | ) | ||||||||||||||
|
Other time deposits
|
330 | (401 | ) | (71 | ) | 1,331 | (303 | ) | 1,028 | |||||||||||||||
|
Short-term borrowings
|
(11 | ) | (12 | ) | (23 | ) | 21 | (10 | ) | 11 | ||||||||||||||
|
Subordinated debentures
|
(53 | ) | (53 | ) | (106 | ) | (90 | ) | 9 | (81 | ) | |||||||||||||
|
Total interest expense
|
1,161 | (1,339 | ) | (178 | ) | 2,350 | (675 | ) | 1,675 | |||||||||||||||
|
Net interest income
|
$ | 4,549 | $ | 1,473 | $ | 6,022 | $ | 868 | $ | (2,965 | ) | $ | (2,097 | ) | ||||||||||
|
1
|
The change in interest due to the combined rate/volume variance has been allocated in proportion to the absolute dollar amounts of the change in each.
|
|
2
|
Average balances include nonaccrual loans.
|
|
3
|
Interest income includes net loan fees.
|
|
4
|
Interest income is presented on a tax-equivalent basis assuming a tax rate of 35% in 2010, 34% in 2009, and 35% in 2008.
|
Loan Portfolio
Interest earned on the loan portfolio is a primary source of income for the Company. The loan portfolio was $708,633,000 and represented 60% of the Company's total assets as of December 31, 2010 and generated $39,785,000 in revenue during the year then ended. The Company had no sub-prime mortgage loans or residential development loans in its portfolio for any of the years presented. The following tables show the composition of the loan portfolio at the end of the periods indicated and remaining maturities for loans as of December 31, 2010.
Loans by Type
|
December 31,
|
||||||||||||||||||||
|
(In thousands)
|
2010
|
2009
|
2008
|
2007
|
2006
|
|||||||||||||||
|
Commercial and industrial
|
$ | 135,061 | $ | 93,371 | $ | 118,044 | $ | 100,827 | $ | 113,162 | ||||||||||
|
Real estate: (Commercial and church)
|
||||||||||||||||||||
|
Mortgage
|
516,579 | 469,097 | 412,788 | 360,907 | 352,044 | |||||||||||||||
|
Construction
|
54,752 | 74,407 | 56,221 | 31,082 | 29,779 | |||||||||||||||
|
Industrial revenue bonds
|
1,014 | 2,676 | 3,363 | 4,149 | 6,293 | |||||||||||||||
|
Other
|
1,227 | 2,406 | 1,560 | 1,490 | 2,847 | |||||||||||||||
|
Total loans
|
$ | 708,633 | $ | 641,957 | $ | 591,976 | $ | 498,455 | $ | 504,125 | ||||||||||
15
Loans by Maturity
(At December 31, 2010)
|
One Year
Or Less
|
Over 1 Year
Through 5 Years
|
Over
5 Years
|
||||||||||||||||||||||||||
|
(In thousands)
|
Fixed
Rate
|
Floating
Rate1
|
Fixed
Rate
|
Floating
Rate1
|
Fixed
Rate
|
Floating
Rate1
|
Total
|
|||||||||||||||||||||
|
Commercial and industrial
|
$ | 2,105 | $ | 67,571 | $ | 18,093 | $ | 21,396 | $ | 7,263 | $ | 18,633 | $ | 135,061 | ||||||||||||||
|
Real estate (Commercial and Church):
|
||||||||||||||||||||||||||||
|
Mortgage
|
56,097 | 19,199 | 398,813 | 36,228 | 6,242 | ― | 516,579 | |||||||||||||||||||||
|
Construction
|
19,109 | 22,758 | 2,897 | 9,988 | ― | ― | 54,752 | |||||||||||||||||||||
|
Industrial revenue bonds
|
231 | ― | 783 | ― | ― | ― | 1,014 | |||||||||||||||||||||
|
Other
|
494 | 718 | 15 | ― | ― | ― | 1,227 | |||||||||||||||||||||
|
Total loans
|
$ | 78,036 | $ | 110,246 | $ | 420,601 | $ | 67,612 | $ | 13,505 | $ | 18,633 | $ | 708,633 | ||||||||||||||
|
1
|
Loans have been classified as having "floating" interest rates if the rate specified in the loan varies with the prime commercial rate of interest. Note: Due to the historically low interest rates encountered during 2008 and continuing during 2009 and 2010, the Company instituted a 4% floor for its prime lending rate.
|
The Company has no concentrations of loans exceeding 10% of total loans, which are not otherwise disclosed in the loan portfolio composition table and as are discussed in Item 8, Note 4 of this report. As can be seen in the loan composition table above and as are discussed in Item 8, Note 4 the Company's primary market niche for banking services is privately held businesses and churches and church-related ministries.
Loans to commercial entities are generally secured by the business assets of the borrower, including accounts receivable, inventory, machinery and equipment, and the real estate from which the borrower operates. Operating lines of credit to these companies generally are secured by accounts receivable and inventory, with specific percentages of each determined on a customer-by-customer basis based on various factors including the type of business. Intermediate term credit for machinery and equipment is generally provided at some percentage of the value of the equipment purchased, depending on the type of machinery or equipment purchased by the entity. Loans secured exclusively by real estate to businesses and churches are generally made with a maximum 80% loan to value ratio, depending upon
the Company's estimate of the resale value and ability of the property to generate cash. The Company's loan policy requires an independent appraisal for all loans over $250,000 secured by real estate. Company management monitors the local economy in an attempt to determine whether it has had a significant deteriorating effect on such real estate loans. When problems are identified, appraised values are updated on a continual basis, either internally or through an updated external appraisal.
Loan portfolio changes from December 31, 2009 to December 31, 2010:
Total loans increased $66,676,000, or 10%, to $708,633,000. This increase was the result of the continued successful marketing efforts by the Company’s lending staff, particularly in the commercial and industrial loan sector. The growth in real estate mortgage loans was primarily due to increased activity in the church portfolio as was the case in 2009. Additional details regarding the types and maturities of loans in the loan portfolio are contained in the tables above and in Item 8, Note 4.
Loan portfolio changes from December 31, 2008 to December 31, 2009:
Total loans increased $49,981,000, or 8%, to $641,957,000. This increase was the result of two primary factors: 1) the continued successful implementation of new marketing efforts by the Company’s lending staff and 2) the negative impact of the credit crisis on many of the Company’s competitors resulted in more attractive loan growth opportunities. The growth in real estate construction loans was primarily due to increased activity in the church portfolio as was the case in 2008. At year-end, church and church-related real estate and construction loans totaled $371,126,000, which represents a 20% increase over 2008. Additional details regarding the types and maturities of loans in the loan portfolio are contained in the tables above and in Item
8, Note 4.
Provision and Allowance for Loan Losses
The Company recorded a provision for loan losses of $4,100,000 in 2010, $2,050,000 in 2009, and $2,200,000 in 2008. The amount of the provisions for loan losses was derived from the Company’s quarterly analysis of the allowance for loan losses. The amount of the provision will fluctuate as determined by these quarterly analyses. The increase in provision for loan losses in 2010 was the result of the recent growth in the loan portfolio and the negative effect the protracted difficult economic conditions have had on both borrowers’ cash flow and collateral values. The Company had net loan charge-offs of $493,000, $217,000, and $2,029,000 in 2010, 2009 and 2008, respectively. The
16
allowance for loan losses was $11,891,000 at December 31, 2010 compared to $8,284,000 at December 31, 2009 and $6,451,000 at December 31, 2008. The year-end 2010 allowance represented 1.68% of outstanding loans, compared to 1.29% at year-end 2009 and 1.09% at year-end 2008. The increase in the allowance for loan losses at December 31, 2010 is the direct result of the increase in the provision for loan losses described above. From December 31, 2009 to December 31, 2010, the level of nonperforming loans decreased $1,043,000 from $1,608,000 to $565,000, which represents .08% of outstanding loans. Nonperforming loans are more fully explained in the section entitled “Nonperforming Assets.”
The allowance for loan losses has been established and is maintained to absorb probable losses in the loan portfolio. An ongoing assessment of risk of loss is performed to determine if the current balance of the allowance is adequate to cover probable losses in the portfolio. Charges or credits are made to expense to cover any deficiency or reduce any excess, as required. The current methodology employed to determine the appropriate allowance consists of two components, specific and general. The Company develops specific allowances on commercial, commercial real estate, and construction loans based on individual review of these loans and an estimate of the borrower’s ability to repay the loan given the availability of collateral, other sources of cash flow and
collection options available. The general component relates to all other loans, which are evaluated based on loan grade. The loan grade assigned to each loan is typically evaluated on an annual basis, unless circumstances require interim evaluation. The Company assigns an allowance amount consistent with each loan's rating category. The allowance amount is based on derived loss experience over prescribed periods. In addition to the amounts derived from the loan grades, a portion is added to the general allowance to take into account other factors including national and local economic conditions, downturns in specific industries including loss in collateral value, trends in credit quality at the Company and the banking industry, and trends in risk rating changes. As part of their examination process, federal and state agencies review the Company's methodology for maintaining the allowance for loan losses and the related
balance. These agencies may require the Company to increase the allowance for loan losses based on their judgments and interpretations about information available to them at the time of their examination.
The following schedule summarizes activity in the allowance for loan losses and the allocation of the allowance to the Company’s loan categories. During 2010, the allocations to the commercial and real estate mortgage portfolios increased primarily due to the increases of $41,690,000 and $47,482,000 respectively, in additional loan balances.
Summary of Loan Loss Experience
|
December 31,
|
||||||||||||||||||||
|
(In thousands)
|
2010
|
2009
|
2008
|
2007
|
2006
|
|||||||||||||||
|
Allowance at beginning of year
|
$ | 8,284 | $ | 6,451 | $ | 6,280 | $ | 6,592 | $ | 6,284 | ||||||||||
|
Loans charged-off:
|
||||||||||||||||||||
|
Commercial and industrial, industrial revenue bonds (“IRB’s”)
|
554 | 109 | 2,120 | 337 | 864 | |||||||||||||||
|
Real estate: (Commercial and church)
|
||||||||||||||||||||
|
Mortgage
|
¾ | 291 | ¾ | 1,038 | ¾ | |||||||||||||||
|
Construction
|
¾ | ¾ | ¾ | ¾ | ¾ | |||||||||||||||
|
Other
|
¾ | ¾ | 53 | ¾ | ¾ | |||||||||||||||
|
Total loans charged-off
|
554 | 400 | 2,173 | 1,375 | 864 | |||||||||||||||
|
Recoveries of loans previously charged-off:
|
||||||||||||||||||||
|
Commercial and industrial, IRB’s
|
60 | 180 | 136 | 159 | 22 | |||||||||||||||
|
Real estate: (Commercial and church)
|
||||||||||||||||||||
|
Mortgage
|
1 | 3 | ¾ | 4 | ¾ | |||||||||||||||
|
Construction
|
¾ | ¾ | ¾ | ¾ | ¾ | |||||||||||||||
|
Other
|
¾ | ¾ | 8 | ¾ | ¾ | |||||||||||||||
|
Total recoveries of loans previously charged-off
|
61 | 183 | 144 | 163 | 22 | |||||||||||||||
|
Net loans charged-off
|
493 | 217 | 2,029 | 1,212 | 842 | |||||||||||||||
|
Provision charged to expense
|
4,100 | 2,050 | 2,200 | 900 | 1,150 | |||||||||||||||
|
Allowance at end of year
|
$ | 11,891 | $ | 8,284 | $ | 6,451 | $ | 6,280 | $ | 6,592 | ||||||||||
|
Loans outstanding:
|
||||||||||||||||||||
|
Average
|
$ | 675,901 | $ | 613,259 | $ | 552,333 | $ | 515,123 | $ | 522,367 | ||||||||||
|
December 31
|
708,633 | 641,957 | 591,976 | 498,455 | 504,125 | |||||||||||||||
|
Ratio of allowance for loan losses to loans outstanding:
|
||||||||||||||||||||
|
Average
|
1.76 | % | 1.35 | % | 1.17 | % | 1.22 | % | 1.26 | % | ||||||||||
|
December 31
|
1.68 | % | 1.29 | % | 1.09 | % | 1.26 | % | 1.31 | % | ||||||||||
|
Ratio of net charge-offs to average loans outstanding
|
.07 | % | .04 | % | .37 | % | .24 | % | .16 | % | ||||||||||
|
Allocation of allowance for loan losses1:
|
||||||||||||||||||||
|
Commercial and industrial, IRB’s
|
$ | 2,732 | $ | 1,511 | $ | 1,521 | $ | 3,380 | $ | 3,507 | ||||||||||
|
Real estate: (Commercial and church)
|
||||||||||||||||||||
|
Mortgage
|
8,491 | 5,953 | 4,343 | 2,564 | 2,723 | |||||||||||||||
|
Construction
|
656 | 809 | 569 | 318 | 271 | |||||||||||||||
|
Other
|
12 | 11 | 18 | 18 | 91 | |||||||||||||||
|
Total
|
$ | 11,891 | $ | 8,284 | $ | 6,451 | $ | 6,280 | $ | 6,592 | ||||||||||
|
Percentage of categories to total loans:
|
||||||||||||||||||||
|
Commercial and industrial, IRB’s
|
19.2 | % | 14.9 | % | 20.5 | % | 21.1 | % | 22.5 | % | ||||||||||
|
Real estate: (Commercial and church)
|
||||||||||||||||||||
|
Mortgage
|
72.9 | 73.1 | 69.7 | 72.4 | 69.8 | |||||||||||||||
|
Construction
|
7.7 | 11.6 | 9.5 | 6.2 | 5.9 | |||||||||||||||
|
Other
|
0.2 | 0.4 | 0.3 | 0.3 | 1.8 | |||||||||||||||
|
Total
|
100.0 | % | 100.0 | % | 100.0 | % | 100.0 | % | 100.0 | % | ||||||||||
1Although specific allocations exist, the entire allowance is available to absorb losses in any particular loan category.
17
Nonperforming Assets
It is the policy of the Company to continually monitor its loan portfolio and to discontinue the accrual of interest on any loan on which payment of principal or interest in a timely manner in the normal course of business, is doubtful. Subsequent payments received on such loans are applied to principal if there is any reasonable doubt as to the collectability of such principal; otherwise, these receipts are recorded as interest income. Interest on nonaccrual and renegotiated loans, which would have been recorded under the original terms of the loans, was approximately $83,000 for the year ended December 31, 2010. Of this amount, approximately $35,000 was actually recorded as interest income on such loans.
Total nonaccrual loans at December 31, 2010 consists of four loans totaling $565,000 that relate to businesses/churches that have weak financial positions and/or are in liquidation. Allocations of the allowance for loan losses have been established for the estimated loss exposure.
Foreclosed assets were $1,910,000 at December 31, 2010. The foreclosed assets relate to the foreclosure of two loans which were secured by commercial real estate buildings in St. Louis County and St. Charles County, Missouri. These buildings are currently listed for sale and have been recorded at their estimated fair value less costs to sell.
The Company does not have any foreign loans. The Company's loan portfolio does not include a significant amount of single family real estate mortgages, as the Company does not market its services to retail customers. Also, the Company had no sub-prime mortgage loans or residential development loans in its portfolio in any of the years presented.
The Company does not have any other interest-earning assets which would have been included in nonaccrual, past due or restructured loans if such assets were loans.
Summary of Nonperforming Assets
|
December 31,
|
||||||||||||||||||||
|
(In thousands)
|
2010
|
2009
|
2008
|
2007
|
2006
|
|||||||||||||||
|
Commercial and industrial, IRB’s:
|
||||||||||||||||||||
|
Nonaccrual
|
$ | 46 | $ | ¾ | $ | 278 | $ | 1,277 | $ | 795 | ||||||||||
|
Contractually past due 90 days or more and still accruing
|
¾ | ¾ | 41 | 496 | ¾ | |||||||||||||||
|
Renegotiated loans
|
¾ | ¾ | ¾ | ¾ | ¾ | |||||||||||||||
|
Real estate – mortgage:
|
||||||||||||||||||||
|
Nonaccrual
|
519 | 1,608 | 900 | 708 | ¾ | |||||||||||||||
|
Contractually past due 90 days or more and still accruing
|
¾ | ¾ | ¾ | ¾ | ¾ | |||||||||||||||
|
Renegotiated loans
|
¾ | ¾ | ¾ | ¾ | ¾ | |||||||||||||||
|
Total nonperforming loans
|
$ | 565 | $ | 1,608 | $ | 1,219 | $ | 2,481 | $ | 795 | ||||||||||
|
Total foreclosed assets
|
1,910 | 1,910 | 2,177 | 1,388 | ¾ | |||||||||||||||
|
Total nonperforming assets
|
$ | 2,475 | $ | 3,518 | $ | 3,396 | $ | 3,869 | $ | 795 | ||||||||||
Operating Expenses
Operating expenses in 2010 compared to 2009 include the following significant pre-tax components:
Salaries and employee benefits expense increased $754,000, or 1%, to $51,368,000. This is mainly attributable to higher incentive compensation related to higher pre-tax income.
18
Occupancy expense increased $89,000, or 4%, to $2,485,000 as a result of additional maintenance and repairs expense.
Equipment expense increased $213,000, or 6%, to $3,561,000 primarily due to increased software license and maintenance expenses.
Amortization of intangibles decreased $115,000, or 52%, to $107,000 because the software from the 2004 PROFITLAB, Inc. acquisition was fully amortized during the third quarter of 2009.
Other operating expense increased $958,000, or 10%, to $10,763,000 primarily due to an increase in professional fees.
Operating expenses in 2009 compared to 2008 include the following significant pre-tax components:
Salaries and employee benefits expense increased $891,000, or 2%, to $50,614,000. This is mainly attributable to higher pension costs.
Occupancy expense increased $168,000, or 8%, to $2,396,000 as a result of additional maintenance and repairs expense plus an increase in rent expense.
Equipment expense increased $17,000, or less than 1%, to $3,348,000.
Amortization of intangibles decreased $58,000, or 21%, to $222,000 because the software from the 2004 PROFITLAB, Inc. acquisition was fully amortized during the third quarter of 2009.
Other operating expense increased $821,000, or 1%, to $66,385,000 primarily due to an increase of $729,000 in FDIC insurance expense.
Income Tax Expense
Income tax expense in 2010 totaled $7,623,000 compared to $5,405,000 in 2009, and $7,160,000 in 2008. When measured as a percent of income, the Company’s effective tax rate was 27% in 2010, 25% in 2009 and 27% in 2008. The effective tax rate varies from year-to-year due to changes in the Company’s pre-tax income and the amount of investment in tax-exempt municipal bonds.
Investment Portfolio
Investment portfolio changes from December 31, 2009 to December 31, 2010:
State and political subdivision securities increased $39,972,000, or 18%, to $264,569,000. The investment portfolio provides the Company with a significant source of earnings, secondary source of liquidity, and mechanisms to manage the effects of changes in loan demand and interest rates. Therefore, the size, asset allocation and maturity distribution of the investment portfolio will vary over time depending on management’s assessment of current and future interest rates, changes in loan demand, changes in the Company’s sources of funds and the economic outlook. During this period, the size of the investment portfolio increased as the Company purchased state and political subdivision securities. These securities all had AA or better credit ratings and
maturities approaching ten years. With the additional liquidity provided by the increase in deposits and accounts and drafts payable, the Company made these purchases to continue to reduce the level of short-term rate sensitive assets. All purchases were made in accordance with the Company’s investment policy. As of December 31, 2010, the Company had no mortgage-backed securities in its portfolio.
There was no single issuer of securities in the investment portfolio at December 31, 2010 for which the aggregate amortized cost exceeded 10% of total shareholders' equity.
Investments by Type
|
December 31,
|
||||||||||||
|
(In thousands)
|
2010
|
2009
|
2008
|
|||||||||
|
U.S. Treasury securities
|
$ | ¾ | $ | ¾ | $ | 200 | ||||||
|
State and political subdivisions
|
264,569 | 224,597 | 192,918 | |||||||||
|
Total investments
|
$ | 264,569 | $ | 224,597 | $ | 193,118 | ||||||
19
Investment in Debt Securities by Maturity
(At December 31, 2010)
|
(In thousands)
|
Within 1
Year
|
Over 1 to
5 Years
|
Over 5 to
10 Years
|
Over
10 Years
|
Yield
|
|||||||||||||||
|
State and political subdivisions
|
$ | 16,853 | $ | 35,968 | $ | 115,425 | $ | 96,323 | 5.93 | % | ||||||||||
|
Weighted average yield1
|
5.83 | % | 5.89 | % | 6.31 | % | 5.55 | % | 5.93 | % | ||||||||||
1Weighted average yield is presented on a tax-equivalent basis assuming a tax rate of 35%.
Deposits and Accounts and Drafts Payable
Noninterest-bearing demand deposits decreased $54,000, or less than 1%, from December 31, 2009 to $113,097,000 at December 31, 2010. The average balances of these deposits increased $11,461,000, or 11%, from 2009 to $113,638,000 in 2010. These balances are primarily maintained by commercial customers and churches and can fluctuate on a daily basis.
Interest-bearing deposits increased $80,768,000, or 25%, from December 31, 2009 to $405,493,000 at December 31, 2010. The average balances of these deposits increased to $356,458,000 in 2010 from $273,395,000 in 2009. This increase came from new and existing customers who transferred deposits from other institutions.
Accounts and drafts payable generated by the Company in its payment processing operations increased $85,856,000, or 20%, from December 31, 2009 to $516,107,000 at December 31, 2010. The average balance of these funds increased $73,729,000, or 16%, from 2009 to $533,617,000 in 2010. The increase relates to the increase in transportation invoice dollars processed. Due to the Company’s payment processing cycle, average balances are much more indicative of the underlying activity than period-end balances since point-in-time comparisons can be misleading if the comparison dates fall on different days of the week.
The composition of average deposits and the average rates paid on those deposits is represented in the table entitled “Distribution of Assets, Liabilities and Shareholders' Equity; Interest Rate and Interest Differential” which is included earlier in this discussion. The Company does not have any significant deposits from foreign depositors.
In response to the financial crisis, in October 2008, the Emergency Economic Stabilization Act of 2008 (the “EESA”) was signed into law. In addition, the U.S. Treasury Department announced that it had been authorized to purchase equity stakes in participating U.S. financial institutions. Under this program, known as the Troubled Asset Relief Program - Capital Purchase Program (the “TARP Capital Purchase Program”), the U.S. Treasury Department made capital available to participating U.S. financial institutions in exchange for, generally, preferred stock. Further, after receiving a recommendation from the boards of the FDIC and the FRB, the U.S. Treasury Department signed the systemic risk exception to the Federal Deposit Insurance Act, enabling the FDIC to
temporarily provide a 100% guarantee of the senior debt of all FDIC-insured institutions and their holding companies, as well as non-interest bearing transaction deposit accounts under a Temporary Liquidity Guarantee Program.
After careful assessment, and due to its strong capital base, the Company chose not to participate in the TARP Capital Purchase Program. The Company elected to participate in the Temporary Liquidity Guarantee Program, as not participating could have put the Company at a competitive disadvantage without the 100% FDIC guarantee of its non-interest bearing transaction deposit accounts. The FDIC guarantee of senior debt was not a factor in the Company’s decision process, as it has no senior debt outstanding. The cost of this program is 10 basis points or approximately $50,000 on an annual basis based upon the additional covered deposits at December 31, 2010.
The Dodd-Frank Act, which was signed into law on July 21, 2010, permanently increased the FDIC insurance limit to $250,000 (retroactive to January 1, 2008), repealed the prohibition against paying interest on demand deposits (effective July, 21, 2011), and extended the Transaction Account Guaranty Program (i.e., unlimited FDIC insurance coverage for certain non-interest bearing demand deposit accounts) to December 31, 2012.
Maturities of Certificates of Deposits of $100,000 or More
|
(In thousands)
|
December 31, 2010
|
|||
|
Three months or less
|
$ | 72,411 | ||
|
Three to six months
|
32,367 | |||
|
Six to twelve months
|
12,944 | |||
|
Over twelve months
|
18,447 | |||
|
Total
|
$ | 136,169 | ||
20
Liquidity
The discipline of liquidity management as practiced by the Company seeks to ensure that funds are available to fulfill all payment obligations relating to invoices processed as they become due, meet depositor withdrawal requests and borrower credit demands while at the same time maximizing profitability. This is accomplished by balancing changes in demand for funds with changes in supply of funds. Primary liquidity to meet demand is provided by short-term liquid assets that can be converted to cash, maturing securities and the ability to obtain funds from external sources. The Company's Asset/Liability Committee (“ALCO”) has direct oversight responsibility for the Company's liquidity position and profile. Management considers both on-balance sheet and
off-balance sheet items in its evaluation of liquidity.
The balances of liquid assets consist of cash and cash equivalents, which include cash and due from banks, interest-bearing deposits in other financial institutions, federal funds sold, and money market funds, and were $138,929,000 at December 31, 2010, an increase of $59,635,000, or 75%, from December 31, 2009. At December 31, 2010 these assets represented 12% of total assets. The Company increased liquid assets during 2010 as a result of the increase in deposits and accounts and drafts payable. Cash and cash equivalents are the Company’s and its subsidiaries’ primary source of liquidity to meet future expected and unexpected loan demand, depositor withdrawals or reductions in accounts and drafts payable.
Secondary sources of liquidity include the investment portfolio and borrowing lines. Total investment in debt securities available-for-sale at fair value was $264,569,000 at December 31, 2010, an increase of $39,972,000 or 18% from December 31, 2009. These assets represented 22% of total assets at December 31, 2010 and all were state and political subdivision securities. Of the total portfolio, 4% mature in one year or less, 15% mature after one year through five years and 81% mature after five years. The Company did not sell any securities available-for-sale during 2010.
As of December 31, 2010, the Bank had unsecured lines of credit at correspondent banks to purchase federal funds up to a maximum of $88,000,000 at the following banks: Bank of America, $20,000,000; US Bank, $20,000,000; Wells Fargo Bank, $15,000,000; PNC Bank, $12,000,000; Frost National Bank, $10,000,000; JPM Chase Bank, $6,000,000; and UMB Bank $5,000,000. The Company had secured lines of credit with the Federal Home Loan Bank of $117,287,000 collateralized by commercial mortgage loans and secured federal funds of $25,579,000 with the Federal Reserve Bank. The Company also had secured federal funds with no collateral with UMB Bank of $10,000,000. There were no amounts outstanding under any of the lines of credit discussed above at December 31, 2010 or 2009.
The deposits of the Company's banking subsidiary have historically been stable, consisting of a sizable volume of core deposits related to customers that utilize many other commercial products of the Bank. The accounts and drafts payable generated by the Company have also historically been a stable source of funds.
Net cash flows provided by operating activities for the years 2010, 2009 and 2008 were $23,776,000, $19,079,000 and $22,030,000, respectively. Net income plus depreciation and amortization accounts for most of the operating cash provided. Net cash flows from investing and financing activities fluctuate greatly as the Company actively manages its investment and loan portfolios and customer activity influences changes in deposit and accounts and drafts payable balances. Further analysis of the changes in these account balances is discussed earlier in this report. Due to the daily fluctuations in these account balances, management believes that the analysis of changes in average balances, also discussed earlier in this report, can be more indicative of underlying activity
than the period-end balances used in the statements of cash flows. Management anticipates that cash and cash equivalents, maturing investments, cash from operations, and borrowing lines will continue to be sufficient to fund the Company’s operations and capital expenditures in 2011. The Company anticipates the annual capital expenditures for 2011 will be consistent with the last few years and, accordingly, should range from $1 million to $3 million. As in the past, 2011 capital expenditures are expected to consist primarily of equipment and software related to its payment and information processing services business.
There are several trends and uncertainties that may impact the Company’s ability to generate revenues and income at the levels that it has in the past. In addition, these trends and uncertainties may impact available liquidity. Those that could significantly impact the Company include the general levels of interest rates, business activity, and energy costs as well as new business opportunities available to the Company.
As a financial institution, a significant source of the Company’s earnings is generated from net interest income. Therefore, the prevailing interest rate environment is important to the Company’s performance. A major portion of the Company’s funding sources are the non-interest bearing accounts and drafts payable generated from its payment and information processing services. Accordingly, higher levels of interest rates will generally allow the Company to earn more net interest income. Conversely, a lower interest rate environment will generally tend to depress net interest income. The Company actively manages its balance sheet in an effort to maximize net interest income as the interest rate
environment changes. This balance sheet management impacts the mix of earning assets maintained by the
21
Company at any point in time. For example, in a low interest rate environment, short-term relatively lower rate liquid investments may be reduced in favor of longer term relatively higher yielding investments and loans. If the primary source of liquidity is reduced in a low interest rate environment, a greater reliance would be placed on secondary sources of liquidity including borrowing lines, the ability of the Bank to generate deposits, and the investment portfolio to ensure overall liquidity remains at acceptable levels.
The overall level of economic activity can have a significant impact on the Company’s ability to generate revenues and income, as the volume and size of customer invoices processed may increase or decrease. Higher levels of economic activity, as experienced in 2010, increased both fee income (as more invoices were processed) and balances of accounts and drafts payable generated (as more invoices were processed) from the Company’s transportation customers.
The relative level of energy costs can impact the Company’s earnings and available liquidity. Higher levels of energy costs will tend to increase transportation and utility invoice amounts resulting in a corresponding increase in accounts and drafts payable. Increases in accounts and drafts payable generate higher interest income and improve liquidity.
New business opportunities are an important component of the Company’s strategy to grow earnings and improve performance. Generating new customers allows the Company to leverage existing systems and facilities and grow revenues faster than expenses. During 2010 new business was added in both the Information Services and Banking Services segments.
Capital Resources
One of management’s primary objectives is to maintain a strong capital base to warrant the confidence of customers, shareholders, and bank regulatory agencies. A strong capital base is needed to take advantage of profitable growth opportunities that arise and to provide assurance to depositors and creditors. The Company and its banking subsidiary continue to exceed all regulatory capital requirements, as evidenced by the capital ratios at December 31, 2010 as shown in Item 8, Note 2 of this report.
In 2010, cash dividends paid were $.58 per share for a total of $5,448,000, an increase of $523,000, or 11%, compared to $.53 per share for a total of $4,925,000 in 2009. The increase is attributable primarily to the per share amount paid.
Shareholders' equity was $142,094,000, or 12%, of total assets, at December 31, 2010, an increase of $12,526,000 over the balance at December 31, 2009. This increase resulted from net income of $20,310,000 and $1,198,000 related to stock bonuses, which were offset by cash dividends paid of $5,448,000, the pension adjustment per FASB ASC 715 of $918,000, an increase in other comprehensive loss of $2,149,000, plus the repurchase of shares for the Treasury of $467,000.
Dividends from the Bank are a source of funds for payment of dividends by the Company to its shareholders. The only restrictions on dividends are those dictated by regulatory capital requirements and prudent and sound banking principles. As of December 31, 2010, unappropriated retained earnings of $14,127,000 were available at the Bank for the declaration of dividends to the Company without prior approval from regulatory authorities.
The Company maintains a treasury stock buyback program pursuant to which the Board of Directors has authorized the repurchase of up to 300,000 shares of the Company’s common stock. The Company repurchased 12,000 shares for an aggregate purchase price of $467,000 in 2010 and 0 shares in 2009. As of December 31, 2010, 168,000 shares remained available for repurchase under the program. A portion of the repurchased shares may be used for the Company's employee benefit plans, and the balance will be available for other general corporate purposes. The stock repurchase authorization does not have an expiration date and the pace of repurchase activity will depend on factors such as levels of cash generation from operations, cash requirements for investments, repayment of debt,
current stock price, and other factors. The Company may repurchase shares from time to time on the open market or in private transactions, including structured transactions. The stock repurchase program may be modified or discontinued at any time.
Commitments, Contractual Obligations and Off-Balance Sheet Arrangements
In the normal course of business, the Company is party to activities that involve credit, market and operational risk that are not reflected in whole or in part in the Company’s consolidated financial statements. Such activities include traditional off-balance sheet credit-related financial instruments and commitments under operating and capital leases. These financial instruments include commitments to extend credit, commercial letters of credit and standby letters of credit. The Company’s maximum potential exposure to credit loss in the event of nonperformance by the other party to the financial instrument for commitments to extend credit, commercial letters of credit and standby letters of credit is represented by the contractual amounts of those instruments. At
December 31, 2010, no amounts have been accrued for any estimated losses for these instruments.
22
Commitments to extend credit are agreements to lend to a customer as long as there is no violation of any condition established in the contract. Commercial and standby letters of credit are conditional commitments issued by the Company or its subsidiaries to guarantee the performance of a customer to a third party. These off-balance sheet financial instruments generally have fixed expiration dates or other termination clauses and may require payment of a fee. At December 31, 2010, the balance of loan commitments, standby and commercial letters of credit were $33,031,000, $23,587,000 and $3,821,000, respectively. Since some of the financial instruments may expire without being drawn upon, the total
amounts do not necessarily represent future cash requirements. Commitments to extend credit and letters of credit are subject to the same underwriting standards as those financial instruments included on the consolidated balance sheets. The Company evaluates each customer’s credit worthiness on a case-by-case basis. The amount of collateral obtained, if deemed necessary upon extension of the credit, is based on management’s credit evaluation of the borrower. Collateral held varies, but is generally accounts receivable, inventory, residential or income-producing commercial property or equipment. In the event of nonperformance, the Company or its subsidiaries may obtain and liquidate the collateral to recover amounts paid under its guarantees on these financial instruments.
The following table summarizes contractual cash obligations of the Company related to operating lease commitments and time deposits at December 31, 2010:
|
Amount of Commitment Expiration per Period
|
||||||||||||||||||||
|
(In thousands)
|
Total
|
Less than 1
Year
|
1-3
Years
|
3-5
Years
|
Over 5
Years
|
|||||||||||||||
|
Operating lease commitments
|
$ | 2,809 | $ | 675 | $ | 1,063 | $ | 644 | $ | 427 | ||||||||||
|
Time deposits
|
157,119 | 134,217 | 20,356 | 2,546 | — | |||||||||||||||
|
Total
|
$ | 159,928 | $ | 134,892 | $ | 21,419 | $ | 3,190 | $ | 427 | ||||||||||
During 2010, the Company contributed $9,350,000 to its noncontributory defined benefit pension plan. The contribution had no significant effect on the Company’s overall liquidity. In determining pension expense, the Company makes several assumptions, including the discount rate and long-term rate of return on assets. These assumptions are determined at the beginning of the plan year based on interest rate levels and financial market performance. For 2010 these assumptions were as follows:
|
Assumption
|
Rate
|
|||
|
Weighted average discount rate
|
6.25 | % | ||
|
Rate of increase in compensation levels
|
4.00 | % | ||
|
Expected long-term rate of return on assets
|
7.25 | % | ||
Impact of New Accounting Pronouncements
None.
ITEM 7A. QUANTITATIVE AND QUALITATIVE DISCLOSURES ABOUT MARKET RISK
Interest Rate Sensitivity
The Company faces market risk to the extent that its net interest income and its fair market value of equity are affected by changes in market interest rates. The asset/liability management discipline as applied by the Company seeks to limit the volatility, to the extent possible, of both net interest income and the fair market value of equity that can result from changes in market interest rates. This is accomplished by limiting the maturities of fixed rate investments, loans, and deposits; matching fixed rate assets and liabilities to the extent possible; and optimizing the mix of fees and net interest income. However, as discussed below, the Company's asset/liability position often differs significantly from most other bank holding companies with significant positive cumulative
"gaps" shown for each time horizon presented. This asset sensitive position is caused primarily by the operations of the Company, which generate large balances of accounts and drafts payable. These balances, which are noninterest bearing, contribute to the Company’s historical high net interest margin but cause the Company to become susceptible to changes in interest rates, with a decreasing net interest margin and fair market value of equity in periods of declining interest rates and an increasing net interest margin and fair market value of equity in periods of rising interest rates.
The Company’s ALCO measures the Company's interest rate risk sensitivity on a quarterly basis to monitor and manage the variability of earnings and fair market value of equity in various interest rate environments. The ALCO evaluates the Company's risk position to determine whether the level of exposure is significant enough to hedge a potential decline in earnings and value or whether the Company can safely increase risk to enhance returns. The ALCO uses gap reports, twelve-month net interest income simulations, and fair market value of equity analyses as its main analytical tools to provide management with insight into the Company's exposure to changing interest rates.
23
Management uses a gap report to review any significant mismatch between the re-pricing points of the Company’s rate sensitive assets and liabilities in certain time horizons. A negative gap indicates that more liabilities re-price in that particular time frame and, if rates rise, these liabilities will re-price faster than the assets. A positive gap would indicate the opposite. Gap reports can be misleading in that they capture only the re-pricing timing within the balance sheet, and fail to capture other significant risks such as basis risk and embedded options risk. Basis risk involves the potential for the spread relationship between rates to change under different rate environments and embedded options risk relates to the potential for the alteration of the level and/or timing of cash
flows given changes in rates.
Another measurement tool used by management is net interest income simulation, which forecasts net interest income during the coming twelve months under different interest rate scenarios in order to quantify potential changes in short term accounting income. Management has set policy limits specifying acceptable levels of interest rate risk given multiple simulated rate movements. These simulations are more informative than gap reports because they are able to capture more of the dynamics within the balance sheet, such as basis risk and embedded options risk. A table containing simulation results as of December 31, 2010, from an immediate and sustained parallel change in interest rates is shown below.
While net interest income simulations do an adequate job of capturing interest rate risk to short term earnings, they do not capture risk within the current balance sheet beyond twelve months. The Company uses fair market value of equity analyses to help identify longer-term risk that may reside on the current balance sheet. The fair market value of equity is represented by the present value of all future income streams generated by the current balance sheet. The Company measures the fair market value of equity as the net present value of all asset and liability cash flows discounted at forward rates suggested by the current U.S. Treasury curve plus appropriate credit spreads. This representation of the change in the fair market value of equity under different rate scenarios gives insight into the
magnitude of risk to future earnings due to rate changes. Management has set policy limits relating to declines in the market value of equity. The table below contains the analysis, which illustrates the effects of an immediate and sustained parallel change in interest rates as of December 31, 2010:
|
Change in Interest Rates
|
% Change in Net Interest Income
|
% Change in Fair Market Value
of Equity
|
||||||
|
+200 basis points
|
9 | % | 8 | % | ||||
|
+100 basis points
|
4 | % | 4 | % | ||||
|
Stable rates
|
— | — | ||||||
|
-100 basis points
|
(2 | )% | (4 | )% | ||||
|
-200 basis points
|
(3 | )% | (2 | )% | ||||
24
Interest Rate Sensitivity Position
The following table presents the Company’s gap or interest rate risk position at December 31, 2010 for the various time periods indicated.
|
(In thousands)
|
Variable
Rate
|
0-90 Days
|
91-180
Days
|
181-364
Days
|
1-5
Years
|
Over
5 Years
|
Total
|
|||||||||||||||||||||
|
Earning assets:
|
||||||||||||||||||||||||||||
|
Loans:
|
||||||||||||||||||||||||||||
|
Taxable
|
$ | 198,811 | $ | 11,232 | $ | 32,771 | $ | 33,273 | $ | 418,029 | $ | 13,505 | $ | 707,621 | ||||||||||||||
|
Tax-exempt
|
– | 20 | 3 | 209 | 782 | – | 1,014 | |||||||||||||||||||||
|
Debt and equity securities1:
|
||||||||||||||||||||||||||||
|
Tax-exempt
|
– | 5,894 | 712 | 9,934 | 33,990 | 214,039 | 264,569 | |||||||||||||||||||||
|
Federal funds sold and other short-term investments
|
126,652 | – | – | – | – | – | 126,652 | |||||||||||||||||||||
|
Total earning assets
|
$ | 325,463 | $ | 17,146 | $ | 33,486 | $ | 43,416 | $ | 452,801 | $ | 223,467 | $ | 1,099,856 | ||||||||||||||
|
Interest-sensitive liabilities:
|
||||||||||||||||||||||||||||
|
Money market accounts
|
$ | 142,790 | $ | – | $ | – | $ | – | $ | – | $ | – | $ | 142,790 | ||||||||||||||
|
Now accounts
|
73,137 | – | – | – | – | – | 73,137 | |||||||||||||||||||||
|
Savings deposits
|
32,447 | – | – | – | – | – | 32,447 | |||||||||||||||||||||
|
Time deposits:
|
||||||||||||||||||||||||||||
|
$100K and more
|
– | 72,410 | 32,367 | 12,944 | 18,448 | – | 136,169 | |||||||||||||||||||||
|
Less than $100K
|
– | 7,715 | 6,222 | 2,558 | 4,455 | – | 20,950 | |||||||||||||||||||||
|
Federal funds purchased and other short-term borrowing
|
9 | – | – | – | – | 9 | ||||||||||||||||||||||
|
Total interest-bearing liabilities
|
$ | 248,383 | $ | 80,125 | $ | 38,589 | $ | 15,502 | $ | 22,903 | $ | – | $ | 405,502 | ||||||||||||||
|
Interest sensitivity gap:
|
||||||||||||||||||||||||||||
|
Periodic
|
$ | 77,080 | $ | (62,979 | ) | $ | (5,103 | ) | $ | 27,914 | $ | 429,898 | $ | 227,544 | $ | 694,354 | ||||||||||||
|
Cumulative
|
77,080 | 14,101 | 8,998 | 36,912 | 466,810 | 694,354 | 694,354 | |||||||||||||||||||||
|
Ratio of interest-bearing assets to interest-bearing liabilities:
|
||||||||||||||||||||||||||||
|
Periodic
|
1.31 | 0.21 | 0.87 | 2.80 | 19.77 | 0.00 | 2.71 | |||||||||||||||||||||
|
Cumulative
|
1.31 | 1.04 | 1.02 | 1.10 | 2.15 | 1.91 | 2.71 | |||||||||||||||||||||
1Balances shown reflect earliest re-pricing date.
25
ITEM 8. FINANCIAL STATEMENTS AND SUPPLEMENTARY DATA
CASS INFORMATION SYSTEMS, INC. AND SUBSIDIARIES
CONSOLIDATED BALANCE SHEETS
|
December 31,
|
||||||||
|
(In thousands except share and per share data)
|
2010
|
2009
|
||||||
|
Assets
|
||||||||
|
Cash and due from banks
|
$ | 12,277 | $ | 5,763 | ||||
|
Interest-bearing deposits in other financial institutions
|
67,299 | 33,426 | ||||||
|
Federal funds sold and other short-term investments
|
59,353 | 40,105 | ||||||
|
Cash and cash equivalents
|
138,929 | 79,294 | ||||||
|
Securities available-for-sale, at fair value
|
264,569 | 224,597 | ||||||
|
Loans
|
708,633 | 641,957 | ||||||
|
Less: Allowance for loan losses
|
11,891 | 8,284 | ||||||
|
Loans, net
|
696,742 | 633,673 | ||||||
|
Premises and equipment, net
|
9,617 | 10,451 | ||||||
|
Investments in bank-owned life insurance
|
14,191 | 13,644 | ||||||
|
Payments in excess of funding
|
33,609 | 22,637 | ||||||
|
Goodwill
|
7,471 | 7,471 | ||||||
|
Other intangible assets, net
|
268 | 375 | ||||||
|
Other assets
|
22,639 | 20,839 | ||||||
|
Total assets
|
$ | 1,188,035 | $ | 1,012,981 | ||||
|
Liabilities and Shareholders’ Equity
|
||||||||
|
Liabilities:
|
||||||||
|
Deposits
|
||||||||
|
Noninterest-bearing
|
$ | 113,097 | $ | 113,151 | ||||
|
Interest-bearing
|
405,493 | 324,725 | ||||||
|
Total deposits
|
518,590 | 437,876 | ||||||
|
Accounts and drafts payable
|
516,107 | 430,251 | ||||||
|
Short-term borrowings
|
9 | 26 | ||||||
|
Other liabilities
|
11,235 | 15,260 | ||||||
|
Total liabilities
|
1,045,941 | 883,413 | ||||||
|
Shareholders’ Equity:
|
||||||||
|
Preferred stock, par value $.50 per share; 2,000,000 shares authorized and no shares issued
|
–
|
–
|
||||||
|
Common stock, par value $.50 per share; 20,000,000 shares authorized and 9,949,324 shares issued at December 31, 2010 and 2009
|
4,975 | 4,975 | ||||||
|
Additional paid-in capital
|
46,653 | 45,696 | ||||||
|
Retained earnings
|
107,263 | 92,401 | ||||||
|
Common shares in treasury, at cost (561,533 and 564,119 shares at December 31, 2010 and 2009, respectively)
|
(13,549 | ) | (13,323 | ) | ||||
|
Accumulated other comprehensive loss
|
(3,248 | ) | (181 | ) | ||||
|
Total shareholders’ equity
|
142,094 | 129,568 | ||||||
|
Total liabilities and shareholders’ equity
|
$ | 1,188,035 | $ | 1,012,981 | ||||
See accompanying notes to consolidated financial statements.
26
CASS INFORMATION SYSTEMS, INC. AND SUBSIDIARIES
CONSOLIDATED STATEMENTS OF INCOME
|
For the Years Ended December 31,
|
||||||||||||
|
(In thousands except per share data)
|
2010
|
2009
|
2008
|
|||||||||
|
Fee Revenue and Other Income:
|
||||||||||||
|
Information services payment and processing revenue
|
$ | 54,183 | $ | 48,665 | $ | 50,721 | ||||||
|
Bank service fees
|
1,410 | 1,324 | 1,330 | |||||||||
|
Gains on sales of securities
|
– | 697 | 552 | |||||||||
|
Other
|
553 | 552 | 567 | |||||||||
|
Total fee revenue and other income
|
56,146 | 51,238 | 53,170 | |||||||||
|
Interest Income:
|
||||||||||||
|
Interest and fees on loans
|
39,785 | 36,003 | 34,204 | |||||||||
|
Interest and dividends on securities:
|
||||||||||||
|
Taxable
|
43 | 58 | 78 | |||||||||
|
Exempt from federal income taxes
|
8,704 | 7,553 | 7,638 | |||||||||
|
Interest on federal funds sold and other short-term investments
|
514 | 170 | 2,218 | |||||||||
|
Total interest income
|
49,046 | 43,784 | 44,138 | |||||||||
|
Interest Expense:
|
||||||||||||
|
Interest on deposits
|
4,875 | 4,924 | 3,179 | |||||||||
|
Interest on short-term borrowings
|
– | 23 | 12 | |||||||||
|
Interest on subordinated convertible debentures
|
– | 106 | 187 | |||||||||
|
Total interest expense
|
4,875 | 5,053 | 3,378 | |||||||||
|
Net interest income
|
44,171 | 38,731 | 40,760 | |||||||||
|
Provision for loan losses
|
4,100 | 2,050 | 2,200 | |||||||||
|
Net interest income after provision for loan losses
|
40,071 | 36,681 | 38,560 | |||||||||
|
Total net revenue
|
96,217 | 87,919 | 91,730 | |||||||||
|
Operating Expense:
|
||||||||||||
|
Salaries and employee benefits
|
51,368 | 50,614 | 49,723 | |||||||||
|
Occupancy
|
2,485 | 2,396 | 2,228 | |||||||||
|
Equipment
|
3,561 | 3,348 | 3,331 | |||||||||
|
Amortization of intangible assets
|
107 | 222 | 280 | |||||||||
|
Other operating
|
10,763 | 9,805 | 10,002 | |||||||||
|
Total operating expense
|
68,284 | 66,385 | 65,564 | |||||||||
|
Income before income tax expense
|
27,933 | 21,534 | 26,166 | |||||||||
|
Income tax expense
|
7,623 | 5,405 | 7,160 | |||||||||
|
Net income
|
$ | 20,310 | $ | 16,129 | $ | 19,006 | ||||||
|
Basic Earnings Per Share
|
$ | 2.18 | $ | 1.76 | $ | 2.08 | ||||||
|
Diluted Earnings Per Share
|
2.15 | 1.73 | 2.03 | |||||||||
See accompanying notes to consolidated financial statements.
27
CASS INFORMATION SYSTEMS, INC. AND SUBSIDIARIES
CONSOLIDATED STATEMENTS OF CASH FLOWS
|
For the Years Ended December 31,
|
||||||||||||
|
(In thousands)
|
2010
|
2009
|
2008
|
|||||||||
|
Cash Flows From Operating Activities:
|
||||||||||||
|
Net income
|
$ | 20,310 | $ | 16,129 | $ | 19,006 | ||||||
|
Adjustments to reconcile net income to net cash provided by operating activities:
|
||||||||||||
|
Depreciation and amortization
|
4,026 | 4,039 | 4,336 | |||||||||
|
Net gains on sales of securities
|
– | (697 | ) | (552 | ) | |||||||
|
Stock-based compensation expense
|
1,472 | 1,881 | 1,026 | |||||||||
|
Provisions for loan losses
|
4,100 | 2,050 | 2,200 | |||||||||
|
Deferred income tax expense (benefit)
|
1,268 | (650 | ) | 1,575 | ||||||||
|
(Decrease) increase in income tax liability
|
(487 | ) | (869 | ) | 1,393 | |||||||
|
Decrease in pension liability
|
(4,259 | ) | (398 | ) | (4,013 | ) | ||||||
|
FDIC insurance prepayment
|
– | (2,124 | ) | – | ||||||||
|
Other operating activities, net
|
(2,654 | ) | (282 | ) | (2,941 | ) | ||||||
|
Net cash provided by operating activities
|
23,776 | 19,079 | 22,030 | |||||||||
|
Cash Flows From Investing Activities:
|
||||||||||||
|
Proceeds from sales of securities available-for-sale
|
– | 21,906 | 20,867 | |||||||||
|
Proceeds from maturities of securities available-for-sale
|
4,770 | 5,655 | 11,106 | |||||||||
|
Purchase of securities available-for-sale
|
(49,944 | ) | (51,160 | ) | (54,460 | ) | ||||||
|
Net increase in loans
|
(67,169 | ) | (50,198 | ) | (95,550 | ) | ||||||
|
Increase in payments in excess of funding
|
(10,972 | ) | (772 | ) | (10,201 | ) | ||||||
|
Purchases of premises and equipment, net
|
(1,190 | ) | (1,077 | ) | (1,240 | ) | ||||||
|
Net cash used in investing activities
|
(124,505 | ) | (75,646 | ) | (129,478 | ) | ||||||
|
Cash Flows From Financing Activities:
|
||||||||||||
|
Net (decrease) increase in noninterest-bearing demand deposits
|
(54 | ) | 9,851 | 10,110 | ||||||||
|
Net increase in interest-bearing demand and savings deposits
|
39,392 | 104,390 | 6,813 | |||||||||
|
Net increase (decrease) in time deposits
|
41,376 | 46,094 | (12,978 | ) | ||||||||
|
Net increase (decrease) in accounts and drafts payable
|
85,856 | (48,774 | ) | (34,709 | ) | |||||||
|
Cash dividends paid
|
(5,448 | ) | (4,925 | ) | (4,499 | ) | ||||||
|
Purchase of common shares of treasury
|
(467 | ) | – | (3,984 | ) | |||||||
|
Other financing activities, net
|
(291 | ) | (260 | ) | 110 | |||||||
|
Net cash provided by (used in) financing activities
|
160,364 | 106,376 | (39,137 | ) | ||||||||
|
Net increase (decrease) in cash and cash equivalents
|
59,635 | 49,809 | (146,585 | ) | ||||||||
|
Cash and cash equivalents at beginning of period
|
79,294 | 29,485 | 176,070 | |||||||||
|
Cash and cash equivalents at end of period
|
$ | 138,929 | $ | 79,294 | $ | 29,485 | ||||||
|
Supplemental information:
|
||||||||||||
|
Cash paid for interest
|
$ | 4,893 | $ | 5,128 | $ | 3,665 | ||||||
|
Cash paid for income taxes
|
7,934 | 5,677 | 4,949 | |||||||||
|
Transfer of loans to foreclosed assets
|
– | – | 788 | |||||||||
See accompanying notes to consolidated financial statements.
28
CASS INFORMATION SYSTEMS, INC. AND SUBSIDIARIES
CONSOLIDATED STATEMENTS OF SHAREHOLDERS’ EQUITY AND COMPREHENSIVE INCOME
|
(In thousands except per share data)
|
Common
Stock
|
Additional
Paid-in
Capital
|
Retained
Earnings
|
Treasury
Stock
|
Accumulated
Other
Comprehensive
Income (Loss)
|
Total
|
Comprehensive
Income (Loss)
|
|||||||||||||||||||||
|
Balance, December 31, 2007
|
$ | 4,975 | $ | 45,837 | $ | 66,690 | $ | (16,118 | ) | $ | (1,932 | ) | $ | 99,452 | ||||||||||||||
|
Net income
|
19,006 | 19,006 | 19,006 | |||||||||||||||||||||||||
|
Cash dividends ($.49 per share)
|
(4,499 | ) | (4,499 | ) | ||||||||||||||||||||||||
|
Purchase of 120,000 shares
|
(3,984 | ) | (3,984 | ) | ||||||||||||||||||||||||
|
Other comprehensive income (loss):
|
||||||||||||||||||||||||||||
|
Reclassification adjustments for gains included in net income, net of tax
|
(359 | ) | (359 | ) | (359 | ) | ||||||||||||||||||||||
|
Net unrealized gain on securities available-for-sale, net of tax
|
867 | 867 | 867 | |||||||||||||||||||||||||
|
FASB ASC 715 adjustment, net of tax
|
(5,989 | ) | (5,989 | ) | (5,989 | ) | ||||||||||||||||||||||
|
Issuance of 31,924 common shares pursuant to stock-based compensation plan
|
(705 | ) | 705 | — | ||||||||||||||||||||||||
|
Exercise of stock options
|
(282 | ) | 306 | 24 | ||||||||||||||||||||||||
|
Stock-based compensation expense
|
1,026 | 1,026 | ||||||||||||||||||||||||||
|
Subordinated debenture conversion
|
(130 | ) | 827 | 697 | ||||||||||||||||||||||||
|
Balance, December 31, 2008
|
$ | 4,975 | $ | 45,746 | $ | 81,197 | $ | (18,264 | ) | $ | (7,413 | ) | $ | 106,241 | ||||||||||||||
|
Comprehensive income for 2008
|
$ | 13,525 | ||||||||||||||||||||||||||
|
Net income
|
16,129 | 16,129 | 16,129 | |||||||||||||||||||||||||
|
Cash dividends ($.53 per share)
|
(4,925 | ) | (4,925 | ) | ||||||||||||||||||||||||
|
Other comprehensive income (loss):
|
||||||||||||||||||||||||||||
|
Reclassification adjustments for gains included in net income, net of tax
|
(453 | ) | (453 | ) | (453 | ) | ||||||||||||||||||||||
|
Net unrealized gain on securities available-for-sale, net of tax
|
6,145 | 6,145 | 6,145 | |||||||||||||||||||||||||
|
FASB ASC 715 adjustment, net of tax
|
1,540 | 1,540 | 1,540 | |||||||||||||||||||||||||
|
Issuance of 38,636 common shares pursuant to stock-based compensation plan
|
(910 | ) | 910 | — | ||||||||||||||||||||||||
|
Exercise of stock options
|
(388 | ) | 408 | 20 | ||||||||||||||||||||||||
|
Stock-based compensation expense
|
1,881 | 1,881 | ||||||||||||||||||||||||||
|
Subordinated debenture conversion
|
(633 | ) | 3,623 | 2,990 | ||||||||||||||||||||||||
|
Balance, December 31, 2009
|
$ | 4,975 | $ | 45,696 | $ | 92,401 | $ | (13,323 | ) | $ | (181 | ) | $ | 129,568 | ||||||||||||||
|
Comprehensive income for 2009
|
$ | 23,361 | ||||||||||||||||||||||||||
|
Net income
|
20,310 | 20,310 | 20,310 | |||||||||||||||||||||||||
|
Cash dividends ($.58 per share)
|
(5,448 | ) | (5,448 | ) | ||||||||||||||||||||||||
|
Purchase of 12,000 shares
|
(467 | ) | (467 | ) | ||||||||||||||||||||||||
|
Other comprehensive income (loss):
|
||||||||||||||||||||||||||||
|
Net unrealized gain on securities available-for-sale, net of tax
|
(2,149 | ) | (2,149 | ) | (2,149 | ) | ||||||||||||||||||||||
|
FASB ASC 715 adjustment, net of tax
|
(918 | ) | (918 | ) | (918 | ) | ||||||||||||||||||||||
|
Issuance of 15,149 common shares pursuant to stock-based compensation plan, net
|
(349 | ) | 108 | (241 | ) | |||||||||||||||||||||||
|
Exercise of stock options and SARs
|
(166 | ) | 133 | (33 | ) | |||||||||||||||||||||||
|
Stock-based compensation expense
|
1,472 | 1,472 | ||||||||||||||||||||||||||
|
Balance, December 31, 2010
|
$ | 4,975 | $ | 46,653 | $ | 107,263 | $ | (13,549 | ) | $ | (3,248 | ) | $ | 142,094 | ||||||||||||||
| Comprehensive income for 2010 | $ | 17,243 | ||||||||||||||||||||||||||
See accompanying notes to consolidated financial statements.
29
NOTES TO CONSOLIDATED FINANCIAL STATEMENTS
Note 1
Summary of Significant Accounting Policies
Summary of Operations Cass Information Systems, Inc. (the “Company”) provides payment and information services, which include processing and payment of transportation, utility and telecommunications invoices. These services include the acquisition and management of data, information delivery and financial exchange. The consolidated balance sheet captions, “Accounts and drafts payable” and “Payments in excess of funding,” consist of obligations related to the payment services that are performed for customers. The Company also provides a full range of banking services to individual, corporate and institutional customers through
Cass Commercial Bank (the “Bank”), its wholly owned bank subsidiary.
Basis of Presentation The accounting and reporting policies of the Company and its subsidiaries conform to U.S. generally accepted accounting principles. The consolidated financial statements include the accounts of the Company and its wholly owned subsidiaries after elimination of intercompany transactions. Certain amounts in the 2009 consolidated financial statements have been reclassified to conform to the 2010 presentation. Such reclassifications have no effect on previously reported net income or shareholders’ equity.
Use of Estimates In preparing the consolidated financial statements, Company management is required to make estimates and assumptions which significantly affect the reported amounts in the consolidated financial statements. A significant estimate, which is particularly susceptible to change in a short period of time, is the determination of the allowance for loan losses.
Cash and Cash Equivalents For purposes of the consolidated statements of cash flows, the Company considers cash and due from banks, interest-bearing deposits in other financial institutions, federal funds sold and other short-term investments as segregated in the accompanying consolidated balance sheets to be cash equivalents.
Investment in Debt Securities The Company classifies its debt marketable securities as available-for-sale. Securities classified as available-for-sale are carried at fair value. Unrealized gains and losses, net of the related tax effect, are excluded from earnings and reported in accumulated other comprehensive income, a component of shareholders’ equity. A decline in the fair value of any available-for-sale security below cost that is deemed other than temporary results in a charge to earnings and the establishment of a new cost basis for the security. To determine whether impairment is other than temporary, the Company considers whether it has the ability and intent to hold the
investment until a marketplace recovery and considers whether evidence indicating the cost of the investment is recoverable outweighs evidence to the contrary. Evidence considered in this assessment includes the reasons for impairment, the severity and duration of the impairment, changes in value subsequent to year-end and forecasted performance of the investee. Premiums and discounts are amortized or accreted to interest income over the estimated lives of the securities using the level-yield method. Interest income is recognized when earned. Gains and losses are calculated using the specific identification method.
Allowance for Loan Losses The allowance for loan losses is increased by provisions charged to expense and is available to absorb charge-offs, net of recoveries. Management utilizes a systematic, documented approach in determining the appropriate level of the allowance for loan losses. Management’s approach, which provides for general and specific allocations, is based on current economic conditions, past losses, collection experience, risk characteristics of the portfolio, assessments of collateral values by obtaining independent appraisals for significant properties, and such other factors which, in management’s judgment, deserve current recognition in estimating loan losses.
Management believes the allowance for loan losses is adequate to absorb probable losses in the loan portfolio. While management uses all available information to recognize losses on loans, future additions to the allowance may be necessary based on changes in economic conditions. Additionally, various regulatory agencies, as an integral part of their examination process, periodically review the Company’s allowance for loan losses. Such agencies may require the Company to increase the allowance for loan losses based on their judgments and interpretations about information available to them at the time of their examination.
Premises and Equipment Premises and equipment are stated at cost less accumulated depreciation and amortization. Depreciation is computed over the estimated useful lives of the assets, or the respective lease terms for leasehold improvements, using straight-line and accelerated methods. Estimated useful lives do not exceed 40 years for buildings, the lesser of 10 years or the life of the lease for leasehold improvements and range from 3 to 7 years for software, equipment, furniture and fixtures. Maintenance and repairs are charged to expense as incurred.
30
Intangible Assets Cost in excess of fair value of net assets acquired has resulted from business acquisitions, which were accounted for using the purchase method. Goodwill and intangible assets with indefinite useful lives are not amortized, but instead are tested for impairment at least annually. Intangible assets with definite useful lives are amortized over their respective estimated useful lives.
Periodically, the Company reviews intangible assets for events or changes in circumstances that may indicate that the carrying amount of the assets may not be recoverable. Based on those reviews, adjustments of recorded amounts have not been required.
Non-marketable Equity Investments The Company accounts for non-marketable equity investments, in which it holds less than a 20% ownership, under the cost method. Under the cost method of accounting, investments are carried at cost and are adjusted only for other than temporary declines in fair value, distributions of earnings and additional investments. The Company periodically evaluates whether any declines in fair value of its investments are other than temporary. In performing this evaluation, the Company considers various factors including any decline in market price, where available, the investee's financial condition, results of operations, operating trends and other financial ratios. Non-marketable
equity investments are included in other assets on the consolidated balance sheets.
Foreclosed Assets Real estate acquired as a result of foreclosure is initially recorded at the lower of its cost, which is the unpaid principal balance of the related loan plus foreclosure costs, or fair value less estimated selling costs. Fair value is generally determined through the receipt of appraisals. Any write down to fair value at the time the property is acquired is recorded as a charge-off to the allowance for loan losses. Any decline in the fair value of the property subsequent to acquisition is recorded as a charge to non-interest expense.
Treasury Stock Purchases of the Company’s common stock are recorded at cost. Upon reissuance, treasury stock is reduced based upon the average cost basis of shares held.
Comprehensive Income Comprehensive income consists of net income, changes in net unrealized gains (losses) on available-for-sale securities and pension liability adjustments and is presented in the accompanying consolidated statements of shareholders' equity and comprehensive income.
Loans Interest on loans is recognized based upon the principal amounts outstanding. It is the Company’s policy to discontinue the accrual of interest when there is reasonable doubt as to the collectability of principal or interest. Subsequent payments received on such loans are applied to principal if there is any doubt as to the collectability of such principal; otherwise, these receipts are recorded as interest income. The accrual of interest on a loan is resumed when the loan is current as to payment of both principal and interest and/or the borrower demonstrates the ability to pay and remain current. Loan origination and commitment fees on originated loans, net of certain direct loan origination costs, are deferred
and amortized to interest income using the level-yield method over the estimated lives of the related loans.
Impairment of Loans A loan is considered impaired when it is probable that a creditor will be unable to collect all amounts due, both principal and interest, according to the contractual terms of the loan agreement. When measuring impairment, the expected future cash flows of an impaired loan are discounted at the loan's effective interest rate. Alternatively, impairment could be measured by reference to an observable market price, if one exists, or the fair value of the collateral for a collateral-dependent loan. Regardless of the historical measurement method used, the Company measures impairment based on the fair value of the collateral when the Company determines foreclosure is probable. Additionally, impairment of a restructured loan
is measured by discounting the total expected future cash flows at the loan's effective rate of interest as stated in the original loan agreement. The Company uses its nonaccrual methods as discussed above for recognizing interest on impaired loans.
Information Services Revenue A majority of the Company’s revenues are attributable to fees for providing services. These services include transportation invoice rating, payment processing, auditing, and the generation of accounting and transportation information. The Company also processes, pays and generates management information from electric, gas, telecommunications and other invoices. The specific payment and information processing services provided to each customer are developed individually to meet each customer’s specific requirements. The Company enters into service agreements with customers typically for fixed fees per transaction that are invoiced
monthly. Revenues are recognized in the period services are rendered and earned under the service agreements, as long as collection is reasonably assured.
Income Taxes Deferred tax assets and liabilities are recognized for the estimated future tax consequences attributable to differences between the financial statement carrying amounts of existing assets and liabilities and their respective tax bases. Deferred tax assets and liabilities are measured using enacted tax rates in effect for the year in which those temporary differences are expected to be recovered or settled. Deferred tax assets are reduced if necessary, by a deferred tax asset valuation allowance. In the event that management determines it will not be able to realize all or part of net deferred tax assets in the future, the Company adjusts the recorded value of deferred tax assets, which
31
would result in a direct charge to income tax expense in the period that such determination is made. Likewise, the Company will reverse the valuation allowance when realization of the deferred tax asset is expected. The effect on deferred tax assets and liabilities of a change in tax rates is recognized in income in the period that includes the enactment date.
Earnings Per Share Basic earnings per share is computed by dividing net income by the weighted average number of common shares outstanding. Diluted earnings per share is computed by dividing net income, adjusted for the net income effect of the interest expense on the outstanding convertible debentures, by the sum of the weighted average number of common shares outstanding and the weighted average number of potential common shares outstanding.
Stock-Based Compensation The Company follows FASB ASC 718 “Accounting for Stock Options and Other Stock-based Compensation” which requires that all stock-based compensation be recognized as an expense in the financial statements and that such cost be measured at the fair value of the award. FASB ASC 718 also requires that excess tax benefits related to stock option exercises and restricted stock awards be reflected as financing cash inflows instead of operating cash inflows.
Pension Plans The amounts recognized in the consolidated financial statements related to pension are determined from actuarial valuations. Inherent in these valuations are assumptions including expected return on plan assets, discount rates at which the liabilities could be settled at December 31, 2010, rate of increase in future compensation levels and mortality rates. These assumptions are updated annually and are disclosed in Note 10. The Company follows FASB ASC 715, “Compensation – Retirement Benefits,” which requires companies to recognize the overfunded or underfunded status of a defined benefit postretirement plan as an asset or liability in its statement of financial position and to
recognize changes in that funded status in the year in which the changes occur through comprehensive income. The funded status is measured as the difference between the fair value of the plan assets and the projected benefit obligation as of the date of its fiscal year-end. There have been no significant changes in the Company’s long-term rate of return assumptions for the past three fiscal years ended December 31 and management believes they are not reasonably likely to change in the future. Pursuant to ASC 715, the Company has recognized the funded status of its defined benefit postretirement plan in its consolidated balance sheet and has recognized changes in that funded status through comprehensive income.
Impact of New and Not Yet Adopted Accounting Pronouncements
In July 2010, the Financial Accounting Standards Board issued Accounting Standards Update (ASU) “Disclosures about the Credit Quality of Financing Receivables and the Allowance for Credit Losses.” This guidance requires a greater level of disaggregated information about the credit quality of financing receivables and reserves for credit losses, including increased disclosure of credit quality indicators, past due information, and modifications of financing receivables. Disclosures regarding activity during a reporting period are effective for interim and annual reporting periods beginning on or after December 15, 2010. Adoption of this ASU did not have a material impact on the Company’s consolidated financial position or results of operations.
Note 2
Capital Requirements and Regulatory Restrictions
The Company and the Bank are subject to various regulatory capital requirements administered by the federal banking agencies. Failure to meet minimum capital requirements can result in certain mandatory, and possibly additional discretionary actions by regulators that, if undertaken, could have a direct material effect on the Company’s consolidated financial statements. Under capital adequacy guidelines, the Company and the Bank must meet specific capital guidelines that involve quantitative measures of assets, liabilities and certain off-balance sheet items as calculated under regulatory accounting practices. The Company and the Bank’s capital amounts and classifications are also subject to qualitative judgments by the regulators about components, risk weightings and other factors.
Quantitative measures established by regulators to ensure capital adequacy require the Company and the Bank to maintain minimum amounts and ratios of total and Tier I capital to risk-weighted assets, and of Tier I capital to average assets. Management believes that as of December 31, 2010 and 2009, the Company and the Bank met all capital adequacy requirements to which they are subject.
The Bank is also subject to the regulatory framework for prompt corrective action. As of December 31, 2010, and 2009 the most recent notification from the regulatory agencies categorized the Bank as well capitalized. To be categorized as well capitalized, the Bank must maintain minimum total risk-based, Tier I risk-based, and Tier I leverage ratios as set forth in the table below. There are no conditions or events since that notification that management believes have changed the Bank’s category.
Subsidiary dividends are a significant source of funds for payment of dividends by the Company to its shareholders. At December 31, 2010, unappropriated retained earnings of $14,127,000 were available at the Bank for the declaration
32
of dividends to the Company without prior approval from regulatory authorities. However, dividends paid by the Bank to the Company would be prohibited if the effect thereof would cause the Bank’s capital to be reduced below applicable minimum capital requirements.
There were no restricted funds on deposit used to meet regulatory reserve requirements at December 31, 2010 and 2009.
The Company’s and the Bank’s actual and required capital amounts and ratios as are as follows:
|
Actual
|
Capital
requirements
|
Requirement to be
well capitalized
|
||||||||||||||||||||||
|
(In thousands)
|
Amount
|
Ratio
|
Amount
|
Ratio
|
Amount
|
Ratio
|
||||||||||||||||||
|
At December 31, 2010
|
||||||||||||||||||||||||
|
Total capital (to risk-weighted assets)
|
||||||||||||||||||||||||
|
Cass Information Systems, Inc.
|
$ | 148,659 | 16.82 | % | $ | 70,695 | 8.00 | % | $ | N/A | N/A | % | ||||||||||||
|
Cass Commercial Bank
|
58,838 | 10.72 | 43,916 | 8.00 | 54,895 | 10.00 | ||||||||||||||||||
|
Tier I capital (to risk-weighted assets)
|
||||||||||||||||||||||||
|
Cass Information Systems, Inc.
|
137,603 | 15.57 | 35,348 | 4.00 | N/A | N/A | ||||||||||||||||||
|
Cass Commercial Bank
|
51,955 | 9.46 | 21,958 | 4.00 | 32,937 | 6.00 | ||||||||||||||||||
|
Tier I capital (to average assets)
|
||||||||||||||||||||||||
|
Cass Information Systems, Inc.
|
137,603 | 11.18 | 36,923 | 3.00 | N/A | N/A | ||||||||||||||||||
|
Cass Commercial Bank
|
51,955 | 8.92 | 17,472 | 3.00 | 29,121 | 5.00 | ||||||||||||||||||
|
At December 31, 2009
|
||||||||||||||||||||||||
|
Total capital (to risk-weighted assets)
|
||||||||||||||||||||||||
|
Cass Information Systems, Inc.
|
$ | 130,187 | 16.69 | % | $ | 62,414 | 8.00 | % | $ | N/A | N/A | % | ||||||||||||
|
Cass Commercial Bank
|
50,853 | 10.34 | 39,361 | 8.00 | 49,202 | 10.00 | ||||||||||||||||||
|
Tier I capital (to risk-weighted assets)
|
||||||||||||||||||||||||
|
Cass Information Systems, Inc.
|
121,903 | 15.63 | 31,207 | 4.00 | N/A | N/A | ||||||||||||||||||
|
Cass Commercial Bank
|
44,864 | 9.12 | 19,681 | 4.00 | 29,521 | 6.00 | ||||||||||||||||||
|
Tier I capital (to average assets)
|
||||||||||||||||||||||||
|
Cass Information Systems, Inc.
|
121,903 | 11.28 | 32,414 | 3.00 | N/A | N/A | ||||||||||||||||||
|
Cass Commercial Bank
|
44,864 | 8.75 | 15,374 | 3.00 | 25,623 | 5.00 | ||||||||||||||||||
Note 3
Investment in Debt Securities
Investment securities available-for-sale are recorded at fair value on a recurring basis. The Company’s investment securities available-for-sale at December 31, 2010 and 2009 are measured at fair value using Level 2 valuations. The market evaluation utilizes several sources which include “observable inputs” rather than “significant unobservable inputs” and therefore falls into the Level 2 category. The table below presents the balances of securities available-for-sale measured at fair value on a recurring basis. The amortized cost, gross unrealized gains, gross unrealized losses and fair value of debt and equity securities are summarized as follows:
|
December 31, 2010
|
||||||||||||||||
|
(In thousands)
|
Amortized
Cost
|
Gross
Unrealized
Gains
|
Gross
Unrealized
Losses
|
Fair Value
|
||||||||||||
|
State and political subdivisions
|
$ | 255,929 | $ | 9,829 | $ | 1,189 | $ | 264,569 | ||||||||
|
Total
|
$ | 255,929 | $ | 9,829 | $ | 1,189 | $ | 264,569 | ||||||||
|
December 31, 2009
|
||||||||||||||||
|
(In thousands)
|
Amortized
Cost
|
Gross
Unrealized
Gains
|
Gross
Unrealized
Losses
|
Fair Value
|
||||||||||||
|
State and political subdivisions
|
$ | 212,651 | $ | 11,970 | $ | 24 | $ | 224,597 | ||||||||
|
Total
|
$ | 212,651 | $ | 11,970 | $ | 24 | $ | 224,597 | ||||||||
33
|
December 31, 2010
|
||||||||||||||||||||||||
|
Less than 12 months
|
12 months or more
|
Total
|
||||||||||||||||||||||
|
Estimated
|
Unrealized
|
Estimated
|
Unrealized
|
Estimated
|
Unrealized
|
|||||||||||||||||||
|
(In thousands)
|
fair value
|
losses
|
fair value
|
losses
|
Fair value
|
losses
|
||||||||||||||||||
|
State and political subdivisions
|
$ | 53,741 | $ | 1,189 | $ | ― | $ | ― | $ | 53,741 | $ | 1,189 | ||||||||||||
|
Total
|
$ | 53,741 | $ | 1,189 | $ | ― | $ | ― | $ | 53,741 | $ | 1,189 | ||||||||||||
|
December 31, 2009
|
||||||||||||||||||||||||
|
Less than 12 months
|
12 months or more
|
Total
|
||||||||||||||||||||||
|
Estimated
|
Unrealized
|
Estimated
|
Unrealized
|
Estimated
|
Unrealized
|
|||||||||||||||||||
|
(In thousands)
|
fair value
|
losses
|
fair value
|
losses
|
Fair value
|
losses
|
||||||||||||||||||
|
State and political subdivisions
|
$ | 1,415 | $ | 24 | $ | ― | $ | ― | $ | 1,415 | $ | 24 | ||||||||||||
|
Total
|
$ | 1,415 | $ | 24 | $ | ― | $ | ― | $ | 1,415 | $ | 24 | ||||||||||||
There were 61 securities (none greater than 12 months) in an unrealized loss position as of December 31, 2010. All unrealized losses are reviewed to determine whether the losses are other than temporary. Management believes that all unrealized losses are temporary since they are market driven and the Company has the ability and intent to hold these securities until maturity.
There were 2 securities (none greater than 12 months) in an unrealized loss position as of December 31, 2009. All unrealized losses are reviewed to determine whether the losses are other than temporary. Management believes that all unrealized losses are temporary since they are market driven and the Company has the ability and intent to hold these securities until maturity.
The amortized cost and fair value of debt and equity securities by contractual maturity are shown in the following table. Expected maturities may differ from contractual maturities because borrowers have the right to prepay obligations with or without prepayment penalties.
|
December 31, 2010
|
||||||||
|
(In thousands)
|
Amortized Cost
|
Fair Value
|
||||||
|
Due in 1 year or less
|
$ | 16,539 | $ | 16,853 | ||||
|
Due after 1 year through 5 years
|
33,990 | 35,968 | ||||||
|
Due after 5 years through 10 years
|
108,405 | 115,425 | ||||||
|
Due after 10 years
|
96,995 | 96,323 | ||||||
|
No stated maturity
|
¾ | ¾ | ||||||
|
Total
|
$ | 255,929 | $ | 264,569 | ||||
The amortized cost of debt securities pledged to secure public deposits, securities sold under agreements to repurchase and for other purposes at December 31, 2010 and 2009 were $27,776,000 and $18,265,000 respectively.
Proceeds from sales of debt securities classified as available-for-sale were $0 in 2010, $21,906,000 in 2009 and $20,867,000 in 2008. Gross realized gains and losses on the sales in 2010, 2009 and 2008 were $0 and $0, $699,000 and $2,000 and $567,000 and $15,000, respectively.
Note 4
Loans
A summary of loan categories is as follows:
|
December 31,
|
||||||||
|
(In thousands)
|
2010
|
2009
|
||||||
|
Commercial and industrial
|
$ | 135,061 | $ | 93,371 | ||||
|
Real estate:
|
||||||||
|
Mortgage – Commercial
|
151,201 | 154,797 | ||||||
|
Mortgage – Church & related
|
365,378 | 314,300 | ||||||
|
Construction – Commercial
|
18,434 | 17,581 | ||||||
|
Construction – Church & related
|
36,318 | 56,826 | ||||||
|
Industrial revenue bonds
|
1,014 | 2,676 | ||||||
|
Other
|
1,227 | 2,406 | ||||||
|
Total loans
|
$ | 708,633 | $ | 641,957 | ||||
34
The Company originates commercial, industrial and real estate loans to businesses and churches throughout the metropolitan St. Louis, Missouri area, Orange County, California and other selected cities in the United States. The Company does not have any particular concentration of credit in any one economic sector; however, a substantial portion of the commercial and industrial loans are extended to privately-held commercial companies in these market areas, and are generally secured by the assets of the business. The Company also has a substantial portion of real estate loans secured by mortgages that are extended to churches in its market area and selected cities in the United States.
Loan transactions involving executive officers and directors of the Company and its subsidiaries and loans to affiliates of executive officers and directors are summarized below. Such loans were made in the normal course of business on substantially the same terms, including interest rates and collateral, as those prevailing at the same time for comparable transactions with other persons, and did not involve more than the normal risk of collectability.
|
(In thousands)
|
2010
|
|||
|
Aggregate balance, January 1
|
$ | 582 | ||
|
New loans
|
¾ | |||
|
Payments
|
(2 | ) | ||
|
Aggregate balance, December 31
|
$ | 580 | ||
A summary of the activity in the allowance for loan losses is as follows:
| December 31, | ||||||||||||
| (In thousands) |
2010
|
2009
|
2008
|
|||||||||
|
Balance, January 1
|
$ | 8,284 | $ | 6,451 | $ | 6,280 | ||||||
|
Provision charged to expense
|
4,100 | 2,050 | 2,200 | |||||||||
|
Loans charged off
|
(554 | ) | (400 | ) | (2,173 | ) | ||||||
|
Recoveries of loans previously charged off
|
61 | 183 | 144 | |||||||||
|
Net loan charge-offs
|
(493 | ) | (217 | ) | (2,029 | ) | ||||||
|
Balance, December 31
|
$ | 11,891 | $ | 8,284 | $ | 6,451 | ||||||
Loans charged off for the year ended December 31, 2010 represented real estate mortgage – church & related loans.
The following table presents the recorded investment and unpaid principal balance for impaired loans at December 31, 2010:
|
(In thousands)
|
Recorded
Investment
|
Unpaid
Principal
Balance
|
Related
Allowance for
Loan Losses
|
|||||||||
|
Commercial and industrial, IRB’s:
|
||||||||||||
|
Nonaccrual
|
$ | 46 | $ | 46 | $ | 5 | ||||||
|
Real estate – mortgage:
|
||||||||||||
|
Nonaccrual
|
519 | 519 | 115 | |||||||||
|
Total impaired loans
|
$ | 565 | $ | 565 | $ | 120 | ||||||
Impaired loans consist primarily of renegotiated loans, nonaccrual loans and loans greater than 90 days past due and still accruing interest. The allowance for loan losses related to impaired loans was $120,000 and $493,000 at December 31, 2010 and 2009, respectively. There were no impaired loans without a valuation allowance at December 31, 2010 or 2009. Nonaccrual loans were $565,000 and $1,608,000 at December 31, 2010 and 2009, respectively. There were no loans delinquent 90 days or more and still accruing interest at December 31, 2010 and 2009. The average balances of impaired loans during 2010, 2009 and 2008 were $1,130,000 $1,568,000 and $1,927,000, respectively. Income that would have been recognized on non-accrual loans under the original
terms of the contract was $83,000, $134,000 and $86,000 for 2010, 2009 and 2008, respectively. Income that was recognized on nonaccrual loans was $35,000, $131,000 and $56,000 for 2010, 2009 and 2008 respectively. There are two foreclosed loans with a book value of $1,910,000 which have been reclassified as other real estate owned (included in other assets) as of December 31, 2010.
The Company does not record loans at fair value on a recurring basis other than loans that are considered impaired. Once a loan is identified as impaired, management measures impairment in accordance with FASB ASC 310, “Allowance for Credit Losses”. At December 31, 2010, all impaired loans were evaluated based on the fair value of the collateral. The fair value of the collateral is based upon an observable market price or current appraised value and therefore, the Company classifies these assets as nonrecurring Level 2. The total principal balance of impaired loans measured at fair value at December 31, 2010 and 2009 was $445,000 and $1,115,000 respectively.
35
|
(In thousands)
|
30-59
Days
|
60-89
Days
|
90 Days
and
Over
|
Total
Past
Due
|
Current
|
Total
Loans
|
||||||||||||||||||
|
Commercial and industrial
|
$ | 105 | $ | — | $ | — | $ | 105 | $ | 134,956 | $ | 135,061 | ||||||||||||
|
Real estate:
|
— | |||||||||||||||||||||||
|
Mortgage – Commercial
|
145 | — | 490 | 635 | 150,566 | 151,201 | ||||||||||||||||||
|
Mortgage – Church & related
|
1,954 | — | — | 1,954 | 363,424 | 365,378 | ||||||||||||||||||
|
Construction – Commercial
|
— | — | — | — | 18,434 | 18,434 | ||||||||||||||||||
|
Construction – Church & related
|
— | — | — | — | 36,318 | 36,318 | ||||||||||||||||||
|
Industrial revenue bonds
|
— | — | — | — | 1,014 | 1,014 | ||||||||||||||||||
|
Other
|
— | — | — | — | 1,227 | 1,227 | ||||||||||||||||||
|
Total
|
$ | 2,204 | $ | — | $ | 490 | $ | 2,694 | $ | 705,939 | $ | 708,633 | ||||||||||||
There were no loans greater than 90 days past due and still accruing interest.
The following table presents the credit exposure of the loan portfolio by internally assigned credit grade as of December 31, 2010:
|
(In thousands)
|
Commercial
and
Industrial
|
Real
Estate
Mortgage
|
Real Estate
Construction
|
Other
|
Total
|
|||||||||||||||
|
Loans subject to normal monitoring1
|
$ | 130,148 | $ | 495,573 | $ | 54,752 | $ | 2,241 | $ | 682,714 | ||||||||||
|
Loans subject to special monitoring2:
|
||||||||||||||||||||
|
Performing
|
4,867 | 20,487 | ¾ | ¾ | 25,354 | |||||||||||||||
|
Nonperforming
|
46 | 519 | ¾ | ¾ | 565 | |||||||||||||||
|
Total
|
$ | 135,061 | $ | 516,579 | $ | 54,752 | $ | 2,241 | $ | 708,633 | ||||||||||
|
1
|
Loans subject to normal monitoring involve borrowers of acceptable-to-strong credit quality and risk, who have the apparent ability to satisfy their loan obligation.
|
|
2
|
Loans subject to special monitoring possess some credit deficiency or potential weakness which requires a high level of management attention.
|
Note 5
Premises and Equipment
A summary of premises and equipment is as follows:
|
December 31,
|
||||||||
|
(In thousands)
|
2010
|
2009
|
||||||
|
Land
|
$ | 873 | $ | 873 | ||||
|
Buildings
|
10,491 | 10,491 | ||||||
|
Leasehold improvements
|
1,794 | 1,823 | ||||||
|
Furniture, fixtures and equipment
|
11,247 | 10,890 | ||||||
|
Purchased software
|
5,390 | 4,948 | ||||||
|
Internally developed software
|
3,283 | 3,433 | ||||||
| $ | 33,078 | $ | 32,458 | |||||
|
Less accumulated depreciation and amortization
|
23,461 | 22,007 | ||||||
|
Total
|
$ | 9,617 | $ | 10,451 | ||||
Total depreciation and amortization charged to expense in 2010, 2009 and 2008 amounted to $2,024,000, $2,243,000, and $2,394,000, respectively.
The Company and its subsidiaries lease various premises and equipment under operating lease agreements, which expire at various dates through 2020. Rental expense for 2010, 2009 and 2008 was $767,000, $814,000 and $729,000, respectively. The following is a schedule, by year, of future minimum rental payments required under operating leases that have initial or remaining noncancelable lease terms in excess of one year as of December 31, 2010:
|
(In thousands)
|
Amount
|
|||
|
2011
|
$ | 675 | ||
|
2012
|
553 | |||
|
2013
|
510 | |||
|
2014
|
381 | |||
|
2015
|
263 | |||
|
2016 and after
|
427 | |||
|
Total
|
$ | 2,809 | ||
36
Note 6
Acquired Intangible Assets
The Company accounts for intangible assets in accordance with FASB ASC 350, “Goodwill and Other Intangible Assets,” which requires that intangibles with indefinite useful lives be tested annually for impairment and those with finite useful lives be amortized over their useful lives. Details of the Company’s intangible assets are as follows:
|
December 31, 2010
|
December 31, 2009
|
|||||||||||||||
|
(In thousands)
|
Gross Carrying
Amount
|
Accumulated
Amortization
|
Gross Carrying
Amount
|
Accumulated
Amortization
|
||||||||||||
|
Assets eligible for amortization:
|
||||||||||||||||
|
Customer List
|
$ | 750 | $ | (482 | ) | $ | 750 | $ | (375 | ) | ||||||
|
Total
|
750 | (482 | ) | 750 | (375 | ) | ||||||||||
|
Unamortized intangible assets:
|
||||||||||||||||
|
Goodwill
|
7,698 | (227 | ) | 7,698 | (227 | ) 1 | ||||||||||
|
Total unamortized intangibles
|
7,698 | (227 | ) | 7,698 | (227 | ) | ||||||||||
|
Total intangible assets
|
$ | 8,448 | $ | (709 | ) | $ | 8,448 | $ | (602 | ) | ||||||
|
1
|
Amortization through December 31, 2001 prior to adoption of FASB ASC 350.
|
The customer list that was acquired in the NTransit purchase is amortized over seven years on a straight-line basis. Goodwill includes $3,073,000 acquired in 2006 in the NTransit purchase. The weighted average remaining amortization period at December 31, 2010 was three years for all amortized intangible assets combined. Amortization of intangible assets amounted to $107,000, $222,000 and $280,000 for the years ended December 31, 2010, 2009 and 2008, respectively. Estimated future amortization of intangibles is as follows: $107,000 in 2011 and 2012, $54,000 in 2013, and $0 in 2014.
Note 7
Interest-Bearing Deposits
Interest-bearing deposits consist of the following:
|
December 31,
|
||||||||
|
(In thousands)
|
2010
|
2009
|
||||||
|
NOW and money market deposit accounts
|
$ | 215,927 | $ | 178,644 | ||||
|
Savings deposits
|
32,447 | 30,339 | ||||||
|
Time deposits:
|
||||||||
|
Less than $100
|
20,950 | 27,980 | ||||||
|
$100 or more
|
136,169 | 87,762 | ||||||
|
Total
|
$ | 405,493 | $ | 324,725 | ||||
Interest on deposits consists of the following:
|
December 31,
|
||||||||||||
|
(In thousands)
|
2010
|
2009
|
2008
|
|||||||||
|
NOW and money market deposit accounts
|
$ | 2,082 | $ | 1,797 | $ | 1,086 | ||||||
|
Savings deposits
|
321 | 335 | 290 | |||||||||
|
Time deposits:
|
||||||||||||
|
Less than $100
|
1,658 | 1,729 | 701 | |||||||||
|
$100 or more
|
814 | 1,063 | 1,102 | |||||||||
|
Total
|
$ | 4,875 | $ | 4,924 | $ | 3,179 | ||||||
The scheduled maturities of time deposits are summarized as follows:
|
December 31,
|
||||||||||||||||
|
2010
|
2009
|
|||||||||||||||
|
(In thousands)
|
Amount
|
Percent
of Total
|
Amount
|
Percent
of Total
|
||||||||||||
|
Due within:
|
||||||||||||||||
|
One year
|
$ | 134,217 | 85.4 | % | $ | 103,021 | 89.0 | % | ||||||||
|
Two years
|
19,442 | 12.4 | % | 9,362 | 8.1 | % | ||||||||||
|
Three years
|
914 | 0.6 | % | 2,524 | 2.2 | % | ||||||||||
|
Four years
|
447 | 0.3 | % | 615 | 0.5 | % | ||||||||||
|
Five years
|
2,099 | 1.3 | % | 220 | 0.2 | % | ||||||||||
|
Total
|
$ | 157,119 | 100.0 | % | $ | 115,742 | 100.0 | % | ||||||||
37
Note 8
Subordinated Convertible Debentures and Unused Available Lines of Credit
On August 24, 2004, the Company issued $3,700,000 of 5.33% subordinated convertible debentures in partial consideration for the acquisition of the assets of PROFITLAB, Inc. Interest was payable annually on the anniversary date of the acquisition. During 2008, several debt holders converted $697,000 of the principal balance into 35,808 shares of the Company’s common stock in accordance with the conversion provisions. During 2009, the remaining principal balance was converted into 153,612 shares, and as such no convertible debentures are outstanding as of December 31, 2009 and 2010.
As of December 31, 2010, the Bank had unsecured lines of credit at correspondent banks to purchase federal funds up to a maximum of $88,000,000 at the following banks: Bank of America, $20,000,000; US Bank, $20,000,000; Wells Fargo Bank, $15,000,000; PNC Bank, $12,000,000; Frost National Bank, $10,000,000; JPM Chase Bank, $6,000,000; and UMB Bank $5,000,000. The Company had secured lines of credit with the Federal Home Loan Bank of $117,287,000 collateralized by commercial mortgage loans and secured federal funds of $25,579,000 with the Federal Reserve Bank. The Company also had secured federal funds with no collateral with UMB Bank of $10,000,000. There were no amounts outstanding under any of the lines of credit discussed above at December 31, 2010 or 2009.
Note 9
Common Stock and Earnings per Share
The table below shows activity in the outstanding shares of the Company’s common stock during 2010.
|
2010
|
||||
|
Shares outstanding at January 1
|
9,385,205 | |||
|
Issuance of common stock:
|
||||
|
Issued under stock-based compensation plan
|
6,889 | |||
|
Stock options/SARs exercised
|
7,697 | |||
|
Stock repurchased
|
(12,000 | ) | ||
|
Shares outstanding at December 31
|
9,387,791 | |||
Basic earnings per share is computed by dividing net income by the weighted average number of common shares outstanding. Diluted earnings per share is computed by dividing net income, adjusted for the net income effect of the interest expense on the outstanding convertible debentures, by the sum of the weighted average number of common shares outstanding and the weighted average number of potential common shares outstanding. Under the treasury stock method, outstanding stock options and SARs are dilutive when the average market price of the Company’s common stock, combined with the effect of any unamortized compensation expense, exceeds the option price during a period. In addition, proceeds from the assumed exercise of dilutive options along with the related tax benefit are
assumed to be used to repurchase common shares at the average market price of such stock during the period. Anti-dilutive shares are those option shares with exercise prices in excess of the current market value.
The calculations of basic and diluted earnings per share are as follows:
|
December 31,
|
||||||||||||
|
(In thousands except share and per share data
|
2010
|
2009
|
2008
|
|||||||||
|
Basic
|
||||||||||||
|
Net income
|
$ | 20,310 | $ | 16,129 | $ | 19,006 | ||||||
|
Weighted-average common shares outstanding
|
9,335,283 | 9,156,673 | 9,150,342 | |||||||||
|
Basic earnings per share
|
$ | 2.18 | $ | 1.76 | $ | 2.08 | ||||||
|
Diluted
|
||||||||||||
|
Basic net income
|
$ | 20,310 | $ | 16,129 | $ | 19,006 | ||||||
|
Net income effect of 5.33% convertible debentures
|
¾ | 55 | 96 | |||||||||
|
Diluted net income
|
$ | 20,310 | $ | 16,184 | $ | 19,102 | ||||||
|
Weighted-average common shares outstanding
|
9,335,283 | 9,156,673 | 9,150,342 | |||||||||
|
Effect of dilutive restricted stock, stock options and SARs
|
112,292 | 124,420 | 106,851 | |||||||||
|
Effect of convertible debentures
|
¾ | 92,976 | 174,557 | |||||||||
|
Weighted-average common shares outstanding assuming dilution
|
9,447,575 | 9,374,069 | 9,431,750 | |||||||||
|
Diluted earnings per share
|
$ | 2.15 | $ | 1.73 | $ | 2.03 | ||||||
38
Note 10
Employee Benefit Plans
Defined Benefit Plan
The Company has a noncontributory defined-benefit pension plan (the “Plan”), which covers most of its employees. The Company accrues and makes contributions designed to fund normal service costs on a current basis using the projected unit credit with service proration method to amortize prior service costs arising from improvements in pension benefits and qualifying service prior to the establishment of the plan over a period of approximately 30 years.
A summary of the activity in the Plan’s projected benefit obligation, assets, funded status and amounts recognized in the Company’s consolidated balance sheets is as follows:
|
December 31,
|
||||||||
|
(In thousands)
|
2010
|
2009
|
||||||
|
Projected benefit obligation:
|
||||||||
|
Balance, January 1
|
$ | 36,588 | $ | 32,823 | ||||
|
Service cost
|
1,771 | 1,606 | ||||||
|
Interest cost
|
2,290 | 2,080 | ||||||
|
Actuarial loss
|
3,853 | 1,099 | ||||||
|
Benefits paid
|
(1,165 | ) | (1,020 | ) | ||||
|
Balance, December 31
|
$ | 43,337 | $ | 36,588 | ||||
|
Plan assets:
|
||||||||
|
Fair value, January 1
|
$ | 33,362 | $ | 25,596 | ||||
|
Actual return
|
3,880 | 5,586 | ||||||
|
Employer contribution
|
9,350 | 3,200 | ||||||
|
Benefits paid
|
(1,165 | ) | (1,020 | ) | ||||
|
Fair value, December 31
|
$ | 45,427 | $ | 33,362 | ||||
|
Funded status:
|
||||||||
|
Accrued pension asset (liability)
|
$ | 2,090 | $ | (3,226 | ) | |||
The following represent the major assumptions used to determine the projected benefit obligation of the Plan. For 2010, 2009 and 2008 the Plan’s expected benefit cash flows were discounted using the Citibank Above Median Curve.
|
2010
|
2009
|
2008
|
||||||||||
|
Weighted average discount rate
|
5.75 | % | 6.25 | % | 6.50 | % | ||||||
|
Rate of increase in compensation levels
|
4.00 | % | 4.00 | % | 4.00 | % | ||||||
The accumulated benefit obligation was $34,881,000 and $29,747,000 as of December 31, 2010 and 2009, respectively. The Company expects to contribute approximately $1,800,000 to the Plan in 2011. The following pension benefit payments, which reflect expected future service, as appropriate, are expected to be paid by the Plan:
|
Amount
|
||||
|
2011
|
$ | 1,224,000 | ||
|
2012
|
1,318,000 | |||
|
2013
|
1,370,000 | |||
|
2014
|
1,538,000 | |||
|
2015
|
1,678,000 | |||
|
2016-2020
|
12,083,090 | |||
The Plan’s pension cost included the following components:
|
For the Year Ended
|
||||||||||
|
December 31,
|
||||||||||
|
(In thousands)
|
2010
|
2009
|
2008
|
|||||||
|
Service cost – benefits earned during the year
|
$ | 1,771 | $ | 1,606 | $ | 1,523 | ||||
|
Interest cost on projected benefit obligations
|
2,290 | 2,080 | 1,947 | |||||||
|
Expected return on plan assets
|
(2,440 | ) | (1,880 | ) | (2,108 | ) | ||||
|
Net amortization and deferral
|
616 | 873 | 66 | |||||||
|
Net periodic pension cost
|
$ | 2,237 | $ | 2,679 | $ | 1,428 | ||||
39
The following represent the major assumptions used to determine the net pension cost of the Plan:
|
2010
|
2009
|
2008
|
||||||||||
|
Weighted average discount rate
|
6.25 | % | 6.50 | % | 6.50 | % | ||||||
|
Rate of increase in compensation levels
|
4.00 | % | 4.00 | % | 4.25 | % | ||||||
|
Expected long-term rate of return on assets
|
7.25 | % | 7.25 | % | 7.25 | % | ||||||
The investment objective for the Plan is to maximize total return with a tolerance for average risk. Asset allocation is a balance between fixed income and equity investments, with a target allocation of approximately 50% fixed income, 34% US equity and 16% Non-US equity. Due to volatility in the market, this target allocation is not always desirable and asset allocations can fluctuate between acceptable ranges. The fixed income component is invested in pooled investment grade securities. The equity components are invested in pooled large cap, small/mid cap and Non-US stocks. The assumed long-term rate of return on assets, which falls within the expected range, is 7.25% as derived below:
|
Asset Class
|
Expected Long-Term
Return on Class
|
X |
Allocation =
|
Assumption
|
||||||||||
|
Fixed Income
|
4 – 6 | % | 50 | % | 2.0 – 3.0 | % | ||||||||
|
US Equity
|
6 – 9 | % | 34 | % | 2.0 – 3.1 | % | ||||||||
|
Non-US Equity
|
6 – 10 | % | 16 | % | 1.0 – 1.6 | % | ||||||||
| 5.0 – 7.7 | % | |||||||||||||
A summary of the fair value measurements by type of asset is as follows:
|
Fair Value Measurements as of December 31
|
||||||||||||||||||||||||
|
2010
|
2009
|
|||||||||||||||||||||||
|
(In thousands)
|
Total
|
Quoted Prices
in Active
Markets for
Identical
Assets
(Level 1)
|
Significant
Observable
Inputs
(Level 2)
|
Total
|
Quoted Prices
in Active
Markets for
Identical
Assets
(Level 1)
|
Significant
Observable
Inputs
(Level 2)
|
||||||||||||||||||
|
Cash
|
$ | 203 | $ | 203 | $ | ― | $ | 184 | $ | 184 | $ | ― | ||||||||||||
|
Equity securities
|
||||||||||||||||||||||||
|
U. S. Large Cap Growth
|
3,844 | ― | 3,844 | 2,902 | ― | 2,902 | ||||||||||||||||||
|
U. S. Large Cap Value
|
3,853 | ― | 3,853 | 2,884 | ― | 2,884 | ||||||||||||||||||
|
U. S. Small/Mid Cap Growth
|
1,594 | ― | 1,594 | 1,161 | ― | 1,161 | ||||||||||||||||||
|
U. S. Small/Mid Cap Value
|
1,597 | ― | 1,597 | 1,171 | ― | 1,171 | ||||||||||||||||||
|
Non-U. S. Core
|
7,236 | ― | 7,236 | 5,325 | ― | 5,325 | ||||||||||||||||||
|
U. S. Large Cap Passive
|
4,542 | ― | 4,542 | 3,245 | ― | 3,245 | ||||||||||||||||||
|
Fixed Income
|
||||||||||||||||||||||||
|
U. S. Core Opportunistic
|
16,227 | ― | 16,227 | 11,880 | ― | 11,880 | ||||||||||||||||||
|
U. S. Passive
|
6,331 | ― | 6,331 | 4,610 | ― | 4,610 | ||||||||||||||||||
|
Total
|
$ | 45,427 | $ | 203 | $ | 45,224 | $ | 33,362 | $ | 184 | $ | 33,178 | ||||||||||||
Supplemental Executive Retirement Plan
The Company also has an unfunded supplemental executive retirement plan (“SERP”) which covers key executives of the Company. The SERP is a noncontributory plan in which the Company’s subsidiaries make accruals designed to fund normal service costs on a current basis using the same method and criteria as the Plan.
A summary of the activity in the SERP’s projected benefit obligation, funded status and amounts recognized in the Company’s consolidated balance sheets is as follows:
|
December 31,
|
||||||||
|
(In thousands)
|
2010
|
2009
|
||||||
|
Benefit obligation:
|
||||||||
|
Balance, January 1
|
$ | 5,369 | $ | 4,210 | ||||
|
Service cost
|
78 | 33 | ||||||
|
Interest cost
|
315 | 278 | ||||||
|
Benefits paid
|
(235 | ) | (317 | ) | ||||
|
Actuarial (gain) loss
|
(48 | ) | 1,165 | |||||
|
Balance, December 31
|
$ | 5,479 | $ | 5,369 | ||||
40
The following represent the major assumptions used to determine the projected benefit obligation of the SERP. For 2010, 2009 and 2008, the SERP’s expected benefit cash flows were discounted using the Citigroup Above Median Curve.
|
2010
|
2009
|
2008
|
||||||||||
|
Weighted average discount rate
|
5.50 | % | 6.00 | % | 7.00 | % | ||||||
|
Rate of increase in compensation levels
|
4.00 | % | 4.00 | % | 4.00 | % | ||||||
The accumulated benefit obligation was $4,136,000 and $3,696,000 as of December 31, 2010 and 2009, respectively. Since this is an unfunded plan there are no plan assets. Benefits paid were $235,000 in 2010, $317,000 in 2009 and $33,000 in 2008. Expected future benefits payable by the Company over the next 10 years are as follows:
|
Amount
|
||||
|
2011
|
$ | 236,000 | ||
|
2012
|
235,000 | |||
|
2013
|
234,000 | |||
|
2014
|
233,000 | |||
|
2015
|
232,000 | |||
|
2016-2020
|
1,396,000 | |||
The SERP’s pension cost included the following components:
|
December 31,
|
||||||||||||
|
(In thousands)
|
2010
|
2009
|
2008
|
|||||||||
|
Service cost – benefits earned during the year
|
$ | 78 | $ | 33 | $ | 59 | ||||||
|
Interest cost on projected benefit obligations
|
315 | 278 | 267 | |||||||||
|
Net amortization and deferral
|
258 | 130 | 170 | |||||||||
|
Net periodic pension cost
|
$ | 651 | $ | 441 | $ | 496 | ||||||
The pre-tax amounts in accumulated other comprehensive loss as of December 31, were as follows:
|
The Plan
|
SERP
|
|||||||||||||||
|
(In thousands)
|
2010
|
2009
|
2010
|
2009
|
||||||||||||
|
Prior service cost
|
$ | 33 | $ | 41 | $ | 50 | $ | 101 | ||||||||
|
Net actuarial loss
|
11,985 | 10,180 | 2,194 | 2,449 | ||||||||||||
|
Total
|
$ | 12,018 | $ | 10,221 | $ | 2,244 | $ | 2,550 | ||||||||
The estimated pre-tax prior service cost and net actuarial loss in accumulated other comprehensive loss at December 31, 2010 expected to be recognized as components of net periodic benefit cost in 2011 for the Plan are $8,000 and $635,000, respectively. The estimated pre-tax prior service cost and net actuarial loss in accumulated other comprehensive loss at December 31, 2010, expected to be recognized as components of net periodic benefit cost in 2011 for SERP are $50,000 and $199,000 respectively.
The Company also maintains a noncontributory profit sharing plan, which covers most of its employees. Employer contributions are calculated based upon formulas which relate to current operating results and other factors. Profit sharing expense recognized in the consolidated statements of income in 2010, 2009 and 2008 was $4,665,000, $3,668,000 and $4,339,000, respectively.
The Company also sponsors a defined contribution 401(k) plan to provide additional retirement benefits to substantially all employees. Contributions under the 401(k) plan for 2010, 2009 and 2008 were $450,000, $470,000, and $444,000, respectively.
Note 11
Stock-based Compensation
In 2007, the Company’s shareholders approved the Omnibus Incentive Stock Plan (“the Omnibus Plan”) to provide incentive opportunities for key employees and non-employee directors and to align the personal financial interests of such individuals with those of the Company’s shareholders. The Omnibus Plan permits the issuance of up to 880,000 shares of the Company’s common stock in the form of stock options, stock appreciation rights, restricted stock, restricted stock units and performance awards.
41
The Company also continues to maintain its other stock-based incentive plans for the restricted common stock previously awarded and the options previously issued and outstanding. Restricted shares are amortized to expense over the three-year vesting period. Options currently vest over a period not to exceed seven years. The plans authorize the grant of awards in the form of options intended to qualify as incentive stock options under Section 422 of the Internal Revenue Code, options that do not qualify (non-statutory stock options) and grants of restricted shares of common stock. The Company issues shares out of treasury stock for restricted shares and option exercises. These plans have been superseded by the Omnibus Plan and accordingly, all remaining
unissued shares under these plans have been cancelled.
Restricted Stock
Changes in restricted shares outstanding for the year ended December 31, 2010 were as follows:
|
Shares
|
Fair Value
|
|||||||
|
Balance at December 31, 2009
|
75,965 | $ | 28.97 | |||||
|
Granted
|
15,149 | 30.91 | ||||||
|
Vested
|
(40,843 | ) | 30.25 | |||||
|
Balance at December 31, 2010
|
50,271 | $ | 28.51 | |||||
During 2009 and 2008, 38,636 shares and 32,254 shares, respectively, were granted with weighted average per share market values at date of grant of $27.30 in 2009 and $29.18 in 2008. The fair value of such shares, which is based on the market price on the date of grant, is amortized to expense over the three-year vesting period. Amortization of the restricted stock bonus awards totaled $848,000 for 2010, $1,194,000 for 2009, and $942,000 for 2008. As of December 31, 2010, the total unrecognized compensation expense related to non-vested restricted stock awards was $741,000 and the related weighted average period over which it is expected to be recognized is approximately .7 years.
Stock Options
Changes in options outstanding for the year ended December 31, 2010 were as follows:
|
Shares
|
Weighted Average Exercise Price
|
|||||||
|
Balance at December 31, 2009
|
44,120 | $ | 17.65 | |||||
|
Exercised
|
(7,492 | ) | $ | 14.14 | ||||
|
Balance at December 31, 2010
|
36,628 | $ | 18.36 | |||||
|
Exercisable at December 31, 2010
|
24,188 | $ | 17.64 | |||||
The total intrinsic value of options exercised during 2010 was $159,000. The total intrinsic value of options exercised during 2009 was $445,000. The average remaining contractual term for options outstanding as of December 31, 2010 was 1.56 years and the aggregate intrinsic value was $717,000. The average remaining contractual term for options exercisable as of December 31, 2010 was 1.42 years and the aggregate intrinsic value was $491,000.
A summary of the activity of the non-vested options during 2010 is shown below.
|
Shares
|
Weighted Average
Grant Date Fair Value
|
|||||||
|
Non-vested at December 31, 2009
|
27,586 | $ | 2.81 | |||||
|
Vested
|
(15,146 | ) | $ | 2.70 | ||||
|
Non-vested at December 31, 2010
|
12,440 | $ | 2.94 | |||||
As of December 31, 2010, the total unrecognized compensation expense related to non-vested stock options was $32,000 and the related weighted average period over which it is expected to be recognized is approximately 1.8 years. For the year ended December 31, 2010, there were 1,463 non-qualified options exercised and 6,029 incentive stock options exercised. During 2010, the Company recognized stock option expense of $27,000.
Stock Appreciation Rights (SARs)
There were 23,311 SARs granted during the year ended December 31, 2010. The Company uses the Black-Scholes option-pricing model to determine the fair value of the SARs at the date of grant. Following are the assumptions used to estimate the $9.12 per share fair value.
|
Year Ended December 31, 2010
|
||||
|
Risk-free interest rate
|
3.33 | % | ||
|
Expected life
|
7 yrs.
|
|||
|
Expected volatility
|
30.00 | % | ||
|
Expected dividend yield
|
1.86 | % | ||
42
The risk-free interest rate is based on the zero-coupon U.S. Treasury yield for the period equal to the expected life of the options at the time of the grant. The expected life was derived using the historical exercise activity. The Company uses historical volatility for a period equal to the expected life of the options using average monthly closing market prices of the Company’s stock. The expected dividend yield is determined based on the Company’s current rate of annual dividends.
During 2010, the Company recognized SARs expense of $597,000. As of December 31, 2010, the total unrecognized compensation expense related to stock appreciation rights was $444,000, and the related weighted average period over which it is expected to be recognized is 0.7 years. Changes in SARs outstanding for the year ended December 31, 2010 were as follows:
|
Shares
|
Weighted Average Exercise Price
|
|||||||
|
Balance at December 31, 2009
|
231,262 | $ | 27.02 | |||||
|
Granted
|
23,311 | $ | 30.16 | |||||
|
Exercised
|
(12,818 | ) | $ | 38.48 | ||||
|
Balance at December 31, 2010
|
241,755 | $ | 27.34 | |||||
|
Exercisable at December 31, 2010
|
100,554 | $ | 27.58 | |||||
The total intrinsic value of SARs exercised during 2010 and 2009 was $188,000 and $10,000 respectively. The average remaining contractual term for SARs outstanding as of December 31, 2010 was 7.83 years and the aggregate intrinsic value was $2,562,000. The average remaining contractual term for SARs exercisable as of December 31, 2010 was 5.12 years and the aggregate intrinsic value was $1,042,000.
Note 12
Other Operating Expense
Details of other operating expense are as follows:
|
For the Years Ended December 31,
|
||||||||||||
|
(In thousands)
|
2010
|
2009
|
2008
|
|||||||||
|
Postage and supplies
|
$ | 2,031 | $ | 2,171 | $ | 2,579 | ||||||
|
Promotional expense
|
1,588 | 1,508 | 1,587 | |||||||||
|
Professional fees
|
1,892 | 1,388 | 1,481 | |||||||||
|
Outside service fees
|
2,282 | 1,956 | 1,520 | |||||||||
|
Data processing services
|
356 | 339 | 352 | |||||||||
|
Telecommunications
|
627 | 550 | 592 | |||||||||
|
Other
|
1,987 | 1,893 | 1,891 | |||||||||
|
Total other operating expense
|
$ | 10,763 | $ | 9,805 | $ | 10,002 | ||||||
Note 13
Income Taxes
The components of income tax expense (benefit) are as follows:
|
For the Years Ended December 31,
|
||||||||||||
|
(In thousands)
|
2010
|
2009
|
2008
|
|||||||||
|
Current:
|
||||||||||||
|
Federal
|
$ | 5,435 | $ | 5,458 | $ | 4,408 | ||||||
|
State
|
920 | 597 | 1,177 | |||||||||
|
Deferred:
|
||||||||||||
|
Federal
|
1,178 | (602 | ) | 1,446 | ||||||||
|
State
|
90 | (48 | ) | 129 | ||||||||
|
Total income tax expense
|
$ | 7,623 | $ | 5,405 | $ | 7,160 | ||||||
A reconciliation of expected income tax expense (benefit), computed by applying the effective federal statutory rate of 35% for 2010, 34% for 2009, and 35% for 2008 to income before income tax expense, to reported income tax expense is as follows:
|
For the Years Ended December 31,
|
||||||||||||
|
(In thousands)
|
2010
|
2009
|
2008
|
|||||||||
|
Expected income tax expense
|
$ | 9,777 | $ | 7,322 | $ | 9,158 | ||||||
|
(Reductions) increases resulting from:
|
||||||||||||
|
Tax-exempt income
|
(3,273 | ) | (2,798 | ) | (2,924 | ) | ||||||
|
State taxes, net of federal benefit
|
657 | 694 | 849 | |||||||||
|
Other, net
|
462 | 187 | 77 | |||||||||
|
Total income tax expense
|
$ | 7,623 | $ | 5,405 | $ | 7,160 | ||||||
43
The tax effects of temporary differences which give rise to significant portions of the deferred tax assets and deferred tax liabilities are presented below:
|
December 31,
|
||||||||
|
(In thousands)
|
2010
|
2009
|
||||||
|
Deferred tax assets:
|
||||||||
|
Allowance for loan losses
|
$ | 4,541 | $ | 3,160 | ||||
|
ASC 715 pension funding liability
|
5,452 | 4,824 | ||||||
|
Net operating loss carryforward1
|
421 | 463 | ||||||
|
Deferred revenue
|
20 | 27 | ||||||
|
Stock compensation
|
731 | 691 | ||||||
|
Supplemental executive retirement plan accrual
|
474 | 319 | ||||||
|
Other
|
28 | 76 | ||||||
|
Total deferred tax assets
|
$ | 11,667 | $ | 9,560 | ||||
|
Deferred tax liabilities:
|
||||||||
|
Premises and equipment
|
(352 | ) | (290 | ) | ||||
|
Pension
|
(4,499 | ) | (1,856 | ) | ||||
|
Intangible/assets
|
(652 | ) | (567 | ) | ||||
|
Unrealized gain on investment in securities available-for-sale
|
(3,024 | ) | (4,181 | ) | ||||
|
Other
|
(182 | ) | (225 | ) | ||||
|
Total deferred tax liabilities
|
$ | (8,709 | ) | $ | (7,119 | ) | ||
|
Net deferred tax assets
|
$ | 2,958 | $ | 2,441 | ||||
1 As of December 31, 2010, the Company had approximately $1,220,000 of net operating loss carryforwards as a result of the acquisition of Franklin Bancorp. The utilization of the net operating loss carryforward is subject to Section 382 of the Internal Revenue Code and limits the Company’s use to approximately $122,000 per year during the carryforward period, which expires in 2020.
A valuation allowance would be provided on deferred tax assets when it is more likely than not that some portion of the assets will not be realized. The Company has not established a valuation allowance at December 31, 2010 or 2009, due to management’s belief that all criteria for recognition have been met, including the existence of a history of taxes paid sufficient to support the realization of deferred tax assets.
ASC 740 "Accounting for Uncertainty in Income Taxes" prescribes a recognition threshold and measurement attribute for financial statement recognition and measurement of a tax position taken or expected to be taken, resulting in the recognition of a cumulative effect of change in accounting principle of $87,000, which was recorded as an increase to retained earnings as of January 1, 2007.
The following table presents a reconciliation of the total beginning and ending amounts of unrecognized tax benefits:
|
(In thousands)
|
2010
|
2009
|
||||||
|
Balance at January 1
|
$ | 1,750 | $ | 1,399 | ||||
|
Changes in unrecognized tax benefits as a result of tax positions taken during a prior year
|
560 | 119 | ||||||
|
Changes in unrecognized tax benefits as a result of tax position taken during the current year
|
555 | 387 | ||||||
|
Decreases in unrecognized tax benefits relating to settlements with taxing authorities
|
(466 | ) | ― | |||||
|
Reductions to unrecognized tax benefits as a result of a lapse of the applicable statute of limitations
|
(522 | ) | (155 | ) | ||||
|
Balance at December 31
|
$ | 1,877 | $ | 1,750 | ||||
The total amount of federal and state unrecognized tax benefits at December 31, 2010 that, if recognized, would affect the effective tax rate was $1,465,000, net of federal tax benefit.
The Company believes it is reasonably possible that the total amount of tax benefits will decrease by approximately $451,000 over the next twelve months. The reduction primarily relates to the anticipated lapse in the statute of limitations. The unrecognized tax benefits relate primarily to apportionment of taxable income among various state tax jurisdictions.
As of December 31, 2010 and 2009, the Company had $106,000 and $147,000, respectively, in accrued interest related to unrecognized tax benefits. During 2010, the Company recorded a reduction in accrued interest of $41,000 as a result of audit settlements and other prior-year adjustments. During 2009 and 2008, the Company accrued additional interest of $34,000 and $60,000, respectively. The Company’s policy is to record interest and penalties related to
44
unrecognized tax benefits as a component of income tax expense. There were no penalties for unrecognized tax benefits accrued at December 31, 2010 and 2009, nor did the Company recognize any expense for penalties during 2010, 2009 and 2008.
The Company is subject to income tax in the U. S. federal jurisdiction and numerous state jurisdictions. The Company’s federal income tax returns for 2004 and 2005 have been examined by the Internal Revenue Service ("IRS"). U.S. federal income tax returns for tax year 2006 through 2009 remain subject to examination by the IRS. In addition, the Company is subject to state tax examinations for the tax years 2005 through 2009.
Note 14
Contingencies
The Company is the defendant in a proceeding pending in the United States Bankruptcy Court for the District of Delaware, which proceeding was initiated by Chapter 11 debtor LNT Services, Inc. ("LNT"), an affiliate of Linens N' Things, on December 19, 2009. The LNT Chapter 11 bankruptcy proceeding was subsequently converted to a Chapter 7 proceeding. Pursuant to Section 547 of the United States Bankruptcy Code, the LNT bankruptcy trustee, on behalf of LNT, seeks to avoid and recover $33,825,773.71 in allegedly preferential payments (the "Payments") made to the Company. The Payments were received by the Company in the normal course of providing services to Linens N' Things. The Company had been engaged under contract with Linens N' Things to audit, process and pay its freight carrier
invoices. Accordingly, the Payments made to the Company were subsequently paid to the appropriate Linens N' Things freight carriers as specified in the contract.
On September 28, 2010, Asentinel LLC ("Asentinel") filed a lawsuit in the United States District Court for the Western District of Tennessee against the Company, AnchorPoint, Inc. ("AnchorPoint") and Veramark Technologies, Inc. ("Veramark"). The suit alleges infringement of two Asentinel patents by the Company, AnchorPoint and Veramark. Cass vigorously denies infringing any valid claim of either patent. Asentinel has requested an order enjoining the Company from infringing the two patents at issue, damages for the alleged infringement, interest and costs, treble damages for willful infringement, and attorneys' fees.
While there is some uncertainty relating to any litigation, management is of the opinion that the Company has valid defenses to both these claims. All other legal proceedings and actions involving the Company are of an ordinary and routine nature and are incidental to the operations of the Company. Management believes the outcome of these proceedings, including the LNT and Asentinel proceedings, will not have a material effect on the businesses or financial conditions of the Company or its subsidiaries.
Note 15
Disclosures about Financial Instruments
The Company is party to financial instruments with off-balance sheet risk in the normal course of business to meet the financing needs of its customers. These financial instruments include commitments to extend credit, commercial letters of credit and standby letters of credit. The Company’s maximum potential exposure to credit loss in the event of nonperformance by the other party to the financial instrument for commitments to extend credit, commercial letters of credit and standby letters of credit is represented by the contractual amounts of those instruments. At December 31, 2010 and 2009, no amounts have been accrued for any estimated losses for these instruments.
Commitments to extend credit are agreements to lend to a customer as long as there is no violation of any condition established in the contract. Commercial and standby letters of credit are conditional commitments issued by the Company to guarantee the performance of a customer to a third party. These off-balance sheet financial instruments generally have fixed expiration dates or other termination clauses and may require payment of a fee. The approximate remaining terms of commercial and standby letters of credit range from less than one to five years. Since these financial instruments may expire without being drawn upon, the total amounts do not necessarily represent future cash requirements. Commitments to extend credit and letters of credit are subject to the same underwriting standards
as those financial instruments included on the consolidated balance sheets. The Company evaluates each customer’s credit-worthiness on a case-by-case basis. The amount of collateral obtained, if deemed necessary upon extension of the credit, is based on management’s credit evaluation of the borrower. Collateral held varies, but is generally accounts receivable, inventory, residential or income-producing commercial property or equipment. In the event of nonperformance, the Company may obtain and liquidate the collateral to recover amounts paid under its guarantees on these financial instruments.
The following table shows conditional commitments to extend credit, standby letters of credit and commercial letters:
|
December 31,
|
||||||||
|
(In thousands)
|
2010
|
2009
|
||||||
|
Conditional commitments to extend credit
|
$ | 33,031 | $ | 25,149 | ||||
|
Standby letters of credit
|
23,587 | 15,115 | ||||||
|
Commercial letters of credit
|
3,821 | 1,764 | ||||||
45
Following is a summary of the carrying amounts and fair values of the Company’s financial instruments:
|
December 31,
|
||||||||||||||||
|
2010
|
2009
|
|||||||||||||||
|
(In thousands)
|
Carrying
Amount
|
Fair Value
|
Carrying
Amount
|
Fair Value
|
||||||||||||
|
Balance sheet assets:
|
||||||||||||||||
|
Cash and cash equivalents
|
$ | 138,929 | $ | 138,929 | $ | 79,294 | $ | 79,294 | ||||||||
|
Investment in debt securities
|
264,569 | 264,569 | 224,597 | 224,597 | ||||||||||||
|
Loans, net
|
696,742 | 710,294 | 633,673 | 634,598 | ||||||||||||
|
Accrued interest receivable
|
5,857 | 5,857 | 5,294 | 5,294 | ||||||||||||
|
Total
|
$ | 1,106,097 | $ | 1,119,649 | $ | 942,858 | $ | 943,783 | ||||||||
|
Balance sheet liabilities:
|
||||||||||||||||
|
Deposits
|
$ | 518,590 | $ | 518,590 | $ | 437,876 | $ | 437,876 | ||||||||
|
Accounts and drafts payable
|
516,107 | 516,107 | 430,251 | 430,251 | ||||||||||||
|
Short-term borrowings
|
9 | 9 | 26 | 26 | ||||||||||||
|
Accrued interest payable
|
208 | 208 | 227 | 227 | ||||||||||||
|
Total
|
$ | 1,034,914 | $ | 1,034,914 | $ | 868,380 | $ | 868,380 | ||||||||
The following methods and assumptions were used to estimate the fair value of each class of financial instruments for which it is practicable to estimate that value:
Cash and Other Short-term Instruments For cash and cash equivalents, accrued interest receivable, accounts and drafts payable, short-term borrowings and accrued interest payable, the carrying amount is a reasonable estimate of fair value because of the demand nature or short maturities of these instruments.
Investment in Debt Securities Fair values are measured using Level 2 valuations.
Loans The fair value of loans is estimated by discounting the future cash flows using the current rates at which similar loans would be made to borrowers with similar credit ratings and for the same remaining maturities.
Deposits The fair value of demand deposits, savings deposits and certain money market deposits is the amount payable on demand at the reporting date. The fair value of fixed-maturity certificates of deposit is estimated using the rates currently offered for deposits of similar remaining maturities. The fair value estimates above do not include the benefit that results from the low-cost funding provided by the deposit liabilities compared to the cost of borrowing funds in the market nor the benefit derived from the customer relationship inherent in existing deposits.
Commitments to Extend Credit and Standby Letters of Credit The fair value of commitments to extend credit and standby letters of credit is estimated using the fees currently charged to enter into similar agreements, taking into account the remaining terms of the agreements, the likelihood of the counterparties drawing on such financial instruments and the present credit-worthiness of such counterparties. The Company believes such commitments have been made at terms which are competitive in the markets in which it operates; however, no premium or discount is offered thereon.
Limitations Fair value estimates are based on existing on- and off-balance sheet financial instruments without attempting to estimate the value of anticipated future business and the value of assets and liabilities that are not considered financial instruments. Other significant assets or liabilities that are not considered financial assets or liabilities include premises and equipment and the benefit that results from the low-cost funding provided by the deposit liabilities compared to the cost of borrowing funds in the market (core deposit intangible). In addition, tax ramifications related to the realization of the unrealized gains and losses can have a significant effect on fair value estimates and have not been considered in any of the estimates.
Because no market exists for a significant portion of the Company’s financial instruments, fair value estimates are based on management’s judgments regarding future expected loss experience, current economic conditions, risk characteristics of various financial instruments and other factors. These estimates are subjective in nature and involve uncertainties and matters of significant judgment and, therefore, cannot be determined with precision. Changes in assumptions could significantly affect the estimates.
Note 16
Industry Segment Information
The services provided by the Company are classified into two reportable segments: Information Services and Banking Services. Each of these segments provides distinct services that are marketed through different channels. They are managed separately due to their unique service, processing and capital requirements.
46
The Information Services segment provides transportation, utility and telecommunication invoice processing and payment services to large corporations. The Banking Services segment provides banking services primarily to privately held businesses and churches.
The Company’s accounting policies for segments are the same as those described in Note 1 of this report. Management evaluates segment performance based on net income after allocations for corporate expenses and income taxes. Transactions between segments are accounted for at what management believes to be fair value.
All revenue originates from and all long-lived assets are located within the United States and no revenue from any customer of any segment exceeds 10% of the Company’s consolidated revenue.
Assets represent actual assets owned by Information Services and there is no allocation methodology used. Loans are sold by Banking Services to Information Services to create liquidity when the Bank’s loan to deposit ratio is greater than 100%. Segment interest from customers is the actual interest earned on the loans owned by Information Services and Banking Services, respectively.
Summarized information about the Company’s operations in each industry segment for the years ended December 31, 2010, 2009 and 2008, is as follows:
|
(In thousands)
|
Information
Services
|
Banking
Services
|
Corporate,
Eliminations
and Other
|
Total
|
||||||||||||
|
2010
|
||||||||||||||||
|
Fee revenue and other income:
|
||||||||||||||||
|
Income from customers
|
$ | 54,732 | $ | 1,414 | $ | ― | $ | 56,146 | ||||||||
|
Intersegment income (expense)
|
8,939 | 1,656 | (10,595 | ) | ― | |||||||||||
|
Net interest income (expense) after provision for loan losses:
|
||||||||||||||||
|
Income from customers
|
19,381 | 20,690 | ― | 40,071 | ||||||||||||
|
Intersegment income (expense)
|
23 | (23 | ) | ― | ― | |||||||||||
|
Depreciation and amortization
|
1,875 | 242 | 14 | 2,131 | ||||||||||||
|
Income taxes
|
2,955 | 4,668 | ― | 7,623 | ||||||||||||
|
Net income
|
13,220 | 7,090 | ― | 20,310 | ||||||||||||
|
Goodwill
|
7,335 | 136 | ― | 7,471 | ||||||||||||
|
Other intangible assets, net
|
268 | ― | ― | 268 | ||||||||||||
|
Total assets
|
$ | 612,981 | $ | 580,948 | $ | (5,894 | ) | $ | 1,188,035 | |||||||
|
2009
|
||||||||||||||||
|
Fee revenue and other income:
|
||||||||||||||||
|
Income from customers
|
$ | 49,913 | $ | 1,325 | $ | ― | $ | 51,238 | ||||||||
|
Intersegment income (expense)
|
6,964 | 1,632 | (8,596 | ) | ― | |||||||||||
|
Net interest income (expense) after provision for loan losses:
|
||||||||||||||||
|
Income from customers
|
19,220 | 17,461 | ― | 36,681 | ||||||||||||
|
Intersegment income (expense)
|
94 | (94 | ) | ― | ― | |||||||||||
|
Depreciation and amortization
|
2,147 | 305 | 13 | 2,465 | ||||||||||||
|
Income taxes
|
2,158 | 3,247 | ― | 5,405 | ||||||||||||
|
Net income
|
11,047 | 5,082 | ― | 16,129 | ||||||||||||
|
Goodwill
|
7,335 | 136 | ― | 7,471 | ||||||||||||
|
Other intangible assets, net
|
375 | ― | ― | 375 | ||||||||||||
|
Total assets
|
$ | 527,897 | $ | 496,286 | $ | (11,202 | ) | $ | 1,012,981 | |||||||
|
2008
|
||||||||||||||||
|
Fee revenue and other income:
|
||||||||||||||||
|
Income from customers
|
$ | 51,837 | $ | 1,333 | $ | ― | $ | 53,170 | ||||||||
|
Intersegment income (expense)
|
4,976 | 1,829 | (6,805 | ) | ― | |||||||||||
|
Net interest income (expense) after provision for loan losses:
|
||||||||||||||||
|
Income from customers
|
24,732 | 13,828 | ― | 38,560 | ||||||||||||
|
Intersegment income (expense)
|
904 | (904 | ) | ― | ― | |||||||||||
|
Depreciation and amortization
|
2,256 | 407 | 10 | 2,673 | ||||||||||||
|
Income taxes
|
5,126 | 2,034 | ― | 7,160 | ||||||||||||
|
Net income
|
15,858 | 3,148 | ― | 19,006 | ||||||||||||
|
Goodwill
|
7,335 | 136 | ― | 7,471 | ||||||||||||
|
Other intangible assets, net
|
597 | ― | ― | 597 | ||||||||||||
|
Total assets
|
$ | 564,687 | $ | 382,982 | $ | (62,441 | ) | $ | 885,228 | |||||||
47
Note 17
Subsequent Events
In accordance with FASB ASC 855, “Subsequent Events,” the Company has evaluated subsequent events after the consolidated balance sheet date of December 31, 2010 and there were no events identified that would require additional disclosures to prevent the Company’s consolidated financial statements from being misleading.
Note 18
Condensed Financial Information of Parent Company
Following are the condensed balance sheets of the Company (parent company only) and the related condensed statements of income and cash flows.
|
Condensed Balance Sheets
December 31,
|
||||||||
|
(In thousands)
|
2010
|
2009
|
||||||
|
Assets
|
||||||||
|
Cash and due from banks
|
$ | 17,842 | $ | 14,843 | ||||
|
Short-term investments
|
61,775 | 46,059 | ||||||
|
Securities available-for-sale, at fair value
|
264,569 | 224,597 | ||||||
|
Loans, net
|
193,622 | 177,811 | ||||||
|
Investments in subsidiary
|
52,091 | 45,000 | ||||||
|
Premises and equipment, net
|
9,093 | 9,709 | ||||||
|
Other assets
|
66,080 | 54,879 | ||||||
|
Total assets
|
$ | 665,072 | $ | 572,898 | ||||
|
Liabilities and Shareholders’ Equity
|
||||||||
|
Liabilities:
|
||||||||
|
Accounts and drafts payable
|
516,107 | 430,251 | ||||||
|
Other liabilities
|
6,871 | 13,079 | ||||||
|
Total liabilities
|
522,978 | 443,330 | ||||||
|
Total shareholders’ equity
|
142,094 | 129,568 | ||||||
|
Total liabilities and shareholders’ equity
|
$ | 665,072 | $ | 572,898 | ||||
|
Condensed Statement of Income
For the Years Ended December 31,
|
||||||||||||
|
(In thousands)
|
2010
|
2009
|
2008
|
|||||||||
|
Income from subsidiary:
|
||||||||||||
|
Dividends
|
$ | ― | $ | ― | $ | 1,192 | ||||||
|
Interest
|
24 | 115 | 939 | |||||||||
|
Management fees
|
1,849 | 1,882 | 1,828 | |||||||||
|
Income from subsidiary
|
1,873 | 1,997 | 3,959 | |||||||||
|
Information services revenue
|
54,183 | 48,665 | 50,721 | |||||||||
|
Net interest income after provision
|
18,373 | 18,157 | 23,389 | |||||||||
|
Gain on sales of investment securities
|
― | 697 | 552 | |||||||||
|
Other income
|
549 | 551 | 564 | |||||||||
|
Total income
|
74,978 | 70,067 | 79,185 | |||||||||
|
Expenses:
|
||||||||||||
|
Salaries and employee benefits
|
45,598 | 45,172 | 44,768 | |||||||||
|
Other expenses
|
13,205 | 11,690 | 12,240 | |||||||||
|
Total expenses
|
58,803 | 56,862 | 57,008 | |||||||||
|
Income before income tax and equity in undistributed income of subsidiary
|
16,175 | 13,205 | 22,177 | |||||||||
|
Income tax expense
|
2,955 | 2,158 | 5,126 | |||||||||
|
Income before undistributed income of subsidiary
|
13,220 | 11,047 | 17,051 | |||||||||
|
Equity in undistributed income of subsidiary
|
7,090 | 5,082 | 1,955 | |||||||||
|
Net income
|
$ | 20,310 | $ | 16,129 | $ | 19,006 | ||||||
48
|
Condensed Statements of Cash Flows
For the Years Ended December 31,
|
||||||||||||
|
(In thousands)
|
2010
|
2009
|
2008
|
|||||||||
|
Cash flows from operating activities:
|
||||||||||||
|
Net income
|
$ | 20,310 | $ | 16,129 | $ | 19,006 | ||||||
|
Adjustments to reconcile net income to net cash provided
|
||||||||||||
|
by operating activities:
|
||||||||||||
|
Equity in undistributed income of subsidiary
|
(7,090 | ) | (5,082 | ) | (1,955 | ) | ||||||
|
Net change in other assets
|
(4,463 | ) | 187 | (11,118 | ) | |||||||
|
Net change in other liabilities
|
(4,930 | ) | (962 | ) | (2,378 | ) | ||||||
|
Amortization of stock-based awards
|
1,472 | 1,193 | 933 | |||||||||
|
Other, net
|
― | (325 | ) | 2,316 | ||||||||
|
Net cash provided by operating activities
|
5,299 | 11,140 | 6,804 | |||||||||
|
Cash flows from investing activities:
|
||||||||||||
|
Net increase in securities
|
(45,173 | ) | (22,226 | ) | (22,605 | ) | ||||||
|
Net (increase) decrease in loans
|
(19,911 | ) | 53,364 | 14,723 | ||||||||
|
Purchases of premises and equipment, net
|
(1,166 | ) | (901 | ) | (1,178 | ) | ||||||
|
Net cash (used in) provided by investing activities
|
(66,250 | ) | 30,237 | (9,060 | ) | |||||||
|
Cash flows from financing activities:
|
||||||||||||
|
Net increase (decrease) in accounts and drafts payable
|
85,856 | (48,774 | ) | (34,709 | ) | |||||||
|
Cash dividends paid
|
(5,448 | ) | (4,925 | ) | (4,499 | ) | ||||||
| Purchase of common shares for treasury | (467 | ) | – | (3,984 | ) | |||||||
|
Other financing activities
|
(275 | ) | 603 | 288 | ||||||||
|
Net cash provided by (used in) financing activities
|
79,666 | (53,096 | ) | (42,904 | ) | |||||||
|
Net increase (decrease) in cash and cash equivalents
|
18,715 | (11,719 | ) | (45,160 | ) | |||||||
|
Cash and cash equivalents at beginning of year
|
60,902 | 72,621 | 117,781 | |||||||||
|
Cash and cash equivalents at end of year
|
$ | 79,617 | $ | 60,902 | $ | 72,621 | ||||||
Note 19
SUPPLEMENTARY FINANCIAL INFORMATION
(Unaudited)
|
(In thousands except per share data)
|
First
Quarter
|
Second
Quarter
|
Third
Quarter
|
Fourth
Quarter
|
YTD
|
|||||||||||||||
|
2010
|
||||||||||||||||||||
|
Fee revenue and other income
|
$ | 13,225 | $ | 13,968 | $ | 14,401 | $ | 14,552 | $ | 56,146 | ||||||||||
|
Interest income
|
11,628 | 12,131 | 12,489 | 12,798 | 49,046 | |||||||||||||||
|
Interest expense
|
1,176 | 1,199 | 1,249 | 1,251 | 4,875 | |||||||||||||||
|
Net interest income
|
10,452 | 10,932 | 11,240 | 11,547 | 44,171 | |||||||||||||||
|
Provision for loan losses
|
900 | 1,150 | 950 | 1,100 | 4,100 | |||||||||||||||
|
Operating expense
|
16,197 | 16,850 | 17,098 | 18,139 | 68,284 | |||||||||||||||
|
Income tax expense
|
1,831 | 2,000 | 2,013 | 1,779 | 7,623 | |||||||||||||||
|
Net income
|
$ | 4,749 | $ | 4,900 | $ | 5,580 | $ | 5,081 | $ | 20,310 | ||||||||||
|
Net income per share:
|
||||||||||||||||||||
|
Basic earnings per share
|
$ | .51 | $ | .52 | $ | .60 | $ | .55 | $ | 2.18 | ||||||||||
|
Diluted earnings per share
|
.50 | .52 | .59 | .54 | 2.15 | |||||||||||||||
|
2009
|
||||||||||||||||||||
|
Fee revenue and other income
|
$ | 12,602 | $ | 12,598 | $ | 12,734 | $ | 13,304 | $ | 51,238 | ||||||||||
|
Interest income
|
10,493 | 10,724 | 11,040 | 11,527 | 43,784 | |||||||||||||||
|
Interest expense
|
991 | 1,280 | 1,399 | 1,383 | 5,053 | |||||||||||||||
|
Net interest income
|
9,502 | 9,444 | 9,641 | 10,144 | 38,731 | |||||||||||||||
|
Provision for loan losses
|
400 | 300 | 400 | 950 | 2,050 | |||||||||||||||
|
Operating expense
|
16,290 | 16,797 | 16,366 | 16,932 | 66,385 | |||||||||||||||
|
Income tax expense
|
1,491 | 1,284 | 1,291 | 1,339 | 5,405 | |||||||||||||||
|
Net income
|
$ | 3,923 | $ | 3,661 | $ | 4,318 | $ | 4,227 | $ | 16,129 | ||||||||||
|
Net income per share:
|
||||||||||||||||||||
|
Basic earnings per share
|
$ | .43 | $ | .40 | $ | .47 | $ | .46 | $ | 1.76 | ||||||||||
|
Diluted earnings per share
|
.42 | .39 | .46 | .46 | 1.73 | |||||||||||||||
49
Report of Independent Registered Public Accounting Firm
The Board of Directors
Cass Information Systems, Inc.:
We have audited the accompanying consolidated balance sheets of Cass Information Systems, Inc. and subsidiaries (the Company) as of December 31, 2010 and 2009, and the related consolidated statements of income, shareholders’ equity and comprehensive income, and cash flows for each of the years in the three-year period ended December 31, 2010. These consolidated financial statements are the responsibility of the Company’s management. Our responsibility is to express an opinion on these consolidated financial statements based on our audits.
We conducted our audits in accordance with the standards of the Public Company Accounting Oversight Board (United States). Those standards require that we plan and perform the audit to obtain reasonable assurance about whether the financial statements are free of material misstatement. An audit includes examining, on a test basis, evidence supporting the amounts and disclosures in the financial statements. An audit also includes assessing the accounting principles used and significant estimates made by management, as well as evaluating the overall financial statement presentation. We believe that our audits provide a reasonable basis for our opinion.
In our opinion, the consolidated financial statements referred to above present fairly, in all material respects, the financial position of Cass Information Systems, Inc. and subsidiaries as of December 31, 2010 and 2009, and the results of their operations and their cash flows for each of the years in the three-year period ended December 31, 2010, in conformity with U.S. generally accepted accounting principles.
We also have audited, in accordance with the standards of the Public Company Accounting Oversight Board (United States), the Company’s internal control over financial reporting as of December 31, 2010 based on criteria established in Internal Control – Integrated Framework issued by the Committee of Sponsoring Organizations of the Treadway Commission (COSO), and our report dated March 10, 2011 expressed an unqualified opinion on the effectiveness of the Company’s internal control over financial reporting.
/s/ KPMG LLP
St. Louis, Missouri
March 10, 2011
50
|
ITEM 9.
|
CHANGES IN AND DISAGREEMENTS WITH ACCOUNTANTS ON ACCOUNTING AND FINANCIAL DISCLOSURE
|
NONE
|
ITEM 9A.
|
CONTROLS AND PROCEDURES
|
Conclusion Regarding the Effectiveness of Disclosure Controls and Procedures
Under the supervision and with the participation of our management, including our principal executive officer and principal financial officer, we conducted an evaluation of our disclosure controls and procedures, as such term is defined in Rules 13a-15(e) and 15d-15(e) under the Securities Exchange Act of 1934, as amended (the “Exchange Act”), as of December 31, 2010. Based on this evaluation, our principal executive officer and our principal financial officer concluded that our disclosure controls and procedures were effective as of December 31, 2010.
There have not been changes in our internal control over financial reporting that occurred during our fourth fiscal quarter that have materially affected or are reasonably likely to materially affect our internal control over financial reporting.
Management’s Report on Internal Control Over Financial Reporting
Our management is responsible for establishing and maintaining adequate internal control over financial reporting, as such term is defined in Exchange Act Rules 13a-15(f) and 15d-15(f). All internal control systems, no matter how well designed, have inherent limitations. Therefore, even those systems determined to be effective can provide only reasonable assurance with respect to financial statement preparation and presentations.
Under the supervision and with the participation of our management, including our principal executive officer and principal financial officer, we conducted an evaluation of the effectiveness of our internal control over financial reporting based on the framework in Internal Control – Integrated Framework issued by the Committee of Sponsoring Organizations of the Treadway Commission. Based on our evaluation under this framework, our management concluded that our internal control over financial reporting was effective as of December 31, 2010.
The effectiveness of our internal control over financial reporting as of December 31, 2010 has been audited by KPMG LLP, our independent registered public accounting firm. KPMG LLP’s report, which expresses an unqualified opinion on the effectiveness of our internal control over financial reporting as of December 31, 2010, is included below.
51
Report of Independent Registered Public Accounting Firm
The Board of Directors and Stockholders
Cass Information Systems, Inc.:
We have audited Cass Information Systems, Inc.’s (the Company) internal control over financial reporting as of December 31, 2010, based on criteria established in Internal Control – Integrated Framework issued by the Committee of Sponsoring Organizations of the Treadway Commission. The Company’s management is responsible for maintaining effective internal control over financial reporting and for its assessment of the effectiveness of internal control over financial reporting, included in the accompanying Management’s Report on Internal Control over Financial Reporting. Our responsibility is to express an opinion on
the Company’s internal control over financial reporting based on our audit.
We conducted our audit in accordance with the standards of the Public Company Accounting Oversight Board (United States). Those standards require that we plan and perform the audit to obtain reasonable assurance about whether effective internal control over financial reporting was maintained in all material respects. Our audit included obtaining an understanding of internal control over financial reporting, assessing the risk that a material weakness exists, and testing and evaluating the design and operating effectiveness of internal control based on the assessed risk. Our audit also included performing such other procedures as we considered necessary in the circumstances. We believe that our audit provides a reasonable basis for our opinion.
A company’s internal control over financial reporting is a process designed to provide reasonable assurance regarding the reliability of financial reporting and the preparation of financial statements for external purposes in accordance with generally accepted accounting principles. A company’s internal control over financial reporting includes those policies and procedures that (1) pertain to the maintenance of records that, in reasonable detail, accurately and fairly reflect the transactions and dispositions of the assets of the company; (2) provide reasonable assurance that transactions are recorded as necessary to permit preparation of financial statements in accordance with generally accepted accounting principles, and that receipts and expenditures of the company are being made only in
accordance with authorizations of management and directors of the company; and (3) provide reasonable assurance regarding prevention or timely detection of unauthorized acquisition, use, or disposition of the company’s assets that could have a material effect on the financial statements.
Because of its inherent limitations, internal control over financial reporting may not prevent or detect misstatements. Also, projections of any evaluation of effectiveness to future periods are subject to the risk that controls may become inadequate because of changes in conditions, or that the degree of compliance with the policies or procedures may deteriorate.
In our opinion, the Company maintained, in all material respects, effective internal control over financial reporting as of December 31, 2010, based on criteria established in Internal Control – Integrated Framework issued by the Committee of Sponsoring Organizations of the Treadway Commission.
We also have audited, in accordance with the standards of the Public Company Accounting Oversight Board (United States), the consolidated balance sheets of the Company as of December 31, 2010 and 2009, and the related consolidated statements of income, shareholders’ equity and comprehensive income, and cash flows for each of the years in the three-year period ended December 31, 2010, and our report dated March 10, 2011 expressed an unqualified opinion on those consolidated financial statements.
/s/ KPMG LLP
St. Louis, Missouri
March 10, 2011
52
|
ITEM 9B.
|
OTHER INFORMATION
|
None.
PART III.
|
ITEM 10.
|
DIRECTORS, EXECUTIVE OFFICERS AND CORPORATE GOVERNANCE
|
Certain information required by this Item 10 is incorporated herein by reference from the following sections of the Company’s definitive Proxy Statement for its 2011 Annual Meeting of Shareholders (“2011 Proxy Statement”), a copy of which will be filed with the SEC no later than 120 days after the close of the fiscal year: “Election of Directors” and “Executive Officers” (please note that “Section 16(a) Beneficial Ownership Reporting Compliance” is within the “Executive Officers” section).
The Company has adopted a Code of Conduct and Business Ethics policy, applicable to all Company directors, executive officers and employees. The policy is publicly available and can be viewed on the Company’s website at www.cassinfo.com. The Company intends to satisfy the disclosure requirement under Item 5.05 of Form 8-K regarding the amendment to, or a waiver of, a provision of this policy that applies to the Company’s principal executive officer, principal financial officer, principal accounting officer or controller, or persons performing similar functions, and that relates to any element of the code of ethics definition enumerated in Item 406(b) of Regulation S-K by posting such information on its website.
There have been no material changes to the procedures by which stockholders may recommend nominees to the Board.
|
ITEM 11.
|
EXECUTIVE COMPENSATION
|
Certain information required pursuant to this Item 11 is incorporated herein by reference from the sections entitled “Compensation Discussion and Analysis,” “Director Compensation,” “Summary Compensation – Directors,” “Executive Officers,” and “Election of Directors” of the Company’s 2011 Proxy Statement, a copy of which will be filed with the SEC no later than 120 days after the close of the fiscal year.
|
ITEM 12.
|
SECURITY OWNERSHIP OF CERTAIN BENEFICIAL OWNERS AND MANAGEMENT AND RELATED STOCKHOLDER MATTERS
|
Information required pursuant to this Item 12 is incorporated herein by reference from the section entitled “Executive Officers” of the Company’s 2011 Proxy Statement, a copy of which will be filed with the SEC no later than 120 days after the close of the fiscal year.
Securities Authorized for Issuance under Equity Compensation Plans
The following information is as of December 31, 2010:
|
Plan Category
|
Number of securities to
be issued upon exercise
of outstanding options,
warrants and rights
(a)
|
Weighted-average
exercise price of
outstanding
options, warrants
and rights
(b)
|
Number of securities
remaining available for
future issuance under
equity compensation
plans (excluding
securities reflected in
column (a))
(c)
|
|||||||||
|
Equity compensation plans
|
36,628 | (1) | $ | 18.36 | — | (1) | ||||||
|
approved by security holders
|
292,026 | (2) | 27.58 | 538,952 | (2) | |||||||
|
Equity compensation plans not approved by security holders
|
– | – | – | |||||||||
|
Total
|
328,654 | $ | 25.18 | 538,952 | ||||||||
|
(1)
|
Amount disclosed relates to the Company’s 1995 Performance-Based Stock Option Plan and 1995 Restricted Stock Bonus Plan. There will be no more shares or options granted under these plans.
|
|
(2)
|
Amount disclosed relates to the 2007 Omnibus Incentive Stock Plan.
|
53
Refer to Note 11 to the consolidated financial statements for information concerning stock options and bonus plans.
|
ITEM 13.
|
CERTAIN RELATIONSHIPS AND RELATED TRANSACTIONS, AND DIRECTOR INDEPENDENCE
|
Information required by this Item 13 is incorporated herein by reference from the section entitled “Election of Directors” of the Company’s 2011 Proxy Statement, a copy of which will be filed with the SEC no later than 120 days after the close of the fiscal year.
|
ITEM 14.
|
PRINCIPAL ACCOUNTANT FEES AND SERVICES
|
Information concerning our principal accountant’s fees and services is incorporated herein by reference from the section “Ratification of Appointment of Independent Registered Public Accounting Firm” of the Company’s 2011 Proxy Statement, a copy of which will be filed with the SEC no later than 120 days after the close of the fiscal year.
PART IV.
|
ITEM 15.
|
EXHIBITS AND FINANCIAL STATEMENT SCHEDULES
|
|
(a)
|
The following documents are incorporated by reference in or filed as an exhibit to this Report:
|
||
|
(1) and (2)
|
Financial Statements and Financial Statement Schedules
|
||
|
Included in Item 8 of this report.
|
|||
|
(3)
|
Exhibits listed under (b) of this Item 15.
|
||
|
(b)
|
Exhibits
|
||
|
3.1
|
Restated Articles of Incorporation of Registrant, incorporated by reference to Exhibit 4.1 to Form S-8 Registration Statement No. 333-44499, filed with the SEC on January 20, 1998.
|
||
|
3.2
|
Articles of Merger of Cass Commercial Corporation, incorporated by reference to Exhibit 3.1 to the quarterly report on Form 10-Q for the quarter ended September 30, 2006 (File No. 333 – 44497).
|
||
|
3.3
|
Second Amended and Restated Bylaws of Registrant, incorporated by reference to Exhibit 3.1 to the current report on Form 8-K, filed with the SEC on April 18, 2007 (File No. 333 – 44497).
|
||
|
10.1
|
1995 Restricted Stock Bonus Plan, as amended to January 19, 1999, including form of Restriction Agreement, incorporated by reference to Exhibit 4.3 to Post-Effective Amendment No. 2 to Form S-8 Registration Statement No. 33-91456, filed with the SEC on February 16, 1999.*
|
||
|
10.2
|
1995 Performance-Based Stock Option Plan, as amended to January 19, 1999, including forms of Option Agreements, incorporated by reference to Exhibit 4.3 to Post-Effective Amendment No. 2 to Form S-8 Registration Statement No. 33-91568, filed with the SEC on February 16, 1999.*
|
||
|
10.3
|
Form of Directors’ Indemnification Agreement, incorporated by reference to Exhibit 10.1 to the quarterly report on Form 10-Q for the quarter ended March 31, 2003 (File No. 333 – 44497).*
|
||
|
10.4
|
Amended and Restated 2007 Omnibus Incentive Stock Plan, incorporated by reference to Exhibit 10.1 to the quarterly report on Form 10-Q for the quarter ended September 30, 2007 (File No. 333-44497).*
|
||
|
10.5
|
Amendment and Restatement of the Supplemental Executive Retirement Plan, incorporated by reference to Exhibit 10.2 to the quarterly report on Form 10-Q for the quarter ended September 30, 2007 (File No. 333 – 44497).*
|
||
54
|
10.6
|
Form of Restricted Stock Agreement Award Agreement, incorporated by reference to Exhibit 10.3 to the quarterly report on Form 10-Q for the quarter ended September 30, 2007 (File No. 333 – 44497).*
|
||
|
10.7
|
Form of Stock Appreciation Rights Award Agreement, incorporated by reference to Exhibit 10.4 to the quarterly report on Form 10-Q for the quarter ended September 30, 2007 (File No. 333 – 44497).*
|
||
|
21
|
Subsidiaries of registrant.
|
||
|
23
|
Consent of Independent Registered Public Accounting Firm.
|
||
|
31.1
|
Certification Pursuant to Section 302 of the Sarbanes-Oxley Act of 2002.
|
||
|
|
|||
|
31.2
|
Certification Pursuant to Section 302 of the Sarbanes-Oxley Act of 2002.
|
||
|
32 .1
|
Certification Pursuant to 18 U.S.C. Section 1350, as Adopted Pursuant to Section 906 of the Sarbanes-Oxley Act of 2002.
|
||
|
32 .2
|
Certification Pursuant to 18 U.S.C. Section 1350, as Adopted Pursuant to Section 906 of the Sarbanes-Oxley Act of 2002.
|
* Management contract or compensatory plan or arrangement.
(c) None.
55
SIGNATURES
Pursuant to the requirements of the Securities Exchange Act of 1934, this report has been signed below by the following persons on behalf of the registrant and in the capacities and on the dates indicated.
|
CASS INFORMATION SYSTEMS, INC.
|
|||
|
Date: March 10, 2011
|
By
|
/s/ Eric H. Brunngraber
|
|
|
Eric H. Brunngraber
|
|||
|
President and Chief Executive Officer
|
|||
|
(Principal Executive Officer)
|
|||
|
Date: March 10, 2011
|
By
|
/s/ P. Stephen Appelbaum
|
|
|
P. Stephen Appelbaum
|
|||
|
Chief Financial Officer
|
|||
|
(Principal Financial and Accounting Officer)
|
Pursuant to the requirements of the Securities Exchange Act of 1934, this report has been signed below on the dates indicated by the following persons on behalf of the registrant and in their capacity as a member of the Board of Directors of the Company.
|
Date: March 10, 2011
|
By
|
/s/
|
K. Dane Brooksher
|
||
|
K. Dane Brooksher
|
|||||
|
Date: March 10, 2011
|
By
|
/s/
|
Eric H. Brunngraber
|
||
|
Eric H. Brunngraber
|
|||||
|
Date: March 10, 2011
|
By
|
/s/
|
Bryan S. Chapell
|
||
|
Bryan S. Chapell
|
|||||
|
Date: March 10, 2011
|
By
|
/s/
|
Lawrence A. Collett
|
||
|
Lawrence A. Collett
|
|||||
|
Date: March 10, 2011
|
By
|
/s/
|
Robert A. Ebel
|
||
|
Robert A. Ebel
|
|||||
|
Date: March 10, 2011
|
By
|
/s/
|
Benjamin F. Edwards, IV
|
||
|
Benjamin F. Edwards, IV
|
|||||
|
Date: March 10, 2011
|
By
|
/s/
|
John L. Gillis, Jr.
|
||
|
John L. Gillis, Jr.
|
|||||
|
Date: March 10, 2011
|
By
|
/s/
|
Wayne J. Grace
|
||
|
Wayne J. Grace
|
|||||
|
Date: March 10, 2011
|
By
|
/s/
|
James J. Lindemann
|
||
|
James J. Lindemann
|
|||||
|
Date: March 10, 2011
|
By
|
/s/
|
Randall L. Schilling
|
||
|
Randall L. Schilling
|
|||||
|
Date: March 10, 2011
|
By
|
/s/
|
Andrew J. Signorelli
|
||
|
Andrew J. Signorelli
|
|||||
|
Date: March 10, 2011
|
By
|
/s/
|
Franklin D. Wicks, Jr.
|
||
|
Franklin D. Wicks, Jr.
|
56