Attached files
| file | filename |
|---|---|
| 8-K - FORM 8-K - SUNTRUST BANKS INC | d8k.htm |
 SunTrust Banks, Inc.
Citigroup Financial Services Conference
March 9, 2011
William H. Rogers, Jr.
President and Chief Operating Officer
Exhibit 99.1 |
 1
Important Cautionary Statement About Forward-Looking Statements
The following should be read in conjunction with the financial statements, notes and other
information contained in the Company’s 2010 Annual Report on Form 10-K, Quarterly Reports on Form 10-Q, and Current Reports on Form 8-K.
This presentation includes non-GAAP financial measures to describe SunTrust’s performance. The reconciliations of those measures to GAAP measures are provided within or in the appendix of this presentation. In this presentation, net
interest
income
and
net
interest
margin
are
presented
on
a
fully
taxable-equivalent
(“FTE”) basis,
and
ratios
are
presented
on
an
annualized
basis.
The
FTE
basis
adjusts
for
the
tax-favored
status
of
income
from
certain
loans
and
investments. The Company believes this measure to be the preferred industry measurement of net
interest income and provides relevant comparison between taxable and non-taxable amounts.
This
presentation
contains
forward-looking
statements.
Statements
regarding
our
expectations
about
first
quarter
2011
levels
of
loan
balances,
deposits,
net
interest
margin
expansion,
noninterest
income
(including
investment
banking
income
and
mortgage
production
income,
and
securities
gains),
noninterest
expense,
net
charge-offs,
ALLL,
and
NPLs
are
forward-looking
statements.
Also,
any
statement
that
does
not
describe
historical
or
current
facts,
is
a
forward-
looking
statement.
These
statements
often
include
the
words
“believes,
” “expects,”
“anticipates,
” “estimates,”
“intends,
” “plans,”
“goals,
” “targets,”
“initiatives,
” “potentially,”
“probably,
” “projects,”
“outlook
” or
similar
expressions
or
future
conditional
verbs
such
as
“may,”
“will,”
“should,
” “would,” and
“could.
” Forward-looking
statements
are
based
upon
the
current
beliefs
and
expectations
of
management
and
on
information
currently
available
to
management.
Our
statements
speak
as
of
the
date
hereof,
and
we
do
not
assume
any
obligation
to
update
these
statements
or
to
update
the
reasons
why
actual
results
could
differ
from
those
contained
in
such
statements
in
light
of
new
information
or
future
events.
Forward-looking
statements
are
subject
to
significant
risks
and
uncertainties.
Investors
are
cautioned
against
placing
undue
reliance
on
such
statements.
Actual
results
may
differ
materially
from
those
set
forth
in
the
forward-looking
statements. Factors that could cause actual results to differ materially from those described
in the forward-looking statements can be found in Item 1A of Part I of our 10-K and in other periodic reports that we file with the SEC.
Those factors include: difficult market conditions have adversely affected our industry;
concerns over market volatility continue; recently enacted legislation, legislation enacted in the future, and certain proposed federal programs
subject us to increased regulation and may adversely affect us; we have not yet received
permission to repay TARP funds; the Dodd-Frank Act makes fundamental changes to the regulation of the financial services industry, some of which
may adversely affect our business; SunTrust Bank may be subject to higher deposit insurance
assessments; we are subject to capital adequacy and liquidity guidelines and, if we fail to meet these guidelines, our financial condition would
be adversely affected; emergency measures designed to stabilize the U.S. banking system are
beginning to wind down; we are subject to credit risk; our ALLL may not be adequate to cover our eventual losses; we will realize future losses
if
the
proceeds
we
receive
upon
liquidation
of
nonperforming
assets
are
less
than
the
carrying
value
of
such
assets;
weakness
in
the
economy
and
in
the
real
estate
market,
including
specific
weakness
within
our
geographic
footprint,
has
adversely affected us and may continue to adversely affect us; weakness in the real estate
market, including the secondary residential mortgage loan markets, has adversely affected us and may continue to adversely affect us; we are
subject to certain risks from originating, selling, and holding mortgages, including the risk
that we may be required to repurchase mortgage loans or indemnify mortgage loan purchasers as a result of breaches of representations and
warranties, borrower fraud, or certain borrower defaults, which could harm our liquidity,
results of operations, and financial condition; we are subject to risks related to delays in the foreclosure process; we may continue to suffer
increased losses in our loan portfolio despite enhancement of our underwriting policies; as a
financial services company, adverse changes in general business or economic conditions could have a material adverse effect on our financial
condition and results of operations; changes in market interest rates or capital markets could
adversely affect our revenue and expense, the value of assets and obligations, and the availability and cost of capital or liquidity; the fiscal and
monetary policies of the federal government and its agencies could have a material adverse
effect on our earnings; depressed market values for our stock may require us to write down goodwill; clients could pursue alternatives to bank
deposits,
causing
us
to
lose
a
relatively
inexpensive
source
of
funding;
consumers
may
decide
not
to
use
banks
to
complete
their
financial
transactions,
which
could
affect
net
income;
we
have
businesses
other
than
banking
which
subject
us to a variety of risks; hurricanes and other natural or man-made disasters may adversely
affect loan portfolios and operations and increase the cost of doing business; negative public opinion could damage our reputation and adversely
impact business and revenues; the soundness of other financial institutions could adversely
affect us; we rely on other companies to provide key components of our business infrastructure; we rely on our systems, employees, and certain
counterparties,
and
certain
failures
could
materially
adversely
affect
our
operations;
we
depend
on
the
accuracy
and
completeness
of
information
about
clients
and
counterparties;
regulation
by
federal
and
state
agencies
could
adversely
affect
the
business,
revenue,
and
profit
margins;
competition
in
the
financial
services
industry
is
intense
and
could
result
in
losing
business
or
margin
declines;
maintaining
or
increasing
market
share
depends
on
market
acceptance
and
regulatory
approval
of
new
products
and
services;
we
may
not
pay
dividends
on
your
common
stock;
our
ability
to
receive
dividends
from
our
subsidiaries
could
affect
our
liquidity
and
ability
to
pay
dividends;
disruptions
in
our
ability
to
access
global
capital
markets
may
negatively
affect
our
capital
resources
and
liquidity;
any
reduction
in
our
credit
rating
could
increase
the
cost
of
our
funding
from
the
capital
markets;
we
have
in
the
past
and
may
in
the
future
pursue
acquisitions, which could affect costs and from which we may not
be able to realize anticipated benefits; we are subject to certain litigation, and our
expenses related to this litigation may adversely affect our results; we depend on the
expertise of key personnel, and if these individuals leave or change their roles without
effective replacements, operations may suffer; we may not be able to hire or retain additional qualified personnel and recruiting and compensation
costs may increase as a result of turnover, both of which may increase costs and reduce
profitability and may adversely impact our ability to implement our business strategy; our accounting policies and processes are critical to how we
report our financial condition and results of operations, and require management to make
estimates about matters that are uncertain; changes in our accounting policies or in accounting standards could materially affect how we report
our financial results and condition; our stock price can be volatile; our disclosure controls
and procedures may not prevent or detect all errors or acts of fraud; our financial instruments carried at fair value expose us to certain market
risks; our revenues derived from our investment securities may be volatile and subject to a
variety of risks; and we may enter into transactions with off-balance sheet affiliates or our subsidiaries. |
  2
SunTrust has an attractive footprint
and a diverse business mix
SunTrust has an attractive footprint
and a diverse business mix |
 3
0.7%
1.1%
2.0%
2.2%
2.9%
3.3%
3.7%
4.0%
4.7%
5.6%
5.7%
6.1%
MTB
PNC
CMA
KEY
FITB
MI
COF
USB
RF
BBT
WFC
STI
Projected Population Growth ²
1.
Source: SNL Financial, as of 6/30/2010 based on MSAs.
2.
Source: SNL Financial---five-year population growth, 2010-2015,
MSA + counties not in any MSA, at 3/1/2011. 3.
Source: SNL Financial, as of 12/31/10. Based upon traditional bank holding
companies headquartered in the United States. Branch Network
A Leading Bank with an Attractive Footprint
U.S. Average:
3.9%
Franchise Overview
Selected Statistics and (U.S. Rank) ³
Assets
$172.9B
(8
th
)
Deposits
$123.0B
(8
th
)
Branches
1,668
(8
th
)
ATMs
2,918
(7
th
)
SunTrust has a top 3 deposit market share in 21 of its top 25
MSAs¹ •
Top 25 represents 85% of total MSA deposits
•
Top 25 average deposit market share is 14% |
 4
Well-diversified Business Mix
2010
Revenue
-
$8.7B
Retail Banking
Extensive network of traditional and in-store branches. Deposit,
lending, and card products offered to consumers and small businesses
Diversified Commercial Banking
Full line of lending, capital markets, financial risk management,
commercial card, and treasury and payment solutions
Corporate and Investment Banking
Complete offering of investment banking and traditional banking
services. National practice with industry sector focus
Mortgage
Prime-based, national platform for residential mortgages. Top 10
U.S. originator and servicer ¹
Wealth & Investment Management
Provider of wealth and investment management products and services
to individual and institutional accounts. $195B AUA
² Corporate Treasury & Other
$27B high quality securities portfolio ²
Commercial Real Estate
Broad range of financial solutions to CRE developers and investors
Diversified Business Mix
42%
15%
12%
11%
10%
7%
3%
1.
Source: Inside Mortgage Finance.
2.
As of December 31, 2010. |
 5
39%
5%
3%
4%
21%
14%
4%
8%
2%
Commercial & Industrial
Commercial Real Estate
Construction
Resi. Mtg. -
Guaranteed
Resi. Mtg. -
Nonguaranteed
Home Equity
Student Loans -
Guaranteed
Indirect Consumer
Other Consumer
2
Distribution by Geography ¹
Distribution by Loan Category
25%
26%
31%
18%
Central
Florida
Mid-Atlantic
Other
3
Diversified Loan Portfolio
Loan Portfolio is Well-diversified by Geography and Product Type
Total Portfolio as of 12/31/10: $116.0 billion
1.
Central region includes AL, AR, GA, MS, and TN. Florida region includes
Florida only. Mid-Atlantic includes DC, MD, NC, SC, and VA. Other includes all other states.
Balances exclude private-label student loans with third-party insurance and
student loans and residential mortgages guaranteed by government agencies.
2.
Includes residential and commercial construction.
3.
Includes Other Direct and Credit Cards. |
  6
We have reduced our risk profile and
improved our core performance
We have reduced our risk profile and
improved our core performance |
 7
$0
$1,000
$2,000
$3,000
$4,000
$5,000
$6,000
$7,000
$8,000
$9,000
$10,000
Construction
Prime
2nd
Lot
Loans
Alt-A
High LTV
Lines
Broker
Originated
Lines
HE
Loans
Government
Guaranteed
Loans
12/31/2008
12/31/2010
Higher
Risk
Segment
Loan
Balances
Reduced
Nearly
45%;
Government
Guaranteed
Loans
Increased
61%
Residential Mortgage
Home Equity
38%
41%
43%
17%
28%
36%
($ in millions)
208%
Higher Risk Portfolio Segments Significantly Reduced |
 8
Capital Position Enhanced and Increasing
Tier 1 Common Ratio
5.83%
7.34%
7.49%
7.67%
7.70%
7.92%
8.02%
8.08%
1Q09
2Q09
3Q09
4Q09
1Q10
2Q10
3Q10
4Q10 |
 9
$0
$200
$400
$600
$800
$1,000
$1,200
1Q09
2Q09
3Q09
4Q09
1Q10
2Q10
3Q10
4Q10
$0
$1,000
$2,000
$3,000
$4,000
$5,000
$6,000
1Q09
2Q09
3Q09
4Q09
1Q10
2Q10
3Q10
4Q10
Nonperforming Loans
Credit Metrics Remain Elevated but Are Exhibiting Favorable Trends
Net Charge-offs
($ in millions)
($ in millions)
Credit Metrics |
 10
1.50%
2.00%
2.50%
3.00%
$2,000
$2,200
$2,400
$2,600
$2,800
$3,000
$3,200
1Q09
2Q09
3Q09
4Q09
1Q10
2Q10
3Q10
4Q10
ALLL
Loan Coverage Ratio
Allowance Increased Through 1Q10; Modest Decline in 2H10 Due to Improved Credit
Trends ($ in millions)
Allowance for Loan and Lease Losses |
 11
$2,000
$2,100
$2,200
$2,300
$2,400
$2,500
$2,600
$2,700
2009
2010
($500)
($400)
($300)
($200)
($100)
$0
$100
$200
1Q09
2Q09
3Q09
4Q09
1Q10
2Q10
3Q10
4Q10
Net Income / (Loss) to Common Shareholders ¹
Earnings Improvement from Lower Provision for Credit Losses and Higher PPNR
Pre-provision Net Revenue (Adjusted Basis) ²
($ in millions)
($ in millions)
Profitability Trends
1.
1Q09 excludes the impact of the $751 million Goodwill impairment.
2.
Excludes non-core items such as Goodwill impairment and securities gains.
See Appendix for reconciliation to GAAP figures. |
 12
Average Balances
($ in billions)
2-year CAGR ¹
Low Cost
Deposits
16%
High Cost
Deposits
-24%
Improved Deposit Mix
Strong Growth in Low Cost Deposits has Enabled Reductions in High Cost Deposits
Note : Low Cost Deposits includes Noninterest Bearing, NOW Accounts,
Money Market Accounts, and Savings Accounts. High Cost includes Consumer Time, Other Time,
Brokered Deposits, and Foreign Deposits.
1.
Reflects 4Q10 average balance as compared to 4Q08 average balance.
$77
$82
$85
$90
$90
$92
$94
$98
$38
$38
$35
$33
$28
$27
$26
$24
1Q09
2Q09
3Q09
4Q09
1Q10
2Q10
3Q10
4Q10
Low Cost Deposits
High Cost Deposits |
 13
Seven Consecutive Quarters of NIM Expansion
Net Interest Margin
2.87%
2.94%
3.10%
3.27%
3.32%
3.33%
3.41%
3.44%
1Q09
2Q09
3Q09
4Q09
1Q10
2Q10
3Q10
4Q10 |
 14
One Team
Client First
Focused on
Profitable Growth
•
Continued to invest in
teammate and leader
development
More than 1 million
hours of training in
2010
•
Realized increased
teammate engagement
scores across the
Company ¹
•
Improved cross-sell
penetration across many
lines of business
•
Implemented shared
goals across the
enterprise
•
Conducted 1,000 client calls per
day to better understand client
loyalty drivers and gather feedback
on our service levels
•
Ranked #1 bank for Customer
Experience ²
•
Achieved #1 industry ranking for
client loyalty in Commercial and
Private Wealth Management ³
•
Achieved #1 ranking for
consumers’
confidence in their
bank ³
•
Received 18 Greenwich
Excellence Awards for outstanding
client service (12 for Small
Business Banking, 6 for Middle
Market Banking)
•
Ranked #1 in Customer
Satisfaction for Small Business
Banking and #2 for Primary Loan
Servicing
4
•
Achieved record revenue in
the Corporate & Investment
Banking line of business
•
Increased total loan yield by 12
basis point from 2010 to 2009,
despite declining rate
environment
•
Grew brokerage managed
account revenue by 28% from
2009
•
Exceeded Lipper 3-year
average for 75% of
RidgeWorth long-term funds
•
Reduced long-term debt,
brokered deposits, and foreign
deposits by a combined $6.4
billion, or 28%, from 2009
Selected 2010 Accomplishments
Substantial Progress Made in 2010; Strong Momentum Entering 2011
1.
Based upon internal surveys conducted by Gallup.
2.
By Forrester Research.
3.
Based upon independent survey results by Gallup.
4.
By J.D. Power and Associates. |
 15
Our mission is to help people and institutions prosper
One Team
Client First
Focused on
Profitable Growth
We accomplish this by focusing on three principles:
We know that highly engaged teammates drive client loyalty, which leads to
primary relationship growth
Mission and Values
SunTrust’s Mission is Supported by a Core Set of Principles
|
  16
Our strategic priorities are intended to
drive further improvements in our
financial performance
Our strategic priorities are intended to
drive further improvements in our
financial performance |
 17
Growth Strategies
Growth Strategies
•
Diversify the Balance Sheet
•
Optimize Business Mix
•
Improve Expense Efficiency
•
Grow Market Share |
 18
Commercial Lending / Fee Businesses
•Asset-Based Lending
•Small Business Administration lending
•Commercial ($5-100MM revenue)
•Middle Market ($100-750MM revenue)
•Corporate & Investment Banking
($750MM+ revenue)
Targeted
Growth
Areas:
High-opportunity
businesses,
segments,
and
products
where
we
are
well-positioned
to
grow
non-real
estate
loans
and
fee
income
Targeted Growth Areas
Consumer Lending / Fee Businesses
•Mass Affluent client segment
•Private Wealth Management
•Credit Card
•Auto lending (direct and indirect)
Loan Portfolio Composition –
12/31/10
Diversify the Balance Sheet & Optimize Business Mix
Targeted Areas for Growth are Intended to Diversify the Loan Portfolio and Enhance Fee
Income
39%
5%
3%
4%
21%
14%
4%
8%
2%
Commercial & Industrial
Commercial Real Estate
Construction
Resi. Mtg.
-
Guaranteed
Resi. Mtg.
-
Nonguaranteed
Home Equity
Student Loans
-
Guaranteed
Indirect Consumer
Other Consumer |
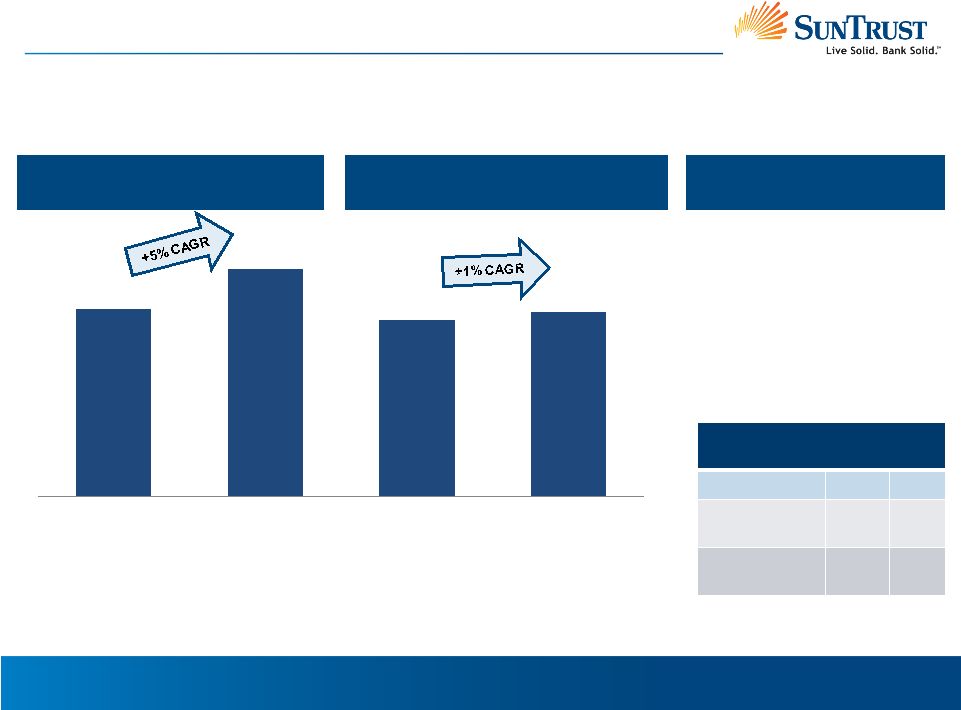 19
$4,867
$5,911
$4,607
$4,797
2006
2010
2006
2010
($ in millions)
Total Noninterest
Expenses
Expenses Excl. Adjustments and
Cyclical Items ¹
Opportunities to Improve
Efficiency Ratio
•
Continued improvements in
revenue generation
•
Balanced approach to
investments and expense
discipline
•
Abatement of cyclical
expenses
Improve Expense Efficiency
Expense Savings Enabled Continued Investment in the Business while Keeping Core
Expenses Flat 1.
Appendix includes reconciliation of non-GAAP numbers and details of adjustments
and cyclical expenses. 2.
Reflects the respective expense item divided by Total Revenue, FTE.
Additional information on the calculation is included in the appendix. Impact
on Efficiency Ratio ²
2006
2010
Credit
Expenses
1.8%
7.9%
Regulatory
Assessments
0.3%
3.0% |
 20
•
Since the “Live Solid. Bank Solid.”
brand campaign began, SunTrust
has improved performance against
the competition on deposit and
household growth
•
According to a Gallup poll,
SunTrust clients showed the
highest level of satisfaction with
efforts to inform them about
overdraft changes
•
Competitive studies indicate
the service in SunTrust
branches and call centers is
the highest in the industry –
beating large and regional
banks in service scores
Household Growth
Grow Market Share
Efforts to Grow Market Share are Yielding Results
1.
Source: 2008 & 2009 Nielsen Claritas Demographic Update.
2.
Retail Banking checking households. |
  21
Updates on Current Topics
Updates on Current Topics |
 22
Net Interest Margin
•
Continued modest NIM expansion, due to favorable trends in deposit mix and costs,
as well as efforts to enhance loan spreads
•
Average loans and deposits relatively stable from the prior quarter
Noninterest Income
Noninterest Expense
•
Decline vs. 4Q10, despite 1Q11 seasonal uptick in employee benefits costs
Provision
•
Net charge-offs stable to modestly down vs. 4Q10
•
ALLL reduction likely to be similar to 4Q10 release, subject to normal
quarter-end evaluation 1Q 2011 Expectations
1
1.
Based upon quarter-to-date information as of the end of February
2011. Favorable Trends Overall with Cyclical Impact to Fee Income
•
Core fee income decline of an approximate low double digit percentage from 4Q10,
due to market-sensitive revenue, including:
Investment Banking down from record 4Q10, as 1Q revenue is typically seasonally
slower Mortgage Production decline from 4Q10, due to the impact of rising
rates on origination volume •
1Q11 quarter-to-date securities portfolio repositioning has generated gains
similar to recent quarters |
 23
Basel III Tier 1 Common
TARP Repayment
•
SunTrust’s TARP
repayment is currently
being evaluated as part
of the Comprehensive
Capital Plan Review
(CCPR)
•
The Fed has indicated it
expects its reviews to
be completed toward
the end of the month
•
SunTrust will re-
evaluate its TARP
repayment options after
completion of the CCPR
Basel III Tier 1 Common (Estimated)
Tier
1
Common
Ratio
Exceeds
2019
Basel
III
Standard
1
1.
2019 is the effective date for Basel III requirement. Includes the 4.5%
minimum standard plus the 2.5% conservation buffer; does not include a countercyclical buffer. |
  24
Summary
•
SunTrust has an attractive footprint and a diverse
business mix
•
We have reduced our risk profile and improved
core performance
•
Our strategic priorities are intended to drive further
improvements in our financial performance
•
SunTrust is well-positioned to manage through the
economic recovery and to capitalize upon our
opportunities
•
SunTrust has an attractive footprint and a diverse
business mix
•
We have reduced our risk profile and improved
core performance
•
Our strategic priorities are intended to drive further
improvements in our financial performance
•
SunTrust is well-positioned to manage through the
economic recovery and to capitalize upon our
opportunities |
 SunTrust Banks, Inc.
Citigroup Financial Services Conference
March 9, 2011
William H. Rogers, Jr.
President and Chief Operating Officer |
 26
Appendix |
 27
Reconciliation
of
Non-GAAP
Measures
–
PPNR
Note:
Adjusted
revenue
and
expenses
are
provided
as
the
removal
of
certain
items
that
are
material
and
potentially
non-recurring
is
useful
to
investors
and
management
in
comparing
institutions
and
in
evaluating
financial
trends.
($ in millions)
Reported PPNR
2009
2010
2010 vs. 2009
Net Interest Income, FTE
$4,589
$4,970
8.3%
Noninterest Income
3,710
3,729
0.5%
Total Revenue
8,299
8,699
4.8%
Noninterest Expense
6,562
5,911
-9.9%
Pre-provision Net Revenue
1,737
2,788
60.5%
Adjustments
Noninterest Income:
Securities Gains
98
191
VISA Gain
112
-
Stable River Gain
-
13
Fair Market Value - Trading
(24)
26
STI Debt Valuation - Trading
(153)
37
Auction Rate Securities - Trading
9
(5)
Fair Value Writedowns - Mortgage Production
(34)
(20)
LOCOM MSR Recovery
199
-
Total Noninterest Income Adjustments
207
242
Nointerest Expense:
Goodwill Impairment
751
-
AHG Writedown
46
16
Loss on Debt Extinguishment
39
71
FDIC Special Assessment
78
-
VISA Litigation Accrual
7
-
VISA Contract Termination
-
8
Total Noninterest Expense Adjustments
921
95
Adjusted PPNR
Net Interest Income, FTE
4,589
4,970
8.3%
Adjusted Noninterest Income
3,503
3,487
-0.5%
Adjusted Total Revenue
8,092
8,457
4.5%
Adjusted Noninterest Expense
5,641
5,816
3.1%
Adjusted Pre-provision Net Revenue
$2,451
$2,641
7.8% |
 28
Reconciliation
of
Non-GAAP
Measures
–
Expenses
1.
Adjusted expense is provided as the removal of certain items that are material and
potentially non-recurring is useful to investors and management in comparing institutions and in evaluating expense trends.
2.
Expense excluding adjustments and cyclical items is provided as it removes expenses
that are recurring in nature, but higher in a recessionary cycle, and is useful to investors and management in
assessing
the
impact
of
the
recession
on
non-interest
expenses
and
earnings.
It
also
facilitates
analysis
of
the
effectiveness
of
management
in
controlling
expense
growth.
($ in millions)
2006
2010
$MM
CAGR
Total Expenses
$4,867
$5,911
$1,044
5.0%
Adjustments
AHG Writedown
-
16
Loss on Debt Extinguishment
12
71
VISA Contract Termination
-
8
Total Adjustments
12
95
Expenses Excl. Adjustments
1
4,855
5,816
961
4.6%
Cyclical Items
Regulatory Assessments
23
265
Pension Expense
78
66
Credit Expenses:
Credit & Collection Services
102
279
Other Real Estate
0
300
Mortgage Reinsurance
-
26
Operating Losses
45
83
Total Cyclical Items
248
1,019
Expenses Excl. Adjustments & Cyclial Items
2
$4,607
$4,797
$190
1.0%
Contribution to Efficiency Ratio
Total Revenue, FTE
$8,217
$8,699
Credit Expenses
147
688
Regulatory Assessments
23
265
Credit Expenses / Total Revenue
1.8%
7.9%
Regulatory Assessments / Total Revenue
0.3%
3.0%
2010 vs. 2006 |