UNITED STATES
SECURITIES AND EXCHANGE COMMISSION
Washington, D.C. 20549
Form 10-K
(Mark One)
| |
|
|
| þ |
|
ANNUAL REPORT PURSUANT TO SECTION 13 OR 15(d) OF THE SECURITIES EXCHANGE ACT OF 1934 |
For the fiscal year ended December 31, 2010
OR
| |
|
|
| o |
|
TRANSITION REPORT PURSUANT TO SECTION 13 OR 15(d) OF THE SECURITIES EXCHANGE ACT OF 1934 |
For the transition period from to
Commission File Number 1-34495
Ladish Co., Inc.
( Exact name of registrant as specified in its charter )
| |
|
|
|
Wisconsin
(State of Incorporation)
|
|
31-1145953
(I.R.S. Employer Identification No.) |
| |
|
|
| 5481 S. Packard Avenue |
|
|
| Cudahy, Wisconsin
|
|
53110 |
| (Address of principal executive offices)
|
|
(Zip Code) |
Registrant’s telephone number, including area code: (414) 747-2611
Securities Registered Pursuant to Section 12(b) of the Act: None
Securities Registered Pursuant to Section 12(g) of the Act:
| |
|
|
|
| Title of each class
|
|
Name of each exchange on which registered |
|
|
|
|
| Common stock, $0.01 par value
|
|
Nasdaq |
Indicate by check mark if the registrant is a well-known seasoned issuer, as defined in Rule
405 of the Securities Act.
Yes o No þ
Indicate by check mark if the registrant is not required to file reports pursuant to Section 13 or
Section 15(d) of the Act.
Yes o No þ
Indicate by check mark whether the registrant (1) has filed all reports required to be filed by
Section 13 or 15(d) of the Securities Exchange Act of 1934 during the preceding 12 months (or for
such shorter period that the registrant was required to file such reports), and (2) has been
subject to such filing requirements for the past 90 days. Yes þ No o
Indicate by check mark whether the registrant has submitted electronically and posted on its
corporate Web site, if any, every Interactive Data File required to be submitted and posted
pursuant to Rule 405 of Regulation S-T (§232.405 of this chapter) during the preceding 12 months
(or for such shorter period that the registrant was required to submit and post such files). Yes
o No o
Indicate by check mark if disclosure of delinquent filers pursuant to Item 405 of Registration S-K
(§229.405 of this chapter) is not contained herein, and will not be contained, to the best
of registrant’s knowledge, in definitive proxy or information
statements incorporated by reference in Part III of this Form 10-K or
any amendment to this Form 10-K. þ
Indicate by check mark whether the registrant is a large accelerated filer, an accelerated filer, a
non-accelerated filer, or a smaller reporting company. See the definitions of “large accelerated
filer,” “accelerated filer” and “smaller reporting company” in Rule 12b-2 of the Exchange Act.
(Check one):
| |
|
|
|
|
|
|
|
| Large accelerated filer o
|
|
Accelerated filer þ
|
|
Non-accelerated filer o
|
|
Smaller reporting company o |
Indicate by check mark whether the registrant is a shell company (as defined in Rule 12b-2 of the Exchange Act).
Yes o No þ
The aggregate market value of voting stock held by non-affiliates of the Registrant was
$356,004,315 as of June 30, 2010.
15,707,552
(Number of Shares of common stock outstanding as of March 8, 2011)
DOCUMENTS INCORPORATED BY REFERENCE
None.
TABLE OF CONTENTS
PART 1
General
Ladish Co., Inc. (“Ladish” or the “Company”) engineers, produces and markets high-strength,
high-technology forged and cast metal components for a wide variety of load-bearing and
fatigue-resisting applications in the jet engine, aerospace and industrial markets. Approximately
85% of the Company’s 2010 revenues were derived from the sale of jet engine parts, missile
components, landing gear, helicopter rotors and other aerospace products. Approximately 33% of the
Company’s 2010 revenues were derived from sales, directly or through prime contractors, under
United States government contracts or under contracts with allies of the United States government,
primarily covering defense equipment. Although no comprehensive trade statistics are available,
based on its experience and knowledge of the industry, management believes that the Company is the
second largest supplier of forged and cast metal components to the domestic aerospace industry,
with an estimated 25% market share in the jet engine component field.
Products and Markets
The Company markets its products primarily to manufacturers of jet engines, commercial business and
defense aircraft, helicopters, satellites, heavy-duty off-road vehicles and industrial and marine
turbines. The principal markets served by the Company are jet engine, commercial aerospace
(defined by Ladish as satellite, rocket and aircraft components other than jet engines) and general
industrial products. The amount of revenue and the revenue as a percentage of total revenue by
market were as follows for the periods indicated:
| |
|
|
|
|
|
|
|
|
|
|
|
|
|
|
|
|
|
|
|
|
|
|
|
|
| |
|
Years Ended December 31, |
|
| |
|
2008 |
|
|
2009 |
|
|
2010 |
|
| |
|
(Dollars in millions) |
|
Jet Engine Components |
|
$ |
238 |
|
|
|
51 |
% |
|
$ |
193 |
|
|
|
55 |
% |
|
$ |
199 |
|
|
|
49 |
% |
Aerospace Components |
|
|
124 |
|
|
|
26 |
% |
|
|
114 |
|
|
|
33 |
% |
|
|
143 |
|
|
|
36 |
% |
General Industrial Components |
|
|
107 |
|
|
|
23 |
% |
|
|
43 |
|
|
|
12 |
% |
|
|
61 |
|
|
|
15 |
% |
|
|
|
|
|
|
|
|
|
|
|
|
|
|
|
|
|
|
|
Total |
|
$ |
469 |
|
|
|
100 |
% |
|
$ |
350 |
|
|
|
100 |
% |
|
$ |
403 |
|
|
|
100 |
% |
|
|
|
|
|
|
|
|
|
|
|
|
|
|
|
|
|
|
|
Manufacturing
Ladish offers one of the most complete range of forging, investment casting and precision machining
services in the world. The Company employs all major forging processes, including open and
closed-die hammer and press forgings, as well as ring-rolling, and also produces near-net shape
aerospace components through isothermal forging and hot-die forging techniques. Closed-die forging
involves hammering or pressing heated metal into the required shape and size by utilizing machined
impressions in specially prepared dies which exert three-dimensional control on the heated metal.
Open-die forging involves the hammering or pressing of metal into the required shape without such
three-dimensional control, and ring-rolling involves rotating heated metal rings through presses to
produce the desired shape. Investment casting involves the creation of precise wax molds which are
dipped, autoclaved and cast to create near-net components for the aerospace industry. The
Company’s precision machining services focus on the milling and turning of components for the
aerospace industry.
Much of the Company’s business is capital intensive, requiring large and sophisticated forging,
casting, machining and heating equipment and extensive facilities for inspection and testing of
components after formation. Ladish believes that it has the largest forging hammer, isothermal
press and ring-roll in the world at its plant in Cudahy, Wisconsin. Its largest counterblow
forging hammer has a capacity of
125,000 mkg (meter-kilograms), and its ring-rolling equipment can produce single-piece seamless
products that weigh up to 350,000 pounds with outside diameters as large as 28 feet and face
heights up to 10 feet. Ladish’s 4,500-ton, 10,000-ton and 12,500-ton isothermal presses can
produce forgings, in superalloys as well as titanium, that weigh up to 2,000 pounds. Ladish
qualified a new 12,500-ton isothermal press in 2010. Much of the domestic forging equipment has
been designed and built by Ladish. The Company also maintains such auxiliary facilities as
die-sinking, heat-treating and machining equipment and produces most of the precision dies
necessary for its forging operations. The Company considers such equipment to be in good operating
condition and adequate for the purposes for which it is being used.
2
Marketing and Sales
The product sales force, consisting primarily of sales engineers, is supported by the Company’s
metallurgical staff of engineers and technicians. These technically trained sales engineers,
organized along product line and customer groupings, work with customers on an ongoing basis to
monitor competitive trends and technological innovations. Additionally, sales engineers consult
with customers regarding potential projects and product development opportunities. During the past
few years, the Company has refocused its marketing efforts on the jet engine components market and
the commercial aerospace industry.
The Company is actively involved with key customers in joint cooperative research and development,
engineering, quality control, just-in-time inventory control and computerized process modeling
programs. The Company has entered into strategic contracts for a number of sole-sourced products
with each of Rolls-Royce, Sikorsky and Snecma for major programs. The Company believes that these
contracts are a reflection of the aerospace and industrial markets’ recognition of the Company’s
manufacturing and technical expertise.
The research and development of jet engine components is actively supported by the Company’s
Advanced Materials and Process Technology Group. The Company’s long-standing commitment to
research and development is evidenced by its industry-recognized materials and process
advancements. The experienced staff and fully equipped research facilities support Ladish sales
through customer-funded projects. Management believes that these research efforts position the
Company to participate in future growth in demand for critical advanced jet engine components.
Customers
The Company’s top three customers, Rolls-Royce, United Technologies and General Electric, accounted
for approximately 47%, 56% and 56% of the Company’s revenues in 2008, 2009 and 2010, respectively.
Net sales to Rolls-Royce were 23%, 26% and 26%, United Technologies 15%, 19% and 17% and General
Electric 9%, 11% and 13% of total Company net sales for the respective years. No other customer
accounted for ten percent or more of the Company’s net sales.
Caterpillar, Boeing, Techspace Aero, Goodrich and Volvo are also important customers of the
Company. Because of the relatively small number of customers for some of the Company’s principal
products, the Company’s largest customers exercise significant influence over the Company’s prices
and other terms of trade.
U.S. exports accounted for approximately 46%, 46% and 43% of total Company net sales in 2008, 2009
and 2010, respectively. U.S. exports to England constituted approximately 25%, 26% and 26%,
respectively in the above years, of total Company net sales.
3
A substantial portion of the Company’s revenues is derived from long-term, fixed price contracts
with major engine and aircraft manufacturers. These contracts are typically “requirements”
contracts under which the purchaser commits to purchase a given portion of its requirements of a
particular component from the Company, and provide the Company with the ability to adjust prices
based on raw material price fluctuation. Actual purchase quantities are typically not determined
until shortly before the year in which products are to be delivered. The Company attempts to
minimize its risk by entering into fixed-price contracts with its raw material suppliers.
Additionally, a portion of the Company’s revenue is directly or indirectly related to government
spending, particularly military and space program spending.
Research and Development
The Company maintains a research and development department which is engaged in applied research
and development work primarily relating to the Company’s forging operations. The Company works
closely with customers, universities and government technical agencies in developing advanced
forgings, materials and processes. The Company spent approximately $3.1 million, $2.7 million and
$3.3 million on applied research and development work during 2008, 2009 and 2010, respectively.
Customers reimbursed the Company for $1.3 million, $1.2 million and $1.7 million of the foregoing
research and development expenses in 2008, 2009 and 2010, respectively.
Patents and Trademarks
Although the Company owns patents covering certain of its processes, the Company does not consider
these patents to be of material importance to the Company’s business as a whole. The Company
considers certain other information that it owns to be trade secrets and the Company takes measures
to protect the confidentiality and control the disclosure and use of such information. The Company
believes that these safeguards adequately protect its proprietary rights and the Company vigorously
defends these rights.
The Company owns or has obtained licenses for various trademarks, trademark registrations, service
marks, service mark registrations, trade names, copyrights, copyright registrations, patent
applications, inventions, know-how, trade secrets, confidential information and any other
intellectual property that is necessary for the conduct of its business (collectively,
“Intellectual Property”). The Company is not aware of any existing or threatened patent
infringement claim (or of any facts that would reasonably be expected to result in any such claim)
or any other existing or threatened challenge by any third party that would significantly limit the
rights of the Company with respect to any such Intellectual Property or to the validity or scope of
any such Intellectual Property. The Company has no pending claim against a third party with
respect to the infringement by such third party of any such Intellectual Property that, if
determined adversely to the Company, would individually or in the aggregate have a material adverse
effect on the Company’s financial condition or results of operations. While the Company considers
all of its proprietary rights as a whole to be important, the Company does not consider any single
right to be essential to its operations as a whole.
Raw Materials
Raw materials used by the Company in its metal components include alloys of titanium, nickel,
steel, aluminum, tungsten and other high temperature alloys. The major portion of metal
requirements for forged products are purchased from major metal suppliers producing forging quality
material as needed to fill customer orders. The Company has two or more sources of supply for all
significant raw materials, with the exception of certain nickel-based powder alloys where the
Company is currently dependent upon a single source of supply.
4
The titanium and nickel-based superalloys used by the Company have a relatively high dollar value.
Accordingly, the Company recovers and recycles scrap materials such as machine turnings, forging
flash, solids and test pieces (“by-products’). The proceeds from the disposition of by-products
are taken as a reduction to the Company’s cost of goods and are not treated as a part of net sales.
The Company’s most significant raw materials consist of nickel and titanium alloys. Its principal
suppliers of nickel alloys include Carpenter Technology, Special Metals Corporation and Allegheny
Technologies, Inc. (“ATI”). Its principal suppliers of titanium alloys are Titanium Metals
Corporation of America (“Timet”), ATI and RTI International. The Company typically has fixed-price
contracts with its suppliers.
In addition, the Company, its customers and suppliers have undertaken active programs for supply
chain management to reduce overall lead times and the total cost of raw materials. In 2009, the
Company experienced a decline in raw material prices and saw lead times shorten as demand for
material eased due to the global economic downturn. In 2010, raw material prices stabilized and
began to increase as aerospace markets firmed. The Company attempts to protect against raw
material price escalation by passing those price increases directly to the Company’s customers.
Energy
The Company uses a considerable amount of energy in the processing of its forged and cast metal
components. The fluctuating prices for energy, both natural gas and electricity, impacted the
Company’s 2009 and 2010 results. Other than increased volume usage in 2010, there was not a
material variance between the two years. The Company expects natural gas to remain stable in 2011,
with expected increases in electrical costs. The Company attempts to ameliorate the impact of
these price swings by purchasing directly from producers and pre-ordering supplies for the future,
however, the level of price fluctuation and lack of availability are not within the control of the
Company.
Backlog
The average amount of time necessary to manufacture the Company’s products is five to six weeks
from the receipt of raw material. The timing of the placement and filling of specific orders may
significantly affect the Company’s backlog figures, which are subject to cancellation for a variety
of reasons. In addition, the Company typically only includes those contracts which will result in
shipments within the next 18 months when compiling backlog and does not include the out years of
long-term agreements. As a result, the Company’s backlog may not be indicative of actual results
or provide meaningful data for period-to-period comparisons. The Company’s backlog was
approximately $629 million, $504 million and $556 million as of December 31, 2008, 2009 and 2010,
respectively. The Company received $408 million, $229 million and $456 million of new orders in
2008, 2009 and 2010, respectively.
Competition
The sale of metal components is highly competitive. Certain of the Company’s competitors are
larger than the Company and have substantially greater capital resources. Although the Company is
the sole supplier on several sophisticated components required by prime contractors under a number
of governmental programs, many of the Company’s products could be replaced with other similar
products of its competitors. However, the significant investment in tooling, the time required and
the cost of obtaining the status of a “certified supplier” are barriers to entry. Competition is
based on quality (including advanced engineering and manufacturing capability), price and the
ability to meet delivery requirements.
5
Website Access to Company Reports
The Company’s annual report is available free of charge on the Company’s website at
www.ladishco.com as soon as reasonably practicable after such material is filed electronically with
the SEC. The Company’s other filings with the SEC; Form 10-K, Form 10-Q, Form 8-K and Form 4 are
readily available at www.sec.gov/edgar or www.secfiling.com. The Company’s Form 14 Proxy Statement
for the 2011 annual stockholders’ meeting is available on the Company’s website. The Company’s
Code of Conduct is available on the Company’s website and in printed form upon request. Also,
copies of the Company’s annual report will be made available, free of charge, upon written request.
Environmental, Health and Safety Matters
The Company’s operations are subject to many federal, state and local regulations relating to the
protection of the environment and to workplace health and safety. In particular, the Company’s
operations are subject to extensive federal, state and local laws and regulations governing waste
disposal, air and water emissions, the handling of hazardous substances, environmental protection,
remediation, workplace exposure and other matters. Management believes that the Company is
presently in substantial compliance with all such laws and does not currently anticipate that the
Company will be required to expend any substantial amounts in the foreseeable future in order to
meet current environmental, workplace health or safety requirements. However, additional costs and
liabilities may be incurred to comply with current and future requirements which could have a
material adverse effect on the Company’s results of operations or financial condition.
There are no known pending remedial actions or claims relating to environmental matters that are
expected to have a material effect on the Company’s financial position or results of operations.
All of the properties owned by the Company, however, are located in industrial areas and have a
history of heavy industrial use. These properties may potentially incur environmental liabilities
in the future that could have a material adverse effect on the Company’s financial condition or
results of operations. The Company was previously named a potentially responsible party at several
“Superfund” sites. The Company’s liability with respect to these sites has largely been resolved.
Although the Company does not believe that the amount for which it may be held liable for any
further administrative or wrap-up expense will exceed the amount it has reserved, no assurance can
be given that the amount for which the Company will be held responsible will not be significantly
greater than expected. In 2006, the Company agreed to participate in the environmental remediation
of a site near Houston, Texas. The Company’s allocated share is relatively small, less than 1%,
and its projected exposure for the site is estimated to be $0.16 million. The Company has an
accrual of $0.3 million for this site and any other environmental claims which may arise.
With respect to any past or future claim for any environmental, health or safety matter, the
Company evaluates every such claim from both a technical and legal perspective, using outside
consultants where necessary. The Company establishes a good faith estimate of its prospective risk
associated with said claim and, where material, establishes an accrual for the estimated value of
such claim.
6
Forward Looking Statements
Any statements contained herein that are not historical facts are forward-looking statements within
the meaning of the Private Securities Legislation Reform Act of 1995, and involve risks and
uncertainties. These forward-looking statements include expectations, beliefs, plans, objectives,
future financial performance, estimates, projections, goals and forecasts. Potential factors which
could cause the Company’s actual results of operations to differ materially from those in the
forward-looking statements include:
| |
|
|
|
|
| •
|
|
Market conditions and demand for the Company’s products
|
|
|
| •
|
|
Interest rates and capital costs
|
|
|
| •
|
|
Unstable governments and business conditions in emerging economies
|
|
|
| •
|
|
Health care costs |
|
|
| •
|
|
Legal, regulatory and environmental issues
|
|
|
| •
|
|
Competition |
|
|
| •
|
|
Technologies |
|
| •
|
|
Raw material and energy prices |
|
| •
|
|
Taxes |
Any forward-looking statement speaks only as of the date on which such statement is made. The
Company undertakes no obligation to update any forward-looking statement to reflect events or
circumstances after the date on which such statement is made.
Employees
As of December 31, 2010, domestically, the Company had approximately 1,250 employees, of whom 960
were engaged in manufacturing functions, 65 in executive and administrative functions, 180 in
technical functions, and 45 in sales and sales support. At such date, approximately 598 employees,
principally those engaged in manufacturing, were represented by labor organizations under
collective bargaining agreements. Internationally, the Company had approximately 460 employees in
Poland as of December 31, 2010, approximately two-thirds of which are represented by trade unions.
| |
|
|
|
|
|
|
| |
|
|
|
Number of Employees |
|
| |
|
|
|
Represented by |
|
| |
|
|
|
Collective |
|
| Union |
|
Expiration Date |
|
Bargaining Agreement |
|
International Association of
Machinists & Aerospace Workers, Local
1862
|
|
February 26, 2012
|
|
|
226 |
|
|
|
|
|
|
|
|
International Brotherhood of
Boilermakers, Iron Ship Builders,
Blacksmiths, Forgers & Helpers,
Subordinate Lodge 1509
|
|
October 1, 2012
|
|
|
178 |
|
|
|
|
|
|
|
|
International Federation of
Professional & Technical Engineers,
Technical Group, Local 92
|
|
August 19, 2012
|
|
|
97 |
|
|
|
|
|
|
|
|
International Association of Machinists
& Aerospace Workers, Die Sinkers, Local
140
|
|
March 26, 2012
|
|
|
53 |
|
|
|
|
|
|
|
|
Office & Professional Employees
International Union, Clerical Group,
Local 35
|
|
July 15, 2013
|
|
|
17 |
|
|
|
|
|
|
|
|
International Brotherhood of Electrical
Workers, Local 662
|
|
November 11, 2012
|
|
|
22 |
|
|
|
|
|
|
|
|
Service Employees International, Local 1
|
|
April 22, 2012
|
|
|
5 |
|
7
Executive Officers of the Company
| |
|
|
|
|
|
|
| Name |
|
Age |
|
|
Position |
Gary J. Vroman
|
|
|
51 |
|
|
President & CEO and Director |
Wayne E. Larsen
|
|
|
56 |
|
|
Vice President Law/Finance & Secretary and Director |
Lawrence C. Hammond
|
|
|
63 |
|
|
Vice President, Human Resources |
Randy B. Turner
|
|
|
61 |
|
|
President — Pacific Cast Technologies, Inc. (“PCT”) |
John Delaney
|
|
|
61 |
|
|
President — Stowe Machine Co., Inc. (“Stowe”) & Aerex LLC (“Aerex”) |
Robert C. Miller
|
|
|
60 |
|
|
President — Valley Machining, Inc. (“Valley”) |
Jozef Burdzy
|
|
|
59 |
|
|
President — Zaklad Kuznia Matrycowa Sp. z o.o. (“ZKM”) & Zaklad Obrobki i Procesow Specjalnych Sp. z o.o. (“ZOPS”) |
Shannon J. S. Ko
|
|
|
68 |
|
|
President — Chen-Tech Industries, Inc. (“Chen-Tech”) |
Cyclicality of the Aerospace and Jet Engine Industries
Substantially all of our revenues are derived from the aerospace and jet engine industries, which
are cyclical in nature and subject to changes based on general economic conditions, airline
profitability, passenger ridership and international relations. The duration and severity of
upturns and downturns in these industries are influenced by a variety of factors, including those
set forth herein. Accordingly, they cannot be predicted with any certainty. Historically, orders
for new commercial aircraft and related commercial aerospace components have been driven by the
operating profits or losses of commercial airlines. Purchases by customers in the military
aerospace sector are dependent upon defense budgets. Events adversely affecting the airline
industry, such as cyclical overcapacity and inability to maintain profitable fare structures, would
likely have a material adverse effect on our financial condition and results of operations.
Merger Between Ladish and ATI May Not Close
In November 2010, we entered into a merger agreement with Allegheny Technologies Incorporated
(“ATI”). Pursuant to the terms of the merger agreement, all of the common stock of Ladish would be
acquired by ATI for the per share consideration of $24.00 in cash and .4556 of an ATI share of
common stock. The closing of the merger is subject to a number of conditions and approvals. There
is no guarantee that the conditions will be met or the approvals obtained. Should the merger not
occur, there could be an impact upon the Ladish share price.
Reduction in Government Spending
Since 2002, approximately 25% to 40% of our annual revenues have been derived from the
government-sponsored aerospace industry, an industry that is dependent upon government budgets and,
in particular, the United States government budget. There can be no assurance that U.S. defense
and space budgets and the related demand for defense and space equipment will continue or that
sales of defense and space equipment to foreign governments will continue at present levels.
Competition
The sale of metal components for the aerospace, jet engine and industrial markets is highly
competitive. Many products we manufacture are readily interchangeable with the products
manufactured by our competitors. Many of our products are sold under long-term contracts which are
bid upon by several suppliers. Our principal competitor, Precision Castparts Corp. (“PCC”), is a
substantially larger business and has greater financial resources. In 2006, PCC purchased one of
our larger suppliers of nickel-based alloys, Special Metals Corporation.
8
Reliance on Major Customers
Our three largest customers accounted for approximately 47%, 56% and 56% of our revenues in 2008,
2009 and 2010, respectively. Because of the small number of customers for some of our principal
products, those customers exercise significant influence over our prices and other terms of trade.
The loss of any of our largest customers would have a material adverse effect on our financial
condition and results of operations.
Dependence on Key Personnel
We have been and continue to be dependent on certain key management personnel. Our ability to
maintain our competitive position will depend, in part, upon our ability to retain these key
managers and to continue to attract and retain highly qualified managerial, manufacturing and sales
and marketing personnel. There can be no assurance that the loss of key personnel would not have a
material adverse effect on our results of operations or that we will be able to recruit and retain
such personnel.
Product Liability Exposure
We produce many critical engine and structural parts for commercial and military aircraft and for
other specialty applications. As a result, we have an inherent risk of exposure to product
liability claims. We currently maintain product liability insurance, but there can be no assurance
that insurance coverage will continue to be available on terms acceptable to us or that such
coverage will be adequate for any liabilities that might be incurred.
Availability and Price of Raw Materials
The largest single component of our cost of goods sold is raw material costs. We manufacture
products in a wide variety of specialty metals and alloys, some of which can only be purchased from
a limited number of suppliers. We hold limited quantities of raw materials in inventory but, for
the principal part of our business, we seek to procure delivery of raw materials in quantities and
at times matching customers’ orders. We, along with other entities in the industry, have
experienced periods of increased delivery times for nickel-based and titanium alloys and certain
stainless steels, which account for a significant portion of our raw materials. Significant
scarcity of supply of raw materials used by us could have a material adverse effect on our results
of operations by affecting both the timing of delivery and the cost of purchasing such materials.
In addition, our largest competitor, PCC, has purchased one of our largest suppliers of
nickel-based alloys. Many of our products are sold pursuant to long-term agreements with our
customers, which currently provide us the right to pass through material cost increases. Any
inability to obtain such rights in future long-term agreements could have a material adverse effect
on our results of operations.
Labor Contracts
Approximately 48% of our domestic employees are represented by seven collective bargaining units.
Contracts were historically renegotiated every three years with each union. Six of the unions in
2006 and one union in 2007 entered into six-year agreements with the Company. While we do not
expect that work stoppages will arise in connection with the renewal of labor agreements expiring
in the foreseeable future, no assurance can be given that work stoppages will not occur. An
extended or widespread work stoppage could have a material adverse effect on our results of
operations.
9
Pension and Other Postretirement Benefit Obligations
Many of our employees are eligible to participate in various Company-sponsored pension plans. In
addition to pension benefits, we provide health care and life insurance benefits to our eligible
employees and retirees. The pension benefits have been and will continue to be funded through
contributions to pension trusts, while health care and life insurance benefits are paid as
incurred.
We have several domestic pension plans, all of which are underfunded. The aggregate actuarially
determined liability recorded for these pension plans on the balance sheet at December 31, 2010 was
approximately $65.5 million. The decline in the equity market in the United States in 2008 had a
negative impact upon the level of assets in the pension trust of the Company; a portion of that
decline was recovered in 2009 and 2010.
The actuarially determined liability recorded for postretirement health care and life insurance
benefits on the balance sheet at December 31, 2010 was approximately $33.7 million and will be paid
as incurred.
Compliance with Environmental and Other Government Regulations
Our operations are subject to extensive environmental, health and safety laws and regulations
promulgated by federal, state and local governments. Many of these laws and regulations provide
for substantial fines and criminal sanctions for violations. The nature of our business exposes us
to risks of liability due to the use and storage of materials that can cause contamination or
personal injury if released into the environment. In addition, environmental laws may have a
significant effect on the nature, scope and cost of cleanup of contamination at operating
facilities. It is difficult to predict the future development of such laws and regulations or
their impact on future earnings and operations, but we anticipate that these standards will
continue to require continued capital expenditures. There can be no assurance that we will not
incur material costs and liabilities in the future relating to environmental matters.
Risks Related to Significant Price Concessions to Our Customers and Increased Pressure to Reduce
Our Costs
We are subject to substantial competition in all of the markets we serve, and we expect this
competition to continue. As a result, we have made significant price concessions to our customers
in the aerospace and industrial markets in recent years and we expect customer pressure for price
concessions to continue. Maintenance of our profitability will depend, in part, on our ability to
sustain a cost structure that enables us to be cost-competitive. If we are unable to adjust our
cost relative to our pricing or if we are unable to continue to compete effectively, our business
will suffer.
Our Business is Affected by Federal Rules, Regulations and Orders Applicable to Government
Contractors
A number of our products are manufactured and sold under U.S. government contracts or subcontracts.
Violation of applicable government rules and regulations could result in civil liability, in
cancellation or suspension of existing contracts or in ineligibility for future contracts or
subcontracts funded in whole or in part with federal funds.
10
Risks Associated with International Operations
We purchase products from and supply products to businesses located outside of the United States.
In fiscal 2010, approximately 51% of our total sales were attributable to non-U.S. customers. A
number of risks inherent in international business could have a material adverse effect on our
future results of operations, including:
| • |
|
general economic and political uncertainties and potential for social unrest in
international markets; |
| • |
|
limitations on our ability to enforce legal rights and remedies; |
| • |
|
changes in trade policies; |
| • |
|
difficulties in obtaining export and import licenses; and |
| • |
|
the risk of government financed competition. |
Our Business Involves Risks Associated with Complex Manufacturing Processes
Our manufacturing processes depend on certain sophisticated and high-value equipment, such as some
of our forging presses for which there may be only limited or no production alternative.
Unexpected failures of this equipment may result in production delays, revenue loss and significant
repair costs. In addition, equipment failures could result in injuries to our employees.
Moreover, the competitive nature of our business requires that we continuously implement process
changes intended to achieve product improvements and manufacturing efficiencies. These process
changes may at times result in production delays, quality concerns and increased costs. Any
disruption of operations at our facilities due to equipment failures or process interruptions could
have a material adverse effect on our business.
Acquisitions
We expect that we will continue to make acquisitions of, investments in, and strategic alliances
with complementary businesses, products and technologies to enable us to add products and services
for our core customer base and for related markets, and to expand our business geographically. The
success of this acquisition strategy will depend on our ability to: identify suitable businesses
to buy; negotiate the purchase of those businesses on terms acceptable to us; complete the
acquisitions within our expected time frame; improve the results of operations of the businesses
that we buy and successfully integrate their operations into our own; and avoid or overcome any
concerns expressed by regulators.
We may fail to properly complete any or all of these steps. We may not be able to find appropriate
acquisition candidates, acquire those candidates that we do find, obtain necessary permits or
integrate acquired businesses effectively and profitably.
Some of our competitors are also seeking to acquire similar businesses, including competitors that
have greater financial resources than we do. Increased competition may reduce the number of
acquisition targets available to us and may lead to less favorable terms as part of any
acquisition, including higher purchase prices. If acquisition candidates are unavailable or too
costly, we may need to change our business strategy.
We also cannot be certain that we will have enough capital or be able to raise enough capital on
reasonable terms, if at all, to complete the purchases of the businesses that we want to buy. Our
credit facility limits our ability to make acquisitions. Our lender may object to certain
purchases or place conditions on them that would limit their benefit to us.
If we are unsuccessful in implementing our acquisition strategy for the reasons discussed above or
otherwise, our financial condition and results of operations could be materially adversely
affected.
|
|
|
| Item 1B. Unresolved Staff Comments |
The Company has no unresolved comments from the Commission staff.
11
The following table sets forth the location and size of the Company’s seven facilities:
| |
|
|
|
|
|
|
|
|
| |
|
Approximate Acreage |
|
|
Approximate Square Footage |
|
Forging — Cudahy, Wisconsin |
|
|
140.0 |
|
|
|
1,650,000 |
|
Stowe — Windsor, Connecticut |
|
|
8.2 |
|
|
|
40,000 |
|
PCT — Albany, Oregon |
|
|
14.0 |
|
|
|
149,000 |
|
Valley — Coon Valley, Wisconsin |
|
|
3.0 |
|
|
|
40,000 |
|
ZKM — Stalowa Wola, Poland |
|
|
70.0 |
|
|
|
820,000 |
|
Chen-Tech — Irvine, California |
|
|
2.0 |
|
|
|
55,000 |
|
Aerex — Windsor, Connecticut |
|
|
1.0 |
|
|
|
15,000 |
|
The above facilities, except for Chen-Tech and Aerex, are owned by the Company.
The Company believes that its facilities are well maintained, are suitable to support the Company’s
business and are adequate for the Company’s present and anticipated needs. While the rate of
utilization of the Company’s manufacturing equipment is not uniform, the Company estimates that its
facilities overall are currently operating at approximately 70% of capacity.
The principal executive offices of the Company are located at 5481 South Packard Avenue, Cudahy,
Wisconsin 53110. Its telephone number at such address is (414) 747-2611.
|
|
|
Item 3. Legal Proceedings |
The Company is involved in various stages of investigations relative to environmental protection
matters relating to various waste disposal sites. The potential costs related to such matters and
the possible impact thereof on future operations are uncertain due in part to uncertainty as to the
extent of the pollution, the complexity of laws and regulations and their interpretations, the
varying costs and effectiveness of alternative cleanup technologies and methods, and the
questionable level of the Company’s involvement. The Company has an accrual of $0.3 million at
December 31, 2010, included in other noncurrent liabilities on the consolidated balance sheets of
the Company, for potential losses related to these matters. The Company does not anticipate such
losses will have a material impact on the financial statements beyond the aforementioned
provisions.
From time to time the Company is involved in legal proceedings relating to claims arising out of
its operations in the normal course of business. Although the Company believes that there are no
material legal proceedings pending or threatened against the Company or any of its properties, the
Company has been named as a defendant in a number of asbestos cases in Mississippi, Illinois,
Wisconsin and California. As of December 31, 2010, the Company has been dismissed from the case in
California and has nine individual claims in Mississippi, two individual claims remaining in
Illinois and one individual claim in Wisconsin. The Company has never manufactured or processed
asbestos. The Company’s only exposure to asbestos involves products the Company purchased from
third parties. The Company has notified its insurance carriers of these claims and is vigorously
defending these actions. The Company has not made any provision in its financial statements for
the asbestos litigation.
The Company is participating in an investigation initiated by U.S. Customs & Border Protection
(“Customs”) into duty drawback claims filed on behalf of the Company by its former export agent.
The Company is cooperating with Customs in this investigation and has voluntarily suspended its
duty drawback claims. Based upon its internal investigation, the Company believes any errors or
omissions with respect to its filings were solely attributable to its former export agent. The
Company and Customs have tentatively agreed to an Offer in Compromise whereby both parties agree to
settle the matter for the amount of approximately $0.146 million and the repayment of approximately
$0.130 million of prior duty drawback claims. The Company has made adequate provisions in its
financial statements for this resolution.
12
The Company and each of its directors have been named as defendants in a lawsuit in Wisconsin State
Circuit Court and in a separate lawsuit in federal court in the eastern district of Wisconsin.
Each of these cases is brought by a stockholder of the Company alleging a breach of fiduciary duty
in connection with the proposed merger with ATI. Neither case seeks monetary damages. Rather,
each case requests equitable relief in enjoining the merger. The Company is defending these
actions and has alerted its insurer.
|
|
|
Item 4. Removed and Reserved |
PART II
|
|
|
Item 5. Market for the Registrant’s Common Equity, Related Stockholder Matters and Issuer
Purchases of Equity Securities |
The common stock of the Company, par value $0.01 per share, trades on the Nasdaq National Market
under the symbol “LDSH”.
The following table sets forth, for the fiscal periods indicated, the high and low closing prices
for each quarter of the years 2008, 2009 and 2010. At December 31, 2010 there were an estimated
2,500 beneficial holders of the Company’s common stock.
| |
|
|
|
|
|
|
|
|
|
|
|
|
|
|
|
|
|
|
|
|
|
|
|
|
| |
|
Year Ended |
|
|
Year Ended |
|
|
Year Ended |
|
| |
|
December 31, 2008 |
|
|
December 31, 2009 |
|
|
December 31, 2010 |
|
| |
|
High |
|
|
Low |
|
|
High |
|
|
Low |
|
|
High |
|
|
Low |
|
First quarter |
|
$ |
41.94 |
|
|
$ |
32.90 |
|
|
$ |
15.34 |
|
|
$ |
5.36 |
|
|
$ |
21.64 |
|
|
$ |
15.02 |
|
Second quarter |
|
$ |
37.35 |
|
|
$ |
20.59 |
|
|
$ |
15.04 |
|
|
$ |
7.28 |
|
|
$ |
28.40 |
|
|
$ |
20.39 |
|
Third quarter |
|
$ |
27.56 |
|
|
$ |
18.75 |
|
|
$ |
16.48 |
|
|
$ |
10.88 |
|
|
$ |
31.73 |
|
|
$ |
21.94 |
|
Fourth quarter |
|
$ |
19.74 |
|
|
$ |
11.47 |
|
|
$ |
16.03 |
|
|
$ |
11.79 |
|
|
$ |
50.39 |
|
|
$ |
29.33 |
|
The Company has not paid cash dividends and currently intends to retain all its earnings to
reduce debt and to finance its operations, its stock repurchase program and future growth. The
Company does not expect to pay dividends for the foreseeable future.
13
TOTAL SHAREHOLDER RETURN
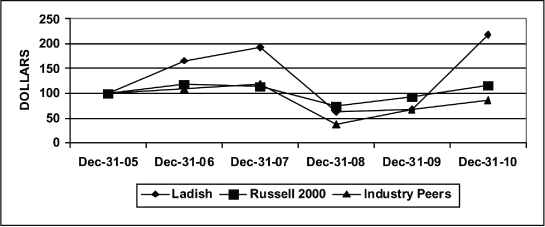
The following graph compares the period percentage change in Ladish’s cumulative total
shareholder return on its common stock, assuming dividend reinvestment, with the cumulative total
return of (i) the Russell 2000 Small Cap Index, and (ii) a peer group from the Company’s industry,
for the period of December 31, 2005 to December 31, 2010. The Company’s peer group is comprised of
PCC, ATI, Timet and SIFCO Industries, Inc.
| |
|
|
|
|
|
|
|
|
|
|
|
|
|
|
|
|
|
|
|
|
|
|
|
|
| |
|
Dec-31-05 |
|
|
Dec-31-06 |
|
|
Dec-31-07 |
|
|
Dec-31-08 |
|
|
Dec-31-09 |
|
|
Dec-31-10 |
|
Ladish |
|
|
22.35 |
|
|
|
37.08 |
|
|
|
43.19 |
|
|
|
13.85 |
|
|
|
15.05 |
|
|
|
48.62 |
|
Russell 2000 |
|
|
673.22 |
|
|
|
796.89 |
|
|
|
765.90 |
|
|
|
499.45 |
|
|
|
625.39 |
|
|
|
783.65 |
|
Industry Peers |
|
|
67.53 |
|
|
|
73.05 |
|
|
|
86.93 |
|
|
|
24.94 |
|
|
|
45.51 |
|
|
|
56.97 |
|
|
|
|
| Item 6. Selected Financial Data |
The selected financial data of the Company for each of the last five fiscal years are set forth
below.
The data below should be read in conjunction with the Financial Statements and the Notes thereto
and “Management’s Discussion and Analysis of Financial Condition and Results of Operations”
included elsewhere in this filing.
| |
|
|
|
|
|
|
|
|
|
|
|
|
|
|
|
|
|
|
|
|
| |
|
Year Ended December 31, |
|
| |
|
(Dollars in millions, except earnings per share) |
|
| INCOME STATEMENT DATA |
|
2006 |
|
|
2007 |
|
|
2008 |
|
|
2009 |
|
|
2010 |
|
Net sales |
|
$ |
369.290 |
|
|
$ |
424.631 |
|
|
$ |
469.466 |
|
|
$ |
349.832 |
|
|
$ |
403.132 |
|
Income from operations |
|
|
48.960 |
|
|
|
52.319 |
|
|
|
39.538 |
|
|
|
9.248 |
|
|
|
46.985 |
|
Interest expense |
|
|
3.548 |
|
|
|
2.528 |
|
|
|
1.971 |
|
|
|
5.050 |
|
|
|
5.613 |
|
Net income |
|
|
28.481 |
|
|
|
32.288 |
|
|
|
32.205 |
|
|
|
6.094 |
|
|
|
25.375 |
|
Basic earnings per share |
|
|
2.01 |
|
|
|
2.22 |
|
|
|
2.15 |
|
|
|
0.38 |
|
|
|
1.61 |
|
Diluted earnings per share |
|
|
2.00 |
|
|
|
2.22 |
|
|
|
2.15 |
|
|
|
0.38 |
|
|
|
1.61 |
|
Dividends paid |
|
|
— |
|
|
|
— |
|
|
|
— |
|
|
|
— |
|
|
|
— |
|
Shares used to compute earnings per share: |
|
|
|
|
|
|
|
|
|
|
|
|
|
|
|
|
|
|
|
|
Basic |
|
|
14,136,946 |
|
|
|
14,516,120 |
|
|
|
14,998,437 |
|
|
|
15,901,833 |
|
|
|
15,742,247 |
|
Diluted |
|
|
14,205,641 |
|
|
|
14,550,258 |
|
|
|
15,000,844 |
|
|
|
15,902,246 |
|
|
|
15,743,201 |
|
| |
|
|
|
|
|
|
|
|
|
|
|
|
|
|
|
|
|
|
|
|
| |
|
December 31, |
|
| BALANCE SHEET DATA |
|
2006 |
|
|
2007 |
|
|
2008 |
|
|
2009 |
|
|
2010 |
|
Total assets |
|
$ |
329.060 |
|
|
$ |
381.833 |
|
|
$ |
509.466 |
|
|
$ |
469.514 |
|
|
$ |
485.568 |
|
Net working capital |
|
|
123.764 |
|
|
|
130.855 |
|
|
|
138.910 |
|
|
|
137.515 |
|
|
|
149.685 |
|
Total debt |
|
|
54.100 |
|
|
|
53.500 |
|
|
|
118.900 |
|
|
|
90.000 |
|
|
|
84.285 |
|
Stockholders’ equity |
|
|
152.670 |
|
|
|
201.554 |
|
|
|
223.411 |
|
|
|
225.582 |
|
|
|
251.921 |
|
14
|
|
|
| Item 7. Management’s Discussion and Analysis of Financial Condition and Results of
Operations |
Executive Overview
2010 was a turnaround year for Ladish. After downsizing the business in 2009 to respond to the
global economic slowdown, we were able to respond rapidly to the recovery in most of our markets in
2010. The actions taken in 2009 to reduce the cost structure of Ladish in order to remain
profitable in 2009 provided added benefits in 2010. The lower cost structure and the increased
focus on productivity at all of Ladish’s operating units combined to yield significantly improved
results as we were able to produce $25.4 million of net income in 2010, a $19.3 million increase
over 2009 results.
The three principal markets, jet engine, aerospace and industrial, served by Ladish all improved in
2010. Ladish’s largest market, jet engine components, experienced the slowest recovery with only a
3% growth level due to continued delays on new aircraft programs such as the 787 and temporary
concerns regarding other programs like the A380. The aerospace components market reflected
significant growth with a 25% increase over 2009 levels. The demand for titanium helicopter
components for new build and for spare parts along with increased orders for airframe components
contributed to the $29 million increase. The market for industrial components, Ladish’s smallest,
had the largest percentage growth with a 42% improvement. The industrial components market
rebounded due to expanded demand from Caterpillar for mining and earthmoving equipment and the
beginning of a recovery at ZKM.
Ladish’s gross profits in 2010 of $65.7 million, or 16.3% of net sales, reflected a significant
advance from the $27.1 million, or 7.7% of net sales, of gross profits in 2009. The increase in
gross profits in total and as a percent of sales in 2010 was directly attributed to higher margins
on incremental sales as fixed costs were absorbed, a better product mix within each of Ladish’s
three primary markets and improved by-product credits of $13.1 million in 2010 in comparison to
$6.3 million in 2009.
The 15% overall growth in net sales contributed to the improved net income in 2010 as did our
ability to manage the cost structure at Ladish. The 15% increase in net sales came as total
employment was increased by 4%. The productivity of Ladish employees grew in 2010 and provided a
significant boost to net income growing from $6.1 million in 2009 to $25.4 million in 2010. Net
income in 2009 was also aided by a $2.9 million tax benefit as opposed to a $16.2 million tax
provision in 2010.
As Ladish experienced significant sales growth in 2010, we also managed our costs and working
capital which enabled Ladish to generate $25.0 million in operating cash flow after contributing
$10.5 million to the pension plans. From the operating cash flow we expended $14.6 million for
capital expenditures, used $5.7 million to retire the first tranche of Series B notes and spent
$3.3 million to repurchase Ladish common stock. We ended 2010 with Ladish’s cash balances
increased by $3.4 million to $23.3 million.
On November 16, 2010, Ladish and ATI entered into an Agreement and Plan of Merger (“Merger
Agreement”). Under the terms of the Merger Agreement, ATI will acquire all of the outstanding
common stock of Ladish for the consideration of $24.00 in cash and .4556 of a share of ATI common
stock for each share of Ladish common. The Merger Agreement contains a number of conditions which
must be met along with certain approvals which must be obtained, including the positive vote of a
majority of the shareholders of Ladish. As of the date of this filing, Ladish and ATI have
received the approval of the U.S. Federal Trade Commission of their filing under the
Hart-Scott-Rodino Act.
15
Results of Operations
Year Ended December 31, 2010 Compared to Year Ended December 31, 2009
Net sales in 2010 were $403.1 million, an increase of $53.3 million, or 15.2%, from the $349.8
million of net sales in 2009. The amount of net sales for each of the three principal markets
served by the Company were as follows for the periods indicated:
| |
|
|
|
|
|
|
|
|
|
|
|
|
|
|
|
|
| |
|
Years Ended December 31, |
|
| |
|
2009 |
|
|
2010 |
|
| |
|
(Dollars in millions) |
|
Jet Engine Components |
|
$ |
193 |
|
|
|
55 |
% |
|
$ |
199 |
|
|
|
49 |
% |
Aerospace Components |
|
|
114 |
|
|
|
33 |
% |
|
|
143 |
|
|
|
36 |
% |
General Industrial Components |
|
|
43 |
|
|
|
12 |
% |
|
|
61 |
|
|
|
15 |
% |
|
|
|
|
|
|
|
|
|
|
|
|
|
Total |
|
$ |
350 |
|
|
|
100 |
% |
|
$ |
403 |
|
|
|
100 |
% |
|
|
|
|
|
|
|
|
|
|
|
|
|
The Company’s $199 million of net sales of jet engine components in 2010 was relatively flat
in comparison to 2009 due to the delays associated with several major programs for new planes and
their accompanying engines. Net sales of aerospace components in 2010 demonstrated a significant
growth of 25% over 2009 due to the strength in the demand for helicopter components. Net sales of
industrial components in 2010 reflected a 42% increase over 2009 net sales as demand for large and
complex forgings to support the mining sector continued to improve in 2010. The Company’s increase
in 2010 net sales was largely attributed to increases in volume of product with relatively stable
pricing.
In 2010, the Company’s cost of sales was $337.5 million, or 83.7%, of net sales in comparison to
$322.7 million, or 92.3%, of net sales in 2009. Although cost of sales increased in 2010, as a
percentage of sales there was a significant decrease which was attributed to a better absorption of
fixed costs through higher net sales in 2010, improved productivity at the Company’s operating
units and higher by-product credits in 2010.
Gross profits in 2010 were $65.7 million, or 16.3% of net sales. This represented a $38.6 million
increase over 2009 when gross profits were $27.1 million, or 7.7% of net sales. The increase in
gross profits in total and as a percentage of net sales in 2010 was attributable to the growth in
net sales. Raw material and energy prices did not have a material impact upon the variation in
gross profits between the two periods. The Company recognized $13.1 million of by-product credits
in 2010 in comparison to $6.3 million of by-product credits in 2009. Any proceeds received from
by-product disposal are considered an offset to cost of sales.
The Company incurred $18.7 million of SG&A expenses in 2010, or 4.6% of net sales, in comparison to
$17.8 million of SG&A expenses in 2009, or 5.1% of net sales. SG&A expenses increased in 2010 in
part due to approximately $0.6 million of professional fees and expenses associated with the
prospective merger of the Company with ATI. SG&A expenses in 2009 were negatively impacted by a
one-time charge of $1.3 million related to employment reductions.
In 2010, the Company recognized $5.6 million of interest expense. This represents a $0.5 million
increase from the $5.1 million of interest expense in 2009. Although total debt at the Company
declined in 2010 as the Company began to amortize long-term notes, interest expense increased due
to the lack of capitalization of interest in 2010 in contrast to 2009. The following table
reflects the Company’s treatment of interest in 2009 and 2010:
| |
|
|
|
|
|
|
|
|
| (Dollars in Millions) |
|
2009 |
|
|
2010 |
|
Interest expensed |
|
$ |
5.050 |
|
|
$ |
5.613 |
|
Interest capitalized |
|
|
0.953 |
|
|
|
0.043 |
|
|
|
|
|
|
|
|
Total |
|
$ |
6.003 |
|
|
$ |
5.656 |
|
|
|
|
|
|
|
|
16
Pretax income in 2010 was $41.6 million, a $38.5 million improvement over the $3.1 million of
pretax income in 2009. The 2010 growth in pretax income is attributable to improved operating
efficiencies, higher sales which produced incremental increases in profits and higher by-product
credits.
In 2010, the Company recorded a tax provision of $16.2 million. This reflected an effective tax
rate of 39%. In contrast, the Company recorded a tax benefit of $2.9 million in 2009 when the
Company recognized a tax asset of $5.3 million.
Net Income in 2010 was $25.4 million, or $1.61 per share, on a fully diluted basis. The increase
from 2009 net income of $6.1 million was the result of $53.3 million of higher net sales, improved
operating efficiencies, cost controls, better absorption of fixed costs and higher by-product
credits.
Contract backlog at the Company was $556 million at December 31, 2010 in comparison to $504 million
at the end of 2009. The Company had $456 million of new orders in 2010 versus $229 million of new
orders in 2009. The growth in new orders in 2010 was attributable to an improvement in all three
of the Company’s major markets.
Year Ended December 31, 2009 Compared to Year Ended December 31, 2008
2009 net sales were $349.8 million, a 25.5% reduction from the $469.5 million of net sales in 2008.
The decline in sales was due to reduced demand in all of the Company’s markets. The Company’s
sales of components for jet engines, aerospace and general industrial declined 19%, 8% and 60%,
respectively, as customers reduced their build schedules and destocked their inventory. In 2009,
cost of sales at the Company increased to 92.3% of net sales in comparison to 87.4% in 2008. The
percentage increase in 2009 is directly linked to the reduction of sales with fewer sales to cover
the fixed costs at the Company.
SG&A expenses at the Company were $17.8 million in 2009, in contrast to $19.8 million of SG&A
expenses in 2008. Although the Company experienced a $2 million year-over-year reduction in SG&A,
as a percentage of sales SG&A increased to 5.1% in 2009 from 4.2% during the same period in 2008.
The increased rate of SG&A expense in 2009 is attributable to a combination of a one-time charge of
$1.3 million related to employment reductions and the reduced level of sales.
Interest expense at the Company in 2009 was $5.1 million, a $3.1 million increase from the level in
2008. The growth of interest expense in 2009 was related to a full year of interest on the Series
C long-term notes along with the reduction of capitalized interest in 2009. The Company was able
to capitalize $2.4 million of interest in 2008 while it only capitalized $1.0 million of interest
in 2009. Total interest incurred was $6.0 million and $4.4 million, respectively, in 2009 and
2008. The following table reflects the Company’s treatment of interest in 2008 and 2009:
| |
|
|
|
|
|
|
|
|
| (Dollars in millions) |
|
2008 |
|
|
2009 |
|
Interest expensed |
|
$ |
1.971 |
|
|
$ |
5.050 |
|
Interest capitalized |
|
|
2.418 |
|
|
|
0.953 |
|
|
|
|
|
|
|
|
Total |
|
$ |
4.389 |
|
|
$ |
6.003 |
|
|
|
|
|
|
|
|
The Company earned $3.1 million and $38.3 million of pretax income, respectively, in 2009 and 2008.
The decline in pretax income was due to decreased sales and increases in pension expense, interest
expense, depreciation expense, costs associated with downsizing operations and lower by-product
credits in 2009. These expense increases were somewhat offset by reductions in employment costs
related to lower employment levels in 2009.
In 2009, the Company reversed a valuation allowance and recognized a tax asset in the amount of
$5.3 million which resulted in a tax benefit of $2.9 million. The tax asset related to a credit
for state taxes
which the Company determined it was more likely than not that the Company would earn sufficient
income to fully utilize the credit in Wisconsin. In 2008, the Company had a tax provision of $5.9
million for an effective rate of 15.4%.
17
Net income for 2009 was $6.1 million or $0.38 per share on a fully diluted basis. The decline from
2008 net income of $32.2 million was a result of reduced sales combined with increases in pension
expense of $4.4 million, interest expense of $3.1 million, depreciation expense of $2.0 million,
employment reduction expenses of $3.0 million and reduced by-product credits of $7.9 million,
offset by the recognition of the state tax credit of $5.3 million.
The Company ended 2009 with a contract backlog of $504 million, down from the 2008 ending backlog
of $629 million. In 2009, the Company booked $229 million of new orders in contrast to $408
million of new orders in 2008. The decline in new orders was related to the global slowdown in the
aerospace market associated with reduced passenger miles in 2009.
Liquidity and Capital Resources
The Company’s cash position as of December 31, 2010 is $3.4 million more than its position at
December 31, 2009. The 2010 increase in cash is due to increased net sales and receipts partially
offset by increased pension contributions along with growth in working capital. Cash flow from
operations in 2010 was $38.2 million less than cash flow from operations in 2009 primarily due to
working capital growth as the Company increased inventories by $8 million and receivables by $23
million which reflects the growth in net sales in 2010, partially offset by a $3.7 million increase
in accounts payable.
On May 16, 2006, the Company sold $40 million of Series B Notes in a private placement to certain
institutional investors. The Series B Notes are unsecured and bear interest at a rate of 6.14% per
annum with interest being paid semiannually. The Series B Notes have a ten-year duration with the
principal amortizing equally over the duration after the fourth year. The first amortization
payment of $5.7 million was made on May 17, 2010.
On September 2, 2008, the Company sold $50 million of Series C Notes in a private placement to
certain institutional investors. The Series C Notes are unsecured and bear interest at a rate of
6.41% per annum with interest being paid semiannually. The Series C Notes have a seven-year
duration with the principal amortizing equally over the duration after the third year.
The Company’s Series B and Series C Notes contain financial covenants which (a) limit the
incurrence of certain additional debt; (b) require a certain level of consolidated adjusted net
worth; (c) require a minimum fixed charges coverage ratio; and (d) require a limited amount of
funded debt to consolidated cash flow. The covenant on incurrence of additional debt limits funded
debt to 60% of total capitalization. At December 31, 2010, funded debt at Ladish was at 23% of
total capitalization. This covenant also limits priority debt to 20% of adjusted net worth.
Ladish had no priority debt at December 31, 2010. The covenant on adjusted net worth requires a
minimum of $119.2 million. At December 31, 2010, Ladish had $286.2 million of adjusted net worth.
The covenant on fixed charges coverage ratio requires that consolidated cash flow to fixed charges
be a minimum of 2.00. The Company’s fixed charges coverage ratio at December 31, 2010 was 11.33.
The final covenant on funded debt to consolidated cash flow allows for a maximum level of 4.00. At
December 31, 2010, the Company’s actual level was 0.96. The Note Agreement for the Series B and
Series C Notes also contains customary representations and warranties and events of default.
At December 31, 2010, the Company was in compliance with all covenants in the Series B and Series C
Notes and the Facility.
18
The Company and a syndicate of lenders entered into a revolving credit facility (the “Facility”),
which was most recently renewed on April 8, 2010. The Facility consists of a $35 million unsecured
revolving line of credit which bears interest at a rate of LIBOR plus 2.00% or at a base rate. At
December 31, 2010, there were no borrowings under the Facility and $35 million of credit was
available pursuant to the terms of the Facility. The Facility has a maturity date of April 7,
2011.
The Company and the syndicate of lenders participating in the Facility entered into Amendment No. 2
to the Facility. This amendment, effective as of April 8, 2010, modified the covenant on minimum
EBITDA by deleting that covenant and substituting in its place a covenant on the ratio of net debt
to EBITDA. The covenant requires a maximum ratio of net debt to EBITDA to be no more than 3.50:1.
As of December 31, 2010, the Company’s ratio was 0.96:1. The Facility also contains a covenant
that requires a minimum fixed charge coverage ratio of 1.7x. As of December 31, 2010, the Company
had a fixed charge coverage ratio of 4.71x.
During 2010, the Company applied $14.6 million of cash toward capital expenditures. These
expenditures were funded by cash from operations.
During the years ending December 31, 2009 and 2010, the Company received $0.015 million and $0.047
million, respectively, from the exercise of employee stock options.
Given the Company’s ability to pass along raw material price increases to its customers,
inflation has not had a material effect upon the Company during the period covered by this report.
Given the rising demand for the products manufactured by the Company, and the prospects for
increases in raw material costs and possible energy cost escalation, the Company cannot determine
at this time if there will be any significant impact from inflation in the foreseeable future.
Off Balance Sheet Arrangements
The Company has no off balance sheet arrangements.
Contractual Obligations Table
(Dollars in Millions)
| |
|
|
|
|
|
|
|
|
|
|
|
|
|
|
|
|
| |
|
Less Than |
|
|
|
|
|
|
|
|
|
|
More Than |
|
| |
|
1 Year |
|
|
1-3 Years |
|
|
3-5 Years |
|
|
5 Years |
|
Senior Notes (1) |
|
$ |
15.714 |
|
|
$ |
31.429 |
|
|
$ |
31.429 |
|
|
$ |
5.714 |
|
Interest on Senior Notes |
|
|
5.135 |
|
|
|
7.294 |
|
|
|
3.326 |
|
|
|
.175 |
|
Bank Facility |
|
|
— |
|
|
|
— |
|
|
|
— |
|
|
|
— |
|
Operating Leases |
|
|
.921 |
|
|
|
1.505 |
|
|
|
1.150 |
|
|
|
1.344 |
|
Purchase Obligations (2) |
|
|
63.991 |
|
|
|
21.427 |
|
|
|
— |
|
|
|
— |
|
Other Long-Term Obligations: |
|
|
|
|
|
|
|
|
|
|
|
|
|
|
|
|
Pensions (3) |
|
|
13.251 |
|
|
|
28.860 |
|
|
|
— |
|
|
|
— |
|
Postretirement Benefits (4) |
|
|
3.474 |
|
|
|
6.549 |
|
|
|
6.023 |
|
|
|
12.428 |
|
| |
|
|
| (1) |
|
The Company expects to fund the payment of long-term debt through the
use of cash on hand, cash generated from operations, the reduction of working capital
and, if necessary, through access to the Facility. |
| |
| (2) |
|
The purchase obligations relate primarily to raw material purchase orders
necessary to fulfill the Company’s production backlog for the Company’s products
along with commitments for energy supplies also necessary to fulfill the Company’s
production backlog. There are no net settlement provisions under any of these
purchase orders nor is there any market for the underlying materials. |
| |
| (3) |
|
The Company’s estimated cash pension contribution is based upon the
calculation of the Company’s independent actuary for 2011. There are no estimates
beyond 2013. |
| |
| (4) |
|
The Company’s cash expenditures for Postretirement Benefits have only been
projected out through the year 2020. |
19
Critical Accounting Policies
Deferred Income Taxes
Deferred income taxes are accounted for under the asset and liability method whereby deferred tax
assets and liabilities are recognized for the future tax consequences attributable to differences
between the financial statement carrying amounts of existing assets and liabilities and their
respective tax bases. Deferred tax assets and liabilities are measured using enacted tax rates.
Deferred income tax provisions or benefits are based on the change in the deferred tax assets and
liabilities from period to period.
Pensions
The Company has domestic noncontributory defined benefit pension plans (“Plans”) covering a number
of its employees. The Company contributed $3.428 million and $10.478 million, respectively, to the
Plans in 2009 and 2010. The Company intends to contribute $13.3 million, $15.4 million and $13.4
million to the Plans in 2011, 2012 and 2013, respectively. The Company plans on funding those
contributions from cash on hand, cash generated from operations, working capital reductions,
treasury stock contributions and, if necessary, from the Facility. No estimates have been made for
payments into the Plans beyond 2013.
The Plans’ assets are held in a trust and are primarily invested in U.S. Government securities,
investment grade corporate bonds and marketable common stocks. The key assumptions the Company
considers with respect to the assets in the Plans and funding the liabilities associated with the
Plans are the discount rate, the long-term rate of return on Plans’ assets, the projected rate of
increase in compensation levels and the actuarial estimate of mortality of participants in the
Plans. The most sensitive assumption is the discount rate. For funding purposes, the Company’s
independent actuaries assumed an annual long-term rate of return on the Plans’ assets of 8.05% and
8.47% for 2009 and 2010, respectively. For the ten-year period ending December 31, 2010, the
Company experienced an annual rate of return on the Plans’ assets of 4.92%. The Company’s annual
measurement date is December 31.
The Company used a rate of 4.55% for its discount rate assumption for 2010, a 12% reduction from
the 5.16% rate used for 2009. An increase in the discount rate results in a decrease in the
accumulated benefit obligation at the measurement date which may also result in a decrease in the
additional minimum pension liability included as a credit to accumulated other comprehensive
income. Such an increase also results in an actuarial gain which is amortized to pension expense
in accordance with FASB ASC 715-30. A decrease in the discount rate will have the opposite effect
in the pension liability and pension expense. The Company bases its discount rate on long maturity
AA rated corporate debt securities. The Company cannot predict whether these interest rates will
increase or decrease in future years.
The Company cannot predict the level of interest rates in the future and correspondingly cannot
predict the future discount rate which will be applied to determine the Company’s projected benefit
obligation. As demonstrated in the chart below, relatively small movements in the discount rate,
up or down, can have a significant impact on the Company’s projected benefit obligation under the
Plans.
| |
|
|
|
|
| Projected Plan Benefit Obligation as of December 31, 2010 |
|
| (Dollars in Millions) |
|
At 4.30% discount rate |
|
$ |
233.557 |
|
At 4.55% discount rate |
|
$ |
227.930 |
|
At 4.80% discount rate |
|
$ |
222.542 |
|
20
Nor can the Company predict with any certainty what the actual rate of return will be for the
Plans’ assets. As demonstrated in the chart below, a modest change in the presumed rate of return
on the Plans’ assets will have a material impact upon the actual net periodic cost for the Plans.
| |
|
|
|
|
| Net Periodic Cost for Year Ending December 31, 2011 |
|
| (Dollars in Millions) |
|
8.22% expected return |
|
$ |
9.247 |
|
8.47% expected return |
|
$ |
8.873 |
|
8.72% expected return |
|
$ |
8.499 |
|
Fair Value Measurement of Pension Assets
FASB ASC 820-10, Fair Value Measurements and Disclosures, establishes a framework and provides
guidance on measuring the fair value of assets in a pension plan and how an employer should
disclose the same. The framework establishes a fair value hierarchy that prioritizes the inputs to
the valuation techniques used to measure fair value. The three levels of fair value hierarchy are
described as follows:
| |
Level 1 |
|
Quoted prices in active markets for identical assets or liabilities. |
| |
| |
Level 2 |
|
Observable inputs other than Level 1 prices, such as quoted prices
for similar assets or liabilities; quoted prices in markets that
are not active; or other inputs that are observable or can be
corroborated by observable market data for substantially the full
term of the assets or liabilities. |
| |
| |
Level 3 |
|
Unobservable inputs that are supported by little or no market
activity and that are significant to the fair value of the assets
or liabilities. |
The following table sets forth by level (dollars in millions), within the fair value hierarchy, the
Plans’ assets at fair value as of December 31, 2010:
| |
|
|
|
|
|
|
|
|
|
|
|
|
|
|
|
|
| |
|
Quoted |
|
|
Significant |
|
|
|
|
|
|
|
| |
|
Prices in |
|
|
Other |
|
|
Significant |
|
|
|
|
| Fair Values at |
|
Active |
|
|
Observable |
|
|
Unobservable |
|
|
|
|
| December 31, 2010 |
|
Markets |
|
|
Inputs |
|
|
Inputs |
|
|
|
|
|
|
Level 1 |
|
|
Level 2 |
|
|
Level 3 |
|
|
Total |
|
Pension Plan Assets |
|
|
|
|
|
|
|
|
|
|
|
|
|
|
|
|
Money Market Accounts |
|
$ |
2.976 |
|
|
$ |
— |
|
|
$ |
— |
|
|
$ |
2.976 |
|
US Government Issues |
|
|
26.506 |
|
|
|
10.991 |
|
|
|
— |
|
|
|
37.497 |
|
Corporate Issues |
|
|
— |
|
|
|
27.508 |
|
|
|
— |
|
|
|
27.508 |
|
Foreign Issues |
|
|
— |
|
|
|
7.488 |
|
|
|
— |
|
|
|
7.488 |
|
Municipal Issues |
|
|
— |
|
|
|
.771 |
|
|
|
— |
|
|
|
.771 |
|
Domestic Common Stocks |
|
|
79.354 |
|
|
|
— |
|
|
|
— |
|
|
|
79.354 |
|
Foreign Stocks |
|
|
1.168 |
|
|
|
— |
|
|
|
— |
|
|
|
1.168 |
|
Mutual Funds |
|
|
5.658 |
|
|
|
— |
|
|
|
— |
|
|
|
5.658 |
|
|
|
|
|
|
|
|
|
|
|
|
|
|
Total |
|
$ |
115.662 |
|
|
$ |
46.758 |
|
|
$ |
— |
|
|
$ |
162.420 |
|
|
|
|
|
|
|
|
|
|
|
|
|
|
Long-Lived Assets
The Company monitors the recoverability of the carrying value of its long-lived assets. An
impairment charge is recognized when an indicator of impairment occurs and the expected net
undiscounted future cash flows from an asset’s use (including any proceeds from disposition) are
less than the asset’s carrying value and the asset’s carrying value exceeds its fair value. Assets
to be disposed of by sale are stated at the lower of their fair values or carrying amounts and
depreciation or amortization is no longer recognized.
21
Goodwill and Other Intangible Assets
Goodwill represents the cost of acquired net assets in excess of their fair market values.
Goodwill and other intangible assets with indefinite useful lives are not amortized but are tested
for impairment at least annually in accordance with the provisions of FASB ASC 350-20, Intangibles
— Goodwill and Other. Intangible assets with estimable useful lives are amortized over their
respective estimated useful lives and also reviewed at least annually for impairment.
A two-step impairment test is required to identify potential goodwill impairment and measure the
amount of the goodwill impairment loss to be recognized. In the first step, the fair value of each
reporting unit is compared to its carrying value to determine if the goodwill is impaired. If the
fair value of the reporting unit exceeds the carrying value of the net assets assigned to that
unit, then goodwill is not impaired and the second step is not required. If the carrying value of
the net assets assigned to the reporting unit exceeds its fair value, then the second step is
performed in order to determine the implied fair value of the reporting unit’s goodwill and an
impairment loss is recorded for an amount equal to the difference between the implied fair value
and the carrying value of the goodwill.
For the purpose of goodwill analysis, the Company has only one reporting unit. Goodwill of $37.6
million represents the excess of the purchase price over the fair value of identifiable tangible
and intangible net assets relating to business acquisitions. Goodwill increased significantly in
2008 due to the acquisitions of Aerex and Chen-Tech. It is an asset with an indefinite life and
therefore is not amortized to expense, but is subject to annual impairment testing. The Company
tests the goodwill for impairment at least annually by fair value impairment testing. The
Company’s assessment of fair value used in the annual impairment testing takes into account a
number of factors including EBITDA and revenue multiples of transactions in the Company’s industry
as well as fair market value multiples of transactions of similarly situated enterprises. No
impairments were recognized in the annual impairment tests conducted as of September 30, 2008, 2009
and 2010, respectively. Should goodwill become impaired in the future, the amount of impairment
will be charged to SG&A expense. The Company has $19.1 million of amortizable customer
relationships included in other intangible assets that are being amortized over 50 years with
annual amortization of $0.4 million.
The control premium that a third party would be willing to pay to obtain a controlling interest in
the Company was considered when determining fair value. Management considered recent transactions
with comparable companies in the industry, and possible synergies to a market participant. The
Company also considered the valuation ATI was proposing for the Company in a merged transaction.
Management concluded there was a reasonable basis for the excess of estimated fair value of the
Company over its market capitalization.
New Accounting Pronouncements
In January 2010, the FASB issued Accounting Standards Update (“ASU”) 2010-06, Fair Value
Measurements and Disclosures — Improving Disclosures about Fair Value Measurements, (“ASU
2010-06”), that amends Accounting Standards Codification (“ASC”) Subtopic 820-10, Fair Value
Measurements and Disclosures — Overall, and requires reporting entities to disclose (1) the amount
of significant transfers in and out of Level 1 and Level 2 fair value measurements and describe the
reasons for the transfers, and (2) separate information about purchases, sales, issuance and
settlements in the reconciliation of fair value measurements using significant unobservable inputs
(Level 3). ASU 2010-06 also requires reporting entities to provide fair value measurement
disclosures for each class of assets and liabilities and disclose the inputs and valuation
techniques for fair value measurements that fall within Levels 2 and 3 of the fair value hierarchy.
These disclosures and clarification are effective for interim and annual reporting periods
beginning after December 15, 2009, except for the disclosures about purchases, sales, issuance, and
settlements in the roll forward of activity in Level 3 fair value
measurements. Those disclosures are effective for fiscal years beginning after December 15, 2010
and for interim periods within those fiscal years. The Company adopted the provisions of ASU
2010-06 and the provisions of ASU 2010-06 did not have a material impact on the Company’s
consolidated financial statements.
22
In February 2010, the FASB issued ASU 2010-09, Subsequent Events — Amendments to Certain
Recognition and Disclosure Requirements, (“ASU 2010-09”), that amends ASC Subtopic 855-10,
Subsequent Events — Overall (“ASC 855-10”). ASU 2010-09 requires an SEC filer to evaluate
subsequent events through the date that the financial statements are issued but removed the
requirement to disclose this date in the notes to the entity’s financial statements. The
amendments are effective upon issuance of the final update and accordingly, the Company has adopted
the provisions of ASU 2010-09. The adoption of these provisions did not have a material impact on
the Company’s consolidated financial statements.
In December 2010, the FASB issued ASU 2010-28, Intangibles — Goodwill and Other — When to Perform
Step 2 of the Goodwill Impairment test for Reporting Units with Zero or Negative Carrying Amounts,
(“ASU 2010-28”), that amends ASC Subtopic 350-20, Intangibles — Goodwill and Other, and requires
entities with reporting units that have carrying amounts that are zero or negative to assess
whether it is more likely than not that the reporting units’ goodwill is impaired. In considering
whether it is more likely than not that goodwill impairment exists, the entities shall evaluate
whether there are adverse qualitative factors. If the entity determines that it is more likely than
not that the goodwill of one or more of its reporting units is impaired, the entity should perform
Step 2 of the goodwill impairment test for those reporting units. ASU 2010-08 is effective for
fiscal years, and interim periods within those fiscal years, beginning after December 15, 2010.
Early adoption is not permitted. The adoption of these provisions is not expected to have a
material impact on the Company’s consolidated financial statements.
In December 2010, the FASB issued ASU 2010-29, Business Combinations — Disclosure of Supplementary
Pro Forma Information for Business Combinations, (“ASU 2010-29”), that amends ASC Subtopic 805-50,
Business Combinations — Disclosures, and requires public entities that are required to present
comparative financial statements to disclose revenue and earnings of the combined entity as though
the business combination that occurred during the current year had occurred as of the beginning of
the comparable prior annual reporting period only. The amendment also requires public entities to
include a description of the nature and amount of material, nonrecurring pro forma adjustments
directly attributable to the business combination included in the reported pro forma revenue and
earnings. The Company adopted the provisions of ASU 2010-29. The adoption of these provisions did
not have a material impact on the Company’s consolidated financial statements.
|
|
|
| Item 7A. Quantitative and Qualitative Disclosures about Market Risk |
The Company believes that its exposure to market risk related to changes in foreign currency
exchange rates and trade accounts receivable is immaterial.
|
|
|
| Item 8. Financial Statements and Supplementary Data |
The response to Item 8. Financial Statements and Supplementary Data incorporates by reference the
information listed in the consolidated financial statements and accompanying schedules beginning on
page F-1.
|
|
|
| Item 9. Changes in and Disagreements with Accountants on Accounting and Financial
Disclosure |
None.
23
|
|
|
| Item 9A. Controls and Procedures |
Evaluation of Disclosure Controls and Procedures
The disclosure controls and procedures of the Company are designed to ensure that information
required to be disclosed by the Company in the reports that it files or submits under the Exchange
Act is recorded, processed, summarized and reported, within the time periods specified in the
Securities and Exchange Commission rules and forms. Disclosure controls and procedures include,
without limitation, controls and procedures designed to ensure that information required to be
disclosed by the Company is accumulated and communicated to the Company’s management, including its
principal executive and principal financial officers to allow timely decisions regarding
disclosure.
Under the direction of the principal executive officer and the principal financial officer, the
Company has evaluated the effectiveness of its disclosure controls and procedures (as defined in
Exchange Act Rules 13a-15(e) and 15d-15(e)) as of December 31, 2010. Based on that evaluation, the
chief executive officer and the chief financial officer have concluded that the Company’s
disclosure controls and procedures were effective.
There were no significant changes in the Company’s internal controls or in other factors that could
significantly affect these controls subsequent to the date of management’s evaluation, including
any corrective actions with regard to significant deficiencies and material weaknesses during the
fourth quarter of 2010 or at any other time during 2010.
Management’s Annual Report on Internal Control over Financial Reporting
The Company’s management is responsible for establishing and maintaining adequate internal controls
over the financial reporting of the Company. The Company’s management, under the supervision and
with the participation of the Company’s principal executive officer and principal financial
officer, has evaluated the effectiveness of the Company’s internal controls over financial
reporting based upon the framework in Internal Control — Integrated Framework issued by the
Committee of Sponsoring Organizations of the Treadway Commission. Based on that assessment, as of
December 31, 2010, management concluded that the Company’s internal controls over financial
reporting are operating effectively. Grant Thornton LLP, an independent registered public
accounting firm, has issued an attestation report on the Company’s internal control over financial
reporting, which is included herein.
|
|
|
| Item 9B. Other Information |
None.
24
Report of Independent Registered Public Accounting Firm
Board of Directors and Stockholders
Ladish Co., Inc.
We have audited Ladish Co., Inc. (a Wisconsin Corporation) and subsidiaries’ internal control over
financial reporting as of December 31, 2010, based on criteria established in Internal
Control-Integrated Framework issued by the Committee of Sponsoring Organizations of the Treadway
Commission (COSO). Ladish Co., Inc. and subsidiaries’ management is responsible for maintaining
effective internal control over financial reporting and for its assessment of the effectiveness of
internal control over financial reporting, included in the accompanying Management’s Annual Report
on Internal Control Over Financial Reporting. Our responsibility is to express an opinion on Ladish
Co., Inc. and subsidiaries’ internal control over financial reporting based on our audit.
We conducted our audit in accordance with the standards of the Public Company Accounting Oversight
Board (United States). Those standards require that we plan and perform the audit to obtain
reasonable assurance about whether effective internal control over financial reporting was
maintained in all material respects. Our audit included obtaining an understanding of internal
control over financial reporting, assessing the risk that a material weakness exists, testing and
evaluating the design and operating effectiveness of internal control based on the assessed risk,
and performing such other procedures as we considered necessary in the circumstances. We believe
that our audit provides a reasonable basis for our opinion.
A company’s internal control over financial reporting is a process designed to provide reasonable
assurance regarding the reliability of financial reporting and the preparation of financial
statements for external purposes in accordance with generally accepted accounting principles. A
company’s internal control over financial reporting includes those policies and procedures that (1)
pertain to the maintenance of records that, in reasonable detail, accurately and fairly reflect the
transactions and dispositions of the assets of the company; (2) provide reasonable assurance that
transactions are recorded as necessary to permit preparation of financial statements in accordance
with generally accepted accounting principles, and that receipts and expenditures of the company
are being made only in accordance with authorizations of management and directors of the company;
and (3) provide reasonable assurance regarding prevention or timely detection of unauthorized
acquisition, use, or disposition of the company’s assets that could have a material effect on the
financial statements.
Because of its inherent limitations, internal control over financial reporting may not prevent or
detect misstatements. Also, projections of any evaluation of effectiveness to future periods are
subject to the risk that controls may become inadequate because of changes in conditions, or that
the degree of compliance with the policies or procedures may deteriorate.
In our opinion, Ladish Co., Inc. and subsidiaries maintained, in all material respects, effective
internal control over financial reporting as of December 31, 2010, based on criteria established in
Internal Control-Integrated Framework issued by COSO.
25
We also have audited, in accordance with the standards of the Public Company Accounting Oversight
Board (United States), the consolidated balance sheets of Ladish Co., Inc. and subsidiaries as of
December 31, 2010 and 2009, and the related statements of operations, stockholders’ equity, and
cash flows for each of the three years in the period ended December 31, 2010 and our report dated
March 8, 2011 expressed an unqualified opinion thereon.
/s/ Grant Thornton LLP
GRANT THORNTON LLP
Chicago, Illinois
March 8, 2011
26
PART III
|
|
|
| Item 10. Directors and Executive Officers of the Registrant |
The list of Executive Officers in Part I, Item 1. Business, paragraph captioned “Executive Officers
of the Registrant” is incorporated by reference. The list of Directors of the Company is as
follows:
| |
|
|
|
|
| Name |
|
Age |
|
Lawrence W. Bianchi |
|
|
69 |
|
James C. Hill |
|
|
62 |
|
Leon A. Kranz |
|
|
71 |
|
Wayne E. Larsen |
|
|
56 |
|
J. Robert Peart |
|
|
48 |
|
John W. Splude |
|
|
65 |
|
Gary J. Vroman |
|
|
51 |
|
Other information required by Item 401 of Regulation S-K is as follows:
Lawrence W. Bianchi, 69. Director since 1998. Mr. Bianchi retired in 1993 as the Managing Partner
of the Milwaukee, Wisconsin office of KPMG LLP. From 1994 to 1998, Mr. Bianchi served as CFO of
the law firm of Foley & Lardner LLP. Mr. Bianchi’s principal occupation is investments. Mr.
Bianchi has years of experience as a certified public accountant at a major public accounting firm.
He serves as the chairman of the Company’s audit committee and is the designated “financial
expert” on the audit committee.
John J. Delaney, 61. Mr. Delaney has been President of Stowe since April 2006 and President of
Aerex since November 2009. Prior to that period, Mr. Delaney served as General Sales Manager at
Stowe.
Lawrence C. Hammond, 63. Mr. Hammond has served as Vice President, Human Resources since January
1994. Prior to that time he had served as Director of Industrial Relations at the Company and he
had been Labor Counsel at the Company. Mr. Hammond has been with the Company since 1980.
James C. Hill, 62. Director since 2003. Mr. Hill was Chairman and Chief Executive Officer of
Vision Metals, Inc., a steel tubing producer, from 1997 to 2001. Prior to that period he was
Corporate Vice President of Quanex Corporation, a NYSE public company and President of its Tube
Group from 1983 to 1997. Mr. Hill has served as a senior executive for a number of businesses in
the metalworking industry. He brings to the Board of Directors years of manufacturing experience
in heavy industry.
Leon A. Kranz, 71. Director since 2001. Mr. Kranz was formerly President and Chief Executive
Officer of Weber Metals, Inc., a Paramount, California based metals processor, a position he held
for more than ten years. Mr. Kranz spent the majority of his career in executive management in the
aerospace and forging industries. He has extensive experience in dealing with the original
equipment manufacturers which dominate the aerospace industry. He serves as chairman of the
Company’s compensation committee.
Wayne E. Larsen, 56. Director since 2009 and previously a director from 1997 to 2003. Since 1995
Mr. Larsen has been Vice President Law/Finance and Secretary of the Company. He served as General
Counsel and Secretary since 1989 after joining the Company as corporate counsel in 1981. Mr. Larsen
is a Trustee of the Ladish Co. Foundation and a Director of the South Shore YMCA of Milwaukee and
serves on the Advisory Board of U.S. Bank-Wisconsin. Mr. Larsen has been with the Company for 30
years, having served as an officer of the Company for 23 of those years. He is responsible for all
financial and legal affairs of the Company.
27
J. Robert Peart, 48. Director since 2003. Mr. Peart is the Chief Investment Officer of Aircastle
Advisor LLC, a position he assumed in 2010. Previously, he had served as Managing Director and
Head of Guggenheim Securities, LLC’s Aviation Capital Markets Group since 2004. Prior to that
period, he was Managing Director of Residco, a transportation investment banking concern. Mr.
Peart brings a unique experience in the aerospace industry to the Board of Directors. He is
extremely knowledgeable regarding the leasing of aircraft as well as the aftermarket for aerospace
components.
John W. Splude, 65. Director since 2004. Mr. Splude recently retired as Executive Chairman of HK
Systems, Inc., an automated material handling and logistics software provider, a position he held
for over ten years. He is also a Director of Superior Die Cast and Ministry Health Care, a regent
of Milwaukee School of Engineering, and serves on the Advisory Board of U.S. Bank-Wisconsin. Mr.
Splude has extensive experience as both a financial executive and as a chief executive of
industrial manufacturing operations. He was also a certified public accountant with both public
and private accounting experience.
Randy B. Turner, 61. Mr. Turner has served as President of PCT since it was acquired by the
Company in January 2000. Prior to joining the Company, Mr. Turner served as President of the
corporate predecessor to PCT.
Gary J. Vroman, 51. Mr. Vroman has served as President and Chief Executive Officer of the Company
since September 2009 after serving as President of Forging since January 1, 2008. Prior to that
time, he was Vice President, Sales and Marketing of Forging since December 1995. Mr. Vroman has
been with the Company since 1982. He is a Trustee of the Ladish Co. Foundation and a regent of
Milwaukee School of Engineering. Mr. Vroman has 28 years of experience at the Company. He has
served in numerous sales, marketing and executive positions at the Company.
The Company’s ethics code is reflected in its policies addressing i) conflict of interest, ii)
compliance with antitrust laws, iii) improper payments, iv) falsification of records, and v)
insider trading. These policies apply to all Company employees including the principal executive
officer, the principal financial officer, controller and members of the Board of Directors. On an
annual basis, the Company requires its key management personnel to certify their review and
compliance with these policies. A copy of the policies was filed as an exhibit to the Form 10-K on
March 25, 2003. The policies can also be found on the Company’s website, www.ladishco.com.
Board of Directors and Corporate Governance
The directors hold regular quarterly meetings, in addition to the meeting immediately following the
Annual Meeting of Stockholders, attend special meetings, as required, and spend such time on our
corporate affairs as their duties require. During the fiscal year ended December 31, 2010, the
Board of Directors held twenty-one (21) meetings. All of our directors attended at least
seventy-five percent (75%) of the meetings of the Board of Directors and the committees on which
they served during the fiscal year ended December 31, 2010. All Board members are encouraged to
attend the Annual Meeting and all Board members attended the 2010 Annual Meeting of Stockholders.
All Directors, except for Messrs. Larsen and Vroman, are considered independent by Nasdaq listing
standards. During the fiscal year ended December 31, 2010, there were three standing committees,
those being an Audit Committee, an Independent/Nominating Committee and a Compensation Committee.
Audit Committee
For the year ending December 31, 2010, the members of the Audit Committee were Chairman Lawrence W.
Bianchi, J. Robert Peart and John W. Splude. Each member of the Audit Committee is “independent”
according to the definition of independence contained in Rule 4200(a)(15) of the Nasdaq listing
standards and Rule 10A-3 of the Securities Exchange Act of 1934. The Board of Directors has
designated Mr. Bianchi, an independent director, as the Audit Committee “financial expert,” as
defined in Item 407(d) of
Regulation S-K. The Audit Committee is established in accordance with section 3(a)(58) (A) of the
Securities Exchange Act of 1934. The Audit Committee is responsible for annually selecting an
independent registered public accounting firm to serve as our auditors, to meet with and review
reports of our auditors and approve the fees payable to them. The independence of the independent
registered public accounting firm auditing our financial statements is one of the factors evaluated
by the Audit Committee when recommending auditors. During fiscal years 2009 and 2010, our auditors
were Grant Thornton LLP. The Audit Committee Charter provides that the Audit Committee must
approve the fees to be paid to the independent auditor for outside auditing services and
pre-approve the use of the independent auditor for any other service. All services provided by
Grant Thornton LLP in 2009 and 2010 were authorized by the Audit Committee in accordance with the
Audit Committee Charter.
28
The Audit Committee assessed the level of non-audit services in determining that our auditors,
Grant Thornton LLP, to be independent. Following conclusion of the 2010 audit by Grant Thornton
LLP, the Audit Committee confirms that:
| |
• |
|
the Audit Committee has reviewed and discussed the audited financial statements
with management; |
| |
• |
|
the Audit Committee has discussed with Grant Thornton LLP the matters required to
be discussed by SAS 114, as amended (AICPA, professional standards, Vol. 1., AU Section
380), as adopted by the Public Company Accounting Oversight Board in Rule 3200T; |
| |
• |
|
the Audit Committee has received the written disclosures and the letter from Grant
Thornton LLP required by Independence Standards Board Statement No. 1, as adopted by
the Public Company Accounting Oversight Board in Rule 3600T, and has discussed with
Grant Thornton LLP the independence of Grant Thornton LLP; and |
| |
• |
|
the Audit Committee recommended, based on the reviews and discussions described
above, to the Board of Directors that the audited financial statements be included in
our Annual Report on Form 10-K. |
The Audit Committee Charter was reviewed by the Audit Committee in 2010 and no changes were made.
The Charter was filed as an Exhibit to the Company’s Proxy Statement for the 2003 Annual Meeting of
Stockholders. We have made the Charter available on the Company’s website, www.ladishco.com. In
addition, the Audit Committee provides oversight to our total financial status as well as assisting
us with assessments of pension-asset performance and investment criteria. The Audit Committee met
five (5) times in 2010 for all of the above purposes.
By the Audit Committee
Lawrence W. Bianchi, J. Robert Peart and John W. Splude
Independent/Nominating Committee
Our Independent/Nominating Committee was established in 2004. The Independent/Nominating Committee
is made up of directors who are not part of our management. For 2010, the Independent/Nominating
Committee consisted of Lawrence W. Bianchi, James C. Hill, Leon A. Kranz, J. Robert Peart and John
W. Splude, all of whom are considered to be independent by Nasdaq listing standards. Among other
duties, the Independent/Nominating Committee is responsible for nominating the slate of directors
to be considered for election at our annual meeting of stockholders. The Independent/Nominating
Committee met once in 2010. The Independent/Nominating Committee has adopted a Charter which was
filed as an Exhibit to the Proxy Statement for the 2004 Annual Meeting of Stockholders. We have
also made the Charter available on the Company’s website, www.ladishco.com. Pursuant to the terms
of the Independent/Nominating Committee Charter, the Independent/Nominating Committee will evaluate
all prospective director nominees including all those nominated by our stockholders. Stockholders
who wish to submit a nominee for director should direct that request to our
President or Secretary who will forward the same to the Independent/Nominating Committee. In 2010,
the Independent/Nominating Committee did not receive any director nominees from our stockholders.
The Independent/Nominating Committee does not apply a prescribed set of qualifications when
assessing a nominee, and does not specifically consider diversity of nominees (other than diversity
of relevant business experience and skills), rather the Independent/Nominating Committee evaluates
and makes appropriate inquiries into the backgrounds and qualifications of all nominees for
director.
29
In identifying and evaluating nominees for director, the Independent/Nominating Committee seeks to
ensure that the Board possesses, in the aggregate, the strategic, managerial and financial skills
and experience necessary to fulfill its duties and to achieve its objectives, and seeks to ensure
that the Board is comprised of directors who have broad and diverse backgrounds, possessing
knowledge in areas that are important to the Company. The Independent/Nominating Committee looks
at each nominee on a case-by-case basis regardless of who recommended the nominee. In looking at
the qualifications of each candidate to determine if their election would further the goals
described above, the Independent/Nominating Committee takes into account all factors it considers
appropriate, which may include strength of character, mature judgment, career specialization,
relevant technical skills or financial acumen, diversity of viewpoint and industry knowledge. In
addition, the Board and the Independent/Nominating Committee believe that the following specific
qualities and skills are necessary for all directors to possess:
| |
• |
|
A director must display high personal and professional ethics, integrity and
values. |
| |
• |
|
A director must have the ability to exercise sound business judgment. |
| |
• |
|
A director must be accomplished in his or her respective field, with broad
experience at the administrative and/or policy-making level in business, government,
education, technology or public interest. |
| |
• |
|
A director must have relevant expertise and experience, and be able to offer advice
and guidance based on that expertise and experience. |
| |
• |
|
A director must be independent of any particular constituency, be able to represent
all of our stockholders and be committed to enhancing long-term stockholder value. |
| |
• |
|
A director must have sufficient time available to devote to activities of the Board
of Directors and to enhance his or her knowledge of our business. |
The Independent/Nominating Committee also believes the following qualities or skills are necessary
for one or more directors to possess:
| |
• |
|
At least one independent director must have the requisite experience and expertise
to be designated as an “audit committee financial expert,” as defined by applicable
rules of the Securities and Exchange Commission, and have past employment experience in
finance or accounting, requisite professional certification in accounting, or any other
comparable experience or background which results in the member’s financial
sophistication, as required by the rules of NASDAQ. |
| |
• |
|
One or more of the directors generally must be active or former executive officers
of public or private companies or leaders of major complex organizations, including
commercial, scientific, government, educational and other similar institutions. |
| |
• |
|
Directors should be selected so that the Board is comprised of persons with diverse
business experience and skills. |
By the Independent/Nominating Committee
Lawrence W. Bianchi, James C. Hill, Leon A. Kranz, J. Robert Peart and John W. Splude
30
Compensation Committee
The members of the Compensation Committee for the year ending December 31, 2010 were Chairman Leon
A. Kranz, James C. Hill and John W. Splude. The Compensation Committee is responsible for (i)
setting the overall policy of our executive compensation program; (ii) establishing the base salary
level for the executive officers; (iii) reviewing and approving the annual incentive program for
our executives; and (iv) acting as the administrator of our 1996 Stock Option Program, the 2006
Long-Term Incentive Plan and the 2010 Restricted Stock Unit Plan. The Compensation Committee met
four (4) times in 2010. Our executive compensation program is designed to be closely linked to
corporate performance and returns to stockholders. To this end, we have developed an overall
compensation strategy and specific compensation plan that tie a very significant portion of
executive compensation to our success in meeting specified performance goals. The primary criteria
used by the Compensation Committee in assessing the performance of the Chief Executive Officer are
our results as measured by earnings before interest, taxes, depreciation and amortization
(“EBITDA”), our success in generating cash and our strategic direction. By monitoring these areas,
the Compensation Committee determines whether the Chief Executive Officer is achieving the
Compensation Committee’s expectations. In addition, the Compensation Committee also assesses the
accomplishments of the Chief Executive Officer and the other executive officers with respect to
activities such as acquisitions, divestitures and raising capital for the business.
The Compensation Committee regularly reports its actions and recommendations to the full Board of
Directors. The Compensation Committee Charter was adopted in February 1999. We have made the
Charter available on the Company’s website, www.ladishco.com. In 2010, none of the actions or
recommendations of the Compensation Committee were modified or rejected by the Board of Directors.
By the Compensation Committee
James C. Hill, Leon A. Kranz and John W. Splude
Compensation of Directors
Non-employee directors receive an annual fee of forty thousand dollars ($40,000.00) which is
payable quarterly. Non-employee directors also receive a fee of one thousand dollars ($1,000.00)
for each Board meeting personally attended. Chairmen of the Audit Committee and the Compensation
Committee receive an additional annual fee of four thousand dollars ($4,000.00). We reimburse all
directors for expenses associated with attending Board meetings and Board Committee meetings.
Director Compensation
| |
|
|
|
|
|
|
|
|
|
|
|
|
|
|
|
|
|
|
|
|
|
|
|
|
|
|
|
|
| |
|
|
|
|
|
|
|
|
|
|
|
|
|
|
|
|
|
Change in |
|
|
|
|
|
|
|
| |
|
|
|
|
|
|
|
|
|
|
|
|
|
|
|
|
|
Pension Value |
|
|
|
|
|
|
|
| |
|
|
|
|
|
|
|
|
|
|
|
|
|
|
|
|
|
and |
|
|
|
|
|
|
|
| |
|
|
|
|
|
|
|
|
|
|
|
|
|
Non-Equity |
|
|
Nonqualified |
|
|
|
|
|
|
|
| |
|
Fees Earned |
|
|
Stock |
|
|
Option |
|
|
Incentive Plan |
|
|
Deferred |
|
|
All Other |
|
|
|
|
| |
|
or Paid in |
|
|
Awards |
|
|
Awards |
|
|
Compensation |
|
|
Compensation |
|
|
Compensation |
|
|
|
|
| Name |
|
Cash ($) |
|
|
($) |
|
|
($) |
|
|
($) |
|
|
Earnings ($) |
|
|
($) |
|
|
Total ($) |
|
Lawrence W. Bianchi |
|
$ |
48,000 |
|
|
$ |
558,000 |
|
|
$ |
0 |
|
|
$ |
0 |
|
|
$ |
0 |
|
|
$ |
0 |
|
|
$ |
606,000 |
|
James C. Hill |
|
$ |
44,000 |
|
|
$ |
558,000 |
|
|
$ |
0 |
|
|
$ |
0 |
|
|
$ |
0 |
|
|
$ |
0 |
|
|
$ |
602,000 |
|
Leon A. Kranz |
|
$ |
48,000 |
|
|
$ |
558,000 |
|
|
$ |
0 |
|
|
$ |
0 |
|
|
$ |
0 |
|
|
$ |
0 |
|
|
$ |
606,000 |
|
J. Robert Peart |
|
$ |
44,000 |
|
|
$ |
558,000 |
|
|
$ |
0 |
|
|
$ |
0 |
|
|
$ |
0 |
|
|
$ |
0 |
|
|
$ |
602,000 |
|
John W. Splude |
|
$ |
44,000 |
|
|
$ |
558,000 |
|
|
$ |
0 |
|
|
$ |
0 |
|
|
$ |
0 |
|
|
$ |
0 |
|
|
$ |
602,000 |
|
31
|
|
|
| Item 11. Executive Compensation |
Compensation Discussion and Analysis
Overview of Our Executive Compensation Philosophy
We recognize the importance of maintaining sound principles for the development and administration
of our executive compensation and benefit programs. Specifically, our executive compensation and
benefit programs are designed to advance the following core principles:
| |
• |
|
We strive to compensate our executives at levels competitive with industry and
geographic peers to ensure we attract and retain key management employees. |
| |
• |
|
We provide our executives with the opportunity to earn reasonable pay for targeted
performance as measured against our peer group of companies. |
| |
• |
|
We link our executives’ compensation, particularly annual cash bonuses, to
established performance goals. |
We believe that a disciplined focus on these core principles will benefit us, and ultimately our
stockholders in the long term by ensuring that we can attract and retain highly qualified
executives who are committed to our long-term success.
Role of Our Compensation Committee
Our Compensation Committee approves, administers and interprets our executive compensation and
benefit policies, including our Executive Officer Incentive Plan, the Stock Option Program, the
Long-Term Incentive Plan and the Restricted Stock Unit Plan. Our Compensation Committee is
appointed by the Board, and consists entirely of directors who are “outside directors” for purposes
of Section 162(m) of the Internal Revenue Code and “non-employee directors” for purposes of Rule
16b-3 under the Exchange Act. Our Compensation Committee is comprised of Leon A. Kranz, John W.
Splude and James C. Hill, and is chaired by Mr. Kranz.
Our Compensation Committee reviews and makes recommendations to the Board to ensure that our
executive compensation and benefit programs are consistent with our compensation philosophy and
corporate governance guidelines and, subject to the approval of the Board, is responsible for
establishing the executive compensation packages offered to our named executive officers. Our
executives’ base salaries, target annual bonus levels and target annual long-term incentive award
values are set at levels competitive with industry and geographic peers, with the opportunity to
earn reasonable pay for targeted performance as measured against our peer group of companies.
Our Compensation Committee has taken the following steps to ensure our executive compensation and
benefit programs are consistent with our compensation philosophy and corporate governance
guidelines:
| |
• |
|
Periodically utilized studies and surveys of Towers Watson and Hewitt Associates to
assess the competitiveness of our overall executive compensation and benefits program,
and provide a high level review of our Executive Officer Incentive Plan, the Stock
Option Program, the Long-Term Incentive Plan and the Restricted Stock Unit Plan; |
| |
• |
|
Aligned executive compensation structures based on targeting a competitive level of
pay as measured against our peer group of companies; |
32
| |
• |
|
Maintained a practice of reviewing the performance and determining the total
compensation earned, paid or awarded to our CEO independent of input from him; |
| |
• |
|
Reviewed on an annual basis the performance of our other named executive officers
and other key employees with assistance from our CEO and determined proper total
compensation based on competitive levels as measured against similarly situated
companies; and |
| |
• |
|
Maintained the practice of holding executive sessions (without management present)
at every Committee meeting. |
The Compensation Committee directed that we acquire an independent evaluation of total executive
compensation which should consider such elements as base salary, short term incentive compensation
and long term incentive compensation all in relation to a group of peer companies. In the fourth
quarter of 2009, we obtained an updated Executive Market Review from the firm Towers Watson. This
review evaluated executive compensation at Ladish and benchmarked the Ladish executives against a
peer group which included such businesses as Carpenter Technology, Park Ohio Holdings, Brush
Engineered Materials, Cubic Corp, Gencorp, Transdigm Group, Haynes International, ESCO
Technologies, RTI International Metals, Standex International, HEICO, Daktronics, Cascade, Kaydon,
Ducommun, Ampco-Pittsburgh, Insteel Industries, Argon St, Badger Meter, and LMI Aerospace.
Total Compensation
We intend to continue our strategy of compensating our named executive officers at competitive
levels, with the opportunity to earn reasonable pay for targeted performance, through programs that
emphasize performance-based incentive compensation in the form of cash. To that end, total
executive compensation is structured to ensure that there is a focus on our financial performance
and stockholder return. We believe total compensation paid in 2010 was reasonable. Further, in
light of our compensation philosophy, we believe that the total compensation package for our
executives should continue to consist of base salary, annual cash incentive awards (bonus),
long-term incentive compensation, and certain other benefits and perquisites.
Elements of Compensation
Base Salary
Our Compensation Committee, in consultation with our CEO, strives to establish competitive base
salaries for our named executive officers (other than the CEO) as measured against similarly
situated companies. When determining the amount of base salary for each of our named executive
officers, our Compensation Committee considers the salaries of similarly situated personnel in
similar companies. When making adjustments in base salaries, our Compensation Committee generally
considers corporate financial performance and return to stockholders. In individual cases where
appropriate, our Compensation Committee also considers non-financial performance measures, such as
increases in market share, manufacturing efficiency gains, improvements in product quality, and
improvements in relations with customers, suppliers, and employees. For 2010, the base salaries of
Messrs. Vroman, Larsen, Turner, Delaney and Hammond were increased by approximately 19%, 4%, 4%,
14% and 5%, respectively. Base salaries of the named executive officers are reviewed annually. In
2010, base salaries paid to Messrs. Vroman, Larsen, Turner, Delaney and Hammond represented 6%, 6%,
10%, 9% and 8%, respectively, of the their total compensation.
33
Executive Officer Incentive Plan
Our Executive Officer Incentive Plan provides for the award of annual cash bonuses to our named
executive officers. In years of strong financial performance, our named executive officers can
earn cash bonuses that we consider reasonable compared to similarly situated companies.
The Executive Officer Incentive Plan is intended to reinforce our corporate goals, promote
achievement of certain financial goals and reward the performance of individual officers in
fulfilling their personal responsibilities. Consistent with our compensation philosophy, cash
bonus payments to our named executive officers are contingent upon the achievement of a specific
performance target during the applicable performance period. Specific performance targets may be
based on EBITDA, Return on Assets, EPS, stock price or similar criteria. Each performance target
may also have a threshold, target and maximum payout level.
For 2010, the specific performance targets for each of Messrs. Vroman, Larsen, Turner, Delaney and
Hammond were $37.103 million Ladish EBITDA, $37.103 million Ladish EBITDA, $5.065 million Pacific
Cast Technologies EBITDA, $5.208 million Stowe/Aerex EBITDA and $37.103 million Ladish EBITDA,
respectively. EBITDA is calculated in a consistent manner for each of our business units as well
as for the Company on a consolidated basis.
In addition to setting performance targets, the Compensation Committee also sets each named
executive officer’s target bonus percentage amount. This amount is based on a percentage of each
named executive officer’s base salary. In determining the target bonus percentage amount, our
Compensation Committee considers the executive’s base salary and determines what target bonus
percentage amount is required to keep the executive’s annual total cash compensation at a
competitive level as compared to similarly situated companies. In addition, the Compensation
Committee may also consider other various factors, including the impact an executive can have on
meeting the stated performance target, previous performance, length of service to the Company and
the amount of cash bonuses paid by similarly situated companies. For 2010, Messrs. Vroman, Larsen,
Turner, Delaney and Hammond had target bonus percentage amounts of 85%, 75%, 75%, 75% and 75%,
respectively, of base salary, which equated to a targeted bonus amount of $403,750, $234,000,
$168,750, $150,000 and $143,250, respectively, which was to be paid upon the achievement of the
above described performance targets for each of such officers. In 2010, due to Ladish and its
operating units significantly exceeding performance targets, Messrs. Vroman, Larsen, Turner,
Delaney and Hammond received cash bonuses of $960,000, $640,000, $320,000, $320,000 and $320,000.
Because of the relative importance of our Executive Officer Incentive Plan to total compensation
and its direct link to the achievement of specific performance targets, we believe that the
Executive Officer Incentive Plan remains an important part of our compensation program.
Stock Options
We established the Stock Option Program in 1996 to promote our long-term financial success by
providing for the award of equity-based incentives to key employees and other persons providing
material services to us. Initially approximately forty (40) persons were granted options. The
Stock Option Program provided a means whereby such individuals acquired shares of Common Stock
through the grant of stock options and stock appreciation rights. In 2010, no stock options were
awarded. We have not awarded stock options since 2000. In 2010, all of the remaining, outstanding
options were exercised.
34
2006 Long-Term Incentive Plan
In 2006, the Compensation Committee approved and recommended that the full Board of Directors adopt
the Long-Term Incentive Plan in recognition of the fact the Stock Option Program has no further
stock options and our executives have not received any stock options since 2000. The Long-Term
Incentive Plan allows the Compensation Committee to annually make discretionary awards of deferred
compensation into investment accounts of designated executives and key management. These
discretionary awards vest over a four (4) year period. The overall objective of the Long-Term
Incentive Plan is to attract and retain the best possible executive talent, to motivate these
executives to achieve the goals inherent in our business strategy and to provide a compensation
package that recognizes individual contributions as well as overall business results. For the year
ending December 31, 2010, no discretionary Long-Term Incentive Plan awards were awarded to Messrs.
Vroman, Larsen, Turner, Delaney and Hammond. As of December 31, 2009 and 2010, the rabbi trust
into which Long-Term Incentive Plan payments are made, had $773,893 and $734,966 in assets,
respectively.
2010 Restricted Stock Unit Plan
The 2010 Restricted Stock Unit Plan of Ladish was approved by the Board of Directors on March 29,
2010 and was subsequently authorized by Ladish stockholders on May 5, 2010. The restricted stock
units were awarded by the Board on May 5, 2010. The grant of restricted stock units vests evenly
over the course of five years. Even though vested, the awards are not exercisable until such time
as the recipient, if an employee, leaves the employment of Ladish, or a recipient who is a director
ceases to serve on the Ladish Board of Directors. In the event of a change of control of the
ownership of Ladish, the restricted stock units immediately vest and are fully exercisable.
Other Benefits
We maintain certain other plans which provide, or may provide compensation and benefits to our
named executive officers. These plans are principally our pension plan, supplemental executive
retirement plan, 401(k) plan and deferred compensation plan. We have elected to provide these
benefits in order to attract and retain crucial talent, as well as ensuring a secure retirement for
employees who contribute to our success over a sustained period of time.
Pension Plan
We maintain a defined benefit pension plan for all salaried employees at our main Wisconsin
facility including three of the named executive officers. Compensation covered by our pension plan
includes salary. Upon termination of employment, the employee may receive benefits in the form of
a monthly payment on a straight life annuity basis and such amounts are not subject to any
deduction for Social Security or other offset amounts. For more information concerning our defined
benefit plan, see the discussion following the Pension Benefit Table, “Defined Benefit Plan.”
Several of our operating business units do not have a defined benefit pension plan for the
employees of those units. For certain of those employees, we have established a deferred
compensation plan in lieu of a defined benefit plan. The assets in these deferred compensation
plans are held in rabbi trusts. As of December 31, 2009 and 2010, there were $422,527 and
$530,892, respectively, of assets in these rabbi trusts. In 2010, we contributed $11,250 and
$5,852 into this program on behalf of Messrs. Turner and Delaney, respectively.
Supplemental Retirement Agreements
We have a supplemental executive retirement agreement with three of the five named executive
officers, which supplements each such officer’s retirement income. Under the agreements, such
named executive officers are entitled to receive a monthly retirement for the lifetime of such
officer. These supplemental retirement agreements provide that the calculation of average base
salary for these individuals can include up to 20% of bonus amounts. For more information
concerning the supplemental executive retirement agreements, see the discussion following the
Pension Benefit Table, “Officer Plans.”
35
401(k) Plan
The Ladish Co., Inc. Savings and Deferral Investment Plan, which has been qualified under
section 401(k) of the Internal Revenue Code, provides that, subject to the limitations of the
Internal Revenue Code, salaried, non-union employees with six months’ service may contribute 1% to
50% of their annual base salary to the Savings and Deferral Investment Plan and we may provide a
matching contribution in an amount to be determined by the Board of Directors. Employees’
contributions of 1% to 50% can be “before tax” contributions, “after tax” contributions or a
combination of both. The employees’ contributions and our matching contribution may be placed by
the employee in a fixed income fund, an equity investment fund or various combinations of each.
Deferred Compensation
The Elective Deferred Compensation Plan was approved by the Board of Directors during 2000 and
became effective during the fourth quarter of 2000. The Elective Deferred Compensation Plan is
available to management employees of the Company and its subsidiaries. Participants in the
Elective Deferred Compensation Plan may elect to defer salary and/or bonus on an unsecured basis
and may select any of eight investment options. We do not match contributions to the Elective
Deferred Compensation Plan and we do not guaranty any return on any of the investment options
available to the participants in the Elective Deferred Compensation Plan. Amounts deferred under
the Elective Deferred Compensation Plan are placed into a rabbi trust. This rabbi trust had assets
of $2,526,843 and $2,087,939, respectively, as of December 31, 2009 and 2010.
Perquisites
In 2010, we provided certain perquisites as summarized below:
Company Cars for Personal Use
During 2010, Messrs. Vroman, Larsen, Turner, Delaney and Hammond used our vehicles for
personal travel, resulting in a benefit to the executives of $14,297, $9,436, $6,000,
$15,464 and $11,905, respectively.
Life Insurance
We provide supplemental term life insurance to certain of our executives.
For 2010, this benefit was valued at $1,296, $2,304, $3,034, $147 and $3,276, respectively,
for Messrs. Vroman, Larsen, Turner, Delaney and Hammond.
Risk
The nature of the Company’s business does not subject it to high degrees of risk. Correspondingly,
the Company’s compensation policies and practices are not directly related to the Company’s risk
management. Rather, the Company bases its compensation policies and practices on the direct
financial results of the Company. None of the Company’s executives or highly-paid individuals
participate in a compensation program whereby their compensation could increase through subjecting
the Company to added risk.
36
The Summary Compensation Table sets forth for fiscal years December 31, 2010, 2009 and 2008 all
compensation awarded to, earned by or paid to our Chief Executive Officer, the Principal Financial
Officer and each of the other three (3) most highly compensated executive officers.
Summary Compensation Table
| |
|
|
|
|
|
|
|
|
|
|
|
|
|
|
|
|
|
|
|
|
|
|
|
|
|
|
|
|
|
|
|
|
|
|
|
|
| |
|
|
|
|
|
|
|
|
|
|
|
|
|
|
|
|
|
|
|
|
|
|
|
|
|
Change in |
|
|
|
|
|
|
|
| |
|
|
|
|
|
|
|
|
|
|
|
|
|
|
|
|
|
|
|
|
|
|
|
|
|
Pension Value |
|
|
|
|
|
|
|
| |
|
|
|
|
|
|
|
|
|
|
|
|
|
|
|
|
|
|
|
|
|
|
|
|
|
& |
|
|
|
|
|
|
|
| |
|
|
|
|
|
|
|
|
|
|
|
|
|
|
|
|
|
|
|
|
|
Non-Equity |
|
|
Nonqualified |
|
|
|
|
|
|
|
| |
|
|
|
|
|
|
|
|
|
|
|
|
|
|
|
|
|
|
|
|
|
Incentive |
|
|
Deferred |
|
|
All Other |
|
|
|
|
| |
|
|
|
|
|
|
|
|
|
|
|
|
|
|
|
|
|
|
|
|
|
Plan |
|
|
Compensa- |
|
|
Compen- |
|
|
|
|
| Name and Principal |
|
|
|
|
|
|
|
|
|
|
|
|
|
Stock |
|
|
Option |
|
|
Compensa- |
|
|
tion Earnings |
|
|
sation |
|
|
|
|
| Position |
|
Year |
|
|
Salary |
|
|
Bonus |
|
|
Awards |
|
|
Awards |
|
|
tion |
|
|
(1)(2)(3) |
|
|
(4) |
|
|
Total |
|
Gary J. Vroman |
|
|
2010 |
|
|
$ |
449,040 |
|
|
|
— |
|
|
$ |
5,880,000 |
|
|
|
— |
|
|
$ |
960,000 |
|
|
$ |
296,703 |
|
|
$ |
15,593 |
|
|
$ |
7,601,336 |
|
President & Chief |
|
|
2009 |
|
|
$ |
311,235 |
|
|
|
— |
|
|
|
— |
|
|
|
— |
|
|
|
— |
|
|
$ |
173,839 |
|
|
$ |
13,847 |
|
|
$ |
498,921 |
|
Executive Officer |
|
|
2008 |
|
|
$ |
286,312 |
|
|
$ |
24,650 |
|
|
|
— |
|
|
|
— |
|
|
$ |
95,700 |
|
|
$ |
131,985 |
|
|
$ |
12,425 |
|
|
$ |
551,072 |
|
Wayne E. Larsen |
|
|
2010 |
|
|
$ |
311,815 |
|
|
|
— |
|
|
$ |
4,410,000 |
|
|
|
— |
|
|
$ |
640,000 |
|
|
$ |
300,421 |
|
|
$ |
11,740 |
|
|
$ |
5,673,976 |
|
Vice President Law/ |
|
|
2009 |
|
|
$ |
295,386 |
|
|
|
— |
|
|
|
— |
|
|
|
— |
|
|
|
— |
|
|
$ |
237,961 |
|
|
$ |
10,264 |
|
|
$ |
543,611 |
|
Finance & Secretary |
|
|
2008 |
|
|
$ |
280,963 |
|
|
$ |
25,500 |
|
|
|
— |
|
|
|
— |
|
|
$ |
169,500 |
|
|
$ |
62,626 |
|
|
$ |
9,364 |
|
|
$ |
547,953 |
|
Randy B. Turner |
|
|
2010 |
|
|
$ |
229,173 |
|
|
|
— |
|
|
$ |
1,764,000 |
|
|
|
— |
|
|
$ |
320,000 |
|
|
$ |
16,988 |
|
|
$ |
9,034 |
|
|
$ |
2,339,195 |
|
President — Pacific Cast |
|
|
2009 |
|
|
$ |
215,000 |
|
|
|
— |
|
|
|
— |
|
|
|
— |
|
|
$ |
60,200 |
|
|
$ |
15,784 |
|
|
$ |
7,968 |
|
|
$ |
298,952 |
|
Technologies, Inc. |
|
|
2008 |
|
|
$ |
214,519 |
|
|
$ |
18,275 |
|
|
|
— |
|
|
|
— |
|
|
$ |
81,700 |
|
|
$ |
(18,944 |
) |
|
$ |
7,961 |
|
|
$ |
303,511 |
|
John J. Delaney (5)
|
|
|
2010 |
|
|
$ |
200,000 |
|
|
|
— |
|
|
$ |
1,764,000 |
|
|
|
— |
|
|
$ |
320,000 |
|
|
$ |
9,827 |
|
|
$ |
15,611 |
|
|
$ |
2,309,438 |
|
President — Stowe |
|
|
2009 |
|
|
|
— |
|
|
|
— |
|
|
|
— |
|
|
|
— |
|
|
|
— |
|
|
|
— |
|
|
|
— |
|
|
|
— |
|
Machine Co., Inc. &
Aerex LLC |
|
|
2008 |
|
|
|
— |
|
|
|
— |
|
|
|
— |
|
|
|
— |
|
|
|
— |
|
|
|
— |
|
|
|
— |
|
|
|
— |
|
Lawrence C. Hammond |
|
|
2010 |
|
|
$ |
190,864 |
|
|
|
— |
|
|
|
1,764,000 |
|
|
|
— |
|
|
$ |
320,000 |
|
|
$ |
94,685 |
|
|
$ |
15,181 |
|
|
$ |
2,384,730 |
|
Vice President |
|
|
2009 |
|
|
$ |
178,500 |
|
|
|
— |
|
|
|
— |
|
|
|
— |
|
|
|
— |
|
|
$ |
205,445 |
|
|
$ |
14,316 |
|
|
$ |
398,261 |
|
Human Resources |
|
|
2008 |
|
|
$ |
173,693 |
|
|
$ |
15,470 |
|
|
|
— |
|
|
|
— |
|
|
$ |
63,700 |
|
|
$ |
(30,027 |
) |
|
$ |
18,647 |
|
|
$ |
241,483 |
|
| |
|
|
| (1) |
|
The 2010 change in pension value of $285,414, $188,573 and $12,893,
respectively, for Messrs. Vroman, Larsen and Hammond reflects an actuarial calculation of the
annual increase in pension value resulting from an additional year of credited service for each
individual. |
| |
| (2) |
|
The nonqualified deferred compensation earnings of $11,289, $111,848 and
$81,792, respectively, for Messrs. Vroman, Larsen and Hammond reflects earnings on income from
prior periods these individuals have previously deferred into the Elective Deferred Compensation
Plan and the Long Term Incentive Plan. |
| |
| (3) |
|
Mr. Turner’s deferred earnings of $16,988 arise from our previous grant
into Mr. Turner’s deferral account and the Long Term Incentive Plan. |
| |
| (4) |
|
All other compensation primarily consists of supplemental life insurance
provided to the above-listed executives along with automobile allowances. |
| |
| (5) |
|
Mr. Delaney was promoted to the position of President of the Company’s
Stowe Machine and Aerex business units on November 13, 2009. |
2010 Grants of Plan-Based Awards
| |
|
|
|
|
|
|
|
|
|
|
|
|
|
|
|
|
|
|
|
|
|
|
|
|
|
|
|
|
|
|
|
|
|
|
|
|
|
|
|
|
| |
|
|
|
|
|
|
|
|
|
|
|
|
|
|
|
|
|
|
|
|
|
|
|
|
|
|
|
|
|
All |
|
|
|
|
|
|
|
| |
|
|
|
|
|
|
|
|
|
|
|
|
|
|
|
|
|
|
|
|
|
|
|
|
|
|
|
|
|
Other |
|
|
All Other |
|
|
|
|
| |
|
|
|
|
|
|
|
|
|
|
|
|
|
|
|
|
|
|
|
|
|
|
|
|
|
|
|
|
|
Stock |
|
|
Option |
|
|
|
|
| |
|
|
|
|
|
|
|
|
|
|
|
|
|
|
|
|
|
|
|
|
|
|
|
|
|
|
|
|
|
Awards: |
|
|
Awards: |
|
|
|
|
| |
|
|
|
|
|
|
|
|
|
|
|
|
|
|
|
|
|
|
|
|
|
|
|
|
|
|
|
|
|
Number |
|
|
Number |
|
|
Exercise |
|
| |
|
|
|
|
|
|
|
|
|
|
|
|
|
|
|
|
|
|
|
|
|
|
|
|
|
|
|
|
|
of |
|
|
of |
|
|
or Base |
|
| |
|
|
|
|
|
Estimated Possible Payouts Under |
|
|
Estimated Future Payouts Under |
|
|
Shares |
|
|
Securities |
|
|
Price of |
|
| |
|
|
|
|
|
Non-Equity Incentive Plan Awards |
|
|
Equity Incentive Plan Awards |
|
|
of Stock |
|
|
Underlying |
|
|
Option |
|
| |
|
Grant |
|
|
|
|
|
|
|
|
|
|
No |
|
|
Threshold |
|
|
Target |
|
|
Maximum |
|
|
or Units |
|
|
Options |
|
|
Awards |
|
| Name |
|
Date |
|
|
Threshold |
|
|
Target |
|
|
Maximum |
|
|
(#) |
|
|
(#) |
|
|
(#) |
|
|
(#) |
|
|
(#) |
|
|
($/Sh) |
|
Gary J. Vroman |
|
|
1/28/10 |
|
|
$ |
190,000 |
|
|
$ |
403,750 |
|
|
|
— |
|
|
|
— |
|
|
|
— |
|
|
|
— |
|
|
|
— |
|
|
|
— |
|
|
|
— |
|
Wayne E. Larsen |
|
|
1/28/10 |
|
|
$ |
109,200 |
|
|
$ |
234,000 |
|
|
|
— |
|
|
|
— |
|
|
|
— |
|
|
|
— |
|
|
|
— |
|
|
|
— |
|
|
|
— |
|
Randy B. Turner |
|
|
1/28/10 |
|
|
$ |
78,750 |
|
|
$ |
168,750 |
|
|
|
— |
|
|
|
— |
|
|
|
— |
|
|
|
— |
|
|
|
— |
|
|
|
— |
|
|
|
— |
|
John J. Delaney |
|
|
1/28/10 |
|
|
$ |
70,000 |
|
|
$ |
150,000 |
|
|
|
— |
|
|
|
— |
|
|
|
— |
|
|
|
— |
|
|
|
— |
|
|
|
— |
|
|
|
— |
|
Lawrence C. Hammond |
|
|
1/28/10 |
|
|
$ |
66,850 |
|
|
$ |
143,250 |
|
|
|
— |
|
|
|
— |
|
|
|
— |
|
|
|
— |
|
|
|
— |
|
|
|
— |
|
|
|
— |
|
37
Disclosure Regarding the Summary Compensation Table. We have structured our executive
compensation program to attract and retain key employees by tying the individual’s total
compensation to both our performance and the individual executive’s performance and contribution.
We consider annual performance which is reflected in the awards under the Executive Officer
Incentive Plan as well as long-term contributions which are reflected in base salary and the Long-Term Incentive Plan. Retention
of key employees is addressed by separate agreements with those individuals. We have entered into
employment agreements with Messrs. Vroman, Larsen, and Hammond which are substantially similar in
all respects. The basic agreement provides for a number of benefits all of which vest after 10
years of employment, three of which must be as an officer, and include group term life insurance,
health and dental coverage and long-term disability coverage. We have separate agreements with
Messrs. Turner and Delaney. See “Potential Payments Upon Termination or Change-in-Control.”
Outstanding Equity Awards at December 31, 2010
| |
|
|
|
|
|
|
|
|
|
|
|
|
|
|
|
|
|
|
|
|
|
|
|
|
|
|
|
|
|
|
|
|
|
|
|
|
| |
|
Option Awards |
|
|
Stock Awards |
|
| |
|
|
|
|
|
|
|
|
|
|
|
|
|
|
|
|
|
|
|
|
|
|
|
|
|
|
|
|
|
|
|
|
Equity |
|
| |
|
|
|
|
|
|
|
|
|
|
|
|
|
|
|
|
|
|
|
|
|
|
|
|
|
|
|
|
Equity |
|
|
Incentive |
|
| |
|
|
|
|
|
|
|
|
|
|
|
|
|
|
|
|
|
|
|
|
|
|
|
|
Market |
|
|
Incentive |
|
|
Plan |
|
| |
|
|
|
|
|
|
|
|
|
|
|
|
|
|
|
|
|
|
|
|
|
|
|
|
Value |
|
|
Plan |
|
|
Awards: |
|
| |
|
|
|
|
|
|
|
|
|
|
|
|
|
|
|
|
|
|
|
|
Number |
|
|
of |
|
|
Awards: |
|
|
Market or |
|
| |
|
|
|
|
|
|
|
|
|
Equity |
|
|
|
|
|
|
|
|
|
|
of |
|
|
Shares |
|
|
Number of |
|
|
Payout |
|
| |
|
|
|
|
|
|
|
|
|
Incentive |
|
|
|
|
|
|
|
|
|
|
Shares |
|
|
or |
|
|
Unearned |
|
|
Value of |
|
| |
|
|
|
|
|
|
|
|
|
Plan Awards |
|
|
|
|
|
|
|
|
|
|
or Units |
|
|
Units |
|
|
Shares, |
|
|
Unearned |
|
| |
|
Number of |
|
|
Number of |
|
|
Number of |
|
|
|
|
|
|
|
|
|
|
of Stock |
|
|
of |
|
|
Units or |
|
|
Shares, |
|
| |
|
Securities |
|
|
Securities |
|
|
Securities |
|
|
|
|
|
|
|
|
|
|
That |
|
|
Stock |
|
|
Other |
|
|
Units or |
|
| |
|
Underlying |
|
|
Underlying |
|
|
Underlying |
|
|
|
|
|
|
Option |
|
|
Have |
|
|
That |
|
|
Rights |
|
|
Other |
|
| |
|
Unexercised |
|
|
Unexercised |
|
|
Unexercised |
|
|
Option |
|
|
Expira- |
|
|
Not |
|
|
Have |
|
|
That Have |
|
|
Rights |
|
| |
|
Options (#) |
|
|
Options (#) |
|
|
Unearned |
|
|
Exercise |
|
|
tion |
|
|
Vested |
|
|
Not |
|
|
Not Vested |
|
|
That Have |
|
| Name |
|
Exercisable |
|
|
Unexercisable |
|
|
Options (#) |
|
|
Price |
|
|
Date |
|
|
(#) |
|
|
Vested |
|
|
(#) |
|
|
Not Vested |
|
Gary J. Vroman |
|
|
— |
|
|
|
— |
|
|
|
— |
|
|
|
— |
|
|
|
— |
|
|
|
122,500 |
|
|
$ |
5,880,000 |
|
|
|
— |
|
|
|
— |
|
Wayne E. Larsen |
|
|
— |
|
|
|
— |
|
|
|
— |
|
|
|
— |
|
|
|
— |
|
|
|
91,875 |
|
|
$ |
4,410,000 |
|
|
|
— |
|
|
|
— |
|
Randy B. Turner |
|
|
— |
|
|
|
— |
|
|
|
— |
|
|
|
— |
|
|
|
— |
|
|
|
36,750 |
|
|
$ |
1,764,000 |
|
|
|
— |
|
|
|
— |
|
John J. Delaney |
|
|
— |
|
|
|
— |
|
|
|
— |
|
|
|
— |
|
|
|
— |
|
|
|
36,750 |
|
|
$ |
1,764,000 |
|
|
|
— |
|
|
|
— |
|
Lawrence C.
Hammond |
|
|
— |
|
|
|
— |
|
|
|
— |
|
|
|
— |
|
|
|
— |
|
|
|
36,750 |
|
|
$ |
1,764,000 |
|
|
|
— |
|
|
|
— |
|
2010 Restricted Stock Units
| |
|
|
|
|
|
|
|
|
|
|
|
|
|
|
|
|
| |
|
Option Awards |
|
|
Stock Awards |
|
| |
|
Number of |
|
|
|
|
|
|
Number of |
|
|
|
|
| |
|
Shares Acquired |
|
|
Value Realized |
|
|
Shares Acquired |
|
|
Value Realized |
|
| Name |
|
on Exercise (#) |
|
|
on Exercise |
|
|
on Vesting (#) |
|
|
on Vesting |
|
Gary J. Vroman |
|
|
— |
|
|
|
— |
|
|
|
— |
|
|
|
— |
|
Wayne E. Larsen |
|
|
— |
|
|
|
— |
|
|
|
— |
|
|
|
— |
|
Randy B. Turner |
|
|
— |
|
|
|
— |
|
|
|
— |
|
|
|
— |
|
John J. Delaney |
|
|
— |
|
|
|
— |
|
|
|
— |
|
|
|
— |
|
Lawrence C. Hammond |
|
|
— |
|
|
|
— |
|
|
|
— |
|
|
|
— |
|
38
Pension Benefits as of December 31, 2010
| |
|
|
|
|
|
|
|
|
|
|
|
|
|
|
| |
|
|
|
|
|
|
|
|
|
|
|
Payments |
|
| |
|
|
|
Years of |
|
|
Present Value of |
|
|
During |
|
| |
|
|
|
Credited |
|
|
Accumulated |
|
|
Last |
|
| Name |
|
Plan Name |
|
Service |
|
|
Benefit |
|
|
Fiscal Year |
|
Gary J. Vroman |
|
Salaried Pension Plan |
|
|
28.6 |
|
|
$ |
463,252 |
|
|
|
— |
|
|
|
Supplemental Retirement Agreement |
|
|
15.3 |
|
|
$ |
716,373 |
|
|
|
— |
|
Wayne E. Larsen |
|
Salaried Pension Plan |
|
|
29.9 |
|
|
$ |
634,652 |
|
|
|
— |
|
|
|
Supplemental Retirement Agreement |
|
|
24.9 |
|
|
$ |
812,927 |
|
|
|
— |
|
Randy B. Turner |
|
— |
|
|
— |
|
|
|
— |
|
|
|
— |
|
John J. Delaney |
|
— |
|
|
— |
|
|
|
— |
|
|
|
— |
|
Lawrence C. Hammond |
|
Salaried Pension Plan |
|
|
30.2 |
|
|
$ |
620,423 |
|
|
|
— |
|
|
|
Supplemental Retirement Agreement |
|
|
17.1 |
|
|
$ |
570,293 |
|
|
|
— |
|
Defined Benefit Plan
The Ladish Co., Inc. Salaried Pension Plan (the “Pension Plan”) is a “defined benefit” pension plan
generally covering salaried, non-union employees at the Cudahy, Wisconsin facility who are not
covered by any other defined benefit plan to which we make contributions pursuant to a collective
bargaining agreement.
Upon reaching normal retirement at or after age 65, a participant is generally entitled to receive
an annual retirement benefit for life. The Pension Plan provides alternative actuarially
equivalent forms of benefit payment. Vesting under the Pension Plan occurs after five years of
continued service.
The monthly retirement benefit at the normal retirement age of at least 65 is determined pursuant
to a formula as follows: 1.25% of the average base salary (exclusive of bonuses or other incentive
or special compensation) of the individual during the consecutive five year period of service
within the ten years preceding termination of employment (or after age 45, if longer) that his/her
earnings were highest multiplied by the number of years of benefit service (as defined in the
plan). Monthly normal retirement benefits are payable on a straight life annuity basis and such
amounts are not subject to any deduction for Social Security or other offset amounts.
The following table sets forth the annual benefits payable to a participant who qualified for
normal retirement in 2010, with the specified highest average earnings during the consecutive five
year period of service within the ten years prior to retirement and the specified years of benefit
service:
| |
|
|
|
|
|
|
|
|
|
|
|
|
|
|
|
|
|
|
|
|
|
|
|
|
| Average Annual Earnings |
|
|
|
| for Highest 5-Year Period |
|
|
|
| Within the 10-Years |
|
Years of Benefit Service |
|
| Preceding Retirement |
|
10 |
|
|
15 |
|
|
20 |
|
|
25 |
|
|
30 |
|
|
40 |
|
$50,000 |
|
$ |
6,250 |
|
|
$ |
9,375 |
|
|
$ |
12,500 |
|
|
$ |
15,625 |
|
|
$ |
18,750 |
|
|
$ |
25,000 |
|
$100,000 |
|
$ |
12,500 |
|
|
$ |
18,750 |
|
|
$ |
25,000 |
|
|
$ |
31,250 |
|
|
$ |
37,500 |
|
|
$ |
50,000 |
|
$150,000 |
|
$ |
18,750 |
|
|
$ |
28,125 |
|
|
$ |
37,500 |
|
|
$ |
46,875 |
|
|
$ |
56,250 |
|
|
$ |
75,000 |
|
$200,000 |
|
$ |
25,000 |
|
|
$ |
37,500 |
|
|
$ |
50,000 |
|
|
$ |
62,500 |
|
|
$ |
75,000 |
|
|
$ |
100,000 |
|
$250,000 |
|
$ |
31,250 |
|
|
$ |
46,875 |
|
|
$ |
62,500 |
|
|
$ |
78,125 |
|
|
$ |
93,750 |
|
|
$ |
125,000 |
|
$300,000 |
|
$ |
37,500 |
|
|
$ |
56,250 |
|
|
$ |
75,000 |
|
|
$ |
93,750 |
|
|
$ |
112,500 |
|
|
$ |
150,000 |
|
The years of benefit service for Messrs. Vroman, Larsen and Hammond as of December 31, 2010
were 28.6, 29.9 and 30.2, respectively.
39
Officer Plans
We have entered into officer agreements with four current officers of the Company, including
Messrs. Vroman, Larsen and Hammond. Each employee covered by the agreements, upon full vesting, is
entitled to receive supplemental disability or retirement benefits; provided that in no event may a
person’s total retirement benefits under the agreements exceed 60% of the monthly average base
salary (inclusive of bonuses or other compensation) during the five calendar years immediately
preceding retirement.
The retirement benefit at the normal retirement age of at least 62 is determined pursuant to a
formula as follows: 60% of the monthly average of the employee’s base salary plus any incentive
compensation which does not exceed twenty percent of the base salary during the five calendar years
of highest compensation over ten years immediately preceding retirement multiplied by years of
service, up to 15, and divided by 15. If an employee suffers a disability (as defined in the
plan), he is entitled to benefits paid under the same formula as in the preceding sentence (with
his years of service calculated as if he had retired at age 62), reduced by other disability
benefits paid by us or through workers’ compensation (unless he is receiving fixed statutory
payments for certain bodily injuries).
Any amount to be paid under the agreements shall be reduced by any benefit paid to an employee or
his beneficiary pursuant to the pension plan. All assumptions utilized by the Pension Plan and the
Officer Plans can be found in pension footnote No. 8 to our audited financial statements contained
in our Annual Report on Form 10-K for the year ending December 31, 2010.
2010 Nonqualified Deferred Compensation
| |
|
|
|
|
|
|
|
|
|
|
|
|
|
|
|
|
|
|
|
|
| |
|
Executive |
|
|
Registrant |
|
|
Aggregate |
|
|
Aggregate |
|
|
Aggregate |
|
| |
|
Contributions in |
|
|
Contributions in |
|
|
Earnings in |
|
|
Withdrawals/ |
|
|
Balance at |
|
| Name |
|
2010 |
|
|
2010 (1) |
|
|
2010 |
|
|
Distributions |
|
|
December 31, 2010 |
|
Gary J. Vroman |
|
|
— |
|
|
|
— |
|
|
$ |
11,289 |
|
|
|
— |
|
|
$ |
78,422 |
|
Wayne E. Larsen |
|
$ |
31,182 |
|
|
|
— |
|
|
$ |
111,848 |
|
|
|
— |
|
|
$ |
976,173 |
|
Randy B. Turner |
|
|
— |
|
|
|
— |
|
|
$ |
16,988 |
|
|
|
— |
|
|
$ |
115,700 |
|
John J. Delaney |
|
|
— |
|
|
|
— |
|
|
$ |
9,827 |
|
|
|
— |
|
|
$ |
81,913 |
|
Lawrence C. Hammond |
|
$ |
124,630 |
|
|
|
— |
|
|
$ |
81,792 |
|
|
|
— |
|
|
$ |
602,848 |
|
| |
|
|
| (1) |
|
These amounts are reported as compensation in the Summary
Compensation Table for each of the named executive officers. |
Participants in the Elective Deferred Compensation Plan may elect to defer salary and/or bonus
on an unsecured basis and may select any of eight investment options. We do not match
contributions to this Plan and we do not guaranty any return on any of the investment options in
this Plan.
Potential Payments Upon Termination or Change-in-Control
We have entered into employment agreements with Messrs. Vroman, Larsen and Hammond which are
substantially similar in all respects. The basic employment agreement provides for a number of
benefits, all of which vest after ten years of employment, including group term life insurance,
health and dental coverage and long-term disability coverage.
The agreements provide that, upon the involuntary termination of the employee other than for cause,
we are required to pay the employee 24 months of severance pay, determined by the employee’s base
monthly salary at the time of termination. In the case of Messrs. Vroman and Larsen they are
entitled to 30 months of severance pay. Upon retirement at age 62, the employee will receive his
normal retirement benefits. Such benefits include a monthly payment equal to 60% of the employee’s
average compensation (i.e., monthly average of compensation for the five years of highest
compensation over the ten years prior to retirement) multiplied by a fraction, the numerator of
which is the length of service of the employee up to 15 and the denominator of which is 15. There
are also provisions adjusting this calculation in the event of early retirement. Disabled
employees can also be eligible for certain retirement
benefits. All retirement benefits are tolled during any period of re-employment by us. Each
agreement further provides that any compensation paid by us shall be reduced by any benefit paid
under our salaried employees’ retirement plan. Mr. Turner has a separate agreement with us which
provides for 12 months of severance pay in the event of involuntary separation other than for
cause.
40
Tables Summarizing Payments Following Termination
The following tables describe the potential payments upon termination. These tables assume the
executive’s employment was terminated on December 31, 2010, the last business day of our fiscal
year.
The following table sets forth certain information relating to compensation following a termination
of employment of Gary J. Vroman.
| |
|
|
|
|
|
|
|
|
|
|
|
|
|
|
|
|
|
|
|
|
| |
|
|
|
|
|
Involuntary |
|
|
|
|
|
|
|
|
|
|
| Executive Benefits and |
|
Voluntary |
|
|
Not For Cause |
|
|
For Cause |
|
|
|
|
|
|
|
| Payments Upon Termination |
|
Termination |
|
|
Termination |
|
|
Termination |
|
|
Death |
|
|
Disability |
|
Compensation: |
|
|
|
|
|
|
|
|
|
|
|
|
|
|
|
|
|
|
|
|
Severance |
|
$ |
— |
|
|
$ |
1,187,500 |
|
|
$ |
— |
|
|
$ |
— |
|
|
$ |
— |
|
Supplemental Retirement Plan |
|
|
716,373 |
|
|
|
716,373 |
|
|
|
716,373 |
|
|
|
716,373 |
|
|
|
716,373 |
|
Benefits and Perquisites: |
|
|
|
|
|
|
|
|
|
|
|
|
|
|
|
|
|
|
|
|
Post-Termination Health Insurance
(1) |
|
|
360,098 |
|
|
|
360,098 |
|
|
|
360,098 |
|
|
|
215,269 |
|
|
|
360,098 |
|
Life Insurance Proceeds (2) |
|
|
100,000 |
|
|
|
100,000 |
|
|
|
100,000 |
|
|
|
200,000 |
|
|
|
100,000 |
|
Disability Benefits (3) |
|
|
180,000 |
|
|
|
180,000 |
|
|
|
180,000 |
|
|
|
— |
|
|
|
180,000 |
|
Total: |
|
$ |
1,356,471 |
|
|
$ |
2,543,971 |
|
|
$ |
1,356,471 |
|
|
$ |
1,131,642 |
|
|
$ |
1,356,471 |
|
The following table sets forth certain information relating to compensation following a
termination of employment of Wayne E. Larsen.
| |
|
|
|
|
|
|
|
|
|
|
|
|
|
|
|
|
|
|
|
|
| |
|
|
|
|
|
Involuntary |
|
|
|
|
|
|
|
|
|
|
| Executive Benefits and |
|
Voluntary |
|
|
Not For Cause |
|
|
For Cause |
|
|
|
|
|
|
|
| Payments Upon Termination |
|
Termination |
|
|
Termination |
|
|
Termination |
|
|
Death |
|
|
Disability |
|
Compensation: |
|
|
|
|
|
|
|
|
|
|
|
|
|
|
|
|
|
|
|
|
Severance |
|
$ |
— |
|
|
$ |
780,000 |
|
|
$ |
— |
|
|
$ |
— |
|
|
$ |
— |
|
Supplemental Retirement Plan |
|
|
812,927 |
|
|
|
812,927 |
|
|
|
812,927 |
|
|
|
812,927 |
|
|
|
812,927 |
|
Benefits and Perquisites: |
|
|
|
|
|
|
|
|
|
|
|
|
|
|
|
|
|
|
|
|
Post-Termination Health Insurance
(1)(4) |
|
|
339,463 |
|
|
|
339,463 |
|
|
|
339,463 |
|
|
|
201,078 |
|
|
|
339,463 |
|
Life Insurance Proceeds (2) |
|
|
100,000 |
|
|
|
100,000 |
|
|
|
100,000 |
|
|
|
200,000 |
|
|
|
100,000 |
|
Disability Benefits (3) |
|
|
180,000 |
|
|
|
180,000 |
|
|
|
180,000 |
|
|
|
— |
|
|
|
180,000 |
|
Total: |
|
$ |
1,432,390 |
|
|
$ |
2,212,390 |
|
|
$ |
1,432,390 |
|
|
$ |
1,214,005 |
|
|
$ |
1,432,390 |
|
The following table sets forth certain information relating to compensation following a
termination of employment of Randy B. Turner.
| |
|
|
|
|
|
|
|
|
|
|
|
|
|
|
|
|
|
|
|
|
| |
|
|
|
|
|
Involuntary |
|
|
|
|
|
|
|
|
|
|
| Executive Benefits and |
|
Voluntary |
|
|
Not For Cause |
|
|
For Cause |
|
|
|
|
|
|
|
| Payments Upon Termination |
|
Termination |
|
|
Termination |
|
|
Termination |
|
|
Death |
|
|
Disability |
|
Compensation: |
|
|
|
|
|
|
|
|
|
|
|
|
|
|
|
|
|
|
|
|
Severance |
|
$ |
— |
|
|
$ |
225,000 |
|
|
$ |
— |
|
|
$ |
— |
|
|
$ |
— |
|
Supplemental Retirement Plan |
|
|
— |
|
|
|
— |
|
|
|
— |
|
|
|
— |
|
|
|
— |
|
Benefits and Perquisites: |
|
|
|
|
|
|
|
|
|
|
|
|
|
|
|
|
|
|
|
|
Post-Termination Health Insurance |
|
|
— |
|
|
|
— |
|
|
|
— |
|
|
|
— |
|
|
|
— |
|
Life Insurance Proceeds (2) |
|
|
380,000 |
|
|
|
380,000 |
|
|
|
380,000 |
|
|
|
380,000 |
|
|
|
380,000 |
|
Disability Benefits (3) |
|
|
123,876 |
|
|
|
123,876 |
|
|
|
123,876 |
|
|
|
— |
|
|
|
123,876 |
|
Total: |
|
$ |
503,876 |
|
|
$ |
728,876 |
|
|
$ |
503,876 |
|
|
$ |
380,000 |
|
|
$ |
503,876 |
|
41
The following table sets forth certain information relating to compensation following a
termination of employment of John J. Delaney.
| |
|
|
|
|
|
|
|
|
|
|
|
|
|
|
|
|
|
|
|
|
| |
|
|
|
|
|
Involuntary |
|
|
|
|
|
|
|
|
|
|
| Executive Benefits and |
|
Voluntary |
|
|
Not For Cause |
|
|
For Cause |
|
|
|
|
|
|
|
| Payments Upon Termination |
|
Termination |
|
|
Termination |
|
|
Termination |
|
|
Death |
|
|
Disability |
|
Compensation: |
|
|
|
|
|
|
|
|
|
|
|
|
|
|
|
|
|
|
|
|
Severance |
|
$ |
— |
|
|
$ |
— |
|
|
$ |
— |
|
|
$ |
— |
|
|
$ |
— |
|
Supplemental Retirement Plan |
|
|
— |
|
|
|
— |
|
|
|
— |
|
|
|
— |
|
|
|
— |
|
Benefits and Perquisites: |
|
|
|
|
|
|
|
|
|
|
|
|
|
|
|
|
|
|
|
|
Post-Termination Health Insurance |
|
|
— |
|
|
|
— |
|
|
|
— |
|
|
|
— |
|
|
|
— |
|
Life Insurance Proceeds (2) |
|
|
25,000 |
|
|
|
25,000 |
|
|
|
25,000 |
|
|
|
25,000 |
|
|
|
25,000 |
|
Disability Benefits |
|
|
— |
|
|
|
— |
|
|
|
— |
|
|
|
— |
|
|
|
— |
|
Total: |
|
$ |
25,000 |
|
|
$ |
25,000 |
|
|
$ |
25,000 |
|
|
$ |
25,000 |
|
|
$ |
25,000 |
|
The following table sets forth certain information relating to compensation following a
termination of employment of Lawrence C. Hammond.
| |
|
|
|
|
|
|
|
|
|
|
|
|
|
|
|
|
|
|
|
|
| |
|
|
|
|
|
Involuntary |
|
|
|
|
|
|
|
|
|
|
| Executive Benefits and |
|
Voluntary |
|
|
Not For Cause |
|
|
For Cause |
|
|
|
|
|
|
|
| Payments Upon Termination |
|
Termination |
|
|
Termination |
|
|
Termination |
|
|
Death |
|
|
Disability |
|
Compensation: |
|
|
|
|
|
|
|
|
|
|
|
|
|
|
|
|
|
|
|
|
Severance |
|
$ |
— |
|
|
$ |
380,000 |
|
|
$ |
— |
|
|
$ |
— |
|
|
$ |
— |
|
Supplemental Retirement Plan |
|
|
570,293 |
|
|
|
570,293 |
|
|
|
570,293 |
|
|
|
570,293 |
|
|
|
570,293 |
|
Benefits and Perquisites: |
|
|
|
|
|
|
|
|
|
|
|
|
|
|
|
|
|
|
|
|
Post-Termination Health Insurance
(1) |
|
|
237,870 |
|
|
|
237,870 |
|
|
|
237,870 |
|
|
|
149,319 |
|
|
|
237,870 |
|
Life Insurance Proceeds (2) |
|
|
100,000 |
|
|
|
100,000 |
|
|
|
100,000 |
|
|
|
200,000 |
|
|
|
100,000 |
|
Disability Benefits (3) |
|
|
121,940 |
|
|
|
121,940 |
|
|
|
121,940 |
|
|
|
— |
|
|
|
121,940 |
|
Total: |
|
$ |
1,030,103 |
|
|
$ |
1,410,103 |
|
|
$ |
1,030,103 |
|
|
$ |
919,612 |
|
|
$ |
1,030,103 |
|
| |
|
|
| (1) |
|
All assumptions used in the determination of these present values are the same as the assumptions used
in the January 1, 2010 actuarial valuation of the postretirement medical benefits for footnote No. 8 to the audited
financial statements contained in our Form 10-K for the year ending December 31, 2010. |
| |
| (2) |
|
Vested life insurance benefits under the Officer Plans for Messrs. Vroman, Larsen and Hammond
provide for a $200,000 term life policy while employed and a $100,000 term life policy after employment terminates. We
provide Mr. Turner with a $380,000 term life policy and Mr. Delaney with a $25,000 term life policy. |
| |
| (3) |
|
Disability insurance is provided for 66.6% of base salary up to a maximum monthly benefit of
$15,000. The above figure represents an annual benefit until the age of 65. |
| |
| (4) |
|
Mr. Larsen does not accept medical benefits from us. This entry represents an actuarial
assumption should he have received such benefits. |
Table Summarizing Potential Payments on a Change-in-Control without Termination of Employment;
Acceleration of Vesting
| |
|
|
|
|
|
|
|
|
| |
|
Value of Restricted Stock Units |
|
|
Value of Deferred Compensation |
|
| Name |
|
Vested on Accelerated Basis |
|
|
Awards Vested on Accelerated Basis |
|
Gary J. Vroman |
|
$ |
5,880,000 |
|
|
$ |
34,418 |
|
Wayne E. Larsen |
|
$ |
4,410,000 |
|
|
$ |
32,554 |
|
Randy B. Turner |
|
$ |
1,764,000 |
|
|
$ |
23,285 |
|
John J. Delaney |
|
$ |
1,764,000 |
|
|
$ |
22,521 |
|
Lawrence C. Hammond |
|
$ |
1,764,000 |
|
|
$ |
— |
|
42
Compensation Committee Report
The Compensation Committee has reviewed and discussed the above Compensation Discussion and
Analysis with management, and based on such review and discussion, has recommended to the Board of
Directors that the Compensation Discussion and Analysis be included in our Annual Report on Form
10-K.
Leon A. Kranz, Chairman
James C. Hill and John W. Splude
Compensation Committee Interlocks and Insider Participation
The members of the Compensation Committee for the full year ending December 31, 2010 were Chairman
Leon A. Kranz, James C. Hill and John W. Splude. None of our executive officers serve as a member
of the board of directors or compensation committee of any entity that has one or more of its
executive officers serving as a member of our Board or Compensation Committee. During the year
ending December 31, 2010, Gary J. Vroman, our President and Chief Executive Officer, did not serve
on the Compensation Committee. No Company insider participated on the Compensation Committee in
2010. See “Certain Relationships.”
|
|
|
| Item 12. Security Ownership of Certain Beneficial Owners and Management |
As of March 8, 2011, no person was known by the Company to own beneficially more than five percent
(5%) of the outstanding shares of Common Stock of the Company, except as shown in the following
table:
| |
|
|
|
|
|
|
|
|
| Name & Address of Beneficial Owner |
|
No. of Shares Beneficially Owned |
|
|
Percent of Class |
|
Water Island Capital LLC |
|
|
1,226,380 |
|
|
|
7.81 |
% |
41 Madison Avenue, Floor 42
New York, New York 10010 |
|
|
|
|
|
|
|
|
|
|
|
|
|
|
|
|
|
Waddell & Reed Financial, Inc. |
|
|
1,125,978 |
|
|
|
7.17 |
% |
6300 Lamar Avenue
Overland Park, Kansas 66202 |
|
|
|
|
|
|
|
|
|
|
|
|
|
|
|
|
|
Dimensional Fund Advisors, Inc. |
|
|
865,415 |
|
|
|
5.51 |
% |
6300 Bee Cave Road
Austin, Texas 78746 |
|
|
|
|
|
|
|
|
|
|
|
|
|
|
|
|
|
Ko Family Irrevocable Trusts |
|
|
856,211 |
|
|
|
5.45 |
% |
9 Wrigley
Irvine, California 92618 |
|
|
|
|
|
|
|
|
|
|
|
|
|
|
|
|
|
Black Rock Global Investors |
|
|
843,906 |
|
|
|
5.37 |
% |
400 Howard Street
San Francisco, California 94105 |
|
|
|
|
|
|
|
|
|
|
|
|
|
|
|
|
|
Century Capital Management LLC |
|
|
786,063 |
|
|
|
5.00 |
% |
100 Federal Street, Floor 29
Boston, Massachusetts 02110 |
|
|
|
|
|
|
|
|
Information regarding the above stockholders and their beneficial ownership of the Company’s
shares was obtained from the Schedule 13F of Water Island Capital LLC dated December 31, 2010; the
Schedule 13G of Waddell & Reed Financial, Inc. dated February 8, 2011; the Schedule 13G of
Dimensional Fund Advisors, Inc. dated February 11, 2011; the Schedule 13G of the Ko Family
Irrevocable Trusts dated February 11, 2009; the Schedule 13G of Black Rock Global Investors dated
January 20, 2010; and the Schedule 13G of Century Capital Management LLC dated February 9, 2011.
43
The following table shows the number of shares of Common Stock beneficially owned by each
director or nominee, by the executive officers named below in the Summary Compensation Table and by
all directors, nominees and executive officers as a group, based upon information supplied by them:
| |
|
|
|
|
|
|
|
|
| |
|
Number of Shares Beneficially |
|
|
Percent |
|
| Name |
|
Owned At March 8, 2010 |
|
|
Of Class |
|
Lawrence W. Bianchi |
|
|
1,000 |
|
|
|
* |
|
James C. Hill |
|
|
1,000 |
|
|
|
* |
|
Shannon J. S. Ko |
|
|
856,211 |
|
|
|
5.45 |
% |
Leon A. Kranz |
|
|
0 |
|
|
|
* |
|
Wayne E. Larsen |
|
|
0 |
|
|
|
* |
|
J. Robert Peart |
|
|
0 |
|
|
|
* |
|
John W. Splude |
|
|
25,000 |
|
|
|
* |
|
Lawrence C. Hammond |
|
|
5,000 |
|
|
|
* |
|
Randy B. Turner |
|
|
0 |
|
|
|
* |
|
Gary J. Vroman |
|
|
0 |
|
|
|
* |
|
Directors and Executive Officers as a Group (10 persons) |
|
|
888,211 |
|
|
|
5.65 |
% |
| |
|
|
| * |
|
Less than one percent (1%) |
|
|
|
| Item 13. Certain Relationships and Related Transactions |
We participate in a relationship with Weber Metals, Inc., of which Leon A. Kranz, one of our
directors, is also a director. We made payments of approximately $372,000 to Weber Metals, Inc.
under the relationship in the year ending December 31, 2010. We also rent the facility which
houses our subsidiary, Chen-Tech Industries, Inc., from one of our executives, Shannon J.S. Ko, and
his wife for the annual rent of $504,000. On March 12, 2010, we purchased 200,000 shares of Ladish
common stock from trusts which benefit Shannon J.S. Ko and his wife for $3,250,000, or $16.25 per
share. Except as disclosed in this section, we had no transactions during 2010, and none are
currently proposed, in which we were a participant and in which any related person had a direct or
indirect material interest. Our Board has adopted written policies and procedures regarding
related person transactions. For purposes of these policies and procedures:
| |
• |
|
A “related person” means any of our directors, executive officers or nominees for
director or any of their immediate family members; and |
| |
• |
|
A “related person transaction” generally is a transaction (including any
indebtedness or a guarantee of indebtedness) in which we were or are to be a
participant and the amount involved exceeds $120,000, and in which a related person had
or will have a direct or indirect material interest. |
Each of our executive officers, directors or nominees for director is required to disclose to our
Chief Legal Officer certain information relating to related person transactions for review,
approval or ratification. Disclosure to our Chief Legal Officer should occur before, if possible,
or as soon as practicable after the related person transaction is effected, but in any event as
soon as practicable after the executive officer, director or nominee for director becomes aware of
the related person transaction. The Chief Legal Officer’s decision whether or not to approve or
ratify a related person transaction is to be made in consultation with the Audit Committee to
determine that consummation of the transaction is not or was not contrary to our best interests.
Any related person transaction must be disclosed to the full Board of Directors.
44
|
|
|
| Item 14. Principal Accountant Fees and Services |
Services provided by Grant Thornton LLP in 2009 and 2010 resulted in fees of:
| |
|
|
|
|
|
|
|
|
|
|
|
|
|
|
|
|
| |
|
Audit Fees (1) |
|
|
Tax Fees |
|
|
Audit-Related Fees |
|
|
Other Fees |
|
2009 |
|
$ |
335,835 |
|
|
$ |
0 |
|
|
$ |
0 |
|
|
$ |
0 |
|
2010 |
|
$ |
525,057 |
|
|
$ |
0 |
|
|
$ |
0 |
|
|
$ |
0 |
|
| |
|
|
| (1) |
|
The 2009 and 2010 fees were for integrated audits which included a
review of Internal Controls over Financial Reporting. |
PART IV
|
|
|
| Item 15. Exhibits and Financial Statement Schedules |
Exhibits. See the accompanying index to exhibits on page X-1 which is part of this report.
Financial Statements. See the accompanying index to financial statements and schedules on page F-1
which is a part of this report.
45
SIGNATURES
Pursuant to the requirements of Section 13 or 15(d) of the Securities Exchange Act of 1934, the
registrant has duly caused this report to be signed on its behalf by the undersigned, thereunto
duly authorized.
| |
|
|
|
|
|
|
|
| |
|
LADISH CO., INC. |
|
|
|
|
|
|
|
|
|
|
|
By:
|
|
/s/ Wayne E. Larsen
Wayne E. Larsen
|
|
|
March 8, 2011
|
|
|
|
Vice President Law/Finance & Secretary |
|
|
Pursuant to the requirements of the Securities Exchange Act of 1934, this report has been signed
below by the following persons on behalf of the registrant and in the capacities and on the dates
indicated.
| |
|
|
|
|
| Signature |
|
Title |
|
Date |
|
|
|
|
|
/s/ Gary J. Vroman
Gary J. Vroman
|
|
Director, President and
Chief Executive Officer
(Principal Executive
Officer)
|
|
March 7, 2011 |
|
|
|
|
|
/s/ Wayne E. Larsen
Wayne E. Larsen
|
|
Director, Vice President
Law/Finance & Secretary
(Principal Financial and
Accounting Officer)
|
|
March 7, 2011 |
|
|
|
|
|
/s/ Lawrence W. Bianchi
Lawrence W. Bianchi
|
|
Director
|
|
March 6, 2011 |
|
|
|
|
|
/s/ James C. Hill
James C. Hill
|
|
Director
|
|
March 6, 2011 |
|
|
|
|
|
/s/ Leon A. Kranz
Leon A. Kranz
|
|
Director
|
|
March 4, 2011 |
|
|
|
|
|
/s/ J. Robert Peart
J. Robert Peart
|
|
Director
|
|
March 7, 2011 |
|
|
|
|
|
/s/ John W. Splude
John W. Splude
|
|
Director
|
|
March 8, 2011 |
46
INDEX TO FINANCIAL STATEMENTS
F-1
THIS PAGE INTENTIONALLY LEFT BLANK
F-2
Report of Independent Registered Public Accounting Firm
Board of Directors and Stockholders
Ladish Co., Inc.
We have audited the accompanying consolidated balance sheets of Ladish Co., Inc. (a Wisconsin
Corporation) and subsidiaries, collectively the “Company” as of December 31, 2010 and 2009, and the
related consolidated statements of operations, stockholders’ equity, and cash flows for each of the
three years in the period ended December 31, 2010. These financial statements are the
responsibility of the Company’s management. Our responsibility is to express an opinion on these
financial statements based on our audits.
We conducted our audits in accordance with the standards of the Public Company Accounting Oversight
Board (United States). Those standards require that we plan and perform the audit to obtain
reasonable assurance about whether the financial statements are free of material misstatement. An
audit includes examining, on a test basis, evidence supporting the amounts and disclosures in the
financial statements. An audit also includes assessing the accounting principles used and
significant estimates made by management, as well as evaluating the overall financial statement
presentation. We believe that our audits provide a reasonable basis for our opinion.
In our opinion, the consolidated financial statements referred to above present fairly, in all
material respects, the financial position of Ladish Co., Inc. and subsidiaries as of December 31,
2010 and 2009, and the results of their operations and their cash flows for each of the three years
in the period ended December 31, 2010 in conformity with accounting principles generally accepted
in the United States of America.
We also have audited, in accordance with the standards of the Public Company Accounting Oversight
Board (United States), Ladish Co., Inc. and subsidiaries’ internal control over financial reporting
as of December 31, 2010, based on criteria established in Internal Control — Integrated Framework
issued by the Committee of Sponsoring Organizations of the Treadway Commission (COSO) and our
report dated March 8, 2011 expressed an unqualified opinion on the effectiveness of internal
control over financial reporting.
/s/ Grant Thornton LLP
GRANT THORNTON LLP
Chicago, Illinois
March 8, 2011
F-3
Ladish Co., Inc.
Consolidated Balance Sheets
December 31, 2009 and 2010
(Dollars in Thousands Except Per Share Data)
| |
|
|
|
|
|
|
|
|
| Assets |
|
2009 |
|
|
2010 |
|
Current Assets: |
|
|
|
|
|
|
|
|
Cash and Cash Equivalents |
|
$ |
19,917 |
|
|
$ |
23,335 |
|
Accounts Receivable, Less Allowance for Doubtful Accounts
of $75 and $200, respectively |
|
|
59,382 |
|
|
|
82,364 |
|
Inventories, Net |
|
|
92,697 |
|
|
|
100,693 |
|
Deferred Income Taxes |
|
|
5,144 |
|
|
|
4,843 |
|
Prepaid Expenses and Other Current Assets |
|
|
6,118 |
|
|
|
2,105 |
|
|
|
|
|
|
|
|
Total Current Assets |
|
|
183,258 |
|
|
|
213,340 |
|
|
|
|
|
|
|
|
|
|
Property, Plant and Equipment: |
|
|
|
|
|
|
|
|
Land and Improvements |
|
|
6,905 |
|
|
|
6,906 |
|
Buildings and Improvements |
|
|
60,416 |
|
|
|
62,153 |
|
Machinery and Equipment |
|
|
240,352 |
|
|
|
297,969 |
|
Construction in Progress |
|
|
58,451 |
|
|
|
8,920 |
|
|
|
|
|
|
|
|
|
|
|
366,124 |
|
|
|
375,948 |
|
Less Accumulated Depreciation |
|
|
(167,688 |
) |
|
|
(180,295 |
) |
|
|
|
|
|
|
|
|
|
|
|
|
|
|
|
|
Net Property, Plant and Equipment |
|
|
198,436 |
|
|
|
195,653 |
|
|
|
|
|
|
|
|
|
|
Deferred Income Taxes |
|
|
26,522 |
|
|
|
16,175 |
|
Goodwill |
|
|
37,571 |
|
|
|
37,571 |
|
Other Intangible Assets, Net |
|
|
19,465 |
|
|
|
19,065 |
|
Other Assets |
|
|
4,262 |
|
|
|
3,764 |
|
|
|
|
|
|
|
|
Total Assets |
|
$ |
469,514 |
|
|
$ |
485,568 |
|
|
|
|
|
|
|
|
See accompanying notes to consolidated financial statements.
F-4
Ladish Co., Inc.
Consolidated Balance Sheets — continued
December 31, 2009 and 2010
(Dollars in Thousands Except Per Share Data)
| |
|
|
|
|
|
|
|
|
| Liabilities and Equity |
|
2009 |
|
|
2010 |
|
Current Liabilities: |
|
|
|
|
|
|
|
|
Accounts Payable |
|
$ |
23,613 |
|
|
$ |
27,317 |
|
Senior Notes |
|
|
5,714 |
|
|
|
15,714 |
|
Accrued Liabilities: |
|
|
|
|
|
|
|
|
Pensions |
|
|
259 |
|
|
|
202 |
|
Postretirement Benefits |
|
|
3,464 |
|
|
|
3,818 |
|
Officers’ Deferred Compensation |
|
|
155 |
|
|
|
328 |
|
Wages and Salaries |
|
|
3,314 |
|
|
|
4,342 |
|
Taxes, Other Than Income Taxes |
|
|
289 |
|
|
|
313 |
|
Interest |
|
|
1,355 |
|
|
|
1,323 |
|
Profit Sharing |
|
|
611 |
|
|
|
3,567 |
|
Paid Progress Billings |
|
|
2,428 |
|
|
|
1,306 |
|
Other |
|
|
4,541 |
|
|
|
5,425 |
|
|
|
|
|
|
|
|
Total Current Liabilities |
|
|
45,743 |
|
|
|
63,655 |
|
|
|
|
|
|
|
|
|
|
Noncurrent Liabilities: |
|
|
|
|
|
|
|
|
Senior Notes |
|
|
84,286 |
|
|
|
68,571 |
|
Pensions |
|
|
69,653 |
|
|
|
57,231 |
|
Postretirement Benefits |
|
|
30,215 |
|
|
|
29,899 |
|
Officers’ Deferred Compensation |
|
|
9,276 |
|
|
|
10,082 |
|
Other Noncurrent Liabilities |
|
|
4,220 |
|
|
|
3,653 |
|
|
|
|
|
|
|
|
Total Liabilities |
|
|
243,393 |
|
|
|
233,091 |
|
|
|
|
|
|
|
|
|
|
Commitments and Contingencies |
|
|
— |
|
|
|
— |
|
|
|
|
|
|
|
|
|
|
Stockholders’ Equity: |
|
|
|
|
|
|
|
|
Common Stock-Authorized 100,000,000, and Issued
15,907,552 Shares at Each Date of $.01 Par Value |
|
|
159 |
|
|
|
159 |
|
Additional Paid-In Capital |
|
|
153,292 |
|
|
|
153,361 |
|
Retained Earnings |
|
|
145,378 |
|
|
|
170,753 |
|
Treasury Stock, 4,548 and 200,000 Shares, Respectively, of
Common Stock at Cost |
|
|
(33 |
) |
|
|
(3,250 |
) |
Accumulated Other Comprehensive Loss |
|
|
(73,214 |
) |
|
|
(69,102 |
) |
Total Stockholders’ Equity |
|
|
225,582 |
|
|
|
251,921 |
|
Noncontrolling Interest in Equity of Subsidiary |
|
|
539 |
|
|
|
556 |
|
|
|
|
|
|
|
|
Total Equity |
|
|
226,121 |
|
|
|
252,477 |
|
|
|
|
|
|
|
|
Total Liabilities and Equity |
|
$ |
469,514 |
|
|
$ |
485,568 |
|
|
|
|
|
|
|
|
See accompanying notes to consolidated financial statements.
F-5
Ladish Co., Inc.
Consolidated Statements of Operations
(Dollars in Thousands Except Per Share Data)
| |
|
|
|
|
|
|
|
|
|
|
|
|
| |
|
Years Ended December 31, |
|
| |
|
2008 |
|
|
2009 |
|
|
2010 |
|
| |
Net Sales |
|
$ |
469,466 |
|
|
$ |
349,832 |
|
|
$ |
403,132 |
|
|
|
|
|
|
|
|
|
|
|
|
|
|
Cost of Sales |
|
|
410,163 |
|
|
|
322,745 |
|
|
|
337,476 |
|
|
|
|
|
|
|
|
|
|
|
|
|
|
|
|
|
|
|
|
|
|
|
|
Gross Profit |
|
|
59,303 |
|
|
|
27,087 |
|
|
|
65,656 |
|
|
|
|
|
|
|
|
|
|
|
|
|
|
Selling, General and Administrative Expenses |
|
|
19,765 |
|
|
|
17,839 |
|
|
|
18,671 |
|
|
|
|
|
|
|
|
|
|
|
|
|
|
|
|
|
|
|
|
|
|
|
|
Income from Operations |
|
|
39,538 |
|
|
|
9,248 |
|
|
|
46,985 |
|
|
|
|
|
|
|
|
|
|
|
|
|
|
Other (Income) Expense: |
|
|
|
|
|
|
|
|
|
|
|
|
Interest Expense |
|
|
1,971 |
|
|
|
5,050 |
|
|
|
5,613 |
|
Other, Net |
|
|
(683 |
) |
|
|
1,062 |
|
|
|
(241 |
) |
|
|
|
|
|
|
|
|
|
|
|
|
|
|
|
|
|
|
|
|
|
|
|
Income Before Income Tax Provision (Benefit) |
|
|
38,250 |
|
|
|
3,136 |
|
|
|
41,613 |
|
|
|
|
|
|
|
|
|
|
|
|
|
|
Income Tax Provision (Benefit) |
|
|
5,876 |
|
|
|
(2,894 |
) |
|
|
16,209 |
|
|
|
|
|
|
|
|
|
|
|
|
|
|
|
|
|
|
|
|
|
|
|
|
Net Income |
|
|
32,374 |
|
|
|
6,030 |
|
|
|
25,404 |
|
|
|
|
|
|
|
|
|
|
|
|
|
|
Noncontrolling Interest in Net Earnings (Loss) of Subsidiary |
|
|
169 |
|
|
|
(64 |
) |
|
|
29 |
|
|
|
|
|
|
|
|
|
|
|
|
|
|
|
|
|
|
|
|
|
|
|
|
Net Income Attributable to Ladish Co., Inc. |
|
$ |
32,205 |
|
|
$ |
6,094 |
|
|
$ |
25,375 |
|
|
|
|
|
|
|
|
|
|
|
|
|
|
|
|
|
|
|
|
|
|
|
|
Earnings Per Share: |
|
|
|
|
|
|
|
|
|
|
|
|
Basic |
|
$ |
2.15 |
|
|
$ |
0.38 |
|
|
$ |
1.61 |
|
Diluted |
|
$ |
2.15 |
|
|
$ |
0.38 |
|
|
$ |
1.61 |
|
See accompanying notes to consolidated financial statements.
F-6
Ladish Co., Inc.
Consolidated Statements of Equity
(Dollars in Thousands Except Per Share Data)
| |
|
|
|
|
|
|
|
|
|
|
|
|
|
|
|
|
|
|
|
|
|
|
|
|
|
|
|
|
|
|
|
|
| |
|
|
|
|
|
|
|
|
|
|
|
|
|
|
|
|
|
|
|
|
|
|
|
|
|
Non- |
|
|
|
|
| |
|
|
|
|
|
|
|
|
|
|
|
|
|
|
|
|
|
|
|
|
|
Accumulated |
|
|
Controlling |
|
|
|
|
| |
|
Common Stock |
|
|
Additional |
|
|
|
|
|
|
Treasury |
|
|
Other |
|
|
Interest in |
|
|
|
|
| |
|
|
|
|
|
Par |
|
|
Paid-in |
|
|
Retained |
|
|
Stock, |
|
|
Comprehensive |
|
|
Equity of |
|
|
|
|
| |
|
Shares |
|
|
Value |
|
|
Capital |
|
|
Earnings |
|
|
at Cost |
|
|
Income (Loss) |
|
|
Subsidiary |
|
|
Total |
|
Balance, December 31, 2007 |
|
|
14,605,591 |
|
|
$ |
146 |
|
|
$ |
125,158 |
|
|
$ |
107,079 |
|
|
$ |
(521 |
) |
|
$ |
(30,308 |
) |
|
$ |
497 |
|
|
$ |
202,051 |
|
|
|
|
|
|
|
|
|
|
|
|
|
|
|
|
|
|
|
|
|
|
|
|
|
|
|
|
|
|
|
|
|
|
Comprehensive Net Income (Loss): |
|
|
|
|
|
|
|
|
|
|
|
|
|
|
|
|
|
|
|
|
|
|
|
|
|
|
|
|
|
|
|
|
Net Income |
|
|
— |
|
|
|
— |
|
|
|
— |
|
|
|
32,205 |
|
|
|
— |
|
|
|
— |
|
|
|
169 |
|
|
|
32,374 |
|
Other Comprehensive Income
(Loss): |
|
|
|
|
|
|
|
|
|
|
|
|
|
|
|
|
|
|
|
|
|
|
|
|
|
|
|
|
|
|
|
|
Foreign Currency Translation
Adjustments |
|
|
— |
|
|
|
— |
|
|
|
— |
|
|
|
— |
|
|
|
— |
|
|
|
(7,519 |
) |
|
|
— |
|
|
|
(7,519 |
) |
Adjustment for Unrealized
Investment Losses, Net of
Tax of $(315) |
|
|
— |
|
|
|
— |
|
|
|
— |
|
|
|
— |
|
|
|
— |
|
|
|
(473 |
) |
|
|
— |
|
|
|
(473 |
) |
Adjustment for Pension &
Post-retirement Plans, Net
of Tax
of $(20,647) |
|
|
— |
|
|
|
— |
|
|
|
— |
|
|
|
— |
|
|
|
— |
|
|
|
(30,971 |
) |
|
|
— |
|
|
|
(30,971 |
) |
|
|
|
|
|
|
|
|
|
|
|
|
|
|
|
|
|
|
|
|
|
|
|
|
|
|
|
|
|
|
|
|
Comprehensive Loss |
|
|
|
|
|
|
|
|
|
|
|
|
|
|
|
|
|
|
|
|
|
|
|
|
|
|
|
|
|
|
(6,589 |
) |
Issuance of Common Stock |
|
|
— |
|
|
|
— |
|
|
|
655 |
|
|
|
— |
|
|
|
475 |
|
|
|
— |
|
|
|
— |
|
|
|
1,130 |
|
Acquisition of Aerex |
|
|
45,750 |
|
|
|
1 |
|
|
|
940 |
|
|
|
— |
|
|
|
— |
|
|
|
— |
|
|
|
— |
|
|
|
941 |
|
Acquisition of Chen-Tech |
|
|
1,256,211 |
|
|
|
12 |
|
|
|
31,808 |
|
|
|
— |
|
|
|
— |
|
|
|
— |
|
|
|
— |
|
|
|
31,820 |
|
Pre-reorganization Deferred Tax
Basis Adjustment |
|
|
— |
|
|
|
— |
|
|
|
(5,498 |
) |
|
|
— |
|
|
|
— |
|
|
|
— |
|
|
|
— |
|
|
|
(5,498 |
) |
Tax Effect Related to Stock Options |
|
|
— |
|
|
|
— |
|
|
|
222 |
|
|
|
— |
|
|
|
— |
|
|
|
— |
|
|
|
— |
|
|
|
222 |
|
|
|
|
|
|
|
|
|
|
|
|
|
|
|
|
|
|
|
|
|
|
|
|
|
|
Balance, December 31, 2008 |
|
|
15,907,552 |
|
|
$ |
159 |
|
|
$ |
153,285 |
|
|
$ |
139,284 |
|
|
$ |
(46 |
) |
|
$ |
(69,271 |
) |
|
$ |
666 |
|
|
$ |
224,077 |
|
|
|
|
|
|
|
|
|
|
|
|
|
|
|
|
|
|
|
|
|
|
|
|
|
|
|
|
|
|
|
|
|
|
Comprehensive Net Income (Loss): |
|
|
|
|
|
|
|
|
|
|
|
|
|
|
|
|
|
|
|
|
|
|
|
|
|
|
|
|
|
|
|
|
Net Income |
|
|
— |
|
|
|
— |
|
|
|
— |
|
|
|
6,094 |
|
|
|
— |
|
|
|
— |
|
|
|
(64 |
) |
|
|
6,030 |
|
Other Comprehensive Income
(Loss): |
|
|
|
|
|
|
|
|
|
|
|
|
|
|
|
|
|
|
|
|
|
|
|
|
|
|
|
|
|
|
|
|
Foreign Currency Translation
Adjustments |
|
|
— |
|
|
|
— |
|
|
|
— |
|
|
|
— |
|
|
|
— |
|
|
|
1,175 |
|
|
|
— |
|
|
|
1,175 |
|
Adjustment for Unrealized
Investment Gains, Net of Tax
of $210 |
|
|
— |
|
|
|
— |
|
|
|
— |
|
|
|
— |
|
|
|
— |
|
|
|
316 |
|
|
|
— |
|
|
|
316 |
|
Adjustment for Pension &
Post-retirement Plans, Net
of Tax
of $(3,623) |
|
|
— |
|
|
|
— |
|
|
|
— |
|
|
|
— |
|
|
|
— |
|
|
|
(5,434 |
) |
|
|
— |
|
|
|
(5,434 |
) |
|
|
|
|
|
|
|
|
|
|
|
|
|
|
|
|
|
|
|
|
|
|
|
|
|
|
|
|
|
|
|
|
Comprehensive Income |
|
|
|
|
|
|
|
|
|
|
|
|
|
|
|
|
|
|
|
|
|
|
|
|
|
|
|
|
|
|
2,087 |
|
Purchase of Subsidiary Shares |
|
|
— |
|
|
|
— |
|
|
|
— |
|
|
|
— |
|
|
|
— |
|
|
|
— |
|
|
|
(63 |
) |
|
|
(63 |
) |
Issuance of Common Stock |
|
|
— |
|
|
|
— |
|
|
|
2 |
|
|
|
— |
|
|
|
13 |
|
|
|
— |
|
|
|
— |
|
|
|
15 |
|
Tax Effect Related to Stock Options |
|
|
— |
|
|
|
— |
|
|
|
5 |
|
|
|
— |
|
|
|
— |
|
|
|
— |
|
|
|
— |
|
|
|
5 |
|
|
|
|
|
|
|
|
|
|
|
|
|
|
|
|
|
|
|
|
|
|
|
|
|
|
Balance, December 31, 2009 |
|
|
15,907,552 |
|
|
$ |
159 |
|
|
$ |
153,292 |
|
|
$ |
145,378 |
|
|
$ |
(33 |
) |
|
$ |
(73,214 |
) |
|
$ |
539 |
|
|
$ |
226,121 |
|
|
|
|
|
|
|
|
|
|
|
|
|
|
|
|
|
|
|
|
|
|
|
|
|
|
|
|
|
|
|
|
|
|
Comprehensive Net Income (Loss): |
|
|
|
|
|
|
|
|
|
|
|
|
|
|
|
|
|
|
|
|
|
|
|
|
|
|
|
|
|
|
|
|
Net Income |
|
|
— |
|
|
|
— |
|
|
|
— |
|
|
|
25,375 |
|
|
|
— |
|
|
|
— |
|
|
|
29 |
|
|
|
25,404 |
|
Other Comprehensive Income
(Loss): |
|
|
|
|
|
|
|
|
|
|
|
|
|
|
|
|
|
|
|
|
|
|
|
|
|
|
|
|
|
|
|
|
Foreign Currency Translation
Adjustments |
|
|
— |
|
|
|
— |
|
|
|
— |
|
|
|
— |
|
|
|
— |
|
|
|
(1,090 |
) |
|
|
— |
|
|
|
(1,090 |
) |
Adjustment for Unrealized
Investment Gains, Net of Tax
of $117 |
|
|
— |
|
|
|
— |
|
|
|
— |
|
|
|
— |
|
|
|
— |
|
|
|
176 |
|
|
|
— |
|
|
|
176 |
|
Adjustment for Pension &
Post-retirement Plans, Net
of Tax
of $3,351 |
|
|
— |
|
|
|
— |
|
|
|
— |
|
|
|
— |
|
|
|
— |
|
|
|
5,026 |
|
|
|
— |
|
|
|
5,026 |
|
|
|
|
|
|
|
|
|
|
|
|
|
|
|
|
|
|
|
|
|
|
|
|
|
|
|
|
|
|
|
|
|
Comprehensive Income |
|
|
|
|
|
|
|
|
|
|
|
|
|
|
|
|
|
|
|
|
|
|
|
|
|
|
|
|
|
|
29,516 |
|
Purchase of Subsidiary Shares |
|
|
— |
|
|
|
— |
|
|
|
— |
|
|
|
— |
|
|
|
— |
|
|
|
— |
|
|
|
(12 |
) |
|
|
(12 |
) |
Purchase of Treasury Stock |
|
|
— |
|
|
|
— |
|
|
|
— |
|
|
|
— |
|
|
|
(3,250 |
) |
|
|
— |
|
|
|
— |
|
|
|
(3,250 |
) |
Issuance of Common Stock |
|
|
— |
|
|
|
— |
|
|
|
14 |
|
|
|
— |
|
|
|
33 |
|
|
|
— |
|
|
|
— |
|
|
|
47 |
|
Tax Effect Related to Stock Options |
|
|
— |
|
|
|
— |
|
|
|
55 |
|
|
|
— |
|
|
|
— |
|
|
|
— |
|
|
|
— |
|
|
|
55 |
|
|
|
|
|
|
|
|
|
|
|
|
|
|
|
|
|
|
|
|
|
|
|
|
|
|
Balance, December 31, 2010 |
|
|
15,907,552 |
|
|
$ |
159 |
|
|
$ |
153,361 |
|
|
$ |
170,753 |
|
|
$ |
(3,250 |
) |
|
$ |
(69,102 |
) |
|
$ |
556 |
|
|
$ |
252,477 |
|
|
|
|
|
|
|
|
|
|
|
|
|
|
|
|
|
|
|
|
|
|
|
|
|
|
See accompanying notes to consolidated financial statements.
F-7
Ladish Co., Inc.
Consolidated Statements of Cash Flows
(Dollars in Thousands)
| |
|
|
|
|
|
|
|
|
|
|
|
|
| |
|
Years Ended December 31, |
|
| |
|
2008 |
|
|
2009 |
|
|
2010 |
|
Cash Flows from Operating Activities: |
|
|
|
|
|
|
|
|
|
|
|
|
Net Income |
|
$ |
32,374 |
|
|
$ |
6,030 |
|
|
$ |
25,404 |
|
Adjustments to Reconcile Net Income to Net Cash Provided by
(Used in) Operating Activities: |
|
|
|
|
|
|
|
|
|
|
|
|
Depreciation |
|
|
13,320 |
|
|
|
15,339 |
|
|
|
15,967 |
|
Amortization of Intangibles |
|
|
— |
|
|
|
546 |
|
|
|
400 |
|
Non-Cash Deferred Compensation |
|
|
(788 |
) |
|
|
527 |
|
|
|
293 |
|
Deferred Income Taxes |
|
|
767 |
|
|
|
(1,838 |
) |
|
|
4,655 |
|
Gain on Purchase of Stock — Noncontrolling Interest |
|
|
— |
|
|
|
(23 |
) |
|
|
(7 |
) |
Loss (Gain) on Disposal of Property, Plant and Equipment |
|
|
(137 |
) |
|
|
308 |
|
|
|
269 |
|
Changes in Assets and Liabilities, Net of Acquired Businesses: |
|
|
|
|
|
|
|
|
|
|
|
|
Accounts Receivable |
|
|
2,595 |
|
|
|
19,405 |
|
|
|
(23,223 |
) |
Inventories |
|
|
8,969 |
|
|
|
36,666 |
|
|
|
(8,071 |
) |
Other Assets |
|
|
3,759 |
|
|
|
2,246 |
|
|
|
4,561 |
|
Accounts Payable and Accrued Liabilities |
|
|
(13,882 |
) |
|
|
(17,421 |
) |
|
|
8,695 |
|
Other Liabilities |
|
|
(21,450 |
) |
|
|
1,331 |
|
|
|
(3,981 |
) |
|
|
|
|
|
|
|
|
|
|
Net Cash Provided by Operating Activities |
|
|
25,527 |
|
|
|
63,116 |
|
|
|
24,962 |
|
|
|
|
|
|
|
|
|
|
|
|
|
|
|
|
|
|
|
|
|
|
|
|
Cash Flows from Investing Activities: |
|
|
|
|
|
|
|
|
|
|
|
|
Additions to Property, Plant and Equipment |
|
|
(49,751 |
) |
|
|
(13,883 |
) |
|
|
(14,558 |
) |
Proceeds from Sale of Property, Plant and Equipment |
|
|
468 |
|
|
|
88 |
|
|
|
189 |
|
Purchase of ZKM Stock — Noncontrolling Interest |
|
|
— |
|
|
|
(37 |
) |
|
|
(5 |
) |
Cash Paid for Acquired Companies, Net of Cash Acquired |
|
|
(40,271 |
) |
|
|
— |
|
|
|
— |
|
Proceeds from Aerex Acquisition Working Capital Adjustment |
|
|
— |
|
|
|
1,200 |
|
|
|
— |
|
|
|
|
|
|
|
|
|
|
|
Net Cash Used in Investing Activities |
|
|
(89,554 |
) |
|
|
(12,632 |
) |
|
|
(14,374 |
) |
|
|
|
|
|
|
|
|
|
|
|
|
|
|
|
|
|
|
|
|
|
|
|
Cash Flows from Financing Activities: |
|
|
|
|
|
|
|
|
|
|
|
|
Borrowings from (Repayment of) Facility |
|
|
21,400 |
|
|
|
(28,900 |
) |
|
|
— |
|
Issuance of Senior Notes |
|
|
50,000 |
|
|
|
— |
|
|
|
— |
|
Repayment of Senior Notes |
|
|
(6,000 |
) |
|
|
— |
|
|
|
(5,715 |
) |
Repayment of Notes Payable |
|
|
(4,610 |
) |
|
|
— |
|
|
|
— |
|
Retirement of Capital Leases |
|
|
— |
|
|
|
(1,660 |
) |
|
|
— |
|
Deferred Financing Costs |
|
|
(299 |
) |
|
|
— |
|
|
|
— |
|
Issuance of Common Stock |
|
|
215 |
|
|
|
15 |
|
|
|
47 |
|
Purchase of Treasury Stock |
|
|
— |
|
|
|
— |
|
|
|
(3,250 |
) |
Increase (Decrease) in Outstanding Checks |
|
|
3,158 |
|
|
|
(4,828 |
) |
|
|
1,743 |
|
|
|
|
|
|
|
|
|
|
|
Net Cash Provided by (Used in) Financing Activities |
|
|
63,864 |
|
|
|
(35,373 |
) |
|
|
(7,175 |
) |
|
|
|
|
|
|
|
|
|
|
|
|
|
|
|
|
|
|
|
|
|
|
|
Effect of Exchange Rate Change on Cash and Cash Equivalents |
|
|
(886 |
) |
|
|
(97 |
) |
|
|
5 |
|
|
|
|
|
|
|
|
|
|
|
Increase (Decrease) in Cash and Cash Equivalents |
|
|
(1,049 |
) |
|
|
15,014 |
|
|
|
3,418 |
|
|
|
|
|
|
|
|
|
|
|
|
|
|
Cash and Cash Equivalents, Beginning of Year |
|
|
5,952 |
|
|
|
4,903 |
|
|
|
19,917 |
|
|
|
|
|
|
|
|
|
|
|
|
|
|
|
|
|
|
|
|
|
|
|
|
Cash and Cash Equivalents, End of Year |
|
$ |
4,903 |
|
|
$ |
19,917 |
|
|
$ |
23,335 |
|
|
|
|
|
|
|
|
|
|
|
|
|
|
|
|
|
|
|
|
|
|
|
|
Supplemental Cash Flow Information: |
|
|
|
|
|
|
|
|
|
|
|
|
Income Taxes Paid (Refunded) |
|
$ |
8,417 |
|
|
$ |
(3,255 |
) |
|
$ |
6,729 |
|
Interest Paid |
|
$ |
3,734 |
|
|
$ |
6,008 |
|
|
$ |
5,668 |
|
|
|
|
|
|
|
|
|
|
|
|
|
|
Non-Cash Supplemental Information: |
|
|
|
|
|
|
|
|
|
|
|
|
Issuance of Stock for Acquisitions |
|
$ |
32,761 |
|
|
$ |
— |
|
|
$ |
— |
|
See accompanying notes to consolidated financial statements
F-8
Ladish Co., Inc.
Notes to Consolidated Financial Statements
(Dollars in Thousands Except Per Share Data)
| |
|
Ladish Co., Inc. (the “Company”), headquartered in Cudahy, Wisconsin, engineers, produces and
markets high-strength, high technology forged and cast metal components for a wide variety of
load-bearing and fatigue-resisting applications in the jet engine, aerospace and industrial
markets, for both domestic and international customers. The Company’s manufacturing site in
Irvine, California produces forgings for commercial and military jet engine applications. The
Company’s manufacturing site in Albany, Oregon produces cast metal components, the Company’s
manufacturing site in Stalowa Wola, Poland produces forgings for the industrial and aerospace
markets and its sites in Windsor, Connecticut and western Wisconsin are finished machining
operations. The Company operates as a single segment. Net sales to jet engine, aerospace and
industrial customers were approximately 51%, 26% and 23% in 2008, 55%, 33% and 12% in 2009 and
49%, 36% and 15% in 2010, respectively, of total company net sales. |
| |
|
In 2008, 2009 and 2010, the Company had three customers that collectively accounted for
approximately 47%, 56% and 56%, respectively, of total Company net sales. Net sales to
Rolls-Royce were 23%, 26% and 26%, United Technologies 15%, 19% and 17% and General Electric
9%, 11% and 13% of total Company net sales for the respective years. |
| |
|
U.S. exports accounted for approximately 46%, 46% and 43% of total Company net sales in 2008,
2009 and 2010, respectively, with exports to England constituting approximately 25%, 26% and
26%, respectively, of total Company net sales. |
| |
|
As of December 31, 2010, approximately 48% of the Company’s domestic employees were represented
by one of seven collective bargaining units. New collective bargaining agreements were
negotiated with six of these units during 2006 and negotiations with one unit were successfully
concluded in 2007. Internationally, the Company had approximately 460 employees in Poland as
of December 31, 2010, most of whom are represented by the Solidarity trade union. |
| (2) |
|
Summary of Significant Accounting Policies |
| |
|
|
The consolidated financial statements include the accounts of the Company and all of its
subsidiaries, including the results of operations of Aerex and Chen-Tech from their
respective acquisition dates. All significant intercompany accounts and transactions have
been eliminated in consolidation. |
| |
|
|
The assets and liabilities of the Company’s foreign subsidiary are translated at year-end
exchange rates and the related statements of earnings are translated at the average
exchange rates for the respective years. Gains or losses resulting from translating
foreign currencies are recorded as accumulated other comprehensive income or loss, a
separate component of stockholders’ equity. |
| |
|
|
Gains or losses resulting from foreign currency transactions (transactions denominated in
a currency other than the Company’s local currency) are included in net earnings, but are
not significant in the years presented. |
F-9
| |
(b) |
|
Cash and Cash Equivalents |
| |
|
|
Cash in excess of daily requirements is invested in marketable securities consisting of
commercial paper and money market instruments which mature in three months or less. Such
investments are deemed to be cash equivalents due to the high liquidity and short term
duration of such money market accounts. The Company maintains deposits in financial
institutions that consistently exceed the FDIC limit of $250. At December 31, 2010, the
Company had deposits of $23,085 which exceeded the FDIC limit. The Company has not
experienced any losses in such accounts and management believes the Company is not at
significant risk. |
| |
|
|
Outstanding payroll and accounts payable checks related to certain bank accounts are
recorded as accounts payable on the balance sheets. These checks amounted to $105 and
$1,848 as of December 31, 2009 and 2010, respectively. |
| |
|
|
Inventories are stated at the lower of cost, first-in, first-out (FIFO) basis, or market.
Inventory values include material and conversion costs. |
| |
|
|
Inventories for the years ended December 31, 2009 and 2010 consist of the following: |
| |
|
|
|
|
|
|
|
|
| |
|
December 31, |
|
| |
|
2009 |
|
|
2010 |
|
Raw Materials |
|
$ |
18,038 |
|
|
$ |
15,259 |
|
Work-In-Process and Finished |
|
|
77,209 |
|
|
|
87,801 |
|
|
|
|
|
|
|
|
|
|
|
95,247 |
|
|
|
103,060 |
|
Less Progress Payments |
|
|
(2,550 |
) |
|
|
(2,367 |
) |
|
|
|
|
|
|
|
Total Inventories |
|
$ |
92,697 |
|
|
$ |
100,693 |
|
|
|
|
|
|
|
|
| |
|
|
The Company is operating at less than normal capacity, as a result the Company had
unabsorbed fixed expenses of approximately $15,700, $16,600 and $16,100 in the years
ending December 31, 2008, 2009 and 2010, respectively. |
| |
(e) |
|
Property, Plant and Equipment |
| |
|
|
Additions to property, plant, and equipment are recorded at cost. Normal repair and
maintenance costs are expensed as incurred. Depreciation is provided using the
straight-line method over the estimated useful lives of the assets, as follows: |
| |
|
|
|
|
|
Land Improvements |
|
39 years |
|
Buildings and Improvements |
|
39 years |
|
Machinery and Equipment |
|
|
5 to 25 years |
|
| |
|
|
Interest is capitalized in connection with construction of plant and equipment. Interest
capitalization ceases when the construction of the asset is substantially complete and the
asset is available for use. Interest capitalization was $2,418, $953 and $43 in 2008,
2009 and 2010, respectively. |
| |
(f) |
|
Goodwill and Other Intangible Assets |
| |
|
|
Goodwill represents the cost of acquired net assets in excess of their fair market values.
Goodwill and other intangible assets with indefinite useful lives are not amortized but
are tested
for impairment at least annually. Intangible assets with estimable useful lives are
amortized over their respective estimated useful lives and also reviewed at least annually
for impairment. |
F-10
| |
|
|
A two-step impairment test is required to identify potential goodwill impairment and
measure the amount of the goodwill impairment loss to be recognized. In the first step,
the fair value of each reporting unit is compared to its carrying value to determine if
the goodwill is impaired. If the fair value of the reporting unit exceeds the carrying
value of the net assets assigned to that unit, then goodwill is not impaired and the
second step is not required. If the carrying value of the net assets assigned to the
reporting unit exceeds its fair value, then the second step is performed in order to
determine the implied fair value of the reporting unit’s goodwill and an impairment loss
is recorded for an amount equal to the difference between the implied fair value and the
carrying value of the goodwill. |
| |
|
|
For the purpose of goodwill analysis, the Company has only one reporting unit. Goodwill
amounted to $37,571 at December 31, 2009 and 2010. There was a significant increase in
goodwill in 2008 due to the acquisitions of Aerex and Chen-Tech. A $1,000 opening balance
sheet deferred tax asset related to the Chen-Tech acquisition was charged to Goodwill in
lieu of taxes upon realization in 2009. Goodwill has been subjected to fair value
impairment tests as of September 30, 2008, 2009 and 2010 and no impairments were
recognized. |
| |
|
|
The Company conducted its annual impairment analysis as of September 30, 2010. The fair
value of the Company as measured by the Company market capitalization plus a control
premium exceeded its carrying value. The Company reviewed the analysis at year-end and
concluded it remained accurate. |
| |
|
|
The control premium that a third party would be willing to pay to obtain a controlling
interest in the Company was considered when determining fair value. Management considered
recent transactions with comparable companies in the industry, and possible synergies to a
market participant. The Company also considered the valuation ATI was proposing for the
Company in a merged transaction. Management concluded there was a reasonable basis for
the excess of estimated fair value of the Company over its market capitalization. |
| |
|
|
The estimated fair value requires judgment and the use of estimates by management.
Potential factors requiring assessment include a decline in the Company’s stock price and
variance in results of operations from projections. Any of these potential factors may
cause the Company to re-evaluate goodwill during any quarter throughout the year. If an
impairment charge were to be taken for goodwill it would be a non-cash charge and would
not impact the Company’s cash position or cash flows, however, such a charge could have a
material impact to equity and the statement of operations. |
| |
|
|
The Company has amortizable customer relationships of $19,465 and $19,065 at December 31,
2009 and 2010, respectively, included in other intangible assets, that are being amortized
over 50 years. The Company recorded amortization expense of $0, $546 and $400 for 2008,
2009 and 2010, respectively. The 2009 amortization expense of $546 included partial year
expense of $146 from 2008. The Company estimates annual amortization expense of $400 in
2011, and $1,600 in years 2012 through 2015. |
| |
|
|
The Company monitors the recoverability of the carrying value of its long-lived assets.
An impairment charge is recognized when an indicator of impairment occurs and the expected
net undiscounted future cash flows from an asset’s use (including any proceeds from
disposition) are less than the asset’s carrying value and the asset’s carrying value
exceeds its fair value.
Assets to be disposed of by sale are stated at the lower of their fair values or carrying
amounts and depreciation or amortization is no longer recognized. |
F-11
| |
(h) |
|
Fair Values of Financial Instruments |
| |
|
|
Authoritative guidance defines fair value, establishes a framework for measuring fair
value in accounting principles generally accepted in the United States of America, and
expands disclosures about fair value measurements. The provisions of this standard apply
to other accounting pronouncements that require or permit fair value measurements and are
to be applied prospectively with limited exceptions. |
| |
|
|
Fair value is defined as the price that would be received to sell an asset or paid to
transfer a liability in an orderly transaction between market participants at the
measurement date. This standard is now the single source in GAAP for the definition of
fair value, except for the fair value of leased property. A fair value hierarchy
distinguishes between (1) market participant assumptions developed based on market data
obtained from independent sources (observable inputs) and (2) an entity’s own assumptions,
about market participant assumptions, that are developed based on the best information
available in the circumstances (unobservable inputs). The fair value hierarchy consists
of three broad levels, which gives the highest priority to unadjusted quoted prices in
active markets for identical assets or liabilities (Level 1) and the lowest priority to
unobservable inputs (Level 3). The three levels of the fair value hierarchy are described
below: |
| |
Level 1 |
|
Unadjusted quoted prices in active markets that are accessible at the
measurement date for identical, unrestricted assets or liabilities. |
| |
Level 2 |
|
Inputs other than quoted prices included within Level 1 that are
observable for the asset or liability, either directly or indirectly, including
quoted prices for similar assets or liabilities in active markets; quoted prices for
identical or similar assets or liabilities in markets that are not active; inputs
other than quoted prices that are observable for the asset or liability (e.g.,
interest rates); and inputs that are derived principally from or corroborated by
observable market data by correlation or other means. |
| |
Level 3 |
|
Inputs that are both significant to the fair value measurement and
unobservable. These inputs rely on management’s own assumptions about the
assumptions that market participants would use in pricing the asset or liability.
(The unobservable inputs are developed based on the best information available in the
circumstances and may include the Company’s own data.)
|
F-12
| |
|
|
The following table presents the Company’s fair value hierarchy for those assets and
liabilities measured at fair value on a recurring basis as of December 31, 2009 and 2010: |
| |
|
|
|
|
|
|
|
|
|
|
|
|
|
|
|
|
| |
|
Quoted |
|
|
Significant |
|
|
|
|
|
|
|
| |
|
Prices in |
|
|
Other |
|
|
Significant |
|
|
|
|
| Fair Values at |
|
Active |
|
|
Observable |
|
|
Unobservable |
|
|
|
|
| December 31, 2009 |
|
Markets |
|
|
Inputs |
|
|
Inputs |
|
|
|
|
| |
|
Level 1 |
|
|
Level 2 |
|
|
Level 3 |
|
|
Total |
|
Pension Plan Assets |
|
|
|
|
|
|
|
|
|
|
|
|
|
|
|
|
Money Market Accounts |
|
$ |
3,734 |
|
|
$ |
— |
|
|
$ |
— |
|
|
$ |
3,734 |
|
US Government Issues |
|
|
15,262 |
|
|
|
16,290 |
|
|
|
— |
|
|
|
31,552 |
|
Corporate Issues |
|
|
— |
|
|
|
29,632 |
|
|
|
— |
|
|
|
29,632 |
|
Foreign Issues |
|
|
— |
|
|
|
6,769 |
|
|
|
— |
|
|
|
6,769 |
|
Municipal Issues |
|
|
— |
|
|
|
24 |
|
|
|
— |
|
|
|
24 |
|
Domestic Common Stocks |
|
|
64,534 |
|
|
|
— |
|
|
|
— |
|
|
|
64,534 |
|
Foreign Stocks |
|
|
695 |
|
|
|
— |
|
|
|
— |
|
|
|
695 |
|
Mutual Funds |
|
|
6,027 |
|
|
|
— |
|
|
|
— |
|
|
|
6,027 |
|
|
|
|
|
|
|
|
|
|
|
|
|
|
Sub-Total |
|
$ |
90,252 |
|
|
$ |
52,715 |
|
|
$ |
— |
|
|
$ |
142,967 |
|
|
|
|
|
|
|
|
|
|
|
|
|
|
|
|
|
|
|
|
|
|
|
|
|
|
|
|
|
|
|
Investments |
|
|
|
|
|
|
|
|
|
|
|
|
|
|
|
|
Money Market Accounts |
|
$ |
1,524 |
|
|
|
— |
|
|
|
— |
|
|
$ |
1,524 |
|
Mutual Funds |
|
|
2,199 |
|
|
|
— |
|
|
|
— |
|
|
|
2,199 |
|
|
|
|
|
|
|
|
|
|
|
|
|
|
Sub-Total |
|
$ |
3,723 |
|
|
$ |
— |
|
|
$ |
— |
|
|
$ |
3,723 |
|
|
|
|
|
|
|
|
|
|
|
|
|
|
| |
Total |
|
$ |
93,975 |
|
|
$ |
52,715 |
|
|
$ |
— |
|
|
$ |
146,690 |
|
|
|
|
|
|
|
|
|
|
|
|
|
|
| |
|
|
|
|
|
|
|
|
|
|
|
|
|
|
|
|
| |
|
Quoted |
|
|
Significant |
|
|
|
|
|
|
|
| |
|
Prices in |
|
|
Other |
|
|
Significant |
|
|
|
|
| Fair Values at |
|
Active |
|
|
Observable |
|
|
Unobservable |
|
|
|
|
| December 31, 2010 |
|
Markets |
|
|
Inputs |
|
|
Inputs |
|
|
|
|
| |
|
Level 1 |
|
|
Level 2 |
|
|
Level 3 |
|
|
Total |
|
Pension Plan Assets |
|
|
|
|
|
|
|
|
|
|
|
|
|
|
|
|
Money Market Accounts |
|
$ |
2,976 |
|
|
$ |
— |
|
|
$ |
— |
|
|
$ |
2,976 |
|
US Government Issues |
|
|
26,506 |
|
|
|
10,991 |
|
|
|
— |
|
|
|
37,497 |
|
Corporate Issues |
|
|
— |
|
|
|
27,508 |
|
|
|
— |
|
|
|
27,508 |
|
Foreign Issues |
|
|
— |
|
|
|
7,488 |
|
|
|
— |
|
|
|
7,488 |
|
Municipal Issues |
|
|
— |
|
|
|
771 |
|
|
|
— |
|
|
|
771 |
|
Domestic Common Stock |
|
|
79,354 |
|
|
|
— |
|
|
|
— |
|
|
|
79,354 |
|
Foreign Stocks |
|
|
1,168 |
|
|
|
— |
|
|
|
— |
|
|
|
1,168 |
|
Mutual Funds |
|
|
5,658 |
|
|
|
— |
|
|
|
— |
|
|
|
5,658 |
|
|
|
|
|
|
|
|
|
|
|
|
|
|
Sub-Total |
|
$ |
115,662 |
|
|
$ |
46,758 |
|
|
$ |
— |
|
|
$ |
162,420 |
|
|
|
|
|
|
|
|
|
|
|
|
|
|
|
|
|
|
|
|
|
|
|
|
|
|
|
|
|
|
|
Investments |
|
|
|
|
|
|
|
|
|
|
|
|
|
|
|
|
Money Market Accounts |
|
$ |
81 |
|
|
|
— |
|
|
|
— |
|
|
$ |
81 |
|
Mutual Funds |
|
|
3,273 |
|
|
|
— |
|
|
|
— |
|
|
|
3,273 |
|
|
|
|
|
|
|
|
|
|
|
|
|
|
Sub-Total |
|
$ |
3,354 |
|
|
$ |
— |
|
|
$ |
— |
|
|
$ |
3,354 |
|
|
|
|
|
|
|
|
|
|
|
|
|
|
| |
Total |
|
$ |
119,016 |
|
|
$ |
46,758 |
|
|
$ |
— |
|
|
$ |
165,774 |
|
|
|
|
|
|
|
|
|
|
|
|
|
|
| |
|
|
The Company considers the carrying amounts of cash and cash equivalents, accounts
receivable and accounts payable to approximate fair value because of the short maturities
of these financial instruments. The fair values of the Senior Notes do not materially
differ from their carrying values. |
F-13
| |
(i) |
|
Revenue Recognition and Accounts Receivable |
| |
|
|
Sales revenue is recognized when the title and risk of loss have passed to the customer,
there is pervasive evidence of an arrangement, delivery has occurred or the service has
been provided,
the sale price is determinable and collectibility is reasonably assured. This occurs at
the time of shipment. Net sales include freight out as well as reductions for returns and
allowances, and sales discounts. Progress payments on contracts are generally recognized
as reductions of the related inventory costs. Progress payments in excess of inventory
costs are reflected as a liability. The Company does not recognize revenue from the
disposal of by-products. Any proceeds received from by-product disposal are considered an
offset to cost of sales. The Company recognized by-product credits of $14,200, $6,300 and
$13,100 in the years ending December 31, 2008, 2009 and 2010, respectively. The Company
generally grants uncollateralized credit to customers on an individual basis based upon
the customer’s financial condition and credit history. Credit is typically on net 30-day
terms and progress payments are frequently required for customers with long production
cycles to minimize credit risk. The Company’s allowance for doubtful accounts is based on
a review of sales reports, open deduction reports, trends in collections, historical
experience and existing economic conditions. Bad debt write-offs occur upon notice of
insolvency or other evidence of business closure. |
| |
|
|
Deferred income taxes are accounted for under the asset and liability method whereby
deferred tax assets and liabilities are recognized for the future tax consequences
attributable to differences between the financial statement carrying amounts of existing
assets and liabilities and their respective tax bases. Deferred tax assets and
liabilities are measured using enacted tax rates. Deferred income tax provisions or
benefits are based on the change in the deferred tax assets and liabilities from period to
period. |
| |
|
|
There are many transactions and calculations where the ultimate tax determination is
uncertain and the Company must exercise its judgment in determining its provision for
income taxes and recording the related assets and liabilities. The FASB has issued
guidance for how a company should recognize, measure, present, and disclose in its
financial statements, uncertain tax positions that a company has taken or expects to take
on a return. The Company has adopted this guidance, and as such, accruals for tax
contingencies are provided for accordingly. |
| |
|
|
The preparation of financial statements in conformity with generally accepted accounting
principles in the United States of America requires management to make estimates and
assumptions that affect the reported amounts of assets and liabilities and disclosure of
contingent assets and liabilities at the date of the financial statements and the reported
amounts of revenues and expenses during the reporting periods. Actual results will likely
differ from those estimates, but management believes such differences are not material. |
| |
|
|
Certain reclassifications have been made to the 2008 and 2009 financial statements to
conform with the 2010 presentation. |
F-14
| |
(m) |
|
New Accounting Pronouncements |
| |
|
|
In January 2010, the FASB issued Accounting Standards Update (“ASU”) 2010-06, Fair Value
Measurements and Disclosures — Improving Disclosures about Fair Value Measurements, (“ASU
2010-06”), that amends Accounting Standards Codification (“ASC”) Subtopic 820-10, Fair
Value Measurements and Disclosures — Overall, and requires reporting entities to disclose
(1) the amount of significant transfers in and out of Level 1 and Level 2 fair value
measurements and describe the reasons for the transfers, and (2) separate information
about purchases, sales, issuance and settlements in the reconciliation of fair value
measurements
using significant unobservable inputs (Level 3). ASU 2010-06 also requires reporting
entities to provide fair value measurement disclosures for each class of assets and
liabilities and disclose the inputs and valuation techniques for fair value measurements
that fall within Levels 2 and 3 of the fair value hierarchy. These disclosures and
clarification are effective for interim and annual reporting periods beginning after
December 15, 2009, except for the disclosures about purchases, sales, issuance, and
settlements in the roll forward of activity in Level 3 fair value measurements. Those
disclosures are effective for fiscal years beginning after December 15, 2010 and for
interim periods within those fiscal years. The Company adopted the provisions of ASU
2010-06 and the provisions of ASU 2010-06 did not have a material impact on the Company’s
consolidated financial statements. |
| |
|
|
In February 2010, the FASB issued ASU 2010-09, Subsequent Events — Amendments to Certain
Recognition and Disclosure Requirements, (“ASU 2010-09”), that amends ASC Subtopic 855-10,
Subsequent Events — Overall (“ASC 855-10”). ASU 2010-09 requires an SEC filer to
evaluate subsequent events through the date that the financial statements are issued but
removed the requirement to disclose this date in the notes to the entity’s financial
statements. The amendments are effective upon issuance of the final update and
accordingly, the Company has adopted the provisions of ASU 2010-09. The adoption of these
provisions did not have a material impact on the Company’s consolidated financial
statements. |
| |
|
|
In December 2010, the FASB issued ASU 2010-28, Intangibles — Goodwill and Other — When
to Perform Step 2 of the Goodwill Impairment test for Reporting Units with Zero or
Negative Carrying Amounts, (“ASU 2010-28”), that amends ASC Subtopic 350-20, Intangibles
— Goodwill and Other, and requires entities with reporting units that have carrying
amounts that are zero or negative to assess whether it is more likely than not that the
reporting units’ goodwill is impaired. In considering whether it is more likely than not
that goodwill impairment exists, the entities shall evaluate whether there are adverse
qualitative factors. If the entity determines that it is more likely than not that the
goodwill of one or more of its reporting units is impaired, the entity should perform Step
2 of the goodwill impairment test for those reporting units. ASU 2010-08 is effective for
fiscal years, and interim periods within those fiscal years, beginning after December 15,
2010. Early adoption is not permitted. The adoption of these provisions is not expected
to have a material impact on the Company’s consolidated financial statements. |
| |
|
|
In December 2010, the FASB issued ASU 2010-29, Business Combinations — Disclosure of
Supplementary Pro Forma Information for Business Combinations, (“ASU 2010-29”), that
amends ASC Subtopic 805-50, Business Combinations — Disclosures, and requires public
entities that are required to present comparative financial statements to disclose revenue
and earnings of the combined entity as though the business combination that occurred
during the current year had occurred as of the beginning of the comparable prior annual
reporting period only. The amendment also requires public entities to include a
description of the nature and amount of material, nonrecurring pro forma adjustments
directly attributable to the business combination included in the reported pro forma
revenue and earnings. The Company adopted the provisions of ASU 2010-29. The adoption of
these provisions did not have a material impact on the Company’s consolidated financial
statements. |
| |
|
|
Investments in marketable securities are stated at fair value and are included in cash and
cash equivalents on the balance sheet. Investments with no readily determinable fair
value are carried at cost. Fair value is determined using quoted market prices at the end
of the reporting period and, when appropriate, exchange rates at that date. Unrealized
gains and losses on marketable securities classified as available-for-sale are recorded in
accumulated other comprehensive income, net of tax. If the decline in fair value is
judged to be other-than-temporary, the cost basis of the security is written down to fair value and the amount of
the write-down is included in the consolidated statements of operations. |
F-15
| |
|
|
Investment securities are exposed to various risks including, but not limited to, interest
rate and market and credit risks. Due to the level of risks associated with certain
investment securities, it is at least reasonably possible that changes in the values of
investment securities will occur in the near term. |
| |
|
|
The Company regularly reviews its investments to determine whether a decline in fair value
below the cost basis is other-than-temporary. To determine whether a decline in value is
other-than-temporary, the Company evaluates several factors, including current economic
environment, market conditions, operational and financial performance of the investee, and
other specific factors relating to the business underlying the investment, including
business outlook of the investee, future trends in the investee’s industry and the
Company’s intent to carry the investment for a sufficient period of time for any recovery
in fair value. If a decline in value is deemed as other-than-temporary, the Company
records reductions in carrying values to estimated fair values, which are determined based
on quoted market prices if available or on one or more of the valuation methods such as
pricing models using historical and projected financial information, liquidation values,
and values of other comparable public companies. |
| |
|
|
Investments, all of which are classified as available-for-sale, are stated at fair value
based on market quotes, when available. Unrealized gains and losses, net of deferred
taxes, are recorded as a component of other comprehensive income. |
| |
|
|
The Company has domestic noncontributory defined benefit pension plans (“Plans”) covering
a number of its employees. Plans covering salaried and management employees provide
pension benefits that are based on the highest five consecutive years of an employee’s
compensation during the last ten years prior to retirement. Plans covering hourly
employees and union members generally provide benefits of stated amounts for each year of
service. The Company’s funding policy is to contribute annually an amount equal to or
greater than the minimum amount required under the Employee Retirement Income Security Act
of 1974. The Company’s annual measurement date is December 31. |
| |
(p) |
|
Postretirement Benefits |
| |
|
|
A number of the Company’s employees are provided certain postretirement healthcare and
life insurance benefits. The employees may become eligible for these benefits when they
retire. The Company accrues, as current costs, the future lifetime retirement benefits
for both active and retired employees and their dependents. Steps have been taken by the
Company to reduce the amount of the future obligation for pensions and postretirement
healthcare benefits of future retirees by capping the amount of funds payable on behalf of
the retirees. |
| |
(q) |
|
Officers’ Deferred Compensation |
| |
|
|
As a part of the total compensation program at the Company, a number of nonqualified plans
have been adopted which entail a portion of deferred compensation. For the individuals
participating in these deferred compensation programs, the deferred portion of their
salary and/ or incentive pay has been placed into a Rabbi Trust for the benefit of those
individuals until such time as the assets are payable pursuant to the terms of the
deferred compensation programs. In the event of a liquidation of the assets of the
Company, the assets placed in the Rabbi Trusts are subject to the general claims of
creditors of the Company. |
F-16
| |
|
On May 16, 2006, the Company sold $40,000 of Series B Notes in a private placement to certain
institutional investors. The Series B Notes are unsecured and bear interest at a rate of 6.14%
per annum with interest being paid semiannually. The Series B Notes have a ten-year duration
with the principal amortizing equally over the duration after the fourth year. The first
amortization payment of $5,714 was made on May 17, 2010. |
| |
|
On September 2, 2008, the Company sold $50,000 of Series C Notes in a private placement to
certain institutional investors. The Series C Notes are unsecured and bear interest at a rate
of 6.41% per annum with interest being paid semiannually. The Series C Notes have a seven-year
duration with the principal amortizing equally over the duration after the third year. |
| |
|
The Company’s Series B and Series C Notes contain financial covenants which (a) limit the
incurrence of certain additional debt; (b) require a certain level of consolidated adjusted net
worth; (c) require a minimum fixed charges coverage ratio; and (d) require a limited amount of
funded debt to consolidated cash flow. The covenant on incurrence of additional debt limits
funded debt to 60% of total capitalization. At December 31, 2010, funded debt at Ladish was at
23% of total capitalization. This covenant also limits priority debt to 20% of adjusted net
worth. Ladish had no priority debt at December 31, 2010. The covenant on adjusted net worth
requires a minimum of $119,173. At December 31, 2010, Ladish had $286,194 of adjusted net
worth. The covenant on fixed charges coverage ratio requires that consolidated cash flow to
fixed charges be a minimum of 2.00. The Company’s fixed charges coverage ratio at December 31,
2010 was 11.33. The final covenant on funded debt to consolidated cash flow allows for a
maximum level of 4.00. At December 31, 2010, the Company’s actual level was 0.96. The Note
Agreement for the Series B and Series C Notes also contains customary representations and
warranties and events of default. |
| |
|
The Company and a syndicate of lenders entered into a revolving credit facility (the
“Facility”), which was most recently renewed on April 8, 2010. The Facility consists of a
$35,000 unsecured revolving line of credit which bears interest at a rate of LIBOR plus 2.00%
or at a base rate. At December 31, 2010, there were no borrowings under the Facility and
$35,000 of credit was available pursuant to the terms of the Facility. The Facility has a
maturity date of April 7, 2011. |
| |
|
The Company and the syndicate of lenders participating in the Facility entered into Amendment
No. 2 to the Facility. This amendment, effective as of April 8, 2010, modified the covenant on
minimum EBITDA by deleting that covenant and substituting in its place a covenant on the ratio
of net debt to EBITDA. The covenant requires a maximum ratio of net debt to EBITDA to be no
more than 3.50:1. As of December 31, 2010, the Company’s ratio was 0.96:1. The Facility also
contains a covenant that requires a minimum fixed charge coverage ratio of 1.7x. As of
December 31, 2010, the Company had a fixed charge coverage ratio of 4.71x. |
| |
|
At December 31, 2010, the Company was in compliance with all covenants in the Series B and
Series C Notes and the Facility. |
| |
|
|
|
|
|
|
|
|
|
|
|
|
|
| Long Term Debt Repayment Schedule |
|
| Senior Notes |
|
| Series B |
|
|
|
|
|
Series C |
|
|
|
|
|
| $ |
5,714 |
|
May 16, 2011 |
|
$ |
10,000 |
|
|
September 2, 2011 |
| $ |
5,714 |
|
May 16, 2012 |
|
$ |
10,000 |
|
|
September 2, 2012 |
| $ |
5,714 |
|
May 16, 2013 |
|
$ |
10,000 |
|
|
September 2, 2013 |
| $ |
5,714 |
|
May 16, 2014 |
|
$ |
10,000 |
|
|
September 2, 2014 |
| $ |
5,714 |
|
May 16, 2015 |
|
$ |
10,000 |
|
|
September 2, 2015 |
| $ |
5,715 |
|
May 16, 2016 |
|
|
|
|
|
|
|
|
F-17
| |
|
The total interest incurred by the Company amounted to $4,389, $6,003 and $5,656 in 2008, 2009
and 2010, respectively. The capacity expansion programs at the Company resulted in higher
interest capitalization in 2008. Debt and interest declined in 2010 as the Company began to
amortize the Series B Senior Notes. |
| |
|
The following table reflects the Company’s treatment of interest for the years 2008, 2009 and
2010: |
| |
|
|
|
|
|
|
|
|
|
|
|
|
| |
|
2008 |
|
|
2009 |
|
|
2010 |
|
Interest Expensed |
|
$ |
1,971 |
|
|
$ |
5,050 |
|
|
$ |
5,613 |
|
Interest Capitalized |
|
|
2,418 |
|
|
|
953 |
|
|
|
43 |
|
|
|
|
|
|
|
|
|
|
|
Total |
|
$ |
4,389 |
|
|
$ |
6,003 |
|
|
$ |
5,656 |
|
|
|
|
|
|
|
|
|
|
|
| |
|
|
The treasury shares represent shares of common stock of the Company which the Company
repurchased on the open market. The value reflects the purchase price for those shares. |
| |
|
|
The Company had a Long-Term Incentive Plan (the “Stock Option Program”) that covered
certain employees. Under the Stock Option Program, incentive stock options for up to
983,333 shares may be granted to employees of the Company of which 943,833 options have
been granted. These options expire ten years from the grant date. For the years 2009 and
2010, no options were granted under the Stock Option Program. As of December 31, 2010,
all options granted under the Stock Option Program have been exercised. |
| |
|
|
During 2008, 2009 and 2010, 26,000, 1,788 and 4,548 shares of common stock, respectively,
were issued from treasury stock for the exercise of stock options. The shares had a cost
of $7.32 per share. In 2008, 2009 and 2010, the difference of $24, $2 and $14,
respectively, between the cost of the shares released from treasury stock and the cash
proceeds from the exercise of stock options was credited to additional paid-in capital, a
component of stockholders’ equity. During the years ending December 31, 2008, 2009 and
2010, the Company received $215, $15 and $47, respectively, from the exercise of employee
stock options. |
| |
|
|
A summary of options for 2008, 2009 and 2010 is as follows: |
| |
|
|
|
|
|
|
|
|
|
|
|
|
|
|
|
|
|
|
|
|
|
|
|
|
| |
|
2008 |
|
|
2009 |
|
|
2010 |
|
| |
|
|
|
|
|
Weighted |
|
|
|
|
|
|
Weighted |
|
|
|
|
|
|
Weighted |
|
| |
|
|
|
|
|
Average |
|
|
|
|
|
|
Average |
|
|
|
|
|
|
Average |
|
| |
|
|
|
|
|
Exercise |
|
|
|
|
|
|
Exercise |
|
|
|
|
|
|
Exercise |
|
| |
|
Options |
|
|
Price |
|
|
Options |
|
|
Price |
|
|
Options |
|
|
Price |
|
Outstanding at
Beginning of Year |
|
|
32,336 |
|
|
$ |
8.57 |
|
|
|
6,336 |
|
|
$ |
9.87 |
|
|
|
4,548 |
|
|
$ |
10.50 |
|
Granted |
|
|
— |
|
|
|
— |
|
|
|
— |
|
|
|
— |
|
|
|
— |
|
|
|
— |
|
Forfeited |
|
|
— |
|
|
|
— |
|
|
|
— |
|
|
|
— |
|
|
|
— |
|
|
|
— |
|
Exercised |
|
|
(26,000 |
) |
|
|
8.25 |
|
|
|
(1,788 |
) |
|
|
8.25 |
|
|
|
(4,548 |
) |
|
|
10.50 |
|
|
|
|
|
|
|
|
|
|
|
|
|
|
|
|
|
|
|
|
|
|
|
Outstanding at
End of Year |
|
|
6,336 |
|
|
|
9.87 |
|
|
|
4,548 |
|
|
|
10.50 |
|
|
|
— |
|
|
|
— |
|
|
|
|
|
|
|
|
|
|
|
|
|
|
|
|
|
|
|
|
|
|
|
Exercisable at
End of Year |
|
|
6,336 |
|
|
$ |
9.87 |
|
|
|
4,548 |
|
|
$ |
10.50 |
|
|
|
— |
|
|
$ |
— |
|
|
|
|
|
|
|
|
|
|
|
|
|
|
|
|
|
|
|
|
|
|
|
| |
|
|
There were no options outstanding as of December 31, 2010. |
F-18
| |
(c) |
|
Comprehensive Income (Loss) |
| |
|
|
Comprehensive income (loss) is defined as the sum of net income and all other non-owner
changes in equity. The components of the non-owner changes in equity, or accumulated
other comprehensive income (loss) were as follows (net of tax): |
| |
|
|
|
|
|
|
|
|
| |
|
December 31, |
|
| |
|
2009 |
|
|
2010 |
|
Foreign Currency Translation Adjustments |
|
$ |
2,779 |
|
|
$ |
1,689 |
|
Amounts in Accumulated Other Comprehensive Income that have
not yet been Recognized as: |
|
|
|
|
|
|
|
|
Components of Net Periodic Benefit Cost: |
|
|
|
|
|
|
|
|
Actuarial Loss |
|
|
(74,567 |
) |
|
|
(69,843 |
) |
Prior Service Cost |
|
|
(1,269 |
) |
|
|
(967 |
) |
Unrealized Investment Loss |
|
|
(157 |
) |
|
|
19 |
|
|
|
|
|
|
|
|
Accumulated Other Comprehensive Loss |
|
$ |
(73,214 |
) |
|
$ |
(69,102 |
) |
|
|
|
|
|
|
|
| |
(d) |
|
Additional Paid-In Capital |
| |
|
|
In 2008, the Company recognized a deferred tax liability of $5,498 which related to an IRS
audit adjustment for 1987. As the adjustment related to a time period prior to the
Company’s reorganization in 1993, under fresh-start accounting, the adjustment is charged
to paid-in capital instead of the current tax provision. |
| (5) |
|
Research and Development |
| |
|
Research and development expenses were $3,061, $2,725 and $3,304 in 2008, 2009 and 2010,
respectively. Customers reimbursed the Company for $1,282, $1,231 and $1,659 of research and
development expenses in 2008, 2009 and 2010, respectively. The expenses and related
reimbursement are included in cost of sales on the statements of operations. |
| |
|
Certain office and warehouse facilities and equipment are leased under noncancelable operating
leases expiring on various dates through the year 2018. Rental expense was $630, $1,225 and
$1,092 in 2008, 2009 and 2010, respectively. |
| |
|
Minimum lease obligations under noncancelable operating leases are as follows: |
| |
|
|
|
|
|
2011 |
|
$ |
921 |
|
2012 |
|
|
827 |
|
2013 |
|
|
678 |
|
2014 |
|
|
642 |
|
2015 |
|
|
508 |
|
2016 and Thereafter |
|
|
1,344 |
|
|
|
|
|
Total |
|
$ |
4,920 |
|
|
|
|
|
| |
|
Certain equipment were leased under noncancelable capital leases assumed as a part of the
Chen-Tech acquisition in 2008. The Company paid off these leases in 2009 and exercised the
purchase option for equipment. |
F-19
| |
|
Deferred income taxes are accounted for under the asset and liability method whereby deferred
tax assets and liabilities are recognized for the future tax consequences attributable to
differences between the financial statement carrying amounts of existing assets and liabilities
and their respective tax bases. Deferred tax assets and liabilities are measured using enacted
tax rates. Deferred income tax provisions or benefits are based on the change in the deferred
tax assets and liabilities from period to period. |
| |
|
There are many transactions and calculations where the ultimate tax determination is uncertain
and the Company must exercise its judgment in determining its provision for income taxes and
recording the related assets and liabilities. The FASB has issued guidance for how a company
should recognize, measure, present, and disclose in its financial statements, uncertain tax
positions that a company has taken or expects to take on a return. The Company has adopted
this guidance, and as such, accruals for tax contingencies are provided for accordingly. |
| |
|
In regards to uncertain tax provisions, the Company has recorded a charge to income tax expense
of $546, $69 and $43 and has corresponding unrecognized tax benefit reserves of $546, $615 and
$658 in 2008, 2009 and 2010, respectively, in connection with research and development (“R&D”)
tax credits recognized in those years. The reserves established are 10% of the R&D tax credit
for each year and include any applicable penalties. The Company has recorded $0, $79 and $51
in interest costs with regard to the foregoing that are included in the 2008, 2009 and 2010
income tax provisions and corresponding reserve balances, respectively. |
| |
|
The entire $615 and $658 of unrecognized tax benefits as of December 31, 2009 and 2010,
respectively, would impact the effective tax rate if recognized. A reconciliation of the
beginning and ending amount of unrecognized tax benefits is as follows: |
| |
|
|
|
|
|
|
|
|
| |
|
2009 |
|
|
2010 |
|
Beginning Balance |
|
$ |
546 |
|
|
$ |
615 |
|
Additions for Tax Positions Related to the Current Year |
|
|
51 |
|
|
|
53 |
|
True-up of Tax Positions of Prior Years |
|
|
18 |
|
|
|
(10 |
) |
|
|
|
|
|
|
|
Ending Balance |
|
$ |
615 |
|
|
$ |
658 |
|
|
|
|
|
|
|
|
| |
|
Realization of the domestic net deferred tax assets over time is dependent upon the Company
generating sufficient taxable income in future periods. In determining that realization of the
net deferred tax assets was more likely than not, the Company gave consideration to a number of
factors including its recent earnings history, expectations for earnings in the future, the
timing of reversal of temporary differences, tax planning strategies available to the Company
and the expiration dates associated with NOL and tax credit carryforwards. If, in the future,
the Company determines that it is no longer more likely than not that the domestic net deferred
tax assets will be realized, a valuation allowance will be established against all or part of
the net deferred tax assets through a charge to the income tax provision. |
| |
|
The Company has total net deferred income tax assets of $31,666 and $21,018 as of December 31,
2009 and 2010, respectively. As of December 31, 2009 and 2010, respectively, ZKM has net
deferred Polish income tax assets of $2,503 and $1,985 which include $1,951 and $1,719 of
foreign economic zone credits along with NOL carryforwards with a net realizable value of $677
and $531 that were generated by its ZKM and ZOPS operations. The NOL carryforwards expire in
the years 2012 through 2015. A valuation allowance has been established against $177 of the
foreign NOLs related to the ZOPS operation. |
| |
|
Certain deferred tax liabilities associated with the acquisitions of Aerex and Chen-Tech in the
amounts of $2,567 and $6,068, respectively, have been recorded against goodwill. |
F-20
| |
|
Deferred taxes were classified in the consolidated balance sheets for the years ended December
31, 2009 and 2010 as follows: |
| |
|
|
|
|
|
|
|
|
| |
|
December 31, |
|
| |
|
2009 |
|
|
2010 |
|
Other Current Assets |
|
$ |
6,434 |
|
|
$ |
7,248 |
|
Other Noncurrent Assets |
|
|
47,964 |
|
|
|
41,323 |
|
Other Current Liabilities |
|
|
(1,290 |
) |
|
|
(2,405 |
) |
Other Noncurrent Liabilities |
|
|
(21,442 |
) |
|
|
(25,148 |
) |
|
|
|
|
|
|
|
Total Net Deferred Tax Assets |
|
$ |
31,666 |
|
|
$ |
21,018 |
|
|
|
|
|
|
|
|
| |
|
The components of net deferred income tax assets and liabilities for the years ended December
31, 2009 and 2010 are as follows: |
| |
|
|
|
|
|
|
|
|
| |
|
December 31, |
|
| |
|
2009 |
|
|
2010 |
|
Deferred Tax Assets: |
|
|
|
|
|
|
|
|
Inventory Adjustments |
|
$ |
1,491 |
|
|
$ |
1,654 |
|
Accrued Employee Costs |
|
|
2,665 |
|
|
|
2,861 |
|
Operating Loss Carryforwards |
|
|
712 |
|
|
|
531 |
|
Pension Benefit Liabilities |
|
|
30,067 |
|
|
|
24,350 |
|
Postretirement Healthcare Benefit Liabilities |
|
|
13,472 |
|
|
|
13,487 |
|
Wisconsin Manufacturing Investment Credit |
|
|
5,335 |
|
|
|
4,049 |
|
|
|
|
|
|
|
|
|
|
|
53,742 |
|
|
|
46,932 |
|
Valuation Allowances |
|
|
(115 |
) |
|
|
(177 |
) |
|
|
|
|
|
|
|
Net Deferred Tax Assets |
|
|
53,627 |
|
|
|
46,755 |
|
|
|
|
|
|
|
|
|
|
|
|
|
|
|
|
|
Deferred Tax Liabilities: |
|
|
|
|
|
|
|
|
Property, Plant and Equipment |
|
|
(21,442 |
) |
|
|
(25,148 |
) |
Other |
|
|
(519 |
) |
|
|
(589 |
) |
|
|
|
|
|
|
|
Net Deferred Tax Liabilities |
|
|
(21,961 |
) |
|
|
(25,737 |
) |
|
|
|
|
|
|
|
Total Net Deferred Tax Assets |
|
$ |
31,666 |
|
|
$ |
21,018 |
|
|
|
|
|
|
|
|
| |
|
The Wisconsin Manufacturing Investment Credit usage is limited to $337 annually and the credit
expires in the year 2022. |
| |
|
A reconciliation of the Federal statutory tax rate to the Company’s effective tax rate for the
years ended December 31, 2008, 2009 and 2010 is as follows: |
| |
|
|
|
|
|
|
|
|
|
|
|
|
| |
|
Years Ended December 31, |
|
| |
|
2008 |
|
|
2009 |
|
|
2010 |
|
Pre-tax Income |
|
$ |
38,250 |
|
|
$ |
3,136 |
|
|
$ |
41,613 |
|
|
|
|
|
|
|
|
|
|
|
Federal Tax at Statutory Rate of 35% |
|
$ |
13,387 |
|
|
$ |
1,098 |
|
|
$ |
14,565 |
|
State Tax, Net of Federal Effect |
|
|
(144 |
) |
|
|
574 |
|
|
|
2,360 |
|
Permanent Differences and Other, Net |
|
|
(737 |
) |
|
|
458 |
|
|
|
476 |
|
Research & Development Credits |
|
|
(3,582 |
) |
|
|
(316 |
) |
|
|
(331 |
) |
Domestic Production Activities Deduction |
|
|
(553 |
) |
|
|
(21 |
) |
|
|
(894 |
) |
Reversal of Domestic Valuation Allowance |
|
|
— |
|
|
|
(5,335 |
) |
|
|
— |
|
Establishment of Foreign Valuation Allowance |
|
|
35 |
|
|
|
80 |
|
|
|
62 |
|
Foreign Economic Zone Credits |
|
|
(1,907 |
) |
|
|
— |
|
|
|
— |
|
Foreign Tax Rate Differential |
|
|
(623 |
) |
|
|
568 |
|
|
|
(29 |
) |
|
|
|
|
|
|
|
|
|
|
Total Tax Provision (Benefit) |
|
$ |
5,876 |
|
|
$ |
(2,894 |
) |
|
$ |
16,209 |
|
|
|
|
|
|
|
|
|
|
|
|
|
|
|
|
|
|
|
|
|
|
|
|
Effective Tax Rate |
|
|
15.4 |
% |
|
|
(92.3 |
)% |
|
|
39.0 |
% |
|
|
|
|
|
|
|
|
|
|
F-21
| |
|
The components of income tax expense (benefits) for the years ended December 31, 2008, 2009 and
2010 are as follows: |
| |
|
|
|
|
|
|
|
|
|
|
|
|
|
|
|
|
| |
|
2008 |
|
| |
|
Federal |
|
|
State |
|
|
Foreign |
|
|
Total |
|
Current |
|
$ |
5,339 |
|
|
$ |
(506 |
) |
|
$ |
14 |
|
|
$ |
4,847 |
|
Deferred |
|
|
1,741 |
|
|
|
249 |
|
|
|
(1,223 |
) |
|
|
767 |
|
Charge in Lieu of Taxes Related to: |
|
|
|
|
|
|
|
|
|
|
|
|
|
|
|
|
Goodwill |
|
|
35 |
|
|
|
5 |
|
|
|
— |
|
|
|
40 |
|
Stock Options |
|
|
194 |
|
|
|
28 |
|
|
|
— |
|
|
|
222 |
|
|
|
|
|
|
|
|
|
|
|
|
|
|
Total Income Tax Expense (Benefit) |
|
$ |
7,309 |
|
|
$ |
(224 |
) |
|
$ |
(1,209 |
) |
|
$ |
5,876 |
|
|
|
|
|
|
|
|
|
|
|
|
|
|
| |
|
|
|
|
|
|
|
|
|
|
|
|
|
|
|
|
| |
|
2009 |
|
| |
|
Federal |
|
|
State |
|
|
Foreign |
|
|
Total |
|
Current |
|
$ |
(1,072 |
) |
|
$ |
9 |
|
|
$ |
2 |
|
|
$ |
(1,061 |
) |
Deferred |
|
|
3,111 |
|
|
|
(4,593 |
) |
|
|
(356 |
) |
|
|
(1,838 |
) |
Charge in Lieu of Taxes Related to
Stock Options |
|
|
4 |
|
|
|
1 |
|
|
|
— |
|
|
|
5 |
|
|
|
|
|
|
|
|
|
|
|
|
|
|
Total Income Tax Expense (Benefit) |
|
$ |
2,043 |
|
|
$ |
(4,583 |
) |
|
$ |
(354 |
) |
|
$ |
(2,894 |
) |
|
|
|
|
|
|
|
|
|
|
|
|
|
| |
|
|
|
|
|
|
|
|
|
|
|
|
|
|
|
|
| |
|
2010 |
|
| |
|
Federal |
|
|
State |
|
|
Foreign |
|
|
Total |
|
Current |
|
$ |
8,650 |
|
|
$ |
2,702 |
|
|
$ |
147 |
|
|
$ |
11,499 |
|
Deferred |
|
|
3,796 |
|
|
|
590 |
|
|
|
269 |
|
|
|
4,655 |
|
Charge in Lieu of Taxes Related to Stock Options |
|
|
48 |
|
|
|
7 |
|
|
|
— |
|
|
|
55 |
|
|
|
|
|
|
|
|
|
|
|
|
|
|
Total Income Tax Expense |
|
$ |
12,494 |
|
|
$ |
3,299 |
|
|
$ |
416 |
|
|
$ |
16,209 |
|
|
|
|
|
|
|
|
|
|
|
|
|
|
| |
|
The Company has not provided additional U.S. income taxes on $7,639 of undistributed earnings
of its Polish subsidiary, ZKM, included in stockholders’ equity. Such earnings could become
taxable upon the sale or liquidation of ZKM or upon dividend repatriation. The Company’s
intent is for such earnings to be reinvested by ZKM or to be repatriated only when it would be
tax effective through the utilization of foreign tax credits. |
| |
|
The Company is currently being audited by the State of Wisconsin for tax years 2005-2008. The
Company has not been notified of any other audit of its U.S. or state tax returns. Federal
returns for the years 2007-2010 are still open. |
| (8) |
|
Pensions and Postretirement Benefits |
| |
|
The Company has domestic noncontributory defined benefit pension plans (“Plans”) covering a
number of its employees. Plans covering salaried and management employees provide pension
benefits that are based on the highest five consecutive years of an employee’s compensation
during the last ten years prior to retirement. Plans covering hourly employees and union
members generally provide benefits of stated amounts for each year of service. The Company’s
funding policy is to contribute annually an amount equal to or greater than the minimum amount
required under the Employee Retirement Income Security Act of 1974. The Company contributed
$8,955, $3,428 and $10,478 to the Plans in 2008, 2009 and 2010, respectively, and the Company
expects to contribute $13,251, $15,422 and $13,438 in 2011, 2012 and 2013, respectively, to the
Plans. The Plans’ assets are primarily invested in U.S. Government securities, investment
grade corporate bonds and marketable common stocks. The Plans may hold shares of the Company’s
common stock, which comprise less than ten percent of any individual plan’s total assets. The
market value of Company
shares held in all Plans as of December 31, 2009 and 2010 total $5,099 and $16,472,
respectively. The Company’s annual measurement date is December 31. |
F-22
| |
|
The following table reflects the funding status of each of the Plans as of December 31, 2010
relative to the Pension Protection Act of 2006, per the Company’s Adjusted Funding Target
Attainment Percentage (“AFTAP”): |
| |
|
|
|
|
|
|
|
|
|
|
|
|
|
|
|
|
|
|
|
|
|
|
|
|
|
|
|
|
|
|
|
|
| |
|
Black- |
|
|
|
|
|
|
|
|
|
|
|
|
|
|
Service |
|
|
|
|
|
|
Electrical |
|
|
Die |
|
| |
|
smiths |
|
|
Salaried |
|
|
Machinists |
|
|
OPEIU |
|
|
Employees |
|
|
Technicians |
|
|
Workers |
|
|
Sinkers |
|
|
|
|
|
|
|
|
|
|
|
|
|
|
|
|
|
|
|
|
|
|
|
|
|
|
|
|
|
|
|
|
|
|
Funding Target |
|
$ |
27,517 |
|
|
$ |
80,700 |
|
|
$ |
43,086 |
|
|
$ |
8,308 |
|
|
$ |
2,245 |
|
|
$ |
15,387 |
|
|
$ |
2,750 |
|
|
$ |
6,658 |
|
|
|
|
|
|
|
|
|
|
|
|
|
|
|
|
|
|
|
|
|
|
|
|
|
|
|
|
|
|
|
|
|
|
Actuarial Value of
Assets |
|
|
22,178 |
|
|
|
68,540 |
|
|
|
38,646 |
|
|
|
6,580 |
|
|
|
1,853 |
|
|
|
12,496 |
|
|
|
2,207 |
|
|
|
6,323 |
|
|
|
|
|
|
|
|
|
|
|
|
|
|
|
|
|
|
|
|
|
|
|
|
|
|
|
|
|
|
|
|
|
|
Market Value of
Assets |
|
|
21,110 |
|
|
|
64,961 |
|
|
|
36,296 |
|
|
|
6,204 |
|
|
|
1,766 |
|
|
|
11,913 |
|
|
|
2,102 |
|
|
|
5,954 |
|
|
|
|
|
|
|
|
|
|
|
|
|
|
|
|
|
|
|
|
|
|
|
|
|
|
|
|
|
|
|
|
|
|
Carryover Balance |
|
|
1,980 |
|
|
|
9,248 |
|
|
|
2,766 |
|
|
|
497 |
|
|
|
118 |
|
|
|
1,187 |
|
|
|
197 |
|
|
|
780 |
|
|
|
|
|
|
|
|
|
|
|
|
|
|
|
|
|
|
|
|
|
|
|
|
|
|
|
|
|
|
|
|
|
|
2010 AFTAP |
|
|
73.4 |
% |
|
|
73.5 |
% |
|
|
83.3 |
% |
|
|
73.2 |
% |
|
|
77.3 |
% |
|
|
73.5 |
% |
|
|
73.1 |
% |
|
|
83.3 |
% |
| |
|
In the above table, the funding status for each Plan is calculated by subtracting the
carryover balance from the actuarial value of assets and dividing the result by the funding
target. The Company has the option of waiving the carryover balance for any Plan. A waiver of
the carryover balances would result in every Plan but the OPEIU Plan being over 80% of 2010
AFTAP. For any Plan under 80% of 2010 AFTAP, the Company is under a number of restrictions
with respect to such Plan which include, i) the prohibition of increasing benefits under such a
Plan, ii) the prohibition of lump-sum payments under such a Plan, iii) increased reporting
requirements to the Plan participants, and iv) increased insurance premiums to the Pension
Benefit Guaranty Corporation. |
| |
|
A summary of the Plans’ asset allocation at December 31, 2009 and 2010 is as follows: |
| |
|
|
|
|
|
|
|
|
| |
|
December 31, |
|
| Asset Category |
|
2009 |
|
|
2010 |
|
Fixed Income Securities |
|
|
51.8 |
% |
|
|
48.6 |
% |
Equity Securities |
|
|
45.6 |
% |
|
|
49.6 |
% |
Cash |
|
|
2.6 |
% |
|
|
1.8 |
% |
|
|
|
|
|
|
|
Total |
|
|
100.0 |
% |
|
|
100.0 |
% |
|
|
|
|
|
|
|
| |
|
The Plans’ target asset allocation percentages are fixed income 50% and equities 50%. The
variance from the target in 2009 was due to the decline in the U.S. equity market in 2008. |
| |
|
In addition to pension benefits, a number of the Company’s employees are provided certain
postretirement healthcare and life insurance benefits. The employees may become eligible for
these benefits when they retire. The Company accrues, as current costs, the future lifetime
retirement benefits for both active and retired employees and their dependents. Steps have
been taken by the Company to reduce the amount of the future obligation for pensions and
postretirement healthcare benefits of future retirees by capping the amount of funds payable on
behalf of the retirees. |
| |
|
The benefits estimated to be paid in the next five years for the pension plans range between
$15,600 and $16,500 per year and for years six through ten in aggregate total $74,100. For
postretirement healthcare and life insurance benefits, the estimated benefit payments over the
next five years approximate $3,200 per year and $12,400 in aggregate for years six through ten. |
| |
|
In December 2003, the Medicare Prescription Drug, Improvement and Modernization Act of 2003 was
enacted. In May 2004, the FASB issued ASC 715-60, Accounting and Disclosure Requirements
Related to the Medicare Prescription Drug, Improvement and Modernization Act of 2003, in
response to the new law which may provide a federal subsidy to sponsors of retiree healthcare
benefit plans. The Company has concluded that certain benefits provided by its postretirement
benefit plan are actuarially equivalent to Medicare Part D under the Act and has filed refund
requests with the Claims Management Services, a division of the Health and Human Services
Department. Refunds of $169, $274 and $168 have been received in 2008, 2009 and 2010,
respectively. |
F-23
| |
|
Certain officers have deferred compensation agreements (the “Officers’ Plan”) which, upon
retirement, provide them with, among other things, supplemental pension and other
postretirement benefits. An accumulated unfunded liability of $9,431 and $10,410 as of
December 31, 2009 and 2010, respectively, has been recorded under these agreements as
actuarially determined. The expense was $552, $662 and $904 in 2008, 2009 and 2010,
respectively. |
| |
|
The Company has established a Rabbi Trust for the beneficiaries of the Officers’ Plan to fund a
portion of the benefits earned under the Officers’ Plan. The Rabbi Trust does not hold any
Company stock and is considered in the calculations determined by the actuary. The Rabbi Trust
had assets of $175 and $122 as of December 31, 2009 and 2010, respectively, and are included in
other assets on the balance sheets. The investments are held on the balance sheet and are
considered available-for-sale securities. The unrealized gain or loss on these investments is
recognized as a component of other comprehensive income. |
| |
|
Fair Value Measurement of Pension Assets |
| |
|
FASB ASC 820-10, Fair Value Measurements and Disclosures, establishes a framework and provides
guidance on measuring the fair value of assets in a pension plan and how an employer should
disclose the same. The framework establishes a fair value hierarchy that prioritizes the
inputs to the valuation techniques used to measure fair value. The three levels of fair value
hierarchy are described as follows: |
| |
Level 1 |
|
Quoted prices in active markets for identical assets or liabilities. |
| |
| |
Level 2 |
|
Observable inputs other than Level 1 prices, such as quoted prices
for similar assets or liabilities; quoted prices in markets that
are not active; or other inputs that are observable or can be
corroborated by observable market data for substantially the full
term of the assets or liabilities. |
| |
| |
Level 3 |
|
Unobservable inputs that are supported by little or no market
activity and that are significant to the fair value of the assets
or liabilities. |
| |
|
The following table sets forth by level, within the fair value hierarchy, the Plans’ assets at
fair value as of December 31, 2009 and 2010: |
| |
|
|
|
|
|
|
|
|
|
|
|
|
|
|
|
|
| |
|
Quoted |
|
|
Significant |
|
|
|
|
|
|
|
| |
|
Prices in |
|
|
Other |
|
|
Significant |
|
|
|
|
| Fair Values at |
|
Active |
|
|
Observable |
|
|
Unobservable |
|
|
|
|
| December 31, 2009 |
|
Markets |
|
|
Inputs |
|
|
Inputs |
|
|
|
|
| |
|
Level 1 |
|
|
Level 2 |
|
|
Level 3 |
|
|
Total |
|
Pension Plan Assets |
|
|
|
|
|
|
|
|
|
|
|
|
|
|
|
|
Money Market Accounts |
|
$ |
3,734 |
|
|
$ |
— |
|
|
$ |
— |
|
|
$ |
3,734 |
|
US Government Issues |
|
|
15,262 |
|
|
|
16,290 |
|
|
|
— |
|
|
|
31,552 |
|
Corporate Issues |
|
|
— |
|
|
|
29,632 |
|
|
|
— |
|
|
|
29,632 |
|
Foreign Issues |
|
|
— |
|
|
|
6,769 |
|
|
|
— |
|
|
|
6,769 |
|
Municipal Issues |
|
|
— |
|
|
|
24 |
|
|
|
— |
|
|
|
24 |
|
Domestic Common Stocks |
|
|
64,534 |
|
|
|
— |
|
|
|
— |
|
|
|
64,534 |
|
Foreign Stocks |
|
|
695 |
|
|
|
— |
|
|
|
— |
|
|
|
695 |
|
Mutual Funds |
|
|
6,027 |
|
|
|
— |
|
|
|
— |
|
|
|
6,027 |
|
|
|
|
|
|
|
|
|
|
|
|
|
|
Total |
|
$ |
90,252 |
|
|
$ |
52,715 |
|
|
$ |
— |
|
|
$ |
142,967 |
|
|
|
|
|
|
|
|
|
|
|
|
|
|
F-24
| |
|
|
|
|
|
|
|
|
|
|
|
|
|
|
|
|
| |
|
Quoted |
|
|
Significant |
|
|
|
|
|
|
|
| |
|
Prices in |
|
|
Other |
|
|
Significant |
|
|
|
|
| Fair Values at |
|
Active |
|
|
Observable |
|
|
Unobservable |
|
|
|
|
| December 31, 2010 |
|
Markets |
|
|
Inputs |
|
|
Inputs |
|
|
|
|
| |
|
Level 1 |
|
|
Level 2 |
|
|
Level 3 |
|
|
Total |
|
Pension Plan Assets |
|
|
|
|
|
|
|
|
|
|
|
|
|
|
|
|
Money Market Accounts |
|
$ |
2,976 |
|
|
$ |
— |
|
|
$ |
— |
|
|
$ |
2,976 |
|
US Government Issues |
|
|
26,506 |
|
|
|
10,991 |
|
|
|
— |
|
|
|
37,497 |
|
Corporate Issues |
|
|
— |
|
|
|
27,508 |
|
|
|
— |
|
|
|
27,508 |
|
Foreign Issues |
|
|
— |
|
|
|
7,488 |
|
|
|
— |
|
|
|
7,488 |
|
Municipal Issues |
|
|
— |
|
|
|
771 |
|
|
|
— |
|
|
|
771 |
|
Domestic Common Stock |
|
|
79,354 |
|
|
|
— |
|
|
|
— |
|
|
|
79,354 |
|
Foreign Stocks |
|
|
1,168 |
|
|
|
— |
|
|
|
— |
|
|
|
1,168 |
|
Mutual Funds |
|
|
5,658 |
|
|
|
— |
|
|
|
— |
|
|
|
5,658 |
|
|
|
|
|
|
|
|
|
|
|
|
|
|
Total |
|
$ |
115,662 |
|
|
$ |
46,758 |
|
|
$ |
— |
|
|
$ |
162,420 |
|
|
|
|
|
|
|
|
|
|
|
|
|
|
| |
|
The following is a reconciliation of the change in benefit obligation and Plans’ assets
for the years ended December 31, 2009 and 2010: |
| |
|
|
|
|
|
|
|
|
|
|
|
|
|
|
|
|
| |
|
Pension & Officers’ |
|
|
Postretirement |
|
| |
|
Benefits |
|
|
Benefits |
|
| |
|
2009 |
|
|
2010 |
|
|
2009 |
|
|
2010 |
|
Change in Benefit Obligation: |
|
|
|
|
|
|
|
|
|
|
|
|
|
|
|
|
Projected Benefit Obligation at Beginning of Yr. |
|
$ |
204,035 |
|
|
$ |
219,756 |
|
|
$ |
33,256 |
|
|
$ |
33,679 |
|
Service Cost |
|
|
1,346 |
|
|
|
1,605 |
|
|
|
190 |
|
|
|
229 |
|
Interest Cost |
|
|
11,856 |
|
|
|
10,926 |
|
|
|
1,903 |
|
|
|
1,649 |
|
Amendments |
|
|
1,229 |
|
|
|
— |
|
|
|
— |
|
|
|
— |
|
Actuarial (Gains) Losses |
|
|
17,887 |
|
|
|
12,550 |
|
|
|
1,835 |
|
|
|
1,100 |
|
Benefits Paid |
|
|
(16,597 |
) |
|
|
(16,907 |
) |
|
|
(5,912 |
) |
|
|
(5,469 |
) |
Participants’ Contributions |
|
|
— |
|
|
|
— |
|
|
|
2,407 |
|
|
|
2,529 |
|
|
|
|
|
|
|
|
|
|
|
|
|
|
Projected Benefit Obligation at End of Yr. |
|
$ |
219,756 |
|
|
$ |
227,930 |
|
|
$ |
33,679 |
|
|
$ |
33,717 |
|
|
|
|
|
|
|
|
|
|
|
|
|
|
|
|
|
|
|
|
|
|
|
|
|
|
|
|
|
|
|
Change in Plans’ Assets: |
|
|
|
|
|
|
|
|
|
|
|
|
|
|
|
|
Plans’ Assets at Fair Value at Beginning of Yr. |
|
$ |
136,472 |
|
|
$ |
142,967 |
|
|
$ |
— |
|
|
$ |
— |
|
Actual Return on Plans’ Assets |
|
|
19,478 |
|
|
|
25,489 |
|
|
|
— |
|
|
|
— |
|
Company Contributions |
|
|
3,614 |
|
|
|
10,871 |
|
|
|
3,505 |
|
|
|
2,940 |
|
Benefits Paid |
|
|
(16,597 |
) |
|
|
(16,907 |
) |
|
|
(5,912 |
) |
|
|
(5,469 |
) |
Participants’ Contributions |
|
|
— |
|
|
|
— |
|
|
|
2,407 |
|
|
|
2,529 |
|
|
|
|
|
|
|
|
|
|
|
|
|
|
Plans’ Assets at Fair Value at End of Yr. |
|
$ |
142,967 |
|
|
$ |
162,420 |
|
|
$ |
— |
|
|
$ |
— |
|
|
|
|
|
|
|
|
|
|
|
|
|
|
|
|
|
|
|
|
|
|
|
|
|
|
|
|
|
|
|
Funded Status of Plans |
|
$ |
(76,789 |
) |
|
$ |
(65,510 |
) |
|
$ |
(33,679 |
) |
|
$ |
(33,717 |
) |
|
|
|
|
|
|
|
|
|
|
|
|
|
F-25
| |
|
|
|
|
|
|
|
|
|
|
|
|
|
|
|
|
| |
|
Pension & Officers’ |
|
|
Postretirement |
|
| |
|
Benefits |
|
|
Benefits |
|
| |
|
2009 |
|
|
2010 |
|
|
2009 |
|
|
2010 |
|
Plans with Benefit Obligations in Excess of
Plan Assets: |
|
|
|
|
|
|
|
|
|
|
|
|
|
|
|
|
Projected Benefit Obligation |
|
$ |
219,756 |
|
|
$ |
227,930 |
|
|
$ |
33,679 |
|
|
$ |
33,717 |
|
Accumulated Benefit Obligation |
|
|
211,461 |
|
|
|
221,085 |
|
|
|
— |
|
|
|
— |
|
Plan Assets |
|
|
142,967 |
|
|
|
162,420 |
|
|
|
— |
|
|
|
— |
|
Plans with Plan Assets in Excess of Benefit
Obligations: |
|
|
|
|
|
|
|
|
|
|
|
|
|
|
|
|
Projected Benefit Obligation |
|
$ |
— |
|
|
$ |
— |
|
|
$ |
— |
|
|
$ |
— |
|
Accumulated Benefit Obligation |
|
|
— |
|
|
|
— |
|
|
|
— |
|
|
|
— |
|
Plan Assets |
|
|
— |
|
|
|
— |
|
|
|
— |
|
|
|
— |
|
Weighted Average Assumptions: |
|
|
|
|
|
|
|
|
|
|
|
|
|
|
|
|
Discount Rate |
|
|
5.16 |
% |
|
|
4.55 |
% |
|
|
5.16 |
% |
|
|
4.55 |
% |
Rate of Increase in Compensation Levels |
|
|
3.00 |
% |
|
|
3.00 |
% |
|
|
— |
|
|
|
— |
|
Expected Long-Term Rate of Return on Assets |
|
|
8.05 |
% |
|
|
8.47 |
% |
|
|
— |
|
|
|
— |
|
| |
|
The total accumulated pension benefit obligation for the Plans is $211,461 and $221,085 at
December 31, 2009 and 2010, respectively. All of the individual Plans and the Officers’ Plan
have accumulated benefit obligations exceeding the fair value of the Plans’ assets at December
31, 2010. |
| |
|
|
|
|
|
|
|
|
|
|
|
|
|
|
|
|
| |
|
Pension & Officers’ |
|
|
Postretirement |
|
| |
|
Benefits |
|
|
Benefits |
|
| |
|
2009 |
|
|
2010 |
|
|
2009 |
|
|
2010 |
|
Amounts Recognized in the Consolidated
Balance Sheets: |
|
|
|
|
|
|
|
|
|
|
|
|
|
|
|
|
Other Assets |
|
$ |
175 |
|
|
$ |
122 |
|
|
$ |
— |
|
|
$ |
— |
|
Accrued Liabilities — Postretirement |
|
|
— |
|
|
|
— |
|
|
|
(3,464 |
) |
|
|
(3,818 |
) |
Accrued Liabilities — Officers’ Deferred Comp. |
|
|
(155 |
) |
|
|
(328 |
) |
|
|
— |
|
|
|
— |
|
Noncurrent Liabilities — Pensions |
|
|
(67,533 |
) |
|
|
(55,222 |
) |
|
|
— |
|
|
|
— |
|
Noncurrent Liabilities — Postretirement |
|
|
— |
|
|
|
— |
|
|
|
(30,215 |
) |
|
|
(29,899 |
) |
Officers’ Deferred Compensation |
|
|
(9,276 |
) |
|
|
(10,082 |
) |
|
|
— |
|
|
|
— |
|
|
|
|
|
|
|
|
|
|
|
|
|
|
Net Amount Recognized |
|
$ |
(76,789 |
) |
|
$ |
(65,510 |
) |
|
$ |
(33,679 |
) |
|
$ |
(33,717 |
) |
|
|
|
|
|
|
|
|
|
|
|
|
|
| |
|
The amounts in accumulated other comprehensive loss that have not yet been recognized as
components of net periodic benefit cost at December 31, 2010 are as follows: |
| |
|
|
|
|
|
|
|
|
| |
|
Pension & Officers’ |
|
|
Postretirement |
|
| |
|
Benefits |
|
|
Benefits |
|
Prior Service Cost |
|
$ |
1,524 |
|
|
$ |
88 |
|
Net Loss |
|
|
110,739 |
|
|
|
5,666 |
|
|
|
|
|
|
|
|
Total |
|
$ |
112,263 |
|
|
$ |
5,754 |
|
|
|
|
|
|
|
|
| |
|
The amounts in accumulated other comprehensive loss that are expected to be recognized as
components of net periodic benefit cost during 2011 are as follows: |
| |
|
|
|
|
|
|
|
|
| |
|
Pension & Officers’ |
|
|
Postretirement |
|
| |
|
Benefits |
|
|
Benefits |
|
Prior Service Cost |
|
$ |
403 |
|
|
$ |
14 |
|
Net Loss |
|
|
9,520 |
|
|
|
180 |
|
|
|
|
|
|
|
|
Total |
|
$ |
9,923 |
|
|
$ |
194 |
|
|
|
|
|
|
|
|
F-26
| |
|
The components of the net periodic benefit costs for the years ended December 31, 2008, 2009
and 2010 are: |
| |
|
|
|
|
|
|
|
|
|
|
|
|
|
|
|
|
|
|
|
|
|
|
|
|
| |
|
Pension & Officers’ Benefits |
|
|
Postretirement Benefits |
|
| |
|
2008 |
|
|
2009 |
|
|
2010 |
|
|
2008 |
|
|
2009 |
|
|
2010 |
|
Service Cost-Benefit Earned
During the Period |
|
$ |
891 |
|
|
$ |
1,346 |
|
|
$ |
1,605 |
|
|
$ |
154 |
|
|
$ |
190 |
|
|
$ |
229 |
|
Interest Cost on Projected
Benefit Obligation |
|
|
11,998 |
|
|
|
11,856 |
|
|
|
10,926 |
|
|
|
2,051 |
|
|
|
1,903 |
|
|
|
1,649 |
|
Expected Return on Pension Assets |
|
|
(15,713 |
) |
|
|
(13,265 |
) |
|
|
(12,237 |
) |
|
|
— |
|
|
|
— |
|
|
|
— |
|
Net Amortization and Deferral |
|
|
3,631 |
|
|
|
5,273 |
|
|
|
8,170 |
|
|
|
4 |
|
|
|
5 |
|
|
|
101 |
|
Prior Service Cost |
|
|
400 |
|
|
|
390 |
|
|
|
490 |
|
|
|
14 |
|
|
|
14 |
|
|
|
14 |
|
|
|
|
|
|
|
|
|
|
|
|
|
|
|
|
|
|
|
|
Net Periodic Benefit Cost |
|
$ |
1,207 |
|
|
$ |
5,600 |
|
|
$ |
8,954 |
|
|
$ |
2,223 |
|
|
$ |
2,112 |
|
|
$ |
1,993 |
|
|
|
|
|
|
|
|
|
|
|
|
|
|
|
|
|
|
|
|
| |
|
Assumptions used in the determination of net periodic benefit costs for these years are: |
| |
|
|
|
|
|
|
|
|
|
|
|
|
|
|
|
|
|
|
|
|
|
|
|
|
| |
|
Pension & Officers’ Benefits |
|
|
Postretirement Benefits |
|
| |
|
2008 |
|
|
2009 |
|
|
2010 |
|
|
2008 |
|
|
2009 |
|
|
2010 |
|
Discount Rate |
|
|
6.11 |
% |
|
|
6.05 |
% |
|
|
5.16 |
% |
|
|
6.11 |
% |
|
|
6.05 |
% |
|
|
5.16 |
% |
Rate of Increase in
Compensation Levels |
|
|
3.00 |
% |
|
|
3.00 |
% |
|
|
3.00 |
% |
|
|
— |
|
|
|
— |
|
|
|
— |
|
Expected Long-Term Rate of
Return on Assets |
|
|
8.90 |
% |
|
|
7.95 |
% |
|
|
8.05 |
% |
|
|
— |
|
|
|
— |
|
|
|
— |
|
| |
|
Assumed healthcare cost trend rates have a significant effect on the amounts reported for the
postretirement healthcare plans. The Company assumes annual increases of 0% on life insurance,
7% on pre-65 healthcare and 5% on post-65 healthcare. A one-percentage-point change in assumed
healthcare cost trend rates would have the following effects: |
| |
|
|
|
|
|
|
|
|
| |
|
1% |
|
|
1% |
|
| |
|
Increase |
|
|
Decrease |
|
Effect on Total of Service and Interest Cost Components |
|
$ |
87 |
|
|
$ |
(76 |
) |
Effect on Postretirement Healthcare Benefit Obligation |
|
$ |
1,703 |
|
|
$ |
(1,515 |
) |
| |
|
As a result of union labor renegotiations finalized during 2000, the benefits in certain
Company sponsored pension plans were frozen and replaced with comparable benefits in national
multi-employer plans not administered by the Company. The Company contributed $2,291 and
$2,766 to these plans during 2009 and 2010, respectively. Should the Company cease to
participate in these plans it could be subject to a withdrawal liability. |
| |
|
ZKM sponsors an unfunded retirement plan and the Company has estimated ZKM’s liability for this
plan to be approximately $2,379 and $2,211 at December 31, 2009 and 2010, respectively. The
Company has included ZKM’s estimated liability in the pension liability in the consolidated
balance sheets. |
| (9) |
|
Deferred Compensation |
| |
|
As a part of the total compensation program at the Company, a number of nonqualified plans have
been adopted which entail a portion of deferred compensation. For the individuals
participating in these deferred compensation programs, the deferred portion of their salary
and/or incentive pay has been placed into a Rabbi Trust for the benefit of those individuals
until such time as the assets are payable pursuant to the terms of the deferred compensation
programs. In the event of a liquidation of the assets of the Company, the assets placed in the
Rabbi Trusts are subject to the general claims of creditors of the Company. The deferred
compensation assets held in the Rabbi Trusts amounted
to $3,723 and $3,354 as of December 31, 2009 and 2010, respectively, and are included as a part
of other assets on the consolidated balance sheets of the Company. The obligation to release
these assets to participating individuals is reflected as a part of other noncurrent
liabilities on the consolidated balance sheets of the Company. The investments are held on the
balance sheet and are considered available-for-sale securities. The unrealized gain (loss) on
the Rabbi Trust assets amounted to $526 and $293 in 2009 and 2010, respectively, and is
recorded net of tax as other comprehensive income on the balance sheets. |
F-27
| |
|
Forging has a profit sharing program in which substantially all of the employees are eligible
to participate. The profit sharing payout is derived from a formula based on net income and is
payable no later than February 15th of the subsequent year. The expense was $1,517,
$350 and $2,677 in 2008, 2009 and 2010, respectively. PCT has a profit sharing program in
which all employees are eligible to participate. The profit sharing pool is calculated based
on various internal operating measurements. The expense was $368, $261 and $602 in 2008, 2009
and 2010, respectively. For Stowe, a profit sharing program for all employees had an expense
of $64, $0 and $207 in 2008, 2009 and 2010, respectively. Profit sharing at Aerex and
Chen-Tech for 2008 was provided by the former owners of each business. In 2009, Aerex and
Chen-Tech did not pay profit sharing. In 2010, Aerex and Chen-Tech had the respective expense
of $120 and $169 for profit sharing. |
| (11) |
|
Commitments and Contingencies |
| |
(a) |
|
The Company is involved in various stages of investigations relative to
environmental protection matters relating to various waste disposal sites. The potential
costs related to such matters and the possible impact thereof on future operations are
uncertain due in part to uncertainty as to the extent of the pollution, the complexity of
laws and regulations and their interpretations, the varying costs and effectiveness of
alternative cleanup technologies and methods, and the questionable level of the Company’s
involvement. The Company had an accrual of $300 at December 31, 2009 and 2010, included
in other noncurrent liabilities on the consolidated balance sheets of the Company, for
potential losses related to these matters. The Company does not anticipate such losses
will have a material impact on the financial statements beyond the aforementioned
provisions. |
| |
(b) |
|
The Company has been named as a defendant in a number of asbestos cases in
Mississippi, six cases in Illinois, one case in Wisconsin and one case in California. As
of December 31, 2010, the Company has been dismissed from the case in California and has
nine claims in Mississippi, two claims in Illinois and one in Wisconsin. The Company has
notified its insurance carriers of these claims and is vigorously defending these
actions. The Company has never manufactured or processed asbestos. The Company’s only
exposure to asbestos involves products the Company purchased from third parties. The
Company has not made any provision in its financial statements for the asbestos
litigation. |
| |
(c) |
|
The Company is participating in an investigation initiated by U.S. Customs & Border
Protection (“Customs”) into duty drawback claims filed on behalf of the Company by its
former export agent. The Company is cooperating with Customs in this investigation and
has voluntarily suspended its duty drawback claims. Based upon its internal
investigation, the Company believes any errors or omissions with respect to its filings
were solely attributable to its former export agent. The Company and Customs have
tentatively agreed to an Offer in Compromise whereby both parties agree to settle the
matter for the amount of approximately $146 and the repayment of approximately $130 of
prior duty drawback claims. The Company has made adequate provisions in its financial
statements for this resolution. |
F-28
| |
(d) |
|
The Company has unconditional fixed price purchase obligations (take-or-pay
contracts) of approximately $85,418 comprised of commitments to purchase natural gas of
approximately $12,084 and raw material of approximately $73,334. These obligations are
for purchases necessary to fulfill the Company’s production backlog. None of these
obligations may be net settled. The Company’s future commitments approximate $63,991 in
2011 and $21,427 in 2012 through 2013. During 2008, 2009 and 2010, the Company fulfilled
its minimum contractual purchase obligations for those periods. |
| |
(e) |
|
The Company and each of its directors have been named as defendants in a lawsuit in
Wisconsin State Circuit Court and in a separate lawsuit in federal court in the eastern
district of Wisconsin. Each of these cases is brought by a stockholder of the Company
alleging a breach of fiduciary duty in connection with the proposed merger with ATI.
Neither case seeks monetary damages. Rather, each case requests equitable relief in
enjoining the merger. The Company is defending these actions and has alerted its
insurer. |
| |
|
Various other lawsuits and claims arising in the normal course of business are pending against
the Company and losses that might result from such actions are not expected to be material to
the financial statements. |
| (12) |
|
Related Party Transactions |
| |
|
Since 1995, the Company has participated in a relationship with Weber Metals, Inc. (“Weber”).
The relationship is directed toward serving the jet engine market by combining the Company’s
technology and market presence with Weber’s unique equipment. A director of the Company is the
former chief executive officer of Weber. The Company’s payments to Weber under the
relationship were $367, $371 and $372 in 2008, 2009 and 2010, respectively. |
| |
|
The Company has entered into a long-term lease for the Irvine, California facilities occupied
by Chen-Tech from the former owners of Chen-Tech for an annual rental of $504. One of the
former owners of Chen-Tech is continuing to serve as President of Chen-Tech. |
| |
|
Basic earnings per share of common stock are computed by dividing net income by the weighted
average number of common shares outstanding during the period. Diluted earnings per share of
common stock are computed by dividing net income by the weighted average number of common
shares and common share equivalents related to the assumed exercise of stock options and
warrants, using the treasury stock method. |
| |
|
The following shares were used to calculate basic and diluted earnings per share for the years
ended December 31, 2008, 2009 and 2010; there were no anti-dilutive shares in any year: |
| |
|
|
|
|
|
|
|
|
|
|
|
|
| |
|
December 31, |
|
| |
|
2008 |
|
|
2009 |
|
|
2010 |
|
Average Basic Common Shares Outstanding |
|
|
14,998,437 |
|
|
|
15,901,833 |
|
|
|
15,742,247 |
|
Incremental Shares Applicable to
Common Stock Options |
|
|
2,407 |
|
|
|
413 |
|
|
|
954 |
|
|
|
|
|
|
|
|
|
|
|
Average Diluted Common Shares Outstanding |
|
|
15,000,844 |
|
|
|
15,902,246 |
|
|
|
15,743,201 |
|
|
|
|
|
|
|
|
|
|
|
F-29
| |
|
On July 9, 2008, the Company acquired all of the outstanding equity of Aerex Manufacturing,
Inc. (“Aerex”) for a combined cash, $11,817, and stock consideration of 45,750 shares which
equated to $941. The net purchase price of $12,758 reflects a post-closing reduction of
$1,200. Located in
South Windsor, Connecticut, Aerex provides precision machining of titanium components for the
aerospace industry. |
| |
|
A summary of the amounts assigned to the assets and liabilities of Aerex is as follows: |
| |
|
|
|
|
|
Net Working Capital |
|
$ |
1,892 |
|
Property, Plant and Equipment |
|
|
3,116 |
|
Goodwill |
|
|
6,666 |
|
Amortizable Intangibles |
|
|
3,651 |
|
Deferred Income Tax Liability |
|
|
(2,567 |
) |
Other Noncurrent Liabilities |
|
|
— |
|
|
|
|
|
|
|
$ |
12,758 |
|
|
|
|
|
| |
|
The Company acquired all of the outstanding equity of Chen-Tech Industries, Inc. (“Chen-Tech”)
on September 4, 2008 for a combined cash, $27,254, and stock consideration of 1,256,211 shares
which equated to $31,820. Chen-Tech is a forger of nickel and titanium rotating components for
commercial and military jet engines. The Chen-Tech facility is located in Irvine, California. |
| |
|
A summary of the amounts assigned to the assets and liabilities of Chen-Tech is as follows: |
| |
|
|
|
|
|
Net Working Capital |
|
$ |
7,222 |
|
Property, Plant and Equipment |
|
|
21,359 |
|
Goodwill |
|
|
21,624 |
|
Amortizable Intangibles |
|
|
16,360 |
|
Deferred Income Tax Liability |
|
|
(6,068 |
) |
Other Noncurrent Liabilities |
|
|
(1,423 |
) |
|
|
|
|
|
|
$ |
59,074 |
|
|
|
|
|
| |
|
Goodwill and amortizable intangibles for both acquisitions are not deductible for income tax
purposes. |
| |
|
The amortizable intangibles for both acquisitions are composed of customer relationships which
will be amortized over 50 years. |
| |
|
For both of the acquisitions, the number of shares was determined by the average thirty-day
closing price prior to the acquisition closing dates. |
F-30
| (15) |
|
Quarterly Results of Operations (Unaudited) |
| |
|
The following table sets forth unaudited consolidated income statement data for each quarter of
the Company’s last two fiscal years. The unaudited quarterly financial information has been
prepared on the same basis as the annual information presented in the financial statements and,
in management’s opinion, reflects all adjustments (consisting of normal recurring entries)
necessary for a fair presentation of the information provided. The operating results for any
quarter are not necessarily indicative of results for any future period. |
| |
|
|
|
|
|
|
|
|
|
|
|
|
|
|
|
|
| |
|
Quarters Ended |
|
| 2009 |
|
March 31 |
|
|
June 30 |
|
|
September 30 |
|
|
December 31 |
|
Net Sales |
|
$ |
105,739 |
|
|
$ |
84,686 |
|
|
$ |
76,191 |
|
|
$ |
83,216 |
|
Gross Profit |
|
|
7,324 |
|
|
|
6,337 |
|
|
|
4,722 |
|
|
|
8,704 |
|
Operating Income (Loss) |
|
|
3,282 |
|
|
|
2,064 |
|
|
|
(970 |
) |
|
|
4,872 |
|
Net Income (Loss) |
|
|
1,200 |
|
|
|
650 |
|
|
|
(2,209 |
) |
|
|
6,453 |
|
Basic Earnings (Loss) Per Share |
|
|
0.08 |
|
|
|
0.04 |
|
|
|
(0.14 |
) |
|
|
0.41 |
|
Diluted Earnings (Loss) Per Share |
|
|
0.08 |
|
|
|
0.04 |
|
|
|
(0.14 |
) |
|
|
0.41 |
|
| |
|
|
|
|
|
|
|
|
|
|
|
|
|
|
|
|
| |
|
Quarters Ended |
|
| 2010 |
|
March 31 |
|
|
June 30 |
|
|
September 30 |
|
|
December 31 |
|
Net Sales |
|
$ |
98,948 |
|
|
$ |
99,407 |
|
|
$ |
100,280 |
|
|
$ |
104,497 |
|
Gross Profit |
|
|
13,663 |
|
|
|
16,698 |
|
|
|
16,262 |
|
|
|
19,033 |
|
Operating Income |
|
|
9,463 |
|
|
|
12,666 |
|
|
|
11,733 |
|
|
|
13,123 |
|
Net Income |
|
|
5,348 |
|
|
|
7,538 |
|
|
|
6,218 |
|
|
|
6,271 |
|
Basic Earnings Per Share |
|
|
0.34 |
|
|
|
0.48 |
|
|
|
0.40 |
|
|
|
0.40 |
|
Diluted Earnings Per Share |
|
|
0.34 |
|
|
|
0.48 |
|
|
|
0.40 |
|
|
|
0.40 |
|
| |
|
Per share amounts for the quarters and the full years have each been calculated separately.
Accordingly, quarterly amounts may not add to the annual amounts because of differences in the
average shares outstanding in each period. |
| (16) |
|
Valuation and Qualifying Accounts |
| |
|
|
|
|
|
|
|
|
|
|
|
|
|
|
|
|
| |
|
|
|
|
|
|
|
|
|
Accounts |
|
|
|
|
| |
|
Balance at |
|
|
Provision |
|
|
Written Off/ |
|
|
Balance at |
|
| |
|
Beginning |
|
|
Charged to |
|
|
Reserve |
|
|
End of |
|
| |
|
of Year |
|
|
Profit & Loss |
|
|
Increased |
|
|
Year |
|
Year ended December
31, 2008 Allowance
for Doubtful
Accounts |
|
$ |
88 |
|
|
$ |
3 |
|
|
$ |
(7 |
) |
|
$ |
84 |
|
Year ended December
31, 2009 Allowance
for Doubtful
Accounts |
|
$ |
84 |
|
|
$ |
914 |
|
|
$ |
(923 |
) |
|
$ |
75 |
|
Year ended December
31, 2010 Allowance
for Doubtful
Accounts |
|
$ |
75 |
|
|
$ |
60 |
|
|
$ |
65 |
|
|
$ |
200 |
|
F-31
INDEX TO EXHIBITS
| |
|
|
|
|
| Exhibit |
|
|
|
Page |
| Numbers |
|
Description |
|
Number |
3 (a)
|
|
Articles of Incorporation of the Company as filed with the Secretary of
the State of Wisconsin filed with Form S-1 as Exhibit 3.2 on December
23, 1997 are incorporated by reference. |
|
|
|
|
|
|
|
3 (b)
|
|
The Ladish Co., Inc. Amended and Restated By-Laws filed with Form 10-Q
as Exhibit 3(b) on November 5, 2003 are incorporated by reference. |
|
|
|
|
|
|
|
10 (a)
|
|
Form of Ladish Co., Inc. 1996 Long Term Incentive Plan filed with Form
S-1 as Exhibit 10.4 on December 23, 1997 is incorporated by reference. |
|
|
|
|
|
|
|
10 (b)
|
|
Form of Employment Agreement between Ladish Co., Inc. and certain of
its executive officers filed with Form S-1 as Exhibit 10.5 on December
23, 1997 is incorporated by reference. |
|
|
|
|
|
|
|
10 (c)
|
|
Amendment No. 1 dated April 13, 2001 to Credit Agreement dated April
14, 2000 among Ladish Co., Inc. and Firstar Bank Milwaukee, N.A. and
the Financial Institutions Parties thereto, filed with Form 10-K on
February 22, 2002 is incorporated by reference. |
|
|
|
|
|
|
|
10 (d)
|
|
Amendment No. 2 dated July 17, 2001 to Credit Agreement dated April 14,
2000 among Ladish Co., Inc. and Firstar Bank Milwaukee, N.A. and the
Financial Institutions Parties thereto, filed with Form 10-K on
February 22, 2002 is incorporated by reference. |
|
|
|
|
|
|
|
10 (e)
|
|
Amendment No. 3 dated April 12, 2002 to Credit Agreement dated April
14, 2000 among Ladish Co., Inc. and U.S. Bank National Association and
the Financial Institutions Party thereto, filed with Form 10-K on March
25, 2003 is incorporated by reference. |
|
|
|
|
|
|
|
10 (f)
|
|
Amendment No. 4 dated December 31, 2002 to Credit Agreement dated April
14, 2000 among Ladish Co., Inc. and U.S. Bank National Association and
the Financial Institutions Party thereto, filed with Form 10-K on March
25, 2003 is incorporated by reference. |
|
|
|
|
|
|
|
10 (g)
|
|
Amendment No. 5 dated December 30, 2003 to Credit Agreement dated April
14, 2000 among Ladish Co., Inc. and U.S. Bank National Association and
the Financial Institutions Party thereto, filed with Form 10-K on
February 25, 2004 is incorporated by reference. |
|
|
|
|
|
|
|
10 (h)
|
|
Amendment No. 6 dated December 29, 2004 to Credit Agreement dated April
14, 2000 among Ladish Co., Inc. and U.S. Bank National Association and
the Financial Institutions Party Thereto, filed with Form 10-K on March
14, 2005 is incorporated by reference. |
|
|
|
|
|
|
|
10 (i)
|
|
Amendment No. 7 dated July 20, 2005 to Credit Agreement dated April 14,
2000 among Ladish Co., Inc. and U.S. Bank National Association and the
Financial Institutions Party Thereto, filed with Form 10-K on March 13,
2006 is incorporated by reference. |
|
|
|
|
|
|
|
10 (j)
|
|
Amendment No. 8 dated April 28, 2006 to Credit Agreement dated April
14, 2000 among Ladish Co., Inc. and U.S. Bank National Association and
the Financial Institutions Party Thereto, filed with Form 10-K on March
7, 2007 is incorporated by reference. |
|
|
|
|
|
|
|
10 (k)
|
|
Amendment No. 9 dated April 25, 2007 to Credit Agreement dated April 14,
2000 among Ladish Co., Inc. and U.S. Bank National Association and the
Financial Institutions Party Thereto, filed with Form 10-K on February
22, 2008 is incorporated by reference. |
|
|
|
|
|
|
|
10 (l)
|
|
Amendment No. 10 dated April 25, 2008 to Credit Agreement dated April
14, 2000 among Ladish Co., Inc. and U.S. Bank National Association and
the Financial Institutions Party Thereto, filed with Form 10-Q on April
29, 2008 is incorporated by reference. |
|
|
|
|
|
|
|
10 (m)
|
|
Second Amended and Restated Credit Agreement dated April 10, 2009 among
Ladish Co., Inc. and U.S. Bank National Association and the Financial
Institutions Party Thereto, filed with Form 8-K on April 10, 2009 is
incorporated by reference. |
|
|
X-1
| |
|
|
|
|
| Exhibit |
|
|
|
Page |
| Numbers |
|
Description |
|
Number |
10 (n)
|
|
Amendment No. 1 dated July 31, 2009 to Second Amended
and Restated Credit Agreement dated April 10, 2009 among
Ladish Co., Inc. and U.S. Bank National Association and
the Financial Institutions Party Thereto, filed with
Form 10-Q on July 31, 2009 is incorporated by reference. |
|
|
|
|
|
|
|
10 (o)
|
|
Amendment No. 2 dated April 8, 2010 to Second Amended
and Restated Credit Agreement dated April 10, 2009 among
Ladish Co., Inc. and U.S. Bank National Association and
the Financial Institutions Party thereto, filed with
Form 8-K on April 9, 2010 is incorporated by reference. |
|
|
|
|
|
|
|
10 (p)
|
|
Note Purchase Agreement dated May 16, 2006 between
Ladish Co., Inc. and the Purchasers listed therein,
filed with Form 8-K on May 17, 2006 is incorporated by
reference. |
|
|
|
|
|
|
|
10 (q)
|
|
Note Purchase Agreement dated September 2, 2008 between
Ladish Co., Inc. and the Purchasers listed therein,
filed with Form 8-K on September 2, 2008 is incorporated
by reference. |
|
|
|
|
|
|
|
10 (r)
|
|
Third Amendment dated December 21, 2009 to Note Purchase
Agreements dated as of July 20, 2001 between Ladish Co.,
Inc. and the Purchasers listed therein, filed with Form
10-K on March 5, 2010 is incorporated by reference. |
|
|
|
|
|
|
|
10 (s)
|
|
Agreement dated September 15, 1995 between Ladish Co.,
Inc. and Weber Metals, Inc. filed with Form S-1 as
Exhibit 10.7 on February 23, 1998 is incorporated by
reference. |
|
|
|
|
|
|
|
10 (t)
|
|
Agreement dated February 24,2005 between Ladish Co.,
Inc. and Huta Stalowa Wola S.A. filed with Form 8-K on
March 2, 2005 is incorporated by reference. |
|
|
|
|
|
|
|
10 (u)
|
|
Ladish Co., Inc. Long-Term Incentive Plan dated January
1, 2006, filed with Form 10-K on March 7, 2007 is
incorporated by reference. |
|
|
|
|
|
|
|
14
|
|
Ladish Co., Inc. Policies filed with Form 10-K on March
25, 2003 is incorporated by reference. |
|
|
|
|
|
|
|
21
|
|
List of Subsidiaries of the Company. |
|
X-3 |
|
|
|
|
|
23
|
|
Consent of Independent Registered Public Accounting Firm. |
|
X-4 |
|
|
|
|
|
31 (a)
|
|
Written statement of the chief executive officer of the
Company certifying this Form 10-K complies with the
requirements of Section 13(a) of the Securities Exchange
Act of 1934. |
|
X-5 |
|
|
|
|
|
31 (b)
|
|
Written statement of the chief financial officer of the
Company certifying this Form 10-K complies with the
requirements of Section 13(a) of the Securities Exchange
Act of 1934. |
|
X-6 |
|
|
|
|
|
32
|
|
Written Statement of the chief executive officer and
chief financial officer of the Company certifying this
Form 10-K complies with the requirements of 18 U.S.C.
§1350 |
|
X-7 |
X-2