Attached files
| file | filename |
|---|---|
| EX-23.1 - Symmetry Medical Inc. | v213712_ex23-1.htm |
| EX-32.1 - Symmetry Medical Inc. | v213712_ex32-1.htm |
| EX-31.2 - Symmetry Medical Inc. | v213712_ex31-2.htm |
| EX-24.1 - Symmetry Medical Inc. | v213712_ex24-1.htm |
| EX-21.1 - Symmetry Medical Inc. | v213712_ex21-1.htm |
| EX-31.1 - Symmetry Medical Inc. | v213712_ex31-1.htm |
UNITED STATES
SECURITIES AND EXCHANGE COMMISSION
Washington, D.C. 20549
FORM 10-K
ANNUAL REPORT PURSUANT TO SECTION 13 OR 15(d)
OF THE SECURITIES EXCHANGE ACT OF 1934
For the Fiscal Year Ended January 1, 2011
Commission File Number 001-32374
SYMMETRY MEDICAL INC.
(Exact Name of Registrant as Specified in Its Charter)
|
Delaware
|
35-1996126
|
|
|
(State of Incorporation)
|
(I.R.S. Employer
Identification No.)
|
3724 North State Road 15
Warsaw, Indiana 46582
(Address of Principal Executive Offices) (Zip Code)
(574) 268-2252
(Registrant's Telephone Number, Including Area Code)
Securities registered pursuant to Section 12(b) of the Act:
|
Title of Each Class:
|
Name of Each Exchange on Which Registered:
|
|
|
Common Stock, Par Value $0.001 Per Share
|
New York Stock Exchange
|
Securities registered pursuant to section 12(g) of the Act: None
Indicate by check mark if the registrant is a well-known seasoned issuer, as defined in Rule 405 of the Securities Act. Yes ¨ No x
Indicate by check mark if the registrant is not required to file reports pursuant to Section 13 or Section 15(d) of the Act. Yes o No x
Indicate by check mark whether the registrant (l) has filed all reports required to be filed by Section 13 or 15(d) of the Securities Exchange Act of l934 during the preceding 12 months (or for such shorter period that the registrant was required to file such reports), and (2) has been subject to such filing requirements for the past 90 days. Yes x No o
Indicate by check mark whether the registrant has submitted electronically and posted on its corporate Web site, if any, every Interactive Data File required to be submitted and posted pursuant to Rule 405 of Regulation S-T (S232.405 of this chapter) during the preceding 12 months (or for such shorter period that the registrant was required to submit and post such files). Yes o No o
Indicate by check mark if disclosure of delinquent filers pursuant to Item 405 of Regulation S-K (229.405 of this chapter) is not contained herein, and will not be contained, to the best of registrant's knowledge, in definitive proxy or information statements incorporated by reference in Part III of this Form 10-K or any amendment to this Form 10-K. x
Indicate by check mark whether the registrant is a large accelerated filer, an accelerated filer, a non-accelerated filer, or a smaller reporting company. See the definitions of "large accelerated filer," "accelerated filer" and" smaller reporting company" in Rule 12b-2 of the Exchange Act.
|
Large accelerated filer ¨
|
Accelerated filer x
|
Non-accelerated filer ¨
|
Smaller reporting company ¨
|
Indicate by check mark whether the registrant is a shell company (as defined in Rule 12b-2 of the Act). Yes o No x
The aggregate market value of voting stock of Symmetry Medical Inc. held by non-affiliates of the Registrant as of July 3, 2010, based on the closing price was $10.39, as reported by the New York Stock Exchange: Approximately $373.5 million.
The number of shares outstanding of the registrant's common stock as of March 4, 2011 was 36,345,292.
DOCUMENTS INCORPORATED BY REFERENCE
Certain information is incorporated into Part III of this report by reference to the Registrant's 2011 Proxy Statement to be filed with the Securities and Exchange Commission not later than 120 days after the end of the fiscal year covered by this Form 10-K.
TABLE OF CONTENTS
SYMMETRY MEDICAL INC.
TABLE OF CONTENTS
|
PART I
|
||
|
Item 1.
Business
|
3
|
|
|
Item 1A.
Risk Factors
|
13
|
|
|
Item 1B.
Unresolved Staff Comments
|
24
|
|
|
Item 2.
Properties
|
24
|
|
|
Item 3.
Legal Proceedings
|
25
|
|
|
Item 4.
(Removed and Reserved)
|
25
|
|
|
PART II
|
||
|
Item 5.
Market for the Registrant's Common Equity, Related Stockholder Matters and Issuer Purchases of Equity Securities
|
25
|
|
|
Item 6.
Selected Financial Data
|
27
|
|
|
Item 7.
Management's Discussion and Analysis of Financial Condition and Results of Operations
|
28
|
|
|
Item 7A.
Quantitative and Qualitative Disclosures About Market Risks
|
37
|
|
|
Item 8.
Financial Statements and Supplementary Data
|
39
|
|
|
Item 9.
Changes in and Disagreements With Accountants on Accounting and Financial Disclosure
|
62
|
|
|
Item 9A.
Controls and Procedures
|
62
|
|
|
Item 9B.
Other Information
|
62
|
|
|
PART III
|
||
|
Item 10.
Directors, Executive Officers and Corporate Governance
|
63
|
|
|
Item 11.
Executive Compensation
|
63
|
|
|
Item 12.
Security Ownership of Certain Beneficial Owners and Management and Related Stockholder Matters
|
63
|
|
|
Item 13.
Certain Relationships and Related Transactions and Director Independence
|
63
|
|
|
Item 14.
Principal Accounting Fees and Services
|
63
|
|
|
PART IV
|
||
|
Item 15.
Exhibits, Financial Statement Schedules
|
64
|
|
|
Signatures
|
66
|
|
1
Cautionary Note Regarding Forward-Looking Statements
Throughout this Annual Report on Form 10-K, or in other reports or registration statements filed from time to time with the Securities and Exchange Commission under the Securities Exchange Act of 1934, or under the Securities Act of 1933, as well as in documents we incorporate by reference or in press releases or oral statements made by our officers or representatives, we may make statements that express our opinions, expectations, or projections regarding future events or future results, in contrast with statements that reflect historical facts. These predictive statements, which we generally precede or accompany by such typical conditional words such as "anticipate," "intend," "believe," "estimate," "plan," "seek," "project,"
"potential," or "expect," or by the words "may," "will," "could," or "should," and similar expressions or terminology are intended to operate as "forward-looking statements" of the kind permitted by the Private Securities Litigation Reform Act of 1995. That legislation protects such predictive statements by creating a "safe harbor" from liability in the event that a particular prediction does not turn out as anticipated.
Forward-looking statements convey our current expectations or forecast future events. While we always intend to express our best judgment when we make statements about what we believe will occur in the future, and although we base these statements on assumptions that we believe to be reasonable when made, these forward-looking statements are not a guarantee of performance, and you should not place undue reliance on such statements. Forward-looking statements are subject to many uncertainties and other variable circumstances, many of which are outside of our control, that could cause our actual results and experience to differ materially from those we thought would occur.
We also refer you to and believe that you should carefully read the portion of this report described in "Risk Factors" to better understand the risks and uncertainties that are inherent in our business and in owning our securities.
Any forward-looking statements which we make in this report or in any of the documents that are incorporated by reference herein speak only as of the date of such statement, and we undertake no ongoing obligation to update such statements. Comparisons of results between current and any prior periods are not intended to express any future trends or indications of future performance, unless expressed as such, and should only be viewed as historical data.
2
PART I
Item 1. Business
General
Symmetry Medical Inc. (which we sometimes refer to, together with our consolidated subsidiaries, as the "Corporation," "we," "our" or "Symmetry") is a leading independent provider of implants and related instruments and cases to global orthopedic device manufacturers. We design, develop and produce these products for companies in other segments of the medical device market, including the arthroscopy, dental, laparoscopy, osteobiologic and endoscopy segments, and we also provide limited specialized products to non-healthcare markets, such as the aerospace market. Our Total Solutions® concept provides our customers with a collaborative process for developing complete implant systems, including the implant, the surgical instruments, and
the related case. This approach presents our customers with a broad range of products, as well as comprehensive design, engineering and project management services and state of the art production capabilities to help them bring their systems to market quickly and efficiently. We believe that our close customer relationships, broad product offering and leading quality and regulatory performance give us a competitive advantage.
During fiscal year 2010, we generated revenue of $360.8 million, derived primarily from the sale of products to the orthopedic device market and other medical markets. Our Total Solutions® approach is supported by an experienced team of designers, development engineers, logistics specialists and by our global sales force that works with our customers to coordinate all of our products.
Our primary products include:
|
·
|
implants, including forged, cast and machined products for the global orthopedic device market;
|
|
·
|
instruments used in the placement and removal of orthopedic implants and in other surgical procedures;
|
|
·
|
cases, including plastic, metal and hybrid cases used to organize, secure and transport medical devices for orthopedic, endoscopy, dental and other surgical procedures; and
|
|
·
|
other specialized products for the aerospace market.
|
History
Our business was established in 1976 as a supplier of instruments to orthopedic device manufacturers. Symmetry Medical Inc. was incorporated in Delaware on July 25, 1996. Over the past five years, we have made several acquisitions which expanded our customer base, enhanced our product offerings and extended our product lines.
In 2006, we acquired Riley Medical and Everest Metal. Riley Medical specializes in cases and trays for the orthopedic industry and the acquisition of Riley Medical included many patented products and expanded our product offering of medical cases and trays to the medical markets. Everest Metal specializes in finishing implants for the orthopedic industry.
During 2007, we acquired Clamonta Ltd., TNCO, Inc., Specialty Surgical Instrumentation, Inc. and UCA, LLC. Clamonta Ltd. machines products for the global aerospace industry. TNCO was a privately owned company with a 40-year history of designing and supplying instruments for arthroscopic, laparoscopic, sinus and other minimally invasive procedures. TNCO allows us to leverage our instrument manufacturing while also leveraging their customer base in non-orthopedic segments of the healthcare market. Specialty Surgical Instrumentation, Inc. and UCA, LLC (collectively "SSI") located in Nashville, Tennessee distributes surgical instruments and sterilization containers directly to hospitals. The addition of SSI allows us to offer a broad array of
medical instruments and related products to our customer base. This includes over 13,000 individual items, many of which are held in inventory for quick delivery. For Symmetry, this was our first entry into the medical product distribution industry, which provides us direct access to hospitals.
In January of 2008, we acquired DePuy Orthopaedics, Inc.'s New Bedford, Massachusetts instrument manufacturing facility ("New Bedford") for approximately $45.2 million. This facility manufactures orthopedic instruments as well as general surgical instruments and small implants. In connection with the acquisition, we entered into a supply agreement which, starting January 25, 2008, requires DePuy to make minimum purchases totaling $106 million from New Bedford for a four year period, with specific amounts in each year. The agreement stipulates that these purchases are incremental to other products we previously produced on DePuy’s behalf. These minimum purchases have been met each year since acquisition.
Our Total Solutions® Approach
We believe that we have created a distinct competitive position in the orthopedic device market based upon our Total Solutions® approach. Our Total Solutions® approach presents our customers with a broad range of products, as well as comprehensive design, engineering and project management services and state of the art production capabilities to help bring their implant systems to market quickly and efficiently.
3
Our Total Solutions® offering is based on:
|
·
|
Comprehensive Offerings. We can support our customers' new product offerings from product concept through market introduction and thereafter, by providing seamless design, engineering, prototyping and manufacturing offerings.
|
|
·
|
Single Source for Complete Systems. We assist our customers in developing new implants, and we design and produce instruments for implant-specific surgical procedures. We also provide customized cases that provide a secure, clearly labeled and well organized arrangement of instruments and devices.
|
|
·
|
Proprietary Symmetry Instruments and Cases. Our established lines of proprietary products allow our customers to complete their proprietary implant systems and bring them to market sooner.
|
|
·
|
Precision Manufacturing Expertise. Our extensive expertise and know-how enable us to produce large volumes of specialized products to our customers' precise standards, which we believe makes us a supplier of choice to the largest orthopedic companies. Our core production competencies include net shaped forging, precision casting, thermo forming, precision sheet metal working and machining/finishing. Over the past several years, we developed high precision machining capabilities to better serve the spine implant market.
|
|
·
|
Quality and Regulatory Compliance. Our quality systems are based upon and in compliance with International Organization for Standardization ("ISO") requirements and, where applicable, United States Food and Drug Administration ("FDA") regulations. We believe our level of quality and regulatory compliance systems meet or exceed our customers' expectations. We continue investing in this area to strengthen our leadership position.
|
|
·
|
Global Reach. Our manufacturing capabilities in the United States, United Kingdom, France, Ireland and Malaysia allow us to offer single-source products to our multinational customers, and the geographic breadth of our experienced sales force effectively brings our Total Solutions® approach to customers around the globe.
|
We believe that our Total Solutions® approach offers a number of benefits to our customers, including:
|
·
|
Shorter Time to Market. Our design, engineering and prototyping skills, as well as our ability to transition seamlessly from product development to production of implants, instruments and cases, enable our customers to reduce time to market for their new products.
|
|
·
|
Reduced Total Product Acquisition Costs. Our comprehensive offerings, including design, engineering, prototyping, project management, production and inventory control, allow our customers to reduce their procurement costs and inventory levels, resulting in lower product acquisition costs.
|
|
·
|
Increased Focus on Marketing and Research and Development Efforts. Our extensive production capabilities and comprehensive offerings provide a one-stop outsourcing solution and allow our customers to focus their resources on their design, development and marketing efforts.
|
|
·
|
Rationalized and Reliable Supply Chain. Our scale, scope of products and Total Solutions® approach allow large orthopedic companies to reduce their number of independent suppliers and streamline their operations.
|
|
·
|
Enhanced Product Consistency on a Global Basis. Our extensive production platform, Total Solutions® approach and international presence allow us to meet global demand for orthopedic devices, which is expected to continue to increase.
|
Over the past several years, we have further developed our Total Solutions® offering through strategic acquisitions which expanded our product offerings to include medical cases and trays to non-orthopedic medical markets, additional patented products, enhanced implant finishing capabilities and minimally invasive instrumentation.
Business Strategy
Our goal is to increase our share of the orthopedic device market and to leverage our strengths to expand in other medical device market segments. The key elements of our business strategy are to:
|
·
|
Develop Strategic Relationships With Our Customers Through Access to Key Decision Makers. Our scale, scope of products and Total Solutions® approach positions us as an important partner to our customers. This position gives us access to key decision makers with whom we intend to continue to build strategic relationships.
|
4
|
·
|
Capitalize on Our Total Solutions® Approach. We believe that our Total Solutions® approach shortens product development cycles, reduces design and manufacturing costs, and simplifies purchasing and logistics, and we intend to aggressively market these benefits to our customers.
|
|
·
|
Increase Sales to Existing Customers by Cross Selling Products and Offerings. Our cases are currently sold in nearly every segment of the medical device market. We believe that our diverse customer base offers us a natural entry point to new orthopedic and non-orthopedic customers for our implants and instruments.
|
|
·
|
Leverage Manufacturing Skills. During recent years, we have continued to expand our manufacturing capacity and design resources, and updated much of our manufacturing and development equipment. We intend to continue to leverage our investments in sophisticated equipment and manufacturing know-how to expand our existing customer relationships and to obtain new customers. During the past several years, we developed high precision machining capabilities to better serve the spine implant market.
|
|
·
|
Increase New Product Offerings. Our Design and Development Centers provide expertise and coordination for our design, engineering and prototyping offerings. We intend to use the dedicated expertise of our Design and Development Centers to generate additional development projects with our customers and to expand our line of innovative and independently developed instruments and cases.
|
|
·
|
Collaborate With Emerging Companies. We believe that new and innovative medical device companies are creating a meaningful market presence and that our Total Solutions® approach positions us to help these companies, many of which may have limited resources, manage their product manufacturing and logistic services.
|
|
·
|
Continued Global Expansion. Our global facilities allow us to serve the global medical marketplace. We believe that having local facilities near our global customers and closer to the end consumer allows us to better serve their needs. In December 2006, we opened a facility in Malaysia to better serve our customers in Asia. We are continuing to expand our Malaysian operations and increase its product offerings.
|
|
·
|
Leverage Technology. Our expertise in metal processing and in particular high integrity net shape forging enables us to develop a role as a niche supplier in certain other markets, most notably the aerospace sector, where we supply engine aerofoil blades and other similar parts.
|
|
·
|
Expand Our Sales Channels to Market. Our 2007 acquisition of SSI in Nashville, Tennessee has created an opportunity to sell a range of products that we procure and manufacture directly to hospitals.
|
Products
We design, develop and manufacture implants and related surgical instruments and cases for orthopedic device companies. We also design, develop and manufacture products for companies in other medical device markets, such as dental, osteobiologic and endoscopy, and we provide specialized products used in the aerospace market. We also market and sell highly specialized operating room products, such as instrumentation, fiber optic light sources and non-toxic enzymatic detergent, targeted directly to surgeons. Our revenue from the sale of instruments, implants, cases and other products represented 40.3%, 30.8%, 22.7% and 6.2%, respectively, of our revenue in fiscal 2010, compared with 45.6%, 29.5%, 18.7% and 6.2%, respectively, of our revenue
in fiscal 2009.
Implants
We design, develop and manufacture implants for use in specific implant systems developed by our customers. We make orthopedic implants used primarily in knee and hip implant systems. Our orthopedic implants are used in reconstructive surgeries to replace or repair hips, knees and other joints, such as shoulders, ankles and elbows (sometimes referred to as extremities), that have deteriorated as a result of disease or injury. An orthopedic implant system is generally comprised of several implants designed to work in concert to replicate the structure and function of a healthy joint.
We also manufacture implant products for trauma, spine and other implant systems. Trauma implant systems are used primarily to reattach or stabilize damaged bone or tissue while the body heals. Spinal implant systems are used by orthopedic surgeons and neurosurgeons in the treatment of degenerative diseases, deformities and injuries in various regions of the spine.
5
Our design, engineering and prototyping expertise is an integral part of our implant offering. Medical device companies, which typically focus their resources on developing new implant systems as well as sales and marketing, may rely on us and companies like us to design, develop and manufacture the implants that comprise their implant systems. Our manufacturing capabilities, including our net shaped forging capabilities, technologically advanced casting facility and machining expertise, allow us to produce consistent, tight tolerance implants in large volumes for our customers.
We produce gross shaped, near-net shaped and net shaped implants for medical device manufacturers. Gross shaped implants require a significant amount of machining and hand processing post-forging. Near-net shaped implants are distinguished by geometric features that are thinner, more detailed and have tighter tolerances. Net shaped and near-net shaped implants require far fewer machine and hand operations post-forging. Net shaped implants typically require machining only on vital areas, such as the taper segment of a hip where it is joined to the femoral head.
We have the machining expertise needed to provide finished implants to our customers. Some customers purchase finished implants from us while others purchase unfinished implants and machine them to final specifications.
Our primary implant products and their applications are:
|
·
|
Knees. The knee joint includes the surfaces of three distinct bones: the lower end of the femur, the upper end of the tibia or shin bone, and the patella (knee cap). Cartilage on any of these surfaces can be compromised by disease or injury, leading to pain and inflammation that may require knee reconstruction. Our knee implants include a femoral component, a patella, a tibial tray and an articulating surface (placed on the tibial tray) and are used in total knee reconstruction, partial knee reconstruction and revision procedures. We provide one or more, and in some cases, all of these implants for our customers' knee implant systems. We use proprietary manufacturing know-how and advanced computer aided simulation techniques to produce tight tolerance near-net shaped to net shaped tibial implants that require minimal if any
machining.
|
|
·
|
Hips. The hip joint consists of a ball-and-socket joint that enables a wide range of motion. The hip joint is often replaced due to degeneration of the cartilage between the head of the femur (the ball) and the acetabulum or hollow portion of the pelvis (the socket). This loss of cartilage causes pain, stiffness and a reduction in hip mobility. We produce tight tolerance femoral heads, hip stems, acetabular cups and spiked acetabular cups used in bone conservation, total-hip reconstruction and revision replacement procedures. Our hip stems are forged with tight tolerance details.
|
|
·
|
Extremities, Trauma and Spine. Extremity reconstruction involves the use of an implant system to replace or reconstruct injured or diseased joints, such as the finger, toe, wrist, elbow, foot, ankle and shoulder. Our forging capabilities allow us to produce thin cross sections of material to very tight tolerances for these smaller joint procedures. Trauma implant procedures commonly involve the internal fixation of bone fragments using an assortment of plates, screws, rods, wires and pins. Our spinal implant products consist primarily of plates and screws. We manufacture trauma and spinal plate implants to exact details to fit bone contours. We have in place a high precision machining cell to serve the spine market.
|
Instruments
We make high-precision surgical instruments used in hip, knee and shoulder reconstruction procedures, as well as in spinal, trauma and other implant procedures. We design, develop and manufacture implant-specific and procedure-specific instruments. In addition, we have several orthopedic reamer systems used by many of our large customers. We typically do not manufacture general surgical instruments, but will procure them as an offering to our customers in order to provide our customers with complete instrument sets. We also market and sell highly specialized operating room instrumentation targeted directly to specialty surgeons. We currently have over 1,500 Symmetry standard products in our catalog plus over 13,000 individual items sold
directly to hospitals.
We produce a wide variety of products, primarily knee cutting blocks (instruments that guide blades that cut bone), osteotome revision systems (instruments used to cut through bone), reamers (instruments used for shaping bone sockets or cavities) and retractors (instruments used to pull back tissue for clear sight during surgery). Some of our instrument handles are made with our patented plastic insertion machine, which is designed to withstand the intense heat produced during frequent sterilizations and is attached to the instrument. Our instruments are made to tight tolerances to ensure precise alignment and fitting of implants.
Each implant system typically has an associated instrument set that is used in the surgical procedure to insert that specific implant system. Instruments included in a set vary by implant system. For example, hip and knee implant procedure instrument sets often contain in excess of 100 instruments, whereas revision procedure sets may contain approximately 50 instruments. Usually, instrument sets are sterilized after each use and then reused.
6
The instruments we produce are typically used in either open, minimally invasive, or revision implant procedures and can generally be categorized as:
|
·
|
Implant-specific instruments, which are used solely for a specific brand of implant, such as high-precision knee cutting blocks, certain reamers and broaches; and
|
|
·
|
Procedure-specific instruments, which are designed for a particular type of procedure, such as a minimally invasive hip implant procedure, but can be used with the implant systems of multiple companies.
|
Implant-Specific Instruments. The size, shape and other features of each implant system are unique. Consequently, unique instruments must be used to ensure precise alignment and fitting during the surgical procedure to insert an implant system. Accordingly, when a medical device company develops a new implant system, it typically also develops instruments specifically designed to insert the implant system. Medical device companies typically provide complete, customized implant-specific instrument sets to end users (hospitals, outpatient centers and physicians) in order to facilitate use of the implant.
We seek to collaborate with our customers early in the development process to facilitate the concurrent design of the implant system and the instruments that will accompany the system. Our implant-specific instruments generally include customized reamers, cutting blocks, broaches, rasps, guides and other instruments designed to accommodate the unique size, shape and other features of our customers' implant systems. These instruments are used by the surgeon to cut and shape bone and cavities during the surgical procedure and to align and fit the implant system. We are recognized in the orthopedic community for constructing these instruments to extremely tight tolerances.
Procedure-Specific Instruments. We also manufacture independently developed instruments referred to as our Symmetry products. We have developed these products through our years of experience serving the orthopedic market and our investments in research and development. Complete implant procedure instrument sets typically include certain instruments that are designed for a particular type of procedure but can be used with the implant systems of multiple companies. By purchasing our proven Symmetry products, customers can leverage our extensive experience and expertise to complete their instrument sets more quickly and efficiently.
Our Symmetry products include successful hip and knee revision systems. Instruments that make up revision systems, which are used to remove orthopedic implants, are typically designed for a specific type of procedure but can be used to remove various brands of implants. These self-contained systems include an assortment of osteotome blades that assist the surgeon in separating an implant from cement or bone in-growth where access is limited, while minimizing damage to the bone. Our established revision systems can also be readily modified for a customer by adding additional instruments. In recent years we have seen our Symmetry product sets grow in demand as our large OEM customers distribute the products and we maintain the
device files.
Specialty Surgical Instrumentation. We distribute a wide array of instruments and related products directly to hospitals. These instruments comprise cutting, dissecting, grasping, cauterizing, ligating, coagulating, hot blade cutting, bi-polar and mono-polar instruments as well as reusable and disposable instruments. Most of these instruments are sold into operating room settings, including neurology, ophthalmology, rhinoplasty, reconstructive, cardiovascular, thoracic, vascular, laparoscopic, and gynecology.
Cases
We produce a wide range of plastic, metal and hybrid cases used in over 25 medical device markets, including orthopedic, spinal, arthroscopy, osteobiologic, endoscopy, cardiovascular, dental, ophthalmology, diagnostic imaging and ear, nose and throat surgical procedures. Cases are used to store, transport and arrange implant systems and other medical devices and related surgical instruments. Our cases are generally designed to allow for sterilization and re-use after an implant or other surgical procedure is performed. Our plastic cases are designed to withstand the intense heat produced during the sterilization process.
Many of the cases we make are tailored for specific implant procedures so that the instruments, implants and other devices are arranged within the case to match the order of use in the procedure and are securely held in clearly labeled, custom-formed pockets. We seek to collaborate with our customers early in the development processes to facilitate the concurrent design of the case and related instruments.
We also produce standard cases which are primarily used in the non-orthopedic market segments where the security or presentation of the instruments and devices is not customized for a specific surgery. Over the past several years, we have made a significant investment to obtain 510(k) clearance for our line of standard cases through the FDA pre-market notification process. We believe this allows our customers to reduce time to market and to reallocate financial and human resources that would otherwise be spent on compliance efforts, which provides us with a significant competitive advantage in selling our standard cases.
We have 40 patents related to our case designs and manufacturing processes. We believe that our complete line of plastic, metal and hybrid product offerings strategically positions us in the case market. We also offer medical containers which are used by hospitals to hold instruments when they are sterilized.
7
Highlights of our case product offerings include:
|
·
|
Orthopedic Cases. We produce custom metal, plastic and hybrid cases designed to store, transport and arrange surgical instruments and related implant systems for orthopedic device manufacturers. Proper identification of instruments, such as reamers which are generally included in a range of sizes in one to two millimeter increments, is critical in orthopedic implant procedures. Our graphics and thermo formed tray pockets provide a secure and organized arrangement to assist surgeons during procedures.
|
|
·
|
Endoscopy Cases. We produce cases for endoscope sterilization for many types of sterilization methods.
|
|
·
|
Dental Cases. We produce cases used in dental implant and general dental procedures. Dental implant cases are typically complex and include many levels of trays, while cases used in general dental procedures tend to be smaller and less complex.
|
|
·
|
Sterilization Containers. We produce lightweight and durable Ultra Container System which is designed for the sterilization of all surgical instruments. This product is primarily sold directly to hospitals.
|
|
·
|
Other Cases. We also manufacture and sell cases for arthroscopy, osteobiologic, cardiovascular, ophthalmology, diagnostic imaging and ear, nose and throat procedures.
|
Specialized Non-Healthcare Products
We offer specialized non-healthcare products on a limited basis. Our core design, engineering and manufacturing competencies give us the expertise to offer aerospace products. Our aerospace products primarily are net shaped aerofoils and non-rotating aircraft engine forgings produced for our aerospace customers. Additionally, our offering in the aerospace industry includes aerospace machining capabilities.
Product Development
Our Design and Development Centers provide dedicated expertise and greater coordination for our design, engineering and prototyping offerings. Our main Design and Development Center is located in Warsaw, Indiana, and brings together talented engineering and design personnel and provides them with state-of-the-art design software and prototyping equipment. Our Design and Development Centers serve to centralize and better institutionalize our design and engineering knowledge and create a fertile environment for new product development. We can coordinate the product development projects for our customers as well as the efforts of our engineers and designers in order to ensure that we have the appropriate people and technology focused on
particular product development initiatives. We seek to collaborate with our customers' product development teams and to assist in the design, engineering and prototyping of new medical device systems from the beginning of the development process. Our sales staff is technically trained and works closely with our customers' staff. As new product concepts are formulated, our sales people bring in our design and engineering personnel and utilize the resources of our Design and Development Centers to provide dedicated design teams with exceptional knowledge and experience. As a project evolves, we can rapidly create prototypes of the proposed product, instrument, case or implant. Working closely with our customers through the conceptual, planning and prototyping stages allows us to quickly scale up for manufacturing of the product.
In addition to supporting our customers' product development efforts, our Design and Development Centers are continuously developing our own product lines, which we refer to as Symmetry products. We develop products by utilizing years of experience and knowledge, investing in research and development and continually seeking to expand our knowledge of the marketplace by consulting surgeons and other end users of our products. We currently offer over 1,500 Symmetry products, including instruments for minimally invasive surgical implant procedures and hip and knee revision systems.
Environmental Issues
Our discussion of environmental issues is presented under the caption "Environmental" in Item 7, Management's Discussion and Analysis of Financial Condition and Results of Operations in this Form 10-K.
Capital Investment
Information concerning our capital expenditures is presented under the caption "Capital Expenditures" in Item 7, Management's Discussion and Analysis of Financial Condition and Results of Operations in this Form 10-K.
Customers
We supply our products primarily to manufacturers in the medical device market. Our customers include large orthopedic device manufacturers, including Biomet Inc., DePuy Orthopaedics, Inc., a subsidiary of Johnson & Johnson, ("DePuy"), Medtronic Inc., Smith & Nephew Plc, Stryker Corp. and Zimmer Holdings, Inc. ("Zimmer"). We also have established relationships, primarily through our case product offerings, with leading medical device manufacturers and distributors in numerous other medical device market segments, including Cardinal Health, Inc., Karl Storz, Edward Lifesciences and St. Jude Medical Inc. With the addition of SSI in August 2007, we serve over 1,000 additional customers, some of which own multiple hospitals.
8
We sold to approximately 1,850 customers in fiscal 2010. Sales to our ten largest customers represented 71.3% and 73.1% of our revenue in fiscal 2010 and 2009, respectively. Our three largest customers accounted for 31.7%, 10.5% and 10.0% of our revenue in fiscal 2010 and were, in alphabetical order, DePuy, Stryker Corp and Zimmer. In 2009, our largest customer, DePuy, accounted for 39.1% of our revenue. No other customer, other than those stated above, accounted for more than 10% of our revenue in fiscal 2010 or fiscal 2009. We typically serve several product teams and facilities within each of our largest customers, which mitigates our reliance on any particular customer. Over the past five years, we have reduced
our concentration in the orthopedic industry through various acquisitions, which increased our presence in non-orthopedic markets.
We sell our products to customers domestically and in a number of regions outside the United States. In addition, our customers often distribute globally products purchased from us in the United States. Set forth below is a summary of percent of revenue by selected geographic locations in our last three fiscal years, based on the location to which we shipped our products:
|
Fiscal Year Ended
|
||||||||||||
|
2010
|
2009
|
2008
|
||||||||||
|
United States
|
74.2 | % | 73.3 | % | 71.5 | % | ||||||
|
Ireland
|
8.8 | % | 10.2 | % | 7.5 | % | ||||||
|
United Kingdom
|
7.7 | % | 8.0 | % | 13.0 | % | ||||||
|
Other foreign countries
|
9.3 | % | 8.5 | % | 8.0 | % | ||||||
|
Total net revenues
|
100.0 | % | 100.0 | % | 100.0 | % | ||||||
Sales and Marketing
Our sales and marketing efforts emphasize our design and engineering expertise, internally developed Symmetry products, manufacturing capabilities, international distribution network and our ability to provide customers with a comprehensive product offering. We are increasingly presenting our products to customers in a Total Solutions® concept which offers the customer a collaborator for developing complete implant, instrument and case solutions.
We have over 70 sales and marketing personnel worldwide serving our Original Equipment Manufacturer ("OEM") customers and more than 30 direct sales personnel selling directly to hospitals. In addition to our internal sales efforts, we also sell standard cases through distributors. Our sales personnel are trained in all of our products in order to cross-sell and identify opportunities outside their immediate area of focus. We typically serve several product teams and facilities within each OEM customer which diminishes our reliance on any one purchasing decision. Our customer base for cases extends into nearly every segment of the medical device market. We believe there is an opportunity to leverage our existing relationships among this
customer base to achieve greater penetration of our customized instrument and implant products. We intend to increase our marketing of implants, instruments and our Total Solutions® concept to these customers.
Our sales personnel are technically trained and are based in close proximity to or located at our largest customers' sites. This physical proximity allows sales personnel to engage quickly with the marketing, design, engineering and purchasing staffs of these orthopedic device manufacturers. Our sales people are empowered to bring in design and engineering product development teams to facilitate a customer's efforts. Our goal is to collaborate with customers early in the development cycle and to continue through production, packaging, delivery and logistics.
Manufacturing and Materials
We have manufacturing facilities in the United States, United Kingdom, France, Ireland and Malaysia. We have made investments in recent years to modernize our production facilities, improve our production processes and develop superior technical skills that complement our manufacturing capabilities. These investments have allowed us to continue to improve the quality of our products, increase our manufacturing capacity and improve our efficiency. Our manufacturing processes include:
|
·
|
Forging. Our forging process uses presses to force heated metal between two dies (called tooling) that contain a precut profile of the desired implant. The forging process enhances the strength of an implant, which is important for hip stems and other implants that must withstand significant stress. Many customers prefer forging because it provides greater mechanical properties. We forge gross shaped, near-net shaped and net shaped implants. Our know-how enables us to produce precision net shaped forgings in large volumes.
|
9
|
·
|
Casting. In the casting process, metal is heated until it is liquid and then poured into an implant mold. Casting can be used to produce implants with intricate shapes. We have developed a technologically advanced, highly automated casting facility in Sheffield, United Kingdom.
|
|
·
|
Plastic and Metal Forming. Our know-how and technology facilitates our extensive plastic and metal forming capabilities. We use thermoform processes to draw uniform plastic cases and specialized equipment to form metal. Our laser controlled metal working machines allow us to punch and shape metal in intricate and complex detail.
|
|
·
|
Machining/Finishing. Machining is used extensively to enhance our forged, cast and formed products. We use computer numerically controlled, multi-axis and wire electric discharge equipment to cut, bend, punch, polish and otherwise shape or detail metal or plastic. Our finishing processes include polishing, laser etch marking, graphics and other customer specific processes. During the past several years, we developed machining capabilities to better serve the spine implant market.
|
The majority of products that we produce are customized to the unique specifications of our customers. Our ability to maintain flexible operations is an important factor in maintaining high levels of productivity. We endeavor to use "just-in-time" manufacturing and flexible manufacturing cells in our production processes. Just-in-time manufacturing is a production technique that minimizes work-in-process inventory and manufacturing cycles. Manufacturing cells are clusters of individual manufacturing operations and work stations grouped in a circular configuration, with the operators placed centrally within the configuration. Cell manufacturing provides flexibility by allowing efficient changes to the number of operations each operator
performs, which enhances our ability to maintain product volumes that are consistent with our customers' requirements and reduce our level of inventory.
We use raw materials, including plastic, titanium, cobalt chrome, stainless steel and nickel alloys, and various other components in the manufacture of our products. Although we generally believe these materials are readily available from multiple sources, from time to time we rely on a limited number of suppliers and in some cases on a single source vendor. For example, we obtain patented Radel® R plastic, which is designed to withstand intense heat produced during frequent sterilizations, from a single supplier for use in our instrument handles and plastic cases.
Quality Assurance
We maintain a comprehensive quality assurance and quality control program, which includes the control and documentation of all material specifications, operating procedures, equipment maintenance and quality control methods. Our quality systems are based upon FDA requirements and the ISO standards for medical device manufacturers. We believe that all of our facilities are currently in substantial compliance with regulations applicable to them. For example, in the United States, France, Malaysia and United Kingdom these regulations include the current good manufacturing practice regulations and other quality system regulations imposed by the FDA. Specific United States based facilities are registered with and audited by the FDA. Our line of
standard cases received FDA 510(k) clearance, which can reduce our customers' burden in obtaining FDA approval. The European, Malaysia and specific United States based facilities are ISO registered and audited annually. Our facilities have obtained numerous industry-specific quality and regulatory assurance certifications.
Regulatory Compliance
We maintain an effective regulatory program to assure compliance to all applicable US and international regulatory standards and directives. Our regulatory program concentrates on assurance to minimize risks associated with regulatory requirements and standards that affects fit, form and function of our products to customers. Focus is on providing effective auditing practices and procedures to assure compliance to all applicable internal and external standard operating procedures and 510(k) process requirements.
Competition
Our OEM customers, to varying degrees, are capable of internally developing and producing most of the products we provide. While we believe that our comprehensive offerings and core production competencies allow medical device companies to reduce costs and shorten time to market, one or more of our customers may seek to expand their development and manufacturing operations which may reduce their reliance on independent suppliers such as us. We compete on the basis of development capability, breadth of product offering, manufacturing quality, cost and on time delivery.
We also compete with independent suppliers of implants, instruments and cases to medical device companies. A majority of these suppliers are privately owned and produce some, but not all, of the products required in orthopedic implant systems. We compete with other independent suppliers primarily on the basis of development capability, breadth of product offering, manufacturing quality, costs and on time delivery. We believe that we are the largest independent supplier of implants, instruments and cases to orthopedic device manufacturers. However, other independent suppliers may consolidate and some of our current and future competitors, either alone or in conjunction with their respective parent corporate groups, may have financial
resources and research and development, sales and marketing, and manufacturing capabilities and brand recognition that are greater than ours.
10
Intellectual Property
We believe our patents are valuable; however, our knowledge, experience, proprietary and trade secret information, manufacturing processes, product design and development staff and sales staff have been equally or more important in maintaining our competitive position. We seek to protect our non-patented know-how, trade secrets, processes and other proprietary confidential information principally through confidentiality, non-compete and invention assignment agreements.
We currently own 88 total issued patents and have 55 patents pending related to our cases and instruments. These patents expire at various times beginning in 2011 and ending in 2026. We also have 37 issued trademarks and 5 pending trademarks. Our policy is to protect technology, inventions and improvements that we consider important through the use of patents, trademarks, copyrights and trade secrets in the United States and significant foreign markets. If our products were found to infringe any proprietary right of a third party, we could be required to pay significant damages or license fees to the third party or cease production, marketing and distribution of those products. Litigation may be necessary to enforce our intellectual
property rights, to protect our trade secrets or other proprietary information we own and to determine the validity and scope of our proprietary rights.
We cannot provide complete assurance that our existing or future patents, if any, will afford adequate protection, that any existing patent applications will result in issued patents, that our patents will not be circumvented, invalidated, or held unenforceable, that our proprietary information will not become known to, or be independently developed by, our competitors, or that the validity or enforceability of any patents or other intellectual property owned by or licensed to us will be upheld if challenged by others in litigation. Due to these and other risks, we do not rely solely on our patents and other intellectual property to maintain our competitive position. Although intellectual property is important to our business operations
and in the aggregate constitutes a valuable asset, we do not believe that any single patent, trade secret, trademark or copyright, or group of patents, trade secrets, trademarks or copyrights is critical to the success of our business.
Employees
As of March 2, 2011 we had 2,797 employees. Our employees are not represented by any unions. We believe that we have a good relationship with our employees.
Government Regulation
Our business is subject to governmental regulation. We are subject to federal, state and local environmental laws and regulations governing the emission, discharge, use, storage and disposal of hazardous materials and the remediation of contamination associated with the release of these materials at our facilities and at off-site disposal locations. We are not aware of any material noncompliance with the environmental laws currently applicable to our business and we are not subject to any material claim for liability with respect to contamination at any company facility or any off-site location. We cannot assure you that we will not be subject to such environmental liabilities in the future as a result of historic or current
operations.
As a component manufacturer, our medical products are subject to regulation by the FDA. The FDA and related state and foreign governmental agencies regulate many of our customers' products as medical devices. In many cases, the FDA must approve those products prior to commercialization. We believe that our existing medical manufacturing plants comply with current Good Manufacturing Practices as applicable.
We have "master files" on record with the FDA. Master files may be used to provide confidential detailed information about facilities, processes or articles used in the manufacturing, processing, packaging and storing of one or more medical device components. These submissions may be used by device manufacturers to support the premarket notification process required by Section 510(k) of the federal Food Drug & Cosmetic Act. This notification process is necessary to obtain clearance from the FDA to market a device for human use in the United States.
We are also subject to various other environmental, transportation and labor laws as well as various other directives and regulations both in the U.S. and abroad. We believe that compliance with these laws will not have a material impact on our capital expenditures, earnings or competitive position. Given the scope and nature of these laws; however, there can be no assurance that they will not have a material impact on our results of operations.
11
Executive Officers of the Registrant
Set forth below are the name, age, position and a brief account of the business experience of each of the Corporation's executive officers as of March 2, 2011.
|
Name
|
Age
|
Position
|
||
|
Executive Officers:
|
||||
|
Thomas J. Sullivan
|
47
|
President and Chief Executive Officer
|
||
|
Brian S. Moore
|
64
|
President of Business Development
|
||
|
Fred L. Hite
|
43
|
Senior Vice President and Chief Financial Officer
|
||
|
D. Darin Martin
|
59
|
Senior Vice President, Quality Assurance/Regulatory Affairs and Compliance Officer
|
||
|
David C. Milne
|
43
|
Senior Vice President of Human Resources, General Counsel and Corporate Secretary
|
||
|
Ronda L. Harris
|
40
|
Chief Accounting Officer
|
||
|
Michael W. Curtis
|
56
|
Senior Vice President and Chief Operating Officer, USA
|
||
|
Christopher W. Huntington
|
38
|
Senior Vice President and Chief Operating Officer, Asia
|
Thomas J. Sullivan has served as President and Chief Executive Officer and has been a member of the Board of Directors since January 17, 2011. From 2007 to 2011, Mr. Sullivan served as the President of the Supply Chain & Business Process division of Johnson & Johnson Health Care Systems, Inc. Prior to this position, Mr. Sullivan served in several other senior leadership roles for Johnson & Johnson, including President of DePuy Orthopaedics, Inc. from 2005 to 2007, and President of Johnson & Johnson Medical Products Canada from 2002 to 2005. Mr. Sullivan began his career in operations at Johnson
& Johnson in 1990. Prior to Johnson & Johnson, Mr. Sullivan spent five years at Verizon. Mr. Sullivan holds a Bachelor of Science in Applied Mathematics and Computer Science from the University of Pittsburgh and an MBA in Strategic Management and Information Technology from The Wharton School of the University of Pennsylvania.
Brian S. Moore has served as President of Business Development since January 17, 2011 and has been a member of the Board of Directors since the Company’s acquisition of Mettis in June 2003. From June 2003 to January 2011, Mr. Moore served as our President and Chief Executive Officer. From April 1999 to June 2003, Mr. Moore served as the Chief Executive Officer of Mettis Group Limited, the parent company of Mettis. From April 1994 to March 1999, Mr. Moore held various positions with EIS Group plc, including Chairman of the Aircraft and Precision Engineering Division, and from 1987 to 1999, Mr. Moore served as Chief Executive Officer of AB Precision (Poole)
Limited. Prior thereto, Mr. Moore served in various management positions at Vanderhoff plc, Land Rover Vehicles, Bass Brewing and Prudential Insurance and as the Financial Director for a subsidiary of GEC Ltd. (UK). Mr. Moore has qualified as a Graduate Mechanical Engineer by the Institution of Mechanical Engineers (the qualifying body for mechanical engineers in the United Kingdom) and as an Accountant with the U.K. Chartered Institute of Management Accounts.
Fred L. Hite has served as Senior Vice President and Chief Financial Officer since March 2004. Mr. Hite served in various capacities at General Electric Industrial Systems, including Finance Manager of General Electric Motors and Controls from 2001 to 2004, Manufacturing Finance Manager from 2000 to 2001, and Finance Manager of Engineering Services from 1997 to 2000. From 1995 to 1997, Mr. Hite served as Sourcing Finance Manager and Commercial Finance Analyst at General Electric Industrial Control Systems. From 1990 to 1995, Mr. Hite served in various finance positions at General Electric Appliances. Mr. Hite received a B.S. in Finance at Indiana University.
D. Darin Martin has served as the Corporation's Senior Vice President of Quality Assurance, Regulatory Affairs, and Chief Compliance Officer since June 2003. From 1994 to 2003, Mr. Martin served as the Corporation's Vice President of Quality Assurance and Regulatory Affairs. Mr. Martin joined the Corporation in 1990 as Director of Quality Assurance. From 1984 to 1990, Mr. Martin served as Quality Assurance Supervisor for Owens-Illinois Inc.'s Kimble HealthCare Division. Mr. Martin has been a member in various medical device industry associations, including a 20 year membership with the American Society of Quality, Biomedical Devices-NE Indiana Division. Mr. Martin
received a B.S. in Business Management from Ball State University, a S.P.C. Instructor Certification from Baldwin-Wallace College and a M.B.A. from Kennedy-Western University.
12
David C. Milne joined Symmetry in 2009 as Senior Vice President of Human Resources, General Counsel and Corporate Secretary. From 2000 through 2009 Mr. Milne was employed by The Steak `n Shake Company (NYSE: SNS), where he most recently served as Vice President, General Counsel and Corporate Secretary. After graduating cum laude from the Indiana University School of Law, Mr. Milne practiced with Bose, McKinney & Evans and Scopelitis, Garvin, Light, Hanson & Feary where he concentrated on representing employers in labor and employment law matters. Mr. Milne received his undergraduate degree from Wabash
College and his MA English Literature from Indiana University, Bloomington.
Ronda L. Harris joined Symmetry on July 14, 2008 with extensive experience in financial management, planning and implementation of effective financial reporting and financial control processes. Prior to joining Symmetry, Ms. Harris served as Assistant Controller of General Electric's Consumer and Industrial Business. Ms. Harris began her career at PricewaterhouseCoopers. She received a Bachelor of Science degree from Indiana University and became a Certified Public Accountant in 1997.
Michael W. Curtis has served as the Corporation's Senior Vice President and Chief Operating Officer, USA since January 1, 2008. Mr. Curtis joined Symmetry in November 2002 and served in several leadership roles with incremental responsibility. Prior to joining Symmetry, Mr. Curtis served as Vice President of Operations for Lightchip, Inc. from May 2000 to 2002, and from 1998 to 2000, he served as Vice President/General Manager of Communications Products at Thomas & Betts Corporation. From 1994 to 1997, Mr. Curtis was employed at Amphenol Aerospace — Amphenol Corporation, initially as a
Business Unit Manager and subsequently as Director of Filter Products. From 1976 through 1994, Mr. Curtis served in various capacities at Hamilton Standard Division of United Technologies Corporation, the last of which was Product Line Manager. Mr. Curtis received his B.S., M.B.A. and M.S. in Engineering Management from Western New England College.
Christopher W. Huntington joined Symmetry in August 2006 through Symmetry's acquisition of Everest Metal Orthopedics Inc. Initially serving as Vice President of Business Development, Mr. Huntington has progressed through the organization and now serves as Senior Vice President and Chief Operating Officer, Asia. Prior to joining Symmetry, Mr. Huntington founded Everest Metal Orthopedics Inc., an Implant manufacturer with locations in Cork Ireland and Suffern, New York. Mr. Huntington received his BA from St. Lawrence University and his Law Degree from Depaul University College of Law.
For information regarding our directors, and additional information regarding our executive officers, see our 2011 Proxy Statement which will be filed with the Securities Exchange Commission no later than 120 days after the end of our fiscal year.
Family Relationships
There are no family relationships between any of the executive officers or directors of the Corporation.
Available Information
Our Annual Reports on Form 10-K, Quarterly Reports on Form 10-Q, Current Reports on Form 8-K and amendments to those reports filed or furnished pursuant to Section 13(a) or 15(d) of the Securities Exchange Act of 1934 are available free of charge through our website as soon as reasonably practicable after we electronically file such material with, or furnish it to, the Securities and Exchange Commission (SEC). Our internet address is www.symmetrymedical.com (access the filings by using the "Investor Relations" link on the home page, and "SEC Filings" within the "Investor Relations" box located in the text). You may read and copy any materials we file with the SEC at the SEC's Public
Reference Room at 100 F Street, N.E., Washington, D.C. 20549. You may obtain information on the operation of the Public Reference Room by calling the SEC at 1-800-SEC-0330. The SEC maintains an internet site that contains reports, proxy and information statements, and other information regarding issuers that file electronically with the SEC. The address of that site is http://www.sec.gov.
Information relating to our corporate governance, including our Corporate Governance Guidelines, Code of Business Conduct and Ethics and information concerning our executive officers, directors and Board committees (including committee charters), and transactions in Symmetry Medical Inc. securities by directors and officers, is available on or through our website at www.symmetrymedical.com under "Investor Relations" then "Corporate Governance."
We are not including the information on our website as a part of, or incorporating it by reference into, our Form 10-K.
Item 1A. Risk Factors
Our profitability is subject to risks described under this section on "Risk Factors" described below. Although the following are not necessarily the only ones facing our company, our business, financial condition or results of operations they could be materially adversely affected by many of the following risks.
13
Risks Related to Our Business
|
·
|
We depend heavily on sales to our significant customers, and our business could be adversely affected if any of them reduced or terminated purchases from us.
|
A limited number of large orthopedic device manufacturers, all of whom are our customers, control the predominant share of the orthopedic device market. We depend heavily on revenue from these large companies. Revenue from our ten largest customers represented approximately 71.3% of our revenue in fiscal year 2010 and 73.1% of our revenue in fiscal year 2009. Our largest customer accounted for approximately 31.7% of our revenue in the fiscal year 2010 and 39.1% in fiscal 2009.
We expect that we will continue to depend on a limited number of large customers for a significant portion of our revenue. Our sales may be impacted by significant changes in our customers' market share, cyclicality, unpredictability of their new product launch activity and possible changes in their supply chain management.
Many healthcare companies are consolidating to create new companies with greater market power. As the healthcare industry continues to consolidate, our customers may delay demand as they integrate operations and products. A consolidation of our customers may also impact demand for our products as the consolidated company implements their supply chain management philosophy. Consolidation of our competitors may also increase pressure as they combine product and services offerings. Consolidation of our customers or competitors may increase pricing pressure or reduce our revenue, either of which would impact our operating results.
|
·
|
If we are unable to continue to improve our current products and develop new products, we may experience a decrease in demand for our products or our products could become obsolete, and our business would be adversely affected.
|
We sell our products to customers in markets that are characterized by technological change, product innovation and evolving industry standards. We are continually engaged in product development and improvement programs, both in collaboration with our customers and independently. Our customers may engage in additional in-house development and manufacturing, and if the product advances we make are not sufficient for their needs, they may instead rely on internal capabilities. In addition, our independent competitors may produce products that are more appealing to our customers and thereby impair our ability to compete effectively with them. Our competitors' product development capabilities could also become more
effective than ours, and their new products may get to market before our products, may be more effective or less expensive than our products or render our products obsolete. Increased regulatory pressures and longer approval processes may also impair our ability to develop and assist our customers in developing innovative products, or to do so on a commercially effective timeline. If one or more of these events were to occur, our business, financial condition and results of operation could be adversely affected.
|
·
|
We face competition from our customers' in-house capabilities, established independent suppliers and potential new market entrants, and if we lose customers it could have an adverse effect on our revenue and operating results.
|
Our customers have varying degrees of development and manufacturing capabilities, and one or more of them may seek to expand their in-house capabilities in the future, including adding capacity in existing sites or expanding into low labor cost areas such as Asia. Many of our customers are larger and have greater financial and other resources than we do and can commit significant resources to product development and manufacturing. Many of our independent competitors are smaller companies, many of which have close customer relationships and either a low cost structure or highly specialized design or production capabilities. Our independent competitors may continue to consolidate and some of our current and future
competitors, either alone or in conjunction with their respective parent corporate groups, may have financial resources and research and development, sales and marketing and manufacturing capabilities or brand recognition that are greater than ours. In addition, the innovative nature of our markets may attract new entrants to the field. Our products may not be able to compete successfully with the products of other companies, which could result in the loss of customers and, as a result, decreased revenue and operating results.
|
·
|
If product liability lawsuits are brought against us or our customers our business may be harmed.
|
The manufacture and sale of our healthcare and other products, including our aerospace products, expose us to potential product liability claims and product recalls, including those which may arise from misuse or malfunction of, or design or manufacturing flaws in, our products, or use of our products with components or systems not manufactured by us. Product liability claims or product recalls, regardless of their ultimate outcome, could require us to spend significant time and money in litigation or otherwise require us to pay significant damages, which could adversely affect our earnings and financial condition. The product liability insurance that we carry is limited in scope and amount and may not be adequate to protect us
against product liability claims. We may be unable to maintain this insurance at reasonable costs and on reasonable terms, if at all.
14
|
·
|
Any claims beyond our insurance coverage may result in substantial costs and a reduction in its available capital resources.
|
The Company maintains property insurance policies covering physical damage to its equipment, facilities, buildings and inventory; employer’s liability insurance generally covering death or work injury of employees; product liability insurance covering product liability claims arising from the use, consumption or operation of its products; general liability insurance covering certain incidents to third parties that occur on or in the premises of the Company; business interruption insurance, and directors and officers liability insurance, among others. The Company does not maintain key man life insurance on any of its senior management or key personnel. The Company’s insurance coverage, however, may
not be sufficient to cover all claims.
|
·
|
Our direct sales efforts may be impaired by consolidation of customers or an inability to compete with regard to pricing or products.
|
The Company’s direct sales success relies upon its ability to provide products to customers on competitive price, delivery and quantity terms. Some of our customers utilize a single or small group of suppliers, and some producers utilize a small or limited group of distributors. If consolidation in the hospital industry continues we may lose customers that are absorbed into larger hospital companies that work with a limited number of competitive suppliers, of whom we are not a member. In addition, our competitors may provide products similar to ours on a more price competitive basis, or we may find that we are unable to secure necessary products on a price or quantity basis required by our
customers. Further, we may be unable to secure distribution rights for products required by our customers, causing them to consolidate their purchasing with competitors who are able to provide such products. Finally, some of the producers for whom we provide distribution services might decide to sell directly to customers, bypassing our distribution services. If any of these events should occur, it could impair our direct sales business and cause a decline in revenue and profit.
|
·
|
Our operating results are subject to significant potential fluctuation and historical results should not be relied on as an indication of our future results.
|
Our operating results have fluctuated in the past and may vary significantly from quarter to quarter or year to year in the future due to a combination of factors, many of which are beyond our control. These factors include:
|
o
|
the timing of significant orders and shipments, including the effects of changes in inventory management practices by our customers;
|
|
o
|
the number, timing and significance of new products and product introductions and enhancements by us, our customers and our competitors;
|
|
o
|
changes in pricing policies by us and our competitors;
|
|
o
|
changes in medical treatment or regulatory practices;
|
|
o
|
delays caused by the regulatory approval process for our new products;
|
|
o
|
restrictions and delays caused by regulatory review of our customers' products;
|
|
o
|
our ability to meet customer demand for certain products or types of product;
|
|
o
|
recalls of our customers' products;
|
|
o
|
availability and cost of raw materials; and
|
|
o
|
general economic factors.
|
Our quarterly revenue and operating results may vary significantly in the future and period-to-period comparisons of our results of operations may not necessarily be meaningful and should not be relied upon as indications of our future performance. We cannot assure you that our revenue will increase or be sustained in future periods or that we will be profitable in any future period. Any shortfalls in revenue or earnings from levels expected by securities or industry analysts could have an immediate and significant adverse effect on the trading price of our common stock in any given period.
|
·
|
If we do not retain key individuals and retain and attract skilled manufacturing workers, we may not be able to operate successfully, and we may not be able to meet our strategic objectives.
|
Our success depends in part upon the retention of key managerial, sales and technical personnel, particularly skilled manufacturing workers. We compete for such personnel with other companies and other organizations, many of which are larger and have greater name recognition and financial and other resources than we do. There can be no assurance that we will be successful in retaining our current personnel or in hiring or retaining qualified personnel in the future. The loss of key personnel or the inability to hire or retain qualified personnel in the future could have a material adverse effect on our ability to operate successfully.
We compete with numerous precision manufacturing companies to attract and retain qualified and highly skilled manufacturing employees. Our Northeast Indiana facilities, in particular, face significant and increasing competition, including from certain of our customers and other companies, including orthopedic related start-up companies located in or near Warsaw, Indiana. Some of these competitors are larger and have greater financial and other resources than we do. If we are not able to retain and attract skilled manufacturing employees, we may be unable to support our anticipated growth, which could adversely affect our profitability.
15
|
·
|
A significant shift in technologies or methods used in the treatment of damaged or diseased bone and tissue could make our products obsolete or less attractive.
|
The development of new technologies could reduce or shift demand for our products. For example, pharmaceutical advances could result in non-surgical treatments gaining more widespread acceptance as a viable alternative to orthopedic implants. The emergence of successful new biological tissue-based or synthetic materials to regenerate damaged or diseased bone and to repair damaged tissue could minimize or delay the need for implant surgery and provide other biological alternatives to orthopedic implants. New surgical procedures could diminish demand for our instruments or implants. New sterilization methods could also limit the demand for our sterilization cases. Any of these or other shifts in technologies
or methods used in the treatment of damaged or diseased bone and tissue could adversely affect demand for our products.
|
·
|
We depend on third party suppliers, and in some cases a single third party supplier, for key components and raw materials used in our manufacturing processes and the loss of these sources could harm our business.
|
We use plastic, titanium, cobalt chrome, stainless steel and nickel alloys, and various other raw materials in our products. Although we generally believe these materials are readily available from multiple sources, from time to time we rely on a limited number of suppliers and in some cases on a single source vendor. For example, we obtain patented Radel® R plastic, which is designed to withstand intense heat produced during frequent sterilizations, for use in our instrument handles and plastic cases from a single supplier. Further, some of our raw materials are produced in areas of the world that are subject to political and other disruptions that could impair supply. Any supply interruption in a limited or sole-sourced
component or raw material could materially harm our ability to manufacture our products until a new source of supply, if any, could be found. Further, our efforts to cover such materials could be costly and impair our ability to meet our contractual obligations for certain products on a profitable basis. We may be unable to find a sufficient alternative supply channel in a reasonable time period or on commercially reasonable terms if at all. This could interrupt our business, cause us to become involved in litigation with suppliers or customers, impair our profitability and/or reduce the quality of our products.
|
·
|
Our current or future levels of indebtedness may limit our ability to operate our business, finance acquisitions and pursue new business strategies.
|
As of January 1, 2011, our total indebtedness, including short-term debt, long-term debt and capital lease obligations was $95.3 million and we had $113.0 million of our $200.0 million revolving credit facility remaining available. Additionally, we have the ability, subject to lender approval, to increase the capacity of the revolving credit facility by $100.0 million. Our revolving credit facility, maturing in November 2015, contains covenants limiting our ability to incur additional indebtedness. In the future we may incur additional debt to finance acquisitions, business opportunities, capital expenditures or other capital requirements.
Our indebtedness could:
|
·
|
make us more vulnerable to unfavorable economic conditions;
|
|
·
|
make it more difficult to obtain additional financing in the future for working capital, capital expenditures or other general corporate purposes;
|
|
·
|
make us susceptible to fluctuations in market interest rates that affect the cost of our borrowings to the extent that our variable rate debt is not covered by interest rate derivative agreements; and
|
|
·
|
make it more difficult to pursue strategic acquisitions, alliances and collaborations.
|
Our ability to service our indebtedness will depend on our future performance, which will be affected by prevailing economic conditions and financial, business, regulatory and other factors. Some of these factors are beyond our control. We believe that, based upon current levels of operations, we will be able to meet our debt service obligations when due. Significant assumptions underlie this belief, including, among others, that we will continue to be successful in implementing our business strategy and that there will be no material adverse developments in our business, liquidity or capital requirements. If we cannot generate sufficient cash flow from operations to service our indebtedness and to meet our other obligations and
commitments, we may be required to refinance our debt or to dispose of assets to obtain funds for such purpose. We cannot be certain that refinancing or asset dispositions could be effected on a timely basis or on satisfactory terms, if at all, or would be permitted by the terms of our debt instruments. To the extent we incur additional indebtedness or other obligations in the future, the risks associated with our indebtedness described above, including our possible inability to service our debt, would increase.
16
|
·
|
Our revolving line of credit contains restrictions that limit our ability to pay dividends, incur additional debt, make acquisitions and make other investments.
|
Our revolving line of credit contains covenants that restrict our ability to make distributions to stockholders or other payments unless we satisfy certain financial tests and comply with various financial ratios. If we do not satisfy these tests or comply with these ratios, our creditors could declare a default under our debt instruments, and our indebtedness could be declared immediately due and payable. Our ability to comply with the provisions of our revolving line of credit may be affected by changes in economic or business conditions beyond our control.
Our revolving line of credit also contains covenants that limit our ability to incur indebtedness, invest in our foreign operations, acquire other businesses and make capital expenditures, and impose various other restrictions. These covenants could affect our ability to operate our business and may limit our ability to take advantage of potential business opportunities as they arise. We may be unable to comply with the foregoing financial ratios or covenants and, if we fail to do so, we may be unable to obtain waivers from our lenders.
|
·
|
Our future capital needs are uncertain and we may need to raise additional funds in the future.
|
Our future capital needs are uncertain and we may need to raise additional funds in the future through debt or equity offerings. Our future capital requirements will depend on many factors, including:
|
o
|
revenue generated by sales of our products;
|
|
o
|
expenses incurred in manufacturing and selling our products;
|
|
o
|
costs of developing new products or technologies;
|
|
o
|
costs associated with capital expenditures;
|
|
o
|
costs associated with our expansion;
|
|
o
|
costs associated with regulatory compliance, including maintaining compliance with the quality system regulations imposed by the FDA;
|
|
o
|
the number and timing of acquisitions and other strategic transactions;
|
|
o
|
working capital requirements related to growing new acquisitions or existing business;
|
|
o
|
expansion of our international or domestic facilities; and
|
|
o
|
costs of litigation or other legal issues that arise.
|
As a result of these factors, we may need to raise additional funds, and these funds may not be available on favorable terms, or at all. Furthermore, if we issue equity or convertible debt securities to raise additional funds, our existing stockholders may experience dilution, and the new equity or convertible debt securities may have rights, preferences and privileges senior to those of our existing stockholders. If we cannot raise funds on acceptable terms, we may not be able to develop or enhance our products, execute our business strategy, take advantage of future opportunities, or respond to competitive pressures or unanticipated customer requirements.
|
·
|
We may not realize all of the sales expected from new product development programs.
|
We incur substantial expenses in developing and testing new products and related devices. Our realization of additional revenue from new product development efforts is inherently subject to a number of important risks and uncertainties, including, directly or indirectly, end-user acceptance of the product, reimbursement approval of third-party payers such as Medicaid, Medicare and private insurers and, in some cases, FDA or comparable foreign regulatory approval of the product. In addition, our customers typically have no contractual requirement to purchase from us the products that we develop, and they could seek to have another supplier or in-house facility manufacture products that we have developed (or substitutes for them). We also
incur costs and make capital expenditures for new product development and production based upon certain estimates of production volumes for our existing and anticipated products. If the actual demand for our products is less than planned, our revenue and net income may decline.
|
·
|
Our earnings would be negatively impacted if we write off goodwill or intangible assets created as a result of our various acquisitions.
|
As a result of acquisitions we have accumulated a substantial amount of goodwill, amounting to $154.2 million as of January 1, 2011, or approximately 34.3% of our total assets as of such date. Goodwill and certain intangible assets are not amortized but rather are tested for impairment by us annually or more frequently if an event occurs or circumstances develop that would likely result in impairment. Examples of such events or circumstances include, but are not limited to, a significant adverse change in legal or business climate, an adverse regulatory action, unanticipated competition or financial restatements.
17
|
·
|
If we are unable to obtain or retain technology required to produce our products, our business could be harmed.
|
We hold licenses with third parties that are necessary to utilize certain technologies used in the design and manufacturing of some of our products. We also need to obtain access to the latest technology in production and manufacturing, which we plan to do through licensing new techniques and processes, or acquiring new machinery. It may be that we are unable to retain our current licenses, or that we will not be able to acquire access to new technologies on a cost efficient basis, if at all. The loss of such licenses, or inability to obtain new technology would prevent us from manufacturing, marketing and selling these products, which could harm our business.
|
·
|
If we are unable to protect our intellectual property and property rights, or are subject to intellectual property claims by third parties, our business could be harmed.
|
We rely on a combination of patents, trade secrets, copyrights, know-how, trademarks, license agreements and contractual provisions to establish and protect our proprietary rights to our technologies and products. We cannot guarantee that the steps we have taken or will take to protect our intellectual property rights will be adequate or that they will deter infringement, misappropriation or violation of our intellectual property. Litigation may be necessary to enforce our intellectual property rights and to determine the validity and scope of our proprietary rights. Any litigation could result in substantial expenses and may not adequately protect our intellectual property rights. In addition, the laws of some of the countries in which
our products are or may be sold may not protect our products and intellectual property to the same extent as U.S. laws, or at all. We may be unable to protect our rights in trade secrets and unpatented proprietary technology in these countries. If our trade secrets become known, we may lose our competitive advantages.
We seek to protect our trade secrets, know-how and other unpatented proprietary technology, in part, with confidentiality agreements with our employees, independent distributors and customers. We cannot confirm, however, that:
|
o
|
these agreements will not be breached;
|
|
o
|
we will have adequate remedies for any breach; or
|
|
o
|
trade secrets, know-how and other unpatented proprietary technology will not otherwise become known to or independently developed by our competitors.
|
In addition, third parties may claim that we are infringing, misappropriating or violating their intellectual property rights. We could be found to infringe those intellectual property rights, which could affect our ability to manufacture any affected product. In addition, any protracted litigation to defend or prosecute our intellectual property rights could drain our financial resources, divert the time and effort of our management and cause customers to delay or limit their purchases of the affected product until resolution of the litigation.
Any litigation or claims against us, whether or not successful, could result in substantial costs and could harm our reputation. In addition, intellectual property litigation or claims could force us to do one or more of the following:
|
o
|
cease selling or using any of our products that incorporate the challenged intellectual property, which could adversely affect our revenue;
|
|
o
|
obtain a license from the holder of the intellectual property right alleged to have been infringed, which license may not be available on reasonable terms, if at all; and
|
|
o
|
redesign or, in the case of trademark claims, rename our products to avoid infringing the intellectual property rights of third parties, which may not be possible and could be costly and time-consuming if it is possible to do so.
|
|
·
|
We are subject to risks resulting from significant changes to product or manufacturing process within our industry.
|
Our industry relies on existing technology to create implants and associated instruments. Our business may be impacted if there is a significant, game changing, technological manufacturing process or product innovation which is protected by intellectual property and we are not able to react to this change or we are locked out of the new technology by intellectual property that is owned by our competitors.
|
·
|
We are subject to risks associated with our foreign operations.
|
We have significant international operations and we continue to expand and grow these operations. We have operations in the United Kingdom, France, Ireland and Malaysia. Certain risks are inherent in international operations, and could have an adverse impact on our business, results of operations or profitability, including, but not limited to:
|
o
|
difficulties in enforcing agreements and collecting receivables through certain foreign legal systems;
|
18
|
o
|
foreign customers who may have longer payment cycles than customers in the United States;
|
|
o
|
tax rates in certain foreign countries that may exceed those in the United States and foreign earnings that may be subject to withholding requirements or the imposition of tariffs, exchange controls or other restrictions including transfer pricing restrictions when products produced in one country are sold to an affiliated entity in another country;
|
|
o
|
general economic and political conditions in countries where we operate or where end users of orthopedic devices reside;
|
|
o
|
difficulties associated with managing a large organization spread throughout various countries;
|
|
o
|
changes in governmental approaches to foreign industry;
|
|
o
|
changes in tax, training or other incentives upon which we relied (or rely) in deciding to do business in a particular country;
|
|
o
|
wars, insurrections or other strife;
|
|
o
|
difficulties in enforcing intellectual property rights; and
|
|
o
|
compliance obligations under a variety of foreign laws and regulations.
|
As we continue to expand our business globally, our success will depend, in part, on our ability to anticipate and effectively manage these and other risks. We cannot assure you that these and other factors will not have a material adverse effect on our international operations or our business as a whole.
|
·
|
Efforts to acquire additional companies or product lines may divert our managerial resources away from our business operations, and if we complete additional acquisitions, we may incur or assume additional liabilities or experience integration problems.
|
In the past five years, we have completed six acquisitions. In the future, we may seek to acquire additional businesses or product lines for various reasons, including providing new product manufacturing capabilities, adding new customers, increasing penetration with existing customers or expanding into new geographic markets. Our ability to successfully grow through additional acquisitions depends upon our ability to identify, negotiate, complete and integrate suitable acquisitions and to obtain any necessary financings. These additional efforts could divert the attention of our management and key personnel from our business operations and integration of our recently completed
acquisitions. If we complete additional acquisitions, we may also experience:
|
§
|
difficulties integrating any acquired companies, personnel and products into our existing business;
|
|
§
|
delays in realizing the benefits of the acquired company or products;
|
|
§
|
diversion of our management's time and attention from other business concerns;
|
|
§
|
limited or no direct prior experience in new markets or countries we may enter;
|
|
§
|
higher costs of integration than we anticipated;
|
|
§
|
difficulties in retaining key employees of the acquired business who are necessary to manage these businesses;
|
|
§
|
difficulties in maintaining uniform standards, controls, procedures and policies throughout our acquired companies; or
|
|
§
|
adverse customer reaction to the business combination.
|
Additional acquisitions could also materially impair our operating results by causing us to incur debt and acquisition expenses or requiring us to amortize acquired assets.
|
·
|
Currency exchange rate fluctuations could have an adverse effect on our revenue and financial results.
|
We generate a significant portion of our revenue and incur a significant portion of our expenses in currencies other than U.S. dollars. Currency exchange rates are subject to fluctuation due to, among other things, changes in local, regional or global economic conditions, the imposition of currency exchange restrictions and unexpected changes in regulatory or taxation environments. To the extent that we are unable to match revenue received in foreign currencies with costs incurred in the same currency, exchange rate fluctuations in any such currency could have an adverse effect on our
financial results.
|
·
|
We may be adversely affected as a result of the long lead times required for sales of certain new products.
|
We often compete for business at the beginning of the development of new medical devices or upon customer redesign of existing medical devices. Our customers generally must obtain clearance or approval from the FDA before commercially distributing their products. Unless exempt, a new medical device must be approved for commercial distribution in the United States by the FDA through the 510(k) pre-market Notification Process or, in some cases, through the more burdensome pre-market approval, or PMA, process. In recent years it has taken three to nine months from the date of submission to the FDA to obtain 510(k) clearance and one to three years from the date of submission to the FDA to obtain approval through the PMA process, but in
each case the approval may take significantly longer. This results in long lead times for some of our customers' new products, which may make it difficult in the short term for us to obtain sales of new products to replace any unexpected decline in sales of existing products.
19
|
·
|
We may be adversely impacted by work stoppages, other labor matters, or new labor laws.
|
Currently, none of our facilities are unionized. However, over the last 10 years, our employees at two of our locations have attempted to unionize. In addition, some of our orthopedic device customers have unionized work forces. While we have not experienced any adverse effects from work stoppages or slow-downs at our customers' facilities, work stoppages or slow-downs experienced by us, our suppliers or our customers or their suppliers could result in slow-downs or closures of facilities where our products are made or used. We cannot assure you that we will not encounter strikes, further unionization efforts, new labor laws, or other types of
conflicts with labor unions or our employees, which could have an adverse effect on our financial results.
|
·
|
If a natural or man-made disaster strikes one or more of our manufacturing facilities, we may be unable to manufacture certain products for a substantial amount of time and our revenue could decline.
|
We have sixteen manufacturing facilities located in the United States, United Kingdom, France, Ireland and Malaysia. These facilities and the manufacturing equipment and personnel know-how that we use to produce our products would be difficult to replace and could require substantial lead-time to repair or replace. Our facilities may be affected by natural or man-made disasters. In the event that one or more of our facilities was affected by a disaster, we would be forced to attempt to shift production to our other manufacturing facilities or rely on third-party manufacturers, and our other facilities or a third-party manufacturer may not have the capability to effectively supply the affected products. Although we have insurance for
damage to our property and the interruption of our business, this insurance may not be sufficient in scope or amount to cover all of our potential losses and may not continue to be available to us on acceptable terms, or at all.
|
·
|
The prolonged period of financial difficulties over the past several years and uncertainty in global economic conditions could continue to adversely affect our business, results of operations, and financial condition.
|
Over the last several years, the United States and other countries around the world have experienced deteriorating and uncertain economic conditions, including unprecedented financial market disruption. If this trend in economic conditions does not continue to improve or reverts to further deterioration, it could lead to delayed or decreased demand for our product. It may additionally adversely affect our customers' access to capital, willingness to spend capital on our products, or ability to pay for products they will order or have already ordered from us. It could also impair our access to markets, capital on favorable terms, access to raw materials, and other difficulties. Furthermore, if our suppliers face challenges in selling
their products or otherwise in operating their businesses, they may become unable to continue to offer the key components and raw materials needed in our manufacturing processes. The foregoing may impact our business, accuracy of our forecasts, profitability and have other adverse impacts on our results.
|
·
|
We may experience difficulties, delays or unexpected costs from consolidation of facilities.
|
We may be required to further consolidate our operations in order to improve our cost structure, achieve increased operating efficiencies, and improve our competitive standing or results of operations and/or to address unfavorable economic conditions. We may also lose favorable tax incentives or not be able to renew a lease on acceptable terms, resulting in the need to consolidate. As part of these actions, we may further reduce staff, make changes to certain capital projects, close certain production operations and abandon leases for certain facilities that will not be used in our operations. In conjunction with any actions, we will continue to make significant
investments and build the framework for our future growth. We may not realize, in full or in part, all of the anticipated benefits and savings from these efforts due to unforeseen difficulties, delays or unexpected costs. If we are unable to achieve or maintain all of the resulting savings or benefits to our business or other unforeseen events occur, our business and results of operations may be adversely affected.
As a result of the global economic downturn, we have worked and will continue to work to increase cost efficiencies and to reduce discretionary expenditures, and in the event the economy does not continue to recover, or if it further deteriorates, we may also be required to consider further steps to improve our cost structure. Additionally, the anticipated benefits of our cost reduction initiatives are based on forecasts which could vary substantially from actual results, and we cannot provide assurance that any such cost saving initiatives will not have a material adverse effect on our business.
20
|
·
|
Significant changes to U.S. federal, state and foreign tax laws and regulations that apply to our operations and activities could have a material adverse effect on our financial results.
|
Our operations are subject to the tax laws, regulations and administrative practices of the United States, U.S. state jurisdictions and other countries in which we do business. Significant changes in these rules could have a material adverse effect on the results of operations. For example, our effective tax rate reflects the impact of undistributed foreign earnings for which no U.S. taxes have been provided because such earnings are intended to be invested indefinitely outside the United States. Substantial reform of U.S. tax law regarding tax on certain foreign profits could result in an increase in our effective tax rate, which could have a material adverse effect on our financial
results.
Risks Related to Our Industry
|
·
|
Orthopedic device manufacturers have significant leverage over their independent suppliers and consolidation could increase their leverage, which could result in the loss of customers or force us to reduce our prices.
|
We compete with many distributors and manufacturers to develop and supply implants, surgical instruments and cases to a limited number of large orthopedic device manufacturers. As a result, orthopedic device manufacturers have historically had significant leverage over their independent suppliers. For example, independent suppliers like us are subject to continuing pressure from the major orthopedic device manufacturers to reduce the cost of products while maintaining quality levels. In the past, the medical device industry has experienced substantial consolidation. If the medical device industry, and the orthopedic device industry in particular, continue to consolidate, competition to
provide products to orthopedic device manufacturers may become more intense. Orthopedic device manufacturers may seek to use their market power to negotiate price or other concessions for our products. If we are forced to reduce prices or if we lose customers because of competition, our revenue and results of operations would suffer.
|
·
|
Our business is indirectly subject to healthcare industry cost containment measures and other industry trends affecting pricing that could result in reduced sales of or prices for our products.
|
Acceptance of our customers' products by hospitals, outpatient centers and physicians depend on, among other things, reimbursement approval of third-party payers such as Medicaid, Medicare and private insurers. The continuing efforts of government, insurance companies and other payers of healthcare costs to contain or reduce those costs could lead to lower reimbursement rates or non-reimbursement for medical procedures that use our products. As that occurs, medical device manufacturers might insist that we lower prices on products related to the affected medical device or they might significantly reduce or eliminate their purchases from us of these related products, which could affect
our profitability.
|
·
|
We and our customers are subject to substantial government regulation that is subject to change and could force us to make modifications to how we develop, manufacture and price our products.
|
The medical device industry is regulated extensively by governmental authorities, principally the FDA and corresponding state and foreign regulatory agencies. Some of our manufacturing processes are required to comply with quality systems regulations, including current good manufacturing practice and quality system requirements that cover the methods and documentation of the design, testing, production, control, quality assurance, labeling, packaging and shipping of our products. Further, some of our facilities, records and manufacturing processes are subject to periodic unscheduled inspections by the FDA or other agencies.
Failure to comply with applicable medical device regulatory requirements could result in, among other things, warning letters, fines, injunctions, civil penalties, repairs, replacements, refunds, recalls or seizures of products, total or partial suspensions of production, refusal of the FDA or other regulatory agencies to grant future pre-market clearances or approvals, withdrawals or suspensions of current clearances or approvals and criminal prosecution.
In addition, orthopedic implants and other medical devices produced by our customers are subject to intensive regulation and potential pre-approval requirements by the FDA and similar international agencies that govern a wide variety of product activities from design and development to labeling, manufacturing, promotion, sales and distribution. Recently, the FDA has imposed more significant requirements on supplier control procedures that may require additional audits, process validations and potentially increased costs to get products to market. Compliance with these regulations may be time consuming, burdensome and expensive for our customers and, indirectly, for us to the extent that our customers' compliance depends on our
operations. These regulations could negatively affect our customers' abilities to sell their products, which in turn would adversely affect our ability to sell our products. This may result in higher than anticipated costs or lower than anticipated revenue.
The regulations to which we and our customers are subject are complex, change frequently and have become more stringent over time. Federal and state legislatures have periodically considered programs to reform or amend the U.S. healthcare system at both the federal and state levels. Recently, the FDA has proposed a substantial 510(k) reform amendment that could change significantly the requirements and review process. The FDA may also review all current and past 510(k)’s to assure they are compliant to current regulatory requirements. In addition, these regulations may contain proposals to increase governmental involvement in healthcare, lower reimbursement rates or otherwise change the environment in which
healthcare industry participants operate. Foreign governmental authorities that regulate the manufacture and sale of medical devices have become increasingly stringent and, to the extent we sell our products in foreign countries, we may be subject to rigorous regulation in the future. Regulatory changes could result in restrictions on our ability to carry on or expand our operations, higher than anticipated costs or lower than anticipated revenue.
21
|
·
|
If our customers fail to obtain, or experience significant delays in obtaining, FDA clearances or approvals to commercially distribute our future products our ability to sell our products could suffer.
|
Some of our medical devices are subject to rigorous regulatory pre-approval by the FDA and other federal, state and foreign governmental authorities. Our customers are typically responsible for obtaining the applicable regulatory approval for the commercial distribution of our products. The process of obtaining this approval, particularly from the FDA, can be costly and time consuming, and there can be no assurance that our customers will obtain the required approvals on a timely basis, if at all. The FDA, for example, assigns medical devices to one of three classes which determine, among other things, the type and degree of FDA approval required to commercially distribute the device in
the United States. We produce Class I, II and III devices. Class I devices are deemed to present little risk to patients and are generally exempt from FDA approval requirements. Class II devices can generally be commercially distributed only after the device has received 510(k) clearance. The FDA will clear marketing of a medical device through the 510(k) process if certain design, testing and validation requirements are met and it is demonstrated that the device is "substantially equivalent" to a device that was legally marketed prior to May 28, 1976, or to another commercially available device subsequently cleared through the 510(k) Pre-Market Notification process. This process generally takes three to six months, but recently has taken substantially longer, up to nine months or longer, due to increased review time and scrutiny of requirements to assure a more safe and effective product. Before a Class III device can be commercially distributed in the United States, a pre-market
approval, or PMA, must be obtained from the FDA. The PMA process can be expensive and uncertain, requires detailed and comprehensive scientific and other data and generally takes between one and three years, but may take significantly longer. The commercial distribution of any products we develop that require regulatory clearance may be delayed. In addition, because we cannot assure you that any new products or any product enhancements we develop for commercial distribution in the United States will be exempt from the FDA market clearance requirements or subject to the shorter 510(k) clearance process, the regulatory approval process for our products or product enhancements may take significantly longer than anticipated by us or our customers.
|
·
|
We may be adversely affected by the impact of environmental and safety regulations.
|
We are subject to federal, state, local and foreign laws and regulations governing the protection of the environment and occupational health and safety, including laws regulating air emissions, wastewater discharges, and the management and disposal of hazardous materials and wastes, and the health and safety of our employees. We are also required to obtain permits from governmental authorities for certain operations. If we violate or fail to comply with these laws, regulations or permits, we could incur fines, penalties or other sanctions, which could have a material adverse effect on us.
Environmental laws tend to become more stringent over time, and we could incur material expenses in the future relating to compliance with future environmental laws. In addition, we could be held responsible for costs and damages arising from any contamination at our past or present facilities or at third-party waste disposal sites. Such costs could be material. We cannot completely eliminate the risk of contamination or injury resulting from hazardous materials and we may incur material liabilities as a result of any contamination or injury.
|
·
|
The impact of the recently enacted federal healthcare reform legislation on our business remains uncertain.
|
In March 2010, the U.S. Congress adopted and President Obama signed into law comprehensive health care reform legislation through the passage of the Patient Protection and Affordable Health Care Act (H.R. 3590) and the Health Care and Education Reconciliation Act (H.R. 4872). Among other initiatives, these bills impose a 2.3% excise tax on domestic sales of medical devices following December 31, 2012, which is estimated to contribute approximately $27 billion to healthcare reform. Various healthcare reform proposals have also emerged at the state level. The excise tax may impact results of operations following December 31, 2012, however we cannot predict
with certainty what healthcare initiatives, if any, will be implemented at the state level, or what the ultimate effect of federal health care reform or any future legislation or regulation will have on us. Many of the details of the new law will be included in new and revised regulations, which have not yet been promulgated, and require additional guidance and specificity to be provided by the Department of Health and Human Services, Department of Labor and Department of the Treasury. Accordingly, while it is too early to understand and predict the ultimate impact of the new legislation on our business, the legislation could have a material adverse effect on our business, cash flows, financial condition and results of operations.
22
|
·
|
Changing laws and increasingly complex corporate governance and public disclosure requirements could have an adverse effect on our business and operating results.
|
Changing laws, regulations and standards, including those relating to corporate governance and public disclosure such as the Dodd-Frank Wall Street Reform and Consumer Protection Act and newly enacted SEC regulations, have created additional compliance requirements for companies such as ours. Our efforts to comply with these requirements have resulted in, and are like to continue to result in, an increase in expenses and a diversion of management’s time from other business activities.
Risks Relating to Our Common Stock
|
·
|
Our common stock may be volatile and could decline substantially.
|
There has been significant volatility in the market price and trading volume of securities of companies operating in the medical device industry, including our company, which has often been unrelated to the operating performance of particular companies. These broad market fluctuations may adversely affect the trading price of our common stock. Price declines in our common stock could result from general market and economic conditions and a variety of other factors, including:
|
o
|
actual or anticipated fluctuations in our operating results;
|
|
o
|
our announcements or our competitors' announcements regarding new products, significant contracts, acquisitions or strategic investments
|
|
o
|
loss of any of our key management or technical personnel;
|
|
o
|
conditions affecting orthopedic device manufacturers or the medical device industry generally;
|
|
o
|
product liability lawsuits against us or our customers;
|
|
o
|
clinical trial results with respect or our customers' medical devices;
|
|
o
|
changes in our growth rates or our competitors' growth rates;
|
|
o
|
developments regarding our patents or proprietary rights, or those of our competitors;
|
|
o
|
FDA and international actions with respect to the government regulation of medical devices and third-party reimbursement practices;
|
|
o
|
public concern as to the safety of our products;
|
|
o
|
changes in health care policy in the United States and internationally;
|
|
o
|
conditions in the financial markets in general or changes in general economic conditions;
|
|
o
|
our inability to raise additional capital;
|
|
o
|
changes in stock market analyst recommendations regarding our common stock, other comparable companies or the medical device industry generally, or lack of analyst coverage of our common stock;
|
|
o
|
sales of our common stock by our executive officers, directors and five percent stockholders or sales of substantial amounts of common stock;
|
|
o
|
changes in accounting principles; and
|
|
o
|
announcement of financial restatements.
|
In the past, following periods of volatility in the market price of a particular company's securities or financial restatements, litigation has often been brought against that company. If litigation of this type is brought against us, it could be extremely expensive and divert management's attention and the Corporation's resources.
|
·
|
Our Certificate of Incorporation, our Bylaws and Delaware law contain provisions that could discourage another company from acquiring us and may prevent attempts by our stockholders to replace or remove our current management.
|
Provisions of the Delaware General Corporation Law, our Certificate of Incorporation and our Bylaws may discourage, delay or prevent a merger or acquisition that stockholders may consider favorable, including transactions in which you might otherwise receive a premium for your shares. In addition, these provisions may frustrate or prevent any attempts by our stockholders to replace or remove our current management by making it more difficult for stockholders to replace or remove our board of directors. These provisions include:
|
o
|
providing for a classified board of directors with staggered terms;
|
|
o
|
requiring supermajority stockholder voting to effect certain amendments to our certificate of incorporation and by-laws;
|
|
o
|
eliminating the ability of stockholders to call special meetings of stockholders;
|
|
o
|
prohibiting stockholder action by written consent;
|
|
o
|
establishing advance notice requirements for nominations for election to the board of directors or for proposing matters that can be acted on by stockholders at stockholder meetings;
|
|
o
|
limiting the ability of stockholders to amend, alter or repeal the by-laws; and
|
|
o
|
authorizing of the board of directors to issue, without stockholder approval, shares of preferred stock with such terms as the board of directors may determine and shares of our common stock.
|
23
We are also protected by Section 203 of the Delaware General Corporation Law, which prevents us from engaging in a business combination with a person who becomes a 15.0% or greater stockholder for a period of three years from the date such person acquired such status unless certain board or stockholder approvals were obtained.
|
·
|
As a result of our 2007 discovery of accounting irregularities at our Sheffield, UK operating unit and the related restatement, the SEC is conducting an informal investigation, which may not be resolved favorably.
|
Following the discovery of the accounting irregularities at our Sheffield, UK operating unit, the Audit Committee self-reported the matter to the staff of the SEC in October 2007. Thereafter, the SEC commenced an informal inquiry regarding this matter.
We have fully cooperated with the SEC in its investigation. At this time we are unable to predict the time period necessary to resolve the investigation or the ultimate resolution thereof. To date, considerable legal, tax and accounting expenses have been incurred in connection with our Audit Committee's investigation into this matter and expenditures may continue to be incurred in the future with regard to the SEC's investigation. It is also possible that the investigation may continue to require management's time and attention and accounting and legal resources, which could otherwise be devoted to the operation of our business. Moreover, any action by the SEC against us, or members of our management, may cause us to be subject to
injunctions, fines and other penalties or sanctions or result in private civil actions, loss of key personnel or other adverse consequences and may require us to devote additional time and resources to these matters. The investigation may adversely affect our ability to obtain, and/or increase the cost of obtaining, directors' and officers' liability insurance and/or other types of insurance, which could have a material adverse affect on our business, results of operations and financial condition. In addition, the SEC investigation and the remedies applied may affect certain of our business relationships and consequently may have an adverse effect on our business in the future.
Item 1B. Unresolved Staff Comments
None.
Item 2. Properties
The properties below are owned or leased by us and we believe these properties are suitable and adequate for our current operations and are appropriately utilized.
|
Location
|
Principal Use
|
Approximate
Square
Footage
|
Own/
Lease
|
|||
|
Avilla, Indiana
|
Instrument and implant design and manufacturing
|
41,000
|
Lease
|
|||
|
Cheltenham, United Kingdom
|
Instrument design and manufacturing
|
25,000
|
Lease
|
|||
|
Claypool, Indiana
|
Instrument design and manufacturing
|
33,800
|
Own
|
|||
|
Cork, Ireland
|
Implant finishing
|
12,500
|
Lease
|
|||
|
Hillburn, New York
|
Implant finishing
|
16,000
|
Lease
|
|||
|
Lansing, Michigan
|
Implant design, forging and machining
|
65,000
|
Own
|
|||
|
Lansing, Michigan
|
Implant finishing and Design and Development Center
|
15,000
|
Own
|
|||
|
Manchester, New Hampshire
|
Plastic and metal case design and manufacturing
|
122,000
|
Lease
|
|||
|
Londonderry, New Hampshire
|
Case warehouse
|
27,000
|
Lease
|
|||
|
Nashville, Tennessee
|
Medical products distribution
|
16,500
|
Own
|
|||
|
New Bedford, Massachusetts
|
Instrument and implant manufacturing
|
85,000
|
Own
|
|||
|
Penang, Malaysia
|
Case, instrument and implant design and manufacturing
|
53,000
|
Lease
|
|||
|
Sheffield, United Kingdom
|
Implant and specialized non-healthcare product design, forging, casting and machining
|
120,500
|
Own
|
|||
|
Sheffield, United Kingdom
|
Implant machining
|
43,400
|
Own
|
|||
|
Wambrechies, France
|
Case design and manufacturing
|
25,000
|
Lease
|
|||
|
Warsaw, Indiana
|
Instrument design and manufacturing
|
58,000
|
Own
|
|||
|
Warsaw, Indiana
|
Design and Development Center; Corporate Headquarters
|
15,800
|
Own
|
|||
|
Warwickshire, United Kingdom
|
Specialized non-healthcare machining
|
20,300
|
Own
|
|||
|
Total square footage
|
794,800
|
24
We own approximately 16 acres of land in Warsaw, Indiana, and approximately 9 acres in Lansing, Michigan. These sites are available for future expansion.
All of our owned properties are encumbered by our revolving line of credit. See Note 9 of our consolidated financial statements. Our capital lease arrangements are discussed in Note 10 of our Financial Statements.
Item 3. Legal Proceedings
SEC Inquiry
Following the discovery of the accounting irregularities at our Sheffield, UK operating unit, the Audit Committee self-reported the matter to the staff of the SEC in October 2007. Thereafter, the SEC commenced an informal inquiry regarding this matter.
We have fully cooperated with the SEC in its investigation. At this time we are unable to predict the time period necessary to resolve the investigation or the ultimate resolution thereof. To date, considerable legal, tax and accounting expenses have been incurred in connection with our Audit Committee's investigation into this matter and expenditures may continue to be incurred in the future with regard to the SEC's investigation. It is also possible that the investigation may continue to require management's time and attention and accounting and legal resources, which could otherwise be devoted to the operation of our business. Moreover, any action by the SEC against us, or
members of our management, may cause us to be subject to injunctions, fines and other penalties or sanctions or result in private civil actions, loss of key personnel or other adverse consequences and may require us to devote additional time and resources to these matters. The investigation may adversely affect our ability to obtain, and/or increase the cost of obtaining, directors' and officers' liability insurance and/or other types of insurance, which could have a material adverse affect on our business, results of operations and financial condition. In addition, the SEC investigation and the remedies applied may affect certain of our business relationships and consequently may have an adverse effect on our business in the future.
Item 4. (Removed and Reserved)
PART II
Item 5. Market for the Registrant's Common Equity, Related Stockholder Matters and Issuer Purchases of Equity Securities
Our common stock trades on the New York Stock Exchange ("NYSE") under the trading symbol SMA. As of March 4, 2011, there were approximately 301 registered holders of record of our common stock. The transfer agent and registrar for our common stock is Computershare Trust Company, N.A., P.O. Box 43078, Providence, RI 02940-3078, telephone (877) 282-1168.
In the two most recent fiscal years, we have not paid dividends on our common stock and do not expect to pay dividends for the foreseeable future. Instead, we anticipate that our earnings in the foreseeable future will be used in the operation and growth of our business. The payment of dividends by us to holders of our common stock is restricted by our revolving line of credit. Any future determination to pay dividends will be at the discretion of our board of directors and will depend upon, among other factors, our results of operations, financial condition, capital requirements and contractual restrictions.
We currently do not have a share repurchase plan or program.
The information required by Item 5 with respect to securities authorized for issuance under Equity Compensation Plans is set forth in Part III, Item 12 of this Form 10-K.
Our common stock has been listed on the New York Stock Exchange since our initial public offering on December 9, 2004. The following table sets forth, for the period indicated, the highest and lowest closing sale price for our common stock by quarter for 2010 and 2009, as reported by the New York Stock Exchange:
|
2010
|
2009
|
|||||||||||||||
|
High
|
Low
|
High
|
Low
|
|||||||||||||
|
Fourth Quarter
|
$ | 9.81 | $ | 8.06 | $ | 10.45 | $ | 7.40 | ||||||||
|
Third Quarter
|
$ | 11.03 | $ | 8.78 | $ | 11.47 | $ | 8.06 | ||||||||
|
Second Quarter
|
$ | 12.05 | $ | 9.89 | $ | 9.60 | $ | 6.10 | ||||||||
|
First Quarter
|
$ | 10.33 | $ | 8.00 | $ | 8.12 | $ | 4.00 | ||||||||
The closing sale price for our common stock on March 4, 2011 was $9.15.
25
Total Return Graph (Unaudited)
The following graph compares the cumulative total return on the Corporation's common stock during the last five fiscal years with the S&P 500 Stock Index, the S&P Health Care Index and the RDG SmallCap Medical Devices Index during the same period. The graph shows the value, at the end of each of the last five fiscal years, of $100 invested Symmetry Medical Inc. stock or the indices on December 31, 2005 and assumes the reinvestment of all dividends. No dividends have been declared or paid on the Corporation's common stock. The graph depicts the change in the value of common stock relative to the indices at the end of each fiscal year and not for any interim period. Returns over the indicated period should not be considered
indicative of future stock price performance.
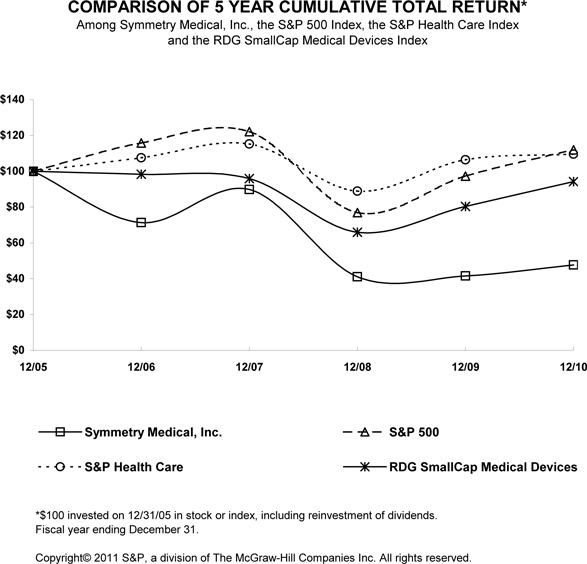
Item 6. Selected Financial Data
The following selected consolidated financial data should be read in connection with our consolidated financial statements, the notes related thereto, and Management's Discussion and Analysis of Financial Condition and Results of Operations and has been derived from our consolidated financial statements.
26
|
Fiscal Year Ended
|
||||||||||||||||||||
|
2010
|
2009
|
2008(3)
|
2007(2)
|
2006(1)
|
||||||||||||||||
|
(in thousands)
|
||||||||||||||||||||
|
Consolidated Statements of Operations Data:
|
||||||||||||||||||||
|
Revenue
|
$ | 360,830 | $ | 365,943 | $ | 423,406 | $ | 290,922 | $ | 245,017 | ||||||||||
|
Cost of Revenue
|
281,132 | 278,926 | 323,048 | 238,343 | 188,579 | |||||||||||||||
|
Gross Profit
|
79,698 | 87,017 | 100,358 | 52,579 | 56,438 | |||||||||||||||
|
Selling, general and administrative expenses
|
50,529 | 47,863 | 58,340 | 39,484 | 28,278 | |||||||||||||||
|
Facility closure and severance costs (4)
|
961 | 2,822 | - | - | - | |||||||||||||||
|
Operating Income
|
28,208 | 36,332 | 42,018 | 13,095 | 28,160 | |||||||||||||||
|
Interest expense, net
|
5,698 | 6,647 | 10,092 | 6,917 | 4,448 | |||||||||||||||
|
Loss on debt extinguishment (5)
|
828 | - | - | - | - | |||||||||||||||
|
Derivative valuation(gain)/loss (6)
|
(1,328 | ) | (1,173 | ) | (2,460 | ) | 1,740 | 2,317 | ||||||||||||
|
Other (income)/expense
|
1,111 | 428 | 2,874 | (503 | ) | (3,699 | ) | |||||||||||||
|
Income before income taxes
|
21,899 | 30,430 | 31,512 | 4,941 | 25,094 | |||||||||||||||
|
Income tax expense
|
7,928 | 8,646 | 7,493 | 5,090 | 6,580 | |||||||||||||||
|
Net income (loss)
|
$ | 13,971 | $ | 21,784 | $ | 24,019 | $ | (149 | ) | $ | 18,514 | |||||||||
|
Basic per share:
|
||||||||||||||||||||
|
Net income (loss)
|
$ | 0.39 | $ | 0.61 | $ | 0.67 | $ | - | $ | 0.53 | ||||||||||
|
Diluted per share:
|
||||||||||||||||||||
|
Net income (loss)
|
$ | 0.39 | $ | 0.61 | $ | 0.67 | $ | - | $ | 0.53 | ||||||||||
|
Weighted average common shares and equivalent shares outstanding:
|
||||||||||||||||||||
|
Basic
|
35,451 | 35,308 | 35,170 | 35,089 | 34,826 | |||||||||||||||
|
Diluted
|
35,810 | 35,530 | 35,357 | 35,268 | 35,156 | |||||||||||||||
|
Consolidated Balance Sheet Data:
|
||||||||||||||||||||
|
Cash and cash equivalents
|
$ | 15,067 | $ | 14,219 | $ | 10,191 | $ | 12,089 | $ | 11,721 | ||||||||||
|
Working capital
|
106,124 | 70,455 | 69,939 | 36,134 | 44,873 | |||||||||||||||
|
Total Assets
|
449,954 | 438,267 | 453,237 | 400,430 | 354,396 | |||||||||||||||
|
Long-term debt and capital lease obligations, less current portion
|
89,767 | 72,087 | 110,956 | 72,532 | 68,792 | |||||||||||||||
|
Total shareholders' equity
|
296,369 | 282,470 | 252,414 | 237,536 | 232,607 | |||||||||||||||
|
Other Financial Data:
|
||||||||||||||||||||
|
Depreciation and amortization
|
$ | 21,129 | $ | 22,252 | $ | 21,463 | $ | 19,998 | $ | 17,022 | ||||||||||
|
(1)
|
Fiscal 2006 includes the results of Riley Medical since its acquisition on May 2, 2006 and Everest Metal since its acquisition on August 31, 2006.
|
|
(2)
|
Fiscal 2007 includes the results of Clamonta, Ltd. since its acquisition on January 9, 2007, TNCO since its acquisition on April 3, 2007 and SSI and UCA since their acquisition on August 31, 2007.
|
|
(3)
|
Fiscal 2008 includes the results of New Bedford since its acquisition on January 25, 2008.
|
|
(4)
|
In fiscal 2009 and 2010, we recorded facility closure and severance costs as a separate component of operating income related to our ongoing cost saving and consolidation efforts. Additional information is set forth in Note 17, Notes to the Consolidated Financial Statements contained in Item 8 of this report.
|
|
(5)
|
During fiscal 2010, we refinanced substantially all of our debt arrangements that were to mature in June 2011, resulting in a loss on debt extinguishment of $828.
|
27
|
(6)
|
Historically, we have had a significant amount of variable rate long-term indebtedness. We have managed our exposure to changes in interest rates by entering into interest rate swap agreements. We have also entered into foreign currency exchange forward contracts to mitigate fluctuations in foreign currency on the statement of operations. Each agreement is evaluated on its ability to qualify for hedge accounting treatment. Changes in fair market value of agreements that do not qualify as a hedge are recorded each period in earnings.
|
Item 7. Management's Discussion and Analysis of Financial Condition and Results of Operations
Overview
As a leading independent provider to orthopedic device manufacturers, we offer a broad range of products, including implants, instruments and cases as well as design and development services. We also provide these types of products and services to companies in other segments of the medical device market, including arthroscopy, dental, laparoscopy, osteobiologic, and endoscopy sectors, and we provide limited specialized products to non-healthcare markets, such as the aerospace industry.
We manufacture many of the products we sell and have manufacturing locations worldwide to service our global customer base. We believe that our comprehensive product and services offering, our quality and regulatory expertise, our global resources and our size and capability provide us a competitive advantage. We leverage these competitive advantages to accelerate our customers' time to market as they develop and launch new products. This relationship typically leads to an ongoing supply of products to our customers during the life of the product.
Our core business strategy is built around our business model which leverages our global resources to expand our leadership position within the orthopedic sector as well as to diversify within related medical markets. In the non-orthopedic sector, we are expanding that core strategy by adding new distribution channels to reach even more end-users of medical instruments, containers and related products. Using this strategy, we strive to provide the best possible customer experience by offering superior value; the highest-quality, new technology; customized services; superior support; and the combination of our products and services into our Total Solutions® offering. Historically, our growth has been driven organically from our core
businesses as well as acquisitions designed to augment select areas of our business with more products, services, and technology.
The global medical device market is estimated to be over $300 billion with annual growth of 4-6%. In 2009, revenues generated by sales of orthopedic products worldwide reached $38 billion, an increase of 6% over 2008 global revenues. Of the $38 billion, 76% or $29 billion came from the ten largest orthopedic companies in the world. The U.S. orthopedic device market was $23 billion in 2009 representing 61% of the global medical device market. Growth for the U.S. orthopedic device market alone is projected to be $28 billion by 2013. Orthopedic devices consist of reconstructive implants used to repair knees, hips, shoulders and other joints, as well as other orthopedic devices to repair bone fractures and the spine. In 2009, global sales of
joint replacement products (hips, knees, shoulders, elbows, wrists, digits) exceeded $13 billion, an increase of 6% over sales generated in 2008. Knees comprised the largest sub-segment of the joint replacement market at $6.8 billion followed by hips at $5.7 billion. Geographically, sales in the U.S. accounted for 53% of global joint replacement revenue. Worldwide, spine procedure volumes exceeded 2.8 million in 2009, including fusion, discectomy, disc replacement, vertebroplasty/kyphoplasty and fracture repair. In 2009, sales of spine products (excluding biologics) exceeded $7 billion worldwide, an increase of 11% over 2008 revenues. The six largest companies in the global spine market controlled 79% sales in this segment. We expect continued growth in the orthopedic device market to be driven by a number of trends including:
|
·
|
growing elderly population;
|
|
·
|
aging, affluent and active "baby boomers";
|
|
·
|
improving technologies that expand the market, including minimally invasive surgery;
|
|
·
|
successful clinical outcomes increasing patient confidence;
|
|
·
|
increasing patient awareness through orthopedic device companies' direct marketing programs;
|
|
·
|
increasing volume of procedures to replace older implants (or revision procedures); and
|
|
·
|
developing international markets.
|
We offer our customers Total Solutions® for complete implant systems-implants, instruments and cases. Our revenue is derived from the sale of implants, instruments, and cases separately, instruments and cases together, and from the sale of complete implant systems which include the implant, instruments and cases. We expect our Total Solutions® offering will provide us with growth opportunities and increase the relative percentage of value added products that we supply to our customers.
We believe that we have well-established relationships with our major customers and these relationships, to a significant extent, involve the sale of products that we have developed or modified specifically for our customers' particular product lines. In connection with the launch of a new implant system, our customers typically provide a customized implant-specific instrument set in cases to end-users (hospitals, outpatient centers and physicians) for use with the new implant system. As a result, our sales of instruments and cases in any particular period are significantly impacted by the amount of new product launch activity by our customers. Our revenues are affected by changes in the number and size of orders and the timing of delivery
dates. Our revenues have fluctuated in the past and may vary in the future due to the effects of changes in inventory management practices and new product introductions by our customers.
28
We believe that trends among our customers to consolidate their supply chains will create opportunities for the Company in 2011 and thereafter. The larger OEMs are increasingly focused on improving their supply chains by outsourcing more of their products among a consolidated group of strategic suppliers who are expected to provide a wider range of services. These actions are intended to result in an increased level of attention among their suppliers to quality and regulatory compliance, resulting in reduced overall costs for the OEM. We believe that our investment in quality and regulatory compliance have positioned the Company to benefit from increased OEM outsourcing and consolidation of suppliers.
To leverage our position in the consolidation of suppliers, we are focused on engaging in more active and positive discussions with our customers to satisfy a greater portion of their product and service needs. While these strategic changes do not happen overnight, we continue to believe that we are in a favorable position to continue as a supplier of choice for our major customers and increase the work we do for them. We believe our global capacity and competitive strengths will continue to benefit us as the order volume and large project launches continue, particularly within the dynamic and aging US population.
We continue to focus on improved performance and are confident that further improvements can be achieved. We are reviewing all aspects of our operations to achieve these further improvements and believe the following actions will help position us for sustainable long-term profitable growth.
|
·
|
Continuous Improvement — We are focused on improving competitiveness by becoming more efficient while strengthening our operating processes and internal controls. Our experienced leadership team is working together to increase efficiency across all functions. We are focused on improving our manufacturing processes through the use of lean principles and techniques.
|
|
·
|
Diversification — Within the orthopedic sector we will continue to expand our product portfolio and build upon the strength of our presence in the large reconstructive joint market. Orthopedic sector diversification will include: spine, trauma, extremities and small joints. We have invested in new technology focused on the spinal market, including a high precision cell. Diversification outside of the orthopedic market could include areas such dental implants, maxillofacial, laboratory testing and veterinary.
|
|
·
|
New Marketing Channels — We will expand our marketing opportunities through direct selling channels and include a wider range of procured product offerings.
|
|
·
|
Partnership — We will continue to develop and grow our customer relationships to include more strategic and longer term partnerships.
|
|
·
|
Intellectual Property — We plan to continue to expand and develop our intellectual property portfolio with focus on both process and product patents.
|
|
·
|
Organizational Development — We continue to build an organization structure that is capable of delivering a 5 year growth plan and support business development.
|
From 2006 to 2008, we completed six acquisitions for an aggregate purchase price of $133.9 million which enhanced our product offerings and our business model. Growth through acquisition is a significant part of our business strategy.
In January 2008, we acquired DePuy's New Bedford, Massachusetts instrument manufacturing facility ("New Bedford"). We purchased substantially all of the assets and real estate of New Bedford for approximately $45.2 million in cash. New Bedford produces orthopedic instruments, general medical instruments and some small spine related implants. Historically, 100% of the products produced at the facility are for DePuy. Commencing in 2008, we began to utilize this facility to serve our other medical customers, as we have a strategy to diversify and expand both product and customer portfolio at this facility. In connection with the acquisition, we entered into a supply agreement which requires DePuy to make minimum purchases from New Bedford for
a four year period. The agreement stipulates that these purchases are incremental to other products we presently or previously produced on DePuy's behalf. The commitment from DePuy totaled $106.0 million over a four year period, with specific amounts in each year. We believe this acquisition has strengthened our position as a leading provider to the orthopedic industry and provided additional manufacturing capacity to better serve our broad customer base, strengthened on our relationship with DePuy, expanded our east coast presence and allowed us to move forward with an existing skilled workforce to service our growing market.
29
Our acquisitions have afforded us the opportunity to offer a comprehensive line of implants, surgical instruments and cases for orthopedic device manufacturers on a global basis, instruments and cases into other medical markets and specialized parts into the aerospace industry.
During fiscal 2010, we sold our products to approximately 1,850 customers. Our largest customer accounted for approximately 31.7% of our revenue in fiscal 2010 and 39.1% in fiscal 2009. Our ten largest customers collectively accounted for approximately 71.3% and 73.1% of our revenue in fiscal 2010 and fiscal 2009, respectively. Within each of our largest customers, we typically serve several product teams and facilities, which reduce our reliance on any single purchasing decision. Approximately 74.2%, 8.8%, 7.7% and 9.3% of our revenue in fiscal 2010 and approximately 73.3%, 10.2%, 8.0% and 8.5% of our revenue in fiscal 2009 was from sales
to the United States, Ireland, United Kingdom, and other foreign countries, respectively.
Our revenue from the sale of instruments, implants, cases and other products represented 40.3%, 30.8%, 22.7% and 6.2%, respectively, of our revenue in fiscal 2010, compared with 45.6%, 29.5%, 18.7% and 6.2%, respectively, of our revenue in fiscal 2009.
Results of Operations
The following table summarizes our consolidated results of operations for each of the past three years. Our historical results are not necessarily indicative of the operating results that may be expected in the future.
|
Fiscal Year
|
||||||||||||||||||||||||
|
2010
|
2009
|
2008
|
||||||||||||||||||||||
|
(in millions)
|
||||||||||||||||||||||||
|
% of
|
% of
|
% of
|
||||||||||||||||||||||
|
Dollars
|
Revenue
|
Dollars
|
Revenue
|
Dollars
|
Revenue
|
|||||||||||||||||||
|
Statement of Operations Data:
|
||||||||||||||||||||||||
|
Revenue
|
$ | 360.8 | 100.0 | % | 365.9 | 100.0 | % | 423.4 | 100.0 | % | ||||||||||||||
|
Cost of Revenue
|
281.1 | 77.9 | % | 278.9 | 76.2 | % | 323.1 | 76.3 | % | |||||||||||||||
|
Gross Profit
|
79.7 | 22.1 | % | 87.0 | 23.8 | % | 100.3 | 23.7 | % | |||||||||||||||
|
Selling, general, and administrative expenses
|
50.5 | 14.0 | % | 47.9 | 13.1 | % | 58.3 | 13.8 | % | |||||||||||||||
|
Facility closure and severance costs
|
1.0 | 0.3 | % | 2.8 | 0.8 | % | - | 0.0 | % | |||||||||||||||
|
Operating Income
|
28.2 | 7.8 | % | 36.3 | 9.9 | % | 42.0 | 9.9 | % | |||||||||||||||
|
Other (income)/expense:
|
||||||||||||||||||||||||
|
Interest expense
|
5.7 | 1.6 | % | 6.6 | 1.8 | % | 10.1 | 2.4 | % | |||||||||||||||
|
Loss on debt extinguishment
|
0.8 | 0.2 | % | |||||||||||||||||||||
|
Derivatives valuation gain
|
(1.3 | ) | (0.4 | )% | (1.2 | ) | (0.3 | )% | (2.5 | ) | (0.6 | )% | ||||||||||||
|
Other
|
1.1 | 0.3 | % | 0.4 | 0.1 | % | 2.9 | 0.7 | % | |||||||||||||||
|
Income before income taxes
|
21.9 | 6.1 | % | 30.4 | 8.3 | % | 31.5 | 7.4 | % | |||||||||||||||
|
Income tax expense
|
7.9 | 2.2 | % | 8.6 | 2.4 | % | 7.5 | 1.8 | % | |||||||||||||||
|
Net income
|
$ | 14.0 | 3.9 | % | $ | 21.8 | 6.0 | % | $ | 24.0 | 5.6 | % | ||||||||||||
30
Fiscal Year 2010 Compared to Fiscal Year 2009
Revenue. Revenue for fiscal 2010 decreased $5.1 million or 1.4% to $360.8 million from $365.9 million in fiscal 2009. Revenue for each of our principal product categories in these periods was as follows:
|
Product Category
|
||||||||
|
2010
|
2009
|
|||||||
|
(in millions)
|
||||||||
|
Instruments
|
$ | 145.4 | $ | 166.7 | ||||
|
Implants
|
111.3 | 108.0 | ||||||
|
Cases
|
81.7 | 68.5 | ||||||
|
Other
|
22.4 | 22.7 | ||||||
|
Total
|
$ | 360.8 | $ | 365.9 | ||||
The $5.1 million decrease in revenue resulted from unfavorable foreign currency exchange rate fluctuations of $2.4 million as well as a $2.7 million reduction in overall customer demand. Our customer demand reached a recent low level in the fourth quarter of 2009, then increased throughout 2010. Instrument revenue decreased $21.3 million in fiscal 2010, driven primarily by lower demand from our five largest OEM customers of $27.8 million due to the timing of their various product launches. After a strong first half of 2009, instrument demand decreased during the second half of 2009. Demand improved in 2010 as compared to the second half of 2009, but not sufficiently to offset the decrease
experienced during the first half of 2010 as compared to the strong first half of 2009. We did experience growth of $6.5 million from other customers during fiscal 2010 as compared to fiscal 2009 driven by our efforts to diversify our customer base in both orthopedic and non-orthopedic markets. Implant revenue increased $3.3 million in fiscal 2010 which was driven by increased customer demand of $4.8 million, primarily from our five largest OEM customers, to support procedure growth, offset by unfavorable foreign currency exchange rate fluctuations of $1.5 million. Case revenues increased $13.2 million in fiscal 2010 as compared to 2009 due primarily to an increase in customer demand from our five largest OEM customers due to the timing of their various product launches. This increased demand was partially offset by $0.7 million of unfavorable foreign currency exchange rate fluctuations in case revenues. Other product revenue decreased $0.3 million,
primarily attributable to unfavorable foreign currency exchange rate fluctuations of $0.2 million.
Gross Profit. Gross profit for fiscal 2010 decreased $7.3 million, or 8.4%, to $79.7 million from $87.0 million in fiscal 2009 due to decreased gross profit as a percentage of revenue and decreased revenue of 1.4%. The Corporation’s gross profit as a percentage of revenue was 22.1% in 2010 a decline from 23.8% in 2009. This decrease was primarily due to manufacturing inefficiencies resulting from our facility consolidation efforts in 2010 and unfavorable changes in product mix resulting in higher material cost as a percentage of revenue. Despite increased costs for resources to support higher customer and FDA regulatory expectations, labor and overhead costs remained
relatively consistent as a percentage of revenue as we endeavored to match variable costs in line with the volatility in customer ordering patterns. Changes in foreign currency exchange rates negatively affected our total year 2010 gross profit by $0.4 million.
Selling, General and Administrative Expenses. Selling, general and administrative expenses in fiscal 2010 increased $2.7 million, or 5.6%, to $50.5 million from $47.9 million in fiscal 2009. This increase was primarily driven by strategic investment in research and development expenditures, increased marketing expenditures as well as increased sales commissions and healthcare costs. These increases were partially offset by $1.6 million reduction in non-cash stock related compensation expense. As a percentage of revenue, selling, general and administrative expenses were 14.0% in fiscal 2010 as compared to 13.1% in fiscal 2009. Changes in foreign
currency exchange rates increased our selling, general and administrative expenses by $0.1 million.
Facility Consolidation and Severance Costs. Results of Operations for fiscal 2010 include charges of $1.0 million associated with employee cost reduction and efficiency actions as well as current period costs associated with the consolidation of our Auburn, Maine facility. These costs are comprised of $0.6 million of severance costs and an additional $0.4 million of asset impairment and moving expenses. The 2009 results of operations include net charges of $2.8 million related primarily to the consolidation of our Whitman, Massachusetts and Auburn, Maine facilities into other facilities that produce similar products. These costs are comprised of $1.4
million of severance costs and an additional $1.4 million of asset impairment and moving expenses. As of January 1, 2011, all charges had been paid. As of January 2, 2010, severance accruals related to these cost reduction and efficiency actions totaled $0.8 million, and were included in accrued and other liabilities in the consolidated balance sheets.
Other (Income) Expense. Interest expense for fiscal 2010 decreased $0.9 million, or 14.3%, to $5.7 million from $6.6 million in fiscal 2009. During 2010, we refinanced substantially all of our debt arrangements that were to mature in June 2011, which resulted in a loss on debt extinguishment of $0.8 million. In 2009, we entered into a forward swap contract to manage interest rate risk related to a portion of our current outstanding term loan indebtedness due in 2011. This swap contract was designated as a cash flow hedge of the future payment of variable rate interest with three-month LIBOR fixed at 1.34% per annum in 2009, 2010 and 2011. The net
derivatives valuation gain for 2010 consists of a gain on interest rate swap valuation of $1.3 million related to our interest rate swap that was not designated as a hedge as compared to a gain of $1.2 million in fiscal 2009. As part of our debt refinancing that occurred in November 2010, both these interest rate swaps were settled.
31
Provision for Income Taxes. Our effective tax rate in fiscal year 2010 was 36.2% compared to 28.4% in fiscal 2009. The 2010 effective tax rate approximates the U.S. Federal statutory rate of 35% and has increased over fiscal 2009 primarily due to reduced benefits from the favorable impacts of income generated in foreign jurisdictions with lower statutory tax rates.
Fiscal Year 2009 Compared to Fiscal Year 2008
Revenue. Revenue for fiscal 2009 decreased $57.5 million or 13.6% to $365.9 million from $423.4 million in fiscal 2008. Revenue for each of our principal product categories in these periods was as follows:
|
Product Category
|
||||||||
|
2009
|
2008
|
|||||||
|
(in millions)
|
||||||||
|
Instruments
|
$ | 166.7 | $ | 177.5 | ||||
|
Implants
|
108.0 | 122.6 | ||||||
|
Cases
|
68.5 | 86.4 | ||||||
|
Other
|
22.7 | 36.9 | ||||||
|
Total
|
$ | 365.9 | $ | 423.4 | ||||
The $57.5 million decrease in revenue resulted from unfavorable foreign currency exchange rate fluctuations of $13.6 million as well as challenging business conditions in the second half of 2009 due to the overall economic environment that has resulted in reduced demand of 10.4% for our five largest OEM customers as they continue to work down inventory levels and adjust the timing of their various product launches. Instrument revenue decreased $10.8 million. This decrease was driven primarily by lower demand from our major OEM customers due to the timing of their various product launch activity and their reduction of inventory levels. Foreign currency exchange rate fluctuations had an unfavorable impact of $1.7 million on instrument
revenue, however, this was more than offset by $2.2 million of incremental instrument revenue from our New Bedford acquisition which was completed at the end of January 2008. Implant revenue decreased $14.6 million in fiscal 2009 which was driven by unfavorable foreign currency exchange rate fluctuations of $7.0 million and decreased customer demand of $8.1 million as our major OEM customers worked down their inventory levels. This was partially offset by the additional sales from our New Bedford acquisition of $0.5 million. Case revenues decreased $17.9 million for fiscal 2009 mainly due to a $16.5 million decrease in customer demand primarily from our non-orthopedic medical customers as they react to the current economic environment. Additionally, we experienced a reduction in demand from our five largest OEM customers as they work down inventory levels and adjust the timing of product launches combined with $1.4 million
unfavorable foreign currency exchange rate fluctuations in case revenues. Other product revenue decreased $14.2 million driven by both a reduction in customer demand of $10.7 million due to our largest customer in the aerospace industry reacting to economic market conditions in that sector and unfavorable foreign currency exchange rate fluctuations of $3.5 million.
We estimate that global orthopedic device procedures grew approximately 4% in 2010 compared to 6% in 2009 and we expect slightly higher industry procedure growth in the future.
Gross Profit. Gross profit for fiscal 2009 decreased $13.3 million, or 13.3%, to $87.0 million from $100.3 million in fiscal 2008 primarily due to the decline in revenue of 13.6%. Despite experiencing declining revenues, the Corporation was able to increase the gross profit as a percentage of revenue to 23.8% in 2009 from 23.7% in 2008. This improvement was primarily due to aggressive actions to manage labor and other costs at all facilities and improved operational performance at our Sheffield, UK operating unit driven by the continued favorable impacts of our new ERP system, implemented in March 2009, headcount reductions, improved manufacturing processes and reduced
material costs from the renegotiation of a key supply agreement. We continue to drive improvements at Sheffield and anticipate continued improvements in the future. Changes in foreign currency exchange rates negatively affected our total year 2009 gross profit by $1.1 million.
Selling, General and Administrative Expenses. Selling, general and administrative expenses in fiscal 2009 decreased $10.4 million, or 18.0%, to $47.9 million from $58.3 million in fiscal 2008. This decrease was primarily driven by a $5.6 million decrease in employee compensation costs, including reductions in headcount due to decreased production, reduced overtime costs and decreased performance based compensation and non-cash stock compensation expense due to lower financial results. The improvement also reflects a reduction in professional fees and expenses incurred during 2008 of $4.7 million from the review of accounting irregularities at our Sheffield, UK operating
unit. As a percentage of revenue, selling, general and administrative expenses were 13.1% in fiscal 2009 as compared to 13.8% in fiscal 2008. Changes in foreign currency exchange rates decreased our selling, general and administrative expenses by $0.9 million.
32
Facility Consolidation and Severance Costs. Results of Operations for fiscal 2009 include net pre-tax charges of $2.8 million related primarily to the consolidation of our Whitman, Massachusetts and Auburn, Maine facilities into other facilities that produce similar products. These costs are comprised of $1.4 million of severance costs and an additional $1.4 million of asset impairment and moving expenses. As of January 2, 2010, severance accruals related to these cost reduction and efficiency actions totaled $0.8 million, and are included in accrued and other liabilities in the consolidated balance sheets. This accrual is expected to be paid during the first quarter of
2010.
Other (Income) Expense. Interest expense for fiscal 2009 decreased $3.5 million, or 34.1%, to $6.6 million from $10.1 million in fiscal 2008. This decrease reflects the reduction in our interest rate margin above LIBOR due to improved financial ratios, as well as the general decline in the interest rate market in 2009 as compared to 2008. Additionally, aggregate outstanding indebtedness has decreased $35.0 million, or 26.7% as compared to January 3, 2009. In 2009, we entered into a forward swap contract to manage interest rate risk related to a portion of its current outstanding term loan indebtedness due in 2011. This swap contract is designated as a cash flow hedge of
the future payment of variable rate interest with three-month LIBOR fixed at 1.34% per annum in 2009, 2010 and 2011, respectively. The net derivatives valuation gain for 2009 consists of a gain on interest rate swap valuation of $1.2 million related to our interest rate swap that has not been designated as a hedge as compared to a loss of $1.8 million in fiscal 2008. During 2008, we also held foreign currency forwards to mitigate fluctuations in foreign currency on the statement of operations. A gain on the foreign currency valuation of $4.3 million was recorded in derivative valuation gain in 2008 and partially offset $3.3 million of losses on foreign currency fluctuations that were included within other expense.
Provision for Income Taxes. Our effective tax rate in fiscal year 2009 was 28.4% compared to 23.8% in fiscal 2008. This rate is lower than the U.S. Federal statutory rate primarily due to the favorable impact of foreign income taxes as we benefited from an increase in income earned in foreign jurisdictions in 2009 where the statutory tax rate is lower than the Federal statutory rate. We also recognized $0.5 million of valuation allowance against foreign losses incurred during the year.
Liquidity and Capital Resources
Liquidity
Our principal sources of liquidity in fiscal 2010 were cash generated from operations and borrowings under our revolving credit facilities. Principal uses of cash in fiscal 2010 included increased working capital and capital expenditures as well as debt service. We expect that our principal uses of cash in the future will be to finance working capital, to pay for capital expenditures, to service debt and to fund possible future acquisitions. In November 2010, we entered into a new revolving credit facility which has total borrowing capacity of up to $200 million with an option to increase capacity, with the approval of the lenders, by $100 million.
We believe our cash resources will permit us to stay committed to our strategic plan of increasing our share in the orthopedic market and expanding into other medical device segments. The following table summarizes our primary sources and uses of cash in the periods presented:
|
Fiscal Year Ended
|
||||||||||||
|
2010
|
2009
|
2008
|
||||||||||
|
(in millions)
|
||||||||||||
|
Net Cash Flow provided by (used in):
|
||||||||||||
|
Operating activities
|
$ | 17.9 | $ | 53.4 | $ | 25.7 | ||||||
|
Investing activities
|
(14.0 | ) | (14.9 | ) | (68.0 | ) | ||||||
|
Financing activities
|
(2.5 | ) | (35.6 | ) | 41.5 | |||||||
|
Effect of exchange rate changes on cash and cash equivalents
|
(0.6 | ) | 1.1 | (1.1 | ) | |||||||
|
Net increase (decrease) in cash and cash equivalents
|
$ | 0.8 | $ | 4.0 | $ | (1.9 | ) | |||||
Operating Activities. We generated cash from operations of $17.9 million in fiscal 2010 compared to $53.4 million in fiscal 2009. The decline in operating cash flows is primarily the result of working capital requirements increasing during the course of 2010 in line with revenue growth as compared to declines during the course of 2009. Working capital used $20.0 million of cash in 2010 compared to cash generation of $2.5 million in 2009. The decrease in cash from operations is also due to a decrease in net income from 2009 to 2010 of $7.8 million. During 2009, the significant increase in cash from operations is primarily the result of lower
working capital requirements given the reduction in revenue in the second half of 2009. As revenue declined, the Corporation focused on reducing account receivable days, reducing required inventory levels and extending accounts payable terms.
Investing Activities. Net cash used in investing activities was $14.0 million for fiscal 2010 compared to $14.9 million in fiscal 2009. Investing activities in fiscal 2010 consisted of $15.9 million for capital expenditures, offset by $2.0 million in proceeds received primarily from the sale of four properties. Our investing activities in fiscal 2009 consisted of $15.0 million for capital expenditures.
33
Financing Activities. In November 2010, we refinanced substantially all our long-term debt, which was scheduled to mature in June 2011, with a new long-term revolving credit facility. Financing activities used $2.5 million of cash in fiscal 2010 due primarily to debt issuance costs paid of $1.4 million in connection with the refinancing and payments made on capital leases. During 2009, financial activities used $35.6 million of cash primarily to pay down long-term debt, capital leases and our revolving line of credit.
Capital Expenditures. Capital expenditures totaled $15.9 million in fiscal 2010, compared to $15.0 million in fiscal 2009. Fiscal 2010 capital spending focused on manufacturing equipment for additional capacity, new capabilities and productivity efficiencies. Fiscal 2009 capital spending was on required replacement equipment and strategic additions in high precision capabilities focused on the spine market as well as expanded capabilities in Malaysia. We expect capital expenditures for fiscal 2011 to approximate $17.0 million. These expenditures are expected to be funded from our cash flows from operating activities.
Debt and Credit Facilities
On November 3, 2010, we refinanced our existing bank revolving line of credit and term loans, which were scheduled to mature in June 2011. Our new revolving credit agreement is senior and secured with a total capacity of up to $200 million and includes the option to increase capacity by $100 million, subject to lender approval.
As of January 1, 2011, we had an aggregate of approximately $95.3 million of outstanding indebtedness, which consisted of an aggregate of $87.0 million of borrowings under our revolving credit agreement; $1.7 million of borrowings under our UK asset-based 24-month term note; $3.7 million of borrowings under our Malaysia short-term credit facility; and $2.9 million of capital lease obligations.
Borrowings under the revolving credit agreement bear interest at a floating rate, which is either a base rate, or at our option, a London Interbank Offered Rate ("LIBOR") rate, plus an applicable margin. As of January 1, 2011, an aggregate of $87.0 million was outstanding under this facility at a weighted average interest rate of 2.58%. We had two outstanding letters of credit as of January 1, 2011 in the amounts of $4.5 million and $0.2 million.
Historically, we have had a significant amount of variable rate long-term indebtedness and managed our exposure to changes in interest rates by entering into interest rate swap agreements. As further discussed in "Quantitative and Qualitative Disclosures about Market Risks —Interest Rate Risk," we had an existing agreement that did not qualify for hedge accounting under the applicable accounting guidelines and an agreement from 2009 that did qualify for hedge accounting. We recorded a non-qualifying interest rate swap valuation of $1.3 million gain, $1.2 million gain and $1.8 million loss for fiscal 2010, fiscal 2009 and fiscal 2008, respectively, within the derivative valuation gain line item in the statement of operations. We
recorded the qualifying interest rate swap losses of $0.2 million, net of tax benefits, in accumulated other comprehensive income for fiscal 2009. This loss was transferred out of accumulated other comprehensive income in fiscal 2010 when the swap was settled in conjunction with the debt refinancing. During fiscal 2010, we settled both these agreements in conjunction with the refinancing of substantially all of our debt arrangements resulting in a net loss of $0.3 million, which is included in loss on debt extinguishment.
Our revolving credit agreement contains various financial covenants, including covenants requiring a maximum ratio of total debt to EBITDA (as defined in the credit agreement) and minimum fixed charges ratio of EBITDA. The revolving line of credit also contains covenants restricting certain corporate actions, including asset dispositions, acquisitions, payment of dividends and certain other restricted payments, changes of control, incurring indebtedness, incurring liens, making loans and investments and transactions with affiliates. The revolving line of credit is secured by substantially all of our assets and also contains customary events of default. We were in compliance with all of our covenants as of January 1, 2011.
The revolving credit agreement requires no scheduled payments of principal until maturity in November 2015.
We hold certain property and equipment pursuant to capital leases. As of January 1, 2011, these leases have future minimum lease payments of $0.9 million, $0.9 million, $0.9 million, $0.8 and $0.8 million in each of the next 5 fiscal years and $0.5 million thereafter.
34
Contractual Obligations and Commercial Commitments
The following table reflects our contractual obligations as of January 1, 2011:
|
Payments Due By Period
|
||||||||||||||||||||
|
Total
|
Less than
1year
|
1-3 years
|
4-5 years
|
More than 5
years
|
||||||||||||||||
|
(In Millions)
|
||||||||||||||||||||
|
Long-term debt obligations (1)
|
$ | 88.7 | $ | 1.4 | $ | 0.3 | $ | 87.0 | $ | - | ||||||||||
|
Capital lease obligations
|
4.9 | 0.9 | 2.6 | 1.4 | - | |||||||||||||||
|
Operating lease obligations
|
5.0 | 1.7 | 2.3 | 0.6 | 0.4 | |||||||||||||||
|
Purchase obligations (2)
|
20.3 | 17.5 | 2.8 | - | - | |||||||||||||||
|
Total
|
$ | 118.9 | $ | 21.5 | $ | 8.0 | $ | 89.0 | $ | 0.4 | ||||||||||
(1) Represents principal maturities only and, therefore, excludes the effects of interest. There are no scheduled payments for our revolving credit facility prior to maturity. Borrowings under the revolving credit facility bear interest at a variable rate based on the London Interbank Offer Rate (LIBOR) or a base rate determined by the lender's prime rate plus an applicable margin, as defined in the agreement. The applicable margin for borrowings under the revolving credit agreement ranges from 0.75% to 1.75% for base rate borrowings and 1.75% to 2.75% for LIBOR
borrowings, subject to adjustment based on the average availability under the revolving line of credit facility.
(2) For the purposes of this table, contractual obligations for purchases of goods or services are defined as agreements that are enforceable and legally binding and that specify all significant terms, including: fixed or minimum quantities, fixed, minimum or variable price provisions; and the approximate timing of the transaction. Our purchase orders are normally based on our current manufacturing needs and are fulfilled by our vendors within a short time. We enter into blank orders with vendors that have preferred pricing terms; however, these orders are normally cancelable by us without penalty. Amounts predominantly
represent purchase agreements to buy minimum quantities of plastic, cobalt chrome and titanium through December 2012.
This table does not include liabilities for unrecognized tax benefits of $6.1 million as reasonable estimates could not be made regarding the timing of future cash outflows associated with those liabilities.
Off-Balance Sheet Arrangements
Our off-balance sheet arrangements include our operating leases and letters of credit, which are available under the revolving credit agreement. We had two letters of credit outstanding as of January 1, 2011 in the amounts of $4.5 million and $0.2 million.
Environmental
Our facilities and operations are subject to extensive federal, state, local and foreign environmental and occupational health and safety laws and regulations. These laws and regulations govern, among other things, air emissions; wastewater discharges; the generation, storage, handling, use and transportation of hazardous materials; the handling and disposal of hazardous wastes; the cleanup of contamination; and the health and safety of our employees. Under such laws and regulations, we are required to obtain permits from governmental authorities for some of our operations. If we violate or fail to comply with these laws, regulations or permits, we could be fined or otherwise sanctioned by regulators. We could also be held responsible for
costs and damages arising from any contamination at our past or present facilities or at third-party waste disposal sites. We cannot completely eliminate the risk of contamination or injury resulting from hazardous materials, and we may incur material liability as a result of any contamination or injury.
We incurred approximately $0.2 million and $0.4 million in capital expenditures for environmental, health and safety in 2010 and 2009, respectively. During 2010, our purchases focused on required replacement and improvements. During 2009, purchases focused on two areas: safety and environmental. Projects included purchases of new press controllers and emergency stops, wet dust collection systems and a nitric system.
In connection with past acquisitions, we completed Phase I environmental assessments and did not find any significant issues that we believe needed to be remediated. We cannot be certain that environmental issues will not be discovered or arise in the future related to these acquisitions.
Based on information currently available, we do not believe that we have any material environmental liabilities.
35
Critical Accounting Policies and Estimates
The preparation of our consolidated financial statements in accordance with accounting principles generally accepted in the United States, requires us to make estimates, judgments and assumptions that affect the reported amounts of assets, liabilities, revenues and expenses during the periods presented. On an ongoing basis, we evaluate these estimates. We base our estimates on historical experiences and assumptions believed to be reasonable under the circumstances. Those estimates form the basis for our judgments that affect the amounts reported in the financial statements. Actual results could differ from our estimates under different assumptions or conditions. Our significant accounting
policies, which may be affected by our estimates and assumptions, are more fully described in Note 2 to our consolidated financial statements that appear elsewhere in this Form 10-K.
|
·
|
Revenue Recognition. We recognize revenue on orders received from customers when there is persuasive evidence of an arrangement with the customer that is supportive of revenue recognition, the customer has made a fixed commitment to purchase the product for a fixed or determinable sales price, collection is reasonably assured under our normal billing and credit terms, and ownership and all risks of loss have been transferred to the buyer, which is normally upon shipment. In certain circumstances, customer terms require receipt of product prior to the transfer of the risk of ownership. In such circumstances, revenue is not recognized upon shipment, but rather upon confirmation of delivery. Estimated discounts and rebates are recorded as a
reduction of revenue in the same period revenue is recognized. Product returns and credits are estimated and recorded at the time of shipment based upon historical experience.
|
|
·
|
Inventory. Inventories are stated at the lower of cost (first-in, first-out) or market (net realizable value). Costs include material, labor and manufacturing overhead costs. We review our inventory balances monthly for excess products or obsolete inventory levels and write down, if necessary, the inventory to net realizable value.
|
|
·
|
Impairment of Long-Lived Assets, Including Intangible Assets. The Corporation assesses the impairment of definite lived long-lived assets when circumstances indicate the carrying value of an asset may not be recoverable based on the undiscounted future cash flows of an asset. If the carrying amount of the asset is determined not to be recoverable, a write-down to fair value is recorded. Fair values are determined based on quoted market values, undiscounted cash flows, or external appraisals, as applicable. The Corporation reviews long-lived assets for impairment at the individual asset or the asset group level for which the lowest level of independent cash flows can be identified.
|
Intangible assets subject to amortization consist of technology, non-compete and customer related intangible assets acquired in connection with our various acquisitions. These assets are amortized using the straight-line method. The Corporation is required to reassess the expected useful lives of existing intangible assets annually. The Corporation also evaluates the recoverability of intangible assets subject to amortization based on undiscounted operating cash flows when factors indicate impairment may exist. In the event of impairment, the Corporation makes appropriate write-downs of recorded costs to fair value. The Corporation reviewed its amortizing intangible assets and has not recorded any impairment related to these assets for
fiscal 2010, 2009, or 2008.
Goodwill is not amortized but is periodically tested for impairment using a two-step process. The first step is a screen for potential impairment, while the second step measures the amount of impairment. Potential impairment is determined by comparing estimated fair value to the net book value of the reporting unit. Fair value is calculated as the present value of estimated future cash flows. The Corporation has multiple operating segments. The Corporation has defined its reporting units at the component of an operating segment as this is the lowest level for which discrete financial information is available and the operating results of that component are regularly reviewed by management. The Corporation completed its annual impairment
testing and concluded that no impairment of goodwill existed for fiscal 2010, 2009, or 2008.
Intangible assets with an indefinite life are not amortized but are subject to review each reporting period to determine whether events and circumstances continue to support an indefinite useful life as well as an annual impairment test. The Corporation reviewed its intangible assets and has not recorded any impairment related to these assets for fiscal 2010, 2009, or 2008.
The assessment of the recoverability of long-lived assets reflects management's assumptions and estimates. Factors that management must estimate when performing impairment tests include future sales volume, prices, inflation, discount rates, exchange rates, tax rates and capital spending. Significant management judgment is involved in estimating these factors, and they include inherent uncertainties. Measurement of the recoverability of these assets is dependent upon the accuracy of the assumptions used in making these estimates, as well as how the estimates compare to the eventual future operating performance of the specific reporting unit to which the assets are attributed.
|
·
|
Stock-Based Compensation. The Corporation measures stock-based compensation cost at the grant date based on the estimated fair value of the award. Compensation cost for service-based awards is recognized ratably over the applicable vesting period. Compensation cost for performance-based awards is reassessed each period and recognized based upon the probability that the performance targets will be achieved. For restricted stock, the fair market value of the award is determined based upon the closing value of the Corporation's stock price on the grant date. The amount of stock-based compensation expense recognized during a period is based on the portion of the awards that are ultimately expected to vest. The
Corporation estimates pre-vesting forfeitures at the time of grant by analyzing historical data and revises those estimates in subsequent periods if actual forfeitures differ from those estimates. The total expense recognized over the vesting period will only be for those awards that ultimately vest.
|
36
|
·
|
Income Taxes. The consolidated financial statements of the Corporation have been prepared using the asset and liability method in accounting for income taxes, which requires the recognition of deferred income taxes for the expected future tax consequences of net operating losses, credits, and temporary differences between the financial statement carrying amounts and the tax basis of assets and liabilities. Differences between the anticipated and actual outcomes of these future tax consequences could have a material impact on our consolidated results of operations or financial position. Additionally, we use tax planning strategies as part of our global tax compliance program. Judgments and interpretation of statutes are inherent in this process. The Corporation
provides related valuation reserves, where applicable, in accounting for uncertain tax positions. Interest and penalties associated with reserves for uncertain tax positions are classified in income tax expense in the Statements of Operations.
|
Impact of Recently Issued and Adopted Accounting Standards
Disclosures about Fair Value Measurements. In January 2010, the Financial Accounting Standards Board (“FASB”) issued Accounting Standards Update (“ASU”) 2010-06, “Improving Disclosures about Fair Value Measurements.” ASU 2010-06 requires additional disclosures about fair value measurements including transfers in and out of Levels 1 and 2 and a higher level of disaggregation for the different types of financial
instruments. For the reconciliation of Level 3 fair value measurements, information about purchases, sales, issuances and settlements are presented separately. This standard is effective for interim and annual reporting periods beginning after December 15, 2009 with the exception of revised Level 3 disclosure requirements which are effective for interim and annual reporting periods beginning after December 15, 2010. Comparative disclosures are not required in the year of adoption. The Corporation adopted the provisions of the standard on January 3, 2010, which did not have an impact on the Corporation’s financial position, results of operations or cash flows.
Item 7A. Quantitative and Qualitative Disclosures About Market Risks
Interest Rate Risk
We are exposed to market risk from fluctuations in interest rates. Historically, we have managed our interest rate risk by balancing the amount of our fixed rate and variable rate debt and through the use of interest rate swaps. The objective of the swaps is to more effectively balance borrowing costs and interest rate risk. For fixed rate debt, interest rate changes affect the fair market value of such debt but do not impact earnings or cash flows. Conversely for variable rate debt, interest rate changes generally do not affect the fair market value of such debt, but do impact future earnings and cash flows, assuming other factors are held constant. At January 1, 2011, we had approximately $89.6 million of variable rate debt with no
interest rate swaps in place. The weighted average interest rate for this debt in 2010 was 3.03%. Holding other variables constant (such as foreign exchange rates and debt levels), a one percentage point change in interest rates would be expected to have an impact on pre-tax earnings and cash flows for the next year of approximately $0.9 million.
Foreign Currency Risk
Foreign currency risk is the risk that we will incur economic losses due to adverse changes in foreign currency exchange rates. As a global company with holdings in the United Kingdom, France, Ireland, Switzerland and Malaysia, we experienced an impact from foreign exchange in fiscal 2010. As a result of the fluctuation in rates, our revenue decreased for the fourth quarter 2010 by $1.0 million and decreased for the total year 2010 by $2.4 million. The fluctuation in rates decreased our gross margin for the fourth quarter 2010 by $0.2 million and decreased our gross margin by $0.4 million for the total year 2010. The impact of rates had minimal impact on our net income in the fourth quarter and decreased the total year 2010 net income by
$0.2 million.
Historically, the Corporation entered into foreign currency forward contracts to mitigate fluctuations in foreign currency on the statement of operations. The gain of the foreign currency valuation of $4.3 million included in derivative income for 2008 offset foreign currency transaction loss included within the other expense of $3.3 million. We did not have any outstanding contracts during 2010 or 2009.
Our primary exposures to foreign currency exchange fluctuations are pound sterling/US dollar and Euro/US dollar. At January 1, 2011, the potential reduction in earnings from a hypothetical instantaneous 10.0% increase or decrease in quoted foreign currency spot rates applied to foreign currency sensitive instruments would be approximately $3.0 million, net of tax. This foreign currency sensitivity model is limited by the assumption that all of the foreign currencies to which we are exposed would simultaneously decrease by 10.0% because such synchronized changes are unlikely to occur.
37
Commodity Price Risk
We are exposed to fluctuations in commodity prices through the purchase of raw materials that are processed from commodities, such as plastic, titanium, stainless steel, cobalt chrome and aluminum. Given the historical volatility of certain commodity prices, this exposure can impact product costs. To manage these fluctuations, we utilize competitive pricing methods such as bulk purchases, blanket orders and long-term contracts with our major suppliers to reduce short term fluctuations. For 2011, we have entered into purchasing contracts on certain raw materials totaling $18.2 million at fixed prices in order to manage our risk of commodity price movements. Additionally, we often do not set prices for our products in advance of our
commodity purchases; therefore, we can take into account the cost of the commodity in setting our prices for each order. In instances where we have supply agreements with customers; many of these agreements allow us to partially adjust prices for the impact of any raw material price increases. However, to the extent that we are unable to offset the increased commodity costs in our product prices, our results would be adversely affected.
38
Item 8. Financial Statements and Supplemental Data
|
Page
|
||
|
Consolidated Financial Statements:
|
||
|
Consolidated Balance Sheets
|
40
|
|
|
Consolidated Statements of Operations
|
41
|
|
|
Consolidated Statements of Shareholders' Equity
|
42
|
|
|
Consolidated Statements of Cash Flow
|
43
|
|
|
Notes to Consolidated Financial Statements
|
44
|
|
|
Report of Independent Registered Public Accounting Firm
|
59
|
|
|
Reports on Internal Control Over Financial Reporting:
|
||
|
Management's Report on Internal Control Over Financial Reporting
|
60
|
|
|
Report of Independent Registered Public Accounting Firm on Internal Control Over Financial Reporting
|
61
|
All schedules have been omitted because they are not required or applicable or the information is included in the consolidated financial statements or notes thereto.
39
SYMMETRY MEDICAL INC.
CONSOLIDATED BALANCE SHEETS
(In Thousands)
|
January 1,
|
January 2,
|
|||||||
|
2011
|
2010
|
|||||||
|
ASSETS:
|
||||||||
|
Current Assets:
|
||||||||
|
Cash and cash equivalents
|
$ | 15,067 | $ | 14,219 | ||||
|
Accounts receivable, net
|
50,457 | 38,221 | ||||||
|
Inventories
|
70,373 | 62,301 | ||||||
|
Refundable income taxes
|
1,911 | 3,048 | ||||||
|
Deferred income taxes
|
4,597 | 5,738 | ||||||
|
Other current assets
|
3,281 | 3,648 | ||||||
|
Total current assets
|
145,686 | 127,175 | ||||||
|
Property and equipment, net
|
107,879 | 113,369 | ||||||
|
Goodwill
|
154,218 | 153,813 | ||||||
|
Intangible assets, net of accumulated amortization
|
39,601 | 42,729 | ||||||
|
Other assets
|
2,570 | 1,181 | ||||||
|
Total Assets
|
$ | 449,954 | $ | 438,267 | ||||
|
LIABILITIES AND SHAREHOLDERS' EQUITY:
|
||||||||
|
Current Liabilities:
|
||||||||
|
Accounts payable
|
$ | 23,097 | $ | 19,494 | ||||
|
Accrued wages and benefits
|
6,808 | 7,607 | ||||||
|
Other accrued expenses
|
3,881 | 5,113 | ||||||
|
Accrued income taxes
|
233 | 257 | ||||||
|
Revolving line of credit
|
3,692 | 3,320 | ||||||
|
Current portion of capital lease obligations
|
454 | 529 | ||||||
|
Current portion of long-term debt
|
1,397 | 20,400 | ||||||
|
Total current liabilities
|
39,562 | 56,720 | ||||||
|
Accrued income taxes
|
6,564 | 6,362 | ||||||
|
Deferred income taxes
|
17,692 | 17,646 | ||||||
|
Derivative valuation liability
|
- | 2,982 | ||||||
|
Capital lease obligations, less current portion
|
2,418 | 2,887 | ||||||
|
Long-term debt, less current portion
|
87,349 | 69,200 | ||||||
|
Total Liabilities
|
153,585 | 155,797 | ||||||
|
Shareholders' Equity:
|
||||||||
|
Common Stock, $.0001 par value; 75,000 shares authorized; shares issued January 1, 2011—35,950; January 2, 2010—35,840
|
4 | 4 | ||||||
|
Additional paid-in capital
|
279,592 | 278,176 | ||||||
|
Retained earnings
|
14,248 | 277 | ||||||
|
Accumulated other comprehensive income
|
2,525 | 4,013 | ||||||
|
Total Shareholders' Equity
|
296,369 | 282,470 | ||||||
|
Total Liabilities and Shareholders' Equity
|
$ | 449,954 | $ | 438,267 | ||||
See accompanying notes to consolidated financial statements.
40
SYMMETRY MEDICAL INC.
CONSOLIDATED STATEMENTS OF OPERATIONS
(In Thousands, Except per Share Data)
|
Years Ended
|
||||||||||||
|
January 1,
|
January 2,
|
January 3,
|
||||||||||
|
2011
|
2010
|
2009
|
||||||||||
|
Revenue
|
$ | 360,830 | $ | 365,943 | $ | 423,406 | ||||||
|
Cost of revenue
|
281,132 | 278,926 | 323,048 | |||||||||
|
Gross profit
|
79,698 | 87,017 | 100,358 | |||||||||
|
Selling, general and administrative expenses
|
50,529 | 47,863 | 58,340 | |||||||||
|
Facility closure and severance costs
|
961 | 2,822 | - | |||||||||
|
Operating Income
|
28,208 | 36,332 | 42,018 | |||||||||
|
Other (income)/expense:
|
||||||||||||
|
Interest expense
|
5,698 | 6,647 | 10,092 | |||||||||
|
Loss on debt extinguishment
|
828 | - | - | |||||||||
|
Derivatives valuation gain
|
(1,328 | ) | (1,173 | ) | (2,460 | ) | ||||||
|
Other
|
1,111 | 428 | 2,874 | |||||||||
|
Income before income taxes
|
21,899 | 30,430 | 31,512 | |||||||||
|
Income tax expense
|
7,928 | 8,646 | 7,493 | |||||||||
|
Net income
|
$ | 13,971 | $ | 21,784 | $ | 24,019 | ||||||
|
Net income per share:
|
||||||||||||
|
Basic
|
$ | 0.39 | $ | 0.61 | $ | 0.67 | ||||||
|
Diluted
|
$ | 0.39 | $ | 0.61 | $ | 0.67 | ||||||
|
Weighted average common shares and equivalent shares outstanding:
|
||||||||||||
|
Basic
|
35,451 | 35,308 | 35,170 | |||||||||
|
Diluted
|
35,810 | 35,530 | 35,357 | |||||||||
See accompanying notes to consolidated financial statements.
41
SYMMETRY MEDICAL INC.
CONSOLIDATED STATEMENTS OF SHAREHOLDERS' EQUITY
(In Thousands)
|
Accumulated
|
||||||||||||||||||||
|
Additional
|
Retained
|
Other
|
||||||||||||||||||
|
Common
|
Paid-in
|
Earnings
|
Comprehensive
|
|||||||||||||||||
|
Stock
|
Capital
|
(Deficit)
|
Income (Loss)
|
Total
|
||||||||||||||||
|
Balance at December 29, 2007
|
$ | 4 | $ | 272,623 | $ | (45,526 | ) | $ | 10,435 | $ | 237,536 | |||||||||
|
Comprehensive income:
|
||||||||||||||||||||
|
Net income
|
24,019 | 24,019 | ||||||||||||||||||
|
Other comprehensive income (loss)—
|
||||||||||||||||||||
|
Foreign currency translation adjustment
|
(12,408 | ) | (12,408 | ) | ||||||||||||||||
|
Comprehensive income
|
$ | 11,611 | ||||||||||||||||||
|
Exercise of Common Stock options
|
371 | 371 | ||||||||||||||||||
|
Amortization of unearned compensation cost
|
2,875 | 2,875 | ||||||||||||||||||
|
Issuance of Common Stock—
|
||||||||||||||||||||
|
Employee Stock Purchase Plan
|
312 | 312 | ||||||||||||||||||
|
Restricted Stock
|
(291 | ) | (291 | ) | ||||||||||||||||
|
Balance at January 3, 2009
|
$ | 4 | $ | 275,890 | $ | (21,507 | ) | $ | (1,973 | ) | $ | 252,414 | ||||||||
|
Comprehensive income:
|
||||||||||||||||||||
|
Net income
|
21,784 | 21,784 | ||||||||||||||||||
|
Other comprehensive income (loss)—
|
||||||||||||||||||||
|
Foreign currency translation adjustment
|
6,217 | 6,217 | ||||||||||||||||||
|
Derivative, net of tax benefit of $154
|
(231 | ) | (231 | ) | ||||||||||||||||
|
Comprehensive income
|
$ | 27,770 | ||||||||||||||||||
|
Amortization of unearned compensation cost
|
2,765 | 2,765 | ||||||||||||||||||
|
Issuance of Common Stock—
|
||||||||||||||||||||
|
Employee Stock Purchase Plan
|
202 | 202 | ||||||||||||||||||
|
Restricted Stock
|
(681 | ) | (681 | ) | ||||||||||||||||
|
Balance at January 2, 2010
|
$ | 4 | $ | 278,176 | $ | 277 | $ | 4,013 | $ | 282,470 | ||||||||||
|
Comprehensive income:
|
||||||||||||||||||||
|
Net income
|
13,971 | 13,971 | ||||||||||||||||||
|
Other comprehensive income (loss)—
|
||||||||||||||||||||
|
Foreign currency translation adjustment
|
(1,719 | ) | (1,719 | ) | ||||||||||||||||
|
Derivative, net of tax expense of $154
|
231 | 231 | ||||||||||||||||||
|
Comprehensive income
|
$ | 12,483 | ||||||||||||||||||
|
Exercise of Common Stock options
|
37 | 37 | ||||||||||||||||||
|
Amortization of unearned compensation cost
|
1,197 | 1,197 | ||||||||||||||||||
|
Issuance of Common Stock—
|
||||||||||||||||||||
|
Employee Stock Purchase Plan
|
167 | 167 | ||||||||||||||||||
|
Restricted Stock
|
15 | 15 | ||||||||||||||||||
|
Balance at January 1, 2011
|
$ | 4 | $ | 279,592 | $ | 14,248 | $ | 2,525 | $ | 296,369 | ||||||||||
See accompanying notes to consolidated financial statements.
42
SYMMETRY MEDICAL INC.
CONSOLIDATED STATEMENTS OF CASH FLOW
(In Thousands)
|
Years Ended
|
||||||||||||
|
January 1,
|
January 2,
|
January 3,
|
||||||||||
|
2011
|
2010
|
2009
|
||||||||||
|
Operating activities
|
||||||||||||
|
Net income
|
$ | 13,971 | $ | 21,784 | $ | 24,019 | ||||||
|
Adjustments to reconcile net income to net cash provided by operating activities:
|
||||||||||||
|
Depreciation
|
18,196 | 19,307 | 18,524 | |||||||||
|
Amortization
|
2,933 | 2,945 | 2,939 | |||||||||
|
Net (gain) loss on sale of assets
|
(62 | ) | 1,014 | (464 | ) | |||||||
|
Deferred income tax provision
|
1,399 | 4,311 | 3,475 | |||||||||
|
Loss on debt extinguishment
|
828 | - | - | |||||||||
|
Excess tax benefit from stock-based compensation
|
- | - | (568 | ) | ||||||||
|
Stock-based compensation
|
1,197 | 2,765 | 2,875 | |||||||||
|
Derivative valuation (gain) loss
|
(1,328 | ) | (1,173 | ) | 1,782 | |||||||
|
Foreign currency transaction (gain) loss
|
816 | (33 | ) | 5,025 | ||||||||
|
Change in operating assets and liabilities:
|
||||||||||||
|
Accounts receivable
|
(12,717 | ) | 16,450 | (14,944 | ) | |||||||
|
Other assets
|
(61 | ) | 599 | (1,083 | ) | |||||||
|
Inventories
|
(8,399 | ) | 197 | (12,136 | ) | |||||||
|
Derivative settlement
|
(1,734 | ) | - | - | ||||||||
|
Current income taxes
|
1,152 | 833 | (1,377 | ) | ||||||||
|
Accounts payable
|
4,165 | (9,558 | ) | (2,131 | ) | |||||||
|
Accrued expenses and other
|
(2,450 | ) | (6,016 | ) | (263 | ) | ||||||
|
Net cash provided by operating activities
|
17,906 | 53,425 | 25,673 | |||||||||
|
Investing activities
|
||||||||||||
|
Purchases of property and equipment
|
(15,917 | ) | (15,017 | ) | (22,756 | ) | ||||||
|
Proceeds from the sale of property and equipment
|
1,950 | 69 | 1,374 | |||||||||
|
Acquisitions, net of cash received
|
- | - | (46,584 | ) | ||||||||
|
Net cash used in investing activities
|
(13,967 | ) | (14,948 | ) | (67,966 | ) | ||||||
|
Financing activities
|
||||||||||||
|
Proceeds from bank revolving line of credit
|
50,396 | 25,313 | 90,721 | |||||||||
|
Payments on bank revolving line of credit
|
(50,377 | ) | (43,314 | ) | (91,737 | ) | ||||||
|
Proceeds from (payments on) short term borrowings, net
|
182 | 433 | (2,001 | ) | ||||||||
|
Issuance of revolving credit agreement
|
92,000 | - | - | |||||||||
|
Payments on revolving credit agreement
|
(5,000 | ) | - | - | ||||||||
|
Issuance of bank term loan
|
2,711 | - | 60,000 | |||||||||
|
Payments on bank term loans and capital lease obligations
|
(91,152 | ) | (17,952 | ) | (16,388 | ) | ||||||
|
Proceeds from the issuance of common stock
|
182 | (81 | ) | 357 | ||||||||
|
Excess tax benefit from stock-based compensation
|
- | - | 568 | |||||||||
|
Debt issuance costs paid
|
(1,427 | ) | - | - | ||||||||
|
Net cash provided by (used in) financing activities
|
(2,485 | ) | (35,601 | ) | 41,520 | |||||||
|
Effect of exchange rate changes on cash
|
(606 | ) | 1,152 | (1,125 | ) | |||||||
|
Net increase (decrease) in cash and cash equivalents
|
848 | 4,028 | (1,898 | ) | ||||||||
|
Cash and cash equivalents at beginning of period
|
14,219 | 10,191 | 12,089 | |||||||||
|
Cash and cash equivalents at end of period
|
$ | 15,067 | $ | 14,219 | $ | 10,191 | ||||||
|
Supplemental disclosures:
|
||||||||||||
|
Cash paid for interest
|
$ | 4,872 | $ | 6,859 | $ | 9,335 | ||||||
|
Cash paid for income taxes
|
$ | 4,436 | $ | 3,964 | $ | 4,946 | ||||||
|
Assets acquired under capital leases
|
$ | - | $ | - | $ | 639 | ||||||
See accompanying notes to consolidated financial statements.
43
SYMMETRY MEDICAL INC.
NOTES TO CONSOLIDATED FINANCIAL STATEMENTS
(In Thousands, Except Share and per Share Data)
1. Description of the Business
The consolidated financial statements include the accounts of Symmetry Medical Inc. and its wholly-owned subsidiaries (collectively referred to as the Corporation); Symmetry Medical USA Inc., Jet Engineering, Inc., Ultrexx, Inc., Symmetry Medical Switzerland SA (formerly known as Riley Medical Europe, SA), Symmetry Medical Everest LLC, Symmetry Medical Ireland Limited (formerly known as Everest Metal International Limited), Symmetry Medical Cheltenham Limited, Symmetry Medical PolyVac, SAS, Symmetry Medical Sheffield Limited (formerly known as Thornton Precision Components Limited), Symmetry Medical Malaysia SDN, Clamonta Limited, Specialty Surgical Instrumentation, Inc., and Symmetry Medical New Bedford Inc.
Symmetry Medical Inc. is a leading independent provider of implants and related instruments and cases to global orthopedic device manufacturers. The Corporation designs, develops and produces these products for companies in other segments of the medical device market, including the arthroscopy, dental, laparoscopy, osteobiologic and endoscopy segments, and also provides limited specialized products to non-healthcare markets, such as the aerospace market.
On January 25, 2008, the Corporation acquired DePuy Orthopaedics, Inc's ("DePuy") New Bedford, Massachusetts instrument manufacturing facility ("New Bedford"). This facility manufactures orthopedic instruments as well as general surgical instruments and small implants.
2. Summary of Significant Accounting Policies
Principles of Consolidation. The consolidated financial statements include the accounts of the Corporation and its wholly-owned subsidiaries. All significant intercompany accounts and transactions have been eliminated in consolidation.
Year End. The Corporation's fiscal year is the 52 or 53 week period ending on the Saturday closest to December 31. Fiscal year 2010 is a 52 week year (ending January 1, 2011), fiscal year 2009 is a 52 week year (ending January 2, 2010), and fiscal 2008 was a 53 week year (ending January 3, 2009). References in these consolidated financial statements to 2010, 2009 and 2008 refer to these financial years, respectively.
Use of Estimates. Preparation of these consolidated financial statements requires management to make estimates and assumptions that affect the amounts reported in the financial statements and accompanying notes. Actual results could differ from those estimates, but management does not believe such differences will materially affect the Corporation's financial position or results of operations.
Revenue Recognition. The Corporation recognizes revenue on orders received from its customers when there is persuasive evidence of an arrangement with the customer that is supportive of revenue recognition, the customer has made a fixed commitment to purchase the product for a fixed or determinable price, collection is reasonably assured under the Corporation's normal billing and credit terms and ownership and all risks of loss have been transferred to the buyer, which is normally upon shipment. In certain circumstances, customer terms require receipt of product prior to the transfer of the risk of ownership. In such circumstances, revenue is not recognized upon shipment, but rather upon confirmation of
delivery. Estimated discounts and rebates are recorded as a reduction of revenue in the same period revenue is recognized. Product returns and credits are estimated and recorded at the time of shipment based upon historical experience.
Cash and Cash Equivalents. Cash and cash equivalents include all highly liquid investments with a maturity of three months or less at the time of purchase.
Allowance for Doubtful Accounts. The Corporation performs periodic credit evaluations of customers' financial condition and generally does not require collateral. Receivables are generally due within 30 to 90 days. The Corporation maintains an allowance for doubtful accounts for estimated losses in the collection of accounts receivable. The Corporation makes estimates regarding the future ability of its customers to make required payments based on historical credit experience and expected future trends. Provisions to the allowance for doubtful accounts are charged to current operating expenses. Actual losses are charged against this allowance when incurred. The activity in the allowance for doubtful accounts was as follows:
44
|
January 1,
|
January 2,
|
January 3,
|
||||||||||
|
2011
|
2010
|
2009
|
||||||||||
|
Beginning balance
|
$ | 578 | $ | 838 | $ | 440 | ||||||
|
Provision
|
597 | 22 | 612 | |||||||||
|
Write-offs, net
|
(172 | ) | (282 | ) | (214 | ) | ||||||
|
Ending balance
|
$ | 1,003 | $ | 578 | $ | 838 | ||||||
Inventories. Inventories are stated at the lower of cost, determined on the first-in, first-out (FIFO) method, or market. Costs include material, labor and manufacturing overhead costs. Inventory balances are reviewed monthly for excess products or obsolete inventory levels and written down, if necessary, to net realizable value.
Property and Equipment. Property and equipment, which includes assets under capital lease, are stated on the basis of cost. Depreciation is calculated on the straight-line method over the estimated useful lives of the respective assets or lease terms, whichever is shorter. Accelerated methods are used for income tax purposes. Repair and maintenance costs are charged to expense as incurred. Upon retirement or sale of an asset, its cost and related accumulated depreciation or amortization is removed from the consolidated balance sheet and any gain or loss is recorded in operating income or expense.
Impairment of Long-Lived Assets, Including Intangible Assets. The Corporation assesses the impairment of definite lived long-lived assets when circumstances indicate the carrying value of an asset may not be recoverable based on the undiscounted future cash flows of an asset. If the carrying amount of the asset is determined not to be recoverable, a write-down to fair value is recorded. Fair values are determined based on quoted market values, undiscounted cash flows, or external appraisals, as applicable. The Corporation reviews long-lived assets for impairment at the individual asset or the asset group level for which the lowest level of independent cash flows can be identified.
Intangible assets subject to amortization consist of technology, non-compete and customer related intangible assets acquired in connection with our various acquisitions. These assets are amortized using the straight-line method. The Corporation is required to reassess the expected useful lives of existing intangible assets annually. The Corporation also evaluates the recoverability of intangible assets subject to amortization based on undiscounted operating cash flows when factors indicate impairment may exist. In the event of impairment, the Corporation makes appropriate write-downs of recorded costs to fair value. The Corporation reviewed its amortizing intangible assets and has not recorded any impairment related to these assets for fiscal 2010, 2009 or 2008.
Goodwill is not amortized but is periodically tested for impairment using a two-step process. The first step is a screen for potential impairment, while the second step measures the amount of impairment. Potential impairment is determined by comparing estimated fair value to the net book value of the reporting unit. Fair value is calculated as the present value of estimated future cash flows. The Corporation has multiple operating segments. The Corporation has defined its reporting units at the component of an operating segment as this is the lowest level for which discrete financial information is available and the operating results of that component are regularly reviewed by management. The Corporation completed
its annual impairment testing and concluded that no impairment of goodwill existed for fiscal 2010, 2009 or 2008.
Intangible assets with an indefinite life are not amortized but are subject to review each reporting period to determine whether events and circumstances continue to support an indefinite useful life as well as an annual impairment test. The Corporation reviewed its intangible assets and has not recorded any impairment related to these assets for fiscal 2010, 2009 or 2008.
The assessment of the recoverability of long-lived assets reflects management's assumptions and estimates. Factors that management must estimate when performing impairment tests include sales volume, prices, inflation, discount rates, exchange rates, tax rates and capital spending. Significant management judgment is involved in estimating these factors, and they include inherent uncertainties. Measurement of the recoverability of these assets is dependent upon the accuracy of the assumptions used in making these estimates, as well as how the estimates compare to the eventual future operating performance of the specific reporting unit to which the assets are attributed. Changes in these estimates could change our conclusion regarding the impairment of goodwill or other intangible assets and potentially result in a
non-cash impairment in the future period.
Income Taxes. The consolidated financial statements of the Corporation have been prepared using the asset and liability method in accounting for income taxes, which requires the recognition of deferred income taxes for the expected future tax consequences of net operating losses, credits, and temporary differences between the financial statement carrying amounts and the tax basis of assets and liabilities. Differences between the anticipated and actual outcomes of these future tax consequences could have a material impact on our consolidated results of operations or financial position. Additionally, we use tax planning strategies as part of our global tax compliance program. Judgments and interpretation of statutes are inherent in this process. The
Corporation provides related reserves, where applicable, in accounting for uncertain tax positions. Interest and penalties associated with reserves for uncertain tax positions are classified in income tax expense in the Statements of Operations.
45
Foreign Currency Translation. The financial statements of the Corporation's foreign subsidiaries are accounted for and have been translated into U.S. dollars in accordance with accounting guidance on foreign currency translation. Assets and liabilities have been translated using the exchange rate in effect at the balance sheet date. Revenues and expenses have been translated using a weighted-average exchange rate for the period. Currency translation adjustments have been recorded as a separate component of shareholders' equity. Foreign currency transaction gains and losses resulting from a subsidiary's foreign currency denominated assets and liabilities included in other income were losses of $1,046, $302, and $3,309 in 2010, 2009 and 2008,
respectively.
Shipping and Handling Costs. The Corporation reflects freight costs associated with shipping its products to customers as a component of cost of revenues.
Advertising Costs. Advertising costs are expensed as incurred. Advertising costs were $490, $315 and $317 in 2010, 2009 and 2008, respectively.
Derivative Financial Instruments. The Corporation recognizes all derivative instruments in its consolidated financial statements at its fair value. Changes in the fair value of derivatives are recorded each period in the Derivative Valuation (gain)/loss line item of the Statements of Operations unless the derivative qualifies for hedge accounting. The effective portion of changes in fair value of hedges is recorded each period in accumulated other comprehensive income (loss), net of tax, until the related hedge transaction occurs. Any ineffective portion of changes in fair value of the hedges is recorded in the Derivative Valuation
(gain)/loss line item of the Statement of Operations.
Stock-Based Compensation. The Corporation measures stock-based compensation cost at the grant date based on the estimated fair value of the award. Compensation cost for service-based awards is recognized ratably over the applicable vesting period. Compensation cost for performance-based awards is reassessed each period and recognized based upon the probability that the performance targets will be achieved. There have been no grants of stock options since 2004. For restricted stock, the fair market value of the award is determined based upon the closing value of the Corporation's stock price on the grant date. The amount of stock-based compensation expense recognized during a period is based on the portion of the awards that are ultimately expected
to vest. The Corporation estimates forfeitures at the time of grant by analyzing historical data and revises those estimates in subsequent periods if actual forfeitures differ from those estimates. The total expense recognized over the vesting period will only be for those awards that ultimately vest. Refer to Note 12 for additional information on the Corporation's compensation plans.
Recently Adopted Accounting Pronouncements
Disclosures about Fair Value Measurements. In January 2010, the Financial Accounting Standards Board (“FASB”) issued Accounting Standards Update (“ASU”) 2010-06, “Improving Disclosures about Fair Value Measurements”. ASU 2010-06 requires additional disclosures about fair value measurements including transfers in and out of Levels 1 and 2 and a higher level of disaggregation for the different types of financial instruments. For the reconciliation of
Level 3 fair value measurements, information about purchases, sales, issuances and settlements are presented separately. This standard is effective for interim and annual reporting periods beginning after December 15, 2009 with the exception of revised Level 3 disclosure requirements which are effective for interim and annual reporting periods beginning after December 15, 2010. Comparative disclosures are not required in the year of adoption. The Corporation adopted the provisions of the standard on January 3, 2010, which did not have an impact on the Corporation’s financial position, results of operations or cash flows.
3. Inventories
Inventories consist of the following:
|
January 1,
|
January 2,
|
|||||||
|
2011
|
2010
|
|||||||
|
Raw material and supplies
|
$ | 14,407 | $ | 15,099 | ||||
|
Work-in-process
|
31,739 | 27,120 | ||||||
|
Finished goods
|
24,227 | 20,082 | ||||||
| $ | 70,373 | $ | 62,301 | |||||
46
4. Property and Equipment
Property and equipment, including depreciable lives, consists of the following:
|
January 1,
|
January 2,
|
|||||||
|
2011
|
2010
|
|||||||
|
Land
|
$ | 6,412 | $ | 6,965 | ||||
|
Buildings and improvements (20 to 40 years)
|
41,152 | 42,252 | ||||||
|
Machinery and equipment (5 to 15 years)
|
144,626 | 138,182 | ||||||
|
Office equipment (3 to 5 years)
|
13,959 | 13,194 | ||||||
|
Construction-in-progress
|
7,276 | 3,750 | ||||||
| 213,425 | 204,343 | |||||||
|
Less accumulated depreciation
|
(105,546 | ) | (90,974 | ) | ||||
| $ | 107,879 | $ | 113,369 | |||||
5. Intangible Assets
As of January 1, 2011, the balances of intangible assets, other than goodwill, were as follows:
|
Weighted-Average
|
Gross
|
Net
|
||||||||||||
|
Amortization
|
Intangible
|
Accumulated
|
Intangible
|
|||||||||||
|
Period
|
Assets
|
Amortization
|
Assets
|
|||||||||||
|
Acquired technology and patents
|
10 years
|
$ | 2,324 | $ | (1,284 | ) | $ | 1,040 | ||||||
|
Acquired customers
|
18 years
|
42,503 | (11,669 | ) | 30,384 | |||||||||
|
Non-compete agreements
|
5 years
|
590 | (442 | ) | 148 | |||||||||
|
Intangible assets subject to amortization
|
17 years
|
45,417 | (13,395 | ) | 32,022 | |||||||||
|
Proprietary processes
|
Indefinite
|
3,525 | ||||||||||||
|
Trademarks
|
Indefinite
|
4,054 | ||||||||||||
|
Indefinite-lived intangible assets, other than goodwill
|
7,579 | |||||||||||||
|
Total
|
$ | 39,601 | ||||||||||||
As of January 2, 2010, the balances of intangible assets, other than goodwill, were as follows:
|
Weighted-Average
Amortization
Period
|
Gross
Intangible Assets
|
Accumulated
Amortization
|
Net
Intangible
Assets
|
|||||||||||
|
Acquired technology and patents
|
10 years
|
$
|
2,343
|
$
|
(1,020
|
)
|
$
|
1,323
|
||||||
|
Acquired customers
|
18 years
|
42,613
|
(9,166
|
)
|
33,447
|
|||||||||
|
Non-compete agreements
|
5 years
|
691
|
(420
|
)
|
271
|
|||||||||
|
Intangible assets subject to amortization
|
17 years
|
45,647
|
(10,606
|
)
|
35,041
|
|||||||||
|
Proprietary processes
|
Indefinite
|
|
|
3,586
|
||||||||||
|
Trademarks
|
Indefinite
|
4,102
|
||||||||||||
|
Indefinite-lived intangible assets, other than goodwill
|
7,688
|
|||||||||||||
|
Total
|
$
|
42,729
|
||||||||||||
47
5. Intangible Assets – (continued)
Intangible asset amortization expense was $2,933, $2,945, and $2,939 for 2010, 2009 and 2008, respectively. Annual intangible asset amortization expense for the next 5 fiscal years is estimated to be $2,700 per year.
The changes in the carrying amounts of goodwill for the years ended January 1, 2011 and January 2, 2010, are as follows:
|
Balance as of January 3, 2009
|
$ | 153,521 | ||
|
Adjustment to goodwill
|
(482 | ) | ||
|
Effects of foreign currency
|
774 | |||
|
Balance as of January 2, 2010
|
$ | 153,813 | ||
|
Effects of foreign currency
|
$ | 405 | ||
|
Balance as of January 1, 2011
|
$ | 154,218 |
6. Fair Value of Financial Instruments
Accounting guidance establishes a three-tier fair value hierarchy, which prioritizes the inputs used in measuring fair value. These tiers include: Level 1, defined as observable inputs such as quoted prices in active markets; Level 2, defined as inputs other than quoted prices in active markets that are either directly or indirectly observable, and Level 3, defined as unobservable inputs in which little or no market data exists, therefore requiring an entity to develop its own assumptions.
As of January 2, 2010, the Corporation held certain instruments that are required to be measured at fair value on a recurring basis. These included the Corporation's interest rate derivative instruments, which were terminated and settled during 2010.
Additionally, financial instruments also consist of cash and cash equivalents, accounts receivable, and long-term debt. The carrying value of these financial instruments approximates fair value.
7. Derivatives
Historically, the Corporation has utilized derivative instruments to minimize the volatility of cash flows and statement of operations impacts associated with interest rate payments on its variable rate debt. The Corporation recognized all derivative instruments as either assets or liabilities at fair value on the consolidated balance sheets. The Corporation utilized third party valuations to assist in the determination of the fair value of these derivatives. The Corporation considered its derivative instrument valuations to be Level 2 fair value measurements.
To the extent a derivative instrument was designated effective as a cash flow hedge of an exposure to changes in the fair value of a future transaction, the change in fair value of the derivative was deferred in accumulated other comprehensive income/ (loss), a component of shareholders' equity in the consolidated balance sheets, until the underlying transaction hedged was recognized in the consolidated statements of operations. The Corporation accounted for certain derivatives hedging the payment of interest as cash flow hedges and the impact of the hedge was reclassified to interest expense in the consolidated statements of operations upon payment of interest.
The Corporation's profitability and cash flows are affected by changes in interest rates, specifically the LIBOR rate. The primary purpose of the Corporation's interest rate risk management activities is to hedge its exposure to changes in interest rates. In 2009, the Corporation entered into a forward swap contract to manage interest rate risk related to a portion of its current variable rate senior secured term loan. The Corporation hedged the future interest payments related to $64,100 of the total outstanding term loan indebtedness due in 2011 pursuant to this forward swap contract. In connection with the refinancing of its debt in November 2010, the Corporation terminated and settled this swap contract. This swap contract, which had a fair value of ($385) at January 2, 2010, was designated as a cash flow hedge
of the future payment of variable rate interest with three-month LIBOR fixed at 1.34% per annum in 2009 and 2010.
In 2006, the Corporation entered into a forward swap contract to manage interest rate risk related to $40,000 of its then existing variable rate senior secured first lien term loan to a fixed payment obligation of 5.45% per annum for the period commencing July 3, 2006 and ending on June 10, 2011. In connection with the refinancing of its debt in November 2010, the Corporation terminated and settled this swap contract. This swap contract, which had a fair value of ($2,598) at January 2, 2010, was not designated as a cash flow hedge of the future variable rate payment of interest. The entire change in the fair value of this interest rate swap was recorded to derivative valuation (gain)/loss in the consolidated statements of operations. In Fiscal 2010, 2009 and 2008, the Corporation recorded a $1,328 gain, $1,173
gain, and $1,856 loss, respectively.
48
Historically, the Corporation entered into forward contracts to mitigate the impact of fluctuations in foreign currency on the consolidated statements of operations. During fiscal 2010 and 2009, the Corporation had no foreign currency contracts outstanding since all contracts were settled during fiscal 2008, resulting in $4,316 of realized gains that was included in the derivative valuation (gain)/loss line item of the consolidated statement of operations.
8. Debt Arrangements
Long-term debt consists of the following:
|
January 1,
|
January 2,
|
|||||||
|
2011
|
2010
|
|||||||
|
Bank term loan payable in quarterly installments, plus interest at a variable rate, through June 2011, extinguished in 2010
|
- | $ | 38,600 | |||||
|
Bank term loan payable in quarterly installments, plus interest at a variable rate, through June 2011, extinguished in 2010
|
- | 51,000 | ||||||
|
Revolving credit agreement, due November 2015
|
$ | 87,000 | - | |||||
|
Bank asset-backed term loan payable in monthly installments, plus interest at 2.75% through March 2012
|
1,746 | - | ||||||
| 88,746 | 89,600 | |||||||
|
Less current portion
|
(1,397 | ) | (20,400 | ) | ||||
| $ | 87,349 | $ | 69,200 | |||||
On November 3, 2010, the Company refinanced its bank revolving line of credit and term loans which were scheduled to mature in June 2011, with a new revolving credit agreement which is senior and secured and has a total borrowing capacity of up to $200,000. The Corporation pays a variable rate commitment fee based on its leverage ratio for the average unused portion of the revolving line of credit facility. The revolving credit agreement requires no scheduled payments of principal until maturity in November 2015.
Borrowings under the revolving credit agreement bear interest at a floating rate, which is either a base rate, or at our option, a London Interbank Offered Rate ("LIBOR") rate, plus an applicable margin. As of January 1, 2011, an aggregate of $87,000 was outstanding at a weighted average interest rate of 2.58%. We had two outstanding letters of credit as of January 1, 2011 in the amounts of $4,500 and $200.
Historically, we have had a significant amount of variable rate long-term indebtedness. We have managed our exposure to changes in interest rates by entering into interest rate swap agreements. As further discussed in "Quantitative and Qualitative Disclosures about Market Risks — Interest Rate Risk," we had an existing agreement that did not qualify for hedge accounting under the applicable accounting guidelines and an agreement from 2009 that did qualify for hedge accounting. We recorded a non-qualifying interest rate swap valuation of $1,328 gain, $1,173 gain and $1,856 loss for fiscal 2010, fiscal 2009 and fiscal 2008, respectively. As of January 1, 2011, we have terminated and settled both of these agreements in conjunction with the refinancing of substantially all of our debt
arrangements.
Our revolving credit agreement contains various financial covenants, including covenants requiring a maximum ratio of total debt to EBITDA (as defined in the agreement) and minimum fixed charges ratio of EBITDA. The revolving credit agreement also contains covenants restricting certain corporate actions, including asset dispositions, acquisitions, payment of dividends and certain other restricted payments, changes of control, incurring indebtedness, incurring liens, making loans and investments and transactions with affiliates. The revolving line of credit is secured by substantially all of our assets and contains customary events of default. We were in compliance with all of our covenants as of January 1, 2011.
In March, 2010, our Sheffield, UK unit obtained a new £3,000 facility, comprised of a 24-month asset-based term note and short-term revolver facility. The term note matures in March 2012 with monthly payments plus interest at 2.75% per year. The short-term revolver is due on demand and accrues interest at 3.50% per year. As of January 1, 2011, $1,746 was outstanding on the term loan and there were no borrowings on the short-term revolver. The term note and revolver are secured by certain assets of our Sheffield, UK unit, which had a net book value of approximately $5,699 as of January 1, 2011.
49
Maturities of long-term debt for the five years succeeding January 1, 2011 are as follows:
|
2011
|
$ | 1,397 | ||
|
2012
|
349 | |||
|
2013
|
- | |||
|
2014
|
- | |||
|
2015
|
87,000 | |||
|
Thereafter
|
- | |||
| $ | 88,746 |
In July 2008, our Penang, Malaysia unit obtained a $5,000 short-term revolving line of credit which is renewable on an annual basis. The facility requires interest only monthly payments at LIBOR, plus an applicable margin per year and the total outstanding due upon maturity in April 2011. As of January 1, 2011, $3,692 was outstanding on the facility. This Malaysian facility is secured by a standby letter of credit issued on the Corporation’s US revolving line of credit facility in the amount of $4,500.
9. Leases
The Corporation has a capital lease arrangement through October 1, 2016 for its New Hampshire manufacturing facility. Beginning October 1, 2001, and every five years thereafter, including extensions, the annual base rent changes based on the Consumer Price Index. The Corporation has an option to extend the lease for an additional five-year period and has a right of first opportunity to purchase the leased property. Any leasehold improvements are depreciated over the shorter of the useful asset life or the minimum lease period. Additionally, the Corporation has entered into capital leases for various machinery and equipment.
Property and equipment and related accumulated amortization for building and equipment under capital leases are as follows:
|
January 1,
|
January 2,
|
|||||||
|
2011
|
2010
|
|||||||
|
Buildings and improvements
|
$ | 4,991 | $ | 4,991 | ||||
|
Machinery and equipment
|
920 | 1,699 | ||||||
| 5,911 | 6,690 | |||||||
|
Less accumulated amortization
|
(4,045 | ) | (3,859 | ) | ||||
| $ | 1,866 | $ | 2,831 | |||||
Amortization of leased assets is included in depreciation expense.
Future minimum payments for capital leases are as follows at January 1, 2011:
|
2011
|
$ | 931 | ||
|
2012
|
931 | |||
|
2013
|
878 | |||
|
2014
|
798 | |||
|
2015
|
798 | |||
|
Thereafter
|
598 | |||
|
Total minimum payments
|
4,934 | |||
|
Amounts representing interest
|
(2,062 | ) | ||
|
Present value of net minimum lease payments (including total current portion of $454)
|
$ | 2,872 |
50
10. Income Taxes
Income before income taxes consisted of:
|
Fiscal Year Ended
|
||||||||||||
|
January 1,
|
January 2,
|
January 3,
|
||||||||||
|
2011
|
2010
|
2009
|
||||||||||
|
Domestic
|
$ | 17,899 | $ | 24,932 | $ | 33,039 | ||||||
|
Foreign
|
4,000 | 5,498 | (1,527 | ) | ||||||||
| $ | 21,899 | $ | 30,430 | $ | 31,512 | |||||||
Significant components of the Corporation's net deferred tax liabilities are as follows:
|
Fiscal Year Ended
|
||||||||
|
January 1,
|
January 2,
|
|||||||
|
2011
|
2010
|
|||||||
|
Deferred tax asset
|
||||||||
|
Compensation
|
$ | 1,567 | $ | 1,256 | ||||
|
Inventory
|
2,848 | 2,256 | ||||||
|
Loss carryforwards
|
5,945 | 6,906 | ||||||
|
Derivative agreements
|
- | 1,207 | ||||||
|
Other
|
2,670 | 4,366 | ||||||
| 13,030 | 15,991 | |||||||
|
Valuation allowance
|
(4,646 | ) | (4,581 | ) | ||||
|
Total defered tax asset
|
8,384 | 11,410 | ||||||
|
Deferred tax liability
|
||||||||
|
Intangibles
|
(11,501 | ) | (11,315 | ) | ||||
|
Property, plant and equipment
|
(9,978 | ) | (12,003 | ) | ||||
|
Total deferred tax liabilities
|
(21,479 | ) | (23,318 | ) | ||||
|
Deferred tax liabilities, net
|
$ | (13,095 | ) | $ | (11,908 | ) | ||
Significant components of the income tax provision are as follows:
|
Fiscal Year Ended
|
||||||||||||
|
January 1,
|
January 2,
|
January 3,
|
||||||||||
|
2011
|
2010
|
2009
|
||||||||||
|
Current:
|
||||||||||||
|
Federal
|
$ | 4,722 | $ | 216 | $ | 7,041 | ||||||
|
State
|
263 | 470 | 1,166 | |||||||||
|
Foreign
|
1,686 | 466 | 4,236 | |||||||||
| 6,671 | 1,152 | 12,443 | ||||||||||
|
Deferred
|
1,257 | 7,494 | (4,950 | ) | ||||||||
| $ | 7,928 | $ | 8,646 | $ | 7,493 | |||||||
51
The provision for income taxes differs from that computed at the Federal statutory rate of 35% for 2010, 2009 and 2008 as follows:
|
Fiscal Year Ended
|
||||||||||||
|
January 1,
|
January 2,
|
January 3,
|
||||||||||
|
2011
|
2010
|
2009
|
||||||||||
|
Tax at Federal statutory rate
|
$ | 7,666 | $ | 10,650 | $ | 11,029 | ||||||
|
State income taxes
|
666 | 607 | 1,616 | |||||||||
|
Foreign income taxes
|
(552 | ) | (2,527 | ) | 1,765 | |||||||
|
Qualified production activities deduction
|
(551 | ) | - | - | ||||||||
|
Research and development credits—current year
|
(315 | ) | (213 | ) | (290 | ) | ||||||
|
Valuation allowance
|
296 | 458 | 2,953 | |||||||||
|
Reserve for uncertain tax positions
|
202 | (242 | ) | 2,196 | ||||||||
|
Realization of loss in investment of foreign subsidiary, net of reserve
|
- | - | (11,952 | ) | ||||||||
|
Other
|
516 | (87 | ) | 176 | ||||||||
| $ | 7,928 | $ | 8,646 | $ | 7,493 | |||||||
At January 1, 2011, the Corporation had foreign net operating loss carryforwards of approximately $16,071 and an associated deferred tax asset of $4,500. The foreign carryforwards have no expiration date. However, due to the uncertainty of the realization of the full benefit of the foreign net operating loss carryforwards, the Corporation has established a valuation allowance of $4,646 against its net deferred tax asset. The Corporation has a U.S. federal tax net operating loss carryforward of $2,339 and an associated deferred tax asset of $933 which will expire beginning in 2029, if unused, and which may be subject to other limitations under IRS rules. The Corporation has various multistate income tax net operating loss carryforwards which have been recorded as a deferred tax asset of approximately $512. No
provision has been made for United States federal and state or foreign taxes that may result from future remittances of undistributed earnings of foreign subsidiaries because it is expected that such earnings will be reinvested in these foreign operations indefinitely. At January 1, 2011, we had an aggregate of $33,906 of unremitted earnings of foreign subsidiaries that have been or are intended to be permanently reinvested for continued use in foreign operations.
As of January 1, 2011, the total amount of unrecognized income tax benefits computed under ASC 740 was approximately $6,147, all of which, if recognized, would impact the effective income tax rate of the Corporation. As of January 1, 2011, the Corporation had recorded a total of $417 of accrued interest and penalties related to uncertain tax positions. The Corporation does not foresee possible changes in its reserves for uncertain income tax positions as reasonably possible during the next 12 months. The Corporation has classified this reserve as long-term tax payable in the consolidated balance sheets. During 2009, the Corporation settled its Internal Revenue Service (IRS) audit of tax years 2001 – 2007. As a result of the IRS audit conclusion, gross unrecognized tax benefits were reduced by
$2,646, and the consolidated statement of operations was benefited $604 through a reduction in income tax expense. As of January 1, 2011, the Corporation is subject to unexpired statutes of limitation for U.S. federal income taxes for the years 2008 – 2009. The Corporation is also subject to unexpired statutes of limitation for various states including most significantly Indiana, Michigan and New Hampshire generally for the years 2007– 2009.
A reconciliation of the beginning and ending amount of unrecognized tax benefits is as follows (in thousands):
|
Balance at December 29, 2007
|
$ | 1,610 | ||
|
Additions based on tax positions—current year
|
5,477 | |||
|
Additions for tax positions—prior years
|
1,608 | |||
|
Balance at January 3, 2009
|
$ | 8,695 | ||
|
Additions based on tax positions—current year
|
128 | |||
|
Additions for tax positions—prior years
|
- | |||
|
Settlements
|
(2,646 | ) | ||
|
Balance at January 2, 2010
|
$ | 6,177 | ||
|
Additions based on tax positions—current year
|
- | |||
|
Reductions for tax positions—prior years
|
(30 | ) | ||
|
Settlements
|
- | |||
|
Balance at January 1, 2011
|
$ | 6,147 |
52
11. Profit Sharing Plan
During fiscal 2010, the Corporation maintained a profit sharing plan, which qualifies for favorable tax treatment under Section 401(k) of the Internal Revenue Code. Contributions by the Corporation are based upon both discretionary and matching nondiscretionary amounts. The matching amounts represent a 50% match of employees' contributions, up to a maximum of $4 per participant per year. Expense recorded for the plans was $768, $1,330, and $1,607 for 2010, 2009 and 2008, respectively.
12. Stock-Based Compensation Plans
2003 Stock Option Plan. The 2003 Stock Option Plan provides for the grant of nonqualified stock options to the Corporation's directors, officers and employees and other persons who provide services to us. A total of 907,167 shares of common stock are reserved for issuance under this plan. Options for 786,979 shares of common stock have been granted, although there have been no grants of stock options since 2004. These options vested ratably over a four year period as of the end of each of our fiscal years following a grant. Options granted under the 2003 Stock Option Plan are generally not transferable by the optionee, and such options must be exercised within 30 days after the end of an optionee's status as an employee, director or consultant
(other than a termination by us for cause, as defined in the 2003 Stock Option Plan), within 180 days after such optionee's termination by death or disability, or within 90 days after such optionee's retirement, but in no event later than the expiration of the option term. All options were granted, as determined by its board of directors, at the fair market value of the Corporation's common stock on the date of grant. The term of all options granted under the 2003 Stock Option Plan may not exceed ten years.
A summary of stock option activity and weighted-average exercise prices for the periods indicated are as follows:
|
Number of
|
Weighted Average
|
Instrinsic
|
||||||||||
|
Options
|
Exercise Price
|
Value
|
||||||||||
|
Outstanding at January 3, 2009
|
256,825 | $ | 3.25 | $ | 1,295 | |||||||
|
Exercised
|
— | — | — | |||||||||
|
Cancelled
|
— | — | — | |||||||||
|
Outstanding at January 2, 2010
|
256,825 | $ | 3.25 | $ | 1,236 | |||||||
|
Exercised
|
(6,000 | ) | $ | 3.04 | — | |||||||
|
Cancelled
|
— | — | — | |||||||||
|
Outstanding at January 1, 2011
|
250,825 | $ | 3.25 | $ | 1,505 | |||||||
|
Weighted
|
Weighted
|
Number
|
Weighted
|
||||||||||||||||
|
Average
|
Average
|
Exercisable at
|
Average
|
||||||||||||||||
|
Number
|
Remaining
|
Exercise
|
January 1,
|
Exercise
|
|||||||||||||||
|
Range of Exercise
|
Outstanding
|
Life
|
Price
|
2011
|
Price
|
||||||||||||||
| $3.04 - 4.83 | 250,825 |
2.6 years
|
3.25 | 250,825 | 3.25 | ||||||||||||||
The 2004 Amended and Restated Equity Incentive Plan. The 2004 Amended and Restated Equity Incentive Plan as amended in 2009 ("The 2004 Incentive Plan") is designed to enable us to attract, retain and motivate our directors, officers, employees and consultants, and to further align their interests with those of the Corporation's stockholders, by providing for or increasing their ownership interests in our Company. The 2004 Incentive Plan provides for the issuance of stock options, stock appreciation rights ("SARs"), restricted stock, deferred stock, dividend equivalents, other stock-based awards and performance awards. Performance awards will be based on the achievement of one or more business or personal criteria or goals, as determined by the
compensation committee. During 2009, the 2004 Incentive Plan was amended to state that performance awards may be granted under the plan in a manner that results in their qualifying as performance-based compensation as determined by the compensation committee. The compensation committee shall not grant, in any one calendar year, to any one participant awards to purchase or acquire a number of shares of common stock in excess of 15% of the total number of shares authorized for issuance under the 2004 Incentive Plan.
An aggregate of 1,673,333 shares of our common stock are reserved for issuance under the 2004 Incentive Plan, subject to certain adjustments reflecting changes in the Corporation's capitalization. Restricted stock is a grant of shares of common stock that may not be sold or disposed of, and that may be forfeited in the event of certain terminations of employment, prior to the end of a restricted period set by the compensation committee. A participant granted restricted stock generally has all of the rights of a shareholder, unless the compensation committee determines otherwise. During 2010, the Corporation awarded 65,667 shares of performance based restricted stock to employees.
During 2009, the Corporation awarded 117,025 shares of performance based restricted stock to employees. Additionally, 5,000 shares of non-performance based restricted stock was granted to one employee during 2009 that will vest on December 31, 2011. The Corporation also granted 51,800 shares of non-performance based restricted stock to directors that vest over three years with one-third vesting on December 31 of each year.
53
In 2008, the Corporation granted 314,150 shares of performance based restricted stock to employees. Previously recognized compensation expense related to these awards was $1,019 for 2008. In 2009, the Corporation determined that the performance based restricted stock targets would not be met for certain 2008 awards, and as such, extended the remaining vesting period to 7 years for the stock compensation expense associated with these awards. The Corporation also granted 88,000 shares of non-performance based restricted stock to directors during 2008 that vest over three years with one-third vesting on December 31 of each year.
In 2010, 2009 and 2008, the Corporation recorded compensation expense of $1,197, $2,765, and $2,873, respectively, related to restricted stock grants. The Corporation's policy is to recognize expense for awards subject to graded vesting using the straight-line attribution method. As of January 1, 2011, the Corporation had unearned compensation cost of $3,082 which will be expensed through 2015.
A summary of all restricted stock activity for the period indicated below is as follows:
|
Weighted-Average
|
||||||||
|
Grant Date Fair
|
||||||||
|
Number of Shares
|
Value
|
|||||||
|
Outstanding at January 3, 2009
|
514,400 | $ | 13.61 | |||||
|
Granted
|
56,800 | 8.12 | ||||||
|
Vested
|
(131,500 | ) | 14.28 | |||||
|
Cancelled
|
(42,433 | ) | 15.77 | |||||
|
Outstanding at January 2, 2010
|
397,267 | $ | 13.18 | |||||
|
Granted
|
117,025 | 9.60 | ||||||
|
Vested
|
(37,002 | ) | 10.14 | |||||
|
Cancelled
|
(30,125 | ) | 13.05 | |||||
|
Outstanding at January 1, 2011
|
447,165 | $ | 11.61 | |||||
The total fair value of restricted stock that vested during 2010, 2009 and 2008 was $342, $1,097, and $765, respectively.
13. Employee Stock Purchase Plan
2004 Employee Stock Purchase Plan. The 2004 Employee Stock Purchase Plan is designed to provide an incentive for our domestic employees to purchase our common stock and acquire a proprietary interest in the Corporation. Persons who subsequently are employed by us or one of our designated subsidiaries are eligible once they have completed three months of service and are an employee as of an offering date of an exercise period, provided they are expected on a regularly-scheduled basis to work more than 30 hours per week for more than ten months per calendar year.
Each participant is granted an option to purchase shares of the Corporation's common stock at the beginning of each 6-month "offering period" under the plan, on each "exercise date," during the offering period. Exercise dates occur on the last date on which the NYSE is open for trading prior to each June 30 and December 31. Participants purchase the shares of the Corporation's common stock through after-tax payroll deductions, not to exceed 10% of the participant's total base salary on each payroll date. No participant may purchase more than 750 shares of common stock on any one exercise date or more than $25 of common stock in any one calendar year. The purchase price for each share is 95% of the fair market value of such share on the exercise date. If a participant's employment with the Corporation or one of its
designated subsidiaries terminates, any outstanding option of that participant also will terminate.
A total of 600,000 shares of the Corporation's common stock are reserved for issuance over the term of the plan. On December 31, 2010, 9,824 shares of the Corporation’s common stock were purchased by the participants in the plan at a price of $8.79 per share. On June 30, 2010, 8,063 shares of the Corporation's common stock were purchased by the participants in the plan at a price of $10.01 per share. On December 31, 2009, 12,332 shares of the Corporation's common stock were purchased by the participants in the plan at a price of $7.66 per share. On June 30, 2009, 11,986 shares of the Corporation's common stock were purchased by the participants in the plan at a price of $8.85 per share. This plan is non-compensatory.
UK Share Incentive Plan 2006. The UK Share Incentive Plan 2006 is designed to provide an incentive for our employees in the United Kingdom to purchase our common stock and acquire a proprietary interest in the Corporation. Each person who was employed by the Corporation's designated subsidiaries are eligible if they have completed six months of service and remain permanent employees during the entire qualifying period.
54
Each qualifying employee is eligible to purchase shares of the Corporation's common stock through payroll deductions, not to exceed 10% of the participant's total base salary. No participant may purchase more than £1.5 of common stock in any one tax year (ending April 5). Payroll deductions are transferred to the plan trustee at the end of each month, and the trustee purchases shares based on the average market price on the award date. When the participant accumulates 20 shares of common stock under the plan, one matching share is awarded to the participant. Matching shares become vested after a three year holding period.
A total of 300,000 shares of the Corporation's common stock are reserved for issuance over the term of the plan. No shares have been issued under this plan.
15. Segment Reporting
The Corporation primarily designs, develops and manufactures implants and related surgical instruments and cases for orthopedic device companies and companies in other medical device markets such as arthroscopy, dental, laparoscopy, osteobiologic and endoscopy. The Corporation also sells products to the aerospace industry. The Corporation manages its business in multiple operating segments. Because of the similar economic characteristics of these operations, including the nature of the products, comparable level of FDA regulations, and same or similar customers, those operations have been aggregated for segment reporting purposes. The results of one segment which sells exclusively to aerospace customers has not been disclosed separately as it does not meet the quantitative disclosure requirements.
The Corporation is a multi-national company with operations in the United States, United Kingdom, France, Ireland and Malaysia. As a result, the Corporation's financial results can be impacted by currency exchange rates in the foreign markets in which the Corporation sells its products. Revenues are attributed to geographic locations based on the location to which we ship our products.
Revenues to External Customers:
|
Fiscal Year Ended
|
||||||||||||
|
2010
|
2009
|
2008
|
||||||||||
|
United States
|
$ | 267,808 | $ | 268,164 | $ | 302,820 | ||||||
|
Ireland
|
31,748 | 37,542 | 31,943 | |||||||||
|
United Kingdom
|
27,894 | 29,146 | 54,954 | |||||||||
|
Other foreign countries
|
33,380 | 31,091 | 33,689 | |||||||||
|
Total net revenues
|
$ | 360,830 | $ | 365,943 | $ | 423,406 | ||||||
Long-Lived Assets:
|
Fiscal Year Ended
|
||||||||||||
|
2010
|
2009
|
2008
|
||||||||||
|
United States
|
$ | 71,942 | $ | 76,660 | $ | 83,090 | ||||||
|
United Kingdom
|
27,449 | 32,366 | 29,401 | |||||||||
|
Ireland
|
2,537 | 1,204 | 872 | |||||||||
|
Other foreign countries
|
5,951 | 3,139 | 1,682 | |||||||||
|
Total long-lived assets
|
$ | 107,879 | $ | 113,369 | $ | 115,045 | ||||||
Concentration of Credit Risk:
Financial instruments that potentially subject the Corporation to concentration of credit risk consist principally of accounts receivable. A significant portion of the Corporation's sales are derived from our top ten customers, all in the orthopedic device market, and, as such, the Corporation is directly affected by the condition of those customers and that industry. However, the credit risk associated with the trade receivables is partially mitigated due to the stability of those customers. The Corporation performs ongoing credit evaluations of its customers.
A substantial portion of the Corporation's net revenues is derived from a limited number of customers. Net revenue from customers of the Corporation which individually account for 10% or more of the Corporation's net revenue is as follows:
2010 — three customers represented approximately 32%, 10% and 10% of net revenues, respectively.
2009 — one customer represented approximately 39% of net revenues.
2008 — two customers represented approximately 33% and 11% of net revenues, respectively.
The customers listed above, which are orthopedic implant manufacturers, comprised approximately 41%, 32% and 39% of the accounts receivable balance at January 1, 2011, January 2, 2010, and January 3, 2009, respectively.
55
Following is a summary of the composition by product category of the Corporation's net revenues to external customers. Revenues from aerospace products are included in the "other" category.
|
Fiscal Year Ended
|
||||||||||||
|
2010
|
2009
|
2008
|
||||||||||
|
Instruments
|
$ | 145,409 | $ | 166,678 | $ | 177,486 | ||||||
|
Implants
|
111,253 | 108,048 | 122,560 | |||||||||
|
Cases
|
81,744 | 68,534 | 86,449 | |||||||||
|
Other
|
22,424 | 22,683 | 36,911 | |||||||||
|
Total net revenues
|
$ | 360,830 | $ | 365,943 | $ | 423,406 | ||||||
16. Net Income (Loss) per Share
The following table sets forth the computation of earnings per share.
|
Fiscal Year Ended
|
||||||||||||
|
2010
|
2009
|
2008
|
||||||||||
|
Earnings per share - Basic:
|
||||||||||||
|
Net income
|
$ | 13,971 | $ | 21,784 | $ | 24,019 | ||||||
|
Less: Undistributed earnings allocated to nonvested stock
|
(128 | ) | (218 | ) | (316 | ) | ||||||
|
Income available to common shares - Basic
|
13,843 | 21,566 | 23,703 | |||||||||
|
Weighted-average common shares outstanding - Basic
|
35,451 | 35,308 | 35,170 | |||||||||
|
Earnings per share - Basic
|
$ | 0.39 | $ | 0.61 | $ | 0.67 | ||||||
|
Earnings per share - Diluted:
|
||||||||||||
|
Net income
|
$ | 13,971 | $ | 21,784 | $ | 24,019 | ||||||
|
Less: Undistributed earnings allocated to nonvested stock
|
- | (144 | ) | (190 | ) | |||||||
|
Income available to common shares - Diluted
|
13,971 | 21,640 | 23,829 | |||||||||
|
Weighted-average common shares outstanding - Basic
|
35,451 | 35,308 | 35,170 | |||||||||
|
Effect of dilution
|
359 | 222 | 187 | |||||||||
|
Weighted-average common shares outstanding - Diluted
|
35,810 | 35,530 | 35,357 | |||||||||
|
Earnings per share - Diluted
|
$ | 0.39 | $ | 0.61 | $ | 0.67 | ||||||
As of January 1, 2011 and January 2, 2010, the diluted weighted average share calculations do not include performance based restricted stock awarded March 31, 2010 totaling 65,667 shares and July 1, 2009, totaling 119,925 shares, respectively, due to the respective measurement period not being complete.
17. Facility Consolidation and Severance Costs
Results of Operations for fiscal 2010 and 2009 include net charges of $961 and $2,822 associated with employee cost reduction and efficiency actions and the consolidation of our Whitman, MA and Auburn, ME facilities into other facilities that produce similar products. In fiscal 2010, these costs are comprised of $628 of severance costs and an additional $333 of asset impairment and moving expenses. In fiscal 2009, these charges were comprised of $1,363 of severance costs and an additional $1,459 of asset impairment and moving expenses. As of January 1, 2011, all charges had been paid. As of January 2, 2010, severance accruals related to these cost reduction and efficiency actions totaled $836, and are included in accrued and other liabilities in the consolidated balance sheets.
18. Commitments and Contingencies
Operating Leases. The Corporation has various operating leases, primarily for equipment and vehicles. Total rental expense for these operating leases amounted to $1,931, $2,538, and $2,357 in 2010, 2009 and 2008, respectively. At January 1, 2011, future minimum payments for operating leases with initial terms of one year or more are as follows: $1,750 in 2011; $1,161 in 2012; $752 in 2013; $355 in 2014; $303 in 2015 and $713 thereafter.
56
Unconditional Purchase Obligations. The Corporation has contracts to purchase minimum quantities of plastic, cobalt chrome and titanium through December 2012. Based on contractual pricing at January 1, 2011, the minimum purchase obligations total $18,158. Purchases under plastic, titanium and cobalt chrome contracts were approximately $19,431 in 2010. These purchases are not in excess of our forecasted requirements. Additionally, as of January 1, 2011, the Corporation has $2,127 of commitments to complete capital projects in progress.
Legal & Environmental Matters. The Corporation is involved, from time to time, in various contractual, product liability, patent (or intellectual property) and other claims and disputes incidental to its business. Currently, there is no environmental or other litigation pending or, to the knowledge of the Corporation, threatened, that the Corporation expects to have a material adverse effect on its financial condition, results of operations or liquidity. While litigation is subject to uncertainties and the outcome of litigated matters is not predictable with assurance, the Corporation currently believes that the disposition of all pending or, to the knowledge of the Corporation, threatened claims and disputes, individually or in the aggregate,
should not have a material adverse effect on the Corporation's consolidated and combined financial condition, results of operations or liquidity.
Following the discovery of certain accounting irregularities at our Sheffield, UK operating unit, the Audit Committee self-reported the matter to the staff of the Securities and Exchange Commission (SEC) in October 2007. Thereafter, the SEC commenced an informal inquiry into this matter. The Corporation has fully cooperated with the SEC in its investigation. At this time, the Corporation is unable to predict the timing of the ultimate resolution of this investigation or the impact thereof.
19. Quarterly Results of Operations (Unaudited)
The Corporation's fiscal year end is the 52 or 53 week period ending the Saturday closest to December 31. Fiscal 2010 and 2009 were 52 week years. The following quarterly results of operations refer to these financial periods (in thousands, except per share data):
|
Fiscal Year 2010
|
||||||||||||||||||||
|
First
Quarter
|
Second
Quarter
|
Third
Quarter
|
Fourth
Quarter
|
Fiscal
Year
|
||||||||||||||||
|
(in thousands except per share data)
|
||||||||||||||||||||
|
Revenue
|
$ | 84,494 | $ | 88,824 | $ | 91,538 | $ | 95,974 | $ | 360,830 | ||||||||||
|
Gross profit
|
17,036 | 20,363 | 19,830 | 22,469 | 79,698 | |||||||||||||||
|
Net income
|
1,631 | 4,479 | 3,572 | 4,289 | 13,971 | |||||||||||||||
|
Earnings per share:
|
||||||||||||||||||||
|
Basic
|
$ | 0.05 | $ | 0.13 | $ | 0.10 | $ | 0.12 | $ | 0.39 | ||||||||||
|
Diluted
|
$ | 0.05 | $ | 0.13 | $ | 0.10 | $ | 0.12 | $ | 0.39 | ||||||||||
|
Fiscal Year 2009
|
||||||||||||||||||||
|
|
First
Quarter
|
Second
Quarter
|
Third
Quarter
|
Fourth
Quarter
|
Fiscal
Year
|
|||||||||||||||
|
|
(In Thousands Except per Share Data)
|
|||||||||||||||||||
|
Revenue
|
$ | 101,422 | $ | 100,954 | $ | 87,164 | $ | 76,403 | $ | 365,943 | ||||||||||
|
Gross profit
|
24,558 | 26,771 | 21,722 | 13,966 | 87,017 | |||||||||||||||
|
Net income
|
6,847 | 8,975 | 5,408 | 554 | 21,784 | |||||||||||||||
|
Earnings per share:
|
||||||||||||||||||||
|
Basic
|
$ | 0.19 | $ | 0.25 | $ | 0.15 | $ | 0.02 | $ | 0.61 | ||||||||||
|
Diluted
|
$ | 0.19 | $ | 0.25 | $ | 0.15 | $ | 0.02 | $ | 0.61 | ||||||||||
The sum of the quarters may not equal the year to date amounts due to rounding.
57
20. Comprehensive Income
Comprehensive income is comprised of net income (loss), gains (losses) resulting from currency translations of foreign entities and unrealized losses on our derivative designated as a hedge. Comprehensive income consists of the following:
|
Foreign currency
translation
|
Unrealized
gains (losses)
on derivatives,
net of taxes (1)
|
Other
comprehensive
income (loss)
|
||||||||||
|
Balance at December 29, 2007
|
$ | 10,435 | $ | - | $ | 10,435 | ||||||
|
Other comprehensive income / (loss)
|
(12,408 | ) | - | (12,408 | ) | |||||||
|
Balance at January 3, 2009
|
(1,973 | ) | - | (1,973 | ) | |||||||
|
Other comprehensive income / (loss)
|
6,217 | (231 | ) | 5,986 | ||||||||
|
Balance at January 2, 2010
|
4,244 | (231 | ) | 4,013 | ||||||||
|
Other comprehensive income / (loss)
|
(1,719 | ) | 231 | (1,488 | ) | |||||||
|
Balance at January 1, 2011
|
$ | 2,525 | - | $ | 2,525 | |||||||
(1)Unrealized gains (losses) are net of tax benefits (expenses) of $154 in fiscal 2009 and ($154) in fiscal 2010.
On October 5, 2008, management designated $37,200 of intercompany loans to its Sheffield, UK subsidiary as a permanent investment. Accordingly, beginning October 5, 2008, gains and losses associated with this permanent investment were charged to accumulated other comprehensive income (loss) on the consolidated balance sheets. As of January 1, 2011 and January 2, 2010, accumulated losses of $1,426 and gains of $3,636, respectively, have been recorded related to these permanent investments.
58
Report of Independent Registered Public Accounting Firm
The Board of Directors and Shareholders of Symmetry Medical Inc.:
We have audited the accompanying consolidated balance sheets of Symmetry Medical Inc. as of January 1, 2011 and January 2, 2010, and the related consolidated statements of operations, shareholders' equity and cash flows for each of the three years in the period ended January 1, 2011. These financial statements are the responsibility of the Corporation's management. Our responsibility is to express an opinion on these financial statements based on our audits.
We conducted our audits in accordance with the standards of the Public Company Accounting Oversight Board (United States). Those standards require that we plan and perform the audit to obtain reasonable assurance about whether the financial statements are free of material misstatement. An audit includes examining, on a test basis, evidence supporting the amounts and disclosures in the financial statements. An audit also includes assessing the accounting principles used and significant estimates made by management, as well as evaluating the overall financial statement presentation. We believe that our audits provide a reasonable basis for our opinion.
In our opinion, the financial statements referred to above present fairly, in all material respects, the consolidated financial position of Symmetry Medical Inc. at January 1, 2011 and January 2, 2010, and the consolidated results of its operations and its cash flows for each of the three years in the period ended January 1, 2011, in conformity with US generally accepted accounting principles.
We also have audited, in accordance with the standards of the Public Company Accounting Oversight Board (United States), Symmetry Medical Inc.'s internal control over financial reporting as of January 1, 2011, based on criteria established in Internal Control—Integrated Framework issued by the Committee of Sponsoring Organizations of the Treadway Commission and our report dated March 7, 2011, expressed an unqualified opinion thereon.
|
/s/ Ernst & Young LLP
|
Indianapolis, Indiana
March 7, 2011
59
MANAGEMENT'S REPORT ON INTERNAL CONTROL OVER FINANCIAL REPORTING
The management of Symmetry Medical Inc. (the Corporation) is responsible for establishing and maintaining adequate internal control over financial reporting. The Corporation's internal control over financial reporting is a process designed to provide reasonable assurance regarding the reliability of financial reporting and the preparation of financial statements for external purposes in accordance with U.S. generally accepted accounting principles. Internal control over financial reporting includes those policies and procedures that (1) pertain to the maintenance of records that, in reasonable detail, accurately and fairly reflect the transactions and dispositions of the assets of the Corporation; (2) provide reasonable assurance that transactions are recorded as necessary to permit preparation of the financial
statements in accordance with U.S. generally accepted accounting principles, and that receipts and expenditures of the Corporation are being made only in accordance with authorizations of management and directors of the Corporation; and (3) provide reasonable assurance regarding prevention or timely detection of unauthorized acquisition, use or disposition of the Corporation's assets that could have a material effect on the financial statements.
Because of its inherent limitations, internal control over financial reporting may not prevent or detect misstatements. Also, projections of any evaluation of effectiveness to future periods are subject to risk that controls may become inadequate because of changes in conditions, or that the degree of compliance with the policies and procedures may deteriorate.
Management assessed the effectiveness of the Corporation's internal control over financial reporting as of January 1, 2011, based on criteria for effective internal control over financial reporting described in Internal Control — Integrated Framework issued by the Committee of Sponsoring Organizations of the Treadway Commission (COSO). Based on this assessment, we have concluded that internal control over financial reporting is effective as of January 1, 2011.
Ernst and Young, LLP the independent registered public accounting firm that audited the consolidated financial statements included in this Annual Report, have also issued an attestation report on the effectiveness of internal control over financial reporting which appears on the following page.
|
|
|
|
|
/s/ Thomas J. Sullivan
|
|
|
|
|
||
|
Thomas J. Sullivan
|
||
|
Chief Executive Officer
|
||
|
|
|
|
|
/s/ Fred L. Hite
|
|
|
|
|
||
|
Fred L. Hite
|
||
|
Chief Financial Officer
|
March 7, 2011
60
Report of Independent Registered Public Accounting Firm
The Board of Directors and Shareholders of Symmetry Medical Inc.
We have audited Symmetry Medical Inc.'s internal control over financial reporting as of January 1, 2011, based on criteria established in Internal Control—Integrated Framework issued by the Committee of Sponsoring Organizations of the Treadway Commission (the COSO criteria). Symmetry Medical Inc.'s management is responsible for maintaining effective internal control over financial reporting, and for its assessment of the effectiveness of internal control over financial reporting included in the accompanying Management's Report on Internal Control Over Financial Reporting. Our responsibility is to express an opinion on the company's internal control over financial reporting based on our audit.
We conducted our audit in accordance with the standards of the Public Company Accounting Oversight Board (United States). Those standards require that we plan and perform the audit to obtain reasonable assurance about whether effective internal control over financial reporting was maintained in all material respects. Our audit included obtaining an understanding of internal control over financial reporting, assessing the risk that a material weakness exists, testing and evaluating the design and operating effectiveness of internal control based on the assessed risk, and performing such other procedures as we considered necessary in the circumstances. We believe that our audit provides a reasonable basis for our opinion.
A company's internal control over financial reporting is a process designed to provide reasonable assurance regarding the reliability of financial reporting and the preparation of financial statements for external purposes in accordance with generally accepted accounting principles. A company's internal control over financial reporting includes those policies and procedures that (1) pertain to the maintenance of records that, in reasonable detail, accurately and fairly reflect the transactions and dispositions of the assets of the company; (2) provide reasonable assurance that transactions are recorded as necessary to permit preparation of financial statements in accordance with generally accepted accounting principles, and that receipts and expenditures of
the company are being made only in accordance with authorizations of management and directors of the company; and (3) provide reasonable assurance regarding prevention or timely detection of unauthorized acquisition, use, or disposition of the company's assets that could have a material effect on the financial statements.
Because of its inherent limitations, internal control over financial reporting may not prevent or detect misstatements. Also, projections of any evaluation of effectiveness to future periods are subject to the risk that controls may become inadequate because of changes in conditions, or that the degree of compliance with the policies or procedures may deteriorate.
In our opinion, Symmetry Medical, Inc. maintained, in all material respects, effective internal control over financial reporting as of January 1, 2011, based on the COSO criteria.
We also have audited, in accordance with the standards of Public Company Accounting Oversight Board (United States), the consolidated balance sheets of Symmetry Medical, Inc. as of January 1, 2011 and January 2, 2010, and the related consolidated statements of operations, shareholders’ equity and cash flows for each of the three years in the period ended January 1, 2011 of Symmetry Medical, Inc. and our report dated March 7, 2011 expressed an unqualified opinion thereon.
|
/s/ Ernst and Young LLP
|
Indianapolis, Indiana
March 7, 2011
61
Item 9. Changes in and Disagreements With Accountants on Accounting and Financial Disclosure
None.
Item 9A. Controls and Procedures
Evaluation of Disclosure Controls and Procedures. In accordance with Rule 13a-15(b) of the Securities Exchange Act of 1934 (the "Exchange Act"), as of the end of the period covered by this Annual Report on Form 10-K, the Corporation's management evaluated, with the participation of the Corporation's Chief Executive Officer and Senior Vice President and Chief Financial Officer, the effectiveness of the design and operation of the Company's disclosure controls and procedures (as defined in Rule 13a-15(e) under the Exchange Act). Based upon their evaluation of these disclosure controls and procedures, the Chief Executive Officer and Senior Vice President and Chief Financial Officer have concluded that the disclosure controls and procedures were
effective as of the end of the period covered by this Annual Report on Form 10-K to ensure that information required to be disclosed by the Company in the reports it files or submits under the Exchange Act is recorded, processed, summarized and reported, within the time period specified in the Securities and Exchange Commission rules and forms, and to ensure that information required to be disclosed by the Company in the reports it files or submits under the Exchange Act is accumulated and communicated to the Company's management, including its Chief Executive Officer and Senior Vice President and Chief Financial Officer, as appropriate, to allow timely decisions regarding disclosure.
Changes in Internal Controls. There were no changes in the Corporation's internal control over financial reporting that occurred during the quarter ended January 1, 2011 that have materially affected, or are reasonably likely to materially affect, the Corporation's internal control over financial reporting.
Management's Report on Internal Control Over Financial Reporting. The report of management required under this Item 9A can be found on page 60 of this Form 10-K under the heading "Management's Report on Internal Control over Financial Reporting."
Symmetry Medical’s independent registered public accounting firm, Ernst & Young LLP, has issued an attestation report on the effectiveness of the Corporation’s internal control over financial reporting. This report appears on page 61 of this Form 10-K under the heading “Report of Independent Registered Public Accounting Firm.”
Item 9B. Other Information
None.
62
PART III
Item 10. Directors, Executive Officers and Corporate Governance
The information required to be furnished pursuant to Item 10 with respect to directors and corporate governance is incorporated herein by reference from the sections entitled "Governance of the Corporation" and "Information on Directors and Executive Officers" in our Proxy Statement for the 2011 Annual Meeting of Shareholders which we will file with the Securities and Exchange Commission no later than 120 days after the end of our fiscal year.
Item 11. Executive Compensation
The information required to be furnished pursuant to Item 11 is incorporated herein by reference from the sections entitled "Executive Compensation" and "Compensation Discussion and Analysis" in our Proxy Statement for the 2011 Annual Meeting of Shareholders which we will file with the Securities and Exchange Commission no later than 120 days after the end of our fiscal year.
Item 12. Security Ownership of Certain Beneficial Owners and Management and Related Stockholder Matters
The information required to be furnished pursuant to Item 12 is incorporated herein by reference from the sections entitled "Stock Ownership of Directors and Executive Officers" and "Stock Ownership of Certain Beneficial Owners" in our Proxy Statement for the 2011 Annual Meeting of Shareholders which we will file with the Securities and Exchange Commission no later than 120 days after the end of our fiscal year.
Item 13. Certain Relationships and Related Transactions and Director Independence
The information required to be furnished pursuant to Item 13 is incorporated herein by reference from the sections entitled "Governance of the Corporation" and "Related Party Transactions" in our Proxy Statement for the 2011 Annual Meeting of Shareholders which we will file with the Securities and Exchange Commission no later than 120 days after the end of our fiscal year.
Item 14. Principal Accounting Fees and Services
The information required to be furnished pursuant to Item 14 is incorporated herein by reference from the section entitled "Audit and Non-Audit Fees" in our Proxy Statement for the 2011 Annual Meeting of Shareholders which we will file with the Securities and Exchange Commission no later than 120 days after the end of our fiscal year.
63
PART IV
Item 15. Exhibits, Financial Statement Schedules
(a) See Part III, Item 8 for an index of the Corporation's consolidated financial statements.
(b) Exhibits:
|
|
|
|
|
3.1
|
Amended and Restated Certificate of Incorporation of Symmetry Medical Inc. (incorporated by reference to Exhibit 3.2 of Amendment No. 3 to our Registration Statement, on Form S-1/A, filed July 22, 2004).
|
|
|
3.2
|
Amended and Restated Bylaws of Symmetry Medical Inc., as amended through March 24, 2005 (incorporated by reference to Exhibit 3.2 from our 2004 Annual Report on Form 10-K, filed March 25, 2005).
|
|
|
4.1
|
Form of Common Stock certificate (incorporated by reference to Exhibit 4.1 of Amendment No. 3 to our Registration Statement, on Form S-1/A, filed July 22, 2004).
|
|
|
10.8†
|
Symmetry Medical Inc. 2002 Stock Option Plan (incorporated by reference to Exhibit 10.10 of our Registration Statement on Form S-1, filed May 28, 2004).
|
|
|
10.9†
|
Form of Nonqualified Stock Option Agreement issued under 2002 Stock Option Plan (incorporated by reference to Exhibit 10.11 of our Registration Statement on Form S-1, filed May 28, 2004).
|
|
|
10.10†
|
Symmetry Medical Inc. 2003 Stock Option Plan (incorporated by reference to Exhibit 10.12 of our Registration Statement on Form S-1, filed May 28, 2004).
|
|
|
10.11†
|
Form of Nonqualified Stock Option Agreement issued under 2003 Stock Option Plan (incorporated by reference to Exhibit 10.13 of our Registration Statement on Form S-1, filed May 28, 2004).
|
|
|
10.12†
|
Symmetry Medical Inc. Amended and Restated 2004 Equity Incentive Plan (incorporated by reference to Exhibit 10.12 from our 2004 Annual Report on Form 10-K, filed March 25, 2005).
|
|
|
10.13†
|
Symmetry Medical Inc. Amended and Restated 2004 Employee Stock Purchase Plan (incorporated by reference to Exhibit 10.13 from our 2004 Annual Report on Form 10-K, filed March 25, 2005).
|
|
|
10.14†
|
Amendment to Symmetry Medical Inc. 2004 Employee Stock Purchase Plan (incorporated by reference to Exhibit 10.14 from our 2004 Annual Report on Form 10-K, filed March 25, 2005).
|
|
|
10.15†
|
Employment Agreement, dated as of June 11, 2003, by and between Symmetry Medical Inc. and Brian S. Moore (incorporated by reference to Exhibit 10.16 of our Registration Statement on Form S-1, filed May 28, 2004).
|
|
|
10.16†
|
Employment Agreement, dated as of January 6, 2004, by and between Symmetry Medical Inc. and Fred L. Hite (incorporated by reference to Exhibit 10.17 of Amendment No. 4 to our Registration Statement, on Form S-1/A, filed July 30, 2004).
|
|
|
10.18†
|
Form of Restricted Stock Agreement issued under the 2004 Equity Incentive Plan (incorporated by reference to Exhibit 10.1 to our Form 8-K filed May 4, 2005).
|
|
|
10.19†
|
Form of Restricted Stock Agreement issued under the Amended and Restated 2004 Equity Incentive Plan (incorporated by reference to Exhibit 10.1(a) to our Form 8-K filed February 15, 2006).
|
|
|
10.20†
|
Form of Restricted Stock Agreement issued under the Amended and Restated 2004 Equity Incentive Plan (incorporated by reference to Exhibit 10.1(b) to our Form 8-K filed February 15, 2006).
|
|
|
10.23
|
Amended and Restated Credit Agreement, dated June 13, 2006, among Symmetry Medical Inc. as borrower, Wachovia Bank, National Association as Administrative Agent, the lenders identified on the signature pages thereto, General Electric Capital Corporation as Syndication Agent and CIT Lending Services Corporation and Charter One Bank, N.A. as Documentation Agents (incorporated by reference to Exhibit 10.1 to our Form 8-K filed June 14, 2006).
|
|
|
10.27†
|
Form of Restricted Stock Agreement (Non-Employee Directors) (incorporated by reference to Exhibit 10.1 to our Form 8-K filed February 15, 2007).
|
|
|
10.30†
|
Form of Restricted Stock Agreement (Key Employees) issued under the 2004 Equity Incentive Plan (incorporated by reference to Exhibit 10.1 to our Form 8-K filed May 8, 2007).
|
|
|
10.37
|
Asset Purchase Agreement, dated December 14, 2007, between Symmetry Medical New Bedford, LLC, Symmetry New Bedford Real Estate, LLC, and DePuy Orthopaedics, Inc. (incorporated by reference to Exhibit 10.2 to our Form 8-K filed December 17, 2007).
|
|
|
10.40†
|
Form of Restricted Stock Agreement (Key Employees) (incorporated by reference to Exhibit 10.1 to our Form 8-K filed May 30, 2008).
|
|
|
10.41†
|
Form of Restricted Stock Agreement (Non-Employee Directors) (incorporated by reference to Exhibit 10.2 to our Form 8-K filed May 30, 2008).
|
|
|
10.42†
|
Form of Restricted Stock Agreement (Key Employees) issued under Amendment No. 1 to the Amended and Restated 2004 Equity Incentive Plan (incorporated by reference to Exhibit 10.42 to our Form 10-Q filed August 7, 2009).
|
|
|
10.44†
|
Symmetry Medical Inc. Amendment No. 1 to the Amended and Restated 2004 Equity Incentive Plan (incorporated by reference to our Form DEF 14A filed May 1, 2009.)
|
64
|
10.45†
|
Amended employment agreement, dated May 4, 2010, by and between Symmetry Medical Inc. and Brian S. Moore (incorporated by reference to Exhibit 10.45 to our Form 10-Q filed May 11, 2010).
|
|
|
10.46†
|
Severance Agreement, dated May 4, 2010, by and between Symmetry Medical Inc. and Fred Hite (incorporated by reference to Exhibit 10.45 to our Form 10-Q filed May 11, 2010).
|
|
|
10.47†
|
Severance Agreement, dated May 4, 2010, by and between Symmetry Medical Inc. and D. Darin Martin and Michael Curtis (incorporated by reference to Exhibit 10.45 to our Form 10-Q filed May 11, 2010).
|
|
|
10.48†
|
Form of Restricted Stock Agreement (CEO) issued under Amendment No. 1 to the Amended and Restated Equity Incentive Plan (incorporated by reference to Exhibit 10.45 to our Form 10-Q filed May 11, 2010).
|
|
|
10.49†
|
Form of Restricted Stock Agreement (Key Employees) issued under Amendment No. 1 to the Amended and Restated Equity Incentive Plan (incorporated by reference to Exhibit 10.45 to our Form 10-Q filed May 11, 2010).
|
|
|
10.50†
|
Compromise Agreement of Mr. Hynes (incorporated by reference to Exhibit 99.1 to our Form 8-K filed June 16, 2010).
|
|
|
10.51†
|
Second Amendment to Employment Agreement, dated as of June 10, 2010, by and between Symmetry Medical Inc. and Brian S. Moore (incorporated by reference to Exhibit 99.2 to our Form 8-K filed June 16, 2010).
|
|
|
10.52†
|
Limited Waiver to Amended and Restated Credit Agreement, executed August 4, 2010, among Symmetry Medical Inc., as Borrower and Wells Fargo Bank, National Association (as successor by merger to Wachovia Bank, National Association), as Administrative Agent for the Lenders (incorporated by reference to Exhibit 10.47 to our Form 10-Q filed August 6, 2010).
|
|
|
10.53†
|
Credit Agreement, dated November 3, 2010, among Symmetry Medical Inc. as borrower, JPMorgan Chase Bank, N.A. as Administrative Agent, the lenders identified on the signature pages thereto, Wells Fargo Bank, National Association as Syndication Agent and Fifth Third Bank, Bank of America, N.A. and PNC Bank National Association as Co-Documentation Agents (incorporated by reference to EX-99.1 to our Form 8-K filed November 9, 2010).
|
|
|
10.54†
|
Third Amendment to Employment Agreement with Mr. Moore, dated January 17, 2011 (incorporated by reference to Exhibit 10.1 to our Form 8-K filed January 19, 2011).
|
|
|
10.55†
|
Employment Agreement with Mr. Sullivan, dated January 17, 2011 (incorporated by reference to Exhibit 10.2 to our Form 8-K filed January 19, 2011).
|
|
|
10.56†
|
Executive Benefit Agreement with Mr. Sullivan, dated January 17, 2011 (incorporated by reference to Exhibit 10.3 to our Form 8-K filed January 19, 2011).
|
|
|
10.57†
|
Bonus Agreement with Mr. Hite, dated January 11, 2011 (incorporated by reference to Exhibit 10.4 to our Form 8-K filed January 19, 2011).
|
|
|
10.58†
|
Form Transition Retention Bonus Agreement with XXXX, dated XXXX (incorporated by reference to Exhibit 10.1 to our Form 8-K filed February 3, 2011).
|
|
|
10.59†
|
Form of Key Employee Restricted Stock Agreement with XXX, dated XXX (incorporated by reference to Exhibit 10.2 to our Form 8-K filed February 3, 2011).
|
|
|
21.1
|
List of Subsidiaries.*
|
|
|
23.1
|
Consent of Independent Registered Public Accounting Firm, Ernst & Young LLP.*
|
|
|
24.1
|
Power of Attorney.*
|
|
|
31.1
|
Certification of Chief Executive Officer required by Item 307 of Regulation S-K as promulgated by the Securities and Exchange Commission and pursuant to Section 302 of the Sarbanes-Oxley Act of 2002.*
|
|
|
31.2
|
Certification of Chief Financial Officer required by Item 307 of Regulation S-K as promulgated by the Securities and Exchange Commission and pursuant to Section 302 of the Sarbanes-Oxley Act of 2002.*
|
|
|
32.1
|
Certification of Chief Executive Officer and Chief Financial Officer pursuant to 18 U.S.C. Section 1350, as adopted pursuant to Section 906 of the Sarbanes-Oxley Act of 2002.*
|
† Indicates management contract or compensatory plans or arrangements required to be filed as an exhibit.
* Filed concurrently herewith.
65
SIGNATURES
Pursuant to the requirements of Section 13 or 15(d) of the Securities Exchange Act of 1934, the Registrant has duly caused this report to be signed on its behalf by the undersigned, thereunto duly authorized.
|
|
|
|
|
SYMMETRY MEDICAL INC.
|
||
|
|
By:
|
|
|
March 7, 2011
|
/s/ Thomas J. Sullivan
|
|
|
Thomas J. Sullivan
|
||
|
Chief Executive Officer and President
|
Pursuant to the requirements of the Securities Exchange Act of 1934, this report has been signed below by the following persons on behalf of the Registrant and in the capacities and on the date indicated.
|
|
|
|
||
|
Name
|
Title
|
Date
|
||
|
/s/ Thomas J. Sullivan
|
Chief Executive Officer, President and Director (Principal Executive Officer)
|
March 7, 2011
|
||
|
Thomas J. Sullivan
|
||||
|
/s/ Fred L. Hite
|
Senior Vice President,
|
March 7, 2011
|
||
|
Fred L. Hite
|
Chief Financial Officer and Secretary
|
|||
|
/s/ Ronda L. Harris
|
Chief Accounting Officer
|
March 7, 2011
|
||
|
Ronda L. Harris
|
||||
|
*
|
Director
|
March 7, 2011
|
||
|
Craig B. Reynolds
|
||||
|
*
|
Director
|
March 7, 2011
|
||
|
Francis T. Nusspickel
|
||||
|
*
|
Director
|
March 7, 2011
|
||
|
James S. Burns
|
||||
|
*
|
Director
|
March 7, 2011
|
||
|
John S. Krelle
|
||||
|
*
|
Director
|
March 7, 2011
|
||
|
Thomas E. Chorman
|
||||
|
*
|
Director
|
March 7, 2011
|
||
|
Robert G. Deuster
|
||||
|
*
|
||||
|
Brian S. Moore
|
Director
|
March 7, 2011
|
||
|
*
|
||||
|
*By:
|
|
|
||
|
/s/ Fred L. Hite
|
||||
|
Fred L. Hite
|
||||
|
Attorney-in-fact
|
||||
|
Pursuant to Power of Attorney
|
||||
|
(Exhibit 24.1 hereto)
|
66