Attached files
| file | filename |
|---|---|
| 8-K - FORM 8-K - SAFEWAY INC | d8k.htm |
| EX-99.1 - PRESS RELEASE - SAFEWAY INC | dex991.htm |
 Reconciliations and Financial Slides
from the Safeway Investor Conference
March 8, 2011
Exhibit 99.2 |
 2
This presentation may contain forward-looking statements. Such statements may
relate to topics such as sales, margins, earnings estimates, guidance, free
cash flow, cash flow available for return to shareholders / debt paydown,
capital spending, and other related subjects.
These statements are based on Safeway’s current plans and expectations and
are subject to risks and uncertainties that could cause actual events and
results to vary significantly from those implied by such statements.
We ask you to refer
to Safeway’s reports and filings with the SEC for a further discussion of
these risks and uncertainties.
Safe Harbor Language |
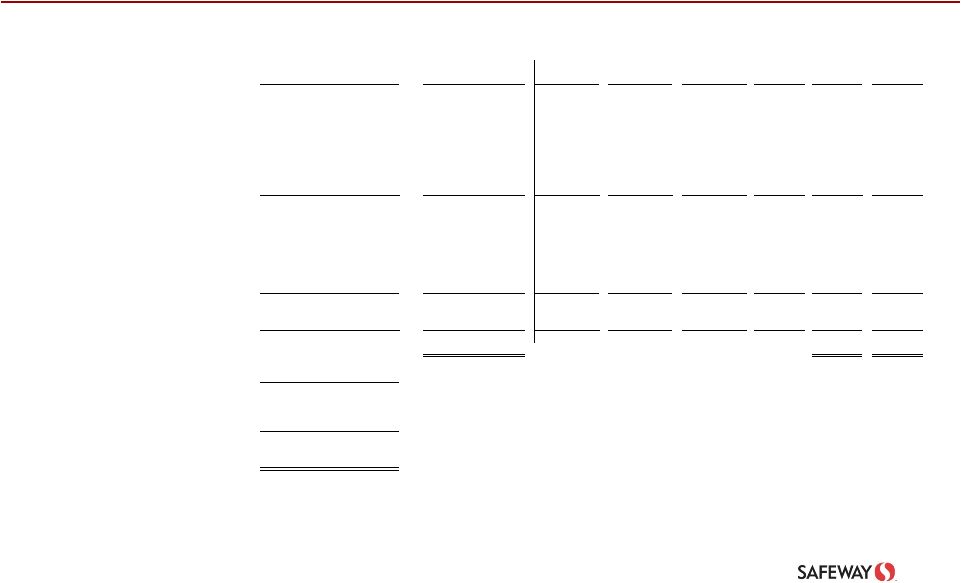
 3
Reconciliation of Diluted EPS
Low
High
Diluted earnings per share
$ 1.45
$ 1.65
Net interest expense
(0.01)
(0.01)
Share repurchase
(0.06)
(0.06)
Tax effect of Canadian dividend
0.22
0.22
Diluted earnings per share, before Canadian dividend
$ 1.60
$ 1.80
2011G |
 4
$ Millions
Reconciliation of GAAP Cash Flow
Measure to Free Cash Flow*
(1)
Without repatriation
Low
High
Low
High
2010
2009
2008
2007
2006
2005
Net cash flow from operating activities
1,850
$
1,950
$
1,950
$
2,050
$
1,850
$
2,549
$
2,251
$
2,190
$
2,175
$
1,881
$
Decrease (increase) in payables related to
third party gift cards, net of receivables
-
-
-
-
7
(170)
(24)
(84)
(71)
(48)
Interest earned on favorable income tax
settlement, net of tax
-
-
-
-
-
-
-
-
(63)
-
Net cash flow from operating activities,
as adjusted
1,850
1,950
1,950
2,050
1,857
2,379
2,227
2,106
2,041
1,833
Net cash flow used by investing activities
(1,000)
(1,000)
(1,050)
(950)
(799)
(889)
(1,546)
(1,686)
(1,735)
(1,314)
Cash used to acquire businesses/stores,
net of tax benefits
-
-
-
-
50
-
Net cash flow used by investing activities,
as adjusted
(1,000)
(1,000)
(1,050)
(950)
(799)
(889)
(1,546)
(1,686)
(1,685)
(1,314)
Free cash flow
850
(1)
950
(1)
900
$
1,100
$
1,058
$
1,490
$
681
$
420
$
356
$
519
$
Tax effect of Canadian dividend
(95)
(95)
41,050
40,851
44,104
42,286
2.6%
3.6%
1.5%
1.0%
Free cash flow with repatriation
755
855
Cash in Canada
600
600
Cash flow available to return to shareholders/
debt paydown
1,355
$
1,455
$
2010
Original Guidance
2011G
Sales and other revenue
Cash flow yield
*Excludes cash flow from payables related to third-party gift cards, net of receivables.
Cash from the sale of third-party gift cards is held for a short period of time and
then remitted, less Safeway's commission, to card partner. Because this cash flow is temporary, it is not available for other uses and
therefore is excluded from the company’s calculation of free cash flow. No forecast was made for
this item. |
 5
$ Millions
Reconciliation of GAAP Cash Flow
Measure to Free Cash Flow
Low
High
Low
High
Low
High
Low
High
Net cash flow from operating activities
2,000
$
2,200
$
2,200
$
2,400
$
2,300
$
2,500
$
2,400
$
2,600
$
Net cash flow used by investing activities
(1,000)
(1,000)
(1,100)
(1,100)
(1,100)
(1,100)
(1,100)
(1,100)
Free cash flow
1,000
$
1,200
$
1,100
$
1,300
$
1,200
$
1,400
$
1,300
$
1,500
$
2014F
2015F
2012F
2013F |
 6
Reconciliation of Operating Profit Margin Basis Point
Change Excluding Fuel & Unusual Items
2010
2009
2008
2007
2006
2005
Low
High *
Low
High
3
NM
(5)
10
436
(574)
1
21
82
(11)
Unusual items:
Texas store closures
(29)
29
Goodwill impairment charges
(483)
483
Impairment charges (incl. Dominick's)
(13)
Labor buyout and health and welfare contributions
(15)
7
Stock option expense
15
Fuel impact
(3)
(3)
(5)
(5)
(3)
(4)
(1)
4
15
6
-
NM
(10)
5
(50)
(95)
-
25
53
33
* Basis point change not specified.
Basis point change in operating profit margin
Basis point change in operating profit margin, excluding
fuel and unusual items
2010G
2011G |
 7
$ Millions
Reconciliation of Net (Loss) Income to
Adjusted
EBITDA (Interest Coverage)
2010
2009
2008
2007
2006
2005
2004
2003
Net income (loss) attributable to Safeway Inc.
$589.8
($1,097.5)
$965.3
$888.4
$870.6
$561.1
$560.2
($169.8)
Add (subtract):
Income taxes
290.6
144.2
539.3
515.2
369.4
287.9
233.7
310.9
Interest expense
298.5
331.7
358.7
388.9
396.1
402.6
411.2
442.4
Depreciation expense
1,162.4
1,171.2
1,141.1
1,071.2
991.4
932.7
894.6
863.6
LIFO (income) expense
(28.0)
(35.2)
34.9
13.9
1.2
(0.2)
(15.2)
(1.3)
Share-based employee compensation
55.5
61.7
64.3
48.4
51.2
59.7
-
-
Property impairment charges
71.7
73.7
40.3
27.1
39.2
78.9
39.4
344.9
Miscellaneous equity investment impairment charge
-
-
-
-
-
-
-
10.6
Goodwill impairment charges
-
1,974.2
-
-
-
-
-
729.1
Equity in (earnings) losses of unconsolidated affiliate
(15.3)
(8.5)
2.5
(8.7)
(21.1)
(15.8)
(12.6)
7.1
Dividend received from unconsolidated affiliate
-
5.8
-
8.9
9.0
-
-
-
Total Adjusted EBITDA
$2,425.2
$2,621.3
$3,146.4
$2,953.3
$2,707.0
$2,306.9
$2,111.3
$2,537.5
Adjusted EBITDA as a multiple of interest expense
8.1x
7.9x
8.8x
7.6x
6.8x
5.7x
5.1x
5.7x |
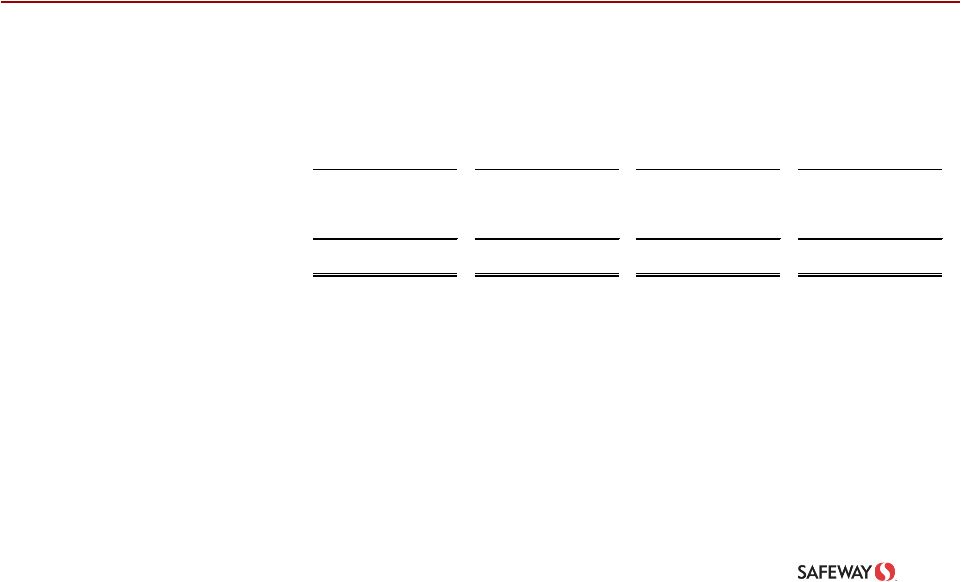
 8
Reconciliation of Net Cash Flow from Operating Activities
to Adjusted EBITDA
$ Millions
2010
2009
2008
2007
2006
2005
2004
2003
Net cash flow from operating activities
$1,849.7
$2,549.7
$2,250.9
$2,190.5
$2,175.0
$1,881.0
$2,226.4
$1,609.6
Add (subtract):
Income taxes
290.6
144.2
539.3
515.2
369.4
287.9
233.7
310.9
Interest expense
298.5
331.7
358.7
388.9
396.1
402.6
411.2
442.4
Amortization of deferred finance costs
(4.8)
(4.8)
(5.1)
(5.3)
-
-
-
-
Excess tax benefit from exercise of stock options
1.6
0.1
1.5
38.3
-
-
-
-
Deferred income taxes
31.3
142.1
(171.7)
(130.8)
(1.1)
215.9
29.2
77.9
Net pension and post-retirement benefits expense
(125.2)
(140.1)
(96.7)
(72.1)
(83.1)
(115.6)
(112.9)
(130.9)
Contributions to pension and post-retirement benefit plans
17.7
24.4
42.5
33.0
29.2
18.1
15.1
12.1
(Increase) decrease in accrued claims and other liabilities
(36.2)
34.3
(21.1)
5.8
(10.8)
(44.1)
(118.1)
(52.7)
Gain (loss) on property dispositions and lease exit activities
27.5
(12.7)
19.0
42.3
17.8
(13.6)
(20.6)
13.4
Changes in working capital items
67.9
(426.7)
226.0
(45.6)
(181.4)
(310.9)
(538.2)
263.0
Other
6.6
(20.9)
3.1
(6.9)
(4.1)
(14.4)
(14.5)
(8.2)
Total Adjusted EBITDA
$2,425.2
$2,621.3
$3,146.4
$2,953.3
$2,707.0
$2,306.9
$2,111.3
$2,537.5 |
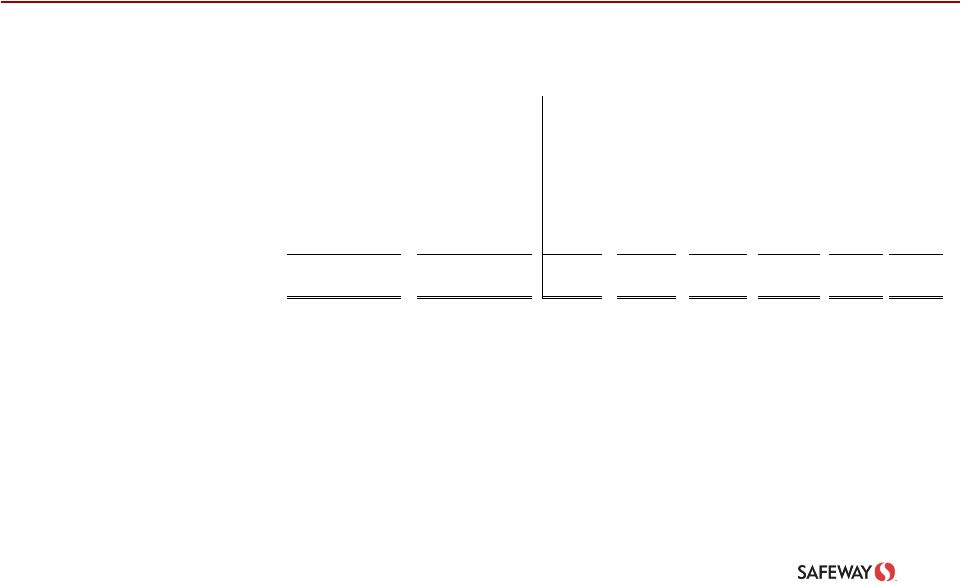
 9
Reconciliation of Gross Margin BP Change
Excluding Fuel
Basis point (decrease) increase over prior year:
2010
2009
2008
2007
2006
Basis point change in gross margin
(34)
24
(36)
(8)
(11)
Fuel
27
(59)
10
20
28
Basis point change in gross margin, excluding fuel
(7)
(35)
(26)
12
17
|
 10
Reconciliation of Gross Margin BP Change
Excluding Fuel
Basis point (decrease) increase over prior year:
Q1
Q2
Q3
Q4
Basis point change in gross margin
(31)
(32)
(13)
(56)
Fuel
26
1
13
60
Basis point change in gross margin, excluding fuel
(5)
(31)
-
4
Burnaby warehouse closure
14
7
Basis point change in gross margin, excluding fuel and
Burnaby warehouse closure
14
11
2010 |
 11
Reconciliation of Operating and Administrative
Expense Margin BP Change
Excluding Fuel
Basis point increase (decrease) over prior year:
Q1
Q2
Q3
Q4
Basis point change in operating and administrative expense margin
44
46
23
(44)
Fuel
39
31
14
36
Basis point change in operating and administrative expense margin, excluding
fuel 83
77
37
(8)
2010 |
 12
Excluding Fuel and Unusual Items
Reconciliation of Operating
&
Administrative Expense BP Change
Basis point (decrease) increase over prior year:
2010
2009
2008
2007
2006
2005
12
116
(38)
(29)
(93)
(53)
Unusual items:
Texas store closures
29
(29)
Impairment charges (incl. Dominick's)
13
Labor buyout and health and welfare contributions
15
(7)
Stock option expense
(15)
Fuel impact
31
(56)
11
16
13
32
43
60
(27)
(13)
(36)
(59)
Basis point change in operating & administrative
expense
Basis point change in operating & administrative
expense, excluding fuel and unusual items |
 13
2011 Guidance –
Before Canadian Dividend
Earnings
per
Share
$1.60 –
$1.80
ID
Sales
1.0% –
1.5%
Operating Profit Margin Change
1,2
flat to
slightly positive
Cash Capital Expenditures
~$1.0B
Free Cash Flow
1,3
$0.85B –
$0.95B
¹
See website for reconciliation
²
X-Fuel
³
Excludes Blackhawk gift card payables, net of receivables
1
2 |
 14
2011 Guidance –
Post Repatriation
EPS
Without repatriation
$1.60 -
$1.80
With repatriation
$1.45 -
$1.65
Free Cash Flow
2
Without repatriation
$0.85B -
$0.95B
With repatriation
$0.75B -
$0.85B
Cash Flow Available for
Return
to Shareholders / Debt Paydown
Without repatriation
$0.85B -
$0.95B
With repatriation
$1.35B -
$1.45B
1
Repatriation benefit post 2011 equals $0.10+ / share
2
Excludes Blackhawk gift card payables, net of receivables
See website for reconciliation
¹ |
 15
2010 Results
Original
Revised
Actual
ID Sales X-Fuel
0.0% -
1.0%
(1.0)% -
(1.5)%
(2.0)%
Inflation / (Deflation)
0.4%
NA
(1.2)%
Operating Profit Margin
Change (X-Fuel)
(10) –
5bps
NA
(50)bps
Capital Expenditures
$0.9 -
$1.0B
~ $0.9B
$838M
Free Cash Flow
$0.09 -
$1.1B
NC
$1,058
Earnings Per Share
$1.65 -
$1.85
$1.50 -
$1.70
$1.55
1
Excludes Blackhawk gift card payables, net of receivables
See website for reconciliations
1 |
 16
Consistent Sales Improvement
0.3
(0.8)
(2.0)
(2.5)
(3.1)
(4.1)
(0.7)
(1.5)
(3.0)
-5.0
-4.0
-3.0
-2.0
-1.0
0.0
1.0
1Q09
2Q09
3Q09
4Q09
1Q10
2Q10
3Q10
4Q10
1Q11
8 weeks
ID Sales X-Fuel –
Total Company |
 17
Lifestyle Stores Completed
20
14
26
82
60
30
8
232
2008
2009
2010
2011F
New
Remodel
90
74
56
252 |
 18
Capital Spending as a % of Sales
3.4%
3.6%
4.2%
4.2%
3.6%
2.1%
2.0%
2.4%
2.3%
2.4%
2.3%
2.2%
2.3%
'04
'05
'06
'07
'08
'09
'10
'11F
'12F
'13F
'14F
'15F
'10-
'15
$1.2
$1.4
$1.7
$1.8
$1.6
$0.9
$0.8
$1.0
$1.0
$1.1
$1.1
$1.1
$ Billions
12 year average = 2.9% |
 19
0.5
0.4
0.4
0.7
1.5
1.0
1.3 -
1.5
1.2 -
1.4
1.1 -
1.3
1.0 -
1.2
0.75 -
0.85*
2005
2006
2007
2008
2009
2010
2011F
2012F
2013F
2014F
2015F
Free Cash Flow
$ Billions
1.4
1.7
1.7
1.6
0.9
0.8
1.0
1.0
1.1
1.1
1.1
Capital Spending
See website for reconciliation
*Includes tax on Canada dividend
Excludes Blackhawk gift card payables, net of receivables
|
 Adjusting
4
th
Quarter
Earnings
Per
Share
–
2010
Proper Adjustment To
Item
Analyst
Normal
Last Year
Comments
Tax Rate
(3) ¢
(3) ¢
(5) ¢
Property Gain
(5)
(3)
(4)
Integral to business
Property Impairment
-
1
(1)
LIFO
(5)
(3)
1
Unprecedented deflation
Currency
(2)
(1)
(1)
Casa Ley
(2)
-
(1)
Subtotal
(17) ¢
(9) ¢
(11) ¢
D.C. Closure
-
1
1
Fuel Margins
-
2
3
Workers Comp
-
3
7
Subtotal
(17) ¢
(3) ¢
0 ¢
Exclude LIFO
-
3
(1)
P&L already contains an 18¢
reduction from deflation
Total Adjustments
(17) ¢
0 ¢
(1) ¢
Reported EPS
62 ¢
62 ¢
62 ¢
Adjusted EPS
45 ¢
62 ¢
61 ¢ |
 |