Attached files
Table of Contents
UNITED STATES
SECURITIES AND EXCHANGE COMMISSION
WASHINGTON, D.C. 20549
FORM 10-K
| x | ANNUAL REPORT PURSUANT TO SECTION 13 OR 15(d) OF THE SECURITIES EXCHANGE ACT OF 1934 |
For the fiscal year ended December 31, 2010
| ¨ | TRANSITION REPORT PURSUANT TO SECTION 13 OR 15(d) OF THE SECURITIES EXCHANGE ACT OF 1934 |
For the Transition Period From to
Commission file number 0-27610
LCA-Vision Inc.
(Exact name of registrant as specified in charter)
| Delaware | 11-2882328 | |
| (State or other jurisdiction of incorporation or organization) |
(I.R.S. Employer Identification Number) |
| 7840 Montgomery Road, Cincinnati, OH | 45236 | |
| (Address of principal executive offices) | (Zip Code) |
Registrant’s telephone number, including area code: (513) 792-9292
Securities registered pursuant to Section 12(b) of the Act:
| Title of each class |
Name of each exchange on which registered | |
| Common Stock, $.001 par value | The NASDAQ Stock Market |
Securities registered pursuant to Section 12(g) of the Act: None
Indicate by check mark if the registrant is a well-known seasoned issuer, as defined in Rule 405 of the Securities Act. Yes ¨ No x
Indicate by check mark if the registrant is not required to file reports pursuant to Section 13 or Section 15(d) of the Act. Yes ¨ No x
Indicate by check mark whether the registrant (1) has filed all reports required to be filed by Section 13 or 15(d) of the Securities Exchange Act of 1934 during the preceding 12 months, and (2) has been subject to such filing requirements for the past 90 days. Yes x No ¨
Indicate by check mark whether the registrant has submitted electronically and posted on its corporate Website, if any, every Interactive Data File required to be submitted and posted pursuant to Rule 405 of Regulation S-T (§232.405 of this chapter) during the preceding 12 months (or for such shorter period that the registrant was required to submit and post such files). Yes ¨ No ¨
Indicate by check mark if disclosure of delinquent filers pursuant to Item 405 of Regulation S-K is not contained herein, and will not be contained, to the best of registrant’s knowledge, in definitive proxy or information statements incorporated by reference in Part III of this Form 10-K or any amendment to this Form 10-K. [ ]
Indicate by check mark whether the registrant is a large accelerated filer, an accelerated filer, a non-accelerated filer, or a smaller reporting company. See the definitions of “large accelerated filer,” “accelerated filer” and “smaller reporting company” in Rule 12b-2 of the Exchange Act.
| Large accelerated filer | ¨ | Accelerated filer | x | |||
| Non-accelerated filer | ¨ | Smaller reporting company | ¨ | |||
Indicate by check mark whether the registrant is a shell company (as defined in Rule 12b-2 of the Exchange Act). Yes ¨ No x
The aggregate market value of the Common Stock held by non-affiliates of the registrant as of June 30, 2010, the last business day of the registrant’s most recently completed second quarter, was approximately $103,611,988 based on the closing price as reported on The NASDAQ Stock Market.
The number of shares outstanding of the registrant’s Common Stock as of February 18, 2011 was 18,718,240.
DOCUMENTS INCORPORATED BY REFERENCE
Portions of the registrant’s definitive Proxy Statement for its Annual Meeting of Stockholders to be held May 17, 2011 are incorporated by reference in Items 10, 11, 12, 13 and 14 of Part III of this Report.
Table of Contents
FISCAL YEAR 2010 FORM 10-K ANNUAL REPORT
TABLE OF CONTENTS
2
Table of Contents
SPECIAL NOTE REGARDING FORWARD-LOOKING INFORMATION
Certain statements contained in this Annual Report on Form 10-K, including information with respect to our future business plans, constitute “forward-looking statements” within the meaning of Section 27A of the Securities Act of 1933 and Section 21E of the Securities Exchange Act of 1934. For this purpose, any statements that are not statements of historical fact may be deemed to be forward-looking statements. Without limiting the foregoing, the words “believes,” “may,” “will,” “estimates,” “continues,” “anticipates,” “intends,” “plans,” “expects” and similar expressions are intended to identify forward-looking statements. There are a number of important factors that could cause our results to differ materially from those indicated by our forward-looking statements. These factors include those set forth in “Item 1A - Risk Factors.”
Background and History of Company
We are a provider of fixed-site laser vision correction services at our LasikPlus® vision centers. Our vision centers provide the staff, facilities, equipment and support services for performing laser vision correction that employ advanced laser technologies to help correct nearsightedness, farsightedness and astigmatism. Our vision centers are supported by independent ophthalmologists and credentialed optometrists, as well as other healthcare professionals. The ophthalmologists perform the laser vision correction procedures in our vision centers, and ophthalmologists or optometrists conduct pre-procedure evaluations and post-operative follow-up care in-center. We have performed over 1.2 million laser vision correction procedures in our vision centers in the United States and Canada since 1991. Most of our patients currently receive a procedure called Laser-Assisted In Situ Keratomileusis, (“LASIK”), which we began performing in the United States in 1997.
As of December 31, 2010, we operated 54 LasikPlus® fixed-site laser vision correction centers generally located in larger metropolitan markets in the United States, including two vision centers licensed to ophthalmologists to operate using our trademarks.
We derive substantially all of our operating revenues from laser refractive surgery, our only operating segment. Financial information concerning revenues, profit and loss and total assets are contained in “Item 8. Financial Statements and Supplementary Data” under “Consolidated Balance Sheets” and “Consolidated Statements of Operations.” See Note 1 of the “Notes to Consolidated Financial Statements” for financial information by geographic area.
Procedure volume in our industry is highly correlated with the Consumer Confidence Index and has been severely affected by the general economic slowdown in the United States. In general, industry demand improved during 2003 through 2007 alongside strong consumer confidence and declined in 2008 through 2010 with declining consumer confidence. Although industry reports anticipate an increase for laser vision correction procedures in 2011, we expect that difficult economic conditions will continue.
Laser Vision Correction Procedures
Laser vision correction procedures reshape the cornea with an excimer laser to correct refractive vision errors by changing the curvature of the cornea. These procedures may reduce the need for wearing corrective lenses such as glasses and contact lenses. Our doctors make an assessment of a patient’s candidacy for laser vision correction and determine the correction required to program the excimer laser. The software of the excimer laser then calculates the number and pattern of pulses needed to achieve the intended correction using a specially developed algorithm. The typical laser vision correction procedure takes approximately 15 – 20 minutes to complete. The eye is anesthetized using topical eye drops. The patient reclines under the laser, a lid speculum holds the eyelids open, and the patient focuses on a blinking fixation light while the excimer laser pulses are applied. The excimer laser is a high-energy ultraviolet “cold” laser; no heat is generated. This non-thermal ablation permits precise reshaping of the cornea. The amount of tissue ablated and the ablation pattern depend upon the refractive error being corrected. Shortly after the procedure, the patient leaves the laser vision center with instructions to rest the remainder of the day. Follow-up visits with an optometrist or ophthalmologist are typically scheduled for one day, one week and one to three months post-procedure.
We currently use two suppliers for our fixed-site excimer lasers: Abbott Medical Optics (“AMO”) and Alcon Inc. (“Alcon”).
3
Table of Contents
We provide primarily two types of procedures in our vision centers:
LASIK
In 1997, we began performing LASIK, which now accounts for the majority of the laser vision correction procedures performed in the United States. In LASIK procedures, our surgeons use a femtosecond laser to create a thin flap, which remains hinged to the eye. The surgeon lays back the corneal flap and applies excimer laser pulses to the exposed surface of the cornea to treat the eye according to the patient’s prescription. The surgeon then folds the corneal flap back to its original position and inspects it to ensure that it remains secured in position by the natural suction of the cornea. Because the surface layer of the cornea remains intact with LASIK, a bandage contact lens is normally not required and the patient typically experiences little discomfort. LASIK often has the advantage of more rapid recovery than Photorefractive Keratectomy (“PRK”), with most patients seeing well enough to drive a car the next day. The LASIK procedure generally allows an ophthalmologist to treat both eyes of a patient during the same visit. LASIK and PRK technology was expanded in 2003 to include wavefront-guided technology, a system that customizes the procedures based on higher order aberrations of certain patients.
PRK and Surface Ablation
The U.S. Food and Drug Administration (“FDA”) approved PRK for commercial use in the United States in 1995. In PRK procedures, the ophthalmologist removes the thin layer of cells covering the outer surface of the cornea (the epithelium) in order to apply the excimer laser pulses directly to the surface of the cornea. Following the PRK procedure, the ophthalmologist places a bandage contact lens on the eye to protect it. The patient may experience discomfort and blurred vision until the epithelium heals, which can take several days. The doctor generally will prescribe certain topical pharmaceuticals for use by the patient post-procedure to assist in alleviating discomfort, minimizing infection and helping to promote corneal healing.
Although a patient generally experiences substantial improvement in clarity of vision within a few days following the procedure, it can take several months for the full benefits of the PRK procedure to be realized. Some patients elect to have one eye treated in one visit and the second eye treated at a later date.
LASIK and PRK procedures are performed using the same excimer lasers, and offer the same results after healing occurs. Each has its advantages. Based on the pre-procedure examination and assessment, our doctors determine which laser correction procedure is best for a patient.
The Laser Vision Correction Market
More than 187 million Americans, or approximately 60% of the U.S. population, require eyeglasses or contact lenses to correct common vision problems. Most people seeking vision correction suffer from one or more refractive vision disorders, which often result from improper curvature of the cornea as related to the size and shape of the eye. If the cornea’s curvature is not precisely correct, it cannot properly focus the light passing through it onto the retina, resulting in a blurred image. Three common refractive vision disorders are:
| • | Myopia (nearsightedness)—images are focused in front of the retina, resulting in the blurred perception of distant objects |
| • | Hyperopia (farsightedness)—images are focused behind the retina, resulting in the blurred perception of near objects |
| • | Astigmatism—images are not focused on any point due to the varying curvature of the eye along different axes |
Since the FDA approved the first laser to perform laser vision correction procedures in the United States in 1995, industry sources estimate that approximately 8.3 million patients have been treated. Laser vision correction is currently one of the most widely performed elective surgical procedures in the United States, with an estimated 747,500 laser vision correction procedures performed in 2010, a slight decrease of 1.5% from 2009. Industry reports on the U.S. refractive market estimate that 2011 laser vision correction procedures are forecasted to increase 7.3% over 2010 and the potential market for laser vision correction procedures in the United States is approximately 129 million procedures. Laser vision correction is typically a private pay procedure performed on an outpatient basis.
4
Table of Contents
Estimated Number of Laser Vision Correction Procedures in North America per Year
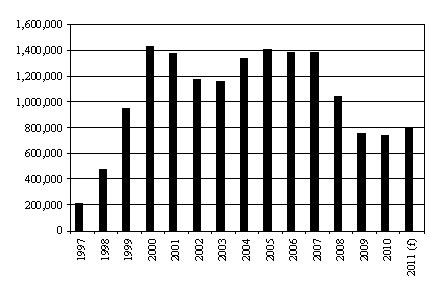
Source: Market Scope, December 2010
(f) = 2011 data forecasted by Market Scope
Our Business Strategy
Our business strategy is to provide quality laser vision correction services at an affordable price. We operate our vision centers as closed-access facilities, where we are responsible for marketing and patient acquisition and contract with independent ophthalmologists for their services.
We intend to grow our business through increased penetration in our current markets and, after the economy and the Company’s cash flow improve, expand into new markets. Key elements of our business strategy include:
| • | Recruiting and retaining independent, board certified ophthalmologists and credentialed optometrists |
| • | Providing patients with continuity of care under our “LasikPlus Advantage Plan” |
| • | Providing attractive patient financing alternatives |
| • | Nurturing relationships with leading managed care providers in the United States to source additional patients |
| • | Developing and implementing innovative marketing campaigns |
| • | Opening and operating new laser vision correction centers |
| • | Adding complementary products and services |
Recruiting and retaining independent, board certified ophthalmologists and credentialed optometrists.
We generally focus our recruiting efforts on leading independent ophthalmologists and optometrists who have a reputation for providing quality eye care within their respective markets and who have experience in laser vision correction procedures. Our ophthalmologists have completed extensive FDA-mandated training and also have met our qualification criteria, which includes a review of state licensure, board certification, malpractice insurance and surgical experience.
Providing patients with continuity of care under our “LasikPlus® Advantage Plan.”
We strive to achieve high patient satisfaction and have established the “LasikPlus® Advantage Plan,” the goal of which is to achieve the level of visual correction agreed to by the patient and physician. The patient’s care begins with our initial contact with the prospective patient. We train our call center personnel to answer questions regarding procedures and generally we provide potential patients access both to a physician to address more difficult inquiries and to past patients who can relate procedure experience. In the vision center, we provide potential patients a free eye evaluation with the local vision center’s independent ophthalmologist or optometrist to determine their candidacy for laser vision correction as well as a consultation focused on educating the patient on vision correction procedures, how the procedure may help correct the patient’s specific refractive vision disorder and what results the patient may expect after the procedure. Additionally, we design our vision centers to create a patient-friendly environment and reduce any anxiety associated with having laser vision correction. We schedule post-surgical follow-up appointments with patients who have received the procedure to monitor results and provide enhancements to those patients who do not receive the desired
5
Table of Contents
correction in the initial procedure. The vast majority of our treated patients who respond to our customer satisfaction surveys indicate that they are satisfied with the care they received in our vision centers.
Providing attractive patient financing alternatives.
Because laser vision correction procedures are elective and generally not reimbursable by third party payers, including governmental programs such as Medicare and Medicaid, we currently offer patients several financing alternatives. A significant percentage of our patients finance some or all of the cost of their procedure. We work closely with an unaffiliated third-party finance company that offers multiple payment plans to qualifying patients. These payment plans typically provide for payments over a 12-month to 60-month period. We bear no credit risk for loans made under this third-party program. For patients not qualifying for these plans, we also currently offer our own direct financing to patients pursuant to which we charge an up-front fee, with the remaining balance paid by the patients in installments over a period of 12 to 36 months. We bear the credit risk of our own direct financing programs.
Nurturing relationships with leading managed care providers in the United States to source additional patients.
With a large number of employers offering vision services in their employee benefit packages, we continue to nurture, develop and grow relationships with managed care organizations, through which we offer discounted rates to plan participants. In general, the plan participant, and not the managed care organization, currently is responsible for the payment of our fees under these arrangements. We currently have agreements with seven of the nation’s eight largest health and vision plans. In addition to the discounted programs, some plans offer a funded, insured LASIK product that covers a portion of the procedure cost.
Partnership programs.
During 2010 and 2009 we participated in partnership programs with two major airlines and a retail chain, among others. These programs allow for their members to obtain frequent flyer miles or reward points for attending a pre-operative appointment and for having the laser vision correction procedure performed. We will continue to evaluate expansions or terminations of these programs as well as explore opportunities for more partnership programs in 2011 and beyond.
We also partnered with the Wounded Warrior Project in 2010 to provide laser vision correction at no cost to wounded U.S. military veterans and their primary caregivers. Our surgeons offer their services at no cost; in addition our vendors are supporting us for this cause.
Developing and implementing innovative consumer marketing campaigns.
Our marketing programs seek to reinforce the LasikPlus® brand name in addition to raising awareness concerning laser vision correction and promoting our vision centers and the experience of our independent ophthalmologists. In each market, we target a specific demographic group of potential patients through the use of print media, radio, internet, television and/or direct mail campaigns, among other strategies. In most advertisements, we provide prospective patients a website address and a toll-free number to contact us. Our call center representatives answer initial questions that potential patients may have, and attempt to schedule eye evaluation appointments with the local vision center to determine whether the prospective patient is a candidate for laser vision correction. We are also reaching new prospects through innovative programs such as partnerships with other companies that provide their members with options such as reduced out-of-pocket procedure costs or other incentives. With the support of advertising agencies, we have refined our branding better to differentiate LasikPlus® from our competitors and continually develop more compelling messages.
Opening and operating new laser vision correction centers.
When our cash flow and the economy improve, we plan to expand our business through the development of new vision centers in attractive new markets and within existing markets. In evaluating new and current markets for opening a laser vision correction center, we consider a number of factors, including population demographics and competition, among other variables. We also typically interview local ophthalmologists and optometrists. We have developed relatively standardized vision center designs to be used in building each new vision center to manage effectively patient flow and physician and staff productivity.
Adding complementary products and services
We are planning to expand our patient care model in 2011 and beyond to include other medical and surgical eye services and products. We desire to diversify into related eye-health businesses to leverage our capabilities and resources, drive more revenue through our existing vision centers, capitalize on our past patients and high patient satisfaction rate, and lessen the impact of future economic downturns. Our focus is on programs that require minimal up-front investment that can be rolled out in a modular approach, allowing for phased introductions. We are also evaluating a co-management/management services offering and potential expansion into cataract and intraocular lens surgery, which targets the fast-growing aging population. We see co-management as an opportunity to expand our patient acquisition channels as optometrists and other eye health providers are good referral sources for laser vision correction services.
6
Table of Contents
We continue to test in our vision centers other products and services, including:
| • | Eyemagination program – using high-tech software to educate patients about eye health |
| • | Patient Advocate program – creates greater interaction with patients from their first point of contact with us through the post-operative examination |
| • | EA360 eye examination – testing a private-pay extensive eye examination in eight vision centers |
| • | Lubricating eye drops – over-the-counter eye drops to treat dry eye symptoms sold in all of our vision centers |
| • | Non-prescription sunglasses and reading glasses – testing the sale in one pilot vision center |
Competition
Laser vision correction, whether performed at one of our vision centers or elsewhere, is an alternative to other surgical as well as non-surgical treatments to correct refractive vision disorders. These non-surgical treatments include eyeglasses and contact lenses. Other refractive surgery procedures include intraocular lenses and lensectomy. In the future, other surgical procedures such as corneal inlays, currently under FDA trial, may prove to be an option as well.
We face competition from other providers of laser vision correction. A fragmented system of local providers, including individual or small groups of opticians, optometrists and ophthalmologists, and chains of retail optical stores and multi-site eye care vision centers deliver eye care services in the United States. Industry sources estimate that local ophthalmologists and hospitals represent approximately 70% of the laser vision correction market. Corporate laser vision correction providers, such as LasikPlus®, are a specialized type of provider, operating multi-site eye care centers that provide primarily laser vision correction.
In most of our markets, we also compete with other corporate laser vision correction center chains including TLC Vision Corporation or the LASIK Vision Institute.
In the past, certain competitors have utilized deeply-discounted pricing in an effort to generate procedural volume. This practice has caused periods of intense price competition in our industry. As a result, we have lowered our prices in the past in order to remain competitive. We currently face competitors offering discounted prices in some geographic markets where we conduct business. It is possible that our business could be materially adversely affected in the future by discounting practices of competitors, including from both a price and volume perspective. However, past experience demonstrates that laser vision correction procedures are not highly price elastic, and discounting has not proven to be an effective business strategy. Laser vision correction procedure volume correlates with the Consumer Confidence Index. In individual markets, one challenge is to leverage the national strengths of our company and enhance local efforts in order to grow market share.
Employees
As of January 26, 2011, we had approximately 365 employees, 318 of whom were full-time. None of our employees are subject to a collective bargaining agreement nor have we experienced any work stoppages. We believe our relations with our employees are good.
Trademarks
We have several registered trademarks in the United States, including the name LasikPlus®. We have not registered all of the names that we use for our products and services with the United States Patent and Trademark Office. Where we use the “TM” (trademark) symbol, we intend to claim trademark rights on those names under common law. The duration of such trademarks under common law is the length of time that we continue to use them.
Suppliers of Equipment
We are not directly involved in the research, development or manufacture of ophthalmic laser systems or diagnostic equipment. Several companies, including AMO and Alcon, our two current suppliers, offer excimer and femtosecond laser systems which have been approved by the FDA for commercial sale in the United States. We currently rely primarily on AMO and McKesson Corporation (“McKesson”) to provide us with patient interface kits and other disposable items required in LASIK procedures. If our relationship with any of these suppliers ceased, we believe we would be able to enter into alternative supplier arrangements.
7
Table of Contents
Government Regulation
Extensive federal, state and local laws, rules and regulations affecting the healthcare industry and the delivery of healthcare apply to our operations. Some of these include laws and regulations, which vary significantly from state to state, prohibiting unlawful rebates and division of fees, and limiting the manner in which prospective patients may be solicited. Furthermore, state and federal laws, some of which may be applicable to our business operations, regulate extensively contractual arrangements with surgery centers, ophthalmologists and optometrists.
If we or our excimer or femtosecond laser manufacturers fail to comply with applicable FDA requirements, the FDA could take enforcement action, including product seizures, recalls, withdrawal of approvals and civil and criminal penalties, any one or more of which could have a material adverse affect on our business, financial condition and results of operations. In addition, the FDA could withdraw clearance or approvals in some circumstances. If we, or our principal suppliers, fail to comply with regulatory requirements, or any adverse regulatory action, we could be named as a party in ensuing litigation or incur a limitation on or prohibition of our use of excimer lasers, financing programs, or other necessary services to our business, which in turn would have a material adverse affect on our business, financial condition and results of operations. Discovery of problems, violations of current laws or future legislative or administrative action in the United States or elsewhere may adversely affect the ability of our suppliers and partners to obtain or maintain appropriate regulatory approval. Furthermore, if AMO or Alcon, or any other manufacturers or suppliers that supply or may supply excimer lasers, diagnostic or other equipment or necessary services to us, fail to comply with applicable federal, state, or foreign regulatory requirements, any adverse regulatory action against such business suppliers and partners, could limit the supply of lasers or limit our ability to use the lasers.
The following is a more detailed description of certain laws and regulations that affect our operations.
Restrictions on medical devices
In the United States, the FDA regulates the uses, manufacturing, labeling, distribution and marketing of medical devices, including excimer and femtosecond lasers and certain other equipment that we use in laser vision correction surgery.
Once FDA approval is obtained, medical device manufacturers are subject to continuing FDA obligations. For example, the FDA requires that medical devices be manufactured in accordance with its Quality System Regulations. In essence, this means that medical devices must be manufactured and records must be maintained in a prescribed manner with respect to production, testing and control activities. In addition, the FDA sometimes imposes restrictions and requirements regarding the labeling and promotion of medical devices with which we must comply.
Non-compliance with FDA requirements could subject manufacturers to enforcement action, including:
| • | Product seizures |
| • | Recalls |
| • | Withdrawal of approvals |
| • | Civil and criminal penalties |
Non-compliance by us could subject us to civil and criminal penalties. Any such enforcement action could have a material adverse affect on our business, financial condition and results of operations.
The FDA has not approved the use of an excimer laser to treat both eyes on the same day (bilateral treatment). The FDA has stated that it considers the use of the excimer laser for bilateral treatment to be a practice of medicine decision, which the FDA is not authorized to regulate. Ophthalmologists, including those practicing in our vision centers, widely perform bilateral treatment in an exercise of professional judgment in connection with their practice of medicine. There can be no assurance that the FDA will not seek to challenge this practice in the future. If the FDA chooses to regulate this aspect of the use of excimer lasers in the future, any potential resulting inconvenience to patients could discourage potential patients from having laser vision correction, potentially having a material adverse affect on our business, financial condition and results of operations by decreasing the total number of procedures that we perform.
The FDA requires that some medical facilities report serious injuries involving medical devices to device manufacturers, and deaths involving medical devices to the FDA. The FDA requires that subject medical facilities have specific written procedures regarding such reporting obligations. Those of our vision centers that meet the FDA’s definition of user facilities are subject to these requirements. In 2009, the FDA issued warning letters to certain facilities advising that written procedures were not compliant. We updated our written procedures in response to the FDA letters. Although we believe that our procedures meet regulatory requirements, if the FDA determines that our procedures or our reporting practices are not adequate, we could be subject to FDA enforcement action. FDA enforcement action could discourage potential patients from having laser vision correction, or could limit our ability to use medical devices, potentially having a material adverse affect on our business, financial condition and results of operations by decreasing the total number of procedures that we perform.
8
Table of Contents
To authorize new uses of existing medical devices, regulations require manufacturers to obtain a supplemental FDA authorization. Obtaining these authorizations is time consuming and expensive, and we cannot be sure that manufacturers of the devices that we use will be able to obtain any such additional FDA authorizations. Further, later discovery of problems with the medical devices that we use may result in restrictions on use of the devices or enforcement action against the manufacturers, including withdrawal of devices from the market. Changes in legislation or regulation could affect whether and how we can use our medical devices. These and other regulatory actions could limit the supply of devices that we use or our ability to use them, which could have a material adverse affect on our business, financial condition and results of operations.
FDA LASIK Review
The FDA’s advisory board on ophthalmic devices is currently reviewing concerns about post-LASIK surgery quality of life matters, and the FDA has commenced a major new study on LASIK outcomes and quality of life that is expected to end in 2012. The FDA or another agency could take legal or regulatory action against us or others in the laser vision correction industry. The outcome of this review or legal or regulatory action potentially could impact negatively the acceptance of LASIK.
Federal and state laws on “kickbacks” and physician referrals
Because laser vision correction procedures currently are not reimbursable by Medicare, Medicaid or other governmental health programs, we do not believe numerous federal healthcare laws that frequently apply to healthcare providers’ business operations (such as the federal Anti-Kickback and “Stark” Physician Self-Referral statutes) currently apply to us. Any changes in the reimbursement and coverage rules for these governmental health programs may cause our services to be subject to such federal laws. Although we do not anticipate such changes in the near future, we cannot predict this with any degree of certainty. Some states have enacted statutes, similar to the federal Anti-Kickback and Stark statutes that are applicable to our operations because they cover all referrals of patients regardless of the payer or type of healthcare service provided. These state laws vary significantly in their scope and penalties for violations. Although we have endeavored to structure our business operations to be in material compliance with such state laws, authorities in those states could determine that our business practices are in violation of their laws. This could have a material adverse affect on our business, financial condition and results of operations.
Advertising restrictions
Our business is heavily dependent on advertising, which is subject to regulation by the Federal Trade Commission (“FTC”). In 2002, the FTC conducted an extensive review of our advertising practices. Following this review, the FTC concluded that certain of our past advertisements contained claims that were not properly substantiated. We elected to settle voluntarily with the FTC. In July 2003, the FTC formally entered a Complaint and an Agreement Containing Consent Order in which we agreed, among other things, that we would not represent in our advertising that our LASIK surgery services eliminate the need for glasses and contacts for life, pose significantly less risk to patients’ eye health than wearing glasses or contacts or eliminate the risk of glare and haloing, unless, at the time made, we possess and rely upon competent and reliable scientific evidence that substantiates the representation. No monetary penalties were imposed on us. Although we consented to this order in 2003, we cannot be certain that this order will not restrict our ability to effectively generate demand for our laser vision correction services.
In 2009 the FDA issued a letter to eye care professionals noting that the FDA’s Ophthalmic Devices Panel had received complaints that advertisements for LASIK procedures and FDA-approved lasers used for LASIK procedures failed to inform consumers of the indications, limitations, and risks associated with LASIK procedures and the approved lasers used for the LASIK procedures. In this letter, the FDA said that an advertisement may be considered misleading if it fails to reveal facts that are material to representations made in the advertisement. We believe that we have structured our advertising practices to be in material compliance with FDA and FTC laws and guidance. However, we cannot be certain that the FDA or the FTC will not determine that our advertising practices are in violation of such laws and guidance.
In addition, the laws of many states restrict certain advertising practices by and on behalf of physicians and optometrists. Many states do not offer clear guidance on the bounds of acceptable advertising practices or on the limits of advertising provided by management companies on behalf of physicians and optometrists. Although we have endeavored to structure our advertising practices to be in material compliance with such state laws, authorities in those states could determine that our advertising practices are in violation of those laws.
Fee-splitting
Many states prohibit professionals (including ophthalmologists and optometrists) from paying a portion of a professional fee to another individual unless that individual is an employee or partner in the same professional practice. If we violate a state’s fee-splitting prohibition, we may be subject to civil or criminal fines, and the physician participating in such arrangements may lose his or her licensing privileges. Many states do not offer clear guidance on what relationships constitute fee-splitting, particularly in the context of providing management services for doctors. Although we have endeavored to structure our business operations in material compliance with these laws, state authorities could find that fee-splitting prohibitions apply to our business practices in their states. If any aspect of our operations were found to violate fee-splitting laws or regulations, this could have a material adverse affect on our business, financial condition and results of operations.
9
Table of Contents
Corporate practice of medicine and optometry
The laws of many states prohibit business corporations, such as us, from practicing medicine and employing or engaging physicians to practice medicine. Some states prohibit business corporations from practicing optometry or employing or engaging optometrists to practice optometry. Such laws preclude companies that are not owned entirely by eye care professionals from:
| • | Employing eye care professionals |
| • | Controlling clinical decision making |
| • | Engaging in other activities that are deemed to constitute the practice of optometry or ophthalmology |
This prohibition is generally referred to as the prohibition against the corporate practice of medicine or optometry. Violation of this prohibition may result in civil or criminal fines, as well as sanctions imposed against the professional through licensing proceedings. Although we have endeavored to structure our contractual relationships to be in material compliance with these laws, if any aspect of our operations were found to violate state corporate practice of medicine or optometry prohibitions, this could have a material adverse affect on our business, financial condition and results of operations.
Facility licensure and certificates of need
State Departments of Health may require us to obtain licenses in the various states in which we have laser vision correction centers or other business operations. We believe that we have obtained the necessary material licensure in states where licensure is required and that we are not required to obtain licenses in other states. However, not all of the regulations governing the need for licensure are clear and there is limited guidance available regarding certain interpretative issues. Therefore, it is possible that a state regulatory authority could determine that we are improperly conducting business operations without a license in that state. This could subject us to significant fines or penalties, result in our being required to cease operations in that state or otherwise have a material adverse affect on our business, financial condition and results of operations. Although we currently have no reason to believe that we will be unable to obtain the necessary licenses without unreasonable expense or delay, there can be no assurance that we will be able to obtain any required licensure.
Some states require permission by the State Department of Health in the form of a Certificate of Need (“CON”) prior to the construction or modification of an ambulatory care facility or the purchase of certain medical equipment in excess of a certain amount. We believe that we have obtained the necessary CONs in states where a CON is required. However, not all of the regulations governing the need for CONs are clear and there is little guidance regarding certain interpretive issues. Therefore, it is possible that a state regulatory authority could determine that we are improperly conducting business operations without a CON in that state. There can be no assurance that we will be able to acquire a CON in all states where it is required, or that our failure or inability to obtain a CON in markets into which we believe we could otherwise be successful expanding will not have a material adverse affect on our business, financial condition and results of operations.
Available Information
Our websites are www.lasikplus.com and www.lca-vision.com. There we make available, free of charge, our annual reports on Form 10-K, quarterly reports on Form 10-Q, current reports on Form 8-K and any amendments to those reports as well as any beneficial ownership reports of officers and directors filed on Forms 3, 4 and 5. We will make all such reports available as soon as reasonably practicable after we file them with or furnish them to the Securities and Exchange Commission (“SEC”). Our committee charters, governance guidelines and code of ethics are also available on our websites. To obtain a copy of any of these documents by mail, free of charge, please send a request to Investor Relations at LCA-Vision Inc., 7840 Montgomery Road, Cincinnati, Ohio 45236. Information contained on our websites is not part of this Annual Report on Form 10-K and is not incorporated by reference in this document. The public may read and copy any materials we file with the SEC at the SEC’s Public Reference Room at 100 F Street, NE, Washington, DC 20549. The public may obtain information on the operation of the Public Reference Room by calling the SEC at 1-800-SEC-0330. The SEC maintains a website (www.sec.gov) that contains reports, proxy and information statements and other information regarding issuers that file electronically with the SEC.
In evaluating and understanding us and our business, you should carefully consider (1) all of the information set forth in this Annual Report on Form 10-K, including the Consolidated Financial Statements and notes thereto and Management’s Discussion and Analysis, (2) information in our other filings with the SEC, including any future reports on Forms 10-Q and 8-K and (3) the risks described below. These are not the only risks we face. Additional risks not presently known or which we currently deem immaterial may also impact our business operations, and the risks identified below may adversely affect our business in ways we cannot currently anticipate. Our business, financial condition and results of operations could be materially adversely affected by any of these risks.
10
Table of Contents
We incurred losses in 2008, 2009 and 2010, and expect to continue to incur losses in 2011.
Our procedure volume in 2010 decreased substantially from 2009 due in large part to continued weak consumer confidence, a weak overall economy, and high unemployment. We sustained losses in all four quarters in 2010 and 2009. We anticipate that in 2011 we will continue generating losses and negative cash flows. At December 31, 2010 and 2009, we had approximately $51.9 million and $54.6 million, respectively, in cash and investments. We are uncertain as to how long the negative economic and industry conditions will continue. There could be a number of other effects from these adverse economic conditions on our business, including reduced consumer demand for our services; insolvency of our customers, resulting in increased provisions for credit losses; insolvency of our key equipment suppliers; inability of consumers to obtain credit to finance some or all of the cost of their procedures; and decreased consumer confidence. If macroeconomic conditions do not improve, our business, financial condition, results of operations and cash flows could be materially adversely affected.
Changes in general economic conditions may cause fluctuations in our revenues and profitability.
The cost of laser vision correction procedures typically is not reimbursed by third-party payers such as health care insurance companies or government programs. Accordingly, as we are experiencing and have experienced in prior fiscal periods, our operating results may vary based upon the impact of changes in the disposable income of consumers interested in laser vision correction, among other economic factors. A significant decrease in consumer disposable income in a weakening economy results in a decrease in the number of laser vision procedures performed and a decline in our revenues and profitability. In addition, weak economic conditions may cause some of our patients to experience financial distress or declare bankruptcy, which may negatively impact our accounts receivable collection experience. Weak economic conditions also may change the risk profile or volume of business that our unaffiliated finance company partner is willing to underwrite, which could adversely affect our business, financial condition, results of operations and cash flows.
Our industry is highly correlated with consumer confidence.
Recessionary economic conditions, uncertainty in the credit markets, a period of rising energy costs and depressed housing prices have all contributed to a deterioration in volume of procedures performed, especially from patients at middle- and lower-income levels. Deteriorating consumer confidence negatively impacts our financial performance. The current market conditions in the credit markets and high unemployment are creating uncertainty and causing potential patients to be more cautious in their purchasing decisions.
Our quarterly and annual operating results are subject to significant fluctuations.
Our revenue and operating results have fluctuated and may continue to fluctuate significantly from quarter to quarter and from year to year depending on many factors, including but not limited to:
| • | Market acceptance of laser vision correction services |
| • | The number of laser vision correction procedures performed |
| • | The timing of advances by our suppliers and the purchase of such advances or upgrades of equipment by us or our competitors |
| • | The impact of competitors, including those who compete by deeply discounting the price of laser vision correction services, in the geographic areas in which we operate |
| • | Declining economic conditions in the geographic areas in which we operate, which can result in decreased demand for our laser vision correction services |
| • | The opening, closing or expansion of vision centers |
| • | Our ability to manage equipment and operating costs |
| • | Collection rates on self-financed procedures |
| • | The availability of third-party financing for our patients |
| • | Regulatory matters |
| • | Litigation |
| • | Acquisitions and other transactions |
In addition, our revenue and operating results are subject to seasonal factors. In terms of the number of procedures performed, our strongest quarter historically has been the first quarter of the year, and our business is generally weaker in the latter half of the year. We believe these fluctuations are primarily due to:
| • | The availability to potential patients of funds under typical employer medical flexible spending plans and health savings plans |
| • | Time constraints imposed by the summer vacation and holiday seasons and a desire by some individuals not to schedule procedures at those times of year |
Reductions in revenues or net income between quarters or our failure to achieve expected quarterly earnings per share has in the past and could in the future result in a decrease in the market price of our common stock.
11
Table of Contents
Our business is very reliant upon direct-to-consumer marketing.
The effectiveness of our marketing programs and messages to consumers can have a significant impact on our financial performance. The effectiveness of marketing fluctuates, resulting in changes in the cost of marketing per procedure, and variations in our margins. Less effective marketing programs could adversely affect our business, financial condition and results of operations.
We derive substantially all of our revenue from laser vision correction services. A decrease in the provision of these services could result in a significant decrease in our revenues and profitability.
We derive substantially all of our revenues from laser vision correction services. If we are not able to provide those services or the number of laser vision correction procedures we perform significantly decreases, our revenues and profitability will decrease materially. We do not currently have other diversified revenue sources to offset a significant decrease in revenues from our provision of laser vision correction services.
Our future success may depend on developing new services or products beyond laser vision correction.
During the fourth quarter of 2010, we added over-the-counter eye drop products in all of our centers. We also are evaluating a co-management/management services offering designed to generate revenue by attracting patients to LasikPlus and offering provisional services to optometrists, as well as potential expansion into cataract and intraocular lens surgery. Any potential diversification of services may not be successful, and we can make no assurance that these opportunities can be developed or that we will have adequate capital to do so.
If we are unable to attract and retain qualified independent ophthalmologists, our ability to maintain operations at existing vision centers, to attract patients or to open new vision centers could be negatively affected.
We generate our revenues through independent ophthalmologists who work with us to perform surgeries. In states where the corporate practice of medicine is prohibited, we contract with professional corporations for ophthalmologists to perform surgeries at our vision centers. The retention of those ophthalmologists is a critical factor in the success of our existing vision centers, and the hiring of independent qualified ophthalmologists is a critical factor in our ability to launch a new vision center successfully. However, it is sometimes difficult for us to retain or hire qualified ophthalmologists. If we are unable consistently to attract, hire and retain qualified ophthalmologists, our ability to open new vision centers, maintain operations at existing vision centers, and attract patients could be negatively affected.
In the fourth quarter of 2010, we began to feature our ophthalmologists in local marketing materials. If we are unable to retain these featured ophthalmologists, our ability to maintain operations at existing vision centers and attract patients could be negatively affected.
If technological changes occur which render our equipment or services obsolete, or increase our cost structure, we may need to make significant capital expenditures or modify our business model, which could cause our revenues or profitability to decline.
Industry, competitive or clinical factors, among others, may require us to introduce alternate ophthalmic laser technology or other surgical or non-surgical methods for correcting refractive vision disorders than those that we currently use in our laser vision correction centers. Such alternative technologies could include various intraocular lens technologies or other new technologies. Introducing such technology could require significant capital investment or force us to modify our business model in such a way as to make our revenues or profits decline. An increase in costs could reduce our ability to maintain our profit margin. An increase in prices could adversely affect our ability to attract new patients.
If a better-financed or lower-cost provider of laser vision correction or a competing vision treatment forces us to lower our laser surgery prices in a particular geographic area, our revenues and profitability could decline.
Laser eye surgery competes with other surgical and non-surgical treatments for refractive vision disorders, including eyeglasses, contact lenses, other types of refractive surgery, corneal implants and other technologies currently under development. Among providers of laser vision correction, competition comes from firms similar to us and from hospitals, hospital-affiliated group entities, physician group practices and private ophthalmologists, among others that, in order to offer laser vision correction to patients, purchase or rent excimer lasers. Suppliers of conventional eyeglasses and contact lenses, such as optometry chains, also may compete with us by purchasing laser systems and offering laser vision correction to their customers.
12
Table of Contents
Some of our current competitors or other companies that may choose to enter the industry in the future, including laser manufacturers themselves, may have substantially greater financial, technical, managerial, marketing or other resources and experience than we do and may be able to compete more effectively. Competition in the market for laser vision correction may also increase as excimer laser surgery becomes more common and the number of ophthalmologists performing the procedure increases. Similarly, competition could increase if the market for laser vision correction does not experience growth, and existing providers compete for market share. Additional competition may develop, particularly if the price to purchase or rent excimer laser systems decreases. Our management, operations, strategy and marketing plans may not be successful in meeting this competition.
If more competitors offer laser vision correction or other competitive types of vision treatments in a given geographic market, we might find it necessary to reduce the prices we charge, particularly if competitors offer the procedures at lower prices than we do. If that were to happen or we were not successful in cost effectively acquiring patients for our procedures, we may not be able to make up for the reduced profit margin by increasing the number of procedures that we perform, and our business, financial condition and results from operations could be adversely affected, as we have experienced in prior fiscal periods.
Our business has been adversely affected in the past by deeply-discounted pricing by some competitors, and it is possible that such competitive practices may adversely affect our business in the future.
In the past, certain competitors have utilized deeply-discounted pricing in an effort to generate procedure volume. This practice has caused periods of intense price competition in our industry. As a result, we have lowered our prices in the past in order to remain competitive. We currently face competitors offering discounted prices, including several providers of laser vision correction centers, in some geographic markets where we conduct business. It is possible that, in the future, business, financial condition and results from operations could be adversely affected, as a result of the discounting practices of competitors.
We have credit risk from accounts receivable from internally financed patients.
A significant percentage of our patients finance some or all of the cost of their procedure. We provide certain of our patients, including patients who could not otherwise obtain third-party financing, with the ability to pay for our procedures with direct financing. The terms of our direct financing typically require the customer to pay a fee up-front, with the remaining balance paid by the patient in up to 36 monthly installments. As of December 31, 2010, we had $4.4 million in gross patient receivables, compared to $7.7 million as of December 31, 2009. We are exposed to significant credit risk from our direct financing program, particularly given that patients who participate in the program generally have not been deemed creditworthy by third-party financing companies with more experience in credit issues. If the uncollectible amounts exceed the amounts that we have reserved, we could be required to write down our accounts receivable, and our cash flow and results of operations would be adversely affected.
Extensive state and federal laws and regulations, some of which may be applicable to our business operations, regulate the extension of credit to patients. Although we believe that our practices are in material compliance with these laws and regulations, non-compliance could subject us to litigation, enforcement action, or civil or criminal penalties. Any such action could have a material adverse affect on our business, financial condition and results of operations.
If laser vision correction does not gain broader market acceptance, our profitability and growth will be severely limited.
We believe that our profitability and expansion depend to a large extent on the acceptance of laser vision correction as a safe and effective treatment. There can be no assurance that laser vision correction will be accepted more widely by ophthalmologists, optometrists or the general population as an alternative to existing or future methods of treating refractive vision disorders. In terms of procedure volume, the industry was relatively flat from 2005 through 2007 and declined in 2008 through 2010 largely due to economic conditions.
Wider acceptance of laser vision correction may be affected adversely by:
| • | Concerns about the safety and effectiveness of laser vision correction procedures, including procedures using new technologies |
| • | General resistance to surgery of any type, and eye surgery in particular |
| • | Cost, particularly because laser vision correction is not typically covered by government or private insurers |
| • | The effectiveness of alternate methods of correcting refractive vision disorders, including but not limited to various intraocular lens technologies |
| • | Possible unknown side effects not yet revealed by long-term follow-up data |
| • | Regulatory developments |
| • | Reported adverse events or other unfavorable publicity involving patient outcomes from laser vision correction |
| • | The results of the FDA’s LASIK study, expected to be completed in 2012 |
13
Table of Contents
Concerns about potential side effects and long-term results may negatively impact market acceptance of laser vision correction, result in potential liability for us and prevent us from growing our business.
Some people and publications have raised concerns with respect to the predictability and stability of results and potential complications or side effects of laser vision correction. Physicians have provided laser vision correction in the United States since 1995. Any long-term complications or side effects of laser vision correction may call into question its safety and effectiveness, which in turn may negatively affect market acceptance of laser vision correction. Complications or side effects of laser vision correction could lead to professional liability, malpractice or other claims against us and product liability claims against the manufacturers of our lasers. Courts have awarded several significant verdicts against non-affiliated refractive surgeons in the past. Consequences of proceedings could include increased liability to us in connection with malpractice litigation, increased difficulty in hiring and retaining qualified independent ophthalmologists who may be wary of the increased liability of laser eye surgery, and decreased operational and financial yield from pre-operative examinations, among other effects that would be adverse to our business, financial condition, and results of operations.
Some of the possible side effects of laser vision correction may include:
| • | Foreign body sensation |
| • | Pain or discomfort |
| • | Sensitivity to bright lights |
| • | Blurred vision or haze |
| • | Dryness or tearing |
| • | Fluctuation in vision |
| • | Night glare and halos |
| • | Poor or reduced visual quality |
| • | Overcorrection or undercorrection |
| • | Regression |
| • | Decreased corneal integrity |
| • | Corneal flap or corneal healing complications |
| • | Loss of best corrected visual acuity |
| • | Inflammation or infection of the eye |
| • | Need for corrective lenses or reading glasses post-operatively |
| • | Need for further treatment |
We depend on limited sources for the excimer lasers and diagnostic equipment we use and for the third-party financing made available to our patients. Shortages of these items or services could hinder our ability to increase our procedure volume.
We use two suppliers, AMO and Alcon, for our excimer lasers. If either or both of these companies became unwilling or unable to supply us with excimer lasers and diagnostic equipment or to repair or replace parts or to provide services, our ability to maintain or increase our capacity to perform laser vision correction services at existing vision centers or to open new vision centers could be restricted.
We currently rely primarily on AMO to provide us with patient interface kits, the devices used to create the corneal flap in the LASIK procedure, and McKesson for other disposable items required for LASIK. If we were to require alternate or additional suppliers, we believe we would be able to find alternative sources, but there can be no assurance that such items would be available in the quantities or within the time frames that we require. Any shortages in our supplies of this equipment could limit our ability to maintain or increase the volume of procedures that we perform, which could adversely affect our business, financial condition and results from operations.
We currently rely exclusively on one unaffiliated finance company for third-party financing made available to our patients. The percentage of our patients who choose to obtain financing from such unaffiliated finance company is significant. There can be no assurance that financing services will be available in such structures or at such interest rates or costs as we or our patients may require. Any reduction in available financing could limit our ability to maintain or increase the volume of procedures that we perform, which could adversely affect our business, financial condition and results from operations.
14
Table of Contents
Our business may be impaired due to government regulations which could restrict our equipment, services and relationships with ophthalmologists, optometrists and other healthcare providers.
As described under “Government Regulation” and below, we, excimer laser manufacturers and our other business partners, including managed care companies and third-party patient financing companies, among others, are subject to extensive federal, state and foreign laws, rules and regulations, including all or some of the following:
| • | Federal restrictions on the approval, distribution and use of medical devices |
| • | Anti-kickback statutes in some states |
| • | Fee-splitting laws in some states |
| • | Corporate practice of medicine restrictions in some states |
| • | Physician self-referral laws in some states |
| • | Anti-fraud provisions in some states |
| • | Facility license requirements and certificates of need in some states |
| • | Conflict of interest regulations in some states |
| • | FDA, FTC, and state rules and regulations regarding advertising and marketing practices |
| • | Credit and financing regulation |
Some of these laws and regulations are vague or ambiguous, and courts and regulatory authorities have not always provided clarification. Moreover, state and local law, including, but not limited to those on sales and use taxes, vary from jurisdiction to jurisdiction. As a result, some of our activities could be challenged, the success of which cannot be predicted.
The failure of our suppliers to obtain regulatory approvals for any additional uses of excimer or femtosecond lasers or otherwise comply with regulatory requirements could limit the number of excimer or femtosecond lasers that we have available for use and, therefore, limit the number of procedures that we can perform.
Failure of the laser manufacturers to comply with applicable FDA requirements could subject us, the independent ophthalmologists who practice in our vision centers or those manufacturers to enforcement actions, including product seizure, recalls, withdrawal of approvals and civil and criminal penalties. Further, failure to comply with regulatory requirements, or any adverse regulatory action, could result in limitations or prohibitions on our use of excimer or femtosecond lasers. Any such actions or proceedings could result in negative publicity, which in turn could result in decreased demand for our services and decrease our capacity to perform laser vision correction services.
Our business is heavily dependent on advertising, which is subject to regulation by the Federal Trade Commission (“FTC”) and various state boards of medicine and optometry. We are subject to a 2003 FTC Consent Order in which it was agreed, among other things, that we would not represent in our advertising that our LASIK surgery services eliminate the need for glasses and contacts for life, pose significantly less risk to patients’ eye health than wearing glasses or contacts, or eliminate the risk of glare and haloing, unless, at the time made, we possess and rely upon competent and reliable scientific evidence that substantiates the representation. We cannot be certain that this order to which we agreed, or any future action by the FTC, will not restrict our laser vision correction services, or otherwise result in negative publicity and damage our reputation.
Our business may be adversely impacted by healthcare reform.
The enactment of the Patient Protection and Affordable Cost Act in 2010 and the activity continuing in the U.S. Congress, several of the states and the courts do not allow us to predict accurately the impact of healthcare reform. Healthcare reform may bring significant changes in the financing and regulation of the healthcare industry. For example, the law currently states that flexible spending account contributions would be limited to $2,500 beginning in 2013. Depending on the nature of such changes and if they go into effect, they could have a material adverse affect on our business, financial condition and results of operations.
The FDA is conducting a study to examine LASIK’s impact on quality of life, the results of which could adversely impact broader market acceptance, and our profitability and growth.
The FDA has launched a collaborative study with the National Eye Institute and the U.S. Department of Defense to examine LASIK’s potential impact on quality of life. The goal of the LASIK Quality of Life Collaboration Project is to determine the percentage of patients with significant quality of life problems after LASIK surgery and to identify predictors of these problems. The project is expected to end in 2012. The results of the project will help identify factors that can affect quality of life following LASIK and potentially reduce the risk of adverse affects that can impact the surgical outcome. If any of these factors are related to the safety or effectiveness of the lasers used in LASIK surgery, the FDA will evaluate whether any action is necessary. The project is part of the FDA’s ongoing effort to better monitor and improve the safety and effectiveness of the lasers used in LASIK surgery. The results of this study could adversely impact broader market acceptance of LASIK, which could have a direct impact on our profitability and growth. In addition, any new adverse regulatory actions by the FDA could result in limitations or prohibitions with respect to LASIK surgery.
15
Table of Contents
We are subject to lawsuits for patient injuries, which could subject us to significant judgments and damage our reputation.
The laser vision correction procedures performed in our vision centers involve the risk of injury to patients. Such risk could result in professional liability, malpractice, or other claims brought against us, or our independent ophthalmologists and optometrists based upon injuries or alleged injuries associated with malpractice by an ophthalmologist, optometrist, technician or other healthcare professional. Product liability claims could also be made against our manufacturers associated with defects in their products. Some injuries or defects may not become evident for a number of years. Significant lawsuits against us could subject us to significant judgments and damage our reputation. In addition, a partially or completely uninsured claim against us could have a material adverse effect on our business, financial condition and results of operations. We rely primarily and intend to continue to rely primarily on the independent ophthalmologists’ professional liability insurance policies and the manufacturers’ product liability insurance policies, although we have limited umbrella general and professional liability insurance. We require the independent ophthalmologists who use our vision centers to maintain certain levels of professional liability insurance, although an inability of ophthalmologists to procure insurance could disrupt business while replacement ophthalmologists are being recruited.
The availability of professional liability insurance has decreased and its cost has increased significantly for a variety of reasons, including reasons outside our control, particularly in certain states. A future increase in cost could result in the reduced profitability of our business, and a future lack of availability of coverage for us or our independent ophthalmologists and optometrists could result in increased exposure to liability and potentially limit our ability to expand in certain markets.
We own a captive insurance company and its payment of significant claims could affect our results of operations and financial condition.
We maintain a captive insurance company to provide professional liability insurance coverage for claims brought against us after December 17, 2002. In addition, our captive insurance company’s charter allows it to provide professional liability insurance for our doctors. Our captive insurance company is capitalized and funded by us based on actuarial studies performed by an independent insurance consulting and management firm. The Company uses the captive insurance company for both the primary insurance and the excess liability coverage. A number of claims are now pending with our captive insurance company. The payment of significant claims by our captive insurance company could adversely affect our business, financial condition and results of operations.
Disputes with respect to intellectual property could result in a decrease in revenues and profitability.
We have not registered all of the names we use for our products and services with the United States Patent and Trademark Office. Some of our internal processes and systems do not have intellectual property protection. If a competitor were to attempt to use our names, processes or systems, we may not be able to prevent such use. The unauthorized use of our name could cause confusion among patients, and the misappropriation of internal processes or systems could reduce our competitive advantages, either of which could adversely affect our business, financial condition and results of operations.
The loss of the services of any members of our senior management team could impair our ability to execute our business strategy and as a result, reduce our sales and profitability.
We depend on the continued services of our senior management team. The loss of key personnel could have a material adverse affect on our ability to execute our business strategy and on our business, financial condition and results of operations. We do not maintain key-person insurance for members of our senior management team.
Item 1B. Unresolved Staff Comments
None.
Our corporate headquarters and one of our laser vision correction centers are located in a 32,547 square feet office building that we own in Cincinnati, Ohio. Our other laser vision correction centers and our Customer Call and Data Centers are in leased locations. The typical vision center location is in a professional office building or retail site and includes a laser surgery room, private examination rooms and patient waiting areas. Vision centers range in size from approximately 2,800 to 6,900 square feet with lease expiration dates through September 2021. The lease for the facility housing our Customer Call and Data Centers expires on April 30, 2015.
16
Table of Contents
Our business results in a number of medical malpractice lawsuits. Claims reported to us prior to December 18, 2002 were generally covered by external insurance policies and to date have not had a material financial impact on our business other than the cost of insurance and our deductibles under those policies. In December 2002, we established a captive insurance company to provide coverage for claims brought against us after December 17, 2002. We use the captive insurance company for both primary insurance and excess liability coverage. A number of claims are now pending with our captive insurance company. Since the inception of the captive insurance company in 2002, it has disbursed total claims and expense payments of $4.9 million. At December 31, 2010, we maintained insurance reserves of $7.4 million.
In addition to the above, we are periodically subject to various other claims and lawsuits. We believe that none of these other claims or lawsuits to which we are currently subject, individually or in the aggregate, will have a material adverse affect on our business, financial condition, results of operations and cash flows.
Item 4. (Removed and Reserved)
Item 5. Market for Registrant’s Common Equity, Related Stockholder Matters and Issuer Purchases of Equity Securities
Our common stock is traded on the NASDAQ Global Select Market under the symbol “LCAV.” There were approximately 11,238 record holders of our common stock as of February 18, 2011.
The following table sets forth the range of high and low sales prices of the common stock as reported on the NASDAQ Global Select Market for the specific periods.
| 2010 | 2009 | |||||||||||||||
| High | Low | High | Low | |||||||||||||
| First Quarter |
$ | 8.76 | $ | 4.59 | $ | 5.35 | $ | 1.99 | ||||||||
| Second Quarter |
9.40 | 5.54 | 8.02 | 2.72 | ||||||||||||
| Third Quarter |
5.76 | 3.94 | 7.92 | 3.50 | ||||||||||||
| Fourth Quarter |
7.08 | 4.90 | 7.01 | 4.23 | ||||||||||||
The Board of Directors may declare dividends in its discretion. There were no dividends paid in 2010 or 2009.
17
Table of Contents
Item 6. Selected Financial Data
The data set forth below should be read in conjunction with the Consolidated Financial Statements and related notes and “Management’s Discussion and Analysis of Financial Condition and Results of Operations.” All amounts are in thousands of U.S. Dollars, except procedure volume and per share data.
| Year Ended December 31, | ||||||||||||||||||||
| 2010 | 2009 | 2008 | 2007 | 2006 | ||||||||||||||||
| Consolidated Statements of Operations Data: |
||||||||||||||||||||
| Revenues: |
||||||||||||||||||||
| Laser refractive surgery |
$ | 99,825 | $ | 129,213 | $ | 205,176 | $ | 292,635 | $ | 238,925 | ||||||||||
| Operating costs and expenses: |
||||||||||||||||||||
| Medical professional and license fees |
24,161 | 28,746 | 41,797 | 49,312 | 42,954 | |||||||||||||||
| Direct costs of services |
46,631 | 63,579 | 77,474 | 97,423 | 77,612 | |||||||||||||||
| General and administrative expenses |
13,956 | 16,501 | 20,262 | 22,657 | 21,156 | |||||||||||||||
| Marketing and advertising |
24,114 | 33,784 | 52,429 | 66,469 | 47,971 | |||||||||||||||
| Depreciation |
9,408 | 14,198 | 17,972 | 11,209 | 8,453 | |||||||||||||||
| Consent revocation solicitation charges |
— | 780 | — | — | — | |||||||||||||||
| Impairment charges |
1,694 | 5,414 | 1,672 | — | — | |||||||||||||||
| Restructuring charges |
3,790 | 2,696 | 1,804 | — | — | |||||||||||||||
| 123,754 | 165,698 | 213,410 | 247,070 | 198,146 | ||||||||||||||||
| Gain (loss) on sale of assets |
1,962 | 385 | 22 | (596 | ) | (3 | ) | |||||||||||||
| Operating (loss) income |
(21,967 | ) | (36,100 | ) | (8,212 | ) | 44,969 | 40,776 | ||||||||||||
| Equity in earnings from unconsolidated businesses |
25 | 122 | 478 | 814 | 746 | |||||||||||||||
| Net investment income (loss) |
1,408 | 1,785 | (1,524 | ) | 5,953 | 6,182 | ||||||||||||||
| Other loss, net |
— | — | — | (11 | ) | (24 | ) | |||||||||||||
| (Loss) income before taxes on income |
(20,534 | ) | (34,193 | ) | (9,258 | ) | 51,725 | 47,680 | ||||||||||||
| Income tax expense (benefit) |
43 | (949 | ) | (2,623 | ) | 19,221 | 19,310 | |||||||||||||
| Net (loss) income |
$ | (20,577 | ) | $ | (33,244 | ) | $ | (6,635 | ) | $ | 32,504 | $ | 28,370 | |||||||
| Net (loss) income per common share |
||||||||||||||||||||
| Basic |
$ | (1.10 | ) | $ | (1.79 | ) | $ | (0.36 | ) | $ | 1.66 | $ | 1.37 | |||||||
| Diluted |
(1.10 | ) | (1.79 | ) | (0.36 | ) | 1.64 | 1.34 | ||||||||||||
| Cash dividends per common share |
$ | — | $ | — | $ | 0.24 | $ | 0.72 | $ | 0.54 | ||||||||||
| Weighted average shares outstanding |
||||||||||||||||||||
| Basic |
18,680 | 18,594 | 18,526 | 19,572 | 20,694 | |||||||||||||||
| Diluted |
18,680 | 18,594 | 18,526 | 19,858 | 21,235 | |||||||||||||||
| Selected Operating Data |
||||||||||||||||||||
| Laser vision correction procedures |
56,720 | 72,776 | 115,153 | 192,204 | 185,268 | |||||||||||||||
| At December 31, | ||||||||||||||||||||
| 2010 | 2009 | 2008 | 2007 | 2006 | ||||||||||||||||
| Balance Sheet Data |
||||||||||||||||||||
| Cash, cash equivalents and short-term investments |
$ | 50,928 | $ | 52,504 | $ | 56,335 | $ | 60,148 | $ | 95,232 | ||||||||||
| Working capital |
33,270 | 50,332 | 55,534 | 48,673 | 95,012 | |||||||||||||||
| Total assets |
80,775 | 112,635 | 157,482 | 179,647 | 190,159 | |||||||||||||||
| Debt obligations maturing in one year |
3,039 | 3,998 | 6,985 | 3,941 | 3,360 | |||||||||||||||
| Long-term debt obligations (less current portion) |
4,245 | 9,145 | 14,120 | 2,012 | 2,431 | |||||||||||||||
| Retained (deficit) earnings |
(31,134 | ) | (9,729 | ) | 23,515 | 34,597 | 16,320 | |||||||||||||
| Total stockholders’ investment |
31,130 | 51,027 | 82,985 | 93,599 | 109,116 | |||||||||||||||
18
Table of Contents
Item 7. Management’s Discussion and Analysis of Financial Condition and Results of Operations.
You should read the following discussion and analysis in conjunction with “Item 6. Selected Financial Data” above and with the financial statements and related notes included in “Item 8. Financial Statements and Supplemental Data” of this Form 10-K. This discussion contains forward-looking statements that involve risks and uncertainties. Our actual results could differ materially from those discussed here. Factors that could contribute to such differences include, but are not limited to, those discussed in “Item 1A. Risk Factors.”
Results of Operations
Overview
Key financial highlights for the year ended December 31, 2010 include (all comparisons are with 2009):
| • | Revenues were $99.8 million compared with $129.2 million; adjusted revenues were $93.7 million compared with $120.1 million. |
| • | We performed 56,720 laser vision correction procedures, compared with 72,776 procedures and 65,944 same-store procedures. |
| • | Operating loss was $22.0 million compared with operating loss of $36.1 million; adjusted operating loss was $27.5 million compared with adjusted operating loss of $44.3 million. The reduced operating loss and adjusted operating loss resulted from closing under-performing vision centers, lower direct costs per center, lower marketing and general and administrative expenses, and lower impairment charges. Direct costs per center averaged $65,000 per month, compared with $74,000 per month. Average marketing cost per procedure decreased to $425 from $464. Operating loss and adjusted operating loss for 2010 included $5.5 million in impairment and restructuring charges and $2.0 million in gain on sale of assets. Operating loss and adjusted operating loss for 2009 included $8.1 million in restructuring and impairment charges, $780,000 in consent revocation solicitation charges and $385,000 in gain on sale of assets. |
| • | Net loss was $20.6 million, or $1.10 per share, compared with net loss of $33.2 million, or $1.79 per share. |
| • | Net cash provided by operations was $1.5 million compared with $1.4 million. |
| • | Cash and investments were $51.9 million at December 31, 2010, compared with $54.6 million at December 31, 2009. |
We derive substantially all of our revenues from the delivery of laser vision correction procedures performed in our U.S. vision centers. Our revenues, therefore, depend on our volume of procedures and are impacted by a number of factors, including the following:
| • | General economic conditions and consumer confidence and discretionary spending levels, |
| • | Our ability to generate patients through our arrangements with managed care companies, direct-to-consumer advertising and word-of-mouth referrals, |
| • | The availability of patient financing, |
| • | The level of consumer acceptance of laser vision correction, and |
| • | The effect of competition and discounting practices in our industry. |
Other factors that impact our revenues include:
| • | Deferred revenue from the sale, prior to June 15, 2007, of separately priced acuity programs, and |
| • | Our mix of procedures among the different types of laser technology. |
19
Table of Contents
Because our revenues are primarily a function of the number of laser vision correction procedures performed and the pricing for these services, and many of our costs are fixed, our vision centers have a relatively high degree of operating leverage. As a result, our level of procedure volume can have a significant impact on our level of profitability. The following table details the number of laser vision correction procedures performed at our vision centers during the last three fiscal years.
| 2010 | 2009 | 2008 | ||||||||||
| First Quarter |
19,066 | 27,859 | 44,159 | |||||||||
| Second Quarter |
15,266 | 17,864 | 30,086 | |||||||||
| Third Quarter |
11,497 | 15,335 | 21,484 | |||||||||
| Fourth Quarter |
10,891 | 11,718 | 19,424 | |||||||||
| Year |
56,720 | 72,776 | 115,153 | |||||||||
Management uses same-store procedure volume as a means of measuring performance that adjusts for closed vision centers. The following table represents procedures for the 54 vision centers that remained open at December 31, 2010:
| 2010 | ||||
| First Quarter |
17,408 | |||
| Second Quarter |
13,943 | |||
| Third Quarter |
10,569 | |||
| Fourth Quarter |
10,671 | |||
| Year |
52,591 | |||
The current economy in the United States has severely impacted our procedure volume and operating results, resulting in a decline in consumer confidence levels and a reduction in high-end discretionary expenditures for many consumers. In response, in 2010 we reduced our workforce so that our staffing levels would be appropriate for our anticipated procedure volume. We also closed nine vision centers in 2010 and converted one vision center into a licensed facility. We have no current plans to open vision centers in new markets until the economy improves. We continue leveraging consumer insights from extensive market research conducted over the past several months in an effort to optimize our marketing efforts.
We have provided both adjusted revenues and operating losses as a means of measuring performance that adjusts for the non-cash impact of accounting for separately priced extended warranties. We believe that the adjusted information better reflects operating performance and therefore is more meaningful to investors. A reconciliation of revenues and operating losses reported in accordance with U.S. Generally Accepted Accounting Principles (“U.S. GAAP”) is provided below (dollars in thousands).
| Twelve Months Ended December 31, | ||||||||||||
| 2010 | 2009 | 2008 | ||||||||||
| Revenues |
||||||||||||
| Reported U.S. GAAP |
$ | 99,825 | $ | 129,213 | $ | 205,176 | ||||||
| Adjustments |
||||||||||||
| Revenues deferred |
— | — | — | |||||||||
| Amortization of prior deferred revenue |
(6,151 | ) | (9,107 | ) | (18,719 | ) | ||||||
| Adjusted revenues |
$ | 93,674 | $ | 120,106 | $ | 186,457 | ||||||
| Operating Loss |
||||||||||||
| Reported U.S. GAAP |
$ | (21,967 | ) | $ | (36,100 | ) | $ | (8,212 | ) | |||
| Adjustments |
||||||||||||
| Impact of prior deferred revenue |
(6,151 | ) | (9,107 | ) | (18,719 | ) | ||||||
| Amortization of prior professional fees |
615 | 911 | 1,872 | |||||||||
| Adjusted operating loss |
$ | (27,503 | ) | $ | (44,296 | ) | $ | (25,059 | ) | |||
20
Table of Contents
Revenues
In 2010, revenues decreased by $29.4 million, or 22.7%, to $99.8 million, from $129.2 million in 2009, compared to a decrease of $76.0 million, or 37.0% in 2009. In 2010, adjusted revenues were $93.7 million compared with $120.1 million in 2009 and $186.5 million in 2008. For vision centers open at least 12 months, procedure volume decreased by approximately 14.0% in 2010 to 56,720, compared to 65,944 in 2009. The components of the revenue change include the following (dollars in thousands):
| 2010 | 2009 | 2008 | ||||||||||
| Decrease in revenues from lower procedure volume |
$ | (26,498 | ) | $ | (68,617 | ) | (114,100 | ) | ||||
| Impact from increase in average selling prices, before revenue deferral |
66 | 2,266 | 15,935 | |||||||||
| Change in deferred revenues |
(2,956 | ) | (9,612 | ) | 10,706 | |||||||
| Decrease in revenues |
$ | (29,388 | ) | $ | (75,963 | ) | $ | (87,459 | ) | |||
The adjusted revenue per procedure, which excludes the impact of deferred revenue from the sale of separately priced acuity programs, increased slightly to $1,652 in 2010 from $1,650 in 2009. The adjusted revenue per procedure increased about 2% in 2009 from $1,619 in 2008, primarily as a result of the addition of the femtosecond laser in all vision centers.
We experienced increases in both appointment show rates and treatment show rates in 2010 compared to 2009. We attribute these improvements to efforts to improve patient interactions, promotions run throughout the year, and organizational effectiveness. Candidacy rates declined slightly in 2010 compared to 2009. We have seen a slight increase in conversion rates compared to 2009. Patient activity with respect to inquiries remains down as a result of economic uncertainty and other macroeconomic factors which results in lower procedure volumes. Industry sources indicate that the entire laser vision correction industry continues to be impacted negatively.
Amortization of prior deferred revenues for 2010, 2009 and 2008 were $6.2 million, $9.1 million and $18.7 million, respectively.
Operating Costs and Expenses
Our operating costs and expenses include:
| • | Medical professional and license fees, including per procedure fees for the ophthalmologists performing laser vision correction, and per procedure license fees paid to certain equipment suppliers of our excimer and femtosecond lasers, |
| • | Direct costs of services, including the salary component of physician compensation for certain physicians employed by us, staff salaries, facility costs of operating laser vision correction centers, equipment lease and maintenance costs, surgical supplies, financing charges for third-party patient financing, and other costs related to revenues, |
| • | General and administrative costs, including corporate headquarters and call center staff expense and other overhead costs, |
| • | Marketing and advertising costs, and |
| • | Depreciation of equipment and leasehold improvements. |
21
Table of Contents
2010 Compared to 2009
Our operating costs and expenses correlate in part with revenues and procedure volumes due to the fact that some of our costs are variable and some are fixed in nature. The following table shows the change in components of operating expenses between 2009 and 2010 in dollars and as a percent of revenues for each period (dollars in thousands):
| (Decrease)/ | % of Revenues | |||||||||||||||||||
| 2010 | 2009 | Increase | 2010 | 2009 | ||||||||||||||||
| Medical professional and license fees |
$ | 24,161 | $ | 28,746 | $ | (4,585 | ) | 24.2 | % | 22.2 | % | |||||||||
| Direct costs of services |
46,631 | 63,579 | (16,948 | ) | 46.7 | % | 49.2 | % | ||||||||||||
| General and administrative expenses |
13,956 | 16,501 | (2,545 | ) | 14.0 | % | 12.8 | % | ||||||||||||
| Marketing and advertising |
24,114 | 33,784 | (9,670 | ) | 24.2 | % | 26.1 | % | ||||||||||||
| Depreciation |
9,408 | 14,198 | (4,790 | ) | 9.4 | % | 11.0 | % | ||||||||||||
| Consent revocation solicitation charges |
— | 780 | (780 | ) | 0.0 | % | 0.6 | % | ||||||||||||
| Impairment charges |
1,694 | 5,414 | (3,720 | ) | 1.7 | % | 4.2 | % | ||||||||||||
| Restructuring charges |
3,790 | 2,696 | 1,094 | 3.8 | % | 2.1 | % | |||||||||||||
Medical professional and license fees
Medical professional and license fees decreased $4.6 million, or 16.0%, in 2010 from 2009. Medical professional fees decreased $2.7 million, or 21.2%, due to lower costs and physician fees associated with continued lower procedure volumes and revenues. License fees decreased $2.1 million, or 15.5%, as a result of lower procedures volumes in 2010 partially offset by lower volume rebates on purchases. The amortization of the deferred medical professional fees associated with the sale of separately priced extended acuity programs also impacted medical professional and license fees. We amortized deferred medical professional fees attributable to prior years of $615,000 in 2010 compared to $911,000 in 2009.
Direct costs of services
Direct costs of services in 2010 decreased by $16.9 million, or 26.7%, from 2009. Salaries, employee incentives, and fringe benefits declined by $5.1 million in 2010 as a result of our workforce reductions. Rent and utilities expense decreased by $1.9 million as a result of closed vision centers. Laser rent declined by $1.7 million as a result of lower procedure fees and volumes. The decrease was also attributed to a $1.6 million decline in financing fees and laser maintenance expense declined by $1.2 million. We reduced bad debt expense by $2.3 million due to lower procedure revenue and improved collection experience. Other decreases in direct costs include repairs and maintenance, professional services, state and local taxes, deferred compensation market value changes, and insurance costs. These decreases in direct costs of services were offset partially by increased stock-based compensation and employee training costs. Direct costs as a percentage of revenues decreased to 46.7% in 2010 from 49.2% in 2009.
General and administrative
General and administrative expenses in 2010 decreased $2.5 million, or 15.4%, from 2009, due primarily to workforce reductions resulting in lower salaries and fringe benefits by $1.5 million. Reduced professional fees of $1.2 million, and travel and entertainment reductions of $218,000 also contributed to this decrease. Increases to employee incentives and stock based compensation in 2010 due to the attainment of internal performance objectives partially offset the decreased expenses.
Marketing and advertising expenses
Marketing and advertising expenses in 2010 decreased $9.7 million, or 28.6%, from 2009. These expenses constituted 24.2% of revenues during 2010, down from 26.1% in 2009. Marketing cost per eye decreased to $425 for 2010 from $464 in 2009 due primarily to more effective spending on media. Due largely to deteriorating returns on some marketing initiatives driven by lower procedure volume and continuing declined consumer confidence, we continued to reduce marketing spending levels significantly in 2010 in an attempt to align spending levels with consumer demand. We are continuing to work to develop more efficient marketing techniques and expand local initiatives as a means to attract patients. Our future operating profitability will depend in large part on the success of our efforts in this regard.
Consent Revocation Solicitation Charges
In 2009, we incurred $780,000 in charges related to our successful defense of a consent solicitation by a stockholder group, which did not recur in 2010.
22
Table of Contents
Impairment Charges
In 2010, we recorded impairment charges to reduce the carrying amount of long-lived assets by approximately $1.7 million compared to a $5.4 million charge in 2009. These impairment charges reflected our decision in 2010 to consolidate vision center operations in four markets and close vision centers in six additional underperforming markets (including one licensed facility) in order to preserve cash. Based on this evaluation and evaluating the recoverability of assets held for use, we determined that leasehold improvements with a carrying amount of $1.2 million and excimer and femtosecond lasers and other equipment with a carrying amount of $1.8 million were no longer recoverable and were in fact impaired. The leasehold improvements for the closed vision centers were written down to zero. We adjusted the carrying value of the excimer and femtosecond lasers and other equipment to their fair value less cost to sell, which we determined based on estimated market prices of similar assets. We are actively marketing and selling unused excimer and femtosecond lasers and other equipment at December 31, 2010. Because of deteriorating market conditions, it is reasonably possible that our estimates may change in the near term resulting in the need to adjust our determination of fair value.
Restructuring Charges
Restructuring charges in 2010 of $3.8 million resulted primarily from the consolidation of vision center operations in four markets, the closure of additional underperforming vision centers, and an 8% workforce reduction in our continued efforts to reduce costs and increase operational efficiencies. The restructuring charges included $3.6 million of contract termination costs and other center closure costs and $195,000 of employee separation benefits. Other center closure costs incurred in 2010 were primarily expenses related to the closures of facilities and the relocation of various medical equipment. We successfully negotiated one lease buy-out agreement with respect to the closed vision centers in 2010.
Depreciation expense
Depreciation expense decreased by $4.8 million, or 33.7%, in 2010 compared to 2009 as a result of minimal capital expenditures since 2007 and a reduction in fixed assets related to sales of equipment and abandonment of leasehold improvements for closed vision centers.
Non-operating income and expenses
We recorded net investment income of $1.4 million in 2010 compared to $1.8 million in 2009. The decrease was due primarily to lower patient financing income of $796,000 and lower earnings on deferred compensation assets of $668,000 due to the distribution of the deferred compensation plan assets in January 2010. The reduction in patient financing income was due to reduced procedure volume and a lower amount of financing per patient as a result of increases in down payment requirements and other more stringent lending prequalifications implemented in 2009. Offsetting the decrease was a $1.0 million realized gain on the sale of equity securities in our investment portfolio, and an $86,000 other-than-temporary loss on auction rate securities in 2010 compared to a $365,000 other-than-temporary loss on various auction rate securities and equity securities in 2009. Investment income of $251,000 in 2010, as compared to $293,000 in 2009, resulted from our investment portfolio being comprised of high quality U.S. Treasuries and money market accounts that earn a low rate of return. Interest expense was $272,000 lower in 2010 due to reductions in debt.
Income taxes
Our effective income tax rate was 0.2% during 2010 compared to a tax benefit of 2.8% during 2009. Our effective tax rate was impacted significantly by a valuation allowance against all of our net deferred tax assets during both 2010 and 2009. We established a full valuation allowance on our net deferred tax assets in 2009 and continued the allowance in 2010 due to increased uncertainty with respect to our ability to realize the net deferred tax assets in future periods. The impact of the valuation allowance on our 2010 and 2009 effective tax rate was 37.4% and 35.6%, respectively. Our provision for income taxes in 2010 included interest on uncertain tax positions and state taxes in our jurisdiction, offset in part by favorable adjustments to our 2009 federal tax return which will allow us to claim a small incremental refund on U.S. federal income taxes previously paid.
23
Table of Contents
2009 Compared to 2008
Our operating costs and expenses have some degree of correlation with revenues and procedure volumes because some of our costs are variable and some are fixed in nature. The following table shows the change in components of operating expenses between 2008 and 2009 in dollars and as a percent of revenues for each period (dollars in thousands):
| (Decrease)/ | % of Revenues | |||||||||||||||||||
| 2009 | 2008 | Increase | 2009 | 2008 | ||||||||||||||||
| Medical professional and license fees |
$ | 28,746 | $ | 41,797 | $ | (13,051 | ) | 22.2 | % | 20.4 | % | |||||||||
| Direct costs of services |
63,579 | 77,474 | (13,895 | ) | 49.2 | % | 37.8 | % | ||||||||||||
| General and administrative expenses |
16,501 | 20,262 | (3,761 | ) | 12.8 | % | 9.9 | % | ||||||||||||
| Marketing and advertising |
33,784 | 52,429 | (18,645 | ) | 26.1 | % | 25.6 | % | ||||||||||||
| Depreciation |
14,198 | 17,972 | (3,774 | ) | 11.0 | % | 8.8 | % | ||||||||||||
| Consent revocation solicitation charges |
780 | — | 780 | 0.6 | % | 0.0 | % | |||||||||||||
| Impairment charges |
5,414 | 1,672 | 3,742 | 4.2 | % | 0.8 | % | |||||||||||||
| Restructuring charges |
2,696 | 1,804 | 892 | 2.1 | % | 0.9 | % | |||||||||||||
Medical professional and license fees
Medical professional and license fees decreased $13.1 million, or 31.2%, in 2009 from 2008. Medical professional fees decreased $7.8 million, or 36.5%, due to lower costs and physician fees associated with lower procedure volumes and revenues. License fees decreased $5.2 million, or 25.7%, as a result of lower procedures volumes in 2009 partially offset by lower volume rebates on purchases. The amortization of the deferred medical professional fees associated with the sale of separately priced extended acuity programs also impacted medical professional and license fees. We amortized deferred medical professional fees attributable to prior years of $911,000 in 2009 compared to $1.9 million in 2008.
Direct costs of services
Direct costs of services in 2009 decreased by $13.9 million, or 17.9%, from 2008. Lower salaries, fringe benefits and travel and entertainment expense as a result of our workforce reductions primarily drove the decrease in direct costs of services in 2009 compared to 2008. This decrease was also the result of lower procedure volumes which drove lower bad debt, surgical supplies, equipment expense, insurance, rent, and financing fees. These decreases in direct costs of services were offset partially by increased laser rent, deferred compensation, state and local taxes and professional services. Direct costs as a percentage of revenues increased to 49.2% in 2009 from 37.8% in 2008 due to a 37.0% decline in revenues as a result of lower procedure volume.
General and administrative
General and administrative expenses in 2009 decreased $3.8 million, or 18.6%, from 2008, due primarily to workforce reductions resulting in lower salaries and fringe benefits. The decrease was also the result of lower professional fees, contracted services, and telecommunications in 2009.
Marketing and advertising expenses
Marketing and advertising expenses in 2009 decreased $18.6 million, or 35.6%, from 2008. These expenses were 26.1% of revenues during 2009, up slightly from 25.6% in 2008. Due largely to declining consumer confidence that resulted in deteriorating returns on some marketing initiatives, we reduced marketing spending levels significantly in 2009 to align our spending better with anticipated consumer demand.
Consent Revocation Solicitation Charges
In 2009, we incurred $780,000 in charges related to our successful defense of a consent revocation solicitation initiated by a stockholder group.
Impairment Charges
In 2009, we recorded impairment charges to reduce the carrying amount of long-lived assets by $5.4 million. These impairment charges reflected our decision in 2009 to close underperforming vision centers by December 31, 2009 in order to preserve cash. Based on this evaluation, we determined that leasehold improvements with a carrying amount of $2.5 million and excimer lasers with a carrying amount of $3.7 million were no longer recoverable and were in fact impaired. The leasehold improvements were written down to their estimated fair value of zero. We adjusted the carrying value of the excimer lasers to their fair value less cost to sell, which we determined based on discounted cash flows and estimated market prices of similar assets. We were actively marketing and selling the unused excimer lasers at December 31, 2009. Included in the 2009 impairment charges was $487,000 related primarily to the disposal of microkeratomes.
24
Table of Contents
Restructuring Charges
Restructuring charges in 2009 of $2.7 million resulted from the closing of underperforming vision centers in our effort to reduce costs and increase operational efficiencies. The restructuring charges included $2.2 million of contract termination costs and other center closure costs and $922,000 of employee separation benefits. Partially offsetting the charges was a benefit of $435,000 due to a change in estimate to certain previously recognized contract termination costs related to our vision centers closed in 2008 after successful negotiations of certain terms with the lessors in 2009. We successfully negotiated rent buy-outs or sublease agreements with respect to all of the closed vision centers.
Depreciation expense
Depreciation expense decreased by $3.8 million, or 21.0%, in 2009 compared to 2008 as a result of $5.4 million in impairment of assets for the closed vision centers and the microkeratomes, as well as the disposal of our Bausch & Lomb lasers. In addition, the 2008 impairment charges of $1.7 million did not occur until the end of the year and capital expenditures were minimal in 2009 compared with $14.9 million in 2008.
Non-operating income and expenses
We recorded net investment income of $1.8 million in 2009 compared to a net investment loss of $1.5 million in 2008. The $3.3 million increase was due primarily to $3.1 million in other-than-temporary impairments on our auction rate security and equity investments occurring in 2008 and a $2.4 million increase in fair value of deferred compensation assets resulting from changing market conditions in 2009 compared with 2008. Offsetting these increases were decreases in patient financing income of $1.1 million and investment income of $788,000. The reduction in patient financing income was due to reduced procedure volume and a lower amount of financing per patient as a result of increases in down payment requirements and other more stringent lending prequalifications. The reduction in investment income resulted from a shifting of our investment portfolio from taxable and tax exempt bond instruments to higher quality U.S. Treasury money market accounts that earn a lower rate of return.
Income taxes
Our effective income tax rate decreased from 28.3% during 2008 to 2.8% during 2009. Our effective tax rate was significantly impacted by the recognition of a $12.2 million valuation allowance against all of our net deferred tax assets during 2009. We established a full valuation allowance on our net deferred tax assets in 2009 due to increased uncertainty with respect to our ability to realize the net deferred tax assets in future periods. We established a valuation allowance of $1.2 million in 2008 for the tax benefit generated from the loss on investments because we did not have capital gains to offset this capital loss. The impact of the valuation allowance on our 2009 and 2008 effective tax rate was 35.6% and 12.5%, respectively.
Liquidity and Capital Resources
Our cash flows from operating, investing and financing activities, as reflected in the Consolidated Statements of Cash Flows, are summarized as follows (dollars in thousands).
| 2010 | 2009 | 2008 | ||||||||||
| Cash provided by (used in): |
||||||||||||
| Operating activities |
$ | 1,469 | $ | 1,401 | $ | 6,931 | ||||||
| Investing activities |
(709 | ) | 6,396 | (8,448 | ) | |||||||
| Financing activities |
(6,039 | ) | (7,980 | ) | 8,315 | |||||||
| Net effect of exchange rate changes on cash and cash equivalents |
211 | 584 | (764 | ) | ||||||||
| Net (decrease) increase in cash and cash equivalents |
$ | (5,068 | ) | $ | 401 | $ | 6,034 | |||||
Cash flows generated from operating activities, a major source of our liquidity, amounted to $1.5 million in 2010, $1.4 million in 2009 and $6.9 million in 2008. Cash flows generated from operating activities during 2010 and 2009 reflect primarily lower earnings on reduced procedure volumes. We are balancing cash conservation in the continued challenging economic environment against our longer-term objective of managing to profitability and growth when the economy improves. Our cost control and cash conservation measures are having the desired results as we continue to take actions that we believe are prudent given the continued economic environment. Among these, we consolidated four markets, closed under-performing vision centers, and reduced headcount in the vision centers, national call center and corporate offices during 2010 and 2009, reduced marketing expense significantly, and continued reducing costs in all other discretionary areas. We are also closely managing working capital with particular focus on ensuring timely collection of outstanding patient receivables and the management of our trade payable obligations. In 2010, we negotiated more favorable terms with two of our largest vendors. We also changed marketing vendors to those with whom we have a more favorable billing process, requiring less prepayments. Gross patient receivables declined $3.3 million in 2010, due primarily to reduced procedure volume. In 2010, cash flow from operations included an $11.8 million federal income tax refund. We do not anticipate receiving a federal income tax refund in 2011 and our cash flow will depend largely upon procedure volume. At December 31, 2010, working capital (excluding debt due within one year) amounted to $36.3 million compared to $54.3 million at
25
Table of Contents
the end of 2009. Liquid assets (cash and cash equivalents, short-term investments, and accounts receivable) amounted to 197.9% of current liabilities at December 31, 2010, compared to 199.3% at December 31, 2009.
We believe that the available cash and short-term investments provide sufficient cash reserves and liquidity to fund our working capital needs, capital expenditures and debt and capital lease obligations for at least the next 12 months. Total operating expenses, excluding depreciation expense, were reduced by $37.2 million from 2009 to 2010. We ended 2010 with $51.9 million in cash and investments. As a result of aggressive efforts to reduce costs, we estimate the number of procedures companywide required for breakeven cash flow, after capital expenditures and debt service, to be approximately 70,000 per year. We believe that we have sufficient cash and investments to fund our business beyond 2012 if we perform at least 47,000 procedures annually, compared with the previous expectation of 52,000. We believe that we have sufficient cash and investments to fund our business beyond 2013 at 52,500 procedures annually. The average number of procedures required for each vision center to reach breakeven remains at 95 per month. Procedure volume for 54 vision centers that remained open at December 31, 2010 was 52,591. There can be no assurance as to the number of procedures that we will perform in 2011.
We continue to offer our own sponsored patient financing. As of December 31, 2010, we had $2.7 million in patient receivables, net of allowance for doubtful accounts, which was a decrease of $2.7 million, or 51%, from December 31, 2009, due primarily to lower procedure volume in 2010. We continually monitor the allowance for doubtful accounts and will adjust our lending criteria or require greater down payments if our experience indicates that is necessary. However, our ability to collect successfully patient accounts depends, in part, on overall economic conditions. Bad debt expense was 1.1% of revenue in 2010 and 2.6% in 2009. We attribute the decrease in bad debt expense to improved collection experience within our 12-month and 18-month patient financing plans resulting from improvements to our underwriting standards that were implemented in 2009, including analysis of FICO scores for patients and requiring varying down payments depending upon a patient’s credit score.
Our cash conservation measures also impacted cash flows from investing activities. Capital expenditures of $878,000 in 2010 were up from $240,000 in 2009, but still minimal, as we curtailed new vision center openings and vision center relocations.
At December 31, 2010 and 2009, we held at par value $2.2 million and $2.4 million, respectively, of various auction rate securities. The assets underlying the auction rate instruments are primarily municipal bonds and closed end preferred stock funds. Our auction rate instruments are not currently liquid. Maturity dates for our auction rate securities range from 2030 to 2049. In 2010, $125,000 of the related securities were called at par by their issuers. In 2009, $1.0 million of the securities were called at par by their issuers, and we redeemed an additional $2.3 million at 46.9% of original par value. In January 2011, auction rate municipal debt with a par value of $1.1 million was redeemed for $891,000.
In April 2008, we entered into a five-year loan agreement with PNC Equipment Finance, LLC to finance the majority of the IntraLase units which we purchased. The remaining unpaid balance on this bank loan was $7.3 million at December 31, 2010. The loan agreement contains no financial covenants and is secured by certain medical equipment. Loan repayments increased approximately $1.3 million in 2010 compared to 2009 due primarily to additional repayments with respect to femtosecond lasers which we sold.
In March and April 2009, we entered into five-year lease agreements with Alcon and AMO, respectively, for new excimer lasers which allowed us to standardize our excimer treatment platforms and reduce the number of platforms at each of our vision centers from three to two. The standardization of our excimer laser platforms reduced equipment and maintenance costs, and allowed us to continue to offer the same broad spectrum of treatment options that included a standard treatment, a custom wavefront guided treatment, an optimized treatment and IntraLase femtosecond technology. As part of the transactions, we disposed of our Bausch & Lomb lasers and retired $1.9 million in related capital lease obligations. We received cash payments totaling $6.8 million from the lessors that may be partially refundable if we do not perform a minimum number of procedures over the term of the agreements. We have deferred these amounts and are recognizing them ratably over the lease terms. The unrecognized portion is included in “Accrued liabilities and other” for the current portion and in “Deferred license fees” for the long-term portion in our Condensed Consolidated Balance Sheet at December 31, 2010 and 2009. The AMO laser lease qualified as a capital lease, and the Alcon laser lease qualified as an operating lease.
26
Table of Contents
We have not opened any new vision centers in 2010 or 2009. The following is a list of the vision centers that we closed in the last two fiscal years:
| 2010 |
2009 | |
| San Jose, CA |
Alpharetta, GA | |
| Savannah, GA |
Charlotte, NC | |
| Birmingham, AL |
Las Vegas, NV | |
| Long Island, NY |
Scarsdale, NY | |
| Sugarland, TX |
Nashville, TN | |
| Arlington, TX |
Colorado Springs, CO | |
| Buckhead, GA |
New Haven, CT | |
| Raleigh, NC |
Fresno, CA | |
| San Diego, CA |
Grand Rapids, MI | |
| Sacramento, CA | ||
| Concord, CA | ||
| San Mateo, CA |
The following table aggregates our obligations and commitments to make future payments under existing contracts at December 31, 2010 (dollars in thousands). We have excluded contractual obligations for which the ultimate settlement of quantities or prices are not fixed and determinable. We also excluded from the table $539,000 of unrecognized tax benefits due to the uncertainty regarding the timing of future cash flows.
| Contractual Obligations |
Total | Less than 1 year |
1 - 3 years | 3 - 5 years | More than 5 years |
|||||||||||||||
| Long-term debt obligations (a) |
$ | 7,726 | $ | 3,331 | $ | 4,395 | $ | — | $ | — | ||||||||||
| Operating lease obligations |
26,406 | 8,737 | 11,596 | 3,174 | 2,899 | |||||||||||||||
| Total |
$ | 34,132 | $ | 12,068 | $ | 15,991 | $ | 3,174 | $ | 2,899 | ||||||||||
| (a) | Includes fixed rate interest payments |
Gross property and equipment decreased $7.7 million from $80.0 million at December 31, 2009, to $72.3 million at December 31, 2010. As a result of the vision center closures, we wrote down assets with a gross cost basis of $7.3 million to zero or their adjusted fair value in the third quarter of 2010. In 2010, we recorded asset impairment charges of $1.7 million as a result of closing vision centers. We reclassified gross assets of $3.2 million, with a net book value of $341,000, consisting primarily of lasers from closed vision centers, to assets held for sale.
Critical Accounting Estimates
Our accounting policies are more fully described in Note 1 to the Consolidated Financial Statements. As disclosed in Note 1, the preparation of financial statements in conformity with generally accepted accounting principles requires management to make estimates and assumptions about future events that affect the amounts reported in the financial statements and accompanying notes. Actual results could differ significantly from those estimates. We believe that the following discussion addresses our most critical accounting policies, which are those that are most important to the portrayal of our financial position and results of operations and require management’s most difficult, subjective and complex judgments.
Revenue Recognition, Patient Receivables and Allowance for Doubtful Accounts
We recognize revenues as services are performed and persuasive evidence of an arrangement for payment exists. Additionally, revenue is recognized when the price is fixed and determinable and collectability is reasonably assured. We deferred revenues associated with separately priced acuity programs and recognize them over the period in which future costs of performing post-surgical enhancement procedures are expected to be incurred because we have sufficient experience to support the costs associated with future enhancements that will be incurred on other than a straight-line basis. Effective June 15, 2007, we changed our pricing model and no longer offer separately priced acuity options. We report all revenues net of tax assessed by applicable governmental authorities.
27
Table of Contents
A significant percentage of our patients finance some or all of the cost of their procedure. We provide financing to some of our patients, including those who could not otherwise obtain third-party financing. We derive approximately 5% of our revenues from patients to whom we have provided direct financing. The terms of our direct financing require the patient to pay an up-front fee, which is intended to cover some or all of our variable costs, and then generally we deduct the remainder automatically from the patient’s checking account over a period of 12 to 36 months. Our direct financing program exposes us to significant credit risks, particularly given that patients who participate in the program generally have not been deemed creditworthy by third-party financing companies. To ensure that collectability is reasonably assured at the time of the service offering, we actively monitor our bad debt experience and adjust underwriting standards as necessary. In addition to increasing underwriting standards in 2010 and 2009, which included an increase in the minimum deposits required, we took steps to continue to improve collection results from internally financed patients through the use of credit scores to qualify patients for appropriate financing options.
Based upon our own experience with patient financing, we have established an allowance for doubtful accounts as of December 31, 2010 of $1.7 million against patient receivables of $4.4 million, compared to an allowance of $2.3 million against patient receivables of $7.7 million at December 31, 2009. Our policy is to reserve for all patient receivables that remain open past the financial maturity date and to provide reserves for patient receivables prior to the maturity date so as to bring patient receivables, net of reserves, down to the estimated net realizable value based on historical collectability rates, recent default activity and the current credit environment. Any excess in our actual allowance for doubtful account write-offs over our estimated bad debt reserve, would adversely impact our results of operations and cash flows. To the extent that our actual allowance for doubtful account write-offs are less than our estimated bad debt reserve, it would favorably impact our results of operations and cash flows.
We have established an allowance for doubtful accounts as of December 31, 2010 of $289,000 against other accounts receivables of $2.7 million, due to collectability issues that arose in the period. At December 31, 2009, there was no allowance against other receivables of $2.0 million.
For patients whom we finance with an initial term over 12 months, we charge interest at market rates and we recognize revenues based upon the present values of the expected payments. Finance and interest charges on patient receivables were $740,000 in 2010, $1.5 million in 2009 and $2.6 million in 2008. We include these amounts in “Net investment income (loss)” within the Consolidated Statements of Operations.
Insurance Reserves
We maintain a captive insurance company to provide professional liability insurance coverage for claims brought against us after December 17, 2002. In addition, our captive insurance company’s charter allows it to provide professional liability insurance for our doctors, none of whom are currently insured by the captive. We use the captive insurance company for both primary insurance and excess liability coverage. Our captive insurance company has a number of pending claims. We consolidate the financial statements of the captive insurance company with our financial statements because it is a wholly-owned enterprise. As of December 31, 2010 and 2009, we maintained insurance reserves of $7.4 million and $9.2 million, respectively, which represent primarily an actuarially determined estimate of future costs associated with claims filed as well as claims incurred but not yet reported. The $1.8 million decrease in the reserve was driven principally by lower procedure volumes in 2010, favorable claim experience and claim payments. Our actuaries determine loss reserves by comparing our historical claim experience to comparable insurance industry experience. Since the inception of the captive insurance company in 2002, it has disbursed total claims and legal expenses of $4.9 million.
Our actuaries determine our loss reserves based on our historical claim experience, comparable industry experience and recent trends that would impact the ultimate settlement of claims. We believe that the recorded loss reserves are reasonable based on this analysis. However, due to the uncertainties inherent in the determination of these liabilities, the ultimate settlement of claims incurred through December 31, 2010 could differ from the amounts recorded. We record any adjustment to these estimates in the period determined.
Accrued Enhancement Expense
We include participation in our LasikPlus Advantage Plan® (“acuity program”) in the base surgical price for substantially all of our patients. Under the acuity program, if determined to be medically appropriate, we provide post-surgical enhancements free of charge should the patient not achieve the desired visual correction during the initial procedure. Under this pricing structure, we account for the acuity program as a warranty obligation. Accordingly, we accrue the costs expected to be incurred to satisfy the obligation as a liability and direct cost of service at the point of sale given our ability to reasonably estimate such costs based on historical trends and the satisfaction of all other revenue recognition criteria.
We record the post-surgical enhancement accrual based on our best estimate of the number and associated cost of the procedures to be performed. Each month, we review the enhancement accrual and consider factors such as procedure cost and historical procedure volume when determining the appropriateness of the recorded balance.
28
Table of Contents
The key assumption we used to determine our enhancement accrual is the rate in which enhancements are likely to occur. We determine the rate based on an analysis of historical enhancements performed and compare it to the original procedure date. A +/- 1.0% change in our enhancement rate would result in a $767,000 increase/decrease to the enhancement accrual at December 31, 2010.
Impairment of Property and Equipment
We assess the impairment of property and equipment whenever events or circumstances indicate that the carrying value might not be recoverable. We write down recorded values of property and equipment that are not expected to be recovered through undiscounted future net cash flows to fair value, which is generally determined from estimated discounted cash flows for assets held for use. In evaluating the recoverability of our recorded values and property and equipment, we analyzed the future undiscounted net cash flows for each of our laser vision correction centers, the lowest level for which there are identifiable cash flows. The key assumption we used to determine the cash flow forecasts included a cash flow period of five years, which is reflective of the remaining useful life of the primary assets within the laser vision correction centers.
During 2010, we recognized $1.7 million in impairment charges due primarily to reducing the carrying amount of long-lived assets. These impairment charges recognized during 2010 reflect our decision to close underperforming vision centers in order to preserve cash and increase operational effectiveness. Based on this evaluation and evaluating the recoverability of assets held for use, we determined that leasehold improvements with a carrying amount of $1.2 million and excimer and femtosecond lasers and other equipment with a carrying amount of $1.8 million were no longer recoverable and were in fact impaired. The leasehold improvements for the closed vision centers were written down to zero. We adjusted the carrying value of the excimer and femtosecond lasers and other equipment to their fair value less cost to sell, which we determined based on estimated market prices of similar assets. We are actively marketing and selling our unused excimer and femtosecond lasers at December 31, 2010, which is reflected by $462,000 in assets held for sale at that date. Based on current estimates, we believe the carrying amount for remaining property and equipment is recoverable through future undiscounted cash flows. Because of deteriorating market conditions, it is reasonably possible that our estimate of discounted cash flows may change in the near term resulting in the need to adjust our determination of fair value or recoverability.
Deferred Tax Valuation Allowance
U.S. GAAP requires a company to establish a valuation allowance for deferred tax assets when it is more-likely-than-not that the deferred tax asset will not be realized. Deferred tax assets may be realized through future reversals of existing taxable temporary differences, future taxable income, taxable income in prior carryback year(s) if carryback is permitted, and tax planning strategies.
We considered all positive and negative evidence in determining whether or not the deferred tax assets are more-likely-than-not to be realized, including the current economic conditions. After considering all of the evidence, we believe that reliance on future projections of income is no longer sufficient to support realization of our deferred tax assets. Accordingly, we maintain a valuation allowance against our net deferred tax assets because we believe that it is not more-likely-than-not that our net deferred tax assets will be utilized. The valuation allowance was $21.1 million and $13.3 million at December 31, 2010 and 2009, respectively.
Item 7A. Quantitative and Qualitative Disclosures About Market Risk
The carrying values of financial instruments including cash and cash equivalents, patient and other accounts receivable, and accounts payable approximate fair value because of the short maturity of these instruments. We record investments at fair value.
We record short-term investments at market value. Due to the short-term nature of our investments in corporate bonds and the significant portion of the investments in Treasury money market funds, municipal and U.S. Government bonds, we believe that there is little risk to the valuation of debt securities.
Long-term investments include auction rate securities that are currently failing auction. We record these investments at fair value using a trinomial discounted cash flow model. We are divesting all auction rate securities as the market allows. Many of the issuers of the auction rate securities are redeeming their issues so as to reduce the overall interest costs for the issuer. There can be no assurance, however, that the issuers of the auction rate securities we hold will do so in advance of their maturity or the restoration of a regularized auction market. The recent disruptions in the credit and financial markets are having a significant adverse impact to the fair market value of these instruments. At December 31, 2010, the par value of our auction rate securities held by us was $1.1 million and the fair value was $951,000. Continuing uncertainty in the credit markets, lack of liquidity and rising risk of defaults may adversely impact the fair value of these investments in future periods.
We have a low exposure to changes in foreign currency exchange rates and, as such, have not used derivative financial instruments to manage foreign currency fluctuation risk. In addition, because our capital leases and secured indebtedness are at fixed rates, we have limited interest-rate risk.
29
Table of Contents
Item 8. Financial Statements and Supplementary Data
Index to Financial Statements
30
Table of Contents
Report of Independent Registered Public Accounting Firm
The Board of Directors and Stockholders of LCA-Vision Inc.
We have audited the accompanying consolidated balance sheets of LCA-Vision Inc. as of December 31, 2010 and 2009, and the related consolidated statements of operations, stockholders’ investment, and cash flows for each of the three years in the period ended December 31, 2010. Our audits also included the financial statement schedule listed in the Index at Item 15.(a)(2). These financial statements and schedule are the responsibility of LCA-Vision Inc.’s management. Our responsibility is to express an opinion on these financial statements and schedule based on our audits.
We conducted our audits in accordance with the standards of the Public Company Accounting Oversight Board (United States). Those standards require that we plan and perform the audit to obtain reasonable assurance about whether the financial statements are free of material misstatement. An audit includes examining, on a test basis, evidence supporting the amounts and disclosures in the financial statements. An audit also includes assessing the accounting principles used and significant estimates made by management, as well as evaluating the overall financial statement presentation. We believe that our audits provide a reasonable basis for our opinion.
In our opinion, the financial statements referred to above present fairly, in all material respects, the consolidated financial position of LCA-Vision Inc. at December 31, 2010 and 2009, and the consolidated results of its operations and its cash flows for each of the three years in the period ended December 31, 2010, in conformity with U.S. generally accepted accounting principles. Also, in our opinion, the related financial statement schedule, when considered in relation to the basic financial statements taken as a whole, presents fairly in all material respects the information set forth therein.
We also have audited, in accordance with the standards of the Public Company Accounting Oversight Board (United States), LCA-Vision Inc.’s internal control over financial reporting as of December 31, 2010, based on criteria established in Internal Control - Integrated Framework issued by the Committee of Sponsoring Organizations of the Treadway Commission and our report dated March 8, 2011 expressed an unqualified opinion thereon.
/s/ Ernst & Young LLP
Cincinnati, Ohio
March 8, 2011
31
Table of Contents
CONSOLIDATED BALANCE SHEETS
(Dollars in thousands, except per share amounts)
| At December 31, | ||||||||
| 2010 | 2009 | |||||||
| Assets |
||||||||
| Current assets |
||||||||
| Cash and cash equivalents |
$ | 18,981 | $ | 24,049 | ||||
| Short-term investments |
31,947 | 28,455 | ||||||
| Patient receivables, net of allowances of $1,392 and $1,645 |
2,256 | 4,562 | ||||||
| Other accounts receivable |
2,400 | 2,002 | ||||||
| Assets held for sale |
462 | 1,031 | ||||||
| Prepaid professional fees |
438 | 615 | ||||||
| Prepaid income taxes |
707 | 12,270 | ||||||
| Deferred compensation plan assets |
— | 400 | ||||||
| Prepaid expenses and other |
4,164 | 5,582 | ||||||
| Total current assets |
61,355 | 78,966 | ||||||
| Property and equipment |
72,286 | 79,993 | ||||||
| Accumulated depreciation and amortization |
(57,322 | ) | (53,995 | ) | ||||
| Property and equipment, net |
14,964 | 25,998 | ||||||
| Long-term investments |
951 | 2,090 | ||||||
| Patient receivables, net of allowances of $330 and $674 |
413 | 854 | ||||||
| Investment in unconsolidated businesses |
6 | 137 | ||||||
| Other assets |
3,086 | 4,590 | ||||||
| Total assets |
$ | 80,775 | $ | 112,635 | ||||
| Liabilities and Stockholders’ Investment |
||||||||
| Current liabilities |
||||||||
| Accounts payable |
$ | 8,404 | $ | 6,504 | ||||
| Accrued liabilities and other |
12,266 | 11,581 | ||||||
| Deferred revenue |
4,376 | 6,151 | ||||||
| Deferred compensation liability |
— | 400 | ||||||
| Debt obligations maturing in one year |
3,039 | 3,998 | ||||||
| Total current liabilities |
28,085 | 28,634 | ||||||
| Long-term rent obligations and other |
3,368 | 2,395 | ||||||
| Long-term debt obligations, less current portion |
4,245 | 9,145 | ||||||
| Insurance reserves |
7,406 | 9,154 | ||||||
| Deferred license fee |
3,065 | 4,428 | ||||||
| Deferred revenue |
3,476 | 7,852 | ||||||
| Stockholders’ Investment |
||||||||
| Common stock ($.001 par value; 25,291,637 and 25,287,387 shares and 18,711,365 and 18,619,185 shares issued and outstanding, respectively) |
25 | 25 | ||||||
| Contributed capital |
175,610 | 174,325 | ||||||
| Common stock in treasury, at cost (6,580,272 shares and 6,668,202 shares) |
(114,033 | ) | (114,668 | ) | ||||
| Retained deficit |
(31,134 | ) | (9,729 | ) | ||||
| Accumulated other comprehensive income |
662 | 1,074 | ||||||
| Total stockholders’ investment |
31,130 | 51,027 | ||||||
| Total liabilities and stockholders’ investment |
$ | 80,775 | $ | 112,635 | ||||
See Notes to Consolidated Financial Statements
32
Table of Contents
CONSOLIDATED STATEMENTS OF OPERATIONS
(Dollars in thousands, except per share amounts)
| Year Ended December 31, | ||||||||||||
| 2010 | 2009 | 2008 | ||||||||||
| Revenues - Laser refractive surgery |
$ | 99,825 | $ | 129,213 | $ | 205,176 | ||||||
| Operating costs and expenses |
||||||||||||
| Medical professional and license fees |
24,161 | 28,746 | 41,797 | |||||||||
| Direct costs of services |
46,631 | 63,579 | 77,474 | |||||||||
| General and administrative |
13,956 | 16,501 | 20,262 | |||||||||
| Marketing and advertising |
24,114 | 33,784 | 52,429 | |||||||||
| Depreciation |
9,408 | 14,198 | 17,972 | |||||||||
| Consent revocation solicitation |
— | 780 | — | |||||||||
| Impairment charges |
1,694 | 5,414 | 1,672 | |||||||||
| Restructuring charges |
3,790 | 2,696 | 1,804 | |||||||||
| 123,754 | 165,698 | 213,410 | ||||||||||
| Gain on sale of assets |
1,962 | 385 | 22 | |||||||||
| Operating loss |
(21,967 | ) | (36,100 | ) | (8,212 | ) | ||||||
| Equity in earnings from unconsolidated businesses |
25 | 122 | 478 | |||||||||
| Net investment income (loss) |
1,408 | 1,785 | (1,524 | ) | ||||||||
| Loss before income taxes |
(20,534 | ) | (34,193 | ) | (9,258 | ) | ||||||
| Income tax expense (benefit) |
43 | (949 | ) | (2,623 | ) | |||||||
| Net loss |
$ | (20,577 | ) | $ | (33,244 | ) | $ | (6,635 | ) | |||
| Loss per common share |
||||||||||||
| Basic |
$ | (1.10 | ) | $ | (1.79 | ) | $ | (0.36 | ) | |||
| Diluted |
$ | (1.10 | ) | $ | (1.79 | ) | $ | (0.36 | ) | |||
| Dividends declared per share |
$ | — | $ | — | $ | 0.24 | ||||||
| Weighted average shares outstanding |
||||||||||||
| Basic |
18,680 | 18,594 | 18,526 | |||||||||
| Diluted |
18,680 | 18,594 | 18,526 | |||||||||
See Notes to Consolidated Financial Statements
33
Table of Contents
CONSOLIDATED STATEMENTS OF CASH FLOWS
(Dollars in thousands)
| Year Ended December 31, | ||||||||||||
| 2010 | 2009 | 2008 | ||||||||||
| Cash flow from operating activities: |
||||||||||||
| Net loss |
$ | (20,577 | ) | $ | (33,244 | ) | $ | (6,635 | ) | |||
| Adjustments to reconcile net loss to net cash provided by operating activities: |
||||||||||||
| Depreciation |
9,408 | 14,198 | 17,972 | |||||||||
| Provision for loss on doubtful accounts |
1,061 | 3,320 | 5,355 | |||||||||
| (Gain) loss on investments |
(943 | ) | (48 | ) | 3,115 | |||||||
| Impairment charges |
1,694 | 5,414 | 1,672 | |||||||||
| Gain on sale of property and equipment |
(1,962 | ) | (385 | ) | (22 | ) | ||||||
| Deferred income taxes |
393 | 10,943 | 4,965 | |||||||||
| Stock-based compensation |
1,272 | 790 | 1,878 | |||||||||
| Insurance reserves |
(1,748 | ) | (335 | ) | 996 | |||||||
| Equity in earnings from unconsolidated affiliates |
(25 | ) | (122 | ) | (477 | ) | ||||||
| Distributions from unconsolidated affiliates |
156 | 362 | 690 | |||||||||
| Changes in operating assets and liabilities: |
||||||||||||
| Patient accounts receivable |
1,975 | 3,587 | (410 | ) | ||||||||
| Other accounts receivable |
(122 | ) | 513 | 3,426 | ||||||||
| Prepaid income taxes |
11,563 | (3,313 | ) | (2,566 | ) | |||||||
| Prepaid expenses and other |
1,418 | 773 | (223 | ) | ||||||||
| Accounts payable |
1,900 | (1,665 | ) | (2,227 | ) | |||||||
| Deferred revenue, net of professional fees |
(5,536 | ) | (8,196 | ) | (16,847 | ) | ||||||
| Accrued liabilities and other |
1,542 | 8,809 | (3,731 | ) | ||||||||
| Net cash provided by operations |
1,469 | 1,401 | 6,931 | |||||||||
| Cash flows from investing activities: |
||||||||||||
| Purchases of property and equipment |
(878 | ) | (240 | ) | (14,869 | ) | ||||||
| Proceeds from sale of assets |
2,829 | 466 | 18 | |||||||||
| Purchases of investment securities |
(404,339 | ) | (327,367 | ) | (391,026 | ) | ||||||
| Proceeds from sale of investment securities |
401,714 | 333,438 | 396,674 | |||||||||
| Other, net |
(35 | ) | 99 | 755 | ||||||||
| Net cash (used in) provided by investing activities |
(709 | ) | 6,396 | (8,448 | ) | |||||||
| Cash flows from financing activities: |
||||||||||||
| Principal payments of capital lease obligations and loan |
(5,859 | ) | (7,962 | ) | (6,410 | ) | ||||||
| Proceeds from loan |
— | — | 19,184 | |||||||||
| Shares repurchased for treasury stock |
(193 | ) | (36 | ) | (205 | ) | ||||||
| Proceeds from exercise of stock options |
13 | 18 | 193 | |||||||||
| Dividends paid to stockholders |
— | — | (4,447 | ) | ||||||||
| Net cash (used in) provided by financing activities |
(6,039 | ) | (7,980 | ) | 8,315 | |||||||
| Net effect of exchange rate changes on cash and cash equivalents |
211 | 584 | (764 | ) | ||||||||
| (Decrease) increase in cash and cash equivalents |
(5,068 | ) | 401 | 6,034 | ||||||||
| Cash and cash equivalents at beginning of year |
24,049 | 23,648 | 17,614 | |||||||||
| Cash and cash equivalents at end of year |
$ | 18,981 | $ | 24,049 | $ | 23,648 | ||||||
See Notes to Consolidated Financial Statements
34
Table of Contents
CONSOLIDATED STATEMENTS OF STOCKHOLDERS’ INVESTMENT
(Dollars in thousands)
| Year Ended December 31, | ||||||||||||||||||||||||
| 2010 | 2009 | 2008 | ||||||||||||||||||||||
| Shares | Amount | Shares | Amount | Shares | Amount | |||||||||||||||||||
| Common Stock |
||||||||||||||||||||||||
| Balance at beginning of year |
25,287,387 | $ | 25 | 25,199,734 | $ | 25 | 25,114,244 | $ | 25 | |||||||||||||||
| Employee stock plans |
4,250 | — | 87,653 | — | 85,490 | — | ||||||||||||||||||
| Balance at end of year |
25,291,637 | $ | 25 | 25,287,387 | $ | 25 | 25,199,734 | $ | 25 | |||||||||||||||
| Common Stock in Treasury |
||||||||||||||||||||||||
| Balance at beginning of year |
(6,668,202 | ) | $ | (114,668 | ) | (6,646,749 | ) | $ | (114,632 | ) | (6,631,586 | ) | $ | (114,427 | ) | |||||||||
| Shares repurchased |
(22,055 | ) | (193 | ) | (21,453 | ) | (36 | ) | (15,163 | ) | (205 | ) | ||||||||||||
| Employee stock plans |
109,985 | 828 | — | — | — | — | ||||||||||||||||||
| Balance at end of year |
(6,580,272 | ) | $ | (114,033 | ) | (6,668,202 | ) | $ | (114,668 | ) | (6,646,749 | ) | $ | (114,632 | ) | |||||||||
| Contributed Capital |
||||||||||||||||||||||||
| Balance at beginning of year |
$ | 174,325 | $ | 174,206 | $ | 172,965 | ||||||||||||||||||
| Employee stock plans |
13 | 18 | 193 | |||||||||||||||||||||
| Stock based compensation |
1,272 | 790 | 1,878 | |||||||||||||||||||||
| Deferred tax expense of disqualified stock options |
— | (689 | ) | (830 | ) | |||||||||||||||||||
| Balance at end of year |
$ | 175,610 | $ | 174,325 | $ | 174,206 | ||||||||||||||||||
| Retained (Deficit) Earnings |
||||||||||||||||||||||||
| Balance at beginning of year |
$ | (9,729 | ) | $ | 23,515 | $ | 34,597 | |||||||||||||||||
| Net loss |
(20,577 | ) | (33,244 | ) | (6,635 | ) | ||||||||||||||||||
| Treasury stock changes |
(828 | ) | — | — | ||||||||||||||||||||
| Dividends paid, $0.24 per common share in 2008 |
— | — | (4,447 | ) | ||||||||||||||||||||
| Balance at end of year |
$ | (31,134 | ) | $ | (9,729 | ) | $ | 23,515 | ||||||||||||||||
| Accumulated Other Comprehensive Income (Loss) |
||||||||||||||||||||||||
| Balance at beginning of year |
$ | 1,074 | $ | (129 | ) | $ | 439 | |||||||||||||||||
| Foreign currency translation adjustments |
214 | 631 | (533 | ) | ||||||||||||||||||||
| Unrealized investment (loss) gain, net of tax of $417, ($381), and $16 |
(626 | ) | 572 | (35 | ) | |||||||||||||||||||
| Balance at end of year |
$ | 662 | $ | 1,074 | $ | (129 | ) | |||||||||||||||||
| Total Stockholders’ Investment |
$ | 31,130 | $ | 51,027 | $ | 82,985 | ||||||||||||||||||
See Notes to Consolidated Financial Statements
35
Table of Contents
NOTES TO CONSOLIDATED FINANCIAL STATEMENTS
| 1. | Description of Business and Summary of Significant Accounting Policies |
Business
We are a provider of fixed-site laser vision correction services at our LasikPlus® vision centers. Our vision centers provide the staff, facilities, equipment and support services for performing laser vision correction that employ advanced laser technologies to help correct nearsightedness, farsightedness and astigmatism. We currently use two suppliers for fixed-site excimer lasers: Abbott Medical Optics (“AMO”) and Alcon Inc. (“Alcon”). Our vision centers are supported by independent board-certified ophthalmologists and credentialed optometrists, as well as other healthcare professionals. The ophthalmologists perform the laser vision correction procedures in our vision centers, and either ophthalmologists or optometrists conduct pre-procedure evaluations and post-operative follow-up care in-center. Most of our patients receive a procedure called LASIK, which we began performing in the United States in 1996.
As of December 31, 2010, we operated 54 LasikPlus® fixed-site laser vision correction centers in the United States. Included in the number are two vision centers licensed to ophthalmologists to operate using our trademarks. Due to the nature of our operations and organization, we operate in only one business segment.
Use of Estimates
The preparation of our Consolidated Financial Statements in conformity with U.S. generally accepted accounting principles (“U.S. GAAP”) requires management to make estimates and assumptions that affect the reported amounts of assets, liabilities, revenues and expenses, and the disclosure of contingent assets and liabilities. Significant items that are subject to such estimates and assumptions include investments, patient financing receivables and reserves, insurance reserves, impairment of property and equipment, income taxes and enhancement accruals. Although management bases its estimates on historical experience and various other assumptions that are believed to be reasonable under the circumstances, actual results could differ significantly from the estimates under different assumptions or conditions.
Consolidation and Basis of Presentation
The consolidated financial statements include all of the assets, liabilities, revenues, expenses and cash flows of entities in which we have a controlling interest. In addition, we consolidate the results of operations of professional corporations with which we contract to provide the services of ophthalmologists or optometrists at our vision centers. Investments in joint ventures and 20% to 50% owned affiliates where we have the ability to exert significant influence are accounted for by the equity method. Intercompany transactions and balances have been eliminated upon consolidation.
Reclassifications
We have reclassified certain prior-period amounts in the Consolidated Financial Statements to conform to current period presentation. The reclassifications were not material to the Consolidated Financial Statements.
Cash and Cash Equivalents
We consider highly liquid investments with an original maturity of 90 days or less when purchased to be cash equivalents.
Investments
Management determines the appropriate classification of securities at the time of purchase and re-evaluates such designation as of each balance sheet date. Currently, we classify all securities as available-for-sale. We carry available-for-sale securities at fair value, with temporary unrealized gains and losses, net of tax, reported in accumulated other comprehensive income (loss), a component of stockholders’ investment. The amortized cost of debt securities in this category reflects amortization of premiums and accretion of discounts to maturity computed under the effective interest method. We include this amortization in the caption “Net investment income (loss)” within the Consolidated Statements of Operations. We also include in net investment income (loss) realized gains and losses and declines in value judged to be other-than-temporary. We base the cost of securities sold upon the specific identification method. We include interest and dividends on securities classified as available-for-sale in net investment income (loss).
36
Table of Contents
Patient Receivables and Allowance for Doubtful Accounts
We provide financing to some of our patients, including those who could not otherwise obtain third-party financing. The terms of the financing require the patient to pay an up-front fee which is intended to cover some or all of our variable costs, and then generally we deduct the remainder automatically from the patient’s checking account over a period of 12 to 36 months. We have recorded an allowance for doubtful accounts as a best estimate of the amount of probable credit losses from our patient financing program. Each month, we review the allowance and adjust the allowance based upon our own experience with patient financing. We charge off receivables against the allowance for doubtful accounts when it is probable that a receivable will not be recovered. Our policy is to reserve for all patient receivables that remain open past their financial maturity date and to provide reserves for patient receivables prior to the maturity date so as to bring patient receivables, net of reserves, down to the estimated net realizable value based on historical collectability rates, recent default activity and the current credit environment. Bad debt expense was $1.1 million, or 1.1% of revenues for 2010, and $3.3 million and $5.4 million, or 2.6% of revenues, for both 2009 and 2008 respectively.
For patients whom we finance with an initial term over 12 months, we charge interest at market rates, and we recognize revenues based upon the present values of the expected payments. Finance and interest charges on patient receivables were $740,000 in 2010, $1.5 million in 2009 and $2.6 million in 2008. We include these amounts in “Net investment income (loss)” within the Consolidated Statements of Operation.
We maintained an allowance for doubtful accounts for our other accounts receivable of $289,000 at December 31, 2010 and $0 at December 31, 2009.
Property and Equipment, Depreciation and Amortization
We record our property and equipment at its original cost, net of accumulated depreciation. At the time that property or equipment is retired, sold, or otherwise disposed of, we deduct the related cost and accumulated depreciation from the amounts reported in the Consolidated Balance Sheets and recognize any gains or losses on disposition in the Consolidated Statements of Operations. We expense repair and maintenance costs as incurred. We include assets recorded under capitalized leases within property and equipment.
We compute depreciation using the straight-line method, which recognizes the cost of the asset over its estimated useful life. We use the following estimated useful lives for computing the annual depreciation expense:
| Fixed Asset Group |
Depreciable Lives | |
| Building and building improvements |
5 - 39 years | |
| Furniture and fixtures |
3 - 7 years | |
| Medical equipment |
3 - 5 years | |
| Other equipment |
3 - 5 years |
We record amortization of leasehold improvements in the Consolidated Statements of Operations as a component of depreciation expense using the straight-line method based on the lesser of the useful life of the improvement or the lease term, which is typically five years or less.
We assess the impairment of property and equipment whenever events or circumstances indicate that the carrying value might not be recoverable. Recoverability of long-lived assets is assessed by comparison of the carrying amount of the asset to the estimated future undiscounted net cash flows expected to be generated by the asset or group of assets. We write down to fair value, which is generally determined from estimated discounted cash flows for assets held for use, recorded values of property and equipment that we do not expect to recover through undiscounted future net cash flows. During 2010, we recognized fixed asset impairment charges of $164,000 for certain assets held for use in a laser vision correction center. We also incurred impairment charges of $1.5 million, $5.4 million and $1.7 million in 2010, 2009 and 2008, respectively, primarily as a result of our decision to close under-performing vision centers. The closures of the vision centers do not qualify for classification as a discontinued operation due to continuing cash flows. We will continue to incur cash expenditures related to these vision centers in the form of future facility lease payments, femtosecond laser lease payments and costs associated with post-operative care and post-surgical enhancements. For vision centers where we will license an ophthalmologist to operate using our trademarks, we will generate future cash in-flows in the form of license fees. In 2009, we did not record any impairments on remaining vision center assets held for use.
Deferred Compensation Plan Assets
In 2009, the Compensation Committee of our Board of Directors approved the termination of our deferred compensation plan. We distributed approximately $2.4 million to participants in December 2009. There was $400,000 remaining at December 31, 2009, that was distributed to participants in January 2010. We invested the deferred compensation plan assets in a variety of funds including a money market fund, a bond fund and several equity funds. These assets were reported at fair value.
37
Table of Contents
Accrued Enhancement Expense
We include participation in our LasikPlus Advantage Plan® (acuity program) in the base surgical price for substantially all of our patients. Under the acuity program, if determined to be medically appropriate, we provide post-surgical enhancements free of charge should the patient not achieve the desired visual correction during the initial procedure. Under this pricing structure, we account for the acuity program as a warranty obligation. Accordingly, we accrue the costs expected to be incurred to satisfy the obligation as a liability and direct cost of service at the point of sale given our ability to estimate reasonably such costs based on historical trends and the satisfaction of all other revenue recognition criteria.
We record the post-surgical enhancement accrual based on our best estimate of the number and associated cost of the procedures to be performed. Each month, we review the enhancement accrual and consider factors such as procedure cost and historical procedure volume when determining the appropriateness of the recorded balance. As of December 31, 2010 and 2009, we maintained an enhancement accrual of $3.1 million and $2.2 million, respectively.
Insurance Reserves
We maintain a captive insurance company to provide professional liability insurance coverage for claims brought against us after December 17, 2002. In addition, our captive insurance company’s charter allows it to provide professional liability insurance for our doctors, none of whom are currently insured by the captive. We use the captive insurance company for both primary insurance and excess liability coverage. A number of claims are now pending with our captive insurance company. We consolidate the financial statements of the captive insurance company with our financial statements because it is a wholly-owned enterprise. As of December 31, 2010 and 2009, we maintained insurance reserves of $7.4 million and $9.2 million, respectively, which represent primarily an actuarially determined estimate of future costs associated with claims filed as well as claims incurred but not yet reported. Our actuaries determine loss reserves by comparing our historical claim experience to comparable insurance industry experience. Since the inception of the captive insurance company in 2002, it has disbursed total claims and legal expenses of $4.9 million.
Income Taxes
We are subject to income taxes in the United States and Canada. Significant judgment is required in determining our provision for income taxes and the related assets and liabilities. The provision for income taxes includes income taxes paid, currently payable or receivable, and those deferred. We determine deferred tax assets and liabilities based on differences between the financial reporting and tax basis of assets and liabilities, and we measure them using enacted tax rates and laws that are expected to be in effect when the differences reverse. We recognize the effect on deferred taxes of changes in tax rates in the period in which the enactment date changes. We establish valuation allowances when necessary on a jurisdictional basis to reduce deferred tax assets to the amounts expected to be realized.
In the ordinary course of business, there are certain transactions and calculations where the ultimate tax determination is uncertain. The evaluation of a tax position in accordance with U.S. GAAP is a two-step process. The first step is a recognition process to determine whether it is more-likely-than-not that a tax position will be sustained upon examination, including resolution of any related appeals or litigation processes, based on the technical merits of the position. The second step is a measurement process whereby a tax position that meets the more-likely-than-not recognition threshold is assessed to determine the cost or benefit to be recognized in the financial statements.
Per Share Data
Basic per share data is income applicable to common shares divided by the weighted average common shares outstanding. Diluted per share data is income applicable to common shares divided by the weighted average common shares outstanding plus shares issuable upon the vesting of outstanding restricted stock units and the exercise of in-the-money stock options.
38
Table of Contents
The following is a reconciliation of basic and diluted loss per share (in thousands, except per share data).
| For the Year Ended December 31, | ||||||||||||
| 2010 | 2009 | 2008 | ||||||||||
| Basic Loss |
||||||||||||
| Net loss |
$ | (20,577 | ) | $ | (33,244 | ) | $ | (6,635 | ) | |||
| Weighted average common shares outstanding |
18,680 | 18,594 | 18,526 | |||||||||
| Basic loss per share |
$ | (1.10 | ) | $ | (1.79 | ) | $ | (0.36 | ) | |||
| Diluted Loss |
||||||||||||
| Net loss |
$ | (20,577 | ) | $ | (33,244 | ) | $ | (6,635 | ) | |||
| Weighted average common shares outstanding |
18,680 | 18,594 | 18,526 | |||||||||
| Effect of dilutive securities |
||||||||||||
| Stock options |
— | — | — | |||||||||
| Restricted stock |
— | — | — | |||||||||
| Weighted average common shares outstanding and potential dilutive shares |
18,680 | 18,594 | 18,526 | |||||||||
| Diluted loss per share |
$ | (1.10 | ) | $ | (1.79 | ) | $ | (0.36 | ) | |||
For 2010, 2009 and 2008, we excluded all outstanding stock options and restricted stock awards from the computation of our diluted earnings per share because the effect of these share-based awards was antidilutive due to our net loss.
Revenue Recognition
We recognize revenues as services are performed and persuasive evidence of an arrangement for payment exists. Additionally, we recognize revenue when the price is fixed and determinable and collectability is reasonably assured. We deferred revenues associated with separately priced acuity programs and recognize it over the period in which future costs of performing the post-surgical enhancement procedures are expected to be incurred as we have sufficient experience to support that costs associated with future enhancements will be incurred on other than a straight-line basis. We report all revenues net of tax assessed by applicable governmental authorities.
Marketing and Advertising Expenditures
We expense marketing and advertising costs as incurred, except for the costs associated with direct mail. Direct mail costs include printing mailers for future use, purchasing mailing lists of potential customers and postage cost. We expense printing and postage costs as the items are mailed. Prepaid advertising expense (principally direct mail cost) was $256,000 at December 31, 2010, and $772,000 at December 31, 2009.
Stock-Based Compensation
We account for stock-based payment transactions in which we receive employee services in exchange for (a) our stock or (b) liabilities that are based on the fair value of our stock or that may be settled by the issuance of our stock. Stock-based compensation cost for restricted stock units (“RSUs”) and performance restricted stock units (“PRSUs”) are measured based on the closing fair market value of our common stock on the date of grant. Stock-based compensation cost for stock options is estimated at the grant date based on each option’s fair-value as calculated by the Black-Scholes option-pricing model. We recognize stock-based compensation cost as expense for awards other than our PRSUs ratably on a straight-line basis over the requisite service period. We recognize stock-based compensation associated with PRSUs over the requisite service period if it is probable that the performance condition will be satisfied. We will recognize a benefit from stock-based compensation in equity if an incremental tax benefit is realized by following the ordering provisions of the tax law. Further information regarding stock-based compensation can be found in Note 10, “Employee Benefits.”
39
Table of Contents
Geographic Information
We have no operations or assets in any countries other than the U.S. and Canada. No single customer represented more than 10% of revenues in 2010, 2009, or 2008. Information about our domestic and international operations is as follows (dollars in thousands):
| Revenues from External Customers | Net Assets | Property and Equipment | ||||||||||||||||||||||||||
| 2010 | 2009 | 2008 | 2010 | 2009 | 2010 | 2009 | ||||||||||||||||||||||
| United States |
$ | 99,825 | $ | 129,213 | $ | 205,176 | $ | 26,566 | $ | 46,689 | $ | 14,964 | $ | 25,998 | ||||||||||||||
| Canada |
— | — | — | 4,564 | 4,338 | — | — | |||||||||||||||||||||
| $ | 99,825 | $ | 129,213 | $ | 205,176 | $ | 31,130 | $ | 51,027 | $ | 14,964 | $ | 25,998 | |||||||||||||||
Fair Value Measurements
We apply fair value accounting for all financial assets and liabilities and non-financial assets and liabilities that are recognized or disclosed at fair value in the financial statements. Fair value is defined as the price that would be received from selling an asset or paid to transfer a liability in an orderly transaction between market participants at the measurement date. When determining the fair value measurements for assets and liabilities, we consider the principal or most advantageous market in which we would transact and the market-based risk measurements or assumptions that market participants would use in pricing the asset or liability, such as inherent risk, transfer restrictions and credit risk (including our own non-performance risk).
Subsequent Events
We evaluated all events or transactions that occurred after December 31, 2010 through the date we issued these Consolidated Financial Statements.
| 2. | Stockholders’ Investment |
Capital Stock
We have 27.5 million authorized shares of common stock with $0.001 per share par value and 5.0 million authorized shares of preferred stock. The holders of the common stock may cast one vote for each share held of record on all matters submitted to a vote of stockholders. Subject to preferences that may be applicable to any outstanding preferred stock, holders of common stock are entitled to receive ratably such dividends as may be declared from time to time by our Board of Directors out of funds legally available for that purpose. In the event of liquidation, dissolution or winding up, the holders of common stock share ratably in all assets remaining after payment of liabilities, subject to prior distribution rights of preferred stock, if any, then outstanding.
Share Repurchase Programs
On August 21, 2007, our Board of Directors authorized a share repurchase plan under which we are authorized to purchase up to an additional $50.0 million of our common stock. Through December 31, 2008, we repurchased 588,408 shares of our common stock under this program at an average price of $16.99 per share, for a total cost of approximately $10.0 million. We did not purchase any shares of our common stock in 2010 or 2009 under this program. At December 31, 2010, we held 6.6 million shares of our common stock in treasury.
Dividend
We paid a quarterly dividend from the third quarter of 2004 through the second quarter of 2008. In the third quarter of 2008, our Board decided to suspend payment of dividends and periodically reassess its decision. No dividends were paid in 2010 or 2009.
| 3. | Investment in Unconsolidated Businesses |
Our investments in unconsolidated businesses were $6,000 and $137,000 at December 31, 2010 and 2009, respectively. These balances represent our equity investment in Eyemed/LCA-Vision, LLC (50% ownership). We account for this investment using the equity method of accounting.
40
Table of Contents
4. Investments
Short-term and long-term investments, designated as available-for-sale, consist of the following (dollars in thousands):
| As of December 31, | ||||||||
| 2010 | 2009 | |||||||
| Short-term investments: |
||||||||
| Corporate obligations |
$ | 18,492 | $ | 13,818 | ||||
| U.S. Government notes |
11,556 | 3,728 | ||||||
| Municipal securities |
1,008 | 8,544 | ||||||
| Equities |
— | 2,365 | ||||||
| Auction rate preferred securities |
891 | — | ||||||
| Total short-term investments |
31,947 | 28,455 | ||||||
| Long-term investments: |
||||||||
| Auction rate municipal debt |
951 | 1,062 | ||||||
| Auction rate preferred securities |
— | 1,028 | ||||||
| Total long-term investments |
951 | 2,090 | ||||||
| Total investments |
$ | 32,898 | $ | 30,545 | ||||
The following table summarizes unrealized gains and losses related to our investments designated as available-for-sale (dollars in thousands):
| As of December 31, 2010 | ||||||||||||||||
| Adjusted Cost |
Gross Unrealized Gains |
Gross Unrealized Losses |
Fair Value | |||||||||||||
| Corporate obligations |
$ | 18,492 | $ | 1 | $ | (1 | ) | $ | 18,492 | |||||||
| U.S. Government notes |
11,585 | — | (29 | ) | 11,556 | |||||||||||
| Municipal securities |
1,006 | 2 | — | 1,008 | ||||||||||||
| Auction rate municipal securities |
924 | 27 | — | 951 | ||||||||||||
| Auction rate preferred securities |
891 | — | — | 891 | ||||||||||||
| Total investments |
$ | 32,898 | $ | 30 | $ | (30 | ) | $ | 32,898 | |||||||
| As of December 31, 2009 | ||||||||||||||||
| Adjusted Cost |
Gross Unrealized Gains |
Gross Unrealized Losses |
Fair Value | |||||||||||||
| Corporate obligations |
$ | 13,818 | $ | — | $ | — | $ | 13,818 | ||||||||
| U.S. Government notes |
3,728 | — | — | 3,728 | ||||||||||||
| Municipal securities |
8,459 | 85 | — | 8,544 | ||||||||||||
| Equities |
1,487 | 878 | — | 2,365 | ||||||||||||
| Auction rate municipal securities |
1,010 | 52 | — | 1,062 | ||||||||||||
| Auction rate preferred securities |
999 | 29 | — | 1,028 | ||||||||||||
| Total investments |
$ | 29,501 | $ | 1,044 | $ | — | $ | 30,545 | ||||||||
41
Table of Contents
The following table presents gross unrealized losses and fair values for those investments that were in an unrealized loss position as of December 31, 2010, aggregated by investment category and the length of time that individual securities have been in a continuous loss position (dollars in thousands):
| As of December 31, 2010 | ||||||||
| Less than 12 Months | ||||||||
| Fair Value | Unrealized Loss |
|||||||
| Corporate obligations |
$ | 6,624 | $ | (1 | ) | |||
| U.S. Government notes |
10,179 | (29 | ) | |||||
| $ | 16,803 | $ | (30 | ) | ||||
There were no investments that were in an unrealized loss position for greater than 12 months at December 31, 2010 or 2009.
We realized gains of $1.1 million and losses of $51,000 on sales of our marketable securities during the year ended December 31, 2010. We had realized gains of $413,000 and $10,000 and no realized losses on the sale of marketable securities during the years ended December 31, 2009 and 2008, respectively.
We recognized $86,000 of other-than-temporary impairments to certain of our auction rate securities in 2010. These auction rate securities were redeemed in January 2011 at 81% of their par value. Given the duration and extent of the decline in fair values associated with our equity securities (comprised primarily of various equity mutual funds), and auction rate securities, we recognized an other-than-temporary impairment of $365,000, before tax, during the year ended December 31, 2009. These equity securities were sold in April 2010. When evaluating investments for other-than-temporary impairment, we review factors such as the length of time and extent to which fair value has been below cost basis, the financial condition of the issuer of the investment securities and any changes thereto, and our intent to sell, or whether it is more-likely-than-not we would be required to sell the investment before recovery of the investment’s amortized cost basis.
The net carrying value and estimated fair value of debt and equity securities available for sale at December 31, 2010, by contractual maturity, are shown below (dollars in thousands). Expected maturities may differ from contractual maturities because the issuers of the securities may have the right or obligation to prepay obligations without prepayment penalties.
| Amortized Cost |
Estimated Fair Value |
|||||||
| Due in one year or less |
$ | 26,190 | $ | 26,174 | ||||
| Due after one year through three years |
4,893 | 4,882 | ||||||
| Due after three years |
1,815 | 1,842 | ||||||
| Total debt securities |
$ | 32,898 | $ | 32,898 | ||||
42
Table of Contents
Auction Rate Securities
At December 31, 2010 and 2009, we held various auction rate securities with par values of $2.2 million and $2.4 million, respectively. The assets underlying the auction rate instruments were primarily municipal bonds and preferred closed end funds. Historically, these securities have provided liquidity through a Dutch auction process that resets the applicable interest rate at pre-determined intervals every 7 to 28 days. However, these auctions began to fail in the first quarter of 2008. Since these auctions have failed, we have realized higher interest rates for many of these auction rate securities than we would have otherwise. Although we have been receiving interest payments at these rates, the related principal amounts will not be accessible until a successful auction occurs, a buyer is found outside of the auction process, the issuer calls the security, or the security matures according to contractual terms. Maturity dates for our auction rate securities range from 2030 to 2049. Since 2008, $16.6 million of the related securities were called at par by their issuers, including $125,000 in 2010 and $2.3 million in auction rate securities redeemed in 2009 at 46% of original par value. In January 2011, auction rate municipal debt with a par value of $1.1 million was redeemed for $891,000.
At December 31, 2010, there was insufficient observable auction rate market information available to determine the fair value of most of our auction rate security investments. Therefore, we estimated fair value using a trinomial discount model employing assumptions that market participants would use in their estimates of fair value. Certain of these assumptions included financial standing of the issuer, final stated maturities, estimates of the probability of the issue being called prior to final maturity, estimates of the probability of defaults and recoveries, expected changes in interest rates paid on the securities, interest rates paid on similar instruments, and an estimated illiquidity discount due to extended redemption periods.
As a result of the failed auctions, our auction rate instruments are not currently liquid. Due to the continuation of the unstable credit environment, we believe that the recovery period for most of our auction rate instruments will exceed 12 months. Accordingly, we have classified the fair value of the auction rate instruments that have not been redeemed subsequent to December 31, 2010, as long-term.
| 5. | Debt |
Long-term debt obligations consist of (dollars in thousands):
| As of December 31, | ||||||||
| 2010 | 2009 | |||||||
| Capitalized lease obligations |
$ | — | $ | 390 | ||||
| Bank loan |
7,284 | 12,753 | ||||||
| Total debt obligations |
7,284 | 13,143 | ||||||
| Debt obligations maturing in one year |
3,039 | 3,998 | ||||||
| Long-term obligations (less current portion) |
$ | 4,245 | $ | 9,145 | ||||
In April 2008, we entered into a bank loan agreement for $19.2 million to finance medical equipment. The loan agreement provides for repayment in equal monthly installments over a five-year period at a fixed interest rate of 4.96%. The loan agreement contains no financial covenants. The bank loan is secured by certain medical equipment.
Aggregate maturities of long-term debt obligations are (dollars in thousands):
| Year |
Amount | |||
| 2011 |
$ | 3,039 | ||
| 2012 |
3,157 | |||
| 2013 |
1,088 | |||
| Total |
$ | 7,284 | ||
The estimated fair value of our long-term debt obligation is $7.2 million based on the present values of the underlying cash flows, using a discount factor of 6.08%.
43
Table of Contents
| 6. | Fair Value Measurements |
U.S. GAAP defines fair value as the exchange price that would be received for an asset or paid to transfer a liability (an exit price) in the principal or most advantageous market for the asset and liability in an orderly transaction between market participants at the measurement date. U.S. GAAP establishes a three-tier hierarchy, which prioritizes the inputs used in the valuation methodologies in measuring fair value.
| Level Input: |
Input Definition: | |
| Level 1 | Inputs are unadjusted, quoted prices for identical assets or liabilities in active markets at the measurement date. | |
| Level 2 | Inputs other than quoted prices included in Level 1 that are observable for the asset or liability through corroboration with market data at the measurement date. | |
| Level 3 | Unobservable inputs that reflect management’s best estimate of what market participants would use in pricing the asset or liability at the measurement date. | |
The fair value hierarchy also requires an entity to maximize the use of observable inputs and minimize the use of unobservable inputs when measuring fair value.
The following tables summarize fair value measurements by level at December 31, 2010 and 2009 for assets and liabilities measured at fair value on a recurring basis (dollars in thousands):
| Fair Value Measurements as of December 31, 2010 Using | ||||||||||||||||
| Description |
Quoted Prices in Active Markets for Identical Assets (Level 1) |
Significant Other Observable Inputs (Level 2) |
Significant Unobservable Inputs (Level 3) |
Total | ||||||||||||
| Assets: |
||||||||||||||||
| Cash and cash equivalents |
$ | 18,981 | $ | — | $ | — | $ | 18,981 | ||||||||
| Investments |
891 | 31,056 | 951 | 32,898 | ||||||||||||
| Total |
$ | 19,872 | $ | 31,056 | $ | 951 | $ | 51,879 | ||||||||
| Fair Value Measurements as of December 31, 2009 Using | ||||||||||||||||
| Description |
Quoted Prices in Active Markets for Identical Assets (Level 1) |
Significant Other Observable Inputs (Level 2) |
Significant Unobservable Inputs (Level 3) |
Total | ||||||||||||
| Assets: |
||||||||||||||||
| Cash and cash equivalents |
$ | 24,049 | $ | — | $ | — | $ | 24,049 | ||||||||
| Investments |
2,365 | 26,090 | 2,090 | $ | 30,545 | |||||||||||
| Deferred compensation assets |
400 | — | — | $ | 400 | |||||||||||
| Total |
$ | 26,814 | $ | 26,090 | $ | 2,090 | $ | 54,994 | ||||||||
| Liabilities: |
||||||||||||||||
| Deferred compensation liabilities |
$ | 400 | $ | — | $ | — | $ | 400 | ||||||||
Cash and cash equivalents are comprised of either bank deposits or amounts invested in money market funds, the fair value of which is based on quoted market prices. The fair values of some investment securities included within our investment portfolio are based on quoted market prices from various stock and bond exchanges. Certain of our debt securities are classified at fair value utilizing Level 2 inputs. For these securities, fair value is measured using observable market data that includes dealer quotes, live trading levels, trade execution data, credit information and the bond’s terms and conditions. The fair values of our auction rate investment instruments are classified in Level 3 because they are valued using a trinomial discounted cash flow model (see Note 4). We previously maintained a self-directed non-qualified deferred compensation plan structured as a rabbi trust for certain highly compensated individuals. The investment assets of the rabbi trust were valued using quoted market prices. The related deferred compensation liability represented the fair value of the participants’ investment elections, determined using quoted market prices.
44
Table of Contents
The deferred compensation plan was terminated as of December 31, 2009. Distributions were made to all participants by January 2010.
The following table sets forth a reconciliation of beginning and ending balances for each major category for assets measured at fair value using significant unobservable inputs (Level 3) during 2010 and 2009 (dollars in thousands).
| Year Ended December 31, | ||||||||
| Description |
2010 | 2009 | ||||||
| Balance as of January 1 |
$ | 2,090 | $ | 3,126 | ||||
| Assets acquired |
— | — | ||||||
| Assets sold or redeemed |
(125 | ) | (829 | ) | ||||
| Transfers out of Level 3 |
(977 | ) | (258 | ) | ||||
| Gains (losses) included in earnings |
17 | (29 | ) | |||||
| (Losses) gains included in other comprehensive loss |
(54 | ) | 80 | |||||
| Balance as of December 31 |
$ | 951 | $ | 2,090 | ||||
| 7. | Assets Held for Sale |
We had assets held for sale of $462,000 and $1.0 million at December 31, 2010 and 2009, respectively, comprised of excimer and femtosecond lasers. During the year ended December 31, 2010, we sold some of our excimer and femtosecond lasers held for sale with a combined net book value of $743,000 for total cash proceeds of approximately $1.5 million and notes receivable of $835,000, resulting in a gain of approximately $1.6 million, before tax. Assets held for sale at December 31, 2010 and 2009 are measured at fair value less cost to sell. The fair value and cost to sell estimates were based on corroborative market data, which is a Level 2 input under U.S. GAAP.
| 8. | Income Taxes |
The following table presents the components of income tax expense (benefit) (dollars in thousands):
| Year Ended December 31, | ||||||||||||
| 2010 | 2009 | 2008 | ||||||||||
| Current: |
||||||||||||
| Federal |
$ | (463 | ) | $ | (11,679 | ) | $ | (7,981 | ) | |||
| State and local |
113 | (213 | ) | 393 | ||||||||
| Total Current |
(350 | ) | (11,892 | ) | (7,588 | ) | ||||||
| Deferred: |
||||||||||||
| Federal |
$ | 418 | $ | 9,356 | $ | 5,314 | ||||||
| State and local |
(25 | ) | 1,587 | (349 | ) | |||||||
| Total Deferred |
393 | 10,943 | 4,965 | |||||||||
| Income tax expense (benefit) |
$ | 43 | $ | (949 | ) | $ | (2,623 | ) | ||||
The following table presents loss before income taxes (dollars in thousands):
| Year Ended December 31, | ||||||||||||
| 2010 | 2009 | 2008 | ||||||||||
| United States |
$ | (20,546 | ) | $ | (34,184 | ) | $ | (9,723 | ) | |||
| Canada |
12 | (9 | ) | 465 | ||||||||
| Total |
$ | (20,534 | ) | $ | (34,193 | ) | $ | (9,258 | ) | |||
45
Table of Contents
The following table reconciles the U.S. statutory federal income tax rate and the tax (benefit) expense shown in our Consolidated Statements of Operations (dollars in thousands):
| Year Ended December 31, | ||||||||||||
| 2010 | 2009 | 2008 | ||||||||||
| Tax at statutory U.S. federal income tax rate of 35% |
$ | (7,187 | ) | $ | (11,968 | ) | $ | (3,240 | ) | |||
| State and local income taxes, net of federal benefit |
(699 | ) | (1,286 | ) | (94 | ) | ||||||
| Permanent differences |
117 | 69 | (220 | ) | ||||||||
| Other |
38 | 52 | (229 | ) | ||||||||
| Valuation allowance |
7,774 | 12,184 | 1,160 | |||||||||
| Income tax provision (benefit) |
$ | 43 | $ | (949 | ) | $ | (2,623 | ) | ||||
We have made no provision for U.S. income taxes on undistributed earnings of approximately $4.6 million from our Canadian subsidiary because it is our intention to reinvest those earnings in that operation. If those earnings are distributed in the form of dividends, we may be subject to both foreign withholding taxes and U.S. income taxes net of allowable foreign tax credits. The amount of additional tax that might be payable upon repatriation of these foreign earnings is approximately $327,000.
U.S. GAAP requires a company to establish a valuation allowance for deferred tax assets when it is more-likely-than-not that the deferred tax asset will not be realized. Deferred tax assets may be realized through future reversals of existing taxable temporary differences, future taxable income, taxable income in prior carryback year(s) if carryback is permitted, and tax planning strategies.
In 2009, we considered all positive and negative evidence in determining whether or not the net deferred tax assets were more-likely-than-not to be realized, including the current economic conditions and our 2010 operating projections completed during 2009. After considering all of the evidence, we concluded that reliance on future projections of income was no longer sufficient to support realization of our deferred tax assets. Accordingly, in 2009 we established a valuation allowance against all of our net deferred tax assets in the amount of $12.2 million as we believed it was not more-likely-than-not that our net deferred tax assets would be utilized. After undertaking a similar analysis again in 2010, we still believe that we cannot support the realization of our deferred tax assets. We established a valuation allowance of $1.2 million in 2008 for the tax benefit generated from the other-than-temporary impairments recognized in 2008 with respect to certain of our investment holdings because we do not have capital gains to offset these capital losses.
As of December 31, 2010, we had net operating loss carryforwards for federal and state income taxes of approximately $18.9 million and $48.0 million, respectively, which will be available to offset future taxable income. Approximately $8.7 million of state net operating loss is subject to an annual IRC Section 382 limitation of $5.3 million. If not used, these carryforwards will expire between 2013 and 2030. To the extent net operating loss carryforwards, when realized, relate to non-qualified stock option deductions, the resulting benefits will be credited to stockholders’ investment.
46
Table of Contents
Deferred taxes arise because of temporary differences in the book and tax basis of certain assets and liabilities. The following table shows the significant components of our deferred taxes (dollars in thousands):
| As of December 31, | ||||||||
| 2010 | 2009 | |||||||
| Deferred tax assets: |
||||||||
| Deferred revenue |
$ | 2,749 | $ | 4,902 | ||||
| Allowance for doubtful accounts |
782 | 902 | ||||||
| Accrued enhancement expense |
1,219 | 715 | ||||||
| Deferred compensation |
— | 156 | ||||||
| Insurance reserves |
1,292 | 1,447 | ||||||
| Deferred lease credits |
473 | 714 | ||||||
| Share-based compensation |
737 | 643 | ||||||
| Vendor rebates |
1,722 | 2,252 | ||||||
| Investments |
152 | 1,288 | ||||||
| Property and equipment |
453 | — | ||||||
| Net operating and capital loss carryforward |
9,395 | 1,399 | ||||||
| Other |
2,658 | 688 | ||||||
| Valuation allowance |
(21,118 | ) | (13,344 | ) | ||||
| Total deferred tax assets |
$ | 514 | $ | 1,762 | ||||
| Deferred tax liabilities: |
||||||||
| Property and equipment |
$ | — | $ | 1,153 | ||||
| Prepaid postage |
— | 270 | ||||||
| Deferred lease incentives |
424 | 213 | ||||||
| Prepaid service |
83 | 126 | ||||||
| Other |
7 | — | ||||||
| Total deferred tax liabilities |
$ | 514 | $ | 1,762 | ||||
| Net deferred tax assets |
$ | — | $ | — | ||||
47
Table of Contents
Changes in unrecognized tax benefits were as follows (dollars in thousands):
| Balance at December 31, 2008 |
$ | 441 | ||
| Additions based on tax positions related to the current year |
196 | |||
| Additions for tax positions of prior years |
102 | |||
| Reductions for tax positions of prior years |
(124 | ) | ||
| Reductions due to statute expiration |
(27 | ) | ||
| Settlements |
(33 | ) | ||
| Balance at December 31, 2009 |
$ | 555 | ||
| Additions based on tax positions related to the current year |
— | |||
| Additions for tax positions of prior years |
32 | |||
| Reductions for tax positions of prior years |
— | |||
| Reductions due to statute expiration |
(20 | ) | ||
| Settlements |
(28 | ) | ||
| Balance at December 31, 2010 |
$ | 539 | ||
The total amount of unrecognized tax benefits that, if recognized, would affect the effective tax rate is $539,000. It is reasonably possible that the amount of the unrecognized tax benefits may increase or decrease within the next 12 months. However, we do not presently anticipate that any increase or decrease in unrecognized tax benefits will be material to the Consolidated Financial Statements. We record unrecognized tax benefits as a component of “Accrued liabilities and other” in our Consolidated Balance Sheets.
We recognize interest and penalties related to unrecognized tax benefits as a component of income tax expense in the Consolidated Statements of Operations. During the year ended December 31, 2010, we recognized tax expense of approximately $23,000 in interest and penalties. We have accrued approximately $145,000 and $122,000 in interest and penalties related to unrecognized tax benefits as of December 31, 2010 and 2009, respectively, recorded as a component of “Accrued liabilities and other” in our Consolidated Balance Sheets.
We file income tax returns in the U.S. federal jurisdiction, various U.S. state jurisdictions and Canada. With the exception of our 2008 federal income tax return which was audited without adjustment, we are subject to audit by taxing authorities for fiscal years ending after 2007. Our federal and state income tax return filings generally are subject to a three-year statute of limitations from date of filing. In January 2011, the Internal Revenue Service initiated a review of the 2009 tax year. Based on the early status of the review, we cannot estimate the impact, if any, to previously recorded unrecognized tax benefits.
| 9. | Leasing Arrangements |
We lease office space for our vision centers under lease arrangements that qualify as operating leases. For leases that contain pre-determined fixed escalations of the minimum rentals and/or rent abatements subsequent to taking possession of the leased property, we recognize the related rent expense on a straight–line basis and record the difference between the recognized rental expense and amounts payable under the leases as deferred lease credits. We used capitalized leases to finance certain excimer lasers used in the laser vision correction procedures. We included capital lease assets in property and equipment.
48
Table of Contents
The following table displays our aggregate minimal rental commitments under noncancellable leases for the periods shown (dollars in thousands):
| Year |
Operating Leases Obligation |
|||
| 2011 |
$ | 8,737 | ||
| 2012 |
6,896 | |||
| 2013 |
4,700 | |||
| 2014 |
1,966 | |||
| 2015 |
1,208 | |||
| Beyond 2015 |
2,899 | |||
| Total minimum rental commitment |
$ | 26,406 | ||
Total rent expense under operating leases amounted to $8.1 million in 2010, $11.5 million in 2009 and $11.8 million in 2008.
In 2009, we entered into five-year lease agreements with Alcon and AMO, respectively, for new excimer lasers which allowed us to standardize our excimer treatment platforms and reduce the number of platforms at each of our vision centers from three to two. The standardization of our excimer laser platforms reduced equipment and maintenance costs, while allowing us to continue to offer the same broad spectrum of treatment options that include a standard treatment, a custom wavefront treatment, an optimized treatment and femtosecond technology. As part of the transactions, we disposed of our Bausch & Lomb lasers and retired $1.9 million in related capital lease obligations. We received cash payments totaling $6.8 million from the lessors that may be partially refundable if we do not perform a minimum number of procedures over the term of the agreements. We have deferred these amounts and will recognize them ratably over the lease term. We included the unrecognized portion in “Deferred license fee” in our Consolidated Balance Sheets at December 31, 2010 and 2009.
The AMO laser lease qualified as a capital lease, and the Alcon laser lease qualified as an operating lease. However, at December 31, 2010, we did not hold any lasers under a capital lease.
| 10. | Employee Benefits |
Savings Plan
We sponsor a savings plan under Internal Revenue Code Section 401(k) to provide an opportunity for eligible employees to save for retirement on a tax-deferred basis. Under this plan, we may make discretionary contributions to the participants’ accounts. We made contributions of $531,000 in 2008. There were no employer contributions in 2010 or 2009.
Stock Incentive Plans
We have four stock incentive plans, the 1995 Long-Term Stock Incentive Plan (“1995 Plan”), the 1998 Long-Term Stock Incentive Plan (“1998 Plan”), the 2001 Long-Term Stock Incentive Plan (“2001 Plan”), and the 2006 Stock Incentive Plan (“2006 Plan”). With the adoption of the 2006 Plan, all prior plans were frozen, and no new grants will be made from the 1995 Plan, the 1998 Plan or the 2001 Plan. Under the stock incentive plans, at December 31, 2010, approximately 711,000 shares of our common stock were reserved for issuance upon the exercise of outstanding stock options and the vesting of outstanding restricted stock units, including 21,000 shares under the 1995 Plan, 132,000 shares under the 1998 Plan, 65,000 shares under the 2001 Plan, and 494,000 shares under the 2006 Plan. At December 31, 2010, a total of 870,000 shares were available for future awards under the 2006 Plan. The Compensation Committee of the Board of Directors administers all of our stock incentive plans.
The 2006 Plan permits us to issue incentive or non-qualified stock options to purchase shares of common stock, stock appreciation rights, restricted and unrestricted stock awards, performance awards, and cash awards to employees and non-employee directors.
49
Table of Contents
The components of our pre-tax stock-based compensation expense (net of forfeitures) and associated income tax benefits are as follows (in thousands of dollars):
| Year Ended December 31, | ||||||||||||
| 2010 | 2009 | 2008 | ||||||||||
| Stock Options |
$ | 36 | $ | 18 | $ | 267 | ||||||
| Restricted Stock |
1,236 | 772 | 1,611 | |||||||||
| $ | 1,272 | $ | 790 | $ | 1,878 | |||||||
| Income Tax Benefit |
$ | 491 | $ | 325 | $ | 767 | ||||||
Stock Options
Our stock incentive plans permit certain employees to receive grants of fixed-price stock options. The option price is equal to the fair value of a share of the underlying stock at the date of grant. Option terms are generally 10 years, with options generally becoming exercisable between one and five years from the date of grant.
We estimate the fair value of each stock option on the date of the grant using a Black-Scholes option pricing model that uses assumptions noted below. We base expected volatility on a blend of implied and historical volatility of our common stock. We use historical data on exercises of stock options and other factors to estimate the expected term of the share-based payments granted. We base the risk-free rate on the U.S. Treasury yield curve in effect at the date of grant. We base the expected life of the options on historical data and it is not necessarily indicative of exercise patterns that may occur. The dividend yield reflects the assumption that the current dividend payout in effect at the time of grant.
We granted stock options with respect to 14,704 and 152,955 shares of our common stock for 2009 and 2008, respectively. No stock options were issued in 2010. We estimated the fair value of each common stock option granted during 2009 and 2008 using the following weighted-average assumptions:
| 2009 | 2008 | |||||||
| Dividend yield |
0 | % | 5.04 -7.11 | % | ||||
| Expected volatility |
92 | % | 361% -362 | % | ||||
| Risk-free interest rate |
0.97 | % | 3.04 -3.10 | % | ||||
| Expected lives (in years) |
0 | 5 | ||||||
50
Table of Contents
The following table summarizes the status of options granted under the stock incentive plans:
| Stock Options |
Weighted Average Exercise Price |
|||||||
| Outstanding at January 1, 2008 |
639,598 | $ | 19.73 | |||||
| Granted |
152,955 | 14.09 | ||||||
| Exercised |
(22,156 | ) | 8.69 | |||||
| Cancelled/forfeited |
(292,203 | ) | 18.61 | |||||
| Outstanding at December 31, 2008 |
478,194 | 19.13 | ||||||
| Granted |
14,704 | 6.43 | ||||||
| Exercised |
(3,187 | ) | 3.55 | |||||
| Cancelled/forfeited |
(139,985 | ) | 16.87 | |||||
| Outstanding at December 31, 2009 |
349,726 | 19.64 | ||||||
| Granted |
— | — | ||||||
| Exercised |
(3,750 | ) | 3.55 | |||||
| Cancelled/forfeited |
(88,260 | ) | 25.08 | |||||
| Outstanding at December 31, 2010 |
257,716 | 18.01 | ||||||
| Options exercisable, December 31, 2010 |
233,691 | $ | 18.47 | |||||
| Options expected to vest, December 31, 2010 |
256,283 | 18.04 | ||||||
The total intrinsic value (market value on date of exercise less exercise price) of options exercised during 2010, 2009 and 2008 was approximately $17,000, $9,000 and $60,000, respectively. As of December 31, 2010, the aggregate intrinsic value of outstanding stock options, options vested and expected to vest, and options exercisable were approximately $24,000.
We received approximately $13,000 for 2010, $18,000 for 2009 and $193,000 for 2008 in cash from option exercises under all share-based payment arrangements. We recognized actual tax expense for the tax deductions from option exercises under all share-based payment arrangements for 2009 and 2008 of approximately $592,000 and $638,000, respectively. U.S. GAAP requires the cash flows resulting from income tax deductions in excess of compensation costs to be classified as financing cash flows.
At December 31, 2010, there was $91,000 of total unrecognized, pre-tax compensation cost related to non-vested stock options. We expect to recognize this cost over a weighted-average period of approximately 2.17 years.
51
Table of Contents
The following table summarizes information about the stock options granted under the stock incentive plans that were outstanding at December 31, 2010:
| Stock Options Outstanding | Stock Options Exercisable | |||||||||||||||||||||||||||
| Range of exercise prices | Number outstanding as of December 31, 2010 |
Weighted- average remaining contractual term |
Weighted- average exercise price |
Number exercisable as of December 31, 2010 |
Weighted- average exercise price |
|||||||||||||||||||||||
| $ | 3.33 | $ | 5.92 | 34,965 | 1.86 | $ | 5.17 | 34,965 | $ | 5.17 | ||||||||||||||||||
| 7.33 | 11.84 | 27,000 | 2.80 | 11.38 | 27,000 | 11.38 | ||||||||||||||||||||||
| 12.19 | 12.19 | 35,776 | 2.87 | 12.19 | 35,776 | 12.19 | ||||||||||||||||||||||
| 12.94 | 14.28 | 40,044 | 7.22 | 13.56 | 16,019 | 13.56 | ||||||||||||||||||||||
| 14.31 | 22.38 | 26,751 | 3.79 | 17.97 | 26,751 | 17.97 | ||||||||||||||||||||||
| 22.81 | 22.81 | 7,500 | 4.05 | 22.81 | 7,500 | 22.81 | ||||||||||||||||||||||
| 27.05 | 27.05 | 66,846 | 3.90 | 27.05 | 66,846 | 27.05 | ||||||||||||||||||||||
| 28.59 | 37.72 | 13,334 | 4.59 | 35.26 | 13,334 | 35.26 | ||||||||||||||||||||||
| 42.56 | 42.56 | 500 | 4.62 | 42.56 | 500 | 42.56 | ||||||||||||||||||||||
| 44.60 | 44.60 | 5,000 | 4.56 | 44.60 | 5,000 | 44.60 | ||||||||||||||||||||||
| Cumulative |
$ | 3.33 | $ | 44.60 | 257,716 | 3.92 | $ | 18.01 | 233,691 | $ | 18.47 | |||||||||||||||||
The weighted-average fair value of options granted was $6.43 per share during 2009.
Restricted Stock
Our stock incentive plans permit certain employees and non-employee directors to be granted restricted share unit awards in common stock. We value awards of restricted share units by reference to shares of common stock. Awards entitle a participant to receive, upon the settlement of the unit, one share of common stock for each unit. The awards vest annually, over either a two or three year period from the date of the award, and do not have voting rights.
We granted 411,130 restricted stock awards to employees and non-employee directors during 2010, of which 89,000 related to PRSUs. We did not grant any restricted stock awards prior to January 1, 2006. We expense the fair value of the time-based awards at the grant date over the applicable vesting periods. We recognize stock-based compensation associated with PRSUs over the requisite service period if it is probable that the performance condition will be satisfied. Actual payment under the PRSUs granted in 2010 was dependent upon achievement of certain cash flow goals, which were achieved at December 31, 2010. No PRSUs were granted in 2009 or 2008.
The following table summarizes the restricted stock award activity for the three years ended December 31, 2010, 2009 and 2008:
| Number of Share Unit Awards |
Weighted Average Grant Date Fair Value |
|||||||
| Outstanding at January 1, 2008 |
141,224 | $ | 41.10 | |||||
| Granted |
63,890 | 9.99 | ||||||
| Released |
(63,334 | ) | 31.43 | |||||
| Forfeited |
(43,385 | ) | 37.17 | |||||
| Outstanding at December 31, 2008 |
98,395 | 27.86 | ||||||
| Granted |
253,319 | 3.47 | ||||||
| Released |
(75,901 | ) | 22.87 | |||||
| Forfeited |
(49,110 | ) | 8.81 | |||||
| Outstanding at December 31, 2009 |
226,703 | 6.40 | ||||||
| Granted |
411,130 | 8.60 | ||||||
| Released |
(110,485 | ) | 9.31 | |||||
| Forfeited |
(73,773 | ) | 6.49 | |||||
| Outstanding at December 31, 2010 |
453,575 | 7.67 | ||||||
52
Table of Contents
As of December 31, 2010, there was $1.9 million of total unrecognized pre-tax compensation cost related to non-vested restricted stock. We expect this cost to be recognized over a weighted-average period of approximately 1.87 years.
| 11. | Restructuring Charges |
2010 Restructuring Plan
In 2010, we announced a restructuring plan to close vision centers, reduce costs and increase operational efficiencies. As a result, we incurred restructuring charges totaling $3.8 million for 2010, which included $3.6 million of contract termination costs and vision center closing costs and $195,000 of employee separation benefits. The fair value measurements utilized internal discounted cash flow analysis in determining fair value, which is a Level 3 input under U.S. GAAP.
2009 Restructuring Plan
In 2009, we announced a restructuring plan to reduce costs and increase operational efficiencies. As a result, we incurred restructuring charges totaling $2.7 million for 2009, which included $2.2 million of contract termination costs and vision center closing costs and $922,000 of employee separation benefits. Partially offsetting the contract termination costs was a benefit of $435,000 due to a change in estimate of certain previously recognized contract termination costs related to our vision centers closed in 2008 after successful renegotiations with the lessors. The fair value measurements utilized internal discounted cash flow analysis in determining fair value, which is a Level 3 input under U.S. GAAP.
The following table summarizes the restructuring liability activities (dollars in thousands):
| Employee Separation | Contract Termination Costs |
|||||||||||||||
| Employees | Dollars | Total | ||||||||||||||
| Balance at January 1, 2008 |
$ | — | $ | — | $ | — | ||||||||||
| Liabilities recognized |
123 | 1,496 | 308 | 1,804 | ||||||||||||
| Utilized |
(1,496 | ) | 166 | (1,330 | ) | |||||||||||
| Balance at December 31, 2008 |
— | 474 | 474 | |||||||||||||
| Liabilities recognized |
108 | 922 | 1,774 | 2,696 | ||||||||||||
| Utilized |
(685 | ) | (1,156 | ) | (1,841 | ) | ||||||||||
| Balance at December 31, 2009 |
237 | 1,092 | 1,329 | |||||||||||||
| Liabilities recognized |
30 | 195 | 3,595 | 3,790 | ||||||||||||
| Utilized |
(325 | ) | (1,046 | ) | (1,371 | ) | ||||||||||
| Balance at December 31, 2010 |
$ | 107 | $ | 3,641 | $ | 3,748 | ||||||||||
At December 31, 2010 and 2009, we included current restructuring reserves of $1.6 and $1.1 million, respectively, in “Accrued liabilities and other” in the Consolidated Balance Sheets. Long-term restructuring reserves, comprised of contract termination costs, were $2.1 million and $268,000 at December 31, 2010 and 2009, respectively, and were included in “Long-term rent obligations and other.”
| 12. | Commitments and Contingencies |
Our business results in a number of medical malpractice lawsuits. Claims reported to us prior to December 18, 2002 were generally covered by external insurance policies and to date have not had a material financial impact on our business other than the cost of insurance and our deductibles under those policies. Effective in December 2002, we established a captive insurance company to provide coverage for claims brought against us after December 17, 2002. We use the captive insurance company for both primary insurance and excess liability coverage. A number of claims are now pending with our captive insurance company. Since the inception of the captive insurance company in 2002, total claims and expense payments of $4.9 million have been disbursed.
In addition to the above, we are periodically subject to various other claims and lawsuits. We believe that none of these other claims or lawsuits to which we are currently subject, individually or in the aggregate, will have a material adverse affect on our business, financial condition, results of operations and cash flows.
53
Table of Contents
| 13. | Additional Financial Information |
The tables below provide additional financial information related to our consolidated financial statements (all dollars in thousands):
Balance Sheet Information
Property and Equipment is comprised of the following:
| At December 31, | ||||||||
| 2010 | 2009 | |||||||
| Land |
$ | 354 | $ | 354 | ||||
| Building and improvements |
5,815 | 5,815 | ||||||
| Leasehold improvements |
17,781 | 21,015 | ||||||
| Furniture and fixtures |
4,075 | 6,057 | ||||||
| Equipment |
43,580 | 46,750 | ||||||
| 71,605 | 79,991 | |||||||
| Accumulated depreciation |
(57,322 | ) | (53,995 | ) | ||||
| Construction in progress |
681 | 2 | ||||||
| $ | 14,964 | $ | 25,998 | |||||
Accrued Liabilities and Other is comprised of the following:
| At December 31, | ||||||||
| 2010 | 2009 | |||||||
| Accrued enhancement expense |
$ | 3,135 | $ | 2,167 | ||||
| Accrued payroll and related benefits |
2,063 | 1,422 | ||||||
| Restructuring reserve - current |
1,659 | 1,061 | ||||||
| Accrued other taxes |
1,197 | 1,093 | ||||||
| Deferred license fees |
1,362 | 1,362 | ||||||
| Marketing accrual |
921 | 1,567 | ||||||
| Professional fees |
401 | 895 | ||||||
| Income taxes payable, including unrecognized tax benefits |
700 | 677 | ||||||
| Miscellaneous and other expenses accrued at year-end |
828 | 1,337 | ||||||
| $ | 12,266 | $ | 11,581 | |||||
Accumulated other comprehensive income consisted of the following:
| December 31, | ||||||||
| 2010 | 2009 | |||||||
| Unrealized investment gain, net of tax at $0 and $417 |
$ | — | $ | 626 | ||||
| Foreign currency translation adjustment |
662 | 448 | ||||||
| Accumulated other comprehensive income |
$ | 662 | $ | 1,074 | ||||
Income Statement Information
The components of net investment income (loss) were as follows:
| For the Year Ended December 31, | ||||||||||||
| 2010 | 2009 | 2008 | ||||||||||
| Interest income |
$ | 1,066 | $ | 2,610 | $ | 2,588 | ||||||
| Interest expense |
(601 | ) | (873 | ) | (997 | ) | ||||||
| Other-than-temporary impairment on securities |
(86 | ) | (365 | ) | (3,125 | ) | ||||||
| Realized gains on investments |
1,080 | 413 | 10 | |||||||||
| Realized losses on investments |
(51 | ) | — | — | ||||||||
| Net investment income (loss) |
$ | 1,408 | $ | 1,785 | $ | (1,524 | ) | |||||
Cash Flow Information
| For the Year Ended December 31, | ||||||||||||
| 2010 | 2009 | 2008 | ||||||||||
| Cash paid during the year for: |
||||||||||||
| Interest |
$ | 620 | $ | 873 | $ | 997 | ||||||
| Income taxes refunded |
(12,086 | ) | (8,612 | ) | (7,406 | ) | ||||||
| Income taxes paid |
125 | 299 | 4,477 | |||||||||
| Non-cash investing activities: |
||||||||||||
| Capital leases |
$ | — | $ | — | $ | 2,378 | ||||||
Other Comprehensive Loss Information
| For the Year Ended December 31, | ||||||||||||
| 2010 | 2009 | 2008 | ||||||||||
| Comprehensive loss |
||||||||||||
| Net loss |
$ | (20,577 | ) | $ | (33,244 | ) | $ | (6,635 | ) | |||
| Unrealized investment (loss) gain, net of tax of $417, ($381) and $16 |
(626 | ) | 572 | (35 | ) | |||||||
| Foreign currency translation adjustments |
214 | 631 | (533 | ) | ||||||||
| Total other comprehensive loss |
$ | (20,989 | ) | $ | (32,041 | ) | $ | (7,203 | ) | |||
54
Table of Contents
| 14. | Quarterly Financial Data (unaudited) |
Financial results for interim periods do not necessarily indicate trends for any 12-month period. Quarterly results can be affected by the number of procedures performed and the timing of certain expense items (dollars in thousands, except per share amounts):
| 2010 Quarters | 2009 Quarters | |||||||||||||||||||||||||||||||
| First | Second | Third | Fourth | First | Second | Third | Fourth | |||||||||||||||||||||||||
| Revenues |
$ | 34,013 | $ | 26,290 | $ | 20,263 | $ | 19,259 | $ | 47,921 | $ | 31,681 | $ | 27,646 | $ | 21,965 | ||||||||||||||||
| Operating loss |
(681 | ) | (5,396 | ) | (8,504 | ) | (7,384 | ) | (4,177 | ) | (11,814 | ) | (10,357 | ) | (9,748 | ) | ||||||||||||||||
| Loss before income taxes |
(505 | ) | (4,251 | ) | (8,401 | ) | (7,377 | ) | (4,327 | ) | (11,133 | ) | (9,652 | ) | (9,081 | ) | ||||||||||||||||
| Net loss |
(564 | ) | (4,287 | ) | (8,440 | ) | (7,286 | ) | (2,844 | ) | (6,887 | ) | (19,903 | ) | (3,610 | ) | ||||||||||||||||
| Loss per share |
||||||||||||||||||||||||||||||||
| Basic |
$ | (0.03 | ) | $ | (0.23 | ) | $ | (0.45 | ) | $ | (0.39 | ) | $ | (0.15 | ) | $ | (0.37 | ) | $ | (1.07 | ) | $ | (0.19 | ) | ||||||||
| Diluted |
$ | (0.03 | ) | $ | (0.23 | ) | $ | (0.45 | ) | $ | (0.39 | ) | $ | (0.15 | ) | $ | (0.37 | ) | $ | (1.07 | ) | $ | (0.19 | ) | ||||||||
Item 9. Changes in and Disagreements with Accountants on Accounting and Financial Disclosure.
None.
Item 9A. Controls and Procedures
Disclosure controls and procedures
We maintain disclosure controls and procedures that are designed to ensure that information required to be disclosed in its periodic filings with the SEC is (a) accumulated and communicated by our management in a timely manner and (b) recorded, processed, summarized and reported within the time periods specified in the SEC’s rules and forms. As of December 31, 2010, our management, with the participation of our Chief Operating Officer and Chief Financial Officer, carried out an evaluation of the effectiveness of our disclosure controls and procedures as defined in Exchange Act Rule 13a-15(e). Based upon that evaluation, our Chief Operating Officer and Chief Financial Officer concluded that these disclosure controls and procedures were effective as of that date.
Changes in internal control over financial reporting
In addition, our Chief Operating Officer and Chief Financial Officer concluded that, during the quarter ended December 31, 2010, there were no changes in our internal control over financial reporting that have materially affected, or are reasonably likely to materially affect, our internal control over financial reporting.
Management’s report on internal control over financial reporting
We, the management of LCA-Vision Inc., are responsible for establishing and maintaining adequate internal control over financial reporting, as such term is defined in the Securities Exchange Act Rules 13a-15(f) and 15d-15(f), and for the preparation and integrity of the consolidated financial statements and the information contained in this Annual Report. We prepared the accompanying consolidated financial statements in accordance with U.S. generally accepted accounting principles. In addition to selecting appropriate accounting principles, we are responsible for the way information is presented and its reliability. To report financial results we must often make estimates based on currently available information and judgments of current conditions and circumstances.
We assessed the effectiveness of our internal control over financial reporting as of December 31, 2010. In making this assessment, management used the criteria set forth by the Committee of Sponsoring Organizations of the Treadway Commission (COSO) in Internal Control – Integrated Framework. As a result of this assessment, management believes that, as of December 31, 2010, our internal control over financial reporting is effective based on the criteria described above.
Because of inherent limitations, internal control over financial reporting may not prevent or detect misstatements and, even when determined to be effective, can only provide reasonable assurance with respect to financial statement preparation and presentation. Also, projections of any evaluation of effectiveness to future periods are subject to the risks that controls may become inadequate because of changes in conditions, or that the degree of compliance with the policies or procedures may deteriorate.
Ernst & Young LLP, our independent registered public accounting firm, has audited and reported on our consolidated financial statements and the effectiveness of our internal control over financial reporting. The reports of the independent auditors are included herein.
55
Table of Contents
Report of Independent Registered Public Accounting Firm
The Board of Directors and Stockholders of LCA-Vision Inc.
We have audited LCA-Vision Inc.’s internal control over financial reporting as of December 31, 2010, based on criteria established in Internal Control - Integrated Framework issued by the Committee of Sponsoring Organizations of the Treadway Commission (the COSO criteria). LCA-Vision Inc.’s management is responsible for maintaining effective internal control over financial reporting, and for its assessment of the effectiveness of internal control over financial reporting included in the accompanying Management’s Report on Internal Control over Financial Reporting. Our responsibility is to express an opinion on the company’s internal control over financial reporting based on our audit.
We conducted our audit in accordance with the standards of the Public Company Accounting Oversight Board (United States). Those standards require that we plan and perform the audit to obtain reasonable assurance about whether effective internal control over financial reporting was maintained in all material respects. Our audit included obtaining an understanding of internal control over financial reporting, assessing the risk that a material weakness exists, testing and evaluating the design and operating effectiveness of internal control based on the assessed risk, and performing such other procedures as we considered necessary in the circumstances. We believe that our audit provides a reasonable basis for our opinion.
A company’s internal control over financial reporting is a process designed to provide reasonable assurance regarding the reliability of financial reporting and the preparation of financial statements for external purposes in accordance with generally accepted accounting principles. A company’s internal control over financial reporting includes those policies and procedures that (1) pertain to the maintenance of records that, in reasonable detail, accurately and fairly reflect the transactions and dispositions of the assets of the company; (2) provide reasonable assurance that transactions are recorded as necessary to permit preparation of financial statements in accordance with generally accepted accounting principles, and that receipts and expenditures of the company are being made only in accordance with authorizations of management and directors of the company; and (3) provide reasonable assurance regarding prevention or timely detection of unauthorized acquisition, use, or disposition of the company’s assets that could have a material effect on the financial statements.
Because of its inherent limitations, internal control over financial reporting may not prevent or detect misstatements. Also, projections of any evaluation of effectiveness to future periods are subject to the risk that controls may become inadequate because of changes in conditions, or that the degree of compliance with the policies or procedures may deteriorate.
In our opinion, LCA-Vision Inc. maintained, in all material respects, effective internal control over financial reporting as of December 31, 2010, based on the COSO criteria.
We also have audited, in accordance with the standards of the Public Company Accounting Oversight Board (United States), the consolidated balance sheets of LCA-Vision Inc. as of December 31, 2010 and 2009, and the related consolidated statements of operations, stockholders’ investment, and cash flows for each of the three years in the period ended December 31, 2010 of LCA-Vision Inc., and our report dated March 8, 2011 expressed an unqualified opinion thereon.
/s/ Ernst & Young LLP
Cincinnati, Ohio
March 8, 2011
Not applicable.
56
Table of Contents
Item 10. Directors, Executive Officers and Corporate Governance
The information required by this Item 10 is incorporated by reference from “Executive Officers,” “Section 16(a) Beneficial Ownership Reporting Compliance,” “Election of Directors,” and “Information about the Board of Directors and its Committees” to be included in our definitive Proxy Statement which will be filed with the SEC in connection with the 2011 Annual Meeting of Stockholders.
The complete mailing address of each director is c/o LCA-Vision Inc., 7840 Montgomery Road, Cincinnati, OH 45236.
Item 11. Executive Compensation
The information required by this Item 11 is incorporated by reference from “Compensation Committee Report on Executive Compensation,” “Compensation Discussion and Analysis” and “Executive Compensation” to be included in our definitive Proxy Statement which will be filed with the SEC in connection with the 2011 Annual Meeting of Stockholders.
Item 12. Security Ownership of Certain Beneficial Owners and Management and Related Stockholder Matters
The information called for by Item 403 of Regulation S-K and required by this Item 12 is incorporated by reference from “Security Ownership of Certain Beneficial Owners and Management” to be included in our definitive Proxy Statement to be filed with the SEC in connection with the 2011 Annual Meeting of Stockholders.
The information called for by Item 201(d) of Regulation S-K is presented below as of December 31, 2010.
| Plan Category |
Number of securities
to be issued upon exercise of outstanding awards, options, warrants and rights A |
Weighted-average exercise price of outstanding options, warrants and rights B |
Number of securities remaining for future issuance under equity compensation plans (excluding securities reflected in column A) C |
|||||||||
| Equity compensation plans approved by security holders |
711,291 | $ | 18.01 | 869,551 | ||||||||
| Equity compensation plans not approved by security holders |
— | — | — | |||||||||
| Total |
711,291 | $ | 18.01 | 869,551 | ||||||||
Item 13. Certain Relationships and Related Transactions, and Director Independence
The information required by this Item 13 is incorporated by reference, if any, from “Information about the Board of Directors and its Committees” and “Certain Transactions” to be included in our definitive Proxy Statement which will be filed with the SEC in connection with the 2011 Annual Meeting of Stockholders.
Item 14. Principal Accountant Fees and Services
The information required by this Item 14 is incorporated from “Ratification of Appointment of Independent Auditors” to be included in our definitive Proxy Statement which will be filed with the SEC in connection with our 2011 Annual Meeting of Stockholders.
57
Table of Contents
Item 15. Exhibits, Financial Statements Schedules
| (a)(1) List of Financial Statements |
The following are the consolidated financial statements of LCA-Vision Inc. and its subsidiaries appearing elsewhere herein:
Report of Management on Internal Control over Financial Reporting
Reports of Independent Registered Public Accounting Firm
Consolidated Balance Sheets as of December 31, 2010 and 2009
Consolidated Statements of Operations for the years ended December 31, 2010, 2009, and 2008
Consolidated Statements of Cash Flows for the years ended December 31, 2010, 2009, and 2008
Consolidated Statements of Stockholders’ Investment for years ended December 31, 2010, 2009, and 2008
Notes to Consolidated Financial Statements
(a)(2) List of Schedules
Schedule II Valuation and Qualifying Accounts and Reserves
All other financial statement schedules have been omitted because the required information is either inapplicable or presented in the consolidated financial statements.
LCA-Vision Inc.
For the years ended December 31, 2010, 2009 and 2008
(in thousands)
| Description |
Balance at Beginning of Period |
Charges to Cost and Expenses |
Deductions | Balance at End of Period |
||||||||||||
| Year ended December 31, 2010 |
||||||||||||||||
| Allowance for doubtful accounts |
$ | 2,319 | $ | 1,061 | $ | 1,370 | $ | 2,010 | ||||||||
| Insurance reserves |
9,154 | 679 | 2,427 | 7,406 | ||||||||||||
| Valuation allowance deferred tax assets |
13,344 | 7,774 | — | 21,118 | ||||||||||||
| Year ended December 31, 2009 |
||||||||||||||||
| Allowance for doubtful accounts |
$ | 3,127 | $ | 3,320 | $ | 4,128 | $ | 2,319 | ||||||||
| Insurance reserves |
9,489 | 863 | 1,198 | 9,154 | ||||||||||||
| Valuation allowance deferred tax assets |
1,160 | 12,184 | — | 13,344 | ||||||||||||
| Year ended December 31, 2008: |
||||||||||||||||
| Allowance for doubtful accounts |
$ | 5,117 | $ | 5,355 | $ | 7,345 | $ | 3,127 | ||||||||
| Insurance reserves |
8,493 | 1,432 | 436 | 9,489 | ||||||||||||
| Valuation allowance deferred tax assets |
— | 1,160 | — | 1,160 | ||||||||||||
58
Table of Contents
| (a)(3) List of Exhibits |
| Exhibit # |
Description of Exhibit | |
| *3(a) | Restated Certificate of Incorporation, as amended, of Registrant (Exhibit 3(a) to Annual Report on Form 10-K for the year ended December 31, 2003) | |
| *3(b) | Amended Bylaws of Registrant (Exhibit 3(b) to Current Report on Form 8-K filed June 15, 2007) | |
| *3(c) | Certificate of designation of Series A Participating Preferred Stock, as filed with the Department of State of the State of Delaware on November 24, 2008 (Exhibit 3.1 to Current Report on Form 8-K filed November 24, 2008) | |
| *10(a) | Loan and Security Agreement between the Registrant and PNC Equipment Finance, LLC dated April 24, 2008 (Exhibit 10.1 to Current Report on Form 8-K filed April 30, 2008) | |
| Executive Compensation Plans and Arrangements | ||
| *10(b) | LCA-Vision Inc. 2006 Stock Incentive Plan (definitive Proxy Statement for 2006 Annual Meeting of Stockholders, filed April 28, 2006) | |
| *10(c) | Form of Restricted Stock Award Agreement with all employees, including named executive officers (Exhibit 10.2 to Current Report on Form 8-K filed February 24, 2006) | |
| *10(d) | Form of Stock Option Agreement with outside directors (Exhibit 10.3 to Current Report on Form 8-K filed February 24, 2006) | |
| *10(e) | Form of Stock Option Agreement with all employees, including named executive officers (Exhibit 10.4 to Current Report on Form 8-K filed February 24, 2006) | |
| *10(f) | Form of Notice of Grant of Award and Award Agreement for Restricted Stock Units (Exhibit 10.2 to Current Report on Form 8-K filed June 16, 2006) | |
| *10(g) | Form of Indemnification Agreement between the Registrant and its directors (Exhibit 10.1 to Current Report on Form 10-K filed July 24, 2008) | |
| *10(h) | Form of Agreement between the Registrant and certain of its executive officers (Exhibit 10.1 to Current Report on Form 8-K filed July 1, 2008 | |
| *10(i) | Employment Agreement between LCA-Vision Inc. and Rhonda Sebastian dated September 8, 2009 (Exhibit 10.1 to Quarterly Report on Form 10-Q filed October 27, 2009) | |
| 21 | Subsidiaries of the Registrant | |
| 23 | Consent of Ernst & Young LLP | |
| 24 | Powers of Attorney (contained on signature page) | |
| 31.1 | Rule 13a-14(a)/15d-14(a) Certification of Chief Operating Officer | |
| 31.2 | Rule 13a-14(a)/15d-14(a) Certification of Chief Financial Officer | |
| 32 | Section 1350 Certifications | |
| * | Incorporated by reference. |
59
Table of Contents
Pursuant to the requirements of Section 13 or 15(d) of the Securities Exchange Act of 1934, the registrant has duly caused this report to be signed on its behalf by the undersigned, thereunto duly authorized, as of the 8th day of March, 2011.
| LCA-Vision Inc. | ||
| By: |
/s/ David L. Thomas | |
| David L. Thomas, Chief Operating Officer | ||
| By: |
/s/ Michael J. Celebrezze | |
| Senior Vice President of Finance, | ||
| Chief Financial Officer and Treasurer | ||
POWER OF ATTORNEY
KNOW ALL PERSONS BY THESE PRESENTS, that each person whose signature appears below hereby constitutes and appoints each of David L. Thomas and Michael J. Celebrezze his true and lawful attorney-in-fact and agent, with full power of substitution and with power to act alone, to sign and execute on behalf of the undersigned any amendment or amendments to this annual report on Form 10-K for the fiscal year ended December 31, 2010, and to perform any acts necessary to be done in order to file such amendment or amendments, with exhibits thereto and other documents in connection therewith, with the Securities and Exchange Commission and each of the undersigned does hereby ratify and confirm all that said attorney-in-fact and agent, or his substitutes, shall do or cause to be done by virtue hereof.
Pursuant to the requirements of the Securities Exchange Act of 1934, this report has been signed below by the following persons on behalf of the registrant and in the capacities indicated below as of the 8th day of March, 2011.
| /s/ David L. Thomas David L. Thomas |
Chief Operating Officer (Co-Principal Executive Officer) | |||
| /s/ Michael J. Celebrezze Michael J. Celebrezze |
Senior Vice President of Finance, Chief Financial Officer and Treasurer (Co-Principal Executive Officer, Principal Financial and Accounting Officer) | |||
| /s/ E. Anthony Woods E. Anthony Woods |
Chairman of the Board | |||
| /s/ William F. Bahl William F. Bahl |
Director | |||
| /s/ John H. Gutfreund John H. Gutfreund |
Director | |||
| /s/ John C. Hassan John C. Hassan |
Director | |||
| /s/ Edgar F. Heizer III Edgar F. Heizer III |
Director | |||
60