Attached files
UNITED STATES
SECURITIES AND EXCHANGE COMMISSION
Washington, D.C. 20549
FORM 10-K
| x | ANNUAL REPORT PURSUANT TO SECTION 13 OR 15(d) OF THE SECURITIES EXCHANGE ACT OF 1934 |
For the fiscal year ended December 31, 2010
OR
| ¨ | TRANSITION REPORT PURSUANT TO SECTION 13 OR 15(d) OF THE SECURITIES EXCHANGE ACT OF 1934 |
For the transition period from to
Commission File Number 000-22439
FISHER COMMUNICATIONS, INC.
(Exact name of registrant as specified in its charter)
| Washington | 91-0222175 | |
| (State or Other Jurisdiction of Incorporation or Organization) | (IRS Employer Identification No.) | |
| 140 4th Avenue N., Suite 500 Seattle, Washington |
98109 | |
| (Address of principal executive offices) | (Zip Code) | |
(206) 404-7000
(Registrant’s telephone number, including area code)
Securities registered pursuant to Section 12(b) of the Act:
| Title of Each Class |
Name of Each Exchange on Which Registered | |
| Common Stock, $1.25 par value | Nasdaq Global Market |
Securities registered pursuant to Section 12(g) of the Act:
None
Indicate by check mark if the registrant is a well-known seasoned issuer, as defined in Rule 405 of the Securities Act. Yes ¨ No x
Indicate by check mark if the registrant is not required to file reports pursuant to Section 13 or Section 15(d) of the Exchange Act. Yes ¨ No x
Indicate by check mark whether the registrant (1) has filed all reports required to be filed by Section 13 or 15(d) of the Securities Exchange Act of 1934 during the preceding 12 months (or for such shorter periods that the registrant was required to file such reports), and (2) has been subject to such filing requirements for the past 90 days. Yes x No ¨
Indicate by check mark whether the registrant has submitted electronically and posted on its corporate Web site, if any, every Interactive Data File required to be submitted and posted pursuant to Rule 405 of Regulation S-T (§ 232.405 of this chapter) during the preceding 12 months (or for such shorter period that the registrant was required to submit and post such files). Yes ¨ No ¨
Indicate by check mark if disclosure of delinquent filers pursuant to Item 405 of Regulation S-K (§ 229.406 of this chapter) is not contained herein, and will not be contained, to the best of the registrant’s knowledge, in definitive proxy or information statements incorporated by reference in Part III of this Form 10-K or any amendment to this Form 10-K. ¨
Indicate by check mark whether the registrant is a large accelerated filer, an accelerated filer, a non-accelerated filer or a smaller reporting company. See the definitions of “large accelerated filer,” “accelerated filer” and “smaller reporting company” in Rule 12b-2 of the Exchange Act.
Large accelerated filer ¨ Accelerated filer x Non-accelerated filer ¨ Smaller reporting company ¨
Indicate by check mark whether the registrant is a shell company (as defined in Rule 12b-2 of the Exchange Act). Yes ¨ No x
As of June 30, 2010, the aggregate market value of the registrant’s common stock held by non-affiliates of the registrant was approximately $143,042,000 based on the closing sale price as reported on the Nasdaq Global Market.
The number of shares outstanding of each of the issuer’s classes of common stock, as of March 4, 2011 was:
| Title of Class |
Number of Shares Outstanding | |
| Common Stock, $1.25 Par Value | 8,791,338 |
DOCUMENTS INCORPORATED BY REFERENCE
| Document |
Parts Into Which Incorporated | |
| Proxy Statement for the Annual Meeting of Shareholders to be held on May 11, 2011 |
Part III |
PART I
| ITEM 1. | BUSINESS |
This annual report on Form 10-K contains forward-looking statements that involve known and unknown risks and uncertainties, such as statements of our plans, objectives, expectations and intentions. Words such as “may,” “could,” “would,” “should,” “expect,” “anticipate,” “intend,” “plan,” “believe,” “estimate” and variations of such words and similar expressions are intended to identify such forward-looking statements. You should not place undue reliance on these forward-looking statements, which are based on our current expectations and projections about future events, are not guarantees of future performance, are subject to risks, uncertainties and assumptions (including those described herein) and apply only as of the date of this report. Our actual results could differ materially from those anticipated in the forward-looking statements. Factors that could cause or contribute to such differences include, but are not limited to, those discussed in the section of this annual report entitled “Risk Factors,” as well as those discussed elsewhere in this annual report.
Although we believe that the expectations reflected in the forward-looking statements are reasonable, we cannot guarantee future results, level of activity, performance or achievements. Moreover, neither we nor any other person assumes responsibility for the accuracy and completeness of the forward-looking statements. Except as otherwise required by law, we disclaim any responsibility to update any of the forward-looking statements after the date of this annual report to conform such statements to actual results or to changes in our expectations.
Unless the context requires otherwise, references in this annual report to “Fisher,” “the Company,” “we,” “us,” or “our” refer to Fisher Communications, Inc. and its consolidated subsidiaries.
Company Description
Fisher Communications, Inc. is an integrated media company that was founded in 1910 and has been in the broadcasting business since 1926. Fisher Communications, Inc. is incorporated in the State of Washington. We conduct our operations through two subsidiaries, Fisher Broadcasting Company (“Fisher Broadcasting”) and Fisher Media Services Company (“Fisher Media Services”). Our broadcasting operations provided approximately 92% of consolidated revenue from continuing operations in 2010, with television accounting for approximately 84% and radio accounting for approximately 16% of our 2010 broadcasting revenue. Our broadcasting operations provided approximately 90% of consolidated revenue in 2009, with television accounting for approximately 81% and radio accounting for approximately 19% of our 2009 broadcasting revenue. Our broadcasting operations provided approximately 92% of consolidated revenue from continuing operations in 2008, with television accounting for approximately 77% and radio accounting for approximately 23% of our 2008 broadcasting revenue.
Fisher Broadcasting Company owns and operates 13 full power television stations (including a 50%-owned television station), seven low power television stations and ten owned and managed radio stations in the Western United States. We have long-standing network affiliations with ABC and CBS, and also operate FOX and Univision affiliates as part of duopolies in several of our markets. Our television and radio stations are located in Washington, Oregon, California, Idaho and Montana. Seattle and Portland are our two largest television markets and Seattle is our largest radio market. We own ABC and Univision network affiliates in both Seattle and Portland, which are within the top 25 Designated Market Area (“DMA”) television markets as determined by Nielsen Media Research (“Nielsen”). We also own three radio stations in Seattle, the 13th largest radio market in the United States, ranked by population, as determined by Arbitron, Inc. (“Arbitron”). Our television stations reach 4.2 million households (approximately 3.6% of U.S. television households) according to Nielsen. Our stations produce quality local programming and have received numerous awards for broadcasting excellence.
1
As part of the ongoing development of our business, in recent years we completed the following transactions:
| • | In September 2006, we completed the stock purchase of African-American Broadcasting of Bellevue for $16 million. We had purchased 25% of the equity in June 2006 for $4 million and completed the purchase of the remaining 75% equity for $12 million. |
| • | In October 2006, we sold eighteen of our twenty-four small-market radio stations located in Montana and Eastern Washington for $26 million. This transaction was structured as a like kind exchange, for tax purposes, and we used a portion of the proceeds, $19 million, to purchase two Oregon television stations in November 2006. We sold an additional Montana radio station in June 2007 for $3 million. We continue to operate five radio stations in Great Falls, Montana. |
| • | In November 2006, we completed the purchase of two Univision-affiliated Oregon television stations for $19 million. As part of the same transaction, which was initially announced in December 2005, we also acquired two Telefutura-affiliated Idaho television stations in May 2006 for $1 million. |
| • | In April 2007, we finalized the purchase of four low power television stations located in Eastern Washington for $5 million. The stations provide Spanish-language programming to the Yakima-Pasco-Richland-Kennewick television market through an affiliation with Univision. |
| • | In July 2007, we acquired the assets of Pegasus News, Inc. (“Pegasus”), an online hyper-local media pioneer based in Dallas, Texas, for approximately $1.5 million. Pegasus is a local news service, specializing in providing personalized online local news, information and advertising. |
| • | In January 2008, we completed the acquisition of a CBS and a FOX television station in Bakersfield, California for $55.3 million in cash. |
| • | In December 2008, we completed our sale of 100% of the outstanding membership interests in Panlocal Media LLC. Panlocal Media, owned and operated Pegasus. As consideration for the sale, the buyer paid Fisher Broadcasting $1.5 million in cash and granted us and our affiliates a royalty-free, non-exclusive, non-transferable license to use certain related technology in our existing television and radio markets to deliver personalized online local news, information and advertising. |
| • | During 2008, we sold our remaining 2.3 million shares of the common stock of Safeco Corporation, an insurance and financial services corporation. The shares were sold at an average price of $66.65 per share, resulting in pre-tax net proceeds to us of $153.4 million. The book basis of the shares sold was $782,000, resulting in a pre-tax gain on sale of $152.6 million that is included in other income, net for 2008. In December 2007, we sold approximately 700,000 shares of Safeco Corporation common stock. The shares were sold at an average price of $58.05 per share, resulting in pre-tax net proceeds to us of approximately $40.6 million. The book basis of the shares sold was $237,000, resulting in a pre-tax gain on sale of $40.4 million. We had been a shareholder of Safeco Corporation since 1923. |
| • | In May 2009, we entered into a three year Local Marketing Agreement (“LMA”) with South Sound Broadcasting LLC (“South Sound”) to manage one of South Sound’s FM radio stations licensed to Oakville, Washington. The station broadcasts our KOMO News Radio programming to FM listeners in the Seattle – Tacoma radio market. Contemporaneously with the LMA, we entered into an option agreement with South Sound, whereby we have the right to acquire the station until May 8, 2012. If we do not exercise the option prior to its expiration date, we are obligated to pay South Sound up to approximately $1.4 million. |
| • | In December 2009, we purchased shares of Series B preferred stock of DataSphere Technologies, Inc. (“DataSphere”) for $1.5 million in cash. DataSphere is a Software as a Service Web technology and hyperlocal ad sales company focused on generating online profits for media companies. Earlier in 2009, we also entered into an agreement with DataSphere to utilize its technology and sales solution for our launch of over 100 hyperlocal neighborhood sites in Seattle, Washington; Portland and Eugene, Oregon; Bakersfield, California; and Boise, Idaho. We also work with DataSphere in its distribution of its technology and sales solution to other broadcast companies looking to establish hyperlocal sites. |
2
| • | During 2009, we repurchased $28.0 million aggregate principal amount of our 8.625% senior notes due in 2014 for a total consideration of $24.4 million in cash plus accrued interest of $637,000. We recorded a gain on the extinguishment of debt, net of a charge for related unamortized debt issuance costs of $557,000, of approximately $3.0 million. |
| • | During 2010, we repurchased $20.6 million aggregate principal amount of our 8.625% senior notes due in 2014 for a total consideration of $20.5 million in cash plus accrued interest of $312,000. We recorded a loss on the extinguishment of debt, net of a charge for related unamortized debt issuance costs of $317,000, of approximately $160,000. |
| • | In March 2010, we entered into a three year consulting and license agreement with ACME Television, LLC (“ACME”) which was effective April 1, 2010. Under the terms of the agreement, we provide consulting services to ACME’s The Daily Buzz television show and we also license certain assets of the program in order to produce unique content to be distributed on both traditional broadcast and newly created digital platforms. In conjunction with the agreement, we were granted an option to purchase the ownership rights to The Daily Buzz television show until September 30, 2012. |
| • | In December 2010, we entered into a ten year Joint Sales Agreement (“JSA”) with NPG of Idaho, Inc., a subsidiary of News Press & Gazette Company (“NPG”), who owns and operates KIFI-TV an Idaho Falls, Idaho television station which was effective January 1, 2011. Under the agreement NPG provides certain services supporting the operation of our television station in Idaho Falls, KIDK-TV, and sells substantially all of the commercial advertising on our station. We pay NPG a non-material fixed fee pursuant to the agreement, and a performance bonus based on station performance. Contemporaneously, with the JSA, we entered into an option agreement with NPG, whereby they have a conditional option to acquire KIDK-TV until January 1, 2021, effective on the expiration or termination of the indenture governing our senior notes. |
| • | In January 2011, we repurchased $2.6 million aggregate principal amount of our 8.625% senior notes due in 2014 for a total consideration of $2.7 million in cash plus accrued interest of $78,000. A loss on extinguishment of debt was recorded, net of a charge for related unamortized debt issuance costs of $35,000, of approximately $110,000. After this repurchase the aggregate principal amount of our outstanding senior notes is $98.8 million. |
Fisher Media Services Company owns and operates Fisher Plaza, a commercial building that includes a data center located near downtown Seattle. The data center is designed to enable companies to distribute analog and digital media content through numerous distribution channels, including broadcast, satellite, cable, Internet and broadband, as well as other wired and wireless communication systems. Fisher Plaza serves as the home of our corporate offices and our Seattle television and radio stations. Fisher Plaza also houses a variety of companies, including media and communications companies.
We report financial data for three reportable segments: television, radio and Fisher Plaza. The television segment includes the operations of our television stations and our Internet business discussed below. The radio segment includes the operations of our radio stations discussed below. The Fisher Plaza segment includes the operations of Fisher Plaza discussed below. See Note 13 to our consolidated financial statements for information about the financial results for our segments for the years ended December 31, 2010, 2009 and 2008.
Employees
We employed 828 full-time employees as of December 31, 2010. Approximately 15% of our workforce, located primarily at our KOMO TV, KATU TV, KBAK TV, KBFX CA and KBOI TV operations, is subject to collective bargaining agreements.
3
Television Segment
Our television segment includes our television operations, as well as our Internet business. For information on our Internet business, see “Internet Business” below.
Our Television Stations
The following table sets forth selected information about our television stations as of December 31, 2010:
| Station |
Market Area (1) |
DMA |
Network Affiliation |
Expiration Date of Affiliation Agreement | ||||
| KOMO-TV |
Seattle-Tacoma, WA | 13 | ABC | August 31, 2014 | ||||
| KUNS-TV |
Seattle-Tacoma, WA | 13 | Univision | September 12, 2011 | ||||
| KATU (TV) |
Portland, OR | 22 | ABC | August 31, 2014 | ||||
| KUNP (TV) |
LaGrande, OR | 22 | Univision | September 12, 2011 | ||||
| KUNP-LP |
Portland, OR | 22 | Univision | September 12, 2011 | ||||
| KBOI-TV |
Boise, ID | 113 | CBS | February 29, 2016 | ||||
| KYUU-LP |
Boise, ID | 113 | Retro TV | N/A | ||||
| KVAL-TV |
Eugene, OR | 118 | CBS | February 29, 2016 | ||||
| KCBY-TV |
Coos Bay, OR | 118 | CBS | February 29, 2016 | ||||
| KPIC (TV) (3) |
Roseburg, OR | 118 | CBS | February 29, 2016 | ||||
| KBAK-TV |
Bakersfield, CA | 125 | CBS | March 3, 2016 | ||||
| KBFX-CA (4) |
Bakersfield, CA | 125 | FOX | June 30, 2010 | ||||
| KIMA-TV |
Yakima, WA | 126 | CBS | February 29, 2016 | ||||
| KEPR-TV |
Pasco/Richland/Kennewick, WA | 126 | CBS | February 29, 2016 | ||||
| KUNW-CA |
Yakima, WA | 126 | Univision | September 12, 2011 | ||||
| KVVK-CA |
Pasco/Richland/Kennewick, WA | 126 | Univision | September 12, 2011 | ||||
| KORX-CA |
Walla-Walla, WA | 126 | Univision | September 12, 2011 | ||||
| KLEW-TV (5) |
Lewiston, ID | N/A | CBS | February 29, 2016 | ||||
| KIDK (TV) |
Idaho Falls-Pocatello, ID | 162 | CBS | February 29, 2016 | ||||
| KXPI-LP |
Pocatello, ID | 162 | My Network TV | N/A |
| (1) | “Market Area” refers to the television market served by each station. Most stations are located in the Nielsen DMA, which represent exclusive geographic areas of counties in which the home market stations are estimated to have the largest quarter-hour audience share. |
| (2) | DMA Rank represents the DMA ranking by size of the market area in which each station is located. DMA Rank is based on January 2011 estimates published by Nielsen. The legend “N/A” designates that the station is not located in a Nielsen DMA. |
| (3) | Fisher Broadcasting owns a 50% interest in South West Oregon Television Broadcasting Corporation, licensee of KPIC. |
| (4) | KBFX is currently operating under an affiliation agreement with Fox Network that expired June 30, 2010. We have been in ongoing discussions with Fox with respect to a new agreement. |
| (5) | Although included as part of the Spokane, Washington DMA, KLEW primarily serves the Lewiston, Idaho and Clarkston, Washington audience that is only a small portion of the Spokane DMA. |
We have been affiliated with ABC and CBS for more than 50 years, Univision since 2006 and FOX since 2005.
KOMO-TV and KUNS-TV, Seattle-Tacoma, Washington
KOMO-TV and KUNS-TV operate in the Seattle-Tacoma DMA, which has approximately 1.9 million television households and a population of approximately 4.5 million. According to Nielsen, in 2010, approximately 73% of the population subscribed to cable and 21% subscribed to alternative delivery systems
4
(alternative delivery service includes program delivery via satellite, satellite master antenna systems or multipoint distribution systems). Major industries in the market include aerospace, information technology, manufacturing, biotechnology, forestry, transportation, retail and international trade. Major employers include Microsoft Corporation, The Boeing Company, Liberty Mutual Group, PACCAR Inc, Nordstrom, Inc., Costco Wholesale Company, Starbucks Corporation, the University of Washington, amazon.com, Inc., T-Mobile-USA and Weyerhaeuser Company.
KOMO-TV began broadcasting in 1953. The station’s commitment to be the market leader in local news is manifested on multiple distribution platforms. KOMO-TV produces 38 hours of live local news per week on its digital channels. In 2010 the National Association of Television Arts and Sciences awarded 16 Emmys to the station for program and individual excellence. In addition, KOMO-TV received 4 regional Edward R. Murrow awards in 2010.
KUNS-TV began serving as Seattle’s first Univision station in January 2007. According to Nielsen, the Seattle-Tacoma DMA has approximately 105,850 Hispanic households and ranks as the 27th largest Hispanic market in the United States. KUNS-TV produces five hours of locally produced television news per week on its digital channel.
KATU (TV) and KUNP (TV), Portland and La Grande, Oregon
KATU (TV) and KUNP (TV) serve the Portland DMA, which has approximately 1.2 million television households and a population of approximately 3.0 million. According to Nielsen, around 58% of Portland’s population subscribed to cable-television service in 2010, while approximately 30% of households are listed as subscribers to alternative delivery systems. The Portland metro area has a broad base of manufacturing, distribution, wholesale and retail trade, regional government and business services. Major employers in the Portland area include Oregon Health & Science University, Intel Corporation, Nike, Inc., Hewlett-Packard Company, Legacy Health System and Kaiser Permanente.
KATU (TV) currently broadcasts 37 1/2 hours of live local news weekly. The station produces and airs AM Northwest, one of the country’s longest running live Monday to Friday local talk/information programs.
In 2009, KATU (TV) won an Edward R. Murrow Award for outstanding news series “Fight for Faith” and two Television Emmy Awards for “Continuing Coverage” and “Best News Team Coverage”. KATU (TV) was also honored with the following awards by the Oregon Association of Broadcasters in 2009: “Best Coverage of Breaking News”, “Best Uniquely Oregon Program Produced by Station”, “Best Single Sports Story” and “Best Public Affairs Program”.
In 2010, KATU (TV) was honored by the Oregon Associated Press for “Best Newscast,” “Overall Excellence,” and “Best Public Affairs Program.” KATU received first place honors for “News Writing,” “Hard News Coverage,” and KATU Sports Director Katy Brown was named “Best Sportscaster.”
KUNP (TV) has been a Univision affiliate since before we acquired the stations in 2006. According to Nielsen, the Portland DMA has approximately 91,270 Hispanic television households and is the 31st largest Hispanic market in the United States. KUNP (TV) produces five hours of locally produced news per week.
KBOI-TV and KYUU-LP, Boise, Idaho
KBOI-TV and KYUU-LP serve the Boise, Idaho DMA, which has approximately 262,920 television households and a total population of approximately 683,000. According to Nielsen, an estimated 24% of the television households in the Boise DMA subscribe to cable television with another 47% subscribing to an alternative delivery system. Boise is the state capital and regional center for business, government, education,
5
health care and the arts. Major employers include Hewlett-Packard Company, Micron Technology, Inc., Boise State University, Albertson’s and Saint Alphonsus Regional Medical Center. Boise was ranked fourth among the “10 Best Places to Live” by US News and World Report in 2009, and was also listed as one of the “25 Best Places to Retire” by CNN Money.com in 2010.
KBOI-TV currently broadcasts 22 1/2 hours per week of live local news programs. In 2010, KBOI-TV was honored by the Idaho State Broadcasters’ Association for “Best Weather,” “Best Sports,” “Best Public Affairs Program,” “Best Promotion,” and “Best Commercial Series”. The station was also nominated for an Emmy and received 11 awards from the Idaho Press Club including “Best Weathercast,” and “Best Sportscast.” KYUU- LP features “Retro TV” programming and broadcasts 3 1/2 hours of local news programming every weekday.
KVAL-TV, KCBY-TV, and KPIC (TV), Eugene, Coos Bay and Roseburg, Oregon
KVAL-TV, KCBY-TV, and KPIC (TV) (collectively “KVAL+”) serve the Eugene DMA, which has approximately 243,870 television households and a population of approximately 571,000. According to Nielsen, around 51% of the Eugene DMA’s population subscribed to cable-television service in 2010, while approximately 35% of households are listed as subscribers to alternative delivery systems. KVAL-TV’s broadcast studios are located in Eugene. KCBY-TV, in Coos Bay and KPIC (TV), in Roseburg, are KVAL -TV’s satellite stations which are defined as full-power terrestrial broadcast stations authorized to retransmit all or part of the programming of a parent station that is ordinarily commonly owned. The area’s economic base includes forest products, agriculture, high-tech manufacturing, regional hospital and medical services, packaging, tourism and fishing. Major employers include the state’s two major universities—University of Oregon in Eugene and Oregon State University in Corvallis, Hewlett-Packard Company, Symantec Corporation, Sacred Heart Medical Center, Monaco Coach Corporation, Levi Strauss & Company, Enterprise Car Rental, and Roseburg Forest Products.
KVAL+ broadcasts 22 hours of live local news per week. KVAL + has a long tradition of award-winning news, public affairs programming and information. In 2010, KVAL+ won the coveted “Best Newscast” award from The Oregon Associated Press for the second year in a row.
KBAK-TV and KBFX-CA, Bakersfield, California
KBAK-TV (CBS) and KBFX-CA (Fox) serve the Bakersfield, California DMA. Ranked as the 125th largest television market, Bakersfield has approximately 225,670 television households and a population of approximately 687,000. According to Nielsen, in 2010, approximately 49% of the population subscribed to cable, while approximately 36% of households are listed as subscribers to alternative delivery systems. The Bakersfield economy is based on agriculture (ranching and row crops), petroleum, and the defense and aerospace industries. The U.S. Department of Defense accounts for approximately 28% of total Kern County employment. The region continues to grow in the areas of manufacturing, distribution, health care, and agriculture-related business services. Major employers in the Bakersfield area include Occidental, Chevron, Frito Lay, Nestle, and the University of California at Bakersfield. In fall of 2010, Bakersfield was announced as a location for one of the first phases of California’s High Speed Rail Project, with construction scheduled to commence in 2012.
KBAK-TV currently broadcasts 25 hours of live local news weekly, and KBFX-CA broadcasts 16 hours of news weekly. KBAK-TV produces Health Alert, a locally produced program on health issues. In January 2010, both stations launched local news in full high definition.
Major station community initiatives include cancer prevention, research, and treatment. In 2010, Eyewitness News was recognized with an Edward R. Murrow Award for Feature Reporting, three Emmy Awards, and five Golden Mike Awards. In addition, anchor Lisa Krch has been recognized by the Central California Regional Obesity Prevention Program (CCROPP) with the 2010 Cultivator Award for her coverage on the issue of Childhood Obesity. Anchor Kurt Rivera was awarded honors in Washington, DC by the National Association for Mental Illness for his series on teen suicide, “Dying For Help.”
6
KIMA-TV, KEPR-TV, KLEW-TV, KUNW-CA, KVVK-CA, and KORX -CA, Yakima and Tri-Cities, Washington and Lewiston, Idaho
KIMA-TV serves the Yakima, Washington area while its satellite stations, KEPR-TV and KLEW-TV, serve Pasco-Richland-Kennewick, Washington (the “Tri-Cities”), and Lewiston, Idaho, respectively. Together, the Yakima and the Tri-Cities areas comprise the Yakima-Pasco-Richland-Kennewick DMA, which includes approximately 225,320 television households and a population of approximately 609,000. According to Nielsen, the market has a 36% cable penetration and a 50% alternate delivery system penetration. KLEW-TV is the only full power station licensed to Lewiston, Idaho, which is part of the Spokane, Washington DMA. KLEW-TV serves approximately 160,000 people in approximately 70,000 television households.
The area covered by KIMA-TV, KEPR-TV and KLEW-TV has an economic base that consists primarily of agriculture, nuclear technology, government, manufacturing and the wholesale food processing and tourism industries, as well as being the core of Washington wine country. Major employers include Battelle, Inc., Clearwater Paper, Con Agra Foods, Inc., Duratek, Inc., Tyson Foods, Inc., Energy Northwest, CH2M HILL Companies, Ltd., Fluor Corporation, Bechtel Corporation, Lockheed Martin Corporation, Siemens AG, Tree Top, Inc., Noel Corp., and Boise Cascade.
KIMA-TV and KEPR-TV each broadcast nearly 20 hours per week of scheduled live local news programs. In 2010, KEPR-TV was nominated for an Emmy for its 5pm newscast and won five awards from the Society of Professional Journalists, Region 10 (the Northwestern United States). KIMA also won five awards from the Society of Professional Journalists, Region 10 including a sweep of the “Spot News Reporting” category.
KUNW-CA, Yakima, KVVK-CA, Kennewick, and KORX-CA, Walla Walla (together, “KUNW+”) are the Univision affiliates in the Yakima, Washington DMA. According to Nielsen, the Yakima market has approximately 45,800 Hispanic television households and is the 50th largest Hispanic market in the United States. KUNW+ produces a local newscast each weekday and also broadcasts interviews with members of the Hispanic community throughout the day.
KIDK (TV) and KXPI-LP, Idaho Falls-Pocatello, Idaho
KIDK (TV) and KXPI-LP serve the Idaho Falls-Pocatello market, which has approximately 128,860 television households and a population of approximately 345,000. According to Nielsen, an estimated 31% of the television households subscribe to cable, with approximately 47% subscribing to an alternative delivery system. The Idaho Falls-Pocatello DMA consists of 14 counties located in Eastern Idaho and Western Wyoming. Idaho Falls and Pocatello, 50 miles apart, are the two largest cities in the DMA. Battelle Inc., the contractor for operation of the Idaho National Engineering & Environmental Laboratory, is the largest employer in the region. Other major employers include Melaluca, Inc., JR Simplot Company, American Microsystems, Idaho State University, Brigham Young University-Idaho, Eastern Idaho Regional Medical Center, Negra Modelo, Qwest, American Microsystems, Inc., Portneuf Medical Center, Convergys Corporation and Ballard Medical Products.
KIDK (TV) broadcasts 3 1/2 hours per week of live local news programs. KXPI-LP is the My Network TV affiliate and airs syndicated programming, along with a live 9 p.m. newscast. KXPI-LP provides 4 hours of live news programming per week along with 10 hours of rebroadcast newscasts from KIDK (TV).
In December 2010, we entered into a ten year Joint Sales Agreement (“JSA”) with NPG of Idaho, Inc., a subsidiary of News Press & Gazette Company (“NPG”), who owns and operates KIFI-TV an Idaho Falls, Idaho television station which was effective January 1, 2011. Under the agreement NPG provides certain services supporting the operation of our television station in Idaho Falls, KIDK-TV, and sells substantially all of the commercial advertising on our station. We pay NPG a non-material fixed fee pursuant to the agreement, and performance bonus based on station performance. Contemporaneously, with the JSA, we entered into an option agreement with NPG, whereby they have a conditional option to acquire KIDK-TV until January 1, 2021, effective on the expiration or termination of the indenture governing our senior notes.
7
Television Broadcasting Industry
The FCC grants licenses to build and operate broadcast television stations. Currently, a limited number of channels are available for television broadcasting in any one geographic area.
According to Nielsen in 2010, there were approximately 116 million television households in the United States (household universe estimates), of which approximately 71 million are cable households, and a total of approximately 105 million receive television via cable or an alternative delivery service. According to Nielsen, on average, overall household television viewing is 58 hours per week.
Television stations primarily receive revenue from the sale of local, regional and national advertising and, to a much lesser extent, from retransmission consent fees, network compensation, tower rental and commercial production activities. Broadcast television stations’ relatively high fixed costs of operation and heavy reliance on advertising revenue render the stations vulnerable to cyclical changes in the economy. The size of advertisers’ budgets, which are sensitive to broad economic trends, affects the broadcast industry in general and, specifically, the revenue of individual broadcast television stations. Broadcasters are dependent on advertising revenue, which can be influenced by events such as declines in the national, regional, or local economies (as has been the case in recent years), employment levels, network ratings, consumer confidence and the success of national time sales representatives. Political and advocacy advertising can constitute, and in the past has constituted, a significant revenue source in some years, particularly national election years. The amount of our revenue in election years depends on many factors, such as whether Washington, Oregon, California and Idaho are contested states in a presidential election and the extent of local and regional ballot initiatives. See “Risk Factors – We depend on advertising revenues, which fluctuate as a result of a number of factors” below for additional information.
Digital Television Transition
The Digital Television standard, or DTV, developed after years of research and approved by the FCC in December 1996, was the breakthrough that made possible the transmission of vast amounts of information in the same amount of radio spectrum (6 megahertz (“MHz”)) as the analog standard television system. All full-power television stations in the United States were required by law to discontinue analog service and to operate only in DTV no later than June 12, 2009. Stations that are not licensed as full-power television stations are permitted to continue to transmit in analog until an as yet determined date. The transition to DTV required consumers who relied on over-the-air reception of broadcast signals to purchase new television receivers capable of displaying DTV signals or set-top boxes that can receive digital signals and convert them to analog signals for display on existing receivers.
DTV brings with it major changes to the way viewers experience television. Specifically, DTV technology permits the distribution of high-definition television (“HDTV”) programming, which includes higher-quality sound and pictures with substantially higher resolution than analog television programming. DTV technology also allows broadcasters to provide multiple channels of programming on one 6 MHz channel, a practice known as “multicasting.”
Television station operators may use a portion of their DTV signals to provide ancillary services, such as transmission of data, interactive programming, e-commerce, paging services, audio signals, subscription video, or data transmission services. To the extent a station provides such ancillary services, it is subject to the same regulations as are applicable to other analogous services under the FCC’s rules and policies. A commercial television station is also required to pay the FCC a fee equal to 5% of the gross revenues derived from all ancillary services provided over such station’s DTV signal for which it received a fee in exchange for the service or received compensation from a third party in exchange for transmission of material from that third party, not including commercial advertisements used to support broadcasting. Because multicast programming, described above, is available to the public without charge, it is not subject to this fee.
8
Beginning in 2002, the FCC required all commercial television broadcasters to transmit programming in DTV format in addition to their existing analog service. The FCC allotted to each station a temporary DTV channel, in addition to its existing analog channel, for this purpose. During 2008, the FCC completed its proceeding to allot DTV channels to each full-power station for post-transition use. The FCC authorized most stations to operate on either their existing DTV channel or their existing analog channel after the DTV transition. A few stations were allotted a third channel for post-transition use.
Stations that switched to a channel other than their current DTV channel were with few exceptions, required to construct DTV transmission facilities specified by the FCC by June 12, 2009. In general, stations are able to serve approximately the same number of viewers using their post-transition facilities as they served using their analog facilities.
The following table sets forth the DTV capabilities for each of our television stations.
| Station |
Market Area |
Analog Channel |
Digital |
Currently | ||||||||
| KOMO-TV |
Seattle-Tacoma, WA | 38 | Yes | |||||||||
| KUNS-TV |
Seattle-Tacoma, WA | 50 | Yes | |||||||||
| KATU (TV) |
Portland, OR | 43 | Yes | |||||||||
| KUNP (TV) |
LaGrande, OR | 16 | Yes | |||||||||
| KUNP LP |
Portland, OR | 47 | No | |||||||||
| KVAL-TV |
Eugene, OR | 13 | Yes | |||||||||
| KCBY-TV |
Coos Bay, OR | 11 | Yes | |||||||||
| KPIC (TV) |
Roseburg, OR | 19 | Yes | |||||||||
| KIMA-TV |
Yakima, WA | 33 | Yes | |||||||||
| KEPR-TV |
Pasco/Richland/Kennewick, WA | 18 | Yes | |||||||||
| KBAK-TV |
Bakersfield, CA | 33 | Yes | |||||||||
| KBFX-CA |
Bakersfield, CA | 29 | Yes | |||||||||
| KUNW-CA |
Yakima, WA | 30 | Yes | |||||||||
| KVVK-CA |
Pasco/Richland/Kennewick, WA | 15 | Yes | |||||||||
| KORX-CA |
Walla-Walla, WA | 16 | No | |||||||||
| KLEW-TV |
Lewiston, ID | 32 | Yes | |||||||||
| KBOI-TV |
Boise, ID | 28 | (9) | Yes(1) | ||||||||
| KYUU-LP |
Boise, ID | 35 | No | |||||||||
| KIDK (TV) |
Idaho Falls-Pocatello, ID | 36 | Yes | |||||||||
| KXPI-LP |
Pocatello, ID | 24 | 34 | Yes | ||||||||
| (1) | A construction permit to change the digital channel assignment of KBOI, Boise from channel 28 to channel 9 has been granted by the FCC and construction is in progress. |
The FCC has adopted rules to limit the amount of interference that full-power DTV stations may cause to other stations. It also has acknowledged that the DTV transition may result in interference to existing low-power television stations and translators, particularly in major television markets. Although most low-power stations are required to accept interference from full-power television stations, certain low- power stations, known as “Class A” stations, have greater interference protection rights. Some low-power and translator stations were “displaced” by the FCC’s channel allotment process for full-power stations, and the FCC has allowed such stations to either apply for a “paired” digital channel on which they can operate simultaneously with their existing analog operations or to choose to convert directly from analog to digital transmissions in the future.
9
Television Broadcasting Competition
Competition within the media/communications industry, including the markets in which our stations compete, is considerable. This competition takes place on several levels: competition for audience, competition for programming (including news), competition for advertisers and competition for local staff and management. Additional factors material to a television station’s competitive position include signal coverage and assigned frequency. The television broadcasting industry faces continuing technological change and innovation, the possible rise in popularity of competing entertainment and communications media, changing business practices such as television “duopolies” (owning and operating two stations in the same market), use of LMAs and JSAs by which one entity agrees to provide administrative and other services to a station operated by another entity, and governmental restrictions or actions of federal regulatory bodies, including the FCC and the Federal Trade Commission. Any of these factors could change and materially harm the television broadcasting industry and our business in particular.
Audience. Stations compete for audience on the basis of program popularity, which has a direct effect on advertising rates. During periods of network programming, the stations are totally dependent on the performance of the network programs in attracting viewers. The competition between the networks is keen and the success of any network’s programming can vary significantly over time. During non-network time periods, each station competes on the basis of the performance of its local and syndicated programming using a combination of self-produced news, public affairs and other entertainment or informational programming to attract viewers. The competition between stations in non-network time periods is intense, and here, too, success can vary over time.
Our stations compete for a share of television viewership against local network-affiliated and independent stations, as well as against programming provided by cable, direct broadcast satellite (“DBS”), and similar multichannel video programming services. These service providers can increase competition faced by a station by bringing into its market distant broadcasting signals not otherwise available to the station’s audience to the extent permitted by the FCC’s rules, and also by serving as a distribution system for non-broadcast programming originated on these systems. To the extent cable and other multichannel video distribution system operators and broadcasters increase the amount of local news programming, the heightened competition for local news audiences could have a material adverse effect on our advertising revenue.
Other sources of competition for Fisher’s television stations include home entertainment systems (including DVD and Blu-ray Disc players, digital video recorders, video on demand and television game devices), Internet websites, wireless cable, satellite master antenna television systems, and program downloads to handheld or other playback devices (including iPods, iPads and smart phones). Our television stations also face competition from DBS services, which transmit programming directly to homes equipped with special receiving antennas or to cable television systems for transmission to their subscribers, and Internet Protocol Television (“IPTV”). We compete with these sources of competition both on the basis of product performance (quality, variety, information and entertainment value of content) and price (the cost to utilize these systems).
Programming. Competition for syndicated programming involves negotiating with national program distributors, or producers. Our stations compete against in-market broadcast stations, as well as station groups, for exclusive access to syndicated programming. Operators of cable, DBS and similar systems (including video services offered by telephone companies such as AT&T and Verizon) generally do not compete with local stations for programming. However, various national non-broadcast programming networks acquire programs that might have otherwise been offered to local television stations.
Advertising. Television advertising rates are based on the size of the market in which a station operates, a program’s popularity among the viewers an advertiser wishes to attract in that market, the number of advertisers competing for the available time, the demographic make-up of the market served by the station, the availability of alternative advertising media in the market area, the presence of aggressive and knowledgeable sales forces and the development of projects, features and programs that tie advertiser messages to programming. Our
10
stations compete for advertising revenue with other television stations in their respective markets, as well as with other advertising media, such as newspapers, DBS services, radio, magazines, Internet websites, outdoor advertising, transit advertising, yellow page directories, direct mail and local cable systems. In addition, another source of revenue is political and advocacy advertising, the amount of which fluctuates significantly, particularly being higher in national election years and very low in years in which there is little election or other ballot activity. Competition for advertising dollars in the television broadcasting industry occurs primarily within individual markets on the basis of the above factors as well as on the basis of advertising rates charged by competitors. Generally, a television broadcasting station in one market area does not compete with stations in other market areas. Our television stations are located in highly competitive markets.
Digital Television. With digital television, broadcasters may transmit one high-definition picture and additional channels of standard-definition television. In different periods of the day, Broadcasters may expand or contract the amount of spectrum they devote to each channel thus varying that channel’s video quality from standard definition and high definition. DTV technology makes it possible for broadcasters to offer more choices to viewers. Like traditional television channels, competition in digital television takes place on several levels: competition for audience, competition for programming (including news) and competition for advertisers. Additional factors material to a television station’s competitive position include signal coverage and assigned frequency. Our stations compete for television viewership share against traditional television stations, as well as against cable programming and alternate methods of television program distribution, such as DBS program services. These other transmission methods can increase competition for a station by bringing into its market distant broadcasting signals not otherwise available to the station’s audience, and also by serving as a distribution system for non-broadcast programming originated on the cable system. To the extent cable operators and broadcasters increase the amount of local news programming, the heightened competition for local news audiences could have a material adverse effect on our advertising revenue. Other sources of competition for our digital television stations include home entertainment systems (including DVD and Blu-ray Disc players, digital video recorders and television game devices), Internet websites, wireless cable, satellite master antenna television systems, and program downloads to handheld or other playback devices (including iPods, iPads and smart phones). Our multicast stations also face competition from DBS services, which transmit programming directly to homes equipped with special receiving antennas or to cable television systems for transmission to their subscribers. We compete with these sources of competition both on the basis of product performance (quality, variety, information and entertainment value of content) and price (the cost to utilize these systems).
11
Internet Business
Our Internet business is included in our television segment. Technology is impacting the distribution and consumption of traditional broadcast media. Developments in digital technology, the Internet and other interactive media have fundamentally changed the competitive landscape and have created an entirely new way for consumers to experience media. In April 2006, we formed the Fisher Interactive Network to bring together our digital media assets. The following table sets forth selected information about our primary television and radio websites:
| Property |
Market Area |
Website URL | ||
| KOMO-TV |
Seattle-Tacoma, WA | www.komonews.com | ||
| KOMO AM |
Seattle-Tacoma, WA | www.komonews.com | ||
| KVI AM |
Seattle-Tacoma, WA | www.570kvi.com | ||
| KPLZ-FM |
Seattle-Tacoma, WA | www.star1015.com | ||
| KUNS-TV |
Seattle-Tacoma, WA | www.univisionseattle.com | ||
| KATU-TV |
Portland, OR | www.katu.com | ||
| KUNP-TV |
Portland, OR | www.univisionportland.com | ||
| KVAL-TV |
Eugene, OR | www.kval.com | ||
| KCBY-TV |
Coos Bay, OR | www.kcby.com | ||
| KPIC-TV |
Roseburg, OR | www.kpic.com | ||
| KIMA-TV |
Yakima, WA | www.kimatv.com | ||
| KEPR-TV |
Pasco/Richland/Kennewick, WA | www.keprtv.com | ||
| KLEW-TV |
Lewiston, ID | www.klewtv.com | ||
| KBOI-TV |
Boise, ID | www.kboi2.com | ||
| KIDK-TV |
Idaho Falls-Pocatello, ID | www.kidk.com | ||
| KBAK-TV/KBFX-CA |
Bakersfield, CA | www.bakersfieldnow.com |
Hyperlocal Websites
In addition to our primary station websites discussed above, we have over 120 hyperlocal websites, each focused on news, information and entertainment specific to an individual geographic neighborhood within the Seattle-Tacoma, Portland, Eugene, Bakersfield and Boise market areas. These sites provide local communities with added coverage of locally-focused news and stories that would not otherwise appeal to the broader audiences reached by our television and radio stations. The sites are an important part of our broadcast-to-broadband initiative to provide neighborhood information at a grassroots level while enabling local businesses to efficiently reach their customers. We are also working with our technology and sales provider, DataSphere in its distributions of the hyperlocal solution to other broadcast companies.
Competition
Individuals as well as multi-national companies can easily enter the Internet business with a limited amount of investment. Some organizations or individuals may have greater financial resources available affording them better access to content, talent, revenue and audience. Competition in the Internet industry takes place on several levels: competition for audience, competition for advertisers, competition for content and competition for staff and management. Websites are in a state of constant technological advancement and innovation and there is no limit to the number of websites one company or individual can create or operate. While there are few governmental restrictions on websites, changes from regulatory bodies could have a material adverse effect on the business.
Audience. Our websites compete for audience on the basis of content, which has a direct effect on advertising rates. As a website’s audience grows the website operator is capable of charging a higher rate for advertising. New content and audience features are regularly created to target advertising vehicles and
12
programming that are focused to appeal to a narrow segment of the population. Tactical and strategic plans are utilized to attract larger audiences through marketing campaigns and are designed to improve the site’s overall audience share.
Advertising. Internet advertising rates are based on the mix of media outlets in the geographic-targeting area, the page views and unique visitors of the website, the ability of the website to target various demographic and psychographic groups, the number of advertisers competing for available inventory, the availability of alternative advertising media in the geo-target area, the presence of aggressive and knowledgeable sales forces and the development of projects and features that tie advertisers’ messages to the content. Our websites compete for revenue with other websites and, to a lesser degree, with other advertising media such as television, radio, cable, newspapers, yellow page directories, direct mail, outdoor and transit advertising. Competition for advertising dollars occurs at the national and local level and is subject to changes in rates generally. While there are no geographic barriers to accessing websites, most news and information-based websites serving a local market compete for audience and revenue on a geo-targeted basis.
Radio Segment
Radio Markets and Stations
The following table sets forth certain information regarding our radio stations.
| Market |
Station |
Dial Position |
Power |
Format | ||||
| Seattle, WA |
KOMO AM/FM | 1000 kHz/97.7MHz | 50 kW/63kW | News | ||||
| Seattle, WA |
KVI AM | 570 kHz | 5 kW | Oldies | ||||
| Seattle, WA |
KPLZ FM | 101.5 MHz | 100 kW | Hot Adult Contemporary | ||||
| Great Falls, MT |
KXGF AM | 1400 kHz | 1 kW | Adult Contemporary | ||||
| Great Falls, MT |
KQDI AM | 1450 kHz | 1 kW | Talk | ||||
| Great Falls, MT |
KQDI FM | 106.1 MHz | 100 kW | Classic Rock | ||||
| Great Falls, MT |
KIKF FM | 104.9 MHz | 94 kW | Country | ||||
| Great Falls, MT |
KINX FM | 107.3 MHz | 94 kW | 4 Decades of Hits |
Our Seattle radio stations broadcast to a six-county metropolitan population of approximately 3.4 million with news and entertainment radio services. KOMO (AM/FM) and KVI (AM) have been on the air since 1926 and KPLZ (FM) has been on the air since 1959. According to 2010 data provided by Arbitron, Seattle is the 13th largest radio market in the United States. KOMO (AM/FM) is Seattle’s only all news formatted station. As of November 8, 2010, KVI (AM) changed from a talk radio format with a mix of local and national issue-oriented programming to an Oldies format and was rebranded as “Seattle’s Greatest Hits”. KPLZ (FM) programs “Hot Adult Contemporary” music.
Effective March 1, 2002, we entered into a JSA with classical music station KING FM. Pursuant to the agreement, the licensee of the station, Classic Radio, Inc., retains all operating accountability, while we pay KING FM a flat fee, subject to annual adjustment, and a share of the net revenue generated by the sale of advertising time for the right to sell substantially all the commercial advertising on the station. This agreement was amended during 2006 and the term was extended through June 30, 2011.
See “Company Description” above for information on the May 2009 LMA with South Sound.
Radio Broadcasting Industry
Only a limited number of frequencies are available for commercial radio broadcasting in any one geographic area. The FCC grants licenses to operate radio stations. Currently, two commercial radio broadcast
13
bands provide free, over-the-air radio service, each of which employs different methods of delivering radio signals to radio receivers. The AM band (amplitude modulation) consists of frequencies from 530 kilohertz (“kHz”) to 1700 kHz. The FM (frequency modulation) band consists of frequencies from 88.1 MHz to 107.9 MHz.
Radio station revenue is generally affected by the same economic trends and factors as television station revenues, as described in the section entitled “Television Segment – Television Broadcasting Industry” above.
Radio Broadcasting Competition
A small number of companies control a large number of radio stations within the United States. Some of these companies syndicate radio programs or own networks whose programming is aired by our stations. Some of these companies also operate radio stations in markets in which we operate, have greater overall financial resources available for their operations and may control large national networks of radio sales representatives.
Competition in the radio industry, including each of the markets in which our radio stations compete, takes place on several levels: competition for audience, competition for advertisers, competition for programming and competition for on-air talent, staff and management. Additional significant factors affecting a radio station’s competitive position include assigned frequency and signal strength. The radio broadcasting industry is continually faced with technological change and innovation and the possible rise in popularity of competing entertainment and communications media, as well as governmental restrictions or actions of federal regulatory bodies, including the FCC and the Federal Trade Commission, any of which could have a material adverse effect on the broadcasting business.
The FCC has authorized Direct Audio Radio from Satellite (“DARS”) to broadcast over a separate frequency spectrum (the S-Band, between 2.31 and 2.36 gigahertz). Sirius XM Radio Inc. is currently offering programming via S-Band satellite channels. Sirius XM Radio offers numerous programming channels on a monthly fee basis. Some of its program channels contain commercial announcements, but they do not currently insert local commercials. Radios capable of receiving these digital signals are available as after-market equipment and in selected new vehicles. While DARS stations are not currently expected to significantly compete for local advertising revenue, they compete for listenership, and may dilute the overall radio audience growth scale.
Audience. Our radio stations compete for audience on the basis of programming popularity, which has a direct effect on advertising rates. As a program or station grows in audience, the station is capable of charging a higher rate for advertising. Formats, stations and music are often researched through large-scale perceptual studies, auditorium-style music tests and weekly call-outs. All are designed to evaluate the distinctions and unique tastes of formats and listeners. New formats and audience niches have created targeted advertising vehicles and programming that are focused to appeal to a narrow segment of the population. Tactical and strategic plans are utilized to attract larger audiences through marketing campaigns and promotions. Marketing campaigns using television, Internet, transit, outdoor, telemarketing or direct mail advertising are designed to improve a station’s cumulative audience (total number of people listening) while promotional tactics such as cash giveaways, trips and prizes are utilized by stations to extend the time spent listening, both of which are intended to establish a station’s share of audience. In the effort to increase audience, the format of a station may be changed. Format changes can result in increased costs and create disruptions that can harm the performance of the station, especially in the time period immediately following a format change.
The proliferation of radio stations and other companies streaming their programming over the Internet has created additional competition for local radio stations, as have “podcasts” which contain programming compilations intended to be recorded on personal audio devices and replayed later, and personal audio systems like iPods, smart phones and MP3 players. These technologies and devices provide further choice for listeners, in addition to the existing over-the-air radio stations and the DARS stations.
14
Advertising. Radio advertising rates are based on the number and mix of media outlets, the audience size of the market in which a radio station operates, the total number of listeners the station attracts in a particular demographic group that an advertiser may be targeting, the number of advertisers competing for available time, the demographic make-up of the market served by the station, the availability of alternative advertising media in the market area, the presence of aggressive and knowledgeable sales forces and the development of projects, features and programs that tie advertisers’ messages to programming. Our radio stations compete for revenue primarily with other radio stations and, to a lesser degree, with other advertising media such as television, cable, newspapers, yellow page directories, direct mail, Internet and outdoor and transit advertising. Competition for advertising dollars in the radio broadcasting industry occurs primarily within the individual markets on the basis of the above factors, as well as on the basis of advertising rates charged by competitors. Generally, a radio station in one market area does not compete with stations in other market areas.
Federal Regulation
The ownership, operation and sale of broadcast stations are subject to the jurisdiction of the FCC under the Communications Act of 1934, as amended (the “Communications Act”). FCC rules cover many areas of station operations, including but not limited to allotment of television and radio channels to particular frequencies and communities; approval of station operating parameters, issuance, renewal, revocation and modification of licenses; changes in the ownership or control of licensees; regulation of equipment; and the employment practices of stations. The FCC has the power to impose penalties, including monetary forfeitures or license revocations, for violations of the Communications Act and Commission rules.
The following discussion summarizes the federal statutes and regulations material to our operations, but does not purport to be a complete summary of all the provisions of the Communications Act or of other current or proposed statutes, regulations, and policies affecting our business. The summaries which follow should be read in conjunction with the text of the statutes, rules, regulations, orders, and decisions described herein.
Programming and Operations. The Communications Act requires broadcasters to serve the “public interest.” Stations must periodically document their presentation of programming responsive to local community problems, needs and interests. Complaints concerning programming may be considered by the FCC at any time.
The FCC has numerous regulations and policies relating to the operation of broadcast stations including rules and policies concerning the maximum rates that stations may charge for certain political advertising, sponsorship identification disclosures, the advertisement of contests and lotteries, the quantity of educational and informational programming directed to children, the amount of commercial matter in and adjacent to certain children’s programming, closed captioning, the emergency alert system, the provision of emergency information to individuals with hearing and visual disabilities, the advertising of cigarettes or smokeless tobacco, the provision of equal opportunities in broadcast employment, broadcast technical operations, and the requirement to maintain for public inspection certain documentation regarding a number of aspects of station operations.
In addition, federal law and the FCC’s rules prohibit the broadcast of obscene material at any time, and the broadcast of indecent or profane material from 6 a.m. through 10 p.m., local time. In recent years, the FCC and its indecency prohibition have received much attention. In 2006, legislation was enacted that raised the maximum monetary penalty for the broadcast of obscene, indecent, or profane material to $325,000 for each “violation,” with a cap of $3 million for any “single act.” The FCC’s indecency enforcement policy was reviewed by the U.S. Supreme Court in 2009. The U.S. Supreme Court upheld the FCC’s “fleeting expletives” indecency policy on administrative law grounds but remanded cases to the U.S. Court of Appeals for the Second and Third Circuits for review of the FCC’s policy on First Amendment constitutional grounds. In July 2010, the Second Circuit declared the FCC’s indecency policy unconstitutionally vague, and the Second Circuit confirmed that decision in a separate case in January 2011. The FCC may appeal those decisions to the U.S. Supreme Court. The Third Circuit case remains pending.
15
New Licenses. The FCC licenses television and radio stations to particular communities. The FCC occasionally accepts applications for authority to construct new television and radio stations on unused channels. Auctions are held by the FCC if more than one party files an application for the same unused channel. A petition to deny a winning application must be resolved through FCC consideration of the applicant’s qualifications and the application’s compliance with FCC rules.
Assignments and Transfers. Assignment of a license or transfer of control of a broadcast licensee requires prior FCC consent. The FCC releases public notice of applications for such consent, and interested parties may petition to deny such applications. The FCC considers the qualifications of the assignee or transferee, the compliance of the proposed transaction with the FCC’s ownership rules, and other factors in order to determine whether the public interest would be served by such change in ownership or control.
Digital Broadcasting. The Communications Act and the FCC required full power television stations to transition from analog television service to digital television service in 2009. All of our full power television stations have completed the transition and are operating with digital facilities in compliance with FCC rules. At this time, Class A Television Stations, Low Power Television Stations, and Television Translator Stations are not required to convert to digital television service; however, in September 2010, the FCC launched a proceeding to establish a deadline for such stations to discontinue analog service. That proceeding remains pending.
The FCC’s rules permit, but do not require, FM and AM stations to broadcast digitally. Digital FM stations were permitted to operate with a power level up to ten percent of the station’s authorized analog power.
License Renewal. Under the Communications Act, the FCC generally may grant and renew broadcast licenses for eight-year terms (subject to short-term renewals in certain circumstances). The Communications Act requires the FCC to renew a broadcast license if the FCC finds that (i) the station has served the public interest, convenience and necessity; (ii) there have been no serious violations of either the Communications Act or the FCC’s rules and regulations by the licensee; and (iii) there have been no other serious violations that taken together constitute a pattern of abuse. During the consideration of a license renewal application, interested parties may petition to deny the application. The FCC will grant the renewal application and dismiss any petitions to deny if it determines that the licensee meets the statutory renewal standards based on a review of the licensee’s performance during the preceding license term. Competing applications for the same frequency may not be filed until after the FCC has denied an incumbent’s application for license renewal and opened a filing window for an auction among new applications.
Failure to observe FCC rules and policies, including, but not limited to, those discussed in this document, can result in the imposition of various sanctions, including monetary forfeitures, the grant of short-term license renewal (i.e., less than the full eight years) or, for particularly egregious violations, the denial of a license renewal application or revocation of a license.
While the vast majority of such licenses are renewed by the FCC, there can be no assurance that our licenses will be renewed at their expiration dates, or, if renewed, that the renewal terms will be for eight years. If a station license is not renewed by the expiration date, the station’s authority to operate is automatically extended while a renewal application is on file and under review.
16
The expiration date for the broadcast licenses of our television stations are as follows:
| Station |
Market Area |
Expiration Date | ||
| KATU (TV) (and related translator stations) |
Portland, OR | February 1, 2007(1) | ||
| KLEW-TV (and related translator stations) |
Lewiston, ID | October 1, 2014 | ||
| KBOI-TV |
Boise, ID | October 1, 2014 | ||
| KYUU-LP |
Boise, ID | October 1, 2014 | ||
| KIDK (TV) (and related translator stations) |
Idaho Falls-Pocatello, ID | October 1, 2014 | ||
| KXPI-LP |
Pocatello, ID | October 1, 2014 | ||
| KBAK-TV |
Bakersfield, CA | December 1, 2014 | ||
| KBFX-CA |
Bakersfield, CA | December 1, 2014 | ||
| KOMO-TV |
Seattle-Tacoma, WA | February 1, 2015 | ||
| KUNS-TV |
Seattle-Tacoma, WA | February 1, 2015 | ||
| KUNP (TV) |
LaGrande, OR | February 1, 2015 | ||
| KUNP-LP |
Portland, OR | February 1, 2015 | ||
| KVAL-TV (and related translator stations) |
Eugene, OR | February 1, 2015 | ||
| KCBY-TV (and related translator stations) |
Coos Bay, OR | February 1, 2015 | ||
| KPIC (TV) (and related translator stations) |
Roseburg, OR | February 1, 2015 | ||
| KIMA-TV (and related translator stations) |
Yakima, WA | February 1, 2015 | ||
| KEPR-TV (and related translator stations) |
Pasco/Richland/Kennewick, WA | February 1, 2015 | ||
| KUNW-CA |
Yakima, WA | February 1, 2015 | ||
| KVVK-CA |
Pasco/Richland/Kennewick, WA | February 1, 2015 | ||
| KORX-CA |
Walla-Walla, WA | February 1, 2015 |
| (1) | The license renewal application for KATU (and KATU’s translator stations) for the term expiring February 1, 2007, was timely filed in September 2006. On December 22, 2006, a petition to deny was filed by Oregon Alliance to Reform Media (“OARM”) against KATU and seven other television stations licensed to serve the Portland, Oregon market. OARM argued that the stations each failed to present adequate programming relating to state and local elections during the 2004 election cycle in their news and public affairs programming. The FCC’s Media Bureau rejected OARM’s petition. However, on September 14, 2007, OARM petitioned the FCC for reconsideration of that decision. That petition remains pending, and we cannot predict when or how the FCC will address it. KATU’s authority to operate is automatically extended while its renewal application is on file and under review. |
The license terms of all of our Montana radio stations expire on April 1, 2013. The license terms of our radio stations in Seattle expire on February 1, 2014.
The non-renewal or revocation of one or more of our FCC licenses could harm our broadcasting operations.
Ownership Restrictions. The Communications Act and FCC rules limit the ability of individuals and entities to have ownership or other attributable interests in certain combinations of broadcast stations and other media.
Under the FCC’s attribution policies, the following relationships and interests generally are attributable for purposes of the FCC’s broadcast ownership restrictions:
| • | holders of 5% or more of a corporation’s voting stock, unless the holder is a qualified passive investor, in which case the threshold is a 20% or greater voting stock interest; |
| • | all officers and directors of a licensee and its direct or indirect parent(s); |
| • | any equity interest in a limited partnership or limited liability company, unless properly “insulated” from management activities; and |
17
| • | equity and/or debt interests which in the aggregate exceed 33% of a licensee’s total assets (or, where the entity in which the interest is held is an “eligible entity,” either 50% of combined equity and debt or 80% of the total debt when the debt holder holds no equity interest), if the interest holder supplies more than 15% of the station’s total weekly programming or is a same-market broadcast company, cable operator or newspaper (the “equity/debt plus” standard). |
If an attributable shareholder of the Company or other attributable party has or acquires an attributable interest in other broadcast stations or daily newspapers, depending on the location and nature of such stations or newspapers, such interest may violate the FCC’s multiple ownership rules and may impact our business or ability to acquire or sell media properties in the future.
The FCC’s currently effective ownership rules that are material to our operations are summarized below:
National Television Ownership Limits
The Communications Act, as amended in 2004, prohibits a single entity from holding attributable interests in television stations that have an aggregate national audience reach exceeding 39% of television households. For entities that have attributable interests in two stations in the same market, the FCC counts the audience reach of the stations in that market only once in computing the national ownership cap. Further, the FCC currently discounts the audience reach of a UHF station by 50% when computing the national television ownership cap due to the historically weaker signal coverage for stations operating in the UHF band (frequency channels above 13). In light of the completion of the national transition to digital television, the propriety of the UHF discount may be the subject of further administrative proceedings, but the discount currently remains in effect. At present, we comply with the FCC’s National Television Ownership limits.
Local Television Ownership Limits
Detailed FCC rules regulate the extent to which a party may have an attributable interest in more than one full-power television station in the same area (the “Local Television Ownership Limits”). Common ownership of multiple television stations is permitted where the stations are in different Nielsen DMAs. Common ownership of two television stations in the same DMA is permitted where (i) there is no impermissible contour overlap among the stations; (ii) where at least one of the two stations is not ranked among the top four stations in the DMA and at least eight separately-owned full-power television stations will remain after the combination is created; or (iii) where certain waiver criteria are met for “failed” or “failing” stations. In addition, stations designated by the FCC as “satellite” stations, which are full-power stations that typically rebroadcast the programming of a “parent” station, are exempt from the Local Television Ownership Limits. Class A Television Stations, Low Power Television Stations, and Television Translator Stations are not subject to the Local Television Ownership Limits. At present, we comply with the FCC’s Local Television Ownership limits.
Local Radio Ownership Limits
Similarly, FCC rules regulate the extent to which a party may have an attributable interest in more than one radio station in the same market, as defined by Arbitron and reported by BIA/Kelsey, or, in the case of stations within communities of license located outside of Arbitron-rated markets, certain overlapping or intersecting signal contours. Depending on the size of the market, a single entity may have attributable interests in two to eight commercial radio stations (with no more than five stations in the same service (AM or FM)). At present, we comply with the FCC’s Local Radio Ownership limits.
Cross-Ownership Restrictions
A party may have attributable interests in both television and radio stations in the same local market. The specific number of such stations is governed by FCC rules, depending on the number of independent media
18
voices in the market. In large markets (markets with at least 20 independently owned media voices), a single entity can own up to one television station and seven radio stations or, if permissible under the Local Television Ownership Limits, two television stations and six radio stations.
The FCC’s rules prohibit the licensee of a radio or television station from directly or indirectly owning, operating, or controlling a daily newspaper if the station’s specified service contour encompasses the entire community where the newspaper is published (the “Broadcast-Newspaper Cross-Ownership Rule”). The FCC revised the Broadcast-Newspaper Cross-Ownership Rule in February 2008. However, the revised rule is under review with the U.S. Court of Appeals for the Third Circuit. Under the revised rule, notwithstanding the general prohibition, newspaper/broadcast cross-ownership would be permissible if (i) the market at issue is one of the 20 largest DMAs; (ii) the transaction involves the combination of only one major daily newspaper and only one television or radio station; (iii) where the transaction involves a television station, at least eight independently owned and operating major media voices (major newspapers and full-power television stations) would remain in the DMA following the transaction; and (iv) where the transaction involves a television station, that station is not ranked among the top four stations in the DMA. In March 2010, the Third Circuit lifted the long-imposed stay on the effectiveness of the revised rule. However, the Third Circuit’s review of the revised rule remains pending.
Foreign Ownership
The Communications Act generally prohibits foreign parties from having a 20% or greater interest in a broadcast licensee entity, or more than a 25% interest in the parent entity of a licensee. As presently organized, we comply with the FCC’s foreign ownership restrictions.
Local Marketing Agreements. LMAs, sometimes also referred to as “Time Brokerage Agreements” or “TBAs” typically permit a third party to provide the programming and sell the advertising time during a substantial portion of the broadcast day of a radio or television station, subject to the requirement that the station’s programming content and operations remain at all times under the independent control of the station licensee. At present, FCC rules permit LMAs, but the licensee of a broadcast station programming more than 15% of the time on another station in the same market is generally considered to have an attributable interest in the other station. In May 2009, we entered into an attributable three year LMA with South Sound Broadcasting, LLC, which permits us to provide programming for and sell the advertising time of KOMO-FM, Oakville, Washington. While the KOMO-FM LMA is attributable to us, such attribution does not cause us to exceed the FCC’s ownership limitations.
Joint Sales Agreements. JSAs typically involve the assignment, for a fee, of the right to sell substantially all the commercial advertising on a station. The typical JSA is distinct from an LMA in that a JSA (unlike an LMA) normally does not involve programming. Under the FCC’s attribution policies, the licensee of a radio station selling more than 15% of the advertising of another radio station in the same market is considered to have an attributable interest in the other station. In July 2006, we entered into an attributable five year JSA with Classic Radio, Inc., which permits us to sell the advertising time of KING-FM, Seattle, Washington. While the KING-FM JSA is attributable to us, such attribution does not cause us to exceed the FCC’s ownership limitations. In contrast, television station JSAs are not attributable under the FCC’s policies. An FCC proceeding to extend attribution to television JSAs was initiated in 2004 but remains unresolved.
Quadrennial Regulatory Reviews. Section 202(h) of the Telecommunications Act of 1996 requires the FCC to review its ownership rules every four years to “determine whether any of such rules are necessary in the public interest as the result of competition.” Under Section 202(h), the FCC “shall repeal or modify any regulation it determines to be no longer in the public interest.” Recently, the FCC commenced its 2010 Quadrennial Review of its media ownership rules, and it remains pending.
19
Network Affiliate Issues. FCC rules regulate the television network-affiliate relationship. Among other things, these rules require network affiliation agreements to (i) prohibit networks from requiring affiliates to clear time previously scheduled for other use, (ii) permit an affiliate to reject network programs it believes are unsuitable for its audience, and (iii) permit affiliates to substitute programs believed to be of greater local or national importance than network programming. In 2008, the FCC resolved a petition to review certain of these rules by clarifying its limitations on the extent to which the networks can exert control over the operations of their affiliates.
Cable and Satellite Carriage of Local Television Signals. Pursuant to the Cable Television Consumer Protection and Competition Act of 1992, as amended (“1992 Cable Act”) and the FCC’s “must carry” regulations, cable operators are generally required to carry the primary digital broadcast signals, but not multicast programming streams, of local commercial television stations electing mandatory carriage. Except for certain small cable systems, must-carry signals broadcast in high definition must be carried on cable systems in high definition. To ensure that all cable subscribers, including those with analog television sets, continue to be able to view all must-carry broadcast stations, for a period of three years after the June 12, 2009, national digital transition, cable operators must (with the exception of certain small cable systems) either (i) provide analog cable subscribers with must-carry digital television signals in an analog format or (ii) provide subscribers using analog television sets with the necessary equipment to view the must-carry digital signals. In 2009, the U.S. Court of Appeals for the Second Circuit affirmed the constitutionality of the cable must-carry rules. The U.S. Supreme Court declined to review the Second Circuit’s decision in May 2010.
The 1992 Cable Act also prohibits cable operators and other multichannel video programming distributors from retransmitting a broadcast signal without obtaining the station’s consent. On a cable system-by-cable system basis, a local television broadcast station must make a choice once every three years whether to proceed under the “must carry” rules or to waive the right to mandatory, but uncompensated, carriage and, instead, to negotiate a grant of retransmission consent to permit the cable system to carry the station’s signal, in most cases in exchange for some form of consideration from the cable operator.
Under the “carry-one, carry-all” provision of the Satellite Home Improvement Act, as amended by the Satellite Home Viewer Extension and Reauthorization Act of 2004 (“SHVERA”) and the Satellite Television Extension and Localism Act of 2010 (“STELA”), a satellite carrier is generally required to retransmit the primary digital signals of all local television stations in a DMA if the satellite carrier chooses to retransmit the primary signal of any local television station in that DMA. Over a four-year period, from 2010 to 2013, satellite carriers are required to begin carrying such stations’ high definition signals without down-resolution. Television stations located in markets in which satellite carriage of local stations is offered may elect mandatory carriage or retransmission consent once every three years.
In recent years, there have been several high-profile disputes in retransmission consent negotiations between broadcasters and cable and satellite operators. Several cable and satellite operators have filed a petition with the FCC seeking the agency’s intervention in the retransmission consent process, and the FCC staff has announced that the FCC intends to open a separate proceeding on the retransmission consent rules. The petition remains pending with the FCC.
Under STELA, which extended some of the compulsory copyright license provisions of SHVERA for 5 years, satellite carriers are permitted in certain circumstances, to retransmit distant broadcast network signals from stations outside the local television market to unserved households that cannot receive an over-the-air signal of a local network station. In November 2010, the FCC released Orders implementing certain provisions of STELA. Among other things, the FCC’s Orders interpreted STELA to allow satellite carriers to import a duplicating adjacent market “significantly viewed” network station in a variety of circumstances, including if the satellite carrier and local affiliate are at an impasse in retransmission consent negotiations.
20
Non-FCC Regulation. A number of other federal regulations, as well as numerous state and local laws, can either directly or indirectly impact broadcast operations. Included in this category are:
| • | rules and regulations of the Federal Aviation Administration affecting the location, marking, and height of broadcast towers; |
| • | federal, state and local environmental and land use restrictions; |
| • | the Copyright Act and the rules and regulations of the Copyright Office; and |
| • | campaign finance laws and the rules and regulations of the Federal Election Commission. |
For example, in January 2010, the United States Supreme Court struck down a portion of a federal statute and certain Federal Election Commission rules and held that corporations and labor unions may make unlimited expenditures to advocate the election or defeat of a federal candidate at any point in the election cycle. As a result of the Supreme Court’s decision, it is likely that the number of political advertisements aired on broadcast stations will increase during the weeks leading up to an election.
Proposed Legislation and Regulation and Court Litigation. Congress and the FCC may in the future adopt new laws, regulations and policies regarding a wide variety of matters that could affect, directly or indirectly, the operation and ownership of our broadcast properties. For example, legislation has been pending in Congress which could remove radio stations’ current exemption from payment of copyright royalties to record companies and performers for music broadcast on radio stations. In addition, in connection with the American Recovery and Reinvestment Act of 2009, the FCC is in the process of reviewing various spectrum bands and has recommended that 120 MHz of spectrum in the bands currently licensed to television broadcasters be repurposed for wireless broadband services. In December 2010, the FCC initiated a proceeding to begin its efforts to reallocate the television spectrum. Also, in December 2010, Congress passed legislation which relaxes the FCC’s interference protections afforded to full-service FM stations in order to make more frequencies available for low-power FM stations. That new law requires the FCC to undertake certain studies and to implement rules to effectuate the relaxed interference standard. The FCC is also considering revisions to its policies and procedures relating to community of license changes for FM and AM stations which could make it more difficult for a radio station to move its community of license closer to a larger city.
In addition, legislation and regulations that directly or indirectly impact the operation of broadcast stations are now, or may become the subject of court litigation. As discussed above, the FCC’s indecency policies were recently reviewed by the U.S. Court of Appeals for the Second Circuit, and remain under review by the U.S. Court of Appeals for the Third Circuit, and the FCC’s Broadcast-Newspaper Cross- Ownership Rule is under review by the Third Circuit. In addition, the FCC’s 2008 decision to allow certain unlicensed devices to operate in frequencies adjacent to active DTV channels has been appealed to the U.S. Court of Appeals for the D.C. Circuit; however, the court has stayed its review of the appeal pending the FCC’s ruling on various pending petitions for reconsideration. The Company cannot predict the outcome or the impact of these cases or any other matters that are now, or may become, the subject of court litigation.
We are party to a lawsuit in federal district court in New York. At issue is a new Internet television distribution service provided by a company name ivi, Inc. Broadcasters, including the Company, sued ivi, Inc. in federal court in New York for, inter alia, copyright infringement, as ivi, Inc. has not secured permission to distribute station programming. If ivi, Inc. prevails and is permitted to distribute our television stations’ programming without our permission, it could harm our television broadcasting operations. We cannot predict how or when the court will rule.
Seasonality
Our results are subject to seasonal fluctuations, and as a result, second and fourth quarter advertising revenue is typically greater than first and third quarter advertising revenue. This seasonality is primarily attributable to increased consumer advertising in the spring and then increased retail advertising in anticipation of
21
holiday season spending. Furthermore, revenue from political advertising is cyclical and varies based on the timing of federal, state, and local elections, as well as the presence of highly contested initiatives or ballot measures. Advertising revenue is generally higher during national election years due to spending by political candidates and advocacy groups. This political spending typically is heaviest during the fourth quarter.
Fisher Plaza Segment
Through Fisher Media Services, we own and manage Fisher Plaza, a full-block, mixed-use facility located near downtown Seattle that serves as the home of our corporate offices and our Seattle television and radio stations. Fisher Plaza also houses a variety of technology and other media and communications companies as well as office and retail tenants. Fisher Plaza is designed to support the production and distribution of media content through numerous distribution channels, including broadcast, satellite, cable, Internet and broadband, as well as other wired and wireless communication systems. Fisher Plaza also houses many companies with complementary needs for the mission critical infrastructure provided at the facility. Major non-Fisher data center occupants include Internet retail and services companies, media companies and telecommunication companies. Fisher also provides co-location facilities for many of its tenants. Fisher Plaza had a net book value of approximately $106 million at December 31, 2010. We seek to produce a return on our total investment in Fisher Plaza by offering and leasing technology space to companies that complement the vision and capabilities of the facility, as well as using the facility for our Seattle-based operations.
On July 2, 2009, an electrical fire contained within a garage level equipment room of the east building of our Fisher Plaza facility disrupted city-supplied electrical service to that building. A third-party investigation concluded that the fire appeared to have been caused by a malfunction of bus duct equipment manufactured by a third-party. All of the final repairs and equipment replacement were completed as of December 31, 2009. As of December 31, 2010, we received reimbursement for substantially all of our insurance claims related to the fire, and we continue to work with our insurers on our remaining outstanding claims. See “Management’s Discussion and Analysis of Financial Condition and Results of Operations – Significant Developments” for more information.
Occupancy levels at Fisher Plaza were 96%, 97% and 97% as of December 31, 2010, 2009 and 2008, respectively. Fisher entities occupied 41%, 43% and 43% of Fisher Plaza as of December 31, 2010, 2009 and 2008.
Available Information
Our website address is www.fsci.com. We make available on this website under “Investor Information—SEC Filings,” free of charge, our code of ethics, annual reports on Form 10-K, quarterly reports on Form 10-Q, current reports on Form 8-K, Section 16 forms and amendments to those reports as soon as reasonably practicable after we electronically file or furnish such materials to the U.S. Securities and Exchange Commission (the “SEC”). In addition, our code of ethics and Board of Directors committee charters are available on the website under “Investor Information—Corp. Governance.” Information on our website is not part of this report. In addition, the reports and materials that we file with the SEC are available at the SEC’s website (http://www.sec.gov) and at the SEC’s Public Reference Room at 100 F Street, NE, Washington DC 20549. Interested parties may obtain information on the operation of the Public Reference Room by calling the SEC at 1-800-SEC-0330.
22
| ITEM 1A. | RISK FACTORS |
The following risk factors and other information included in this annual report should be carefully considered. The risks and uncertainties described below are not the only ones we face. Additional risks and uncertainties not presently known to us or that we currently deem immaterial also may impair our business operations. If any of the following risks occur, our business, financial condition and future results could be adversely impacted.
The current uncertain economic conditions in the United States may adversely affect our results of operations, cash flows and financial condition.
There were indications of general economic recovery in the United States in 2010 compared to 2009; however, factors such as the continued high levels of unemployment and ongoing weakness in the housing sector have created much uncertainty in the strength and sustainability of the recovery. Any adverse change in economic conditions may again negatively affect our operating results and the broadcast industry in general by, among other things, reducing demand for local and national broadcast advertising and making it more difficult for customers to pay their accounts. In such an environment, we may experience downward pressure on our stock price and credit capacity without regard to our underlying financial strength. If high levels of market disruption and volatility return, our business, financial condition, results of operations and cash flows will likely be adversely affected, possibly materially. In addition, our ability to access the capital markets may be severely restricted which could reduce our flexibility to react to changing economic and business conditions. Any such disruption could require us to take measures to conserve cash until the markets stabilize or until alternative credit arrangements or other funding for our business needs can be arranged. In addition, our cash balances will not yield significant interest income in this low-interest rate environment. Such measures could include deferring capital expenditures and other discretionary uses of cash. Uncertainty about current economic conditions could also affect the volatility of our stock price. We cannot predict the timing, magnitude or duration of any future economic downturn or any subsequent recovery.
We depend on advertising revenues, which fluctuate as a result of a number of factors.
Our main source of revenue is the sale of advertising. Our ability to sell advertising depends on many factors, including the following:
| • | the health of the economy, and particularly the economy of the Pacific Northwest region and Seattle, Washington and Portland, Oregon; |
| • | the popularity of our programming; |
| • | pricing fluctuations in local and national advertising; |
| • | the activities of our competitors, including increased competition from other forms of advertising-based media, particularly network, cable television, direct satellite television and radio, and the Internet; |
| • | the use of new services and devices that allow viewers to minimize commercial advertisements, such as satellite radio and personal digital video recorders; |
| • | increased competition for the leisure time of audiences, including video-on-demand, video game consoles, personal computers, Internet-delivered audio and video programming, and other sources of home entertainment; |
| • | changes in the makeup of the population in the areas where our stations are located; |
| • | level of consumer confidence; |
| • | level of political advertising spending; |
| • | advertisers’ budgets, which are affected by broad economic trends; |
23
| • | size and demographic characteristics of our markets, especially the Pacific Northwest region; and |
| • | other factors that may be beyond our control. |
Our net broadcasting advertising revenue increased 32% in 2010 as compared to 2009 as a result of numerous factors including incremental improvement in economic conditions locally and regionally, increases in political spending during 2010, and increased monetization of our local advertising strategies. It is unclear whether all of those factors will continue to positively impact our revenue in 2011 or beyond.
In addition, our results are subject to seasonal fluctuations, and as a result, second and fourth quarter broadcasting revenue is typically greater than first and third quarter broadcasting revenue. This seasonality is primarily attributable to increased consumer advertising in the spring and then increased retail advertising in anticipation of holiday season spending. Furthermore, revenue from political advertising is cyclical and varies based on the timing of federal, state, and local elections, as well as the presence of highly contested initiatives or ballot measures. For instance, because 2011 will not be a significant year for political advertising, our 2011 political advertising revenue is expected to decline compared to 2010.
Also, the occurrence of disasters, acts of terrorism, political uncertainty or hostilities or other circumstances beyond our control may cause us to lose our ability to operate our stations or, if we are able to broadcast under such circumstances, our broadcast operations may shift to around-the-clock news coverage, which would cause the loss of advertising revenues due to the suspension of advertising-supported commercial programming.
In recent years, we have incurred losses. We cannot assure you that we will be able to maintain profitability in the future.
While we had income from continuing operations in 2010, in 2009 we had a loss from continuing operations before income taxes of $14 million. We cannot assure you that our initiatives to improve our operating performance will be successful or that we will be able to maintain profitability in the future, especially given the current uncertain state of the national and regional economies and its effect on advertising revenues.
Unfavorable resolution of tax returns and positions could adversely affect our tax expense and our results of operations, cash flows and financial condition.
Our tax returns and positions are subject to review and audit by federal, state, and local taxing authorities. The U.S. federal statute of limitations remains open for the year 2006 and onward. The IRS is currently conducting a field examination of the Company’s 2008 and 2009 U.S. tax returns. The State of California and Oregon have notified us that they will be conducting an audit of the Company’s 2007 and 2008 state tax returns. The IRS completed its field examination of our 2006 and 2007 U.S. tax returns in June 2009 and we paid $856,000 for the settlement of this examination, as well as $31,000 in interest expense. An unfavorable outcome to a U.S. tax audit or any other tax audit could result in higher tax costs and payments, thereby negatively impacting our results of operations and cash flows. Our federal and state income tax returns are subject to periodic examination, and the tax authorities may challenge certain of our tax positions as a result of examinations. We believe our tax positions comply with applicable tax law, and we would vigorously defend these positions if challenged. The final disposition of any positions challenged by the tax authorities could require us to make additional tax payments. Such a resolution could also materially affect our effective tax rate for future periods.
Because significant portions of our cost of services are fixed, downturns in the economy harm our operations, revenue, cash flow and earnings.
Nearly all of our operations are concentrated in the Pacific Northwest region. The Seattle, Washington and Portland, Oregon markets are particularly important for our financial strength. Operating results in recent years, including 2009, were adversely impacted by the Pacific Northwest regional economy. While there were
24
improvements in 2010, any renewed weak economic conditions in these markets would harm our operations and financial condition. Because significant portions of our costs of services are fixed, we may be unable to materially reduce costs to offset declines in our revenues. As a result, we could suffer net losses if economic conditions once again deteriorate. In addition, any renewed downturn in the national economy could result in decreased national advertising sales. If this happens, it could harm our results of operations because national advertising sales represent a significant portion of our television advertising net revenue.
Difficulties in the automotive, retail and other key advertising categories could materially affect our results and the value of our common stock.
A significant portion of our revenue consists of advertising by companies in the retail and automotive sectors, two sectors that experienced extreme difficulties in 2009. While both industries improved in 2010, renewed difficulties in these and other key industries could adversely affected total advertising expenditures in the United States. Reductions in spending by these and other industries over the course of 2011 could adversely affect our results of operations and cash flows, and the value of our common stock.
The non-renewal, modification, or cancellation of affiliation agreements with major television networks, including our affiliation agreement with FOX Network for KBFX which expired in June 2010, could harm our operating results.
For each of our television stations that are affiliated with one of the four major television networks, such affiliation has a significant impact on the composition of the station’s programming, revenue, expenses and operations. In some instances, network affiliation agreements are not renewed, or in limited circumstances, may be cancelled by the network. For example, if a network acquires a television station in a market in which we own a station affiliated with that network, the network will likely decline to renew the affiliation agreement for our station in that market.
Our two largest television stations, KOMO-TV, which broadcasts in Seattle, Washington, and KATU, which broadcasts in Portland, Oregon, have affiliation agreements with ABC Network with current terms expiring in August 2014. The major network affiliations for our television stations other than KOMO-TV and KATU are with CBS or FOX. Our affiliation agreements with CBS generally expire in February 2016. Our only affiliation agreement with FOX Network at KBFX, in Bakersfield, California, expired in June 2010. We continue to operate under the terms of the expired agreement as we engage in discussions on a new agreement. There can be no assurances as to the terms of any such new agreement, or whether in fact we will enter into a new agreement with FOX Network for KBFX. The non-renewal of any of our major network affiliation agreements could adversely affect our business and results. While we generally expect to renew our affiliation agreements prior to their expiration, there can be no assurances that we will do so, or on terms that are beneficial to us. Although none of our affiliation agreements with CBS or ABC are scheduled for renewal in 2011, any modification, cancellation or eventual non-renewal of any of these agreements could harm our operating results. Some of the networks with which our stations are affiliated may require as a condition to the renewal of affiliation agreements, among other things, cash payments to the network. Consequently, our affiliation agreements may not remain in place under existing terms and each network may not continue to provide programming or compensation to affiliates on the same basis as it currently provides programming or compensation. If this occurs, we would need to find alternative sources of programming, which may be less attractive and more expensive.
A change in network affiliation in a given television market may have many short-term and long-term consequences, depending upon the circumstances surrounding the change. Potential short-term consequences include the following:
| • | increased marketing costs and increased internal operating costs, which can vary widely depending on the amount of marketing required to educate the audience regarding the change and to maintain the station’s viewing audience; |
| • | short-term loss of market share or slower market growth due to advertiser uncertainty about the switch; |
25
| • | costs of building a new or larger news operation and other increases in station programming costs, if necessary; and |
| • | the cost of equipment needed to conform the station’s programming, equipment and logos to the new network affiliation, if any. |
Long-term consequences are more difficult to assess, due to the cyclical nature of each of the major network’s audience share and the fact that national network audience ratings are not necessarily indicative of how a network’s programming is accepted in an individual market. There can be no assurances that any future affiliation agreement will be obtainable on economic terms or other conditions that will be favorable to us, nor that any network could not change the type, quality, or quantity of programming provided to us in a way that could be detrimental to our operations.
Our operating results are dependent on the success of programming aired by our television and radio stations, which depends in part upon factors beyond our control.
Our advertising revenues are dependent on the success and popularity of our local, network and syndicated programming. We make significant commitments to acquire rights to television and radio programs under multi-year agreements. The success of such programs is dependent partly upon unpredictable factors such as audience preferences, competing programming, and the availability of other entertainment activities. If a particular program is not popular in relation to its costs, we may not be able to sell enough advertising to cover the costs of the program. In some instances, we may have to replace or cancel programs before their costs have been fully amortized, resulting in write-offs that increase operating costs. Our primary Seattle and Portland television stations, which accounted for approximately 63% of our television broadcasting revenue in 2010, are affiliated with the ABC Network. Twelve of our television stations are affiliated with one of the four major television networks, including ABC, six of our television stations are affiliated with Univision (Spanish language) and the remainder are independent or subscribe to various programming services. Any performance decline by ABC, CBS, or by other networks or network program suppliers, could harm our business and operating results. We rely on our stations’ ratings points when determining the advertising rates that we receive. The use of new ratings technologies and measurements could adversely impact our program ratings and reduce advertising pricing and spending.
The costs of television programming may increase, which could adversely affect our results of operations.
Programming is a significant operating cost in our television businesses. There can be no assurances that we will not be exposed to future increases in programming costs, including, without limitation, for network programming. Should such an increase occur, it could have an adverse effect on our results of operations. In addition, some television networks, including ABC Network, are requiring affiliates to share the networks’ programming costs and to eliminate network compensation traditionally paid to broadcast affiliates. We cannot predict the nature or scope of any such future compensation arrangements or the effect, if any, on our operations. Acquisitions of program rights for syndicated programming are usually made two or three years in advance and may require multi-year commitments, making it difficult to predict accurately how a program will perform. In addition, any significant shortfall, now or in the future, in advertising revenue and/or a decline in the expected popularity of the programming for which we have acquired rights could lead to less than expected revenue which could result in programming write-offs. Additionally, in some instances, programs must be replaced before their costs have been fully amortized, resulting in write-offs. These write-offs increase station operating costs and decrease station earnings. An increase in the cost of news programming and content or in the costs for on-air and creative talent may also increase our expenses, particularly during events requiring extended news coverage, and therefore adversely affect our business and operating results.
26
Radio and television programming revenue may be negatively affected by the cancellation of syndication agreements.
Syndication agreements are licenses to broadcast programs that are produced by production companies. Such programming can form a significant component of a station’s programming schedule. Syndication agreements are subject to cancellation, which may affect a station’s programming schedule, and we cannot assure you that we will continue to be able to acquire rights to syndicated programs once our current contracts for these programs end.
If we are unable to respond to changes in technology and evolving industry trends, our television and radio businesses may not be able to compete effectively.
New technologies could continue to adversely affect our television and radio stations. Information delivery and programming alternatives including cable, direct satellite-to-home services, video provided by telephone companies, satellite radio, pay-per-view, the Internet, digital video recorders and home video and entertainment systems, portable audio and video entertainment systems, and mobile phones have fractionalized television and radio audiences and expanded the numbers and types of distribution channels for advertisers to access. Over the past decade, cable television programming services, other emerging video distribution platforms and the Internet have captured an increasing market share, while the aggregate viewership of the major television networks has declined. In addition, the expansion of cable and satellite television, the Internet and other technological changes including the increased usage of video-on-demand have increased, and may continue to increase, the competitive demand for programming. Such increased demand, together with rising production costs, may increase our programming costs or impair our ability to acquire desired programming. Technologies that enable users to view content of their own choosing, in their own time, and to fast-forward or skip advertisements, such as DVRs, portable digital devices, video-on-demand, and the Internet, may cause changes in consumer behavior that could affect the attractiveness of our offerings to advertisers. Other advances in technology, such as increasing use of local-cable advertising “interconnects,” which allow for easier insertion of advertising on local cable systems, have also increased competition for advertisers.
In addition, video compression techniques permit greater numbers of channels to be carried within existing bandwidth. These compression techniques as well as other technological developments are applicable to all video delivery systems, including over-the-air broadcasting and cable satellite systems, and have the potential to provide vastly expanded programming to highly targeted audiences. Reduction in the cost of creating additional channel capacity could lower entry barriers for new channels and encourage the development of increasingly specialized niche programming. This ability to reach very narrowly defined audiences may alter the competitive dynamics for advertising expenditures. We are unable to predict the effect that these and other technological changes will have on the television industry or the future results of our television businesses. Any inability on our part to effectively respond to these technological changes may result in our inability to effectively compete for advertising revenue and programming.
Competition in the broadcasting industry and the rise of alternative entertainment and communications media may result in loss of audience share and advertising revenue by our stations.
Our television and radio stations face intense competition for market share, including competition from the following sources:
| • | other local network affiliates and independent stations; |
| • | cable, direct broadcast satellite, satellite radio, digital radio, Internet radio, and alternative methods of broadcasting brought about by technological advances and innovations, including pay-per-view and home video and entertainment systems; |
| • | television networks, other programmers, and third party entities that have begun to distribute their audio and video programming directly to the consumer via the Internet and portable digital devices such as personal video players, tablet computers, and mobile phones; and |
27
| • | other sources of news, information and entertainment, including streaming video broadcasts over the Internet, podcasting, newspapers, magazines, movie theaters and live sporting events. |
In addition to competing with other media outlets for audience share, we also compete for advertising revenue that comprises our primary source of revenue. Our stations compete for advertising revenue with other television and radio stations in their respective markets, as well as with other advertising media such as newspapers, the Internet, magazines, outdoor advertising, transit advertising, yellow page directory, direct mail and local cable systems. Cable companies and others have national advertising networks that increase the competition for national advertising. Our stations also compete against other local media outlets for exclusive local access to programming. Competition for non-network programming involves negotiating with national program distributors or syndicators that sell first-run and off-network packages of programming.
Our operating results are dependent in part upon the ability of each of our stations to compete successfully in its market, and there can be no assurance that any one of our stations will be able to maintain or increase its current audience share or revenue share. Our television stations compete for audiences and advertising revenues primarily on the basis of programming content and advertising rates. Advertising rates are set based upon a variety of factors, including a program’s popularity among the advertiser’s target audience, the number of advertisers competing for the available time, the demographic make-up of the market served and the availability of alternative advertising in the market. Our ability to maintain market share and competitive advertising rates depends in part on audience acceptance of our network, syndicated and local programming. To the extent that certain of our competitors have, or may in the future obtain, greater financial, marketing, programming and broadcasting resources, audience share or revenue share, our ability to compete successfully in our broadcasting markets may be impeded.
Recently third parties have begun to stream broadcast programming over the Internet without permission from broadcast stations. In at least one instance, programming from our Seattle television station, KOMO-TV, is being streamed without our consent. This practice can dilute the value of our programming and adversely affect our stations’ results of operations. Currently, we are a party to a lawsuit concerning such unauthorized streaming —WPIX Inc. et. al. v. ivi, Inc. and Todd Weaver-and we cannot predict the outcome of such litigation.
Changes by the national broadcast television networks in their respective business models and practices could adversely affect our business, financial condition and results of operations.
In recent years, the networks have streamed or allowed others to stream their programming on the Internet in close proximity to said programming’s broadcast on local television stations, including those we own. Networks have also moved programming, including some premium programming, to non-broadcast distribution platforms like cable channels owned by the networks. These and other practices by the networks dilute the exclusivity and value of network programming originally broadcast by the local stations and could adversely affect the business, financial conditions and results of operations of our stations.
If we are unable to secure or maintain carriage of our television stations’ signals over cable and/or direct broadcast satellite systems, our television stations may not be able to compete effectively.
Pursuant to FCC rules, local television stations may elect every three years to either (1) require cable and/or direct broadcast satellite operators to carry the station’s primary programming stream or (2) enter into retransmission consent negotiations for carriage, which may include carriage of a station’s primary and multicast programming streams. Unless a retransmission consent agreement is reached, cable and direct satellite operators are not required to carry our multicast programming streams. At present, we have retransmission consent agreements with the major cable operators in our markets and both satellite providers, including carriage of certain of our multicast programming streams. If our retransmission consent agreements are terminated or not renewed, or if our broadcast signals are distributed on less favorable terms than our competitors, our ability to compete effectively may be adversely affected.
28
In recent years, there have been several high-profile disputes in retransmission consent negotiations between broadcasters and cable and satellite operators. Several cable and satellite operators have filed a petition with the FCC seeking the agency’s intervention in the retransmission consent process, and the FCC has announced that it intends to open a separate proceeding on the retransmission consent rules. It is uncertain what, if any, impact these FCC proceedings may have on our television stations’ ability to secure and maintain signal carriage over cable or satellite, and our ability to compete effectively may be adversely affected.
Pending initiatives to reallocate television spectrum and to impose a performance royalty on radio broadcasters could, if adopted, adversely affect our business, operation results, and stock price.
New mobile communications technologies are increasingly offering Internet broadband services using wireless spectrum. In connection with the FCC’s development of a National Broadband Plan-a plan the FCC was required to develop pursuant to the American Recovery and Reinvestment Act of 2009 to ensure wide access to broadband capability throughout the United States—the FCC has expressed concern that the United States will not have spectrum sufficient to meet demand for wireless broadband services in the near future. The National Broadband Plan recommends that 120 MHz of spectrum in the bands currently licensed to television broadcasters be reallocated for wireless broadband services. Various scenarios are being considered, including voluntary reallocation of spectrum that broadcasters agree to surrender, which may be all or a portion of a particular station’s spectrum, and compensation to broadcasters from the proceeds from the auction of reallocated spectrum to other services. In December 2010, the FCC initiated a proceeding to begin its efforts to reallocate the television spectrum. One proposal in this new proceeding is to establish a framework in which two or more television stations may share a single 6 MHz channel. This reallocation could limit our ability to realize the full potential of digital television, including high definition, multicast programming, and mobile digital television. Related reductions in the quality or quantity of our services may impede our ability to compete for programming, diminish the size of our audience, or reduce our advertising revenues. We cannot predict the ultimate outcome of any proposals made in this or related proceedings proceeding; however, the reallocation of all or some portions of our television stations’ spectrum and increased competition from new mobile communications technologies could materially affect our operating results, financial condition and stock price.
The recording industry continues to request that Congress impose a performance royalty on radio broadcasters that would require local stations to pay record labels and performers for the music they air on the radio without charge to listeners. This royalty would be in addition to the license fees already paid by broadcasters to songwriters and composers. Performance royalty legislation was introduced in 2009, but it has failed to pass, and it remains to be seen if the new Congress in 2011 will favor or oppose performance royalty legislation. If enacted a performance royalty could materially affect the financial results of our radio stations.
Changes in FCC regulations regarding ownership have increased the uncertainty surrounding the competitive position of our stations in the markets we serve.
Section 202(h) of the Telecommunications Act of 1996 requires the FCC to review its ownership rules every four years to “determine whether any of such rules are necessary in the public interest as the result of competition.” Under Section 202(h), the FCC “shall repeal or modify any regulation it determines to be no longer in the public interest.”
The FCC concluded its 2006 Quadrennial Review in February 2008, in which the FCC also addressed issues raised by the U.S. Court of Appeals for the Third Circuit in connection with the Third Circuit’s review of the FCC’s 2002 ownership rule review. In the 2002 review, the FCC relaxed certain of its local media ownership rules, including its local television ownership limitations and its prohibition against common ownership of newspapers and broadcast stations in the same market. It also modified its local radio ownership limitations in a way that could limit our ability to acquire additional radio stations in existing markets that we serve. The FCC’s new rules were to have become effective on September 4, 2003, but were stayed by the Third Circuit. In June 2004, the court remanded the new rules to the FCC with instructions to undertake additional analysis of the
29
record in order to justify its decision. In September 2004, the Third Circuit court lifted its stay insofar as it applied to the modified local radio ownership rules. In the 2008 remand order, the FCC liberalized its broadcast/newspaper cross-ownership rule and declined to modify its other ownership rules which, except for the modified local radio ownership rules, are currently in effect as effective prior to the FCC’s 2002 review. In March 2010, the Third Circuit lifted its 2003 stay of the revised broadcast/newspaper cross-ownership rule.
Recently, the FCC commenced its 2010 Quadrennial Review of its media ownership rules. We cannot predict the outcome of this proceeding nor the effect that any particular outcome will have on our stations and business.
Under existing law a single entity is permitted to have an attributable interest in television stations serving up to 39% of U.S. television households. The 39% cap is statutorily excluded from the FCC quadrennial review requirement. Large broadcast groups may take advantage of this law to expand further their ownership interests on a national basis. Any relaxation of ownership restrictions may provide a competitive advantage to those with greater financial and other resources than we possess.
Changes in laws and regulations of the broadcasting industry and changes in enforcement policies may have an adverse effect on our business.
The broadcasting industry is subject to extensive regulation by the FCC under the Communications Act of 1934, as amended. Compliance with and the effects of existing and future regulations could have a material adverse impact on us.
We are required to obtain licenses from the FCC to operate our radio and television stations. Issuance, renewal, assignment, or transfer of broadcast station operating licenses requires FCC approval. Under the Communications Act, the FCC generally may grant and renew broadcast licenses for terms of eight years, though licenses may be renewed for a shorter period or denied under certain circumstances. While the majority of such licenses are renewed by the FCC, we cannot assure you that our licenses will be renewed at their expiration dates, or, if renewed, that the renewal terms will be for eight years. If the FCC decides to include conditions or qualifications in any of our licenses, we may be limited in the manner in which we may operate the affected stations.
Except for KATU (and KATU’s translator stations), FCC licenses for our various television and radio stations expire in 2013, 2014 or 2015. The license renewal application for KATU (and KATU’s translator stations) for the term expiring February 1, 2007, was timely filed in September 2006. On December 22, 2006, a petition to deny was filed by Oregon Alliance to Reform Media, or OARM, against KATU and seven other television stations licensed to serve the Portland, Oregon market. OARM argued that the stations each failed to present adequate programming relating to state and local elections during the 2004 election cycle in their news and public affairs programming. The FCC’s Media Bureau rejected OARM’s petition. However, on September 14, 2007, OARM petitioned the FCC for reconsideration of that decision. That petition remains pending, and we cannot predict when or how the FCC will address it. KATU’s and its translator stations’ authority to operate is automatically extended while its renewal application is on file and under review.
We must comply with extensive FCC ownership regulations and policies. In general, the FCC’s ownership rules limit the number of television and radio stations that we can own in a market and the number of television stations we can own nationwide. The FCC attributes interests held by, among others, a licensee entity’s officers, directors, certain stockholders, and in some circumstances, lenders, to that entity for purposes of applying these ownership limitations. The ownership rules may prevent us from acquiring additional stations in a particular market. We may also be prevented from engaging in a swap transaction if the swap would cause the other company to violate these rules. We may further be prevented from implementing certain joint operations with competitors that might make the operation of our stations more efficient. The ownership rules may limit our ability to conduct our business in ways that we believe would be advantageous and may thereby affect our operating results.
30
Federal law and the FCC’s rules prohibit the broadcast of obscene material at any time, and the broadcast of indecent or profane material during the period from 6 a.m. through 10 p.m. In recent years, the FCC has vigorously enforced its indecency prohibition, and in 2006, legislation was enacted that raised the maximum monetary penalty for the broadcast of obscene, indecent, or profane language to $325,000 for each “violation,” with a cap of $3 million for any “single act.” The determination of whether content is indecent or profane is inherently subjective, creates uncertainty as to our ability to comply with the rules (in particular during live programming), and impacts our programming decisions. Violation of the indecency rules could lead to sanctions that may adversely affect our business and results of operations. The FCC’s indecency enforcement policy is currently the subject of federal litigation by networks and broadcasters. The outcome of this litigation is uncertain.
In recent years, the FCC has also vigorously enforced a number of other rules, typically in connection with license renewals. For example, in recent years, the FCC has issued fines and sanctions for violations of its equal employment opportunity rules, public inspection file rules, children’s programming rules, commercial time limits rules, sponsorship identification rules, closed captioning rules, station-conducted contest rules, and emergency alert system rules.
We may experience disruptions in our business if we sell or acquire and integrate new television or radio stations.
As part of our business strategy and subject to market conditions, we plan to continue to evaluate opportunities to sell or acquire television and radio stations. If we make acquisitions in the future, we may need to use more of our existing cash, incur more debt, or issue equity securities, and we may incur contingent liabilities and amortization and/or impairment expenses related to intangible assets. Further, we cannot provide assurance that we will find other attractive acquisition candidates or effectively manage the integration of acquired stations into our existing business. If the expected operating efficiencies from acquisitions do not materialize, if we fail to integrate new stations or recently acquired stations into our existing business, if the costs of such integration exceed expectations or if undertaking such sales or acquisitions diverts management’s attention from normal daily operations of the business, our operating results and financial condition could be harmed.
In addition, television and radio station acquisitions are subject to the approval of the FCC and, potentially, other regulatory authorities. The need for FCC and other regulatory approvals could restrict our ability to consummate future transactions and potentially require us to divest some television or radio stations if the FCC believes that a proposed acquisition would result in excessive concentration in a market, even if the proposed combinations may otherwise comply with FCC ownership limitations.
We have a significant amount of intangible assets and we have recorded substantial impairments of these assets in the past. Future write-downs of intangible assets would reduce net income or increase net loss, which could materially and adversely affect our results of operations and the value of our common stock.
We currently have approximately $53.8 million of goodwill and intangibles included in our total assets, which represents approximately 17% of our total assets. We test goodwill at the reporting unit level and intangible assets annually in October or whenever certain triggering events or circumstances occur, including, but not limited to changing business conditions and outlook, significant slowdown in the economic environment, and significant reduction in our market capitalization, indicating that goodwill or intangible assets might be impaired. For example, we recorded an impairment charge of $76.7 million during the fourth quarter of 2008. In recent years, declines in advertising revenues adversely affected investors’ outlooks on the market value of broadcasting companies including ours. Trends like this may be considered an indicator of impairment, and if they reemerge, they could require us to perform an impairment analysis in advance of our annual impairment testing. In addition, any significant shortfall in advertising revenue could lead to a downward revision in the fair value of certain reporting segments. If impairment is indicated as a result of future evaluations, we would record a further impairment charge in accordance with accounting rules, which would reduce any reported net income or increase any reported net loss for the period in which the charge is taken, and which could adversely affect the value of
31
our common stock. We may need to take additional impairments in the future, and historical trends may not be indicative of our future impairments. As a result, we could recognize further impairments in future quarters on the approximately $53.8 million goodwill and intangibles currently included in our total assets.
Our indebtedness could materially and adversely affect our business.
As of December 31, 2010, we had total debt, in the form of 8.625% senior notes due 2014, in the aggregate principal amount of $101.4 million.
Our indebtedness could have a material adverse effect on our business. For example, it could:
| • | increase our vulnerability to adverse economic and industry conditions and resulting downturn in our business; |
| • | reduce the availability of our cash flow to fund working capital, capital expenditures and other general business purposes; |
| • | reduce the funds available to purchase the rights to television and radio programs; |
| • | limit our flexibility in planning for, or reacting to, changes in our industries, making us more vulnerable to economic downturns; |
| • | limit our ability to raise additional funding; and |
| • | place us at a competitive disadvantage compared to our competitors that have less debt. |
If our indebtedness produces such adverse effects, our business, financial condition, cash flow and results of operations could suffer, making it more difficult for us to satisfy our obligations under the notes. Furthermore, the indenture governing our 8.625% senior notes due 2014 permits us to incur additional debt only if we satisfy certain financial tests and comply with other covenants. Refer to Note 8 in the accompanying notes to the consolidated financial statements for a description of the covenants included in the indenture. The failure to comply with the covenants in the indenture could result in an event of default, which, if not cured or waived, would permit acceleration of our payment obligations under the notes. See Item 7 “Management’s Discussion and Analysis of Financial Condition and Results of Operations—Liquidity and Capital Resources” for further discussion of our indebtedness.
Dependence on key personnel may expose us to additional risks.
Our business is dependent on the performance of certain key employees, including executive officers and senior operational personnel. While we have entered into change of control agreements with some of our key executives, we do not enter into employment agreements with most of our key executive officers and senior operational personnel. We also employ several on-air personalities who have significant loyal audiences in their respective markets, with whom we have entered into employment agreements. We cannot assure you that all such key personnel or on-air personalities will remain with us or that our on-air personalities will renew their contracts. The loss of any key personnel could harm our operations and financial results.
Failure of our information technology systems would disrupt our operations, which could reduce our customer base and result in lost revenue. Our computer systems are vulnerable to viruses, unauthorized tampering, system failures and potential obsolescence.
Our operations depend on the continued and uninterrupted performance of our information technology systems. Despite our implementation of network security measures, our servers and computer systems are vulnerable to computer viruses, break-ins, and similar disruptions from unauthorized tampering with our computer systems. Our computer systems are also subject to potential system failures and obsolescence. Any of these events could cause system interruption, delays and loss of critical data that would adversely affect our reputation and result in a loss of customers. Our recovery planning may not be sufficient for all eventualities.
32
Our ownership and operation of Fisher Plaza is subject to risks, including those relating to the economic climate, local real estate conditions, potential inability to provide adequate management, maintenance and insurance, potential collection problems, reliance on significant tenants, and regulatory risks.
Revenue and operating income from, and the value of, Fisher Plaza may be adversely affected by the general economic climate, the Seattle economic climate and real estate conditions, including prospective tenants’ perceptions of the attractiveness of the property and the availability of space in other competing properties. In addition, the economic conditions in the telecommunications and high-tech sectors may significantly affect our ability to attract tenants to Fisher Plaza, because space at Fisher Plaza is marketed in significant part to organizations from these sectors. Other risks relating to the operation of Fisher Plaza include the potential inability to provide adequate management, maintenance and insurance, and the potential inability to collect rent, due to bankruptcy or insolvency of tenants or otherwise, especially in light of the current difficult economic environment. We also risk facing lower rents due to the continuing uncertain economic conditions and abundance of available commercial space in downtown Seattle. Real estate income and values may also be adversely affected by such factors as applicable laws and regulations, including tax and environmental laws, interest rate levels and the availability of financing.
We carry comprehensive liability, fire, extended coverage and rent loss insurance with respect to Fisher Plaza. There are, however, certain losses that may be either uninsurable, not economically insurable, or in excess of our current insurance coverage limits. If an uninsured loss occurs, it could harm our operating results.
We may experience volatility in the market price of our common stock due to the lower trading volume and lower public ownership of our common stock.
The market price of our common stock has fluctuated significantly in the past and is likely to continue to be highly volatile. In particular, the volatility of our shares is influenced by lower trading volume and lower public ownership relative to many of our publicly-held competitors, as well as the recent turmoil in the stock market. For example, our closing stock price has ranged from a high of $27.72 per share to a low of $7.34 per share during the period between January 1, 2009 and February 28, 2011. Because several of our shareholders own significant portions of our outstanding shares, our stock is relatively less liquid and therefore more susceptible to large price fluctuations than many other companies’ shares. If these shareholders were to sell all or a portion of their holdings of our common stock, the market price of our common stock could be negatively impacted. The effect of such sales, or of significant portions of our stock being offered or made available for sale, could result in strong downward pressure on our stock price. Investors should be aware that they could experience significant short-term volatility in our stock if such shareholders decide to sell all or a portion of their holdings of our common stock at once or within a short period of time.
Our stock price may fluctuate in response to a number of events and factors, including without limitation, quarterly variations in operating results; announcements by us or our competitors; announcements relating to strategic decisions or key personnel; industry developments; service disruptions; acts of war, terrorism, or national calamities; changes in financial estimates and recommendations by security analysts; the operating and stock price performance of other companies that investors may deem comparable to us; and news reports relating to trends in our markets or general economic conditions.
In addition, the stock market has recently experienced significant price and volume fluctuations. These fluctuations are often unrelated to the operating performance of particular companies. These broad market fluctuations may adversely affect the market price of our common stock. When the market price of a company’s stock drops significantly, shareholders often institute securities class action litigation against that company. Any litigation against us could cause us to incur substantial costs, divert the time and attention of our management and other resources or otherwise harm our business.
33
We are subject to the ongoing internal control provisions of Section 404 of the Sarbanes-Oxley Act of 2002. Material weaknesses in internal control over financial reporting, if identified in future periods, could indicate a lack of proper controls to generate accurate financial statements.
Pursuant to Section 404 of the Sarbanes-Oxley Act of 2002 and related SEC rules, we are required to furnish a report of management’s assessment of the effectiveness of our internal control over financial reporting as part of our annual report on Form 10-K. Our independent registered public accountants are required to audit and provide a separate opinion on their evaluation of our internal control over financial reporting. To issue our report, we document our internal control design and the testing processes that support our evaluation and conclusion, and then we test and evaluate the results. There can be no assurance, however, that we will be able to remediate material weaknesses, if any, that may be identified in future periods, or maintain all of the controls necessary for continued compliance. We have in the past discovered, and may in the future discover, areas of our internal control over financial reporting that need improvement. If we or our independent registered public accountants discover a material weakness, the disclosure of that fact, even if quickly remedied, could reduce the market’s confidence in our financial statements and harm our stock price. We may not be able to effectively and timely implement necessary control changes and employee training to ensure continued compliance with Section 404 of the Sarbanes-Oxley Act and other regulatory and reporting requirements. There likewise can be no assurance that we will be able to retain sufficient skilled finance and accounting personnel, especially in light of the increased demand for such personnel among publicly traded companies.
Our operations may be adversely affected by earthquakes and other natural catastrophes in the Pacific Northwest or California.
Our corporate headquarters, Fisher Plaza and the majority of our operations are located in the Pacific Northwest and we own two television stations in California. The Pacific Northwest and California have from time to time experienced earthquakes. We do not know the ultimate impact on our operations of being located near major earthquake faults, but an earthquake could harm our operating results. Our broadcasting towers may also be affected by other natural catastrophes, such as forest fires. Our insurance coverage may not be adequate to cover the losses and interruptions caused by earthquakes or other natural catastrophes.
We could be negatively affected as a result of a currently threatened proxy fight.
In January 2011, a dissident shareholder declared its intention to nominate four individuals for election to our Board of Directors at the 2011 Annual Meeting of Shareholders. A proxy contest could negatively affect us because:
| • | Responding to proxy contests and other actions by dissident shareholders can be costly and time-consuming, disrupting our operations and diverting the attention of management and our employees; |
| • | Perceived uncertainties as to our future direction may impact our existing and potential strategic and operational relationships and opportunities and may make it more difficult to attract and retain qualified personnel; |
| • | If individuals are elected to our Board of Directors with a specific agenda, it may adversely affect our ability to effectively and timely implement our current business plan which could have a material adverse effect on our results of operations and financial condition; and |
| • | A proxy contest could cause our stock price to experience periods of volatility. |
| ITEM 1B. | UNRESOLVED STAFF COMMENTS |
None
34
| ITEM 2. | PROPERTIES |
Television Segment Properties. Our television stations other than KOMO TV and KUNS TV operate from offices and studios owned by our Fisher Broadcasting subsidiary in the markets listed in “Business—Television Segment”. KOMO TV and KUNS TV operate from the offices and studios in Fisher Plaza in Seattle, Washington. Television transmitting facilities and towers are also generally owned by Fisher Broadcasting in California, Idaho, Oregon and Washington. In each of Boise, Idaho and Portland, Oregon, our local television station is a member in a limited liability company with other broadcast companies. Each limited liability company was formed to construct and operate a joint use tower and transmitting site for the broadcast of radio and digital television signals. The land on which the towers is sited is leased by the limited liability companies from another company or entity (not Fisher or its local station).
Radio Segment Properties. We own the building housing our radio stations in Great Falls, Montana. Our Seattle stations are located in Fisher Plaza. Radio transmitting facilities and towers are owned by Fisher Broadcasting, except transmitting facilities and towers for KPLZ FM and the towers operated by Fisher Radio Regional Group, which are situated on leased land.
Fisher Plaza Segment Properties. Fisher Media Services owns and manages Fisher Plaza, a facility located near downtown Seattle that serves as the home of our corporate offices and our Seattle television and radio stations. See “Business—Fisher Plaza Segment” for a description of Fisher Plaza.
We believe that the properties owned or leased by our operating subsidiaries are generally in good condition and well maintained, and are adequate for present operations.
| ITEM 3. | LEGAL PROCEEDINGS |
We are parties to various claims, legal actions and complaints in the ordinary course of our businesses. In our opinion, all such matters are adequately covered by insurance, are without merit or are of such kind, or involve such amounts, that unfavorable disposition would not have a material adverse effect on our consolidated financial position or results of operations.
| ITEM 4. | (REMOVED AND RESERVED) |
35
PART II
| ITEM 5. | MARKET FOR REGISTRANT’S COMMON EQUITY, RELATED STOCKHOLDER MATTERS AND ISSUER PURCHASES OF EQUITY SECURITIES |
Our common stock is traded on The Nasdaq Global Market under the symbol “FSCI.” The following table sets forth the high and low sales prices for our common stock for the periods indicated. In determining the high and low prices we used the high and low sales prices as reported on The Nasdaq Global Market.
| Quarterly Common Stock Price Ranges | ||||||||||||||||
| 2010 | 2009 | |||||||||||||||
| Quarter |
High | Low | High | Low | ||||||||||||
|
1st |
$ | 17.28 | $ | 12.00 | $ | 24.25 | $ | 7.34 | ||||||||
|
2nd |
$ | 19.60 | $ | 13.90 | $ | 15.82 | $ | 9.50 | ||||||||
|
3rd |
$ | 18.93 | $ | 14.87 | $ | 21.61 | $ | 10.44 | ||||||||
|
4th |
$ | 22.51 | $ | 17.11 | $ | 22.59 | $ | 13.11 | ||||||||
We estimate that at March 1, 2011, there were approximately 1,900 holders of our common stock, including holders whose stock is in nominee or “street name” accounts through brokers and other institutions.
Dividends
On July 30, 2008, our Board of Directors declared a special cash dividend of $3.50 per share on our common stock. This dividend totaling $30.7 million was paid on August 29, 2008 to shareholders of record on August 15, 2008.
We did not declare cash dividends in 2010 or 2009, and we cannot know whether payment of dividends will resume in the future.
See Item 7. “Management’s Discussion and Analysis of Financial Condition and Results of Operations—Liquidity and Capital Resources” for discussion of the impact of our debt covenants on dividends.
36
Stock Performance Graph
This performance graph shall not be deemed “filed” for purposes of Section 18 of the Securities Exchange Act of 1934, as amended (the “Exchange Act”) or otherwise subject to the liabilities under that Section, and shall not be deemed to be incorporated by reference into any of our filing under the Securities Act of 1933, as amended or the Exchange Act.
The following graph compares the cumulative 5-year total return attained by shareholders on Fisher’s common stock relative to the cumulative total returns of the S & P 500 Index, and a customized peer group of 14 companies listed in footnote 1 below. The graph tracks the performance of a $100 investment in our common stock, in the peer group, and the index (with the reinvestment of all dividends) from December 31, 2005 to December 31, 2010.
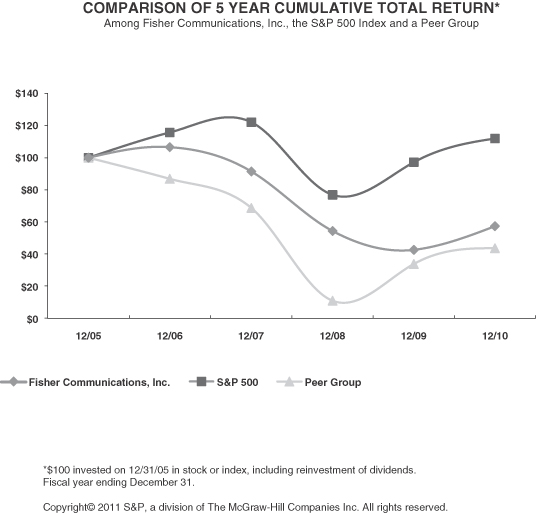
| 12/05 | 12/06 | 12/07 | 12/08 | 12/09 | 12/10 | |||||||||||||||||||
| Fisher Communications, Inc. |
$ | 100.00 | $ | 106.71 | $ | 91.62 | $ | 54.54 | $ | 42.94 | $ | 57.61 | ||||||||||||
| S&P 500 |
$ | 100.00 | $ | 115.80 | $ | 122.16 | $ | 76.96 | $ | 97.33 | $ | 111.99 | ||||||||||||
| Peer Group (1) |
$ | 100.00 | $ | 86.96 | $ | 68.81 | $ | 11.22 | $ | 34.17 | $ | 43.94 | ||||||||||||
37
The stock price performance included in this graph is not necessarily indicative of future stock price performance.
| (1) | There are 14 companies included in the customized peer group which are: Acme Communication Inc., Beasley Broadcast Group Inc., Belo Corp., Cumulus Media Inc., Emmis Communications Corp., Entercom Communications Corp., Gray Television Inc., LIN TV Corp., Radio One Inc., Saga Communications Inc., Salem Communications Corp., Sinclair Broadcast Group Inc., Westwood One Inc. and Young Broadcasting Inc. Regent Communications Inc. which was previously included in the peer group, has been excluded as it is no longer publicly traded. |
38
| ITEM 6. | SELECTED FINANCIAL DATA |
The following selected financial data is derived from our historical consolidated financial statements and related footnotes. The selected financial data for the years ended December 31, 2007 and 2006 and the balance sheets as of December 31, 2008, 2007 and 2006 are derived from historical consolidated financial statements not included herein. The information set forth below should be read in conjunction with “Management’s Discussion and Analysis of Financial Condition and Results of Operations” and the historical consolidated financial statements and related footnotes contained elsewhere in this Form 10-K.
| Year ended December 31, | ||||||||||||||||||||
| 2010 (2) | 2009 (3) | 2008 (4) | 2007 (5) | 2006 (6) | ||||||||||||||||
| (In thousands, except per-share amounts) | ||||||||||||||||||||
| Revenue |
$ | 175,926 | $ | 133,664 | $ | 173,791 | $ | 162,266 | $ | 156,537 | ||||||||||
| Net income (loss) |
||||||||||||||||||||
| From continuing operations (2)(3)(4)(5) |
$ | 9,746 | $ | (9,330 | ) | $ | 45,730 | $ | 30,879 | $ | 6,192 | |||||||||
| From discontinued operations |
— | — | (1,072 | ) | 995 | 10,309 | ||||||||||||||
| Net income (loss) |
$ | 9,746 | $ | (9,330 | ) | $ | 44,658 | $ | 31,874 | $ | 16,501 | |||||||||
| Per share data |
||||||||||||||||||||
| Net income (loss) per share—basic |
||||||||||||||||||||
| From continuing operations |
$ | 1.11 | $ | (1.06 | ) | $ | 5.23 | $ | 3.54 | $ | 0.71 | |||||||||
| From discontinued operations |
— | — | (0.12 | ) | 0.11 | 1.18 | ||||||||||||||
| Net income (loss) |
$ | 1.11 | $ | (1.06 | ) | $ | 5.11 | $ | 3.65 | $ | 1.89 | |||||||||
| Net income (loss) per share assuming dilution |
||||||||||||||||||||
| From continuing operations |
$ | 1.10 | $ | (1.06 | ) | $ | 5.23 | $ | 3.54 | $ | 0.71 | |||||||||
| From discontinued operations |
— | — | (0.12 | ) | 0.11 | 1.18 | ||||||||||||||
| Net income (loss) |
$ | 1.10 | $ | (1.06 | ) | $ | 5.11 | $ | 3.65 | $ | 1.89 | |||||||||
| Dividends declared per share |
$ | — | $ | — | $ | 3.50 | $ | — | $ | — | ||||||||||
| December 31, | ||||||||||||||||||||
| 2010 | 2009 | 2008 | 2007 | 2006 | ||||||||||||||||
| Working capital (1) |
$ | 72,023 | $ | 76,527 | $ | 104,905 | $ | 18,048 | $ | 30,373 | ||||||||||
| Total assets (1) |
320,892 | 331,110 | 369,157 | 485,934 | 497,577 | |||||||||||||||
| Total debt (1) |
101,440 | 122,050 | 150,000 | 150,000 | 150,000 | |||||||||||||||
| Stockholders’ equity |
165,226 | 155,472 | 162,608 | 231,261 | 237,429 | |||||||||||||||
| (1) | Includes discontinued operations and held for sale assets as of December 31, 2007 and 2006. |
| (2) | Income from continuing operations in 2010 includes a $2.1 million pre-tax gain resulting from the exchange of assets with Sprint Nextel and $3.4 million pre-tax gain for insurance reimbursements as a result of the July 2009 Fisher Plaza fire and a $160,000 pre-tax loss on extinguishment of debt. |
| (3) | Loss from continuing operations in 2009 includes a $2.6 million pre-tax gain resulting from the exchange of assets with Sprint Nextel, a charge of $2.7 million for expenses incurred as a result of the July 2009 Fisher Plaza fire, net of reimbursements and a $3.0 million pre-tax gain on extinguishment of debt. |
| (4) | Income from continuing operations in 2008 includes a $152.6 million pre-tax gain resulting from the sale of 2.3 million shares of Safeco Corporation common stock, $2.1 million in dividends on the Safeco Corporation common stock and an impairment charge of $78.2 million for goodwill, intangibles and equity investment. We sold our remaining shares of Safeco Corporation common stock in 2008. |
| (5) | Income from continuing operations in 2007 includes a $40.4 million pre-tax gain resulting from the sale of 700,000 shares of Safeco Corporation common stock and $4.2 million in dividends on the Safeco Corporation common stock. |
| (6) | As discussed in Note 1 to the consolidated financial statements, we revised our previously issued historical financial statements to reflect the deferred tax liability on our annuity contracts. |
39
| ITEM 7. | MANAGEMENT’S DISCUSSION AND ANALYSIS OF FINANCIAL CONDITION AND RESULTS OF OPERATIONS |
This annual report on Form 10-K contains forward-looking statements that involve known and unknown risks and uncertainties, such as statements of our plans, objectives, expectations and intentions. Words such as “may,” “could,” “would,” “should,” “expect,” “anticipate,” “intend,” “plan,” “believe,” “estimate” and variations of such words and similar expressions are intended to identify such forward-looking statements. You should not place undue reliance on these forward-looking statements, which are based on our current expectations and projections about future events, are not guarantees of future performance, are subject to risks, uncertainties and assumptions (including those described herein) and apply only as of the date of this report. Our actual results could differ materially from those anticipated in the forward-looking statements. Factors that could cause or contribute to such differences include, but are not limited to, those discussed in the section entitled “Risk Factors” as well as those discussed in this section and elsewhere in this annual report.
This discussion is intended to provide an analysis of significant trends and material changes in our financial condition and operating results during the period from 2008 through 2010.
Overview
We are an integrated media company. We own and operate 13 full power (including a 50%-owned television station) and seven low-power television stations and ten owned or managed radio stations. Our television stations are located in Washington, Oregon, Idaho and California, and our radio stations are located in Washington and Montana. We also own and operate Fisher Plaza, a mixed-use commercial facility located near downtown Seattle that serves as the home for our corporate offices and our Seattle television and radio stations. We lease a majority of the space at Fisher Plaza to a variety of unaffiliated companies.
Our broadcasting operations receive revenue from the sale of local, regional and national advertising and, to a much lesser extent, from retransmission consent fees, tower rental and commercial production activities. Our operating results are, therefore, sensitive to broad economic trends that affect the broadcasting industry in general, as well as local and regional trends, particularly those affecting the Pacific Northwest economy. The advertising revenue of our stations is generally highest in the second and fourth quarters of each year, due in part to increases in consumer advertising in the spring, and retail advertising in the period leading up to and including the holiday season. In addition, advertising revenue is generally higher during national election years due to spending by political candidates and advocacy groups. This political spending typically is heaviest during the fourth quarter.
Our television revenue is significantly affected by network affiliation and the success of programming offered by those networks. Our two largest television stations, KOMO TV and KATU TV, accounted for approximately 63% percent of our television broadcasting revenue in 2010 and are affiliated with the ABC Television Network. We have twelve television stations which are affiliated with one of the four major networks. Six of our television stations are affiliated with Univision (Spanish language) and the remainder of our television stations are independent or subscribe to various programming services. We have affiliation agreements with the ABC Television Network with current terms expiring in August 2014. Our affiliation agreements with the CBS Television Network generally expire in February 2016. Our only affiliation agreement with FOX Television Network for KBFX-CA in Bakersfield, California expired in June 2010. We are currently operating under the terms of the expired agreement as we continue discussions with FOX on the terms of a new agreement. Our affiliation agreement with Univision expires in September 2011. The non-renewal of any of our major network affiliation agreements could adversely affect our business and results. Our broadcasting operations are subject to competitive pressures from traditional broadcasting sources, as well as from alternative methods of delivering information and entertainment, and these pressures may cause fluctuations in operating results.
In addition to our broadcasting operations, we own and operate Fisher Plaza, and we lease space to other companies that are attracted by the property location and the infrastructure provided at this facility. At
40
December 31, 2010, approximately 96% of Fisher Plaza was occupied or committed for occupancy (41% occupied by Fisher entities), compared to 97% occupied or committed for occupancy at December 31, 2009 (43% occupied by Fisher entities). Revenue and operating income from Fisher Plaza are dependent upon the general economic climate, the Seattle economic climate, the outlook of the telecommunications and technology sectors and commercial real estate conditions, including the availability of space in other competing properties.
Management focuses on key metrics from operational data within our broadcasting and Fisher Plaza operations. Information on significant trends is provided in the section entitled “Consolidated Results of Operations.”
Significant Developments
The following significant developments affect the comparability of our consolidated financial statements for the years ended December 31, 2010, 2009 and 2008.
Joint Sales Agreement. In December 2010, we entered into a ten year Joint Sales Agreement (“JSA”) with NPG of Idaho, Inc., a subsidiary of News Press & Gazette Company (“NPG”), who owns and operates KIFI-TV an Idaho Falls, Idaho television station which was effective January 1, 2011. Under the agreement, NPG provides certain services supporting the operation of our television station in Idaho Falls, KIDK-TV, and sells substantially all of the commercial advertising on our station. We pay NPG a non-material fixed fee pursuant to the agreement, and a performance bonus based on station performance. Contemporaneously, with the JSA, we entered into an option agreement with NPG, whereby they have a conditional option to acquire KIDK-TV until January 1, 2021, effective on the expiration or termination of the indenture governing our senior notes.
ACME Agreement. In March 2010, we entered into a three year consulting and license agreement with ACME Television, LLC (“ACME”) which was effective April 1, 2010. Under the terms of the agreement we provide consulting services to ACME’s The Daily Buzz television show and we also license certain assets of the program in order to produce unique content to be distributed on both traditional broadcast and newly created digital platforms. In conjunction with the agreement, we were granted an option to purchase the ownership rights to The Daily Buzz television show until September 30, 2012. This agreement does not meet the criteria for consolidation. Revenue earned under this agreement is recorded in revenue and programming and other expenses are recorded in operating costs.
DataSphere Investment. In December 2009, we purchased shares of Series B preferred stock of DataSphere Technologies, Inc. for $1.5 million in cash. DataSphere is a Software as a Service Web technology and hyperlocal ad sales company focused on generating online profits for media companies. Since August 2009, we have utilized DataSphere’s technology and sales solution to launch over 100 hyperlocal neighborhood websites. We also work with DataSphere in its distribution of its technology and sales solution to other broadcast companies looking to establish hyperlocal sites. See “Business—Internet Business—Hyperlocal Websites”. Revenue earned from this arrangement is recorded in operating revenue.
ABC Affiliate Agreement. In August 2009, we renewed our network affiliation agreement with American Broadcasting Companies, Inc. (“ABC”). The renewed affiliation agreement, which requires that we pay an annual license fee to ABC for network programming, expires on August 31, 2014.
Fisher Plaza Fire. On July 2, 2009, an electrical fire contained within a garage level equipment room of the east building of our Fisher Plaza facility disrupted city-supplied electrical service to that building. A third-party investigation concluded that the fire appears to have been caused by a malfunction of bus duct equipment manufactured by a third-party. All of the final repairs and equipment replacement have been completed as of December 31, 2009.
We incurred approximately $6.8 million of expenditures related to the Fisher Plaza fire, including remediation expenses of $3.7 million and capital expenditures of $3.1 million. During the year ended
41
December 31, 2010, the Company recognized in the consolidated statement of operations, $3.4 million of insurance reimbursements, which represents substantially all of the Company’s expected reimbursements. During the year ended December 31, 2009, the Company recognized in the consolidated statement of operations, total Plaza fire expenses of $2.7 million, consisting of a $1.5 million loss on fixed assets destroyed by the fire plus the above mentioned $3.7 million of remediation expenses offset by $2.5 million of insurance reimbursements.
Retransmission Agreements. In the fourth quarter of 2008 and during 2009 we executed retransmission consent agreements with substantially all of our satellite and cable distribution partners. Retransmission revenue increased $4.1 million to $12.5 million in 2010 compared to 2009.
Repurchase of Senior Notes. During 2010, we repurchased $20.6 million aggregate principal amount of our 8.625% senior notes due in 2014 for a total consideration of $20.5 million in cash plus accrued interest of $312,000. We recorded a loss on extinguishment of debt, net of a $317,000 charge for related unamortized debt issuance costs, of approximately $160,000 for the year ended December 31, 2010.
During 2009, we repurchased $28.0 million aggregate principal amount of our 8.625% senior notes due in 2014 for a total consideration of $24.4 million in cash plus accrued interest of $637,000. We recorded a gain on extinguishment of debt, net of a $557,000 charge for related unamortized debt issuance costs, of approximately $3.0 million for the year ended December 31, 2009.
Local Marketing Agreement. In May 2009, we entered into a three year Local Marketing Agreement (“LMA”) with South Sound Broadcasting LLC (“South Sound”) to manage one of South Sound’s FM radio stations licensed to Oakville, Washington. The station broadcasts our KOMO News Radio programming to FM listeners in the Seattle—Tacoma radio market. Contemporaneously with the LMA, we entered into an option agreement with South Sound, whereby we have the right to acquire the station until May 8, 2012. If we do not exercise the option prior to its expiration date, we are obligated to pay South Sound up to approximately $1.4 million. Advertising revenue earned under this LMA is recorded as revenue and LMA fees and programming expenses are recorded as operating costs.
Goodwill and Intangibles Impairment. Given the rapid economic deterioration and significant decline in our market capitalization during the fourth quarter of 2008, we conducted an interim impairment assessment at year-end. Based on this review, we recorded a goodwill and intangible assets impairment charge of $76.7 million during the fourth quarter of 2008. See Note 6 to our consolidated financial statements for discussion of several key assumptions used in the fair value estimate of our broadcasting licenses and goodwill during our fourth quarter 2008 interim impairment test and the reason for the impairment charge.
Investment in equity investee impairment. During the fourth quarter of 2008, as a result of an impairment review, we recorded an impairment charge of $1.5 million on the investment in our equity investee, South West Oregon Broadcasting Corporation.
Special Dividend. On July 30, 2008, our Board of Directors declared a special cash dividend of $3.50 per share on our common stock, which was paid on August 29, 2008 to shareholders of record on August 15, 2008. The aggregate dividend amount was $30.7 million.
Dividends on Safeco Corporation Common Stock. During 2008, we recorded dividends on our shares of Safeco Corporation common stock in the amount of $2.1 million.
Sale of Safeco Corporation Shares. In 2008, we sold our remaining 2.3 million shares of Safeco Corporation common stock. The shares were sold at an average price of $66.65 per share, resulting in pre-tax net proceeds of $153.4 million. The book basis of the shares sold totaled $782,000, resulting in a pre-tax gain on sale of $152.6 million, which is included in other income, net for 2008.
42
Expiration of Seattle Mariners Radio Rights Agreement. Our radio rights agreement to broadcast Seattle Mariners baseball games on KOMO AM (the “Mariners Agreement”) ended in 2008. Our results for the year ended December 31, 2008, reflect $8.7 million of advertising revenue and $16.0 million of operating expenses, related to the Mariners Agreement. No such advertising revenue or operating expenses are reflected in our results for the years ended December 31, 2010 and 2009.
Termination of National Advertising Representation Agreement. In April 2008, we terminated the agreement with our national advertising representation firm. The successor firm will satisfy our contractual termination obligation to the predecessor firm with no cash payment required by us. In the second quarter of 2008, we recognized a net non-cash termination charge of $5.0 million to selling, general and administrative expenses and we are amortizing the resulting deferred credit as a non-cash reduction in costs associated with our national advertising representation firm over the five year term of the new agreement. We recognized a $1.5 million benefit due to this amortization for both the years ended December 31, 2010 and 2009.
Purchase of Bakersfield, California Television Stations. On January 1, 2008 we completed the purchase of substantially all of the assets of two television stations in Bakersfield, California, KBAK TV and KBFX-CA, for $55.3 million in cash. The acquisition contributed $10.2 million in additional television revenue for the year ended December 31, 2008.
Critical Accounting Policies
Our discussion and analysis of our financial condition and results of operations is based upon our consolidated financial statements, which have been prepared in accordance with accounting principles generally accepted in the United States. The preparation of these financial statements requires us to make estimates and judgments that affect the reported amounts of assets, liabilities, revenues and expenses, and related disclosure of contingent assets and liabilities. On an on-going basis, we evaluate our estimates including, but not limited to, those affecting revenues, goodwill and intangibles impairment, the useful lives of tangible and intangible assets, valuation allowances for receivables and broadcast rights, stock-based compensation expense, valuation allowances for deferred income taxes and liabilities and contingencies. The brief discussion below is intended to highlight some of the judgments and uncertainties that can impact the application of these policies and the specific dollar amounts reported on our financial statements. We base our estimates on historical experience and on various other assumptions that we believe to be reasonable under the circumstances, the results of which form our basis for making judgments about the carrying values of assets and liabilities that are not readily apparent from other sources. Actual results may differ from these estimates under different assumptions or conditions, or if management made different judgments or utilized different estimates. Many of our estimates or judgments are based on anticipated future events or performance, and as such are forward-looking in nature, and are subject to many risks and uncertainties, including those discussed below and elsewhere in this annual report. Except as otherwise required by law, we do not undertake any obligation to update or revise this discussion to reflect any future events or circumstances.
We have identified below our accounting policies that we consider critical to our business operations and the understanding of our results of operations. This is not a complete list of all of our accounting policies, and there may be other accounting policies that are significant to us. For a detailed discussion of the application of these and our other accounting policies, see Note 1 to the consolidated financial statements included in this annual report on Form 10-K.
We have discussed the development and selection of these critical accounting estimates with the Audit Committee of our Board of Directors and the Audit Committee has reviewed our disclosures relating to them, as presented in this annual report.
Goodwill and indefinite-lived intangible assets. Goodwill represents the excess of purchase price of certain media properties over the fair value of acquired tangible and identifiable intangible net assets. Indefinite-lived intangible assets consist of certain television licenses (primarily FCC licenses). In making estimates of fair
43
values for the purposes of allocating the purchase price, we rely primarily on our extensive knowledge of the market and, if considered appropriate, will obtain valuations from independent third party specialists. In estimating the fair value of the tangible and intangible assets acquired, we consider information obtained as a result of pre-acquisition due diligence, including third party reports that may be obtained in connection with the acquisition or financing of the respective assets. We evaluate the potential for impairment of goodwill and indefinite-lived intangible assets at least annually, or whenever events indicate that an impairment may exist. If the fair value of these assets is less than the carrying value, we may be required to record an impairment charge.
The goodwill impairment test involves a comparison of the fair value of each of our reporting units with the carrying amounts of net assets, including goodwill, related to each reporting unit. If the carrying amount exceeds a reporting unit’s fair value, the second step of the impairment test is performed to measure the amount of impairment loss, if any. The impairment loss is measured based on the amount by which the carrying amount of goodwill exceeds the implied fair value of goodwill in the reporting unit being tested. Fair values are determined based on valuations that rely primarily on the discounted cash flow method and market multiples of current earnings. This method uses future projections of cash flows from each of our reporting units and includes, among other estimates, projections of future advertising revenue and operating expenses, market supply and demand, projected capital spending and an assumption of our weighted average cost of capital, as adjusted for market participant data. Our indefinite-lived assets (broadcast licenses), which are not subject to amortization, are tested for impairment at least on an annual basis by applying a fair-value-based test as required. Our evaluations of fair values include analyses based on the estimated future cash flows generated by the underlying assets, estimated trends, and other relevant determinants of fair value for these assets. If the fair value of the asset is less than its carrying amount, a loss is recognized for the difference between the fair value and its carrying value. Changes in any of these estimates, projections and assumptions could have a material effect on the fair value of these assets in future measurement periods and result in an impairment of goodwill or indefinite-lived intangibles which could materially affect our results of operations.
The impairment test for FCC licenses consists of a station-by-station comparison of the carrying amount of FCC licenses with their fair value, using a discounted cash flow analysis.
We believe our estimate of the value of our goodwill and broadcasting licenses is a critical accounting estimate as the value is significant in relation to our total assets, and our estimate of the value uses assumptions that incorporate variables based on past experiences and judgments about future performance of our stations.
Tangible long-lived assets. We evaluate the recoverability of the carrying amount of long-lived tangible assets whenever events or changes in circumstances indicate that the carrying amount of an asset may not be fully recoverable. We use our judgment when applying the impairment rules to determine when an impairment analysis is necessary. Factors we consider which could trigger an impairment analysis include significant underperformance relative to historical or forecasted operating results, a significant decrease in the market value of an asset, a significant change in the extent or manner in which an asset is used or significant negative cash flows or industry trends.
Impairment losses are measured as the amount by which the carrying value of an asset exceeds its estimated fair value, which is primarily based on market transactions for comparable businesses, discounted cash flows and a review of the underlying assets of the reporting unit. In estimating future cash flows, we use future projections of cash flows directly associated with, and that were expected to arise as a direct result of, the use and eventual disposition of the assets. These projections rely on significant assumptions. If it is determined that a long-lived asset is not recoverable, an impairment loss would be calculated based on the excess of the carrying amount of the long-lived asset over its fair value. Changes in any of our estimates could have a material effect on the estimated future cash flows expected to be generated by the asset and could result in a future impairment of the involved assets with a material effect on our future results of operations.
44
Television and radio broadcast rights. Television and radio broadcast rights are recorded as assets when the license period begins and the programs are available for broadcast, at the gross amount of the related obligations (or, for non-sports first-run programming, at the amount of the annual obligation). Costs incurred in connection with the purchase of programs to be broadcast within one year are classified as current assets, while costs of those programs to be broadcast after one year are considered non-current. These programming costs are charged to operations over their estimated broadcast periods using the straight-line method. Program obligations are classified as current or non-current in accordance with the payment terms of the license agreement.
Revenue recognition. Television and radio revenue is recognized, net of advertising agency commissions, when the advertisement is broadcast, subject to meeting certain conditions such as persuasive evidence that an arrangement exists, the price is fixed or determinable and collection is reasonably assured. These criteria are generally met at the time an advertisement is broadcast, and the revenue is recorded net of advertising agency commission. We may trade certain advertising time for products or services, as well as barter advertising time for program material. Trade transactions are generally reported at the estimated fair value of the product or service received, while barter transactions are reported at management’s estimate of the value of the advertising time exchanged, which approximates the fair value of the program material received. Revenue is reported on trade and barter transactions when commercials are broadcast and expenses are reported when products or services are utilized or when programming airs. We receive consideration from certain satellite, cable and wireless providers in return for consent to the retransmission of the signals of our television stations. Revenue from production of broadcast media content is recognized when a contracted production is available for distribution. Revenues from retransmission consent and satellite transmission services are recognized when the service is performed. Website advertising revenue is recognized as services are delivered. Rentals from real estate leases are recognized on a straight-line basis over the term of the lease, while revenue from related service fees is recognized when the services are delivered.
Accrued retirement benefits. We maintain a noncontributory supplemental retirement program that was established for key management. No new participants have been admitted to this program since 2001 and the benefits of active participants were frozen in 2005. The program participants do not include any of our current executive officers. The program provides for vesting of benefits under certain circumstances. Funding is not required, but we have made investments in annuity contracts and maintain life insurance policies on the lives of the individual participants to assist in our payment of retirement benefits. We are the owner and beneficiary of the annuity contracts and life insurance policies. Accordingly, the cash value of the annuity contracts and the cash surrender value of the life insurance policies are reported in the consolidated balance sheet. The supplemental retirement program requires continued employment or disability through the date of expected retirement. The cost of the program is recognized over the participants’ average expected future lifetime.
The cost of this program is reported and accounted for in accordance with accounting rules that require significant assumptions regarding such factors as discount rates. We use an independent actuarial consulting firm to assist in estimating the supplemental retirement obligation and related periodic expenses. The discount rate used in determining the actuarial present value of the projected benefit obligation was 5.22% at December 31, 2010 and 5.57% at December 31, 2009. The rate of increase in future compensation was no longer applicable at December 31, 2010 or 2009 (due to freezing plan benefits for active participants). Although we believe that our estimates are reasonable for these key actuarial assumptions, future actual results could differ from our estimates. Changes in benefits provided by us may also affect future plan costs.
Income taxes. The preparation of our provision for income taxes requires significant judgment, the use of estimates and the interpretation and application of complex tax laws. These estimates and judgments must be used in the calculation of certain tax assets and liabilities because of differences in the timing of recognition of revenue and expense for tax and financial statement purposes. In assessing whether, and to what extent, deferred tax assets can be realized, we consider whether it is more likely than not that some portion or all of the deferred tax assets will be realized.
45
We must assess the likelihood that we will be able to recover some or all our deferred tax assets prior to their expiration and are required to establish valuation allowances against that portion of our deferred tax assets not considered recoverable. The determination of required valuation allowances involves significant judgment and is based upon our best estimate of anticipated taxable profits in various jurisdictions with which the deferred tax assets are associated. Changes in expectations and actual future results could result in significant adjustments to the valuation allowances and material changes to our provision for income taxes. We assess the likelihood of the realizability of our deferred tax assets on a quarterly basis. At December 31, 2010, we have not recorded a valuation allowance on our federal deferred tax assets as management believes that it is more likely than not that our federal deferred tax assets are realizable. The amount of net deferred tax assets considered realizable, however, could be reduced in the future if our projections of future taxable income are reduced or if we do not perform at the levels we are projecting. This could result in the need to establish a valuation allowance for our federal deferred tax assets.
Due to the uncertainty of our ability to generate sufficient state taxable income to realize our deferred state tax assets, we have established a 100% valuation allowance for financial reporting purposes. The valuation allowance was $2.2 million at December 31, 2010 and 2009. Our federal and state income tax returns are subject to periodic examination and the tax authorities may challenge certain of our tax positions as a result of examinations. We believe our tax positions comply with applicable tax law and we would vigorously defend these positions if challenged. The final disposition of any positions challenged by the tax authorities could require us to make additional tax payments.
The application of income tax law is inherently complex. Laws and regulations in this area are voluminous and are sometimes ambiguous. As such, we are required to make certain subjective assumptions and judgments regarding our income tax exposures. Interpretations of and guidance surrounding income tax laws and regulations change over time. Accordingly, changes in our subjective assumptions and judgments can materially affect amounts recognized in the consolidated balance sheets and statements of operations.
We believe that we have appropriate support for the income tax positions taken and to be taken on our tax returns and that our accruals for tax liabilities are adequate for all open years based on an assessment of many factors, including past experience and interpretations of tax law applied to the facts of each matter. Therefore, no reserves for uncertain income tax positions have been recorded for the years ended December 31, 2010 and 2009.
Allowance for doubtful accounts. We evaluate the collectibility of our accounts receivable based on a combination of factors. In circumstances where we are aware of a specific customer’s inability to meet its financial obligations, we record a specific reserve to reduce the amounts recorded to what we believe will be collected. Our allowance for doubtful accounts is based on factors such as the level of past due balances for each business unit, as well as changes in current economic conditions.
Variable Interest Entities. We may enter into JSAs or LMAs with non-owned stations. Under the terms of these agreements, we make specific periodic payments to the station’s owner-operator in exchange for the right to provide programming and/or sell advertising on a portion of the station’s broadcast time. Nevertheless, the owner-operator retains control and responsibility for the operation of the station, including responsibility over all programming broadcast on the station. Generally, we continue to operate the station and sell advertising under the LMA agreement and sell advertising under the JSA agreement until the termination of such agreement. As a result of these agreements, we may determine that the station is a Variable Interest Entity (“VIE”) and that we are the primary beneficiary of the variable interest. This typically occurs if we also have an agreement to acquire a station and the conditions to close are considered to be perfunctory. We also may determine that a station is a VIE in connection with other types of local service agreements entered into with stations in markets in which we own and operate a station.
Stock-based compensation. We use the Black-Scholes option pricing model to estimate the fair value of stock option awards. Our estimation of the fair value of stock option awards on the date of grant using an option
46
pricing model is affected by our stock price, as well as assumptions regarding a number of highly complex and subjective variables. These variables include, but are not limited to, the expected life of the award, our expected stock price volatility over the term of the award, forfeitures and projected exercise behaviors. The Black-Scholes option pricing model requires the input of subjective assumptions and other reasonable assumptions could provide differing results.
Contingencies. In the ordinary course of business, we are involved in legal proceedings regarding contractual and employment relationships and a variety of other matters. We record contingent liabilities resulting from claims against us, including related legal costs, when a loss is assessed to be probable and the amount of the loss is reasonably estimable. Assessing probability of loss and estimating probable losses requires analysis of multiple factors, including in some cases judgments about the potential actions of third party claimants and courts. Currently, we do not believe that any of our pending legal proceedings or claims will have a material impact on our consolidated financial position or results of operations.
Consolidated Results of Operations
We report financial data for three reportable segments: television, radio and Fisher Plaza. The television segment includes the operations of our 20 owned and operated television stations (including a 50%-owned television station) and Internet business. The radio segment includes the operations of our eight radio stations and two managed radio stations. Corporate expenses are allocated to the television and radio segments on a pro-rata basis. The Fisher Plaza segment consists of the operations of Fisher Plaza, a retail, office and communications center located near downtown Seattle that serves as the home of our Seattle-based television and radio operations, our corporate offices and third-party tenants. Fisher-owned entities that reside at Fisher Plaza do not pay rent, but do pay common area maintenance expenses. The segment data includes additional allocation of depreciation and certain operating expenses from Fisher Plaza to our television and radio segments. The other segment includes corporate and administrative expenses that are not attributable to the operations of the television, radio or Fisher Plaza segments.
47
The following information presents our results of operations for the years ended December 31, 2010, 2009 and 2008 and variances between periods. Percentage comparisons have been omitted within the following table where they are not considered meaningful.
| Year Ended December 31, |
2010-2009 Variance |
Year Ended December 31, |
2009-2008 Variance |
|||||||||||||||||||||||||
| (dollars in thousands) | 2010 | 2009 | $ | % | 2008 | $ | % | |||||||||||||||||||||
| Revenue |
||||||||||||||||||||||||||||
| Television |
$ | 136,397 | $ | 97,201 | $ | 39,196 | 40 | % | $ | 124,001 | $ | (26,800 | ) | -22 | % | |||||||||||||
| Radio |
25,283 | 22,833 | 2,450 | 11 | % | 36,719 | (13,886 | ) | -38 | % | ||||||||||||||||||
| Fisher Plaza |
14,400 | 13,739 | 661 | 5 | % | 13,122 | 617 | 5 | % | |||||||||||||||||||
| Other |
(154 | ) | (109 | ) | (45 | ) | -41 | % | (51 | ) | (58 | ) | -114 | % | ||||||||||||||
| Consolidated |
175,926 | 133,664 | 42,262 | 32 | % | 173,791 | (40,127 | ) | -23 | % | ||||||||||||||||||
| Direct operating costs |
||||||||||||||||||||||||||||
| Television |
54,135 | 50,342 | 3,793 | 8 | % | 52,627 | (2,285 | ) | -4 | % | ||||||||||||||||||
| Radio |
9,978 | 8,945 | 1,033 | 12 | % | 11,420 | (2,475 | ) | -22 | % | ||||||||||||||||||
| Fisher Plaza |
4,216 | 3,693 | 523 | 14 | % | 3,719 | (26 | ) | -1 | % | ||||||||||||||||||
| Other |
2,600 | 2,131 | 469 | 22 | % | 2,044 | 87 | 4 | % | |||||||||||||||||||
| Consolidated |
70,929 | 65,111 | 5,818 | 9 | % | 69,810 | (4,699 | ) | -7 | % | ||||||||||||||||||
| Selling, general and administrative expenses |
||||||||||||||||||||||||||||
| Television |
36,722 | 31,845 | 4,877 | 15 | % | 39,259 | (7,414 | ) | -19 | % | ||||||||||||||||||
| Radio |
11,145 | 10,720 | 425 | 4 | % | 16,683 | (5,963 | ) | -36 | % | ||||||||||||||||||
| Fisher Plaza |
671 | 404 | 267 | 66 | % | 814 | (410 | ) | -50 | % | ||||||||||||||||||
| Other |
10,086 | 8,201 | 1,885 | 23 | % | 9,103 | (902 | ) | -10 | % | ||||||||||||||||||
| Consolidated |
58,624 | 51,170 | 7,454 | 15 | % | 65,859 | (14,689 | ) | -22 | % | ||||||||||||||||||
| Impairment of goodwill and intangible assets |
||||||||||||||||||||||||||||
| Television |
— | — | — | — | 75,332 | (75,332 | ) | -100 | % | |||||||||||||||||||
| Radio |
— | — | — | — | 1,410 | (1,410 | ) | -100 | % | |||||||||||||||||||
| Consolidated |
— | — | — | — | 76,742 | (76,742 | ) | -100 | % | |||||||||||||||||||
| Impairment of investment in equity investee |
||||||||||||||||||||||||||||
| Television |
— | — | — | — | 1,468 | (1,468 | ) | -100 | % | |||||||||||||||||||
| Consolidated |
— | — | — | — | 1,468 | (1,468 | ) | -100 | % | |||||||||||||||||||
| Amortization of program rights |
||||||||||||||||||||||||||||
| Television |
11,877 | 10,056 | 1,821 | 18 | % | 8,538 | 1,518 | 18 | % | |||||||||||||||||||
| Radio |
— | — | — | — | 10,750 | (10,750 | ) | -100 | % | |||||||||||||||||||
| Consolidated |
11,877 | 10,056 | 1,821 | 18 | % | 19,288 | (9,232 | ) | -48 | % | ||||||||||||||||||
| Depreciation and amortization |
||||||||||||||||||||||||||||
| Television |
9,136 | 8,862 | 274 | 3 | % | 8,053 | 809 | 10 | % | |||||||||||||||||||
| Radio |
932 | 791 | 141 | 18 | % | 1,018 | (227 | ) | -22 | % | ||||||||||||||||||
| Fisher Plaza |
3,210 | 3,019 | 191 | 6 | % | 3,117 | (98 | ) | -3 | % | ||||||||||||||||||
| Other |
1,170 | 1,041 | 129 | 12 | % | 515 | 526 | 102 | % | |||||||||||||||||||
| Consolidated |
14,448 | 13,713 | 735 | 5 | % | 12,703 | 1,010 | 8 | % | |||||||||||||||||||
| Plaza fire expenses (reimbursements), net |
||||||||||||||||||||||||||||
| Fisher Plaza |
(3,363 | ) | 2,657 | (6,020 | ) | -227 | % | — | 2,657 | — | ||||||||||||||||||
| Consolidated |
(3,363 | ) | 2,657 | (6,020 | ) | -227 | % | — | 2,657 | — | ||||||||||||||||||
| Gain on asset exchange, net |
||||||||||||||||||||||||||||
| Television |
(2,054 | ) | (2,569 | ) | 515 | 20 | % | — | (2,569 | ) | — | |||||||||||||||||
| Consolidated |
(2,054 | ) | (2,569 | ) | 515 | 20 | % | — | (2,569 | ) | — | |||||||||||||||||
| Income (loss) from operations |
||||||||||||||||||||||||||||
| Television |
26,581 | (1,335 | ) | 27,916 | 2091 | % | (61,276 | ) | 59,941 | 98 | % | |||||||||||||||||
| Radio |
3,228 | 2,377 | 851 | 36 | % | (4,562 | ) | 6,939 | 152 | % | ||||||||||||||||||
| Fisher Plaza |
9,666 | 3,966 | 5,700 | 144 | % | 5,472 | (1,506 | ) | -28 | % | ||||||||||||||||||
| Other |
(14,010 | ) | (11,482 | ) | (2,528 | ) | -22 | % | (11,713 | ) | 231 | 2 | % | |||||||||||||||
| Consolidated |
25,465 | (6,474 | ) | 31,939 | 493 | % | (72,079 | ) | 65,605 | 91 | % | |||||||||||||||||
| Gain (loss) on extinguishment of senior notes, net |
(160 | ) | 2,965 | (3,125 | ) | -105 | % | — | 2,965 | — | ||||||||||||||||||
| Other income, net |
217 | 1,288 | (1,071 | ) | -83 | % | 156,570 | (155,282 | ) | -99 | % | |||||||||||||||||
| Interest expense |
(9,954 | ) | (11,677 | ) | 1,723 | 15 | % | (13,928 | ) | 2,251 | 16 | % | ||||||||||||||||
| Income (loss) before income taxes |
15,568 | (13,898 | ) | 29,466 | 212 | % | 70,563 | (84,461 | ) | -120 | % | |||||||||||||||||
| Provision (benefit) for income taxes |
5,822 | (4,568 | ) | 10,390 | 227 | % | 24,833 | (29,401 | ) | -118 | % | |||||||||||||||||
| Income (loss) from continuing operations |
9,746 | (9,330 | ) | 19,076 | 204 | % | 45,730 | (55,060 | ) | -120 | % | |||||||||||||||||
| Income (loss) from discontinued operations, net of income taxes |
— | — | — | — | (1,072 | ) | 1,072 | 100 | % | |||||||||||||||||||
| Net income (loss) |
$ | 9,746 | $ | (9,330 | ) | $ | 19,076 | 204 | % | $ | 44,658 | $ | (53,988 | ) | -121 | % | ||||||||||||
48
Revenue
Total revenue increased 32% in 2010 as compared to 2009, of which the majority was related to the increase in broadcasting advertising revenue. Broadcasting revenue increased primarily due to the robust political spending in California, Washington and Oregon and the continued economic recovery in our markets, which lead to improvements in some of our key sectors, including automotive and retail. We also experienced higher than normal political advertising revenue in 2010, in light of the recent United States Supreme Court decision in Citizens United v. FEC in which the Court struck down federal laws banning independent electoral and issue advocacy sponsored by nonprofit and for-profit corporations. Political spending was also positively affected by the competitive races and robust initiatives in our markets.
The following table sets forth our main types of revenue by segment for the years ended December 31, 2010, 2009 and 2008;
| Year Ended December 31, | ||||||||||||||||||||||||||||||||
| 2010 | % change |
% total revenue |
2009 | % change |
% total revenue |
2008 | % total revenue |
|||||||||||||||||||||||||
| Core advertising (local and national) |
$ | 90,227 | 16 | % | 51 | % | $ | 77,945 | -17 | % | 58 | % | $ | 93,369 | 54 | % | ||||||||||||||||
| Political |
22,109 | 1037 | % | 13 | % | 1,945 | -90 | % | 1 | % | 19,330 | 11 | % | |||||||||||||||||||
| Internet |
3,496 | 105 | % | 2 | % | 1,705 | -12 | % | 1 | % | 1,943 | 1 | % | |||||||||||||||||||
| Retransmission |
12,451 | 49 | % | 7 | % | 8,361 | 173 | % | 6 | % | 3,059 | 2 | % | |||||||||||||||||||
| Trade, barter and other |
8,114 | 12 | % | 5 | % | 7,245 | 15 | % | 5 | % | 6,300 | 4 | % | |||||||||||||||||||
| TV |
136,397 | 40 | % | 78 | % | 97,201 | -22 | % | 73 | % | 124,001 | 71 | % | |||||||||||||||||||
| Core advertising (local and national) |
22,810 | 9 | % | 13 | % | 20,999 | -37 | % | 16 | % | 33,314 | 19 | % | |||||||||||||||||||
| Political |
1,155 | 297 | % | 1 | % | 291 | -67 | % | 0 | % | 886 | 1 | % | |||||||||||||||||||
| Trade, barter and other |
1,318 | -15 | % | 1 | % | 1,543 | -39 | % | 1 | % | 2,519 | 1 | % | |||||||||||||||||||
| Radio |
25,283 | 11 | % | 14 | % | 22,833 | -38 | % | 17 | % | 36,719 | 21 | % | |||||||||||||||||||
| Plaza |
14,400 | 5 | % | 8 | % | 13,739 | 5 | % | 10 | % | 13,122 | 8 | % | |||||||||||||||||||
| Other |
(154 | ) | 41 | % | 0 | % | (109 | ) | 114 | % | 0 | % | (51 | ) | 0 | % | ||||||||||||||||
| Total Revenue |
$ | 175,926 | 32 | % | 100 | % | $ | 133,664 | -23 | % | 100 | % | $ | 173,791 | 100 | % | ||||||||||||||||
Television. Television revenue increased $39.2 million or 40% in 2010 as compared to 2009, primarily due to significant increases in local and national political advertising spending and continued improvement in some of our key sectors, including automotive, retail and professional services. Retransmission revenue increased $4.1 million or 49% in 2010 compared to 2009, the increase primarily related to the benefit of a full year of retransmission revenue from our agreement with DISH Network (“DISH”) as compared to a partial year in 2009 and our contractual rate increases under existing agreements.
Television revenue decreased $26.8 million or 22% in 2009 as compared to 2008, primarily due to sharp declines in local and political advertising spending, partially offset by an increase in national advertising and retransmission revenues. Local advertising revenues declined as a result of the broad economic recession and the absence of our stations from DISH in the first half of 2009 due to the expiration of our retransmission agreement with DISH in December 2008. Political advertising revenues declined as 2009 was a minor political year. National advertising revenues increased marginally from the prior year. Retransmission revenue increased $5.3 million, or 173%, in 2009 compared to 2008 as a result of our execution of new retransmission consent agreements with over 50 distribution partners in the fourth quarter of 2008 and during 2009. Additionally, on June 10, 2009, we executed a new multi-year retransmission agreement with DISH. Retransmission fees under the new DISH agreement began accruing as of the date of execution.
49
Revenues from our ABC-affiliated stations and our CBS-affiliated stations increased 43% and 31%, respectively, in 2010 as compared to 2009, due primarily to increases in local and national political advertising as well as a broader recovery in general advertising conditions, in particular within the retail and automotive categories. Retransmission revenue increased primarily due to the benefit of a full year of retransmission revenue under our DISH agreements and contractual rate increases under existing agreements.
Revenues from our ABC-affiliated stations and our CBS-affiliated stations decreased 23% and 22%, respectively, in 2009 as compared to 2008, due primarily to declines in local and political advertising spending, partially offset by an increase in national and retransmission revenues. Local advertising revenues declined as a result of the broad economic recession and the absence of our stations from DISH. Political revenues declined as 2009 was a minor political year. These declines were partially offset by an increase in retransmission revenues.
Radio. Radio revenue increased $2.5 million or 11% in 2010, as compared to 2009.The increase was primarily driven by higher national advertising and political spending.
Radio revenue decreased $13.9 million or 38% in 2009, as compared to 2008, primarily as a result of the expiration of our Mariners broadcast agreement and a decline in local advertising revenue. Excluding revenue specifically attributable to our Mariners broadcast agreement, radio revenue decreased 19% for the year ended December 31, 2009 as compared to 2008. We attribute the decrease to weak demand in advertising spending as a result of the broad economic recession.
Fisher Plaza. Revenue increase at Fisher Plaza in 2010 compared to 2009 due primarily to an expansion of leased space for certain of our existing tenants, contractual rent increases, service fees and tenant reimbursements.
The revenue increase at Fisher Plaza in 2009 compared to 2008 was due primarily to an expansion of leased space for certain of our existing tenants and increased service fees and base rent for our current tenants.
Occupancy levels have remained generally consistent at Fisher Plaza over the past three years. Fisher Plaza occupancy was 96%, 97% and 97% for the years ended December 31, 2010, 2009 and 2008, respectively. Fisher entities occupied 41%, 43% and 43% of Fisher Plaza as of December 31, 2010, 2009 and 2008.
Direct operating costs
Direct operating costs are expenses required to produce and promote broadcast programming for our television and radio segments and costs to operate Fisher Plaza. Many of these costs are relatively fixed in nature and do not necessarily vary on a proportional basis with revenue.
Television. The increase in direct operating costs of $3.8 million, or 8%, for the television segment in 2010 as compared to 2009 was primarily the result of an increase in our network programming costs, an increase in news rating services and an increase in our compensation costs. The increase in compensation costs was primarily due to increases in personal services contracts and union rates, state unemployment rates and employee benefits.
The decrease in direct operating costs of $2.3 million, or 4%, for the television segment in 2009 as compared to 2008 was primarily the result of a reduction in personnel and associated compensation costs and benefits, plus a reduction in promotional spending. The reduction in these costs was partially offset by an increase in our network programming costs as a result of the renewal of our ABC affiliation agreement.
Radio. The increase of $1.0 million, or 12%, in direct operating costs at our radio segment for 2010 as compared to 2009 was primarily related to $571,000 of costs associated with the format change for our station, KVI and $240,000 for fees related to our LMA with South Sound.
50
The decrease of $2.5 million, or 22%, in direct operating costs at our radio segment for 2009 as compared to 2008 was primarily due to the termination of our Mariners broadcast agreement in 2008. The termination of this agreement resulted in reduced rights fees, as well as a reduction in personnel and promotional costs.
Fisher Plaza. The increase in direct operating costs of $523,000, or 14%, at Fisher Plaza in 2010 as compared to 2009 was primarily due to a one-time expense for equipment removal costs and an increase in property taxes.
The decrease in direct operating costs of $26,000, or 1%, at Fisher Plaza in 2009 as compared to 2008 was primarily attributable to decreased management costs and repair and maintenance expenditures.
Other. The other category consists primarily of the reclassification and elimination of certain operating expenses between operating segments. For example, KOMO TV and Seattle Radio recognize facilities-related intercompany expenses as selling, general and administrative, while Fisher Plaza records the reimbursement of these intercompany expenses as a reduction of direct operating costs.
Selling, general and administrative expenses
Television. The increase in selling, general and administrative expenses of $4.9 million, or 15%, in the television segment in 2010 as compared to 2009 was primarily due to higher sales commissions of $1.8 million based on increased local and national revenue and increased trade and barter advertising expense of $1.1 million.
The decrease in selling, general and administrative expenses of $7.4 million, or 19%, in the television segment in 2009 as compared to 2008 was due primarily to a decrease in commissions as a result of the decline in advertising revenue, and personnel reductions. In April 2008 we terminated national advertising representation agreements with contractual termination penalties. As a result we recorded approximately $5 million as a non-cash charge to selling, general and administrative expense and are amortizing the resulting deferred credit on a straight-line basis over the five-year term of the new contract.
Radio. The increase in selling, general and administrative expenses of $425,000, or 4%, in the radio segment in 2010 compared to 2009 was primarily due to higher sales commissions of $344,000 corresponding to the increase in radio revenue.
The decrease in selling, general and administrative expenses of $6.0 million, or 36%, at our radio segment in 2009 compared to 2008 was due primarily to the termination of our Mariners broadcast agreement in 2008.
Fisher Plaza. Total selling, general and administrative expenses at Fisher Plaza increased $267,000, or 66%, in 2010 as compared to 2009 due primarily to a loss on disposal of leasehold improvements due to the relocation of our corporate offices to consolidate our footprint in Fisher Plaza in early 2010.
Total selling, general and administrative expenses at Fisher Plaza decreased $410,000, or 50%, in 2009 as compared to 2008 due primarily to costs incurred to market Fisher Plaza to potential buyers during the summer of 2008. Similar costs were not incurred in 2009 as we stopped marketing the sale of Fisher Plaza in the fourth quarter of 2008.
Other. Total selling, general and administrative expenses for the other category increased $1.9 million, or 23%, in 2010 as compared to 2009 due primarily to increases in compensation and incentive bonuses of $2.7 million and related benefits expenses partially offset by a decrease in various consulting, legal and other professional fees and a decrease in our supplemental retirement plan expenses resulting from an actuarial gain on the death benefit for certain life insurance and annuity contracts.
Total selling, general and administrative expenses for the other category decreased $902,000, or 10%, in 2009 as compared to 2008. The decrease was due primarily to a $1.0 million non-recurring non-cash charge we recognized in 2008 for the forfeiture of a non-refundable option payment related to our decision not to exercise an option to acquire additional television stations, offset by increases in legal and professional service fees.
51
Amortization of program rights
Television. Amortization of program rights for the television segment increased in 2010 as compared to 2009 and in 2009 as compared to 2008, in both cases due primarily to the addition of new programs for broadcast on our KATU TV and KOMO TV stations.
Radio. Amortization of program rights for the radio segment in 2008 was related to the agreement to broadcast Seattle Mariners baseball games. There was no amortization of program rights related to the Mariners Agreement in 2010 or 2009.
Impairment of goodwill and intangible assets
Based on our annual impairment analysis as of October 1, 2010, we determined that it was not necessary to record an impairment charge because the estimated fair value of each of our reporting units is greater than the carrying value. The individual carrying value of one reporting unit is within 10% of its estimated fair value. The aggregate carrying value of goodwill at this reporting unit was $5.1 million at December 31, 2010.
We recorded an impairment charge of $76.7 million during the fourth quarter of 2008 that included:
| • | a $38.0 million impairment to the carrying values of FCC licenses, related to five of our television stations and two of our radio stations; |
| • | a $340,000 impairment to the carrying value of a network affiliation agreement for one of our television stations; and |
| • | a $38.4 million impairment to the carrying values of goodwill, related to six reporting units consisting of eleven of our television stations and five of our radio stations. |
We tested our FCC licenses and goodwill for impairment at December 31, 2008, between the annual impairment tests, because we believed events had occurred and circumstances changed that would more likely than not reduce the fair value of our reporting units below their carrying amounts and that our FCC licenses might be impaired. These events included:
| • | a decline in the price of our common stock as of December 31, 2008; |
| • | the deterioration of overall economic conditions; and |
| • | the decline in advertising revenues at our radio and television stations. |
Impairment of investment in equity investee
We recorded an impairment charge of $1.5 million in the fourth quarter of 2008 on the investment in our equity investee, South West Oregon Broadcasting Corporation, as part of our fourth quarter impairment review.
Plaza fire expenses (reimbursements), net
Plaza fire expenses (reimbursements), net for the year ended December 31, 2010 represent net insurance reimbursements of $3.4 million related to the Fisher Plaza fire. Plaza fire expenses (reimbursements), net for the year ended December 31, 2009 represent costs related to the Fisher Plaza fire, and were comprised of remediation costs of $3.7 million and loss of fixed assets destroyed by the fire of $1.5 million, offset by $2.5 million of insurance reimbursements We did not have these costs in 2008.
Gain on asset exchange, net
Gain on asset exchange, net was $2.1 million and $2.6 million for the years ended December 31, 2010 and December 31, 2009. This amount represents the substitute equipment received from Sprint Nextel and the costs
52
of installing the equipment. Upon installation and use of the equipment, the gain net of disposals was recorded. See Note 18 to our consolidated financial statements for additional information on the asset exchange with Sprint Nextel. We did not have these costs in 2008.
Depreciation and amortization
Depreciation for the television segment increased in 2010 as compared to 2009, due primarily to the fixed asset additions as a result of the Sprint Nextel asset exchange which occurred in 2010 and 2009.
Depreciation for the radio segment increased in 2010 as compared to 2009, due to a broadcast equipment upgrade during 2010.
Depreciation at Fisher Plaza increased in 2010 as compared to 2009, as a result of fixed asset replacement expenditures related to the electrical fire in July 2009 and the build out for the relocation of our corporate offices from the Plaza West building to the Plaza East building.
Depreciation for the television segment also increased in 2009 as compared to 2008, due primarily to the fixed asset additions as a result of the Sprint Nextel asset exchange. Depreciation for the radio segment decreased in 2009 as compared to 2008, due primarily to certain assets becoming fully depreciated. Depreciation at Fisher Plaza declined in 2009 as compared to 2008, due to the loss on disposal of fixed assets destroyed in the electrical fire during July 2009.
Gain on extinguishment of senior notes, net
During the year ended December 31, 2010, we repurchased $20.6 million aggregate principal amount of our senior notes for total consideration of $20.5 million in cash plus accrued interest of $312,000. A loss on extinguishment of debt was recorded, net of a charge for related unamortized debt issuance costs of $317,000, of approximately $160,000.
During the year ended December 31, 2009, we repurchased $28.0 million aggregate principal amount of our senior notes for total consideration of $24.4 million in cash plus accrued interest of $637,000. A gain on extinguishment of debt was recorded, net of a charge for related unamortized debt issuance costs of $557,000, of approximately $3.0 million.
Other income, net
Other income, net, typically consists of interest and other miscellaneous income received. In 2010, this included interest income earned on our cash balances and other miscellaneous income. In 2009, this included interest income earned on our cash balances, income from the sale of a trademark and other miscellaneous income.
In 2008, other income, net, included a gain on the sale of marketable securities, dividends received on marketable securities and, to a lesser extent, interest and miscellaneous income received. The significant decrease in 2009 as compared to 2008 was due primarily to the June and July 2008 sales of our remaining 2.3 million shares of Safeco Corporation common stock, resulting in a pre-tax gain of $152.6 million.
Interest expense
Interest expense consists primarily of interest on our senior notes and amortization of loan fees. The decrease in interest expense in 2010 as compared to 2009 was due to our repurchase of $20.6 million aggregate principal amount of senior notes during the year ended December 31, 2010.
53
The decrease in interest expense in 2009 as compared to 2008 was due to our repurchase of $28.0 million aggregate principal amount of senior notes during the year ended December 31, 2009 and the fact that we did not have any borrowings outstanding under our $20 million senior credit facility during 2009 as the facility was terminated in December 2008.
Provision (benefit) for federal and state income taxes
Our effective tax rate increased to 37.4% in 2010 as compared to 32.9% in 2009 due primarily to changes in the rate adjustment from our 2009 loss carry back and non-deductible expenses. Our effective tax rate was higher than the statutory rate of 35% for the same reasons discussed above. Our effective tax rate decreased to 32.9% in 2009 as compared to 35.2% in 2008 due primarily to changes in our state tax benefit.
Due to the uncertainty of our ability to generate sufficient state taxable income to realize our state deferred tax assets, we have established a 100% valuation allowance for these deferred tax assets consistent with prior years. As a result, our effective tax rate is not affected by changes in state income tax rates.
Income (loss) from discontinued operations, net of income taxes
The loss from discontinued operations in 2008 was related primarily to the operations of Pegasus News, Inc. (“Pegasus”). In addition, in December 2008 we sold Pegasus for a net after-tax loss of $21,000 and we recognized an after-tax loss of $171,000 in 2008 upon final settlement of a dispute related to the sale of 18 small-market radio stations in 2006.
Liquidity and Capital Resources
Liquidity
Our liquidity is primarily dependent upon our cash and cash equivalents and net cash generated from operating activities. Our net cash generated from operating activities is sensitive to many factors, including changes in working capital and the timing and magnitude of capital expenditures. Working capital at any specific point in time is dependent upon many variables, including operating results, receivables and the timing of cash receipts and payments.
We expect cash flows from operations, cash, and cash equivalents to provide sufficient liquidity to meet our cash requirements for operations, projected working capital requirements, planned capital expenditures and commitments for at least the next 12 months. In the future, we may obtain a credit facility depending on market conditions and our current needs.
Capital Resources
Cash and Cash Equivalents. Cash and cash equivalents were approximately $52.9 million as of December 31, 2010 compared to $44.0 million as of December 31, 2009. The increase in cash and cash equivalents of $9.0 million was due primarily to cash provided by operating activities of $39.7 million, offset by the repurchase of our senior notes of $20.5 million and purchases of property, plant and equipment of $10.0 million.
Senior Notes. In 2004, we issued 8.625% senior notes due 2014 in the aggregate principal amount of $150 million. The senior notes are unconditionally guaranteed, jointly and severally, on an unsecured, senior basis by our current and future material domestic subsidiaries. Interest on the senior notes is payable semiannually in arrears on March 15 and September 15 of each year. The maturity date of the senior notes is September 15, 2014. We are subject to various debt covenants and other restrictions, the violation of which could require repayment of outstanding borrowings and affect our credit rating and access to other financing. See Note 8 to our consolidated financial statements. We were in compliance with the debt covenant requirements at December 31, 2010 and 2009.
54
In 2010, we repurchased $20.6 million aggregate principal amount of the senior notes for total consideration of $20.5 million in cash plus accrued interest of $312,000. A loss of approximately $160,000 was recorded in 2010 in connection with these repurchases, net of a charge for related unamortized debt issuance costs of $317,000. As of December 31, 2010, we had $101.4 million aggregate principal amount of the senior notes outstanding.
In 2009, we repurchased $28.0 million aggregate principal amount of the senior notes for total consideration of $24.4 million in cash plus accrued interest of $637,000. A gain of $3.0 million was recorded in 2009 in connection with these repurchases, net of a charge for related unamortized debt issuance costs of $557,000.
Our senior notes indenture contains covenants that limit our ability to pay dividends or make other distributions on, redeem or repurchase capital stock, and other restrictive and financial covenants applicable to our business, and we analyze our compliance with those covenants on an ongoing basis.
Operating activities
Net cash provided by operating activities in 2010 of $39.7 million consists of our net income of $9.7 million, adjusted by non-cash charges of $30.1 million which primarily consisted of depreciation and amortization, amortization of broadcast rights, stock-based compensation, loss on disposal of fixed assets, gain on exchange of assets and the loss on extinguishment of senior notes and an $11.9 million increase in working capital, offset by $12.0 million of payments for broadcast rights.
Net cash used in operating activities in 2009 of $10.2 million consisted of a net loss of $9.3 million, adjusted by non-cash charges of $27.4 million which consisted of depreciation and amortization, amortization of broadcast rights, stock-based compensation, loss on disposal of fixed assets, gain on exchange of assets and the gain on extinguishment of senior notes, offset by $18.3 million used in working capital and $10.0 million of payments for broadcast rights.
Net cash used in operating activities in 2008 of $29.2 million consisted of net income of $44.7 million, adjusted by non-cash charges of $53.3 million which included loss impairment of goodwill, intangible assets and equity investment, gain on sale of Safeco shares, depreciation and amortization, amortization of broadcast rights and stock-based compensation offset by $2.4 million used in working capital and $18.2 million of payment of broadcast rights.
Investing activities
Net cash used in investing activities during 2010 was $10.0 million compared to net cash provided by investing activities during 2009 of $46.9 million and net cash provided by investing activities of $85.4 million in 2008. During 2010, cash flows related to investing activities consisted primarily of purchases of property, plant and equipment of $10.0 million.
During 2009, cash flows related to investing activities consisted primarily of proceeds from sale of marketable securities of $60.0 million offset by the investment in DataSphere of $1.5 million, which is accounted for on a cost basis, and purchases of property, plant and equipment of $11.6 million.
During 2008, cash flows related to investing activities consisted primarily of proceeds of $153.5 million from the sale of marketable securities (primarily Safeco shares) and a decrease in restricted cash of $52.4 million, offset by $52.4 million for the purchase of the Bakersfield television stations, $58.9 million in purchases of short-term investments and $10.3 million in purchases of property, plant and equipment.
Financing activities
Net cash used in financing activities in 2010 was $20.7 million primarily due the retirement of $20.6 million aggregate principal amount of our senior notes for total consideration of $20.5 million in cash. Net cash used in
55
financing in 2009 was $24.6 million primarily due to the retirement of $28.0 aggregate principal amount of our senior notes for total consideration of $24.4 million in cash. Net cash used in financing in 2008 was $30.8 million due primarily to the special cash dividend payment to shareholders in August 2008.
Contractual Obligations
The following table presents our contractual obligations as of December 31, 2010 (in thousands):
| Debt Maturities |
Interest Payments |
Broadcast Rights |
Other Obligations |
Lease Obligations |
Total | |||||||||||||||||||
| 2011 |
$ | — | $ | 8,749 | $ | 5,501 | $ | 1,485 | $ | 1,439 | $ | 17,174 | ||||||||||||
| 2012 |
— | 8,749 | 11,301 | 375 | 1,020 | 21,445 | ||||||||||||||||||
| 2013 |
— | 8,749 | 9,834 | — | 818 | 19,401 | ||||||||||||||||||
| 2014 |
101,440 | 8,749 | 6,198 | — | 488 | 116,875 | ||||||||||||||||||
| 2015 |
— | — | 15 | — | 218 | 233 | ||||||||||||||||||
| Thereafter |
— | — | — | — | 587 | 587 | ||||||||||||||||||
| $ | 101,440 | $ | 34,996 | $ | 32,849 | $ | 1,860 | $ | 4,570 | $ | 175,715 | |||||||||||||
Commitments for broadcasting rights consist of future rights to broadcast television programming and future programming costs pursuant to network affiliate agreements. Other obligations represent rights to sell available advertising time on third party radio stations through 2012. This contractual obligation table does not include personal service contracts, as discussed below, or our obligation to pay South Sound up to approximately $1.4 million if we do not exercise the option to purchase the South Sound FM radio station licensed to Oakville, Washington.
In the ordinary course of our broadcasting business, we enter into personal services contracts (the “PSCs”) with many of our station-level employees. Our aggregate contractual obligation under such existing PSCs as of December 31, 2010 is approximately $14.2 million and have expirations ranging from 2011 through 2015.
We currently expect to fund these commitments primarily with operating cash flows generated in the normal course of business, as well as cash and cash equivalents. However, we may in the future be required to finance these commitments through the use of bank borrowings or the issuance of debt and/or equity securities.
Description of Indebtedness
As of December 31, 2010, we had $101.4 million aggregate principal amount of our senior notes outstanding. The senior notes are fully and unconditionally guaranteed, jointly and severally, on an unsecured, senior basis by our current and future material domestic subsidiaries. Interest on the senior notes is payable semiannually in arrears on March 15 and September 15 of each year. The maturity date for our senior notes is September 15, 2014.
The indenture governing our senior notes contains provisions that limit our ability to distribute proceeds from asset sales. In the event that we do not use the proceeds from asset sales for qualifying purposes (as specified in the indenture) within 360 days from the date of sale, we will be required to offer to repurchase outstanding senior notes at par value to the extent of such unused proceeds. Under the indenture, qualifying purposes include: (i) repayment of secured indebtedness; (ii) purchase of assets used or useful in our business; (iii) certain acquisitions of other companies; (iv) expenditures used or useful in our business; and (v) certain investments in our company or our subsidiaries. We were in compliance with all debt covenant requirements at December 31, 2010.
We are subject to various debt covenants and other restrictions under the indenture, including the requirement for early payments upon the occurrence of certain events, the violation of which could require repayment of the senior notes and affect our credit rating and access to other financing.
56
Recent Accounting Pronouncements
In June 2009, the Financial Accounting Standards Board (“FASB”) issued an update to authoritative guidance on consolidation. This update addresses the effects on certain provisions of previous accounting guidance related to the consolidation of variable interest entities as a result of the elimination of the qualifying special-purpose entity concept and concerns about the application of certain key provisions of consolidation guidance, including those in which the accounting and disclosures under the standard do not always provide timely and useful information about an enterprise’s involvement in a variable interest entity. This update was effective January 1, 2010. Based on the updated authoritative guidance discussed above, we determined it was appropriate to consolidate our investment in Southwest Oregon Broadcasting Corporation. We own 50% of the outstanding stock of Southwest Oregon Broadcasting Corporation, licensee of a television station in Roseburg, Oregon for which we serve as the manager. The consolidation of this equity investment did not have a significant impact on our consolidated financial statements.
| ITEM 7A. | QUANTITATIVE AND QUALITATIVE DISCLOSURES ABOUT MARKET RISKS |
The market risk in our consolidated financial instruments represents the potential loss arising from adverse changes in financial rates. We are currently exposed to market risk in the areas of interest rates. This exposure is directly related to our normal funding activities.
Interest Rate Exposure
The aggregate principal amount of our 8.625% senior notes due 2014 is at a fixed rate. The fair market value of long-term fixed interest rate debt is subject to interest rate risk. Generally, the fair market value of fixed interest rate debt will increase as interest rates fall and decrease as interest rates rise. As of December 31, 2010, our fixed-rate debt totaled $101.4 million. The estimated fair value of our long-term debt at December 31, 2010 was approximately $104.2 million, which was approximately $2.8 million more than its carrying value. Market risk is estimated as the potential change in fair value resulting from a hypothetical 10% change in interest rates and, as of December 31, 2010, amounted to approximately $2.7 million. Fair market values are determined based on market quotes by brokers. For fixed-rate debt, interest rate changes do not impact book value, operations, or cash flows.
| ITEM 8. | FINANCIAL STATEMENTS AND SUPPLEMENTARY DATA |
Our consolidated financial statement and related schedules listed in the index set forth in Item 15 in this report are filed as part of this report and are incorporated herein by reference.
Quarterly financial information for 2010 and 2009 is included in Note 20 to our consolidated financial statements and is incorporated herein by reference.
| ITEM 9. | CHANGES IN AND DISAGREEMENTS WITH ACCOUNTANTS ON ACCOUNTING AND FINANCIAL DISCLOSURE |
None
| ITEM 9A. | CONTROLS AND PROCEDURES |
Our management, with the participation of our Chief Executive Officer and Chief Financial Officer, has evaluated the effectiveness of our disclosure controls and procedures (as defined in Rules 13a-15(e) and 15d-15(e) of the Securities Exchange Act of 1934, as amended (the “Exchange Act”)) as of the end of our fiscal year ended December 31, 2010. Based on their evaluation, our Chief Executive Officer and Chief Financial Officer have concluded that, as of the end of our fiscal year ended December 31, 2010, our disclosure controls and procedures were effective in ensuring that the information required to be disclosed by us in the reports that
57
we file or submit under the Exchange Act is (i) recorded, processed, summarized and reported, within the time periods specified in the SEC’s rules and forms, and (ii) accumulated and communicated to our management, including our Chief Executive Officer and Chief Financial Officer, to allow timely decisions regarding required disclosure.
We made no change in our internal control over financial reporting during the fourth fiscal quarter of 2010 that materially affected, or is reasonably likely to materially affect, our internal control over financial reporting. We intend to continue to refine our internal control over financial reporting on an ongoing basis, as we deem appropriate with a view towards continuous improvement.
Management’s Report on Internal Control Over Financial Reporting
Fisher Communications, Inc.’s management is responsible for establishing and maintaining adequate internal control over financial reporting for the Company. We assessed the effectiveness of the Company’s internal control over financial reporting as of December 31, 2010. In making this assessment, we used the criteria set forth by the Committee of Sponsoring Organizations of the Treadway Commission (COSO) in Internal Control—Integrated Framework. Based on our assessment using those criteria, we determined that as of December 31, 2010, Fisher Communications, Inc.’s internal control over financial reporting was effective.
The effectiveness of the Company’s internal control over financial reporting as of December 31, 2010 has been audited by PricewaterhouseCoopers LLP, an independent registered public accounting firm, as stated in their report which appears elsewhere in this report.
Because of its inherent limitations, internal control over financial reporting may not prevent or detect misstatements. Also, projections of any evaluation of effectiveness to future periods are subject to the risk that controls may become inadequate because of changes in conditions, or that the degree of compliance with the policies or procedures may deteriorate.
| ITEM 9B. | OTHER INFORMATION |
None
58
PART III
| ITEM 10. | DIRECTORS, EXECUTIVE OFFICERS AND CORPORATE GOVERNANCE |
The information required by this Item will be contained in the sections entitled “Information With Respect to Nominees and Directors Whose Terms Continue,” “Executive Officers of the Company,” “Section 16(a) Beneficial Ownership Reporting Compliance,” and “Information Regarding the Board of Directors and its Committees—Committees of the Board of Directors—Audit Committee” of the definitive Proxy Statement for our Annual Meeting of Shareholders to be held on May 11, 2011, and is incorporated herein by reference.
We have a Code of Ethics applicable to our Chief Executive Officer, Chief Financial Officer, Controller, general managers, station managers and business managers. The Code of Ethics is available on our website at www.fsci.com under the section heading “Investor Information—Corporate Governance.” We intend to satisfy the disclosure requirement under Item 5.05 of Form 8-K regarding any amendments to or waivers of our Code of Ethics by posting such information at this location on our website.
| ITEM 11. | EXECUTIVE COMPENSATION |
The information required by this Item will be contained in the sections entitled “Compensation Discussion and Analysis,” “Compensation Committee Report,” “Summary Compensation Table,” “2010 Grants of Plan-Based Awards Table,” “2010 Outstanding Equity Awards at Fiscal-Year End Table,” “2010 Option Exercises and Stock Vested Table,” “Potential Payments upon Termination of Employment or Change of Control,” “Estimated Potential Cash Payments and Value of Acceleration Under Equity Compensation Plans,” “2010 Non-Employee Director Compensation” and “Information Regarding the Board of Directors and its Committees—Compensation Committee Interlocks and Insider Participation” of the definitive Proxy Statement for our Annual Meeting of Shareholders to be held on May 11, 2011, and is incorporated herein by reference.
| ITEM 12. | SECURITY OWNERSHIP OF CERTAIN BENEFICIAL OWNERS AND MANAGEMENT AND RELATED STOCKHOLDER MATTERS |
The information required by this Item will be contained in the sections entitled “Security Ownership of Certain Beneficial Owners and Management” and “Equity Compensation Plan Information” of the definitive Proxy Statement for our Annual Meeting of Shareholders to be held on May 11, 2011, and is incorporated herein by reference.
59
Securities authorized for issuance under equity compensation plans
The Company maintains three incentive plans: (i) the Amended and Restated Fisher Communications Incentive Plan of 1995 (the “1995 Plan”), (ii) the Fisher Communications Incentive Plan of 2001 (the “2001 Plan”) and (iii) the Fisher Communications Amended and Restated 2008 Equity Incentive Plan (the “2008 Plan” and together with the 1995 Plan and the 2001 Plan, the “Plans”). The 1995 Plan provided that up to 560,000 shares of the Company’s common stock could be issued to eligible key management employees pursuant to options and rights through 2002. As of December 31, 2010, options and rights for 96,172 shares, net of forfeitures, had been issued under the 1995 Plan. No further equity awards may be issued pursuant to the 1995 Plan. The 2001 Plan provided that up to 600,000 shares of the Company’s common stock could be issued to eligible key management employees or directors pursuant to awards, options and rights through April 2008. As of December 31, 2010, awards, options and rights for 344,497 shares, net of forfeitures, had been issued under the 2001 Plan. No further options and rights will be issued pursuant to the 2001 Plan. The 2008 Plan provides that up to 600,000 shares of the Company’s common stock may be issued to eligible key management employees or directors pursuant to awards, options and rights through 2018. As of December 31, 2010, awards, options and rights for 242,526 shares had been issued, net of forfeitures, from the 2008 Plan.
| Plan Category |
Number of securities to be issued upon exercise of outstanding options, warrants and rights |
Weighted average exercise price of outstanding options, warrants and rights |
Number of securities remaining available for future issuance under equity compensation plans |
|||||||||
| Equity compensation plans approved by security holders |
418,123 | (1) | $ | 22.24 | (2) | 357,474 | (3)(4) | |||||
| Equity compensation plans not approved by security holders |
— | — | — | |||||||||
| Total |
418,123 | (1) | $ | 22.24 | (2) | 357,474 | (3)(4) | |||||
| (1) | Includes 275,420 shares subject to outstanding stock options and 142,703 outstanding restricted stock rights under the 2001 Plan, the 1995 Plan and the 2008 Plan. |
| (2) | Includes restricted stock rights, which have no exercise price. The weighted-average exercise excluding the restricted stock rights is $33.76. |
| (3) | Represents shares available under the 2008 Plan. In addition to stock options, the 2008 Plan permits the granting of stock appreciation rights, stock awards, restricted stock, restricted stock rights, stock units, performance shares, performance units and other stock or cash-based awards. The type of awards and the number of shares of common stock subject to the awards granted under the 2008 Plan is in the discretion of the Compensation Committee of the Board of Directors, as administrator of the plan. |
| (4) | As of December 31, 2010, each non-employee director received 25% of his or her annual retainer in the form of a fully vested stock award under the 2008 Plan for the number of shares of the Company’s common stock determined by dividing the amount of cash compensation to be received in the form of a stock award by the fair market value of the Company’s common stock on the last trading day of each quarter. As of December 31, 2010, non-employee directors also were permitted to elect to receive all or any portion of their remaining annual retainer, committee chair retainer(s), Board of Directors meeting fees and committee meeting fees in the form of a fully vested stock award under the 2008 Plan. |
| ITEM 13. | CERTAIN RELATIONSHIPS AND RELATED TRANSACTIONS, AND DIRECTOR INDEPENDENCE |
The information required by this Item will be contained in the sections entitled “Transactions with Related Persons,” “Review, Approval or Ratification of Transactions with Related Persons,” “Information With Respect to Nominees and Directors Whose Terms Continue,” “Director Independence” and “Information Regarding the Board of Directors and its Committees” of the definitive Proxy Statement for our Annual Meeting of Shareholders to be held on May 11, 2011, and is incorporated herein by reference.
60
| ITEM 14. | PRINCIPAL ACCOUNTANT FEES AND SERVICES |
The information required by this Item will be contained in the sections entitled “Audit and Non-Audit Fees” and “Policy on Audit Committee Pre-Approval of Audit and Non-Audit Services of Independent Auditor” of the definitive Proxy Statement for our Annual Meeting of Shareholders to be held on May 11, 2011, and is incorporated herein by reference.
Important Additional Information
In connection with its 2011 Annual Meeting of Stockholders, the Company will file a proxy statement and other documents regarding the 2011 Annual Meeting with the Securities and Exchange Commission and will mail the definitive proxy statement and a proxy card to each shareholder of record entitled to vote at the 2011 Annual Meeting. SHAREHOLDERS ARE URGED TO READ THE PROXY STATEMENT AND ANY OTHER RELEVANT DOCUMENTS WHEN THEY BECOME AVAILABLE BECAUSE THEY WILL CONTAIN IMPORTANT INFORMATION. When they are available, the proxy statement and other documents relating to the 2011 Annual Meeting can be obtained free of charge from the SEC’s website at http://www.sec.gov. These documents can also be obtained free of charge from the Company at its website, www.fsci.com, under: Investor Information – SEC Filings.
The Company and its directors and executive officers may be deemed to be participants in the solicitation of proxies in connection with the 2011 Annual Meeting. INFORMATION REGARDING THE INTERESTS OF THE DIRECTORS AND EXECUTIVE OFFICERS IS SET FORTH HEREIN AND IN THE COMPANY’S PROXY STATEMENT RELATING TO ITS 2010 ANNUAL MEETING OF SHAREHOLDERS FILED BY THE COMPANY WITH THE SECURITIES AND EXCHANGE COMMISSION ON APRIL 7, 2010.
61
PART IV
| ITEM 15. | EXHIBITS AND FINANCIAL STATEMENT SCHEDULES |
| (a) (1) Consolidated | Financial Statements: |
| • | Report of Independent Registered Public Accounting Firm |
| • | Consolidated Statements of Operations |
| • | Consolidated Balance Sheets |
| • | Consolidated Statements of Stockholders’ Equity |
| • | Consolidated Statements of Cash Flows |
| • | Consolidated Statements of Comprehensive Income (Loss) |
| • | Notes to Consolidated Financial Statements |
| (2) Financial Statement Schedules: |
| • | Schedule II—Valuation and Qualifying Accounts |
All other schedules have been omitted because of the absence of the conditions under which they are required or because the information required is included in the consolidated financial statements or notes thereto.
| (3) Exhibits: See Exhibit Index. |
62
REPORT OF INDEPENDENT REGISTERED PUBLIC ACCOUNTING FIRM
To the Board of Directors and Stockholders
of Fisher Communications, Inc.
In our opinion, the consolidated financial statements listed in the accompanying index appearing under Item 15(a)(1) present fairly, in all material respects, the financial position of Fisher Communications, Inc. and its subsidiaries at December 31, 2010 and 2009, and the results of their operations and their cash flows for each of the three years in the period ended December 31, 2010 in conformity with accounting principles generally accepted in the United States of America. In addition, in our opinion, the financial statement schedule listed in the accompanying index presents fairly, in all material respects, the information set forth therein when read in conjunction with the related consolidated financial statements. Also in our opinion, the Company maintained, in all material respects, effective internal control over financial reporting as of December 31, 2010, based on criteria established in Internal Control—Integrated Framework issued by the Committee of Sponsoring Organizations of the Treadway Commission (COSO). The Company’s management is responsible for these financial statements and financial statement schedule, for maintaining effective internal control over financial reporting and for its assessment of the effectiveness of internal control over financial reporting, included in Management’s Report on Internal Controls over Financial Reporting appearing under Item 9A. Our responsibility is to express opinions on these financial statements, on the financial statement schedule, and on the Company’s internal control over financial reporting based on our integrated audits. We conducted our audits in accordance with the standards of the Public Company Accounting Oversight Board (United States). Those standards require that we plan and perform the audits to obtain reasonable assurance about whether the financial statements are free of material misstatement and whether effective internal control over financial reporting was maintained in all material respects. Our audits of the financial statements included examining, on a test basis, evidence supporting the amounts and disclosures in the financial statements, assessing the accounting principles used and significant estimates made by management, and evaluating the overall financial statement presentation. Our audit of internal control over financial reporting included obtaining an understanding of internal control over financial reporting, assessing the risk that a material weakness exists, and testing and evaluating the design and operating effectiveness of internal control based on the assessed risk. Our audits also included performing such other procedures as we considered necessary in the circumstances. We believe that our audits provide a reasonable basis for our opinions.
A company’s internal control over financial reporting is a process designed to provide reasonable assurance regarding the reliability of financial reporting and the preparation of financial statements for external purposes in accordance with generally accepted accounting principles. A company’s internal control over financial reporting includes those policies and procedures that (i) pertain to the maintenance of records that, in reasonable detail, accurately and fairly reflect the transactions and dispositions of the assets of the company; (ii) provide reasonable assurance that transactions are recorded as necessary to permit preparation of financial statements in accordance with generally accepted accounting principles, and that receipts and expenditures of the company are being made only in accordance with authorizations of management and directors of the company; and (iii) provide reasonable assurance regarding prevention or timely detection of unauthorized acquisition, use, or disposition of the company’s assets that could have a material effect on the financial statements.
Because of its inherent limitations, internal control over financial reporting may not prevent or detect misstatements. Also, projections of any evaluation of effectiveness to future periods are subject to the risk that controls may become inadequate because of changes in conditions, or that the degree of compliance with the policies or procedures may deteriorate.
/s/ PricewaterhouseCoopers LLP
Seattle, Washington
March 8, 2011
63
FISHER COMMUNICATIONS, INC. AND SUBSIDIARIES
CONSOLIDATED STATEMENTS OF OPERATIONS
| Year Ended December 31, | ||||||||||||
| (in thousands, except per-share amounts) | 2010 | 2009 | 2008 | |||||||||
| Revenue |
$ | 175,926 | $ | 133,664 | $ | 173,791 | ||||||
| Operating expenses |
||||||||||||
| Direct operating costs (exclusive of depreciation and amortization and amortization of program rights) |
70,929 | 65,111 | 69,810 | |||||||||
| Selling, general and administrative expenses |
58,624 | 51,170 | 65,859 | |||||||||
| Impairment of goodwill and intangible assets |
— | — | 76,742 | |||||||||
| Impairment of investment in equity investee |
— | — | 1,468 | |||||||||
| Amortization of program rights |
11,877 | 10,056 | 19,288 | |||||||||
| Depreciation and amortization |
14,448 | 13,713 | 12,703 | |||||||||
| Plaza fire expenses (reimbursements), net |
(3,363 | ) | 2,657 | — | ||||||||
| Gain on asset exchange, net |
(2,054 | ) | (2,569 | ) | — | |||||||
| Total operating expenses |
150,461 | 140,138 | 245,870 | |||||||||
| Income (loss) from operations |
25,465 | (6,474 | ) | (72,079 | ) | |||||||
| Gain (loss) on extinguishment of senior notes, net |
(160 | ) | 2,965 | — | ||||||||
| Other income, net |
217 | 1,288 | 156,570 | |||||||||
| Interest expense |
(9,954 | ) | (11,677 | ) | (13,928 | ) | ||||||
| Income (loss) before income taxes |
15,568 | (13,898 | ) | 70,563 | ||||||||
| Provision (benefit) for income taxes |
5,822 | (4,568 | ) | 24,833 | ||||||||
| Income (loss) from continuing operations |
9,746 | (9,330 | ) | 45,730 | ||||||||
| Income (loss) from discontinued operations, net of income taxes |
— | — | (1,072 | ) | ||||||||
| Net income (loss) |
$ | 9,746 | $ | (9,330 | ) | $ | 44,658 | |||||
| Net income (loss) per share: |
||||||||||||
| From continuing operations |
$ | 1.11 | $ | (1.06 | ) | $ | 5.23 | |||||
| From discontinued operations |
— | — | (0.12 | ) | ||||||||
| Net income (loss) per share |
$ | 1.11 | $ | (1.06 | ) | $ | 5.11 | |||||
| Net income (loss) per share assuming dilution: |
||||||||||||
| From continuing operations |
$ | 1.10 | $ | (1.06 | ) | $ | 5.23 | |||||
| From discontinued operations |
— | — | (0.12 | ) | ||||||||
| Net income (loss) per share |
$ | 1.10 | $ | (1.06 | ) | $ | 5.11 | |||||
| Weighted average shares outstanding |
8,796 | 8,776 | 8,732 | |||||||||
| Weighted average shares outstanding assuming dilution |
8,843 | 8,776 | 8,735 | |||||||||
| Dividends declared per share |
$ | — | $ | — | $ | 3.50 | ||||||
See accompanying notes to consolidated financial statements.
64
FISHER COMMUNICATIONS, INC. AND SUBSIDIARIES
CONSOLIDATED BALANCE SHEETS
| December 31, | ||||||||
| (in thousands, except share and per-share amounts) | 2010 | 2009 | ||||||
| ASSETS |
||||||||
| Current Assets |
||||||||
| Cash and cash equivalents |
$ | 52,945 | $ | 43,982 | ||||
| Receivables, net |
30,807 | 28,070 | ||||||
| Income taxes receivable |
1,353 | 11,746 | ||||||
| Deferred income taxes, net |
1,649 | 3,813 | ||||||
| Prepaid expenses and other |
2,863 | 4,460 | ||||||
| Cash surrender value of annuity contracts |
2,397 | 2,626 | ||||||
| Television broadcast rights |
7,855 | 7,919 | ||||||
| Total current assets |
99,869 | 102,616 | ||||||
| Cash surrender value of life insurance and annuity contracts |
16,499 | 15,711 | ||||||
| Goodwill, net |
13,293 | 13,293 | ||||||
| Intangible assets, net |
40,543 | 40,779 | ||||||
| Deferred financing fees and other |
7,376 | 7,590 | ||||||
| Deferred income taxes, net |
— | 2,297 | ||||||
| Property, plant and equipment, net |
143,312 | 148,824 | ||||||
| Total Assets |
$ | 320,892 | $ | 331,110 | ||||
| LIABILITIES AND STOCKHOLDERS’ EQUITY |
||||||||
| Current Liabilities |
||||||||
| Accounts payable |
$ | 4,044 | $ | 3,148 | ||||
| Accrued payroll and related benefits |
7,896 | 4,445 | ||||||
| Interest payable |
2,552 | 3,158 | ||||||
| Television broadcast rights payable |
7,849 | 7,987 | ||||||
| Current portion of accrued retirement benefits |
1,117 | 1,100 | ||||||
| Other current liabilities |
4,388 | 6,251 | ||||||
| Total current liabilities |
27,846 | 26,089 | ||||||
| Long-term debt |
101,440 | 122,050 | ||||||
| Accrued retirement benefits |
18,982 | 18,023 | ||||||
| Deferred income taxes, net |
417 | — | ||||||
| Other liabilities |
6,981 | 9,476 | ||||||
| Total liabilities |
155,666 | 175,638 | ||||||
| Commitments and Contingencies (Note 14) |
— | — | ||||||
| Stockholders’ Equity |
||||||||
| Common stock, shares authorized 12,000,000, $1.25 par value; 8,790,399 and 8,762,383 issued and outstanding at December 31, 2010 and December 31, 2009, respectively |
10,988 | 10,953 | ||||||
| Capital in excess of par |
13,273 | 12,086 | ||||||
| Accumulated other comprehensive income (loss), net of income taxes: |
||||||||
| Accumulated loss |
(2,176 | ) | (1,525 | ) | ||||
| Prior service cost |
(100 | ) | (139 | ) | ||||
| Retained earnings |
143,241 | 134,097 | ||||||
| Total Stockholders’ Equity |
165,226 | 155,472 | ||||||
| Total Liabilities and Stockholders’ Equity |
$ | 320,892 | $ | 331,110 | ||||
See accompanying notes to consolidated financial statements.
65
FISHER COMMUNICATIONS, INC. AND SUBSIDIARIES
CONSOLIDATED STATEMENTS OF STOCKHOLDERS’ EQUITY
| Common Stock | Capital in Excess of Par |
Accumulated Other Comprehensive Income (Loss) |
Retained Earnings |
Total Stockholders’ Equity |
||||||||||||||||||||
| (in thousands, except share amounts) | Shares | Amount | ||||||||||||||||||||||
| Balances, December 31, 2007 |
8,725,516 | $ | 10,907 | $ | 10,220 | $ | 80,679 | $ | 129,455 | $ | 231,261 | |||||||||||||
| Net income |
— | — | — | — | 44,658 | 44,658 | ||||||||||||||||||
| Cash dividends paid |
— | — | — | — | (30,686 | ) | (30,686 | ) | ||||||||||||||||
| Other comprehensive loss |
— | — | — | (83,560 | ) | — | (83,560 | ) | ||||||||||||||||
| Stock-based compensation |
— | — | 918 | — | — | 918 | ||||||||||||||||||
| Issuance of common stock under awards, rights and options and related tax benefit |
11,765 | 15 | 2 | — | — | 17 | ||||||||||||||||||
| Balances, December 31, 2008 |
8,737,281 | 10,922 | 11,140 | (2,881 | ) | 143,427 | 162,608 | |||||||||||||||||
| Net loss |
— | — | — | — | (9,330 | ) | (9,330 | ) | ||||||||||||||||
| Other comprehensive income |
— | — | — | 1,217 | — | 1,217 | ||||||||||||||||||
| Stock-based compensation |
— | — | 1,015 | — | — | 1,015 | ||||||||||||||||||
| Issuance of common stock under awards, rights and options and related tax benefit |
25,102 | 31 | (69 | ) | — | — | (38 | ) | ||||||||||||||||
| Balances, December 31, 2009 |
8,762,383 | 10,953 | 12,086 | (1,664 | ) | 134,097 | 155,472 | |||||||||||||||||
| Cumulative adjustment due to consolidation of equity investee, net of taxes |
— | — | — | — | (602 | ) | (602 | ) | ||||||||||||||||
| Net income |
— | — | — | — | 9,746 | 9,746 | ||||||||||||||||||
| Other comprehensive loss |
— | — | — | (612 | ) | — | (612 | ) | ||||||||||||||||
| Stock-based compensation |
— | — | 1,342 | — | — | 1,342 | ||||||||||||||||||
| Issuance of common stock under awards, rights and options and related tax benefit |
28,016 | 35 | (155 | ) | — | — | (120 | ) | ||||||||||||||||
| Balances, December 31, 2010 |
8,790,399 | $ | 10,988 | $ | 13,273 | $ | (2,276 | ) | $ | 143,241 | $ | 165,226 | ||||||||||||
See accompanying notes to consolidated financial statements.
66
FISHER COMMUNICATIONS, INC. AND SUBSIDIARIES
CONSOLIDATED STATEMENTS OF CASH FLOWS
| (in thousands) |
Year Ended December 31, | |||||||||||
| 2010 | 2009 | 2008 | ||||||||||
| Operating activities |
||||||||||||
| Net income (loss) |
$ | 9,746 | $ | (9,330 | ) | $ | 44,658 | |||||
| Adjustments to reconcile net income (loss) to net cash provided by (used in) operating activities |
||||||||||||
| Depreciation and amortization |
14,448 | 13,713 | 12,786 | |||||||||
| Deferred income taxes |
4,933 | 7,190 | (15,318 | ) | ||||||||
| Amortization of deferred financing fees |
407 | 469 | 782 | |||||||||
| Amortization of program rights |
11,877 | 10,056 | 19,288 | |||||||||
| Payments for broadcast rights |
(11,963 | ) | (10,038 | ) | (18,154 | ) | ||||||
| Gain on exchange of assets, net |
(2,054 | ) | (2,569 | ) | — | |||||||
| (Gain) loss on extinguishment of senior notes, net |
160 | (2,965 | ) | — | ||||||||
| Gain on sale of marketable securities |
— | — | (152,610 | ) | ||||||||
| Loss on disposal of fixed assets destroyed in Plaza fire |
— | 1,482 | — | |||||||||
| Loss on disposal of fixed assets, net |
284 | 558 | — | |||||||||
| Impairment of goodwill and intangible assets |
— | — | 76,742 | |||||||||
| Impairment of investment in equity investee |
— | — | 1,468 | |||||||||
| Net non-cash contract termination fee |
— | — | 4,990 | |||||||||
| Amortization of non-cash contract termination fee |
(1,461 | ) | (1,461 | ) | (1,264 | ) | ||||||
| Amortization of short-term investment discount |
— | (303 | ) | (789 | ) | |||||||
| Loss in operations of equity investees |
86 | 133 | (134 | ) | ||||||||
| Stock-based compensation |
1,342 | 1,015 | 918 | |||||||||
| Other |
— | 205 | (179 | ) | ||||||||
| Change in operating assets and liabilities, net |
||||||||||||
| Receivables |
(2,964 | ) | (2,026 | ) | 4,399 | |||||||
| Prepaid expenses and other |
2,023 | (2,260 | ) | 1,481 | ||||||||
| Cash surrender value of life insurance and annuity contracts |
(962 | ) | (912 | ) | (616 | ) | ||||||
| Other assets |
(48 | ) | (19 | ) | 698 | |||||||
| Accounts payable, accrued payroll and related benefits and other current liabilities |
4,170 | (2,259 | ) | (1,921 | ) | |||||||
| Interest payable |
(606 | ) | (615 | ) | — | |||||||
| Income taxes receivable and payable |
10,571 | (8,983 | ) | (6,722 | ) | |||||||
| Accrued retirement benefits |
365 | (511 | ) | 911 | ||||||||
| Other liabilities |
(686 | ) | (759 | ) | (643 | ) | ||||||
| Net cash provided by (used in) operating activities |
39,668 | (10,189 | ) | (29,229 | ) | |||||||
| Investing activities |
||||||||||||
| Purchase of marketable securities |
— | — | (104 | ) | ||||||||
| Proceeds from sale of marketable securities and short-term investments |
— | 60,000 | 153,513 | |||||||||
| Purchase of short-term investments |
— | — | (58,909 | ) | ||||||||
| Restricted cash |
— | — | 52,365 | |||||||||
| Investment in equity investee |
(48 | ) | — | — | ||||||||
| Net cash in consolidation of equity investee |
75 | — | — | |||||||||
| Purchase of television stations |
— | — | (52,365 | ) | ||||||||
| Proceeds from sale of online news service |
— | — | 1,460 | |||||||||
| Purchase of intangible assets |
— | — | (285 | ) | ||||||||
| Purchase of investment in DataSphere |
— | (1,500 | ) | — | ||||||||
| Purchase of property, plant and equipment |
(9,990 | ) | (11,581 | ) | (10,291 | ) | ||||||
| Net cash provided by (used in) investing activities |
(9,963 | ) | 46,919 | 85,384 | ||||||||
| Financing activities |
||||||||||||
| Borrowings under borrowing agreements |
— | — | 21,000 | |||||||||
| Payments on borrowing agreements |
— | — | (21,000 | ) | ||||||||
| Repurchase of senior notes |
(20,453 | ) | (24,428 | ) | — | |||||||
| Shares settled upon vesting of stock rights |
(121 | ) | — | — | ||||||||
| Payment of capital lease obligations |
(168 | ) | (155 | ) | (144 | ) | ||||||
| Cash dividends paid |
— | — | (30,686 | ) | ||||||||
| Net cash used in financing activities |
(20,742 | ) | (24,583 | ) | (30,830 | ) | ||||||
| Net increase in cash and cash equivalents |
8,963 | 12,147 | 25,325 | |||||||||
| Cash and cash equivalents, beginning of period |
43,982 | 31,835 | 6,510 | |||||||||
| Cash and cash equivalents, end of period |
$ | 52,945 | $ | 43,982 | $ | 31,835 | ||||||
| Supplemental disclosures: |
||||||||||||
| Cash paid (received) for income taxes, net |
$ | (10,013 | ) | $ | (2,173 | ) | $ | 45,978 | ||||
| Cash paid for interest |
$ | 10,089 | $ | 11,716 | $ | 13,281 | ||||||
See accompanying notes to consolidated financial statements.
67
FISHER COMMUNICATIONS, INC. AND SUBSIDIARIES
CONSOLIDATED STATEMENTS OF COMPREHENSIVE INCOME (LOSS)
| (in thousands) | Year Ended December 31, | |||||||||||
| 2010 | 2009 | 2008 | ||||||||||
| Net income (loss) |
$ | 9,746 | $ | (9,330 | ) | $ | 44,658 | |||||
| Other comprehensive income (loss): |
||||||||||||
| Unrealized loss on marketable securities |
— | 242 | 24,953 | |||||||||
| Effect of income taxes |
— | (85 | ) | (8,733 | ) | |||||||
| Accumulated income (loss) |
(1,001 | ) | 1,569 | (903 | ) | |||||||
| Effect of income taxes |
350 | (548 | ) | 316 | ||||||||
| Prior service cost |
60 | 60 | 4 | |||||||||
| Effect of income taxes |
(21 | ) | (21 | ) | (1 | ) | ||||||
| Reclassification adjustment for gains included in net income (loss) |
— | — | (152,610 | ) | ||||||||
| Effect of income taxes |
— | — | 53,414 | |||||||||
| Other comprehensive income (loss) |
(612 | ) | 1,217 | (83,560 | ) | |||||||
| Comprehensive income (loss) |
$ | 9,134 | $ | (8,113 | ) | $ | (38,902 | ) | ||||
See accompanying notes to consolidated financial statements.
68
FISHER COMMUNICATIONS, INC. AND SUBSIDIARIES
NOTES TO CONSOLIDATED FINANCIAL STATEMENTS
NOTE 1
Operations and Significant Accounting Policies
The principal operations of Fisher Communications, Inc. and subsidiaries (the “Company”) are television and radio broadcasting. The Company also owns and operates Fisher Plaza, a mixed-use facility that houses a variety of office, retail, technology and other media and communications companies. The Company conducts its business in Washington, Oregon, Idaho, California and Montana. A summary of significant accounting policies is as follows:
Principles of consolidation. The consolidated financial statements are presented on an accrual basis in accordance with accounting principles generally accepted in the United States of America (“GAAP”) and include the accounts of Fisher Communications, Inc. and its wholly-owned subsidiaries. Television and radio broadcasting operations are conducted through Fisher Broadcasting Company. Fisher Media Services Company operates Fisher Plaza. All material intercompany balances and transactions have been eliminated.
Revisions. During the fourth quarter of 2009, the Company determined that correcting adjustments were necessary to recognize deferred tax liabilities associated with appreciation on the Company’s investments in annuity contracts.
The Company is the owner and beneficiary of annuity contracts that were entered into prior to 1986 and that are presented on the balance sheet in the consolidated financial statements. Increases in the fair value of these annuity contracts have been recognized into the consolidated statements of operations in each reporting period. For income tax purposes, the increases in the fair value of these annuity contracts are deferred and taxable upon the settlement of the related annuity contracts.
The Company had not recognized the deferred income tax expense and a related deferred tax liability for the appreciation in the fair value of the annuity contracts. The Company assessed the materiality of this correcting adjustment for the periods from the date of the original investments in the annuity contracts through December 31, 2008 and each of the quarterly reporting periods during the years ended December 31, 2007, 2008 and 2009, in accordance with the SEC’s Staff Accounting Bulletin (“SAB”) No. 99 and concluded that the correcting adjustment was not material to any individual reporting periods. The Company also concluded that the impact of correcting the related accounts was not material. Accordingly, January 1, 2007 opening retained earnings was adjusted by $2.1 million to reflect the increase in the deferred tax liability for the earlier years. The adjustment related to the 2009 quarters of $42,000 was recorded in the fourth quarter of 2009.
Estimates. The preparation of these consolidated financial statements requires management to make estimates and judgments that affect the reported amounts of assets, liabilities, revenues and expenses and related disclosure of contingent assets and liabilities. On an on-going basis, the Company evaluates its estimates including, but not limited to, those affecting revenues, goodwill and intangibles impairment, the estimated useful lives of tangible and intangible assets, valuation allowances for receivables and broadcast rights, stock-based compensation expense, valuation allowances for deferred income taxes and accruals of liabilities and contingencies. The Company bases its estimates on historical experience and various other assumptions that it believes to be reasonable under the circumstances, the results of which form its basis for making judgments about the carrying values of assets and liabilities that are not readily apparent from other sources. Actual results may differ from these estimates.
Television and radio broadcast licenses. The Company’s broadcast operations are subject to the jurisdiction of the Federal Communications Commission (the “FCC”) under the Communications Act of 1934, as
69
amended (the “Communications Act”). The Communications Act empowers the FCC to regulate many aspects of the broadcasting industry, including the granting and renewal of broadcast licenses. The cost of certain acquired indefinite-lived television licenses is included in intangible assets in the consolidated balance sheets.
Revenue recognition. Television and radio revenue is recognized, net of advertising agency commissions, when the advertisement is broadcast, subject to meeting certain conditions such as persuasive evidence that an arrangement exists, the price is fixed or determinable and collection is reasonably assured. These criteria are generally met at the time an advertisement is broadcast, and the revenue is recorded net of advertising agency commission. The Company may trade certain advertising time for products or services, as well as barter advertising time for program material. Trade transactions are generally reported at the estimated fair value of the product or service received, while barter transactions are reported at management’s estimate of the value of the advertising time exchanged, which approximates the fair value of the program material received. Revenue is reported on trade and barter transactions when commercials are broadcast; and expenses are reported when products or services are utilized or when programming airs. The Company receives consideration from certain satellite, cable and wireless providers in return for consent to the retransmission of the signals of the Company’s television stations. Revenue from production of broadcast media content is recognized when a contracted production is available for distribution. Revenues from retransmission consent and satellite transmission services are recognized when the service is performed. Website advertising revenue is recognized as services are delivered. Rentals from real estate leases are recognized on a straight-line basis over the term of the lease, while revenue from related service fees is recognized when the services are delivered.
Termination of national advertising representation firms. Broadcasters may periodically terminate existing agreements with national advertising representation firms; under such circumstances, the successor firm generally satisfies the broadcaster’s contractual termination obligation to the predecessor firm with no cash payment made by the broadcaster. When the Company terminates national advertising representation agreements with contractual termination penalties, the Company recognizes a non-cash termination charge to selling, general and administrative expenses and amortizes the resulting liability as a reduction of expense over the term of the new agreement. In the second quarter of 2008, the Company recognized a net non-cash termination charge of $5.0 million and will recognize a non-cash benefit over the five year term of the new agreement.
Cash and cash equivalents. The Company considers all highly liquid investments that have maturities at the date of purchase of 90 days or less to be cash equivalents. The Company’s cash equivalents comprise primarily of money market funds.
Marketable securities. Marketable securities consisted primarily of shares of Safeco Corporation common stock, valued at the closing per-share sale price on the specific-identification basis as reported on the New York Stock Exchange and investments held under deferred compensation arrangements. The Company sold all of its remaining shares of Safeco Corporation common stock in 2008 (see Note 3). The Company classified its investments in marketable securities as available-for-sale and those investments were reported at fair market value. Unrealized gains and losses are a separate component of stockholders’ equity, net of any related income tax effect. Dividends received of approximately $2.1 million are included in other income, net during the year ended December 31, 2008.
Concentration of credit risk. Financial instruments that potentially subject the Company to concentration of credit risk are primarily cash and cash equivalents and receivables. The Company maintains its cash and cash equivalents in accounts primarily with one major financial institution, in the form of demand deposits, money market funds and other cash and cash equivalents. Deposits in these institutions may exceed the amounts of federal insurance provided on such deposits. Concentration of credit risk with respect to receivables is limited due to the large number of customers in the Company’s customer base and their dispersion across different industries and geographic areas. The Company does not generally require collateral or other security for its receivables.
70
Television and radio broadcast rights. Television and radio broadcast rights are recorded as assets when the license period begins and the programs are available for broadcast, at the gross amount of the related obligations (or, for non-sports first-run programming, at the amount of the annual obligation). Costs incurred in connection with the purchase of programs to be broadcast within one year are classified as current assets, while costs of those programs to be broadcast after one year are considered non-current. These programming costs are charged to operations over their estimated broadcast periods using either the straight-line method or in proportion to estimated revenue of the related program. Television and radio broadcast rights obligations are classified as current or non-current in accordance with the payment terms of the license agreement.
Investments in equity investees. Investments in equity investees represent investments in entities for which the Company does not have controlling interest, but has significant influence. Such investments are accounted for using the equity method of accounting. An impairment on the investment in equity investee is recognized if the decline in value is other than temporary.
Goodwill and indefinite-lived intangible assets. Goodwill represents the excess of purchase price of certain media properties over the fair value of acquired tangible and identifiable intangible net assets. Indefinite-lived intangible assets consist of certain television licenses. In making estimates of fair values for the purposes of allocating the purchase price, the Company relies primarily on its extensive knowledge of the market and, if considered appropriate, obtains appraisals from appraisers. In estimating the fair value of the tangible and intangible assets acquired, the Company considers information obtained about each property as a result of pre-acquisition due diligence, including appraisals that may be obtained in connection with the acquisition or financing of the respective assets. The Company tests for the potential impairment of goodwill and indefinite-lived intangible assets at least annually, or whenever events indicate that an impairment may exist.
The goodwill impairment test involves a comparison of the fair value of each of the Company’s reporting units with the carrying amounts of net assets, including goodwill, related to each reporting unit. If the carrying amount exceeds a reporting unit’s fair value, the second step of the impairment test is performed to measure the amount of impairment loss, if any. The impairment loss is measured based on the amount by which the carrying amount of goodwill exceeds the implied fair value of goodwill in the reporting unit being tested. Fair values are determined based on valuations that rely primarily on the discounted cash flow method and market multiples of current earnings. This method uses future projections of cash flows from each of the Company’s reporting units and includes, among other estimates, projections of future advertising revenue and operating expenses, market supply and demand, projected capital spending and an assumption of the Company’s weighted average cost of capital. The Company’s indefinite-lived assets (broadcast licenses), which are not subject to amortization, are tested for impairment at least annually by applying a fair-value-based test as required. The Company’s evaluations of fair values include analyses based on the estimated future cash flows generated by the underlying assets, estimated trends and other relevant determinants of fair value for these assets. If the fair value of the asset is less than its carrying amount, a loss is recognized for the difference between the fair value and its carrying value. Changes in any of these estimates, projections and assumptions could have a material effect on the fair value of these assets in future measurement periods and result in an impairment of goodwill or indefinite-lived intangibles which could materially affect the Company’s results of operations.
Property, plant and equipment, net. Property, plant and equipment are stated at historical cost, net of related accumulated depreciation. Gains or losses on dispositions of property, plant and equipment are included in operating income, or in discontinued operations, based on the nature of the disposition. Replacements and improvements are capitalized and repairs and maintenance are expensed as incurred.
Real estate taxes, interest expense and certain other costs related to real estate projects constructed for lease to third parties are capitalized as a cost of such projects until the project, including major tenant improvements, is substantially completed. A project is considered to be substantially completed when a predetermined occupancy level has been reached or the project has been available for occupancy for a period of one year. Costs, including depreciation, applicable to a project are charged to expense based on the ratio of occupied space to total rentable space until the project is substantially completed, after which such costs are expensed as incurred.
71
Depreciation of property, plant and equipment is determined using the straight-line method over the estimated useful lives of the assets as follows:
| Buildings and improvements |
10–55 years | |||
| Machinery and equipment |
3–25 years | |||
| Land improvements |
10–30 years |
In 2011, as part of its ongoing review of property, plant and equipment asset lives the Company determined that the asset lives of certain of its machinery and equipment categories should be increased, the increase in the lives ranged from one to ten years depending on the category. A change in depreciation method is considered a change in accounting estimate and the Company will adjust the remaining lives of existing assets effective January 1, 2011 and as a result the Company expects that future depreciation will be lower than in the prior periods.
The Company classifies the net carrying values of stations as held for sale when the stations are actively marketed, their sale is considered probable within one year and various other criteria relating to their disposition are met. The Company discontinues depreciation of the stations at that time, but continues to recognize operating revenues and expenses until the date of sale. The Company reports revenues and expenses of stations classified as held for sale in discontinued operations for all periods presented if the Company will sell or has sold the stations on terms where the Company has no continuing involvement with them after the sale. If active marketing ceases or the stations no longer meet the criteria to be classified as held for sale, the Company reclassifies the stations as held for use, resumes depreciation and recognizes the expense for the period that the Company classified the properties as held for sale. The Company evaluates the recoverability of the carrying amount of long-lived tangible assets whenever events or changes in circumstances indicate that the carrying amount of an asset may not be fully recoverable. The Company uses judgment when applying the impairment rules to determine when an impairment test is necessary. Factors considered which could trigger an impairment review include significant underperformance relative to historical or forecasted operating results, a significant decrease in the market value of an asset, a significant change in the extent or manner in which an asset is used and significant negative cash flows or industry trends.
Impairment losses are measured as the amount by which the carrying value of an asset exceeds its estimated fair value, which is primarily based on market transactions for comparable businesses, discounted cash flows and a review of the underlying assets of the reporting unit. In estimating these future cash flows, the Company uses future projections of cash flows directly associated with, and that are expected to arise as a direct result of, the use and eventual disposition of the assets. These projections contain estimates and judgments that are significant and subjective. If it is determined that a long-lived asset is not recoverable, an impairment loss is calculated based on the excess of the carrying amount of the long-lived asset over its fair value. Changes in any of the Company’s estimates could have a material effect on the estimated future cash flows expected to be generated by the asset and could result in a future impairment of the related assets with a material effect on the Company’s future results of operations.
Fair value of financial instruments. The carrying amount of cash and cash equivalents, receivables, marketable securities, accounts payable and television and radio broadcast rights asset and payable approximate fair value due to their short maturities.
The estimated fair value of the Company’s long-term debt at December 31, 2010 and 2009 was $104.2 million and $117.2 million, respectively. The fair value of long-term debt is based on estimates made by investment bankers based on the fair value of the Company’s fixed rate long-term debt.
The FASB issued authoritative guidance for fair value measurements in September 2006, which defined fair value, established a framework for measuring fair value and expanded disclosures about assets and liabilities measured at fair value in the financial statements. In February 2008, the FASB issued authoritative guidance,
72
which allowed for the delay of the effective date of the authoritative guidance for fair value measurements for one year for all nonfinancial assets and liabilities, except those that are recognized or disclosed at fair value in the financial statements on a recurring basis. These include goodwill and other non-amortizable intangible assets. The adoption during the first quarter of 2009 did not have a significant impact on the Company’s consolidated financial statements. Fair value is defined as the exchange price that would be received for an asset or paid to transfer a liability (an exit price) in the principal or most advantageous market for the asset or liability in an orderly transaction between market participants on the measurement date. A three-tier hierarchy, which prioritizes the inputs used to measure fair value is as follows:
Level 1—Quoted prices in active markets for identical assets or liabilities.
Level 2—Observable inputs other than Level 1 prices such as quoted prices for similar assets or liabilities; quoted prices in markets that are not active; or other inputs that are observable or can be corroborated by observable market data for substantially the full term of the assets or liabilities.
Level 3—Unobservable inputs that are supported by little or no market activity and that are significant to the fair value of the assets or liabilities.
Assets and liabilities measured at fair value on a recurring basis consist of marketable securities, for which the reported fair value of approximately $1.0 million and $1.1 million at December 31, 2010 and 2009, respectively, is measured using Level 1 inputs.
Deferred financing costs. The Company capitalizes costs associated with financing activities and amortizes such costs to interest expense using the effective interest method over the term of the underlying financing arrangements. Such costs associated with the senior notes issued in 2004 are amortized over the ten year life of the senior notes.
Variable interest entities. The Company may enter into Joint Sales Agreements (“JSAs”) or Local Marketing Agreements (“LMAs”) with non-owned stations. Under the terms of these agreements, the Company makes specific periodic payments to the station’s owner-operator in exchange for the right to provide programming and/or sell advertising on a portion of the station’s broadcast time. Nevertheless, the owner-operator retains control and responsibility for the operation of the station, including responsibility over all programming broadcast on the station. Generally, the Company continues to operate the station under the agreement until the termination of such agreement. As a result of these agreements, the Company may determine that the station is a Variable Interest Entity (“VIE”) and that the Company is the primary beneficiary of the variable interest. This typically occurs if the Company has an agreement to acquire a station and the conditions to close are considered to be perfunctory. The Company also may determine that a station is a VIE in connection with other types of local service agreements entered into with stations in markets in which the Company owns and operates a station.
Advertising. The Company expenses advertising costs at the time the advertising first takes place. Advertising expense totaled approximately $2.4 million, $2.0 million and $3.1 million in 2010, 2009 and 2008, respectively.
Operating leases. The Company has operating leases for television and radio transmitting facilities, tower locations, administrative offices and certain other operational and administrative equipment. The television and radio transmitting facilities lease agreements are for periods up to 30 years, with certain renewal options. The Company recognizes lease expense on a straight-line basis when cash payments fluctuate over the term of the lease.
Capital leases. For equipment under capital lease arrangements, an asset is recorded based on the net present value of the lease payments, which may not exceed the fair value of the underlying leased equipment, and a corresponding long-term liability is recorded. Lease payments are allocated between principal and interest on the lease obligation and the capital lease asset is depreciated over the term of the related lease.
73
Income taxes. Deferred income taxes are provided for temporary differences in reporting for financial reporting versus income tax reporting purposes. The Company evaluates both positive and negative evidence that it believes is relevant in assessing whether the Company will realize its deferred tax assets. The determination of the Company’s provision for income taxes and valuation allowance requires significant judgment, the use of estimates and the interpretation and application of complex tax laws. In assessing whether deferred tax assets can be realized, the Company considers whether it is more likely than not that some portion or all of the deferred tax assets will be realized.
The Company assesses the likelihood of the realizability of its deferred tax assets on a quarterly basis. Due to the uncertainty of the Company’s ability to generate state taxable income, a full valuation allowance has been established on the Company’s state deferred tax assets consistent with prior years. At December 31, 2010, the Company has not recorded a valuation allowance on its federal deferred tax assets as management believes that it is more likely than not that the Company’s federal deferred tax assets are realizable. The amount of net deferred tax assets considered realizable, however, could be reduced in the future if the Company’s projections of future taxable income are reduced or if the Company does not perform at the levels that it is projecting. This could result in an increase in the Company’s valuation allowance for federal deferred tax assets.
The Company recognizes tax expense related to uncertain tax positions as part of its income tax provision and recognizes interest and penalties related to uncertain tax positions in interest expense. The uncertain tax position must reach a certain recognition threshold that a tax position is required to meet before being recognized in the financial statements. The application of income tax law is inherently complex. Laws and regulations in this area are voluminous and are sometimes ambiguous. As such, the Company is required to make certain subjective assumptions and judgments regarding its income tax exposures. Interpretations of and guidance surrounding income tax laws and regulations change over time. As such, changes in the Company’s subjective assumptions and judgments can materially affect amounts recognized in the consolidated financial statements.
Net income (loss) per share. Net income (loss) per share represents net income (loss) divided by the weighted average number of shares outstanding during the year. Net income (loss) per share assuming dilution represents net income (loss) divided by the weighted average number of shares outstanding, including the potentially dilutive impact of stock options and restricted stock rights issued under the Company’s incentive plans. Common stock options and restricted stock rights are converted using the treasury stock method.
A reconciliation of net income (loss) per share and net income (loss) per share assuming dilution is as follows (in thousands, except per share amounts):
| Year Ended December 31, | ||||||||||||
| 2010 | 2009 | 2008 | ||||||||||
| Net income (loss) |
$ | 9,746 | $ | (9,330 | ) | $ | 44,658 | |||||
| Weighted average shares outstanding—basic |
8,796 | 8,776 | 8,732 | |||||||||
| Weighted effect of dilutive options and rights |
47 | — | 3 | |||||||||
| Weighted average shares outstanding assuming dilution |
8,843 | 8,776 | 8,735 | |||||||||
| Net income (loss) per share applicable to common shareholders—basic |
$ | 1.11 | $ | (1.06 | ) | $ | 5.11 | |||||
| Net income (loss) per share applicable to common shareholders assuming dilution |
$ | 1.10 | $ | (1.06 | ) | $ | 5.11 | |||||
The effect of 129,391 restricted stock rights and options to purchase 275,420 shares of the Company’s common stock are excluded from the calculation of weighted average shares outstanding for the year ended December 31, 2010 because such options and rights were anti-dilutive. The effect of 74,708 restricted stock rights and options to purchase 254,021 shares of the Company’s common stock are excluded from the calculation of weighted average shares outstanding for the year ended December 31, 2009 because such options and rights
74
were anti-dilutive. The effect of 12,528 restricted stock rights and options to purchase 249,757 shares of the Company’s common stock are excluded from the calculation of weighted average shares outstanding for the year ended December 31, 2008 because such options and rights were anti-dilutive.
Stock-based compensation The Company uses the Black-Scholes option pricing model to estimate the fair value of stock option awards. The Company’s estimation of the fair value of stock option awards on the date of grant is affected by the Company’s stock price, as well as assumptions regarding a number of variables. These variables include, but are not limited to, the expected term of the award, expected stock price volatility over the term of the award, forfeitures and projected exercise behaviors. The Company’s estimation of the fair value of stock option awards using the Black-Scholes option pricing model requires the input of subjective assumptions and other reasonable assumptions could yield differing results.
Recent accounting pronouncements
In June 2009, the Financial Accounting Standards Board (“FASB”) issued an update to authoritative guidance on consolidation. This update addresses the effects on certain provisions of previous accounting guidance related to the consolidation of variable interest entities as a result of the elimination of the qualifying special-purpose entity concept and concerns about the application of certain key provisions of consolidation guidance, including those in which the accounting and disclosures under the standard do not always provide timely and useful information about an enterprise’s involvement in a variable interest entity. This update was effective January 1, 2010. Based on the updated authoritative guidance discussed above, the Company determined that it was appropriate to consolidate its investment in Southwest Oregon Broadcasting Corporation. The Company owns 50% of the outstanding stock of Southwest Oregon Broadcasting Corporation, licensee of a television station in Roseburg, Oregon for which the Company serves as the manager. The consolidation of this equity investment did not have a significant impact on the Company’s consolidated financial statements. As of January 1, 2010 the impact of this consolidation was a $602,000 charge to beginning retained earnings.
NOTE 2
Discontinued Operations
On October 31, 2006, the Company completed the sale of 18 small market radio stations located in Montana and Eastern Washington for $26.1 million. The Company received $24.4 million in cash, and $1.6 million was placed in escrow with respect to certain standard representations and warranties made by the Company. In 2006, the Company included the escrowed amount in the calculation of the gain on sale of the radio stations due to the Company’s assessment that no liabilities would arise under the indemnification provisions of the agreement. In 2008, the Company recorded a charge of $263,000 ($171,000 net of tax) for the settlement amount rendered upon final resolution of claims made by the buyer against the escrow amount, which is included in loss from discontinued operations. Of the $24.4 million in cash received, $18.0 million was deposited directly with a Qualified Intermediary (“QI”) in order to facilitate a tax deferred exchange under Internal Revenue Code Section 1031. The sale of one additional Montana station to the same buyer closed on June 1, 2007 for $3.0 million.
On December 31, 2008, the Company sold Pegasus News, Inc. (“Pegasus”) for net proceeds of $1.46 million. The buyer paid Fisher Broadcasting $1.5 million in cash and granted the Company and its affiliates a royalty-free, non-exclusive, non-transferable license to use certain related technology in its existing television and radio markets to deliver personalized online local news, information and advertising. The Company reported the results of operations of Pegasus as discontinued operations in the accompanying consolidated statement of operations. The operations of Pegasus were included in the Company’s television segment.
75
Operational data for Pegasus included in discontinued operations is summarized as follows (in thousands):
| Year Ended December 31, 2008 |
||||
| Revenue |
$ | 216 | ||
| Loss from discontinued operations: |
||||
| Discontinued operating activities |
(1,351 | ) | ||
| Loss on sale |
(33 | ) | ||
| (1,384 | ) | |||
| Income tax effect |
483 | |||
| Loss from discontinued operations |
$ | (901 | ) | |
NOTE 3
Sale of Safeco Corporation Common Stock
In June and July 2008, the Company sold its remaining 2.3 million shares of Safeco Corporation common stock. The shares were sold at an average price of $66.65 per share, resulting in pre-tax net proceeds to the Company of $153.4 million. The book basis of the shares sold totaled $782,000, resulting in a pre-tax gain on sale of $152.6 million, which is included in other income, net for 2008.
NOTE 4
Trade and Barter Transactions
Trade transactions represent the exchange of commercial air time for products or services, while barter transactions represent the exchange of commercial air time for programming. Trade transactions are generally reported at the estimated fair value of the product or service received, while barter transactions are reported at management’s estimate of the value of the advertising time exchanged, which approximates the fair value of the program material received. Revenue is reported on trade and barter transactions when commercials are broadcast; expenses are reported when products or services are utilized or when programming airs. Trade and barter revenue totaled approximately $5.6 million, $4.6 million and $3.3 million for the years ended December 31, 2010, 2009 and 2008, respectively. Trade and barter expense totaled approximately $5.7 million, $4.8 million and $3.1 million for the years ended December 31, 2010, 2009 and 2008, respectively.
NOTE 5
Receivables
Receivables are summarized as follows (in thousands):
| December 31, | ||||||||
| 2010 | 2009 | |||||||
| Accounts receivables |
$ | 31,790 | $ | 28,428 | ||||
| Other receivables |
134 | 951 | ||||||
| 31,924 | 29,379 | |||||||
| Less: allowance for doubtful accounts |
(1,117 | ) | (1,309 | ) | ||||
| Total receivables, net |
$ | 30,807 | $ | 28,070 | ||||
76
The Company estimates the collectability of accounts receivable, by specifically analyzing accounts receivable and historical bad debts, customer credit-worthiness, current economic trends and changes in customer payment terms, when evaluating the adequacy of the allowance for doubtful accounts. In addition to the identification of specific doubtful accounts receivable, the Company provides allowances calculated as a percentage of past due balances based on historical collection experience.
NOTE 6
Goodwill and Intangible Assets
The following table summarizes the carrying amount of goodwill and intangible assets (in thousands):
| December 31, 2010 | December 31, 2009 | |||||||||||||||||||||||
| Gross carrying amount |
Accumulated amortization |
Net | Gross carrying amount |
Accumulated amortization |
Net | |||||||||||||||||||
| Goodwill (1) |
$ | 13,293 | $ | — | $ | 13,293 | $ | 13,293 | $ | — | $ | 13,293 | ||||||||||||
| Intangible assets: |
||||||||||||||||||||||||
| Broadcast licenses (1) |
$ | 37,430 | $ | — | $ | 37,430 | $ | 37,430 | $ | — | $ | 37,430 | ||||||||||||
| Other intangible assets |
285 | — | 285 | 285 | — | 285 | ||||||||||||||||||
| Intangible assets subject to amortization (2) |
||||||||||||||||||||||||
| Network affiliation agreement |
3,560 | (732 | ) | 2,828 | 3,560 | (496 | ) | 3,064 | ||||||||||||||||
| Total intangible assets |
$ | 41,275 | $ | (732 | ) | $ | 40,543 | $ | 41,275 | $ | (496 | ) | $ | 40,779 | ||||||||||
| (1) | Goodwill and broadcast licenses are considered indefinite-lived assets for which no periodic amortization is recognized. The television and radio broadcast licenses are issued by the FCC and provide the Company with the exclusive right to utilize certain frequency spectrum to air its stations’ programming. While FCC licenses are issued for only a fixed time, renewals of FCC licenses have occurred routinely and at nominal cost. Moreover, the Company has determined that there are currently no legal, regulatory, contractual, competitive, economic or other factors that limit the useful lives of its FCC licenses. |
| (2) | Intangible assets subject to amortization are amortized on a straight-line basis. Total amortization expense for intangible assets subject to amortization for the years ended December 31, 2010, 2009 and 2008 was $236,000, $236,000 and $328,000 ($68,000 of which is included in discontinued operations), respectively. |
The following table presents the Company’s estimate of amortization expense for each of the next five years and thereafter for intangible assets subject to amortization recorded on its books as of December 31, 2010 (in thousands):
| Year ending December 31, |
||||
| 2011 |
$ | 236 | ||
| 2012 |
236 | |||
| 2013 |
236 | |||
| 2014 |
236 | |||
| 2015 |
236 | |||
| Thereafter |
1,648 | |||
| $ | 2,828 | |||
77
The change in the carrying amount of goodwill for the years ended December 31, 2010 and 2009 was as follows (in thousands):
| December 31, | ||||||||
| 2010 | 2009 | |||||||
| Beginning balance |
$ | 51,709 | $ | 51,709 | ||||
| Accumulated impairment losses |
(38,416 | ) | (38,416 | ) | ||||
| Ending balance |
$ | 13,293 | $ | 13,293 | ||||
The change in the carrying amount of intangible assets for the years ended December 31, 2010 and 2009 was as follows (in thousands):
| December 31, | ||||||||
| 2010 | 2009 | |||||||
| Beginning balance |
$ | 40,779 | $ | 41,015 | ||||
| Amortization |
(236 | ) | (236 | ) | ||||
| Ending balance |
$ | 40,543 | $ | 40,779 | ||||
The Company is required to test goodwill and intangible assets for impairment at least annually, or whenever events indicate that impairment may exist. The Company performs its annual impairment measurement test on October 1st. The Company has determined that the impairment test should be conducted at the operating segment level (which is at a reporting unit level), which, with respect to the broadcast operations, requires separate assessment of each of the Company’s television and radio station groups. The Company determines fair value based on valuation methodologies that include an analysis of market transactions for comparable businesses, discounted cash flows and a review of the underlying assets of the reporting unit. Based on the impairment analyses the Company performed in 2010 and 2009, no impairment charges were recorded.
The Company tested its FCC licenses and goodwill for impairment at December 31, 2008, between the annual impairment tests, because the Company believed events had occurred and circumstances changed that would more likely than not reduce the fair value of the Company’s reporting units below their carrying amounts and that the Company’s FCC licenses might be impaired. These events included: (a) the decline in the price of the Company’s common stock as of December 31, 2008; (b) the decline in overall economic conditions; and (c) the decline in advertising revenues at the Company’s radio and television stations. As a result, the Company recorded an impairment charge of $76.7 million during the fourth quarter of 2008 that included an impairment to the carrying values of FCC licenses of $38.0 million, related to five of the Company’s television stations and two of the Company’s radio stations; an impairment to the carrying value of a network affiliation agreement of $340,000, related to one of the Company’s television stations; and an impairment to the carrying values of goodwill of $38.4 million, related to six reporting units consisting of eleven of the Company’s television stations and five of the Company’s radio stations.
Additionally, the Company tests its network affiliation agreement whenever events or changes in circumstances indicate that its carrying amount may not be recoverable, relying on a number of factors including operating results, business plans, economic projections and anticipated future cash flows. An impairment in the carrying amount of a network affiliation agreement is recognized when the expected future operating cash flow derived from the operation to which the asset relates to is less than its carrying value. The impairment test for a network affiliation agreement consists of a comparison of the carrying amount of the network affiliation agreement with its fair value, using a discounted cash flow analysis.
The impairment test for FCC licenses consists of a station-by-station comparison of the carrying amount of FCC licenses with their fair value, using a discounted cash flow analysis.
78
The impairment step for goodwill utilizes a two-step fair value approach. The first step of the goodwill impairment test is used to identify potential impairment by comparing the fair value of the combined stations in a market (“reporting unit”) to its carrying amount. The fair value of a reporting unit is determined using a discounted cash flow analysis. If the fair value of the reporting unit exceeds its carrying amount, goodwill is not considered impaired. If the carrying amount of the reporting unit exceeds its fair value, the second step of the goodwill impairment test is performed to measure the amount of impairment loss, if any. The second step of the goodwill impairment test compares the implied fair value of the reporting unit’s goodwill with the carrying amount of that goodwill. The implied fair value of goodwill is determined by performing an assumed purchase price allocation, using the reporting unit’s fair value (as determined in Step 1) as the purchase price. If the carrying amount of goodwill exceeds the implied fair value, an impairment loss is recognized in an amount equal to that excess.
Determining the fair value of our reporting units requires the Company’s management to make a number of judgments about assumptions and estimates that are highly subjective and that are based on unobservable inputs. The actual results may differ from these assumptions and estimates; and it is possible that such differences could have a material impact on the Company’s financial statements. In addition to the various inputs (i.e., market growth, operating profit margins, discount rates) that the Company uses to calculate the fair value of its FCC licenses and reporting units, the Company evaluates the reasonableness of its assumptions by comparing the total fair value of all its reporting units to the Company’s total market capitalization; and by comparing the fair value of its reporting units and FCC licenses to recent sale transactions.
As noted above, the Company is required to test its indefinite-lived intangible assets on an annual basis or whenever events or changes in circumstances indicate that these assets might be impaired. As a result, if future economic trends negatively impact our operations, it is possible that the Company may need to record additional impairments in the future.
NOTE 7
Property, Plant and Equipment
Property, plant and equipment are summarized as follows (in thousands):
| December 31, | ||||||||
| 2010 | 2009 | |||||||
| Building and improvements |
$ | 138,858 | $ | 136,837 | ||||
| Machinery and equipment |
126,945 | 123,952 | ||||||
| Land and improvements |
8,340 | 8,309 | ||||||
| 274,143 | 269,098 | |||||||
| Less: accumulated depreciation |
(130,831 | ) | (120,274 | ) | ||||
| $ | 143,312 | $ | 148,824 | |||||
In 2007, the Company completed a sale-leaseback transaction involving one of its news helicopters. The resulting lease qualifies and is accounted for as a capital lease (see Note 14). The gain on sale of $663,000 has been deferred and is being amortized as an offset to depreciation expense over the life of the lease. Machinery and equipment includes $1.3 million recorded under this capital lease, offset by deferred gain of $347,000 at December 31, 2010. Accumulated depreciation associated with the capital lease asset totals $595,000 at December 31, 2010.
79
Property, plant and equipment includes property leased to third parties. Property held for lease to third parties as of December 31, 2010, consists of buildings and improvements of $125.3 million, machinery and equipment of $21.8 million and land and improvements of $4.4 million, less accumulated depreciation of $45.2 million. The Company receives rental income principally from the lease of data center, office and retail space under leases and agreements, which expire at various dates through 2023. These leases and agreements are accounted for as operating leases. Minimum future rental income from leases and agreements in effect at December 31, 2010 are as follows (in thousands):
| Year |
Rental Income | |||
| 2011 |
$ | 4,576 | ||
| 2012 |
4,369 | |||
| 2013 |
4,059 | |||
| 2014 |
3,861 | |||
| 2015 |
3,235 | |||
| Thereafter |
15,591 | |||
| $ | 35,691 | |||
The Company did not capitalize any interest expense in 2010, 2009 or 2008.
NOTE 8
Long-Term Debt
In 2004, the Company issued $150.0 million of 8.625% senior notes due in 2014. The notes are fully and unconditionally guaranteed, jointly and severally, on an unsecured, senior basis by the current and future material domestic subsidiaries of the Company (see Note 21). Interest on the notes is payable semiannually in arrears on March 15 and September 15 of each year, commencing March 15, 2005. As of December 31, 2010, the total principal amount of outstanding senior notes was $101.4 million
The Company may redeem all or a part of the senior notes at the redemption prices (expressed as percentages of principal amount) set forth below plus accrued and unpaid interest thereon, to the applicable redemption date, if redeemed during the 12-month period beginning on September 15 of the years indicated below:
| Year |
Percentage | |||
| 2010 |
102.8750 | % | ||
| 2011 |
101.4375 | % | ||
| 2012 and thereafter |
100.0000 | % | ||
The indenture under which the senior notes were issued contains covenants that, among other things, limit the Company’s ability to:
| • | incur additional indebtedness; |
| • | make certain asset dispositions; |
| • | make investments or other restricted payments; |
| • | pay dividends or make other distributions on, redeem or repurchase, capital stock; |
| • | issue capital stock of our restricted subsidiaries; |
| • | enter into transactions with affiliates or related persons; |
| • | incur certain liens on assets to secure debt; and |
80
| • | enter into a merger, sale or consolidation. |
These covenants are subject to a number of important qualifications and exceptions as described in the indenture.
Included in the indenture are provisions that limit the Company’s ability to distribute proceeds from asset sales. In the event that the Company does not use the proceeds from asset sales for qualifying purposes (as specified in the indenture) within 360 days from the date of sale, the Company will be required to offer to repurchase its outstanding senior notes at par value to the extent of such unused proceeds. Under the indenture, qualifying purposes include: (i) repayment of secured indebtedness; (ii) purchase of assets used or useful in the Company’s business; (iii) certain acquisitions of other companies; (iv) expenditures used or useful in the Company’s business; and (v) certain investments in the Company or its subsidiaries.
Total transaction costs of $5.5 million were capitalized. The capitalized balances are amortized to interest expense using the effective interest method over ten years.
NOTE 9
Television Broadcast Rights and Other Broadcast Commitments
The Company acquires television broadcast rights. The impact of such contracts on the Company’s overall financial results is dependent on a number of factors, including popularity of the program, increased competition from other programming and strength of the advertising market. It is possible that the cost of commitments for program rights may ultimately exceed direct revenue from the program. Estimates of future revenues can change significantly and, accordingly, are reviewed periodically to determine whether impairment is expected over the life of the contract.
Television broadcast rights acquired under contractual arrangements were $11.9 million and $11.8 million in 2010 and 2009, respectively. At December 31, 2010, the Company had commitments under license agreements amounting to $32.8 million for future rights to broadcast television programs and network affiliate agreements through 2014. The Company also has rights to sell available advertising time for third party radio stations. Commitments for these rights were approximately $1.4 million through 2012.
NOTE 10
Stockholders’ Equity
The Company maintains three incentive plans: (i) the Amended and Restated Fisher Communications Incentive Plan of 1995 (the “1995 Plan”), (ii) the Fisher Communications Incentive Plan of 2001 (the “2001 Plan”) and (iii) the Fisher Communications Amended and Restated 2008 Equity Incentive Plan (the “2008 Plan” and together with the 1995 Plan and the 2001 Plan, the “Plans”). The 1995 Plan provided that up to 560,000 shares of the Company’s common stock could be issued to eligible key management employees pursuant to options and rights through 2002. As of December 31, 2010, options and rights for 96,172 shares, net of forfeitures, had been issued under the 1995 Plan. No further equity awards may be issued pursuant to the 1995 Plan. The 2001 Plan provided that up to 600,000 shares of the Company’s common stock could be issued to eligible key management employees or directors pursuant to awards, options and rights through April 2008. As of December 31, 2010, awards, options and rights for 344,497 shares, net of forfeitures, had been issued under the 2001 Plan. No further options and rights may be issued pursuant to the 2001 Plan. The 2008 Plan provides that up to 600,000 shares of the Company’s common stock may be issued to eligible key management employees or directors pursuant to awards, options and rights through 2018. As of December 31, 2010, awards, options and rights for 242,526 shares had been issued, net of forfeitures, from the 2008 Plan.
Stock options. The Plans provide that eligible key management employees may be granted options to purchase the Company’s common stock at the fair market value on the date the options are granted. The
81
outstanding options generally vest over four or five years and generally expire ten years from the date of grant. Non-cash compensation expense of $485,000 ($315,000 after-tax), $394,000 ($256,000 after-tax) and $453,000 ($295,000 after-tax) related to the options was recorded during the years ended December 31, 2010, 2009 and 2008, respectively.
Restricted stock rights. The Plans also provide that eligible key management employees may be granted restricted stock rights which entitle such employees to receive a stated number of shares of the Company’s common stock. The outstanding rights generally vest over four or five years and expire upon termination of employment. Non-cash compensation expense of $690,000 ($448,000 after-tax), $429,000 ($279,000 after-tax) and $264,000 ($171,000 after-tax) related to the rights was recorded during the years ended December 31, 2010, 2009 and 2008, respectively.
Stock awards. The Company’s non-employee directors receive 25% of their annual retainer in the form of a fully vested stock award for the number of shares of the Company’s common stock determined by dividing the amount of cash compensation to be received in the form of a stock award by the fair market value of the Company’s common stock on the last trading date of each quarter. Non-employee directors are permitted to elect to receive all or any portion of their remaining annual retainer, committee Chair retainer(s), Board of Directors meeting fees and committee meeting fees in the form of a fully vested stock award.
In 2010, 9,731 shares of common stock were issued to non-employee directors associated with compensation earned in 2010. In 2009, 14,536 shares of common stock were issued to non-employee directors associated with compensation earned in 2009. In 2008, 4,243 shares of common stock were issued to non-employee directors associated with compensation earned in the first, second and third quarters of 2008, while 2,579 shares were issued in January 2009 associated with director compensation earned in the fourth quarter of 2008. Non-cash compensation expense of $167,000 ($109,000 after-tax), $193,000 ($125,000 after-tax) and $201,000 ($131,000 after-tax) related to the awards was recorded during the years ended December 31, 2010, 2009 and 2008, respectively.
Determining Fair Value
Valuation and Expense Recognition. The Company estimates the fair value of stock option awards granted using the Black-Scholes option pricing model. The Company amortizes the fair value of all awards on a straight-line basis over the requisite service periods, which are generally the vesting periods.
Expected Life. The expected life of awards granted represents the period of time that the awards are expected to be outstanding. The Company determines the expected life based primarily on historical experience with similar awards, giving consideration to the contractual terms, vesting schedules, expected exercises and post-vesting forfeitures. Outstanding stock options granted by the Company generally vest 20% per year over five years or 25% per year over four years and have contractual lives of ten years.
Expected Volatility. The Company estimates the volatility of its common stock at the date of grant based on the historical volatility of its common stock. The volatility factor the Company uses in the Black-Scholes option pricing model is based on its historical stock prices over the most recent period commensurate with the estimated expected life of the award.
Risk-Free Interest Rate. The risk-free interest rates used in the Black-Scholes option pricing model are obtained from the implied yield currently available on U.S. Treasury zero-coupon issues with an equivalent remaining term equal to the expected life of the award.
Expected Dividend Yield. The Company uses an expected dividend yield of zero in the Black-Scholes option pricing model.
82
Expected Forfeitures. The Company primarily uses historical data to estimate pre-vesting option forfeitures. The Company records stock-based compensation only for those awards that are expected to vest.
The fair value of each option grant is estimated on the date of grant using the Black-Scholes option pricing model. A summary of the weighted average assumptions and results for options granted during the periods presented is as follows:
| Year Ended December 31, | ||||||||||||
| 2010 | 2009 | 2008 | ||||||||||
| Assumptions: |
||||||||||||
| Weighted average risk-free interest rate |
2.22 | % | 1.90 | % | 2.80 | % | ||||||
| Expected dividend yield |
0.00 | % | 0.00 | % | 0.00 | % | ||||||
| Expected volatility |
56.43 | % | 42.00 | % | 24.10 | % | ||||||
| Expected life of options |
5.4 years | 5.3 years | 6.0 years | |||||||||
| Weighted average fair value per share at date of grant |
$ | 8.19 | $ | 3.58 | $ | 9.17 | ||||||
Stock-based Compensation
Stock-based compensation cost is measured at grant date, based on the fair value of the award, and recognized over the requisite service period. The Company applied the alternative transition (shortcut) method in calculating its pool of excess tax benefits.
Stock-based compensation expense related to stock-based awards during the years ended December 31, 2010, 2009 and 2008 totaled approximately $1.3 million, $1.0 million and $918,000, respectively, which is included in selling, general and administrative expenses in the Company’s consolidated statements of operations.
As of December 2010 and 2009, the Company had approximately $2.7 million and $2.2 million, respectively, of total unrecognized compensation cost related to non-vested stock-based awards granted under all equity compensation plans. Total unrecognized compensation cost will be adjusted for any future changes in estimated forfeitures. The Company expects to recognize this cost over a weighted average period of approximately 1.5 years and 6.0 years for restricted stock rights and options, respectively.
83
Stock Award Activity
A summary of stock options and restricted stock rights for the Plans is as follows:
| Stock Options | Restricted Stock Rights |
|||||||||||||||||||||||
| Number of Shares |
Weighted Average Exercise Price Per Share |
Weighted Average Remaining Contractual Life |
Aggregate Intrinsic Value |
Number of Shares |
Weighted Average Grant- Date Fair Value |
|||||||||||||||||||
| Outstanding at December 31, 2007 |
199,505 | $ | 49.52 | 17,120 | $ | 44.73 | ||||||||||||||||||
| Options and stock rights granted |
100,621 | 31.07 | 25,483 | 30.56 | ||||||||||||||||||||
| Options exercised/stock rights vested |
— | — | (3,530 | ) | 44.49 | |||||||||||||||||||
| Options expired |
(25,830 | ) | 37.29 | — | ||||||||||||||||||||
| Options and stock rights forfeited |
(13,860 | ) | 61.31 | (7,070 | ) | 37.38 | ||||||||||||||||||
| Outstanding at December 31, 2008 |
260,436 | $ | 42.98 | 6.42 | — | 32,003 | $ | 35.28 | ||||||||||||||||
| Options and stock rights granted |
30,650 | 9.08 | 72,200 | 8.25 | ||||||||||||||||||||
| Options exercised/stock rights vested |
— | — | (7,787 | ) | 12.61 | |||||||||||||||||||
| Options expired |
(37,065 | ) | 57.14 | — | — | |||||||||||||||||||
| Options and stock rights forfeited |
— | — | — | — | ||||||||||||||||||||
| Outstanding at December 31, 2009 |
254,021 | 36.83 | 6.66 | $ | 232,065 | 96,416 | 14.84 | |||||||||||||||||
| Options and stock rights granted |
41,950 | 15.82 | 89,550 | 15.54 | ||||||||||||||||||||
| Options exercised/stock rights vested |
— | — | (25,815 | ) | 16.54 | |||||||||||||||||||
| Options expired |
(6,500 | ) | 59.88 | — | — | |||||||||||||||||||
| Options and stock rights forfeited |
(14,051 | ) | 23.59 | (17,448 | ) | 14.51 | ||||||||||||||||||
| Outstanding at December 31, 2010 |
275,420 | $ | 33.76 | 6.01 | $ | 577,352 | 142,703 | $ | 14.96 | |||||||||||||||
| Exercisable at December 31, 2010 |
156,934 | $ | 41.14 | 4.61 | $ | 97,802 | — | $ | — | |||||||||||||||
The aggregate intrinsic value of options outstanding at December 31, 2010 is calculated as the difference between the exercise price of the underlying options and the quoted price of our common stock for those options that have an exercise price below the $21.80 closing market price of the Company’s common stock at December 31, 2010.
No options were exercised in 2008, 2009 and 2010. During 2010, 25,815 restricted stock rights vested with a total fair value of $406,000. During 2009, 7,787 restricted stock rights vested with a total fair value of $95,000. During 2008, 3,530 restricted stock rights vested with a total fair value of $192,000.
84
NOTE 11
Income Taxes
Income taxes have been provided as follows (in thousands):
| Year Ended December 31, | ||||||||||||
| 2010 | 2009 | 2008 | ||||||||||
| Current tax expense (benefit) |
||||||||||||
| Continuing operations |
$ | 623 | $ | (11,190 | ) | $ | 39,429 | |||||
| Deferred tax expense (benefit) |
||||||||||||
| Continuing operations |
5,199 | 6,622 | (14,596 | ) | ||||||||
| Discontinued operations |
— | — | (575 | ) | ||||||||
| 5,199 | 6,622 | (15,171 | ) | |||||||||
| Total |
$ | 5,822 | $ | (4,568 | ) | $ | 24,258 | |||||
| Income tax expense (benefit) is allocated as follows: |
||||||||||||
| Continuing operations |
$ | 5,822 | $ | (4,568 | ) | $ | 24,833 | |||||
| Discontinued operations |
— | — | (575 | ) | ||||||||
| $ | 5,822 | $ | (4,568 | ) | $ | 24,258 | ||||||
Reconciliation of income taxes computed at federal statutory rates to the reported provisions for income taxes on continuing operations is as follows (in thousands):
| Year Ended December 31, | ||||||||||||
| 2010 | 2009 | 2008 | ||||||||||
| Normal expense computed at 35% of pretax income |
$ | 5,449 | $ | (4,864 | ) | $ | 24,697 | |||||
| Dividends received deduction |
— | — | (516 | ) | ||||||||
| State taxes, net of federal tax benefit |
69 | 23 | (1,390 | ) | ||||||||
| Change in state tax valuation allowance |
(54 | ) | 11 | 2,406 | ||||||||
| Pension death and disability benefits, and increases in pension values |
(150 | ) | (139 | ) | (182 | ) | ||||||
| Non-deductible expenses |
294 | 230 | 274 | |||||||||
| Other |
214 | 171 | (456 | ) | ||||||||
| $ | 5,822 | $ | (4,568 | ) | $ | 24,833 | ||||||
85
Deferred tax assets and liabilities are summarized as follows (in thousands):
| December 31, | ||||||||
| 2010 | 2009 | |||||||
| Assets |
||||||||
| Accrued employee benefits |
$ | 6,654 | $ | 6,735 | ||||
| Goodwill and intangible assets |
6,065 | 10,155 | ||||||
| Allowance for doubtful accounts |
405 | 480 | ||||||
| Net operating loss carryforwards |
1,567 | 1,345 | ||||||
| Contract termination charge |
1,250 | 1,786 | ||||||
| Stock-based compensation |
1,014 | 745 | ||||||
| Deferred income |
2,431 | 2,284 | ||||||
| Plaza fire expenses, net |
— | 1,560 | ||||||
| Other |
607 | 584 | ||||||
| 19,993 | 25,674 | |||||||
| Liabilities |
||||||||
| Appreciation on annuity contracts |
(2,546 | ) | (2,395 | ) | ||||
| Extinguishment of senior notes |
(1,087 | ) | (1,291 | ) | ||||
| Property, plant and equipment |
(12,313 | ) | (13,018 | ) | ||||
| Prepaid insurance |
(477 | ) | (506 | ) | ||||
| Other |
(169 | ) | (161 | ) | ||||
| (16,592 | ) | (17,371 | ) | |||||
| Valuation allowance |
(2,169 | ) | (2,193 | ) | ||||
| Net |
$ | 1,232 | $ | 6,110 | ||||
| Current asset, net |
1,649 | 3,813 | ||||||
| Noncurrent asset (liability), net |
(417 | ) | 2,297 | |||||
| $ | 1,232 | $ | 6,110 | |||||
In 2009, the Company determined that correcting adjustments were necessary to recognize deferred tax liabilities associated with its investments in annuity contracts. See Note 1 for further information.
The determination of the Company’s provision for income taxes and valuation allowance requires significant judgment, the use of estimates and the interpretation and application of complex tax laws. In assessing whether and to what extent deferred tax assets can be realized, the Company considers whether it is more likely than not that some portion or all of the deferred tax assets will be realized.
The Company assesses the likelihood of the realizability of its deferred tax assets on a quarterly basis. Due to the uncertainty of the Company’s ability to generate state taxable income a full valuation allowance has been established on the Company’s deferred state tax assets consistent with prior years. As of December 31, 2010, the Company has not recorded a valuation allowance on its federal deferred tax assets as management believes that it is more likely than not that the Company’s federal deferred tax assets are realizable. The amount of net deferred tax assets considered realizable, however, could be reduced in the future if the Company’s projections of future taxable income are reduced or if the Company does not perform at the levels that it is projecting. This could result in an increase in the Company’s valuation allowance for federal deferred tax assets.
Due to the uncertainty of the Company’s ability to generate sufficient state taxable income to realize its deferred state tax assets, a valuation allowance has been established for financial reporting purposes. The valuation allowance was $2.2 million at December 31, 2010 and 2009. The Company has state net operating losses expiring in 2010 through 2030.
86
The U.S. federal statute of limitations remains open for the year 2006 and onward. The IRS is currently conducting a field examination of the Company’s 2008 and 2009 U.S. tax returns. The State of California and the State of Oregon have also notified us that they will be conducting an examination of the Company’s 2007 and 2008 state tax returns.
The IRS completed its field examination of the Company’s 2006 and 2007 U.S. tax returns in June 2009 and the Company paid $856,000 associated with the acceleration of certain deferred tax liabilities, as well as $31,000 in interest.
The IRS completed a field examination of the Company’s 2003, 2004 and 2005 U.S. tax returns during March 2008.
The Company recognizes tax expense related to agreed-upon tax adjustments currently as part of its income tax provision. The Company recognizes interest and penalties related to uncertain tax positions in interest expense. A net reduction in interest expense of $135,000 was recognized for the year ended December 31, 2008 as a result of the final settlement of the IRS examination of the Company’s 1999 – 2005 income tax returns.
NOTE 12
Retirement Benefits
The Company has a noncontributory supplemental retirement program for key management. No new participants have been admitted to this program since 2001 and no current executive officers participate in the program. The program provides for vesting of benefits under certain circumstances. Funding is not required, but the Company has made investments in annuity contracts and maintains life insurance policies on the lives of the individual participants to assist in payment of retirement benefits. The Company is the owner and beneficiary of the annuity contracts and life insurance policies; accordingly, the cash value of the annuity contracts and the cash surrender value of the life insurance policies are reported on the balance sheet in the financial statements and the appreciation is included in the consolidated statement of operations. The supplemental retirement program requires continued employment or disability through the date of expected retirement. The cost of the program is accrued over the average expected future lifetime of the participants.
In June 2005, the program was amended to freeze accrual of all benefits to active participants provided under the program. The Company continues to recognize periodic pension cost related to the program, but the amount is lower as a result of the curtailment.
The following provides a reconciliation of benefit obligation and funded status of the Company’s supplemental retirement program (in thousands):
| Year Ended December 31, |
||||||||
| 2010 | 2009 | |||||||
| Projected benefit obligation, beginning of year |
$ | 18,769 | $ | 20,304 | ||||
| Interest cost |
1,017 | 1,084 | ||||||
| Assumption changes |
716 | (144 | ) | |||||
| Actuarial (gain) loss |
240 | (1,311 | ) | |||||
| Benefit payments |
(1,039 | ) | (1,164 | ) | ||||
| Projected benefit obligation, end of year |
$ | 19,703 | $ | 18,769 | ||||
| Unfunded status |
$ | 19,703 | $ | 18,769 | ||||
| Accumulated loss |
(3,513 | ) | (2,596 | ) | ||||
| Net amount recognized |
$ | 16,190 | $ | 16,173 | ||||
87
Amounts recognized in consolidated balance sheets consist of (in thousands):
| December 31, | ||||||||
| 2010 | 2009 | |||||||
| Accrued pension liability |
$ | 19,703 | $ | 18,769 | ||||
| Accumulated other comprehensive loss |
(3,513 | ) | (2,596 | ) | ||||
| Net amount recognized |
$ | 16,190 | $ | 16,173 | ||||
| Assumptions used to determine pension obligations are as follows: |
||||||||
| Discount rate |
5.22 | % | 5.57 | % | ||||
| Rate of compensation increase |
N/A | N/A | ||||||
In selecting the discount rate, the Company’s policy is to refer to yields available on high-quality, long-term U.S. corporate bonds on the measurement date of December 31, and is intended to reflect prevailing market conditions. At December 31, 2010 and 2009, the Company has estimated its discount rate based on the Moody’s AA long-term corporate bond yield, which is a well established and credible source based upon bonds of appropriate credit quality and similar duration to the Company’s pension obligations.
The net periodic pension cost for the Company’s supplemental retirement program is as follows (in thousands):
| Year Ended December 31, | ||||||||||||
| 2010 | 2009 | 2008 | ||||||||||
| Interest cost |
$ | 1,017 | $ | 1,084 | $ | 1,099 | ||||||
| Amortization of loss |
39 | 113 | 60 | |||||||||
| Net periodic pension cost |
$ | 1,056 | $ | 1,197 | $ | 1,159 | ||||||
The discount rate used to determine net periodic benefit cost at December 31, 2010, 2009 and 2008 was 5.57%, 5.50% and 5.88%, respectively.
The accumulated benefit obligation of the Company’s supplemental retirement program was $19.7 million and $18.8 million as of December 31, 2010 and 2009, respectively. At December 31, 2010 and 2009, the accumulated benefit obligation of the Company’s supplemental retirement program exceeded plan assets.
Health insurance benefits are provided to certain employees who retire before age 65 and, in certain cases, spouses of retired employees. The accrued postretirement benefit cost was approximately $404,000 and $367,000 as of December 31, 2010 and 2009, respectively. The Company has not accepted new participants into this benefit program since 2001.
The Company estimates that benefits expected to be paid to participants under the supplemental retirement program and postretirement health insurance program are as follows (in thousands):
| Supplemental Retirement Program |
Postretirement Health Insurance Program |
|||||||
| 2011 |
1,037 | 80 | ||||||
| 2012 |
1,198 | 87 | ||||||
| 2013 |
1,251 | 59 | ||||||
| 2014 |
1,240 | 63 | ||||||
| 2015 |
1,413 | 67 | ||||||
| Next 5 years |
7,364 | 105 | ||||||
| $ | 13,503 | $ | 461 | |||||
88
The Company has a defined contribution retirement plan which is qualified under Section 401(k) of the Internal Revenue Code. All U.S. employees are eligible to participate. The Company may make a discretionary profit-sharing contribution. Employer contributions to the plan were $0, $0 and $818,000 in 2010, 2009 and 2008, respectively.
NOTE 13
Segment Information
The Company reports financial data for three reportable segments: television, radio and Fisher Plaza. The television reportable segment includes the operations of the Company’s 20 owned and operated network-affiliated television stations (including a 50%-owned station) and internet business, and excludes the operations of Pegasus, which are reported as discontinued operations. The radio reportable segment includes the operations of the Company’s three Seattle radio stations and five radio stations in Montana. Corporate expenses are allocated to the television and radio segments based on a pro-rata basis. The Fisher Plaza reportable segment includes the operations of a communications center located near downtown Seattle that serves as home of the Company’s Seattle television and radio operations, the Company’s corporate offices and third-party tenants. The other segment includes corporate and administrative expenses that are not attributable to the operations of the television, radio or Fisher Plaza segments.
Operating results and other financial data for each segment are as follows (in thousands):
Revenue
| Year Ended December 31, | ||||||||||||
| 2010 | 2009 | 2008 | ||||||||||
| Television |
$ | 136,397 | $ | 97,201 | $ | 124,001 | ||||||
| Radio |
25,283 | 22,833 | 36,719 | |||||||||
| Fisher Plaza |
14,400 | 13,739 | 13,122 | |||||||||
| Other |
(154 | ) | (109 | ) | (51 | ) | ||||||
| $ | 175,926 | $ | 133,664 | $ | 173,791 | |||||||
Inter-segment sales amounted to $154,000, $109,000 and $51,000 during the years ended December 31, 2010, 2009 and 2008, respectively, related primarily to sales between our television and radio stations.
Depreciation and amortization
| Year Ended December 31, | ||||||||||||
| 2010 | 2009 | 2008 | ||||||||||
| Television |
$ | 9,136 | $ | 8,862 | $ | 8,053 | ||||||
| Radio |
932 | 791 | 1,018 | |||||||||
| Fisher Plaza |
3,210 | 3,019 | 3,117 | |||||||||
| Other |
1,170 | 1,041 | 515 | |||||||||
| $ | 14,448 | $ | 13,713 | $ | 12,703 | |||||||
Income (loss) from continuing operations
| Year Ended December 31, | ||||||||||||
| 2010 | 2009 | 2008 | ||||||||||
| Television |
$ | 26,581 | $ | (1,335 | ) | $ | (61,276 | ) | ||||
| Radio |
3,228 | 2,377 | (4,562 | ) | ||||||||
| Fisher Plaza |
9,666 | 3,966 | 5,472 | |||||||||
| Other |
(14,010 | ) | (11,482 | ) | (11,713 | ) | ||||||
| $ | 25,465 | $ | (6,474 | ) | $ | (72,079 | ) | |||||
89
Total assets
| December
31, 2010 |
December
31, 2009 |
|||||||
| Television |
$ | 141,707 | $ | 150,574 | ||||
| Radio |
15,020 | 14,911 | ||||||
| Fisher Plaza |
108,271 | 112,384 | ||||||
| Other |
55,894 | 53,241 | ||||||
| $ | 320,892 | $ | 331,110 | |||||
Television segment cash and cash equivalents were approximately $25.4 million and $35.1 million at December 31, 2010 and 2009, respectively. Other assets are principally cash and cash equivalents and cash value of life insurance and annuity contracts.
Goodwill
| Year Ended December 31, | ||||||||
| 2010 | 2009 | |||||||
| Television |
$ | 5,077 | $ | 5,077 | ||||
| Radio |
8,216 | 8,216 | ||||||
| $ | 13,293 | $ | 13,293 | |||||
Capital expenditures
| Year Ended December 31, | ||||||||||||
| 2010 | 2009 | 2008 | ||||||||||
| Television |
$ | 6,923 | $ | 6,120 | $ | 6,918 | ||||||
| Radio |
128 | 187 | 290 | |||||||||
| Fisher Plaza |
2,217 | 3,926 | 688 | |||||||||
| Other |
722 | 1,348 | 2,395 | |||||||||
| $ | 9,990 | $ | 11,581 | $ | 10,291 | |||||||
Capital expenditures are reported exclusive of acquisitions.
No geographic areas outside the United States were significant relative to consolidated sales and other revenue, income from operations or total assets.
90
NOTE 14
Commitments and Contingencies
The Company leases office space and equipment under non-cancelable leases. Rent expense totaled approximately $1.1 million, $1.5 million and $1.2 million during the years ended December 31, 2010, 2009 and 2008, respectively. Amortization of assets recorded under capital leases was included in depreciation expense. Minimum future payments for all capital and operating leases as of December 31, 2010 are as follows (in thousands):
| Year |
Capital Leases |
Operating Leases |
||||||
| 2011 |
$ | 954 | $ | 1,439 | ||||
| 2012 |
983 | 1,020 | ||||||
| 2013 |
1,012 | 818 | ||||||
| 2014 |
608 | 488 | ||||||
| 2015 |
— | 218 | ||||||
| Thereafter |
— | 587 | ||||||
| 3,557 | $ | 4,570 | ||||||
| Less executory costs |
(2,707 | ) | ||||||
| Net minimum lease payments |
850 | |||||||
| Less amounts representing interest |
(112 | ) | ||||||
| Present value of net minimum lease payments |
738 | |||||||
| Less current portion of obligations under capital leases |
(181 | ) | ||||||
| Long-term portion of obligations under capital leases |
$ | 557 | ||||||
The current portion of obligations under capital lease is included in other current liabilities in the consolidated balance sheet at December 31, 2010, while the long-term portion is included in other liabilities.
The Company is subject to certain legal proceedings that have arisen in the ordinary course of its business. Management does not anticipate that disposition of these proceedings will have a material effect on the consolidated financial position, results of operations or cash flows of the Company.
NOTE 15
Other Current Liabilities
Other current liabilities consist of (in thousands):
| December 31, | ||||||||
| 2010 | 2009 | |||||||
| Deferred income (including prepaid rent) |
1,740 | 1,368 | ||||||
| Short-term portion of non-cash contract termination fee |
1,461 | 1,461 | ||||||
| Deferred gain on asset exchange (Note 18) |
81 | 1,751 | ||||||
| Other |
1,106 | 1,671 | ||||||
| Total |
$ | 4,388 | $ | 6,251 | ||||
91
NOTE 16
Local Marketing Agreement
In May 2009, the Company entered into a three year LMA with South Sound Broadcasting LLC (“South Sound”) to manage one of South Sound’s FM radio stations licensed to Oakville, Washington. The station broadcasts the Company’s KOMO Radio programming to FM listeners in the Seattle – Tacoma radio market. Contemporaneously with the LMA, the Company entered into an option agreement with South Sound, whereby the Company has the right to acquire the station until May 8, 2012. If the Company does not exercise the option prior to its expiration date, the Company is obligated to pay South Sound up to approximately $1.4 million. Due to the term of our LMA and the uncertainties associated with the exercise of our option agreement, South Sound does not meet the criteria for consolidation. Advertising revenues earned under this LMA are recorded as revenue and LMA fees and programming expenses are recorded as operating costs.
NOTE 17
Extinguishment of Senior Notes
During 2010, the Company repurchased $20.6 million of aggregate principal amount of its 8.625% senior notes due in 2014 for total consideration of $20.5 million in cash, plus accrued interest of $312,000. The Company recorded a loss on extinguishment of debt, net of a charge for related unamortized debt issuance costs of $317,000, resulting in a net loss of approximately $160,000 on the extinguishment of senior notes for the year ended December 31, 2010. The loss is presented as “gain (loss) on extinguishment of senior notes, net” in the Company’s consolidated statements of operations.
During the first half of 2009, the Company repurchased $28.0 million of aggregate principal amount of its 8.625% senior notes due in 2014 for total consideration of $24.4 million in cash, plus accrued interest of $637,000. The Company recorded a gain on extinguishment of debt, net of a charge for related unamortized debt issuance costs of $557,000, resulting in a net gain of approximately $3.0 million on the extinguishment of senior notes for the year ended December 31, 2009.
NOTE 18
Sprint Nextel Asset Exchange
In 2004, the Federal Communications Commission (“FCC”) approved a spectrum allocation exchange between Sprint Nextel Corporation (“Nextel”) and public safety entities to eliminate interference caused to public safety radio licenses by Nextel’s operations.
In order to utilize this spectrum, Nextel is required to relocate broadcasters to new spectrum by replacing all analog equipment currently used by broadcasters with comparable digital equipment. The Company has agreed to accept the substitute equipment that Nextel will provide in all of its markets, and in turn must relinquish its existing equipment back to Nextel. All replacement equipment purchases will be paid for directly by Nextel. All other reasonable and necessary costs incurred by the Company in conjunction with the exchange, both internal and external, will be reimbursed by Nextel.
The Company has recognized a $2.1 million and $2.6 million gain for the years ended December 31, 2010 and 2009, respectively, which represents the amount of the substitute equipment currently in use, including installation costs and net of assets disposed. This gain on asset exchange was not reported as a capital expenditure on the statement of cash flows as it was not a cash outflow.
The Company had approximately $81,000 and $1.8 million of the substitute equipment as of December 31, 2010 and 2009, respectively that had been received but not yet installed. The $81,000 and $1.8 million was recorded as deferred gain in other current liabilities on the consolidated balance sheet. Once the equipment is fully installed and is in use, the deferred gain will be recorded as a gain on the Company’s consolidated statement of operations.
92
NOTE 19
Plaza Fire Expense
In July 2009, an electrical fire contained within a garage level equipment room of the east building of Fisher Plaza disrupted city-supplied electrical service to that building. According to a third-party investigation, the fire appears to have been caused by a malfunction of bus duct equipment manufactured by a third-party.
The Company recorded the Plaza fire expenses as incurred and recorded insurance reimbursements within operating results in the period the reimbursements were considered certain. During the years ended December 31, 2010 and December 31, 2009, the Company recorded net reimbursements of $3.4 million and net expenditures of $2.7 million, respectively, which is included in Plaza fire expenses (reimbursement), net on the Company’s condensed consolidated statements of operations. In total, the Company has incurred approximately $6.8 million in cash expenditures related to the Fisher Plaza fire, comprised of remediation expenses of $3.7 million and capital expenditures of $3.1 million. To date, the Company has received total insurance reimbursements of $5.9 million, which represents substantially all of the Company’s expected reimbursements. The Company continues to work with its insurers on its remaining outstanding claims.
NOTE 20 (unaudited)
Quarterly Financial Information
Unaudited quarterly financial information for fiscal 2010 and 2009 is presented in the following table. Data may not add due to rounding (in thousands, except per share amounts).
| First Quarter |
Second Quarter |
Third Quarter |
Fourth Quarter |
Annual | ||||||||||||||||
| Revenue |
||||||||||||||||||||
| 2010 |
$ | 35,341 | $ | 40,833 | $ | 42,186 | $ | 57,566 | $ | 175,926 | ||||||||||
| 2009 |
$ | 28,513 | $ | 31,983 | $ | 34,527 | $ | 38,641 | $ | 133,664 | ||||||||||
| Net income (loss) |
||||||||||||||||||||
| 2010 |
$ | (2,179 | ) | $ | 328 | $ | 3,320 | $ | 8,277 | $ | 9,746 | |||||||||
| 2009 |
$ | (4,265 | ) | $ | (2,134 | ) | $ | (4,010 | ) | $ | 1,079 | $ | (9,330 | ) | ||||||
| Income (loss) per share—basic: |
||||||||||||||||||||
| 2010 |
$ | (0.25 | ) | $ | 0.04 | $ | 0.38 | $ | 0.94 | $ | 1.11 | |||||||||
| 2009 |
$ | (0.49 | ) | $ | (0.24 | ) | $ | (0.46 | ) | $ | 0.12 | $ | (1.06 | ) | ||||||
| Income (loss) per share, assuming dilution: |
||||||||||||||||||||
| 2010 |
$ | (0.25 | ) | $ | 0.04 | $ | 0.38 | $ | 0.93 | $ | 1.10 | |||||||||
| 2009 |
$ | (0.49 | ) | $ | (0.24 | ) | $ | (0.46 | ) | $ | 0.12 | $ | (1.06 | ) | ||||||
Net loss for the first quarter of 2010 includes a $940,000 pre-tax gain resulting from the asset exchange. Net income for the second quarter of 2010 includes an $842,000 pre-tax gain resulting from the asset exchange. Net income for the third quarter of 2010 includes a $2.9 million pre-tax gain resulting from Plaza fire insurance reimbursements.
Net loss for the third quarter of 2009 includes a $4.0 million charge resulting from expenses incurred related to the Plaza fire, net of reimbursements. Net income for the fourth quarter of 2009 includes a $1.3 million pre-tax gain resulting from Plaza fire insurance reimbursements, net of additional expenses and a $2.6 million pre-tax gain resulting from the exchange of assets, net.
93
NOTE 21
Financial Information for Guarantors
In 2004, the Company completed a private placement of $150.0 million of 8.625% senior notes due 2014 to qualified institutional buyers pursuant to Rule 144A of the Securities Act. The Company exchanged the senior notes for freely tradable notes registered under the Securities Act on February 2, 2005. The senior notes are fully and unconditionally guaranteed, jointly and severally, on an unsecured, senior basis by the current and future material domestic subsidiaries of the Company. Interest on the senior notes is payable semiannually in arrears on March 15 and September 15 of each year.
Presented below are condensed consolidated statements of operations and cash flows for the years ended December 31, 2010, 2009 and 2008 and the condensed consolidated balance sheets as of December 31, 2010 and 2009. The condensed consolidated information is presented for the Company (issuer) with its investments accounted for under the equity method, the 100% owned guarantor subsidiaries, eliminations, and the Company on a consolidated basis. The Company (issuer) information consists primarily of corporate oversight and administrative personnel and related activities, as well as certain investments.
94
Financial Information for Guarantors
Condensed Consolidated Statements of Operations
Year Ended December 31, 2010
| (In thousands) | Fisher Communications, Inc. |
100% Owned Guarantor Subsidiaries |
Eliminations | Fisher Communications, Inc. and Subsidiaries |
||||||||||||
| Revenue |
$ | — | $ | 175,926 | $ | — | $ | 175,926 | ||||||||
| Operating expenses |
||||||||||||||||
| Direct operating costs |
463 | 70,256 | 210 | 70,929 | ||||||||||||
| Selling, general and administrative expenses |
15,028 | 43,806 | (210 | ) | 58,624 | |||||||||||
| Amortization of program rights |
— | 11,877 | — | 11,877 | ||||||||||||
| Depreciation and amortization |
1,539 | 12,909 | — | 14,448 | ||||||||||||
| Plaza fire expenses (reimbursements), net |
— | (3,363 | ) | — | (3,363 | ) | ||||||||||
| Gain on asset exchange, net |
— | (2,054 | ) | — | (2,054 | ) | ||||||||||
| Total operating expenses |
17,030 | 133,431 | — | 150,461 | ||||||||||||
| Income (loss) from operations |
(17,030 | ) | 42,495 | — | 25,465 | |||||||||||
| Gain (loss) on extinguishment of senior notes, net |
(160 | ) | — | — | (160 | ) | ||||||||||
| Other income, net |
136 | 81 | — | 217 | ||||||||||||
| Equity in income of consolidated subsidiaries |
26,613 | — | (26,613 | ) | — | |||||||||||
| Interest expense |
(9,890 | ) | (64 | ) | — | (9,954 | ) | |||||||||
| Income (loss) before income taxes |
(331 | ) | 42,512 | (26,613 | ) | 15,568 | ||||||||||
| Provision (benefit) for income taxes |
(10,077 | ) | 15,899 | — | 5,822 | |||||||||||
| Net income (loss) |
$ | 9,746 | $ | 26,613 | $ | (26,613 | ) | $ | 9,746 | |||||||
95
Financial Information for Guarantors
Condensed Consolidated Statements of Operations
Year Ended December 31, 2009
| (In thousands) | Fisher Communications, Inc. |
100% Owned Guarantor Subsidiaries |
Eliminations | Fisher Communications, Inc. and Subsidiaries |
||||||||||||
| Revenue |
$ | — | $ | 133,664 | $ | — | $ | 133,664 | ||||||||
| Operating expenses |
||||||||||||||||
| Direct operating costs |
421 | 64,488 | 202 | 65,111 | ||||||||||||
| Selling, general and administrative expenses |
10,067 | 41,305 | (202 | ) | 51,170 | |||||||||||
| Amortization of program rights |
— | 10,056 | — | 10,056 | ||||||||||||
| Depreciation and amortization |
1,582 | 12,131 | — | 13,713 | ||||||||||||
| Plaza fire expenses (reimbursements), net |
— | 2,657 | — | 2,657 | ||||||||||||
| Gain on asset exchange, net |
— | (2,569 | ) | — | (2,569 | ) | ||||||||||
| Total operating expenses |
12,070 | 128,068 | — | 140,138 | ||||||||||||
| Income (loss) from operations |
(12,070 | ) | 5,596 | — | (6,474 | ) | ||||||||||
| Gain (loss) on extinguishment of senior notes, net |
2,965 | — | — | 2,965 | ||||||||||||
| Other income, net |
689 | 599 | — | 1,288 | ||||||||||||
| Equity in income of consolidated subsidiaries |
4,107 | — | (4,107 | ) | — | |||||||||||
| Interest expense |
(11,601 | ) | (76 | ) | — | (11,677 | ) | |||||||||
| Income (loss) before income taxes |
(15,910 | ) | 6,119 | (4,107 | ) | (13,898 | ) | |||||||||
| Provision (benefit) for income taxes |
(6,580 | ) | 2,012 | — | (4,568 | ) | ||||||||||
| Net income (loss) |
$ | (9,330 | ) | $ | 4,107 | $ | (4,107 | ) | $ | (9,330 | ) | |||||
96
Financial Information for Guarantors
Condensed Consolidated Statements of Operations
Year Ended December 31, 2008
| (In thousands) | Fisher Communications, Inc. |
100% Owned Guarantor Subsidiaries |
Eliminations | Fisher Communications, Inc. and Subsidiaries |
||||||||||||
| Revenue |
$ | — | $ | 173,798 | $ | (7 | ) | $ | 173,791 | |||||||
| Operating expenses |
||||||||||||||||
| Direct operating costs |
347 | 69,265 | 198 | 69,810 | ||||||||||||
| Selling, general and administrative expenses |
12,276 | 53,788 | (205 | ) | 65,859 | |||||||||||
| Impairment of goodwill and intangible assets |
— | 76,742 | — | 76,742 | ||||||||||||
| Impairment of investment in equity investee |
— | 1,468 | — | 1,468 | ||||||||||||
| Amortization of program rights |
— | 19,288 | — | 19,288 | ||||||||||||
| Depreciation and amortization |
1,118 | 11,585 | — | 12,703 | ||||||||||||
| Total operating expenses |
13,741 | 232,136 | (7 | ) | 245,870 | |||||||||||
| Income (loss) from operations |
(13,741 | ) | (58,338 | ) | — | (72,079 | ) | |||||||||
| Other income, net |
156,357 | 213 | — | 156,570 | ||||||||||||
| Equity in loss of consolidated subsidiaries |
(39,435 | ) | — | 39,435 | — | |||||||||||
| Interest expense |
(13,840 | ) | (88 | ) | — | (13,928 | ) | |||||||||
| Income (loss) before income taxes |
89,341 | (58,213 | ) | 39,435 | 70,563 | |||||||||||
| Provision (benefit) for income taxes |
44,683 | (19,850 | ) | — | 24,833 | |||||||||||
| Income (loss) from continuing operations |
44,658 | (38,363 | ) | 39,435 | 45,730 | |||||||||||
| Loss from discontinued operations net of income taxes |
— | (1,072 | ) | — | (1,072 | ) | ||||||||||
| Net income (loss) |
$ | 44,658 | $ | (39,435 | ) | $ | 39,435 | $ | 44,658 | |||||||
97
Financial Information for Guarantors
Condensed Consolidated Balance Sheets
December 31, 2010
| (In thousands) | Fisher Communications, Inc. |
100% Owned Guarantor Subsidiaries |
Eliminations | Fisher Communications, Inc. and Subsidiaries |
||||||||||||
| ASSETS |
||||||||||||||||
| Current Assets |
||||||||||||||||
| Cash and cash equivalents |
$ | 27,563 | $ | 25,382 | $ | — | $ | 52,945 | ||||||||
| Receivables, net |
— | 30,807 | — | 30,807 | ||||||||||||
| Due from affiliates |
(43,165 | ) | 43,165 | — | — | |||||||||||
| Income taxes receivable |
16,938 | (15,585 | ) | — | 1,353 | |||||||||||
| Deferred income taxes , net |
467 | 1,182 | — | 1,649 | ||||||||||||
| Prepaid expenses and other |
1,543 | 1,320 | — | 2,863 | ||||||||||||
| Cash surrender value of annuity contracts |
2,397 | — | 2,397 | |||||||||||||
| Television broadcast rights |
— | 7,855 | — | 7,855 | ||||||||||||
| Total current assets |
5,743 | 94,126 | — | 99,869 | ||||||||||||
| Investment in consolidated subsidiaries |
261,813 | — | (261,813 | ) | — | |||||||||||
| Cash surrender value of life insurance and annuity contracts |
16,499 | — | — | 16,499 | ||||||||||||
| Goodwill, net |
— | 13,293 | — | 13,293 | ||||||||||||
| Intangible assets, net |
— | 40,543 | — | 40,543 | ||||||||||||
| Deferred financing fees and other |
2,874 | 4,502 | — | 7,376 | ||||||||||||
| Property, plant and equipment, net |
2,265 | 141,047 | — | 143,312 | ||||||||||||
| Total Assets |
$ | 289,194 | $ | 293,511 | $ | (261,813 | ) | $ | 320,892 | |||||||
| LIABILITIES AND STOCKHOLDERS’ EQUITY |
||||||||||||||||
| Current Liabilities |
||||||||||||||||
| Accounts payable |
$ | 96 | $ | 3,948 | $ | — | $ | 4,044 | ||||||||
| Accrued payroll and related benefits |
3,182 | 4,714 | — | 7,896 | ||||||||||||
| Interest payable |
2,552 | — | — | 2,552 | ||||||||||||
| Television broadcast rights payable |
— | 7,849 | — | 7,849 | ||||||||||||
| Current portion of accrued retirement benefits |
1,117 | — | — | 1,117 | ||||||||||||
| Other current liabilities |
889 | 3,499 | — | 4,388 | ||||||||||||
| Total current liabilities |
7,836 | 20,010 | — | 27,846 | ||||||||||||
| Long-term debt |
101,440 | — | — | 101,440 | ||||||||||||
| Accrued retirement benefits |
18,982 | — | — | 18,982 | ||||||||||||
| Deferred income taxes, net |
(4,126 | ) | 4,543 | — | 417 | |||||||||||
| Other liabilities |
(164 | ) | 7,145 | 6,981 | ||||||||||||
| Total liabilities |
123,968 | 31,698 | — | 155,666 | ||||||||||||
| Stockholders’ Equity |
||||||||||||||||
| Common stock |
10,988 | 1,131 | (1,131 | ) | 10,988 | |||||||||||
| Capital in excess of par |
13,273 | 164,233 | (164,233 | ) | 13,273 | |||||||||||
| Accumulated other comprehensive income (loss), net of income taxes: |
||||||||||||||||
| Accumulated loss |
(2,176 | ) | — | — | (2,176 | ) | ||||||||||
| Prior service cost |
(100 | ) | — | — | (100 | ) | ||||||||||
| Retained earnings |
143,241 | 96,449 | (96,449 | ) | 143,241 | |||||||||||
| Total Stockholders’ Equity |
165,226 | 261,813 | (261,813 | ) | 165,226 | |||||||||||
| Total Liabilities and Stockholders’ Equity |
$ | 289,194 | $ | 293,511 | $ | (261,813 | ) | $ | 320,892 | |||||||
98
Financial Information for Guarantors
Condensed Consolidated Balance Sheets
December 31, 2009
| (In thousands) | Fisher Communications, Inc. |
100% Owned Guarantor Subsidiaries |
Eliminations | Fisher Communications, Inc. and Subsidiaries |
||||||||||||
| ASSETS |
||||||||||||||||
| Current Assets |
||||||||||||||||
| Cash and cash equivalents |
$ | 8,840 | $ | 35,142 | $ | — | $ | 43,982 | ||||||||
| Receivables, net |
— | 28,070 | — | 28,070 | ||||||||||||
| Due from affiliate |
12,810 | (12,810 | ) | — | — | |||||||||||
| Income taxes receivable |
13,757 | (2,011 | ) | — | 11,746 | |||||||||||
| Deferred income taxes |
947 | 2,866 | — | 3,813 | ||||||||||||
| Prepaid expenses and other |
1,555 | 2,905 | — | 4,460 | ||||||||||||
| Cash surrender value of life insurance and annuity contracts |
2,626 | — | 2,626 | |||||||||||||
| Television broadcast rights |
— | 7,919 | — | 7,919 | ||||||||||||
| Total current assets |
40,535 | 62,081 | — | 102,616 | ||||||||||||
| Investment in consolidated subsidiaries |
235,390 | — | (235,390 | ) | — | |||||||||||
| Cash surrender value of life insurance and annuity contracts |
15,711 | — | — | 15,711 | ||||||||||||
| Goodwill, net |
— | 13,293 | — | 13,293 | ||||||||||||
| Intangible assets, net |
— | 40,779 | — | 40,779 | ||||||||||||
| Deferred financing fees and other |
3,597 | 3,993 | — | 7,590 | ||||||||||||
| Deferred income taxes |
3,762 | (1,465 | ) | — | 2,297 | |||||||||||
| Property, plant and equipment, net |
2,998 | 145,826 | — | 148,824 | ||||||||||||
| Total Assets |
$ | 301,993 | $ | 264,507 | $ | (235,390 | ) | $ | 331,110 | |||||||
| LIABILITIES AND STOCKHOLDERS’ EQUITY |
||||||||||||||||
| Current Liabilities |
||||||||||||||||
| Accounts payable |
$ | 407 | $ | 2,741 | $ | — | $ | 3,148 | ||||||||
| Accrued payroll and related benefits |
482 | 3,963 | — | 4,445 | ||||||||||||
| Interest payable |
3,158 | — | — | 3,158 | ||||||||||||
| Television broadcast rights payable |
— | 7,987 | — | 7,987 | ||||||||||||
| Current portion of accrued retirement benefits |
1,100 | — | — | 1,100 | ||||||||||||
| Other current liabilities |
1,301 | 4,950 | — | 6,251 | ||||||||||||
| Total current liabilities |
6,448 | 19,641 | — | 26,089 | ||||||||||||
| Long-term debt |
122,050 | — | — | 122,050 | ||||||||||||
| Accrued retirement benefits |
18,023 | — | — | 18,023 | ||||||||||||
| Other liabilities |
— | 9,476 | — | 9,476 | ||||||||||||
| Total Liabilities |
146,521 | 29,117 | — | 175,638 | ||||||||||||
| Stockholders’ Equity |
||||||||||||||||
| Common stock |
10,953 | 1,131 | (1,131 | ) | 10,953 | |||||||||||
| Capital in excess of par |
12,086 | 164,234 | (164,234 | ) | 12,086 | |||||||||||
| Accumulated other comprehensive income (loss), net of income taxes: |
||||||||||||||||
| Accumulated loss |
(1,525 | ) | — | — | (1,525 | ) | ||||||||||
| Prior service cost |
(139 | ) | — | — | (139 | ) | ||||||||||
| Retained earnings |
134,097 | 70,025 | (70,025 | ) | 134,097 | |||||||||||
| Total Stockholders’ Equity |
155,472 | 235,390 | (235,390 | ) | 155,472 | |||||||||||
| Total Liabilities and Stockholders’ Equity |
$ | 301,993 | $ | 264,507 | $ | (235,390 | ) | $ | 331,110 | |||||||
99
Financial Information for Guarantors
Condensed Consolidated Statements of Cash Flows
Year Ended December 31, 2010
| (In thousands) | Fisher Communications, Inc. |
100% Owned Guarantor Subsidiaries |
Eliminations | Fisher Communications, Inc. and Subsidiaries |
||||||||||||
| Net cash provided by operating activities |
$ | 30,019 | $ | 9,649 | $ | — | $ | 39,668 | ||||||||
| Investing activities |
||||||||||||||||
| Redemption of capital |
10,000 | — | (10,000 | ) | — | |||||||||||
| Investment in equity investee |
— | (48 | ) | — | (48 | ) | ||||||||||
| Net cash in consolidation of equity investee |
— | 75 | — | 75 | ||||||||||||
| Purchases of property, plant and equipment |
(722 | ) | (9,268 | ) | — | (9,990 | ) | |||||||||
| Net cash provided by (used in) investing activities |
9,278 | (9,241 | ) | (10,000 | ) | (9,963 | ) | |||||||||
| Financing activities |
||||||||||||||||
| Redemption of capital |
— | (10,000 | ) | 10,000 | — | |||||||||||
| Repurchase of senior notes |
(20,453 | ) | — | — | (20,453 | ) | ||||||||||
| Shares settled upon vesting of stock rights |
(121 | ) | — | — | (121 | ) | ||||||||||
| Payment of capital lease obligations |
— | (168 | ) | — | (168 | ) | ||||||||||
| Net cash provided by (used in) financing activities |
(20,574 | ) | (10,168 | ) | 10,000 | (20,742 | ) | |||||||||
| Net increase (decrease) in cash and cash equivalents |
18,723 | (9,760 | ) | — | 8,963 | |||||||||||
| Cash and cash equivalents, beginning of period |
8,840 | 35,142 | — | 43,982 | ||||||||||||
| Cash and cash equivalents, end of period |
$ | 27,563 | $ | 25,382 | $ | — | $ | 52,945 | ||||||||
100
Financial Information for Guarantors
Condensed Consolidated Statements of Cash Flows
Year Ended December 31, 2009
| (In thousands) | Fisher Communications, Inc. |
100% Owned Guarantor Subsidiaries |
Eliminations | Fisher Communications, Inc. and Subsidiaries |
||||||||||||
| Net cash provided by (used in) operating activities |
$ | (20,025 | ) | $ | 9,836 | $ | — | $ | (10,189 | ) | ||||||
| Investing activities |
||||||||||||||||
| Capital contribution to subsidiary |
(35,000 | ) | — | 35,000 | — | |||||||||||
| Proceeds from sale of short-term investments |
60,000 | — | — | 60,000 | ||||||||||||
| Purchase of investment in DataSphere |
(1,500 | ) | — | — | (1,500 | ) | ||||||||||
| Purchase of property, plant and equipment |
(1,348 | ) | (10,233 | ) | — | (11,581 | ) | |||||||||
| Net cash provided by (used in) investing activities |
22,152 | (10,233 | ) | 35,000 | 46,919 | |||||||||||
| Financing activities |
||||||||||||||||
| Capital contribution from parent |
— | 35,000 | (35,000 | ) | — | |||||||||||
| Repurchase of senior notes |
(24,428 | ) | — | — | (24,428 | ) | ||||||||||
| Payment of capital lease obligations |
— | (155 | ) | — | (155 | ) | ||||||||||
| Net cash provided by (used in) financing activities |
(24,428 | ) | 34,845 | (35,000 | ) | (24,583 | ) | |||||||||
| Net increase (decrease) in cash and cash equivalents |
(22,301 | ) | 34,448 | — | 12,147 | |||||||||||
| Cash and cash equivalents, beginning of period |
31,141 | 694 | — | 31,835 | ||||||||||||
| Cash and cash equivalents, end of period |
$ | 8,840 | $ | 35,142 | $ | — | $ | 43,982 | ||||||||
101
Financial Information for Guarantors
Condensed Consolidated Statements of Cash Flows
Year Ended December 31, 2008
| (In thousands) | Fisher Communications, Inc. |
100% Owned Guarantor Subsidiaries |
Eliminations | Fisher Communications, Inc. and Subsidiaries |
||||||||||||
| Net cash provided by (used in) operating activities |
$ | (36,077 | ) | $ | 6,848 | $ | — | $ | (29,229 | ) | ||||||
| Investing activities |
||||||||||||||||
| Purchase of marketable securities |
— | (104 | ) | — | (104 | ) | ||||||||||
| Proceeds from sale of marketable securities |
153,403 | 110 | — | 153,513 | ||||||||||||
| Purchase of short term investments |
(58,909 | ) | — | — | (58,909 | ) | ||||||||||
| Restricted cash |
52,365 | — | — | 52,365 | ||||||||||||
| Purchase of television stations |
(52,365 | ) | — | — | (52,365 | ) | ||||||||||
| Proceeds from sale of online new service |
— | 1,460 | — | 1,460 | ||||||||||||
| Purchase of intangible assets |
— | (285 | ) | — | (285 | ) | ||||||||||
| Purchases of property, plant and equipment |
(2,394 | ) | (7,897 | ) | — | (10,291 | ) | |||||||||
| Net cash provided by (used in) investing activities |
92,100 | (6,716 | ) | — | 85,384 | |||||||||||
| Financing activities |
||||||||||||||||
| Capital contribution from parent |
21,000 | — | — | 21,000 | ||||||||||||
| Repurchase of senior notes |
(21,000 | ) | — | — | (21,000 | ) | ||||||||||
| Cash dividends paid |
(30,686 | ) | — | — | (30,686 | ) | ||||||||||
| Payment of capital lease obligations |
— | (144 | ) | — | (144 | ) | ||||||||||
| Net cash used in financing activities |
(30,686 | ) | (144 | ) | — | (30,830 | ) | |||||||||
| Net increase (decrease) in cash and cash equivalents |
25,337 | (12 | ) | — | 25,325 | |||||||||||
| Cash and cash equivalents, beginning of period |
5,804 | 706 | — | 6,510 | ||||||||||||
| Cash and cash equivalents, end of period |
$ | 31,141 | $ | 694 | $ | — | $ | 31,835 | ||||||||
NOTE 22
Subsequent Events
Joint Sales Agreement
In December 2010, the Company entered into a ten year Joint Sales Agreement (“JSA”) with NPG of Idaho, Inc., a subsidiary of News Press & Gazette Company (“NPG”), who owns and operates KIFI-TV an Idaho Falls, Idaho television station which was effective January 1, 2011. Under the agreement NPG provides certain services supporting the operation of the Company’s television station in Idaho Falls, KIDK-TV, and sells substantially all of the commercial advertising on the Company’s station. We pay NPG a non-material fixed fee pursuant to the agreement, and a performance bonus based on station performance. Contemporaneously, with the JSA, the Company’s entered into an option agreement with NPG, whereby they have a conditional option to acquire KIDK-TV from us until January 1, 2021, effective on the expiration or termination of the indenture governing our senior notes.
Repurchase of senior notes
In January 2011, the Company repurchased $2.6 million aggregate principal amount of its 8.625% senior notes due in 2014 for total consideration of $2.7 million in cash, plus accrued interest of $78,000. The Company will recognize an estimated net loss on extinguishment of debt of $109,000.
102
Schedule II
FISHER COMMUNICATIONS, INC. AND SUBSIDIARIES
Valuation and Qualifying Accounts
(in thousands)
| Year Ended December 31, | ||||||||||||
| 2010 | 2009 | 2008 | ||||||||||
| Allowance for doubtful accounts: |
||||||||||||
| Balance at beginning of year |
$ | 1,309 | $ | 1,554 | $ | 851 | ||||||
| Additions charged to expense |
803 | 820 | 1,813 | |||||||||
| Balances written off, net of recoveries |
(995 | ) | (1,065 | ) | (1,110 | ) | ||||||
| Balance at end of year |
$ | 1,117 | $ | 1,309 | $ | 1,554 | ||||||
103
SIGNATURES
Pursuant to the requirements of Section 13 or 15(d) of the Securities Exchange Act of 1934, the registrant has duly caused this report to be signed on its behalf by the undersigned, thereunto duly authorized, on the 8th day of March, 2011.
| FISHER COMMUNICATIONS, INC. (Registrant) | ||
| By: |
/S/ COLLEEN B. BROWN | |
| Colleen B. Brown President and Chief Executive Officer | ||
Pursuant to the requirements of the Securities Exchange Act of 1934, this report has been signed below by the following persons on behalf of the registrant and in the capacities and on the date indicated:
| Signatures |
Title |
Date | ||
| /s/ COLLEEN B. BROWN Colleen B. Brown |
President, Chief Executive Officer and Director (Principal Executive Officer) |
March 8, 2011 | ||
| /s/ HASSAN N. NATHA Hassan N. Natha |
Vice President, Chief Financial Officer (Principal Financial Officer) |
March 8, 2011 | ||
| /s/ PAUL A. BIBLE Paul A. Bible |
Director | March 8, 2011 | ||
| /s/ DONALD G. GRAHAM, III Donald G. Graham, III |
Director | March 8, 2011 | ||
| /s/ RICHARD L. HAWLEY Richard L. Hawley |
Director | March 8, 2011 | ||
| /s/ BRIAN P. MCANDREWS Brian P. McAndrews |
Director | March 8, 2011 | ||
| /s/ DAVID A. LORBER David A. Lorber |
Director | March 8, 2011 | ||
| /s/ GEORGE F. WARREN, JR. George F. Warren, Jr. |
Director | March 8, 2011 | ||
| /s/ WILLIAM W. WARREN, JR. William W. Warren, Jr. |
Director | March 8, 2011 | ||
| /s/ MICHAEL D. WORTSMAN Michael D. Wortsman |
Director | March 8, 2011 | ||
|
Anthony Cassara |
Director | |||
104
EXHIBIT INDEX
| Exhibit No. |
Description | |
| 3.1* | Articles of Incorporation, as amended to date (filed as Exhibit 3.1 to the Company’s Quarterly Report on Form 10-Q for the quarter ended June 30, 2008 (File No. 000-22439)). | |
| 3.2* | Bylaws as of April 26, 2007 (filed as Exhibit 3.1 to the Company’s Current Report on Form 8-K filed on May 2, 2007 (File No. 000-22439)). | |
| 4.1* | Indenture relating to Fisher Communications, Inc.’s 8.625% Senior Notes Due 2014, dated as of September 20, 2004 (filed as Exhibit 4.1 to the Company’s Current Report on Form 8-K filed on September 21, 2004 (File No. 000-22439)). | |
| 4.2* | Form of Fisher Communications, Inc.’s 8.625% Exchange Note due 2014 (filed as Exhibit 4.3 to the Company’s Registration Statement on Form S-4 filed on December 20, 2004 (Registration No. 333-121432)). | |
| 4.3* | Form of Common Stock Certificate (filed as Exhibit 4.1 to the Company’s Quarterly Report on Form 10-Q for the quarter ended June 30, 2008 (File No. 000-22439)). | |
| 4.4* | Registration Rights Agreement among Fisher Communications, Inc., its domestic subsidiaries listed on Schedule 1 thereto, and Wachovia Securities, Inc., dated September 20, 2004 (filed as Exhibit 4.2 to the Company’s Current Report on Form 8-K dated September 20, 2004) (File No. 000-22439)). | |
| 10.1* | Primary Television Affiliation Term Sheet Renewal Agreement dated August 12, 2009, by and between Fisher Communications, Inc. and American Broadcasting Companies, Inc. (filed as Exhibit 10.2 to the Company’s Quarterly Report on Form 10-Q for the quarter ended June 30, 2010 filed on August 9, 2010 (File No. 000-22439)). | |
| 10.2*+ | Transition and Consultation Agreement and General Release, Dated December 21, 2010, by and between Fisher Communications, Inc. and Joseph L. Lovejoy (Filed as Exhibit 10.1 to the Company’s Current Report on Form 8-K filed on December 27, 2010 (File No. 000-22439)). | |
| 10.3* | Letter Agreement, dated March 20, 2009, by and between Fisher Communications, Inc. and GAMCO Asset Management, Inc. (filed as Exhibit 10.1 to the Company’s Current Report on Form 8-K filed on March 26, 2009 (File No. 000-22439)). | |
| 10.4*+ | Amended and Restated Fisher Communications Incentive Plan of 1995 (filed as Exhibit 10.22 to the Company’s Annual Report on Form 10-K for the fiscal year ended December 31, 2000 (File No. 000-22439)). | |
| 10.5*+ | Amended and Restated Fisher Communications Incentive Plan of 2001 (filed as Appendix A to the Company’s definitive proxy statement on Schedule 14A filed on March 21,
2007 (File No. 000-22439)). | |
| 10.6*+ | Fisher Communications, Inc. Amended and Restated 2008 Equity Incentive Plan (filed as Appendix A to the Company’s Definitive Proxy Statement on Schedule 14A filed with the Securities and Exchange Commission on April 7, 2010 (File No. 000-22439)). | |
| 10.7*+ | Form of Non-Qualified Stock Option Contract for grants made pursuant to the Amended and Restated Fisher Communications Incentive Plan of 2001 (filed as Exhibit 10.1 to the Company’s Current Report on Form 8-K filed on October 13, 2005 (File No. 000-22439)). | |
| 10.8*+ | Form of Restricted Stock Rights Agreement for grants made pursuant to the Amended and Restated Fisher Communications Incentive Plan of 2001 (filed as Exhibit 10.2 to the Company’s Current Report on Form 8-K filed on October 13, 2005 (File No. 000-22439)). | |
105
| Exhibit No. |
Description | |
| 10.9*+ | Form of Stock Option Grant Notice and Agreement for grants made pursuant to the Fisher Communications, Inc. Amended and Restated 2008 Equity Incentive Plan (filed as Exhibit 10.3 to
the Company’s Quarterly Report on Form 10-Q for the quarter ended June 30, 2008 (File No. 000-22439)). | |
| 10.10+ | Summary of Non-Employee Directors Cash Compensation Fees (filed herewith). | |
| 10.11*+ | Amended and Restated Change of Control Agreement, dated August 24, 2009, by and between Fisher Communications, Inc. and Colleen B. Brown (filed as Exhibit 10.1 to the Company’s Current Report on Form 8-K filed on August 28, 2009 (File No. 000-22439)). | |
| 10.12*+ | Form of Change of Control Agreement by and between Fisher Communications, Inc. and Company Executives (filed as Exhibit 10.2 to the Company’s Current Report on Form 8-K filed on August 28, 2009 (File No. 000-22439)). | |
| 10.13*+ | Offer Letter to Colleen B. Brown, dated October 3, 2005 (filed as Exhibit 10.2 to the Company’s Current Report on Form 8-K filed on October 7, 2005 (File No. 000-22439)). | |
| 10.14*+ | Offer Letter to Hassan N. Natha, dated November 6, 2008 (filed as Exhibit 99.1 to the Company’s Current Report on Form 8-K filed on December 16, 2008 (File No. 000-22439)). | |
| 10.15*+ | Fisher Communications, Inc. 2010 Management Short-Term Incentive Plan, (filed as Exhibit 10.1 to the Company’s Quarterly Report on Form 10-Q for the quarter ended March 31, 2010 (File No.000-22439)). | |
| 10.16+ | Fisher Communications, Inc. 2011 Management Short-Term Incentive Plan (filed herewith). | |
| 10.17*+ | Summary of Non-Employee Director Fees (filed herewith). | |
| 21.1 | Subsidiaries of the Registrant. | |
| 23.1 | Consent of Independent Registered Public Accounting Firm | |
| 31.1 | Rule 13a-14(a)/15d-14(a) Certification of Chief Executive Officer. | |
| 31.2 | Rule 13a-14(a)/15d-14(a) Certification of Chief Financial Officer. | |
| 32.1 | Section 1350 Certification of Chief Executive Officer. | |
| 32.2 | Section 1350 Certification of Chief Financial Officer. | |
| * | Incorporated herein by reference. |
| + | Management contract or compensatory plan or arrangement. |
106