Attached files
| file | filename |
|---|---|
| EX-21.1 - EXHIBIT 21.1 - EYEBLASTER INC | exhibit_21-1.htm |
| EX-31.1 - EXHIBIT 31.1 - EYEBLASTER INC | exhibit_31-1.htm |
| EX-32.2 - EXHIBIT 32.2 - EYEBLASTER INC | exhibit_32-2.htm |
| EX-32.1 - EXHIBIT 32.1 - EYEBLASTER INC | exhibit_32-1.htm |
| EX-31.2 - EXHIBIT 31.2 - EYEBLASTER INC | exhibit_31-2.htm |
| EX-10.7 - EXHIBIT 10.7 - EYEBLASTER INC | exhibit_10-7.htm |
| EX-23.1 - EXHIBIT 23.1 - EYEBLASTER INC | exhibit_23-1.htm |
UNITED STATES
SECURITIES AND EXCHANGE COMMISSION
Washington, D.C. 20549
FORM 10-K
(Mark One)
x ANNUAL REPORT PURSUANT TO SECTION 13 OR 15(d) OF THE SECURITIES EXCHANGE ACT OF 1934
For the fiscal year ended December 31, 2010.
or
o TRANSITION REPORT PURSUANT TO SECTION 13 OR 15(d) OF THE SECURITIES EXCHANGE ACT OF 1934
For the transition period from__________________to_____________________
Commission file number: 001-34844
MediaMind Technologies Inc.
(Exact name of registrant as specified in its charter)
| Delaware | 52-2266402 | |
| State or other jurisdiction of incorporation or organization | (I.R.S. Employer Identification No.) |
| 135 West 18th Street (5th Floor), New York, NY | 10011 | |
| (Address of principal executive offices) | (Zip Code) |
|
(646) 202 - 1320
(Registrant’s telephone number, including area code)
|
Securities registered pursuant to Section 12(b) of the Act:
| Title of each class: | Name of each exchange on which registered: |
| Common shares | NASDAQ Global Select Market |
Securities registered pursuant to Section 12(g) of the Act: None
Indicate by check mark if the registrant is a well-known seasoned issuer, as defined in Rule 405 of the Securities Act.
o Yes x No
Indicate by check mark if the registrant is not required to file reports pursuant to Section 13 or Section 15(d) of the Act.
o Yes x No
Indicate by check mark whether the registrant (1) has filed all reports required to be filed by Section 13 or 15(d) of the Securities Exchange Act of 1934 during the preceding 12 months (or for such shorter period that the registrant was required to file such reports), and (2) has been subject to such filing requirements for the past 90 days.
x Yes o No
Indicate by check mark whether the registrant has submitted electronically and posted on its corporate Web site, if any, every Interactive Data File required to be submitted and posted pursuant to Rule 405 of Regulation S-T (§ 232.405 of this chapter) during the preceding 12 months (or for such shorter period that the registrant was required to submit and post such files).
o Yes o No
Indicate by check mark if disclosure of delinquent filers pursuant to Item 405 of Regulation S-K (§ 229.405 of this chapter) is not contained herein, and will not be contained, to the best of registrant’s knowledge, in definitive proxy or information statements incorporated by reference in Part III of this Form 10-K or any amendment to this Form 10-K.
o
Indicate by check mark whether the registrant is a large accelerated filer, an accelerated filer, a non-accelerated filer, or a smaller reporting company. See the definitions of “large accelerated filer,” “accelerated filer” and “smaller reporting company” in Rule 12b-2 of the Exchange Act.
|
Large accelerated filer o
|
Accelerated filer o
|
|
|
Non-accelerated filer x
|
(Do not check if a smaller reporting company)
|
Smaller reporting company o
|
Indicate by check mark whether the registrant is a shell company (as defined in Rule 12b-2 of the Act).
o Yes x No
The registrant completed the initial public offering of its common stock in August 2010. Accordingly, there was no public market for the registrant’s common stock as of June 30, 2010, the last day of the registrant’s most recently completed second fiscal quarter.
On February 28, 2011, the registrant had outstanding 18,726,615 shares of common Stock, par value $0.001 per share.
DOCUMENTS INCORPORATED BY REFERENCE
Portions of the registrant's Proxy Statement for the 2011 Annual Meeting of Stockholders, which will be filed by the registrant on or prior to 120 days following the end of the registrant's fiscal year ended December 31, 2010, are incorporated by reference into Part III of this Form 10-K.
ii
TABLE OF CONTENTS
| 1 | |
| 1 | |
| 13 | |
| 29 | |
| 29 | |
| 29 | |
|
|
29 |
| 29 | |
| 29 | |
| 31 | |
| 34 | |
| 47 | |
| F-1 | |
| 48 | |
| 48 | |
|
|
49 |
| 49 | |
| 49 | |
| 49 | |
| 49 | |
| 49 | |
|
|
49 |
| 49 | |
| 49 |
iii
Unless the context otherwise requires, in this Annual Report on Form 10-K, the terms “MediaMind,” “the Company,” “we,” “us,” and “our” refer to MediaMind Technologies, Inc. and its subsidiaries.
Forward-Looking Statements
This Annual Report on Form 10-K contains forward-looking statements within the meaning of Section 21E of the Securities Exchange Act of 1934 and Section 27A of the Securities Act of 1933. These statements include, but are not limited to, statements regarding our plans to grow our business and customer base, our ability to respond to new market developments, our intent to migrate our non-platform customers to platform customers, our expectations that our revenues will continue to increase, our belief in the sufficiency of our cash flows to meet our needs for the next year, our plans to invest in emerging media solutions, our plans to continue to expand our international presence and our expectations regarding our future product mix. In some cases, you can identify these statements by forward-looking words such as “may,” “might,” “will,” “should,” “expects,” “plans,” “anticipates,” “believes,” “estimates,” “predicts,” “potential” or “continue,” the negative of these terms and other comparable terminology. These forward-looking statements, which are subject to risks, uncertainties and assumptions about us, may include projections of our future financial performance, our anticipated growth strategies and anticipated trends in our business. These statements are only predictions based on our current expectations and projections about future events. There are important factors that could cause our actual results, level of activity, performance or achievements to differ materially from the results, level of activity, performance or achievements expressed or implied by the forward-looking statements, including those factors discussed in Part I—Item IA—“Risk Factors” of this Form 10-K and Part II—Item 7 “Management’s Discussion and Analysis of Financial Condition and Results of Operation”. Many of these factors are beyond our ability to predict or control.

ITEM 1. BUSINESS
We are a leading global provider of digital advertising campaign management solutions to advertising agencies and advertisers. Our goal is to enable advertisers to engage consumers of digital media with more impact and efficiency.
Our integrated campaign management platform, MediaMind, helps advertisers and agencies simplify the complexities of managing their advertising budgets across multiple digital media channels and formats, including online, mobile, rich media, in-stream video, display and search. MediaMind provides our customers with an easy-to-use, end-to-end solution to enhance planning, creative, delivery, measurement and optimization of digital media campaigns. As a result, our customers are able to enhance brand awareness, strengthen communications with their customers, increase website traffic and conversion, and improve online and offline sales. Our solutions are delivered through a scalable technology infrastructure that allows delivery of digital media advertising campaigns of any size.
We are the only major provider of integrated campaign management solutions not committed to, or affiliated with, a particular publisher, agency or agency group, or advertising network. We believe our independence allows us to provide our customers with unbiased insight and analysis regarding the implementation and effectiveness of their digital media campaigns.
In 2010, we delivered campaigns for approximately 9,000 brand advertisers using approximately 3,800 media agencies and creative agencies across approximately 8,200 global web publishers in 64 countries throughout North America, South America, Europe, Asia Pacific, Africa and the Middle East. We derive our revenue from customers who pay fees to create, execute and measure advertising campaigns on our platform.
Industry Background
Over the last decade, the consumption of media has increasingly moved from traditional media channels, such as television, radio and print media, to digital media channels. Digital media channels offer consumers significant flexibility and choice relative to traditional media channels, and as such, present advertisers with new opportunities to reach a global audience with highly targeted, interactive and measurable advertising campaigns. The transition to digital media also introduces unique challenges and complexities for advertisers, including fragmentation of the audience base and advertising inventory, limited consumer engagement and lack of standardization. The process of planning and executing digital media advertising campaigns differs significantly from the traditional process to which advertisers have grown accustomed. This creates a unique opportunity for an integrated digital advertising campaign management platform to address the underlying complexities and challenges associated with digital media advertising and to enable delivery and management of campaigns with more impact and efficiency.
Media consumption is moving from offline to online
Consumers are increasingly using digital channels for their communication, media intake and shopping needs. Consumers that historically read newspapers or magazines for the latest news now get their news from websites, portals or blogs, and increasingly turn to social networks and other forms of user-generated media for their entertainment and communication needs. Online video, previously a user-generated space, has evolved to serve premium video content, affecting the traditional TV model. Consumers are also accessing the Internet through a variety of entry points, including computers, mobile devices, gaming consoles and web-enabled televisions. The large number of websites visited by consumers, combined with the multiple access points for digital content, has resulted in significant audience fragmentation and is disrupting how advertisers reach and engage consumers.
Advertising budgets are migrating online
Advertisers are allocating a greater portion of their spending online as more consumers use the Internet as a preferred medium for accessing information and purchasing products and services. Traditional brand advertisers, such as consumer packaged goods companies, have been slower to transition their budgets online; however, we believe they are increasingly recognizing the unique benefits offered by the Internet and are allocating more of their marketing budgets to digital channels. We expect this trend to accelerate in the future as advertisers can more effectively measure success, standardization improves and innovative advertising formats allow more engaging brand experiences.
1
New distribution channels and advertising formats continue to emerge
The digital media landscape is rapidly evolving with the introduction of new distribution channels, such as mobile devices and gaming consoles, and new advertising formats, such as online video. Advertising spend on these channels and formats in the United States is projected to increase significantly. Digital channels and formats provide unique opportunities for advertisers to not only strengthen their engagement with target audiences in innovative ways, but also to create an increasingly dispersed and fragmented user base. Digital media is expected to continue to fragment with the introduction of new devices such as tablet computers and web-connected TV sets. While this fragmentation improves aspects of a consumer’s experience and may allow for improved audience segmentation, we believe it will continue to create substantial challenges for advertisers.
Media planning, buying and delivery become increasingly data-dependent
Advertisers have historically relied on external expertise from creative agencies to design their advertising campaigns and from media agencies to plan media and purchase inventory from media publishers across different regions and advertising channels. The traditional media planning, buying and creative design and production processes typically involved limited use of technology and automation and relied on a small number of parties for each campaign. Digital media advertising requires a heavy reliance on sophisticated technologies. It also requires the integration of creative and media buying processes which necessitates a transformation in agencies’ and advertisers’ practices and can be a highly complex and costly endeavor. For example, advertisers seeking to launch a digital media advertising campaign must allocate their spending across multiple advertising formats and channels, select relevant inventory and target audiences, understand the technical capabilities of different publisher websites and platforms and aggregate and analyze massive amounts of data in real-time. Media-buying decisions are increasingly performed in real time, based on accumulated data on performance, prices and audience characteristics.
The Challenges of Digital Media Advertising
The core challenges faced by advertisers and advertising agencies in delivering digital advertising campaigns and migrating more of their budgets to digital media include:
Fragmentation. Unlike traditional mass reach media, digital media provides consumers with access to a virtually unlimited array of content targeted to an individual’s unique interests. The Internet also provides consumers with a greater degree of control over when media is consumed, as well as the devices and platforms used. However, the growing availability of media online and the proliferation of emerging digital media formats and channels, such as mobile devices, social networks and other forms of user-generated media, has led to an increasingly fragmented user base.
The diversity of digital media options available to consumers results in advertising inventory with multiple formats, delivery specifications, metrics and targeting capabilities. This variety and lack of standardization creates additional fragmentation and presents a significant challenge for advertisers to effectively reach a broad audience of consumers and optimize their digital media campaigns. Advertisers must also navigate through decentralized workflow processes involving numerous constituencies to deliver an effective campaign.
Consumer engagement. Advertisers are struggling to reach and engage consumers in a digital media environment overloaded with ad messages. Advertising redundancy and ineffective creative content often result in underperforming campaigns that fail to meet advertisers’ goals. When compared to traditional media consumers, digital media consumers have a greater degree of control and interaction with digital content, thereby making it more challenging for advertisers to draw attention to their marketing campaigns. For example, standard display advertisements, which are static by nature, are experiencing an ongoing decline in click-through rates. Additionally, while digital media users increasingly spend more of their online time on social networks, consumer engagement and monetization of advertising inventory on these sites has been challenging for advertisers.
Effective use of data. In order to enhance the overall effectiveness of their online campaigns and determine the optimal allocation of their advertising budgets, advertisers need to integrate, compare and analyze campaign performance data in real-time from multiple sources. Advertisers also require comprehensive and reliable campaign performance data to target consumers with more relevant ads. The abundance of data and discrepancies across different platforms requires significant time and effort to aggregate, process and report data accurately. Many existing systems and technologies deliver and measure only specific types of advertising formats or channels, thereby providing advertisers with limited visibility into and conflicting data about their overall campaign performance. Finally, many third-party technology providers are affiliated with an advertising network or specific publisher website which can lead to advertisers’ concern about the handling of their proprietary data and the neutrality of measurement.
2
Global campaign management. While the Internet presents an opportunity for advertisers to reach a global audience, advertisers have been challenged by the need to tailor creative content to specific end markets, geographies or user preferences, and to aggregate and compare campaign results on a global basis. With multiple technologies, standards and processes, advertisers are increasingly seeking solutions that will enable them to reach a global audience with localized messaging, provide consistent delivery measurements and analytics and facilitate coordination and collaboration among multiple agencies across different geographies.
The MediaMind Solution
We believe that advertisers and their agency partners seeking to enhance planning, delivery, measurement and optimization of their digital media campaigns need an independent, integrated campaign management platform with robust functionality and scalability. Our MediaMind platform provides an easy-to-use, end-to-end solution to manage digital media campaigns throughout their lifecycle. We have designed MediaMind to benefit each of the key constituencies across the digital media advertising ecosystem as follows:
· advertisers benefit from improved advertising returns due to increased reach, impact, relevancy and measurement of their online campaigns across a variety of channels and formats;
· advertising agencies benefit from an integrated campaign management platform that simplifies the complexity of digital media advertising and enables them to focus on more strategic objectives;
· web publishers benefit from increased demand due to the enhanced value of their advertising inventory; and
· consumers benefit from an improved user experience due to more engaging and targeted advertising.
We believe that our platform addresses the core challenges of digital media advertising in the following ways:
Fragmentation. Our integrated platform simplifies the numerous complexities of managing digital media advertising campaigns across multiple websites, advertising formats and channels with varying publisher-imposed creative content restrictions. Through a single web-based campaign management dashboard, agencies and advertisers can manage campaign creation, delivery, real-time measurement, analysis and optimization while scheduling and monitoring numerous campaigns.
Our open architecture technology, which is designed to accommodate new and emerging digital media channels, enables the placement of ads through multiple formats and media types. The formats we support include a variety of banners, in-stream video ads, full page ads, button links and text links, and the media types we support include rich media and video, static media and text. As a result, our customers benefit from an integrated cross-channel platform that maximizes publisher acceptance and streamlines campaign management, which mitigates fragmentation. Our technology is designed to integrate with other solutions used by our customers, such as planning, reporting, billing and workflow.
Consumer engagement. Our platform facilitates consumer engagement by providing advertisers with the tools to create immersive and interactive experiences for consumers with reduced costs and time to market. Our rich media, video and emerging media capabilities enable advertisers to interact with their target audience more effectively and yield higher engagement, performance and recall rates. Our solutions also facilitate real-time targeting and creative optimization, enabling advertisers to reach specific consumer segments by assigning the best performing and most relevant creative throughout the campaign.
Effective use of data. We believe the measurement, targeting and optimization features of our solutions, combined with our analytics tools, exceed the features of other online advertising solutions. Our platform provides actionable and real-time advertising performance statistics with numerous metrics, such as display time, interaction rate and interaction time. This improves our ability to measure various levels of users’ engagement and brand awareness and enhances our customers’ ability to optimize the performance of their campaigns. Our platform also provides a systematic approach to measuring return on investment, or ROI, which allows advertisers and agencies to compare campaign performance using a consistent methodology across multiple formats, channels and publisher websites. As a result, advertisers are able to allocate their budgets more efficiently and maximize their return.
3
We are the only major provider of integrated campaign management solutions not committed to, or affiliated with, a particular publisher, agency or agency group, or advertising network. We believe our neutral position has numerous benefits, such as eliminating potential conflicts with advertisers since we do not own or sell any advertising inventory, allowing us to provide unbiased insight and analysis, and ensuring the protection and proper use of our customers’ proprietary data.
Global campaign management. We leverage our presence across multiple geographies and end markets to provide customized and integrated global campaign management solutions. In 2010, we delivered campaigns across approximately 8,200 global web publishers in 64 countries throughout North America, South America, Europe, Asia Pacific, Africa and the Middle East. Our technology platform is accepted and supported by thousands of publishers worldwide, including all of the major portals. Our local sales and support, unique product capabilities and broad publisher acceptance enable us to deliver global or pan-regional advertising campaigns and streamline coordination and collaboration across agencies while providing more efficient localization of campaigns.
Our Strategy
Our goal is to enable advertisers to engage consumers with more impact and efficiency across a variety of digital media formats and channels by expanding our position as a leading global provider of digital advertising campaign management solutions. Key elements of our strategy include:
Growing the share of total digital media advertising managed through our solutions by:
· expanding existing relationships with advertisers and advertising agencies to manage a greater portion of their digital advertising campaigns and transitioning them to use more capabilities of our MediaMind platform, primarily for more efficient use of accumulated data;
· accessing additional advertising budgets by establishing new agency relationships and creating partnerships with global advertising agency holding companies, leading digital media publishers and technology companies;
· increasing our global footprint by expanding into new geographic markets; and
· aligning our organization to assure quality of customer service, while accommodating large scale and growth in the number of advertisers and campaigns.
Increasing the value and efficiency of our customers’ advertising spend and leveraging our technology expertise by:
|
|
·
|
allowing advertisers to leverage the data generated by our platform for real time decision making for optimizing campaign performance;
|
|
|
·
|
empowering creative innovation and interactivity to maximize user engagement;
|
|
|
·
|
enabling more targeted, efficient and performance-driven campaigns with immediate and actionable analytics and data driven advertising solutions;
|
|
|
·
|
investing in emerging digital media formats and channels to create new opportunities for our customers to deliver high impact advertising campaigns to consumers; and
|
|
|
·
|
emphasizing ease-of-use, enabling real-time control and facilitating effective collaboration between advertisers, advertising agencies and publishers throughout the entire campaign management cycle.
|
4
Reinforcing the advantages of partnering with an independent provider of campaign management solutions by:
|
|
·
|
remaining focused primarily on the needs of advertisers and advertising agencies;
|
|
|
·
|
protecting our customers’ proprietary data and providing unbiased insights and analytics; and
|
|
|
·
|
extending our open technology architecture to allow for additional customization of our offerings and further integration into our customers’ workflows.
|
Our Solutions and Services – The MediaMind Platform
Our MediaMind technology platform is used by advertisers, media buyers, creative agencies and publishers in a shared workflow environment to manage advertising campaigns across multiple digital media channels. Our customers may adopt MediaMind as an end-to-end solution for all their campaigns and across all channels of media in use. Alternatively, customers can select MediaMind to run specific campaigns on a specific channel or publisher, or to use a portion of the services that our solution provides. Our tools are easy to use and are designed to seamlessly integrate with other tools used by our customers to facilitate the deployment of advertising campaigns.
MediaMind Capabilities
MediaMind offers shared capabilities for automating and enhancing advertising campaigns throughout their lifecycles, including:
Planning and Buying
An effective media plan involves a detailed selection of digital advertising placements and respective budget allocations to meet campaign objectives. Historically, the planning process could not take into consideration previously accumulated data about the advertising activities of the specific brand or other brands in the same industry. Our Smart Planning product allows advertisers to for the first time to use this accumulated data in planning and buying media for new campaigns.
Our platform:
· allows advertisers to research optimal media inventory options in order to establish a new media plan to address a given business objective;
· provides advertisers with relevant historic performance and cost data across different publishers, as well as of other peer media buyers, to enable them to leverage prior experience to optimize new campaigns;
· Automates the workflow of negotiating and buying digital media from publishers;
· allows buying of media using real time bidding across multiple ad exchanges using a demand side platform;
· enables our customers to compare campaigns’ specifications and results and assists in the creation of a media plan and campaign strategy, including design, placement and timing of advertisements using our central database of publishers’ mandatory guidelines for ad design;
· analyzes specific media plans and determines the common denominator for creative guidelines so customers can design a campaign for different publishers with different formats; and
· offers multiple options to complete the trafficking process, which involves inputting and editing significant amounts of data across multiple publishers.
Creative Management
We provide creative designers and producers with the tools and services to manage a campaign’s creative development lifecycle, from initial design, to inclusion of interactive features, to adaptation for analytics and ad insertion, and finally, integration with campaign management and ad serving processes. MediaMind offers an integrated tool for creative designers, which is embedded within common development platforms and provides efficiencies during ad production. This tool facilitates collaboration and communication among various teams and experts to promote an innovative, improved consumer experience and brand communication. In addition to the designer tool, we offer a library and a marketplace for pre-developed advertising code, which we call MediaMind Blocks. By using MediaMind Blocks, designers gain access to advanced concepts and can implement them quickly and easily. Additional capabilities include optimal video encoding and a testing and approval workflow.
5
Delivery and Targeting
MediaMind enables seamless delivery of advertisements to the target audience using several methods:
· Ad serving. Our platform transmits ad content into ad insertions on publisher websites, ensuring a seamless consumer experience. Our network infrastructure delivers ads to the majority of global Internet users while handling a significant load with high performance and quality.
· Targeting. Our tools enable our customers to deliver tailored messages to a specific consumer segment, which increases the relevancy of the advertisement and improves the consumer experience. Our targeting capabilities include the ability to deliver ads based on preference, geography, context, sequence, time of exposure and capabilities of a user’s computer and network connection.
· Optimization. We offer several tools to improve the consumer experience and the ROI of the campaign. These tools enable our customers to test ad performance on defined groups of consumers and adjust campaigns to show the audience the best performing ad variation in real-time time based on various performance objectives such as consumer engagement or conversions.
Analytics and Monitoring
MediaMind enables clear and comprehensive real-time monitoring and reporting of campaign execution, delivery and performance in multi-channel campaigns to achieve campaign optimization and insights.
|
|
·
|
Real-time campaign monitoring. The availability of relevant, real-time information is essential to improving a campaign’s performance. Our campaign monitor tool provides a quick snapshot of key performance indicators, which are available in real-time at 15-minute intervals and enables our customers to quickly adjust their advertising campaigns.
|
|
|
·
|
Campaign performance and reporting. Comprehensive campaign performance and delivery data is monitored and stored in our databases. The data monitored includes the status of campaign execution, delivery of ad impressions, duration of ad view, user clicks and advance interactions and post-click and post-view activity on the advertiser website. We offer a broad range of standard account and campaign reports that can be viewed online or scheduled for automatic email delivery quickly and easily. The reports measure:
|
|
|
·
|
Delivery: progress of an impression’s delivery against the plan;
|
|
|
·
|
Frequency: user interaction rates and performance by exposure frequency and reach;
|
|
|
·
|
Engagement: standard and custom interaction rates and duration;
|
|
|
·
|
Creative comparison: relative effectiveness of various creative units across multiple channels and different publisher websites;
|
|
|
·
|
Conversion: post-click and post-view online activities on the advertiser website, conversion rates and conversion value; and
|
|
|
·
|
ROI: effectiveness of the campaign by using pre-defined campaign objectives.
|
|
|
·
|
Flexible reporting formats. Our analytics solutions generate reports and data in multiple forms. We can provide a broad range of formats, including pre-defined reports, summary presentation reports that highlight multiple aspects of campaign performance or custom-built reports tailored to the specific needs of our advertisers and agency partners. We also make campaign data dynamically available to users and offer additional tools that enable the highest level of flexibility in evaluating and presenting campaign data.
|
6
Unique Design Aspects
MediaMind is uniquely designed to enable advertisers to deliver campaigns across multiple markets globally or within a specific region, in an easy-to-use manner that can integrate with other tools.
Global campaign management. MediaMind is able to address and support the unique requirements of global or pan-regional campaigns where multiple media agencies and creative agencies can be involved in the campaign process. Our platform enables our customers to:
|
|
·
|
allow collaboration between multiple media and creative agencies in the different countries served;
|
|
|
·
|
aggregate and segment campaign data in a variety of ways including regional (region, sub-region, country) and lingual (region, country, language);
|
|
|
·
|
automate the localization process with local languages and local campaign information such as pricing or launch date; and
|
|
|
·
|
gain immediate reach for their global advertising campaigns due to MediaMind’s acceptance by publishers worldwide.
|
Ease-of-use. MediaMind simplifies control of highly complex campaigns, with hundreds of placements, hundreds of creative versions, and a large number of publishers per campaign. The workflow for delivering such campaigns is complicated and requires a wide variety of campaign management features. Usability has been an important area of focus for us and we continue to invest in our user interface and workflow tools to meet our customers’ evolving needs.
Integration. The MediaMind platform integrates with other tools already used by the advertiser or its agency. MediaMind Application Programming Interfaces (“APIs”) can connect the platform to other services for data sharing, campaign workflow and creative setup, and advertising tools such as search engine marketing services. We offer integration services to utilize these APIs for a tailored workflow according to agency and advertiser requirements.
Formats and Channels
Our solutions enable our customers to use a wide range of digital media channels and formats to maximize reach and optimize engagement with consumers. Digital media channels include a combination of the device through which the ad is delivered and the content in which the ad is delivered. Devices today include personal computers and increasingly mobile devices, and in the future, may include digital out-of-home media and on-demand television. Delivered content includes websites, streaming video, games, instant messaging, web search, applications and downloadable applications or gadgets. Our solutions enable the placement of advertisements through multiple ad formats, such as a variety of banners, in-stream video ads, full page ads, including ads that float or overlap web pages, button links and text links, using a variety of media types, including interactive animation, video, static media and text.
The formats, channels and advertising functionalities supported by MediaMind include:
Rich Media Advertising
Rich media advertising typically includes more extensive graphics, animation and interactivity, and in some cases, audio and video within the advertisement. Unlike standard display advertisements, which are static in their design, rich media advertisements often enable users to interact with the banner without leaving the page on which it appears. Our rich media advertising options enable our customers to create, deliver, and manage the rich media portion of their digital campaigns. When creating and producing ads, our customers can choose from a wide range of interactive advertising formats to engage their audience.
7
Video Advertising
Video advertising includes in-banner video formats displayed within rich media banners, as well as, in-stream video formats displayed within or alongside video content on a publisher website. Our video advertising options enable our customers to easily integrate video components across different advertising formats and include a set of tools designed to maximize the performance of the video ads. These tools include easy-to-use drag and drop templates, different delivery options, automatic encoding and optimization of quality of video per user bandwidth capabilities.
Standard Display Advertising
We offer a complete solution for managing standard display banner campaigns. A low-cost, high-volume marketing tool, standard display represents the majority of banners viewed online and is often combined with conversion tags placed on advertisers’ web pages. Our solution offers one of the most advanced suites of tools for setup, optimization and analysis of standard display campaigns.
Search Engine Advertising
Our search engine advertising product, which we launched in 2008, analyzes the performance of search engine marketing campaigns, integrated with display campaigns by the same advertisers. This combination allows marketers to understand a consumer’s path of interactions and analyze the mutual impact of search and display advertising. Our solutions offer our customers a holistic view of their campaigns across channels, offering a range of advertising metrics and easy-to-use reports, and our product is seamlessly compatible with multiple search engine marketing tools and does not require the customer to use a specific product.
Mobile Advertising
Our mobile advertising product provides our customers with the ability to manage mobile ad campaigns with all the benefits of third-party ad serving and the MediaMind integrated platform. The solution delivers, optimizes and tracks ads on multiple mobile sites and networks and across multiple mobile devices. It also provides advanced, independent analytics on campaign delivery, performance and receiving devices.
Demand Side Platform
We offer Smart Trading, a powerful demand side platform for buying display media across multiple ad exchanges in a real-time bidding process. Our Smart Trading solutions can retarget consumers based on previous interaction with the brand, target new members of the target audience, and buy media to achieve given Cost per Click or Cost per Action objectives.
Dynamic Creative Optimization
We offer Smart Versioning, a powerful tool for improving ad relevancy by dynamically changing ad messaging in real-time. Our Smart Versioning solution automates the personalization of ads, the localization to different languages and the dynamic updating of advertisement messaging.
Customized Services
We offer our customers a range of optional customized professional services based on their specific needs. These services include trafficking, creative production and quality assurance, research and analysis, custom reporting and data integration.
Customer Support
We believe that superior customer support is critical to retaining and expanding our customer base. Our customer support program assists our customers in the use of our services and identifies, analyzes and solves problems or issues with our services. Our customer support group is available to customers by telephone or e-mail or through our website 24 hours per day, seven days per week during the campaign period. We offer specialized support for our different customer types – media, creative and publisher. Our support organization combines customer-facing local account managers with a global support desk that handles all technical service aspects.
8
Technology, Infrastructure and Research and Development
Technology and Infrastructure
We have developed a proprietary set of modules and technologies that collectively serve as the foundation for our integrated campaign management platform. The modular design of our solutions allows for high scalability, availability and extensibility of our platform while enabling seamless integration with our customers’ existing technologies and systems. The following modules enable the delivery of a variety of features within our solutions:
· Ad serving and targeting. Our ad serving and targeting technology is based on a set of proprietary server side applications and databases that serve ads based on predefined or customized configurations that can be changed in real-time. Our servers include modules for creative optimization, creative rotation, behavioral targeting, ad delivery and filtering. Each of our servers is designed to ensure high availability and performance.
· Ad display. Our ad display module includes technologies for displaying ads on a variety of consumer devices, such as PC web browsers and mobile phones. The display modules use proprietary code for detecting user display capabilities and present ads based on the specific configuration of each user. Our ad display modules enable targeting and optimization of ads.
· Analytics. Our analytics module has a robust and scalable architecture that enables high-speed processing of large amounts of data for reporting purposes and online campaign optimization. Our platform captures, processes and aggregates campaign performance data in an efficient manner that allows for real-time campaign monitoring and optimization. Our analytics module is designed to allow third-party analytics tools to interface with our systems. We are certified by the Media Rating Council as compliant with measurement guidelines defined by the Internet Advertising Bureau.
· Web-based administrative interface. Our technology includes an advanced interface layer for performing the full range of ad campaign management administrative operations. The interface includes a proprietary web user interface infrastructure that enables the rapid creation and customization of web base management applications. The infrastructure complies with World Wide Web Consortium standards and supports all major web browser applications. The administrative interface is connected to our other architectural modules in a manner that allows real-time updates to campaign configuration. The administrative interface is accessed daily by thousands of media agencies, creative agencies and publishers, and is designed for high availability and global accessibility.
· Creative authoring. We have developed a rich media creative authoring application that is integrated into the development programs used by our creative agency customers. This application provides easy-to-use add-on components that enrich the ad creative, as well as a full workflow with connectivity to our backend systems to allow uploading, previewing and testing of new ads created.
· APIs. Some of our developed modules include application programming interfaces, or APIs, that allow extensibility and integration with other systems. MediaMind has four types of APIs, including a media plan setup and trafficking API, a creative setup API, a data feed API and an ad display API.
· Distributed global network. We have developed a backend system that enables the deployment of our ad servers in different locations around the globe with full real-time synchronization of data. The backend system is connected to our central databases and synchronizes every data change to a local data cache that exists in every location of our global network. This system allows real-time control over global campaign execution without compromising performance or redundancy.
We have programmed the majority of our applications using industry-standard software programming languages, such as C++ and .NET, to maximize performance and scalability while allowing for easy integration with other systems and technologies and reducing our overall time to market.
Our hardware consists primarily of Intel-based servers from various vendors, networked behind firewalls and networking load balancers in eight different third-party data centers in New York, New Jersey, Los Angeles, Amsterdam (2), Tokyo, Beijing and Singapore. Our servers, storage and networking hardware are clustered to ensure high availability, redundancy and scalability. The modular design of our systems allows us to grow capacity incrementally by adding servers and network equipment as necessary with little additional cost.
9
Our systems are monitored 24 hours a day, seven days a week, 365 days a year using proprietary and non-proprietary monitoring systems and are managed by highly experienced teams of system and network technicians and engineers. In 2010, we maintained uptime on our systems of over 99.9%.
Research and Development
Our research and development center is based in Israel. The focus of our research and development activities is to enhance our existing products and develop new products to meet our customers’ changing digital marketing needs. Our research and development team has expertise in database programming, high load server, web application, browser, desktop, gaming and mobile technologies. Most of our engineers have been with us for many years and have contributed significantly to building the foundations of our architecture.
Customers
Our campaign management solutions and services are used by media agencies, creative agencies and publishers who collaborate with advertisers to deliver better ad campaign results. Online media campaigns are generally managed by an advertising agency for an advertiser. We are generally hired and paid by the media agency to manage the online campaign and coordinate with the media agency, the creative agency and the publishers to deliver the ad.
While we generally are paid by agencies, in some situations publishers, advertisers, or other constituents decide to retain us. For instance, publishers may opt to sponsor our fees and bundle them with the media fees that they charge to the agency and advertiser.
We provide services to all relevant parties, and we serve a diversified base consisting of a great majority of the online advertising industry in all key markets. In 2010, we served:
|
|
·
|
approximately 3,800 media agencies and creative agencies worldwide, including Mediacom, Mindshare, Universal McCann, ZenithOptimedia, OMD, Zed Media, MEC and Media Contacts;
|
|
|
·
|
over 8,200 global web publishers who are MediaMind-enabled, including Yahoo!, MSN, Google, MySpace, AOL, and ESPN; and
|
|
|
·
|
nearly 9,000 brand advertisers in every major product vertical, including Nike, Sony, Toyota, Volkswagen, H&M, McDonalds, Vodafone and MasterCard.
|
Our largest customer is Microsoft. We derive our revenues related to Microsoft, which totaled approximately 14%, 22% and 28% of our total revenues for fiscal 2010, 2009 and 2008, respectively, in two primary ways. First, we are engaged by Microsoft’s internal advertising group to develop innovative custom products for specific campaigns and for global campaign delivery. This accounted for $5.4 million, or 7%, of our revenues in 2010.
We also provide ad-serving and rich media services to advertising agency and advertiser customers that advertise on Microsoft online properties, which accounted for $5.7 million, or 7%, of our revenues in 2010. In this case, we are selected by the advertising agency or advertiser customer and not by Microsoft, although the fee for our services is usually paid to us by Microsoft as publisher.
We derive an increasing portion of our revenues directly from agencies and customers who pay us directly for serving ads on Microsoft online properties which revenues are not included in the figures above. See “Risk Factors—The loss of Microsoft or another major customer or a reduction in any such customer’s Internet advertising or marketing budget could significantly reduce our revenue and profitability.”
No other customer accounted for more than 10% of our revenues in 2010, 2009 or 2008.
10
Sales and Marketing
We sell our offerings primarily through a direct sales force or through third-party selling agents that employ a direct sales force. The MediaMind sales organization consists of local sales teams, including sales managers and sales engineers, who cover agencies and advertisers in an effort to increase their awareness and utilization of our solutions and services.
In 2010, we delivered campaigns in 64 countries. Our sales and services organization is globally organized and our offices and partners are coordinated and supported through four regional offices covering North America, EMEA, Asia Pacific, and Latin America. We believe this is an important advantage which allows us to offer global advertisers a consistent pan-regional service.
We sell directly in countries including Argentina, Australia, Austria, Brazil, Canada, China, Colombia, Denmark, Finland, France, Germany, Japan (where we also sell through a local selling agent), Mexico, New Zealand, Norway, Portugal, Spain, Sweden, Taiwan, the United Kingdom, the United States and Venezuela.
We sell through local selling agents in countries and regions that include Belgium, Dubai, Greece, Hong Kong, India, Indonesia, Israel, Italy, Japan, Korea, Malaysia, the Netherlands, Pakistan, the Philippines, Poland, Romania, Russia, Singapore, South Africa, Thailand and Turkey. We typically maintain a long-term, strategic relationship with our local selling agents. Our agreements are typically at least one year in term, with automatic renewals in most cases, unless one party provides the other with prior written notice or if we and the local selling agent are unable to agree upon sales targets. The agreements generally provide our agents with the exclusive right to promote us in a certain region and are generally terminable only for cause or if the local selling agent does not meet the agreed upon sales targets. We also agree as to provisions regarding non-competition, non-disclosure and the protection of our intellectual property.
Our client services organization assumes responsibility and account management for active relationships with clients, and handles management of campaigns and ongoing adoption of our solutions. The client services organization includes specialist representatives for our different categories of clients, including media agencies, creative agencies and publishers.
Our business development team supports our sales efforts by developing strategic relationships with agency holding groups, key publishers and media companies, as well as technology partners.
Our marketing efforts are focused on enhancing the MediaMind brand, thought leadership research, lead generation, sales support and product marketing. We support these objectives with activities that include public relations, industry events, advertising, social media, web sites, blogs and research publications.
Competition
The markets in which we operate are rapidly evolving and highly competitive. We expect this competitive environment to continue. We believe that the principal competitive factors affecting the market for digital advertising services and tools are existing strategic relationships with customers and vendors globally; ease-of- use, integration and customization; innovation; technology; quality and breadth of service, including local language support; data analysis; price and independence.
With respect to these significant competitive factors, we believe that our solutions and services are stronger than those of our competitors in the areas of ease-of-use, integration and customization; innovation; technology; quality and breadth of service; data analysis and independence. For example, we are the only provider offering real-time monitoring capabilities and additional unique custom analytics tools that allow us to measure various levels of users’ engagement and brand awareness. We have an advantage that many of our competitors lack because our technology platform is accepted and supported by thousands of publishers worldwide, including the major portals, and we are able to customize our services and solutions to meet our customers’ specific competitive needs. In addition, we believe that our integrated platform is a significant advantage when compared to some of our competitors who only offer point solutions.
We compete against other integrated campaign management and ad serving providers, stand-alone rich media companies, and channel-specific niche providers. Our main competitors in the campaign management and ad serving category are DoubleClick (which was acquired by Google in March 2008), Atlas (which was acquired by Microsoft in May 2007) and MediaPlex, a division of ValueClick. Our main competitors in the stand-alone rich media category are niche players, such as PointRoll (which is owned by Gannett), Eyewonder (which was acquired by Limelight Networks in December 2009), Unicast (which is owned by DG FastChannel) and FlashTalking. Google and Microsoft have significantly greater name recognition and greater financial, technical and marketing resources than we do. In addition, many of our other competitors have longer operating histories, greater name recognition, larger client bases or greater financial, technical and marketing resources than we do. We believe that we maintain a competitive position in the markets in which we operate.
11
The consolidation of some of our competitors into larger publishing organizations with increased resources is a relatively recent trend in the industry. The effects of such acquisitions on the market are still unclear. We believe that our independent position in the industry is one of our competitive advantages, and see the consolidation trend as an opportunity to offer agnostic, independent solutions that support multiple channels, formats and publishers equally and focus on the needs of advertisers.
Intellectual Property
Our intellectual property rights are important to our business. We believe that the complexity of our products and the know-how incorporated in them makes it difficult to copy them or replicate their features. We rely on a combination of confidentiality clauses, copyrights and, to a lesser extent, patents and trademarks to protect our intellectual property and know-how.
To protect our know-how and trade secrets, we customarily require our employees, customers, and third-party collaborators to execute confidentiality agreements or otherwise agree to keep our proprietary information confidential when their relationship with us begins. Typically, our employment contracts also include clauses requiring our employees to assign to us all inventions and intellectual property rights they develop in the course of their employment and agree not to disclose our confidential information. Because software is stored electronically and thus is highly portable, we attempt to reduce the portability of our software by physically protecting our servers through the use of closed networks and with physical security systems which prevent their external access. We also seek to minimize disclosure of our source code to customers or other third parties.
The online advertising industry is characterized by ongoing product changes resulting from new technological developments, performance improvements, and decreasing costs. We believe that our future growth depends to a large extent on our ability to profoundly understand our clients and their needs and to be an innovator in the development and application of technology. As we develop next generation products, we intend to pursue patent and other intellectual property rights protection, when practical, for our core technologies. As we continue to move into new markets, we will evaluate how best to protect our technologies in those markets.
We have a limited patent portfolio. We currently have two issued U.S. patents and six pending U.S. patent applications. We also have one registered Israeli patent and one pending Israeli patent application. We cannot be certain that patents will be issued as a result of the patent applications we have filed.
Although we have no registered trademarks, we have three trademark applications pending.
Employees
As of December 31, 2010, we employed approximately 379 employees. None of our employees is represented by unions. We consider our relationship with our employees to be good and have not experienced significant interruptions of operations due to labor disagreements.
12
We face a variety of significant and diverse risks, many of which are inherent in our business. Described below are risks that we currently believe could materially affect us. If any of the following risks actually occurs, our business, financial condition or results of operations would likely be materially adversely affected.
Risks Related to Our Business and Industry
We face significant competition from Google and Microsoft and may not be able to compete successfully with such powerful competitors.
We face formidable competition in every aspect of our business from other companies that provide solutions and services similar to ours. Currently, our primary competitors are DoubleClick and Atlas, a technology and service division of aQuantive. In March 2008, Google acquired DoubleClick and in May 2007, Microsoft acquired aQuantive. DoubleClick and Atlas offer solutions and services similar to ours and compete directly with us. While we continue to do business with Google and Microsoft as publishers and with Microsoft as an advertising agency, they may use their substantial financial and engineering resources to expand the DoubleClick and Atlas businesses and increase their ability to compete with us.
Google and Microsoft have significantly greater name recognition and greater financial, technical and marketing resources than we do. Microsoft also has a longer operating history and more established relationships with customers. In addition, we believe that both Google and Microsoft have a greater ability to attract and retain customers due to numerous competitive advantages, including their ability to offer and provide their marketing and advertising customers with a significantly broader range of related solutions and services than us. Google or Microsoft may elect not to work with us or may use their experience and resources to compete with us in a variety of ways, including through acquisitions of competitors or related businesses, research and development, and marketing for new customers more aggressively. Furthermore, Google or Microsoft could use campaign management solutions as a loss leader or may provide campaign management solutions or portions of such solutions without charge or below cost in order to encourage customers to use their other product offerings. If Google and Microsoft are successful in providing solutions or services that are better than ours, or in leveraging platforms more effectively than ours or that are perceived by customers as being more cost-effective, we could experience a significant decline in our customers’ use of our solutions and services. Such a decline could have a material adverse effect on our business, financial condition and results of operations.
We face intense and increasing competition from other companies within our industry and may not be able to compete successfully with such competitors.
In addition to Google and Microsoft, we face competition from other companies. Among our competitors are rich-media solutions companies (such as Pointroll, owned by Gannett, Eyewonder, which was acquired by Limelight Networks in December 2009, Unicast, which is owned by DG FastChannel, and Flashtalking) and ad serving companies (such as MediaPlex, a division of Value Click). We also may experience competition from companies that provide web analytics or web intelligence. Other companies are also developing campaign management solutions. Our competitors may develop services that are equal or superior to our services or that achieve greater market acceptance than ours. Many of our competitors have longer operating histories, greater name recognition, larger client bases and significantly greater financial, technical and marketing resources than us.
In addition, many of our current and potential competitors have established or may establish cooperative relationships among themselves or with third parties and several of our competitors have combined or may combine in the future with larger companies with greater resources than ours. This growing trend of cooperative relationships and consolidation within our industry may result in fewer, but more powerful and aggressive, competitors that may engage in more extensive research and development, undertake more far-reaching marketing campaigns and make more attractive offers to existing and potential employees and customers than we are able to. They may also adopt more aggressive pricing policies and may even provide services similar to ours at no additional cost by bundling them with their other product and service offerings. Any increase in the level of competition from these, or any other competitor, is likely to result in price reductions, reduced margins, or loss of market share and a potential decline in our revenues. We cannot assure you that we will be able to compete successfully with our existing or future competitors. If we fail to withstand competitive pressures and compete successfully, our business, financial condition and results of operations could be materially adversely affected.
13
We face competition from traditional media companies, and our services may not be included in the advertising budgets of large advertisers, which could harm our operating results.
In addition to Internet companies, such as Google and Microsoft, rich-media solutions companies and ad serving companies, we face competition from companies that offer traditional media advertising opportunities, such as television, radio, cable and print. Most large advertisers have pre-determined advertising budgets, of which a very small portion is allocated to Internet advertising. We expect that large advertisers will continue to focus most of their advertising efforts on traditional media. Advertisers, including current and potential customers, may also find Internet advertising or marketing to be less effective than traditional media advertising or marketing methods for promoting their products and services, and therefore may decrease the portion of their budget allocated to Internet advertising or may shift their advertising away from the Internet. If we fail to convince these companies to spend a portion of their advertising budgets with us to advertise online, or if our existing advertisers reduce the amount they spend on our solutions and services, our business, financial condition or results of operations could be materially adversely affected.
The loss of a major customer, including Microsoft, or a reduction in any such customer’s Internet advertising or marketing budget could significantly reduce our revenue and profitability.
Our top 20 paying customers, including our largest customer, Microsoft, accounted for 41%, 46% and 49% of our revenues in the years ended December 31, 2010, 2009 and 2008, respectively. If one or more of these major customers decides not to continue purchasing services from us or significantly reduces its spending with us, we may not be able to make up the lost revenue. This could have a material adverse affect on our business, financial condition and results of operations.
We derive our revenues related to Microsoft, which totaled approximately 14%, 22% and 28% of our total revenues for fiscal 2010, 2009 and 2008, respectively, in two primary ways. First, we are engaged by Microsoft’s internal advertising group to provide our solutions for specific campaigns, consistent with how we provide solutions to other customers. This accounted for $5.4 million, or 7%, of our revenues in 2010.
In addition, we also provide solutions to advertising agency and advertiser customers that advertise on Microsoft online properties. However, while we are selected by the advertising agency or advertiser customer and not by Microsoft, in certain jurisdictions the fee for our services is paid to us by Microsoft as publisher. Because Microsoft is the one that pays our fee in those jurisdictions, we account for such revenues as coming from Microsoft (even though the decision to hire us is made by the advertising agency), and these revenues accounted for $5.7 million, or 7%, of our revenues in 2010. In other jurisdictions, such as the United Kingdom and Spain, we derive our revenues increasingly from agencies and customers who pay us directly for serving ads on Microsoft online properties, consistent with how they pay us for serving ads on other publisher properties; these revenues are not included in the figures above.
Microsoft’s internal advertising group does not partner with us exclusively and has not committed to provide us a minimum level of business. We face significant competition for Microsoft’s business from other campaign management service providers, including Atlas, which was acquired by Microsoft in May 2007. Microsoft is continuing to expand its relationships with other campaign management service providers and, as a result, we cannot provide any assurance that we will succeed in maintaining or growing this portion of our revenues from Microsoft. In addition, we have reduced, and may continue to reduce the cost per thousand impressions (“CPM”) rate for ads of the same format. A decline in the volume of impressions or the CPM rate, whether generally or from one or more major customers (including Microsoft), could materially and adversely affect our revenues and profitability.
Consolidation of Internet advertising networks, web portals, Internet search engine sites and web publishers may impair our ability to serve advertisements and to collect campaign data and could lead to a loss of significant customers.
The growing trend of consolidation of Internet advertising networks, web portals, Internet search engine sites and web publishers, and increasing industry presence of a small number of large companies, such as Google, Microsoft and, most recently, Apple, with the announcement of its iAd platform for placing ads on Apple’s applications, could harm our business. We are currently able to serve, track and manage advertisements for our customers in a variety of networks and websites, which is a major benefit to our customers’ overall campaign management. Concentration of advertising networks could substantially impair our ability to serve advertisements if these networks or websites decide not to permit us to serve, track or manage advertisements on their websites, if they develop ad placement systems that are incompatible with our ad serving systems, or if they use their market power to force their customers to use certain vendors on their networks or websites. These networks or websites could also prohibit or limit our aggregation of advertising campaign data if they use technology that is not compatible with our technology. In addition, concentration of desirable advertising space in a small number of networks and websites could result in pricing pressures and diminish the value of our advertising campaign databases, as the value of these databases depends to some degree on the continuous aggregation of data from advertising campaigns on a variety of different advertising networks and websites. Additionally, major networks and publishers can terminate our ability to serve advertisements on their properties on short notice. If we are no longer able to serve, track and manage advertisements on a variety of networks and websites, our ability to service campaigns effectively and aggregate useful campaign data for our customers will be limited.
14
We may be adversely affected by cyclicality or an extended downturn in the United States, Europe or worldwide economy in or related to the industries we serve.
Our revenues are generated primarily from providing online campaign management solutions and services to advertising agencies and advertisers across various formats and digital media channels. Demand for these services tends to be tied to economic cycles, reflecting overall economic conditions as well as budgeting and buying patterns. We cannot assure you that advertising budgets and expenditures by advertising agencies and advertisers will not decline in any given period or that advertising spending will not be diverted to more traditional media or other online marketing products and services, which would lead to a decline in the demand for our campaign management solutions and services. For example, during the recent economic crisis, our revenue growth slowed due to weaker advertising spend and increased price pressure. A decline in the economic prospects of advertisers or the economy in general could alter current or prospective customers’ spending priorities. As a result, our revenues may not increase or may decline significantly in any given period. Additionally, in 2010, due in large part to uncertainty in the European sovereign debt markets, the European economy has been under stress. An extended downturn in the European economy could adversely affect our results of operations.
The Internet advertising or marketing market may deteriorate, or develop more slowly than expected, which could have a material adverse affect on our business, financial condition or results of operations.
If the market for Internet advertising or marketing deteriorates, or develops more slowly than we expect, our business could suffer. Our future success is highly dependent on an increase in the use of the Internet, the commitment of advertisers and advertising agencies to the Internet as an advertising and marketing medium, the advertisers’ implementation of advertising campaigns and the willingness of current or potential customers to outsource their Internet advertising and marketing needs. The Internet advertising and marketing market is relatively new and rapidly evolving. As a result, demand and market acceptance for Internet advertising solutions and services is uncertain.
If we do not continue to innovate and provide high quality solutions and services, as well as increase our revenues from more traditional solutions and services, we may not remain competitive, and our business, financial condition or results of operations could be materially adversely affected.
Our success depends on providing high quality solutions and services that make online campaign management easier and more efficient for our customers. Our competitors are constantly developing innovations in online advertising and campaign management, and therefore the prices that we charge for existing services and solutions generally decline over time. As a result, we must continue to invest significant resources in research and development in order to enhance our technology and our existing solutions and services and introduce new high-quality solutions and services. If we are unable to predict user preferences or industry changes, or if we are unable to modify our solutions and services on a timely basis, and as a result are unable to provide quality solutions and services that run without complication or service interruptions, our customers may become dissatisfied and we may lose customers to our competitors and our reputation in the industry may suffer, making it difficult to attract new customers. Our operating results would also suffer if our innovations are not responsive to the needs of our customers, are not appropriately timed with market opportunity or are not effectively brought to market. As online advertising and campaign management technologies continue to develop, our competitors may be able to offer solutions that are, or that are perceived to be, substantially similar or better than those offered by us. Customers will not continue to do business with us if our solutions do not deliver advertisements in an appropriate and effective manner, if the advertiser’s investment in advertising does not generate the desired results, or if our campaign management tools do not provide our customers with the help they need to manage their campaigns. If we are unable to meet these challenges or if we over expend our resources in our research and development of new solutions and services, our business, financial condition and results of operations could be materially adversely affected. Recently, we began to emphasize our standard display ads, which generate lower revenue per impression than other formats but represent a large and profitable market, and which can help offset pricing pressure in other formats, such as rich media. If we are unable to grow our market share in this area significantly, our revenue could decrease.
15
Our business depends on a strong brand reputation, and if we are not able to maintain and enhance our brand, our business, financial condition and results of operations could be materially adversely affected.
We believe that maintaining and enhancing the “MediaMind” brand is critical to expanding our base of customers and maintaining brand loyalty among customers, particularly in North America where brand perception can impact the competitive position in other markets worldwide, and that the importance of brand recognition will increase due to the growing number of competitors providing similar services and solutions. Maintaining and enhancing our brand may require us to make substantial investments in research and development and in the marketing of our solutions and services, and these investments may not be successful. If we fail to promote and maintain the “MediaMind” brand, or if we incur excessive expenses in this effort, our business, financial condition and results of operations could be materially adversely affected. We anticipate that, as our market becomes increasingly competitive, maintaining and enhancing our brand may become increasingly difficult and expensive. Maintaining and enhancing our brand will depend largely on our ability to be a technology leader and to continue to provide high quality solutions and services, which we may not do successfully. In 2009, we released our next generation integrated MediaMind campaign management platform, which all our customers now use. Any defect or error in this platform could materially adversely affect our brand reputation, customer relationships and results of operations.
We operate in an emerging and rapidly evolving market. This makes it difficult to evaluate our future prospects.
The online advertising industry is an immature industry that has undergone rapid and dramatic changes in its short history. You must consider our business and prospects in light of the risks and difficulties we will encounter in a new and rapidly evolving market. We may not be able to successfully address new risks and difficulties as they arise, which could have a material adverse effect on our business, financial condition and results of operations.
Our operating results fluctuate and, as a result, our historical operating results may not be indicative of our future performance, and the failure to meet certain expectations with respect to our operating results may cause our stock price to decline.
Our operating results have historically fluctuated on a quarterly basis due to the seasonal nature of Internet advertising, and we expect this fluctuation to continue. Our fourth calendar quarter is typically the strongest, generating approximately 32%, 34% and 26% of our revenues for the years ended December 31, 2010, 2009 and 2008 respectively. Our first quarter is often the weakest quarter, generating approximately 20%,18 % and 21% of our revenues for the years ended December 31, 2010, 2009 and 2008, respectively. The increase in revenue in the fourth quarter is primarily the result of heavy advertising and online shopping during November and December due to the holidays. The drop in revenues in the first quarter is linked to the drop in online advertising and shopping that occurs at the beginning of each year. Revenue prediction could be impacted by unexpected demand for our services during a particular quarter and consequently impact that quarter. Quarterly and annual expenses as a percentage of net revenues may also be significantly different from historical or projected rates. For these reasons, comparing our operating results on a period-to-period basis may not be meaningful, and you should not rely on past results as an indication of future performance. If our operating results fail to meet expectations, the market price of our common stock could decline.
New advertisement blocking technologies could limit or block the delivery or display of advertisements by our solutions, which could undermine the viability of our business.
Advertisement blocking technologies, such as “filter” software programs, that can limit or block the delivery or display of advertisements delivered through our solutions are currently available for Internet users and are continuing to be developed. If these technologies become widespread, the commercial viability of the current Internet advertisement model may be undermined. As a result, ad-blocking technology could, in the future, have a material adverse effect on our business, financial condition and results of operations.
16
More individuals are using non-personal computer devices to access the Internet, and the solutions developed for these devices may not be widely deployed.
The number of people who access the Internet through devices other than personal computers (“PCs”), including mobile devices, game consoles and television set-top devices, has increased dramatically in the past few years. The lower resolution, functionality and memory associated with alternative devices make the use of our solutions and services through such devices difficult. If we are unable to deliver our solutions and services to a substantial number of alternative device users or if we are slow to develop solutions and technologies that are more compatible with non-PC communications devices, we will fail to capture a significant share of an increasingly important portion of the market. For instance, while we have developed Channel Connect for Mobile™ which provides customers with the ability to manage mobile ad campaigns with the MediaMind integrated platform, we cannot ensure widespread integration and acceptance of our solution. Our failure to deliver our solutions and services to a substantial number of alternative device users, or failure to develop in a timely manner solutions and technologies that are more compatible with non-PC communications devices, could have a material adverse effect on our business, financial condition and results of operations.
We may have difficulty scaling and adapting our existing network infrastructure to accommodate increased systems traffic and technology advances or changing business requirements.
All of our solutions and services are delivered through our network. For our business to be successful, our network infrastructure must perform well and be reliable. We will need significantly more computing power as traffic within our systems increases and our solutions and services become more complex. We expect to continue spending significant amounts to purchase or lease data centers and equipment, and to upgrade our technology and network infrastructure to handle increased Internet traffic and roll out new solutions and services, many of which internal improvements were delayed during the recent financial crisis. This expansion will be expensive and complex and could result in inefficiencies or operational failures. The costs associated with these necessary adjustments to our network infrastructure could harm our operating results. In addition, cost increases, loss of traffic or failure to accommodate new technologies or changing business requirements associated with our network infrastructure could also have a material adverse effect on our business, financial condition and results of operations.
Problems with content delivery services, bandwidth providers, data centers or other third parties could harm our business, financial condition or results of operations.
Our business relies significantly on third-party vendors, such as data centers, content delivery services and bandwidth providers. For example, we have entered into an agreement (as amended) to use a third-party, Akamai Technologies, Inc. (“Akamai”), to provide content delivery services to assist us in serving advertisements and have committed to a minimum revenue amount to Akamai during the calendar year and to using Akamai for at least 75% of our delivery needs, excluding China, provided Akamai meets our service requirements. The term of our agreement with Akamai is until May 31, 2012. Akamai may terminate this agreement if we materially breach the agreement and such breach continues unremedied for 30 days following Akamai’s notice to us. If Akamai or other third-party vendors fail to provide their services or if their services are no longer available to us for any reason and we are not immediately able to find replacement providers, our business, financial conditions or results of operations could be materially adversely affected.
Additionally, any disruption in network access or co-location services provided by these third-party providers or any failure of these third-party providers to handle current or higher volumes of use could significantly harm our business operations. If our service is disrupted, we may lose revenues directly related to the impressions we fail to serve and we may be obligated to compensate clients for their loss. Our reputation may also suffer in the event of a disruption. Any financial or other difficulties our providers face may negatively impact our business and we are unable to predict the nature and extent of any such impact. We exercise very little control over these third-party vendors, which increases our vulnerability to problems with the services they provide. We license technologies from third-parties to facilitate aspects of our data center and connectivity operations including, among others, Internet traffic management services. We have experienced and expect to continue to experience interruptions and delays in service and availability for such elements. Any errors, failures, interruptions or delays experienced in connection with these third-party technologies and information services could negatively impact our customer relationships and materially adversely affect our brand reputation and our business, financial condition or results of operations and expose us to liabilities to third parties.
17
Our data centers are vulnerable to natural disasters, terrorism and system failures that could significantly harm our business operations and lead to client dissatisfaction.
In delivering our solutions, we are dependent on the operation of our data centers, which are vulnerable to damage or interruption from earthquakes, terrorist attacks, war, floods, fires, power loss, telecommunications failures, computer viruses, computer denial of service attacks or other attempts to harm our system, and similar events. In particular, two of our data centers, in Tokyo, Japan and Los Angeles, California, are located in areas with a high risk of major earthquakes and others are located in areas with high risk of terrorist attacks, such as New York, New York. Our insurance policies have limited coverage in such cases and may not fully compensate us for any loss. Some of our systems are not fully redundant, and our disaster recovery planning cannot account for all eventualities. The occurrence of a natural disaster, a terrorist attack, a provider’s decision to close a facility we are using without adequate notice or other unanticipated problems at our data centers could result in lengthy interruptions in our service. Any damage to or failure of our systems could result in interruptions in our service. Interruptions in our service could reduce our revenues and profits, and our brand reputation could be damaged if customers believe our system is unreliable, which could have a material adverse affect on our business, financial condition and results of operations.
We have in the past experienced, and may in the future experience, system failures. For example, during the fourth quarter of 2006, we experienced two incidents in which our then DNS (Domain Name System, which translates human-readable computer hostnames into the relevant IP addresses) provider experienced global downtime of its system, which resulted in a failure to broadcast approximately 50% of the ads on our platform for up to six hours in each incident. Following these incidents, we replaced our DNS provider and have not since experienced any major system failures. Any unscheduled interruption in our service would put a burden on our entire organization and would result in an immediate loss of revenue. If we experience frequent or persistent system failures, our reputation and brand could be permanently harmed. The steps we have taken to increase the reliability and redundancy of our systems are expensive, reduce our operating margin and may not be successful in reducing the frequency or duration of unscheduled downtime.
Our business may be adversely affected by malicious third-party software applications that interfere with the function of our technology.
Our business may be adversely affected by malicious software applications that make changes to our users’ computers and interfere with our technology. These applications may attempt to change users’ experience in using our services, including altering or replacing advertisements delivered by our platform, changing configurations of our user interface, or otherwise interfering with our ability to connect with users. The interference may occur without disclosure to or consent from users, resulting in a negative experience that users may associate with our solutions. These software applications may be difficult or impossible to uninstall or disable, may reinstall themselves and may circumvent other applications’ efforts to block or remove them. The ability to reach users on behalf of our customers and provide them with a superior experience is critical to our success. If our efforts to combat these malicious software applications are unsuccessful, our reputation may be harmed, and the communications with certain users on behalf of our customers could be impaired. This could result in a decline in usage of our solutions and corresponding revenues, which would have a material adverse effect on our business, financial condition and results of operations.
If we fail to detect click-through fraud or other invalid clicks, we could lose the confidence of our advertisers, thereby causing our business to suffer.
We are exposed to the risk of fraudulent and other invalid clicks on advertisements delivered by us from a variety of potential sources. Invalid clicks are clicks that we have determined are not intended by the user to link to the underlying content, such as inadvertent clicks on the same ad twice and clicks resulting from click fraud. Click fraud occurs when a user intentionally clicks on an ad displayed on a web site for a reason other than to view the underlying content. These types of fraudulent activities could harm our business and our brand. If fraudulent clicks are not detected, the data that our solutions provide to our customers is inaccurate and the affected advertisers may lose confidence in our solutions to deliver a return on their investment. If advertisers become dissatisfied with our solutions, they may choose to do business with our competitors or reduce their Internet advertising spending, which would have a material adverse effect on our business, financial condition and results of operations.
18
If we fail to manage our growth effectively, our business, financial condition and results of operations could be materially adversely affected.
We have experienced, and continue to experience, rapid growth in our operations and headcount, which has placed, and will continue to place, significant demands on our management, operational and financial infrastructure. If we do not effectively manage our growth, the quality of our solutions and services could suffer, which could negatively affect our brand and operating results. To effectively manage this growth, we will need to continue to improve, among other things:
|
|
·
|
our information and communication systems to ensure that our offices around the world are well coordinated and that we can effectively communicate with our growing base of customers;
|
|
|
·
|
our systems of internal controls to ensure timely and accurate reporting of all of our operations;
|
|
|
·
|
our documentation of our information technology systems and our business processes for our advertising and billing systems; and
|
|
|
·
|
our information technology infrastructure to maintain the effectiveness of our systems.
|
In order to enhance and improve these systems we will be required to make significant capital expenditures and allocation of valuable management resources. If the improvements are not implemented successfully, our ability to manage our growth will be impaired and we may have to make additional expenditures to address these issues, which could materially adversely affect our business, financial condition and results of operations.
In order to facilitate our sales growth and ability to deliver quality service worldwide, we have entered into strategic relationships with local selling agents in various countries. The termination of any of these strategic relationships could limit our ability to grow in those jurisdictions and have a material adverse effect on our business, financial condition and results of operations.
We have entered into strategic relationships with local selling agents in several countries and regions around the world, including Belgium, Dubai, Greece, Hong Kong, India, Indonesia, Israel, Italy, Japan, Korea, Malaysia, the Netherlands, Pakistan, the Philippines, Poland, Romania, Russia, Singapore, South Africa, Thailand and Turkey to help expand our business internationally and intend to continue to do so as part of our strategy. These strategic relationships are important to help us better understand our international markets and local preferences in order to expand internationally. In order to define the terms of the relationships, we have entered into agreements with these entities pursuant to which they sell and distribute our solutions and services in their local jurisdiction, usually on an exclusive basis. Our agreements are typically at least one year in term, with automatic renewal in most cases, unless one party provides the other with prior written notice or if we and the local selling agent are unable to agree upon sales targets. However, a few agreements have longer terms of three to five years. We also generally agree that during the term of the contract and for 12 months afterward (although sometimes for shorter or longer periods) the local selling agent will not: (i) acquire, develop, market, sell or promote any product, service, system, platform or technology reasonably deemed to be competitive with our products, services, systems, platforms or technologies; (ii) engage in, have any financial interest or management position in, or solicit to anyone else to engage in, any business that competes directly with our business operations; or (iii) solicit any of our employees to work for an entity in which the local selling agent has a financial interest or management position. Upon the expiration of the non-compete provisions, the local selling agent will not be prevented from conducting business with our competitors and our competitors may benefit from the knowledge our local selling agent gained through our strategic relationship, although the local selling agent must surrender any records and files immediately upon termination of the agreement. We generally pay the local selling agent a commission based on sales they generate. In the year ended December 31, 2010, these strategic relationships generated approximately $15.9 million, or 20% of our revenues. If any of our local selling agents terminates its relationship with us, we could lose a significant portion, and in some cases all, of the revenue from that jurisdiction. If any of our strategic relationships were terminated or if our local selling agents failed to effectively aid in the growth of our business, our business, financial conditions and results of operations could be materially adversely affected.
19
Expansion into international markets is important to our long-term success, and our limited experience in operating our business in certain locations outside the United States increases the risk that our international expansion efforts will not be successful.
Other than our Israeli research and development facility, we opened our first office outside the United States in 2002. Expansion into new international markets requires additional management attention and resources in order to tailor our solutions to the unique aspects of each country. As of December 31, 2010, we had approximately 75% of our employees located outside the United States. In the year ended December 31, 2010, we generated approximately 74% of our revenues from our operations outside the United States. In addition, we face the following additional risks associated with our expansion into locations outside the United States:
· challenges caused by distance, language and cultural differences;
· longer payment cycles in some countries;
· credit risk and higher levels of payment fraud;
· legal and regulatory restrictions;
· currency exchange rate fluctuations;
· foreign exchange controls that might prevent us from repatriating cash earned in countries outside the United States;
· political and economic instability and export restrictions;
· potentially adverse tax consequences; and
· higher costs associated with doing business internationally.
These risks could harm our international expansion efforts, which could have a materially adverse effect on our business, financial condition or results of operations.
Our inability to protect our intellectual property rights could reduce the value of our solutions, services and brand or permit competitors to more easily compete with us and have a material adverse effect on our business, financial condition and results of operations.
Our know-how and trade secrets related to the Internet advertising industry are an important aspect of our intellectual property rights. To protect our know-how and trade secrets, we customarily require our employees, customers, and third-party collaborators to execute confidentiality agreements or otherwise agree to keep our proprietary information confidential when their relationship with us begins. Typically, our employment contracts also include clauses requiring our employees to assign to us all inventions and intellectual property rights they develop in the course of their employment and to agree not to disclose our confidential information. Despite our efforts, our know-how and trade secrets could be disclosed to third parties, which could cause us to lose any competitive advantage resulting from such know-how or trade secrets. Because software is stored electronically and thus is highly portable, we attempt to reduce the portability of our software by physically protecting our servers through the use of closed networks and with physical security systems which prevent their external access. We also seek to minimize disclosure of our source code to customers or other third parties. We cannot be certain, however, that such measures will adequately prevent third parties from accessing our software, code or proprietary information.
From time to time, we may discover that third parties are infringing or otherwise violating our intellectual property rights. We are also aware of third parties that use trademarks or names similar to ours and there may be other third parties using trademarks or names similar to ours of whom we are unaware. Monitoring unauthorized use of intellectual property is difficult and protecting our intellectual property rights could be costly and time consuming. To protect our intellectual property rights, we may become involved in litigation, which could result in substantial expenses, divert the attention of management, cause significant delays, materially disrupt the conduct of our business or adversely affect our revenue, financial condition and results of operations. We may choose not to pursue patents or other protection for innovations that later turn out to be important or we may choose not to enforce our intellectual property rights. Some foreign laws do not protect intellectual property rights to the same extent as the laws of the United States. If we are unable to adequately protect our trademarks, third parties may use our brand names or trademarks similar to ours in a manner that may cause confusion to our customers and confusion in the market, which could decrease the value of our brand. Any infringement of our intellectual property rights by third parties may eliminate any competitive advantage such intellectual property rights provide and harm our operating results.
20
We have a limited patent portfolio. We have no trademark registrations. While we plan to protect our intellectual property with, among other things, copyright, trade secret, patent and trademark protection, there can be no assurance that:
|
|
·
|
current or future United States or foreign registrations of our intellectual property rights will be approved;
|
|
|
·
|
our issued patents and trademarks will adequately protect the intellectual property rights we use in our business or that such patents and trademarks will not be held invalid or unenforceable if challenged by third parties;
|
|
|
·
|
third parties do not have blocking patents that could be used to prevent us from marketing our own patented products and practicing our own technology;
|
|
|
·
|
we will succeed in protecting our technology adequately in all key jurisdictions in which we or our competitors operate; or
|
|
|
·
|
others will not independently develop similar or competing products or methods or design around any patents that may be issued to us.
|
Third parties may claim we infringe on their intellectual property rights, forcing us to expend substantial resources in resulting litigation, the outcome of which would be uncertain. Any unfavorable outcome of such litigation could have a material adverse effect on our business, financial condition and results of operations.
Companies in the Internet advertising industry often enter into litigation based on allegations of infringement or other violations of intellectual property rights. From time to time we have received and may in the future receive notices or inquiries from third parties regarding our services or the manner in which we conduct our business suggesting that we may be infringing or violating a patent, trademark or other intellectual property right. While we are not currently party to any infringement proceedings with respect to any patents or other intellectual property rights or aware of any third parties planning to pursue such litigation, there can be no assurance that third parties will not pursue claims against us in the future if they believe their intellectual property rights are being infringed. Any intellectual property claims, with or without merit, could be time consuming, expensive to litigate or settle and could divert management resources and attention.
We may not be successful in defending any third-party infringement claims, and as a result of such claims we may have to pay substantial damages or stop conducting our business in the manner that is found to be in violation of such third party’s rights. Further, we may have to seek a license for such intellectual property, which may not be available on reasonable terms, or at all, and may significantly increase our operating expenses. As a result, we may be required to develop alternative non-infringing technology, which could require significant effort and expense. If we cannot license or develop technology for the infringing aspects of our business, we may be forced to limit our solution and service offerings and may be unable to fulfill our obligations to our customers or to compete effectively. Any of these results could have a material adverse effect on our brand name, business, financial condition and results of operations.
In addition, many of our agreements with customers require us to indemnify such customers for third-party intellectual property infringement claims against them. Pursuant to such agreements we may be required to defend such customers against certain claims which could cause us to incur additional costs. An adverse determination in any such proceeding could require that we cease offering the solutions or services that are the subject of such of a determination, procure or develop substitute solutions or services for such customers and/or pay any damages such customers incur as a result of such determination.
21
In addition, we use open source software in connection with our solutions and services. Some open source licenses require users who distribute software containing open source software to make available all or part of such software, which in some circumstances could include valuable proprietary source code of the user. We monitor the use of open source software in our solutions and services to ensure that none is used in a manner that requires us to disclose or grant licenses for our proprietary source code; however, such use could inadvertently occur, in part because open source license terms are often ambiguous. Companies that incorporate open source software into their products have, in the past, faced claims seeking enforcement of open source license provisions and claims asserting ownership of open source software incorporated into their products. Defending such claims or being required to disclose or make available our proprietary source code pursuant to an open source license could adversely affect our business.
Uncertainty regarding a variety of United States and foreign laws may expose us to liability and adversely affect our ability to offer our solutions and services.
The laws relating to the liability of providers of online services for activities of their customers and users are currently unsettled both within the United States and abroad. Claims have been threatened and filed under both United States and foreign law for defamation, libel, invasion of privacy and other data protection claims, tort, unlawful activity, copyright or trademark infringement, or other theories based on the nature and content of the advertisements posted or the content generated by our customers. From time to time we have received notices from individuals who do not want to be exposed to advertisements delivered by us on behalf of our customers. If one of these complaints results in liability to us, it could be costly, encourage similar lawsuits, distract management and harm our reputation and possibly our business. In addition, increased attention focused on these issues and legislative proposals could harm our reputation or otherwise negatively affect the growth of our business.
There is also uncertainty regarding the application to us of existing laws regulating or requiring licenses for certain advertisers’ businesses, including, for example, distribution of pharmaceuticals, adult content, financial services, alcohol or firearms. Existing or new legislation could expose us to substantial liability, restrict our ability to deliver services to our customers and post ads for various industries, limit our ability to grow and cause us to incur significant expenses in order to comply with such laws and regulations.
Several other federal laws could also expose us to liability and impose significant additional costs on us. For example, the Digital Millennium Copyright Act has provisions that limit, but do not eliminate, our liability for listing or linking to third-party web sites that include materials that infringe copyrights or other rights, so long as we comply with the statutory requirements of the Act. In addition, the Children’s Online Privacy Protection Act restricts the ability of online services to collect information from minors and the Protection of Children from Sexual Predators Act of 1998 requires online service providers to report evidence of violations of federal child pornography laws under certain circumstances. Compliance with these laws and regulations is complex and any failure on our part to comply with these regulations may subject us to additional liabilities.
Privacy concerns could lead to legislative and other limitations on our ability to collect usage data from Internet users, including limitations on our use of cookie or conversion tag technology and user profiling, which is crucial to our ability to provide our solutions and services to our customers.
Our ability to conduct targeted advertising campaigns and compile data that we use to formulate campaign strategies for our customers depends on the use of “cookies” and “conversion tags” to track Internet users and their online behavior, which allows us to build anonymous user profiles and measure an advertising campaign’s effectiveness. A cookie is a small file of information stored on a user’s computer that allows us to recognize that user’s browser when we serve advertisements. A conversion tag functions similarly to a banner advertisement, except that the conversion tag is not visible. Our conversion tags may be placed on specific pages of clients of our customers’ or prospective customers’ websites. Government authorities inside the United States concerned with the privacy of internet users have suggested limiting or eliminating the use of cookies, conversion tags or user profiling. Bills aimed at regulating the collection and use of personal data from Internet users are currently pending in U.S. Congress and many state legislatures. Attempts to regulate spyware may be drafted in such a way as to include technology like cookies and conversion tags in the definition of spyware, thereby creating restrictions that could reduce our ability to use them. In addition, the Federal Trade Commission and the Department of Commerce have conducted hearings regarding user profiling, the collection of non-personally identifiable information and online privacy.
22
Our foreign operations may also be adversely affected by regulatory action outside the United States. For example, the European Union has adopted a directive addressing data privacy that limits the collection, disclosure and use of information regarding European Internet users. In addition, the European Union has enacted an electronic communications directive that imposes certain restrictions on the use of cookies and conversion tags and also places restrictions on the sending of unsolicited communications. Each European Union member country was required to enact legislation to comply with the provisions of the electronic communications directive by October 31, 2003 (though not all have done so). Germany has also enacted additional laws limiting the use of user profiling, and other countries, both in and out of the European Union, may impose similar limitations.
Internet users may also directly limit or eliminate the placement of cookies on their computers by using third-party software that blocks cookies, or by disabling or restricting the cookie functions of their Internet browser software. Internet browser software upgrades may also result in limitations on the use of cookies or conversion tags. Technologies like the Platform for Privacy Preferences Project (P3P) may limit collection of cookie and conversion tag information. Individuals have also brought class action suits against companies related to the use of cookies and several companies, including companies in the Internet advertising industry, have had claims brought against them before the Federal Trade Commission regarding the collection and use of Internet user information. We may be subject to such suits in the future, which could limit or eliminate our ability to collect such information.
If our ability to use cookies or conversion tags or to build user profiles were substantially restricted due to the foregoing, or for any other reason, we would have to generate and use other technology or methods that allow the gathering of user profile data in order to provide our services to our customers. This change in technology or methods could require significant reengineering time and resources, and may not be complete in time to avoid negative consequences to our business. In addition, alternative technology or methods might not be available on commercially reasonable terms, if at all. If the use of cookies and conversion tags are prohibited and we are not able to efficiently and cost effectively create new technology, our business, financial condition and results of operations would be materially adversely affected.
In addition, any compromise of our security that results in the release of internet users’ and/or our customers’ data could seriously limit the adoption of our solutions and services as well as harm our reputation and brand, expose us to liability and subject us to reporting obligations under various state laws, which could have an adverse effect on our business. The risk that these types of events could seriously harm our business is likely to increase as the amount of data we store for our customers on our servers (including personal information) and the number of countries where we operate has been increasing, and we may need to expend significant resources to protect against security breaches, which could have an adverse effect on our business, financial condition or results of operations.
The loss of key personnel or the inability to attract and retain the necessary qualified personnel could materially and adversely affect our business, financial condition or results of operations or our ability to grow.
Our future success depends in a large part upon the continued service of key personnel and members of our senior management team. In particular, members of our senior management team are critical to the overall successful management of Media Mind as well as the development of our technology, culture and strategic direction. All of our executive officers and key personnel are employed at-will and we do not maintain key-person life insurance policies for any members of our senior management team (except for our Chief Executive Officer, Mr. Gal Trifon). The loss of key personnel or members of our management team could have a material adverse effect on our business, financial condition and results of operations.
Our future success will also depend in a large part upon our ability to attract, retain and motivate highly skilled managerial, research, selling and marketing, information technology, software engineering and other technical personnel. Competition for qualified employees in our industry is intense and we are aware that certain of our competitors have directly targeted our employees. As our business grows, it may be more difficult to recruit the additional number of highly skilled personnel we need in a timely manner. In addition, as we become a more mature company, we may find our recruiting efforts more challenging. The incentives to attract, retain and motivate employees provided by our option grants or by future arrangements, such as through cash bonuses, may not be as effective as in the past. If we do not succeed in attracting excellent personnel or retaining or motivating existing personnel, we may be unable to grow effectively, which could have a material adverse effect on our business, financial condition and results of operations.
23
The options held by some of our senior management and key employees are fully vested. Consequently, these employees may not have sufficient financial incentive to stay with us.
Some of our senior management personnel and other key employees have become substantially vested in their initial stock option grants. This includes our Chief Executive Officer, Chief Financial Officer, Chief Solutions Officer and Vice President, Global Sales. While we often grant additional stock options to management personnel and other key employees after their hire dates to provide additional incentives to remain employed by us, their initial grants are usually much larger than follow-on grants. Employees may be more likely to leave us after their initial option grants fully vest, especially if the shares underlying the options have significantly appreciated in value relative to the option exercise price. If a significant number of employees or a group of key personnel or members of the management team no longer have an incentive to remain employed by us, they may leave and it may be difficult to replace these employees in a timely manner, which could have a material adverse effect on our business, financial condition and results of operations.
The unsuccessful integration of any businesses in future acquisitions could result in operating difficulties, dilution and other harmful consequences on our results of operations.
We have limited experience acquiring companies and the companies we have acquired have all been small acquisitions of our selling agents in particular countries. We have in the past evaluated, and expect to continue to evaluate, a wide array of potential strategic acquisitions and, from time to time, we may engage in discussions regarding potential acquisitions. Any of these transactions could be material to our business, financial condition and results of operations. Future acquisitions could result in potentially dilutive issuances of our equity securities, the incurrence of debt, contingent liabilities or amortization expenses, or write-offs of goodwill, any of which could harm our financial condition. In addition, the process of integrating an acquired company, business or technology is risky and may create unforeseen operating difficulties and expenditures, including:
|
|
·
|
difficulties in integrating the operations, technologies, services and personnel of acquired businesses;
|
|
|
·
|
ineffectiveness or incompatibility of acquired technologies or services;
|
|
|
·
|
additional financing required to make contingent payments;
|
|
|
·
|
unavailability of favorable financing for future acquisitions;
|
|
|
·
|
potential loss of key employees of acquired businesses and cultural challenges associated with integrating employees from the acquired company into our organization;
|
|
|
·
|
inability to maintain the key business relationships and the reputations of acquired businesses;
|
|
|
·
|
responsibility for liabilities of acquired businesses;
|
|
|
·
|
diversion of management’s attention from other business concerns;
|
|
|
·
|
inability to maintain our standards, controls, procedures and policies, which could affect our ability to receive an unqualified attestation from our independent accountants regarding management’s required assessment of the effectiveness of our internal control structure and procedures for financial reporting; and
|
|
|
·
|
increased fixed costs.
|
Foreign acquisitions involve additional risks to those described above, including those related to integration of operations across different cultures and languages, currency risks and the particular economic, political and regulatory risks associated with specific countries. Additionally, the anticipated benefit of many of our future acquisitions may not materialize. If we are unsuccessful in smoothly integrating an acquired company, our business, financial condition and results of operations may be materially adversely affected.
We may need additional financing in the future, which we may be unable to obtain.
We may need additional funds to finance our operations in the future, as well as to enhance our solutions and services, respond to competitive pressures or acquire complementary businesses or technologies. We may be unable to obtain financing on terms favorable to us, if at all. Poor financial results, unanticipated expenses or unanticipated opportunities that require financial commitments could give rise to additional financing requirements sooner than we currently expect. If we raise additional funds through the issuance of equity or convertible debt securities, this may reduce the percentage ownership of our existing stockholders, and these securities might have rights, preferences or privileges senior to those of our common stock. Debt financing may also require us to comply with restrictive covenants that could impair our business and financial flexibility. If adequate funds are not available or are not available on acceptable terms, our ability to enhance our solutions and services, respond to competitive pressures or take advantage of business opportunities would be significantly limited, and we might need to significantly restrict our operations.
24
Fluctuations in currency exchange rates may affect our results of operations.
We conduct business in a large number of countries in the Americas, Europe, Asia, Australia, Latin America and the Middle East. Most of our revenues are generated in U.S. dollars, the euro, the Australian dollar and the British pound sterling. Most of our expenses are denominated in U.S. dollars, the new Israeli shekel, the British pound sterling and the euro. In the future, the percentage of our revenues earned in other currencies may increase as we further expand our sales internationally. Accordingly, we are subject to the risk of exchange rate fluctuations between such other currencies and the dollar.
We currently do not use hedging instruments to mitigate foreign currency exchange risks except to hedge our expenses denominated in new Israeli shekels, and this hedging program, as well as any other hedging programs we may implement in the future to mitigate currency exchange rate risk, may not fully or adequately eliminate our exposure to foreign exchange fluctuations.
We may have exposure to greater than anticipated tax liabilities.
The amount of income tax that we pay could be adversely affected by earnings being lower than anticipated in jurisdictions where we have lower statutory rates and higher than anticipated in jurisdictions where we have higher statutory rates. In particular, we have endeavored to structure our activities in a manner so that most of our income is not subject to tax outside of Israel. Taxing authorities outside of Israel, however, could contend that a larger portion of such income is subject to tax in their jurisdictions, which may have higher tax rates than the rates applicable to such income in Israel. In addition, we have entered into transfer pricing arrangements that establish transfer prices for our intercompany operations. However, our transfer pricing procedures are not binding on the applicable taxing authorities. No official authority in any country has made a determination as to whether or not we are operating in compliance with its transfer pricing laws. Accordingly, taxing authorities in any of these countries could challenge our transfer prices and require us to adjust them to reallocate our income. Any change to the allocation of our income as a result of review by such taxing authorities could have a negative effect on our operating results and financial condition. In addition, the determination of our worldwide provision for income taxes and other uncertain tax liabilities requires significant judgment and there are many transactions and calculations where the ultimate tax determination is uncertain. Although we believe our estimates are reasonable, the ultimate outcome may differ from the amounts recorded in our financial statements and may materially affect our financial results in the period or periods for which such determination is made.
The Israeli tax benefits that we currently receive require us to meet several conditions and may be terminated or reduced in the future, which would increase our taxes, possibly with a retroactive effect.
Some of our investments in Israeli facilities have been granted “Approved Enterprise” status by the Investment Center in the Israeli Ministry of Industry Trade and Labor. In addition, we have elected to treat some of our investments in Israeli facilities as a “Privileged Enterprise” under the Law for Encouragement of Capital Investments, 1959, or the Investment Law. Income that is attributable to an Approved Enterprise or Privileged Enterprise (if it meets the relevant qualification requirements of applicable law) is eligible for tax benefits under the Investment Law. The availability of the tax benefits is subject to certain requirements, including, among other things, making specified investments in fixed assets and equipment, financing a percentage of those investments with our capital contributions, filing certain reports with the Investment Center and complying with Israeli intellectual property laws.
25
Generally, income attributed to the Approved Enterprise and Privileged Enterprise is exempt from tax for a certain period, or the Exemption Period, subject to certain conditions and limitations, and may qualify for a reduced corporate tax rate of 10% to 25% for additional limited periods after the Exemption Period, depending on, among other things, the percentage of foreign investment in a company and the location of its facilities. If we do not meet the relevant eligibility requirements for the tax benefits discussed above, these tax benefits may be cancelled (possibly with retroactive effect) and our Israeli taxable income would be subject to regular Israeli corporate tax rates. Under current law, in certain cases, starting 2011, the standard Israeli corporate tax rate may be lower than the rate applicable to income of Approved Enterprises and Privileged Enterprises after the Exemption Period. The standard corporate tax rate for Israeli companies in 2006 was 31 % of their taxable income. It declined to 29% in 2007, 27% in 2008, 26% in 2009, 25% in 2010 and is scheduled to decline to 24% in 2011, 23% in 2012, 22% in 2013, 21% in 2014, 20% in 2015 and 18% in 2016 and thereafter. In addition, we could be required to refund any tax benefits that we have already received plus interest and penalties thereon. The tax benefits that our current Approved Enterprise and Privileged Enterprise programs receive may not be continued in the future at their current levels or at all. If these tax benefits were reduced or eliminated, the amount of taxes that we pay would likely increase as we would be subject to regular Israeli corporate tax rates, which could adversely affect our results of operations. Additionally, if we increase our activities outside of Israel, for example, by acquisitions, our increased activities may not be eligible for inclusion in Israeli tax benefit programs. Finally, in the event of a distribution of a dividend from the above mentioned exempt income, the amount distributed will be subject to corporate tax at the rate applicable to the Approved Enterprise’s and Privileged Enterprise’s income during the Exemption Period absent exemption in addition to withholding tax. Distribution of dividends attributable to income that was not exempt as described above will be subject, in Israel, only to withholding tax.
The obligations associated with being a public company require significant resources and management attention.
We completed our initial public offering on August 10, 2010. As a public company, we incur significant legal, accounting and other expenses that we did not previously incur. We are subject to the reporting requirements of the Exchange Act and the Sarbanes-Oxley Act of 2002 (the “Sarbanes-Oxley Act”). The Securities Exchange Act of 1934, as amended, (the “Exchange Act”), requires that we file annual, quarterly and current reports with respect to our business and financial condition. The Sarbanes-Oxley Act requires, among other things, that we establish and maintain effective internal controls and procedures for financial reporting. Furthermore, the need to continue to establish the corporate infrastructure demanded of a public company may divert management’s attention from implementing our growth strategy, which could prevent us from improving our business, results of operations and financial condition. We have made, and will continue to make, changes to our internal controls and procedures for financial reporting and accounting systems to meet our reporting obligations as a public company. However, the measures we take may not be sufficient to satisfy our obligations as a public company. In addition, we cannot predict or estimate the amount of additional costs we may incur in order to comply with these requirements.
Section 404 of the Sarbanes-Oxley Act requires annual management assessments of the effectiveness of our internal control over financial reporting, starting with the second annual report that we file with the SEC, and will require in the same report, a report by our independent registered public accounting firm on the effectiveness of our internal control over financial reporting. In connection with the implementation of the necessary procedures and practices related to internal control over financial reporting, we may identify deficiencies that we may not be able to remediate in time to meet the deadline imposed by the Sarbanes-Oxley Act for compliance with the requirements of Section 404. If we fail to comply with Section 404, we could be subject to regulatory scrutiny and sanctions, our ability to raise revenue could be impaired, investors may lose confidence in the accuracy and completeness of our financial reports and our stock price could be adversely affected.
It may be difficult to enforce a U.S. judgment against us, our directors and officers and the Israeli experts named in this annual report outside the United States, or to assert U.S. securities laws claims outside of the United States.
The majority of our directors and executive officers are not residents of the United States, and the majority of our assets and the assets of these persons are located outside the United States. Therefore, it may be difficult to enforce a U.S. court judgment based upon the civil liability provisions of the U.S. federal securities laws against us or any of these persons in a U.S. or foreign court, or to effect service of process upon these persons in the United States, Additionally, it may be difficult to assert U.S. securities law claims in actions originally instituted outside of the United States. Foreign courts may refuse to hear a U.S. securities law claim because foreign courts may not be the most appropriate forums in which to bring such a claim. Even if a foreign court agrees to hear a claim, it may determine that the law of the jurisdiction in which the foreign court resides, and not U.S. law, is applicable to the claim. Further, if U.S. law is found to be applicable, the content of applicable U.S. law must be proved as a fact, which can be a time-consuming and costly process, and certain matters of procedure would still be governed by the law of the jurisdiction in which the foreign court resides. As a result of the difficulty associated with enforcing a judgment against us, you may not be able to collect any damages awarded by either a U.S. or foreign court.
26
We have significant operations in Israel, which may be adversely affected by acts of terrorism or major hostilities.
We are subject to a number of risks and challenges that specifically relate to our Israeli operations, which includes our primary research and development facilities located in Ra’anana, Israel. Since the establishment of the State of Israel in 1948, a number of armed conflicts have occurred between Israel and its Arab neighbors. Any hostilities involving Israel or any acts of terrorism or other major hostilities in the Middle East could harm our Israeli operations and make it more difficult to conduct our operations in Israel. Any such effects may also not be covered by insurance. Our Israeli operations may not be successful if we are affected by these challenges, which could limit the growth of our business and may have a material adverse effect on our business, financial condition and results of operations as a whole. Additionally, in early 2011, riots and popular uprisings in various countries in the Middle East have led to severe political instability in those countries the effects of which we are unable to predict.
Risks Related to Our Common Stock
The market price and trading volume of our common stock may be volatile, which could result in substantial losses for you.
Shares of our Common Stock are listed on the NASDAQ Global Select Market. The market price of our common stock may be highly volatile and could be subject to wide fluctuations. In addition, the trading volume in our common stock may fluctuate and cause significant price variations to occur, which may limit or prevent investors from readily selling their common stock and may otherwise negatively affect the liquidity of our common stock. We cannot provide any assurance that the market price of our common stock will not fluctuate or decline significantly in the future. Some of the factors that may cause the market price of our common stock or trading volume to fluctuate include:
· fluctuations in our quarterly financial results or the quarterly financial results of companies perceived to be similar to us;
· changes in estimates of our financial results or recommendations by securities analysts;
· failure of any of our solutions and services to achieve or maintain market acceptance;
· failure to develop or deliver our solutions and services;
· changes in market valuations of similar companies;
· success of competitive solutions and services;
· changes in our capital structure, such as future issuances of securities or the incurrence of debt;
· sales of large blocks of our common stock;
· announcements by us or our competitors of significant solutions and services, contracts, acquisitions or strategic alliances;
· regulatory developments in the United States, foreign countries or both;
· litigation involving our company, our general industry or both;
· additions or departures of key personnel;
· investors’ general perception of us, including any perception of misuse of sensitive information;
27
· changes in general economic, industry and market conditions;
· our ability to forecast revenue and control our costs; and
· changes in regulatory and other dynamics.
In addition, if the market for stocks in our industry, or the stock market in general, experiences a loss of investor confidence, the trading price of our common stock could decline for reasons unrelated to our business, financial condition or results of operations. If any of the foregoing occurs, it could cause our stock price to fall and may expose us to lawsuits that, even if unsuccessful, could be costly to defend and a distraction to management.
Future sales of our common stock, or the perception that such sales may occur, could depress our common stock price.
On February 25, 2011, the lock-up agreements entered into in connection with our initial public offering expired and substantially all our stock became freely tradable (subject in the case of stock held by affilaites to volume and other restrictions imposed by Rule 144 under the Securities Act). As restrictions on resale have ended, the market price of our common stock could drop significantly if the holders of these shares sell them or are perceived by the market as intending to sell them. These factors could also make it more difficult for us to raise additional funds through future offerings of our common stock or other securities.
If equity research analysts do not publish research or reports about our business or if they issue unfavorable commentary or downgrade our common stock, the price of our common stock could decline.
The trading market for our common stock relies in part on the research and reports that equity research analysts publish about us and our business. The price of our stock could decline if one or more securities analysts downgrade our stock or if those analysts issue other unfavorable commentary or cease publishing reports about us or our business.
Provisions in our Amended and Restated Certificate of Incorporation and By-laws and Delaware law might discourage, delay or prevent a change of control of our company or changes in our management and, therefore, depress the trading price of our common stock.
Provisions of our amended and restated certificate of incorporation and by-laws and Delaware law may discourage, delay or prevent a merger, acquisition or other change in control that stockholders may consider favorable, including transactions in which you might otherwise receive a premium for your shares of our common stock. These provisions may also prevent or frustrate attempts by our stockholders to replace or remove our management. These provisions include:
|
|
·
|
provisions relating to creating a board of directors that is divided into three classes with staggered terms;
|
|
|
·
|
limitations on the removal of directors;
|
|
|
·
|
advance notice requirements for stockholder proposals and director nominations;
|
|
|
·
|
the inability of stockholders to act by written consent or to call special meetings;
|
|
|
·
|
the ability of our board of directors to make, alter or repeal our by-laws; and
|
|
|
·
|
the ability of our board of directors to designate the terms of and issue new series of preferred stock without stockholder approval.
|
Generally, the amendment of our amended and restated certificate of incorporation requires approval by our board of directors and a majority vote of stockholders. However, certain material amendments (including amendments with respect to provisions governing board composition, actions by written consent, and special meetings) require the approval of at least 66 2/3% of the votes entitled to be cast by the outstanding capital stock in the election of our board of directors. Any amendment to our by-laws requires the approval of either a majority of our board of directors or at least 66 2/3% of the votes entitled to be cast by the holders of our outstanding capital stock in the election of our board of directors.
28
The existence of the foregoing provisions and anti-takeover measures could limit the price that investors might be willing to pay in the future for shares of our common stock. They could also deter potential acquirers of our company, thereby reducing the likelihood that you could receive a premium for your common stock in an acquisition.
We do not currently intend to pay dividends on our common stock and, consequently, your ability to achieve a return on your investment will depend on appreciation in the price of our common stock.
We have never declared or paid any cash dividend on our capital stock. We do not intend to pay any cash dividends on our common stock for the foreseeable future. We currently intend to invest our future earnings, if any, to fund our growth, including growth through acquisitions. The payment of any future dividends will be determined by the board of directors in light of conditions then existing, including our earnings, financial condition and capital requirements, business conditions, corporate law requirements and other factors.
The Company has no unresolved SEC staff comments.
ITEM 2. PROPERTIES.
Our headquarters are in New York, New York, where we currently lease approximately 11,000 square feet under a lease expiring in January 2015. We also lease office space in Ra’anana, Israel; London, England; Chicago, Illinois; Los Angeles, California; San Francisco, California; Paris, France; Sydney, Australia; Barcelona, Spain; Madrid, Spain; Hamburg, Germany; Sao Paulo, Brazil; Mexico City, Mexico, Tokyo, Japan, Guang Zhou, Beijing, and Shanghai China, and Taiwan under leases expiring at various times between April 2011 and August 2015. We intend to move to new leased offices in Herzelia, Israel in April 2011. The lease expires in March 2021. We believe that our properties are in good operating condition and adequately serve our current business operations. We anticipate that suitable additional or alternative space, including those under lease options, will be available at commercially reasonable terms for future expansion.
ITEM 3. LEGAL PROCEEDINGS.
From time to time we are a party to various litigation matters incidental to the conduct of our business. There is no pending or threatened legal proceeding to which we are a party that, in our opinion, is likely to have a material adverse effect on our future financial results.
ITEM 4. (REMOVED AND RESERVED).
PART II
ITEM 5. MARKET FOR REGISTRANT’S COMMON EQUITY, RELATED STOCKHOLDER MATTERS AND ISSUER PURCHASES OF EQUITY SECURITIES.
Our common stock began trading on the NASDAQ on August 11, 2010 under the symbol "MDMD". Prior to this, there was no public market for our common stock. On March 6, 2011, there were approximately 58 holders of record of our common stock. This figure does not reflect the beneficial ownership of shares held in nominee name.
The table below sets forth for the periods indicated the high and low sales prices per share of our common stock reported on the NASDAQ since our IPO.
29
|
Common Stock
Price Range
|
||||||||
|
High
|
Low
|
|||||||
|
Fiscal 2010
|
||||||||
|
1st Quarter
|
$ | N/A | $ | N/A | ||||
|
2nd Quarter
|
N/A | N/A | ||||||
|
3rd Quarter – August 11, 2010 (date of IPO) through September 30, 2010
|
15.60 | 10.95 | ||||||
|
4th Quarter
|
14.99 | 11.87 | ||||||
On December 31, 2010, there were 18,530,503 shares outstanding. Our authorized number of shares of common stock is 89,000,000 shares. The closing price per share of our common stock on March 7, 2011 was The closing price per share of our common stock on March 7, 2011 was $13.47.
We have never declared or paid any cash dividends on our capital stock. We do not intend to pay any dividends in the foreseeable future and currently intend to retain all future earnings to finance the operation of our business and to expand our business. Any future determination relating to our dividend policy will be made at the discretion of our board of directors and will depend on a number of factors, including future earnings, capital requirements, contractual restrictions, financial condition and future prospects and other factors our board of directors may deem relevant.
Use of Proceeds from Registered Securities
Our initial public offering of common stock was effected through a Registration Statement on Form S-1 (File No. 333-165379) that was declared effective by the Securities and Exchange Commission on August 10, 2010, which registered an aggregate of 5,413,703 shares of our common stock, including 413,703 shares related to the underwriters’ over-allotment option, for the net aggregate amount of approximately $56 million (after deduction of underwriters’ discounts and offering expenses). There was no material change in the use of proceeds from our initial public offering as described in our final prospectus filed with the SEC pursuant to Rule 424(b). To date we have invested the net proceeds in short term deposits.
Performance Graph—Total Stockholder Return
The following graph compares the cumulative total stockholder return on our common stock from August 11, 2010 (the date our common stock began trading on NASDAQ) through December 31, 2010, with the cumulative total return of the Russell 2000 Growth Index, and the NASDAQ. The graph assumes an investment of $100 in our common stock and in each of the two indices on August 11, 2010 and the reinvestment of all dividends, if any. The initial public offering price of our common stock was $11.50 per share.
We have used the Russell 2000 Growth Index in lieu of (a) a published industry or line-of business index or (b) peer issuers. We are the only major provider of integrated campaign management solutions not committed to, or affiliated with, a particular publisher, agency or agency group, or advertising network. Therefore, we do not believe that a relevant published industry or line-of-business index exists for us, and we are unable to reasonably identify peer issuers.
30
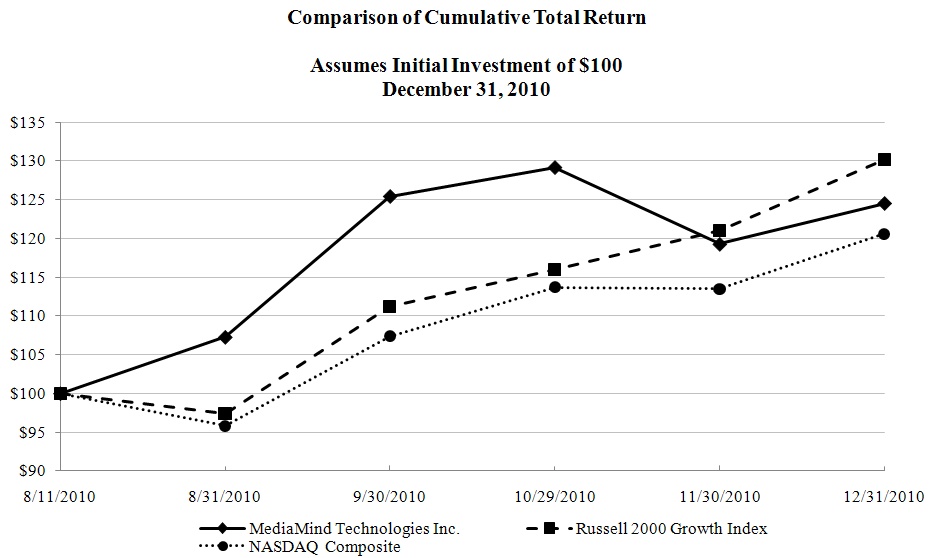
The following selected consolidated financial data of MediaMind should be read in conjunction with, and are qualified by reference to, Part II—Item 7 “Management’s Discussion and Analysis of Financial Condition and Results of Operation” and the consolidated financial statements and notes thereto included in Part II—Item 8. The consolidated statements of income and cash flows data for the years ended December 31, 2008, 2009, and 2010 and the consolidated balance sheet data as of December 31, 2009 and 2010 are derived from our audited consolidated financial statements included elsewhere in Part II—Item 8 of this Annual Report. The consolidated statements of income and cash flows data for the years ended December 31, 2006 and 2007 and the consolidated balance sheet data as of December 31, 2006, 2007 and 2008 are derived from our audited consolidated financial statements not included in this Annual Report.
31
|
Year Ended December 31,
|
||||||||||||||||||||
|
2006
|
2007
|
2008
|
2009
|
2010
|
||||||||||||||||
|
(U.S. dollars in thousands, except per share data)
|
||||||||||||||||||||
|
Consolidated Statements of Income Data:
|
||||||||||||||||||||
|
Revenues
|
$ | 27,659 | $ | 44,737 | $ | 63,775 | $ | 65,075 | $ | 80,846 | ||||||||||
|
Cost of revenues
|
2,700 | 3,243 | 3,520 | 3,306 | 4,289 | |||||||||||||||
|
Gross profit
|
24,959 | 41,494 | 60,255 | 61,769 | 76,557 | |||||||||||||||
|
Operating expenses:
|
||||||||||||||||||||
|
Research and development
|
2,428 | 4,525 | 7,443 | 6,844 | 9,148 | |||||||||||||||
|
Selling and marketing
|
13,554 | 23,484 | 34,936 | 36,530 | 45,932 | |||||||||||||||
|
General and administrative
|
4,575 | 5,990 | 10,292 | 6,201 | 8,259 | |||||||||||||||
|
Total operating expenses
|
20,557 | 33,999 | 52,671 | 49,575 | 63,339 | |||||||||||||||
|
Operating income
|
4,402 | 7,495 | 7,584 | 12,194 | 13,218 | |||||||||||||||
|
Financial income (expenses), net
|
162 | 1,077 | 753 | 80 | 577 | |||||||||||||||
|
Income before income taxes
|
4,564 | 8,572 | 8,337 | 12,274 | 13,795 | |||||||||||||||
|
Income taxes
|
838 | 1,213 | 2,175 | 2,446 | 3,843 | |||||||||||||||
|
Net income
|
3,726 | 7,359 | 6,162 | 9,828 | 9,952 | |||||||||||||||
|
Deemed dividend upon repurchase of preferred stock
|
— | (3,469 | ) | — | — | — | ||||||||||||||
|
Accretion of preferred stock dividend preference (1)
|
(401 | ) | (558 | ) | (821 | ) | (1,617 | ) | (1,292 | ) | ||||||||||
|
Net income attributable to common stockholders
|
$ | 3,325 | $ | 3,332 | $ | 5,341 | $ | 8,211 | $ | 8,660 | ||||||||||
|
Net income per share:
|
||||||||||||||||||||
|
Basic
|
$ | 1.18 | $ | 0.52 | $ | 0.64 | $ | 0.98 | $ | 0.70 | ||||||||||
|
Diluted
|
$ | 0.29 | $ | 0.29 | $ | 0.43 | $ | 0.68 | $ | 0.54 | ||||||||||
|
Weighted average number of shares of common stock used in computing net income per share (in thousands):
|
||||||||||||||||||||
|
Basic
|
2,829 | 6,391 | 8,380 | 8,397 | 12,394 | |||||||||||||||
|
Diluted
|
12,854 | 13,212 | 14,358 | 14,352 | 18,273 | |||||||||||||||
|
Year Ended December 31,
|
||||||||||||||||||||
|
2006
|
2007
|
2008
|
2009
|
2010
|
||||||||||||||||
|
(U.S. dollars in thousands, except per share data)
|
||||||||||||||||||||
|
Other Data:
|
||||||||||||||||||||
|
Adjusted EBITDA (2)
|
$ | 5,032 | $ | 9,343 | $ | 11,393 | $ | 16,697 | $ | 19,946 | ||||||||||
|
Capital expenditures
|
927 | 1,447 | 1,425 | 1,251 | 4,347 | |||||||||||||||
|
Consolidated Statements of Cash Flow Data:
|
||||||||||||||||||||
|
Net cash provided by operating activities
|
$ | 1,952 | $ | 5,758 | $ | 8,738 | $ | 10,311 | $ | 11,824 | ||||||||||
|
Net cash provided by (used in) investing activities
|
(265 | ) | (13,278 | ) | 13,164 | (21,633 | ) | (62,155 | ) | |||||||||||
|
Net cash provided by financing activities
|
10 | 7,839 | 121 | 45 | 56,463 | |||||||||||||||
32
|
Year Ended December 31,
|
||||||||||||||||||||
|
2006
|
2007
|
2008
|
2009
|
2010
|
||||||||||||||||
|
(U.S. dollars in thousands, except per share data)
|
||||||||||||||||||||
|
Consolidated Balance Sheet Data:
|
||||||||||||||||||||
|
Cash and cash equivalents
|
$ | 4,619 | $ | 4,895 | $ | 26,160 | $ | 15,363 | $ | 21,484 | ||||||||||
|
Short-term deposits
|
— | — | — | 18,357 | 75,873 | |||||||||||||||
|
Short-term marketable securities
|
3,299 | 15,310 | 544 | — | — | |||||||||||||||
|
Trade receivables
|
12,628 | 16,872 | 15,779 | 22,104 | 25,604 | |||||||||||||||
|
Total assets
|
23,411 | 42,028 | 49,452 | 66,890 | 139,629 | |||||||||||||||
|
Total stockholders’ equity
|
9,228 | 33,791 | 40,586 | 54,815 | 126,370 | |||||||||||||||
________________
|
(1)
|
Represents dividends accrued on preferred stock. Following our 2010 initial public offering, we have no outstanding preferred stock.
|
|
(2)
|
The following table reconciles net income to Adjusted EBITDA for the periods presented and is unaudited:
|
|
Year Ended December 31,
|
||||||||||||||||||||
|
2006
|
2007
|
2008
|
2009
|
2010
|
||||||||||||||||
|
(U.S. dollars in thousands, except per share data)
|
||||||||||||||||||||
|
Reconciliation of Net Income to Adjusted EBITDA:
|
||||||||||||||||||||
|
Net income
|
$ | 3,726 | $ | 7,359 | $ | 6,162 | $ | 9,828 | $ | 9,952 | ||||||||||
|
Financial income, net
|
162 | 1,077 | 753 | 80 | 577 | |||||||||||||||
|
Taxes on income
|
838 | 1,213 | 2,175 | 2,446 | 3,843 | |||||||||||||||
|
Depreciation and amortization
|
524 | 825 | 1,053 | 1,211 | 2,239 | |||||||||||||||
|
EBITDA
|
$ | 4,926 | $ | 8,320 | $ | 8,637 | $ | 13,405 | $ | 15,457 | ||||||||||
|
Stock-based compensation
|
106 | 1,023 | 2,756 | 3,292 | 4,489 | |||||||||||||||
|
Adjusted EBITDA
|
$ | 5,032 | $ | 9,343 | $ | 11,393 | $ | 16,697 | $ | 19,946 | ||||||||||
|
|
·
|
Adjusted EBITDA is a metric used by management to measure operating performance. EBITDA represents net income before financial income, net, income tax expense and depreciation. We do not have any amortization expense. Adjusted EBITDA represents EBITDA excluding non-cash stock-based compensation expense. We present Adjusted EBITDA as a supplemental performance measure because we believe it facilitates operating performance comparisons from period to period and company to company by backing out potential differences caused by variations in capital structures (affecting financial income, net), tax positions (such as the impact on periods or companies of changes in effective tax rates), the age and book depreciation of fixed assets (affecting relative depreciation expense), and the impact of non-cash stock-based compensation expense. Because Adjusted EBlTDA facilitates internal comparisons of operating performance on a more consistent basis, we also use Adjusted EBITDA in measuring our performance relative to that of our competitors. Adjusted EBITDA is not a measurement of our financial performance under GAAP and should not be considered as an alternative to net income, operating income or any other performance measures derived in accordance with GAAP or as an alternative to cash flow from operating activities as a measure of our profitability or liquidity. We understand that although Adjusted EBITDA is frequently used by securities analysts, lenders and others in their evaluation of companies, Adjusted EBITDA has limitations as an analytical tool, and you should not consider it in isolation, or as a substitute for analysis of our results as reported under GAAP. Some of these limitations are: |
|
|
·
|
Adjusted EBITDA does not reflect our cash expenditures, or future requirements for capital expenditures or contractual commitments;
|
|
|
·
|
Adjusted EBITDA does not reflect changes in, or cash requirements for, our working capital needs;
|
|
|
·
|
although depreciation is a non-cash charge, the assets being depreciated will often have to be replaced in the future, and Adjusted EBITDA does not reflect any cash requirements for such replacements; and
|
|
|
·
|
other companies in our industry may calculate Adjusted EBITDA differently than we do, limiting its usefulness as a comparative measure.
|
33
Forward-Looking Statements
The following discussion should be read in conjunction with our consolidated financial statements and the related notes included thereto. This discussion contains forward-looking statements that are subject to known and unknown risks and uncertainties. Actual results and the timing of events may differ significantly from those expressed or implied in such forward-looking statements due to a number of factors, including those set forth in the in Part I – Item 1A – “Risk Factors” of this Form 10-K.
Overview
We are a leading global provider of digital advertising campaign management solutions to advertising agencies and advertisers. Our goal is to enable advertisers to engage consumers of digital media with more impact and efficiency.
Our integrated campaign management platform, MediaMind, helps advertisers and agencies simplify the complexities of managing their advertising budgets across multiple digital media channels and formats, including online, mobile, rich media, in-stream video, display and search. MediaMind provides our customers with an easy-to-use, end-to-end solution to enhance planning, media buying, creative development, delivery, measurement and optimization of digital media campaigns. As a result, our customers are able to enhance brand awareness, strengthen communications with their customers, increase website traffic and conversion, and improve online and offline sales. Our solutions are delivered through a scalable technology infrastructure that allows delivery of digital media advertising campaigns of any size.
Our Revenues and Expenses
Revenues
We derive our revenues from customers who pay fees to create, execute and measure digital advertising campaigns on MediaMind, our integrated campaign management platform.
Our primary pricing model is based on cost per thousand impressions (“CPM”) delivered by our platform. An “impression” is a single instance of sending an advertisement for display on a web browser or other connected Internet application. Under our primary pricing model, our revenue is the result of multiplying the volume of impressions delivered by the applicable CPM rates. Therefore, we consider growth in the volume of impressions delivered to be a key indicator of our financial condition and operating performance. We have benefited from significant growth in the volume of impressions delivered over time.
Our CPM rates vary based upon a number of factors, including the ad format, the media channel in which the ad is delivered and the geographical location of our customers. Certain of our formats, including rich media and video, generate higher CPMs than others, such as standard display (static design) ads. We do not track our aggregate blended CPM rate since we have found that it does not serve as a meaningful metric due to the variance between the relative volume of impressions delivered in different formats over different periods.
As in many technology businesses, prices in our industry decrease over time for ads delivered in long-existing formats as newer formats gain in popularity. Our ability to provide new and enhanced formats, which can be priced at higher CPM rates than long-existing formats, is important to ensuring that we are able to continue generating revenue and profit growth.
In addition to our focus on delivering new and enhanced CPM formats, we are also focused on growing the standard display and tracking pixel format portions of our business, which have grown rapidly in recent years, as part of our strategy to have our customers use us as their full campaign management platform. By providing a full suite of solutions, including standard display and tracking pixels, our platform becomes a focal point for the advertiser’s data and we are able to deliver more impressions, increase our market share and increase our exposure to new and existing customers, thereby creating additional opportunities for upselling of data driven solutions. Standard display ads and tracking pixels generate lower revenues per impression, but greater volumes, when compared with rich media and video formats. The addition and growth of standard display and tracking pixels has not impacted our gross margins and we do not expect it to do so in the near future.
34
In certain circumstances, we charge fees that are based on a charge for each click-through, which we refer to as cost per click or CPC. These fees accounted for approximately 2% of our revenues in 2010 and 2009.
Media agencies are the paying parties for the majority of our services, but in some cases other parties, including publishers or advertisers, may pay our fees. In all cases, our fees cover use of our platform and tools by all parties involved in the campaign, including creative agencies, media agencies and publishers, irrespective of the paying party.
We monitor a number of additional metrics that we consider to be important revenue drivers, including:
|
●
|
Any change in the number of advertisers using our services.
|
|
●
|
The extent to which our customers use our services. Customers may choose to adopt MediaMind as an end-to-end solution for all campaigns they run and across different channels of digital media they use (which customers we refer to as “platform customers”), or they can select MediaMind to run specific campaigns on a specific channel or specific publisher, or may only use us for a portion of the services that we offer (which customers we refer to as “non-platform customers”). Our customer engagements, with both platform and non-platform customers, could be pursuant to long-term agreements (usually twelve months) or on a per-campaign basis. We believe platform customers are more likely to buy additional services from us as they have increased exposure to the value of the capabilities and services that we provide. We have increased our revenues in standard display and tracking pixels, as a result of a strategy to provide additional services to existing platform customers. As an indicator for our progress in penetrating the platform category, we measure growth in volume of standard banners and tracking pixels, formats that customer manage from their end-to-end platform of choice. In 2010 relative to the prior year we have increased our volume of standard display impressions by 76% and our volume of tracking pixel impressions by 117%. Another aspect of service utilization which we measure is the penetration and growth of our data driven products, which include our solutions for planning and buying, ad exchange trading, dynamic creative optimization, search engine analytics and tracking pixels. As our campaign management and ad serving services become the focal point for advertiser data, we plan to leverage by offering our clients solutions that utilize data for real time decision making and advanced analysis.
|
|
●
|
The geographic distribution of our revenues. We deliver campaigns across publishers in 64 countries and believe that geographic diversification is an important strength. In 2010, 50% of our revenues were from Europe, the Middle East and Africa (“EMEA”), 30% were from North America, 15% were from Asia Pacific and 5% were from Latin America. In some territories, we sell our services utilizing local selling agents. We generally add a local selling agent in new territories where we believe that we will be able to achieve faster penetration utilizing a local selling agent than through the build-out of our own infrastructure.
|
We do not have any deferred revenues or backlog because we generally recognize revenues at the time the advertising impressions are delivered or click-through occurs. See “Critical Accounting Policies and Estimates -Revenue Recognition”.
Cost of Revenues
Cost of revenues primarily consists of fees we pay to service providers that enable the delivery of advertising campaigns online, principally Akamai, a provider of caching and web acceleration services. The fees include monthly fixed fees and additional fees that are paid in proportion to the bandwidth that is used or the number of impressions that we deliver. Cost of revenues also includes depreciation expense relating to our servers, which are located in several data centers around the world, and which enable us to better support campaign delivery on a global basis, as well as the ongoing maintenance cost of our servers.
35
Operating Expenses
Operating expenses consist of selling and marketing expenses, research and development expenses, and general and administrative expenses. The largest component of our expenses is personnel costs, which were approximately 63% of our operating expenses in 2010. Personnel costs consist of salaries, benefits, and incentive compensation for our employees, including commissions for sales people. Personnel costs are categorized in our statements of operations based on each employee’s principal function.
Research and development expenses primarily consist of costs for personnel involved in research and development activities. Selling and marketing expenses primarily consist of costs related to sales and marketing personnel, as well as branding and advertising expenditures and commissions paid to our local selling agents. General and administrative expenses primarily consist of personnel costs for our management, as well as other expenses such as accounting and legal expenses.
We believe that our general and administrative expenses will increase in 2011 as a result of becoming a public company in August of 2010. This increase will be due to the costs related to filing annual, quarterly and current reports with the SEC, including increased audit fees, as well as consulting fees, investor relations, directors’ fees, directors’ and officers’ insurance, legal fees, printer and transfer agent fees and other costs that we did not incur as a private company in the first 8 months of 2010.
Financial Income, net
In addition to our operating revenues and expenses, we record financial income or expenses, net, which to date has consisted primarily of interest income earned on our cash and cash equivalents and marketable securities and foreign currency translation gains and losses.
Income Taxes
We also record income tax expenses. Our consolidated provision for income taxes and deferred tax assets and liabilities is computed based on a combination of the United States tax rates on our United States income, the Israeli tax rates on our Israeli income, as well as the tax rates of other jurisdictions where we conduct business. We indirectly own all of our subsidiaries through our wholly-owned subsidiary, MediaMind Technologies Ltd. (formerly Eyeblaster Ltd.), an Israeli company. The standard corporate tax rate for Israeli companies was 27% in 2008, 26% in 2009, 25% in 2010 and is scheduled to gradually decline to 24% in 2011, 23% in 2012, 22% in 2013, 21% in 2014, 20% in 2015 and 18% in 2016 and thereafter. However, the effective tax rate payable by a company that derives income from an “Approved Enterprise” or a “Privileged Enterprise” designated as set forth under the Investment Law may be less in certain cases. Some of our investments in Israeli facilities have been granted “Approved Enterprise” status by the Investment Center in the Israeli Ministry of Industry Trade and Labor. In addition, we have elected to treat some of our investments in Israeli facilities as a “Privileged Enterprise” under the Law for Encouragement of Capital Investments, 1959, or the Investment Law.
Since part of our taxable income in Israel is not entitled to tax benefits under the Investment Law and is taxed at the regular tax rate, our effective tax rate is the result of a weighted combination of the various applicable rates and tax exemptions, and the computation is made for income derived from each program on the basis of formulas specified in the Investment Law and in the applicable governmental approvals.
Recently, new legislation amending to the Investment Law was adopted. Under this new legislation, a uniform corporate tax rate will apply to all qualifying income of certain Industrial Companies, as opposed to the current law’s incentives, which are limited to income from Approved Enterprises during their benefits period. Under the new law, the uniform tax rate will be 10% in areas in Israel designated as Development Zone A and 15% elsewhere in Israel during 2011-2012, 7% and 12.5%, respectively, in 2013-2014, and 6% and 12%, respectively thereafter. The profits of these Industrial Companies will be freely distributable as dividends, subject to a 15% withholding tax (or lower, under an applicable tax treaty).
36
Under the transition provisions of the new legislation, we may decide to irrevocably implement the new law while waiving benefits provided under the current law or to remain subject to the current law. Changing from the current law to the new law is permitted at any time.
Accretion of Preferred Stock Dividends
In periods prior to our IPO in August 2010, we have also recognized accretion of preferred stock dividends relating to our outstanding preferred stock. All of our preferred stock was converted into common stock immediately upon the IPO, hence we will no longer recognize such accretion in future periods.
Acceleration of Stock Option Expense Upon IPO
Upon the IPO, options to purchase 147,844 shares of common stock held by certain of our executive officers vested immediately and options to purchase additional 147,844 shares of common stock held by certain of our executive officers have and will continue to vest in twelve equal monthly installments following the IPO, of which 204,224 shares of common stock (including the options that vested immediately upon the IPO) vested in 2010. As a result, we recorded stock-based compensation expenses of $731,032 in 2010, and we will record an additional aggregate amount of $299,856 of stock-based compensation expenses in 2011 related to such issuances.
Results of Operations
The following table sets forth our results of operations as a percentage of revenues for the periods indicated:
|
|
2008
|
2009
|
2010
|
|||||||||||||||
|
|
Amount
|
|
% of revenues
|
Amount
|
|
% of revenues
|
Amount
|
|
% of revenues
|
|||||||||
|
|
(U.S. dollars in thousands, except percentages)
|
|||||||||||||||||
|
Revenues
|
|
$
|
63,775
|
|
100
|
%
|
$
|
65,075
|
|
100
|
%
|
$
|
80,846
|
|
100
|
%
|
||
|
Cost of revenues
|
|
3,520
|
|
6
|
|
3,306
|
|
5
|
|
4,289
|
|
5
|
|
|||||
|
Gross profit
|
|
$
|
60,255
|
|
94
|
%
|
$
|
61,769
|
|
95
|
%
|
$
|
76,557
|
|
95
|
%
|
||
|
Operating expenses:
|
|
|
|
|
||||||||||||||
|
Research and development
|
|
$
|
7,443
|
|
11
|
%
|
$
|
6,844
|
|
11
|
%
|
$
|
9,148
|
|
11
|
%
|
||
|
Selling and marketing
|
|
34,936
|
|
55
|
|
36,530
|
|
56
|
|
45,932
|
|
57
|
|
|||||
|
General and administrative
|
|
10,292
|
|
16
|
|
6,201
|
|
9
|
|
8,259
|
|
10
|
|
|||||
|
Operating expenses
|
|
52,671
|
|
82
|
|
49,575
|
|
76
|
|
63,339
|
|
78
|
|
|||||
|
Operating income
|
|
7,584
|
|
12
|
|
12,194
|
|
19
|
|
13,218
|
|
16
|
|
|||||
|
Financial income, net
|
|
753
|
|
1
|
|
80
|
|
0
|
|
577
|
|
1
|
|
|||||
|
Income before income taxes
|
|
8,337
|
|
13
|
|
12,274
|
|
19
|
|
13,795
|
|
17
|
|
|||||
|
Income taxes
|
|
2,175
|
|
3
|
|
2,446
|
|
4
|
|
3,843
|
|
5
|
|
|||||
|
Net income
|
|
$
|
6,162
|
|
10
|
%
|
$
|
9,828
|
|
15
|
%
|
$
|
9,952
|
|
12
|
%
|
||
37
Year Ended December 31, 2010 Compared to Year Ended December 31, 2009
Revenues
The following table sets forth our revenues during 2009 and 2010 by geographic area:
|
|
2009
|
2010
|
Year over
Year Change
|
|||||||||||||||
|
|
Amount
|
|
% of revenues
|
Amount
|
|
% of revenues
|
||||||||||||
|
|
(U.S. dollars in thousands, except percentages)
|
|||||||||||||||||
|
EMEA
|
|
|
|
|||||||||||||||
|
United Kingdom
|
|
$
|
11,559
|
|
18
|
%
|
$
|
11,504
|
|
14
|
%
|
$
|
(55
|
)
|
(0
|
)%
|
||
|
France
|
|
5,612
|
|
9
|
|
5,518
|
|
7
|
|
(94
|
)
|
(2
|
)
|
|||||
|
Other
|
|
17,758
|
|
27
|
|
23,462
|
|
29
|
|
5,704
|
|
32
|
|
|||||
|
Total EMEA
|
|
34,929
|
|
54
|
|
40,484
|
|
50
|
|
5,555
|
16
|
|
||||||
|
North America
|
|
|
|
|||||||||||||||
|
United States
|
|
16,776
|
|
26
|
|
22,495
|
|
28
|
|
5,719
|
|
34
|
|
|||||
|
Canada
|
|
1,510
|
|
2
|
|
1,580
|
|
2
|
|
70
|
|
5
|
|
|||||
|
Total North America
|
|
18,286
|
|
28
|
|
24,075
|
|
30
|
|
5,789
|
|
32
|
|
|||||
|
Asia Pacific
|
|
9,676
|
|
15
|
|
12,392
|
|
15
|
|
2,716
|
28
|
|||||||
|
Latin America
|
|
2,184
|
|
3
|
|
3,895
|
|
5
|
|
1,711
|
|
78
|
|
|||||
|
|
$
|
65,075
|
|
100
|
%
|
$
|
80,846
|
|
100
|
%
|
$
|
15,771
|
|
24
|
%
|
|||
Revenues increased by $15.8 million, or 24%, to $80.8 million in 2010, from $65.1 million in 2009.
The increase was attributable to the addition of new advertising customers and higher volumes, driven by improved momentum in key geographic markets and demand from our large advertisers. In 2010, we increased the number of advertisers we service by 29% compared to 2009. Our volume of standard display impressions grew by 76% compared to the same period last year, which demonstrates the growth in share of our long term platform service agreements. Our premium video-based rich media impressions grew by 29%, while basic rich media grew 10%, resulting in overall rich media impressions growth of 17%. Tracking pixel impressions, which incorporate data from environments like social media and publisher-served ads, grew 117% in 2010 compared to 2009. This growth demonstrates our momentum in developing data driven products that utilize tracking pixels for cross channel analytics.
In 2010, revenue in EMEA, North America, APAC and Latin America, increased 16%, 32%, 28% and 78%, respectively.
Cost of revenues and gross margin
The following table sets forth our cost of revenues in each of 2009 and 2010:
|
2009
|
2010
|
Year over
Year Change
|
||||||||||||||
|
(U.S. dollars in thousands, except percentages)
|
||||||||||||||||
|
Cost of revenues
|
$ | 3,306 | $ | 4,289 | $ | 983 | 30 | % | ||||||||
Cost of revenues increased by $1.0 million, or 30%, to $4.3 million in 2010 from $3.3 million in 2009. While fees due to service providers decreased on a per impression basis, overall cost of revenues increased due to the significant increase in the volume of impressions we delivered. Gross margin remained flat at 95% in the 2009 and 2010.
Operating expenses
|
2009
|
2010
|
Year over
Year Change
|
||||||||||||||
|
(U.S. dollars in thousands, except percentages)
|
||||||||||||||||
|
Research and development
|
$ | 6,844 | $ | 9,148 | $ | 2,304 | 34 | % | ||||||||
|
Selling and marketing
|
36,530 | 45,932 | 9,402 | 26 | ||||||||||||
|
General and administrative
|
6,201 | 8,259 | 2,058 | 33 | ||||||||||||
|
Total operating expenses
|
$ | 49,575 | $ | 63,339 | $ | 13,764 | 28 | % | ||||||||
Research and development. Research and development expenses increased by $2.3 million, or 34%, to $9.1 million 2010, from $6.8 million in 2009. The increase was primarily the result of growth in headcount, increased salaries following salary reductions we initiated in the first half of 2009, as we focused on cutting costs given the uncertain global economic environment, increase in stock-based compensation expenses in relation to the stock option vesting acceleration in the second half of the year, in connection with our initial public offering, as aforementioned, increase in related costs for personnel associated with research and development activities, including training, and overhead expenses. Research and development expenses as a percentage of revenues remained flat at 11%.
38
Selling and marketing. Selling and marketing expenses increased by $9.4 million, or 26%, to $45.9 in 2010, from $36.5 million in 2009. The increase was primarily attributable to an increase in compensation expenses relating to growth in headcount associated with supporting the revenue increase in 2010 compared with 2009. In addition, we increased salaries following salary reductions we initiated in the first half of 2009. The increase in selling and marketing expenses was also attributable to an increase in all other selling and marketing expenses, including commission paid to selling agents, marketing, travel, training, recruiting and depreciation. Selling and marketing expenses as a percentage of revenues increased to 57% in 2010, from 56% in 2009.
General and administrative. General and administrative expenses increased by $2.1 million, or 33%, to $8.3 million in 2010, from $6.2 million in 2009. This increase was due to an increase in headcount and increase in compensation expenses relating to growth in headcount associated with supporting the company becoming public. In addition, we increased salaries following salary reductions we initiated in the first half of 2009. Furthermore, the increase is attributable to the increase in stock-based compensation expenses due to the stock option vesting acceleration in the second half of the year, in connection with our initial public offering, as aforementioned. The increase in general and administrative expenses was also attributable to an increase in other general and administrative expenses, including recruiting, travel, training, and depreciation. This increase was partially offset by a $0.5 million reimbursement of legal fees incurred over the years 2007 and 2008, as a result of a settlement between us and our insurance carrier regarding our entitlement to reimbursement. General and administrative expenses as a percentage of revenues increased to 10% in 2010, from 9% in 2009.
Financial income, net
The following table sets forth our financial income, net, in each of 2009 and 2010:
|
2009
|
2010
|
Year over
Year Change
|
||||||||||||||
|
(U.S. dollars in thousands, except percentages)
|
||||||||||||||||
|
Financial income, net
|
$ | 80 | $ | 577 | $ | 497 | 621 | % | ||||||||
Financial income, net, for 2010, includes net interest consisting of earnings on our cash, cash equivalents and marketable securities, partially offset by bank charges.
Financial income, net, for 2009, includes net interest consisting of earnings on our cash, cash equivalents and marketable securities, and interest received from Tax authorities due to over prepayments completely offset by foreign currency translation losses arising from the translation adjustments on net assets held by our subsidiaries in euros and in new Israeli shekels to U.S. dollars during consolidation and by bank charges.
Income tax expense
The following table sets forth our tax expense in each of 2009 and 2010:
|
2009
|
2010
|
Year over
Year Change
|
||||||||||||||
|
(U.S. dollars in thousands, except percentages)
|
||||||||||||||||
|
Income taxes
|
$ | 2,446 | $ | 3,843 | $ | 1,397 | 57 | % | ||||||||
Income tax expense increased by $1.4 million, or 57%, to $3.8 million in 2010 from $2.4 million in 2009. Our consolidated provision for income taxes and our deferred tax assets and liabilities are computed based on a combination of the United States tax rates on United States income, the Israeli tax rates on Israeli income as well as the tax rates of other wholly-owned subsidiaries in Australia, the United Kingdom, France, Germany, Spain, Mexico, Brazil, Hong Kong and Japan. Our effective tax rate increased from 20% in 2009 to 26% in 2010 due to non-deductible expenses resulting mainly from high stock-based compensation expenses due to the stock option vesting acceleration as aforementioned and lower tax benefits under our Approved and Privilege Enterprise programs in Israel in 2010, compared to higher benefits in 2009. In addition, 2009 taxes were partly offset by a tax refund with respect to previous years.
39
Year Ended December 31, 2009 Compared to Year Ended December 31, 2008
Revenues
The following table sets forth our revenues during each of 2008 and 2009 by geographic area:
|
|
2008
|
2009
|
Year over
Year Change
|
||||||||||||||
|
|
Amount
|
|
% of revenues
|
Amount
|
|
% of revenues
|
|||||||||||
|
|
(U.S. dollars in thousands, except percentages)
|
||||||||||||||||
|
EMEA
|
|
|
|
||||||||||||||
|
United Kingdom
|
|
$
|
12,558
|
|
20
|
%
|
$
|
11,559
|
|
18
|
%
|
$
|
(999
|
)
|
(8
|
)%
|
|
|
France
|
|
6,155
|
|
10
|
|
5,612
|
|
9
|
|
(543
|
)
|
(9
|
)
|
||||
|
Other
|
|
16,368
|
|
25
|
|
17,758
|
|
27
|
|
1,390
|
|
8
|
|
||||
|
Total EMEA
|
|
35,081
|
|
55
|
|
34,929
|
|
54
|
|
(152
|
)
|
0
|
|
||||
|
North America
|
|
|
|
||||||||||||||
|
United States
|
|
15,760
|
|
25
|
|
16,776
|
|
26
|
|
1,016
|
|
6
|
|
||||
|
Canada
|
|
1,491
|
|
2
|
|
1,510
|
|
2
|
|
19
|
|
1
|
|
||||
|
Total North America
|
|
17,251
|
|
27
|
|
18,286
|
|
28
|
|
1,035
|
|
6
|
|
||||
|
Asia Pacific
|
|
9,755
|
|
15
|
|
9,676
|
|
15
|
|
(79
|
)
|
(1
|
)
|
||||
|
Latin America
|
|
1,688
|
|
3
|
|
2,184
|
|
3
|
|
496
|
|
29
|
|
||||
|
|
|
|
|||||||||||||||
|
|
$
|
63,775
|
|
100
|
%
|
$
|
65,075
|
|
100
|
%
|
$
|
1,300
|
|
2
|
%
|
||
Revenues increased by $1.3 million, or 2%, to $65.1 million in 2009, from $63.8 million in 2008. Excluding the impact of the appreciation of the U.S. dollar relative to foreign currencies, revenues increased by approximately 5.5%. In spite of the economic slowdown in 2009 we were able to slightly increase our revenue compared to 2008 as a result of a 103% increase in the volume of impressions delivered, driven primarily by increased market share, partially offset by lower prices due to a change in the mix of formats provided and pricing pressure. We were particularly successful in increasing the utilization of standard display ads by platform customers, as standard display volumes increased 139% in 2009. Pricing pressure was primarily the result of general industry conditions, including economic weakness, and also reflected a discount in pricing given to one customer in expectation of higher volume that did not fully materialize due to economic conditions.
Cost of revenues and gross margin
The following table sets forth our cost of revenues during each of 2008 and 2009:
|
2008
|
2009
|
Year over
Year Change
|
||||||||||||||
|
(U.S. dollars in thousands, except percentages)
|
||||||||||||||||
|
Cost of revenues
|
$ | 3,520 | $ | 3,306 | $ | (214 | ) | (6 | )% | |||||||
Cost of revenues decreased by $0.2 million, or 6%, to $3.3 million in 2009 from $3.5 million in 2008, primarily reflecting lower fees due to service providers. Gross margin increased slightly from 94% in 2008 to 95% in 2009.
40
Operating expenses
The following table sets forth our operating expenses in each of 2008 and 2009:
|
2008
|
2009
|
Year over
Year Change
|
||||||||||||||
|
(U.S. dollars in thousands, except percentages)
|
||||||||||||||||
|
Research and development
|
$ | 7,443 | $ | 6,844 | $ | (599 | ) | (8 | )% | |||||||
|
Selling and marketing
|
34,936 | 36,530 | 1,594 | 5 | ||||||||||||
|
General and administrative
|
10,292 | 6,201 | (4,091 | ) | (40 | ) | ||||||||||
|
Total operating expenses
|
$ | 52,671 | $ | 49,575 | $ | (3,096 | ) | (6 | )% | |||||||
Research and development. Research and development expenses decreased by $0.6 million, or 8%, to $6.8 million in 2009 from $7.4 million in 2008. This decrease primarily resulted from a decrease in headcount and a reduction in salaries that we experienced in the first half of 2009, as we focused on cutting costs given the uncertain global economic environment.
Selling and marketing. Selling and marketing expenses increased by $1.6 million, or 5%, to $36.5 million in 2009 from $34.9 million in 2008. This increase was primarily due to an increase in headcount associated with the establishment of subsidiaries in Brazil and Mexico in 2009, previously operated through a local selling agent, and an increase in commissions paid to employees, partially offset by a decrease in marketing expenses. The commission rate paid to employees includes an accelerator rate which is effective once targets are met. Because actual revenues in 2009 exceeded targeted revenues, commission payments were $1.3 million higher than in 2008. Selling and marketing expenses as a percentage of revenues increased to 56% in 2009 from 55% in 2008. This increase was primarily due to an expansion in foreign markets in which we previously operated utilizing local selling agents, as the margin on revenue we generate from such markets is generally lower at first due to start-up expenses.
General and administrative. General and administrative expenses decreased by $4.1 million, or 40%, to $6.2 million in 2009 from $10.3 million in 2008. This decrease was primarily due to a decrease in headcount and a reduction in salaries we experienced in the first half of 2009 as we focused on cutting costs given the uncertain global economic environment, and a decrease in accounting and legal fees, which were higher in 2008 due to the commencement of an initial public offering process in January 2008, after which costs of $1.1 million were expensed following the withdrawal of our registration statement in December 2008. This decrease was also the result of the termination in 2009 of a management fee agreement with Sycamore Technologies Ventures L.P. The management agreement obligated us to pay $1.0 million in management fees to the investment group each year until the agreement terminated in the first half of 2009, which resulted in expense of $0.3 million in 2009, compared to $1.0 million in 2008. General and administrative expenses as a percentage of revenues decreased to 10% in 2009 from 16% in 2008.
41
Financial income, net
The following table sets forth our financial income, net, in each of 2008 and 2009:
|
2008
|
2009
|
Year over
Year Change
|
||||||||||||||
|
(U.S. dollars in thousands, except percentages)
|
||||||||||||||||
|
Financial income, net
|
$ | 753 | $ | 80 | $ | (673 | ) | (89 | )% | |||||||
Financial income, net, for 2008, includes net interest consisting of earnings on our cash, cash equivalents and marketable securities, dividends received and foreign currency translation gains arising from the translation adjustments on net assets held by our subsidiaries in euros and in new Israeli shekels to U.S. dollars during consolidation partially offset by bank charges.
Income tax expense
The following table sets forth our tax expense in each of 2008 and 2009:
|
2008
|
2009
|
Year over
Year Change
|
||||||||||||||
|
(U.S. dollars in thousands, except percentages)
|
||||||||||||||||
|
Income taxes
|
$ | 2,175 | $ | 2,446 | $ | 271 | 12 | % | ||||||||
Income tax expense increased by $0.3 million, or 12%, to $2.5 million in 2009 from $2.2 million in 2008. Our effective tax rate decreased from 26% in 2008 to 20% in 2009 due to tax benefits under our Approved and Privilege Enterprise programs in Israel, which were higher in 2009 compared to 2008, as well as a reduction of the tax rate in Israel, and a tax refund in respect of previous years.
Seasonality and Fluctuations in Quarterly Operation Results
Our operating results have historically fluctuated on a quarterly basis due to the seasonal nature of Internet advertising, and we expect this fluctuation to continue. Our fourth calendar quarter is typically the strongest, generating 32%, 34% and 26% of our revenues for the years ended December 31, 2010, 2009 and 2008, respectively. Our first quarter is often the weakest quarter, generating approximately 20%, 18% and 21% of our revenues for the years ended December 31, 2010, 2009 and 2008, respectively. The increase in revenue in the fourth quarter is primarily the result of heavy digital media advertising and online shopping during November and December due to the holidays. The drop in revenues in the first quarter is linked to the drop in digital media advertising and shopping that occurs at the beginning of each year. Cyclicality and seasonality may have a more pronounced effect on our operating results in the future, as our growth slows, and may in the future cause our operating results to fluctuate.
42
The following is a summary of our quarterly results in each of the last eight fiscal quarters:
|
Quarter ended
|
||||||||||||||||||||||||||||||||
|
March 31,
2009
(unaudited)
|
June 30,
2009
(unaudited)
|
September 30,
2009
(unaudited)
|
December 31,
2009
(unaudited)
|
March 31,
2010
(unaudited)
|
June 30,
2010
(unaudited)
|
September 30,
2010
(unaudited)
|
December 31,
2010
(unaudited)
|
|||||||||||||||||||||||||
|
(U.S. dollars in thousands)
|
||||||||||||||||||||||||||||||||
|
Revenues
|
$ | 11,403 | $ | 16,009 | $ | 15,231 | $ | 22,432 | $ | 16,001 | $ | 21,224 | $ | 17,721 | $ | 25,900 | ||||||||||||||||
|
Cost of revenues
|
780 | 869 | 819 | 838 | 881 | 1,061 | 1,000 | 1,347 | ||||||||||||||||||||||||
|
Gross profit
|
10,623 | 15,140 | 14,412 | 21,594 | 15,120 | 20,163 | 16,721 | 24,553 | ||||||||||||||||||||||||
|
Operating Expenses:
|
||||||||||||||||||||||||||||||||
|
Research and development
|
1,571 | 1,718 | 1,795 | 1,760 | 2,261 | 2,237 | 2,373 | 2,277 | ||||||||||||||||||||||||
|
Selling and marketing
|
7,230 | 8,833 | 9,134 | 11,333 | 10,048 | 11,554 | 11,281 | 13,049 | ||||||||||||||||||||||||
|
General and administrative
|
1,614 | 1,525 | 1,448 | 1,614 | 1,975 | 1,881 | 2,359 | 2,044 | ||||||||||||||||||||||||
|
Operating expenses
|
10,415 | 12,076 | 12,377 | 14,707 | 14,284 | 15,672 | 16,013 | 17,370 | ||||||||||||||||||||||||
|
Operating income
|
208 | 3,064 | 2,035 | 6,887 | 836 | 4,491 | 708 | 7,183 | ||||||||||||||||||||||||
|
Financial income (expenses), net
|
(580 | ) | (34 | ) | 528 | 166 | 82 | (559 | ) | 771 | 283 | |||||||||||||||||||||
|
Income (Loss) before income taxes
|
(372 | ) | 3,030 | 2,563 | 7,053 | 918 | 3,932 | 1,479 | 7,466 | |||||||||||||||||||||||
|
Income taxes
|
101 | 652 | 618 | 1,075 | 358 | 1,057 | 491 | 1,937 | ||||||||||||||||||||||||
|
Net income (Loss)
|
$ | (473 | ) | $ | 2,378 | $ | 1,945 | $ | 5,978 | $ | 560 | $ | 2,875 | $ | 988 | $ | 5,529 | |||||||||||||||
43
Liquidity and Capital Resources
In 2010, we received net proceeds from our IPO of approximately $56.0 million (after underwriters’ discounts of $3.8 million and additional offering related costs of approximately $2.9 million). Prior to the IPO, our primary sources of cash were cash flows generated by operations and, to a lesser extent, private issuances of equity. We believe that our cash flows from operations and current cash and cash equivalents will be sufficient to meet our anticipated cash needs for working capital and capital expenditures for the next twelve months. Our principal sources of liquidity are expected to be our existing cash and cash equivalents, which totaled $21.5 million and $15.4 million as of December 31, 2010 and 2009, respectively, as well as the cash flow that we generate from our operations and the proceeds from anticipated option exercises.
Our cash and cash equivalents are highly liquid investments with original maturities of three months or less at date of issuance and consist of time deposits and investments in money market funds with commercial banks and financial institutions.
As of December 31, 2009 and 2010, our short-term deposits were $18.4 million and $75.9 million, respectively. We had no short-term deposits as of December 31, 2008. Our short-term deposits consist of deposits with a contractual maturity of more than three months and less than one year.
As of December 31, 2009 and 2010, our long-term marketable securities were $2.1 and $2.0 million, as compared to short-term marketable securities of $0.5 million at December 31, 2008. Our marketable securities consist of highly rated government and corporate debt securities and none of them are auction rate securities. Securities with a contractual maturity of less than one year are classified as short-term, and those with maturities of more than one year are classified as long-term.
Operating activities. Cash provided by operating activities consists primarily of net income adjusted for certain non-cash items including depreciation, stock-based compensation, and the effect of changes in working capital. Net cash provided by operating activities in 2010 and 2009 was $11.8 million and $10.3 million, respectively, reflecting net income adjusted for non-cash items partially offset by an increase in working capital.
Investing activities. Net cash used in investing activities, consisted of the purchase of short-term deposits, marketable securities and capital expenditures. Net cash used in investing activities in 2010 were $62.2 million which consisted primarily of the purchase of short term deposits and capital expenditures, partially offset by the expiration of short term deposits. Net cash used in investing activities in 2009 were $21.6 million which consisted primarily of the purchase of short term deposits and marketable securities, and capital expenditures. Our capital expenditures consisting primarily of research and development software tools, computers and other peripheral equipment, leasehold improvements and furniture, totaled to $4.3 million in 2010, as compared to $1.3 million in 2009.
Financing activities. Net cash provided by financing activities for the 2010 were $56.5 million, primarily due to the net cash provided from our IPO. Net cash provided by financing activities for 2009, amounted to $45 thousand generated by the exercise of stock options under our equity incentive plan.
Commitments and Contingencies
The following table presents minimum payments due under contractual obligations with minimum firm commitments as of December 31, 2010:
|
For the year ended December 31,
|
||||||||||||||||||||||||||||
|
Total
|
2011
|
2012
|
2013
|
2014
|
2015
|
Thereafter
|
||||||||||||||||||||||
|
(U.S. dollars in thousands)
|
||||||||||||||||||||||||||||
|
Rent, motor vehicle and other services
|
$ | 23,229 | $ | 3,963 | $ | 3,402 | $ | 2,780 | $ | 2,251 | $ | 1,844 | $ | 8,989 | ||||||||||||||
Due to the uncertainty of the timing of future cash flows associated with our uncertain income tax position (see Note 7f, “Income Taxes,” to the consolidated financial statements included in this prospectus), we are unable to make reasonably reliable estimates for the period of cash settlement, if any, with the respective taxing authorities.
44
Off-Balance Sheet Arrangements
We do not engage in any off-balance sheet financing arrangements that have or are reasonably likely to have a current or future effect on our financial condition, changes in financial condition, revenues or expenses, results of operations, liquidity, capital expenditures or capital resources.
Critical Accounting Policies and Estimates
The discussion of our financial condition and results of operations is based upon our consolidated financial statements, which have been prepared in accordance with accounting principles generally accepted in the United States. The preparation of these consolidated financial statements requires us to make estimates, judgments and assumptions that affect the reported amount of assets, liabilities, revenue and expenses. On an ongoing basis, we evaluate our estimates, including those related to revenue, the allowance for doubtful accounts, stock-based compensation and income taxes. We based our estimates of the carrying value of certain assets and liabilities on historical experience and on various other assumptions that we believe to be reasonable. In many cases, we could reasonably have used different accounting policies and estimates. In some cases, changes in the accounting estimates are reasonably likely to occur from period to period. Our actual results may differ from these estimates under different assumptions or conditions. Our significant accounting policies are more fully described in Note 2 to our consolidated financial statements included elsewhere in this annual report.
We believe the following critical accounting policies require our more significant judgments in preparing our consolidated financial statements:
Revenue Recognition
We generate revenues primarily from monthly transaction volume-based fees earned by us for making MediaMind available to our customers on an Application Service Provider, or ASP, basis. Accordingly, such revenue is recognized in accordance with ASC 605, “Revenue Recognition” and Staff Accounting Bulletin No. 104, “Revenue Recognition”, in the month that the advertising impressions or click-throughs occur, provided the following four criteria are met:
|
●
|
Persuasive evidence of an arrangement exists. We generally require a purchase order from a customer specifying the terms and conditions of the services to be delivered. Alternately, we have entered into long term agreements with certain of our customers specifying the terms and conditions of the services provided by us to such customers.
|
|
●
|
Delivery. We deem delivery of our services to have occurred when the advertising impressions or click-throughs are delivered by our platform.
|
|
●
|
The fees are fixed and determinable. We consider the fees to be fixed and determinable if they are not subject to a refund or adjustment. Our services are of a type that are not subject to a refund or customer acceptance provisions.
|
|
●
|
Collection is probable. Probability of collection is assessed on a customer-by-customer basis based on a number of factors including credit-worthiness and our transaction history with the customer. Customers are subject to a credit review process that evaluates the customers’ financial position and ultimately their ability to pay.
|
Our customers do not have the right to take possession of our software at any time during or after the term of the relevant customer agreement. Accordingly, as prescribed by ASC 605-30 our revenue recognition is outside the scope of ASC 985-605 “Software, Revenue Recognition” and within the scope of ASC 605, “Revenue Recognition” and Staff Accounting Bulletin No. 104, “Revenue Recognition”.
Allowance for doubtful accounts
We maintain an allowance for doubtful accounts for estimated losses resulting from our customers’ inability to pay us which is accounted for in accordance with ASC 450, “Contingencies”. The provision is based on our historical experience with specific customers and an assessment of whether they are probable to default on our receivables from them. In order to identify these customers, we perform ongoing reviews of all customers that have breached their payment terms, as well as those that have filed for bankruptcy or for whom information has become available indicating a significant risk of non-recoverability. Historically, we have not experienced any material losses on our accounts receivable. If our historical collection experience does not reflect our future ability to collect outstanding accounts receivables, our future provision for doubtful accounts could be materially affected.
45
Income Taxes
We are subject to income taxes in the United States and numerous foreign jurisdictions. ASC 740, “Income Taxes”, prescribes the use of the liability method whereby deferred tax asset and liability account balances are determined based on differences between financial reporting and tax bases of assets and liabilities and are measured using the enacted tax rates and laws that will be in effect when the differences are expected to reverse.
Under ASC 740, significant judgment is required in evaluating our uncertain tax positions and determining our provision for income taxes. ASC 740 contains a two-step approach to recognizing and measuring uncertain tax positions accounted for in accordance with ASC 740. The first step is to evaluate the tax position taken or expected to be taken in a tax return by determining if the weight of available evidence indicates that it is more likely than not that, on an evaluation of the technical merits, the tax position will be sustained on audit, including resolution of any related appeals or litigation processes. The second step is to measure the tax benefit as the largest amount that is more than 50% likely to be realized upon ultimate settlement.
Although we believe we have adequately reserved for our uncertain tax positions, no assurance can be given that the final tax outcome of these matters will not be different. We adjust these reserves in light of changing facts and circumstances, such as the closing of a tax audit or the refinement of an estimate. To the extent that the final tax outcome of these matters is different than the amounts recorded, such differences will impact the provision for income taxes in the period in which such determination is made. The provision for income taxes includes the impact of reserve provisions and changes to reserves that are considered appropriate as well as the related net interest.
Stock-based Compensation
We recognize stock-based compensation expenses in accordance with ASC 71, “Compensation—Stock Compensation” 8 which requires the measurement and recognition of compensation expense based on estimated fair values for all stock-based payment awards made to employees and directors.
We determine the fair value of stock-based awards on the dates of grant using the Black-Scholes option-pricing model. The valuation model takes into account the exercise price of the stock option, the fair value of the common stock underlying the stock option as measured on the date of grant and an estimation of the volatility of the common stock underlying the stock option. Such value is recognized as expense over the service period, net of estimated forfeitures, using the straight-line method.
We consider many factors when estimating expected forfeitures, including types of awards, employee class and historical experience. Actual results, and future changes in estimates, may differ substantially from current estimates. The risk-free interest rate is based on the yield from U.S. Treasury zero-coupon bonds with an equivalent term.
The fair value of stock options granted to employees and directors for the years ended December 31, 2008, 2009 and 2010 was estimated using the weighted average assumptions in the table below. Because our stock was not publicly traded during these periods, the expected volatility was calculated based upon peer public companies in the past one to four years. The expected option term represents the period that stock options are expected to be outstanding and was determined based on the simplified method permitted by Staff Accounting Bulletin No. 110 as the average of the vesting period and the contractual term. The risk-free interest rate is based on the yield from U.S. Treasury zero- coupon bonds with an equivalent term. We have historically not paid dividends and have no plans to pay dividends in the foreseeable future.
46
The following assumptions were used to estimate the fair value of the stock options granted during the years ended December 31, 2008, 2009 and 2010:
|
Year ended December 31,
|
||||||||||||
|
2008
|
2009
|
2010
|
||||||||||
|
Risk free interest
|
2.46%-5.68 | % | 2.23%-3.6 | % | 1.08%-5.33 | % | ||||||
|
Dividend yields
|
0 | % | 0 | % | 0 | % | ||||||
|
Volatility
|
85 | % | 80%-85 | % | 59%-84 | % | ||||||
|
Expected term (in years)
|
5-10 | 4.8-7 | 4-8 | |||||||||
|
Weighted average fair value of options at grant date
|
$ | 3.84 | $ | 6.11 | $ | 6.60 | ||||||
Market risk represents the risk of loss that may impact our financial position due to adverse change in financial market prices and rates. In the course of our normal operations, we are exposed to market risks, including fluctuations in foreign currency exchange rates and interest rates.
Foreign Exchange Risk
We conduct business in a large number of countries in the Americas, Europe, Asia, Australia, Latin America and the Middle East. Most of our revenues are generated in U.S. dollars, the euro, the Australian dollar and the British pound sterling. Based on our results for the year ended December 31, 2010, a 1% increase (decrease) in the value of the euro, the Australian dollar and the British pound sterling against the U.S. dollar would have increased (decreased) our revenues by $226 thousand, $57 thousand and $75 thousand, respectively. Based on our results for the year ended December 31, 2010, a 1% increase (decrease) in the value of the new Israeli shekel, the euro, the Australian dollar and the British pound sterling against the dollar would have increased (decreased) our expenses by $50 thousand, $90 thousand, $24 thousand and $58 thousand, respectively. In the future, the percentage of our revenues earned in other currencies may increase as we further expand our sales internationally. Accordingly, we are subject to the risk of exchange rate fluctuations between such other currencies and the dollar. Our expenses in currencies other than the new Israeli shekel tend to be hedged by revenues being denominated in the same currency, which helps reduce the impact of currency fluctuations on our profit margins. We hedge our expenses denominated in new Israeli shekels. The sensitivity analysis provided above does not give effect to this cash flow hedging program.
Interest Rate Risk
As of December 31, 2010, we had no outstanding debt, and accordingly were not subject to interest rate risk on debt. We invest our cash in a combination of cash equivalents and marketable securities, all of which marketable securities are at least AA+ rated U.S. corporate bonds. Our cash throughout the world is affected by changes in interest rates. Interest rates are highly sensitive to many factors, including governmental monetary policies and domestic and international economic and political conditions
47
ITEM 8. FINANCIAL STATEMENTS AND SUPPLEMENTARY DATA.
 |
Kost Forer Gabbay & Kasierer
3 Aminadav St.
Tel-Aviv 67067, Israel
Tel: 972 (3)6232525
Fax: 972 (3)5622555
www.ey.com/il
|
REPORT OF INDEPENDENT REGISTERED PUBLIC ACCOUNTING FIRM
To the Board of Directors and Stockholders of
MEDIAMIND TECHNOLOGIES INC.
(Formerly Eyeblaster, Inc.)
We have audited the accompanying consolidated balance sheets of MediaMind Technologies Inc. (formerly Eyeblaster, Inc.) ("the Company") and its subsidiaries as of December 31, 2009 and 2010 and the related consolidated statements of income, stockholders' equity and consolidated cash flows for each of the three years in the period ended December 31, 2010. These financial statements are the responsibility of the Company's management. Our responsibility is to express an opinion on these financial statements based on our audits.
We conducted our audits in accordance with the standards of the Public Company Accounting Oversight Board (United States). Those standards require that we plan and perform the audit to obtain reasonable assurance about whether the financial statements are free of material misstatement. We were not engaged to perform an audit of the Company's internal control over financial reporting. Our audit included consideration of internal control over financial reporting as a basis for designing audit procedures that are appropriate in the circumstances, but not for the purpose of expressing an opinion on the effectiveness of the Company's internal control over financial reporting. Accordingly we express no such opinion. An audit also includes examining, on a test basis, evidence supporting the amounts and disclosures in the financial statements, assessing the accounting principles used and significant estimates made by management, and evaluating the overall financial statement presentation. We believe that our audits provide a reasonable basis for our opinion.
In our opinion, the consolidated financial statements referred to above present fairly, in all material respects, the consolidated financial position of the Company and its subsidiaries as of December 31, 2009 and 2010 and the consolidated results of their operations and their cash flows for each of the three years in the period ended December 31, 2010, in conformity with generally accepted accounting principles in the United States.
|
Tel-Aviv, Israel
|
KOST FORER GABBAY & KASIERER
|
|
March 8, 2011
|
A Member of Ernst & Young Global
|
F - 1 -
MEDIAMIND TECHNOLOGIES INC.
(FORMERLY EYEBLASTER, INC.) AND ITS SUBSIDIARIES
CONSOLIDATED BALANCE SHEETS
U.S. dollars in thousands
|
December 31,
|
||||||||
|
2009
|
2010
|
|||||||
|
ASSETS
|
||||||||
|
CURRENT ASSETS:
|
||||||||
|
Cash and cash equivalents
|
$ | 15,363 | $ | 21,484 | ||||
|
Short-term deposit
|
18,357 | 75,873 | ||||||
|
Restricted cash
|
769 | 1,180 | ||||||
|
Trade receivables, net
|
22,104 | 25,604 | ||||||
|
Other accounts receivable and prepaid expenses
|
1,972 | 2,926 | ||||||
|
Total current assets
|
58,565 | 127,067 | ||||||
|
LONG-TERM ASSETS:
|
||||||||
|
Marketable securities (Note 3)
|
2,077 | 2,043 | ||||||
|
Deferred taxes, net
|
1,289 | 2,146 | ||||||
|
Severance pay fund
|
1,517 | 2,267 | ||||||
|
Other long-term assets
|
1,015 | 1,092 | ||||||
|
Total long-term assets
|
5,898 | 7,548 | ||||||
|
PROPERTY AND EQUIPMENT, NET (Note 4)
|
2,427 | 5,014 | ||||||
|
Total assets
|
$ | 66,890 | $ | 139,629 | ||||
The accompanying notes are an integral part of the consolidated financial statements.
F - 2 -
MEDIAMIND TECHNOLOGIES INC.
(FORMERLY EYEBLASTER, INC.) AND ITS SUBSIDIARIES
CONSOLIDATED BALANCE SHEETS
U.S. dollars in thousands (except share and per share data)
|
December 31,
|
||||||||
|
2009
|
2010
|
|||||||
|
LIABILITIES AND STOCKHOLDERS' EQUITY
|
||||||||
|
CURRENT LIABILITIES:
|
||||||||
|
Trade payables
|
$ | 1,001 | $ | 756 | ||||
|
Employees and payroll accruals
|
4,686 | 3,996 | ||||||
|
Other accounts payable (Note 5)
|
4,053 | 5,094 | ||||||
|
Total current liabilities
|
9,740 | 9,846 | ||||||
|
LONG-TERM LIABILITIES:
|
||||||||
|
Accrued severance pay and other employee accruals
|
2,335 | 3,413 | ||||||
|
Total long-term liabilities
|
2,335 | 3,413 | ||||||
|
STOCKHOLDERS' EQUITY (Note 8):
|
||||||||
|
Stock capital:
|
||||||||
|
Common stock of $ 0.001 par value -
|
||||||||
|
19,200,000 and 88,000,000 shares authorized at December 31, 2009 and 2010,
respectively; 11,573,706 and 21,692,207shares issued at December 31, 2009
and 2010, respectively; 8,412,002 and 18,530,503 shares outstanding at
December 31, 2009 and 2010, respectively.
|
12 | 22 | ||||||
|
Series A-1 Convertible Preferred stock of $ 0.001 par value -
|
||||||||
|
2,100,000 shares authorized at December 31, 2009 and no shares authorized
at December 31, 2010; 2,068,966 shares issued and outstanding at
December 31, 2009 and no shares issued and outstanding at
December 31, 2010; Aggregate liquidation preference of
$ 32,996 at December 31, 2009 and no aggregate liquidation
preference at December 31, 2010.
|
2 | - | ||||||
|
Additional paid-in capital
|
48,450 | 109,927 | ||||||
|
Treasury stock at cost (3,161,704 shares of Common stock)
|
(23,213 | ) | (23,213 | ) | ||||
|
Accumulated other comprehensive loss
|
(558 | ) | (440 | ) | ||||
|
Retained earnings
|
30,122 | 40,074 | ||||||
|
Total stockholders' equity
|
54,815 | 126,370 | ||||||
|
Total liabilities and stockholders' equity
|
$ | 66,890 | $ | 139,629 | ||||
The accompanying notes are an integral part of the consolidated financial statements.
F - 3 -
MEDIAMIND TECHNOLOGIES INC.
(FORMERLY EYEBLASTER, INC.) AND ITS SUBSIDIARIES
CONSOLIDATED STATEMENTS OF INCOME
U.S. dollars in thousands (except share and per share data)
|
Year ended December 31,
|
||||||||||||
|
2008
|
2009
|
2010
|
||||||||||
|
Revenues
|
$ | 63,775 | $ | 65,075 | $ | 80,846 | ||||||
|
Cost of revenues
|
3,520 | 3,306 | 4,289 | |||||||||
|
Gross profit
|
60,255 | 61,769 | 76,557 | |||||||||
|
Operating expenses:
|
||||||||||||
|
Research and development
|
7,443 | 6,844 | 9,148 | |||||||||
|
Selling and marketing
|
34,936 | 36,530 | 45,932 | |||||||||
|
General and administrative
|
10,292 | 6,201 | 8,259 | |||||||||
|
Total operating expenses
|
52,671 | 49,575 | 63,339 | |||||||||
|
Operating income:
|
7,584 | 12,194 | 13,218 | |||||||||
|
Financial income, net (Note 12)
|
753 | 80 | 577 | |||||||||
|
Income before income taxes
|
8,337 | 12,274 | 13,795 | |||||||||
|
Income taxes (Note 7)
|
2,175 | 2,446 | 3,843 | |||||||||
|
Net income
|
6,162 | 9,828 | 9,952 | |||||||||
|
Accretion of Preferred stock dividend preference
|
(821 | ) | (1,617 | ) | (1,292 | ) | ||||||
|
Net income attributable to Common stockholders
|
$ | 5,341 | $ | 8,211 | $ | 8,660 | ||||||
|
Net earnings per share (Note 9):
|
||||||||||||
|
Basic
|
$ | 0.64 | $ | 0.98 | $ | 0.70 | ||||||
|
Diluted
|
$ | 0.43 | $ | 0.68 | $ | 0.54 | ||||||
|
Weighted average number of shares of Common stock used in
computing earnings per share (in thousands):
|
||||||||||||
|
Basic
|
8,380 | 8,397 | 12,394 | |||||||||
|
Diluted
|
14,358 | 14,352 | 18,273 | |||||||||
The accompanying notes are an integral part of the consolidated financial statements.
F - 4 -
MEDIAMIND TECHNOLOGIES INC.
(FORMERLY EYEBLASTER, INC.) AND ITS SUBSIDIARIES
STATEMENTS OF CHANGES IN STOCKHOLDERS' EQUITY
U.S. dollars in thousands (except share data)
|
Common
stock
|
Preferred
stock
|
Additional
paid-in
capital
|
Treasury
stock -
at cost
|
Accumulated
other
comprehensive
income (loss)
|
Retained
earnings
|
Total
comprehensive
income
|
Total
stockholders'
equity
|
|||||||||||||||||||||||||
|
Balance as of January 1, 2008
|
$ | 12 | $ | 2 | $ | 42,236 | $ | (23,213 | ) | $ | 622 | $ | 14,132 | $ | 33,791 | |||||||||||||||||
|
Exercise of stock options
|
* | ) - | - | 121 | - | - | - | 121 | ||||||||||||||||||||||||
|
Compensation related to options
granted to employees
|
- | - | 2,756 | - | - | - | 2,756 | |||||||||||||||||||||||||
|
Foreign currency translation
adjustments
|
- | - | - | - | (2,244 | ) | - | $ | (2,244 | ) | (2,244 | ) | ||||||||||||||||||||
|
Net income
|
- | - | - | - | - | 6,162 | 6,162 | 6,162 | ||||||||||||||||||||||||
|
Total comprehensive income
|
$ | 3,918 | ||||||||||||||||||||||||||||||
|
Balance as of December 31, 2008
|
12 | 2 | 45,113 | (23,213 | ) | (1,622 | ) | 20,294 | 40,586 | |||||||||||||||||||||||
|
Exercise of stock options
|
* | ) - | - | 45 | - | - | - | 45 | ||||||||||||||||||||||||
|
Compensation related to options
granted to employees
|
- | - | 3,292 | - | - | - | 3,292 | |||||||||||||||||||||||||
|
Foreign currency translation adjustments
|
- | - | - | - | 997 | - | $ | 997 | 997 | |||||||||||||||||||||||
|
Unrealized gain from derivatives, net
of taxes
|
- | - | - | - | 67 | - | 67 | 67 | ||||||||||||||||||||||||
|
Net income
|
- | - | - | - | - | 9,828 | 9,828 | 9,828 | ||||||||||||||||||||||||
|
Total comprehensive income
|
$ | 10,892 | ||||||||||||||||||||||||||||||
|
Balance as of December 31, 2009
|
12 | 2 | 48,450 | (23,213 | ) | (558 | ) | 30,122 | 54,815 | |||||||||||||||||||||||
|
Conversion of Series A-1
Convertible Preferred stock into Common stock
|
5 | (2 | ) | (3 | ) | - | - | - | - | |||||||||||||||||||||||
|
Issuance of Common stock in
connection with initial public offering (net of $ 6,296 in issuance expenses)
|
5 | - | 55,957 | - | - | - | 55,962 | |||||||||||||||||||||||||
|
Exercise of stock options
|
* | ) - | - | 1,017 | - | - | - | 1,017 | ||||||||||||||||||||||||
|
Compensation related to options
granted to employees
|
- | - | 4,489 | - | - | - | 4,489 | |||||||||||||||||||||||||
|
Exercise of warrants
|
* | ) - | - | 17 | - | - | - | 17 | ||||||||||||||||||||||||
|
Foreign currency translation
adjustments
|
- | - | - | - | (24 | ) | - | $ | (24 | ) | (24 | ) | ||||||||||||||||||||
|
Unrealized gain from derivatives, net
of taxes
|
- | - | - | - | 142 | - | 142 | 142 | ||||||||||||||||||||||||
|
Net income
|
- | - | - | - | - | 9,952 | 9,952 | 9,952 | ||||||||||||||||||||||||
|
Total comprehensive income
|
$ | 10,070 | ||||||||||||||||||||||||||||||
|
Balance as of December 31, 2010
|
$ | 22 | $ | - | $ | 109,927 | $ | (23,213 | ) | $ | (440 | ) | $ | 40,074 | $ | 126,370 | ||||||||||||||||
*) Represents an amount lower than $ 1.
The accompanying notes are an integral part of the consolidated financial statements.
F - 5 -
MEDIAMIND TECHNOLOGIES INC.
(FORMERLY EYEBLASTER, INC.) AND ITS SUBSIDIARIES
CONSOLIDATED STATEMENTS OF CASH FLOWS
U.S. dollars in thousands
|
Year ended December 31,
|
||||||||||||
|
2008
|
2009
|
2010
|
||||||||||
|
Cash flows from operating activities:
|
||||||||||||
|
Net income
|
$ | 6,162 | $ | 9,828 | $ | 9,952 | ||||||
|
Adjustments to reconcile net income to net cash provided by operating activities:
|
||||||||||||
|
Depreciation
|
1,053 | 1,211 | 2,239 | |||||||||
|
Compensation related to options granted to employees
|
2,756 | 3,292 | 4,489 | |||||||||
|
Increase in trade receivables
|
(256 | ) | (5,853 | ) | (3,574 | ) | ||||||
|
Decrease (increase) in other accounts receivable and prepaid expenses
|
459 | (217 | ) | (776 | ) | |||||||
|
Increase in deferred taxes
|
(1,476 | ) | (226 | ) | (814 | ) | ||||||
|
Decrease (increase) in other long-term assets
|
(685 | ) | 13 | (66 | ) | |||||||
|
Decrease in trade payables
|
(894 | ) | (79 | ) | (295 | ) | ||||||
|
Increase (decrease) in employee and payroll accruals
|
1,001 | 1,327 | (678 | ) | ||||||||
|
Increase (decrease) in other accounts payable
|
(536 | ) | 1,419 | 1,171 | ||||||||
|
Increase (decrease) in accrued severance pay and other employee accruals, net
|
959 | (261 | ) | 335 | ||||||||
|
Decrease (increase) in accrued interest
|
177 | (111 | ) | (109 | ) | |||||||
|
Loss (gain) on disposal of property and equipment
|
17 | (32 | ) | (50 | ) | |||||||
|
Net cash provided by operating activities
|
8,737 | 10,311 | 11,824 | |||||||||
|
Cash flows from investing activities:
|
||||||||||||
|
Investments in marketable securities
|
(12,502 | ) | (2,124 | ) | - | |||||||
|
Proceeds from redemption of marketable securities
|
27,084 | 591 | - | |||||||||
|
Investments in short-term deposits
|
- | (18,250 | ) | (79,453 | ) | |||||||
|
Proceeds from maturity of short-term deposits
|
- | - | 22,050 | |||||||||
|
Restricted cash
|
- | (765 | ) | (2,080 | ) | |||||||
|
Proceeds from release of restricted cash
|
- | - | 1,664 | |||||||||
|
Purchase of property and equipment
|
(1,425 | ) | (1,251 | ) | (4,347 | ) | ||||||
|
Proceeds from sale of property and equipment
|
7 | 166 | 11 | |||||||||
|
Net cash provided by (used in) investing activities
|
13,164 | (21,633 | ) | (62,155 | ) | |||||||
|
Cash flows from financing activities:
|
||||||||||||
|
Acquisition of treasury stock
|
- | - | (533 | ) | ||||||||
|
Proceeds from initial public offering, net of issuance costs
|
- | - | 55,962 | |||||||||
|
Proceeds from exercise of stock options and warrants
|
121 | 45 | 1,034 | |||||||||
|
Net cash provided by financing activities
|
121 | 45 | 56,463 | |||||||||
|
Increase (decrease) in cash and cash equivalents
|
22,022 | (11,277 | ) | 6,132 | ||||||||
|
Effects of exchange rate changes on cash and cash equivalents
|
(757 | ) | 480 | (11 | ) | |||||||
|
Cash and cash equivalents at the beginning of the year
|
4,895 | 26,160 | 15,363 | |||||||||
|
Cash and cash equivalents at the end of the year
|
$ | 26,160 | $ | 15,363 | $ | 21,484 | ||||||
The accompanying notes are an integral part of the consolidated financial statements.
F - 6 -
MEDIAMIND TECHNOLOGIES INC.
(FORMERLY EYEBLASTER, INC.) AND ITS SUBSIDIARIES
CONSOLIDATED STATEMENTS OF CASH FLOWS
U.S. dollars in thousands
|
Year ended December 31,
|
||||||||||||
|
2008
|
2009
|
2010
|
||||||||||
|
Supplemental disclosure of cash flow information:
|
||||||||||||
|
Cash paid and received during the year for:
|
||||||||||||
|
Income taxes paid
|
$ | 3,236 | $ | 2,596 | $ | 4,269 | ||||||
|
Income taxes received
|
$ | - | $ | 1,312 | $ | 15 | ||||||
|
Interest on income tax received
|
$ | - | $ | 273 | $ | - | ||||||
|
Income interest received
|
$ | 531 | $ | 121 | $ | 544 | ||||||
|
Non-cash activities:
|
||||||||||||
|
Purchase of property and equipment
|
$ | - | $ | - | $ | 416 | ||||||
The accompanying notes are an integral part of the consolidated financial statements.
F - 7 -
MEDIAMIND TECHNOLOGIES INC.
(FORMERLY: EYEBLASTER, INC.) AND ITS SUBSIDIARIES
NOTES TO CONSOLIDATED FINANCIAL STATEMENTS
U.S. dollars in thousands
|
NOTE 1:-
|
GENERAL
|
|
|
a.
|
Mediamind Technologies Inc. ("the Company") is a global provider of digital advertising campaign management solutions to media agencies and advertisers. The Company provides its customers with an integrated campaign management platform ("Mediamind") that helps advertisers and agencies simplify the complexities of managing their advertising budgets across multiple digital media channels and formats, including online, mobile, rich media, in-stream video, display and search. Mediamind provides the Company’s customers with the ability to plan, create, deliver, measure, track and optimize digital media campaigns.
The Company markets its services through wholly-owned subsidiaries in Israel, the United Kingdom, France, Germany, Australia, Spain, Hong Kong, Japan, China, Mexico and Brazil. The subsidiaries provide marketing and distribution services for the Company’s solutions and services to its customers worldwide.
The Company's operations rely significantly on third-party service providers, such as data centers, content delivery services and bandwidth providers. The Company has entered into an agreement to use a third-party to provide content delivery services to assist the Company in serving advertisements and had committed to a minimum amount during the calendar year. If this service provider or other third-party service providers fail to provide their services or if their services are no longer available to the Company for any reason and the Company is not immediately able to find replacement providers, the Company's business, financial conditions or results of operations could be materially adversely affected.
As to principal markets and major customers, see Note 10. If a major customer decides not to continue purchasing services from the Company or significantly reduces its spending with the Company, the Company may not be able to make up the lost revenue.
|
|
|
b.
|
Initial Public Offering (“IPO”):
On August 10, 2010 the Company completed the IPO of its Common stock on the Nasdaq Capital Market. The Company issued 5,413,703 shares of Common stock, including 413,703 shares derived from the exercise of the underwriters’ over-allotment at a price of $ 11.50 per share for total gross proceeds of $ 62,258 or approximately $ 55,962 in net proceeds after deducting underwriting discounts and commissions of $ 3,795 and other offering costs of $ 2,501. Immediately prior to the closing of the IPO, each outstanding Convertible Preferred Stock was converted into 2.1068 Common stock based on the effective conversion rate calculated as of the closing date. As none of the holders of the preferred stocks chose to redeem its holdings rather than to convert, no holder was entitled to receive accretion specified in the preferred stocks' terms (see also note 2q).
|
F - 8 -
MEDIAMIND TECHNOLOGIES INC.
(FORMERLY: EYEBLASTER, INC.) AND ITS SUBSIDIARIES
NOTES TO CONSOLIDATED FINANCIAL STATEMENTS
U.S. dollars in thousands
|
NOTE 2:-
|
SIGNIFICANT ACCOUNTING POLICIES
|
The consolidated financial statements are prepared according to United States generally accepted accounting principles ("U.S. GAAP").
|
|
a.
|
Use of estimates:
The preparation of financial statements in conformity with U.S. GAAP requires management to make estimates and assumptions that affect the amounts reported in the financial statements and accompanying notes. Actual results could differ from those estimates.
|
|
|
b.
|
Financial statements in U.S. dollars:
Most of the Company's revenues are generated in U.S. dollars. Although a portion of the subsidiaries' expenses is denominated in their respective local currencies, a substantial portion of their expenses is denominated in U.S. dollars. The Company's management believes that the U.S. dollar is the primary currency of the primary economic environment in which the Company operates. Accordingly, the U.S. dollar was used as the Company's functional and reporting currency. Monetary accounts in currencies other than the U.S. dollar of foreign subsidiaries whose functional currency has been determined to be the U.S. dollar are remeasured into U.S. dollar in accordance with ASC 830, "Foreign Currency Matters". All transaction gains and losses of the remeasured monetary balance sheet items are reflected in the statement of income as financial income or expenses, as appropriate.
|
F - 9 -
MEDIAMIND TECHNOLOGIES INC.
(FORMERLY: EYEBLASTER, INC.) AND ITS SUBSIDIARIES
NOTES TO CONSOLIDATED FINANCIAL STATEMENTS
U.S. dollars in thousands
|
NOTE 2:-
|
SIGNIFICANT ACCOUNTING POLICIES (Cont.)
|
The financial statements of the Company's subsidiaries whose functional currency has been determined to be their local currency have been translated into U.S. dollars. Assets and liabilities of these subsidiaries are translated at year-end exchange rates and their statement of operations items are translated using the actual exchange rates at the dates on which those items are recognized. Such translation adjustments are recorded as a separate component of accumulated other comprehensive income in stockholders' equity.
|
|
c.
|
Principles of consolidation:
The consolidated financial statements include the financial statements of the Company and its wholly-owned subsidiaries. Intercompany transactions and balances have been eliminated upon consolidation.
|
|
|
d.
|
Cash equivalents:
Cash equivalents are short-term bank deposits that are readily convertible into cash with original maturities of three months or less.
|
|
|
e.
|
Restricted cash:
Restricted cash is an interest-bearing saving account which is used as a security for a bank's guarantee in favor of the Company.
|
|
|
f.
|
Marketable securities:
The Company accounts for its marketable securities in accordance with ASC 320, "Investments-Debt and Equity Securities". Management determines the appropriate classification of its investments in debt and equity securities at the time of purchase and reevaluates such determinations at each balance sheet date.
The Company classified all its marketable securities as held-to-maturity as it has the positive intent and ability to hold the securities to maturity and stated them at amortized cost. The amortized cost of held-to-maturity securities is adjusted for amortization of premiums and accretion of discounts to maturity. Such amortization, accretion and decline in value judged to be other than temporary determined on a specific identification method and interest are included in financial income or expenses, as appropriate, in accordance with the Company's policy and ASC 320.
|
F - 10 -
MEDIAMIND TECHNOLOGIES INC.
(FORMERLY: EYEBLASTER, INC.) AND ITS SUBSIDIARIES
NOTES TO CONSOLIDATED FINANCIAL STATEMENTS
U.S. dollars in thousands
|
NOTE 2:-
|
SIGNIFICANT ACCOUNTING POLICIES (Cont.)
|
|
|
g.
|
Property and equipment:
Property and equipment are stated at cost, net of accumulated depreciation. Depreciation is calculated by the straight-line method over the estimated useful lives of the assets at the following annual rates:
|
|
%
|
||||
|
Computers and peripheral equipment
|
33 | |||
|
Office furniture and equipment
|
7 - 15 (mainly 15%)
|
|||
|
Leasehold improvements
|
The shorter of term of the lease or the useful life of the asset
|
|||
The Company reviews property and equipment for impairment whenever events or changes in circumstances indicate the carrying amount of an asset may not be recoverable. The Company measures recoverability of these assets by comparing the carrying amounts to the future undiscounted cash flows the assets are expected to generate. If property and equipment are considered to be impaired, the impairment to be recognized equals the amount by which the carrying value of the asset exceeds its fair market value. The tests are based on the Company's single operating segment and reporting unit structure. No impairment losses were identified in any of the years presented.
|
|
h.
|
Revenue recognition:
The Company generates revenues primarily from monthly transaction volume-based fees earned by the Company for making the MediaMind platform available to the Company's customers on an Application Service Provider (ASP) basis. Accordingly, such revenue is recognized in accordance with ASC 605, "Revenue Recognition" and Staff Accounting Bulletin No. 104, "Revenue Recognition in Financial Statements" in the month that the advertising impressions or click-through occur, provided that persuasive evidence of an arrangement exists, no significant Company obligations remain, collection of the resulting receivable is reasonably assured, and the fees are fixed or determinable.
The Company's customers do not have the right to take possession of the Company's software at any time during or after the term of the relevant customer agreement. Accordingly, as prescribed by ASC 605-30, "Rights to Use" the Company's revenue recognition is outside the scope of ASC 985-605.
|
F - 11 -
MEDIAMIND TECHNOLOGIES INC.
(FORMERLY: EYEBLASTER, INC.) AND ITS SUBSIDIARIES
NOTES TO CONSOLIDATED FINANCIAL STATEMENTS
U.S. dollars in thousands
|
NOTE 2:-
|
SIGNIFICANT ACCOUNTING POLICIES (CONT.)
|
|
|
i.
|
Research and development expenses:
Research and development expenses mainly include costs associated with the maintenance of the Company's technology platform and are therefore expensed as incurred. The Company follows the guidance of ASC 350-40, "Internal-Use Software". No material software development costs were capitalized during all periods presented.
|
|
j.
|
Income taxes:
The Company and its subsidiaries account for income taxes in accordance with ASC 740, "Income Taxes". This Statement prescribes the use of the liability method whereby deferred tax asset and liability account balances are determined based on differences between financial reporting and tax bases of assets and liabilities and are measured using the enacted tax rates and laws that will be in effect when the differences are expected to reverse.
Deferred tax liabilities and assets are classified as current or noncurrent based on the classification of the related asset or liability for financial reporting, or according to the expected reversal dates of the specific temporary differences if not related to an asset or liability for financial reporting.
The Company accounts for its uncertain tax positions in accordance with ASC 740 which contains a two-step approach to recognizing and measuring uncertain tax positions accounted for in accordance with ASC 740. The first step is to evaluate the tax position taken or expected to be taken in a tax return by determining if the weight of available evidence indicates that it is more likely than not that, on an evaluation of the technical merits, the tax position will be sustained on audit, including resolution of any related appeals or litigation processes. The second step is to measure the tax benefit as the largest amount that is more than 50% likely to be realized upon ultimate settlement. The Company reevaluates its income tax positions to consider factors such as changes in facts or circumstances, changes in or interpretations of tax law, effectively settled issues under audit, and new audit activity. Such a change in recognition or measurement would result in recognition of a tax benefit or an additional charge to the tax provision. The Company accrues interest and penalties related to unrecognized tax benefits in its financial expenses.
|
F - 12 -
MEDIAMIND TECHNOLOGIES INC.
(FORMERLY: EYEBLASTER, INC.) AND ITS SUBSIDIARIES
NOTES TO CONSOLIDATED FINANCIAL STATEMENTS
U.S. dollars in thousands
|
NOTE 2:-
|
SIGNIFICANT ACCOUNTING POLICIES (Cont.)
|
|
|
k.
|
Concentration of credit risks:
Financial instruments that potentially subject the Company and its subsidiaries to concentrations of credit risk consist principally of cash and cash equivalents, short-term bank deposits, trade receivables and marketable securities. The majority of the Company's cash and cash equivalents, bank deposits and marketable securities are invested with major banks in the United States, Israel and the United Kingdom. Management believes that the financial institutions that hold the Company's investments are institutions with high credit standing, and accordingly, low credit risk exists with respect to these investments.
The Company's marketable securities include investments in U.S. corporate debentures. It is the Company's policy to review its marketable equity securities classified as investments on a regular basis to evaluate whether or not any security has experienced other than temporary decline in fair value.
The Company's trade receivables are derived from sales to customers located primarily in the United States and Europe. The Company performs ongoing credit evaluations of its customers' financial condition. The Company maintains an allowance for doubtful accounts receivable based upon management's experience and estimate of collectability of each outstanding invoice. The allowance for doubtful accounts is determined with respect to specific debts that are doubtful of collection. As of December 31, 2009 and 2010, the Company recorded allowance for doubtful accounts of $0 and $106, respectively. To date, the Company has not experienced any material losses on its accounts receivable. The risk of collection associated with accounts receivable is mitigated by the diversity and number of customers.
|
F - 13 -
MEDIAMIND TECHNOLOGIES INC.
(FORMERLY: EYEBLASTER, INC.) AND ITS SUBSIDIARIES
NOTES TO CONSOLIDATED FINANCIAL STATEMENTS
U.S. dollars in thousands
|
NOTE 2:-
|
SIGNIFICANT ACCOUNTING POLICIES (Cont.)
|
|
|
l.
|
Severance pay:
The Israeli subsidiary's liability for severance pay is calculated pursuant to the Israeli Severance Pay Law based on the most recent salary of the employee multiplied by the number of years of employment as of the balance sheet date. Employees are entitled to one month's salary for each year of employment or a portion thereof. The Israeli subsidiary's liability for all of its employees is satisfied by monthly deposits with insurance policies and by an accrual.
The deposited funds include profits accumulated up to the balance sheet date. The deposited funds may be withdrawn only upon the fulfillment of the obligations pursuant to the Israeli Severance Pay Law or labor agreements. The value of the deposited funds is based on the cash surrendered value of these policies.
Severance pay expense for the years ended December 31, 2008, 2009 and 2010 amounted to approximately $ 945, $ 367 and $ 927, respectively.
|
|
|
m.
|
Accounting for stock-based compensation:
ASC 718 requires the use of a valuation model to calculate the fair value of stock based awards. The Company has elected to use the Black-Scholes option-pricing model to determine the fair value of stock based awards on the dates of grant. The assumptions about stock-price volatility have been based exclusively on the volatilities of publicly traded companies that, in management's opinion, are comparable to the Company as the Company trading history is limited (see note 1b). The risk-free interest rate is based on the yield from U.S Treasury zero-coupon bonds with an equivalent term. The expected option term represents the period that the Company's stock options are expected to be outstanding and was determined based on the simplified method permitted by SAB 110 as the average of the vesting period and the contractual term. The Company has historically not paid dividends and has no foreseeable plans to pay dividends.
The following assumptions were used to estimate the fair value of the stock options granted during the years ended December 31, 2008, 2009 and 2010:
|
|
Year ended December 31,
|
||||||||||||
|
2008
|
2009
|
2010
|
||||||||||
|
Risk free interest
|
2.46%-5.68 | % | 2.23%-3.6 | % | 1.08%-5.33 | % | ||||||
|
Dividend yields
|
0 | % | 0 | % | 0 | % | ||||||
|
Volatility
|
85 | % | 80%-85 | % | 59%-84 | % | ||||||
|
Expected term (in years)
|
5-10 | 4.8-7 | 4-8 | |||||||||
|
Weighted average fair value of options at grant date
|
$ | 3.84 | $ | 6.11 | $ | 6.60 | ||||||
The Company recognizes compensation expense for the value of its awards, net of estimated forfeitures. Estimated forfeitures are based on actual historical pre-vesting forfeitures.
F - 14 -
MEDIAMIND TECHNOLOGIES INC.
(FORMERLY: EYEBLASTER, INC.) AND ITS SUBSIDIARIES
NOTES TO CONSOLIDATED FINANCIAL STATEMENTS
U.S. dollars in thousands
|
NOTE 2:-
|
SIGNIFICANT ACCOUNTING POLICIES (Cont.)
|
|
|
n.
|
Stock Split:
All figures in these financial statements relating to the common stock and convertible preferred stock have been retroactively adjusted to reflect a two-for-one stock split effected July 23, 2010 (see Note 8(a)(1)).
|
|
|
o.
|
Derivative instruments:
In 2009, the Company adopted a foreign currency cash flow hedging program using foreign currency forward contracts ("derivative instruments") in order to hedge the exposure to variability in expected future cash flows resulting from changes in related foreign currency exchange rates. These transactions are designated as cash flow hedges, as defined by ASC 815, "Derivatives and Hedging".
ASC 815 requires companies to recognize all of their derivative instruments as either assets or liabilities in the balance sheet at fair value. The Company measured the fair value of the contracts in accordance with ASC 820, "Fair Value Measurements and Disclosures" at Level 2. The accounting for changes in the fair value (i.e., gains or losses) of a derivative instrument depends on whether it has been designated and qualifies as part of a hedging relationship and further, on the type of hedging relationship.
For those derivative instruments that are designated and qualify as hedging instruments, a company must designate the hedging instrument, based upon the exposure being hedged, as a fair value hedge, cash flow hedge or a hedge of a net investment in a foreign operation.
For derivative instruments that are designated and qualify as a cash flow hedge (i.e., hedging the exposure to variability in expected future cash flows that is attributable to a particular risk), the effective portion of the gain or loss on the derivative instrument is reported as a component of other comprehensive income (loss), net of taxes and reclassified into earnings in the same period or periods during which the hedged transaction affects earnings.
The Company's cash flow hedging strategy is to hedge against the risk of overall changes in cash flows resulting from forecasted foreign currency salary payments during the year. The Company hedges portions of its forecasted expenses denominated in NIS with forward exchange contracts. These forward exchange contracts are designated as cash flow hedges, as defined by ASC 815 and Derivative Implementation ASC 815-30, "Cash Flow Hedges".
|
F - 15 -
MEDIAMIND TECHNOLOGIES INC.
(FORMERLY: EYEBLASTER, INC.) AND ITS SUBSIDIARIES
NOTES TO CONSOLIDATED FINANCIAL STATEMENTS
U.S. dollars in thousands
|
NOTE 2:-
|
SIGNIFICANT ACCOUNTING POLICIES (Cont.)
|
The Company recognized a net gain from its currency forward transactions of $ 111 and $ 225 during the years ended December 31, 2009 and 2010, respectively. An amount of $ 89 and $ 193 was offset against operating expenses during the years ended December 31, 2009 and 2010, respectively. An amount of $ 22 and $ 32 was included in financial income, net during the years ended December 31, 2009 and 2010, respectively.
As of December 31, 2010, the Company recorded accumulated other comprehensive income, net of taxes, in the amount of $ 209 from its currency forward transactions with respect to payroll incurred during 2010. Such amount will be recorded in earnings during 2011.
|
p.
|
Comprehensive income:
The Company accounts for comprehensive income in accordance with ASC 220, "Comprehensive Income". This Statement establishes standards for the reporting and display of comprehensive income and its components in a full set of general purpose financial statements. Comprehensive income generally represents all changes in stockholders' equity during the period except those resulting from investments by, or distributions to, stockholders. The Company determined that its items of other comprehensive income relate to gain and loss on hedging derivative instruments and from foreign currency translation adjustments.
|
|
|
q.
|
Net income attributable to Common stockholders:
Under the Company's articles of incorporation effective prior to the closing of the IPO, in the event that the Company declares or distributes dividends prior to the consummation of a Qualified IPO ("a QIPO"), an IPO in which the Company raises at least $ 40,000 of net proceeds at a price per share equal to at least $ 14.50, as defined in the Company's articles of incorporation, holders of the Company's Preferred stock were entitled to a preference to receive, prior to distribution of any dividends to holders of any of its Common stock, an amount equal to the original issue price per share on a cumulative basis, net of all previously paid management fees, where applicable (see also Note 11). In accordance with ASC 260, "Earning per Share", the Company deducted the value of the Preferred stock dividend preference, calculated through the date of the conversion of the Preferred stock into Common stock (see note 1b), from its reported net income to compute net income attributable to Common stockholders, even though the Company has not declared or distributed any dividends since inception. Net income attributable to Common stockholders is used to compute earnings per share.
|
F - 16 -
MEDIAMIND TECHNOLOGIES INC.
(FORMERLY: EYEBLASTER, INC.) AND ITS SUBSIDIARIES
NOTES TO CONSOLIDATED FINANCIAL STATEMENTS
U.S. dollars in thousands
|
NOTE 2:-
|
SIGNIFICANT ACCOUNTING POLICIES (Cont.)
|
|
|
r.
|
Earnings per share:
Basic net earnings per share ("Basic EPS") are computed by dividing net income attributable to Common stockholders by the weighted average number of shares of Common stock outstanding during the period, excluding shares subject to repurchase, using the two-class method as required by ASC 260-10, "Other Presentation Matters". The two-class method is an earnings allocation formula that determines earnings per share for each class of Common stock and participating security according to dividends declared (or accumulated) and participation rights in undistributed earnings. Under the two-class method, net income is reduced by the contractual amount of dividends (or interest on participating income bonds) that must be paid for the current period. The remaining earnings are then allocated to Common stock and participating securities to the extent that each security may share in earnings as if all of the earnings for the period had been distributed.
The total earnings allocated to each security are determined by adding the amount allocated for dividends and the amount allocated for a participation feature. The total earnings allocated to each security are then divided by the weighted average number of outstanding shares of each class of the security to which the earnings are allocated to determine the net earnings per share for the class of such security.
All above mentioned calculations were carried until the date through which the participating securities were outstanding. As of the date the participating securities were converted into Common stock for the proportional period remaining until the end of the year (see note 1b).
Diluted net earnings per share ("Diluted EPS") give effect to all dilutive potential Common stock outstanding during the period. The computation of Diluted EPS does not assume conversion, exercise or contingent exercise of securities that would have an anti-dilutive effect on earnings. The dilutive effect of outstanding stock options and warrants is computed using the treasury stock method.
|
F - 17 -
MEDIAMIND TECHNOLOGIES INC.
(FORMERLY: EYEBLASTER, INC.) AND ITS SUBSIDIARIES
NOTES TO CONSOLIDATED FINANCIAL STATEMENTS
U.S. dollars in thousands
|
NOTE 2:-
|
SIGNIFICANT ACCOUNTING POLICIES (Cont.)
|
|
|
s.
|
Fair value measurements:
The following methods and assumptions were used by the Company in estimating fair value disclosures for financial instruments.
The carrying amounts reported in the balance sheet for cash and cash equivalents, bank deposits, trade receivables, other accounts receivable, trade payables and other accounts payable approximate their fair values due to the short-term maturities of such instruments.
The Company measures the fair value based on guidance of ASC 820, "Fair Value Measurements and Disclosures", which defines fair value, establishes a framework for measuring fair value, and expands disclosures about fair value measurements.
The Company adopted the provisions of ASC 820, with respect to non-financial assets and liabilities measured at fair value on a non-recurring basis.
ASC 820 defines fair value as the price that would be received to sell an asset or paid to transfer a liability in an orderly transaction between market participants at the measurement date. ASC 820 describes three levels of inputs that may be used to measure fair value as follows:
|
|
Level 1
|
-
|
quoted prices in active markets for identical assets or liabilities;
|
|
|
Level 2
|
-
|
significant other observable inputs based on market data obtained from sources independent of the reporting entity;
|
|
|
Level 3
|
-
|
inputs that are unobservable (for example cash flow modeling inputs based on assumptions).
|
|
|
|
During the years ended December 31, 2008, 2009 and 2010, no impairment losses have been identified.
|
|
|
t.
|
Impact of newly issued accounting pronouncements:
There are no relevant newly issued accounting pronouncements which have an impact on these financial statements.
|
F - 18 -
MEDIAMIND TECHNOLOGIES INC.
(FORMERLY: EYEBLASTER, INC.) AND ITS SUBSIDIARIES
NOTES TO CONSOLIDATED FINANCIAL STATEMENTS
U.S. dollars in thousands
|
NOTE 3:-
|
MARKETABLE SECURITIES
|
Marketable securities with contractual maturities of one year through five years are as follows:
|
December 31, 2009
|
||||||||||||||||
|
Amortized cost
|
Gross unrealized gains
|
Gross unrealized losses
|
Fair
value
|
|||||||||||||
|
Corporate debentures
|
$ | 2,077 | $ | 29 | $ | - | $ | 2,106 | ||||||||
|
December 31, 2010
|
||||||||||||||||
|
Amortized cost
|
Gross unrealized gains
|
Gross unrealized losses
|
Fair
value
|
|||||||||||||
|
Corporate debentures
|
$ | 2,043 | $ | 55 | $ | - | $ | 2,098 | ||||||||
The unrealized gains in the Company's investments in held-to-maturity marketable securities were mainly caused by interest rate changes. The contractual cash flow of these investments are issued by highly rated corporations. Accordingly, it is expected that the securities will not be settled at a price of less than the amortized cost of the Company's investments.
In accordance with ASC 820, the Company measures its marketable securities at fair value. Marketable securities are classified within level 1 and are thus valued using quoted market prices.
F - 19 -
MEDIAMIND TECHNOLOGIES INC.
(FORMERLY: EYEBLASTER, INC.) AND ITS SUBSIDIARIES
NOTES TO CONSOLIDATED FINANCIAL STATEMENTS
U.S. dollars in thousands
|
NOTE 4:-
|
PROPERTY AND EQUIPMENT
|
|
December 31,
|
||||||||
|
2009
|
2010
|
|||||||
|
Cost:
|
||||||||
|
Computers and peripheral equipment
|
$ | 5,494 | $ | 9,052 | ||||
|
Office furniture and equipment
|
812 | 1,111 | ||||||
|
Leasehold improvements
|
334 | 1,294 | ||||||
| 6,640 | 11,457 | |||||||
|
Accumulated depreciation:
|
||||||||
|
Computers and peripheral equipment
|
3,812 | 5,490 | ||||||
|
Office furniture and equipment
|
365 | 504 | ||||||
|
Leasehold improvements
|
36 | 449 | ||||||
| 4,213 | 6,443 | |||||||
|
Depreciated cost
|
$ | 2,427 | $ | 5,014 | ||||
Depreciation expenses for the years ended December 31, 2008, 2009 and 2010 amounted to $ 1,053, $ 1,211 and $ 2,239, respectively.
|
NOTE 5:-
|
OTHER ACCOUNTS PAYABLE
|
|
December 31,
|
||||||||
|
2009
|
2010
|
|||||||
|
Accrued expenses
|
$ | 1,371 | $ | 1,828 | ||||
|
Accrued commissions
|
415 | 604 | ||||||
|
Government authorities
|
2,267 | 2,644 | ||||||
|
Deferred taxes
|
- | 18 | ||||||
| $ | 4,053 | $ | 5,094 | |||||
F - 20 -
MEDIAMIND TECHNOLOGIES INC.
(FORMERLY: EYEBLASTER, INC.) AND ITS SUBSIDIARIES
NOTES TO CONSOLIDATED FINANCIAL STATEMENTS
U.S. dollars in thousands
|
NOTE 6:-
|
COMMITMENTS AND CONTINGENCIES
|
The Company and its subsidiaries rent their facilities and motor vehicles under various operating lease agreements. In addition the Company and its subsidiaries are engaged into an agreement to use a third party to provide content delivery. The agreements end on different dates, the latest of which is in 2015 (excluding renewal options).
Future minimum payments under non-cancelable contractual obligations as of December 31, 2010 are as follows:
|
Year ended December 31,
|
||||
|
2011
|
3,963 | |||
|
2012
|
3,402 | |||
|
2013
|
2,780 | |||
|
2014
|
2,251 | |||
|
2015
|
1,844 | |||
|
Thereafter
|
8,989 | |||
| 23,229 | ||||
Total rent, motor vehicle and content delivery services expenses for the years ended December 31, 2008, 2009 and 2010 were $ 3,808, $ 3,869 and $ 4,173, respectively.
The Company leases motor vehicles under cancelable operating lease agreements. The Company has an option to be released from this agreement, which may result in penalties in a maximum amount of $ 75 as of December 31, 2010. The Company also has contractual penalties in a maximum amount of $ 188 as of December 31, 2010 in respect for mobile phone agreements for the use of its employees.
Litigation:
During 2010, the Company settled a claim against its insurance carrier regarding its entitlement for reimbursement under the insurance policy, for legal fees incurred over the years 2007 and 2008 in litigation over a third party claim. The total income recognized by the Company, as a reduction to the general and administrative expenses, during the year ended December 31, 2010, as a result of such settlement, was $ 502.
F - 21 -
MEDIAMIND TECHNOLOGIES INC.
(FORMERLY: EYEBLASTER, INC.) AND ITS SUBSIDIARIES
NOTES TO CONSOLIDATED FINANCIAL STATEMENTS
U.S. dollars in thousands
|
NOTE 7:-
|
INCOME TAXES
The Company's consolidated provision for income taxes and deferred tax assets and liabilities is computed based on a combination of the United States tax rates on its United States income, the Israeli tax rates on its Israeli income, as well as the tax rates of other jurisdictions where it conducts business.
|
|
|
a.
|
Taxation of Israeli income:
|
|
|
1.
|
Corporate tax rates:
Taxable income of Israeli companies is subject to tax at the rate of 27% in 2008, 26% in 2009, 25% in 2010, 24% in 2011, 23% in 2012, 22% in 2013, 21% in 2014, 20% in 2015, 18% in 2016 and thereafter.
|
|
|
2.
|
Tax benefits under the Law for the Encouragement of Capital Investments, 1959 ("the Investment Law"):
Certain production facilities of the Company's subsidiary in Israel ("MediaMind Technologies Ltd.", formerly: Eyeblaster Ltd.") have been granted "Approved Enterprise" status under the Investment Law.
In accordance with the Investment Law, MediaMind Technologies Ltd. has elected the "Alternative tax benefits". On April 1, 2005, an amendment to the Investment Law came into effect ("the first Amendment") and has significantly changed the provisions of the Investment Law. The first Amendment limits the scope of enterprises which may be approved by the Investment Center by setting criteria for the approval of a facility as a "Beneficiary Enterprise" (rather than the previous terminology of "Approved Enterprise"), such as by requiring that at least 25% of the "Beneficiary Enterprise's" income will be derived from export. Additionally, the first Amendment enacted major changes in the manner in which tax benefits are awarded under the Investment Law so that companies no longer require Investment Center approval in order to qualify for tax benefits. However, the Investment Law provides that terms and benefits included in any certificate of approval already granted will remain subject to the provisions of the Investment Law as they were on the date of such approval. Therefore, MediaMind Technologies Ltd.'s existing Approved Enterprise will generally not be subject to the provisions of the first Amendment. As a result of the first Amendment, tax-exempt income generated under the provisions of the amended Investment Law, will subject the Company to taxes upon distribution or complete liquidation.
Accordingly, MediaMind Technologies Ltd.'s income attributed to its Approved Enterprise and Beneficiary Enterprise programs is tax exempt for a period of two years and is subject to a reduced corporate tax rate of 10%-25% for an additional period of five to eight years, depending on the percentage of foreign investment in the Company.
|
F - 22 -
MEDIAMIND TECHNOLOGIES INC.
(FORMERLY: EYEBLASTER, INC.) AND ITS SUBSIDIARIES
NOTES TO CONSOLIDATED FINANCIAL STATEMENTS
U.S. dollars in thousands
|
NOTE 7:-
|
INCOME TAXES (Cont.)
|
The duration of tax benefits for the program is subject to limitations of the earlier of 12 years from commencement of investment, or 14 years from receipt of approval as an "Approved Enterprise" under the Investment Law.
The entitlement to the above benefits is conditional upon MediaMind Technologies Ltd. fulfilling the conditions stipulated by the Investment Law, regulations published thereunder and the certificates of approval for the specific investments in Approved Enterprises.
Should MediaMind Technologies Ltd. fail to meet such requirements in the future, income attributable to its Approved Enterprise or Beneficiary Enterprise programs could be subject to the statutory Israeli corporate tax rate, and MediaMind Technologies Ltd. could be required to refund the tax benefits already received with respect to such program, in whole or in part, including interest.
In the event of distribution of a dividend from the above mentioned tax-exempt income, the amount distributed will be subject to corporate tax at the rate ordinarily applicable to the Approved Enterprise's and Beneficiary Enterprise's income, in addition to withholding tax.
Out of the MediaMind Technologies Ltd.'s earnings available for distribution as of December 31, 2010, $ 2,330 is a tax-exempt income attributable to its Approved Enterprise program. If such tax-exempt income is distributed in a manner other than upon the complete liquidation of MediaMind Technologies Ltd., it would be taxed at the corporate tax rate applicable to such profits and an income tax liability of up to approximately $ 583 would be incurred as of December 31, 2010. The tax-exempt income attributable to the Approved Enterprise can be distributed to stockholders without imposing tax liability on MediaMind Technologies Ltd. only upon the complete liquidation of MediaMind Technologies Ltd.
In addition, as a result of the Amendment, tax-exempt income attributed to the Company's Beneficiary Enterprise program will subject the Company to taxes upon distribution or complete liquidation. Through December 31, 2010, the Company had $ 22,068 of tax-exempt income attributed to its Beneficiary Enterprise program. If such tax-exempt income is distributed in a merger or a regular distribution or upon complete liquidation of the Company, it would be taxed at the corporate tax rate applicable to such profits and an income tax liability of up to $ 5,517 would be incurred as of December 31, 2010.
F - 23 -
MEDIAMIND TECHNOLOGIES INC.
(FORMERLY: EYEBLASTER, INC.) AND ITS SUBSIDIARIES
NOTES TO CONSOLIDATED FINANCIAL STATEMENTS
U.S. dollars in thousands
|
NOTE 7:-
|
INCOME TAXES (Cont.)
|
The Company has determined that it will not distribute any amounts of its undistributed tax-exempt income as dividend. The Company intends to reinvest its tax-exempt income and not to distribute such income as a dividend. Accordingly, no deferred income taxes have been provided on income attributable to the Company's Approved Enterprise or Beneficiary Enterprise (totaling $ 6,100 of additional liability as aforementioned) programs as the undistributed tax-exempt income is essentially permanent in duration.
Since part of MediaMind Technologies Ltd.'s taxable income is not entitled to tax benefits under the Investment Law and is taxed at the regular statutory tax rate, its effective tax rate is the result of a weighted combination of the various applicable rates and tax exemptions, and the computation is made for income derived from each program on the basis of formulas specified in the law and in the approvals.
On January 6, 2011, an additional amendment to the Investment Law came into effect ("the Second Amendment") which has significantly changed the provision of the Investment Law (see also note 13).
|
|
b.
|
Deferred taxes:
Deferred taxes reflect the net tax effects of temporary differences between the carrying amounts of assets and liabilities for financial reporting purposes and the amounts used for income tax purposes. As of December 31, 2009 and 2010, the Company's deferred taxes were in respect of the following:
|
|
December 31,
|
||||||||
|
2009
|
2010
|
|||||||
|
Reserves and allowances
|
$ | 1,415 | $ | 1,751 | ||||
|
Stock-based compensation
|
990 | 1,895 | ||||||
|
Property and equipment
|
(100 | ) | (523 | ) | ||||
|
Other
|
- | (18 | ) | |||||
|
Net deferred tax asset
|
$ | 2,305 | $ | 3,105 | ||||
|
Domestic:
|
||||||||
|
Current deferred tax asset
|
$ | 128 | $ | 135 | ||||
|
Non-current deferred tax asset, net
|
891 | 1,121 | ||||||
| 1,019 | 1,256 | |||||||
|
Foreign:
|
||||||||
|
Current deferred tax asset, net
|
888 | 842 | ||||||
|
Non-current deferred tax asset, net
|
398 | 1,025 | ||||||
|
Current deferred tax liability
|
- | (18 | ) | |||||
| 1,286 | 1,849 | |||||||
| $ | 2,305 | $ | 3,105 | |||||
Current deferred tax asset is included within other accounts receivables and prepaid expenses in the balance sheets.
F - 24 -
MEDIAMIND TECHNOLOGIES INC.
(FORMERLY: EYEBLASTER, INC.) AND ITS SUBSIDIARIES
NOTES TO CONSOLIDATED FINANCIAL STATEMENTS
U.S. dollars in thousands
|
NOTE 7:-
|
INCOME TAXES (Cont.)
|
|
|
c.
|
Income before income taxes is comprised as follows:
|
|
Year ended
December 31,
|
||||||||||||
|
2008
|
2009
|
2010
|
||||||||||
|
Domestic
|
$ | 544 | $ | 1,046 | $ | 1,349 | ||||||
|
Foreign
|
7,793 | 11,228 | 12,446 | |||||||||
| $ | 8,337 | $ | 12,274 | $ | 13,795 | |||||||
|
|
d.
|
Income tax expenses are comprised as follows:
|
|
Year ended
December 31,
|
||||||||||||
|
2008
|
2009
|
2010
|
||||||||||
|
Current
|
$ | 3,651 | $ | 2,672 | $ | 4,657 | ||||||
|
Deferred
|
(1,476 | ) | (226 | ) | (814 | ) | ||||||
| $ | 2,175 | $ | 2,446 | $ | 3,843 | |||||||
|
Domestic
|
$ | 395 | $ | 370 | $ | 488 | ||||||
|
Foreign
|
1,780 | 2,076 | 3,355 | |||||||||
| $ | 2,175 | $ | 2,446 | $ | 3,843 | |||||||
F - 25 -
MEDIAMIND TECHNOLOGIES INC.
(FORMERLY: EYEBLASTER, INC.) AND ITS SUBSIDIARIES
NOTES TO CONSOLIDATED FINANCIAL STATEMENTS
U.S. dollars in thousands
|
NOTE 7:-
|
INCOME TAXES (Cont.)
|
|
|
e.
|
A reconciliation between the theoretical tax expense, assuming all income is taxed at statutory rate applicable to income of the Company and actual tax expense as reported in the statements of income is as follows:
|
|
Year ended
December 31,
|
||||||||||||
|
2008
|
2009
|
2010
|
||||||||||
|
Income before income taxes as reported in the statements of income
|
$ | 8,337 | $ | 12,274 | $ | 13,795 | ||||||
|
Statutory tax rate in the U.S.
|
34 | % | 34 | % | 34 | % | ||||||
|
Theoretical tax provision at the U.S. statutory tax rate
|
$ | 2,835 | $ | 4,173 | $ | 4,690 | ||||||
|
Increase (decrease) in taxes resulting from:
|
||||||||||||
|
Effect of "Approved and Beneficiary Enterprise" status (*)
|
(975 | ) | (1,494 | ) | (813 | ) | ||||||
|
State tax expenses, net of federal benefit
|
33 | 53 | 94 | |||||||||
|
Tax adjustment in respect of foreign subsidiaries different tax rates
|
(463 | ) | (886 | ) | (1,010 | ) | ||||||
|
Nondeductible stock-based compensation
|
230 | 467 | 614 | |||||||||
|
Other nondeductible expenses
|
618 | 202 | 217 | |||||||||
|
Other
|
(103 | ) | (69 | ) | (51 | ) | ||||||
|
Actual tax expenses
|
$ | 2,175 | $ | 2,446 | $ | 3,843 | ||||||
|
(*)Basic earnings per share amounts of the benefit resulting from "Approved and Beneficiary Enterprise" status
|
$ | 0.12 | $ | 0.18 | $ | 0.08 | ||||||
|
(*)Diluted earnings per share amounts of the benefit resulting from "Approved and Beneficiary Enterprise" status
|
$ | 0.07 | $ | 0.11 | $ | 0.05 | ||||||
F - 26 -
MEDIAMIND TECHNOLOGIES INC.
(FORMERLY: EYEBLASTER, INC.) AND ITS SUBSIDIARIES
NOTES TO CONSOLIDATED FINANCIAL STATEMENTS
U.S. dollars in thousands
|
NOTE 7:-
|
INCOME TAXES (Cont.)
|
|
|
f.
|
The balance at December 31, 2009 and 2010, includes a liability for unrecognized tax benefits of $ 707 and $ 100, respectively for tax positions which are uncertain of being sustained. The accruals are with respect to some expenses which deduction for tax purposes is uncertain. The Company recognized accrued interest of $ 75 related to unrecognized tax benefits as financial expenses. A reconciliation of the beginning and ending amount of unrecognized tax benefits is as follows:
|
|
December 31,
|
||||||||
|
2009
|
2010
|
|||||||
|
Balance at beginning of year
|
$ | 702 | $ | 707 | ||||
|
Additions based on tax positions related to thecurrent year
|
- | - | ||||||
|
Additions for tax positions of prior years
|
5 | - | ||||||
|
Reductions for tax positions of prior years
|
- | (353 | ) | |||||
|
Reductions relating to settlement with tax authorities
|
- | (254 | ) | |||||
|
Balance at end of year
|
$ | 707 | $ | 100 | ||||
The Company and its subsidiaries are routinely examined by various taxing authorities.
The Company's tax years 2008 through 2009 remain subject to examination by the IRS for U.S. federal tax purposes. During 2010, the IRS completed its examination of the 2007 tax year with no changes.
Also during 2010, the Israeli tax authorities completed its examination for the years 2003 through 2006 resulting in a settlement for those years. As a result of the settlement, the Company released certain tax reserves during the three months ended December 31, 2010.
There are tax years which remain subject to examination in various other jurisdictions that are not material to the Company's financial statement.
F - 27 -
MEDIAMIND TECHNOLOGIES INC.
(FORMERLY: EYEBLASTER, INC.) AND ITS SUBSIDIARIES
NOTES TO CONSOLIDATED FINANCIAL STATEMENTS
U.S. dollars in thousands (except share and per share data)
|
NOTE 8:-
|
STOCKHOLDERS' EQUITY
|
|
|
a.
|
The Company's changes in stockholders' equity during the years ended December 31, 2008, 2009 and 2010, are as follows (1):
|
|
Common stock
|
Series A-1 Convertible Preferred stock
|
|||||||
|
Balance as of January 1, 2008
|
8,324,842 | 2,068,966 | ||||||
|
Exercise of stock options
|
61,440 | - | ||||||
|
Balance as of December 31, 2008
|
8,386,282 | 2,068,966 | ||||||
|
Exercise of stock options
|
25,720 | - | ||||||
|
Balance as of December 31, 2009
|
8,412,002 | 2,068,966 | ||||||
|
Exercise of stock options
|
317,900 | - | ||||||
|
Conversion of series A-1
|
4,358,898 | (2,068,966 | ) | |||||
|
Exercise of warrants
|
28,000 | - | ||||||
|
Initial public offering
|
5,413,703 | - | ||||||
|
Balance as of December 31, 2010
|
18,530,503 | - | ||||||
|
|
The Company's capital consisted of the following as of December 31, 2009 and 2010:
|
|
Authorized
|
Issued
|
Outstanding
|
||||||||||||||||||||||
|
December 31,
|
December 31,
|
December 31,
|
||||||||||||||||||||||
|
2009
|
2010
|
2009
|
2010
|
2009
|
2010
|
|||||||||||||||||||
|
Number of shares
|
||||||||||||||||||||||||
|
Common stock (2)
|
19,200,000 | 88,000,000 | 11,573,706 | 21,692,207 | 8,412,002 | 18,530,503 | ||||||||||||||||||
|
Series A-1 Convertible Preferred stock (3)
|
2,100,000 | - | 2,068,966 | - | 2,068,966 | - | ||||||||||||||||||
|
Preferred stock (4)
|
- | 1,000,000 | - | - | - | - | ||||||||||||||||||
|
|
(1)
|
On July 23, 2010, the Company’s Board of Directors and Stockholders approved an amendment to its Certificate of Incorporation (“the Amendment”) to affect a 2:1 stock split. Following the Amendment and until the closing of the IPO on August 10, 2010, the Company’s authorized shares consisted of 19,200,000 shares of Common stock and 2,100,000 shares of Preferred stock. After the closing of the IPO, the Company filed an Amendment and Restated Certificate of Incorporation ("the Second Amendment"). Following the Second Amendment, the Company’s authorized shares consist of 88,000,000 shares of Common stock and 1,000,000 shares of Preferred stock.
|
F - 28 -
MEDIAMIND TECHNOLOGIES INC.
(FORMERLY: EYEBLASTER, INC.) AND ITS SUBSIDIARIES
NOTES TO CONSOLIDATED FINANCIAL STATEMENTS
U.S. dollars in thousands (except share and per share data)
|
|
(2)
|
Common stock - Shares of Common stock confer to their holders voting rights, the right to receive cash and stock dividends, and the right to share in excess assets upon liquidation of the Company.
|
|
|
(3)
|
Series A-1 Convertible Preferred Stock - On April 16, 2007, the Company issued 2,068,966 shares of series A-1 Convertible Preferred stock (see also paragraph below). Immediately prior to closing of the IPO each outstanding Convertible Preferred Stock was converted into 2.1068 Common stock based on the then effective conversion rate.
|
|
|
(4)
|
Preferred Stock - The board of Directors is empowered to authorize by resolution or resolutions from time the issuance of one or more classes or series of Preferred stock and to fix the designations, powers, preferences and relative, participation, optional or other rights, if any, and the qualifications, limitations or restrictions thereof, if any, with respect to each such class or series of Preferred Stock and the number of stocks constituting each such class or series, and to increase or decrease the number of stocks of any such class or series of the extent permitted by the Delaware Law.
|
|
|
b.
|
Warrants:
The following table summarizes information regarding outstanding warrants to purchase Common stock of the Company issued to service providers as of December 31, 2010:
|
|
Issuance
date
|
Number of warrants
|
Class of
shares
|
Exercise
price per warrant
|
Exercisable
through
|
||||||
|
January 2002
|
3,000 |
Common
|
$ | 0.001 |
January 2012
|
|||||
| 3,000 | ||||||||||
|
|
The warrants will be exercisable for shares of Common stock at a rate of 1:1.
Upon the closing of the Company’s IPO, 28,000 warrants were exercised that otherwise would have expired upon closing of the offering.
|
F - 29 -
MEDIAMIND TECHNOLOGIES INC.
(FORMERLY: EYEBLASTER, INC.) AND ITS SUBSIDIARIES
NOTES TO CONSOLIDATED FINANCIAL STATEMENTS
U.S. dollars in thousands (except share and per share data)
|
NOTE 8:
|
STOCKHOLDERS' EQUITY (Cont.)
|
|
|
c.
|
Stock options:
The Company has reserved for issuance as stock options a total of 7,270,172 shares of Common stock. As of December 31, 2010, an aggregate of 371,186 shares of Common stock of the Company were still available for future grant. Any options, which are forfeited or not exercised before expiration, become available for future grants.
Options granted under the plan expire 10 years from the date of grant or upon termination of the optionee's employment or other relationship with the Company. The options generally vest over a period of four years.
The following table sets forth the total stock-based compensation expense resulting from stock options included in the consolidated statements of income.
|
|
Year ended
December 31,
|
||||||||||||
|
2008
|
2009
|
2010
|
||||||||||
|
Cost of revenues
|
$ | 20 | $ | 25 | $ | 16 | ||||||
|
Research and development expenses
|
478 | 595 | 848 | |||||||||
|
Selling and marketing expenses
|
1,063 | 1,462 | 1,858 | |||||||||
|
General and administrative expenses
|
1,195 | 1,210 | 1,767 | |||||||||
|
Total stock-based compensation expense
|
$ | 2,756 | $ | 3,292 | $ | 4,489 | ||||||
F - 30 -
MEDIAMIND TECHNOLOGIES INC.
(FORMERLY: EYEBLASTER, INC.) AND ITS SUBSIDIARIES
NOTES TO CONSOLIDATED FINANCIAL STATEMENTS
U.S. dollars in thousands (except share and per share data)
|
NOTE 8:-
|
STOCKHOLDERS' EQUITY (Cont.)
|
A summary of employee option activity under the Company's equity incentive plans as of January 1, 2010 and changes during the year ended December 31, 2010 is as follows:
|
Number of options
|
Weighted average exercise price
|
Weighted average remaining contractual term (years)
|
Aggregate intrinsic value
|
|||||||||||||
|
Outstanding at January 1, 2010
|
6,092,822 | $ | 4.53 | |||||||||||||
|
Granted
|
742,060 | 14.90 | ||||||||||||||
|
Exercised
|
(317,900 | ) | 3.20 | |||||||||||||
|
Forfeited and cancelled
|
(387,476 | ) | 6.33 | |||||||||||||
|
Outstanding at December 31, 2010
|
6,129,506 | 5.74 | 6.52 | 48,811 | ||||||||||||
|
Vested and expected to vest at December 31, 2010
|
5,574,527 | 5.16 | 6.25 | 47,606 | ||||||||||||
|
Exercisable at December 31, 2010
|
4,431,336 | 4.09 | 5.63 | 42,600 | ||||||||||||
F - 31 -
MEDIAMIND TECHNOLOGIES INC.
(FORMERLY: EYEBLASTER, INC.) AND ITS SUBSIDIARIES
NOTES TO CONSOLIDATED FINANCIAL STATEMENTS
U.S. dollars in thousands (except share and per share data)
|
NOTE 8:-
|
STOCKHOLDERS' EQUITY (Cont.)
The aggregate intrinsic value in the table above represents the total intrinsic value that would have been received by the option holders had all option holders exercised their options on December 31, 2010 and 2009, respectively. This amount changes, based on the fair value of the Company's Common stock. As of December 31, 2010, there were approximately $ 6,228 of total unrecognized compensation costs related to non-vested share-based compensation arrangements granted under the Company's equity incentive plan. That cost is expected to be recognized over a weighted-average period of 2.97 years. The total grant-date fair value of vested options for the year ended December 31, 2010, was approximately $ 18,109. The total intrinsic value of options exercised during the years ended December 31, 2008, 2009 and 2010 was $ 313, $ 158 and $ 3,635, respectively.
The options outstanding under the Company's equity incentive plan as of December 31, 2010 have been separated into exercise prices as follows:
|
|
Options outstanding
|
Weighted average
|
Options exercisable
|
||||||||||||
|
as of
|
remaining
|
as of
|
||||||||||||
|
Exercise
|
December 31,
|
contractual
|
December 31,
|
|||||||||||
|
price
|
2010
|
life (years)
|
2010
|
|||||||||||
| $ | ||||||||||||||
| 0.001 | 314,758 | 0.81 | 314,758 | |||||||||||
| 0.005 | 349,872 | 1.06 | 349,872 | |||||||||||
| 1.35 | 285,318 | 3.62 | 285,318 | |||||||||||
| 1.94 | 11,000 | 4.09 | 11,000 | |||||||||||
| 2.00 | 28,034 | 4.33 | 28,034 | |||||||||||
| 2.10 | 40,000 | 4.82 | 40,000 | |||||||||||
| 2.13 | 353,720 | 5.00 | 353,720 | |||||||||||
| 2.55 | 424,320 | 5.46 | 424,320 | |||||||||||
| 5.11 | 823,736 | 8.16 | 424,300 | |||||||||||
| 5.65 | 1,726,150 | 6.56 | 1,614,796 | |||||||||||
| 6.32 | 246,454 | 7.19 | 161,596 | |||||||||||
| 7.05 | 333,424 | 6.90 | 254,396 | |||||||||||
| 8.75 | 460,660 | 8.84 | 143,172 | |||||||||||
| 13.10 | 109,500 | 9.18 | 13,212 | |||||||||||
| 16.88 | 315,000 | 9.53 | 7,740 | |||||||||||
| 13.45 | 307,560 | 9.91 | 5,102 | |||||||||||
| 6,129,506 | 4,431,336 | |||||||||||||
F - 32 -
MEDIAMIND TECHNOLOGIES INC.
(FORMERLY: EYEBLASTER, INC.) AND ITS SUBSIDIARIES
NOTES TO CONSOLIDATED FINANCIAL STATEMENTS
U.S. dollars in thousands (except share and per share data)
NOTE 9:- NET EARNINGS PER SHARE
The following table sets forth the computation of the basic and diluted earnings per share:
|
|
a.
|
Numerator:
|
|
Year ended
December 31,
|
||||||||||||
|
2008
|
2009
|
2010
|
||||||||||
|
Net income as reported
|
$ | 6,162 | $ | 9,828 | $ | 9,952 | ||||||
|
Deduct:
|
||||||||||||
|
Accretion of series A-1 Preferred stock dividend preference
|
(821 | ) | (1,617 | ) | (1,292 | ) | ||||||
|
Numerator for basic net income per share of Common stock
|
5,341 | 8,211 | 8,660 | |||||||||
|
Add:
|
||||||||||||
|
Series A-1 Preferred stock dividend preference
|
821 | 1,617 | 1,292 | |||||||||
|
Numerator for diluted net income per share of Common stock
|
$ | 6,162 | $ | 9,828 | $ | 9,952 | ||||||
|
|
b.
|
Denominator:
|
|
Year ended
December 31,
|
||||||||||||
|
2008
|
2009
|
2010
|
||||||||||
|
Weighted average number of shares of Common stock
|
8,380 | 8,397 | 12,394 | |||||||||
|
Denominator for basic income per share of Common stock
|
8,380 | 8,397 | 12,394 | |||||||||
|
Add:
|
||||||||||||
|
Employee stock options and warrants
|
1,667 | 1,596 | 3,232 | |||||||||
|
Series A-1 Preferred stock conversion
|
4,311 | 4,359 | 2,647 | |||||||||
|
Denominator for diluted income per share of Common stock
|
14,358 | 14,352 | 18,273 | |||||||||
The total numbers of options to purchase Common stock excluded from the calculation of Diluted EPS, as they would have an anti-dilutive effect were 1,292, 3,524 and 732 for the years ended December 31, 2008, 2009 and 2010, respectively.
F - 33 -
MEDIAMIND TECHNOLOGIES INC.
(FORMERLY: EYEBLASTER, INC.) AND ITS SUBSIDIARIES
NOTES TO CONSOLIDATED FINANCIAL STATEMENTS
U.S. dollars in thousands
|
NOTE 10:-
|
GEOGRAPHIC INFORMATION
The Company applies ASC 280, "Segment Reporting" (formerly: SFAS No. 131 "Disclosures About Segments of an Enterprise and Related Information."). The Company operates in one reportable segment (see Note 1 for a brief description of the Company's business).
Revenues by geography are based on the address of the agency. The following table sets forth revenues by geographic area:
|
|
Year ended
December 31,
|
||||||||||||
|
2008
|
2009
|
2010
|
||||||||||
|
Revenues:
|
||||||||||||
|
United States
|
$ | 15,760 | $ | 16,776 | $ | 22,495 | ||||||
|
Europe, Middle East and Africa (EMEA) (excluding the United Kingdom)
|
22,523 | 23,370 | 28,980 | |||||||||
|
United Kingdom
|
12,558 | 11,559 | 11,504 | |||||||||
|
Asia Pacific (APAC)
|
9,755 | 9,676 | 12,392 | |||||||||
|
Latin America
|
1,688 | 2,184 | 3,895 | |||||||||
|
Canada
|
1,491 | 1,510 | 1,580 | |||||||||
| $ | 63,775 | $ | 65,075 | $ | 80,846 | |||||||
The following table sets forth long-lived assets by geographic area:
|
December 31,
|
||||||||
|
2009
|
2010
|
|||||||
|
Long-lived assets:
|
||||||||
|
United States
|
$ | 861 | 2,165 | |||||
|
Europe
|
437 | 503 | ||||||
|
Israel
|
1,005 | 2,179 | ||||||
|
Other
|
124 | 167 | ||||||
| $ | 2,427 | 5,014 | ||||||
The Company has one major customer that accounted for more than 10% of revenues during all years presented. While this customer is a major media agency from which the Company generates revenues, it is also a web publisher that acts in certain cases as the paying customer for other media agencies that purchase the Company's services.
During the years ended December 31, 2008, 2009 and 2010, this major customer as a media agency accounted for approximately 14%, 13%, and 7% of the Company's annual revenues, respectively. In addition, as the paying customer of other media agencies it accounted for approximately 14%, 9% and 7%, aggregating to a total of 28%, 22% and 14% for the years ended December 31, 2008, 2009 and 2010, respectively.
F - 34 -
MEDIAMIND TECHNOLOGIES INC.
(FORMERLY: EYEBLASTER, INC.) AND ITS SUBSIDIARIES
NOTES TO CONSOLIDATED FINANCIAL STATEMENTS
U.S. dollars in thousands
|
NOTE 11:-
|
TRANSACTIONS AND BALANCES WITH RELATED PARTY
On April 16, 2007, the Company signed a management agreement with the series A-1 Convertible Preferred stockholders ("the A-1 stockholders") pursuant to which such A-1 stockholders agreed to provide the Company with various management and consulting services. Under the terms of the management agreement, the Company paid the A-1 stockholder an annual management fee of $ 1,000 during the term of the management agreement. The A-1 stockholder is not entitled to any additional or other forms of consideration for its services. The management agreement terminated on April 16, 2009, two years after the date of agreement.
The following transactions with the A-1 stockholders are included in the statements of income:
|
|
Year ended
December 31,
|
||||||||||||
|
2008
|
2009
|
2010
|
||||||||||
|
General and administrative expenses
|
$ | 1,000 | $ | 318 | $ | - | ||||||
NOTE 12:- FINANCIAL INCOME, NET
|
Year ended
December 31,
|
||||||||||||
|
2008
|
2009
|
2010
|
||||||||||
|
Financial income:
|
||||||||||||
|
Interest on bank deposits and marketable securities
|
$ | 657 | $ | 604 | $ | 665 | ||||||
|
Foreign currency translation differences
|
2,859 | 5,696 | 7,935 | |||||||||
| 3,516 | 6,300 | 8,600 | ||||||||||
|
Financial expenses:
|
||||||||||||
|
Interest and other bank charges
|
(55 | ) | (75 | ) | (96 | ) | ||||||
|
Foreign currency translation differences
|
(2,708 | ) | (6,145 | ) | (7,927 | ) | ||||||
| (2,763 | ) | (6,220 | ) | (8,023 | ) | |||||||
| $ | 753 | $ | 80 | $ | 577 | |||||||
F - 35 -
MEDIAMIND TECHNOLOGIES INC.
(FORMERLY: EYEBLASTER, INC.) AND ITS SUBSIDIARIES
NOTES TO CONSOLIDATED FINANCIAL STATEMENTS
U.S. dollars in thousands
NOTE 13:- SUBSEQUENT EVENT
On January 6, 2011, an amendment to the Law for the Encouragement of Capital Investments, 1959 ("the Law") was enacted. According to the amendment, the benefit tracks in the Law were modified and a flat tax rate may apply to the Company's entire preferred income. The Company will be able to apply (the waiver is non-recourse) the amendment and from then on it will be subject to the amended tax rates that are: 2011 and 2012 - 15%, 2013 and 2014 - 12.5% and in 2015 and thereafter - 12%.
The Company is examining the possible effect of the amendment on the financial statements, if at all, and at this time has not yet decided whether to opt to apply the amendment.
F - 36 -
ITEM 9. CHANGES IN AND DISAGREEMENTS WITH ACCOUNTANTS ON ACCOUNTING AND FINANCIAL DISCLOSURE.
None
ITEM 9A. CONTROLS AND PROCEDURES.
Evaluation of Disclosure Controls and Procedures.
As of the end of the period covered by this report, we carried out an evaluation, under the supervision and with the participation of our principal executive officer and principal financial officer, of the effectiveness of the design and operation of our disclosure controls and procedures (as such term is defined in Rules 13a-15(e) and 15d-15(e) under the Securities Exchange Act of 1934 (the “Exchange Act”)). Based on this evaluation, our principal executive officer and principal financial officer concluded that our disclosure controls and procedures are effective, to ensure that information required to be disclosed in our reports under the Exchange Act is recorded, processed, summarized and reported, within the time periods specified in the Commission’s rules and forms.
48
Management’s Annual Report on Internal Control over Financial Reporting and Attestation Report of the Registered Public Accounting Firm.
This annual report does not include a report of management’s assessment regarding internal control over financial reporting or an attestation report of our registered public accounting firm due to a transition period established by the rules of the Securities and Exchange Commission for newly public companies.
Changes in Internal Control over Financial Reporting.
During our most recent fiscal quarter, there has not occurred any change in our internal control over financial reporting (as such term is defined in Rules 13a-15(f) and 15d-15(f) under the Exchange Act) that has materially affected, or is reasonably likely to materially affect, our internal control over financial reporting.
None.
PART III
ITEM 10. DIRECTORS, EXECUTIVE OFFICERS AND CORPORATE GOVERNANCE.
Information relating to our executive officers and directors, including our audit committee and audit committee financial experts and the procedures by which stockholders can recommend director nominees, and our executive officers will be in our definitive Proxy Statement for our 2011 Annual Meeting of Stockholders which will be filed within 120 days of the end of our fiscal year ended December 31, 2010, (“2011 Proxy Statement”) and is incorporated herein by reference.
ITEM 11. EXECUTIVE COMPENSATION.
Information required by this item will be in the 2011 Proxy Statement and is incorporated herein by reference.
ITEM 12. SECURITY OWNERSHIP OF CERTAIN BENEFICIAL OWNERS AND MANAGEMENT AND RELATED STOCKHOLDER MATTERS.
Information required by this item will be in the 2011 Proxy Statement and is incorporated herein by reference.
ITEM 13. CERTAIN RELATIONSHIPS AND RELATED TRANSACTIONS, AND DIRECTOR INDEPENDENCE.
Information required by this item will be in the 2011 Proxy Statement and is incorporated herein by reference.
ITEM 14. PRINCIPAL ACCOUNTING FEES AND SERVICES.
Information required by this item will be in the 2011 Proxy Statement and is incorporated herein by reference.
PART IV
ITEM 15. EXHIBITS, FINANCIAL STATEMENT SCHEDULES.
(a) Documents filed as part of this report are as follows:
1. Consolidated Financial Statements:
Our following Consolidated Financial Statements are set forth under Part II—Item 8 of this Annual Report:
49
Report of Independent Registered Public Accounting Firm
Consolidated Balance Sheets as of December 31, 2009 and December 31, 2010
Consolidated Statements of Income for the years ended December 31, 2008, 2009 and 2010
Statements of Changes in Stockholders' Equity
Consolidated Statements of Cash Flows for the years ended December 31, 2008, 2009 and 2010
Notes to Consolidated Financial Statements
2. Exhibits:
The required exhibits are included at the end of this Annual Report on Form 10-K and are described in the Exhibit Index immediately preceding the first exhibit.
50
SIGNATURES
Pursuant to the requirements Section 13 or 15(d) of the Securities Act of 1933, the Registrant has duly caused this report to be signed on its behalf by the undersigned, thereunto duly authorized.
|
MEDIAMIND TECHNOLOGIES INC.
|
|||
|
|
By:
|
/s/ SARIT FIRON | |
|
Sarit Firon
|
|||
|
Chief Financial Officer
|
|||
Date: March 8, 2011
Pursuant to the requirements of the Securities Act of 1933, this Registration Statement has been signed by the following persons in the capacities and on the dates indicated:
|
Signature
|
Title
|
Date
|
|
|
/s/ Gal Trifon
|
Chief Executive Officer, President and Director (principal executive officer)
|
March 8, 2011
|
|
|
Gal Trifon
|
|||
|
/s/ Sarit Firon
|
Chief Financial Officer (principal financial officer and principal accounting officer)
|
March 8, 2011
|
|
|
Sarit Firon
|
|||
|
/s/ Eli Barkat
|
Director
|
March 8, 2011
|
|
|
Eli Barkat
|
|||
|
/s/ Guy Gamzu
|
Director
|
March 8, 2011
|
|
|
Guy Gamzu
|
|||
|
/s/ Michael J. Kelly
|
Director
|
March 8, 2011
|
|
|
Michael J. Kelly
|
|||
|
/s/ Timothy I. Maudlin
|
Director
|
March 8, 2011
|
|
|
Timothy I. Maudlin
|
|||
|
/s/ Deven Parekh
|
Director
|
March 8, 2011
|
|
|
Deven Parekh
|
|||
|
/s/ James Warner
|
Director
|
March 8, 2011
|
|
|
James Warner
|
51
EXHIBIT INDEX
|
Exhibit
Number
|
Description
|
|
|
3.1
|
Form of Amended and Restated Certificate of Incorporation (incorporated by reference to Amendment No. 3 to the Company’s Registration Statement on Form S-1 (File No. 333-165379) (Exhibit 3.1))#
|
|
|
3.2
|
Form of Amended and Restated By-Laws (incorporated by reference to Amendment No. 3 to the Company’s Registration Statement on Form S-1 (File No. 333-165379) (Exhibit 3.2))#
|
|
|
4.1
|
Form of Common Stock Certificate (incorporated by reference to Amendment No. 3 to the Company’s Registration Statement on Form S-1 (File No. 333-165379) (Exhibit 4.1))#
|
|
|
10.1
|
Amended and Restated Registration Rights Agreement dated April 26, 2007, between MediaMind Technologies Inc. (formerly known as Eyeblaster, Inc.) and the Investors named therein (incorporated by reference to the Company’s Registration Statement on Form S-1 (File No. 333-149619) (Exhibit 10.1))#
|
|
|
10.2
|
Joinder Agreement dated November 8, 2010 between MediaMind Technologies Inc. (formerly known as Eyeblaster, Inc.) and the Investors named therein (incorporated by reference to the Company’s Quarterly Report on Form 10-Q (File No. 001-34844) (Exhibit 10.1))#
|
|
|
10.6
|
Akamai Terms and Conditions, Addendum, Akamai Service Order Form, Advanced Features Schedule and EdgeSuite Delivery Order Form dated September 1, 2009, between Akamai Technologies Inc. and MediaMind Technologies Inc. (formerly known as Eyeblaster, Inc.) (incorporated by reference to the Company’s Registration Statement on Form S-1 (File No. 333-165379) (Exhibit 10.6))†#
|
|
|
10.7
|
Akamai Service Order Form dated December1, 2010, between Akamai Technologies Inc. and MediaMind Technologies Inc. (formerly known as Eyeblaster, Inc.)†
|
|
|
10.8
|
Stock Option and Incentive Plan (incorporated by reference to the Company’s Registration Statement on Form S-1 (File No. 333-149619) (Exhibit 10.9))#*
|
|
|
10.9.1
|
Form of U.S. Option Agreement (incorporated by reference to Amendment No. 2 to the Company’s Registration Statement on Form S-1 (File No. 333-149619) (Exhibit 10.10.1))#*
|
|
|
10.9.2
|
Form of Israeli Option Agreement (incorporated by reference to Amendment No. 2 to the Company’s Registration Statement on Form S-1 (File No. 333-149619) (Exhibit 10.10.2))#*
|
|
|
10.9.3
|
Form of International Option Agreement (incorporated by reference to Amendment No. 2 to the Company’s Registration Statement on Form S-1 (File No. 333-149619) (Exhibit 10.10.3))#*
|
|
|
10.10
|
Form of Amendment No. 1 to Stock Option and Incentive Plan (incorporated by reference to Amendment No. 3 to the Company’s Registration Statement on Form S-1 (File No. 333-165379) (Exhibit 10.9))#*
|
|
|
10.11
|
Form of Director Indemnification Agreement between MediaMind Technologies Inc. (formerly known as Eyeblaster, Inc.) and each of its directors (incorporated by reference to the Company’s Registration Statement on Form S-1 (File No. 333-149619) (Exhibit 10.11))#*
|
|
|
10.12
|
Employment Agreement between MediaMind Technologies Ltd. (formerly known as Eyeblaster Ltd.) and Gal Trifon (incorporated by reference to Amendment No. 1 to the Company’s Registration Statement on Form S-1 (File No. 333-165379) (Exhibit 10.10))#*
|
|
|
10.13
|
Letter Agreement between MediaMind Technologies Inc. (formerly known as Eyeblaster, Inc.) and Michael J. Kelly (incorporated by reference to Amendment No. 1 to the Company’s Registration Statement on Form S-1 (File No. 333-165379) (Exhibit 10.11))#*
|
|
|
10.14
|
Employment Agreement between MediaMind Technologies Inc. (formerly known as Eyeblaster, Inc.) and Sarit Firon (incorporated by reference to Amendment No. 1 to the Company’s Registration Statement on Form S-1 (File No. 333-165379) (Exhibit 10.12))#*
|
|
|
10.15
|
Restated Employment Agreement between MediaMind Technologies Ltd. (formerly known as Eyeblaster Ltd.) and Joe Girling (incorporated by reference to Amendment No. 1 to the Company’s Registration Statement on Form S-1 (File No. 333-165379) (Exhibit 10.13))#*
|
|
Exhibit
Number
|
Description
|
|
|
10.16
|
Employment Agreement and Amendment to Employment Agreement between MediaMind Technologies Ltd. (formerly known as Eyeblaster, Ltd.) and Amit Rahav (incorporated by reference to Amendment No. 1 to the Company’s Registration Statement on Form S-1 (File No. 333-165379) (Exhibit 10.14))#*
|
|
|
10.17
|
Employment Agreement between MediaMind Technologies Ltd. (formerly known as Eyeblaster Ltd.) and Ofer Zadikario (incorporated by reference to Amendment No. 1 to the Company’s Registration Statement on Form S-1 (File No. 333-165379) (Exhibit 10.15))#*
|
|
|
10.18
|
Employment Agreement Update for Gal Trifon (incorporated by reference to Amendment No. 1 to the Company’s Registration Statement on Form S-1 (File No. 333-165379) (Exhibit 10.16))#*
|
|
|
10.19
|
Employment Agreement Update for Sarit Firon (incorporated by reference to Amendment No. 1 to the Company’s Registration Statement on Form S-1 (File No. 333-165379) (Exhibit 10.17))#*
|
|
|
10.20
|
Employment Agreement Update for Joe Girling (incorporated by reference to Amendment No. 1 to the Company’s Registration Statement on Form S-1 (File No. 333-165379) (Exhibit 10.18))#*
|
|
|
10.21
|
Employment Agreement Update for Amit Rahav (incorporated by reference to Amendment No. 1 to the Company’s Registration Statement on Form S-1 (File No. 333-165379) (Exhibit 10.19))#*
|
|
|
10.22
|
Employment Agreement Update for Ofer Zadikario (incorporated by reference to Amendment No. 1 to the Company’s Registration Statement on Form S-1 (File No. 333-165379) (Exhibit 10.20))#*
|
|
|
10.23
|
Form of Non-Competition and Non-Disclosure and Developments Agreement between MediaMind Technologies Inc. (formerly known as Eyeblaster, Inc.) and certain of its executive officers (incorporated by reference to Amendment No. 1 to the Company’s Registration Statement on Form S-1 (File No. 333-149619) (Exhibit 10.19))#*
|
|
|
10.24
|
Letter Agreement (Warrant), dated October 3, 2001, between Gal Trifon, MediaMind Technologies Ltd. (formerly known as Eyeblaster Ltd.) and MediaMind Technologies Inc. (formerly known as Eyeblaster, Inc.) (incorporated by reference to the Company’s Registration Statement on Form S-1 (File No. 333-149619) (Exhibit 10.20))#*
|
|
|
10.25
|
Letter Agreement (Warrant), dated October 4, 2001, between Ofer Zadikario, MediaMind Technologies Ltd. (formerly known as Eyeblaster Ltd.) and MediaMind Technologies Inc. (formerly known as Eyeblaster, Inc.) (incorporated by reference to the Company’s Registration Statement on Form S-1 (File No. 333-149619) (Exhibit 10.21))#*
|
|
|
21.1
|
Subsidiaries of the Registrant
|
|
|
23.1
|
Consent of Kost Forer Gabbay & Kasierer, a member of Ernst & Young Global
|
|
|
31.1
|
Certification by the Chief Executive Officer Pursuant to Section 302 of the Sarbanes-Oxley Act of 2002.
|
|
|
31.2
|
Certification by the Chief Financial Officer Pursuant to Section 302 of the Sarbanes-Oxley Act of 2002.
|
|
|
32.1
|
Certification by the Chief Executive Officer Pursuant to 18 U.S.C. Section 1350, as Adopted Pursuant to Section 906 of the Sarbanes-Oxley Act of 2002.
|
|
|
32.2
|
Certification by the Chief Financial Officer Pursuant to 18 U.S.C. Section 1350, as Adopted Pursuant to Section 906 of the Sarbanes-Oxley Act of 2002.
|
________________
|
†
|
Portions of these Exhibits have been omitted pursuant to a confidential treatment extension request. These portions have been filed separately with the Securities and Exchange Commission.
|
|
††
|
Portions of these Exhibits have been omitted pursuant to a request for confidential treatment. These portions have been filed separately with the Securities and Exchange Commission.
|
|
#
|
Previously filed.
|
|
*
|
Management contract compensatory plan or arrangement.
|