Attached files
| file | filename |
|---|---|
| 8-K - FORM 8-K - KEMPER Corp | d8k.htm |
 1
Exhibit 99.1 |
 Donald G. Southwell
Chairman, President & Chief Executive Officer
Dennis R. Vigneau
Senior Vice President & Chief Financial Officer
RAYMOND JAMES
32nd Annual Institutional Investor Conference
March 9, 2011
Orlando, Florida |
| 2
Safe Harbor Statement:
This presentation may contain or incorporate by reference information that includes
or is based on forward-looking statements within the meaning of Section
27A of the Securities Act of 1933 and Section 21E of the Securities Exchange
Act of 1934. Forward-looking statements give expectations or forecasts
of future events. These statements can be indentified by the fact that they do not relate strictly to historical or
current
facts.
They
use
words
such
as
“believe(s),”
“goal(s),”
“target(s),”
“estimate(s),”
“anticipate(s),”
“forecast(s),”
“project(s),”
“plan(s),”
“intend(s),”
“expect(s),”
“might,”
“may”
and
other
words
and
terms
of
similar
meaning
in
connection
with
a
discussion
of
future
operating
financial performance or financial condition. Forward-looking statements, in
particular, include statements relating to future actions, prospective
services or products, future performance or results of current and anticipated services or products, sales efforts, expenses, the
outcome of contingencies such as legal proceedings, trends in operations and
financial results. These statements are based on current expectations and the
current economic environment. They involve a number of risks and
uncertainties that are difficult to predict. These statements are not guarantees of
future performance; actual results could differ materially from those
expressed or implied in the forward-looking statements. Forward-looking statements can be affected by inaccurate assumptions
or by known or unknown risks and uncertainties. No assurances can be given
that the results contemplated in any forward-looking statements will be
achieved or will be achieved in any particular timetable. The Company assumes no obligation to publicly correct or
update any forward-looking statements as a result of events or developments
subsequent to the date of this presentation. The reader is advised, however,
to consult any further disclosures Unitrin makes on related subjects in its filings with the SEC.
Kemper®:
Kemper®
is a registered service mark of Unitrin, Inc.
iMingle™, iMingle Network
and Insuring The i Generation™, and logos containing such terms, are service
marks or trademarks of Unitrin Direct Insurance Company.
Presentation Note:
Unless otherwise noted, numbers are as of December 31, 2010 and dollars are in
millions. Non-GAAP Measures:
Non-GAAP Measures are discussed and reconciled at the end of this
presentation. |
 3
Unitrin Highlights
A diversified P&C and Life business with a national footprint
-
20
largest
personal
lines
writer
and
17
largest
auto
insurer
in
the
United
States
(1)
-
Strong regional presence providing basic protection product
Multi-channel distribution network
History of opportunistic acquisitions and successful integration
Conservative balance sheet with strong holding company liquidity
-
$8.4
billion
assets,
$2.1
billion
shareholders’
equity,
22.4%
basic
debt
to
capital
ratio
-
94% of fixed maturity investment portfolio rated investment grade
Experienced management team with long-term association with the Company
th
th |
 4
-
Flagship operating companies have been conducting business for more than 80
years Independently managed businesses, leveraging key common platforms
Over 6 million policyholders served by 7,000 associates
Company Overview
Kemper
Unitrin
Specialty
(Non-Standard)
Unitrin Direct
Property & Casualty Insurance
$900 statutory surplus
Career Agency
Fireside Bank
(In Run-off)
$249
Life & Health Insurance
$405 statutory surplus
Reserve
National
Earned Premiums
Policies in Force
$888
$475
$282
$514
$130
721K
342K
175K
5,000K
80K
Multi-line insurance holding company incorporated in 1990 and based in Chicago, IL (Ticker:
UTR) |
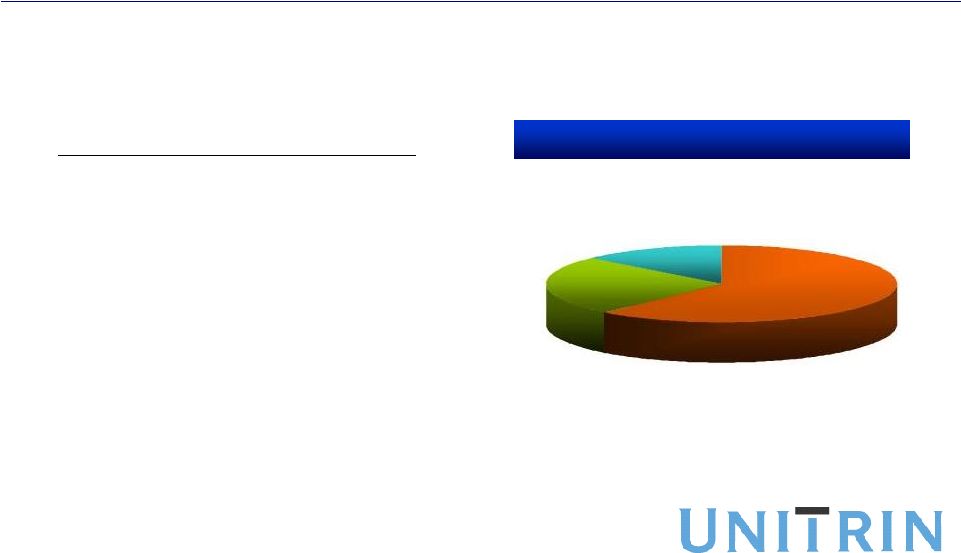
 Life 17%
Other 6%
Homeowners
13%
A&H 7%
Commercial
Auto 2%
$44
Earned Premiums
by Line of Business
Earned Premiums $2,289
Standard & Preferred
Personal Auto 36%
Non-Standard
Personal Auto 19%
Total
Personal
Auto
$1,250
55%
5
Total Revenues $2,743
$137
$162
$299
$397
$431
$891 |
 History of Successful Transactions
Multiple acquisitions since spin-off
Launched Unitrin Direct as a start-up
6
Disciplined capital management to
create shareholder value
-
Tax-free spin-off of Curtiss Wright
-
Structured tax efficient sale of Litton to
Northrop Grumman
-
Exited several non-core businesses
(e.g. Fireside, Pyramid Life and Unitrin
Business Insurance |
 Business Lines |
 8
Property & Casualty Insurance Segment
54%
17%
29% |
 Personal Lines Insurance
Headquartered in Jacksonville, Florida
Personal auto (61% sales) & homeowners/other (39% sales)
2,600 independent agents in 38 states
Lead product is Package Plus
Net Written Premium:
$872
Top 4 premium states: NY, CA, NC & TX
9 |
 Competitive Advantages
Strong brand name recognized by agents and target market
Package policies specifically designed for target market
Proprietary pricing engine
-
Multi-variant capabilities
-
Leveraged across Unitrin
Automation and service built for agency convenience
Claims handling focused on high quality customer service,
supported by a shared services group
10 |
 Headquartered in Dallas, Texas
Non Standard Auto (NSA) -
personal and
commercial
8,000 independent agents in 21 states
Target market is top tier of insureds not eligible
for Preferred and/or Standard offerings
Non Standard Auto Insurance
11
Business model focused on automation and agent convenience
Net Written Premium: $457
Top 2 premium states: CA & TX |
 Competitive Advantages
Recognized carrier in the NSA market for over 60 years
Strong regional presence expandable to more states
Point of sale systems designed for ease of placement
12
Proprietary pricing engine leveraged across Unitrin
Claims handling designed for the unique challenges of NSA,
supported by a shared claims organization |
 Headquartered in Chicago, Illinois
Built through several key acquisitions
Recent enhancements:
-
Re-designed Customer Website
-
New proprietary product (now active in 12 states)
-
Focused on margin improvement in 2011
Direct to Consumer
13
Launched
iMingle
, a social networking insurance platform
TM |
 Experienced foothold in the direct marketplace
Complete on-line life cycle capabilities for ease of doing business
Product suite includes Homeowners coverage
Multi-channel approach targeting standard & preferred customers
-
Customizable product offerings
-
Integrated customer experience
-
Flexible payment options
Leveraging claims and other back office infrastructure
Building Competitive
Advantages
14 |
 Life
and Health Insurance Segment 80%
20%
Career Agency Companies |
 16
Life and Health Insurance Business
-
3,800 associates and career agents
-
Targets modest income consumers
-
Basic protection for individuals and families
-
Leading product is ordinary life insurance,
including permanent and term insurance
-
No exposure to variable annuities
-
Operates in 25 states
Career Agency Companies
-
275 exclusive independent agents and 150
home office employees, targeting under-
served rural markets
-
Key products include limited benefit hospital
expense and surgical benefit plan, Medicare
Supplement and other supplemental A&H
insurance |
 17
Life and Health Insurance Business
Career
Agency
Competitive
Advantages
-
Leader in moderate income segment
-
Significant scale
-
Business not sensitive to interest rate or
stock market volatility
-
Products are simple with stable, predictable
cash flows
-
Over 5 million policyholders
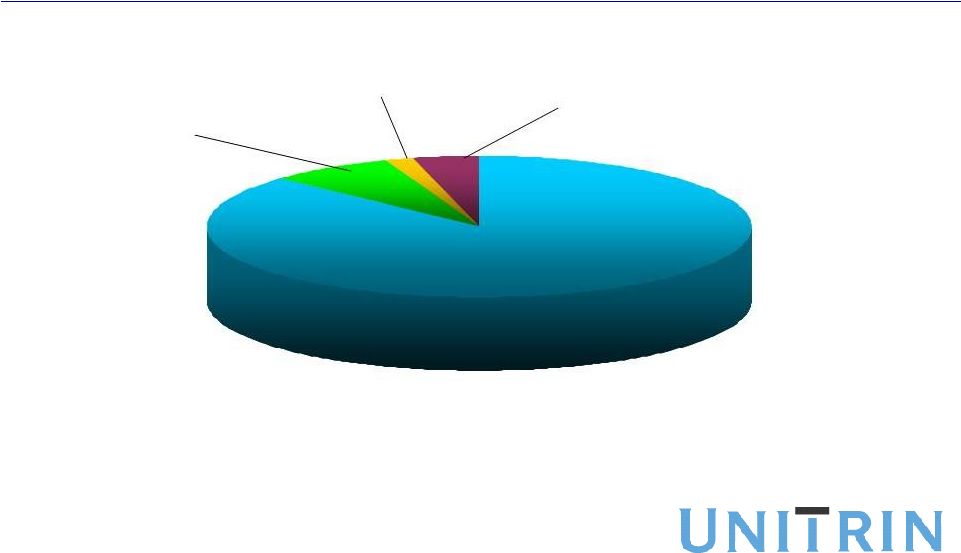
Life
Property
Total Earned Premiums = $644
Accident &
Health
Earned Premiums by Product
Predominately a career agency-driven business with modest amounts of
A&H business through Reserve National
25%
13%
62% |
 Reserves By Product Line
Life and Health
Whole Life
$2,666
Term Life
$225
A&H
$54 2%
Total $ 3,064
Interest Sensitive Life
$119
18
87%
4%
7% |
 Financial Overview |
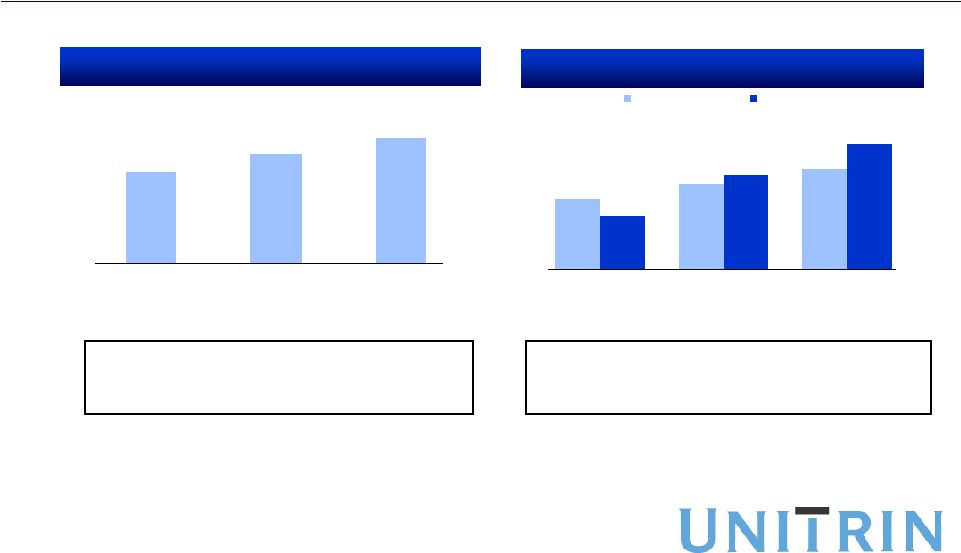
 20
Financial Trends
Earned Premiums
Stable earned premiums over the
past several years
Income from continuing operations
has rebounded from low in 2008
-
Portfolio losses
-
Catastrophe losses
Post 2008 catastrophe exposure
significantly reduced in both P&C
and Career Agency businesses
$2,291
$2,287
$2,377
$2,456
$2,289
Catastrophes
& GW Write-off
2006
2007
2008
2009
2010
$259
$192
$137
$222
$230
Net Income
26
(39)
(22)
(5)
15
$248
$127
$21
$189
$179
Note:
P&C
and
Life
Net
Income
excluding
Catastrophe
Losses
and
a
Goodwill
Write-off
is
a
Non-GAAP
measure.
See
the
discussion
and
a
detailed
reconciliation
at
the
end
of
this
presentation.
2006
2007
2008
2009
2010
$(37)
$(26)
$(94)
$(28)
$(66)
Fireside
Reported
Segment
Net Income
P&C / Life
(ex. Cats &
2010 GW
Write-off) |
 21
P&C Insurance Financial Results
Earned Premiums
Underlying Combined Ratios*
$945
$926
$931
$932
$888
2006
2007
2008
2009
2010
Kemper
$444
$449
$494
$528
$475
2006
2007
2008
2009
2010
Unitrin Specialty
$226
$258
$291
$346
$282
2006
2007
2008
2009
2010
Unitrin Direct
2006
2007
2008
2009
2010
Kemper
93.7%
96.7%
96.7%
93.6%
96.9%
2006
2007
2008
2009
2010
Unitrin Specialty
97.9%
98.9%
100.3%
98.7%
99.8%
2006
2007
2008
2009
2010
Unitrin Direct
106.1%
111.9%
119.8%
111.9%
117.3%
Cats / Loss Development (Favorable)/Unfavorable:
(2.4%)
(1.6%)
4.6%
(1.4%)
5.2%
(1.7%)
(3.3%)
(0.5%)
(0.7%)
1.4%
2.5%
2.3%
0.0%
(2.6%)
(1.8%)
GAAP Reported Combined Ratios:
91.3%
95.3%
101.3%
95.3%
98.8%
96.2%
96.5%
99.8%
98.2%
100.1%
108.6%
119.6%
119.8%
109.3%
110.1%
*Underlying
Combined Ratio is a Non-GAAP measure discussed at the end of
this presentation. |
 22
Life and Health Insurance Financial Results
2006
2007
2008
2009
2010
$651
$654
$676
$661
$644
2006
2007
2008
2009
2010
Earned Premiums
Segment Net Income
Catastrophes
& GW Write-off
$102
$97
$52
$112
$95
$109
$104
$80
$116
$115
$(7)
$(7)
$(27)
$(4)
$(20) |
 23
Auto only subprime lender
-
30+ year history with strong lifetime ROE
Run-off plan commenced March 2009
-
All deposits mature by Q3 2012
-
No new deposits since March 2009
-
No deposit rollovers since October 2009
Strong
balance
sheet
–
Tier
One
Capital
37%
(2)
$250 million expected to be returned to Unitrin
Run-off Asset: Fireside Bank
Loans 30 or More Days Delinquent
$19
$103
91%
44%
3/31/2009
12/31/2010
Loans 30 or more days
delinquent
Loans 30 or more days delinquent
as a % of reserves for loan losses
Net Automobile Loan Receivables Outstanding
$1,125
$381
3/31/2009
12/31/2010
Tier One Capital
(2)
16%
37%
3/31/2009
12/31/2010 |
 Investment Portfolio |
 25
Investment Portfolio Overview
Total return investment strategy with an
emphasis on yield
No direct exposure to:
-
Enhanced Money Market Funds
-
Commercial Paper Investments
-
Sovereign Governments
-
Securities Lending
-
Credit or Other Derivatives
Minimal exposure to non-governmental
RMBS, CMBS, and CDO
Centralized investment function
Equities
$550
Real
Estate
$250
Other (3)
$245
LP
LLC
$328
Short
Term
$403
Fixed Maturities
$4,475
72%
6%
9%
5%
4%
4%
$6,251 million |
 26
Fixed Income Portfolio
40%
$4,475 million
95% investment grade municipal, corporate & agency bonds
-
40% of portfolio relates to states, municipal entities and political subdivisions;
No state represents more than 4% of total fixed maturity investments
12%
48%
46%
State
G.O.’s
Revenue
Bonds
Local
Government
G. O.’s
24%
Pre-Refunded
20%
10%
States & Political
Subs
$1,793
U.S. Gov’t &
Agencies
$537
Corporate
$2,049 |
 27
LP’s & LLC’s / Equities
-
Diversified across 30+ funds
-
Performed well during financial crisis
Secondary
Funds
$68
Private Equity /
LBO Funds
$31
Other Funds
$8
Mezzanine /
Senior Debt
$74
Distressed Debt
$206
51%
18%
17%
8%
2%
$403 million
(4)
4%
Equity
Co-Investments
$16
LP & LLC’s
Fair
value
%
Intermec
138
$
2.2%
Barclays Bank (Pfd.)
22
0.3%
Deutsche Bank (Pfd.)
20
0.3%
HSBC Holdings (Pfd.)
16
0.3%
Bank of America (Pfd.)
16
0.3%
Total
211
$
3.4%
Top 5 Holdings
33%
23%
7%
10%
8%
2%
Equities
$475 million
(5)
17%
Industrial
$158
Technology
$12
Other
$37
Consumer,
Non-cyclical
$47
Energy
$33
ETF
$79
Financial
$109 |
 Capital and Liquidity |
 Sound Balance Sheet
Strong liquidity at the holding company
Simple
capital
structure
–
no converts or hybrids
Low debt to total capitalization ratio of 22%
High quality investment portfolio
Highly rated reinsurance partners
Shareholders’
equity
of
$2.1B
/
$2.0B
ex.
AOCI
(6)
29 |
 30
Strong Liquidity Profile
Operating Company Dividend Capacity
$170
$147
$123
$1,757
$1,859
$1,956
$1,649
$1,918
$2,113
Excl. AOCI
Incl. AOCI
U.S. GAAP Shareholders’
Equity
(6)
Growing Statutory Earnings
and Dividend Capacity
(6)
Improved Operating Results
and Asset Valuations
2008
2009
2010
2008
2009
2010 |
 31
Earnings per Share
Book Value per Share
Delivered 13% Growth in Earnings
& Book Value per Share in 2010
Creating Shareholder Value
($0.47)
$2.64
$2.98
2008
2009
2010
2008
2009
2010
$26.46
$30.75
$34.61 |
 Capital Deployment Priorities
1.
Fund Organic Growth
-
Maintain or improve margins in all lines
-
Build growth capital for improved pricing environment
2.
Acquisitions
-
Bolt-on Standard & Preferred opportunities
-
Geographic expansion in Non-standard
-
Leverage scale in Life operations
-
$300 million program announced February 2011
-
Maintain a flexible, measured approach
3.
Dividends
-
Remain competitive
-
Target around 1/3 of earnings
32
4.
Share Repurchase |
 Investor Considerations
Unitrin is well positioned across personal lines market
-
Preferred, Standard & Non Standard product auto product suite &
homeowners -
Broad distribution capabilities; direct channel in place today to capture evolving
consumer buying preferences
Life & Health business is stable & accretive with potential for
upside A disciplined approach to capital management
-
Competitive, 3%+ dividend yield
-
$300 million repurchase program
-
Fireside Bank on track to free-up $250 million
-
Acquisition focus
33
Delivering Shareholder Value |
 |
 Non-GAAP
Measures Underlying Combined Ratio is a non-GAAP measure, which
is computed as the difference between the GAAP combined ratio, the effect of
catastrophes (excluding development of prior year catastrophes) on the combined ratio
and the effect of prior year reserve development (including development on prior year
catastrophes) on the combined ratio. The most directly comparable GAAP measure is the
combined ratio. We believe the underlying combined ratio is useful to investors and is
used by management to reveal the trends in our Property and Casualty business that may
be obscured by catastrophe losses and prior year reserve development. These
catastrophe losses cause our loss trends to vary significantly between periods as a
result of their incidence of occurrence and magnitude, and can have a significant impact on
the combined ratio. Prior year reserve developments are caused by unexpected loss development
on historical reserves. We believe it is useful for investors to evaluate these
components separately and in the aggregate when reviewing our underwriting
performance. The underlying combined ratio should not be considered a substitute for
the combined ratio and does not reflect the overall underwriting profitability of our
business. The P&C and Life Net Income excluding Catastrophe Losses / and a
Goodwill Write-off is a non-GAAP measure, which is computed
as reported Segment Net Income (Loss) from Kemper, Unitrin Specialty,
Unitrin Direct and Life and Health Insurance, excluding Catastrophe Losses
and a 2010 Reserve National Goodwill write-off. A detailed
reconciliation is on the following slide. The most directly comparable GAAP
measure is the Total Segment Net Income. We believe the P&C and Life
net income excluding catastrophe losses / and a Goodwill write-off is useful to investors
and is used by management to reveal the trends in business.
|
 Reconciliation of Non-GAAP Measure
2006
2007
2008
2009
2010
P&C and Life Net Income excluding
Catastrophe Losses and a 2010 Goodwill Write-off
259
$
192
$
137
$
222
$
230
$
Catastrophe Losses
(37)
(26)
(94)
(28)
(51)
Reserve National Goodwill Write-off
-
-
-
-
(15)
Fireside Bank (In Run-off)
26
(39)
(22)
(5)
15
Total Segment Net Income as Reported
248
$
127
$
21
$
189
$
179
$ |
 Footnotes
(1)
Source: SNL Financial based on 2009 Direct Premium Written
(2)
Ratio of Tier 1 Capital to total average assets
(3)
Primarily loans to policyholders
(4)
Includes $75 million of LP & LLC’s accounted under the Fair Value Method and
reported as Equity Securities
(5)
Excludes $75 million of LP & LLC’s accounted under the Fair Value Method and
reported as Equity Securities; includes $125 million of Preferred Stock
(6)
AOCI represents Accumulated Other Comprehensive Income reported in the company’s 10K
filings |