Attached files
UNITED STATES
SECURITIES AND EXCHANGE COMMISSION
Washington, D.C. 20549
Form 10-K
(Mark One)
|
X
|
ANNUAL REPORT PURSUANT TO SECTION 13 OR 15(d) OF THE SECURITIES EXCHANGE ACT OF 1934
|
For the fiscal year ended December 31, 2010
or
|
|
TRANSITION REPORT PURSUANT TO SECTION 13 OR 15(d) OF THE SECURITIES EXCHANGE ACT OF 1934
|
For the Transition Period From _____ to _____
Commission file number 0-12247
Southside Bancshares, Inc.
(Exact name of registrant as specified in its charter)
|
Texas
|
75-1848732
|
|
(State or other jurisdiction of incorporation or organization)
|
(I.R.S. Employer Identification No.)
|
|
1201 S. Beckham Avenue, Tyler, Texas
|
75701
|
|
(Address of Principal Executive Offices)
|
(Zip Code)
|
Registrant's telephone number, including area code: (903) 531-7111
Securities registered pursuant to Section 12(b) of the Act:
|
Name of each exchange
|
|
|
Title of each class
|
on which registered
|
|
COMMON STOCK, $1.25 PAR VALUE
|
NASDAQ Global Select Market
|
Securities registered pursuant to Section 12(g) of the Act:
NONE
Indicate by check mark if the registrant is a well-known seasoned issuer, as defined in Rule 405 of the Securities Act. Yes [ ] No [X]
Indicate by check mark if the registrant is not required to file reports pursuant to Section 13 or Section 15(d) of the Act. Yes [ ] No [X]
Indicate by check mark whether the registrant (1) has filed all reports required to be filed by Section 13 or 15(d) of the Securities Exchange Act of 1934 during the preceding 12 months (or for such shorter period that the registrant was required to file such reports), and (2) has been subject to such filing requirements for the past 90 days. Yes [X ] No [ ]
Indicate by check mark whether the registrant has submitted electronically and posted on its corporate Web site, if any, every Interactive Data File required to be submitted and posted pursuant to Rule 405 of Regulation S-T (§ 232.405 of this chapter) during the preceding 12 months (or for such shorter period that the registrant was required to submit and post such files). Yes [ ] No [ ]
Indicate by check mark if disclosure of delinquent filers pursuant to Item 405 of Regulation S-K (§ 229.405 of this chapter) is not contained herein, and will not be contained, to the best of registrant's knowledge, in definitive proxy or information statements incorporated by reference in Part III of this Form 10-K or any amendment to this Form 10-K. [ ]
Indicate by check mark whether the registrant is a large accelerated filer, an accelerated filer, a non-accelerated filer, or a smaller reporting company. See the definitions of “large accelerated filer,” “accelerated filer,” and “smaller reporting company” in Rule 12b-2 of the Exchange Act. (Check one):
|
Large accelerated filer [ ]
|
Accelerated filer [X]
|
||
|
Non-accelerated filer [ ]
|
Smaller reporting company [ ]
|
Indicate by check mark whether the registrant is a shell company (as defined in Rule 12b-2 of the Act). Yes [ ] No [X]
The aggregate market value of the common stock held by non-affiliates of the registrant as of June 30, 2010 was $268,472,594.
As of February 11, 2011, 15,637,272 shares of common stock of Southside Bancshares, Inc. were outstanding.
DOCUMENTS INCORPORATED BY REFERENCE
Certain portions of the Registrant's proxy statement to be filed for the Annual Meeting of Shareholders to be held April 21, 2011 are incorporated by reference into Part III of this Annual Report on Form 10-K. Other than those portions of the proxy statement specifically incorporated by reference pursuant to Items 10-14 of Part III hereof, no other portions of the proxy statement shall be deemed so incorporated.
|
TABLE OF CONTENTS
|
|
|
PART I
|
|
|
ITEM 1. BUSINESS
|
|
|
ITEM 1A. RISK FACTORS
|
|
|
ITEM 1B. UNRESOLVED STAFF COMMENTS
|
|
|
ITEM 2. PROPERTIES
|
|
|
ITEM 3. LEGAL PROCEEDINGS
|
|
|
ITEM 4. (REMOVED AND RESERVED)
|
|
|
PART II
|
|
|
ITEM 5. MARKET FOR REGISTRANT’S COMMON EQUITY, RELATED STOCKHOLDER
|
|
|
MATTERS AND ISSUER PURCHASES OF EQUITY SECURITIES
|
|
|
ITEM 6. SELECTED FINANCIAL DATA
|
|
|
ITEM 7. MANAGEMENT’S DISCUSSION AND ANALYSIS OF FINANCIAL
|
|
|
CONDITION AND RESULTS OF OPERATIONS
|
|
|
ITEM 7A. QUANTITATIVE AND QUALITATIVE DISCLOSURES ABOUT
|
|
|
MARKET RISK
|
|
|
ITEM 8. FINANCIAL STATEMENTS AND SUPPLEMENTARY DATA
|
|
|
ITEM 9. CHANGES IN AND DISAGREEMENTS WITH ACCOUNTANTS ON
|
|
|
ACCOUNTING AND FINANCIAL DISCLOSURE
|
|
|
ITEM 9A. CONTROLS AND PROCEDURES
|
|
|
ITEM 9B. OTHER INFORMATION
|
|
|
PART III
|
|
|
ITEM 10. DIRECTORS, EXECUTIVE OFFICERS AND CORPORATE GOVERNANCE
|
|
|
ITEM 11. EXECUTIVE COMPENSATION
|
|
|
ITEM 12. SECURITY OWNERSHIP OF CERTAIN BENEFICIAL OWNERS
|
|
|
AND MANAGEMENT AND RELATED STOCKHOLDER MATTERS
|
|
|
ITEM 13. CERTAIN RELATIONSHIPS AND RELATED TRANSACTIONS, AND DIRECTOR
|
|
|
INDEPENDENCE
|
|
|
ITEM 14. PRINCIPAL ACCOUNTANT FEES AND SERVICES
|
|
|
PART IV
|
|
|
ITEM 15. EXHIBITS AND FINANCIAL STATEMENT SCHEDULES
|
|
|
Report of Independent Registered Public Accounting Firm
|
|
|
INDEX TO EXHIBITS
|
|
|
Subsidiaries of the Registrant
|
|
|
Consent of Independent Registered Public Accounting Firm
|
|
|
Certification Pursuant to Section 302
|
|
|
Certification Pursuant to Section 302
|
|
|
Certification Pursuant to Section 906
|
IMPORTANT INFORMATION ABOUT THIS REPORT
In this report, the words “the Company,” “we,” “us,” and “our” refer to the combined entities of Southside Bancshares, Inc. and its subsidiaries. The words “Southside” and “Southside Bancshares” refer to Southside Bancshares, Inc. The words “Southside Bank” and “the Bank” refer to Southside Bank (which, subsequent to the internal merger of Fort Worth National Bank (“FWNB”) with and into Southside Bank, includes FWNB). “FWBS” refers to Fort Worth Bancshares, Inc., a bank holding company acquired by Southside of which FWNB was a wholly-owned subsidiary. “SFG” refers to Southside Financial Group, LLC of which Southside owns a 50% interest and consolidates for financial reporting.
PART I
|
ITEM 1. BUSINESS
|
FORWARD-LOOKING INFORMATION
The disclosures set forth in this item are qualified by the section captioned “Cautionary Notice Regarding Forward-Looking Statements” in “Item 7. Management’s Discussion and Analysis of Financial Condition and Results of Operations” of this Annual Report on Form 10-K and other cautionary statements set forth elsewhere in this report.
GENERAL
Southside Bancshares, Inc., incorporated in Texas in 1982, is a bank holding company for Southside Bank, a Texas state bank headquartered in Tyler, Texas that was formed in 1960. The Tyler metropolitan area has a population of approximately 198,000 and is located approximately 90 miles east of Dallas, Texas and 90 miles west of Shreveport, Louisiana.
At December 31, 2010, our total assets were $3.0 billion, total loans were $1.08 billion, deposits were $2.13 billion, and total equity was $215.4 million. For the years ended December 31, 2010 and 2009, our net income was $39.5 million and $44.4 million, respectively, and diluted earnings per common share were $2.51 and $2.82, respectively. We have paid a cash dividend every year since 1970 (including dividends paid by Southside Bank prior to the incorporation of Southside Bancshares).
We are a community-focused financial institution that offers a full range of financial services to individuals, businesses, municipal entities, and non-profit organizations in the communities that we serve. These services include consumer and commercial loans, deposit accounts, trust services, safe deposit services and brokerage services.
Our consumer loan services include 1-4 family residential mortgage loans, home equity loans, home improvement loans, automobile loans and other installment loans. Commercial loan services include short-term working capital loans for inventory and accounts receivable, short and medium-term loans for equipment or other business capital expansion, commercial real estate loans and municipal loans. We also offer construction loans for 1-4 family residential and commercial real estate.
We offer a variety of deposit accounts with a wide range of interest rates and terms, including savings, money market, interest and noninterest bearing checking accounts and certificates of deposit (“CDs”). Our trust services include investment management, administration and advisory services, primarily for individuals and, to a lesser extent, partnerships and corporations. At December 31, 2010, our trust department managed approximately $718 million of trust assets.
We and our subsidiaries are subject to comprehensive regulation, examination and supervision by the Board of Governors of the Federal Reserve System (the “Federal Reserve”), the Texas Department of Banking (the “TDB”) and the Federal Deposit Insurance Corporation (the “FDIC”) and are subject to numerous laws and regulations relating to internal controls, the extension of credit, making of loans to individuals, deposits, and all other facets of our operations.
1
On October 10, 2007, Southside completed the acquisition of FWBS and its wholly-owned subsidiaries, Fort Worth Bancorporation, Inc., FWNB and Magnolia Trust Company I. Southside purchased all of the outstanding capital stock of FWBS for approximately $37 million. FWNB operated two banking offices in Fort Worth, one banking office in Arlington and a loan production office in Austin. At the time of purchase FWNB had approximately $124 million in total assets, $105 million in loans and $103 million in deposits.
Our administrative offices are located at 1201 South Beckham Avenue, Tyler, Texas 75701, and our telephone number is 903-531-7111. Our website can be found at www.southside.com. Our public filings with the Securities and Exchange Commission (the “SEC”) may be obtained free of charge at either our website, under the “Investor Relations” tab, or the SEC’s website, www.sec.gov, as soon as reasonably practicable after filing with the SEC.
RECENT DEVELOPMENTS
During April 2010, we opened a full service bank in a leased space in a grocery store in Tyler, Texas. During August 2010, we opened a full service branch on the west side of Tyler on Highway 64. We are in the process of building a new facility adjacent to our headquarters in Tyler which will house our Trust department. We anticipate that this facility will be completed during the first half of 2011. Plans are underway to open a full service branch in a leased space in a grocery store being constructed in Tyler, Texas. We anticipate that this branch will open during 2011. We have made application to change our Austin loan production office to a full service branch. We anticipate this change will occur during 2011. During September 2010, we purchased a 50% interest in a commercial building in Arlington, Texas. SFG is leasing a little over 50% of this facility. The remaining portion of the facility is under a long-term lease. We continue to explore opportunities to expand into either additional grocery stores or traditional branch locations. During the fourth quarter of 2009, we completed a core banking computer system conversion. This new system should provide for our core computer system needs for many years.
MARKET AREA
We consider our primary market area to be all of Smith, Gregg, Tarrant, Travis, Cherokee, Anderson, Kaufman, Henderson and Wood Counties in Texas, and to a lesser extent, portions of adjoining counties. Our expectation is that our presence in all of the market areas we serve should grow in the future. In addition, we continue to explore new markets in which we believe we can expand successfully.
The principal economic activities in our market areas include retail, distribution, manufacturing, medical services, education and oil and gas industries. Additionally, the industry base includes conventions and tourism, as well as retirement relocation. These economic activities support a growing regional system of medical service, retail and education centers. Tyler, Longview, Fort Worth, Austin and Arlington are home to several nationally recognized health care systems that represent all major specialties.
We serve our markets through 48 banking centers, 19 of which are located in grocery stores. The branches are located in and around Tyler, Longview, Lindale, Gresham, Jacksonville, Bullard, Chandler, Hawkins, Seven Points, Palestine, Forney, Gun Barrel City, Athens, Whitehouse, Fort Worth, Arlington and Austin. Our advertising is designed to target the market areas we serve. The type and amount of advertising done in each market area is directly attributable to our market share in that market area combined with overall cost.
We also maintain 12 motor bank facilities. Additionally, our customers may access various banking services through our 50 automated teller machines (“ATMs”) and ATMs owned by others, through debit cards, and through our automated telephone, internet and electronic banking products. These products allow our customers to apply for loans from their computers, access account information and conduct various other transactions from their telephones and computers.
2
THE BANKING INDUSTRY IN TEXAS
The banking industry is affected by general economic conditions such as interest rates, inflation, recession, unemployment and other factors beyond our control. During the last twenty years the Texas economy has continued to diversify, decreasing the overall impact of fluctuations in oil and gas prices; however, the oil and gas industry is still a significant component of the Texas economy. Beginning in the fourth quarter of 2008, as oil prices declined significantly and consumers all across the United States were impacted even more severely by the economic slowdown, our market areas began to experience a greater slowdown in economic activity. During 2009 and continuing throughout 2010, our market areas experienced the effects of the housing-led slowdown that impacted the other regions of the United States. Many economists predict growth for the U. S. economy during 2011, however, we are well aware that any economic growth could be uneven. We cannot predict whether current economic conditions will improve, remain the same or decline.
COMPETITION
The activities we are engaged in are highly competitive. Financial institutions such as savings and loan associations, credit unions, consumer finance companies, insurance companies, brokerage companies and other financial institutions with varying degrees of regulatory restrictions compete vigorously for a share of the financial services market. During 2010, the number of financial institutions in our market areas increased, a trend that we expect will continue. Brokerage and insurance companies continue to become more competitive in the financial services arena and pose an ever-increasing challenge to banks. Legislative changes also greatly affect the level of competition we face. Federal legislation allows credit unions to use their expanded membership capabilities, combined with tax-free status, to compete more fiercely for traditional bank business. The tax-free status granted to credit unions provides them with a significant competitive advantage. Many of the largest banks operating in Texas, including some of the largest banks in the country, have offices in our market areas. Many of these institutions have capital resources, broader geographic markets, and legal lending limits substantially in excess of those available to us. We face competition from institutions that offer products and services we do not or cannot currently offer. Some institutions we compete with offer interest rate levels on loan and deposit products that we are unwilling to offer due to interest rate risk and overall profitability concerns. We expect the level of competition to continue to increase.
EMPLOYEES
At February 15, 2011, we employed approximately 578 full time equivalent persons. None of our employees are represented by any unions or similar groups, and we have not experienced any type of strike or labor dispute. We consider the relationship with our employees to be good.
EXECUTIVE OFFICERS OF THE REGISTRANT
Our executive officers as of December 31, 2010 and as of February 11, 2011 were as follows:
B. G. Hartley (Age 81), Chairman of the Board and Chief Executive Officer of Southside Bancshares, Inc. since 1983. He also serves as Chairman of the Board and Chief Executive Officer of Southside Bank, having served in these capacities since Southside Bank's inception in 1960.
Sam Dawson (Age 63), President, Secretary and Director of Southside Bancshares, Inc. since 1998. He also has served as President, Chief Operations Officer and Director of Southside Bank since 1996. He became an officer of Southside Bancshares, Inc. in 1982 and of Southside Bank in 1975.
Robbie N. Edmonson (Age 79), Vice Chairman of the Board of Southside Bancshares, Inc. and Southside Bank since 1998. He joined Southside Bank as a vice president in 1968.
Jeryl Story (Age 59), Senior Executive Vice President of Southside Bancshares, Inc. since 2000, and Senior Executive Vice President - Loan Administration, Senior Lending Officer and Director of Southside Bank since 1996. He joined Southside Bank in 1979 as an officer in Loan Documentation.
3
Lee R. Gibson (Age 54), Senior Executive Vice President and Chief Financial Officer of Southside Bancshares, Inc. and of Southside Bank since 2000. He is also a Director of Southside Bank. He became an officer of Southside Bancshares, Inc. in 1985 and of Southside Bank in 1984.
Michael Coogan (Age 51), Executive Vice President and Treasurer of Southside Bank. He became an officer of Southside Bank in 2009.
All the individuals named above serve in their capacity as officers of Southside Bancshares, Inc. and Southside Bank and are appointed annually by the board of directors of each entity.
SUPERVISION AND REGULATION
General
Banking is a complex, highly regulated industry. As bank holding companies under federal law, Southside Bancshares, Inc. (the “Company”) and its wholly-owned subsidiary, Southside Delaware Financial Corporation, (collectively, the “Holding Companies”) are subject to regulation, supervision and examination by the Board of Governors of the Federal Reserve System. In addition, under state law, as the parent companies of a Texas-chartered state bank, the Holding Companies are subject to supervision and examination by the TDB. As a Texas-chartered state bank, Southside Bank is subject to regulation, supervision and examination by the TDB, as its chartering authority, and by the FDIC, as its primary federal regulator and deposit insurer. This system of regulation and supervision applicable to us establishes a comprehensive framework for our operations and is intended primarily for the protection of the FDIC’s Deposit Insurance Fund (“DIF”) and the public rather than our shareholders and creditors.
The earnings of Southside Bank and, therefore, the earnings of the Holding Companies, are affected by general economic conditions, changes in federal and state laws and regulations and actions of various regulatory authorities, including those referenced above. Additional changes to the laws and regulations applicable to us are frequently proposed at both the federal and state levels. The regulatory framework under which we operate will change substantially over the next several years as the result of the enactment of the Dodd-Frank Wall Street Reform and Consumer Protection Act (the “Dodd-Frank Act”) on July 21, 2010. The Dodd-Frank Act represents a significant overhaul of many aspects of the regulation of the financial-services industry, addressing, among other things, systemic risk, capital adequacy, deposit insurance assessments, consumer financial protection, interchange fees, derivatives, lending limits, mortgage lending practices, registration of investment advisors and changes among the bank regulatory agencies. Among the provisions that may affect the operations of the Holding Companies and Southside Bank are the following:
|
·
|
Creation of the Bureau of Consumer Financial Protection with centralized authority for consumer protection in the banking industry.
|
|
·
|
New limitations on federal preemption.
|
|
·
|
Application of new regulatory capital requirements, including changes to leverage and risk-based capital standards and changes to the components of permissible tiered capital.
|
|
·
|
Requirement that holding companies and their subsidiary banks be well capitalized and well managed in order to engage in activities permitted for financial holding companies.
|
|
·
|
Changes to the assessment base for deposit insurance premiums.
|
|
·
|
Making permanent the $250,000 limit for federal deposit insurance and providing unlimited insurance coverage for noninterest-bearing demand transaction accounts.
|
|
·
|
Repeal of the prohibition on the payment of interest on demand deposits, effective July 21, 2011, thereby permitting depository institutions to pay interest on business transaction and other accounts.
|
|
·
|
Restrictions on compensation, including a prohibition on incentive-based compensation arrangements that encourage inappropriate risk taking by covered financial institutions and are deemed to be excessive, or that may lead to material losses.
|
4
Some of these and other major changes could materially impact the profitability of our business, the value of assets we hold or the collateral available for our loans, require changes to business practices or force us to discontinue businesses and expose us to additional costs, taxes, liabilities, enforcement actions and reputational risk. Many of these provisions became effective upon enactment of the Dodd-Frank Act, while others are subject to further study, rule making, and the discretion of regulatory bodies. We cannot predict the effect that compliance with the Dodd-Frank Act or any implementing regulations will have on the Holding Companies’ or Southside Bank’s businesses or their ability to pursue future business opportunities. Additional regulations resulting from the Dodd-Frank Act may materially adversely affect the Company’s business, financial condition or results of operations.
The likelihood, timing, and scope of any such change and the impact any such change may have on us are impossible to determine with any certainty. Also, additional changes to the laws and regulations applicable to us are frequently proposed at both the federal and state levels. We cannot predict whether new legislation or regulations will be enacted and, if enacted, the effect that it, or any regulations, would have on our business, financial condition or results of operations. Set forth below is a brief description of the significant federal and state laws and regulations to which we are currently subject. These descriptions do not purport to be complete and are qualified in their entirety by reference to the particular statutory or regulatory provision.
Holding Company Regulation
As bank holding companies regulated under the Bank Holding Company Act of 1956 (“BHCA”), as amended, the Holding Companies are registered with and subject to regulation, supervision and examination by the Federal Reserve. The Holding Companies are required to file annual and other reports with, and furnish information to, the Federal Reserve, which makes periodic inspections of the Holding Companies.
Permitted Activities. Under the BHCA, a bank holding company is generally permitted to engage in, or acquire direct or indirect control of more than 5 percent of the voting shares of any company engaged in the following activities:
|
·
|
banking or managing or controlling banks;
|
|
·
|
furnishing services to or performing services for our subsidiaries; and
|
|
·
|
any activity that the Federal Reserve determines to be so closely related to banking as to be a proper incident to the business of banking, including:
|
|
o
|
factoring accounts receivable;
|
|
o
|
making, acquiring, brokering or servicing loans and usual related activities;
|
|
o
|
leasing personal or real property;
|
|
o
|
operating a nonbank depository institution, such as a savings association;
|
|
o
|
performing trust company functions;
|
|
o
|
conducting financial and investment advisory activities;
|
|
o
|
conducting discount securities brokerage activities;
|
|
o
|
underwriting and dealing in government obligations and money market instruments;
|
|
o
|
providing specified management consulting and counseling activities;
|
|
o
|
performing selected data processing services and support services;
|
5
|
o
|
acting as agent or broker in selling credit life insurance and other types of insurance in connection with credit transactions; and
|
|
o
|
performing selected insurance underwriting activities.
|
The Federal Reserve has the authority to order a bank holding company or its subsidiaries to terminate any of these activities or to terminate its ownership or control of any subsidiary when it has reasonable cause to believe that the bank holding company’s continued ownership, activity or control constitutes a serious risk to the financial safety, soundness or stability of it or any of its bank subsidiaries.
Under the BHCA, a bank holding company meeting certain eligibility requirements may elect to become a “financial holding company.” A financial holding company and companies under its control may engage in activities that are “financial in nature,” as defined by the Gramm-Leach-Bliley Act (“GLBA”) and Federal Reserve interpretations, and therefore may engage in a broader range of activities than those permitted for bank holding companies and their subsidiaries. Financial activities specifically include insurance brokerage and underwriting, securities underwriting and dealing, merchant banking, investment advisory and lending activities. Financial holding companies and their subsidiaries also may engage in additional activities that are determined by the Federal Reserve, in consultation with the Treasury Department, to be “financial in nature or incidental to” a financial activity or are determined by the Federal Reserve unilaterally to be “complementary” to financial activities.
We plan to offer broker-dealer services through a newly established subsidiary, Southside Securities, Inc. Accordingly, as of February 8, 2011, we filed with the Federal Reserve Bank of Dallas a declaration of financial holding company status. Election of financial holding company status is not automatic and whether it is granted depends upon a number of factors, including that all of our depository institution subsidiaries satisfy the Federal Reserve’s “well capitalized” and “well managed” standards and have at least a satisfactory rating under the Community Reinvestment Act (discussed below). In order to become effective, the declaration will be evaluated in accordance with the Federal Reserve’s established procedures for processing financial holding company declarations. If we succeed in attaining financial holding company status, that status could be impacted by the condition of Southside Bank and/or other factors. For example, if Southside Bank ceases to be “well capitalized” or “well managed” under applicable regulatory standards, the Federal Reserve Board may, among other things, place limitations on our ability to conduct broader financial activities or, if the deficiencies persist, require us to divest Southside Bank. In addition, if Southside Bank were to receive a rating of less than satisfactory under the Community Reinvestment Act, we would be prohibited from engaging in any additional activities other than those permissible for bank holding companies that are not financial holding companies. If, after becoming a financial holding company and undertaking expanded financial activities (that are not permissible for a bank holding company), the financial holding company fails to continue to meet any of the prerequisites for its “financial holding company” status, including those described above, the financial holding company would be required to enter into an agreement with the Federal Reserve Board to comply with all applicable capital and management requirements. If the financial holding company does not return to compliance within 180 days, the Federal Reserve may order the financial holding company to divest its bank or the company may discontinue or divest investments in companies engaged in, activities permissible only for a bank holding company that has elected to be treated as a financial holding company.
Capital Adequacy. Each of the federal banking agencies, including the Federal Reserve and the FDIC, has issued substantially similar risk-based and leverage capital guidelines applicable to the banking organizations they supervise.
The agencies’ risk-based guidelines define a three-tier capital framework. Tier 1 capital principally consists of shareholder’s equity less any amounts of goodwill, other intangible assets, interest-only strips receivables, deferred tax assets, non-financial equity investments and other items that are required to be deducted by the Federal Reserve. Perpetual, non-cumulative preferred stock, certain amounts of trust-preferred securities and minority interests in consolidated subsidiaries also may be included in Tier 1 capital, but the Federal Reserve requires that common stock be the predominant form of Tier 1 capital. Tier 2 capital principally consists of perpetual and trust preferred stock not qualifying as Tier 1 capital, mandatorily convertible debt, limited amounts of term-subordinated debt, intermediate-term preferred stock, and, subject
6
to limitations, general allowances for loan and lease losses, and other adjustments. Tier 3 capital includes subordinated debt that is unsecured, fully paid, has an original maturity of at least two years, is not redeemable before maturity without prior approval by the Federal Reserve and includes a lock-in clause precluding payment of either interest or principal if the payment would cause the issuing bank’s risk-based capital ratio to fall or remain below the requirement minimum. The sum of Tier 1 and Tier 2 capital less investments in unconsolidated subsidiaries represents qualifying total capital.
Risk-based capital ratios are calculated by dividing, as appropriate, total capital and Tier 1 capital by risk-weighted assets. Assets and off-balance sheet exposures are assigned to one of four categories of risk weights, based primarily on relative credit risk. Under the existing risk-based capital requirements, the Holding Companies and Southside Bank are each generally required to maintain a minimum ratio of total capital to risk-weighted assets of at least 8% and a minimum ratio of Tier 1 capital to risk-weighted assets of at least 4%. To the extent we engage in trading activities, we are required to adjust our risk-based capital ratios to take into consideration market risks that may result from movements in market prices of covered trading positions in trading accounts, or from foreign exchange or commodity positions, whether or not in trading accounts, including changes in interest rates, equity prices, foreign exchange rates or commodity prices. Any capital required to be maintained under these provisions may consist of Tier 3 capital.
Each of the federal bank regulatory agencies, including the Federal Reserve and the FDIC, also have established minimum leverage capital requirements for the banking organizations they supervise. These requirements provide that banking organizations that meet certain criteria, including excellent asset quality, high liquidity, low interest rate exposure and good earnings, and that have received the highest regulatory rating must maintain a ratio of Tier 1 capital to total adjusted average assets of at least 3%. Institutions not meeting these criteria, as well as institutions with supervisory, financial or operational weaknesses, are expected to maintain a minimum Tier 1 capital to total adjusted average assets ratio equal to 100 to 200 basis points above this stated minimum. Holding companies experiencing internal growth or making acquisitions are expected to maintain strong capital positions substantially above the minimum supervisory levels without significant reliance on intangible assets. The Federal Reserve also continues to consider a “tangible Tier 1 capital leverage ratio” (deducting all intangibles) and other indicators of capital strength in evaluating proposals for expansion or new activity.
The ratios of Tier 1 capital and total capital to risk-weighted assets, and the leverage ratios of the Company and Southside Bank as of December 31, 2010, are shown in the following table.
|
Capital Adequacy Ratios
|
||||||||||||||
|
Regulatory Minimums
|
Regulatory Minimums
to be Well-Capitalized
|
Southside Bancshares, Inc.
|
Southside Bank
|
|||||||||||
|
Risk-based capital ratios:
|
||||||||||||||
|
Tier 1 capital (1)
|
4.0
|
%
|
6.0
|
%
|
19.84
|
%
|
19.01
|
%
|
||||||
|
Total risk-based capital (2)
|
8.0
|
10.0
|
21.09
|
20.27
|
||||||||||
|
Tier 1 leverage ratio (3)
|
4.0
|
5.0
|
8.45
|
8.10
|
||||||||||
|
(1)
|
Common shareholders’ equity excluding unrealized gains or losses on debt securities available for sale, unrealized gains on equity securities available for sale and unrealized gains or losses on cash flow hedges, net of deferred income taxes; plus certain mandatorily redeemable capital securities, less nonqualifying intangible assets net of applicable deferred income taxes, and certain nonfinancial equity investments; computed as a ratio of risk-weighted assets, as defined in the risk-based capital guidelines.
|
|
(2)
|
The sum of Tier 1 capital, a qualifying portion of the allowance for credit losses, qualifying subordinated debt and qualifying unrealized gains on available for sale equity securities; computed as a ratio of risk-weighted assets, as defined in the risk-based capital guidelines.
|
|
(3)
|
Tier 1 capital computed as a percentage of fourth quarter average assets less nonqualifying intangibles and certain nonfinancial equity investments.
|
7
The capital requirements applicable to the Holding Companies and Southside Bank are subject to change because, over the coming years, the regulatory capital framework is expected to change in important respects as a result of the Dodd-Frank Act and as a result of a separate, international regulatory capital initiative known as “Basel III.” In particular, the current risk-based capital guidelines that apply to the banks and bank holding companies are based upon the 1988 capital accord of the Basel Committee on Banking Supervision (“BCBS”), a committee of central banks and bank supervisors. The Basel I standards to which U.S. banks and bank and financial holding companies are subject were implemented by the Federal Reserve. In 2008, the Federal Reserve began to phase-in capital standards based on the BCBS’ second capital accord, referred to as Basel II, for large or “core” international banks (total assets of $250 billion or more or consolidated foreign exposures of $10 billion or more). Basel II emphasizes internal assessment of credit, market and operational risk, as well as supervisory assessment and market discipline in determining minimum capital requirements. In December 2010, BCBS finalized new regulatory capital standards, known as Basel III. These standards, which are aimed at capital reform, seek to further strengthen financial institutions’ capital positions by mandating a higher minimum level of common equity to be held, along with a capital conservation buffer to withstand future periods of stress. The Basel III regime does not supplant Basel II, however. The Basel II requirements focus on the appropriate allocation of capital to bank assets based on credit risk. Basel III addresses the quality of capital and introduces new capital requirements but does not purport to overrule the credit risk-based standards of Basel II.
Complying with these new capital requirements will likely affect our operations, and the extent to which we will be affected will be known with more certainty once additional clarity is provided on the underlying details of these new requirements. These new requirements have been endorsed by the U.S. banking regulators, but have not yet been translated by the regulators into official regulation for U.S. financial institutions. It is anticipated that the regulators will adopt new regulatory capital requirements similar to those proposed by the BCBS, and the new requirements are anticipated to be phased-in for U.S. financial institutions beginning in 2013. Furthermore, it is widely anticipated that the capital requirements for most bank and financial holding companies, as well as for most insured depository institutions, will increase, although the nature and amounts of the increase have not yet been specified.
Source of Strength. Federal Reserve policy requires a bank holding company to act as a source of financial strength and to take measures to preserve and protect bank subsidiaries in situations where additional investments in a troubled bank may not otherwise be warranted. As a result, a bank holding company may be required to contribute additional capital to its subsidiaries in the form of capital notes or other instruments which qualify as capital under regulatory rules. Any loans from the holding company to its subsidiary banks likely will be unsecured and subordinated to the bank’s depositors and perhaps to other creditors of the bank. Notably, the Dodd-Frank Act has codified the Federal Reserve’s “source of strength” policy, which is scheduled to become effective in 2011. In addition to the foregoing requirements, the Dodd-Frank Act’s new provisions authorize the Federal Reserve to require a company that directly or indirectly controls a bank to submit reports that are designed both to assess the ability of such company to comply with its “source of strength” obligations and to enforce the company’s compliance with these obligations.
In addition, if a bank holding company enters into bankruptcy or becomes subject to the orderly liquidation process established by the Dodd-Frank Act, any commitment by the bank holding company to a federal bank regulatory agency to maintain the capital of a subsidiary bank would be assumed by the bankruptcy trustee or the FDIC, as appropriate, and entitled to a priority of payment. In addition, the FDIC provides that any insured depository institution generally will be liable for any loss incurred by the FDIC in connection with the default of, or any assistance provided by the FDIC to, a commonly controlled insured depository institution. Southside Bank is an FDIC-insured depository institution and thus subject to these requirements. See also Bank Regulation - Prompt Corrective Action.
Dividends. The principal source of our liquidity at the parent company level is dividends from Southside Bank. Southside Bank is subject to federal and state restrictions on its ability to pay dividends to Southside Delaware Financial Corporation, the direct parent of Southside Bank, which in turn may affect the ability of Southside Delaware to pay dividends to the Company. We must pay essentially all of our operating expenses from funds we receive from Southside Bank. Therefore, shareholders may receive dividends from us only to the extent that funds are available after payment of our operating expenses. Consistent with its “source of strength” policy, the Federal Reserve discourages bank holding companies from paying dividends except out of operating earnings and prefers that dividends be paid only if, after the payment, the prospective rate of earnings retention appears consistent with the bank holding company’s capital needs, asset quality and overall financial condition.
8
Among other things, the ability of banks and bank holding companies to pay dividends, and the contents of their respective dividend policies, could be impacted by a range of changes imposed by the Dodd-Frank Act, many of which will require implementing rules to become effective. See also Bank Regulation - Dividends for additional information.
Change in Control. Subject to certain exceptions, under the BHCA and the Change in Bank Control Act (“CBCA”), and the regulations promulgated thereunder, persons who intend to acquire direct or indirect control of a depository institution or a bank holding company are required to obtain the approval of the Federal Reserve Board prior to acquiring control. With respect to the Holding Companies, “control” is conclusively presumed to exist where an acquiring party directly or indirectly owns, controls or has the power to vote at least 25% of our voting securities. Under the Federal Reserve’s CBCA regulations, a rebuttable presumption of control would arise with respect to an acquisition where, after the transaction, the acquiring party owns, controls or has the power to vote at least 10% (but less than 25%) of our voting securities. In certain cases, a company may also be presumed to have control under the Bank Holding Company Act if it acquires 5 percent or more of any class of voting securities.
On September 22, 2008, the Federal Reserve issued a policy statement on minority equity investments in banks and bank holding companies, that permits investors to (1) acquire up to 33 percent of the total equity of a target bank or bank holding company, subject to certain conditions, including that the acquiring investor does not acquire 15 percent or more of any class of voting securities, and (2) designate at least one director, without triggering the various regulatory requirements associated with control.
Acquisitions. The BHCA provides that a bank holding company must obtain the prior approval of the Federal Reserve (i) for the acquisition of more than five percent of the voting stock in any bank or bank holding company, (ii) for the acquisition of substantially all the assets of any bank or bank holding company or (iii) in order to merge or consolidate with another bank holding company.
Regulatory Examination. Federal and state banking agencies require the Holding Companies and Southside Bank to prepare annual reports on financial condition and to conduct an annual audit of financial affairs in compliance with minimum standards and procedures. Southside Bank, and in some cases the Holding Companies and any nonbank affiliates, must undergo regular on-site examinations by the appropriate banking agency, which will examine for adherence to a range of legal and regulatory compliance responsibilities. A bank regulator conducting an examination has complete access to the books and records of the examined institution, and the results of the examination are confidential. The cost of examinations may be assessed against the examined organization as the agency deems necessary or appropriate. The FDIC has developed a method for insured depository institutions to provide supplemental disclosure of the estimated fair market value of assets and liabilities, to the extent feasible and practicable, in any balance sheet, financial statement, report of condition or any other report.
Enforcement Authority. The Federal Reserve has broad enforcement powers over bank holding companies and their nonbank subsidiaries, as well as “institution-affiliated parties,” including management, employees, agents, independent contractors and consultants, such as attorneys and accountants and others who participate in the conduct of the institution’s affairs, and has authority to prohibit activities that represent unsafe or unsound banking practices or constitute knowing or reckless violations of laws or regulations. These powers may be exercised through the issuance of cease and desist orders, civil money penalties or other actions. Civil money penalties can be as high as $1,000,000 for each day the activity continues and criminal penalties for some financial institution crimes may include imprisonment for 20 years. Regulators have flexibility to commence enforcement actions against institutions and institution-affiliated parties, and the FDIC has the authority to terminate deposit insurance. When issued by a banking agency, cease-and-desist and similar orders may, among other things, require affirmative action to correct any harm resulting from a violation or practice, including restitution, reimbursement, indemnifications or guarantees against loss. A financial institution may also be ordered to restrict its growth, dispose of certain assets, rescind agreements or contracts, or take other actions determined to be appropriate by the ordering agency. The federal banking agencies also may remove a director or officer from an insured depository institution (or bar them from the industry) if a violation is willful or reckless.
Bank Regulation
Southside Bank is a Texas-chartered commercial bank, the deposits of which are insured up to the applicable limits by the DIF of the FDIC. It is not a member of the Federal Reserve System. The Bank is subject to extensive regulation, examination and supervision by the TDB, as its chartering authority, and by
9
the FDIC, as its primary federal regulator and deposit insurer. The federal and state laws applicable to banks regulate, among other things, the scope of their business and investments, lending and deposit-taking activities, borrowings, maintenance of retained earnings and reserve accounts, distribution of earnings and payment of dividends.
Permitted Activities and Investments. Under the Federal Deposit Insurance Act (“FDIA”), the activities and investments of state nonmember banks are generally limited to those permissible for national banks, notwithstanding state law. With FDIC approval, a state nonmember bank may engage in activities not permissible for a national bank if the FDIC determines that the activity does not pose a significant risk to the DIF and that the bank meets its minimum capital requirements. Similarly, under Texas law, a state bank may engage in those activities permissible for national banks domiciled in Texas. The TDB may permit a Texas state bank to engage in additional activities so long as the performance of the activity by the bank would not adversely affect the safety and soundness of the bank.
Brokered Deposits. Southside Bank also may be restricted in its ability to accept, renew or roll over brokered deposits, depending on its capital classification. Only “well capitalized” banks are permitted to accept, renew or roll over brokered deposits. The FDIC may, on a case-by-case basis, permit banks that are adequately capitalized to accept brokered deposits if the FDIC determines that acceptance of such deposits would not constitute an unsafe or unsound banking practice with respect to the bank. Undercapitalized banks generally may not accept, renew or roll over brokered deposits.
Loans to One Borrower. Under Texas law, without the approval of the TDB and subject to certain limited exceptions, the maximum aggregate amount of loans that Southside Bank is permitted to make to any one borrower is 25% of Tier 1 capital.
Insider Loans. Under Regulation O of the Federal Reserve, as made applicable to state nonmember banks by section 18(j)(2) of the FDIA, Southside Bank is subject to quantitative restrictions on extensions of credit to its executive officers and directors, the executive officers and directors of the Holding Companies, any owner of 10% or more of its stock or the stock of Southside Bancshares, Inc., and certain entities affiliated with any such persons. In general, any such extensions of credit must (i) not exceed certain dollar limitations, (ii) be made on substantially the same terms, including interest rates and collateral, as those prevailing at the time for comparable transactions with third parties and (iii) not involve more than the normal risk of repayment or present other unfavorable features. Additional restrictions are imposed on extensions of credit to executive officers. Certain extensions of credit also require the approval of a bank’s board of directors.
Deposit Insurance. The deposits of Southside Bank are insured by the DIF of the FDIC, up to the applicable limits established by law and are subject to the deposit insurance premium assessments of the DIF. In February 2009, the FDIC adopted a long-term DIF restoration plan, as well as an additional emergency assessment for 2009. The restoration plan increases base assessment rates for banks in all risk categories with the goal of raising the DIF reserve ratio from 0.40% to 1.15% within seven years. Banks in the best risk category paid initial base rates ranging from 12 to 16 basis points of assessable deposits beginning April 1, 2009 partially up from the initial base rate range of 12 to 14 basis points. Additionally, the FDIC adopted a final rule imposing a special emergency assessment to all financial institutions of 5 basis points of insured deposits as of June 30, 2009. Our special emergency assessment totaled $1.3 million and was collected on September 30, 2009. Currently, initial base rate assessments for all FDIC-insured institutions range from 12 to 45 basis points, with assessment rates of 12 to 16 basis points for banks in the best risk category.
In November 2009, the FDIC issued a rule that required all insured depository institutions, with limited exceptions, to prepay their estimated quarterly risk-based assessments for the fourth quarter of 2009 and for all of 2010, 2011 and 2012. In December 2009, we paid $9.9 million in prepaid risk-based assessments, which included $625,000 related to the fourth quarter of 2009 that would have otherwise been payable in the first quarter of 2010 and was included in deposit insurance expense for 2009. The remaining $9.3 million in prepaid deposit insurance was included in other assets in the accompanying consolidated balance sheet as of December 31, 2009. As of December 31, 2010, $6.7 million remained of the prepaid deposit insurance.
In addition, all FDIC-insured institutions are required to pay a pro rata portion of the interest due on bonds issued by the Financing Corporation (“FICO”) to fund the closing and disposal of failed thrift
10
institutions by the Resolution Trust Corporation. FICO assessments are set quarterly, and in 2009 ranged from 114 basis points in the first quarter to 102 basis points in the fourth quarter. These assessments will continue until the FICO bonds mature in 2017 through 2019.
Effective November 21, 2008 and until December 31, 2009, the FDIC expanded deposit insurance limits for certain accounts under the FDIC’s Temporary Liquidity Guarantee Program. Provided an institution has not opted out of the Temporary Liquidity Guarantee Program, the FDIC will fully guarantee funds deposited in noninterest bearing transaction accounts, including (i) interest on Lawyer Trust Accounts or IOLTA accounts, and (ii) negotiable order of withdrawal or NOW accounts with rates no higher than 0.50% if the institution has committed to maintain the interest rate at or below that rate. In conjunction with the increased deposit insurance coverage, insurance assessments also increased. In addition, the Dodd-Frank Act provides temporary, unlimited deposit insurance for all noninterest-bearing transaction accounts. In January 2011, the FDIC issued final rules implementing this provision of the Dodd-Frank Act by including IOLTAs within the definition of a noninterest-bearing transaction account. Per the FDIC’s final rules, all funds held in IOLTA accounts, together with all other noninterest-bearing transaction account deposits, are fully insured, without limit, from December 31, 2010, through December 31, 2012. Southside Bank has not opted out of the Temporary Liquidity Guarantee Program. In May 2009, the FDIC deposit insurance limits provision which was set to expire on December 31, 2009 was extended until December 31, 2013 under the Helping Families Save Their Homes Act of 2009.
The Dodd-Frank Act directs the FDIC to amend its regulations to re-define the method of calculation of an insured depository institution’s insurance fund assessment, changing the calculation from being based on domestic deposits to one that is based on asset size. Specifically, the Dodd-Frank Act requires the assessment base to be an amount equal to the average consolidated total assets of the insured depository institution during the assessment period, minus the sum of the average tangible equity of the insured depository institution during the assessment period and an amount the FDIC determines is necessary to establish assessments consistent with the risk-based assessment system found in the Federal Deposit Insurance Act. The FDIC has issued final rules outlining this new insurance assessment methodology, which will impact the amount of Southside Bank’s insurance assessment as these new standards become effective.
Capital Adequacy. See Holding Company Regulation – Capital Adequacy.
Prompt Corrective Action. The Federal Deposit Insurance Improvement Act of 1991 (“FDICIA”), among other things, identifies five capital categories for insured depository institutions (well-capitalized, adequately capitalized, undercapitalized, significantly undercapitalized and critically undercapitalized). FDICIA requires the federal banking agencies, including the FDIC, to implement systems for “prompt corrective action” for insured depository institutions that do not meet minimum capital requirements within these categories. Under such systems, federal banking regulators are required to rate insured depository institutions on the basis of the five capital categories described. The FDICIA imposes progressively more restrictive restraints on operations, management and capital distributions, as the classification of a bank or thrift deteriorates. Failure to meet the capital guidelines could also subject a depository institution to capital raising requirements. An “undercapitalized” bank must develop a capital restoration plan and its parent holding company must guarantee the bank’s compliance with the plan. The liability of the parent holding company under any such guarantee is limited to the lesser of 5% of the bank’s assets at the time it became “undercapitalized” or the amount needed to comply with the plan. Furthermore, in the event of the bankruptcy of the parent holding company, such guarantee would take priority over the parent’s general unsecured creditors. The Bank currently meets the criteria for “well-capitalized.”
Within the “prompt corrective action” regulations, the federal banking agencies also have established procedures for “downgrading” an institution to a lower capital category based on supervisory factors other than capital. Specifically, a federal banking agency may, after notice and an opportunity for a hearing, reclassify a well-capitalized institution as adequately capitalized and may require an adequately capitalized institution or an undercapitalized institution to comply with supervisory actions as if it were in the next lower category if the institution is operating in an unsafe or unsound condition or the institution has received and not corrected a less-than-satisfactory rating for any of the categories of asset quality, management, earnings or liquidity in its most recent examination. The FDIC may not, however, reclassify a significantly undercapitalized institution as critically undercapitalized.
11
In addition to the “prompt corrective action” directives, failure to meet capital guidelines may subject a banking organization to a variety of other enforcement remedies, including additional substantial restrictions on its operations and activities, termination of deposit insurance by the FDIC and, under certain conditions, the appointment of a conservator or receiver.
Standards for Safety and Soundness. The FDIA also requires the federal banking regulatory agencies to prescribe, by regulation or guideline, operational and managerial standards for all insured depository institutions relating to: (i) internal controls; (ii) information systems and internal audit systems; (iii) loan documentation; (iv) credit underwriting; (v) interest rate risk exposure; and (vi) asset quality. The agencies also must prescribe standards for asset quality, earnings, and stock valuation, as well as standards for compensation, fees and benefits. The federal banking agencies have adopted regulations and Interagency Guidelines Prescribing Standards for Safety and Soundness (“Guidelines”) to implement these required standards. The Guidelines set forth the safety and soundness standards that the federal banking agencies use to identify and address problems at insured depository institutions before capital becomes impaired. Under the regulations, if the FDIC determines that Southside Bank fails to meet any standards prescribed by the Guidelines, it may require Southside Bank to submit an acceptable plan to achieve compliance, consistent with deadlines for the submission and review of such safety and soundness compliance plans.
Dividends. All dividends paid by Southside Bank are paid to the Company, as the sole indirect shareholder of Southside Bank, through Southside Delaware Financial Corporation. The ability of Southside Bank, as a Texas state bank, to pay dividends is restricted under federal and state law and regulations. As an initial matter, the FDICIA and the regulations of the FDIC generally prohibit an insured depository institution from making a capital distribution (including payment of dividend) if, thereafter, the institution would not be at least adequately capitalized. Under Texas law, Southside Bank generally may not pay a dividend reducing its capital and surplus without the prior approval of the Texas Banking Commissioner. All dividends must be paid out of net profits then on hand, after deducting expenses, including losses and provisions for loan losses.
Southside Bank’s general dividend policy is to pay dividends at levels consistent with maintaining liquidity and preserving applicable capital ratios and servicing obligations. Southside Bank’s dividend policies are subject to the discretion of its board of directors and will depend upon such factors as future earnings, financial conditions, cash needs, capital adequacy, compliance with applicable statutory and regulatory requirements and general business conditions. The exact amount of future dividends paid by Southside Bank will be a function of its general profitability (which cannot be accurately estimated or assured), applicable tax rates in effect from year to year and the discretion of its board of directors.
As described above under Holding Company Regulation - Dividends, the ability of banks and bank holding companies to pay dividends, and the contents of their respective dividend policies, could be impacted by a range of changes imposed by the Dodd-Frank Act, many of which will require implementing rules to become effective.
Transactions with Affiliates. Southside Bank is subject to sections 23A and 23B of the Federal Reserve Act (“FRA”) and the Federal Reserve’s Regulation W, as made applicable to state nonmember banks by section 18(j) of the FDIA. Sections 23A and 23B of the FRA restrict a bank’s ability to engage in certain transactions with its affiliates. An affiliate of a bank is any company or entity that controls, is controlled by or is under common control with the bank. In a holding company context, the parent bank holding company and any companies controlled by such parent holding company are generally affiliates of the bank.
Specifically, section 23A places limits on the amount of “covered transactions,” which include loans or extensions of credit to, and investments in or certain other transactions with, affiliates. It also limits the amount of any advances to third parties that are collateralized by the securities or obligations of affiliates. The aggregate of all covered transactions is limited to 10 percent of the bank’s capital and surplus for any one affiliate and 20 percent for all affiliates. Additionally, within the foregoing limitations, each covered transaction must meet specified collateral requirements ranging from 100 to 130 percent of the loan amount, depending on the type of collateral. Further, banks are prohibited from purchasing low quality assets from an affiliate.
12
Section 23B, among other things, prohibits a bank from engaging in certain transactions with affiliates unless the transactions are on terms substantially the same, or at least as favorable to the bank, as those prevailing at the time for comparable transactions with nonaffiliated companies. Except for limitations on low quality asset purchases and transactions that are deemed to be unsafe or unsound, Regulation W generally excludes affiliated depository institutions from treatment as affiliates.
Anti-Tying Regulations. Under the BHCA and Federal Reserve’s regulations, a bank is prohibited from engaging in certain tying or reciprocity arrangements with its customers. In general, a bank may not extend credit, lease, sell property, or furnish any services or fix or vary the consideration for these products or services on the condition that either: (i) the customer obtain or provide some additional credit, property, or services from or to the bank, the bank holding company or subsidiaries thereof or (ii) the customer not obtain credit, property, or service from a competitor, except to the extent reasonable conditions are imposed to assure the soundness of the credit extended. A bank may, however, offer combined-balance products and may otherwise offer more favorable terms if a customer obtains two or more traditional bank products. Also, certain foreign transactions are exempt from the general rule.
Community Reinvestment Act. Under the Community Reinvestment Act (“CRA”), Southside Bank has a continuing and affirmative obligation, consistent with safe and sound banking practices, to help meet the needs of our entire community, including low- and moderate-income neighborhoods. The CRA does not establish specific lending requirements or programs for banks nor does it limit a bank’s discretion to develop the types of products and services that it believes are best suited to its particular community.
On a periodic basis, the FDIC is charged with preparing a written evaluation of our record of meeting the credit needs of the entire community and assigning a rating - outstanding, satisfactory, needs to improve or substantial noncompliance. Banks are rated based on their actual performance in meeting community credit needs. The FDIC will take that rating into account in its evaluation of any application made by the bank for, among other things, approval of the acquisition or establishment of a branch or other deposit facility, an office relocation, a merger or the acquisition of shares of capital stock of another financial institution. A bank’s CRA rating may be used as the basis to deny or condition an application. In addition, as discussed above, a bank holding company may not become a financial holding company unless each of its subsidiary banks has a CRA rating of at least “Satisfactory.” Southside Bank was last examined for compliance with the CRA and received a rating of “Outstanding” on April 26, 2010.
Branch Banking. Pursuant to the Texas Finance Code, all banks located in Texas are authorized to branch statewide. Accordingly, a bank located anywhere in Texas has the ability, subject to regulatory approval, to establish branch facilities near any of our facilities and within our market area. If other banks were to establish branch facilities near our facilities, it is uncertain whether these branch facilities would have a material adverse effect on our business.
The Dodd-Frank Act substantially amended the legal framework that had previously governed interstate branching activities. Formerly, under the Riegle-Neal Interstate Banking and Branching Efficiency Act of 1994, a bank’s ability to branch into a particular state was largely dependent upon whether the state “opted in” to de novo interstate branching. Many states did not “opt-in,” which resulted in branching restrictions in those states. The Dodd-Frank Act removed the “opt-in” concept and permits banks to engage in de novo branching outside of their home states, provided that the laws of the target state permit banks chartered in that state to branch within that state. Accordingly, de novo interstate branching by Southside Bank is subject to these new standards. All branching in which Southside Bank may engage remains subject to regulatory approval and adherence to applicable legal and regulatory requirements.
Consumer Protection Regulation. The activities of Southside Bank are subject to a variety of statutes and regulations designed to protect consumers. Interest and other charges collected or contracted for by the banks are subject to state usury laws and federal laws concerning interest rates. Loan operations are also subject to federal laws applicable to credit transactions, such as:
|
·
|
the federal Truth-In-Lending Act and Regulation Z issued by the Federal Reserve, governing disclosures of credit terms to consumer borrowers;
|
|
·
|
the Home Mortgage Disclosure Act and Regulation C issued by the Federal Reserve, requiring financial institutions to provide information to enable the public and public officials to determine whether a financial institution is fulfilling its obligation to help meet the housing
|
13
needs of the community it serves;
|
·
|
the Equal Credit Opportunity Act and Regulation B issued by the Federal Reserve, prohibiting discrimination on the basis of race, creed or other prohibited factors in extending credit;
|
|
·
|
the Fair Credit Reporting Act and Regulation V issued by the Federal Reserve, governing the use and provision of information to consumer reporting agencies;
|
|
·
|
the Fair Debt Collection Act, governing the manner in which consumer debts may be collected by collection agencies; and
|
|
·
|
the guidance of the various federal agencies charged with the responsibility of implementing such federal laws.
|
Deposit operations also are subject to:
|
·
|
the Truth in Savings Act and Regulation DD issued by the Federal Reserve, governing disclosure of deposit account terms to consumers;
|
|
·
|
the Right to Financial Privacy Act, which imposes a duty to maintain confidentiality of consumer financial records and prescribes procedures for complying with administrative subpoenas of financial records; and
|
|
·
|
the Electronic Funds Transfer Act and Regulation E issued by the Federal Reserve, which governs automatic deposits to and withdrawals from deposit accounts and customers’ rights and liabilities arising from the use of automated teller machines and other electronic banking services.
|
Many of the foregoing laws and regulations are subject to change resulting from the provisions in the Dodd-Frank Act and other developments, which in many cases call for revisions to implementing regulations. In addition, oversight responsibilities of these and other consumer protection laws and regulations will, in large measure, transfer from the bank’s primary regulator to the Bureau of Consumer Financial Protection. We cannot predict the effect that being regulated by a new, additional regulatory authority focused on consumer financial protection, or any new implementing regulations or revisions to existing regulations that may result from the establishment of this new authority, will have on our businesses. Additional regulations resulting from the Dodd-Frank Act may materially adversely affect our business, financial condition or results of operations. In addition, Southside Bank also may be subject to certain state laws and regulations designed to protect consumers.
Commercial Real Estate Lending. Lending operations that involve concentration of commercial real estate loans are subject to enhanced scrutiny by federal banking regulators. The regulators have issued guidance with respect to the risks posed by commercial real estate lending concentrations. Real estate loans generally include land development, construction loans, land and lot loans to individuals, loans secured by multi-family property and nonfarm nonresidential real property where the primary source of repayment is derived from rental income associated with the property. The guidance prescribes the following guidelines for examiners to help identify institutions that are potentially exposed to concentration risk and may warrant greater supervisory scrutiny:
|
·
|
total reported loans for construction, land development and other land represent 100 percent or more of the institution’s total capital, or
|
|
·
|
total commercial real estate loans represent 300 percent or more of the institution’s total capital and the outstanding balance of the institution’s commercial real estate loan portfolio has increased by 50 percent or more during the prior 36 months.
|
In October 2009, the federal banking agencies issued additional guidance on real estate lending that emphasizes these considerations.
Anti-Money Laundering. Southside Bank is subject to the regulations of the Financial Crimes Enforcement Network (“FinCEN”), which implement the Bank Secrecy Act, as amended by the Uniting and
14
Strengthening America by Providing Appropriate Tools Required to Intercept and Obstruct Terrorism Act of 2001, or the “USA Patriot Act.” The USA Patriot Act gives the federal government the power to address terrorist threats through enhanced domestic security measures, expanded surveillance powers, increased information sharing, and broadened anti-money laundering requirements. Title III of the USA Patriot Act includes measures intended to encourage information sharing among banks, regulatory agencies and law enforcement bodies. Further, certain provisions of Title III impose affirmative obligations on a broad range of financial institutions, including state-chartered banks like Southside Bank.
The USA Patriot Act and the related FinCEN regulations impose certain requirements with respect to financial institutions, including the following:
|
·
|
establishment of anti-money laundering programs, including adoption of written procedures and an ongoing employee training program, designation of a compliance officer and auditing of the program;
|
|
·
|
establishment of a program specifying procedures for obtaining information from customers seeking to open new accounts, including verifying the identity of customers within a reasonable period of time;
|
|
·
|
establishment of enhanced due diligence policies, procedures and controls designed to detect and report money laundering, and for financial institutions that administer, maintain or manage private bank accounts or correspondent accounts for non-U.S. persons;
|
|
·
|
prohibitions on correspondent accounts for foreign shell banks and compliance with recordkeeping obligations with respect to correspondent accounts of foreign banks;
|
|
·
|
filing of suspicious activities reports if a bank believes a customer may be violating U.S. laws and regulations; and
|
|
·
|
requirements that bank regulators consider bank holding company or bank compliance in connection with merger or acquisition transactions.
|
Bank regulators routinely examine institutions for compliance with these obligations and have been active in imposing “cease and desist” and other regulatory orders and money penalty sanctions against institutions found to be violating these obligations.
The Federal Bureau of Investigation can send bank regulatory agencies lists of the names of persons suspected of involvement in terrorist activities. Southside Bank can be requested to search its records for any relationships or transactions with persons on those lists and required to report any identified relationships or transactions.
OFAC. The Office of Foreign Assets Control (“OFAC”) is responsible for helping to insure that U.S. entities do not engage in transactions with certain prohibited parties, as defined by various Executive Orders and Acts of Congress. OFAC publishes, and routinely updates, lists of names of persons and organizations suspected of aiding, harboring or engaging in terrorist acts, including the Specially Designated Nationals and Blocked Persons. If we find a name on any transaction, account or wire transfer that is on an OFAC list, we must undertake certain specified activities, which could include blocking or freezing the account or transaction requested, and we must notify the appropriate authorities.
Privacy and Data Security. Under federal law, financial institutions are generally prohibited from disclosing consumer information to non-affiliated third parties unless the consumer has been given the opportunity to object and has not objected to such disclosure. Financial institutions are further required to disclose their privacy policies to consumers annually. To the extent state laws are more protective of consumer privacy, financial institutions must comply with state law privacy provisions.
In addition, federal and state banking agencies have prescribed standards for maintaining the security and confidentiality of consumer information. Southside Bank is subject to such standards, as well as standards for notifying consumers in the event of a security breach. Under federal law, Southside Bank must disclose its privacy policy for collecting and protecting confidential customer information to consumers, permit consumers to “opt out” of having non-public customer information disclosed to non-affiliated third
15
parties, with some exceptions, and allow customers to opt out of receiving marketing solicitations based on information about the customer received from another subsidiary. States may adopt more extensive privacy protections. Southside Bank is similarly required to have an information security program to safeguard the confidentiality and security of customer information and to ensure proper disposal. Customers must be notified when unauthorized disclosure involves sensitive customer information that may be misused.
Regulatory Examination. See Holding Company Regulation.
Enforcement Authority. Southside Bank and its “institution-affiliated parties,” including management, employees, agents, independent contractors and consultants, such as attorneys and accountants and others who participate in the conduct of the institution’s affairs, are subject to potential civil and criminal penalties for violations of law, regulations or written orders of a government agency. Violations can include failure to timely file required reports, filing false or misleading information or submitting inaccurate reports. Civil penalties may be as high as $1,000,000 a day for such violations, and criminal penalties for some financial institution crimes may include imprisonment for 20 years. Regulators have flexibility to commence enforcement actions against institutions and institution-affiliated parties, and the FDIC has the authority to terminate deposit insurance. When issued by a banking agency, cease-and-desist orders may, among other things, require affirmative action to correct any harm resulting from a violation or practice, including restitution, reimbursement, indemnifications or guarantees against loss. A financial institution may also be ordered to restrict its growth, dispose of certain assets, rescind agreements or contracts, or take other actions determined to be appropriate by the ordering agency. The federal banking agencies also may remove a director or officer from an insured depository institution (or bar them from the industry) if a violation is willful or reckless.
Governmental Monetary Policies. The commercial banking business is affected not only by general economic conditions but also by the monetary policies of the Federal Reserve. Changes in the discount rate on member bank borrowings, control of borrowings, open market operations, the imposition of and changes in reserve requirements against member banks, deposits and assets of foreign branches, the imposition of and changes in reserve requirements against certain borrowings by banks and their affiliates and the placing of limits on interest rates which member banks may pay on time and savings deposits are some of the instruments of monetary policy available to the Federal Reserve. These monetary policies influence to a significant extent the overall growth of all bank loans, investments and deposits and the interest rates charged on loans or paid on time and savings deposits. Recently, in response to the financial crisis, the Federal Reserve has established several innovative programs to stabilize certain financial institutions and to ensure the availability of credit. The nature of future monetary policies and the effect of such policies on Southside Bank’s future business and earnings, therefore, cannot be predicted accurately.
Capital Purchase Program. Under Title I of the Emergency Economic Stabilization Act (“EESA”) enacted in October 2008, as amended by the America Recovery and Reinvestment Act (“ARRA”) in February 2009, the U.S. Treasury Department (“Treasury”) established the Troubled Asset Relief Program (“TARP”), which includes the Capital Purchase Program (“CPP”). Under the CPP, the Treasury, upon application by a bank holding company and approval by the Federal Reserve Board and the primary federal regulator of the subsidiary bank or banks, purchased senior preferred stock from the company. Because of our sound financial condition and the conditions that are or may be imposed on use of the CPP funds or on the institutions that received CPP funds, we chose not to apply for such funds.
Evolving Legislation and Regulatory Action. Proposals for new statutes and regulations are frequently circulated at both the federal and state levels, and may include wide-ranging changes to the structures, regulations and competitive relationships of financial institutions. We cannot predict whether new legislation or regulations will be enacted and, if enacted, the effect that it, or any regulations, would have on our business, financial condition or results of operations.
ITEM 1A. RISK FACTORS
An investment in our common stock is subject to risks inherent to our business. The material risks and uncertainties that management believes affect us are described below. Before making an investment decision, you should carefully consider the risks and uncertainties described below together with all of the other information included or incorporated by reference in this report. The risks and uncertainties described below are not the only ones facing us. Additional risks and uncertainties that management is not aware of
16
or focused on or that management currently deems immaterial may also impair our business operations. This report is qualified in its entirety by these risk factors.
If any of the following risks actually occur, our financial condition and results of operations could be materially and adversely affected. If this were to happen, the value of our common stock could decline significantly, and you could lose all or part of your investment.
RISKS RELATED TO OUR BUSINESS
We are subject to an economic environment that continues to pose significant challenges for us and could adversely affect our financial condition and results of operations.
We continue to operate in a challenging and uncertain economic environment. Financial institutions continue to be affected by declines in the real estate market and constrained financial markets. We retain direct exposure to the residential and commercial real estate markets, and we could be affected by these events. Continued declines in real estate values, home sales volumes and financial stress on borrowers as a result of the uncertain economic environment, including unemployment and new job losses, could have an adverse effect on our borrowers or their customers, which could adversely affect our financial condition and results of operations. In addition, the effects of the national economic recession and any residual deterioration in local economic conditions in our markets could drive losses beyond those which are provided for in our allowance for loan losses and result in the following consequences:
|
·
|
increases in loan delinquencies;
|
|
·
|
increases in nonperforming assets and foreclosures;
|
|
·
|
decreases in demand for our products and services, which could adversely affect our liquidity position;
|
|
·
|
decreases in the value of the collateral securing our loans, especially real estate, which could reduce customers’ borrowing power;
|
|
|
|
·
|
decreases in the credit quality of our non U.S. Government and non U.S. agency investment securities, especially our trust preferred, corporate and municipal securities;
|
|
·
|
an adverse or unfavorable resolution of the Fannie Mae or Freddie Mac receivership; and
|
|
·
|
decreases in the real estate values subject to ad-valorem taxes by municipalities that impact such municipalities ability to repay their debt, which could adversely affect our municipal loans or debt securities.
|
Any of the foregoing could adversely affect our financial condition and results of operation.
We continue to face market volatility, which could adversely impact our results of operations and access to capital.
The capital and credit markets have been experiencing volatility and disruption for more than two years. While volatility in, and disruption of, these markets no longer remain at unprecedented levels, in some cases, the markets have produced downward pressure on stock prices and credit capacity without regard to an issuer’s underlying financial strength. If current levels of market disruption and volatility continue or worsen, there can be no assurance that we will not experience adverse effects, which may be material, on our ability to access capital and on our results of operations and financial condition, including our liquidity position.
Current market developments may adversely affect our industry, business and results of operations.
Dramatic declines in the housing market during the past few years, with falling home prices and increasing foreclosures and unemployment, have resulted in significant write-downs of asset values by financial institutions, including government-sponsored entities and major commercial and investment banks. These write-downs, initially of mortgage-backed securities but spreading to credit default swaps
17
and other derivative securities, have caused many financial institutions to seek additional capital, to merge with larger and stronger institutions and, in some cases, to fail. Reflecting concern about the stability of the financial markets generally and the strength of counterparties, many lenders and institutional investors have reduced, and in some cases, ceased to provide funding to borrowers including other financial institutions. The resulting lack of available credit, lack of confidence in the financial sector, increased volatility in the financial markets and reduced business activity could materially and adversely affect our business, financial condition and results of operations.
Emergency measures designed to stabilize the U.S. financial system are beginning to wind down.
Since 2008, various legislative and regulatory actions have been implemented in response to the financial crises affecting the banking system and financial markets and to the recession. Many of these programs are beginning to expire. The wind-down of these programs may have a direct adverse effect on us or a broader adverse impact on the financial sector. TARP was established pursuant to EESA, as amended by ARRA, whereby the Treasury has the authority to, among other things, spend up to $700 billion to purchase equity in financial institutions, purchase mortgages, mortgage-backed securities and certain other financial instruments from financial institutions for the purpose of stabilizing and providing liquidity to the U.S. financial markets. Though TARP was scheduled to expire on December 31, 2009, Treasury extended TARP until October 3, 2010, in order to retain an adequate financial stability reserve if financial conditions worsen and threaten the economy. On October 21, 2009, the FDIC voted to end the Debt Guarantee Program portion of the Temporary Liquidity Guarantee Program, which guarantees certain “newly-issued unsecured debt” of banks and certain holding companies. The Debt Guarantee Program expired on October 31, 2009, with the guarantee period on such debt expiring on December 30, 2012. The Transaction Account Guarantee portion of the program, which guarantees non-interest bearing bank transaction accounts on an unlimited basis was extended until December 31, 2010 and recent amendments to the Federal Deposit Insurance Act provide full deposit insurance coverage for noninterest-bearing transaction accounts and Interest on Lawyer Trust Accounts or IOLTAs beginning December 31, 2010, for a two-year period.
We cannot predict the effect that the wind-down of these various governmental programs will have on current financial market conditions, or on our business, financial condition, results of operations, access to credit and the trading price of our common stock.
We are subject to interest rate risk.
Our earnings and cash flows are largely dependent upon our net interest income. Net interest income is the difference between interest income earned on interest earning assets such as loans and securities and interest expense paid on interest bearing liabilities such as deposits and borrowed funds. Interest rates are highly sensitive to many factors that are beyond our control, including general economic conditions and policies of various governmental and regulatory agencies and, in particular, the Board of Governors of the Federal Reserve System. Changes in monetary policy, changes in interest rates, changes in the yield curve, changes in market risk spreads, or a prolonged inverted yield curve could influence not only the interest we receive on loans and securities and the amount of interest we pay on deposits and borrowings, but such changes could also affect:
|
·
|
our ability to originate loans and obtain deposits;
|
|
·
|
our ability to retain deposits in a rising rate environment;
|
|
·
|
net interest rate spreads and net interest rate margins;
|
|
·
|
our ability to enter into instruments to hedge against interest rate risk;
|
|
·
|
the fair value of our financial assets and liabilities; and
|
|
·
|
the average duration of our loan and mortgage-backed securities portfolio.
|
If the interest rates paid on deposits and other borrowings increase at a faster rate than the interest rates received on loans and other investments, our net interest income, and therefore earnings, could be
18
adversely affected. Earnings could also be adversely affected if the interest rates received on loans and other investments fall more quickly than the interest rates paid on deposits and other borrowings.
Any substantial, unexpected or prolonged change in market interest rates could have a material adverse effect on our financial condition and results of operations. See the section captioned “Net Interest Income” in “Item 7. Management’s Discussion and Analysis of Financial Condition and Results of Operations” for further discussion related to our management of interest rate risk.
We are subject to credit quality risks and our credit policies may not be sufficient to avoid losses.
We are subject to the risk of losses resulting from the failure of borrowers, guarantors and related parties to pay interest and principal amounts on their loans. Although we maintain credit policies and credit underwriting and monitoring and collection procedures, these policies and procedures may not prevent losses, particularly during periods in which the local, regional or national economy suffers a general decline. If borrowers fail to repay their loans, our financial condition and results of operations would be adversely affected.
Our interest rate risk, liquidity, market value of securities and profitability are subject to risks associated with the successful management of our balance sheet strategy.
We implemented a balance sheet strategy in 1998 for the purpose of enhancing overall profitability by maximizing the use of our capital. The effectiveness of our balance sheet strategy, and therefore our profitability, may be adversely affected by a number of factors, including reduced net interest margin and spread, adverse market value changes to the investment securities and U.S. agency mortgage-backed and related securities, adverse changes in the market liquidity of our investment securities and U.S. agency mortgage-backed and related securities, incorrect modeling results due to the unpredictable nature of mortgage-backed securities prepayments, the length of interest rate cycles and the slope of the interest rate yield curve. In addition, we may not be able to obtain wholesale funding to profitably and properly fund the balance sheet strategy. If our balance sheet strategy is flawed or poorly implemented, we may incur significant losses. See the section captioned “Balance Sheet Strategy” in “Item 7. Management’s Discussion and Analysis of Financial Condition and Results of Operations.”
We have a high concentration of loans secured by real estate and a further decline in the real estate market, for any reason, could result in losses and materially and adversely affect our business, financial condition, results of operations and future prospects.
A significant portion of our loan portfolio is dependent on real estate. In addition to the financial strength and cash flow characteristics of the borrower in each case, often loans are secured with real estate collateral. At December 31, 2010, approximately 49.6% of our loans have real estate as a primary or secondary component of collateral. The real estate in each case provides an alternate source of repayment in the event of default by the borrower and may deteriorate in value during the time the credit is extended. Beginning in the third quarter of 2007 and continuing throughout 2008, 2009 and 2010, there were well-publicized developments in the credit markets, beginning with a decline in the sub-prime mortgage lending market, which later extended to the markets for collateralized mortgage obligations, mortgage-backed securities and the lending markets generally. This decline has continued to result in restrictions in the resale markets for non-conforming loans and has had an adverse effect on retail mortgage lending operations in many markets. A further decline in the credit markets generally could adversely affect our financial condition and results of operations if we are unable to extend credit or sell loans in the secondary market. An adverse change in the economy affecting values of real estate generally or in our primary markets specifically could significantly impair the value of collateral and our ability to sell the collateral upon foreclosure. Furthermore, it is likely that, in a declining real estate market, we would be required to further increase our allowance for loan losses. If we are required to liquidate the collateral securing a loan to satisfy the debt during a period of reduced real estate values or to increase our allowance for loan losses, our profitability and financial condition could be adversely impacted.
We have a high concentration of loans directly related to the medical community in our market area, primarily in Smith and Gregg counties. A negative change adversely impacting the medical community, for any reason, could result in losses and materially and adversely affect our business, financial condition, results of operations and future prospects.
19
A significant portion of our loan portfolio is dependent on the medical community. The primary source of repayment for loans in the medical community is cash flow from continuing operations. However, changes in the amount the government pays the medical community through the various government health insurance programs could adversely impact the medical community, which in turn could result in higher default rates by borrowers in the medical industry. Healthcare reform or increased regulation of the medical community could also negatively impact profitability and cash flow in the medical community. It is likely that, should there be any significant adverse impact to the medical community, our profitability and financial condition would also be adversely impacted.
Our allowance for probable loan losses may be insufficient.
We maintain an allowance for probable loan losses, which is a reserve established through a provision for probable loan losses charged to expense. This allowance represents management’s best estimate of probable losses that may exist within the existing portfolio of loans. The allowance, in the judgment of management, is necessary to reserve for estimated loan losses and risks inherent in the loan portfolio. The level of the allowance reflects management’s continuing evaluation of industry concentrations; specific credit risks; loan loss experience; current loan portfolio quality; present economic, political and regulatory conditions; and unidentified losses inherent in the current loan portfolio. The determination of the appropriate level of the allowance for probable loan losses inherently involves a high degree of subjectivity and requires us to make significant estimates and assumptions regarding current credit risks and future trends, all of which may undergo material changes. Changes in economic conditions affecting the value of properties used as collateral for loans, problems affecting the credit of borrowers, new information regarding existing loans, identification of additional problem loans and other factors, both within and outside our control, may require an increase in the allowance for probable loan losses. In addition, bank regulatory agencies periodically review our allowance for loan losses and may require an increase in the provision for probable loan losses or the recognition of further loan charge-offs, based on judgments different than those of management. In addition, if charge-offs in future periods exceed the allowance for probable loan losses, we will need additional provisions to increase the allowance for probable loan losses. Any increases in the allowance for probable loan losses will result in a decrease in net income and, possibly, capital, and may have a material adverse effect on our financial condition and results of operations. See the section captioned “Loan Loss Experience and Allowance for Loan Losses” in “Item 7. Management’s Discussion and Analysis of Financial Condition and Results of Operations” for further discussion related to our process for determining the appropriate level of the allowance for probable loan losses.
We are subject to environmental liability risk associated with lending activities.
A significant portion of our loan portfolio is secured by real property. During the ordinary course of business, we may foreclose on and take title to properties securing certain loans. There is a risk that hazardous or toxic substances could be found on these properties. If hazardous or toxic substances are found, we may be liable for remediation costs, as well as for personal injury and property damage. Environmental laws may require us to incur substantial expenses and may materially reduce the affected property’s value or limit our ability to use or sell the affected property. In addition, future laws or more stringent interpretations or enforcement policies with respect to existing laws may increase our exposure to environmental liability. Although we have policies and procedures to perform an environmental review before initiating any foreclosure action on nonresidential real property, these reviews may not be sufficient to detect all potential environmental hazards. The remediation costs and any other financial liabilities associated with an environmental hazard could have a material adverse effect on our financial condition and results of operations.
Our profitability depends significantly on economic conditions in the State of Texas.
Our success depends primarily on the general economic conditions of the State of Texas and the specific local markets in which we operate. Unlike larger national or other regional banks that are more geographically diversified, we provide banking and financial services to customers primarily in the Texas areas of Tyler, Longview, Lindale, Whitehouse, Chandler, Gresham, Athens, Palestine, Jacksonville, Hawkins, Bullard, Forney, Seven Points, Gun Barrel City, Fort Worth, Austin and Arlington. The local economic conditions in these areas have a significant impact on the demand for our products and services, as well as the ability of our customers to repay loans, the value of the collateral securing loans and the stability of our deposit funding sources. A significant decline in general economic conditions, caused by inflation, recession, acts of terrorism, outbreak of hostilities or other international or domestic occurrences, unemployment, changes in securities markets or other factors could impact these local
20
economic conditions and, in turn, have a material adverse effect on our financial condition and results of operations.
We operate in a highly competitive industry and market area.
We face substantial competition in all areas of our operations from a variety of different competitors, many of which are larger and may have more financial resources. Such competitors primarily include national, regional, and community banks within the various markets we operate. Additionally, various out-of-state banks have entered or have announced plans to enter the market areas in which we currently operate. We also face competition from many other types of financial institutions, including, without limitation, savings and loans, credit unions, finance companies, brokerage firms, insurance companies, factoring companies and other financial intermediaries. The financial services industry could become even more competitive as a result of legislative, regulatory and technological changes, continued consolidation and recent trends in the credit and mortgage lending markets. Banks, securities firms and insurance companies can merge under the umbrella of a financial holding company, which can offer virtually any type of financial service, including banking, securities underwriting, insurance (both agency and underwriting) and merchant banking. Also, technology has lowered barriers to entry and made it possible for nonbanks to offer products and services traditionally provided by banks, such as automatic transfer and automatic payment systems. Many of our competitors have fewer regulatory constraints and may have lower cost structures. Additionally, due to their size, many competitors may be able to achieve economies of scale and, as a result, may offer a broader range of products and services as well as better pricing for those products and services than we can.
Our ability to compete successfully depends on a number of factors, including, among other things:
|
·
|
the ability to develop, maintain and build upon long-term customer relationships based on top quality service, high ethical standards and safe, sound assets;
|
|
·
|
the ability to expand our market position;
|
|
·
|
the scope, relevance and pricing of products and services offered to meet customer needs and demands;
|
|
·
|
the rate at which we introduce new products and services relative to our competitors;
|
|
·
|
customer satisfaction with our level of service; and
|
|
·
|
industry and general economic trends.
|
Failure to perform in any of these areas could significantly weaken our competitive position, which could adversely affect our growth and profitability, which, in turn, could have a material adverse effect on our financial condition and results of operations.
New lines of business or new products and services may subject us to additional risks.
From time to time, we may implement new delivery systems, such as internet banking, or offer new products and services within existing lines of business. In developing and marketing new delivery systems and/or new products and services, we may invest significant time and resources. Initial timetables for the introduction and development of new lines of business and/or new products or services may not be achieved and price and profitability targets may not prove feasible. External factors, such as compliance with regulations, competitive alternatives, and shifting market preferences, may also impact the successful implementation of a new line of business or a new product or service. Furthermore, any new line of business and/or new product or service could have a significant impact on the effectiveness of our system of internal controls. Failure to successfully manage these risks in the development and implementation of new lines of business or new products or services could have a material adverse effect on our business, results of operations and financial condition.
We rely on dividends from our subsidiaries for most of our revenue.
Southside Bancshares, Inc. is a separate and distinct legal entity from our subsidiaries. We receive substantially all of our revenue from dividends from our subsidiaries. These dividends are the principal
21
source of funds to pay dividends on our common stock and interest and principal on our debt. Various federal and/or state laws and regulations limit the amount of dividends that Southside Bank, and certain nonbank subsidiaries may pay to Southside Bancshares, Inc. Also, Southside Bancshares, Inc.’s right to participate in a distribution of assets upon a subsidiary’s liquidation or reorganization is subject to the prior claims of the subsidiary’s creditors. In the event Southside Bank is unable to pay dividends to Southside Bancshares, Inc., Southside Bancshares, Inc. may not be able to service debt, pay obligations or pay dividends on common stock. The inability to receive dividends from Southside Bank could have a material adverse effect on Southside Bancshares, Inc.’s business, financial condition and results of operations. See the section captioned “Supervision and Regulation” in “Item 1. Business” and “Note 14 – Shareholders’ Equity” to our consolidated financial statements included in this report.
Funding to provide liquidity may not be available to us on favorable terms or at all.
Liquidity is the ability to meet cash flow needs on a timely basis at a reasonable cost. The liquidity of Southside Bank is used to make loans and leases, to repay deposit liabilities as they become due or are demanded by customers. Liquidity policies and limits are established by the board of directors. Management and our investment committee regularly monitor the overall liquidity position of Southside Bank and the Company to ensure that various alternative strategies exist to cover unanticipated events that could affect liquidity. Management and our investment committee also establish policies and monitor guidelines to diversify Southside Bank’s funding sources to avoid concentrations in excess of board approved policies in any one market source. Funding sources include federal funds purchased, securities sold under repurchase agreements, non-core deposits, and short- and long-term debt. Southside Bank is also a member of the Federal Home Loan Bank (“FHLB”) System, which provides funding through advances to members that are collateralized with mortgage-related assets.
We maintain a portfolio of securities that can be used as a secondary source of liquidity. There are other sources of liquidity available to us should they be needed. These sources include sales or securitizations of loans, our ability to acquire additional national market, non-core deposits, additional collateralized borrowings such as Federal Home Loan Bank advances, the issuance and sale of debt securities, and the issuance and sale of preferred or common securities in public or private transactions. Southside Bank also can borrow from the Federal Reserve’s discount window.
We have historically had access to a number of alternative sources of liquidity, but given an increase in volatility in the credit and liquidity markets, there is no assurance that we will be able to obtain such liquidity on terms that are favorable to us, or at all. For example, the cost of out-of-market deposits may exceed the cost of deposits of similar maturity in our local market area, making them unattractive sources of funding; financial institutions may be unwilling to extend credit to banks because of concerns about the banking industry and the economy generally; there may not be a market for the issuance of additional trust preferred securities; and, given recent downturns in the economy, there may not be a viable market for raising equity capital.
If we were unable to access any of these funding sources when needed, we might be unable to meet customers’ needs, which could adversely impact our financial condition, results of operations, cash flows and liquidity, and level of regulatory-qualifying capital.
Acquisitions and potential acquisitions may disrupt our business and dilute shareholder value.
During 2007, we completed the acquisition of FWBS. This was our first acquisition. Aside from this acquisition, we occasionally investigate potential merger or acquisition partners that appear to be culturally similar, have experienced management and possess either significant or attractive market presence or have potential for improved profitability through financial management, economies of scale or expanded services. Acquiring other banks, businesses or branches involves various risks commonly associated with acquisitions, including, among other things:
|
·
|
potential exposure to unknown or contingent liabilities of the target company;
|
|
·
|
exposure to potential asset quality issues of the target company;
|
|
·
|
difficulty and expense of integrating the operations and personnel of the target company;
|
|
·
|
potential disruption to our business;
|
22
|
·
|
potential diversion of our management’s time and attention;
|
|
·
|
the possible loss of key employees and customers of the target company;
|
|
·
|
difficulty in estimating the value of the target company; and
|
|
·
|
potential changes in banking or tax laws or regulations that may affect the target company.
|
We occasionally evaluate merger and acquisition opportunities and conduct due diligence activities related to possible transactions with other financial institutions and financial services companies. As a result, merger or acquisition discussions and, in some cases, negotiations may take place and future mergers or acquisitions involving cash, debt or equity securities may occur at any time. Acquisitions typically involve the payment of a premium over book and market values, and, therefore, some dilution of our tangible book value and net income per common share may occur in connection with any future transaction. Furthermore, failure to realize the expected revenue increases, cost savings, increases in geographic or product presence, and/or other projected benefits and synergies from an acquisition could have a material adverse effect on our financial condition and results of operations.
We may not be able to attract and retain skilled people.
Our success depends, in large part, on our ability to attract and retain key people. Competition for the best people in most activities we engage in can be intense, and we may not be able to hire people or to retain them. The unexpected loss of services of one or more of our key personnel could have a material adverse impact on our business because of their skills, knowledge of our market, relationships in the communities we serve, years of industry experience and the difficulty of promptly finding qualified replacement personnel. Although we have employment agreements with certain of our executive officers, there is no guarantee that these officers will remain employed with the Company.
Our information systems may experience an interruption or breach in security.
We rely heavily on communications and information systems to conduct our business. Any failure, interruption or breach in security of these systems could result in failures or disruptions in our customer relationship management, general ledger, deposit, loan and other systems. While we have policies and procedures designed to prevent or limit the effect of the failure, interruption or security breach of our information systems, there can be no assurance that we can prevent any such failures, interruptions or security breaches or, if they do occur, that they will be adequately addressed. The occurrence of any failures, interruptions or security breaches of our information systems could damage our reputation, result in a loss of customer business, subject us to additional regulatory scrutiny, or expose us to civil litigation and possible financial liability, any of which could have a material adverse effect on our financial condition and results of operations.
We continually encounter technological change.
The financial services industry is continually undergoing rapid technological change with frequent introductions of new technology-driven products and services. The effective use of technology increases efficiency and enables financial institutions to better serve customers and to reduce costs. Our future success depends, in part, upon our ability to address the needs of our customers by using technology to provide products and services that will satisfy customer demands, as well as to create additional efficiencies in our operations. Many of our competitors have substantially greater resources to invest in technological improvements. We may not be able to effectively implement new technology-driven products and services or be successful in marketing these products and services to our customers and even if we implement such products and services, we may incur substantial costs in doing so. Failure to successfully keep pace with technological change affecting the financial services industry could have a material adverse impact on our business, financial condition and results of operations.
Severe weather, natural disasters, climate change, acts of war or terrorism and other external events could significantly impact our business.
Severe weather, natural disasters, climate change, acts of war or terrorism and other adverse external events could have a significant impact on our ability to conduct business. Such events could affect the stability of our deposit base, impair the ability of borrowers to repay outstanding loans, impair
23
the value of collateral securing loans, cause significant property damage, result in loss of revenue and/or cause us to incur additional expenses. For example, because of our location and the location of the market areas we serve, severe weather is more likely than in other areas of the country. Although management has established disaster recovery policies and procedures, there can be no assurance of the effectiveness of such policies and procedures, and the occurrence of any such event could have a material adverse effect on our business, financial condition and results of operations.
RISKS ASSOCIATED WITH THE BANKING INDUSTRY
We are subject or may become subject to extensive government regulation and supervision.
Southside Bancshares, Inc., primarily through Southside Bank, and certain nonbank subsidiaries, is subject to extensive federal and state regulation and supervision. Banking regulations are primarily intended to protect depositors’ funds, federal deposit insurance funds and the banking system as a whole, not shareholders. These regulations affect our lending practices, capital structure, investment practices and dividend policy and growth, among other things. The statutory and regulatory framework under which we operate will change substantially over the next several years as the result of the enactment of the Dodd-Frank Act. The Dodd-Frank Act represents a significant overhaul of many aspects of the regulation of the financial-services industry, addressing, among other things, systemic risk, capital adequacy, deposit insurance assessments, consumer financial protection, interchange fees, derivatives, lending limits, mortgage lending practices, registration of investment advisors and changes among bank regulatory authorities. To date, there are a number of provisions of the Dodd-Frank Act that have not taken effect and many important provisions require implementing rules to become effective. In addition to these developments, Congress and federal and state regulatory agencies continually review banking laws, regulations and policies for possible changes. Changes to statutes, regulations or regulatory policies, including changes in interpretation or implementation of statutes, regulations or policies, could affect us in substantial and unpredictable ways. Such changes could subject us to additional costs, limit deposit fees and other types of fees we charge, limit the types of financial services and products we may offer and/or increase the ability of nonbanks to offer competing financial services and products, among other things. While we cannot predict the impact caused by the Dodd-Frank Act and forthcoming implementing rules, or the impact of any additional regulatory changes that may arise out of the current financial and economic environment, any regulatory changes or increased regulatory scrutiny could increase costs directly related to complying with new regulatory requirements. Failure to comply with laws, regulations or policies could result in sanctions by regulatory agencies, civil money penalties and/or reputation damage, which could have a material adverse effect on our business, financial condition and results of operations. While our policies and procedures are designed to prevent any such violations, there can be no assurance that such violations will not occur. See the section captioned “Supervision and Regulation” in “Item 1. Business” and “Note 14 – Shareholders’ Equity” to our consolidated financial statements included in this report.
We may become subject to increased regulatory capital changes.
The capital requirements applicable to Southside Bancshares, Inc. and Southside Bank are subject to change because, over the coming years, the regulatory capital framework is expected to change in important respects as a result of the Dodd-Frank Act and as a result of a separate, international regulatory capital initiative known as Basel III. In particular, in December 2010, the committee of central banks and bank supervisors, BCBS, finalized new regulatory capital standards, known as Basel III. These standards, which are aimed at capital reform, seek to further strengthen financial institutions’ capital positions by mandating a higher minimum level of common equity to be held, along with a capital conservation buffer to withstand future periods of stress. These new requirements have been endorsed by the U.S. banking regulators, but have not yet been translated by the regulators into official regulation for U.S. financial institutions. It is anticipated that the regulators will adopt new regulatory capital requirements similar to those proposed by the BCBS, and the new requirements are anticipated to be phased-in for U.S. financial institutions beginning in 2013. Furthermore, it is widely anticipated that the capital requirements for most bank and financial holding companies, as well as for most insured depository institutions, will increase, although the nature and amounts of the increase have not yet been specified. Complying with the higher capital requirements mandated by the Dodd-Frank Act and new capital standards brought about by Basel III implementation will likely affect our operations, including our asset portfolios and financial performance. The extent to which we will be affected will be known with more certainty once additional clarity is provided on the underlying details of these new requirements.
24
The earnings of financial services companies are significantly affected by general business and economic conditions.
Our operations and profitability are impacted by general business and economic conditions in the United States and abroad. These conditions include short-term and long-term interest rates, inflation, money supply, political issues, legislative and regulatory changes, fluctuations in both debt and equity capital markets, broad trends in industry and finance, and the strength of the U.S. economy and the local economies in which we operate, all of which are beyond our control. A deterioration in economic conditions could result in an increase in loan delinquencies and nonperforming assets, decreases in loan collateral values and a decrease in demand for our products and services, among other things, any of which could have a material adverse impact on our financial condition and results of operations.
Financial services companies depend on the accuracy and completeness of information about customers and counterparties.
In deciding whether to extend credit or enter into other transactions, we may rely on information furnished by or on behalf of customers and counterparties, including financial statements, credit reports and other financial information. We may also rely on representations of those customers, counterparties or other third parties, such as independent auditors, as to the accuracy and completeness of that information. Reliance on inaccurate or misleading financial statements, credit reports or other financial information could have a material adverse impact on our business, financial condition and results of operations.
Consumers may decide not to use banks to complete their financial transactions.
Technology and other changes are allowing parties to complete financial transactions that historically have involved banks through alternative methods. For example, consumers can now maintain funds that would have historically been held as bank deposits in brokerage accounts or mutual funds. Consumers can also complete transactions such as paying bills and/or transferring funds directly without the assistance of banks. The process of eliminating banks as intermediaries could result in the loss of fee income, as well as the loss of customer deposits and the related income generated from those deposits. The loss of these revenue streams and the lower cost deposits as a source of funds could have a material adverse effect on our financial condition and results of operations.
The soundness of other financial institutions could adversely affect us.
Financial services institutions are interrelated as a result of trading, clearing, counterparty or other relationships. We have exposure to many different industries and counterparties, and we routinely execute transactions with counterparties in the financial services industry, including brokers and dealers, commercial banks, investment banks, mutual and hedge funds, and other institutional clients. Many of these transactions expose us to credit risk in the event of default of our counterparty or client. In addition, our credit risk may be exacerbated when the collateral held by us cannot be realized or is liquidated at prices not sufficient to recover the full amount of the loan or derivative exposure due us. There is no assurance that any such losses would not materially and adversely affect our results of operations or earnings.
We are subject to claims and litigation pertaining to fiduciary responsibility.
From time to time, customers make claims and take legal action pertaining to our performance of our fiduciary responsibilities. Whether customer claims and legal action related to our performance of our fiduciary responsibilities are founded or unfounded, defending claims is costly and diverts management’s attention, and if such claims and legal actions are not resolved in a manner favorable to us, they may result in significant financial liability and/or adversely affect our market perception and products and services as well as impact customer demand for those products and services. Any financial liability or reputation damage could have a material adverse effect on our business, financial condition and results of operations.
25
RISKS ASSOCIATED WITH OUR COMMON STOCK
Our stock price can be volatile.
Stock price volatility may make it more difficult for you to resell your common stock when you want and at prices you find attractive. Our stock price can fluctuate significantly in response to a variety of factors including, among other things:
|
·
|
actual or anticipated variations in quarterly results of operations;
|
|
·
|
recommendations by securities analysts;
|
|
·
|
operating and stock price performance of other companies that investors deem comparable to us;
|
|
·
|
news reports relating to trends, concerns and other issues in the financial services industry;
|
|
·
|
perceptions in the marketplace regarding us and/or our competitors;
|
|
·
|
new technology used, or services offered, by competitors;
|
|
·
|
significant acquisitions or business combinations, strategic partnerships, joint ventures or capital commitments by or involving us or our competitors;
|
|
·
|
failure to integrate acquisitions or realize anticipated benefits from acquisitions;
|
|
·
|
changes in government regulations; and
|
|
·
|
geopolitical conditions such as acts or threats of terrorism or military conflicts.
|
General market fluctuations, industry factors and general economic and political conditions and events, such as economic slowdowns or recessions, interest rate changes or credit loss trends, could also cause our stock price to decrease regardless of operating results.
The trading volume in our common stock is less than that of other larger financial services companies.
Although our common stock is listed for trading on the NASDAQ Global Select Market, the trading volume is low, and you are not assured liquidity with respect to transactions in our common stock. A public trading market having the desired characteristics of depth, liquidity and orderliness depends on the presence in the marketplace of willing buyers and sellers of our common stock at any given time. This presence depends on the individual decisions of investors and general economic and market conditions over which we have no control. Given the lower trading volume of our common stock, significant sales of our common stock, or the expectation of these sales, could cause our stock price to fall.
The holders of our junior subordinated debentures have rights that are senior to those of our shareholders.
On September 4, 2003, we issued $20.6 million of floating rate junior subordinated debentures in connection with a $20.0 million trust preferred securities issuance by our subsidiary, Southside Statutory Trust III. These junior subordinated debentures mature in September 2033. On August 8 and 10, 2007, we issued $23.2 million and $12.9 million, respectively, of five-year fixed rate converting to floating rate thereafter, junior subordinated debentures in connection with $22.5 million and $12.5 million, respectively, trust preferred securities issuances by our subsidiaries Southside Statutory Trust IV and V, respectively. Trust IV matures October 2037 and Trust V matures September 2037. As part of the acquisition of FWBS on October 10, 2007, we assumed $3.6 million of floating rate junior subordinated debentures issued to Magnolia Trust Company I in connection with $3.5 million of trust preferred securities issued in 2005 that matures in 2035.
We conditionally guarantee payments of the principal and interest on the trust preferred securities. Our junior subordinated debentures are senior to our shares of common stock. As a result, we must
26
make payments on the junior subordinated debentures (and the related trust preferred securities) before any dividends can be paid on our common stock and, in the event of bankruptcy, dissolution or liquidation, the holders of the debentures must be satisfied before any distributions can be made to the holders of common stock. We have the right to defer distributions on our junior subordinated debentures (and the related trust preferred securities) for up to five years, during which time no dividends may be paid to holders of common stock.
An investment in our common stock is not an insured deposit.
Our common stock is not a bank deposit and, therefore, is not insured against loss by the FDIC, any other deposit insurance fund or by any other public or private entity. Investment in our common stock is inherently risky for the reasons described in this “Risk Factors” section and elsewhere in this report and is subject to the same market forces that affect the price of common stock in any company. As a result, if you acquire our common stock, you may lose some or all of your investment.
Provisions of our articles of incorporation bylaws, as well as state and federal banking regulations, could delay or prevent a takeover of us by a third party.
Our articles of incorporation and bylaws could delay, defer or prevent a third party from acquiring us, despite the possible benefit to our shareholders, or otherwise adversely affect the price of our common stock. These provisions include, among others, requiring advance notice for raising business matters or nominating directors at shareholders’ meetings and staggered board elections.
Any individual, acting alone or with other individuals, who are seeking to acquire, directly or indirectly, 10.0% or more of our outstanding common stock must comply with the Change in Bank Control Act, which requires prior notice to the Federal Reserve for any acquisition. Additionally, any entity that wants to acquire 5.0% or more of our outstanding common stock, or otherwise control us, may need to obtain the prior approval of the Federal Reserve under the BHCA of 1956, as amended. As a result, prospective investors in our common stock need to be aware of and comply with those requirements, to the extent applicable.
We may issue additional securities, which could dilute your ownership percentage.
In certain situations, our board of directors has the authority, without any vote of our shareholders, to issue shares of our authorized but unissued stock. In the future, we may issue additional securities, through public or private offerings, to raise additional capital or finance acquisitions. Any such issuance would dilute the ownership of current holders of our common stock.
ITEM 1B. UNRESOLVED STAFF COMMENTS
None
|
ITEM 2. PROPERTIES
|
Southside Bank owns and operates the following properties:
|
·
|
Southside Bank main branch at 1201 South Beckham Avenue, Tyler, Texas. The executive offices of Southside Bancshares, Inc. are located at this location;
|
|
·
|
Southside Bank Annex at 1211 South Beckham Avenue, Tyler, Texas. The Southside Bank Annex is directly adjacent to the main bank building. Human Resources, the Trust Department and other support areas are located in this building;
|
|
·
|
Operations Annex at 1221 South Beckham Avenue, Tyler, Texas. Various back office, lending and training facilities and other support areas are located in this building;
|
|
·
|
Southside Bank main branch motor bank facility at 1010 East First Street, Tyler, Texas;
|
|
·
|
South Broadway branch at 6201 South Broadway, Tyler, Texas;
|
|
·
|
South Broadway branch motor bank facility at 6019 South Broadway, Tyler, Texas;
|
27
|
·
|
Downtown branch at 113 West Ferguson Street, Tyler, Texas;
|
|
·
|
Gentry Parkway branch and motor bank facility at 2121 West Gentry Parkway, Tyler, Texas;
|
|
·
|
Highway 64 West branch and motor bank facility at 3815 State Highway 64 West, Tyler, Texas;
|
|
·
|
Longview main branch and motor bank facility at 2001 Judson Road, Longview, Texas;
|
|
·
|
Lindale main branch and motor bank facility at 2510 South Main Street, Lindale, Texas;
|
|
·
|
Whitehouse main branch and motor bank facility at 901 Highway 110 North, Whitehouse, Texas;
|
|
·
|
Jacksonville main branch and motor bank at 1015 South Jackson Street, Jacksonville, Texas;
|
|
·
|
Gresham main branch and motor bank at 16691 FM 2493, Tyler, Texas;
|
|
·
|
Gun Barrel City main branch and motor bank facility at 901 West Main, Gun Barrel City, Texas;
|
|
·
|
Arlington branch and motor bank facility at 2831 West Park Row, Arlington, Texas;
|
|
·
|
Fort Worth branch and motor bank facility at 9516 Clifford Street, Fort Worth, Texas; and
|
|
·
|
50 ATM’s located throughout our market areas.
|
Southside Bank currently operates full service banks in leased space in 19 grocery stores, two lending centers and two full service branches in leased office space in the following locations:
|
·
|
one in Bullard, Texas;
|
|
·
|
one in Lindale, Texas;
|
|
·
|
one in Flint, Texas;
|
|
·
|
one in Whitehouse, Texas;
|
|
·
|
one in Chandler, Texas;
|
|
·
|
one in Seven Points, Texas;
|
|
·
|
one in Palestine, Texas;
|
|
·
|
one in Athens, Texas;
|
|
·
|
one in Hawkins, Texas;
|
|
·
|
three in Longview, Texas;
|
|
·
|
seven in Tyler, Texas;
|
|
·
|
Fort Worth branch and motor bank facility at 701 West Magnolia, Fort Worth, Texas;
|
|
·
|
Fort Worth branch at 707 West Magnolia, Fort Worth, Texas;
|
|
·
|
Forney loan production office at 413 North McGraw, Forney, Texas; and
|
|
·
|
Austin loan production office at 8200 North Mopac, Suite 130, Austin, Texas.
|
We purchased a 50% interest in a commercial building in Arlington, Texas. SFG currently operates its business in this building and is leasing a little over 50% of this facility in the following location:
28
|
·
|
700 West Arkansas Lane, Arlington, Texas.
|
We are in the process of building a new facility adjacent to our headquarters at 1305 South Beckham Avenue, Tyler, Texas, which will house our Trust department. We anticipate that this facility will be completed during the first half of 2011. Plans are underway to open a full service branch in a leased space in a grocery store being constructed in Tyler, Texas. We anticipate that this branch will open during 2011. We will continue to explore opportunities to expand either into additional grocery store or traditional branch locations.
All of the properties detailed above are suitable and adequate to provide the banking services intended based on the type of property described. In addition, the properties for the most part are fully utilized but designed with productivity in mind and can handle the additional business volume we anticipate they will generate. As additional potential needs are identified, individual property enhancements or the need to add properties will be evaluated.
|
ITEM 3. LEGAL PROCEEDINGS
|
We are party to legal proceedings arising in the normal conduct of business. Management believes that such litigation is not material to our financial position or results of operations.
|
ITEM 4. (REMOVED AND RESERVED)
|
|
PART II
|
|
ITEM 5.
|
MARKET FOR REGISTRANT’S COMMON EQUITY, RELATED STOCKHOLDER MATTERS AND ISSUER PURCHASES OF EQUITY SECURITIES
|
MARKET INFORMATION
Our common stock trades on the NASDAQ Global Select Market under the symbol "SBSI." Set forth below are the high and low sales prices on the NASDAQ Global Select Market for each full quarterly period from January 1, 2009 to December 31, 2010. During the first quarter of 2010 and the second quarter of 2009, we declared and paid a 5% stock dividend. Stock prices listed below have been adjusted to give retroactive recognition to such stock dividends.
|
Year Ended
|
1st Quarter
|
2nd Quarter
|
3rd Quarter
|
4th Quarter
|
||||||||||||
|
December 31, 2010
|
$ | 20.86 – 17.55 | $ | 22.02 – 18.96 | $ | 19.71 – 17.77 | $ | 21.64 – 18.44 | ||||||||
|
December 31, 2009
|
$ | 20.76 – 12.53 | $ | 23.82 – 17.36 | $ | 23.90 – 19.38 | $ | 21.20 – 18.71 | ||||||||
See "Item 7. Management’s Discussion and Analysis of Financial Condition and Results of Operations – Capital Resources" for a discussion of our common stock repurchase program.
SHAREHOLDERS
There were approximately 1,000 holders of record of our common stock, the only class of equity securities currently issued and outstanding, as of February 11, 2011.
DIVIDENDS
Cash dividends declared and paid were $0.85 and $0.75 per share for the years ended December 31, 2010 and 2009, respectively. Stock dividends of 5% were also declared and paid during each of the years ended December 31, 2008, 2007 and 2006. We have paid a cash dividend at least once every year since 1970 (including dividends paid by Southside Bank prior to the incorporation of Southside Bancshares). Future dividends will depend on our earnings, financial condition and other factors that our board of directors considers to be relevant. In addition, we must make payments on our junior subordinated debentures before any dividends can be paid on the common stock. For additional discussion relating to restrictions that limit our ability to pay dividends refer to “Supervision and Regulation” in “Item 1. Business” and in “Item 7. Management’s Discussion and Analysis of Financial Condition and Results of Operations –Capital Resources.” The cash dividends were paid quarterly each year as listed below.
29
Quarterly Cash Dividends Paid
|
Year Ended
|
1st Quarter
|
2nd Quarter
|
3rd Quarter
|
4th Quarter
|
||||||||||||
|
December 31, 2010
|
$ | 0.17 | $ | 0.17 | $ | 0.17 | $ | 0.34 | ||||||||
|
December 31, 2009
|
$ | 0.13 | $ | 0.14 | $ | 0.14 | $ | 0.34 | ||||||||
ISSUER SECURITY REPURCHASES
The following table provides information with respect to purchases made by or on behalf of any “affiliated purchaser” (as defined in Rule 10b-18(a)(3) under the Exchange Act), of our common stock during the three months ended December 31, 2010.
|
Period
|
Total Number of Shares Purchased
|
Average Price Paid Per Share
|
Total Number of Shares Purchased as Part of Publicly Announced Plan
|
Maximum Dollar Value of Shares That May Yet Be Purchased Under the Plan at the End of the Period
|
|||||||||||||
|
October 1, 2010 to October 31, 2010
|
- | $ | - | - | $ | 6,000,000 | |||||||||||
|
November 1, 2010 to November 30, 2010
|
6,200 | 18.81 | 6,200 | 5,883,362 | |||||||||||||
|
December 1, 2010 to December 31, 2010
|
- | - | - | 5,883,362 | |||||||||||||
|
Total
|
6,200 | (1) | $ | 18.81 | 6,200 | ||||||||||||
(1) During the first quarter of 2010, our board of directors approved the continuation of its stock repurchase plan, committing $6.0 million to repurchase common stock during 2010 with a re-evaluation of such plan by the board of directors to occur on a quarterly basis. No common stock was purchased during the first or second quarter of 2010 under the repurchase plan, however, outside of the board authorized repurchase plan, 1,101 shares were repurchased in connection with the exercise of certain employee stock options. During the fourth quarter of 2010, our board of directors approved increasing the amount available for repurchase under the plan to $6.0 million, replenishing the $4.7 million used during the third quarter of 2010. During the three and twelve months ended December 31, 2010, we purchased 6,200 and 260,476 shares of common stock, respectively, at an average price of $18.81 and $18.46, respectively.
30
FINANCIAL PERFORMANCE
The following performance graph does not constitute soliciting material and should not be deemed filed or incorporated by reference into any other Company under the Securities Act of 1933 or the Securities Exchange Act of 1934, except to the extent the filing Company specifically incorporates the performance graph by reference therein.
Southside Bancshares, Inc.
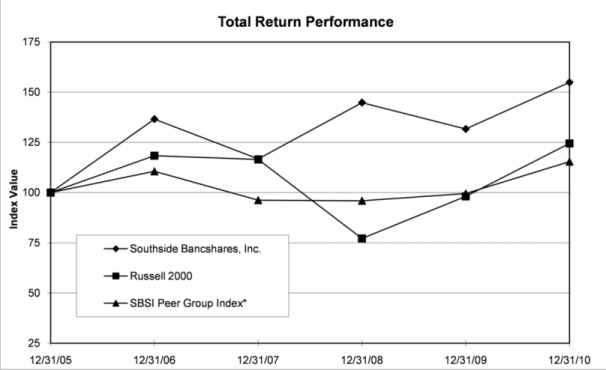
|
Period Ending
|
|||||||||||
|
Index
|
12/31/05
|
12/31/06
|
12/31/07
|
12/31/08
|
12/31/09
|
12/31/10
|
|||||
|
Southside Bancshares, Inc.
|
100.00
|
136.56
|
116.78
|
144.79
|
131.63
|
154.87
|
|||||
|
Russell 2000
|
100.00
|
118.37
|
116.51
|
77.15
|
98.11
|
124.46
|
|||||
|
SBSI Peer Group Index*
|
100.00
|
110.59
|
96.23
|
95.94
|
99.53
|
115.41
|
|||||
|
*SBSI Peer Group Index contains the following Texas banks: Cullen/Frost Bankers Inc.(CFR), First Financial Bankshares, Inc. (FFIN),
|
|||||||||||
|
International Bancshares Corporation (IBOC), MetroCorp Bancshares, Inc. (MCBI), Prosperity Bancshares, Inc. (PRSP),
|
|||||||||||
|
Sterling Bancshares, Inc. (SBIB), Texas Capital Bancshares, Inc. (TCBI) and Encore Bancshares, Inc.(EBTX)
|
|||||||||||
|
Source : SNL Financial LC, Charlottesville, VA
|
|
© 2011
|
31
ITEM 6. SELECTED FINANCIAL DATA
The following table sets forth selected financial data regarding our results of operations and financial position for, and as of the end of, each of the fiscal years in the five-year period ended December 31, 2010. This information should be read in conjunction with "Item 7. Management's Discussion and Analysis of Financial Condition and Results of Operations" and “Item 8. Financial Statements and Supplementary Data,” as set forth in this report. Please refer to “Item 1. Business” for a discussion of our acquisition of FWBS in 2007.
|
As of and For the Years Ended December 31,
|
||||||||||||||||||||
|
2010
|
2009
|
2008
|
2007
|
2006
|
||||||||||||||||
|
(in thousands, except per share data)
|
||||||||||||||||||||
|
Balance Sheet Data:
|
||||||||||||||||||||
|
Investment Securities
|
$ | 300,839 | $ | 266,553 | $ | 278,856 | $ | 110,403 | $ | 100,303 | ||||||||||
|
Mortgage-backed and Related Securities
|
$ | 1,363,905 | $ | 1,480,847 | $ | 1,183,800 | $ | 917,518 | $ | 869,326 | ||||||||||
|
Loans, Net of Allowance for Loan Losses
|
$ | 1,057,209 | $ | 1,013,680 | $ | 1,006,437 | $ | 951,477 | $ | 751,954 | ||||||||||
|
Total Assets
|
$ | 2,999,621 | $ | 3,024,288 | $ | 2,700,238 | $ | 2,196,322 | $ | 1,890,976 | ||||||||||
|
Deposits
|
$ | 2,134,428 | $ | 1,870,421 | $ | 1,556,131 | $ | 1,530,491 | $ | 1,282,475 | ||||||||||
|
Long-term Obligations
|
$ | 433,790 | $ | 592,830 | $ | 715,800 | $ | 146,558 | $ | 149,998 | ||||||||||
|
Shareholders’ Equity
|
$ | 214,323 | $ | 201,781 | $ | 160,617 | $ | 132,328 | $ | 110,604 | ||||||||||
|
Income Statement Data:
|
||||||||||||||||||||
|
Interest & Deposit Service Income
|
$ | 148,193 | $ | 162,822 | $ | 154,571 | $ | 123,021 | $ | 112,434 | ||||||||||
|
Net Income Attributable to Southside Bancshares, Inc.
|
$ | 39,491 | $ | 44,396 | $ | 30,696 | $ | 16,684 | $ | 15,002 | ||||||||||
|
Per Share Data:
|
||||||||||||||||||||
|
Earnings Per Common Share:
|
||||||||||||||||||||
|
Basic
|
$ | 2.51 | $ | 2.84 | $ | 2.00 | $ | 1.10 | $ | 1.01 | ||||||||||
|
Diluted
|
$ | 2.51 | $ | 2.82 | $ | 1.96 | $ | 1.07 | $ | 0.97 | ||||||||||
|
Cash Dividends Paid Per Common Share
|
$ | 0.85 | $ | 0.75 | $ | 0.60 | $ | 0.50 | $ | 0.47 | ||||||||||
32
|
ITEM 7.
|
MANAGEMENT'S DISCUSSION AND ANALYSIS OF FINANCIAL CONDITION AND RESULTS OF OPERATIONS
|
The following discussion and analysis provides a comparison of our results of operations for the years ended December 31, 2010, 2009, and 2008 and financial condition as of December 31, 2010 and 2009. This discussion should be read in conjunction with the financial statements and related notes included elsewhere in this report. All share data has been adjusted to give retroactive recognition to stock splits and stock dividends.
CAUTIONARY NOTICE REGARDING FORWARD-LOOKING STATEMENTS
Certain statements of other than historical fact that are contained in this document and in written material, press releases and oral statements issued by or on behalf of Southside Bancshares, Inc., a bank holding company, may be considered to be “forward-looking statements” within the meaning of and subject to the protections of the Private Securities Litigation Reform Act of 1995. These forward-looking statements are not guarantees of future performance, nor should they be relied upon as representing management’s views as of any subsequent date. These statements may include words such as "expect," "estimate," "project," "anticipate," "appear," "believe," "could," "should," "may," "intend," "probability," "risk," "target," "objective," "plans," "potential," and similar expressions. Forward-looking statements are statements with respect to our beliefs, plans, expectations, objectives, goals, anticipations, assumptions, estimates, intentions and future performance, and are subject to significant known and unknown risks and uncertainties, which could cause our actual results to differ materially from the results discussed in the forward-looking statements. For example, discussions of the effect of our expansion, trends in asset quality and earnings from growth, and certain market risk disclosures are based upon information presently available to management and are dependent on choices about key model characteristics and assumptions and are subject to various limitations. See “Item 1. Business” and this “Item 7. Management’s Discussion and Analysis of Financial Condition and Results of Operations.” By their nature, certain of the market risk disclosures are only estimates and could be materially different from what actually occurs in the future. As a result, actual income gains and losses could materially differ from those that have been estimated. Other factors that could cause actual results to differ materially from forward-looking statements include, but are not limited to, the following:
|
·
|
general economic conditions, either globally, nationally, in the State of Texas, or in the specific markets in which we operate, including, without limitation, the deterioration of the commercial real estate, residential real estate, construction and development, credit and liquidity markets, which could cause an adverse change in our net interest margin, or a decline in the value of our assets, which could result in realized losses;
|
|
·
|
legislation, regulatory changes or changes in monetary or fiscal policy that adversely affect the businesses in which we are engaged, including the impact of the Dodd-Frank Act, the Federal Reserve’s actions with respect to interest rates and other regulatory responses to current economic conditions;
|
|
·
|
adverse changes in the status or financial condition of the Government-Sponsored Enterprises (the “GSEs”) impacting the GSEs’ guarantees or ability to pay or issue debt;
|
|
·
|
adverse changes in the credit portfolio of other U. S. financial institutions relative to the performance of certain of our investment securities;
|
33
|
·
|
economic or other disruptions caused by acts of terrorism in the United States, Europe or other areas;
|
|
·
|
changes in the interest rate yield curve such as flat, inverted or steep yield curves, or changes in the interest rate environment that impact interest margins and may impact prepayments on the mortgage-backed securities portfolio;
|
|
·
|
increases in our non-performing assets;
|
|
·
|
our ability to maintain adequate liquidity to fund operations and growth;
|
|
·
|
the failure of our assumptions underlying allowance for loan losses and other estimates;
|
|
·
|
unexpected outcomes of, and the costs associated with, existing or new litigation involving us;
|
|
·
|
changes impacting our balance sheet and leverage strategy;
|
|
·
|
our ability to monitor interest rate risk;
|
|
·
|
significant increases in competition in the banking and financial services industry;
|
|
·
|
changes in consumer spending, borrowing and saving habits;
|
|
·
|
technological changes;
|
|
·
|
our ability to increase market share and control expenses;
|
|
·
|
the effect of changes in federal or state tax laws;
|
|
·
|
the effect of compliance with legislation or regulatory changes;
|
|
·
|
the effect of changes in accounting policies and practices;
|
|
·
|
risks of mergers and acquisitions including the related time and cost of implementing transactions and the potential failure to achieve expected gains, revenue growth or expense savings;
|
|
·
|
credit risks of borrowers, including any increase in those risks due to changing economic conditions; and
|
|
·
|
risks related to loans secured by real estate, including the risk that the value and marketability of collateral could decline.
|
All written or oral forward-looking statements made by us or attributable to us are expressly qualified by this cautionary notice. We disclaim any obligation to update any factors or to announce publicly the result of revisions to any of the forward-looking statements included herein to reflect future events or developments.
34
IMPACT OF DODD-FRANK ACT
On July 21, 2010, the Dodd-Frank Act was signed into law. The Dodd-Frank Act represents a significant overhaul of many aspects of the regulation of the financial services industry, although some of its provisions apply to companies that are significantly larger than us. The Dodd-Frank Act directs applicable regulatory authorities to promulgate regulations implementing its provisions, and its effect on us and on the financial services industry as a whole will be clarified as those regulations are issued. Major elements of the Dodd-Frank Act include:
|
·
|
A permanent increase in deposit insurance coverage to $250,000 per account, unlimited deposit insurance on noninterest bearing transaction accounts beginning December 31, 2010 through December 31, 2012, and an increase in the minimum Deposit Insurance Fund reserve requirement from 1.15% to 1.35%, with assessments to be based on assets as opposed to deposits.
|
|
·
|
New disclosure and other requirements relating to executive compensation and corporate governance.
|
|
·
|
Amendments to the Truth in Lending Act aimed at improving consumer protections with respect to mortgage originations, including originator compensation, minimum repayment standards, and prepayment considerations.
|
|
·
|
The establishment of the Financial Stability Oversight Council, which will be responsible for identifying and monitoring systemic risks posed by financial firms, activities, and practices.
|
|
·
|
The development of regulations to limit debit card interchange fees.
|
|
·
|
The future elimination of newly issued trust preferred securities as a permitted element of Tier 1 capital.
|
|
·
|
The creation of a special regime to allow for the orderly liquidation of systemically important financial companies, including the establishment of an orderly liquidation fund.
|
|
·
|
The development of regulations to address derivatives markets, including clearing and exchange trading requirements and a framework for regulating derivatives-market participants.
|
|
·
|
Enhanced supervision of credit rating agencies through the Office of Credit Ratings within the SEC.
|
|
·
|
Increased regulation of asset-backed securities, including a requirement that issuers of asset-backed securities retain at least 5% of the risk of the asset backed securities.
|
|
·
|
The establishment of a Bureau of Consumer Financial Protection, within the Federal Reserve, to serve as a dedicated consumer-protection regulatory body.
|
We are currently evaluating the potential impact of the Dodd-Frank Act on our business, financial condition and results of operations and expect that some provisions may have adverse effects on us, such as the cost of complying with the numerous new regulations and reporting requirements mandated by the Dodd-Frank Act.
35
CRITICAL ACCOUNTING ESTIMATES
Our accounting and reporting estimates conform with U.S. generally accepted accounting principles (“GAAP”) and general practices within the financial services industry. The preparation of financial statements in conformity with GAAP requires management to make estimates and assumptions that affect the amounts reported in the financial statements and accompanying notes. Actual results could differ from those estimates. We consider our critical accounting policies to include the following:
Allowance for Losses on Loans. The allowance for losses on loans represents our best estimate of probable losses inherent in the existing loan portfolio. The allowance for losses on loans is increased by the provision for losses on loans charged to expense and reduced by loans charged-off, net of recoveries. The provision for losses on loans is determined based on our assessment of several factors: reviews and evaluations of specific loans, changes in the nature and volume of the loan portfolio, current economic conditions and the related impact on specific borrowers and industry groups, historical loan loss experience, the level of classified and nonperforming loans and the results of regulatory examinations.
The loan loss allowance is based on the most current review of the loan portfolio and is validated by multiple processes. The servicing officer has the primary responsibility for updating significant changes in a customer's financial position. Each officer prepares status updates on any credit deemed to be experiencing repayment difficulties which, in the officer's opinion, would place the collection of principal or interest in doubt. Our internal loan review department is responsible for an ongoing review of our loan portfolio with specific goals set for the loans to be reviewed on an annual basis.
At each review, a subjective analysis methodology is used to grade the respective loan. Categories of grading vary in severity from loans that do not appear to have a significant probability of loss at the time of review to loans that indicate a probability that the entire balance of the loan will be uncollectible. If full collection of the loan balance appears unlikely at the time of review, estimates of future expected cash flows or appraisals of the collateral securing the debt are used to allocate the necessary allowances. The internal loan review department maintains a list of all loans or loan relationships that are graded as having more than the normal degree of risk associated with them. In addition, a list of specifically reserved loans or loan relationships of $50,000 or more is updated on a quarterly basis in order to properly allocate necessary allowance and keep management informed on the status of attempts to correct the deficiencies noted with respect to the loan.
Loans are considered impaired if, based on current information and events, it is probable that we will be unable to collect the scheduled payments of principal or interest when due according to the contractual terms of the loan agreement. The measurement of impaired loans is generally based on the present value of expected future cash flows discounted at the historical effective interest rate stipulated in the loan agreement, except that all collateral-dependent loans are measured for impairment based on fair value of the collateral. In measuring the fair value of the collateral, in addition to relying on third party appraisals, we use assumptions such as discount rates, and methodologies, such as comparison to the recent selling price of similar assets, consistent with those that would be utilized by unrelated third parties performing a valuation.
Changes in the financial condition of individual borrowers, economic conditions, historical loss experience and the conditions of the various markets in which collateral may be sold all may affect the required level of the allowance for losses on loans and the associated provision for loan losses.
As of December 31, 2010, our review of the loan portfolio indicated that a loan loss allowance of $20.7 million was adequate to cover probable losses in the portfolio.
Refer to “Loan Loss Experience and Allowance for Loan Losses” and “Note 6 - Loans and Allowance for Probable Loan Losses” to our consolidated financial statements included in this report for a detailed description of our estimation process and methodology related to the allowance for loan losses.
36
Estimation of Fair Value. The estimation of fair value is significant to a number of our assets and liabilities. GAAP requires disclosure of the fair value of financial instruments as a part of the notes to the consolidated financial statements. Fair values for securities are volatile and may be influenced by a number of factors, including market interest rates, prepayment speeds, discount rates and the shape of yield curves. Fair values for most investment and mortgage-backed securities are based on quoted market prices, where available. If quoted market prices are not available, fair values are based on the quoted prices of similar instruments or our estimate of fair value by using a range of fair value estimates in the market place as a result of the illiquid market specific to the type of security.
At September 30, 2008 and continuing at December 31, 2010, the valuation inputs for our available for sale (“AFS”) trust preferred securities (“TRUPs”) became unobservable as a result of the significant market dislocation and illiquidity in the marketplace. Although we continue to rely on non-binding prices compiled by third party vendors, the visibility of the observable market data (Level 2) to determine the values of these securities has become less clear. Fair values of financial assets are determined in an orderly transaction and not a forced liquidation or distressed sale at the measurement date. While we feel the financial market conditions at December 31, 2010 reflect the market illiquidity from forced liquidation or distressed sales for these TRUPs, we determined that the fair value provided by our pricing service continues to be an appropriate fair value for financial statement measurement and therefore, as we verified the reasonableness of that fair value, we have not otherwise adjusted the fair value provided by our vendor. However, the severe decline in estimated fair value is caused by the significant illiquidity in this market which contrasts sharply with our assessment of the fundamental performance of these securities. Therefore, we believe the estimate of fair value is still not clearly based on observable market data and will be based on a range of fair value data points from the market place as a result of the illiquid market specific to this type of security. Accordingly, we determined that the TRUPs security valuation is based on Level 3 inputs.
Impairment of Investment Securities and Mortgage-backed Securities. Investment and mortgage-backed securities classified as AFS are carried at fair value and the impact of changes in fair value are recorded on our consolidated balance sheet as an unrealized gain or loss in “Accumulated other comprehensive income (loss),” a separate component of shareholders’ equity. Securities classified as AFS or held to maturity (“HTM”) are subject to our review to identify when a decline in value is other-than-temporary. Factors considered in determining whether a decline in value is other-than-temporary include: whether the decline is substantial; the duration of the decline; the reasons for the decline in value; whether the decline is related to a credit event, a change in interest rate or a change in the market discount rate; and the financial condition and near-term prospects of the issuer. Additionally, we do not currently intend to sell the security and it is not more likely than not that we will be required to sell the security before the anticipated recovery of its amortized cost basis. When it is determined that a decline in value is other-than-temporary, the carrying value of the security is reduced to its estimated fair value, with a corresponding charge to earnings for the credit portion and the non credit portion to other comprehensive income. For certain assets we consider expected cash flows of the investment in determining if impairment exists.
The turmoil in the capital markets had a significant impact on our estimate of fair value for certain of our securities. We believe the market values are reflective of a combination of illiquidity and credit impairment. At December 31, 2010 we have in AFS Other Stocks and Bonds $2.9 million amortized cost basis in pooled TRUPs. Those securities are structured products with cash flows dependent upon securities issued by U.S. financial institutions, including banks and insurance companies. Our estimate of fair value at December 31, 2010 for the TRUPs is approximately $189,000 and reflects the market illiquidity. With the exception of the TRUPs, to the best of management’s knowledge and based on our consideration of the qualitative factors associated with each security, there were no securities in our investment and mortgage-backed securities portfolio at December 31, 2010 with an other-than-temporary impairment. Given the facts and circumstances associated with the TRUPs, we performed detailed cash flow modeling for each TRUP using an industry accepted model. Prior to loading the required assumptions into the model, we reviewed the financial condition of the underlying issuing banks within the TRUP collateral pool that had not deferred or defaulted as of December 31, 2010.
37
Management’s best estimate of a default assumption, based on a third party method, was assigned to each issuing bank based on the category in which it fell. Our analysis of the underlying cash flows contemplated various default, deferral and recovery scenarios to arrive at our best estimate of cash flows. Based on that detailed analysis, we have concluded that the other-than-temporary impairment which captures the credit component in compliance with the Financial Accounting Standards Board (“FASB”) Accounting Standards Codification (“ASC”) Topic 320, “Investments – Debt and Equity Securities,” was estimated at $3.1 million and $3.0 million at December 31, 2010 and December 31, 2009, respectively. The non credit charge to other comprehensive income was estimated at $2.7 million at both December 31, 2010 and December 31, 2009. Therefore, the carrying amount of the TRUPs was written down with $75,000 recognized in earnings for the year ended December 31, 2010 and $3.0 million recognized in earnings for the year ended December 31, 2009. The cash flow model assumptions represent management’s best estimate and consider a variety of qualitative factors, which include, among others, the credit rating downgrades, severity and duration of the mark-to-market loss, and structural nuances of each TRUP. Management believes the detailed review of the collateral and cash flow modeling support the conclusion that the TRUPs had an other-than-temporary impairment at December 31, 2010. We will continue to update our assumptions and the resulting analysis each reporting period to reflect changing market conditions. Additionally, we do not currently intend to sell the TRUPs and it is not more likely than not that we will be required to sell the TRUPs before the anticipated recovery of their amortized cost basis.
Defined Benefit Pension Plan. The plan obligations and related assets of our defined benefit pension plan (the “Plan”) are presented in “Note 12 – Employee Benefits” to our consolidated financial statements included in this report. Entry into the Plan by new employees was frozen effective December 31, 2005. Plan assets, which consist primarily of marketable equity and debt instruments, are valued using observable market quotations. Plan obligations and the annual pension expense are determined by independent actuaries and through the use of a number of assumptions that are reviewed by management. Key assumptions in measuring the plan obligations include the discount rate, the rate of salary increases and the estimated future return on plan assets. In determining the discount rate, we utilized a cash flow matching analysis to determine a range of appropriate discount rates for our defined benefit pension and restoration plans. In developing the cash flow matching analysis, we constructed a portfolio of high quality non-callable bonds (rated AA- or better) to match as close as possible the timing of future benefit payments of the plans at December 31, 2010. Based on this cash flow matching analysis, we were able to determine an appropriate discount rate.
Salary increase assumptions are based upon historical experience and our anticipated future actions. The expected long-term rate of return assumption reflects the average return expected based on the investment strategies and asset allocation on the assets invested to provide for the Plan’s liabilities. We considered broad equity and bond indices, long-term return projections, and actual long-term historical Plan performance when evaluating the expected long-term rate of return assumption. At December 31, 2010, the weighted-average actuarial assumptions of the Plan were: a discount rate of 5.63%; a long-term rate of return on Plan assets of 7.5%; and assumed salary increases of 4.5%. Material changes in pension benefit costs may occur in the future due to changes in these assumptions. Future annual amounts could be impacted by changes in the number of Plan participants, changes in the level of benefits provided, changes in the discount rates, changes in the expected long-term rate of return, changes in the level of contributions to the Plan and other factors.
Long-term Advance Commitments. During the third and fourth quarters of 2010, we entered into the option to fund between one and a half and two years forward from the advance commitment date, $150 million par in long-term advance commitments from the FHLB at the FHLB rates on the date the option was purchased. A table detailing the optional advance commitment terms is presented in “Note 11- Long-Term Obligations” to our consolidated financial statements included in this report. In order to obtain these commitments from the FHLB we paid fees, which at December 31, 2010, were $7.6 million. The fee, included in other assets in our consolidated balance sheet, will be amortized over the term of the advance as long as it is probable we will exercise the advance commitments. In determining quarterly, if it is still probable we will exercise the advance commitments we compare the all in costs of the advance commitment with the current advance rate available from the FHLB. If the current advance rate is reasonably close to or greater than the advance commitment rate then it is probable we will exercise our option. If the current rate is less, then we review the slope of the yield curve to determine if the forward yield curve supports our assumption that it is probable we will exercise the advance commitments.
38
|
OVERVIEW
|
OPERATING RESULTS
During the year ended December 31, 2010, our net income decreased $4.9 million, or 11.0%, to $39.5 million, from $44.4 million for the same period in 2009. The decrease in net income was primarily attributable to the decrease in net interest income and noninterest income and was partially offset by a decrease in the provision for losses, income tax expense and noninterest expense. The decrease in noninterest income was driven primarily by a decrease in gain on sale of AFS securities. Noninterest expense decreased slightly primarily due to a decrease in FDIC insurance and other expense which was offset by an increase in salaries and employee benefits due to our overall growth and expansion. Earnings per diluted share decreased $0.31, or 11.0%, to $2.51 for the year ended December 31, 2010, from $2.82 for the same period in 2009.
During the year ended December 31, 2009, our net income increased $13.7 million, or 44.6%, to $44.4 million, from $30.7 million for the same period in 2008. The increase in net income was primarily attributable to the increase in net interest income and noninterest income that was partially offset by an increase in the provision for loan losses and noninterest expense. The increase in noninterest income driven primarily by gain on sale of AFS securities was offset by an increase in noninterest expense due primarily to increases in salaries and employee benefits that resulted from our overall growth and expansion. Earnings per diluted share were $2.82 and $1.96 respectively, for the years ended December 31, 2009 and 2008.
FINANCIAL CONDITION
Our total assets decreased $24.7 million, or 0.8%, to $3.00 billion at December 31, 2010 from $3.02 billion at December 31, 2009. This decrease was attributable to a decrease in our investment and mortgage-backed securities which was partially offset by loan growth. At December 31, 2010, loans were $1.08 billion compared to $1.03 billion at December 31, 2009. Our securities portfolio decreased by $82.7 million, or 4.7%, to $1.66 billion compared to $1.75 billion at December 31, 2009. The decrease in our securities was comprised entirely of mortgage-backed and related securities. The increase in loans was funded by increases in deposits.
Our nonperforming assets at December 31, 2010 decreased to $17.7 million, and represented 0.59% of total assets, compared to $23.5 million, or 0.78% of total assets at December 31, 2009. Nonaccruing loans decreased to $14.5 million and the ratio of nonaccruing loans to total loans decreased to 1.35% at December 31, 2010 compared to $18.6 million and 1.80% at December 31, 2009. Other Real Estate Owned (“OREO”) decreased to $220,000 at December 31, 2010 from $1.9 million at December 31, 2009. Loans 90 days past due at December 31, 2010 decreased to $7,000 compared to $323,000 at December 31, 2009. Repossessed assets decreased to $638,000 at December 31, 2010 from $654,000 at December 31, 2009. Restructured performing loans at December 31, 2010 increased to $2.3 million compared to $2.0 million at December 31, 2009.
Our deposits increased $264.0 million to $2.13 billion at December 31, 2010 from $1.87 billion at December 31, 2009. The increase in our deposits during 2010 was primarily due to an increase deposits from municipalities and to a lesser extent branch expansion, increased market penetration, and an increase in brokered CDs issued. During 2010, our public fund deposits increased $177.2 million. During 2010 brokered deposits increased $30.1 million. Our deposits, net of brokered deposits, increased $233.9 million. Due primarily to the increase in deposits during 2010, FHLB advances decreased $292.3 million to $562.6 million at December 31, 2010, from $854.9 million at December 31, 2009. Short-term FHLB advances decreased $133.3 million to $189.1 million at December 31, 2010 from $322.4 million at December 31, 2009. Long-term FHLB advances decreased $159.0 million to $373.5 million at December 31, 2010 from $532.5 million at December 31, 2009. During 2010, we utilized long-term brokered CDs for our long-term funding needs because the overall costs were less than comparable FHLB advances at that time. In addition, during 2010 we entered into the option to purchase, between one and a half and two years forward from the advance commitment date $150 million par in long-term advance commitments from FHLB at the FHLB rates on the date option was purchased. Other borrowings at December 31, 2010 and 2009 totaled $66.8 million and $76.4 million, respectively, and at December 31, 2010 consisted of $6.5 million of short-term borrowings and $60.3 million of long-term debt.
39
Assets under management in our trust department increased during 2010 and were approximately $718 million at December 31, 2010 compared to $657 million at December 31, 2009.
Shareholders’ equity at December 31, 2010 totaled $214.3 million compared to $201.8 million at December 31, 2009. The increase primarily reflects the net income of $39.5 million recorded for the year ended December 31, 2010, and the common stock issued of $1.8 million as a result of our incentive stock option and dividend reinvestment plans, which were partially offset by a decrease in the accumulated other comprehensive income of $11.0 million, the payment of cash dividends to our shareholders of $13.2 million and the repurchase of common stock of $4.8 million through the stock repurchase plan. The decrease in accumulated other comprehensive income is comprised of a decrease of $7.4 million, net of tax, in the unrealized gain on securities, net of reclassification adjustment and an increase of $3.6 million, net of tax, related to the change in the unfunded status of our defined benefit plan. See “Note 3 – Comprehensive (Loss) Income” to our consolidated financial statements included in this report.
Our market areas to date, have not experienced the level of downturn in the economy and real estate prices that some of the harder hit areas of the country have experienced. However, we have experienced weakening conditions associated with the real estate led downturn. Many economists predict growth for the economy during 2011, however we are well aware that any economic recovery could be uneven. We cannot predict whether current economic conditions will improve, remain the same or decline.
Key financial indicators management follows include, but are not limited to, numerous interest rate sensitivity and interest rate risk indicators, credit risk, operations risk, liquidity risk, capital risk, regulatory risk, competition risk, yield curve risk, and economic risk indicators.
BALANCE SHEET STRATEGY
We utilize wholesale funding and securities to enhance our profitability and balance sheet composition by determining acceptable levels of credit, interest rate and liquidity risk consistent with prudent capital management. This balance sheet strategy consists of borrowing a combination of long and short-term funds from the FHLB and, when determined appropriate, issuing brokered CDs. These funds are invested primarily in U. S. agency mortgage-backed securities, and to a lesser extent, long-term municipal securities. Although U. S. agency mortgage-backed securities often carry lower yields than traditional mortgage loans and other types of loans we make, these securities generally (i) increase the overall quality of our assets because of either the implicit or explicit guarantees of the U.S. Government, (ii) are more liquid than individual loans and (iii) may be used to collateralize our borrowings or other obligations. While the strategy of investing a substantial portion of our assets in U. S. agency mortgage-backed securities and to a lesser extent municipal securities has historically resulted in lower interest rate spreads and margins, we believe that the lower operating expenses and reduced credit risk combined with the managed interest rate risk of this strategy have enhanced our overall profitability over the last several years. At this time, we utilize this balance sheet strategy with the goal of enhancing overall profitability by maximizing the use of our capital.
Risks associated with the asset structure we maintain include a lower net interest rate spread and margin when compared to our peers, changes in the slope of the yield curve, which can reduce our net interest rate spread and margin, increased interest rate risk, the length of interest rate cycles, changes in volatility spreads associated with the mortgage-backed securities and municipal securities, the unpredictable nature of mortgage-backed securities prepayments and credit risks associated with the municipal securities. See “Part I - Item 1A. Risk Factors – Risks Related to Our Business” for a discussion of risks related to interest rates. Our asset structure, net interest spread and net interest margin require us to closely monitor our interest rate risk. An additional risk is the change in market value of the AFS securities portfolio as a result of changes in interest rates. Significant increases in interest rates, especially long-term interest rates, could adversely impact the market value of the AFS securities portfolio, which could also significantly impact our equity capital. Due to the unpredictable nature of mortgage-backed securities prepayments, the length of interest rate cycles, and the slope of the interest rate yield curve, net interest income could fluctuate more than simulated under the scenarios modeled by our Asset/Liability Committee (“ALCO”) and described under “Item 7A. Quantitative and Qualitative Disclosures about Market Risk” in this report.
40
Determining the appropriate size of the balance sheet is one of the critical decisions any bank makes. Our balance sheet is not merely the result of a series of micro-decisions, but rather the size is controlled based on the economics of assets compared to the economics of funding. For several quarters up to and ending June 30, 2007, the size of our balance sheet was in a period of no growth or actual shrinkage due to the flat to inverted yield curve and tight volatility spreads during that time period. Beginning with the third quarter of 2007 we began deliberately increasing the size of our balance sheet taking advantage of the increasingly attractive economics of financial intermediation, due to the extraordinary volatility in the capital markets. As the volatility in the capital markets has moderated, the current investment and economic landscape makes it uncertain whether we will experience asset growth over the near term.
The management of our securities portfolio as a percentage of earning assets is guided by changes in our overall loan and deposit levels, combined with changes in our wholesale funding levels. If adequate quality loan growth is not available to achieve our goal of enhancing profitability by maximizing the use of capital, as described above, then we could purchase additional securities, if appropriate, which could cause securities as a percentage of earning assets to increase. Should we determine that increasing the securities portfolio or replacing the current securities maturities and principal payments is not an efficient use of capital, we could decrease the level of securities through proceeds from maturities, principal payments on mortgage-backed securities or sales. Our balance sheet strategy is designed such that our securities portfolio should help mitigate financial performance associated with slower loan growth and higher credit costs.
The year ended December 31, 2010 was marked by proactive management of the investment portfolio which included restructuring a portion of our investment portfolio. This restructuring resulted in a gain on the sale of securities available for sale of $25.8 million during 2010. In February of 2010, Fannie Mae and Freddie Mac announced a change in practice when an individual mortgage holder becomes delinquent on their obligation. This was not a credit event, but rather a change in the cash flows of the mortgage-backed securities. Consequently, we embarked on a strategy to identify mortgage-backed securities with cash flows that might become significantly more volatile as a result of this announcement, attempted to liquidate those securities, and replace them with securities with income and cash flow characteristics that were potentially more stable. During June and July we decided to liquidate substantially all municipal securities located outside the State of Texas due to growing municipal concerns, with less than $3 million remaining at December 31, 2010. During the third quarter and early parts of the fourth quarter interest rates decreased causing us to restructure a portion of the securities portfolio, selling securities to replace them with potentially better risk/reward securities. As interest rates increased significantly during the fourth quarter we sold selected securities and replaced them with securities that might perform better in the higher interest rate environment. During the fourth quarter ended December 31, 2010, we reduced both the duration and the size of the securities portfolio as long-term U.S. Treasury yields declined significantly. The net result was a decrease of $49.3 million in our investment and U.S. agency mortgage-backed securities from $1.71 billion at September 30, 2010, to $1.66 billion at December 31, 2010. The average coupon of the mortgage-backed securities portfolio decreased from 6.42% at December 31, 2009 to 5.90% at December 31, 2010. At December 31, 2010, securities as a percentage of assets decreased to 55.5%, when compared to 56.8% at September 30, 2010 and 57.8% at December 31, 2009. Our balance sheet management strategy is dynamic and will be continually reevaluated as market conditions warrant. As interest rates, yield curves, mortgage-backed securities prepayments, funding costs, security spreads and loan and deposit portfolios change, our determination of the proper types and maturities of securities to own, proper amount of securities to own and funding needs and funding sources will continue to be reevaluated. Should the economics of asset accumulation decrease, we might allow the balance sheet to shrink through run-off or asset sales. However, should the economics become more attractive, we will strategically increase the balance sheet.
41
With respect to liabilities, we will continue to utilize a combination of FHLB advances and deposits to achieve our strategy of minimizing cost while achieving overall interest rate risk objectives as well as the liability management objectives of the ALCO. FHLB funding and brokered CDs represent wholesale funding sources we are currently utilizing. Our FHLB borrowings at December 31, 2010 decreased 34.2%, or $292.3 million, to $562.6 million from $854.9 million at December 31, 2009 primarily as a result of an increase in deposits. During 2010 we entered into the option to purchase, between one and a half and two years forward from the advance commitment date, $150 million par in long-term advance commitments from FHLB at the FHLB rates on the date the option was purchased. As of December 31, 2010 we had $161.3 million in brokered CDs of which $20.0 million were short-term and $141.3 million were long-term. All of the long-term brokered CDs have short-term calls that we control. We utilized long-term callable brokered CDs because the brokered CDs better matched overall ALCO objectives at the time of issuance by protecting us with fixed rates should interest rates increase, while providing us options to call the funding should interest rates decrease. Our wholesale funding policy currently allows maximum brokered CDs of $165 million; however, this amount could be increased to match changes in ALCO objectives. The potential higher interest expense and lack of customer loyalty are risks associated with the use of brokered CDs. During 2010, a decrease in FHLB borrowings, coupled with the overall growth in deposits, resulted in a decrease in our total wholesale funding as a percentage of deposits, not including brokered CDs, to 36.7% at December 31, 2010, from 56.7% at December 31, 2009.
42
RESULTS OF OPERATIONS
Our results of operations are dependent primarily on net interest income, which is the difference between the interest income earned on assets (loans and investments) and interest expense due on our funding sources (deposits and borrowings) during a particular period. Results of operations are also affected by our noninterest income, provision for loan losses, noninterest expenses and income tax expense. General economic and competitive conditions, particularly changes in interest rates, changes in interest rate yield curves, prepayment rates of mortgage-backed securities and loans, repricing of loan relationships, government policies and actions of regulatory authorities, also significantly affect our results of operations. Future changes in applicable law, regulations or government policies may also have a material impact on us.
COMPARISON OF OPERATING RESULTS FOR THE YEARS ENDED DECEMBER 31, 2010 COMPARED TO DECEMBER 31, 2009
NET INTEREST INCOME
Net interest income is one of the principal sources of a financial institution's earnings stream and represents the difference or spread between interest and fee income generated from interest earning assets and the interest expense paid on deposits and borrowed funds. Fluctuations in interest rates or interest rate yield curves, as well as repricing characteristics and volume and changes in the mix of interest earning assets and interest bearing liabilities, materially impact net interest income.
|
Years ended December 31,
|
||||||||||||||||
|
2010
|
2009
|
Amount Change
|
Percent Change
|
|||||||||||||
|
(dollars in thousands)
|
||||||||||||||||
|
Interest income
|
||||||||||||||||
|
Loans
|
$ | 69,973 | $ | 70,679 | $ | (706 | ) | (1.0 | %) | |||||||
|
Investment securities - taxable
|
91 | 1,055 | (964 | ) | (91.4 | %) | ||||||||||
|
Investment securities - tax exempt
|
10,889 | 7,607 | 3,282 | 43.1 | % | |||||||||||
|
Mortgage-backed and related securities
|
50,130 | 65,463 | (15,333 | ) | (23.4 | %) | ||||||||||
|
FHLB stock and other investments
|
259 | 235 | 24 | 10.2 | % | |||||||||||
|
Other interest earning assets
|
32 | 154 | (122 | ) | (79.2 | %) | ||||||||||
|
Total interest income
|
131,374 | 145,193 | (13,819 | ) | (9.5 | %) | ||||||||||
|
Interest expense
|
||||||||||||||||
|
Deposits
|
18,969 | 22,682 | (3,713 | ) | (16.4 | %) | ||||||||||
|
Short-term obligations
|
7,563 | 4,696 | 2,867 | 61.1 | % | |||||||||||
|
Long-term obligations
|
18,775 | 25,294 | (6,519 | ) | (25.8 | %) | ||||||||||
|
Total interest expense
|
45,307 | 52,672 | (7,365 | ) | (14.0 | %) | ||||||||||
|
Net interest income
|
$ | 86,067 | $ | 92,521 | $ | (6,454 | ) | (7.0 | %) | |||||||
Net interest income for the year ended December 31, 2010 decreased $6.5 million, or 7.0%, compared to the same period in 2009. The overall decrease in net interest income was primarily the result of decreases in interest income from mortgage-backed and related securities which was due to the increased amortization expense that resulted primarily from the Fannie Mae and Freddie Mac repurchase of delinquent loans during the first and second quarters of 2010 and an overall increase in prepayments on mortgage-backed securities and to a lesser extent a decrease in interest income from loans and taxable investment securities along with an increase in interest expense on short-term obligations. This was partially offset by decreases in interest expense on deposits and long-term obligations and increases in interest income from tax-exempt investment securities.
During the year ended December 31, 2010, total interest income decreased $13.8 million, or 9.5%. The decrease in total interest income was the result of a decrease in the average yield on average interest earning assets from 5.82% for the year ended December 31, 2009 to 5.01% for the year ended December 31, 2010 which more than offset the increase in average interest earning assets of $175.5 million, or 6.7%, from $2.63 billion to $2.80 billion. The decrease in the yield on interest earning assets is reflective of an 11 basis point decrease in the yield on loans due to lower overall interest rates and a 123 basis point decrease in the yield on our securities portfolio due to a combination of increased prepayments in the mortgage-backed securities portfolio which increased amortization expense and lower
43
overall interest rates. Total interest expense decreased $7.4 million, or 14.0%, during the year ended December 31, 2010. The decrease was attributable to a decrease in the average yield on interest bearing liabilities for the year ended December 31, 2010, to 1.94% from 2.39% for the same period in 2009 which was partially offset by an increase in average interest bearing liabilities of $137.7 million, or 6.3%, from $2.20 billion to $2.34 billion. The decrease in the average yield on interest bearing liabilities of 45 basis points is a result of an overall decrease in interest rates. For the year ended December 31, 2010, our net interest spread decreased to 3.07% from 3.43%, and our net interest margin decreased to 3.39% from 3.81% when compared to the same period in 2009.
During the year ended December 31, 2010, average loans increased $10.1 million, or 1.0%, from $1.02 billion to $1.03 billion, compared to the same period in 2009. Automobile loans purchased through SFG and municipal loans represent a large part of this increase. The average yield on loans decreased from 7.21% for the year ended December 31, 2009 to 7.10% for the year ended December 31, 2010. The decrease in interest income on loans of $706,000, or 1.0%, for the year ended December 31, 2010 was the result of a decrease in the average yield which more than offset the increase in the average balance. The decrease in the yield on loans was due to overall lower interest rates.
Average investment and mortgage-backed securities increased $178.4 million, or 11.6%, from $1.54 billion to $1.72 billion, for the year ended December 31, 2010 when compared to the same period in 2009. This increase was the result of securities purchased due primarily to market volatility related to buying opportunities available throughout most of 2009 and early 2010. At December 31, 2010, virtually all of our mortgage-backed securities were fixed rate securities with less than one percent variable rate mortgage-backed securities. The overall yield on average investment and mortgage-backed securities decreased to 3.89% during the year ended December 31, 2010 from 5.12% during the same period in 2009. The decrease in the average yield primarily reflects increased amortization expense associated with increased mortgage-backed securities prepayments due to Freddie Mac and Fannie Mae repurchases of mortgage loans delinquent 120 days or more from mortgage-backed security pools (see additional discussion in “Balance Sheet Strategy”), increased prepayments due to lower interest rates creating refinancing alternatives, tighter spreads on mortgage-backed securities and overall lower interest rates. Interest income on investment and mortgage-backed securities decreased $13.0 million in 2010, or 17.6%, due to a decrease in the average yield which was partially offset by the increase in the average balance. A further decrease in long-term interest rate levels combined with lower volatility and credit spreads could negatively impact our net interest margin in the future due to increased prepayments and repricings.
Average FHLB stock and other investments decreased $2.8 million, or 6.9%, to $38.0 million, for the year ended December 31, 2010, when compared to $40.8 million for 2009 due to the decrease in FHLB advances during 2010 and the corresponding requirement to hold stock associated with those advances. Interest income from our FHLB stock and other investments increased $24,000, or 10.2%, during 2010, due to the increase in average yield from 0.58% for the year ended December 31, 2009 compared to 0.68% for the same period in 2010 which more than offset the decrease in the average balance. The FHLB stock is a variable instrument with the rate typically tied to the federal funds rate. We are required as a member of FHLB to own a specific amount of stock that changes as the level of our FHLB advances and asset size change.
We had no federal funds sold during the year ended December 31, 2010 therefore, average federal funds sold decreased $3.9 million, or 100%, when compared to 2009. Interest income from federal funds sold decreased $17,000, or 100%, for the year ended December 31, 2010 when compared to the same period in 2009. Average interest earning deposits decreased $7.4 million, or 34.7%, to $13.9 million, for the year ended December 31, 2010, when compared to $21.2 million for 2009. Interest income from interest earning deposits decreased $105,000, or 76.6%, for the year ended December 31, 2010, when compared to 2009, as a result of the decrease in the average balance and the average yield from 0.64% in 2009 to 0.23% in 2010.
During the year ended December 31, 2010, our average securities increased more than our average loans. As a result, the mix of our average interest earning assets reflected an increase in average total securities as a percentage of total average interest earning assets compared to the prior year as securities averaged 62.5% during 2010 compared to 60.0% during 2009, a direct result of securities purchases. Average loans were 37.0% of average total interest earning assets and other interest earning asset categories averaged 0.5% for December 31, 2010. During 2009, the comparable mix was 39.0% in loans and 1.0% in the other interest earning asset categories.
44
Total interest expense decreased $7.4 million, or 14.0%, during the year ended December 31, 2010. The decrease was primarily attributable to decreased funding costs as the average yield on interest bearing liabilities decreased from 2.39% for 2009 to 1.94% for the year ended December 31, 2010, which more than offset an increase in average interest bearing liabilities. The increase in average interest bearing liabilities included an increase in deposits of $211.0 million, or 15.9% that was partially offset by a decrease in FHLB advances and other short-term obligations of $73.3 million, or 9.0%.
The following table sets forth our deposit averages by category for the years ended December 31, 2010, 2009 and 2008:
|
COMPOSITION OF DEPOSITS
|
||||||||||||||||
|
Years Ended December 31,
|
||||||||||||||||
|
2010
|
2009
|
2008
|
||||||||||||||
|
(dollars in thousands)
|
||||||||||||||||
|
AVG BALANCE
|
AVG YIELD
|
AVG BALANCE
|
AVG YIELD
|
AVG BALANCE
|
AVG YIELD
|
|||||||||||
|
Interest Bearing Demand Deposits
|
$
|
723,315
|
0.71
|
%
|
$
|
573,937
|
1.02
|
%
|
$
|
500,955
|
2.08
|
%
|
||||
|
Savings Deposits
|
74,668
|
0.43
|
%
|
65,896
|
0.67
|
%
|
57,587
|
1.28
|
%
|
|||||||
|
Time Deposits
|
741,712
|
1.82
|
%
|
688,854
|
2.37
|
%
|
535,921
|
4.05
|
%
|
|||||||
|
Total Interest Bearing Deposits
|
1,539,695
|
1.23
|
%
|
1,328,687
|
1.71
|
%
|
1,094,463
|
3.01
|
%
|
|||||||
|
Noninterest Bearing Demand Deposits
|
415,162
|
N/A
|
379,991
|
N/A
|
372,160
|
N/A
|
||||||||||
|
Total Deposits
|
$
|
1,954,857
|
0.97
|
%
|
$
|
1,708,678
|
1.33
|
%
|
$
|
1,466,623
|
2.24
|
%
|
||||
Average interest bearing deposits increased $211.0 million, or 15.9%, from $1.33 billion to $1.54 billion, while the average rate paid decreased from 1.71% for the year ended December 31, 2009 to 1.23% for the year ended December 31, 2010. Average time deposits increased $52.9 million, or 7.7%, from $688.9 million to $741.7 million while the average rate paid decreased 55 basis points. Average interest bearing demand deposits increased $149.4 million, or 26.0%, while the average rate paid decreased 31 basis points. Average savings deposits increased $8.8 million, or 13.3%, while the average rate paid decreased 24 basis points. Interest expense for interest bearing deposits for the year ended December 31, 2010, decreased $3.7 million, or 16.4%, when compared to the same period in 2009 due to the decrease in the average yield which more than offset the increase in the average balance. Average noninterest bearing demand deposits increased $35.2 million, or 9.3%, during 2010. The latter three categories, which are considered the lowest cost deposits, comprised 62.1% of total average deposits during the year ended December 31, 2010 compared to 59.7% during 2009. The increase in our average total deposits during 2010 is primarily the result of an increase in deposits from municipalities and to a lesser extent, deposit growth due to branch expansion, continued market penetration, and an increase in brokered CDs issued.
At December 31, 2010, total brokered CDs issued were $161.3 million of which $20.0 million were short-term and $141.3 million were long-term. This represented an increase of $30.1 million, or 22.9% from 2009. All of the long-term brokered CDs have short-term calls that we control. We utilize long-term callable brokered CDs because the brokered CDs better match overall ALCO objectives at the time of issuance by protecting us with fixed rates should interest rates increase, while providing us options to call the funding should interest rates decrease. At December 31, 2010, brokered CDs represented 7.6% of deposits compared to 7.0% of deposits, at December 31, 2009. At December 31, 2010, all of the brokered CDs had maturities of less than six years. Our wholesale funding policy currently allows maximum brokered CDs of $165 million; however, this amount could be increased to match changes in ALCO objectives. The potential higher interest cost and lack of customer loyalty are risks associated with the use of brokered CDs.
45
Average short-term interest bearing liabilities, consisting primarily of FHLB advances and federal funds purchased and repurchase agreements, were $309.6 million, an increase of $100.6 million, or 48.1%, for the year ended December 31, 2010 when compared to the same period in 2009. Interest expense associated with short-term interest bearing liabilities increased $2.9 million, or 61.1%, and the average rate paid increased 19 basis points to 2.44% for the year ended December 31, 2010, when compared to 2.25% for the same period in 2009. The increase in the average rate paid was due to the higher rate long-term FHLB advances rolling into the short-term FHLB advances. The increase in the interest expense was due to an increase in the average rate paid and in the average balance of short-term interest bearing liabilities.
Average long-term interest bearing liabilities consisting of FHLB advances decreased $173.9 million, or 28.8%, during the year ended December 31, 2010 to $430.5 million as compared to $604.4 million at December 31, 2009. The decrease in the average long-term FHLB advances is due primarily to advances classified as long-term at December 31, 2009 rolling into the short-term category, an increase in the issuance of long-term callable brokered CDs, the use of more short-term FHLB advances during the period and the decision to enter into $150 million par in long-term advance commitments from the FHLB. During the third and fourth quarters of 2010, we entered into the option to fund between one and a half years and two years forward from the advance commitment date, $150 million par in long-term advance commitments from the FHLB at the FHLB rates on the date the option was purchased. In order to obtain these commitments from the FHLB we paid fees, which at December 31, 2010, were $7.6 million. The fee, included in other assets in our consolidated balance sheet, will be amortized over the term of the advance as long as it is probable we will exercise the advance commitments. Should we determine the advance commitments will not be exercised, the fee will be expensed in the period determination is made. Interest expense associated with long-term FHLB advances decreased $6.4 million, or 29.2%, and average rate paid decreased 2 basis points to 3.60% for the year ended December 31, 2010 when compared to 3.62% for the same period in 2009. The decrease in interest expense was due to the decrease in the average balance of long-term interest bearing liabilities and the decrease in the average rate paid. FHLB advances are collateralized by FHLB stock, securities and nonspecific real estate loans.
Average long-term debt, consisting of our junior subordinated debentures issued in 2003 and August 2007 and the junior subordinated debentures acquired in the purchase of FWBS, was $60.3 million for both of the years ended December 31, 2010 and 2009. Interest expense associated with long-term debt decreased $134,000, or 3.9%, to $3.3 million for the year ended December 31, 2010 when compared to $3.4 million for the same period in 2009 as a result of the decrease in the average yield of 22 basis points. The interest rate on the $20.6 million of long-term debentures issued to Southside Statutory Trust III adjusts quarterly at a rate equal to three-month LIBOR plus 294 basis points. The $23.2 million of long-term debentures issued to Southside Statutory Trust IV and the $12.9 million of long-term debentures issued to Southside Statutory Trust V have fixed rates of 6.518% through October 30, 2012 and 7.48% through December 15, 2012, respectively, and thereafter, adjusts quarterly. The interest rate on the $3.6 million of long-term debentures issued to Magnolia Trust Company I, assumed in the purchase of FWBS, adjusts quarterly at a rate equal to three-month LIBOR plus 180 basis points.
46
AVERAGE BALANCES AND YIELDS
The following table presents average balance sheet amounts and average yields for the years ended December 31, 2010, 2009 and 2008. The information should be reviewed in conjunction with the consolidated financial statements for the same years then ended. Two major components affecting our earnings are the interest earning assets and interest bearing liabilities. A summary of average interest earning assets and interest bearing liabilities is set forth below, together with the average yield on the interest earning assets and the average cost of the interest bearing liabilities.
|
AVERAGE BALANCES AND YIELDS
|
||||||||||||||||||||||||||
|
(dollars in thousands)
|
||||||||||||||||||||||||||
|
Years Ended
|
||||||||||||||||||||||||||
|
December 31, 2010
|
December 31, 2009
|
December 31, 2008
|
||||||||||||||||||||||||
|
AVG. BALANCE
|
INTEREST
|
AVG. YIELD
|
AVG. BALANCE
|
INTEREST
|
AVG. YIELD
|
AVG. BALANCE
|
INTEREST
|
AVG. YIELD
|
||||||||||||||||||
|
ASSETS
|
||||||||||||||||||||||||||
|
INTEREST EARNING ASSETS:
|
||||||||||||||||||||||||||
|
Loans(1) (2)
|
$
|
1,031,858
|
$
|
73,230
|
7.10
|
%
|
$
|
1,021,770
|
$
|
73,654
|
7.21
|
%
|
$
|
983,336
|
$
|
75,445
|
7.67
|
%
|
||||||||
|
Loans Held For Sale
|
5,123
|
189
|
3.69
|
%
|
4,098
|
161
|
3.93
|
%
|
2,487
|
121
|
4.87
|
%
|
||||||||||||||
|
Securities:
|
||||||||||||||||||||||||||
|
Inv. Sec. (Taxable)(4)
|
9,156
|
91
|
0.99
|
%
|
42,598
|
1,055
|
2.48
|
%
|
46,537
|
1,723
|
3.70
|
%
|
||||||||||||||
|
Inv. Sec. (Tax Exempt)(3)(4)
|
245,874
|
16,515
|
6.72
|
%
|
174,003
|
12,203
|
7.01
|
%
|
103,608
|
7,074
|
6.83
|
%
|
||||||||||||||
|
Mortgage-backed and related Sec.(4)
|
1,460,785
|
50,130
|
3.43
|
%
|
1,320,766
|
65,463
|
4.96
|
%
|
1,034,406
|
55,470
|
5.36
|
%
|
||||||||||||||
|
Total Securities
|
1,715,815
|
66,736
|
3.89
|
%
|
1,537,367
|
78,721
|
5.12
|
%
|
1,184,551
|
64,267
|
5.43
|
%
|
||||||||||||||
|
FHLB stock and other investments, at cost
|
37,973
|
259
|
0.68
|
%
|
40,786
|
235
|
0.58
|
%
|
31,875
|
841
|
2.64
|
%
|
||||||||||||||
|
Interest Earning Deposits
|
13,880
|
32
|
0.23
|
%
|
21,243
|
137
|
0.64
|
%
|
1,006
|
22
|
2.19
|
%
|
||||||||||||||
|
Federal Funds Sold
|
–
|
–
|
–
|
3,925
|
17
|
0.43
|
%
|
4,039
|
90
|
2.23
|
%
|
|||||||||||||||
|
Total Interest Earning Assets
|
2,804,649
|
140,446
|
5.01
|
%
|
2,629,189
|
152,925
|
5.82
|
%
|
2,207,294
|
140,786
|
6.38
|
%
|
||||||||||||||
|
NONINTEREST EARNING ASSETS:
|
||||||||||||||||||||||||||
|
Cash and Due From Banks
|
43,881
|
43,504
|
45,761
|
|||||||||||||||||||||||
|
Bank Premises and Equipment
|
48,709
|
45,231
|
40,449
|
|||||||||||||||||||||||
|
Other Assets
|
124,052
|
112,702
|
89,473
|
|||||||||||||||||||||||
|
Less: Allowance for Loan Loss
|
(19,135
|
)
|
(17,622
|
)
|
(11,318
|
)
|
||||||||||||||||||||
|
Total Assets
|
$
|
3,002,156
|
$
|
2,813,004
|
$
|
2,371,659
|
||||||||||||||||||||
|
(1)
|
Interest on loans includes fees on loans that are not material in amount.
|
|
(2)
|
Interest income includes taxable-equivalent adjustments of $3,446, $3,136 and $2,446 for the years ended December 31, 2010, 2009 and 2008, respectively.
|
|
(3)
|
Interest income includes taxable-equivalent adjustments of $5,626, $4,596 and $2,164 for the years ended December 31, 2010, 2009 and 2008, respectively.
|
|
(4)
|
For the purpose of calculating the average yield, the average balance of securities is presented at historical cost.
|
|
Note:
|
As of December 31, 2010, 2009 and 2008, loans totaling $14,524, $18,629 and $14,289, respectively, were on nonaccrual status. The policy is to reverse previously accrued but unpaid interest on nonaccrual loans; thereafter, interest income is recorded to the extent received when appropriate.
|
47
|
AVERAGE BALANCES AND YIELDS
|
|||||||||||||||||||||||||||
|
(dollars in thousands)
|
|||||||||||||||||||||||||||
|
Years Ended
|
|||||||||||||||||||||||||||
|
December 31, 2010
|
December 31, 2009
|
December 31, 2008
|
|||||||||||||||||||||||||
|
AVG. BALANCE
|
INTEREST
|
AVG. YIELD
|
AVG. BALANCE
|
INTEREST
|
AVG. YIELD
|
AVG. BALANCE
|
INTEREST
|
AVG. YIELD
|
|||||||||||||||||||
|
LIABILITIES AND
SHAREHOLDERS’ EQUITY
|
|||||||||||||||||||||||||||
|
INTEREST BEARING LIABILITIES:
|
|||||||||||||||||||||||||||
|
Savings Deposits
|
$
|
74,668
|
$
|
324
|
0.43
|
%
|
$
|
65,896
|
$
|
442
|
0.67
|
%
|
$
|
57,587
|
$
|
736
|
1.28
|
%
|
|||||||||
|
Time Deposits
|
741,712
|
13,514
|
1.82
|
%
|
688,854
|
16,360
|
2.37
|
%
|
535,921
|
21,727
|
4.05
|
%
|
|||||||||||||||
|
Interest Bearing
|
|||||||||||||||||||||||||||
|
Demand Deposits
|
723,315
|
5,131
|
0.71
|
%
|
573,937
|
5,880
|
1.02
|
%
|
500,955
|
10,428
|
2.08
|
%
|
|||||||||||||||
|
Total Interest Bearing
Deposits
|
1,539,695
|
18,969
|
1.23
|
%
|
1,328,687
|
22,682
|
1.71
|
%
|
1,094,463
|
32,891
|
3.01
|
%
|
|||||||||||||||
|
Short-term Interest
|
|||||||||||||||||||||||||||
|
Bearing Liabilities
|
309,649
|
7,563
|
2.44
|
%
|
209,048
|
4,696
|
2.25
|
%
|
290,895
|
8,969
|
3.08
|
%
|
|||||||||||||||
|
Long-term Interest Bearing
|
|||||||||||||||||||||||||||
|
Liabilities-FHLB Dallas
|
430,485
|
15,500
|
3.60
|
%
|
604,425
|
21,885
|
3.62
|
%
|
383,677
|
14,454
|
3.77
|
%
|
|||||||||||||||
|
Long-term Debt (5)
|
60,311
|
3,275
|
5.43
|
%
|
60,311
|
3,409
|
5.65
|
%
|
60,311
|
4,049
|
6.71
|
%
|
|||||||||||||||
|
Total Interest Bearing
Liabilities
|
2,340,140
|
45,307
|
1.94
|
%
|
2,202,471
|
52,672
|
2.39
|
%
|
1,829,346
|
60,363
|
3.30
|
%
|
|||||||||||||||
|
NONINTEREST BEARING LIABILITIES:
|
|||||||||||||||||||||||||||
|
Demand Deposits
|
415,162
|
379,991
|
372,160
|
||||||||||||||||||||||||
|
Other Liabilities
|
28,132
|
42,318
|
26,497
|
||||||||||||||||||||||||
|
Total Liabilities
|
2,783,434
|
2,624,780
|
2,228,003
|
||||||||||||||||||||||||
|
SHAREHOLDERS’ EQUITY (6)
|
218,722
|
188,224
|
143,656
|
||||||||||||||||||||||||
|
TOTAL LIABILITIES AND SHAREHOLDERS’ EQUITY
|
$
|
3,002,156
|
$
|
2,813,004
|
$
|
2,371,659
|
|||||||||||||||||||||
|
NET INTEREST INCOME
|
$
|
95,139
|
$
|
100,253
|
$
|
80,423
|
|||||||||||||||||||||
|
NET INTEREST MARGIN ON AVERAGE EARNING ASSETS
|
3.39
|
%
|
3.81
|
%
|
3.64
|
%
|
|||||||||||||||||||||
|
NET INTEREST SPREAD
|
3.07
|
%
|
3.43
|
%
|
3.08
|
%
|
|||||||||||||||||||||
|
(5)
|
Represents junior subordinated debentures issued by us to Southside Statutory Trust III, IV and V in connection with the issuance by Southside Statutory Trust III of $20 million of trust preferred securities, Southside Statutory Trust IV of $22.5 million of trust preferred securities, Southside Statutory Trust V of $12.5 million of trust preferred securities and junior subordinated debentures issued by FWBS to Magnolia Trust Company I in connection with the issuance by Magnolia Trust Company I of $3.5 million of trust preferred securities.
|
(6) Includes average equity of noncontrolling interest of $1,248, $815 and $487 for the years ended December 31, 2010, 2009 and 2008, respectively.
48
ANALYSIS OF CHANGES IN INTEREST INCOME AND INTEREST EXPENSE
The following tables set forth the dollar amount of increase (decrease) in interest income and interest expense resulting from changes in the volume of interest earning assets and interest bearing liabilities and from changes in yields (in thousands):
|
Years Ended December 31,
|
||||||||||||
|
2010 Compared to 2009
|
||||||||||||
|
Average
|
Average
|
Increase
|
||||||||||
|
Volume
|
Yield
|
(Decrease)
|
||||||||||
|
INTEREST INCOME:
|
||||||||||||
|
Loans (1)
|
$
|
723
|
$
|
(1,147
|
)
|
$
|
(424
|
)
|
||||
|
Loans Held For Sale
|
38
|
(10
|
)
|
28
|
||||||||
|
Investment Securities (Taxable)
|
(547
|
)
|
(417
|
)
|
(964
|
)
|
||||||
|
Investment Securities (Tax Exempt) (1)
|
4,847
|
(535
|
)
|
4,312
|
||||||||
|
Mortgage-backed and related Securities
|
6,393
|
(21,726
|
)
|
(15,333
|
)
|
|||||||
|
FHLB stock and other investments
|
(17
|
)
|
41
|
24
|
||||||||
|
Interest Earning Deposits
|
(37
|
)
|
(68
|
)
|
(105
|
)
|
||||||
|
Federal Funds Sold
|
(17
|
)
|
–
|
(17
|
)
|
|||||||
|
Total Interest Income
|
11,383
|
(23,862
|
)
|
(12,479
|
)
|
|||||||
|
INTEREST EXPENSE:
|
||||||||||||
|
Savings Deposits
|
53
|
(171
|
)
|
(118
|
)
|
|||||||
|
Time Deposits
|
1,183
|
(4,029
|
)
|
(2,846
|
)
|
|||||||
|
Interest Bearing Demand Deposits
|
1,315
|
(2,064
|
)
|
(749
|
)
|
|||||||
|
Short-term Interest Bearing Liabilities
|
2,427
|
440
|
2,867
|
|||||||||
|
Long-term FHLB Advances
|
(6,264
|
)
|
(121
|
)
|
(6,385
|
)
|
||||||
|
Long-term Debt
|
–
|
(134
|
)
|
(134
|
)
|
|||||||
|
Total Interest Expense
|
(1,286
|
)
|
(6,079
|
)
|
(7,365
|
)
|
||||||
|
Net Interest Income
|
$
|
12,669
|
$
|
(17,783
|
)
|
$
|
(5,114
|
)
|
||||
|
Years Ended December 31,
|
||||||||||||
|
2009 Compared to 2008
|
||||||||||||
|
Average
|
Average
|
Increase
|
||||||||||
|
Volume
|
Yield
|
(Decrease)
|
||||||||||
|
INTEREST INCOME:
|
||||||||||||
|
Loans (1)
|
$
|
2,879
|
$
|
(4,670
|
)
|
$
|
(1,791
|
)
|
||||
|
Loans Held For Sale
|
67
|
(27
|
)
|
40
|
||||||||
|
Investment Securities (Taxable)
|
(136
|
)
|
(532
|
)
|
(668
|
)
|
||||||
|
Investment Securities (Tax Exempt) (1)
|
4,932
|
197
|
5,129
|
|||||||||
|
Mortgage-backed and related Securities
|
14,443
|
(4,450
|
)
|
9,993
|
||||||||
|
FHLB stock and other investments
|
187
|
(793
|
)
|
(606
|
)
|
|||||||
|
Interest Earning Deposits
|
141
|
(26
|
)
|
115
|
||||||||
|
Federal Funds Sold
|
(3
|
)
|
(70
|
)
|
(73
|
)
|
||||||
|
Total Interest Income
|
22,510
|
(10,371
|
)
|
12,139
|
||||||||
|
INTEREST EXPENSE:
|
||||||||||||
|
Savings Deposits
|
94
|
(388
|
)
|
(294
|
)
|
|||||||
|
Time Deposits
|
5,152
|
(10,519
|
)
|
(5,367
|
)
|
|||||||
|
Interest Bearing Demand Deposits
|
1,347
|
(5,895
|
)
|
(4,548
|
)
|
|||||||
|
Short-term Interest Bearing Liabilities
|
(2,175
|
)
|
(2,098
|
)
|
(4,273
|
)
|
||||||
|
Long-term FHLB Advances
|
8,013
|
(582
|
)
|
7,431
|
||||||||
|
Long-term Debt
|
–
|
(640
|
)
|
(640
|
)
|
|||||||
|
Total Interest Expense
|
12,431
|
(20,122
|
)
|
(7,691
|
)
|
|||||||
|
Net Interest Income
|
$
|
10,079
|
$
|
9,751
|
$
|
19,830
|
||||||
|
(1)
|
Interest yields on loans and securities that are nontaxable for federal income tax purposes are presented on a taxable equivalent basis.
|
NOTE: Volume/Yield variances (change in volume times change in yield) have been allocated to amounts attributable to changes in volumes and to changes in yields in proportion to the amounts directly attributable to those changes.
49
PROVISION FOR LOAN LOSSES
The provision for loan losses for the year ended December 31, 2010 was $13.7 million compared to $15.1 million for the year ended December 31, 2009. For the year ended December 31, 2010, net charge-offs of loans increased $1.6 million, to $12.9 million when compared to $11.3 million for the same period in 2009.
The increase in net charge-offs for 2010 was due to a combination of an increase in total charge-offs of $3.3 million while offset by an increase in total recoveries of $1.7 million. Net charge-offs for loans to individuals increased $1.8 million, to $9.6 million for the year ended December 31, 2010 which included $8.4 million in net charge-offs from the SFG automobile loan portfolio.
As of December 31, 2010, our review of the loan portfolio indicated that a loan loss allowance of $20.7 million was adequate to cover probable losses in the portfolio.
NONINTEREST INCOME
Noninterest income consists of revenues generated from a broad range of financial services and activities including deposit related fee based services. The following schedule lists the accounts from which noninterest income was derived, gives totals for these accounts for the year ended December 31, 2010 and the comparable year ended December 31, 2009 and indicates the percentage changes:
|
Years Ended
|
||||||||||||
|
December 31,
|
Percent
|
|||||||||||
|
2010
|
2009
|
Change
|
||||||||||
|
(dollars in thousands)
|
||||||||||||
|
Deposit services
|
$ | 16,819 | $ | 17,629 | (4.6 | %) | ||||||
|
Gain on sale of securities available for sale
|
25,789 | 33,446 | (22.9 | %) | ||||||||
|
Total other-than-temporary impairment losses
|
(39 | ) | (5,730 | ) | 99.3 | % | ||||||
|
Portion of loss recognized in other comprehensive income (before taxes)
|
(36 | ) | 2,730 | (101.3 | %) | |||||||
|
Net impairment losses recognized in earnings
|
(75 | ) | (3,000 | ) | 97.5 | % | ||||||
|
Gain on sale of loans
|
1,751 | 1,240 | 41.2 | % | ||||||||
|
Trust income
|
2,368 | 2,456 | (3.6 | %) | ||||||||
|
Bank owned life insurance income
|
1,155 | 1,724 | (33.0 | %) | ||||||||
|
Other
|
3,589 | 3,179 | 12.9 | % | ||||||||
|
Total noninterest income
|
$ | 51,396 | $ | 56,674 | (9.3 | %) | ||||||
Total noninterest income for the year ended December 31, 2010 decreased 9.3%, or $5.3 million, compared to 2009. During the year ended December 31, 2010, we had gains on sale of AFS securities, net of impairment charges of $25.7 million compared to gains of $30.4 million for the same period in 2009. The market value of the AFS securities portfolio at December 31, 2010 was $1.25 billion with a net unrealized gain on that date of $13.9 million. The net unrealized gain is comprised of $25.8 million in unrealized gains and $11.9 million in unrealized losses. The market value of HTM securities portfolio at December 31, 2010 was $428.1 million with a net unrealized gain on that date of $8.8 million. The net unrealized gain is comprised of $9.4 million in unrealized gains and $664,000 in unrealized losses. The year ended December 31, 2010 was marked by proactive management of the investment portfolio which included restructuring a portion of our investment portfolio. This restructuring resulted in a gain on the sale of securities available for sale of $25.8 million during 2010. In February of 2010, Fannie Mae and Freddie Mac announced a change in practice when an individual mortgage holder becomes delinquent on their obligation. This was not a credit event, but rather a change in the cash flows of the mortgage-backed securities. Consequently, we embarked on a strategy to identify mortgage-backed securities with cash flows that might become significantly more volatile as a result of this announcement, attempted to liquidate those securities, and replace them with securities with income and cash flow characteristics that were potentially more stable.
50
During June and July we decided to liquidate substantially all municipal securities located outside the State of Texas due to growing municipal concerns, with less than $3 million remaining at December 31, 2010. During the third quarter and early parts of the fourth quarter interest rates decreased causing us to restructure a portion of the securities portfolio, selling securities to replace them with potentially better risk/reward securities. As interest rates increased significantly during the fourth quarter we sold selected securities and replaced them with securities that might perform better in the higher interest rate environment. There can be no assurance that the level of security gains reported during the year ended December 31, 2010, will continue in future periods
Gain on sale of loans increased $511,000, or 41.2%, for the year ended December 31, 2010, when compared to the same period in 2009. This is primarily a result of the gains on sales of mortgage loans and reflects an increase in the volume of loans sold.
Bank owned life insurance (“BOLI”) income decreased $569,000, or 33.0%, for the year ended December 31, 2010, when compared to the same period in 2009 primarily as a result of a decrease in death proceeds related to death benefits received in 2009.
Other income increased $410,000, or 12.9%, for the year ended December 31, 2010, when compared to the same period in 2009 as a result of increases in face value of written loan commitments, credit life income, check printing fees and brokerage service income.
NONINTEREST EXPENSE
The following schedule lists the accounts which comprise noninterest expense, gives totals for these accounts for the years ended December 31, 2010 and 2009 and indicates the percentage changes:
|
Years Ended
|
||||||||||||
|
December 31,
|
Percent
|
|||||||||||
|
2010
|
2009
|
Change
|
||||||||||
|
(dollars in thousands)
|
||||||||||||
|
Salaries and employee benefits
|
$ | 43,957 | $ | 42,505 | 3.4 | % | ||||||
|
Occupancy expense
|
6,780 | 6,372 | 6.4 | % | ||||||||
|
Equipment expense
|
1,899 | 1,718 | 10.5 | % | ||||||||
|
Advertising, travel and entertainment
|
2,319 | 2,344 | (1.1 | %) | ||||||||
|
ATM and debit card expense
|
825 | 1,296 | (36.3 | %) | ||||||||
|
Director fees
|
950 | 785 | 21.0 | % | ||||||||
|
Supplies
|
902 | 863 | 4.5 | % | ||||||||
|
Professional fees
|
2,015 | 2,218 | (9.2 | %) | ||||||||
|
Postage
|
800 | 872 | (8.3 | %) | ||||||||
|
Telephone and communications
|
1,443 | 1,424 | 1.3 | % | ||||||||
|
FDIC insurance
|
2,909 | 3,943 | (26.2 | %) | ||||||||
|
Other
|
6,515 | 7,290 | (10.6 | %) | ||||||||
|
Total noninterest expense
|
$ | 71,314 | $ | 71,630 | (0.4 | %) | ||||||
Noninterest expense for the year ended December 31, 2010 decreased $316,000, or 0.4%, when compared to the year ended December 31, 2009. Salaries and employee benefits expense increased $1.5 million, or 3.4%, during the year ended December 31, 2010, when compared to the same period in 2009. Direct salary expense and payroll taxes increased $2.0 million, or 5.7%, for the year ended December 31, 2010, when compared to the same period in 2009. These increases were the result of the increases in personnel associated with our overall growth and expansion, including SFG and normal salary increases for existing personnel.
Retirement expense, included in salary and benefits, decreased $706,000, or 18.9%, for the year ended December 31, 2010, when compared to the same period in 2009. The decrease was primarily related to the decrease in the defined benefit plan expense due to an increase in the fair value of the plan assets. The actuarial assumptions used to determine net periodic pension costs for 2010 assumed a long-
51
term rate of return of 7.5% and a discount rate of 6.1%. These assumptions remained unchanged from 2009. We will continue to evaluate the assumed long-term rate of return and the discount rate to determine if either should be changed in the future. If either of these assumed rates decrease, the cost and funding required for the retirement plan could increase.
Health and life insurance expense, included in salary and benefits, increased $168,000, or 4.6%, for the year ended December 31, 2010, when compared to the same period in 2009 due to increased health claims expense and plan administrative cost during 2010. We have a self-insured health plan which is supplemented with stop loss insurance policies. Health insurance costs are rising nationwide and these costs may continue to increase during 2011.
Equipment expense increased $181,000, or 10.5%, for the year ended December 31, 2010, when compared to the same period in 2009 as a result of increases in equipment service contracts and bank growth.
ATM and debit card expense decreased $471,000, or 36.3% for the year ended December 31, 2010, compared to the same period in 2009 due to cost savings in relation to our new core banking system which allowed us to bring our ATM and debit card processing in house during the fourth quarter of 2009.
Director fees increased $165,000, or 21.0%, for the year ended December 31, 2010, compared to the same period in 2009 due primarily to an increase in the number of directors.
FDIC insurance decreased $1.0 million, or 26.2%, for the year ended December 31, 2010, compared to the same period in 2009 due to a special FDIC assessment of $1.3 million during the second quarter of 2009.
Other expenses decreased $775,000, or 10.6%, for the year ended December 31, 2010 compared to the same period in 2009 due primarily to a decrease in the losses on ORE property and computer fees while partially offset by increases in ORE and repossessed asset expense.
INCOME TAXES
Pre-tax income for the year ended December 31, 2010 was $52.4 million compared to $62.5 million for the year ended December 31, 2009.
Income tax expense was $12.0 million for the year ended December 31, 2010 and represented a decrease of $4.6 million, or 28.0%, when compared to the year ended December 31, 2009. The effective tax rate as a percentage of pre-tax income was 22.8% in 2010 and 26.6% in 2009. The decrease in the income tax expense and effective tax rate for the year ended December 31, 2010 was due to an increase in tax exempt income as a percentage of taxable income as compared to the same period in 2009. Net deferred assets totaled $6.7 million at December 31, 2010 as compared to $1.6 million in 2009.
52
COMPARISON OF OPERATING RESULTS FOR THE YEARS ENDED DECEMBER 31, 2009 COMPARED TO DECEMBER 31, 2008
NET INTEREST INCOME
Net interest income for the year ended December 31, 2009 was $92.5 million, an increase of $16.7 million, or 22.0%, compared to the same period in 2008. The overall increase in net interest income was primarily the result of increases in interest income from tax exempt investment securities and mortgage-backed and related securities and a decrease in interest expense on deposits and short-term obligations that was partially offset by a decrease in interest income on loans and an increase in interest expense on long-term obligations. During the year ended December 31, 2009, total interest income increased $9.0 million, or 6.6%, from $136.2 million to $145.2 million. The increase in total interest income was the result of an increase in average interest earning assets of $421.9 million, or 19.1%, from $2.21 billion to $2.63 billion, while partially offset by a decrease in average yield on average interest earning assets from 6.38% for the year ended December 31, 2008 to 5.82% for the year ended December 31, 2009. Total interest expense decreased $7.7 million, or 12.7%, to $52.7 million during the year ended December 31, 2009 as compared to $60.4 million during the same period in 2008. The decrease was attributable to a decrease in the average yield on interest bearing liabilities for the year ended December 31, 2009, to 2.39% from 3.30% for the same period in 2008 while partially offset by an increase in average interest bearing liabilities of $373.1 million, or 20.4%, from $1.83 billion to $2.20 billion.
Net interest income increased during 2009 as a result of increases in our average interest earning assets and net interest margin on average earning assets during 2009 when compared to 2008. This is a result of an increase in the average balance of our interest earning assets combined with a decrease in the average yield on the average interest bearing liabilities. The decrease in the yield on interest earning assets is reflective of a 46 basis point decrease in the yield on loans and, a 31 basis point decrease in the yield on our securities portfolio, which is the result of overall lower interest rates and higher credit and volatility spreads. The decrease in the average yield on interest bearing liabilities of 91 basis points is a result of an overall decrease in interest rates. For the year ended December 31, 2009, our net interest spread increased to 3.43% from 3.08%, and our net interest margin increased to 3.81% from 3.64% when compared to the same period in 2008.
During the year ended December 31, 2009, average loans increased $38.4 million, or 3.9% from $983.3 million to $1.02 billion, compared to the same period in 2008. Automobile loans purchased through SFG and municipal loans represent a large part of this increase. The average yield on loans decreased from 7.67% for the year ended December 31, 2008 to 7.21% for the year ended December 31, 2009. The decrease in interest income on loans of $2.4 million, or 3.3%, to $70.7 million for the year ended December 31, 2009, when compared to $73.1 million for the same period in 2008 was the result of a decrease in the average yield which more than offset the increase in the average balance. The decrease in the yield on loans was due to overall lower interest rates.
Average investment and mortgage-backed securities increased $352.8 million, or 29.8%, from $1.18 billion to $1.54 billion, for the year ended December 31, 2009 when compared to the same period in 2008. This increase was the result of securities purchased due primarily to market volatility related to buying opportunities available throughout most of 2009. At December 31, 2009, virtually all of our mortgage-backed securities were fixed rate securities with less than one percent variable rate mortgage-backed securities. The overall yield on average investment and mortgage-backed securities decreased to 5.12% during the year ended December 31, 2009 from 5.43% during the same period in 2008. The decrease in the average yield primarily reflects increased prepayments due to lower interest rates creating refinancing alternatives, tighter spreads on mortgage-backed securities and overall lower interest rates. Interest income on investment and mortgage-backed securities increased $12.0 million in 2009, or 19.4%, compared to 2008 due to the increase in the average balance which was partially offset by the decrease in average yield. A return to lower long-term interest rate levels combined with lower volatility and credit spreads similar to those experienced in May and June of 2003 could negatively impact our net interest margin in the future due to increased prepayments and repricings.
Average FHLB stock and other investments increased $8.9 million, or 28.0%, to $40.8 million, for the year ended December 31, 2009, when compared to $31.9 million for 2008. Interest income from our FHLB stock and other investments decreased $606,000, or 72.1%, during 2009, when compared to 2008, due to the decrease in average yield from 2.64% for the year ended December 31, 2008 compared to 0.58% for the same period in 2009 which more than offset the increase in the average balance. The
53
FHLB stock is a variable instrument with the rate typically tied to the federal funds rate. We are required as a member of FHLB to own a specific amount of stock that changes as the level of our FHLB advances and asset size change.
Average federal funds sold and other interest earning assets increased $20.1 million, or 398.9%, to $25.2 million, for the year ended December 31, 2009, when compared to $5.0 million for 2008. Interest income from federal funds sold and other interest earning assets increased $42,000, or 37.5%, for the year ended December 31, 2009, when compared to 2008, as a result of the increase in the average balance while partially offset by a decrease in the average yield from 2.22% in 2008 to 0.61% in 2009.
During the year ended December 31, 2009, our average securities increased more than our average loans. As a result, the mix of our average interest earning assets reflected an increase in average total securities as a percentage of total average interest earning assets compared to the prior year as securities averaged 60.0% during 2009 compared to 55.1% during 2008, a direct result of securities purchases. Average loans were 39.0% of average total interest earning assets and other interest earning asset categories averaged 1.0% for December 31, 2009. During 2008, the comparable mix was 44.7% in loans and 0.2% in the other interest earning asset categories.
Total interest expense decreased $7.7 million, or 12.7%, to $52.7 million during the year ended December 31, 2009 as compared to $60.4 million during the same period in 2008. The decrease was primarily attributable to decreased funding costs as the average yield on interest bearing liabilities decreased from 3.30% for 2008 to 2.39% for the year ended December 31, 2009, which more than offset an increase in average interest bearing liabilities. The increase in average interest bearing liabilities included an increase in deposits and FHLB advances of $373.1 million, or 20.4%.
Average interest bearing deposits increased $234.2 million, or 21.4%, from $1.09 billion to $1.33 billion, while the average rate paid decreased from 3.01% for the year ended December 31, 2008 to 1.71% for the year ended December 31, 2009. Average time deposits increased $152.9 million, or 28.5%, from $535.9 million to $688.9 million while the average rate paid decreased 168 basis points. Average interest bearing demand deposits increased $73.0 million, or 14.6%, while the average rate paid decreased 106 basis points. Average savings deposits increased $8.3 million, or 14.4%, while the average rate paid decreased 61 basis points. Interest expense for interest bearing deposits for the year ended December 31, 2009, decreased $10.2 million, or 31.0%, when compared to the same period in 2008 due to the decrease in the average yield which more than offset the increase in the average balance. Average noninterest bearing demand deposits increased $7.8 million, or 2.1%, during 2009. The latter three categories, which are considered the lowest cost deposits, comprised 59.7% of total average deposits during the year ended December 31, 2009 compared to 63.5% during 2008. The increase in our average total deposits during 2009 is the result of overall bank growth, branch expansion, an increase in public funds deposits and an increase in brokered CDs issued.
During the year ended December 31, 2009, we issued $9.9 million of what are now short-term brokered CDs, and $121.5 million of long-term brokered CDs. At December 31, 2009, all of our brokered CDs had maturities of less than 10 years. At December 31, 2009, the long-term brokered CDs of $121.3 million had calls that we controlled, all of which were twelve months or less. At December 31, 2009, we had $131.2 million in brokered CDs that represented 7.0% of deposits compared to $40.0 million, or 2.6% of deposits, at December 31, 2008. At December 31, 2008, the $40.0 million of brokered CDs had maturities of less than one year. Our current policy allows for a maximum of $150 million in brokered CDs. The potential higher interest cost and lack of customer loyalty are risks associated with the use of brokered CDs.
Average short-term interest bearing liabilities, consisting primarily of FHLB advances and federal funds purchased and repurchase agreements, were $209.0 million, a decrease of $81.8 million, or 28.1%, for the year ended December 31, 2009 when compared to the same period in 2008. Interest expense associated with short-term interest bearing liabilities decreased $4.3 million, or 47.6%, and the average rate paid decreased 83 basis points to 2.25% for the year ended December 31, 2009, when compared to 3.08% for the same period in 2008. The decrease in the interest expense was due to a decrease in the average rate paid and in the average balance of short-term interest bearing liabilities.
Average long-term interest bearing liabilities consisting of FHLB advances increased $220.7 million, or 57.5%, during the year ended December 31, 2009 to $604.4 million as compared to $383.7 million at December 31, 2008. The increase in the average long-term FHLB advances occurred primarily as a result
54
of lower long-term rates during 2009, the increase in our securities portfolio and the need to mitigate the risk associated with any potential increase in future interest rates. Interest expense associated with long-term FHLB advances increased $7.4 million, or 51.4%, while the average rate paid decreased 15 basis points to 3.62% for the year ended December 31, 2009 when compared to 3.77% for the same period in 2008. The increase in interest expense was due to the increase in the average balance of long-term interest bearing liabilities which more than offset the decrease in the average rate paid. FHLB advances are collateralized by FHLB stock, securities and nonspecific real estate loans.
Average long-term debt, consisting of our junior subordinated debentures issued in 2003 and August 2007 and junior subordinated debentures acquired in the purchase of FWBS, was $60.3 million for both of the years ended December 31, 2009 and 2008. Interest expense decreased $640,000, or 15.8%, to $3.4 million for the year ended December 31, 2009 when compared to $4.0 million for the same period in 2008 as a result of the decrease in the average yield of 106 basis points. The interest rate on the $20.6 million of long-term debentures issued to Southside Statutory Trust III adjusts quarterly at a rate equal to three-month LIBOR plus 294 basis points. The $23.2 million of long-term debentures issued to Southside Statutory Trust IV and the $12.9 million of long-term debentures issued to Southside Statutory Trust V have fixed rates of 6.518% through October 30, 2012 and 7.48% through December 15, 2012, respectively, and thereafter, adjusts quarterly. The interest rate on the $3.6 million of long-term debentures issued to Magnolia Trust Company I, assumed in the purchase of FWBS, adjusts quarterly at a rate equal to three-month LIBOR plus 180 basis points.
PROVISION FOR LOAN LOSSES
The provision for loan losses for the year ended December 31, 2009 was $15.1 million compared to $13.7 million for the year ended December 31, 2008. For the year ended December 31, 2009, net charge-offs of loans increased $4.0 million, to $11.3 million when compared to $7.3 million for the same period in 2008.
The increase in net charge-offs for 2009 was due to a combination of an increase in total charge-offs of $4.0 million and a decrease in total recoveries of $43,000. Net charge-offs for commercial loans increased $1.5 million from 2008 primarily as a result of an overall increase in charge-offs. Net charge-offs for loans to individuals increased $1.1 million, to $7.9 million for the year ended December 31, 2009 which included $6.6 million in net charge-offs from the SFG automobile loan portfolio. Net charge-offs for construction real estate loans increased $819,000, to $930,000 for the year ended December 31, 2009.
As of December 31, 2009, our review of the loan portfolio indicated that a loan loss allowance of $19.9 million was adequate to cover probable losses in the portfolio.
NONINTEREST INCOME
Noninterest income consists of revenues generated from a broad range of financial services and activities including deposit related fee based services. The following schedule lists the accounts from which noninterest income was derived, gives totals for these accounts for the year ended December 31, 2009 and the comparable year ended December 31, 2008 and indicates the percentage changes:
55
|
Years Ended
|
||||||||||||
|
December 31,
|
Percent
|
|||||||||||
|
2009
|
2008
|
Change
|
||||||||||
|
(dollars in thousands)
|
||||||||||||
|
Deposit services
|
$ | 17,629 | $ | 18,395 | (4.2 | %) | ||||||
|
Gain on sale of securities available for sale
|
33,446 | 12,334 | 171.2 | % | ||||||||
|
Total other-than-temporary impairment losses
|
(5,730 | ) | – | 100.0 | % | |||||||
|
Portion of loss recognized in other comprehensive income (before taxes)
|
2,730 | – | 100.0 | % | ||||||||
|
Net impairment losses recognized in earnings
|
(3,000 | ) | – | 100.0 | % | |||||||
|
Gain on sale of loans
|
1,240 | 1,757 | (29.4 | %) | ||||||||
|
Trust income
|
2,456 | 2,465 | (0.4 | %) | ||||||||
|
Bank owned life insurance income
|
1,724 | 2,246 | (23.2 | %) | ||||||||
|
Other
|
3,179 | 3,105 | 2.4 | % | ||||||||
|
Total noninterest income
|
$ | 56,674 | $ | 40,302 | 40.6 | % | ||||||
Total noninterest income for the year ended December 31, 2009 increased 40.6%, or $16.4 million, compared to 2008. During the year ended December 31, 2009, we had gains on sale of AFS securities, net of impairment charges of $30.4 million compared to gains of $12.3 million for the same period in 2008. The market value of the AFS securities portfolio at December 31, 2009 was $1.50 billion with a net unrealized gain on that date of $25.6 million. The net unrealized gain is comprised of $33.9 million in unrealized gains and $8.3 million in unrealized losses. The market value of HTM securities portfolio at December 31, 2009 was $249.3 million with a net unrealized gain on that date of $5.1 million. The net unrealized gain is comprised of $5.9 million in unrealized gains and $802,000 in unrealized losses. During 2009, volatility associated with the direction of interest rates and credit spreads for both agency mortgage-backed securities and municipal securities provided opportunities to reposition portions of both the mortgage-backed securities portfolio as well as portions of the municipal portfolio. During 2009, as credit and volatility spreads tightened in the face of a steepening interest rate yield curve, we repositioned a portion of the mortgage-backed and municipal securities portfolio by selling selected securities with market values that did not compensate the bank for the potential funding risk and to accomplish overall ALCO investment portfolio objectives. As part of these sales, on average, lower coupon mortgage-backed securities were sold and on average replaced with higher coupon mortgage-backed securities. We believe the higher coupon has less funding risk should interest rates increase.
Municipal securities purchased during a period of tremendous volatility in 2008 at what management believed were attractive prices, were sold, as market prices and spreads returned to levels which appeared consistent with a more liquid market. The level of security gains during the year ended December 31, 2009, are unlikely to be repeated in future quarters.
Deposit services income decreased $766,000, or 4.2%, for the year ended December 31, 2009, when compared to the same period in 2008, primarily as a result of decreases in overdraft and NSF fee income.
Gain on sale of loans decreased $517,000, or 29.4%, for the year ended December 31, 2009, when compared to the same period in 2008. This is primarily a result of the sale of selected loans from automobile loans purchased by SFG at a loss of $389,000 during 2009 combined with the sale of selected loans from automobile loans purchased by SFG at gains of $333,000 during 2008 and a decrease in gains on the sale of student loans of $272,000, all of which more than offset the gains on sales of mortgage loans.
Bank owned life insurance (“BOLI”) income decreased $522,000, or 23.2%, for the year ended December 31, 2009, when compared to the same period in 2008 primarily as a result of a decrease in death proceeds received related to two death benefits received in 2008.
56
NONINTEREST EXPENSE
The following schedule lists the accounts which comprise noninterest expense, gives totals for these accounts for the years ended December 31, 2009 and 2008 and indicates the percentage changes:
|
Years Ended
|
||||||||||||
|
December 31,
|
Percent
|
|||||||||||
|
2009
|
2008
|
Change
|
||||||||||
|
(dollars in thousands)
|
||||||||||||
|
Salaries and employee benefits
|
$ | 42,505 | $ | 37,228 | 14.2 | % | ||||||
|
Occupancy expense
|
6,372 | 5,704 | 11.7 | % | ||||||||
|
Equipment expense
|
1,718 | 1,305 | 31.6 | % | ||||||||
|
Advertising, travel and entertainment
|
2,344 | 2,097 | 11.8 | % | ||||||||
|
ATM and debit card expense
|
1,296 | 1,211 | 7.0 | % | ||||||||
|
Director fees
|
785 | 674 | 16.5 | % | ||||||||
|
Supplies
|
863 | 812 | 6.3 | % | ||||||||
|
Professional fees
|
2,218 | 1,864 | 19.0 | % | ||||||||
|
Postage
|
872 | 755 | 15.5 | % | ||||||||
|
Telephone and communications
|
1,424 | 1,050 | 35.6 | % | ||||||||
|
FDIC insurance
|
3,943 | 966 | 308.2 | % | ||||||||
|
Other
|
7,290 | 6,686 | 9.0 | % | ||||||||
|
Total noninterest expense
|
$ | 71,630 | $ | 60,352 | 18.7 | % | ||||||
Noninterest expense for the year ended December 31, 2009 increased $11.3 million, or 18.7%, when compared to the year ended December 31, 2008. Salaries and employee benefits expense increased $5.3 million, or 14.2%, during the year ended December 31, 2009, when compared to the same period in 2008. Direct salary expense and payroll taxes increased $4.0 million, or 12.8%, for the year ended December 31, 2009, when compared to the same period in 2008. These increases were the result of the increases in personnel associated with our overall growth and expansion including SFG, normal salary increases for existing personnel and an increase in incentive pay during 2009.
Retirement expense, included in salary and benefits, increased $328,000, or 9.6%, for the year ended December 31, 2009, when compared to the same period in 2008. The increase was related to the increase in the defined benefit and restoration plan which more than offset the decrease to the retirement agreement for the Chairman and Chief Executive Officer executed during the third quarter of 2008. The defined benefit and restoration plan increased primarily due to the changes in the actuarial assumptions used to determine net periodic pension costs for 2009 when compared to 2008. Specifically, the assumed long-term rate of return was 7.5% and the assumed discount rate was decreased to 6.1%. We will continue to evaluate the assumed long-term rate of return and the discount rate to determine if either should be changed in the future. If either of these assumptions were decreased, the cost and funding required for the retirement plan could increase.
Health and life insurance expense, included in salary and benefits, increased $968,000, or 35.6%, for the year ended December 31, 2009, when compared to the same period in 2008 due to increased health claims expense and plan administrative cost during 2009. We have a self-insured health plan which is supplemented with stop loss insurance policies. Health insurance costs are rising nationwide and these costs may continue to increase during 2010.
Occupancy expense increased $668,000, or 11.7%, for the year ended December 31, 2009, when compared to the same period in 2008 primarily as a result of the opening of one branch during the third quarter of 2008 and another branch early third quarter 2009.
Equipment expense increased $413,000, or 31.6%, for the year ended December 31, 2009, when compared to the same period in 2008 as a result of increases in equipment service contracts and bank growth.
57
Advertising, travel and entertainment increased $247,000, or 11.8%, for the year ended December 31, 2009, when compared to the same period in 2008 as a result of bank growth and increased advertising expenses.
Director fees increased $111,000, or 16.5%, for the year ended December 31, 2009, compared to the same period in 2008 due to an increase in the number of directors, additional meetings and additional number of directors attending committee meetings as well as year-end bonuses paid to our directors.
Professional fees increased $354,000, or 19.0%, for the year ended December 31, 2009, compared to the same period in 2008 primarily as a result of increases in legal fees.
Postage increased $117,000, or 15.5%, for the year ended December 31, 2009, when compared to the same period in 2008 due to bank growth and an increase in postage rates.
Telephone and communications increased $374,000, or 35.6%, for the year ended December 31, 2009, when compared to the same period in 2008 due to bank growth, additional locations and upgraded systems.
FDIC insurance increased $3.0 million, or 308.2%, for the year ended December 31, 2009, compared to the same period in 2008. The increases were due to the FDIC finalizing a rule in December 2008 that raised the then-current assessment rates uniformly by 7 basis points for the 2009 assessment as well as a special second quarter assessment of approximately $1.3 million. The new rule resulted in annualized assessment rates for Risk Category 1 institutions ranging from 12 to 14 basis points. The increases were also related to the additional 10 basis point assessment paid during 2009 on covered transaction accounts exceeding $250,000 under the Temporary Liquidity Guaranty Program.
INCOME TAXES
Pre-tax income for the year ended December 31, 2009 was $62.5 million compared to $42.1 million for the year ended December 31, 2008.
Income tax expense was $16.6 million for the year ended December 31, 2009 and represented an increase of $5.4 million, or 47.6%, when compared to the year ended December 31, 2008. The effective tax rate as a percentage of pre-tax income was 26.6% in 2009 and 26.7% in 2008. The increase in the income tax expense for 2009 was due to an increase in taxable income as compared to the same period in 2008. The effective tax rate decreased as a direct result of the net income attributable to the noncontrolling interest included in pre-tax income. Net deferred assets totaled $1.6 million at December 31, 2009 as compared to $2.9 million in 2008.
LENDING ACTIVITIES
One of our main objectives is to seek attractive lending opportunities in Texas, primarily in the counties in which we operate. Substantially all of our loan originations are made to borrowers who live in and conduct business in the counties in Texas in which we operate, with the exception of municipal loans which are made almost entirely in Texas, and purchases of automobile loan portfolios throughout the United States. Municipal loans are made to municipalities, counties, school districts, and colleges primarily throughout the state of Texas. Through SFG, we purchase portfolios of automobile loans from a variety of lenders throughout the United States. These high yield loans represent existing subprime automobile loans with payment histories that are collateralized by new and used automobiles. At December 31, 2010, the SFG loans totaled approximately $89.5 million.
Total loans as of December 31, 2010 increased $44.3 million, or 4.3%, and the average loan balance was up $10.1 million, or 1.0%, when compared to 2009.
Our market areas to date, have not, experienced the level of downturn in the economy and real estate prices that some of the harder hit areas of the country have experienced. However, we have experienced weakening conditions associated with the real estate led downturn and have strengthened our underwriting standards, especially related to all aspects of real estate lending. Our real estate loan portfolio does not have Alt-A or subprime mortgage exposure.
58
Loans to individuals increased $9.5 million, or 5.0%, from December 31, 2009. Municipal loans as of December 31, 2010 increased $46.5 million, or 31.0%, from December 31, 2009. The increase in municipal loans is due in part to the overall market volatility related to credit markets, including municipal credits. This provided additional opportunities for us to lend to municipalities during 2010. Construction loans increased $9.8 million, or 9.3%, from December 31, 2009. 1-4 Family residential loans increased $1.4 million, or 0.6%, from December 31, 2009. Other real estate loans decreased $12.0 million, or 5.6%, and commercial loans decreased $10.8 million, or 6.7%, from December 31, 2009 to December 31, 2010, respectively.
The decrease in our other real estate loans and our commercial loans is reflective of decreased loan demand for these types of loans in our market areas. The increase in construction loans is due to an increase in loan demand for this type of loan. The increase in loans to individuals reflects an increase in automobile loan portfolios purchased by SFG and success in penetrating this competitive market in our market areas. In our loan portfolio, loans dependent upon private household income represent a significant concentration. Due to the number of customers involved who work in all sectors of the numerous local, state and national economies, we believe the risk in this portion of the portfolio is adequately spread throughout the economic community, which assists in mitigating this concentration.
A significant portion of our loan portfolio is dependent on the medical community. Medical loan types include commercial loans and commercial real estate loans. Collateral for these loans varies depending on the type of loan and financial strength of the borrower. The primary source of repayment for loans in the medical community is cash flow from continuing operations. The medical community represents a concentration of risk in our Commercial loan and Commercial Real Estate loan portfolio. See “Item 1. Business – Market Area.” We believe that risk in the medical community is mitigated because it is spread among multiple practice types and multiple specialties. Should the government change the amount it pays the medical community through the various government health insurance programs or if new government regulation impacts the profitability of the medical community, the medical community could be adversely impacted which in turn could result in higher default rates by borrowers in the medical industry.
The aggregate amount of loans that we are permitted to make under applicable bank regulations to any one borrower, including non-affiliate related entities is 25% of Tier 1 capital. Our legal lending limit at December 31, 2010, was approximately $61.7 million. Our largest loan relationship at December 31, 2010 was approximately $21.0 million.
The average yield on loans for the year ended December 31, 2010, decreased to 7.10% from 7.21% for the year ended December 31, 2009. This decrease was reflective of the overall lower interest environment during 2010.
LOAN PORTFOLIO COMPOSITION AND ASSOCIATED RISK
The following table sets forth loan totals for the years presented:
|
December 31,
|
||||||||||||||||||||
|
2010
|
2009
|
2008
|
2007
|
2006
|
||||||||||||||||
|
(in thousands)
|
||||||||||||||||||||
|
Real Estate Loans:
|
||||||||||||||||||||
|
Construction
|
$ | 115,094 | $ | 105,268 | $ | 132,666 | $ | 117,046 | $ | 46,712 | ||||||||||
|
1-4 Family Residential
|
219,031 | 217,677 | 226,180 | 228,330 | 220,230 | |||||||||||||||
|
Other
|
200,723 | 212,731 | 184,629 | 200,148 | 181,047 | |||||||||||||||
|
Commercial Loans
|
148,761 | 159,529 | 165,558 | 154,171 | 118,962 | |||||||||||||||
|
Municipal Loans
|
196,594 | 150,111 | 134,986 | 112,523 | 106,155 | |||||||||||||||
|
Loans to Individuals
|
197,717 | 188,260 | 178,530 | 149,012 | 86,041 | |||||||||||||||
|
Total Loans
|
$ | 1,077,920 | $ | 1,033,576 | $ | 1,022,549 | $ | 961,230 | $ | 759,147 | ||||||||||
For purposes of this discussion, our loans are divided into Real Estate Loans, Commercial Loans, Municipal Loans and Loans to Individuals.
59
REAL ESTATE LOANS
Real estate loans represent our greatest concentration of loans. We attempt to mitigate the amount of risk associated with this group of loans through the type of loans originated and geographic distribution. At December 31, 2010, the majority of our real estate loans were collateralized by properties located in our market areas. Of the $534.8 million in real estate loans, $219.0 million, or 41.0%, represent loans collateralized by residential dwellings that are primarily owner occupied. Historically, the amount of losses suffered on this type of loan has been significantly less than those on other properties. Beginning in the third quarter of 2007, there were well-publicized developments in the credit markets, beginning with a decline in the sub-prime mortgage lending market, which later extended to the markets for collateralized mortgage obligations, mortgage-backed securities and the lending markets generally. Initially our markets appeared to have been relatively resilient, not experiencing the significant effects associated with these market trends; however, beginning in the later half of 2008 as consumers all across the United States were impacted by the economic slowdown, our market areas began to experience more of a slowdown in economic activity. During 2009 and 2010, our markets did experience a slowdown as a result of the real estate led downturn across the county. A continued decline in credit markets generally could adversely affect our financial condition and results of operation if we are unable to extend credit or sell loans into the secondary market. Our loan policy requires an appraisal or evaluation on the property, based on the size and complexity of the transaction, prior to funding any real estate loan and also outlines the requirements for appraisals on renewals.
We pursue an aggressive policy of reappraisal on any real estate loan that is in the process of foreclosure and potential exposures are recognized and reserved for or charged off as soon as they are identified. Our ability to liquidate certain types of properties that may be obtained through foreclosure could adversely affect the volume of our nonperforming real estate loans.
Real estate loans are divided into 1-4 Family Residential Mortgage Loans, Construction Loans and Other. The Other real estate consists of $194.3 million of commercial real estate loans, $5.0 million of loans secured by multi-family properties and $1.4 million of loans secured by farm land. The Commercial Real Estate portion of Other will be discussed in more detail below.
1-4 Family Residential Mortgage Loans
Residential loan originations are generated by our loan officers, in-house origination staff, marketing efforts, present customers, walk-in customers and referrals from real estate agents and builders. We focus our lending efforts primarily on the origination of loans secured by first mortgages on owner-occupied, 1-4 family residences. Substantially all of our 1-4 family residential mortgage originations are secured by properties located in or near our market areas. Historically, we have originated a portion of our residential mortgage loans for sale into the secondary market. These loans are reflected on the balance sheet as loans held for sale. These secondary market investors typically pay us a service release premium in addition to a predetermined price based on the interest rate of the loan originated. We retain liabilities related to early prepayments, defaults, failure to adhere to origination and processing guidelines and other issues. We have internal controls in place to mitigate many of these liabilities and historically our realized liability has been extremely low. In addition, many of the retained liabilities expire inside of one year from the date a loan is sold. We warehouse these loans until they are transferred to the secondary market investor, which usually occurs within 45 days.
Our 1-4 family residential mortgage loans generally have maturities ranging from five to 30 years. These loans are typically fully amortizing with monthly payments sufficient to repay the total amount of the loan or amortizing with a balloon feature, typically due in fifteen years or less. Our 1-4 family residential mortgage loans are made at both fixed and adjustable interest rates.
We review information concerning the income, financial condition, employment and credit history when evaluating the creditworthiness of the applicant.
We also make home equity loans, which are included as part of the 1-4 Family Residential Mortgage Loans, and at December 31, 2010, these loans totaled $64.9 million. Under Texas law, these loans, when combined with all other mortgage indebtedness for the property, are capped at 80% of appraised value.
60
Construction Loans
Our commercial construction loans and construction loans to individuals are collateralized by property located primarily in the market areas we serve. A majority of our construction loans are directed toward properties that will be owner occupied. Construction loans for projects built on speculation are financed, but these typically have secondary sources of repayment and collateral. Our construction loans have both adjustable and fixed interest rates during the construction period. Construction loans to individuals are typically priced and made with the intention of granting the permanent loan on the property. During 2010 our construction loans experienced additional stress due to the general downturn in market conditions associated with this type of lending.
Commercial Real Estate Loans
Commercial real estate loans primarily include commercial office buildings, retail, medical facilities and offices, warehouse facilities, hotels and churches. In determining whether to originate commercial real estate loans, we generally consider such factors as the financial condition of the borrower and the debt service coverage of the property. Commercial real estate loans are made at both fixed and adjustable interest rates for terms generally up to 20 years.
COMMERCIAL LOANS
Our commercial loans are diversified to meet most business needs. Loan types include short-term working capital loans for inventory and accounts receivable and short- and medium-term loans for equipment or other business capital expansion. Management does not consider there to be a concentration of risk in any one industry type, other than the medical industry. Loans to borrowers in the medical industry include all loan types listed above for commercial loans. Collateral for these loans varies depending on the type of loan and financial strength of the borrower. The primary source of repayment for loans in the medical community is cash flow from continuing operations.
In our commercial loan underwriting, we assess the creditworthiness, ability to repay, and the value and liquidity of the collateral being offered. Terms of commercial loans are generally commensurate with the useful life of the collateral offered.
MUNICIPAL LOANS
We have a specific lending department that makes loans to municipalities and school districts throughout the state of Texas. The majority of the loans to municipalities and school districts has tax or revenue pledges and in some cases are additionally supported by collateral. Municipal loans made without a direct pledge of taxes or revenues are usually made based on some type of collateral that represents an essential service. Lending money directly to these municipalities allows us to earn a higher yield for similar durations than we could if we purchased municipal securities. Total loans to municipalities and school districts as of December 31, 2010 increased $46.5 million when compared to 2009. At December 31, 2010, we had total loans to municipalities and school districts of $196.6 million.
LOANS TO INDIVIDUALS
Substantially all of our consumer loan originations are made to consumers in our market areas. The majority of loans to individuals outstanding are collateralized by titled equipment, which are primarily vehicles, and automobile loans purchased by SFG. At December 31, 2010, these types of loans accounted for approximately $163.4 million, or 82.7%, of total loans to individuals.
The total of SFG automobile loans included in loans to individuals at December 31, 2010 was $89.5 million. These high yield loans represent existing subprime automobile loans with payment histories that are primarily collateralized by used automobiles. Loan pools purchased through SFG are subjected to a modeling system to determine the risk associated with the expected defaults. Among other things, the model takes into consideration credit scores and estimated collateral values to determine the risk inherent in each pool.
Home equity loans, which are included in 1-4 family residential loans, have replaced some of the traditional loans to individuals. In addition, we make loans for a full range of other consumer purposes, which may be secured or unsecured depending on the credit quality and purpose of the loan.
61
Consumer loan terms vary according to the type and value of collateral, length of contract and creditworthiness of the borrower. The underwriting standards we employ for consumer loans include an application, a determination of the applicant's payment history on other debts, with the greatest weight being given to payment history with us, and an assessment of the borrower's ability to meet existing obligations and payments on the proposed loan. Although creditworthiness of the applicant is a primary consideration, the underwriting process also includes a comparison of the value of the collateral, if any, in relation to the proposed loan amount. Most of our loans to individuals are collateralized, which management believes should assist in limiting our exposure.
LOAN MATURITIES AND SENSITIVITY TO CHANGES IN INTEREST RATES
The following table represents loan maturities and sensitivity to changes in interest rates for our real estate construction, commercial and municipal loans. The amounts of these loans outstanding at December 31, 2010, which, based on remaining scheduled repayments of principal, are due in (1) one year or less, (2) more than one year but less than five years, and (3) more than five years, are shown in the following table. The amounts due after one year are classified according to the sensitivity to changes in interest rates.
|
Due in One
|
After One but
|
||||||||||
|
Year or
|
within Five
|
After Five
|
|||||||||
|
Less*
|
Years
|
Years
|
|||||||||
|
(in thousands)
|
|||||||||||
|
Real Estate Loans – Construction
|
$
|
43,155
|
$
|
27,639
|
$
|
44,300
|
|||||
|
Commercial Loans
|
69,957
|
72,831
|
5,973
|
||||||||
|
Municipal Loans
|
13,766
|
59,239
|
123,589
|
||||||||
|
Total
|
$
|
126,878
|
$
|
159,709
|
$
|
173,862
|
|||||
|
Loans with Maturities After
|
||||
|
One Year for Which:
|
Interest Rates are Fixed or Predetermined
|
$ | 227,742 | |
|
Interest Rates are Floating or Adjustable
|
$ | 105,829 | ||
|
|
*
|
The volume of commercial loans due within one year reflects our general policy of attempting to limit a majority of these loans to a short-term maturity. Nonaccrual loans totaling $6.5 million are reflected in the due after five years column.
|
LOANS TO AFFILIATED PARTIES
In the normal course of business, we make loans to certain of our own executive officers and directors and their related interests. As of December 31, 2010 and 2009, these loans totaled $4.5 million and $3.9 million, respectively. These loans represented 2.1% and 2.0% of shareholders' equity as of December 31, 2010 and 2009, respectively. Such loans are made in the normal course of business at normal credit terms, including interest rate and collateral requirements and do not represent more than normal credit risks contained in the rest of the loan portfolio for loans of similar types.
LOAN LOSS EXPERIENCE AND ALLOWANCE FOR LOAN LOSSES
Our allowance for loan losses was $20.7 million at December 31, 2010, or 1.9% of loans. The increase in the allowance for loan losses is due primarily to an increase in the dollar amount of loans and a change in the mix of loans.
The allowance for loan losses is based on the most current review of the loan portfolio and is validated by multiple processes. First, the bank utilized historical data to establish general reserve amounts for each class of loans. While we track several years of data, we primarily review one year data because we found during the 1980’s that longer periods would not respond quickly enough to market conditions. Second, our lenders have the primary responsibility for identifying problem loans and estimating necessary reserves based on customer financial stress and underlying collateral. These recommendations are reviewed by the Senior lender, the Special Assets department, and the Loan Review department and are signed off on by the President. Third, the Loan Review department does independent reviews of the
62
portfolio on an annual basis. The Loan Review department follows a board approved annual loan review scope. The loan review scope encompasses a number of metrics that takes into consideration the size of the loan, the type of credit extended, the seasoning of the loan along with the performance of the loan. The loan review scope as it relates to size, focuses more on larger dollar loan relationships, typically, for example, aggregate debt of $500,000 or greater. The Loan Review officer also tracks specific reserves for loans by type compared to general reserves to determine trends in comparative reserves as well as losses not reserved for prior to charge off to determine the efficiency of the specific reserve process.
At each review, a subjective analysis methodology is used to grade the respective loan. Categories of grading vary in severity from loans that do not appear to have a significant probability of loss at the time of review to loans that indicate a probability that the entire balance of the loan will be uncollectible. If full collection of the loan balance appears unlikely at the time of review, estimates of future expected cash flows or appraisals of the collateral securing the debt are used to allocate the necessary allowances. The internal loan review department maintains a list of all loans or loan relationships that are graded as having more than the normal degree of risk associated with them. In addition, a list of specifically reserved loans or loan relationships of $50,000 or more is updated on a quarterly basis in order to properly allocate necessary allowances and keep management informed on the status of attempts to correct the deficiencies noted with respect to the loan.
For loans to individuals the methodology associated with determining the appropriate allowance for losses on loans primarily consists of an evaluation of individual payment histories, remaining term to maturity and underlying collateral support.
Industry experience indicates that a portion of our loans will become delinquent and a portion of the loans will require partial or entire charge-off. Regardless of the underwriting criteria utilized, losses may be experienced as a result of various factors beyond our control, including, among other things, changes in market conditions affecting the value of properties used as collateral for loans and problems affecting the credit of the borrower and the ability of the borrower to make payments on the loan. Our determination of the adequacy of allowance for loan losses is based on various considerations, including an analysis of the risk characteristics of various classifications of loans, previous loan loss experience, specific loans which would have loan loss potential, delinquency trends, estimated fair value of the underlying collateral, current economic conditions, the views of the bank regulators (who have the authority to require additional allowances), and geographic and industry loan concentration.
Consumer loans at SFG are reserved for based on general estimates of loss at the time of purchase for current loans. SFG loans experiencing past due status or extension of maturity characteristics are reserved for at significantly higher levels based on the circumstances associated with each specific loan. In general the reserves for SFG are calculated based on the past due status of the loan. For reserve purposes, the portfolio has been segregated by past due status and by the remaining term variance from the original contract. During repayment, loans that pay late will take longer to pay out than the original contract. Additionally, some loans may be granted extensions for extenuating payment circumstances. The remaining term extensions increase the risk of collateral deterioration and accordingly, reserves are increased to recognize this risk.
For loans originated after August 1, 2010, additional reserve methods have been added. New pools purchased are reserved at their estimated annual loss. Thereafter, the reserve is adjusted based on the actual performance versus projected performance. Additionally, during the fourth quarter of 2010, data mining measures were further enhanced to track migration within risk tranches. Reserves are adjusted quarterly to match the migration metrics.
After all of the data in the loan portfolio is accumulated the reserve allocations are separated into various loan classes detailed in the table below. At December 31, 2010, the unallocated portion of the allowance for loan loss decreased to $453,000 or 0.04% of loans. The decrease in the unallocated portion of the allowance for loan loss when compared to December 31, 2009 is the result of a reduction in the uncertainty surrounding the national, state and local economies we serve, combined with a reduction in non-performing assets.
As of December 31, 2010, our review of the loan portfolio indicated that a loan loss allowance of $20.7 million was adequate to cover probable losses in the portfolio. Changes in economic and other conditions may require future adjustments to the allowance for loan losses.
63
The following table presents information regarding the average amount of net loans outstanding, changes in the allowance for loan losses, selected asset quality ratios and an allocation of the allowance for loan losses.
LOAN LOSS EXPERIENCE AND ALLOWANCE FOR LOAN LOSSES
|
Years Ended December 31,
|
||||||||||||||||||||
|
2010
|
2009
|
2008
|
2007
|
2006
|
||||||||||||||||
|
(dollars in thousands)
|
||||||||||||||||||||
|
Average Net Loans Outstanding
|
$ | 1,031,858 | $ | 1,021,770 | $ | 983,336 | $ | 809,906 | $ | 722,252 | ||||||||||
|
Balance of Allowance for Loan Losses at Beginning of Period
|
$ | 19,896 | $ | 16,112 | $ | 9,753 | $ | 7,193 | $ | 7,090 | ||||||||||
|
Loan Charge-Offs:
|
||||||||||||||||||||
|
Real Estate-Construction
|
(873 | ) | (932 | ) | (111 | ) | – | – | ||||||||||||
|
Real Estate-1-4 Family Residential
|
(288 | ) | (267 | ) | (11 | ) | (33 | ) | (59 | ) | ||||||||||
|
Real Estate-Other
|
(577 | ) | (322 | ) | – | (7 | ) | (18 | ) | |||||||||||
|
Commercial Loans
|
(2,603 | ) | (2,037 | ) | (505 | ) | (95 | ) | (245 | ) | ||||||||||
|
Loans to Individuals
|
(12,072 | ) | (9,589 | ) | (8,570 | ) | (2,612 | ) | (2,650 | ) | ||||||||||
|
Total Loan Charge-Offs
|
(16,413 | ) | (13,147 | ) | (9,197 | ) | (2,747 | ) | (2,972 | ) | ||||||||||
|
Recovery of Loans Previously Charged-off:
|
||||||||||||||||||||
|
Real Estate-Construction
|
165 | 2 | – | – | – | |||||||||||||||
|
Real Estate-1-4 Family Residential
|
13 | 5 | 1 | 30 | 7 | |||||||||||||||
|
Real Estate-Other
|
– | – | 6 | 10 | – | |||||||||||||||
|
Commercial Loans
|
854 | 104 | 32 | 98 | 87 | |||||||||||||||
|
Loans to Individuals
|
2,459 | 1,727 | 1,842 | 1,909 | 1,901 | |||||||||||||||
|
Total Recovery of Loans Previously Charged-Off
|
3,491 | 1,838 | 1,881 | 2,047 | 1,995 | |||||||||||||||
|
Net Loan Charge-Offs
|
(12,922 | ) | (11,309 | ) | (7,316 | ) | (700 | ) | (977 | ) | ||||||||||
|
Allowance for Loan Losses Acquired
|
– | – | – | 909 | – | |||||||||||||||
|
Provision for Loan Losses
|
13,737 | 15,093 | 13,675 | 2,351 | 1,080 | |||||||||||||||
|
Balance of Allowance for Loan Losses at End of Period
|
$ | 20,711 | $ | 19,896 | $ | 16,112 | $ | 9,753 | $ | 7,193 | ||||||||||
|
Reserve for Unfunded Loan Commitments at Beginning of Period
|
$ | 5 | $ | 7 | $ | 50 | $ | – | $ | – | ||||||||||
|
Provision for Losses on Unfunded Loan Commitments
|
25 | (2 | ) | (43 | ) | 50 | – | |||||||||||||
|
Reserve for Unfunded Loan Commitments at End of Period
|
$ | 30 | $ | 5 | $ | 7 | $ | 50 | $ | – | ||||||||||
|
Net Charge-Offs to Average Net Loans Outstanding
|
1.25 | % | 1.11 | % | 0.74 | % | 0.09 | % | 0.14 | % | ||||||||||
|
Allowance for Loan Losses to Nonaccruing Loans
|
142.60 | 106.80 | 112.76 | 334.81 | 539.61 | |||||||||||||||
|
Allowance for Loan Losses to Nonperforming Assets
|
116.95 | 84.83 | 102.10 | 247.16 | 340.90 | |||||||||||||||
|
Allowance for Loan Losses to Total Loans
|
1.92 | 1.92 | 1.58 | 1.01 | 0.95 | |||||||||||||||
64
Allocation of Allowance for Loan Losses (dollars in thousands):
|
Years Ended December 31,
|
||||||||||||||||||||||||||||||||||||||||
|
2010
|
2009
|
2008
|
2007
|
2006
|
||||||||||||||||||||||||||||||||||||
|
Percent
|
Percent
|
Percent
|
Percent
|
Percent
|
||||||||||||||||||||||||||||||||||||
|
of
|
of
|
of
|
of
|
of
|
||||||||||||||||||||||||||||||||||||
|
Loans
|
Loans
|
Loans
|
Loans
|
Loans
|
||||||||||||||||||||||||||||||||||||
|
to Total
|
to Total
|
to Total
|
to Total
|
to Total
|
||||||||||||||||||||||||||||||||||||
|
Amount
|
Loans
|
Amount
|
Loans
|
Amount
|
Loans
|
Amount
|
Loans
|
Amount
|
Loans
|
|||||||||||||||||||||||||||||||
|
Real Estate
|
||||||||||||||||||||||||||||||||||||||||
|
Construction
|
$ | 2,585 | 10.7 | % | $ | 3,080 | 10.2 | % | $ | 2,757 | 12.9 | % | $ | 1,031 | 12.2 | % | $ | 366 | 6.2 | % | ||||||||||||||||||||
|
1-4 Family
Residential
|
1,988 | 20.3 | % | 1,460 | 21.1 | % | 1,567 | 22.1 | % | 1,313 | 23.8 | % | 1,221 | 29.0 | % | |||||||||||||||||||||||||
|
Other
|
3,354 | 18.6 | % | 3,175 | 20.6 | % | 2,701 | 18.1 | % | 2,594 | 20.8 | % | 2,327 | 23.8 | % | |||||||||||||||||||||||||
|
Commercial Loans
|
3,746 | 13.8 | % | 3,184 | 15.4 | % | 2,496 | 16.2 | % | 2,126 | 16.0 | % | 1,536 | 15.7 | % | |||||||||||||||||||||||||
|
Municipal Loans
|
607 | 18.3 | % | 400 | 14.5 | % | 341 | 13.2 | % | 277 | 11.7 | % | 262 | 14.0 | % | |||||||||||||||||||||||||
|
Loans to Individuals
|
7,978 | 18.3 | % | 7,321 | 18.2 | % | 6,206 | 17.5 | % | 2,391 | 15.5 | % | 1,394 | 11.3 | % | |||||||||||||||||||||||||
|
Unallocated
|
453 | 0.0 | % | 1,276 | 0.0 | % | 44 | 0.0 | % | 21 | 0.0 | % | 87 | 0.0 | % | |||||||||||||||||||||||||
|
Ending Balance
|
$ | 20,711 | 100.0 | % | $ | 19,896 | 100.0 | % | $ | 16,112 | 100.0 | % | $ | 9,753 | 100.0 | % | $ | 7,193 | 100.0 | % | ||||||||||||||||||||
See "Consolidated Financial Statements - Note 6. Loans and Allowance for Probable Loan Losses."
NONPERFORMING ASSETS
Nonperforming assets consist of delinquent loans 90 days or more past due, nonaccrual loans, OREO, repossessed assets and restructured loans. Nonaccrual loans are those loans which are 90 days or more delinquent and collection in full of both the principal and interest is in doubt. Additionally, some loans that are not delinquent may be placed on nonaccrual status due to doubts about full collection of principal or interest. When a loan is categorized as nonaccrual, the accrual of interest is discontinued and the accrued balance is reversed for financial statement purposes. Restructured loans represent loans that have been renegotiated to provide a reduction or deferral of interest or principal because of deterioration in the financial position of the borrowers. Categorization of a loan as nonperforming is not in itself a reliable indicator of potential loan loss. Other factors, such as the value of collateral securing the loan and the financial condition of the borrower must be considered in judgments as to potential loan loss. OREO represents real estate taken in full or partial satisfaction of debts previously contracted. The dollar amount of OREO is based on a current evaluation of the OREO at the time it is recorded on our books, net of estimated selling costs. Updated valuations are obtained as needed and any additional impairments are recognized.
Total nonperforming assets at December 31, 2010 were $17.7 million, representing a decrease of $5.7 million, or 24.5%, from $23.5 million at December 31, 2009. From December 31, 2009 to December 31, 2010, nonaccrual loans decreased $4.1 million, or 22.0%, to $14.5 million. Of this total, 16.2% are residential real estate loans, 9.8% are commercial real estate loans, 12.4% are commercial loans, 29.0% are loans to individuals and 32.6% are construction loans. OREO decreased $1.7 million, or 88.3%, to $220,000 from December 31, 2009 to December 31, 2010. We are actively marketing all properties and none are being held for investment purposes. Of the $5.7 million decrease in nonperforming assets, $3.1 million was attributable to the SFG automobile loans and $2.6 million was attributable to Southside. Accruing loans past due more than 90 days decreased $316,000, or 97.8% to $7,000 at December 31, 2010 from $323,000 at December 31, 2009. Restructured performing loans increased $348,000, or 17.6%, to $2.3 million. Restructured loans attributable to SFG were $2.2 million. Restructured loans for Southside decreased $16,000. Repossessed assets decreased $16,000, or 2.4%, to $638,000.
65
The following table presents information on nonperforming assets:
|
NONPERFORMING ASSETS
|
||||||||||||||||||||
|
Years Ended December 31,
|
||||||||||||||||||||
|
2010
|
2009
|
2008
|
2007
|
2006
|
||||||||||||||||
|
(dollars in thousands)
|
||||||||||||||||||||
|
Loans 90 Days Past Due:
|
||||||||||||||||||||
|
Real Estate
|
$ | – | $ | 289 | $ | 404 | $ | 286 | $ | 64 | ||||||||||
|
Loans to Individuals
|
7 | 34 | 53 | 114 | 64 | |||||||||||||||
|
Commercial
|
– | – | 136 | – | – | |||||||||||||||
| 7 | 323 | 593 | 400 | 128 | ||||||||||||||||
|
Loans on Nonaccrual:
|
||||||||||||||||||||
|
Real Estate
|
8,511 | 8,930 | 7,469 | 636 | 975 | |||||||||||||||
|
Loans to Individuals
|
4,214 | 7,461 | 5,976 | 2,119 | 262 | |||||||||||||||
|
Commercial
|
1,799 | 2,238 | 844 | 158 | 96 | |||||||||||||||
| 14,524 | 18,629 | 14,289 | 2,913 | 1,333 | ||||||||||||||||
|
Restructured Loans:
|
||||||||||||||||||||
|
Real Estate
|
36 | 87 | 91 | 94 | 97 | |||||||||||||||
|
Loans to Individuals
|
2,243 | 1,831 | 39 | 120 | 105 | |||||||||||||||
|
Commercial
|
41 | 54 | 18 | 11 | 18 | |||||||||||||||
| 2,320 | 1,972 | 148 | 225 | 220 | ||||||||||||||||
|
Total Nonperforming Loans
|
16,851 | 20,924 | 15,030 | 3,538 | 1,681 | |||||||||||||||
|
Other Real Estate Owned
|
220 | 1,875 | 318 | 153 | 351 | |||||||||||||||
|
Repossessed Assets
|
638 | 654 | 433 | 255 | 78 | |||||||||||||||
|
Total Nonperforming Assets
|
$ | 17,709 | $ | 23,453 | $ | 15,781 | $ | 3,946 | $ | 2,110 | ||||||||||
|
Nonperforming Assets to Total Assets
|
0.59 | % | 0.78 | % | 0.58 | % | 0.18 | % | 0.11 | % | ||||||||||
|
Nonperforming Assets to Total Loans
|
1.64 | 2.27 | 1.54 | 0.41 | 0.28 | |||||||||||||||
|
Nonaccrual Loans to Total Loans
|
1.35 | 1.80 | 1.40 | 0.30 | 0.18 | |||||||||||||||
|
Loans 90 Days Past Due to Total Loans
|
– | 0.03 | 0.06 | 0.04 | 0.02 | |||||||||||||||
Nonperforming assets at December 31, 2010, as a percentage of total assets decreased to 0.59% from the previous year and as a percentage of loans decreased to 1.64%. Nonperforming assets hinder our ability to earn money. Decreases in earnings can result from both the loss of interest income and the costs associated with maintaining the OREO, for taxes, insurance and other operating expenses. In addition to the nonperforming assets, at December 31, 2010 in the opinion of management, we had $292,000 of loans identified as potential problem loans. A potential problem loan is a loan where information about possible credit problems of the borrower is known, causing management to have serious doubts about the ability of the borrower to comply with the present loan repayment terms and which may result in a future classification of the loan in one of the nonperforming asset categories.
The restructured loans to individuals referred to in the preceding table are primarily SFG loans which have had payment extensions or whose maturity has extended due to late payments on the contract. These loans continue to accrue interest on the principal balance.
66
The following is a summary of our recorded investment in loans (primarily nonaccrual loans) for which impairment has been recognized (in thousands):
|
Valuation
|
Carrying
|
||||||||
|
Total
|
Allowance
|
Value
|
|||||||
|
Real Estate Loans
|
$
|
8,512
|
$
|
1,167
|
$
|
7,345
|
|||
|
Loans to Individuals
|
6,457
|
1,978
|
4,479
|
||||||
|
Commercial Loans
|
1,799
|
719
|
1,080
|
||||||
|
Balance at December 31, 2010
|
$
|
16,768
|
$
|
3,864
|
$
|
12,904
|
|||
|
Valuation
|
Carrying
|
||||||||
|
Total
|
Allowance
|
Value
|
|||||||
|
Real Estate Loans
|
$
|
8,930
|
$
|
1,857
|
$
|
7,073
|
|||
|
Loans to Individuals
|
9,291
|
2,712
|
6,579
|
||||||
|
Commercial Loans
|
2,292
|
458
|
1,834
|
||||||
|
Balance at December 31, 2009
|
$
|
20,513
|
$
|
5,027
|
$
|
15,486
|
|||
The balances of impaired loans included above with no valuation allowances were approximately $69,000 and $287,000 at December 31, 2010 and 2009, respectively.
For the years ended December 31, 2010 and 2009, the average recorded investment in impaired loans was approximately $18.6 million and $16.1 million, respectively.
The amount of interest recognized on loans that were nonaccruing or restructured during the year was $1.1 million, $1.2 million and $1.1 million for the years ended December 31, 2010, 2009 and 2008, respectively. If these loans had been accruing interest at their original contracted rates, related income would have been $2.2 million, $1.7 million and $1.8 million for the years ended December 31, 2010, 2009 and 2008, respectively.
67
SECURITIES ACTIVITY
Our securities portfolio plays a primary role in management of our interest rate sensitivity and, therefore, is managed in the context of the overall balance sheet. The securities portfolio generates a substantial percentage of our interest income and serves as a necessary source of liquidity.
We account for debt and equity securities as follows:
|
|
·
|
Held to Maturity (“HTM”). Debt securities that management has the current intent and ability to hold until maturity are classified as HTM and are carried at their remaining unpaid principal balance, net of unamortized premiums or unaccreted discounts. Premiums are amortized and discounts are accreted using the level interest yield method over the estimated remaining term of the underlying security.
|
|
|
·
|
Available for Sale (“AFS”). Debt and equity securities that will be held for indefinite periods of time, including securities that may be sold in response to changes in market interest or prepayment rates, needs for liquidity and changes in the availability of and the yield of alternative investments are classified as AFS. These assets are carried at market value. Market value is determined using quoted market prices, where available. If quoted market prices are not available, fair values are based on quoted market prices for similar securities or estimates from independent pricing services. Unrealized gains and losses on AFS securities are excluded from earnings and reported net of tax as a separate component of shareholders' equity until realized.
|
Purchase of premiums and discounts are recognized in interest income using the interest method over the terms of the securities. Declines in the fair value of HTM and AFS securities below their cost that are deemed to be other-than-temporary are reflected in earnings as realized losses. In estimating other-than-temporary impairment losses, management considers (1) the length of time and the extent to which the fair value has been less than cost, (2) the financial condition and near-term prospects of the issuer, and (3) our intent and ability to retain our investment in the issuer for a period of time sufficient to allow for any anticipated recovery in fair value. Gains and losses on the sale of securities are recorded on the trade date and are determined using the specific identification method.
Securities with limited marketability, such as FHLB stock and other investments, are carried at cost, which approximates its fair value and assessed for other-than-temporary impairment.
Management attempts to deploy investable funds into instruments that are expected to provide a reasonable overall return on the portfolio given the current assessment of economic and financial conditions, while maintaining acceptable levels of capital, interest rate and liquidity risk. At December 31, 2010, the securities portfolio as a percentage of total assets was 56.7% and was larger than loans, which were 35.9% of total assets. For a discussion of our strategy in relation to the securities portfolio, see “Item 7. Management’s Discussion and Analysis of Financial Condition and Results of Operations – Balance Sheet Strategy.”
68
The following table sets forth the carrying amount of investment securities and mortgage-backed securities at December 31, 2010, 2009 and 2008:
|
December 31,
|
||||||||||||
|
Available for Sale:
|
2010
|
2009
|
2008
|
|||||||||
|
(in thousands)
|
||||||||||||
|
Investment Securities:
|
||||||||||||
|
U.S. Treasury
|
$ | 4,700 | $ | 4,899 | $ | 5,031 | ||||||
|
Government Sponsored Enterprise Debentures
|
– | – | 60,551 | |||||||||
|
State and Political Subdivisions
|
294,262 | 259,526 | 211,594 | |||||||||
|
Other Stocks and Bonds
|
382 | 635 | 1,202 | |||||||||
|
Mortgage-backed Securities:
|
||||||||||||
|
U.S. Government Agencies
|
154,534 | 129,582 | 168,299 | |||||||||
|
Government Sponsored Enterprises
|
791,509 | 1,108,600 | 858,214 | |||||||||
|
Total
|
$ | 1,245,387 | $ | 1,503,242 | $ | 1,304,891 | ||||||
|
December 31,
|
||||||||||||
|
Held to Maturity:
|
2010
|
2009
|
2008
|
|||||||||
|
(in thousands)
|
||||||||||||
|
Investment Securities:
|
||||||||||||
|
State and Political Subdivisions
|
$ | 1,012 | $ | 1,013 | $ | – | ||||||
|
Other Stocks and Bonds
|
483 | 480 | 478 | |||||||||
|
Mortgage-backed Securities:
|
||||||||||||
|
U.S. Government Agencies
|
21,888 | 16,677 | 22,778 | |||||||||
|
Government Sponsored Enterprises
|
395,974 | 225,988 | 134,509 | |||||||||
|
Total
|
$ | 419,357 | $ | 244,158 | $ | 157,765 | ||||||
We invest in mortgage-backed and related securities, including mortgage participation certificates, which are insured or guaranteed by U.S. Government agencies and GSEs, and CMOs and real estate mortgage investment conduits (“REMICs”). Mortgage-backed securities (which also are known as mortgage participation certificates or pass-through certificates) represent a participation interest in a pool of single-family or multi-family mortgages, the principal and interest payments on which are passed from the mortgage originators, through intermediaries (generally U.S. Government agencies and GSEs) that pool and repackage the participation interests in the form of securities, to investors such as us. U.S. Government agencies, primarily Government National Mortgage Association (“GNMA”) and GSEs, primarily Freddie Mac, and Fannie Mae guarantee the payment of principal and interest to investors. GSEs are not backed by the full faith and credit of the U.S. government. Freddie Mac, Fannie Mae and FHLB are the primary GSEs with which we purchase securities. At December 31, 2010 all of our mortgage-backed securities were collateralized by U.S. Government agencies or GSEs.
Mortgage-backed securities typically are issued with stated principal amounts, and the securities are backed by pools of mortgages that have loans with varying maturities. The characteristics of the underlying pool of mortgages, such as fixed-rate or adjustable-rate, as well as prepayment risk, are passed on to the certificate holder. The term of a mortgage-backed pass-through security thus approximates the term of the underlying mortgages and can vary significantly due to prepayments.
69
Our mortgage-backed securities include CMOs, which include securities issued by entities that have qualified under the Internal Revenue Code of 1986, as amended, as REMICs. CMOs and REMICs (collectively CMOs) were developed in response to investor concerns regarding the uncertainty of cash flows associated with the prepayment option of the underlying mortgagor and are typically issued by governmental agencies, GSEs and special purpose entities, such as trusts, corporations or partnerships, established by financial institutions or other similar institutions. A CMO can be collateralized by loans or securities which are insured or guaranteed by Fannie Mae, Freddie Mac or GNMA. In contrast to pass-through mortgage-backed securities, in which cash flow is received pro rata by all security holders, the cash flow from the mortgages underlying a CMO is segmented and paid in accordance with a predetermined priority to investors holding various CMO classes. By allocating the principal and interest cash flows from the underlying collateral among the separate CMO classes, different classes of bonds are created, each with its own stated maturity, estimated average life, coupon rate and prepayment characteristics.
Like most fixed-income securities, mortgage-backed and related securities are subject to interest rate risk. However, unlike most fixed-income securities, the mortgage loans underlying a mortgage-backed or related security generally may be prepaid at any time without penalty. The ability to prepay a mortgage loan generally results in significantly increased price and yield volatility (with respect to mortgage-backed and related securities) than is the case with non-callable fixed income securities. Most of our mortgage-backed securities were purchased at a premium. As these mortgage-backed securities prepay at a faster rate our yield on these securities will decrease. Conversely, as prepayments slow the yield on these mortgage-backed securities will increase.
The combined investment securities, mortgage-backed securities, and FHLB stock and other investments portfolio decreased to $1.70 billion at December 31, 2010, compared to $1.79 billion at December 31, 2009, a decrease of $86.6 million, or 4.8%. This is primarily a result of a decrease in mortgage-backed securities of $116.9 million, or 7.9%, during 2010 when compared to 2009 which was partially offset a $34.7 million, or 13.3%, increase in our ownership of securities issued by state and political subdivisions. FHLB stock decreased $3.9 million, or 10.1%, due to stock redemptions as our FHLB advances decreased. The change in U.S. Treasury securities was related to the replacement of U.S. Treasury securities that matured during 2010. Other stocks and bonds are comprised primarily of TRUPs. The reason for the decrease in other stocks and bonds at December 31, 2010 when compared to December 31, 2009 is the decrease in market value of the TRUP investments due to illiquidity.
During 2010, the interest rate yield curve remained steep while at the same time credit and volatility spreads continued to tighten. We used this environment to reposition a portion of the securities portfolio. Through this process, we are able to decrease the overall average coupon duration, significantly reduce our exposure to non-Texas municipalities, and decrease the size of the overall securities portfolio.
The combined market value of the AFS and HTM securities portfolio at December 31, 2010 was $1.67 billion, which represented a net unrealized gain as of that date of $22.6 million. The net unrealized gain was comprised of $35.2 million in unrealized gains and $12.6 million of unrealized losses. The market value of the AFS securities portfolio at December 31, 2010 was $1.25 billion, which represented a net unrealized gain as of that date of $13.9 million. The net unrealized gain was comprised of $25.8 million of unrealized gains and $11.9 million of unrealized losses. The $11.9 million of unrealized losses is primarily resulting from securities issued by state and political subdivisions and our investment in three tranches of TRUPs. Net unrealized gains and losses on AFS securities, which is a component of shareholders’ equity on the consolidated balance sheet, can fluctuate significantly as a result of changes in interest rates. Because management cannot predict the future direction of interest rates, the effect on shareholders’ equity in the future cannot be determined; however, this risk is monitored through the use of shock tests on the AFS securities portfolio using an array of interest rate assumptions.
There were no securities transferred from AFS to HTM during 2010, 2009 and 2008. There were no sales from the HTM portfolio during the years ended December 31, 2010, 2009 or 2008. There were $419.4 million and $244.2 million of securities classified as HTM for the years ended December 31, 2010 and 2009, respectively.
70
The maturities classified according to the sensitivity to changes in interest rates of the December 31, 2010 securities portfolio and the weighted yields are presented below. Tax-exempt obligations are shown on a taxable equivalent basis. Mortgage-backed securities are included in maturity categories based on their stated maturity date. Expected maturities may differ from contractual maturities because issuers may have the right to call or prepay obligations.
|
MATURING
|
||||||||||||||||||||||||
|
Within 1 Year
|
After 1 But
Within 5 Years
|
After 5 But
Within 10 Years
|
After 10 Years
|
|||||||||||||||||||||
|
Available For Sale:
|
Amount
|
Yield
|
Amount
|
Yield
|
Amount
|
Yield
|
Amount
|
Yield
|
||||||||||||||||
|
(dollars in thousands)
|
||||||||||||||||||||||||
|
Investment Securities:
|
||||||||||||||||||||||||
|
U.S. Treasury
|
$
|
4,700
|
0.14
|
%
|
$
|
–
|
–
|
$
|
–
|
–
|
$
|
–
|
–
|
|||||||||||
|
State and Political Subdivisions
|
3,932
|
6.43
|
%
|
6,042
|
6.62
|
%
|
21,680
|
5.99
|
%
|
262,608
|
6.45
|
%
|
||||||||||||
|
Other Stocks and Bonds
|
–
|
–
|
–
|
–
|
–
|
–
|
382
|
3.50
|
%
|
|||||||||||||||
|
Mortgage-backed Securities:
|
||||||||||||||||||||||||
|
U.S. Government Agencies
|
–
|
–
|
240
|
5.00
|
%
|
5,652
|
2.97
|
%
|
148,642
|
3.97
|
%
|
|||||||||||||
|
Government Sponsored Enterprises
|
14
|
8.27
|
%
|
6,374
|
2.50
|
%
|
64,727
|
2.45
|
%
|
720,394
|
3.26
|
%
|
||||||||||||
|
Total
|
$
|
8,646
|
3.01
|
%
|
$
|
12,656
|
4.52
|
%
|
$
|
92,059
|
3.31
|
%
|
$
|
1,132,026
|
4.09
|
%
|
||||||||
|
MATURING
|
||||||||||||||||||||||||
|
Within 1 Year
|
After 1 But
Within 5 Years
|
After 5 But
Within 10 Years
|
After 10 Years
|
|||||||||||||||||||||
|
Held to Maturity:
|
Amount
|
Yield
|
Amount
|
Yield
|
Amount
|
Yield
|
Amount
|
Yield
|
||||||||||||||||
|
(dollars in thousands)
|
||||||||||||||||||||||||
|
Investment Securities:
|
||||||||||||||||||||||||
|
State and Political Subdivisions
|
$
|
–
|
–
|
|
$
|
–
|
–
|
$
|
–
|
–
|
$
|
1,012
|
7.97
|
%
|
||||||||||
|
Other Stocks and Bonds
|
|
–
|
–
|
|
–
|
–
|
483
|
6.78
|
%
|
–
|
–
|
|||||||||||||
|
Mortgage-backed Securities:
|
||||||||||||||||||||||||
|
U.S. Government Agencies
|
–
|
–
|
|
690
|
4.62
|
%
|
15,646
|
3.70
|
%
|
5,552
|
5.40
|
%
|
||||||||||||
|
Government Sponsored Enterprises
|
263
|
3.60
|
%
|
45,654
|
4.47
|
%
|
30,275
|
2.81
|
%
|
319,782
|
3.90
|
%
|
||||||||||||
|
Total
|
$
|
263
|
3.60
|
%
|
$
|
46,344
|
4.47
|
%
|
$
|
46,404
|
3.15
|
%
|
$
|
326,346
|
3.94
|
%
|
||||||||
At December 31, 2010, there were no holders of any one issuer, other than the U. S. government, its agencies and its GSEs, in an amount greater than 10% of our shareholders’ equity.
71
DEPOSITS AND BORROWED FUNDS
Deposits provide us with our primary source of funds. The increase of $264.0 million, or 14.1%, in total deposits during 2010 provided us with funds for the growth in loans and funds to pay down FHLB advances. Deposits increased during 2010 primarily due to an increase in public fund deposits and to a lesser extent branch expansion, increased market penetration, and an increase in brokered CDs issued. During 2010, our public fund deposits increased $177.2 million to $537.9 million at December 31, 2010 from $360.7 million at December 31, 2009. At December 31, 2010, brokered CDs reflected an increase of approximately $30.1 million when compared to December 31, 2009. Deposits net of brokered deposits, at December 31, 2010, increased $233.9 million, or 13.4% when compared to December 31, 2009. Time deposits, including brokered CDs issued increased a total of $73.7 million, or 9.6%, during 2010 when compared to 2009. Noninterest bearing demand deposits increased $29.3 million, or 7.4%, during 2010. Interest bearing demand deposits increased $151.7 million, or 23.9%, and saving deposits increased $9.3 million, or 13.2%, during 2010. The latter three categories, which are considered the lowest cost deposits, comprised 60.4% of total deposits at December 31, 2010 compared to 58.8% at December 31, 2009.
The following table sets forth deposits by category at December 31, 2010, 2009, and 2008:
|
Years Ended December 31,
|
||||||||||||
|
2010
|
2009
|
2008
|
||||||||||
|
(in thousands)
|
||||||||||||
|
Noninterest Bearing Demand Deposits
|
$ | 423,304 | $ | 394,001 | $ | 390,823 | ||||||
|
Interest Bearing Demand Deposits
|
786,552 | 634,806 | 552,532 | |||||||||
|
Savings Deposits
|
79,472 | 70,198 | 60,852 | |||||||||
|
Time Deposits
|
845,100 | 771,416 | 551,924 | |||||||||
|
Total Deposits
|
$ | 2,134,428 | $ | 1,870,421 | $ | 1,556,131 | ||||||
During the year ended December 31, 2010, total time deposits of $100,000 or more increased $73.1 million, or 17.0%, to $501.9 million, from $428.8 million at December 31, 2009.
The table below sets forth the maturity distribution of time deposits of $100,000 or more at December 31, 2010 and 2009:
|
December 31, 2010
|
December 31, 2009
|
|||||||||||||||||||||||
|
Time Certificates of Deposit
|
Other Time Deposits
|
Total
|
Time Certificates of Deposit
|
Other Time Deposits
|
Total
|
|||||||||||||||||||
|
(in thousands)
|
||||||||||||||||||||||||
|
Three months or less
|
$ | 103,070 | $ | 28,000 | $ | 131,070 | $ | 178,488 | $ | 28,000 | $ | 206,488 | ||||||||||||
|
Over three to six months
|
65,202 | 21,000 | 86,202 | 78,948 | 21,000 | 99,948 | ||||||||||||||||||
|
Over six to twelve months
|
178,145 | 7,000 | 185,145 | 66,546 | 7,000 | 73,546 | ||||||||||||||||||
|
Over twelve months
|
99,477 | – | 99,477 | 48,804 | – | 48,804 | ||||||||||||||||||
|
Total
|
$ | 445,894 | $ | 56,000 | $ | 501,894 | $ | 372,786 | $ | 56,000 | $ | 428,786 | ||||||||||||
At December 31, 2010, we had a total of $20.0 million of short-term and $141.3 million in long-term brokered CDs that represented 7.6% of our deposits. Our brokered CDs at December 31, 2010 have maturities of less than six years and are reflected in the CDs under $100,000 category. At December 31, 2009, we had $131.2 million in brokered CDs and at December 31, 2008, we had $40.0 million in brokered CDs. Our current policy allows for a maximum of $165 million in brokered CDs. The potential higher interest cost and lack of customer loyalty are risks associated with the use of brokered CDs.
72
Short-term obligations, consisting primarily of FHLB advances and federal funds purchased and repurchase agreements, decreased $142.8 million, or 42.2%, during 2010 when compared to 2009. FHLB advances are collateralized by FHLB stock, nonspecified loans and securities. Other obligations consist primarily of a treasury tax and loan account. Short-term obligations are summarized as follows:
|
Years Ended December 31,
|
||||||||||||
|
2010
|
2009
|
2008
|
||||||||||
|
(dollars in thousands)
|
||||||||||||
|
Federal funds purchased and repurchase agreements
|
||||||||||||
|
Balance at end of period
|
$
|
3,844
|
$
|
13,325
|
$
|
10,629
|
||||||
|
Average amount outstanding during the period (1)
|
6,699
|
19,270
|
11,789
|
|||||||||
|
Maximum amount outstanding during the period (2)
|
13,187
|
46,983
|
16,432
|
|||||||||
|
Weighted average interest rate during the period (3)
|
3.1
|
%
|
2.7
|
%
|
3.7
|
%
|
||||||
|
Interest rate at end of period
|
3.3
|
%
|
2.7
|
%
|
3.8
|
%
|
||||||
|
FHLB advances
|
||||||||||||
|
Balance at end of period
|
$
|
189,094
|
$
|
322,351
|
$
|
229,385
|
||||||
|
Average amount outstanding during the period (1)
|
300,428
|
187,467
|
278,164
|
|||||||||
|
Maximum amount outstanding during the period (2)
|
401,893
|
322,351
|
367,823
|
|||||||||
|
Weighted average interest rate during the period (3)
|
2.4
|
%
|
2.2
|
%
|
3.1
|
%
|
||||||
|
Interest rate at end of period
|
3.6
|
%
|
1.5
|
%
|
2.6
|
%
|
||||||
|
Other obligations
|
||||||||||||
|
Balance at end of period
|
$
|
2,651
|
$
|
2,760
|
$
|
1,857
|
||||||
|
Average amount outstanding during the period (1)
|
2,522
|
2,311
|
942
|
|||||||||
|
Maximum amount outstanding during the period (2)
|
3,135
|
3,962
|
2,500
|
|||||||||
|
Weighted average interest rate during the period (3)
|
0.2
|
%
|
–
|
1.6
|
%
|
|||||||
|
Interest rate at end of period
|
0.7
|
%
|
–
|
–
|
||||||||
|
(1)
|
The average amount outstanding during the period was computed by dividing the total daily outstanding principal balances by the number of days in the period.
|
|
(2)
|
The maximum amount outstanding at any month-end during the period.
|
|
(3)
|
The weighted average interest rate during the period was computed by dividing the actual interest expense by the average balance outstanding during the period.
|
73
Long-term obligations are summarized as follows:
|
December 31,
|
December 31,
|
|||||||
|
2010
|
2009
|
|||||||
|
(in thousands)
|
||||||||
|
FHLB Advances (1)
|
||||||||
|
Varying maturities to 2028
|
$ | 373,479 | $ | 532,519 | ||||
|
Long-term Debt (2)
|
||||||||
|
Southside Statutory Trust III Due 2033 (3)
|
20,619 | 20,619 | ||||||
|
Southside Statutory Trust IV Due 2037 (4)
|
23,196 | 23,196 | ||||||
|
Southside Statutory Trust V Due 2037 (5)
|
12,887 | 12,887 | ||||||
|
Magnolia Trust Company I Due 2035 (6)
|
3,609 | 3,609 | ||||||
|
Total Long-term Debt
|
60,311 | 60,311 | ||||||
|
Total Long-term Obligations
|
$ | 433,790 | $ | 592,830 | ||||
(1) At December 31, 2010, the weighted average cost of these fixed rate advances was 3.6%.
|
|
(2)
|
This long-term debt consists of trust preferred securities that qualify under the risk-based capital guidelines as Tier 1 capital, subject to certain limitations.
|
|
|
(3)
|
This debt carries an adjustable rate of 3.24281% through March 30, 2011 and adjusts quarterly at a rate equal to three-month LIBOR plus 294 basis points.
|
|
|
(4)
|
This debt carries a fixed rate of 6.518% through October 30, 2012 and thereafter, adjusts quarterly at a rate equal to three-month LIBOR plus 130 basis points.
|
|
|
(5)
|
This debt carries a fixed rate of 7.48% through December 15, 2012 and thereafter, adjusts quarterly at a rate equal to three-month LIBOR plus 225 basis points.
|
|
|
(6)
|
This debt carries an adjustable rate of 2.08438% through February 22, 2011 and adjusts quarterly at a rate equal to three-month LIBOR plus 180 basis points.
|
74
Long-term FHLB advances decreased $159.0 million, or 29.9%, during 2010 to $373.5 million when compared to $532.5 million in 2009. The decrease was the result of a decrease in long-term FHLB advances purchased during 2010 combined with advances classified as long-term at December 31, 2009 rolling into the short-term FHLB advance category. During 2010, we issued long-term brokered CDs with call options we retained to replace a portion of the reduction in FHLB advances.
The decrease in the average long-term FHLB advances is due primarily to advances classified as long-term at December 31, 2009 rolling into the short-term category, an increase in the issuance of long-term callable brokered CDs, the use of more short-term FHLB advances during the period and the decision to enter into $150 million par in long-term advance commitments from the FHLB. During the third and fourth quarters of 2010, we entered into the option to fund between one and a half years and two years forward from the advance commitment date, $150 million par in long-term advance commitments from the FHLB at the FHLB rates on the date the option was purchased.
Long-term debt was $60.3 million at December 31, 2010 and 2009. Long-term debt consists of $20.6 million of our junior subordinated debentures issued in 2003 and $36.1 million issued in August 2007 in connection with the issuance of trust preferred securities by Southside Statutory Trusts III, IV and V and the assumption in October 2007 of $3.6 million of junior subordinated debentures issued by FWBS to Magnolia Trust Company I.
CAPITAL RESOURCES
Our total shareholders' equity at December 31, 2010 of $214.3 million increased 6.2%, or $12.5 million, from December 31, 2009 and represented 7.1% of total assets at December 31, 2010 compared to 6.7% at December 31, 2009.
Net income for 2010 of $39.5 million was the major contributor to the increase in shareholders' equity at December 31, 2010 along with the issuance of $1.8 million in common stock (163,313 shares) through our incentive stock option and dividend reinvestment plans which more than offset a decrease of $11.0 million in accumulated other comprehensive income, $13.2 million in cash dividends paid and the repurchase of common stock of $4.8 million through the stock repurchase plan. The decrease in accumulated other comprehensive income is composed of a decrease of $7.4 million, net of tax, in the unrealized gain on securities, net of reclassification adjustment (see “Note 3 – Comprehensive (Loss) Income”) and an increase of $3.6 million, net of tax, related to the change in the unfunded status of our defined benefit plans. Our dividend policy requires that any cash dividend payments may not exceed consolidated earnings for that year. Shareholders should not anticipate a continuation of the cash dividend simply because of the existence of a dividend reinvestment program. The payment of dividends will depend upon future earnings, our financial condition, and other related factors including the discretion of the board of directors.
We are subject to various regulatory capital requirements administered by the federal banking agencies. Failure to meet minimum capital requirements can initiate certain mandatory and possibly additional discretionary actions by regulators that, if undertaken, could have a direct material effect on our financial statements. Under capital adequacy guidelines and the regulatory framework for prompt corrective action, we must meet specific capital guidelines that involve quantitative measures of our assets, liabilities, and certain off-balance-sheet items as calculated under regulatory accounting practices. Our capital amounts and classification are also subject to qualitative judgments by the regulators about components, risk weightings, and other factors.
Quantitative measures established by regulation to ensure capital adequacy require us to maintain minimum amounts and ratios (set forth in the table below) of Total and Tier 1 Capital (as defined in the regulations) to risk-weighted assets (as defined), and of Tier 1 Capital (as defined) to average assets (as defined). Tier 1 Capital is defined as the sum of shareholders’ equity and qualifying subordinated debt, excluding unrealized gains or losses on debt securities available for sale, unrealized gains on equity securities available for sale and unrealized gains or losses on cash flow hedges, net of deferred income taxes; plus certain mandatorily redeemable capital securities, less nonqualifying intangible assets net of applicable deferred income taxes, and certain nonfinancial equity investments. Total capital is defined as the sum of Tier 1 Capital, a qualifying portion of the allowance for loan losses, and qualifying subordinated debt. Management believes, as of December 31, 2010, that we meet all capital adequacy requirements to which we are subject.
75
In addition, for a depository institution to be considered “well capitalized” under the regulatory framework for prompt corrective action, its Tier 1 and Total Capital ratios must be at least 6.0% and 10.0% on a risk-adjusted basis, respectively and its leverage ratio must be at least 5.0%.
To be categorized as well capitalized, we must maintain minimum Total risk-based, Tier 1 risk-based, and Tier 1 leverage ratios as set forth in the following table (dollars in thousands):
|
To Be Well
|
||||||||||||||||||||||||
|
Capitalized Under
|
||||||||||||||||||||||||
|
For Capital Adequacy
|
Prompt Corrective
|
|||||||||||||||||||||||
|
Actual
|
Purposes
|
Action Provisions
|
||||||||||||||||||||||
|
Amount
|
Ratio
|
Amount
|
Ratio
|
Amount
|
Ratio
|
|||||||||||||||||||
|
As of December 31, 2010:
|
||||||||||||||||||||||||
|
Total Capital (to Risk Weighted Assets)
|
||||||||||||||||||||||||
|
Consolidated
|
$ | 274,175 | 21.09 | % | $ | 103,981 | 8.00 | % | N/A | N/A | ||||||||||||||
|
Bank Only
|
$ | 263,186 | 20.27 | % | $ | 103,882 | 8.00 | % | $ | 129,853 | 10.00 | % | ||||||||||||
|
Tier 1 Capital (to Risk Weighted Assets)
|
||||||||||||||||||||||||
|
Consolidated
|
$ | 257,837 | 19.84 | % | $ | 51,991 | 4.00 | % | N/A | N/A | ||||||||||||||
|
Bank Only
|
$ | 246,848 | 19.01 | % | $ | 51,941 | 4.00 | % | $ | 77,912 | 6.00 | % | ||||||||||||
|
Tier 1 Capital (to Average Assets) (1)
|
||||||||||||||||||||||||
|
Consolidated
|
$ | 257,837 | 8.45 | % | $ | 122,026 | 4.00 | % | N/A | N/A | ||||||||||||||
|
Bank Only
|
$ | 246,848 | 8.10 | % | $ | 121,893 | 4.00 | % | $ | 152,367 | 5.00 | % | ||||||||||||
|
As of December 31, 2009:
|
||||||||||||||||||||||||
|
Total Capital (to Risk Weighted Assets)
|
||||||||||||||||||||||||
|
Consolidated
|
$ | 249,687 | 19.12 | % | $ | 104,447 | 8.00 | % | N/A | N/A | ||||||||||||||
|
Bank Only
|
$ | 247,250 | 18.94 | % | $ | 104,420 | 8.00 | % | $ | 130,525 | 10.00 | % | ||||||||||||
|
Tier 1 Capital (to Risk Weighted Assets)
|
||||||||||||||||||||||||
|
Consolidated
|
$ | 233,278 | 17.87 | % | $ | 52,224 | 4.00 | % | N/A | N/A | ||||||||||||||
|
Bank Only
|
$ | 230,841 | 17.69 | % | $ | 52,210 | 4.00 | % | $ | 78,315 | 6.00 | % | ||||||||||||
|
Tier 1 Capital (to Average Assets) (1)
|
||||||||||||||||||||||||
|
Consolidated
|
$ | 233,278 | 8.03 | % | $ | 116,176 | 4.00 | % | N/A | N/A | ||||||||||||||
|
Bank Only
|
$ | 230,841 | 7.95 | % | $ | 116,100 | 4.00 | % | $ | 145,125 | 5.00 | % | ||||||||||||
(1) Refers to quarterly average assets as calculated by bank regulatory agencies.
76
The table below summarizes our key equity ratios for the years ended December 31, 2010, 2009 and 2008:
|
Years Ended December 31,
|
||||||||||||
|
2010
|
2009
|
2008
|
||||||||||
|
Return on Average Assets
|
1.32
|
%
|
1.58
|
%
|
1.29
|
%
|
||||||
|
Return on Average Shareholders' Equity
|
18.16
|
%
|
23.69
|
%
|
21.44
|
%
|
||||||
|
Dividend Payout Ratio - Basic
|
33.86
|
%
|
26.41
|
%
|
30.00
|
%
|
||||||
|
Dividend Payout Ratio - Diluted
|
33.86
|
%
|
26.60
|
%
|
30.61
|
%
|
||||||
|
Average Shareholders' Equity to Average Total Assets
|
7.24
|
%
|
6.66
|
%
|
6.04
|
%
|
||||||
ACCOUNTING PRONOUNCEMENTS
See “Note 1 – Summary of Significant Accounting and Reporting Policies” to our consolidated financial statements included in this report.
EFFECTS OF INFLATION
Our consolidated financial statements, and their related notes, have been prepared in accordance with GAAP that require the measurement of financial position and operating results in terms of historical dollars, without considering the change in the relative purchasing power of money over time and due to inflation. The impact of inflation is reflected in the increased cost of our operations. Unlike many industrial companies, nearly all of our assets and liabilities are monetary. As a result, interest rates have a greater impact on our performance than do the effects of general levels of inflation. Interest rates do not necessarily move in the same direction or to the same extent as the price of goods and services. Inflation can affect the amount of money customers have for deposits, as well as ability to repay loans.
MANAGEMENT OF LIQUIDITY
Liquidity management involves our ability to convert assets to cash with a minimum of loss to enable us to meet our obligations to our customers at any time. This means addressing (1) the immediate cash withdrawal requirements of depositors and other funds providers; (2) the funding requirements of all lines and letters of credit; and (3) the short-term credit needs of customers. Liquidity is provided by short-term investments that can be readily liquidated with a minimum risk of loss. Cash, interest earning deposits, federal funds sold and short-term investments with maturities or repricing characteristics of one year or less continue to be a substantial percentage of total assets. At December 31, 2010, these investments were 16.8% of total assets, as compared with 18.9% for December 31, 2009, and 27.5% for December 31, 2008. The decrease to 16.8% at December 31, 2010 is primarily reflective of changes in the investment portfolio. Liquidity is further provided through the matching, by time period, of rate sensitive interest earning assets with rate sensitive interest bearing liabilities. Southside Bank has four lines of credit for the purchase of overnight federal funds at prevailing rates. Three $15.0 million and one $10.0 million unsecured lines of credit have been established with Bank of America, Frost Bank, Sterling Bank and TIB -The Independent Bankers Bank, respectively. There were no federal funds purchased at December 31, 2010. At December 31, 2010, the amount of additional funding Southside Bank could obtain from FHLB using unpledged securities at FHLB was approximately $377.3 million, net of FHLB stock purchases required. Southside Bank obtained $32.0 million letters of credit from FHLB as collateral for a portion of its public fund deposits.
77
Interest rate sensitivity management seeks to avoid fluctuating net interest margins and to enhance consistent growth of new interest income through periods of changing interest rates. The ALCO closely monitors various liquidity ratios, interest rate spreads and margins. The ALCO performs interest rate simulation tests that apply various interest rate scenarios including immediate shocks and market value of portfolio equity (“MVPE”) with interest rates immediately shocked plus and minus 200 basis points to assist in determining our overall interest rate risk and adequacy of the liquidity position. In addition, the ALCO utilizes a simulation model to determine the impact of net interest income of several different interest rate scenarios. By utilizing this technology, we can determine changes that need to be made to the asset and liability mixes to minimize the change in net interest income under these various interest rate scenarios.
OFF-BALANCE-SHEET ARRANGEMENTS
Financial Instruments with Off-Balance-Sheet Risk. In the normal course of business, we are a party to certain financial instruments, with off-balance-sheet risk, to meet the financing needs of our customers. These off-balance-sheet instruments include commitments to extend credit and standby letters of credit. These instruments involve, to varying degrees, elements of credit and interest rate risk in excess of the amount reflected in the financial statements. The contract or notional amounts of these instruments reflect the extent of involvement and exposure to credit loss we have in these particular classes of financial instruments.
Commitments to extend credit are agreements to lend to a customer provided that the terms established in the contract are met. Commitments generally have fixed expiration dates and may require payment of fees. Since some commitments are expected to expire without being drawn upon, the total commitment amounts do not necessarily represent future cash requirements. Standby letters of credit are conditional commitments issued to guarantee the performance of a customer to a third party. These guarantees are primarily issued to support public and private borrowing arrangements. The credit risk involved in issuing letters of credit is essentially the same as that involved in extending loan commitments to customers.
We had outstanding unused commitments to extend credit of $113.3 million and $118.7 million at December 31, 2010 and 2009, respectively. Each commitment has a maturity date or an annual cancellation date and the commitment expires on that date with the exception of credit card and ready reserve commitments, which have no stated maturity date. Unused commitments for credit card and ready reserve at December 31, 2010 and 2009 were $11.5 million and $10.7 million, respectively, and are reflected in the due after one year category. We had outstanding standby letters of credit of $5.0 million and $5.2 million at December 31, 2010 and 2009, respectively.
The scheduled maturities of unused commitments as of December 31, 2010 and 2009 were as follows (in thousands):
|
December 31,
|
||||||||
|
2010
|
2009
|
|||||||
|
Unused commitments:
|
||||||||
|
Due in one year or less
|
$ | 64,984 | $ | 67,773 | ||||
|
Due after one year
|
48,267 | 50,898 | ||||||
|
Total
|
$ | 113,251 | $ | 118,671 | ||||
We apply the same credit policies in making commitments and standby letters of credit as we do for on-balance-sheet instruments. We evaluate each customer's credit worthiness on a case-by-case basis. The amount of collateral obtained, if deemed necessary, upon extension of credit is based on management's credit evaluation of the borrower. Collateral held varies but may include cash or cash equivalents, negotiable instruments, real estate, accounts receivable, inventory, property, plant, and equipment.
78
COMMITMENTS AND CONTRACTUAL OBLIGATIONS
The following summarizes our contractual cash obligations and commercial commitments at December 31, 2010, and the effect such obligations are expected to have on liquidity and cash flow in future periods. Payments reflected in the table below do not include interest.
|
Payments Due By Period
|
||||||||||||||||||||
|
Less than 1 Year
|
1-3 Years
|
3-5 Years
|
More than 5 Years
|
Total
|
||||||||||||||||
|
Contractual obligations:
|
(in thousands)
|
|||||||||||||||||||
|
Long-term debt, including current maturities (1)
|
$ | – | $ | – | $ | – | $ | 60,311 | $ | 60,311 | ||||||||||
|
FHLB advances (2)
|
191,363 | 309,532 | 52,663 | 9,015 | 562,573 | |||||||||||||||
|
Operating leases (3)
|
1,202 | 1,527 | 384 | 14 | 3,127 | |||||||||||||||
|
Deferred compensation agreements (4)
|
891 | 974 | 1,084 | 5,377 | 8,326 | |||||||||||||||
|
Time deposits (5)
|
559,887 | 101,406 | 155,535 | 28,272 | 845,100 | |||||||||||||||
|
Securities purchased not paid for
|
145 | – | – | – | 145 | |||||||||||||||
|
Capital lease obligations
|
– | – | – | – | – | |||||||||||||||
|
Purchase obligations
|
– | – | – | – | – | |||||||||||||||
|
Total contractual obligations
|
$ | 753,488 | $ | 413,439 | $ | 209,666 | $ | 102,989 | $ | 1,479,582 | ||||||||||
(1) The total balance of long-term debt was $60.3 million at December 31, 2010. The scheduled maturities and interest rates were as follows:
|
·
|
Floating rate debt of $20.6 million with a scheduled maturity of 2033, that was indexed to three-month LIBOR and adjusts on a quarterly basis. The rate of interest for the first quarter of 2011 associated with this debt is 3.24281%.
|
|
·
|
Floating rate debt of $3.6 million with a scheduled maturity of 2035, that was indexed to three-month LIBOR and adjusts on a quarterly basis. The rate of interest associated with this debt is 2.08438% through February 22, 2011.
|
|
·
|
Debt of $23.2 million with a scheduled maturity of 2037, which carries a fixed rate of 6.518% through October 30, 2012 and thereafter adjusts quarterly at a rate equal to three-month LIBOR plus 130 basis points.
|
|
·
|
Debt of $12.9 million with a scheduled maturity of 2037, which carries a fixed rate of 7.48% through December 15, 2012 and thereafter adjusts quarterly at a rate equal to three-month LIBOR plus 225 basis points.
|
(2) We had fixed rate FHLB advances with maturity dates ranging from 2011 through 2028, with interest rates ranging from 0.9% to 7.6% with a total balance of $562.6 million at December 31, 2010. Callable FHLB advances with a total balance of $5.0 million are presented based on contractual maturity.
(3) We had various operating leases for our office machines that total $219,000 and expire on or before the end of 2015. In addition, we have operating leases totaling $2.9 million on our retail branch locations and loan production offices which have future commitments of up to five years and additional options, which we control, beyond the commitment period.
(4) We have deferred compensation agreements (the “agreements”) with 18 officers totaling $8.3 million. Payments from the agreements are to commence at the time of retirement. As of December 31, 2010, $170,000 in payments had been made from such agreements. Of the 18 officers included in the agreements, two were eligible for retirement at December 31, 2010 and one retired officer is currently receiving benefits. One officer becomes eligible in each of the years 2012, 2014 and 2015. The remaining 12 officers are eligible at various dates after five years. The totals reflected under five years assume the retirement of the two eligible officers at December 31, 2010 and the retirement of the eligible officers in 2012, 2014 and 2015. Additional information regarding executive compensation is incorporated into “Item 11. Executive Compensation” of this Annual Report on Form 10-K.
(5) We had $161.3 million of callable brokered CDs at December 31, 2010 with maturity dates ranging from 2014 through 2016 and coupons ranging from 0.75% to 2.4%.
During the third and fourth quarters of 2010, we entered into the option to fund between one and a half years and two years forward from the advance commitment date, $150 million par in long-term advance commitments from the FHLB at the FHLB rates on the date the option was purchased. In order to obtain these commitments from the FHLB we paid fees, which at December 31, 2010, were $7.6 million. The fee, included in other assets in our consolidated balance sheet, will be amortized over the term of the advance as long as it is probable we will exercise the advance commitments. Should we determine the advance commitments will not be exercised, the fee will be expensed in the period determination is made.
We expect to contribute $2.0 million to our defined benefit plan during 2011. We also expect to contribute to our defined benefit plan in future years, however, those amounts are indeterminable at this time.
79
|
ITEM 7A.
|
QUANTITATIVE AND QUALITATIVE DISCLOSURES ABOUT MARKET RISK
|
In the banking industry, a major risk exposure is changing interest rates. The primary objective of monitoring our interest rate sensitivity, or risk, is to provide management the tools necessary to manage the balance sheet to minimize adverse changes in net interest income as a result of changes in the direction and level of interest rates. Federal Reserve Board monetary control efforts, the effects of deregulation, the current economic downturn and legislative changes have been significant factors affecting the task of managing interest rate sensitivity positions in recent years.
In an attempt to manage our exposure to changes in interest rates, management closely monitors our exposure to interest rate risk through our ALCO. Our ALCO meets regularly and reviews our interest rate risk position and makes recommendations to our board for adjusting this position. In addition, our board reviews our asset/liability position on a monthly basis. We primarily use two methods for measuring and analyzing interest rate risk: net income simulation analysis and MVPE modeling. We utilize the net income simulation model as the primary quantitative tool in measuring the amount of interest rate risk associated with changing market rates. The model quantifies the effects of various interest rate scenarios on projected net interest income and net income over the next 12 months. The model was used to measure the impact on net interest income relative to a base case scenario of rates increasing 100 and 200 basis points or decreasing 100 and 200 basis points over the next 12 months. These simulations incorporate assumptions regarding balance sheet growth and mix, pricing and the repricing and maturity characteristics of the existing and projected balance sheet. The impact of interest rate-related risks such as prepayment, basis and option risk are also considered. As of December 31, 2010, the model simulations projected that 100 and 200 basis point immediate increases in interest rates would result in negative variances on net interest income of 2.56% and 6.97%, respectively, relative to the base case over the next 12 months, while an immediate decrease in interest rates of 100 and 200 basis points would result in a positive variance in net interest income of 6.14% and 5.98%, respectively, relative to the base case over the next 12 months. As of December 31, 2009, the model simulations projected that 100 and 200 basis point increases in interest rates would result in negative variances on net interest income of 4.28% and 8.33%, respectively, relative to the base case over 12 months, while decreases in interest rates of 100 and 200 basis points would result in positive variances in net interest income of 4.74% and 13.60%, respectively, relative to the base case over the next 12 months. As part of the overall assumptions, certain assets and liabilities have been given reasonable floors. This type of simulation analysis requires numerous assumptions including but not limited to changes in balance sheet mix, prepayment rates on mortgage-related assets and fixed rate loans, cash flows and repricings of all financial instruments, changes in volumes and pricing, future shapes of the yield curve, relationship of market interest rates to each other (basis risk), credit spread and deposit sensitivity. Assumptions are based on management’s best estimates but may not accurately reflect actual results under certain changes in interest rates.
The ALCO monitors various liquidity ratios to ensure a satisfactory liquidity position for us. Management continually evaluates the condition of the economy, the pattern of market interest rates and other economic data to determine the types of investments that should be made and at what maturities. Using this analysis, management from time to time assumes calculated interest sensitivity gap positions to maximize net interest income based upon anticipated movements in the general level of interest rates. Regulatory authorities also monitor our gap position along with other liquidity ratios. In addition, as described above, we utilize a simulation model to determine the impact of net interest income under several different interest rate scenarios. By utilizing this technology, we can determine changes that need to be made to the asset and liability mixes to mitigate the change in net interest income under these various interest rate scenarios.
80
|
ITEM 8. FINANCIAL STATEMENTS AND SUPPLEMENTARY DATA
|
The information required by this item is set forth in Part IV.
|
ITEM 9. CHANGES IN AND DISAGREEMENTS WITH ACCOUNTANTS ON ACCOUNTING AND
|
|
FINANCIAL DISCLOSURE
|
None.
|
ITEM 9A. CONTROLS AND PROCEDURES
|
|
Evaluation of Disclosure Controls and Procedures
|
Management, including our Chief Executive Officer ("CEO") and our Chief Financial Officer ("CFO"), undertook an evaluation of our disclosure controls and procedures (as defined in Rules 13a-15(e) and 15d-15(e) of the Exchange Act of 1934, as amended) as of December 31, 2010 and, based on that evaluation, our CEO and CFO concluded that our disclosure controls and procedures were effective as of that date.
Management’s Report on Internal Control Over Financial Reporting
Management is responsible for establishing and maintaining adequate internal control over financial reporting. Internal control over financial reporting is defined in Rules 13a-15(f) and 15d-15(f) under the Securities Exchange Act of 1934, as amended, as a process designed by, or under the supervision of, our CEO and CFO and effected by our board of directors, management and other personnel to provide reasonable assurance regarding the reliability of financial reporting and the preparation of financial statements for external purposes in accordance with generally accepted accounting principles and includes those policies and procedures that:
|
|
·
|
pertain to the maintenance of records that in reasonable detail accurately and fairly reflect the transactions and dispositions of our assets;
|
|
|
·
|
provide reasonable assurance that transactions are recorded as necessary to permit preparation of financial statements in accordance with generally accepted accounting principles, and that our receipts and expenditures are being made only in accordance with authorizations of our management and directors; and
|
|
|
·
|
provide reasonable assurance regarding prevention or timely detection of unauthorized acquisition, use or disposition of our assets that could have a material effect on the financial statements.
|
Because of its inherent limitations, internal control over financial reporting may not prevent or detect misstatements. Also, projections of any evaluation of effectiveness to future periods are subject to the risks that controls may become inadequate because of changes in conditions, or that the degree of compliance with the policies or procedures may deteriorate.
Management assessed the effectiveness of our internal control over financial reporting as of December 31, 2010. In making this assessment, management used the criteria set forth by the Committee of Sponsoring Organizations of the Treadway Commission (“COSO”) in Internal Control-Integrated Framework.
Based on this assessment, management concluded that we maintained effective internal control over financial reporting as of December 31, 2010.
The effectiveness of our internal control over financial reporting as of December 31, 2010 has been audited by PricewaterhouseCoopers LLP, an independent registered public accounting firm, as stated in their report which appears herein.
81
|
Changes in Internal Control Over Financial Reporting
|
No changes were made to our internal control over financial reporting (as defined in Rule 13a-15(f) under the Exchange Act of 1934, as amended) during the last fiscal quarter of the period covered by this report that materially affected, or are reasonably likely to materially affect, our internal control over financial reporting.
|
ITEM 9B.
|
OTHER INFORMATION
|
None.
PART III
|
ITEM 10.
|
DIRECTORS, EXECUTIVE OFFICERS AND CORPORATE GOVERNANCE
|
The information required by this Item is incorporated herein by reference to our Proxy Statement (Schedule 14A) for our 2011 Annual Meeting of shareholders to be filed with the SEC within 120 days of our fiscal year-end.
|
ITEM 11.
|
EXECUTIVE COMPENSATION
|
The information required by this Item is incorporated herein by reference to our Proxy Statement (Schedule 14A) for our 2011 Annual Meeting of shareholders to be filed with the SEC within 120 days of our fiscal year-end.
|
ITEM 12.
|
SECURITY OWNERSHIP OF CERTAIN BENEFICIAL OWNERS AND MANAGEMENT AND RELATED STOCKHOLDER MATTERS
|
The information required by this Item is incorporated herein by reference to our Proxy Statement (Schedule 14A) for our 2011 Annual Meeting of shareholders to be filed with the SEC within 120 days of our fiscal year-end.
|
ITEM 13.
|
CERTAIN RELATIONSHIPS AND RELATED TRANSACTIONS, AND DIRECTOR INDEPENDENCE
|
The information required by this Item is incorporated herein by reference to our Proxy Statement (Schedule 14A) for our 2011 Annual Meeting of shareholders to be filed with the SEC within 120 days of our fiscal year-end.
|
ITEM 14.
|
PRINCIPAL ACCOUNTANT FEES AND SERVICES
|
The information required by this Item is incorporated herein by reference to our Proxy Statement (Schedule 14A) for our 2011 Annual Meeting of shareholders to be filed with the SEC within 120 days of our fiscal year-end.
82
PART IV
|
ITEM 15.
|
EXHIBITS AND FINANCIAL STATEMENT SCHEDULES
|
(a)
|
|
1.
|
Financial Statements
|
The following consolidated financial statements of Southside Bancshares, Inc. and its subsidiaries are filed as part of this report.
Consolidated Balance Sheets as of December 31, 2010 and 2009.
Consolidated Statements of Income for the years ended December 31, 2010, 2009 and 2008.
Consolidated Statements of Shareholders’ Equity for the years ended December 31, 2010, 2009 and 2008.
Consolidated Statements of Cash Flow for the years ended December 31, 2010, 2009 and 2008.
Notes to Consolidated Financial Statements.
|
|
2.
|
Financial Statement Schedules
|
|
|
All schedules are omitted because they are not applicable or not required, or because the required information is included in the consolidated financial statements or notes thereto.
|
|
|
3.
|
Exhibits
|
|
Exhibit No.
|
|||
|
3 (a)
|
–
|
Amended and Restated Articles of Incorporation of Southside Bancshares, Inc. effective April 17, 2009 (filed as Exhibit 3(a) to the Registrant’s Form 8-K, filed April 20, 2009, and incorporated herein by reference).
|
|
|
3 (b)(i)
|
–
|
Amended and Restated Bylaws of Southside Bancshares, Inc. effective February 28, 2008 (filed as Exhibit 3(b) to the Registrant’s Form 8-K, filed March 5, 2008, and incorporated herein by reference).
|
|
|
3 (b)(ii)
|
–
|
Amendment No.1 to the Amended and Restated Bylaws of Southside Bancshares, Inc. effective August 27, 2009 (filed as Exhibit 3.1 to the Registrant’s Form 8-K/A, filed September 10, 2009, and incorporated herein by reference).
|
|
|
3(b)(iii)
|
–
|
Amendment No. 2 to the Amended and Restated Bylaws of Southside Bancshares, Inc. effective September 2, 2010 (filed as Exhibit 3.1 to the Registrant’s Form 8-K, filed September 2, 2010, and incorporated herein by reference).
|
|
|
4
|
–
|
Management agrees to furnish to the Securities and Exchange Commission, upon request, a copy of any other agreements or instruments of Southside Bancshares, Inc. and its subsidiaries defining the rights of holders of any long-term debt whose authorization does not exceed 10% of total assets.
|
|
|
10
|
–
|
Southside Securities, Inc., located in Tyler, Texas. The Company is the sole shareholder of this nonbank subsidiary, formed April 8, 2010, created under the laws of the State of Texas.
|
83
|
** 10 (a)(i)
|
–
|
Deferred Compensation Plan for B. G. Hartley effective February 13, 1984, as amended June 28, 1990, December 15, 1994, November 20, 1995, December 21,1999 and June 29, 2001 (filed as Exhibit 10(a)(i) to the Registrant’s Form 10-Q for the quarter ended June 30, 2001, and incorporated herein by reference).
|
|
|
** 10 (a)(ii)
|
–
|
Deferred Compensation Plan for Robbie N. Edmonson effective February 13, 1984, as amended June 28, 1990 and March 16, 1995 (filed as Exhibit 10(a)(ii) to the Registrant's Form 10-K for the year ended December 31, 1995, and incorporated herein by reference).
|
|
|
** 10 (b)
|
–
|
Officers Long-term Disability Income Plan effective June 25, 1990 (filed as Exhibit 10(b) to the Registrant's Form 10-K for the year ended June 30, 1990, and incorporated herein by reference).
|
|
|
** 10 (c)
|
–
|
Retirement Plan Restoration Plan for the subsidiaries of SoBank, Inc. (now named Southside Bancshares, Inc.) (filed as Exhibit 10(c) to the Registrant's Form 10-K for the year ended December 31, 1992, and incorporated herein by reference).
|
|
|
** 10 (d)
|
–
|
Form of Deferred Compensation Agreements dated June 30, 1994 with each of Sam Dawson, Lee Gibson and Jeryl Story as amended October 15, 1997 (filed as Exhibit 10(f) to the Registrant’s Form 10-K for the year ended December 31, 1997, and incorporated herein by reference).
|
|
|
** 10 (e)
|
–
|
Split dollar compensation plan dated October 13, 2004 with Jeryl Wayne Story (filed as exhibit 10(h) to the Registrant’s Form 8-K, filed October 19, 2004, and incorporated herein by reference).
|
|
|
** 10 (f)
|
–
|
Split dollar compensation plan dated September 7, 2004 with Lee R. Gibson, III (filed as exhibit 10(i) to the Registrant’s Form 8-K, filed October 19, 2004, and incorporated herein by reference).
|
|
|
** 10 (g)
|
–
|
Split dollar compensation plan dated August 27, 2004 with B. G. Hartley (filed as exhibit 10 (j) to the Registrant’s Form 8-K, filed October 19, 2004, and incorporated herein by reference).
|
|
|
** 10 (h)
|
–
|
Split dollar compensation plan dated August 31, 2004 with Charles E. Dawson (filed as exhibit 10(k) to the Registrant’s Form 8-K, filed October 19, 2004, and incorporated herein by reference).
|
|
|
** 10 (i)
|
–
|
Employment Agreement dated October 22, 2007 by and between Southside Bank and Lee R. Gibson (filed as exhibit 10 (l) to the Registrant’s Form 8-K, filed October 26, 2007, and incorporated herein by reference).
|
|
|
** 10 (j)
|
–
|
Employment Agreement dated October 22, 2007 by and between Southside Bank and Sam Dawson (filed as exhibit 10 (m) to the Registrant’s Form 8-K, filed October 26, 2007, and incorporated herein by reference).
|
|
10 (k)
|
–
|
Master Software License Maintenance and Services Agreement dated February 4, 2008, by and between Southside Bank and Jack Henry & Associates, Inc. (filed as Item 1.01 to the Registrant’s Form 8-K, filed February 8, 2008, and incorporated herein by reference).
|
84
|
** 10 (l)
|
–
|
Retirement Agreement dated November 7, 2008, by and between Southside Bank, Southside Bancshares, Inc. and B. G. Hartley (filed as exhibit 10 (o) to the Registrant’s Form 10-Q, filed November 7, 2008, and incorporated herein by reference).
|
|
|
** 10 (m)
|
–
|
Southside Bancshares, Inc. 2009 Incentive Plan (filed as Exhibit 99.1 to the Registrant’s Form 8-K filed April 20, 2009, and incorporated herein by reference).
|
|
|
10 (n)
|
–
|
Agreement and Plan of Merger dated May 17, 2007, as amended, by and among Southside Bancshares, Inc., Southside Merger Sub, Inc. and FWBS (filed as Exhibit 10(a) to the Registrant’s Form 10-Q for the quarter ended September 30, 2007, and incorporated herein by reference).
|
|
|
11
|
Southside Financial Properties, Inc., located in Tyler, Texas. Southside Financial Properties is a nonbank subsidiary formed September 17, 2010, created under the laws of the State of Texas.
|
||
|
* 21
|
–
|
Subsidiaries of the Registrant.
|
|
|
* 23
|
–
|
Consent of Independent Registered Public Accounting Firm.
|
|
|
* 31.1
|
–
|
Certification Pursuant to Section 302 of the Sarbanes-Oxley Act of 2002.
|
|
|
* 31.2
|
–
|
Certification Pursuant to Section 302 of the Sarbanes-Oxley Act of 2002.
|
|
|
* 32
|
–
|
Certification Pursuant to Section 906 of the Sarbanes-Oxley Act of 2002.
|
|
|
*Filed herewith.
|
|||
|
**Compensation plan, benefit plan or employment contract or arrangement.
|
|||
85
Pursuant to the requirements of Section 13 or 15(d) of the Securities Exchange Act of 1934, the registrant has duly caused this report to be signed on its behalf by the undersigned, thereunto duly authorized.
|
SOUTHSIDE BANCSHARES, INC.
|
||
|
|
||
|
BY: /s/
|
B. G. HARTLEY
|
|
|
B. G. Hartley, Chairman of the Board and Chief Executive Officer
|
||
|
(Principal Executive Officer)
|
||
|
|
||
|
DATE: March 7, 2011
|
||
|
BY: /s/
|
LEE R. GIBSON
|
|
|
Lee R. Gibson, CPA, Senior Executive Vice President and Chief Financial Officer
|
||
|
(Principal Financial Officer)
|
||
|
DATE: March 7, 2011
|
||
Pursuant to the requirements of the Securities Exchange Act of 1934, this report has been signed below by the following persons on behalf of the registrant and in the capacities and on the date indicated.
|
Signature
|
Title
|
Date
|
|
|
/s/
|
B. G. HARTLEY
|
||
|
(B. G. Hartley)
|
Chief Executive Officer,
|
March 7, 2011
|
|
|
Chairman of the Board
|
|||
|
and Director
|
|||
|
/s/
|
ROBBIE N. EDMONSON
|
||
|
(Robbie N. Edmonson)
|
Vice Chairman of the Board
|
March 7, 2011
|
|
|
and Director
|
|||
|
/s/
|
SAM DAWSON
|
||
|
(Sam Dawson)
|
President, Secretary
|
March 7, 2011
|
|
|
and Director
|
|||
|
/s/
|
JULIE N. SHAMBURGER
|
||
|
(Julie N. Shamburger)
|
CPA, Executive Vice President
|
March 7, 2011
|
|
|
and Chief Accounting Officer
|
|||
|
(Principal Accounting Officer)
|
|||
|
(Lawrence Anderson)
|
Director
|
March 4, 2011
|
|
|
(Herbert C. Buie)
|
Director
|
March 4, 2011
|
|
86
|
/s/
|
ALTON CADE
|
||
|
(Alton Cade)
|
Director
|
March 4, 2011
|
|
|
/s/
|
PIERRE DE WET
|
||
|
(Pierre de Wet)
|
Director
|
March 4, 2011
|
|
|
(Bob Garrett)
|
Director
|
March 4, 2011
|
|
|
/s/
|
MELVIN B. LOVELADY
|
||
|
(Melvin B. Lovelady)
|
Director
|
March 4, 2011
|
|
|
/s/
|
JOE NORTON
|
||
|
(Joe Norton)
|
Director
|
March 4, 2011
|
|
|
(Paul W. Powell)
|
Director
|
March 4, 2011
|
|
|
/s/
|
WILLIAM SHEEHY
|
||
|
(William Sheehy)
|
Director
|
March 4, 2011
|
|
|
/s/
|
PRESTON SMITH
|
||
|
(Preston Smith)
|
Director
|
March 4, 2011
|
|
|
/s/
|
DON THEDFORD
|
||
|
(Don Thedford)
|
Director
|
March 4, 2011
|
|
87
Report of Independent Registered Public Accounting Firm
To the Board of Directors and Shareholders of
Southside Bancshares, Inc.
In our opinion, the accompanying consolidated balance sheets and the related consolidated statements of income, changes in equity and cash flow present fairly, in all material respects, the financial position of Southside Bancshares, Inc. and its subsidiaries at December 31, 2010 and 2009 and the results of their operations and their cash flows for each of the three years in the period ended December 31, 2010 in conformity with accounting principles generally accepted in the United States of America. Also in our opinion, the Company maintained, in all material respects, effective internal control over financial reporting as of December 31, 2010, based on criteria established in Internal Control - Integrated Framework issued by the Committee of Sponsoring Organizations of the Treadway Commission (COSO). The Company's management is responsible for these financial statements, for maintaining effective internal control over financial reporting and for its assessment of the effectiveness of internal control over financial reporting, included in Management's Report on Internal Control Over Financial Reporting appearing under Item 9A. Our responsibility is to express opinions on these financial statements and on the Company's internal control over financial reporting based on our integrated audits. We conducted our audits in accordance with the standards of the Public Company Accounting Oversight Board (United States). Those standards require that we plan and perform the audits to obtain reasonable assurance about whether the financial statements are free of material misstatement and whether effective internal control over financial reporting was maintained in all material respects. Our audits of the financial statements included examining, on a test basis, evidence supporting the amounts and disclosures in the financial statements, assessing the accounting principles used and significant estimates made by management, and evaluating the overall financial statement presentation. Our audit of internal control over financial reporting included obtaining an understanding of internal control over financial reporting, assessing the risk that a material weakness exists, and testing and evaluating the design and operating effectiveness of internal control based on the assessed risk. Our audits also included performing such other procedures as we considered necessary in the circumstances. We believe that our audits provide a reasonable basis for our opinions.
As discussed in Note 1 to the consolidated financial statements, the Company changed the manner in which it accounts for other-than-temporary impairment in 2009.
A company’s internal control over financial reporting is a process designed to provide reasonable assurance regarding the reliability of financial reporting and the preparation of financial statements for external purposes in accordance with generally accepted accounting principles. A company’s internal control over financial reporting includes those policies and procedures that (i) pertain to the maintenance of records that, in reasonable detail, accurately and fairly reflect the transactions and dispositions of the assets of the company; (ii) provide reasonable assurance that transactions are recorded as necessary to permit preparation of financial statements in accordance with generally accepted accounting principles, and that receipts and expenditures of the company are being made only in accordance with authorizations of management and directors of the company; and (iii) provide reasonable assurance regarding prevention or timely detection of unauthorized acquisition, use, or disposition of the company’s assets that could have a material effect on the financial statements.
Because of its inherent limitations, internal control over financial reporting may not prevent or detect misstatements. Also, projections of any evaluation of effectiveness to future periods are subject to the risk that controls may become inadequate because of changes in conditions, or that the degree of compliance with the policies or procedures may deteriorate.
/s/ PricewaterhouseCoopers LLP
Dallas, Texas
March 7, 2011
88
|
SOUTHSIDE BANCSHARES, INC. AND SUBSIDIARIES
|
||||||||
|
CONSOLIDATED BALANCE SHEETS
|
||||||||
|
(in thousands, except share amounts)
|
||||||||
|
December 31, 2010
|
December 31, 2009
|
|||||||
|
ASSETS
|
||||||||
|
Cash and due from banks
|
$ | 56,188 | $ | 50,350 | ||||
|
Interest earning deposits
|
22,885 | 1,816 | ||||||
|
Total cash and cash equivalents
|
79,073 | 52,166 | ||||||
|
Investment securities:
|
||||||||
|
Available for sale, at estimated fair value
|
299,344 | 265,060 | ||||||
|
Held to maturity, at amortized cost
|
1,495 | 1,493 | ||||||
|
Mortgage-backed and related securities:
|
||||||||
|
Available for sale, at estimated fair value
|
946,043 | 1,238,182 | ||||||
|
Held to maturity, at amortized cost
|
417,862 | 242,665 | ||||||
|
FHLB stock, at cost
|
34,712 | 38,629 | ||||||
|
Other investments, at cost
|
2,064 | 2,065 | ||||||
|
Loans held for sale
|
6,583 | 2,857 | ||||||
|
Loans:
|
||||||||
|
Loans
|
1,077,920 | 1,033,576 | ||||||
|
Less: allowance for loan losses
|
(20,711 | ) | (19,896 | ) | ||||
|
Net Loans
|
1,057,209 | 1,013,680 | ||||||
|
Premises and equipment, net
|
50,144 | 46,477 | ||||||
|
Goodwill
|
22,034 | 22,034 | ||||||
|
Other intangible assets, net
|
777 | 1,096 | ||||||
|
Interest receivable
|
18,033 | 18,482 | ||||||
|
Deferred tax asset
|
6,677 | 1,611 | ||||||
|
Other assets
|
57,571 | 77,791 | ||||||
|
TOTAL ASSETS
|
$ | 2,999,621 | $ | 3,024,288 | ||||
|
LIABILITIES AND EQUITY
|
||||||||
|
Deposits:
|
||||||||
|
Noninterest bearing
|
$ | 423,304 | $ | 394,001 | ||||
|
Interest bearing
|
1,711,124 | 1,476,420 | ||||||
|
Total Deposits
|
2,134,428 | 1,870,421 | ||||||
|
Short-term obligations:
|
||||||||
|
Federal funds purchased and repurchase agreements
|
3,844 | 13,325 | ||||||
|
FHLB advances
|
189,094 | 322,351 | ||||||
|
Other obligations
|
2,651 | 2,760 | ||||||
|
Total Short-term obligations
|
195,589 | 338,436 | ||||||
|
Long-term obligations:
|
||||||||
|
FHLB advances
|
373,479 | 532,519 | ||||||
|
Long-term debt
|
60,311 | 60,311 | ||||||
|
Total Long-term obligations
|
433,790 | 592,830 | ||||||
|
Other liabilities
|
20,378 | 20,352 | ||||||
|
TOTAL LIABILITIES
|
2,784,185 | 2,822,039 | ||||||
|
Off-Balance-Sheet Arrangements, Commitments and Contingencies (Note 17)
|
||||||||
|
Shareholders' equity:
|
||||||||
|
Common stock: ($1.25 par, 40,000,000 shares authorized, 17,660,312 shares issued in 2010 and 16,742,835 shares issued in 2009)
|
22,075 | 20,928 | ||||||
|
Paid-in capital
|
162,877 | 146,357 | ||||||
|
Retained earnings
|
64,567 | 53,812 | ||||||
|
Treasury stock (2,023,838 and 1,762,261 shares at cost)
|
(28,377 | ) | (23,545 | ) | ||||
|
Accumulated other comprehensive (loss) income
|
(6,819 | ) | 4,229 | |||||
|
TOTAL SHAREHOLDERS' EQUITY
|
214,323 | 201,781 | ||||||
|
Noncontrolling interest
|
1,113 | 468 | ||||||
|
TOTAL EQUITY
|
215,436 | 202,249 | ||||||
|
TOTAL LIABILITIES AND EQUITY
|
$ | 2,999,621 | $ | 3,024,288 | ||||
The accompanying notes are an integral part of these consolidated financial statements.
89
|
SOUTHSIDE BANCSHARES, INC. AND SUBSIDIARIES
|
||||||||||||
|
CONSOLIDATED STATEMENTS OF INCOME
|
||||||||||||
|
(in thousands, except per share data)
|
Years Ended December 31,
|
|||||||||||
|
2010
|
2009
|
2008
|
||||||||||
|
Interest income
|
||||||||||||
|
Loans
|
$
|
69,973
|
$
|
70,679
|
$
|
73,120
|
||||||
|
Investment securities - taxable
|
91
|
1,055
|
1,723
|
|||||||||
|
Investment securities - tax exempt
|
10,889
|
7,607
|
4,910
|
|||||||||
|
Mortgage-backed and related securities
|
50,130
|
65,463
|
55,470
|
|||||||||
|
FHLB stock and other investments
|
259
|
235
|
841
|
|||||||||
|
Other interest earning assets
|
32
|
154
|
112
|
|||||||||
|
Total interest income
|
131,374
|
145,193
|
136,176
|
|||||||||
|
Interest expense
|
||||||||||||
|
Deposits
|
18,969
|
22,682
|
32,891
|
|||||||||
|
Short-term obligations
|
7,563
|
4,696
|
8,969
|
|||||||||
|
Long-term obligations
|
18,775
|
25,294
|
18,503
|
|||||||||
|
Total interest expense
|
45,307
|
52,672
|
60,363
|
|||||||||
|
Net interest income
|
86,067
|
92,521
|
75,813
|
|||||||||
|
Provision for loan losses
|
13,737
|
15,093
|
13,675
|
|||||||||
|
Net interest income after provision for loan losses
|
72,330
|
77,428
|
62,138
|
|||||||||
|
Noninterest income
|
||||||||||||
|
Deposit services
|
16,819
|
17,629
|
18,395
|
|||||||||
|
Gain on sale of securities available for sale
|
25,789
|
33,446
|
12,334
|
|||||||||
|
Total other-than-temporary impairment losses
|
(39
|
)
|
(5,730
|
)
|
–
|
|||||||
|
Portion of loss recognized in other comprehensive income (before taxes)
|
(36
|
)
|
2,730
|
–
|
||||||||
|
Net impairment losses recognized in earnings
|
(75
|
)
|
(3,000
|
)
|
–
|
|||||||
|
Gain on sale of loans
|
1,751
|
1,240
|
1,757
|
|||||||||
|
Trust income
|
2,368
|
2,456
|
2,465
|
|||||||||
|
Bank owned life insurance income
|
1,155
|
1,724
|
2,246
|
|||||||||
|
Other
|
3,589
|
3,179
|
3,105
|
|||||||||
|
Total noninterest income
|
51,396
|
56,674
|
40,302
|
|||||||||
|
Noninterest expense
|
||||||||||||
|
Salaries and employee benefits
|
43,957
|
42,505
|
37,228
|
|||||||||
|
Occupancy expense
|
6,780
|
6,372
|
5,704
|
|||||||||
|
Equipment expense
|
1,899
|
1,718
|
1,305
|
|||||||||
|
Advertising, travel and entertainment
|
2,319
|
2,344
|
2,097
|
|||||||||
|
ATM and debit card expense
|
825
|
1,296
|
1,211
|
|||||||||
|
Director fees
|
950
|
785
|
674
|
|||||||||
|
Supplies
|
902
|
863
|
812
|
|||||||||
|
Professional fees
|
2,015
|
2,218
|
1,864
|
|||||||||
|
Postage
|
800
|
872
|
755
|
|||||||||
|
Telephone and communications
|
1,443
|
1,424
|
1,050
|
|||||||||
|
FDIC Insurance
|
2,909
|
3,943
|
966
|
|||||||||
|
Other
|
6,515
|
7,290
|
6,686
|
|||||||||
|
Total noninterest expense
|
71,314
|
71,630
|
60,352
|
|||||||||
|
Income before income tax expense
|
52,412
|
62,472
|
42,088
|
|||||||||
|
Provision (benefit) for income tax expense
|
||||||||||||
|
Current
|
11,100
|
16,816
|
15,601
|
|||||||||
|
Deferred
|
866
|
(207
|
)
|
(4,351
|
)
|
|||||||
|
Total income taxes
|
11,966
|
16,609
|
11,250
|
|||||||||
|
Net income
|
40,446
|
45,863
|
30,838
|
|||||||||
|
Less: Net income attributable to the noncontrolling interest
|
(955
|
)
|
(1,467
|
)
|
(142
|
)
|
||||||
|
Net income attributable to Southside Bancshares, Inc
|
$
|
39,491
|
$
|
44,396
|
$
|
30,696
|
||||||
|
Earnings per common share – basic
|
$
|
2.51
|
$
|
2.84
|
$
|
2.00
|
||||||
|
Earnings per common share – diluted
|
$
|
2.51
|
$
|
2.82
|
$
|
1.96
|
||||||
|
Dividends declared per common share
|
$
|
0.85
|
$
|
0.75
|
$
|
0.60
|
||||||
The accompanying notes are an integral part of these consolidated financial statements.
90
SOUTHSIDE BANCSHARES, INC. AND SUBSIDIARIES
CONSOLIDATED STATEMENTS OF CHANGES IN EQUITY
(in thousands, except share amounts)
|
Years Ended December 31,
|
||||||||||||
|
2010
|
2009
|
2008
|
||||||||||
|
Common Stock
|
||||||||||||
|
Balance, beginning of period
|
$ | 20,928 | $ | 19,695 | $ | 18,581 | ||||||
|
Issuance of common stock (163,313 shares in 2010, 277,761 shares in 2009 and 231,749 shares in 2008)
|
204 | 347 | 290 | |||||||||
|
Stock dividend
|
943 | 886 | 824 | |||||||||
|
Balance, end of period
|
22,075 | 20,928 | 19,695 | |||||||||
|
Paid-in capital
|
||||||||||||
|
Balance, beginning of period
|
146,357 | 131,112 | 115,250 | |||||||||
|
Issuance of common stock (163,313 shares in 2010, 277,761 shares in 2009 and 231,749 shares in 2008)
|
1,619 | 1,953 | 1,794 | |||||||||
|
Stock compensation expense
|
– | – | 7 | |||||||||
|
Tax benefit of incentive stock options
|
331 | 651 | 639 | |||||||||
|
Stock dividend
|
14,570 | 12,641 | 13,422 | |||||||||
|
Balance, end of period
|
162,877 | 146,357 | 131,112 | |||||||||
|
Retained earnings
|
||||||||||||
|
Balance, beginning of period
|
53,812 | 34,021 | 26,187 | |||||||||
|
Net income attributable to Southside Bancshares, Inc.
|
39,491 | 44,396 | 30,696 | |||||||||
|
Cumulative effect of adoption of a new accounting principle on January 1, 2008
|
– | – | (351 | ) | ||||||||
|
Dividends paid on common stock ($0.85 per share in 2010, $0.75 per share in 2009 and $0.60 per share in 2008)
|
(13,223 | ) | (11,078 | ) | (8,265 | ) | ||||||
|
Stock dividend
|
(15,513 | ) | (13,527 | ) | (14,246 | ) | ||||||
|
Balance, end of period
|
64,567 | 53,812 | 34,021 | |||||||||
|
Treasury Stock
|
||||||||||||
|
Balance, beginning of period
|
(23,545 | ) | (23,115 | ) | (22,983 | ) | ||||||
|
Purchase of common stock (261,577 shares in 2010, 30,691 shares in 2009 and 6,713 shares in 2008)
|
(4,832 | ) | (430 | ) | (132 | ) | ||||||
|
Balance, end of period
|
(28,377 | ) | (23,545 | ) | (23,115 | ) | ||||||
|
Accumulated other comprehensive (loss) income
|
||||||||||||
|
Balance, beginning of period
|
4,229 | (1,096 | ) | (4,707 | ) | |||||||
|
Net unrealized gains on available for sale securities, net of tax
|
9,238 | 24,225 | 18,680 | |||||||||
|
Reclassification adjustment for gains on sales of available for sale securities included in net income, net of tax
|
(16,763 | ) | (21,740 | ) | (8,017 | ) | ||||||
|
Non-credit portion of other-than-temporary impairment losses on available for sale
|
||||||||||||
|
securities, net of tax
|
23 | (1,775 | ) | – | ||||||||
|
Reclassification of other-than-temporary impairment charges on available for sale securities included in net income, net tax
|
49 | 1,950 | – | |||||||||
|
Adjustment to net periodic benefit cost, net of tax
|
(3,595 | ) | 2,665 | (7,052 | ) | |||||||
|
Net change in accumulated other comprehensive (loss) income
|
(11,048 | ) | 5,325 | 3,611 | ||||||||
|
Balance, end of period
|
(6,819 | ) | 4,229 | (1,096 | ) | |||||||
|
Total shareholders’ equity
|
214,323 | 201,781 | 160,617 | |||||||||
|
Noncontrolling interest
|
||||||||||||
|
Balance, beginning of period
|
468 | 472 | 498 | |||||||||
|
Net income attributable to noncontrolling interest shareholders
|
955 | 1,467 | 142 | |||||||||
|
Capital distribution to noncontrolling interest shareholders
|
(310 | ) | (1,471 | ) | (168 | ) | ||||||
|
Balance, end of period
|
1,113 | 468 | 472 | |||||||||
|
Total equity
|
$ | 215,436 | $ | 202,249 | $ | 161,089 | ||||||
|
Comprehensive income
|
||||||||||||
|
Net income
|
$ | 40,446 | $ | 45,863 | $ | 30,838 | ||||||
|
Net change in accumulated other comprehensive (loss) income
|
(11,048 | ) | 5,325 | 3,611 | ||||||||
|
Comprehensive income
|
29,398 | 51,188 | 34,449 | |||||||||
|
Comprehensive income attributable to the noncontrolling interest
|
(955 | ) | (1,467 | ) | (142 | ) | ||||||
|
Comprehensive income attributable to Southside Bancshares, Inc.
|
$ | 28,443 | $ | 49,721 | $ | 34,307 | ||||||
The accompanying notes are an integral part of these consolidated financial statements.
91
|
SOUTHSIDE BANCSHARES, INC. AND SUBSIDIARIES
|
||||||||||||
|
CONSOLIDATED STATEMENTS OF CASH FLOW
|
||||||||||||
|
(in thousands)
|
Years Ended December 31,
|
|||||||||||
|
2010
|
2009
|
2008
|
||||||||||
|
OPERATING ACTIVITIES:
|
||||||||||||
|
Net income
|
$
|
40,446
|
$
|
45,863
|
$
|
30,838
|
||||||
|
Adjustments to reconcile net income to net cash provided by operations:
|
||||||||||||
|
Depreciation
|
3,204
|
2,888
|
2,458
|
|||||||||
|
Amortization of premium
|
35,245
|
15,393
|
7,148
|
|||||||||
|
Accretion of discount and loan fees
|
(4,502
|
)
|
(3,913
|
)
|
(4,483
|
)
|
||||||
|
Provision for loan losses
|
13,737
|
15,093
|
13,675
|
|||||||||
|
Stock compensation expense
|
–
|
–
|
7
|
|||||||||
|
Decrease (increase) in interest receivable
|
449
|
(2,130
|
)
|
(4,561
|
)
|
|||||||
|
Increase in other assets
|
(8,289
|
)
|
(12,239
|
)
|
(1,596
|
)
|
||||||
|
Net change in deferred taxes
|
883
|
(1,642
|
)
|
(378
|
)
|
|||||||
|
(Decrease) increase in interest payable
|
(879
|
)
|
(1,621
|
)
|
468
|
|||||||
|
Increase (decrease) in other liabilities
|
1,566
|
(944
|
)
|
(5,324
|
)
|
|||||||
|
(Increase) decrease in loans held for sale
|
(3,726
|
)
|
(2,346
|
)
|
2,850
|
|||||||
|
Gain on sale of securities available for sale
|
(25,789
|
)
|
(33,446
|
)
|
(12,334
|
)
|
||||||
|
Net other-than-temporary impairment losses
|
75
|
3,000
|
–
|
|||||||||
|
(Gain) loss on sale of assets
|
(7
|
)
|
–
|
77
|
||||||||
|
Loss on disposal of assets
|
–
|
171
|
–
|
|||||||||
|
Impairment on other real estate owned
|
20
|
729
|
–
|
|||||||||
|
Loss on sale of other real estate owned
|
153
|
52
|
–
|
|||||||||
|
Net cash provided by operating activities
|
52,586
|
24,908
|
28,845
|
|||||||||
|
INVESTING ACTIVITIES:
|
||||||||||||
|
Proceeds from sales of investment securities available for sale
|
115,282
|
260,090
|
137,826
|
|||||||||
|
Proceeds from sales of mortgage-backed securities available for sale
|
1,209,939
|
718,520
|
449,537
|
|||||||||
|
Proceeds from maturities of investment securities available for sale
|
19,446
|
56,523
|
86,790
|
|||||||||
|
Proceeds from maturities of mortgage-backed securities available for sale
|
340,139
|
268,035
|
127,008
|
|||||||||
|
Proceeds from maturities of mortgage-backed securities held to maturity
|
75,956
|
51,167
|
33,613
|
|||||||||
|
Proceeds from redemption of FHLB stock
|
6,818
|
3,698
|
897
|
|||||||||
|
Purchases of investment securities available for sale
|
(178,399
|
)
|
(284,222
|
)
|
(381,801
|
)
|
||||||
|
Purchases of investment securities held to maturity
|
–
|
(1,014
|
)
|
–
|
||||||||
|
Purchases of mortgage-backed securities available for sale
|
(1,253,375
|
)
|
(1,199,783
|
)
|
(867,793
|
)
|
||||||
|
Purchases of mortgage-backed securities held to maturity
|
(258,935
|
)
|
(138,214
|
)
|
(1,664
|
)
|
||||||
|
Purchases of FHLB stock and other investments
|
(2,900
|
)
|
(2,916
|
)
|
(20,454
|
)
|
||||||
|
Net increase in loans
|
(58,985
|
)
|
(26,657
|
)
|
(69,149
|
)
|
||||||
|
Purchases of premises and equipment
|
(6,902
|
)
|
(6,814
|
)
|
(5,315
|
)
|
||||||
|
Proceeds from sales of premises and equipment
|
38
|
–
|
384
|
|||||||||
|
Proceeds on bank owned life insurance
|
|
–
|
1,086
|
713
|
||||||||
|
Proceeds from sales of other real estate owned
|
1,648
|
1,102
|
515
|
|||||||||
|
Proceeds from sales of repossessed assets
|
4,949
|
2,900
|
3,465
|
|||||||||
|
Net cash provided by (used in) investing activities
|
14,719
|
(296,499
|
)
|
(505,428
|
)
|
|||||||
(continued)
92
|
SOUTHSIDE BANCSHARES, INC. AND SUBSIDIARIES
|
||||||||||||
|
CONSOLIDATED STATEMENTS OF CASH FLOW (continued)
|
||||||||||||
|
(in thousands)
|
Years Ended December 31,
|
|||||||||||
|
2010
|
2009
|
2008
|
||||||||||
|
FINANCING ACTIVITIES:
|
||||||||||||
|
Net increase in demand and savings accounts
|
190,323
|
94,798
|
95,928
|
|||||||||
|
Net increase (decrease) in certificates of deposit
|
87,268
|
199,521
|
(71,174
|
)
|
||||||||
|
Net (decrease) increase in federal funds purchased and
repurchase agreements
|
(9,481
|
)
|
2,696
|
3,606
|
||||||||
|
Proceeds from FHLB advances
|
8,949,688
|
7,961,046
|
15,498,447
|
|||||||||
|
Repayment of FHLB advances
|
(9,241,985
|
)
|
(7,991,050
|
)
|
(15,053,612
|
)
|
||||||
|
Net capital distributions to non-controlling interest in consolidated entities
|
(310
|
)
|
(1,471
|
)
|
(168
|
)
|
||||||
|
Tax benefit of incentive stock options
|
331
|
651
|
639
|
|||||||||
|
Purchase of common stock
|
(4,832
|
)
|
(430
|
)
|
(132
|
)
|
||||||
|
Proceeds from the issuance of common stock
|
1,823
|
2,300
|
2,084
|
|||||||||
|
Dividends paid
|
(13,223
|
)
|
(11,078
|
)
|
(8,265
|
)
|
||||||
|
Net cash (used in) provided by financing activities
|
(40,398
|
)
|
256,983
|
467,353
|
||||||||
|
Net increase (decrease) in cash and cash equivalents
|
26,907
|
(14,608
|
)
|
(9,230
|
)
|
|||||||
|
Cash and cash equivalents at beginning of year
|
52,166
|
66,774
|
76,004
|
|||||||||
|
Cash and cash equivalents at end of year
|
$
|
79,073
|
$
|
52,166
|
$
|
66,774
|
||||||
|
SUPPLEMENTAL DISCLOSURES FOR CASH FLOW INFORMATION:
|
||||||||||||
|
Interest paid
|
$
|
46,186
|
$
|
54,293
|
$
|
59,895
|
||||||
|
Income taxes paid
|
$
|
10,650
|
$
|
17,500
|
$
|
11,525
|
||||||
|
SUPPLEMENTAL DISCLOSURES OF NONCASH INVESTING AND FINANCING ACTIVITIES:
|
||||||||||||
|
Acquisition of other repossessed assets and real estate through foreclosure
|
$
|
6,990
|
$
|
8,560
|
$
|
6,078
|
||||||
|
Adjustment to pension liability
|
$
|
5,531
|
$
|
(4,099
|
)
|
$
|
11,025
|
|||||
|
5% stock dividend
|
$
|
15,513
|
$
|
13,527
|
$
|
14,246
|
||||||
|
Unsettled trades to purchase securities
|
$
|
(145
|
)
|
$
|
(2,573
|
)
|
$
|
–
|
||||
|
Unsettled trades to sell securities
|
$
|
–
|
$
|
8,084
|
$
|
–
|
||||||
|
Unsettled issuances of brokered CDs
|
$
|
4,960
|
$
|
19,842
|
$
|
–
|
||||||
The accompanying notes are an integral part of these consolidated financial statements.
93
|
NOTES TO FINANCIAL STATEMENTS
|
Southside Bancshares, Inc. and Subsidiaries
|
|
1.
|
SUMMARY OF SIGNIFICANT ACCOUNTING AND REPORTING POLICIES
|
The significant accounting and reporting policies of Southside Bancshares, Inc. (the "Company"), and its wholly owned subsidiaries, Southside Delaware Financial Corporation, Southside Bank (“Southside Bank”), and our nonbank subsidiaries, are summarized below.
Organization and Basis of Presentation. The consolidated financial statements include the accounts of Southside Bancshares, Inc., Southside Delaware Financial Corporation, Southside Bank, Southside Financial Group and the nonbank subsidiaries. We offer a full range of financial services to commercial, industrial, financial and individual customers. All significant intercompany accounts and transactions are eliminated in consolidation. The preparation of these consolidated financial statements in conformity with U.S. generally accepted accounting principles (“GAAP”) requires the use of management’s estimates. These estimates are subjective in nature and involve matters of judgment. Actual amounts could differ from these estimates.
We determine if we have a controlling financial interest in an entity by first evaluating whether the entity is a voting interest entity or a variable interest entity (VIE) under accounting principles generally accepted in the United States. Voting interest entities are entities in which the total equity investment at risk is sufficient to enable the entity to finance itself independently and provides the equity holders with the obligation to absorb losses, the right to receive residual returns and the right to make decisions about the entity’s activities. We consolidate voting interest entities in which we have all, or at least a majority of, the voting interest. As defined in applicable accounting standards, VIEs are entities that lack one or more of the characteristics of a voting interest entity. A controlling financial interest in a VIE is present when an enterprise has both the power to direct the activities of the VIE that most significantly impact the VIEs economic performance and an obligation to absorb losses or the right to receive benefits that could potentially be significant to the VIE. The enterprise with a controlling financial interest, known as the primary beneficiary, consolidates the VIE.
Cash Equivalents. Cash equivalents, for purposes of reporting cash flow, include cash, amounts due from banks and federal funds sold.
Basic and Diluted Earnings per Common Share. Basic earnings per common share is based on net income divided by the weighted-average number of common shares outstanding during the period. Diluted earnings per common share include the dilutive effect of stock options granted using the treasury stock method. A reconciliation of the weighted-average shares used in calculating basic earnings per common share and the weighted average common shares used in calculating diluted earnings per common share for the reported periods is provided in “Note 2 – Earnings Per Share.”
Comprehensive Income. Comprehensive income includes all changes in shareholders’ equity during a period, except those resulting from transactions with shareholders. Besides net income, other components of comprehensive income include the after tax effect of changes in the fair value of securities available for sale, changes in the funded status of defined benefit retirement plans and the non credit portion of other-than-temporary impairment. Comprehensive income is reported in the accompanying consolidated statements of changes in shareholders’ equity and in “Note 3 – Comprehensive (Loss) Income.”
Loans. All loans are stated at principal outstanding net of unearned discount and other deferred expenses or fees. Interest income on loans is recognized using the level yield method. Loans receivable that management has the intent and ability to hold for the foreseeable future or until maturity or pay-off are reported at their outstanding principal adjusted for any charge-offs, the allowance for loan losses, and any unamortized deferred fees or costs on originated loans and unamortized premiums or discounts on purchased loans. A loan is considered impaired, based on current information and events, if it is probable that we will be unable to collect the scheduled payments of principal or interest when due according to the contractual terms of the loan agreement. Substantially all of our impaired loans are collateral-dependent, and as such, are measured for impairment based on the fair value of the collateral.
94
Loans Acquired Through Transfer. Loans acquired through the completion of a transfer, including loans acquired in a business combination, that have evidence of deterioration of credit quality since origination and for which it is probable, at acquisition, that we will be unable to collect all contractually required payment receivable are initially recorded at fair value (as determined by the present value of expected future cash flows) with no valuation allowance. The difference between the undiscounted cash flows expected at acquisition and the investment in the loan, or the “accretable yield,” is recognized as interest income on a level-yield method over the life of the loan. Contractually required payments for interest and principal that exceed the undiscounted cash flows expected at acquisition, or the “non-accretable difference,” are not recognized as a yield adjustment or as a loss accrual or a valuation allowance. Increases in expected cash flows subsequent to the initial investment are recognized prospectively through adjustment of the yield on the loan over its remaining life. Decreases in expected cash flows are recognized as impairment. Valuation allowances on these impaired loans reflect only losses incurred after the acquisition (meaning the present value of all cash flows expected at acquisition that ultimately are not to be received).
Loans Held For Sale. Loans originated and intended for sale in the secondary market are carried at the lower of aggregate cost or fair value, as determined by aggregate outstanding commitments from investors or current investor yield requirements. Net unrealized losses are recognized through a valuation allowance by charges to income. Gains or losses on sales of mortgage loans are recognized based on the difference between the selling price and the carrying value of the related mortgage loans sold.
Loan Fees. We treat loan fees, net of direct costs, as an adjustment to the yield of the related loan over its term.
Allowance for Loan Losses. An allowance for loan losses is provided through charges to income in the form of a provision for loan losses. Loans which management believes are uncollectible are charged against this account with subsequent recoveries, if any, credited to the account. The amount of the allowance for loan losses is determined by management's evaluation of the quality and inherent risks in the loan portfolio, economic conditions and other factors which warrant current recognition.
Nonaccrual Loans. A loan is placed on nonaccrual when principal or interest is contractually past due 90 days or more unless, in the determination of management, the principal and interest on the loan are well collateralized and in the process of collection. In addition, a loan is placed on nonaccrual when, in the opinion of management, the future collectability of interest and principal is in serious doubt. When classified as nonaccrual, accrued interest receivable on the loan is reversed and the future accrual of interest is suspended. Payments of contractual interest are recognized as income only to the extent that full recovery of the principal balance of the loan is reasonably certain.
Other Real Estate Owned. Other Real Estate Owned (“OREO”) includes real estate acquired in full or partial settlement of loan obligations. OREO is initially carried at the fair market value of the collateral net of estimated selling costs. Prior to foreclosure, the recorded amount of the loan is written down, if necessary, to the appraised fair market value of the real estate to be acquired, less selling costs, by charging the allowance for loan losses. Any subsequent reduction in fair market value net of estimated selling costs is charged to noninterest expense. Costs of maintaining and operating foreclosed properties are expensed as incurred. Expenditures to complete or improve foreclosed properties are capitalized only if expected to be recovered; otherwise, they are expensed.
Securities. We use the specific identification method to determine the basis for computing realized gain or loss. We account for debt and equity securities as follows:
Held to Maturity (“HTM”). Debt securities that management has the positive intent and ability to hold until maturity are classified as HTM and are carried at their remaining unpaid principal balance, net of unamortized premiums or unaccreted discounts. Premiums are amortized and discounts are accreted using the level interest yield method over the estimated remaining term of the underlying security.
Available for Sale (“AFS”). Debt and equity securities that will be held for indefinite periods of time, including securities that may be sold in response to changes in market interest or prepayment rates, needs for liquidity and changes in the availability of and the yield of alternative investments are classified as AFS. These assets are carried at market value. Market value is determined using published quotes as of the close of business. If quoted market prices are not available, fair values are based on quoted market prices for similar securities or estimates from independent pricing services.
95
Unrealized gains and losses on AFS securities are excluded from earnings and reported net of tax in Accumulated Other Comprehensive Income until realized. We adopted the provisions of FASB ASC Topic 320, “Investments - Debt and Equity Securities" in 2009. Declines in the fair value of securities below their cost will be reflected in earnings as realized losses to the extent the impairment is deemed to be other-than-temporary credit losses. The amount of the impairment related to other factors is recognized in other comprehensive income unless there is no ability or intent to hold to recovery.
Purchase premiums and discounts are recognized in interest income using the interest method over the terms of the securities. Declines in the fair value of HTM and AFS securities below their cost that are deemed to be other-than-temporary are reflected in earnings as realized losses. In estimating other-than-temporary impairment losses, management considers (1) the length of time and the extent to which the fair value has been less than cost, (2) the financial condition and near-term prospects of the issuer, and (3) our intent and ability to retain our investment in the issuer for a period of time sufficient to allow for any anticipated recovery in fair value. Gains and losses on the sale of securities are recorded on the trade date and are determined using the specific identification method.
Securities with limited marketability, such as stock in the FHLB, are carried at cost and assessed for other-than-temporary impairment.
Premises and Equipment. Bank premises and equipment are stated at cost, net of accumulated depreciation. Depreciation is computed on a straight line basis over the estimated useful lives of the related assets. Useful lives are estimated to be 15 to 40 years for premises and three to 10 years for equipment. Leasehold improvements are generally depreciated over the lesser of the term of the respective leases or the estimated useful lives of the improvements. Maintenance and repairs are charged to income as incurred while major improvements and replacements are capitalized.
Goodwill and Other Intangibles. Intangible assets consist primarily of core deposits and customer relationships. Intangible assets with definite useful lives are amortized on an accelerated basis over their estimated life. Goodwill and intangible assets that have indefinite useful lives are subject to at least an annual impairment test and more frequently if a triggering event occurs. If any such impairment is determined, a write-down is recorded.
We measured our goodwill for impairment at December 31, 2010. At December 31, 2010, the fair value of the reporting unit was greater than the carrying value of the reporting unit. As a result, we did not record any goodwill impairment for the year ended December 31, 2010 and we had no cumulative goodwill impairment.
Repurchase Agreements. We sell certain securities under agreements to repurchase. The agreements are treated as collateralized financing transactions and the obligations to repurchase securities sold are reflected as a liability in the accompanying consolidated balance sheets. The dollar amount of the securities underlying the agreements remains in the asset account. We determine the type of securities to pledge. Generally we pledge U. S. agency mortgage-backed securities.
Income Taxes. We file a consolidated federal income tax return. Deferred tax assets and liabilities are recognized for the future tax consequences attributable to differences between the financial statement carrying amounts of existing assets and liabilities and their respective tax bases. Deferred tax assets and liabilities are measured using enacted tax rates expected to apply to taxable income in the years in which those temporary differences are expected to be recovered or settled. The effect on deferred tax assets and liabilities of changes in tax rates is recognized in income in the period the change occurs.
Use of Estimates. In preparing consolidated financial statements in conformity with GAAP, management is required to make estimates and assumptions that affect the reported amounts of assets and liabilities as of the date of the balance sheet and reported amounts of revenues and expenses during the reporting period. Actual results could differ from those estimates. Material estimates that are particularly susceptible to significant change in the near term relate to the determination of the allowance for loan losses, assumptions used in the defined benefit plan and the fair values of financial instruments. The status of contingencies are particularly subject to change and significant assumptions used in periodic evaluation of securities for other-than-temporary impairment.
96
Fair Value of Financial Instruments. Fair values of financial instruments are estimated using relevant market information and other assumptions. Fair value estimates involve uncertainties and matters of significant judgment. In cases where quoted market prices are not available, fair values are based on estimates using present value or other estimation techniques. Those techniques are significantly affected by the assumptions used, including the discount rate and estimates of future cash flows.
Stock Options. Stock-based compensation transactions are recognized as compensation cost in the income statement based on their fair values on the date of the grant.
Loss Contingencies. Loss contingencies, including claims and legal actions arising in the ordinary course of business are recorded as liabilities when the likelihood of loss is probable and an amount or range of loss can be reasonably estimated.
Trust Assets. Assets of our trust department, other than cash on deposit at Southside Bank, are not included in the accompanying financial statements because they are not our assets.
General. Certain prior period amounts have been reclassified to conform to current year presentation and had no impact on net income, equity, or cash flows.
Accounting Pronouncements:
The Financial Accounting Standards Board’s (“FASB”) Accounting Standards Codification (“ASC”) became effective on July 1, 2009. At that date, the ASC became FASB’s officially recognized source of authoritative U.S. generally accepted accounting principles applicable to all public and non-public non-governmental entities, superseding existing FASB, American Institute of Certified Public Accountants (“AICPA”), Emerging Issues Task Force (“EITF”) and related literature. Rules and interpretive releases of the SEC under the authority of federal securities laws are also sources of authoritative GAAP for SEC registrants. All other accounting literature is considered non-authoritative. The switch to the ASC affects the way companies refer to U.S. GAAP in financial statements and accounting policies. Citing particular content in the ASC involves specifying the unique numeric path to the content through the Topic, Subtopic, Section and Paragraph structure.
Accounting Standards Update (“ASU”) No. 2009-17, “Consolidations (Topic 810) – Improvements to Financial Reporting by Enterprises Involved with Variable Interest Entities.” ASU 2009-17 amends prior guidance to change how a company determines when an entity that is insufficiently capitalized or is not controlled through voting (or similar rights) should be consolidated. The determination of whether a company is required to consolidate an entity is based on, among other things, an entity’s purpose and design and a company’s ability to direct the activities of the entity that most significantly impact the entity’s economic performance. ASU 2009-17 requires additional disclosures about the reporting entity’s involvement with variable-interest entities and any significant changes in risk exposure due to that involvement as well as its affect on the entity’s financial statements. The provisions of ASU 2009-17 became effective on January 1, 2010 and did not have a significant impact on our consolidated financial statements.
ASU No. 2010-06, “Fair Value Measurements and Disclosures (Topic 820) – Improving Disclosures About Fair Value Measurements.” ASU 2010-06 requires expanded disclosures related to fair value measurements including (i) the amounts of significant transfers of assets or liabilities between Levels 1 and 2 of the fair value hierarchy and the reasons for the transfers, (ii) the reasons for transfers of assets or liabilities in or out of Level 3 of the fair value hierarchy, with significant transfers disclosed separately, (iii) the policy for determining when transfers between levels of the fair value hierarchy are recognized and (iv) for recurring fair value measurements of assets and liabilities in Level 3 of the fair value hierarchy, a gross presentation of information about purchases, sales, issuances and settlements. ASU 2010-06 further clarifies that (i) fair value measurement disclosures should be provided for each class of assets and liabilities (rather than major category), which would generally be a subset of assets or liabilities within a line item in the statement of financial position and (ii) company should provide disclosures about the valuation techniques and inputs used to measure fair value for both recurring and nonrecurring fair value measurements for each class of assets and liabilities included in Levels 2 and 3 of the fair value hierarchy. The disclosures related to the gross presentation of purchases, sales, issuances and settlements of assets and liabilities included in Level 3 of the fair value hierarchy will be required for us beginning January 1, 2011. The remaining disclosure requirements and clarifications made by ASU 2010-06 became effective for us on January 1, 2010. See “Note 13 – Fair Value Measurements.”
97
ASU No. 2010-18 “Effect of a Loan Modification When the Loan is Part of a Pool That Is Accounted for as a Single Asset”. ASU 2010-18 provides that modifications of loans that are accounted for within a pool under Subtopic 310-30 do not result in the removal of those loans from the pool even if the modification of those loans would otherwise be considered a troubled debt restructuring. An entity will continue to be required to consider whether the pool of assets in which the loan is included is impaired if expected cash flows for the pool change. ASU 2010-18 does not affect the accounting for loans under the scope of Subtopic 310-30 that are not accounted for within pools. Loans accounted for individually under Subtopic 310-30 continue to be subject to the troubled debt restructuring accounting provisions within Subtopic 310-40. ASU 2010-18 is effective prospectively for modifications of loans accounted for within pools under Subtopic 310-30 occurring in the first interim or annual period ending on or after July 15, 2010. Early application is permitted. Upon initial adoption of ASU 2010-18, an entity may make a one time election to terminate accounting for loans as a pool under Subtopic 310-30. This election may be applied on a pool-by-pool basis and does not preclude an entity from applying pool accounting to subsequent acquisitions of loans with credit deterioration. The provisions of ASU 2010-18 did not have a significant impact on our consolidated financial statements.
ASU No. 2010-20. “Receivables (Topic 310) – Disclosures about the Credit Quality of Financing Receivables and the Allowance for Credit Losses.” ASU 2010-20 requires entities to provide disclosures designed to facilitate financial statement users’ evaluation of (i) the nature of credit risk inherent in the entity’s portfolio of financing receivables, (ii) how that risk is analyzed and assessed in arriving at the allowance for credit losses and (iii) the changes and reasons for those changes in the allowance for credit losses. Disclosures must be disaggregated by portfolio segment, the level at which an entity develops and documents a systematic method for determining its allowance for credit losses, and class of financing receivable, which is generally a disaggregation of portfolio segment. The required disclosures include, among other things, a roll forward of the allowance for credit losses as well as information about modified, impaired, non-accrual and past due loans and credit quality indicators. ASU 2010-20 is effective for our financial statements as of December 31, 2010, as it relates to disclosures required as of the end of a reporting period. Disclosures that relate to activity during a reporting period will be required for our financial statements that include periods beginning on or after January 1, 2011.
2. EARNINGS PER SHARE
2. EARNINGS PER SHARE
Earnings per share attributable to Southside Bancshares, Inc. on a basic and diluted basis as required by FASB ASC Topic 260, "Earnings Per Share," has been adjusted to give retroactive recognition to stock splits and stock dividends and is calculated as follows (in thousands, except per share amounts):
|
Years Ended December 31,
|
||||||||||||
|
2010
|
2009
|
2008
|
||||||||||
|
Basic and Diluted Earnings:
|
||||||||||||
|
Net Income – Southside Bancshares, Inc.
|
$
|
39,491
|
$
|
44,396
|
$
|
30,696
|
||||||
|
Basic weighted-average shares outstanding:
|
15,733
|
15,615
|
15,319
|
|||||||||
|
Add: Stock options
|
27
|
142
|
338
|
|||||||||
|
Diluted weighted-average shares outstanding
|
15,760
|
15,757
|
15,657
|
|||||||||
|
Basic Earnings Per Share:
|
||||||||||||
|
Net Income – Southside Bancshares, Inc.
|
$
|
2.51
|
$
|
2.84
|
$
|
2.00
|
||||||
|
Diluted Earnings Per Share:
|
||||||||||||
|
Net Income – Southside Bancshares, Inc.
|
$
|
2.51
|
$
|
2.82
|
$
|
1.96
|
||||||
For the years ended December 31, 2010, 2009 and 2008, there were no antidilutive options.
98
3. COMPREHENSIVE (LOSS) INCOME
The components of other comprehensive (loss) income as required by FASB ASC Topic 220 “Comprehensive Income,” are as follows (in thousands):
|
Year Ended December 31, 2010
|
||||||||||||
|
Before-Tax
|
Tax (Expense)
|
Net-of-Tax
|
||||||||||
|
Amount
|
Benefit
|
Amount
|
||||||||||
|
Unrealized losses on securities:
|
||||||||||||
|
Unrealized holding gains arising during period
|
$ | 14,212 | $ | (4,974 | ) | $ | 9,238 | |||||
|
Non credit portion of other-than-temporary impairment losses on the AFS securities
|
36 | (13 | ) | 23 | ||||||||
|
Less: reclassification adjustment for gains included in net income
|
25,789 | (9,026 | ) | 16,763 | ||||||||
|
Less: reclassification of other-than-temporary impairment charges on AFS securities included in net income
|
(75 | ) | 26 | (49 | ) | |||||||
|
Net unrealized losses on securities
|
(11,466 | ) | 4,013 | (7,453 | ) | |||||||
|
Change in pension plans
|
(5,531 | ) | 1,936 | (3,595 | ) | |||||||
|
Other comprehensive loss
|
$ | (16,997 | ) | $ | 5,949 | $ | (11,048 | ) | ||||
|
Year Ended December 31, 2009
|
||||||||||||
|
Before-Tax
|
Tax (Expense)
|
Net-of-Tax
|
||||||||||
|
Amount
|
Benefit
|
Amount
|
||||||||||
|
Unrealized gains on securities:
|
||||||||||||
|
Unrealized holding gains arising during period
|
$ | 37,269 | $ | (13,044 | ) | $ | 24,225 | |||||
|
Non credit portion of other-than-temporary impairment losses on the AFS securities
|
(2,730 | ) | 955 | (1,775 | ) | |||||||
|
Less: reclassification adjustment for gains included in net income
|
33,446 | (11,706 | ) | 21,740 | ||||||||
|
Less: reclassification of other-than-temporary impairment charges on AFS securities included in net income
|
(3,000 | ) | 1,050 | (1,950 | ) | |||||||
|
Net unrealized gains on securities
|
4,093 | (1,433 | ) | 2,660 | ||||||||
|
Change in pension plans
|
4,099 | (1,434 | ) | 2,665 | ||||||||
|
Other comprehensive income
|
$ | 8,192 | $ | (2,867 | ) | $ | 5,325 | |||||
|
Year Ended December 31, 2008
|
||||||||||||
|
Before-Tax
|
Tax (Expense)
|
Net-of-Tax
|
||||||||||
|
Amount
|
Benefit
|
Amount
|
||||||||||
|
Unrealized gains on securities:
|
||||||||||||
|
Unrealized holding gains arising during period
|
$ | 28,805 | $ | (10,125 | ) | $ | 18,680 | |||||
|
Less: reclassification adjustment for gains included in net income
|
12,334 | (4,317 | ) | 8,017 | ||||||||
|
Net unrealized gains on securities
|
16,471 | (5,808 | ) | 10,663 | ||||||||
|
Change in pension plans
|
(11,025 | ) | 3,973 | (7,052 | ) | |||||||
|
Other comprehensive income
|
$ | 5,446 | $ | (1,835 | ) | $ | 3,611 | |||||
99
The components of accumulated other comprehensive (loss) income, net of tax, as of December 31, 2010 and 2009, are reflected in the table below (in thousands):
|
Years Ended December 31,
|
||||||||
|
2010
|
2009
|
|||||||
|
Unrealized gains on AFS securities
|
$ | 8,706 | $ | 16,159 | ||||
|
Net unfunded liability for defined benefit plans
|
(15,525 | ) | (11,930 | ) | ||||
|
Total
|
$ | (6,819 | ) | $ | 4,229 | |||
|
4.
|
CASH AND DUE FROM BANKS
|
We are required to maintain cash reserve balances with the Federal Reserve Bank. The reserve balances were $250,000 as of December 31, 2010 and 2009.
|
5.
|
SECURITIES
|
The amortized cost and estimated market value of investment and mortgage-backed securities as of December 31, 2010 and 2009, are reflected in the tables below (in thousands):
|
December 31, 2010
|
||||||||||||||||||||
|
Gross
|
Gross
|
Estimated
|
||||||||||||||||||
|
Amortized
|
Unrealized
|
Unrealized Losses
|
Fair
|
|||||||||||||||||
|
AVAILABLE FOR SALE:
|
Cost
|
Gains
|
OTTI
|
Other
|
Value
|
|||||||||||||||
|
Investment Securities:
|
||||||||||||||||||||
|
U.S. Treasury
|
$ | 4,700 | $ | – | $ | – | $ | – | $ | 4,700 | ||||||||||
|
State and Political Subdivisions
|
296,357 | 4,445 | – | 6,540 | 294,262 | |||||||||||||||
|
Other Stocks and Bonds
|
3,117 | 1 | 2,736 | – | 382 | |||||||||||||||
|
Mortgage-backed Securities:
|
||||||||||||||||||||
|
U.S. Government Agencies
|
149,402 | 5,311 | – | 179 | 154,534 | |||||||||||||||
|
Government-Sponsored Enterprises
|
777,921 | 16,049 | – | 2,461 | 791,509 | |||||||||||||||
|
Total
|
$ | 1,231,497 | $ | 25,806 | $ | 2,736 | $ | 9,180 | $ | 1,245,387 | ||||||||||
|
December 31, 2010
|
||||||||||||||||||||
|
Gross
|
Gross
|
Estimated
|
||||||||||||||||||
|
Amortized
|
Unrealized
|
Unrealized Losses
|
Fair
|
|||||||||||||||||
|
HELD TO MATURITY:
|
Cost
|
Gains
|
OTTI
|
Other
|
Value
|
|||||||||||||||
|
Investment Securities:
|
||||||||||||||||||||
|
State and Political Subdivisions
|
$ | 1,012 | $ | 44 | $ | – | $ | – | $ | 1,056 | ||||||||||
|
Other Stocks and Bonds
|
483 | 14 | – | – | 497 | |||||||||||||||
|
Mortgage-backed Securities:
|
||||||||||||||||||||
|
U.S. Government Agencies
|
21,888 | 631 | – | 55 | 22,464 | |||||||||||||||
|
Government-Sponsored Enterprises
|
395,974 | 8,743 | – | 609 | 404,108 | |||||||||||||||
|
Total
|
$ | 419,357 | $ | 9,432 | $ | – | $ | 664 | $ | 428,125 | ||||||||||
100
|
December 31, 2009
|
||||||||||||||||||||
|
Gross
|
Gross
|
Estimated
|
||||||||||||||||||
|
Amortized
|
Unrealized
|
Unrealized Losses
|
Fair
|
|||||||||||||||||
|
AVAILABLE FOR SALE:
|
Cost
|
Gains
|
OTTI
|
Other
|
Value
|
|||||||||||||||
|
Investment Securities:
|
||||||||||||||||||||
|
U.S. Treasury
|
$ | 4,898 | $ | 1 | $ | – | $ | – | $ | 4,899 | ||||||||||
|
State and Political Subdivisions
|
250,391 | 9,431 | – | 296 | 259,526 | |||||||||||||||
|
Other Stocks and Bonds
|
3,383 | 3 | 2,730 | 21 | 635 | |||||||||||||||
|
Mortgage-backed Securities:
|
||||||||||||||||||||
|
U.S. Government Agencies
|
126,264 | 3,725 | – | 407 | 129,582 | |||||||||||||||
|
Government-Sponsored Enterprises
|
1,092,659 | 20,787 | – | 4,846 | 1,108,600 | |||||||||||||||
|
Total
|
$ | 1,477,595 | $ | 33,947 | $ | 2,730 | $ | 5,570 | $ | 1,503,242 | ||||||||||
|
December 31, 2009
|
||||||||||||||||||||
|
Gross
|
Gross
|
Estimated
|
||||||||||||||||||
|
Amortized
|
Unrealized
|
Unrealized Losses
|
Fair
|
|||||||||||||||||
|
HELD TO MATURITY:
|
Cost
|
Gains
|
OTTI
|
Other
|
Value
|
|||||||||||||||
|
Investment Securities:
|
||||||||||||||||||||
|
State and Political Subdivisions
|
$ | 1,013 | $ | 103 | $ | – | $ | – | $ | 1,116 | ||||||||||
|
Other Stocks and Bonds
|
480 | 22 | – | – | 502 | |||||||||||||||
|
Mortgage-backed Securities:
|
||||||||||||||||||||
|
U.S. Government Agencies
|
16,677 | 534 | – | 36 | 17,175 | |||||||||||||||
|
Government-Sponsored Enterprises
|
225,988 | 5,248 | – | 766 | 230,470 | |||||||||||||||
|
Total
|
$ | 244,158 | $ | 5,907 | $ | – | $ | 802 | $ | 249,263 | ||||||||||
The following table represents the unrealized loss on securities for the years ended December 31, 2010 and 2009 (in thousands):
|
Less Than 12 Months
|
More Than 12 Months
|
Total
|
||||||||||||||||||||||
|
Fair Value
|
Unrealized Loss
|
Fair Value
|
Unrealized Loss
|
Fair Value
|
Unrealized Loss
|
|||||||||||||||||||
|
As of December 31, 2010:
|
||||||||||||||||||||||||
|
Available for Sale
|
||||||||||||||||||||||||
|
State and Political Subdivisions
|
$ | 136,671 | $ | 6,501 | $ | 270 | $ | 39 | $ | 136,941 | $ | 6,540 | ||||||||||||
|
Other Stocks and Bonds
|
– | – | 189 | 2,736 | 189 | 2,736 | ||||||||||||||||||
|
Mortgage-Backed Securities
|
312,985 | 2,475 | 21,779 | 165 | 334,764 | 2,640 | ||||||||||||||||||
|
Total
|
$ | 449,656 | $ | 8,976 | $ | 22,238 | $ | 2,940 | $ | 471,894 | $ | 11,916 | ||||||||||||
|
Held to Maturity
|
||||||||||||||||||||||||
|
Mortgage-Backed Securities
|
$ | 52,676 | $ | 644 | $ | 1,104 | $ | 20 | $ | 53,780 | $ | 664 | ||||||||||||
|
Total
|
$ | 52,676 | $ | 644 | $ | 1,104 | $ | 20 | $ | 53,780 | $ | 664 | ||||||||||||
|
As of December 31, 2009:
|
||||||||||||||||||||||||
|
Available for Sale
|
||||||||||||||||||||||||
|
State and Political Subdivisions
|
$ | 14,520 | $ | 160 | $ | 2,953 | $ | 136 | $ | 17,473 | $ | 296 | ||||||||||||
|
Other Stocks and Bonds
|
– | – | 441 | 2,751 | 441 | 2,751 | ||||||||||||||||||
|
Mortgage-Backed Securities
|
391,889 | 5,250 | 1,065 | 3 | 392,954 | 5,253 | ||||||||||||||||||
|
Total
|
$ | 406,409 | $ | 5,410 | $ | 4,459 | $ | 2,890 | $ | 410,868 | $ | 8,300 | ||||||||||||
|
Held to Maturity
|
||||||||||||||||||||||||
|
Mortgage-Backed Securities
|
$ | 19,705 | $ | 802 | $ | – | $ | – | $ | 19,705 | $ | 802 | ||||||||||||
|
Total
|
$ | 19,705 | $ | 802 | $ | – | $ | – | $ | 19,705 | $ | 802 | ||||||||||||
101
When it is determined that a decline in fair value of HTM and AFS securities is other-than-temporary, the carrying value of the security is reduced to its estimated fair value, with a corresponding charge to earnings for the credit portion and the non credit portion to other comprehensive income. In estimating other-than-temporary impairment losses, management considers, among other things, the length of time and the extent to which the fair value has been less than cost and the financial condition and near-term prospects of the issuer. Additionally, we do not currently intend to sell the securities and it is not more likely than not that we will be required to sell the security before the anticipated recovery of its amortized cost basis.
The turmoil in the capital markets had a significant impact on our estimate of fair value for certain of our securities. We believe the market values are reflective of illiquidity and credit impairment. At December 31, 2010, we have in AFS Other Stocks and Bonds, $2.9 million amortized cost basis in pooled trust preferred securities (“TRUPs”). Those securities are structured products with cash flows dependent upon securities issued by U.S. financial institutions, including banks and insurance companies. Our estimate of fair value at December 31, 2010 for the TRUPs is approximately $189,000 and reflects the market illiquidity. With the exception of the TRUPs, to the best of management’s knowledge and based on our consideration of the qualitative factors associated with each security, there were no securities in our investment and mortgage-backed securities portfolio at December 31, 2010 with an other-than-temporary impairment.
Given the facts and circumstances associated with the TRUPs we performed detailed cash flow modeling for each TRUP using an industry-accepted cash flow model. Prior to loading the required assumptions into the model we reviewed the financial condition of each of the underlying issuing banks within the TRUP collateral pool that had not deferred or defaulted as of December 31, 2010. Management’s best estimate of a deferral assumption was assigned to each issuing bank based on the category in which it fell. Our analysis of the underlying cash flows contemplated various default, deferral and recovery scenarios to arrive at our best estimate of cash flows. Based on that detailed analysis, we have concluded that the other-than-temporary impairment, which captures the credit component in compliance with FASB ASC Topic 320, “Investments – Debt and Equity Securities,” was estimated at $3.1 million and $3.0 million at December 31, 2010 and 2009, respectively. The non credit charge to other comprehensive income was estimated at $2.7 million at December 31, 2010 and 2009. Therefore, the carrying amount of the TRUPs was written down with $75,000 and $3.0 million recognized in earnings for the years ended December 31, 2010 and 2009, respectively. The cash flow model assumptions represent management’s best estimate and consider a variety of qualitative factors, which include, among others, the credit rating downgrades, the severity and duration of the mark-to-market loss, and the structural nuances of each TRUP. Management believes that the detailed review of the collateral and cash flow modeling support the conclusion that the TRUPs had an other-than-temporary impairment at December 31, 2010. We will continue to update our assumptions and the resulting analysis each reporting period to reflect changing market conditions. Additionally, we do not currently intend to sell the TRUPs and it is not more likely than not that we will be required to sell the TRUPs before the anticipated recovery of their amortized cost basis.
The table below provides more detail on the TRUPs at December 31, 2010 (dollars in thousands).
|
TRUP
|
Par
|
Credit
Loss
|
Amortized Cost
|
Fair Value
|
Tranche
|
Credit Rating
|
||||||||||||||||||||
| 1 | $ | 2,000 | $ | 1,075 | $ | 925 | $ | 125 | C1 |
Ca
|
||||||||||||||||
| 2 | 2,000 | 550 | 1,450 | 36 | B1 |
Ca
|
||||||||||||||||||||
| 3 | 2,000 | 1,450 | 550 | 28 | B2 | C | ||||||||||||||||||||
| $ | 6,000 | $ | 3,075 | $ | 2,925 | $ | 189 | |||||||||||||||||||
102
The following table presents the impairment activity related to credit loss, which is recognized in earnings, and the impairment activity related to all other factors, which are recognized in other comprehensive income (in thousands).
|
Year Ended December 31, 2010
|
||||||||||||
|
Impairment Related to Credit Loss
|
Impairment Related to All Other Factors
|
Total Impairment
|
||||||||||
|
Balance, beginning of the period
|
$ | 3,000 | $ | 2,730 | $ | 5,730 | ||||||
|
Charges on securities for which other-than-temporary impairment charges were not previously recognized
|
– | – | – | |||||||||
|
Additional charges on securities for which other-than-temporary impairment charges were previously recognized
|
75 | (36 | ) | 39 | ||||||||
|
Balance, end of the period
|
$ | 3,075 | $ | 2,694 | $ | 5,769 | ||||||
|
Year Ended December 31, 2009
|
||||||||||||
|
Impairment Related to Credit Loss
|
Impairment Related to All Other Factors
|
Total Impairment
|
||||||||||
|
Balance, beginning of the period
|
$ | – | $ | – | $ | – | ||||||
|
Charges on securities for which other-than-temporary impairment charges were not previously recognized
|
3,000 | 2,730 | 5,730 | |||||||||
|
Additional charges on securities for which other-than-temporary impairment charges were previously recognized
|
– | – | – | |||||||||
|
Balance, end of the period
|
$ | 3,000 | $ | 2,730 | $ | 5,730 | ||||||
Interest income recognized on AFS and HTM securities for the years presented:
|
Years Ended December 31,
|
||||||||||||
|
2010
|
2009
|
2008
|
||||||||||
|
(in thousands)
|
||||||||||||
|
U.S. Treasury
|
$
|
8
|
$
|
40
|
$
|
115
|
||||||
|
U.S. Government Agencies
|
–
|
678
|
690
|
|||||||||
|
State and Political Subdivisions
|
10,926
|
7,797
|
5,414
|
|||||||||
|
Other Stocks and Bonds
|
46
|
147
|
414
|
|||||||||
|
Mortgage-backed Securities
|
50,130
|
65,463
|
55,470
|
|||||||||
|
Total interest income on securities
|
$
|
61,110
|
$
|
74,125
|
$
|
62,103
|
||||||
There were no securities transferred from AFS to HTM during 2009 and 2010. There were no sales from the HTM portfolio during the years ended December 31, 2010, 2009 or 2008. There were $419.4 million and $244.2 million of securities classified as HTM for the years ended December 31, 2010 and 2009, respectively.
Of the $25.8 million in net securities gains from the AFS portfolio for the year ended December 31, 2010, there were $28.3 million in realized gains and $2.5 million in realized losses. Of the $33.4 million in net securities gains from the AFS portfolio for the year ended December 31, 2009, there were $33.5 million in realized gains and $0.1 million in realized losses. Of the $12.3 million in net securities gains from the AFS portfolio for the year ended December 31, 2008, there were $12.5 million in realized gains and $0.2 million in realized losses.
103
The amortized cost and fair value of securities at December 31, 2010, are presented below by contractual maturity. Expected maturities may differ from contractual maturities because issuers may have the right to call or prepay obligations. Mortgage-backed securities are presented in total by category due to the fact that mortgage-backed securities typically are issued with stated principal amounts, and the securities are backed by pools of mortgages that have loans with varying maturities. The characteristics of the underlying pool of mortgages, such as fixed-rate or adjustable-rate, as well as prepayment risk, are passed on to the certificate holder. The term of a mortgage-backed pass-through security thus approximates the term of the underlying mortgages and can vary significantly due to prepayments.
|
December 31, 2010
|
||||||||
|
Amortized Cost
|
Fair Value
|
|||||||
|
(in thousands)
|
||||||||
|
Available for sale securities:
|
||||||||
|
Investment Securities
|
||||||||
|
Due in one year or less
|
$ | 8,594 | $ | 8,632 | ||||
|
Due after one year through five years
|
5,876 | 6,041 | ||||||
|
Due after five years through ten years
|
20,968 | 21,681 | ||||||
|
Due after ten years
|
268,736 | 262,990 | ||||||
| 304,174 | 299,344 | |||||||
|
Mortgage-backed securities
|
927,323 | 946,043 | ||||||
|
Total
|
$ | 1,231,497 | $ | 1,245,387 | ||||
|
December 31, 2010
|
||||||||
|
Amortized Cost
|
Fair Value
|
|||||||
|
(in thousands)
|
||||||||
|
Held to maturity securities:
|
||||||||
|
Investment Securities
|
||||||||
|
Due in one year or less
|
$ | – | $ | – | ||||
|
Due after one year through five years
|
– | – | ||||||
|
Due after five years through ten years
|
483 | 497 | ||||||
|
Due after ten years
|
1,012 | 1,056 | ||||||
| 1,495 | 1,553 | |||||||
|
Mortgage-backed securities
|
417,862 | 426,572 | ||||||
|
Total
|
$ | 419,357 | $ | 428,125 | ||||
Investment and mortgage-backed securities with book values of $977.4 million and $1.06 billion were pledged as of December 31, 2010 and 2009, respectively, to collateralize FHLB advances, repurchase agreements, public funds and trust deposits or for other purposes as required by law.
Securities with limited marketability, such as FHLB stock and other investments, are carried at cost, which approximates its fair value and assessed for other-than-temporary impairment. These securities have no maturity date.
104
|
6.
|
LOANS AND ALLOWANCE FOR PROBABLE LOAN LOSSES
|
Loans in the accompanying consolidated balance sheets are classified as follows:
|
December 31,
|
December 31,
|
|||||||
|
2010
|
2009
|
|||||||
|
(in thousands)
|
||||||||
|
Real Estate Loans:
|
||||||||
|
Construction
|
$ | 115,094 | $ | 105,268 | ||||
|
1-4 family residential
|
219,031 | 217,677 | ||||||
|
Other
|
200,723 | 212,731 | ||||||
|
Commercial loans
|
148,761 | 159,529 | ||||||
|
Municipal loans
|
196,594 | 150,111 | ||||||
|
Loans to individuals
|
197,717 | 188,260 | ||||||
|
Total loans
|
1,077,920 | 1,033,576 | ||||||
|
Less: Allowance for loan losses
|
20,711 | 19,896 | ||||||
|
Net loans
|
$ | 1,057,209 | $ | 1,013,680 | ||||
Loans to Affiliated Parties
In the normal course of business, we make loans to certain of our own executive officers and directors and their related interests. As of December 31, 2010 and 2009, these loans totaled $4.5 million and $3.9 million, respectively. These loans represented 2.1% and 2.0% of shareholders' equity as of December 31, 2010 and 2009, respectively. Such loans are made in the normal course of business at normal credit terms, including interest rate and collateral requirements and do not represent more than normal credit risks contained in the rest of the loan portfolio for loans of similar types.
Allowance for Loan Losses
The allowance for loan losses is based on the most current review of the loan portfolio and is validated by multiple processes. First, the bank utilized historical data to establish general reserve amounts for each class of loans. While we track several years of data, we primarily review one year data because we found during the 1980’s that longer periods would not respond quickly enough to market conditions. Second, our lenders have the primary responsibility for identifying problem loans and estimating necessary reserves based on customer financial stress and underlying collateral. These recommendations are reviewed by the Senior lender, the Special Assets department, and the Loan Review department and are signed off on by the President. Third, the Loan Review department does independent reviews of the portfolio on an annual basis. The Loan Review department follows a board approved annual loan review scope. The loan review scope encompasses a number of metrics that takes into consideration the size of the loan, the type of credit extended, the seasoning of the loan along with the performance of the loan. The loan review scope as it relates to size, focuses more on larger dollar loan relationships, typically, for example, aggregate debt of $500,000 or greater. The Loan Review officer also tracks specific reserves for loans by type compared to general reserves to determine trends in comparative reserves as well as losses not reserved for prior to charge off to determine the efficiency of the specific reserve process.
At each review, a subjective analysis methodology is used to grade the respective loan. Categories of grading vary in severity from loans that do not appear to have a significant probability of loss at the time of review to loans that indicate a probability that the entire balance of the loan will be uncollectible. If full collection of the loan balance appears unlikely at the time of review, estimates of future expected cash flows or appraisals of the collateral securing the debt are used to allocate the necessary allowances. The internal loan review department maintains a list of all loans or loan relationships that are graded as having more than the normal degree of risk associated with them. In addition, a list of specifically reserved loans or loan relationships of $50,000 or more is updated on a quarterly basis in order to properly allocate necessary allowances and keep management informed on the status of attempts to correct the deficiencies noted with respect to the loan.
For loans to individuals the methodology associated with determining the appropriate allowance for losses on loans primarily consists of an evaluation of individual payment histories, remaining term to maturity and underlying collateral support.
105
Industry experience indicates that a portion of our loans will become delinquent and a portion of the loans will require partial or entire charge-off. Regardless of the underwriting criteria utilized, losses may be experienced as a result of various factors beyond our control, including, among other things, changes in market conditions affecting the value of properties used as collateral for loans and problems affecting the credit of the borrower and the ability of the borrower to make payments on the loan. Our determination of the adequacy of allowance for loan losses is based on various considerations, including an analysis of the risk characteristics of various classifications of loans, previous loan loss experience, specific loans which would have loan loss potential, delinquency trends, estimated fair value of the underlying collateral, current economic conditions, the views of the bank regulators (who have the authority to require additional allowances), and geographic and industry loan concentration.
Consumer loans at SFG are reserved for based on general estimates of loss at the time of purchase for current loans. SFG loans experiencing past due status or extension of maturity characteristics are reserved for at significantly higher levels based on the circumstances associated with each specific loan. In general the reserves for SFG are calculated based on the past due status of the loan. For reserve purposes, the portfolio has been segregated by past due status and by the remaining term variance from the original contract. During repayment, loans that pay late will take longer to pay out than the original contract. Additionally, some loans may be granted extensions for extenuating payment circumstances. The remaining term extensions increase the risk of collateral deterioration and accordingly, reserves are increased to recognize this risk.
For loans originated after August 1, 2010, additional reserve methods have been added. New pools purchased are reserved at their estimated annual loss. Thereafter, the reserve is adjusted based on the actual performance versus projected performance. Additionally, during the fourth quarter of 2010, data mining measures were further enhanced to track migration within risk tranches. Reserves are adjusted quarterly to match the migration metrics.
Credit Quality Indicators:
We categorize loans into risk categories based on relevant information about the ability of borrowers to service their debt such as: current financial information, historical payment experience, credit documentation, public information, and current economic trends, among other factors. We use the following definitions for risk ratings:
|
·
|
Satisfactory (Rating 1 – 4) – This rating is assigned to all satisfactory loans. This category, by definition, should consist of completely acceptable credit. Credit and collateral exceptions should not be present, although their presence would not necessarily prohibit a loan from being rated Satisfactory, if deficiencies are in process of correction. These loans will not be included in the Watch List.
|
|
·
|
Satisfactory (Rating 5) – Special Treatment Required – (Pass Watch) – These loans require some degree of special treatment, but not due to credit quality. This category does not include loans specially mentioned or adversely classified by the Loan Review Officer or regulatory authorities; however, particular attention must be accorded such credits due to characteristics such as:
|
|
·
|
A lack of, or abnormally extended payment program;
|
|
·
|
A heavy degree of concentration of collateral without sufficient margin;
|
|
·
|
A vulnerability to competition through lesser or extensive financial leverage;
|
|
·
|
A dependence on a single, or few customers, or sources of supply and materials without suitable substitutes or alternatives.
|
|
·
|
Special Mention (Rating 6) – A Special Mention asset has potential weaknesses that deserve management’s close attention. If left uncorrected, these potential weaknesses may result in deterioration of the repayment prospects for the asset or in the institution’s credit position at some future date. Special Mention assets are not adversely classified and do not expose an institution to sufficient risk to warrant adverse classification.
|
106
|
·
|
Substandard (Rating 7) – Substandard loans are inadequately protected by the current sound worth and paying capacity of the obligor or of the collateral pledged, if any. Loans so classified must have a well-defined weakness or weaknesses that jeopardize the liquidation of the debt. They are characterized by the distinct possibility that the Bank will sustain some loss if the deficiencies are not corrected.
|
|
·
|
Doubtful (Rating 8) – Loans classified Doubtful have all the weaknesses inherent in those classified Substandard with the added characteristic that the weaknesses make collection or liquidation, in full, on the basis of currently known facts, conditions and values, highly questionable and improbable.
|
|
·
|
Loss (Rating 9) – Loans classified Loss are considered uncollectible and of such little value that there continuance as bankable assets is not warranted. This classification does not mean that the loan has absolutely no recovery or salvage value but rather it is not practical or desirable to defer writing off this basically worthless asset even though partial recovery may be affected in the future.
|
Loans not meeting risk ratings six through nine are reserved for as a group of similar type pass rated credits and included in the general portion of the allowance for loan losses.
The general portion of the loan loss allowance is reflective of historical charge-off levels for similar loans adjusted for changes in current conditions and other relevant factors. These factors are likely to cause estimated losses to differ from historical loss experience and include:
|
·
|
Changes in lending policies or procedures, including underwriting, collection, charge-off, and recovery procedures;
|
|
·
|
Changes in local, regional and national economic and business conditions including entry into new markets;
|
|
·
|
Changes in the volume or type of credit extended;
|
|
·
|
Changes in the experience, ability, and depth of lending management;
|
|
·
|
Changes in the volume and severity of past due, nonaccrual, restructured, or classified loans;
|
|
·
|
Changes in loan review or Board oversight; and,
|
|
·
|
Changes in the level of concentrations of credit.
|
The following is a summary of the Allowance for Loan Losses and Reserve for Unfunded Loan Commitments for the years ended December 31, 2010, 2009 and 2008:
|
Years Ended December 31,
|
||||||||||||
|
2010
|
2009
|
2008
|
||||||||||
|
(in thousands)
|
||||||||||||
|
Allowance For Loan Losses:
|
||||||||||||
|
Balance at beginning of year
|
$
|
19,896
|
$
|
16,112
|
$
|
9,753
|
||||||
|
Provision for loan losses
|
13,737
|
15,093
|
13,675
|
|||||||||
|
Loans charged off
|
(16,413
|
)
|
(13,147
|
)
|
(9,197
|
)
|
||||||
|
Recoveries of loans charged off
|
3,491
|
1,838
|
1,881
|
|||||||||
|
Balance at end of year
|
$
|
20,711
|
$
|
19,896
|
$
|
16,112
|
||||||
|
Reserve For Unfunded Loan Commitments:
|
||||||||||||
|
Balance at beginning of year
|
$
|
5
|
$
|
7
|
$
|
50
|
||||||
|
Provision for losses on unfunded loan commitments
|
25
|
(2
|
)
|
(43
|
)
|
|||||||
|
Balance at end of year
|
$
|
30
|
$
|
5
|
$
|
7
|
||||||
107
The following tables present the balance in the allowance for loan losses and the recorded investment in loans by portfolio segment based on impairment method as described in the allowance for loan losses methodology discussion as of December 31, 2010 (in thousands):
|
Allowance for Loan Losses
Ending Allowance Balance Attributable to Loans
|
||||||||||||
|
Individually Evaluated for Impairment
|
Collectively Evaluated for Impairment
|
Total Ending Allowance Balance
|
||||||||||
|
Real Estate Loans:
|
||||||||||||
|
Construction
|
$ | 1,214 | $ | 1,371 | $ | 2,585 | ||||||
|
1-4 Family residential
|
832 | 1,156 | 1,988 | |||||||||
|
Other
|
914 | 2,440 | 3,354 | |||||||||
|
Commercial loan
|
1,986 | 1,760 | 3,746 | |||||||||
|
Municipal loan
|
125 | 482 | 607 | |||||||||
|
Loans to individuals
|
442 | 7,536 | 7,978 | |||||||||
|
Unallocated
|
– | 453 | 453 | |||||||||
|
Total
|
$ | 5,513 | $ | 15,198 | $ | 20,711 | ||||||
|
Loans
|
||||||||||||
|
Loans Individually Evaluated for Impairment
|
Loans Collectively Evaluated for Impairment
|
Total Ending Loans Balance
|
||||||||||
|
Real Estate Loans:
|
||||||||||||
|
Construction
|
$ | 10,355 | $ | 104,739 | $ | 115,094 | ||||||
|
1-4 Family residential
|
8,331 | 210,700 | 219,031 | |||||||||
|
Other
|
10,688 | 190,035 | 200,723 | |||||||||
|
Commercial loan
|
12,144 | 136,617 | 148,761 | |||||||||
|
Municipal loan
|
738 | 195,856 | 196,594 | |||||||||
|
Loans to individuals
|
1,625 | 196,092 | 197,717 | |||||||||
|
Total
|
$ | 43,881 | $ | 1,034,039 | $ | 1,077,920 | ||||||
The following table presents weighted average risk grades and classified loans by class in Risk Grades 7, 8 and 9 as of December 31, 2010 (in thousands):
|
Weighted Average Risk Grade
|
Classified Loans
|
|||||||
|
Real Estate Loans:
|
||||||||
|
Construction
|
7.00 | $ | 8,174 | |||||
|
1-4 family residential
|
7.13 | 6,140 | ||||||
|
Other
|
7.08 | 5,802 | ||||||
|
Commercial loans
|
7.03 | 8,647 | ||||||
|
Municipal Loans
|
7.00 | 480 | ||||||
|
Loans to individuals
|
7.33 | 6,751 | ||||||
|
Total
|
$ | 35,994 | ||||||
108
Nonaccrual and Past Due Loans
Nonaccrual loans are those loans which are 90 days or more delinquent and collection in full of both the principal and interest is in doubt. Additionally, some loans that are not delinquent may be placed on nonaccrual status due to doubts about full collection of principal or interest. When a loan is categorized as nonaccrual, the accrual of interest is discontinued and the accrued balance is reversed for financial statement purposes. Payments of contractual interest are recognized as income only to the extent that full recovery of the principal balance of the loan is reasonably certain. Loans are returned to accrual status when all the principal and interest amounts contractually due are brought current and future payments are reasonably assured. Other factors, such as the value of collateral securing the loan and the financial condition of the borrower must be considered in judgments as to potential loan loss.
Loans are considered impaired if, based on current information and events, it is probable that we will be unable to collect the scheduled payments of principal and interest when due according to the contractual terms of the loan agreement. The measurement of impaired loans is generally based on the present value of the expected future cash flows discounted at the historical effective interest rate stipulated in the loan agreement, except that all collateral-dependent loans are measured for impairment based on the fair value of the collateral. In measuring the fair value of the collateral, in addition to relying on third party appraisals, we use assumptions such as discount rates, and methodologies, such as comparison to the recent selling price of similar assets, consistent with those that would be utilized by unrelated third parties performing a valuation.
Nonaccrual loans and accruing loans past due more than 90 days include both smaller balance homogeneous loans that are collectively evaluated for impairment and individually classified impaired loans.
The following table presents the recorded investment in nonaccrual and accruing loans past due more than 90 days by class of loans as of December 31, 2010 (in thousands):
|
Nonaccrual
|
Accruing Loans Past Due More Than 90 Days
|
|||||||
|
Real Estate Loans:
|
||||||||
|
Construction
|
$ | 4,730 | $ | – | ||||
|
1-4 family residential
|
2,353 | – | ||||||
|
Other
|
1,428 | – | ||||||
|
Commercial loans
|
1,799 | – | ||||||
|
Municipal Loans
|
– | – | ||||||
|
Loans to individuals
|
4,214 | 7 | ||||||
|
Total
|
$ | 14,524 | $ | 7 | ||||
109
The following table presents the aging of the recorded investment in past due loans as of December 31, 2010 by class of loans (in thousands):
|
30-59 Days Past Due
|
60-89 Days Past Due
|
Greater than 90 Days Past Due
|
Total Past Due
|
Loans Not Past Due
|
Total
|
|||||||||||||||||||
|
Real Estate Loans:
|
||||||||||||||||||||||||
|
Construction
|
$ | 515 | $ | 655 | $ | 4,730 | $ | 5,900 | $ | 109,194 | $ | 115,094 | ||||||||||||
|
1-4 Family residential
|
3,437 | 641 | 2,353 | 6,431 | 212,600 | 219,031 | ||||||||||||||||||
|
Other
|
350 | 399 | 1,428 | 2,177 | 198,546 | 200,723 | ||||||||||||||||||
|
Commercial loan
|
500 | 227 | 1,799 | 2,526 | 146,235 | 148,761 | ||||||||||||||||||
|
Municipal loan
|
– | – | – | – | 196,594 | 196,594 | ||||||||||||||||||
|
Loans to individuals
|
6,477 | 1,306 | 4,221 | 12,004 | 185,713 | 197,717 | ||||||||||||||||||
|
Total
|
$ | 11,279 | $ | 3,228 | $ | 14,531 | $ | 29,038 | $ | 1,048,882 | $ | 1,077,920 | ||||||||||||
Impaired loans were as follows (in thousands):
|
2010
|
2009
|
|||||||
|
Year-end loans with no allocated allowance for loan losses
|
$
|
69
|
$
|
287
|
||||
|
Year-end loans with allocated allowance for loan losses
|
16,699
|
20,226
|
||||||
|
Total
|
$
|
16,768
|
$
|
20,513
|
||||
|
Amount of the allowance for loan losses allocated
|
$
|
3,864
|
$
|
5,027
|
||||
At any time a potential loss is recognized in the collection of principal, proper reserves should be allocated. Loans are charged off when deemed uncollectible. Loans are charged down as soon as collection by liquidation is evident to the liquidation value of the collateral net of liquidation costs, if any, and placed in nonaccrual status.
The following table presents the interest income recognized on nonaccrual and restructured loans by class of loans for the year ended December 31, 2010 (in thousands):
|
Interest Income Recognized
|
Accruing Interest at Original Contracted Rate
|
|||||||
|
Real Estate Loans:
|
||||||||
|
Construction
|
$ | 4 | $ | 356 | ||||
|
1-4 family residential
|
49 | 139 | ||||||
|
Other
|
16 | 117 | ||||||
|
Commercial loans
|
8 | 48 | ||||||
|
Municipal Loans
|
– | – | ||||||
|
Loans to individuals
|
980 | 1,547 | ||||||
|
Total
|
$ | 1,057 | $ | 2,207 | ||||
The amount of interest recognized on loans that were nonaccruing or restructured during the year was $1.2 million and $1.1 million for the years ended December 31, 2009 and 2008, respectively. If these loans had been accruing interest at their original contracted rates, related income would have been $1.7 million and $1.8 million for the years ended December 31, 2009 and 2008, respectively.
110
The following table presents impaired loans by class of loans as of December 31, 2010 in (thousands):
|
Unpaid Contractual Principal Balance
|
Recorded Investment With No Allowance
|
Recorded Investment With Allowance
|
Total Recorded Investment
|
Loan Losses Allocated
|
Average Recorded Investment
|
|||||||||||||||||||
|
Real Estate Loans:
|
||||||||||||||||||||||||
|
Construction
|
$ | 6,045 | $ | – | $ | 4,730 | $ | 4,730 | $ | 562 | $ | 6,013 | ||||||||||||
|
1-4 family residential
|
2,453 | – | 2,354 | 2,354 | 426 | 1,250 | ||||||||||||||||||
|
Other
|
1,807 | – | 1,428 | 1,428 | 179 | 1,445 | ||||||||||||||||||
|
Commercial Loans
|
1,826 | – | 1,799 | 1,799 | 719 | 1,950 | ||||||||||||||||||
|
Municipal Loans
|
– | – | – | – | – | – | ||||||||||||||||||
|
Loans to individuals
|
6,854 | 69 | 6,388 | 6,457 | 1,978 | 7,904 | ||||||||||||||||||
|
Total
|
$ | 18,985 | $ | 69 | $ | 16,699 | $ | 16,768 | $ | 3,864 | $ | 18,562 | ||||||||||||
For the years ended December 31, 2010 and 2009, the average recorded investment in impaired loans was approximately $18.6 million and $16.1 million, respectively.
7. PREMISES AND EQUIPMENT
|
December 31,
|
December 31,
|
|||||||
|
2010
|
2009
|
|||||||
|
(in thousands)
|
||||||||
|
Premises
|
$ | 59,569 | $ | 54,010 | ||||
|
Furniture and equipment
|
22,949 | 22,053 | ||||||
| 82,518 | 76,063 | |||||||
|
Less: accumulated depreciation
|
32,374 | 29,586 | ||||||
|
Total
|
$ | 50,144 | $ | 46,477 | ||||
Depreciation expense was $3.2 million, $2.9 million and $2.5 million for the years ended December 31, 2010, 2009 and 2008, respectively.
8. OTHER REAL ESTATE OWNED
For the years ended December 31, 2010 and 2009, the total of OREO was $220,000 and $1.9 million, respectively. OREO is reflected in other assets in our consolidated balance sheet.
For the years ended December 31, 2010, 2009 and 2008, losses on impairment or sale of OREO were $173,000, $781,000 and $174,000, respectively.
For the years ended December 31, 2010, 2009 and 2008, OREO operating expense exceeded income by $157,000, $141,000 and $83,000, respectively.
111
9. INTEREST BEARING DEPOSITS
|
December 31, 2010
|
December 31, 2009
|
|||||||
|
(in thousands)
|
||||||||
|
Savings deposits
|
$ | 79,466 | $ | 70,192 | ||||
|
Money market demand deposits
|
118,794 | 114,447 | ||||||
|
Platinum money market deposits
|
247,192 | 209,194 | ||||||
|
NOW demand deposits
|
181,850 | 163,465 | ||||||
|
Certificates and other time deposits of $100,000 or more
|
215,799 | 227,838 | ||||||
|
Certificates and other time deposits under $100,000
|
342,950 | 342,412 | ||||||
|
Public fund deposits
|
525,073 | 348,872 | ||||||
|
Total
|
$ | 1,711,124 | $ | 1,476,420 | ||||
At December 31, 2010 and 2009, interest-bearing public funds deposits included $238.7 million and $147.7 million in savings and interest bearing checking accounts, $286.1 million and $201.0 million in time deposits of $100,000 or more and $256,000 and $218,000 in time deposits under $100,000, respectively.
For the years ended December 31, 2010, 2009 and 2008, interest expense on time deposits of $100,000 or more was $5.4 million, $8.3 million and $10.0 million, respectively.
At December 31, 2010, the scheduled maturities of certificates and other time deposits, including public funds, are as follows (in thousands):
|
2011
|
$ | 559,887 | ||
|
2012
|
90,282 | |||
|
2013
|
11,124 | |||
|
2014
|
16,421 | |||
|
2015 and thereafter
|
167,386 | |||
| $ | 845,100 |
At December 31, 2010, we had a total of $20.0 million of short-term and $141.3 million in long-term brokered certificates of deposit (“CDs”) that represented 7.6% of our deposits. These brokered CDs mature within six years and are reflected in the CDs under $100,000 category. At December 31, 2009, we had $131.2 million in brokered CDs. We utilized long-term brokered CDs because the brokered CDs better matched overall ALCO objectives at the time of issuance by protecting us with fixed rates should interest rates increase, while providing us options to call the funding should interest rates decrease. Our current policy allows for a maximum of $165 million in brokered CDs.
The aggregate amount of demand deposit overdrafts that have been reclassified as loans were $1.3 million and $1.1 million for December 31, 2010 and 2009, respectively.
112
10. SHORT-TERM BORROWINGS
Information related to short-term borrowings is provided in the table below:
|
Years Ended December 31,
|
||||||||
|
2010
|
2009
|
|||||||
|
(dollars in thousands)
|
||||||||
|
Federal funds purchased and repurchase agreements
|
||||||||
|
Balance at end of period
|
$ | 3,844 | $ | 13,325 | ||||
|
Average amount outstanding during the period (1)
|
6,699 | 19,270 | ||||||
|
Maximum amount outstanding during the period (2)
|
13,187 | 46,983 | ||||||
|
Weighted average interest rate during the period (3)
|
3.1 | % | 2.7 | % | ||||
|
Interest rate at end of period
|
3.3 | % | 2.7 | % | ||||
|
FHLB advances
|
||||||||
|
Balance at end of period
|
$ | 189,094 | $ | 322,351 | ||||
|
Average amount outstanding during the period (1)
|
300,428 | 187,467 | ||||||
|
Maximum amount outstanding during the period (2)
|
401,893 | 322,351 | ||||||
|
Weighted average interest rate during the period (3)
|
2.4 | % | 2.2 | % | ||||
|
Interest rate at end of period
|
3.6 | % | 1.5 | % | ||||
|
Other obligations
|
||||||||
|
Balance at end of period
|
$ | 2,651 | $ | 2,760 | ||||
|
Average amount outstanding during the period (1)
|
2,522 | 2,311 | ||||||
|
Maximum amount outstanding during the period (2)
|
3,135 | 3,962 | ||||||
|
Weighted average interest rate during the period (3)
|
0.2 | % | – | |||||
|
Interest rate at end of period
|
0.7 | % | – | |||||
|
(1)
|
The average amount outstanding during the period was computed by dividing the total daily outstanding principal balances by the number of days in the period.
|
|
(2)
|
The maximum amount outstanding at any month-end during the period.
|
|
(3)
|
The weighted average interest rate during the period was computed by dividing the actual interest expense by the average balance outstanding during the period.
|
Southside Bank has four lines of credit for the purchase of federal funds. Three $15.0 million and one $10.0 million unsecured lines of credit have been established with Bank of America, Frost Bank, Sterling Bank and TIB – The Independent Bankers Bank, respectively. At December 31, 2010, the amount of additional funding Southside Bank could obtain from FHLB using unpledged securities at FHLB was approximately $377.3 million, net of FHLB stock purchases required. There were no federal funds purchased at December 31, 2010 or 2009. Southside Bank obtained $32.0 million letters of credit from FHLB as collateral for a portion of its public fund deposits.
Securities sold under agreements to repurchase are secured by borrowings and are stated at the amount of cash received in connection with the transaction. Securities sold under agreements to repurchase totaled $3.8 million at December 31, 2010. There were $13.3 million sold under agreements to repurchase at December 31, 2009.
|
Other obligations consist primarily of a treasury tax and loan account.
|
113
|
11. LONG-TERM OBLIGATIONS
|
|
Years Ended December 31,
|
|||||||||
|
2010
|
2009
|
||||||||
|
(dollars in thousands)
|
|||||||||
|
FHLB advances
|
|||||||||
|
Balance at end of period
|
$ | 373,479 | $ | 532,519 | |||||
|
Weighted average interest rate during the period (1)
|
3.6 | % |
|
3.6 | % | ||||
|
Interest rate at end of period
|
3.6 | % |
|
3.7 | % | ||||
|
Long-term debt (2)
|
|||||||||
|
Balance at end of period
|
$ | 60,311 | $ | 60,311 | |||||
|
Weighted average interest rate during the period (1)
|
5.4 | % |
|
5.7 | % | ||||
|
Interest rate at end of period
|
5.3 | % |
|
5.3 | % | ||||
Maturities of fixed rate long-term obligations based on scheduled repayments at December 31, 2010 are as follows (in thousands):
|
Under 1 Year
|
Due 1-5 Years
|
Due 6-10 Years
|
Over 10 Years
|
Total
|
||||||||||||||||
|
FHLB advances
|
$ | 2,269 | $ | 362,195 | $ | 6,297 | $ | 2,718 | $ | 373,479 | ||||||||||
|
Long-term debt
|
– | – | – | 60,311 | 60,311 | |||||||||||||||
|
Total long-term obligations
|
$ | 2,269 | $ | 362,195 | $ | 6,297 | $ | 63,029 | $ | 433,790 | ||||||||||
FHLB advances represent borrowings with fixed interest rates ranging from 1.2% to 7.6% and with maturities of one to eighteen years. FHLB advances are collateralized by FHLB stock, nonspecified real estate loans and mortgage-backed securities.
|
Years Ended December 31,
|
||||||||
|
2010
|
2009
|
|||||||
|
(in thousands)
|
||||||||
|
Long-term Debt
|
||||||||
|
Southside Statutory Trust III Due 2033 (3)
|
$ | 20,619 | $ | 20,619 | ||||
|
Southside Statutory Trust IV Due 2037 (4)
|
23,196 | 23,196 | ||||||
|
Southside Statutory Trust V Due 2037 (5)
|
12,887 | 12,887 | ||||||
|
Magnolia Trust Company I Due 2035 (6)
|
3,609 | 3,609 | ||||||
|
Total Long-term Debt
|
$ | 60,311 | $ | 60,311 | ||||
|
(1)
|
The weighted average interest rate during the period was computed by dividing the actual interest expense by the average balance outstanding during the period.
|
|
(2)
|
This long-term debt consists of trust preferred securities that qualify under the risk-based capital guidelines as Tier 1 capital, subject to certain limitations.
|
|
(3)
|
This debt carries an adjustable rate of 3.24281% through March 30, 2011 and adjusts quarterly at a rate equal to three-month LIBOR plus 294 basis points.
|
|
(4)
|
This debt carries a fixed rate of 6.518% through October 30, 2012 and thereafter, adjusts quarterly at a rate equal to three-month LIBOR plus 130 basis points.
|
|
(5)
|
This debt carries a fixed rate of 7.48% through December 15, 2012 and thereafter, adjusts quarterly at a rate equal to three-month LIBOR plus 225 basis points.
|
|
(6)
|
This debt carries an adjustable rate of 2.08438% through February 22, 2011 and adjusts quarterly at a rate equal to three-month LIBOR plus 180 basis points.
|
The long-term debt was $60.3 million for the years ended December 31, 2010 and 2009. During the third quarter ended September 30, 2007, we issued $36.1 million of junior subordinated debentures in connection with the issuance of trust preferred securities by our subsidiaries Southside Statutory Trusts IV and V. The $36.1 million in debentures were issued to fund the purchase of FWBS. In addition, as a result of the acquisition, we assumed $3.6 million of junior subordinated debentures issued to Magnolia Trust Company I.
114
Beginning in September 2010 and continuing into the fourth quarter of 2010, we entered into the option to fund between one and a half and two years forward from the advance commitment date $150 million par in long-term advance commitments from the FHLB at the rates on the date the option was purchased. The fee, included in other assets in our consolidated balance sheet, will be amortized over the term of the advance as long as it is probable we will exercise the advance commitments. Should we determine the advance commitments will not be exercised, the fee will be expensed in the period determination is made.
Below is a table detailing the optional advance commitment terms (dollars in thousands):
|
Advance Commitment
|
Option Expiration Date
|
Advance Commitment Term at Exercise Date
|
Advance Commitment Rate
|
Option Fee Paid
|
|||||||||
| $ | 25,000 |
09/20/12
|
36 months
|
1.325 | % | $ | 1,105 | ||||||
| 25,000 |
09/20/12
|
48 months
|
1.674 | % | 1,410 | ||||||||
| 20,000 |
10/09/12
|
36 months
|
1.153 | % | 789 | ||||||||
| 20,000 |
10/09/12
|
48 months
|
1.466 | % | 1,042 | ||||||||
| 20,000 |
10/09/12
|
60 months
|
1.807 | % | 1,216 | ||||||||
| 20,000 |
05/17/12
|
48 months
|
1.710 | % | 917 | ||||||||
| 20,000 |
05/17/12
|
60 months
|
2.085 | % | 1,102 | ||||||||
| $ | 150,000 | $ | 7,581 | ||||||||||
12. EMPLOYEE BENEFITS
Southside Bank has a deferred compensation agreement with 18 of its executive officers, which generally provides for payment of an aggregate amount of $8.3 million over a maximum period of 15 years after retirement or death. Deferred compensation expense was $256,000, $257,000 and $1.2 million for the years ended December 31, 2010, 2009 and 2008, respectively. For the years ended December 31, 2010 and 2009, the deferred compensation plan liability totaled $3.9 million and $3.7 million, respectively.
We provide accident and health insurance for substantially all employees through a self funded insurance program. Our healthcare plan was amended December 2006 to eliminate retiree health insurance for all current employees effective December 31, 2006. Effective July 31, 2007, the healthcare plan no longer provides health insurance coverage for any current retirees. The cost of health care benefits was $3.7 million, $3.6 million and $2.6 million for the years ended December 31, 2010, 2009 and 2008, respectively. There were no retirees participating in the health insurance plan as of December 31, 2010 and 2009.
We have an Employee Stock Ownership Plan (the “ESOP”) which covers substantially all employees. Contributions to the ESOP are at the sole discretion of the board of directors. There was $250,000 contributed to the ESOP for each of the years ended December 31, 2010, 2009 and 2008. At December 31, 2010 and 2009, 320,699 and 289,093 shares of common stock were owned by the ESOP, respectively. The number of shares has been adjusted as a result of stock splits and stock dividends. These shares are treated as externally held shares for dividend and earnings per share calculations.
We have an officer’s long-term disability income policy which provides coverage in the event they become disabled as defined under its terms. Individuals are automatically covered under the policy if they (a) have been elected as an officer, (b) have been an employee of Southside Bank for three years and (c) receive earnings of $50,000 or more on an annual basis. The policy provides, among other things, that should a covered individual become totally disabled he would receive two-thirds of his current salary, not to exceed $15,000 per month. The benefits paid out of the policy are limited by the benefits paid to the individual under the terms of our other Company sponsored benefit plans.
We entered into split dollar agreements with eight of our executive officers. The agreements provide we will be the beneficiary of bank owned life insurance (“BOLI”) insuring the executives’ lives. The agreements provide the executives the right to designate the beneficiaries of the death benefits guaranteed in each agreement. The agreements originally provided for death benefits of an initial aggregate amount of $4.5 million. The individual amounts are increased annually on the anniversary date of the agreement by inflation adjustment factors ranging from 3% to 5%. As of December 31, 2010, the expected death benefits total $5.7 million. The agreements also state that before and after the executive’s retirement dates, we shall also pay an annual gross-up bonus to the executive in an amount sufficient to enable the executive to pay federal income tax on both the economic benefit and on the gross-up bonus. The expense required to
115
record the post retirement liability associated with the split dollar post retirement bonuses was $41,000 and $70,000 for the years ended December 31, 2010 and 2009, respectively. There was no expense associated with the postretirement liability for the year ended December 31, 2008.
FASB ASC Topic 715, “Compensation-Retirement Benefits,” requires that for a split-dollar life insurance arrangement, an employer should recognize a liability for future benefits. We adopted FASB ASC Topic 715 as of January 1, 2008 as a change in accounting principle through a cumulative-effect adjustment to retained earnings. The amount of the adjustment was $351,000. For the years ended December 31, 2010 and 2009, the split-dollar liability totaled $1.3 million and 1.2 million, respectively.
We have a defined benefit pension plan (“the Plan”) pursuant to which participants are entitled to benefits based on final average monthly compensation and years of credited service determined in accordance with plan provisions.
On November 3, 2005, our board of directors approved amendments to the Plan which affected future participation in the Plan and reduced the accrual of future benefits.
Entrance into the Plan by new employees was frozen effective December 31, 2005. Employees hired after December 31, 2005 are not eligible to participate in the plan. All other employees are eligible to participate under the plan on the first day of the month coincident with or next following the first anniversary of hire. Employees are vested upon the earlier of five years credited service or the employee attaining 60 years of age. Benefits are payable monthly commencing on the later of age 65 or the participant’s date of retirement. Eligible participants may retire at reduced benefit levels after reaching age 55. We contribute amounts to the pension fund sufficient to satisfy funding requirements of the Employee Retirement Income Security Act.
Plan assets, which consist primarily of marketable equity and debt instruments, are valued using market quotations. Plan obligations and the annual pension expense are determined by independent actuaries and through the use of a number of assumptions. Key assumptions in measuring the plan obligations include the discount rate, the rate of salary increases and the estimated future return on plan assets. In determining the discount rate, we utilized a cash flow matching analysis to determine a range of appropriate discount rates for the defined benefit pension plan and restoration plans. In developing the cash flow matching analysis, we constructed a portfolio of high quality non-callable bonds (rated AA- or better) to match as closely as possible the timing of future benefit payments of the plans at December 31, 2010. Based on this cash flow matching analysis, we were able to determine an appropriate discount rate.
Salary increase assumptions are based upon historical experience and anticipated future management actions. The expected long-term rate of return assumption reflects the average return expected based on the investment strategies and asset allocation on the assets invested to provide for the Plan’s liabilities. We considered broad equity and bond indices, long-term return projections, and actual long-term historical Plan performance when evaluating the expected long-term rate of return assumption. At December 31, 2010, the weighted-average actuarial assumptions used to determine the benefit obligation of the Plan were: a discount rate of 5.63%; a long-term rate of return on Plan assets of 7.50%; and assumed salary increases of 4.50%. Material changes in pension benefit costs may occur in the future due to changes in these assumptions. Future annual amounts could be impacted by changes in the number of Plan participants, changes in the level of benefits provided, changes in the discount rates, changes in the expected long-term rate of return, changes in the level of contributions to the Plan and other factors.
Plan assets included 175,205 shares of our stock at December 31, 2010 and 2009. Our stock included in Plan assets was purchased at fair market value. The number of shares has been adjusted as a result of stock splits and stock dividends. During 2010, our funded status decreased $2.4 million to an underfunded status of $19,000 at December 31, 2010 from a funded status of $2.4 million at December 31, 2009.
We have a nonfunded supplemental retirement plan (the “Restoration Plan”) for our employees whose benefits under the principal retirement plan are reduced because of compensation deferral elections or limitations under federal tax laws.
116
We use a measurement date of December 31 for our plans.
|
2010
|
2009
|
|||||||||||||||
|
Defined Benefit
Pension
Plan
|
Restoration
Plan
|
Defined Benefit
Pension
Plan
|
Restoration
Plan
|
|||||||||||||
|
(in thousands)
|
||||||||||||||||
|
Change in Projected Benefit Obligation:
|
||||||||||||||||
|
Benefit obligation at end of prior year
|
$ | 45,290 | $ | 4,789 | $ | 42,781 | $ | 3,989 | ||||||||
|
Service cost
|
1,363 | 154 | 1,277 | 108 | ||||||||||||
|
Interest cost
|
2,832 | 384 | 2,570 | 271 | ||||||||||||
|
Actuarial loss
|
5,538 | 1,927 | 150 | 501 | ||||||||||||
|
Benefits paid
|
(1,469 | ) | (80 | ) | (1,386 | ) | (80 | ) | ||||||||
|
Expenses paid
|
(83 | ) | – | (102 | ) | – | ||||||||||
|
Benefit obligation at end of year
|
53,471 | 7,174 | 45,290 | 4,789 | ||||||||||||
|
Change in Plan Assets:
|
||||||||||||||||
|
Fair value of plan assets at end of prior year
|
47,669 | – | 36,894 | – | ||||||||||||
|
Actual return
|
4,335 | – | 6,263 | – | ||||||||||||
|
Employer contributions
|
3,000 | 80 | 6,000 | 80 | ||||||||||||
|
Benefits paid
|
(1,469 | ) | (80 | ) | (1,386 | ) | (80 | ) | ||||||||
|
Expenses paid
|
(83 | ) | – | (102 | ) | – | ||||||||||
|
Fair value of plan assets at end of year
|
53,452 | – | 47,669 | – | ||||||||||||
|
Funded status at end of year
|
(19 | ) | (7,174 | ) | 2,379 | (4,789 | ) | |||||||||
|
Accrued benefit (liability) recognized
|
$ | (19 | ) | $ | (7,174 | ) | $ | 2,379 | $ | (4,789 | ) | |||||
|
Accumulated benefit obligation at end of year
|
$ | 42,043 | $ | 4,586 | $ | 35,954 | $ | 3,202 | ||||||||
Amounts related to our defined benefit pension and restoration plans recognized as a component of other comprehensive income (loss) were as follows:
|
2010
|
||||||||
|
Defined
Benefit
Pension
Plan
|
Restoration
Plan
|
|||||||
|
(in thousands)
|
||||||||
|
Recognition of net loss
|
$ | 1,006 | $ | 290 | ||||
|
Recognition of prior service credit
|
(42 | ) | (2 | ) | ||||
|
Net loss occurring during the year
|
(4,856 | ) | (1,927 | ) | ||||
|
Recognition of transition obligation
|
– | – | ||||||
| (3,892 | ) | (1,639 | ) | |||||
|
Deferred tax benefit
|
1,362 | 574 | ||||||
|
Other comprehensive loss, net of tax
|
$ | (2,530 | ) | $ | (1,065 | ) | ||
117
Net amounts recognized in net periodic benefit cost and other comprehensive loss as of December 31, 2010 were as follows:
|
2010
|
||||||||
|
Defined
Benefit
Pension
Plan
|
Restoration
Plan
|
|||||||
|
(in thousands)
|
||||||||
|
Net loss
|
$ | 1,006 | $ | 290 | ||||
|
Prior service credit
|
(42 | ) | (2 | ) | ||||
| 964 | 288 | |||||||
|
Deferred tax benefit
|
(337 | ) | (101 | ) | ||||
|
Accumulated other comprehensive loss, net of tax
|
$ | 627 | $ | 187 | ||||
Amounts recognized as a component of accumulated other comprehensive loss as of December 31, 2010 were as follows:
|
2010
|
||||||||
|
Defined
Benefit
Pension
Plan
|
Restoration
Plan
|
|||||||
|
(in thousands)
|
||||||||
|
Net loss
|
$ | (20,743 | ) | $ | (3,611 | ) | ||
|
Prior service credit
|
464 | 5 | ||||||
| (20,279 | ) | (3,606 | ) | |||||
|
Deferred tax benefit
|
7,098 | 1,262 | ||||||
|
Accumulated other comprehensive loss, net of tax
|
$ | (13,181 | ) | $ | (2,344 | ) | ||
At December 31, 2010 and 2009, the assumptions used to determine the benefit obligation were as follows:
|
2010
|
2009
|
|||||||||||
|
Defined Benefit
Pension
Plan
|
Restoration
Plan
|
Defined Benefit
Pension
Plan
|
Restoration
Plan
|
|||||||||
|
Discount rate
|
5.63
|
%
|
5.63
|
%
|
6.10
|
%
|
6.10
|
%
|
||||
|
Compensation increase rate
|
4.50
|
%
|
4.50
|
%
|
4.50
|
%
|
4.50
|
%
|
||||
118
Net periodic pension cost and postretirement benefit cost for the years ended December 31, 2010, 2009 and 2008 included the following components:
|
2010
|
2009
|
2008
|
||||||||||
|
Defined Benefit Pension Plan
|
(in thousands)
|
|||||||||||
|
Service cost
|
$
|
1,363
|
$
|
1,277
|
$
|
1,240
|
||||||
|
Interest cost
|
2,832
|
2,570
|
2,424
|
|||||||||
|
Expected return on assets
|
(3,652
|
)
|
(2,878
|
)
|
(2,990
|
)
|
||||||
|
Net loss amortization
|
1,006
|
1,200
|
417
|
|||||||||
|
Prior service credit amortization
|
(42
|
)
|
(42
|
)
|
(42
|
)
|
||||||
|
Net periodic benefit cost
|
$
|
1,507
|
$
|
2,127
|
$
|
1,049
|
||||||
|
Restoration Plan
|
||||||||||||
|
Service cost
|
$
|
154
|
$
|
108
|
$
|
85
|
||||||
|
Interest cost
|
384
|
271
|
228
|
|||||||||
|
Net loss amortization
|
290
|
209
|
152
|
|||||||||
|
Prior service credit amortization
|
(2
|
)
|
(2
|
)
|
(2
|
)
|
||||||
|
Net periodic benefit cost
|
$
|
826
|
$
|
586
|
$
|
463
|
||||||
For the years ended December 31, 2010, 2009, and 2008, the assumptions used to determine net periodic pension cost and postretirement benefit cost were as follows:
|
2010
|
2009
|
2008
|
|||||||||
|
Defined Benefit Pension Plan
|
|||||||||||
|
Discount rate
|
6.10%
|
6.10%
|
6.25%
|
||||||||
|
Expected long-term rate of return on plan assets
|
7.50%
|
7.50%
|
7.50%
|
||||||||
|
Compensation increase rate
|
4.50%
|
4.50%
|
4.50%
|
||||||||
|
Restoration Plan
|
|||||||||||
|
Discount rate
|
6.10%
|
6.10%
|
6.25%
|
||||||||
|
Compensation increase rate
|
4.50%
|
4.50%
|
4.50%
|
||||||||
The amounts in accumulated other comprehensive income (loss) that are expected to be recognized as components of net periodic benefit cost during 2011 are as follows (in thousands):
|
Defined Benefit
|
Restoration
|
|||||||
|
Pension Plan
|
Plan
|
|||||||
|
Net Loss
|
$ | 1,103 | $ | 291 | ||||
|
Prior service credit
|
(42 | ) | (2 | ) | ||||
| 1,061 | 289 | |||||||
|
Deferred tax benefit
|
(371 | ) | (101 | ) | ||||
|
Other comprehensive loss, net of tax
|
$ | 690 | $ | 188 | ||||
119
|
Fair Value Measurements at
|
||||||||||||||||
|
December 31, 2010
|
||||||||||||||||
|
Asset Category:
|
Level 1
|
Level 2
|
Level 3
|
Total
|
||||||||||||
|
Input
|
Input
|
Input
|
Fair Value
|
|||||||||||||
|
(in thousands)
|
||||||||||||||||
|
Cash and cash equivalents:
|
$ | 3,335 | $ | 4,479 | $ | – | $ | 7,814 | ||||||||
|
Equity Securities:
|
||||||||||||||||
|
U.S. large cap (1)
|
25,204 | – | – | 25,204 | ||||||||||||
|
U.S. mid cap (1)
|
2,959 | – | – | 2,959 | ||||||||||||
|
U.S. small cap (2)
|
4,194 | – | – | 4,194 | ||||||||||||
|
International developed (3)
|
456 | – | – | 456 | ||||||||||||
|
International emerging (4)
|
415 | – | – | 415 | ||||||||||||
|
Fixed income securities:
|
||||||||||||||||
|
Corporate bonds (5)
|
– | 1,493 | – | 1,493 | ||||||||||||
|
U.S. Government Agencies (5)
|
– | 8,530 | 8,530 | |||||||||||||
|
Municipal Bonds (5)
|
– | 451 | – | 451 | ||||||||||||
|
U.S. Agency mortgage-backed securities (6)
|
– | 1,936 | – | 1,936 | ||||||||||||
|
Total
|
$ | 36,563 | $ | 16,889 | $ | – | $ | 53,452 | ||||||||
|
(1)
|
This category is comprised of individual securities that are actively managed.
|
|
(2)
|
This category is also comprised of individual securities that are actively managed. Also included in this category is Southside Bancshares stock that is owned in the Plan.
|
|
(3)
|
This category is comprised of a broadly ‘passive’ mutual fund.
|
|
(4)
|
This category is comprised of a broadly diversified ‘passive’ mutual fund.
|
|
(5)
|
This category is comprised of individual investment grade securities that are generally held to maturity.
|
|
(6)
|
This category is comprised of individual securities that are generally not held to maturity.
|
We did not have any plan assets with Level 3 input fair value measurements at December 31, 2010.
Our overall investment strategy is to realize long term growth of the plan within acceptable risk parameters, while funding benefit payments from dividend and interest income, to the extent possible. The target allocations for plan assets are 65% equities, 33% fixed income and 2% cash equivalents. Equity securities are diversified among US and international (both developed and emerging), large, mid and small caps, and value and growth securities. Fixed income securities include U.S. Treasuries, agencies, CDs, corporate bonds, and mortgage backed securities. Mutual funds, primarily because of the superior diversification they provide, are used to provide specific international developed and emerging market exposure.
As of December 31, 2010, expected future benefit payments related to our defined benefit pension plan and restoration plan were as follows (in thousands):
|
Defined Benefit Pension Plan
|
Restoration Plan
|
|||||||
|
2011
|
$ | 1,635 | $ | 120 | ||||
|
2012
|
1,880 | 305 | ||||||
|
2013
|
2,065 | 315 | ||||||
|
2014
|
2,314 | 333 | ||||||
|
2015
|
2,581 | 359 | ||||||
|
2016 through 2020
|
16,545 | 2,894 | ||||||
| $ | 27,020 | $ | 4,326 | |||||
We expect to contribute $2.0 million to our defined benefit pension plan and $80,000 to our postretirement benefit plan in 2011.
401(k) Plan
We have a 401(k) defined contribution plan (the “401(k) Plan”) covering substantially all employees, who have completed one year of service and are age 21 or older. A participant may elect to defer a percentage of their compensation subject to certain limits based on federal tax laws. For the years ended December
120
31, 2010, 2009 and 2008, expense attributable to the 401(k) Plan amounted to $119,000 $100,000 and $117,000, respectively.
Incentive Stock Options
In April 1993, we adopted the Southside Bancshares, Inc. 1993 Incentive Stock Option Plan (the “ISO Plan"), a stock-based incentive compensation plan. The ISO Plan expired March 31, 2003.
As of December 31, 2010, there were no nonvested shares. For the years ended December 31, 2010 and 2009 there was no stock-based compensation expense.
As of December 31, 2010 and 2009, there was no unrecognized compensation cost related to the ISO Plan for nonvested options granted in March 2003.
The fair value of each stock option granted is estimated on the date of grant using the Black-Scholes method of option pricing with the following weighted-average assumptions for grants in 2003: dividend yield of 1.93%; risk-free interest rate of 4.93%; expected life of six years; and expected volatility of 28.90%.
Under the ISO Plan, we were authorized to issue shares of common stock pursuant to "Awards" granted in the form of incentive stock options (intended to qualify under Section 422 of the Internal Revenue Code of 1986, as amended). Before the ISO Plan expired, awards were granted to selected employees and directors. No stock options have been available for grant under the ISO Plan since its expiration in March 2003.
The ISO Plan provided that the exercise price of any stock option not be less than the fair market value of the common stock on the date of grant. The outstanding stock options have contractual terms of 10 years. All options vest on a graded schedule, 20% per year for five years, beginning on the first anniversary date of the grant date.
A summary of the status of our stock options as of December 31, 2010, and the changes during the year ended is presented below:
|
Number of Options
|
Weighted Average Exercise Prices
|
Weighted Average Remaining Contract Life (Years)
|
Aggregate Intrinsic Value
|
|||||||
|
Outstanding at December 31, 2009
|
108,115
|
$
|
5.14
|
|||||||
|
Exercised
|
(97,807
|
)
|
$
|
4.53
|
||||||
|
Cancelled
|
–
|
$
|
–
|
|||||||
|
Outstanding at December 31, 2010
|
10,308
|
$
|
10.90
|
2.25
|
$
|
105,000
|
||||
|
Exercisable at December 31, 2010
|
10,308
|
$
|
10.90
|
2.25
|
$
|
105,000
|
||||
The total intrinsic value (i.e., the amount by which the fair value of the underlying common stock exceeds the exercise price of a stock option on exercise date) of stock options exercised during the years ended December 31, 2010, 2009 and 2008 were $1.5 million, $3.0 million and $2.9 million, respectively.
Cash received from stock option exercises for the years ended December 31, 2010, 2009 and 2008 was $419,000, $734,000 and $908,000, respectively. The tax benefit realized for the deductions related to the stock option exercises were $331,000, $651,000 and $639,000 for the years ended December 31, 2010, 2009 and 2008, respectively.
On April 16, 2009, our shareholders approved the Southside Bancshares, Inc. 2009 Incentive Plan (the “2009 Incentive Plan”), which is a stock-based incentive compensation plan. A total of 1,102,500 shares of our common stock are reserved and available for issuance pursuant to awards granted under the 2009 Incentive Plan. As of December 31, 2010, no awards had been granted under this plan.
13. FAIR VALUE MEASUREMENT
Fair value is the price that would be received to sell an asset or paid to transfer a liability in an orderly
121
transaction between market participants. A fair value measurement assumes that the transaction to sell the asset or transfer the liability occurs in the principal market for the asset or liability or, in the absence of a principal market, the most advantageous market for the asset or liability. The price in the principal (or most advantageous) market used to measure the fair value of the asset or liability shall not be adjusted for transaction costs. An orderly transaction is a transaction that assumes exposure to the market for a period prior to the measurement date to allow for marketing activities that are usual and customary for transactions involving such assets and liabilities; it is not a forced transaction. Market participants are buyers and sellers in the principal market that are (i) independent, (ii) knowledgeable, (iii) able to transact and (iv) willing to transact.
Valuation techniques including the market approach, the income approach and/or the cost approach are utilized to determine fair value. Inputs to valuation techniques refer to the assumptions that market participants would use in pricing the asset or liability. An entity must consider all aspects of nonperforming risk, including the entity’s own credit standing when measuring fair value of a liability. Inputs may be observable, meaning those that reflect the assumptions market participants would use in pricing the asset or liability developed based on market data obtained from independent sources, or unobservable, meaning those that reflect the reporting entity’s own assumptions about the assumptions market participants would use in pricing the asset or liability developed based on the best information available in the circumstances. A fair value hierarchy for valuation inputs gives the highest priority to quoted prices in active markets for identical assets or liabilities and the lowest priority to unobservable inputs. The fair value hierarchy is as follows:
Level 1 Inputs - Unadjusted quoted prices in active markets for identical assets or liabilities that the reporting entity has the ability to access at the measurement date.
Level 2 Inputs - Inputs other than quoted prices included in Level 1 that are observable for the asset or liability, either directly or indirectly. These might include quoted prices for similar assets or liabilities in active markets, quoted prices for identical or similar assets or liabilities in markets that are not active, inputs other than quoted prices that are observable for the asset or liability (such as interest rates, volatilities, prepayment speeds, credit risks, etc.) or inputs that are derived principally from or corroborated by market data by correlation or other means.
Level 3 Inputs - Unobservable inputs for determining the fair values of assets or liabilities that reflect an entity's own assumptions about the assumptions that market participants would use in pricing the assets or liabilities.
A description of the valuation methodologies used for assets and liabilities measured at fair value, as well as the general classification of such instruments pursuant to the valuation hierarchy, is set forth below.
Securities Available for Sale - Securities classified as available for sale primarily consist of U.S. Treasuries, government-sponsored enterprise debentures, mortgage-backed securities, municipal bonds, and, to a lesser extent, TRUPs and equity securities. We use quoted market prices of identical assets on active exchanges, or Level 1 measurements, where possible. Where such quoted market prices are not available, we typically employ quoted market prices of similar instruments (including matrix pricing) and/or discounted cash flows using observable inputs to estimate a value of these securities, or Level 2 measurements. Discounted cash flow analyses are typically based on market interest rates, prepayment speeds and/or option adjusted spreads. Level 3 measurements include a range of fair value estimates in the marketplace as a result of the illiquid market specific to the type of security or discounted cash flow analyses based on assumptions that are not readily observable in the market place. Such assumptions include projections of future cash flows, including loss assumptions and discount rates.
Certain financial assets are measured at fair value in accordance with GAAP. Adjustments to the fair value of these assets usually result from the application of fair value accounting or write-downs of individual assets. Transfers between levels of the fair value hierarchy are recognized on the actual date of the event or circumstances that caused the transfer, which generally coincides with our monthly and/or quarterly valuation process. There were no transfers between Level 1 and Level 2 during the year ended December 31, 2010.
Loans Held for Sale - These loans are reported at the lower of cost or fair value. Fair value is determined based on expected proceeds, which are based on sales contracts and commitments and are considered
122
Level 2 inputs. At December 31, 2010, based on our estimates of fair value, no valuation allowance was recognized.
Impaired Loans – Certain impaired loans may be reported at the fair value of the underlying collateral if repayment is expected solely from the collateral. Collateral values are estimated using Level 3 inputs based on customized discounting criteria or appraisals. At December 31, 2010, the impact of loans with specific reserves based on the fair value of the collateral was reflected in our allowance for loan losses.
Certain non-financial assets and non-financial liabilities measured at fair value on a recurring basis include reporting units measured at fair value in the first step of a goodwill impairment test. Certain non-financial assets measured at fair value on a non-recurring basis include non-financial assets and non-financial liabilities measured at fair value in the second step of a goodwill impairment test, as well as intangible assets and other non-financial long-lived assets (such as real estate owned) that are measured at fair value in the event of an impairment. The framework became applicable to these fair value measurements beginning January 1, 2009.
The following tables summarize financial assets and financial liabilities measured at fair value on a recurring basis as of December 31, 2010 and 2009, segregated by the level of the valuation inputs within the fair value hierarchy utilized to measure fair value (in thousands):
|
As of December 31, 2010
|
||||||||||||||||
|
Level 1
|
Level 2
|
Level 3
|
Total
|
|||||||||||||
|
Securities Available For Sale
|
Input
|
Input
|
Input
|
Fair Value
|
||||||||||||
|
Investment Securities:
|
||||||||||||||||
|
U.S. Treasury
|
$ | 4,700 | $ | – | $ | – | $ | 4,700 | ||||||||
|
State and Political Subdivisions
|
– | 294,262 | – | 294,262 | ||||||||||||
|
Other Stocks and Bonds
|
193 | – | 189 | 382 | ||||||||||||
|
Mortgage-backed Securities:
|
||||||||||||||||
|
U.S. Government Agencies
|
– | 154,534 | – | 154,534 | ||||||||||||
|
Government-Sponsored Enterprise
|
– | 791,509 | – | 791,509 | ||||||||||||
|
Total
|
$ | 4,893 | $ | 1,240,305 | $ | 189 | $ | 1,245,387 | ||||||||
|
As of December 31, 2009
|
||||||||||||||||
|
Securities Available For Sale
|
Level 1
|
Level 2
|
Level 3
|
Total
|
||||||||||||
|
Input
|
Input
|
Input
|
Fair Value
|
|||||||||||||
|
Investment Securities:
|
||||||||||||||||
|
U.S. Treasury
|
$ | 4,899 | $ | – | $ | – | $ | 4,899 | ||||||||
|
State and Political Subdivisions
|
– | 259,526 | – | 259,526 | ||||||||||||
|
Other Stocks and Bonds
|
365 | – | 270 | 635 | ||||||||||||
|
Mortgage-backed Securities:
|
||||||||||||||||
|
U.S. Government Agencies
|
– | 129,582 | – | 129,582 | ||||||||||||
|
Government-Sponsored Enterprise
|
– | 1,108,600 | – | 1,108,600 | ||||||||||||
|
Total
|
$ | 5,264 | $ | 1,497,708 | $ | 270 | $ | 1,503,242 | ||||||||
123
The following tables present additional information about financial assets and liabilities measured at fair value on a recurring basis and for which we have utilized Level 3 inputs to determine fair value (in thousands):
|
Years Ended December 31,
|
||||||||
|
2010
|
2009
|
|||||||
|
Other Stocks and Bonds
|
||||||||
|
Balance at Beginning of Period
|
$ | 270 | $ | 646 | ||||
|
Total gains or losses (realized/unrealized):
|
||||||||
|
Included in earnings (or changes in net assets)
|
(75 | ) | (3,000 | ) | ||||
|
Included in other comprehensive income (loss)
|
(6 | ) | 2,624 | |||||
|
Purchases, issuances and settlements
|
– | – | ||||||
|
Transfers in and/or out of Level 3
|
– | – | ||||||
|
Balance at End of Period
|
$ | 189 | $ | 270 | ||||
|
The amount of total gains or losses for the periods included in earnings (or changes in net assets) attributable to the change in unrealized gains or losses relating to assets still held at reporting date
|
$ | (75 | ) | $ | (3,000 | ) | ||
Disclosure of fair value information about financial instruments, whether or not recognized in the balance sheet is required, for which it is practicable to estimate that value. In cases where quoted market prices are not available, fair values are based on estimates using present value or other estimation techniques. Those techniques are significantly affected by the assumptions used, including the discount rate and estimates of future cash flows. Such techniques and assumptions, as they apply to individual categories of our financial instruments, are as follows:
|
|
Cash and cash equivalents - The carrying amounts for cash and cash equivalents is a reasonable estimate of those assets' fair value.
|
Investment and mortgage-backed and related securities - Fair values for these securities are based on quoted market prices, where available. If quoted market prices are not available, fair values are based on quoted market prices for similar securities or estimates from independent pricing services.
|
|
FHLB stock and other investments - The carrying amount of FHLB stock is a reasonable estimate of those assets’ fair value.
|
|
|
Loans receivable - For adjustable rate loans that reprice frequently and with no significant change in credit risk, the carrying amounts are a reasonable estimate of those assets' fair value. The fair value of fixed rate loans is estimated by discounting the future cash flows using the current rates at which similar loans would be made to borrowers with similar credit ratings and for the same remaining maturities. Nonperforming loans are estimated using discounted cash flow analyses or the underlying value of the collateral where applicable.
|
Deposit liabilities - The fair value of demand deposits, savings accounts, and certain money market deposits is the amount on demand at the reporting date, that is, the carrying value. Fair values for fixed rate CDs are estimated using a discounted cash flow calculation that applies interest rates currently being offered for deposits of similar remaining maturities.
|
|
Federal funds purchased and repurchase agreements - Federal funds purchased and repurchase agreements generally have an original term to maturity of one day and thus are considered short-term borrowings. Consequently, their carrying value is a reasonable estimate of fair value.
|
|
|
FHLB advances - The fair value of these advances is estimated by discounting the future cash flows using rates at which advances would be made to borrowers with similar credit ratings and for the same remaining maturities.
|
124
Long-term debt - The carrying amount for the long-term debt is estimated by discounting future cash flows using estimated rates at which long-term debt would be made to borrowers with similar credit ratings and for the remaining maturities. This type of debt is not issued as frequently since the economic crisis beginning in 2007 and change to the capital rates issued in 2010. Therefore the discount rate is a best estimate.
The following table presents our financial assets, financial liabilities, and unrecognized financial instruments at both their respective carrying amounts and fair value:
|
At December 31, 2010
|
At December 31, 2009
|
|||||||||||||||
|
Carrying
|
Carrying
|
|||||||||||||||
|
Amount
|
Fair Value
|
Amount
|
Fair Value
|
|||||||||||||
|
(in thousands)
|
||||||||||||||||
|
Financial assets:
|
||||||||||||||||
|
Cash and cash equivalents
|
$ | 79,073 | $ | 79,073 | $ | 52,166 | $ | 52,166 | ||||||||
|
Investment securities:
|
||||||||||||||||
|
Available for sale, at estimated fair value
|
299,344 | 299,344 | 265,060 | 265,060 | ||||||||||||
|
Held to maturity, at amortized cost
|
1,495 | 1,553 | 1,493 | 1,618 | ||||||||||||
|
Mortgage-backed and related securities:
|
||||||||||||||||
|
Available for sale, at estimated fair value
|
946,043 | 946,043 | 1,238,182 | 1,238,182 | ||||||||||||
|
Held to maturity, at amortized cost
|
417,862 | 426,572 | 242,665 | 247,645 | ||||||||||||
|
FHLB stock and other investments, at cost
|
36,776 | 36,776 | 40,694 | 40,694 | ||||||||||||
|
Loans, net of allowance for loan losses
|
1,057,209 | 1,066,125 | 1,013,680 | 1,028,332 | ||||||||||||
|
Loans held for sale
|
6,583 | 6,583 | 2,857 | 2,857 | ||||||||||||
|
Financial liabilities:
|
||||||||||||||||
|
Retail deposits
|
$ | 2,134,428 | $ | 2,138,587 | $ | 1,870,421 | $ | 1,877,145 | ||||||||
|
Federal funds purchased and repurchase agreements
|
3,844 | 3,844 | 13,325 | 13,325 | ||||||||||||
|
FHLB advances
|
562,573 | 578,561 | 854,870 | 873,917 | ||||||||||||
|
Long-term debt
|
60,311 | 50,673 | 60,311 | 35,192 | ||||||||||||
As discussed earlier, the fair value estimate of financial instruments for which quoted market prices are unavailable is dependent upon the assumptions used. Consequently, those estimates cannot be substantiated by comparison to independent markets and, in many cases, could not be realized in immediate settlement of the instruments. Accordingly, the aggregate fair value amounts presented in the above fair value table do not necessarily represent their underlying value.
The estimated fair value of our commitments to extend credit, credit card arrangements and letters of credit, was not material at December 31, 2010 or 2009.
14. SHAREHOLDERS' EQUITY
Cash dividends declared and paid were $0.85, $0.75 and $0.60 per share for the years ended December 31, 2010, 2009 and 2008, respectively. Future dividends will depend on our earnings, financial condition and other factors which the board of directors considers to be relevant. Our dividend policy requires that any cash dividend payments made may not exceed consolidated earnings for that year.
We are subject to various regulatory capital requirements administered by the federal banking agencies. Failure to meet minimum capital requirements can initiate certain mandatory and possibly additional discretionary actions by regulators that, if undertaken, could have a direct material effect on our financial statements. Under capital adequacy guidelines and the regulatory framework for prompt corrective action, we must meet specific capital guidelines that involve quantitative measures of our assets, liabilities, and certain off-balance-sheet items as calculated under regulatory accounting practices. Our capital amounts and classification are also subject to qualitative judgments by the regulators regarding components, risk weightings, and other factors.
Quantitative measures established by regulation to ensure capital adequacy require us to maintain minimum amounts and ratios (set forth in the table below) of Total and Tier 1 Capital (as defined in the regulations) to risk-weighted assets (as defined), and of Tier 1 Capital (as defined) to average assets (as defined). At December 31, 2010, we exceeded all regulatory minimum capital requirements.
125
In addition, for a depository institution to be considered “well capitalized” under the regulatory framework for prompt corrective action, its Tier 1 and Total Capital ratios must be at least 6.0% and 10.0% on a risk-adjusted basis, respectively and its leverage ratio must be at least 5.0%.
As of December 31, 2010, the most recent notification from the FDIC categorized us as well capitalized under the regulatory framework for prompt corrective action. To be categorized as well capitalized we must maintain minimum Total risk-based, Tier 1 risk-based, and Tier 1 leverage ratios as set forth in the table. There are no conditions or events since that notification that management believes have changed our category.
126
|
Actual
|
For Capital Adequacy Purposes
|
To Be Well Capitalized Under Prompt Corrective Actions Provisions
|
||||||||||||||
|
Amount
|
Ratio
|
Amount
|
Ratio
|
Amount
|
Ratio
|
|||||||||||
|
As of December 31, 2010:
|
(dollars in thousands)
|
|||||||||||||||
|
Total Capital (to Risk Weighted Assets)
|
||||||||||||||||
|
Consolidated
|
$
|
274,175
|
21.09
|
%
|
$
|
103,981
|
8.00
|
%
|
N/A
|
N/A
|
||||||
|
Bank Only
|
$
|
263,186
|
20.27
|
%
|
$
|
103,882
|
8.00
|
%
|
$
|
129,853
|
10.00
|
%
|
||||
|
Tier 1 Capital (to Risk Weighted Assets)
|
||||||||||||||||
|
Consolidated
|
$
|
257,837
|
19.84
|
%
|
$
|
51,991
|
4.00
|
%
|
N/A
|
N/A
|
||||||
|
Bank Only
|
$
|
246,848
|
19.01
|
%
|
$
|
51,941
|
4.00
|
%
|
$
|
77,912
|
6.00
|
%
|
||||
|
Tier 1 Capital (to Average Assets) (1)
|
||||||||||||||||
|
Consolidated
|
$
|
257,837
|
8.45
|
%
|
$
|
122,026
|
4.00
|
%
|
N/A
|
N/A
|
||||||
|
Bank Only
|
$
|
246,848
|
8.10
|
%
|
$
|
121,893
|
4.00
|
%
|
$
|
152,367
|
5.00
|
%
|
||||
|
As of December 31, 2009:
|
||||||||||||||||
|
Total Capital (to Risk Weighted Assets)
|
||||||||||||||||
|
Consolidated
|
$
|
249,687
|
19.12
|
%
|
$
|
104,447
|
8.00
|
%
|
N/A
|
N/A
|
||||||
|
Bank Only
|
$
|
247,250
|
18.94
|
%
|
$
|
104,420
|
8.00
|
%
|
$
|
130,525
|
10.00
|
%
|
||||
|
Tier 1 Capital (to Risk Weighted Assets)
|
||||||||||||||||
|
Consolidated
|
$
|
233,278
|
17.87
|
%
|
$
|
52,224
|
4.00
|
%
|
N/A
|
N/A
|
||||||
|
Bank Only
|
$
|
230,841
|
17.69
|
%
|
$
|
52,210
|
4.00
|
%
|
$
|
78,315
|
6.00
|
%
|
||||
|
Tier 1 Capital (to Average Assets) (1)
|
||||||||||||||||
|
Consolidated
|
$
|
233,278
|
8.03
|
%
|
$
|
116,176
|
4.00
|
%
|
N/A
|
N/A
|
||||||
|
Bank Only
|
$
|
230,841
|
7.95
|
%
|
$
|
116,100
|
4.00
|
%
|
$
|
145,125
|
5.00
|
%
|
||||
(1) Refers to quarterly average assets as calculated by bank regulatory agencies.
Our payment of dividends is limited under regulation. The amount that can be paid in any calendar year without prior approval of our regulatory agencies cannot exceed the lesser of net profits (as defined) for that year plus the net profits for the preceding two calendar years, or retained earnings.
15. DIVIDEND REINVESTMENT AND COMMON STOCK REPURCHASE PLAN
We have a Dividend Reinvestment Plan funded by stock authorized but not yet issued. Proceeds from the sale of the common stock will be used for general corporate purposes and could be directed to our subsidiaries. For the year ended December 31, 2010, 67,978 shares were sold under this plan at an average price of $20.29 per share, reflective of other trades at the time of each sale. For the year ended December 31, 2009, 53,873 shares were sold under this plan at an average price of $21.09 per share, reflective of other trades at the time of each sale.
We instituted a Common Stock Repurchase Plan in late 1994. Under the repurchase plan, our board of directors establishes, on a quarterly basis, total dollar limitations and price per share for stock to be repurchased. Our board reviews this plan in conjunction with our capital needs and Southside Bank and may, at their discretion, modify or discontinue the plan. During 2010, 260,476 shares of common stock were purchased under this plan at a cost of $4.8 million. During 2009, no shares of common stock were purchased under this plan. During the years ended December 31, 2010 and 2009, outside of the board authorized repurchase plan, 1,101 and 30,691 shares were repurchased, respectively, in connection with the exercise of certain employee stock options at a cost of $24,000 and $430,000, respectively.
127
16. INCOME TAXES
The provisions for income taxes included in the accompanying statements of income consist of the following (in thousands):
|
Years Ended December 31,
|
||||||||||||
|
2010
|
2009
|
2008
|
||||||||||
|
Current tax provision
|
$
|
11,100
|
$
|
16,816
|
$
|
15,601
|
||||||
|
Deferred tax provision (benefit)
|
866
|
(207
|
)
|
(4,351
|
)
|
|||||||
|
Provision for tax expense charged to operations
|
$
|
11,966
|
$
|
16,609
|
$
|
11,250
|
||||||
The components of the net deferred tax asset as of December 31, 2010 and 2009 are summarized below (in thousands):
|
Assets
|
Liabilities
|
||||||||
|
Writedowns on OREO
|
$ | 58 | $ | ||||||
|
Allowance for loan losses
|
6,193 | ||||||||
|
Retirement and other benefit plans
|
(4,220 | ) | |||||||
|
Unrealized gains on securities available for sale
|
(4,688 | ) | |||||||
|
Premises and equipment
|
(1,007 | ) | |||||||
|
FHLB stock dividends
|
(12 | ) | |||||||
|
Other-than-temporary impairment losses
|
1,076 | ||||||||
|
Unfunded status of defined benefit plan
|
8,360 | ||||||||
|
State Business Tax Credit
|
709 | ||||||||
|
Other
|
208 | ||||||||
|
Gross deferred tax assets (liabilities)
|
16,604 | (9,927 | ) | ||||||
|
Net deferred tax asset at December 31, 2010
|
$ | 6,677 | |||||||
|
Writedowns on OREO
|
$ | 306 | $ | ||||||
|
Allowance for loan losses
|
5,977 | ||||||||
|
Retirement and other benefit plans
|
(4,069 | ) | |||||||
|
Unrealized gains on securities available for sale
|
(8,701 | ) | |||||||
|
Premises and equipment
|
(286 | ) | |||||||
|
FHLB stock dividends
|
(5 | ) | |||||||
|
Other-than-temporary impairment losses
|
1,050 | ||||||||
|
Unfunded status of defined benefit plan
|
6,424 | ||||||||
|
State Business Tax Credit
|
726 | ||||||||
|
Other
|
189 | ||||||||
|
Gross deferred tax assets (liabilities)
|
14,672 | (13,061 | ) | ||||||
|
Net deferred tax asset at December 31, 2009
|
$ | 1,611 | |||||||
A reconciliation of tax at statutory rates and total tax expense is as follows (dollars in thousands):
|
Years Ended December 31,
|
||||||||||||||||
|
2010
|
2009
|
2008
|
||||||||||||||
|
Amount
|
Percent of Pre-Tax Income
|
Amount
|
Percent of Pre-Tax Income
|
Amount
|
Percent of Pre-Tax Income
|
|||||||||||
|
Statutory Tax Expense
|
$
|
18,344
|
35.0
|
%
|
$
|
21,865
|
35.0
|
%
|
$
|
14,731
|
35.0
|
%
|
||||
|
Increase (Decrease) in Taxes from:
|
||||||||||||||||
|
Tax Exempt Interest
|
(6,323
|
)
|
(12.1
|
%)
|
(4,990
|
)
|
(8.0
|
%)
|
(3,589
|
)
|
(8.5
|
%)
|
||||
|
Increase in statutory rate
|
–
|
–
|
–
|
–
|
(33
|
)
|
(0.1
|
%)
|
||||||||
|
State Business Tax
|
91
|
0.2
|
%
|
86
|
0.1
|
%
|
10
|
0.0
|
%
|
|||||||
|
Other Net
|
(146
|
)
|
(0.3
|
%)
|
(352
|
)
|
(0.5
|
%)
|
131
|
0.3
|
%
|
|||||
|
Provision for Tax Expense Charged to Operations
|
$
|
11,966
|
22.8
|
%
|
$
|
16,609
|
26.6
|
%
|
$
|
11,250
|
26.7
|
%
|
||||
We file income tax returns in the U.S. federal jurisdiction. We are no longer subject to U.S. federal income tax examinations by tax authorities for years before 2007.
128
17. OFF-BALANCE-SHEET ARRANGEMENTS, COMMITMENTS AND CONTINGENCIES
Financial Instruments with Off-Balance-Sheet Risk. In the normal course of business, we are a party to certain financial instruments, with off-balance-sheet risk, to meet the financing needs of our customers. These off-balance-sheet instruments include commitments to extend credit and standby letters of credit. These instruments involve, to varying degrees, elements of credit and interest rate risk in excess of the amount reflected in the financial statements. The contract or notional amounts of these instruments reflect the extent of involvement and exposure to credit loss that we have in these particular classes of financial instruments.
Commitments to extend credit are agreements to lend to a customer provided that the terms established in the contract are met. Commitments generally have fixed expiration dates and may require payment of fees. Since some commitments are expected to expire without being drawn upon, the total commitment amounts do not necessarily represent future cash requirements. Standby letters of credit are conditional commitments issued to guarantee the performance of a customer to a third party. These guarantees are primarily issued to support public and private borrowing arrangements. The credit risk involved in issuing letters of credit is essentially the same as that involved in extending loan commitments to customers.
We had outstanding unused commitments to extend credit of $113.3 million and $118.7 million at December 31, 2010 and 2009, respectively. Each commitment has a maturity date and the commitment expires on that date with the exception of credit card and ready reserve commitments, which have no stated maturity date. Unused commitments for credit card and ready reserve at December 31, 2010 and 2009 were $11.5 million and $10.7 million, respectively, and are reflected in the due after one year category. We had outstanding standby letters of credit of $5.0 million and $5.2 million at December 31, 2010 and 2009, respectively.
The scheduled maturities of unused commitments as of December 31, 2010 and 2009 were as follows (in thousands):
|
December 31,
|
||||||||
|
2010
|
2009
|
|||||||
|
Unused commitments:
|
||||||||
|
Due in one year or less
|
$ | 64,984 | $ | 67,773 | ||||
|
Due after one year
|
48,267 | 50,898 | ||||||
|
Total
|
$ | 113,251 | $ | 118,671 | ||||
We apply the same credit policies in making commitments and standby letters of credit as we do for on-balance-sheet instruments. We evaluate each customer's credit worthiness on a case-by-case basis. The amount of collateral obtained, if deemed necessary, upon extension of credit is based on management's credit evaluation of the borrower. Collateral held varies but may include cash or cash equivalents, negotiable instruments, real estate, accounts receivable, inventory, oil, gas and mineral interests, property, plant, and equipment.
Lease Commitments. We lease certain branch facilities and office equipment under operating leases. Rent expense for branch facilities was $1.1 million, $1.1 million and $1.0 million for the years ended December 31, 2010, 2009 and 2008, respectively. Rent expense for leased equipment was $228,000, $222,000 and $198,000 for the years ended December 31, 2010, 2009 and 2008, respectively.
129
Future minimum rental commitments due under non-cancelable operating leases at December 31, 2010 were as follows (in thousands):
|
2011
|
$ | 1,202 | ||
|
2012
|
875 | |||
|
2013
|
652 | |||
|
2014
|
258 | |||
|
2015
|
126 | |||
|
Thereafter
|
14 | |||
| $ | 3,127 |
It is expected that certain leases will be renewed, or equipment replaced with new leased equipment, as these leases expire.
Securities. In the normal course of business we buy and sell securities. There were no unsettled trades to sell securities at December 31, 2010. There were $8.1 million of unsettled trades to sell securities at December 31, 2009. There were $145,000 of unsettled trades to purchase securities at December 31, 2010. There were $2.6 million of unsettled trades to purchase securities at December 31, 2009.
Deposits. There were $5.0 million of unsettled issuances of brokered CDs at December 31, 2010. There were $19.8 million of unsettled issuances of brokered CDs at December 31, 2009.
Litigation. We are involved with various litigation in the normal course of business. Management, after consulting with our legal counsel, believes that any liability resulting from litigation will not have a material effect on the financial position and results of operations and our liquidity.
18. SIGNIFICANT GROUP CONCENTRATIONS OF CREDIT RISK
Although we have a diversified loan portfolio, a significant portion of our loans are collateralized by real estate. Repayment of these loans is in part dependent upon the economic conditions in the market area. Part of the risk associated with real estate loans has been mitigated since 41.0% of this group represents loans collateralized by residential dwellings that are primarily owner occupied. Losses on this type of loan have historically been less than those on speculative properties. Many of the remaining real estate loans are collateralized primarily with owner occupied commercial real estate. The oil and gas industry remains a significant component of the East Texas economy and as such the health of the oil and gas industry has an effect on our business.
A significant portion of our loan portfolio is dependent on the medical community. Medical loan types include commercial loans and commercial real estate loans. Collateral for these loans varies depending on the type of loan and financial strength of the borrower. The primary source of repayment for loans in the medical community is cash flow from continuing operations. The medical community represents a concentration of risk in our Commercial loan and Commercial Real Estate loan portfolio. See “Item 1. Business – Market Area.” We believe that risk in the medical community is mitigated because it is spread among multiple practice types and multiple specialties. Should the government change the amount it pays the medical community through the various government health insurance programs or if new government regulation impacts the profitability of the medical community, the medical community could be adversely impacted which in turn could result in higher default rates by borrowers in the medical industry.
The mortgage-backed securities we hold consist exclusively of U.S. agency pass-through securities which are either directly or indirectly backed by the full faith and credit of the United States Government or guaranteed by GSEs. The GNMA mortgage-backed securities are backed by the full faith and credit of the United States Government and the Fannie Mae and Freddie Mac U.S. agency GSE guaranteed mortgage-backed securities are not backed by the full faith and credit of the United States government.
130
19. PARENT COMPANY FINANCIAL INFORMATION
Condensed financial information for Southside Bancshares, Inc. (parent company only) was as follows
(in thousands, except share amounts):
|
CONDENSED BALANCE SHEETS
|
December 31,
|
December 31,
|
||||||
|
2010
|
2009
|
|||||||
|
ASSETS
|
||||||||
|
Cash and due from banks
|
$ | 8,500 | $ | 873 | ||||
|
Investment in bank subsidiaries at equity in underlying net assets
|
259,602 | 255,607 | ||||||
|
Investment in nonbank subsidiaries at equity in underlying net assets
|
3,525 | 1,826 | ||||||
|
Other assets
|
3,377 | 4,399 | ||||||
|
TOTAL ASSETS
|
$ | 275,004 | $ | 262,705 | ||||
|
LIABILITIES
|
||||||||
|
Long-term debt
|
$ | 60,311 | $ | 60,311 | ||||
|
Other liabilities
|
370 | 613 | ||||||
|
TOTAL LIABILITIES
|
60,681 | 60,924 | ||||||
|
SHAREHOLDERS' EQUITY
|
||||||||
|
Common stock ($1.25 par, 40,000,000 shares authorized, 17,660,312 shares issued in 2010 and 16,742,835 shares issued in 2009)
|
22,075 | 20,928 | ||||||
|
Paid-in capital
|
162,877 | 146,357 | ||||||
|
Retained earnings
|
64,567 | 53,812 | ||||||
|
Treasury stock (2,023,838 and 1,762,261 shares at cost)
|
(28,377 | ) | (23,545 | ) | ||||
|
Accumulated other comprehensive (loss) income
|
(6,819 | ) | 4,229 | |||||
|
TOTAL SHAREHOLDERS' EQUITY
|
214,323 | 201,781 | ||||||
|
TOTAL LIABILITIES AND SHAREHOLDERS' EQUITY
|
$ | 275,004 | $ | 262,705 | ||||
CONDENSED STATEMENTS OF INCOME
|
Years Ended December 31,
|
||||||||||||
|
2010
|
2009
|
2008
|
||||||||||
|
INCOME
|
(in thousands)
|
|||||||||||
|
Dividends from subsidiary
|
$
|
28,000
|
$
|
11,000
|
$
|
6,000
|
||||||
|
Interest income
|
98
|
102
|
116
|
|||||||||
|
TOTAL INCOME
|
28,098
|
11,102
|
6,116
|
|||||||||
|
EXPENSE
|
||||||||||||
|
Interest expense
|
3,275
|
3,409
|
3,869
|
|||||||||
|
Other
|
1,775
|
1,378
|
1,556
|
|||||||||
|
TOTAL EXPENSE
|
5,050
|
4,787
|
5,425
|
|||||||||
|
Income before income tax expense
|
23,048
|
6,315
|
691
|
|||||||||
|
Income tax benefit
|
1,733
|
1,640
|
1,864
|
|||||||||
|
Income before equity in undistributed earnings of subsidiaries
|
24,781
|
7,955
|
2,555
|
|||||||||
|
Equity in undistributed earnings of subsidiaries
|
14,710
|
36,441
|
28,141
|
|||||||||
|
NET INCOME
|
$
|
39,491
|
$
|
44,396
|
$
|
30,696
|
||||||
131
CONDENSED STATEMENTS OF CASH FLOW
|
Years Ended December 31,
|
||||||||||||
|
2010
|
2009
|
2008
|
||||||||||
|
(in thousands)
|
||||||||||||
|
OPERATING ACTIVITIES:
|
||||||||||||
|
Net Income
|
$
|
39,491
|
$
|
44,396
|
$
|
30,696
|
||||||
|
Adjustments to reconcile net income to net cash provided by operations:
|
||||||||||||
|
Equity in undistributed earnings of subsidiaries
|
(14,710
|
)
|
(36,441
|
)
|
(28,141
|
)
|
||||||
|
Decrease (increase) in other assets
|
1,022
|
(844
|
)
|
(401
|
)
|
|||||||
|
(Decrease) increase in other liabilities
|
(243
|
)
|
265
|
(56
|
)
|
|||||||
|
Net cash provided by operating activities
|
25,560
|
7,376
|
2,098
|
|||||||||
|
INVESTING ACTIVITIES:
|
||||||||||||
|
Investment in subsidiaries
|
(1,701
|
)
|
1,226
|
–
|
||||||||
|
Net cash (used in) provided by investing activities
|
(1,701
|
)
|
1,226
|
–
|
||||||||
|
FINANCING ACTIVITIES:
|
||||||||||||
|
Purchase of common stock
|
(4,832
|
)
|
(430
|
)
|
(132
|
)
|
||||||
|
Proceeds from issuance of common stock
|
1,823
|
2,300
|
2,084
|
|||||||||
|
Dividends paid
|
(13,223
|
)
|
(11,078
|
)
|
(8,265
|
)
|
||||||
|
Net cash used in financing activities
|
(16,232
|
)
|
(9,208
|
)
|
(6,313
|
)
|
||||||
|
Net increase (decrease) in cash and cash equivalents
|
7,627
|
(606
|
)
|
(4,215
|
)
|
|||||||
|
Cash and cash equivalents at beginning of year
|
873
|
1,479
|
5,694
|
|||||||||
|
Cash and cash equivalents at end of year
|
$
|
8,500
|
$
|
873
|
$
|
1,479
|
||||||
132
|
20.
|
QUARTERLY FINANCIAL INFORMATION OF REGISTRANT
|
|
|
NOTES TO CONSOLIDATED FINANCIAL STATEMENTS
|
|
|
(UNAUDITED)
|
|
|
(in thousands, except per share data)
|
|
2010
|
||||||||||||||||
|
Fourth
|
Third
|
Second
|
First
|
|||||||||||||
|
Quarter
|
Quarter
|
Quarter
|
Quarter
|
|||||||||||||
|
Interest income
|
$ | 32,809 | $ | 32,753 | $ | 30,825 | $ | 34,987 | ||||||||
|
Interest expense
|
10,477 | 11,464 | 11,455 | 11,911 | ||||||||||||
|
Net interest income
|
22,332 | 21,289 | 19,370 | 23,076 | ||||||||||||
|
Provision for loan losses
|
4,409 | 3,201 | 2,260 | 3,867 | ||||||||||||
|
Noninterest income
|
9,175 | 14,678 | 13,170 | 14,373 | ||||||||||||
|
Noninterest expense
|
18,228 | 17,655 | 17,979 | 17,452 | ||||||||||||
|
Income before income tax expense
|
8,870 | 15,111 | 12,301 | 16,130 | ||||||||||||
|
Provision for income tax expense
|
1,670 | 3,811 | 2,530 | 3,955 | ||||||||||||
|
Net income
|
7,200 | 11,300 | 9,771 | 12,175 | ||||||||||||
|
Less: Net (income) loss attributable to the noncontrolling interest
|
346 | (252 | ) | (519 | ) | (530 | ) | |||||||||
|
Net income attributable to Southside Bancshares, Inc.
|
7,546 | 11,048 | 9,252 | 11,645 | ||||||||||||
|
Earnings per common share
|
||||||||||||||||
|
Basic
|
$ | 0.49 | $ | 0.70 | $ | 0.58 | $ | 0.74 | ||||||||
|
Diluted
|
$ | 0.49 | $ | 0.70 | $ | 0.58 | $ | 0.74 | ||||||||
|
2009
|
||||||||||||||||
|
Fourth
|
Third
|
Second
|
First
|
|||||||||||||
|
Quarter
|
Quarter
|
Quarter
|
Quarter
|
|||||||||||||
|
Interest income
|
$ | 37,407 | $ | 35,399 | $ | 35,727 | $ | 36,660 | ||||||||
|
Interest expense
|
12,241 | 12,736 | 13,272 | 14,423 | ||||||||||||
|
Net interest income
|
25,166 | 22,663 | 22,455 | 22,237 | ||||||||||||
|
Provision for loan losses
|
5,113 | 2,973 | 3,417 | 3,590 | ||||||||||||
|
Noninterest income
|
12,854 | 12,513 | 12,393 | 18,914 | ||||||||||||
|
Noninterest expense
|
19,074 | 17,751 | 18,288 | 16,517 | ||||||||||||
|
Income before income tax expense
|
13,833 | 14,452 | 13,143 | 21,044 | ||||||||||||
|
Provision for income tax expense
|
3,588 | 3,620 | 3,255 | 6,146 | ||||||||||||
|
Net income
|
10,245 | 10,832 | 9,888 | 14,898 | ||||||||||||
|
Less: Net (income) loss attributable to the noncontrolling interest
|
132 | (335 | ) | (511 | ) | (753 | ) | |||||||||
|
Net income attributable to Southside Bancshares, Inc.
|
10,377 | 10,497 | 9,377 | 14,145 | ||||||||||||
|
Earnings per common share
|
||||||||||||||||
|
Basic
|
$ | 0.66 | $ | 0.67 | $ | 0.60 | $ | 0.91 | ||||||||
|
Diluted
|
$ | 0.66 | $ | 0.66 | $ | 0.60 | $ | 0.90 | ||||||||
133