Attached files
|
UNITED STATES
|
|
|
SECURITIES AND EXCHANGE COMMISSION
|
|
|
Washington, D.C. 20549
|
|
|
FORM 10-K
|
|
|
|
|
|
X Annual Report Pursuant to Section 13 or 15(d) of the Securities and Exchange Act of 1934:
|
|
|
For the fiscal year ended December 31, 2010
|
|
|
Commission file number 1-31763
|
|
|
KRONOS WORLDWIDE, INC.
|
|
|
(Exact name of Registrant as specified in its charter)
|
|
|
DELAWARE
|
76-0294959
|
|
(State or other jurisdiction of
incorporation or organization)
|
(IRS Employer Identification No.)
|
|
|
|
|
5430 LBJ Freeway, Suite 1700
|
|
|
Dallas, Texas 75240-2697
|
|
|
(Address of principal executive offices)
|
|
|
Registrant's telephone number, including area code: (972) 233-1700
|
|
|
Securities registered pursuant to Section 12(b) of the Act:
|
|
|
Title of each class
|
Name of each exchange on
which registered
|
|
Common stock
($.01 par value)
|
New York Stock Exchange
|
No securities are registered pursuant to Section 12(g) of the Act.
Indicate by check mark:
If the Registrant is a well-known seasoned issuer, as defined in Rule 405 of the Securities Act. Yes No X
If the Registrant is not required to file reports pursuant to Section 13 or Section 15(d) of the Act. Yes No X
Whether the Registrant (1) has filed all reports required to be filed by Section 13 or 15(d) of the Securities Exchange Act of 1934 during the preceding 12 months and (2) has been subject to such filing requirements for the past 90 days. Yes X No
Whether the registrant has submitted electronically and posted on its corporate Website, if any, every Interactive Data File required to be submitted and posted pursuant to Rule 405 of Regulation S-T during the preceding 12 months (or for such shorter period that the registrant was required to submit and post such files).* Yes No _
|
*
|
The registrant has not yet been phased into the interactive data requirements.
|
If disclosure of delinquent filers pursuant to Item 405 of Regulation S-K is not contained herein, and will not be contained, to the best of Registrant's knowledge, in definitive proxy or information statements incorporated by reference in Part III of this Form 10-K or any amendment to this Form 10-K. Yes No X
Whether the Registrant is a large accelerated filer, an accelerated filer, a non-accelerated filer or a smaller reporting company (as defined in Rule 12b-2 of the Act). Large accelerated filer Accelerated filer Non-accelerated filer X Smaller reporting company
Whether the Registrant is a shell company (as defined in Rule 12b-2 of the Act). Yes No X
The aggregate market value of the 2.0 million shares of voting stock held by nonaffiliates of Kronos Worldwide, Inc. as of June 30, 2010 (the last business day of the Registrant's most recently-completed second fiscal quarter) approximated $38.8 million.
As of February 28, 2011, 57,947,549 shares of the Registrant's common stock were outstanding.
Documents incorporated by reference
The information required by Part III is incorporated by reference from the Registrant's definitive proxy statement to be filed with the Commission pursuant to Regulation 14A not later than 120 days after the end of the fiscal year covered by this report.
- 1 -
Forward-Looking Information
This Annual Report on Form 10-K contains forward-looking statements within the meaning of the Private Securities Litigation Reform Act of 1995, as amended. Statements in this Annual Report that are not historical facts are forward-looking in nature and represent management’s beliefs and assumptions based on currently available information. In some cases, you can identify forward-looking statements by the use of words such as "believes," "intends," "may," "should," "could," "anticipates," "expects" or comparable terminology, or by discussions of strategies or trends. Although we believe that the expectations reflected in such forward-looking statements are reasonable, we do not know if these expectations will be correct. Such statements by their nature involve substantial risks and uncertainties that could significantly impact expected results. Actual future results could differ materially from those predicted. The factors that could cause actual future results to differ materially from those described herein are the risks and uncertainties discussed in this Annual Report and those described from time to time in our other filings with the SEC include, but are not limited to, the following:
|
·
|
Future supply and demand for our products
|
|
·
|
The extent of the dependence of certain of our businesses on certain market sectors
|
|
·
|
The cyclicality of our businesses
|
|
·
|
Changes in raw material and other operating costs (such as energy and ore costs)
|
|
·
|
Changes in the availability of raw materials (such as ore)
|
|
·
|
General global economic and political conditions (such as changes in the level of gross domestic product in various regions of the world and the impact of such changes on demand for TiO2)
|
|
·
|
Competitive products and substitute products
|
|
·
|
Customer and competitor strategies
|
|
·
|
Potential consolidation of our competitors
|
|
·
|
The impact of pricing and production decisions
|
|
·
|
Competitive technology positions
|
|
·
|
The introduction of trade barriers
|
|
·
|
Possible disruption of our business or increases in the cost of doing business resulting from terrorist activities or global conflicts
|
|
·
|
Fluctuations in currency exchange rates (such as changes in the exchange rate between the U.S. dollar and each of the euro, the Norwegian krone and the Canadian dollar)
|
|
·
|
Operating interruptions (including, but not limited to, labor disputes, leaks, natural disasters, fires, explosions, unscheduled or unplanned downtime and transportation interruptions)
|
|
·
|
Our ability to renew or refinance credit facilities
|
|
·
|
Our ability to maintain sufficient liquidity
|
|
·
|
The ultimate outcome of income tax audits, tax settlement initiatives or other tax matters
|
|
·
|
Our ability to utilize income tax attributes, the benefits of which have been recognized under the more-likely-than-not recognition criteria
|
|
·
|
Environmental matters (such as those requiring compliance with emission and discharge standards for existing and new facilities)
|
|
·
|
Government laws and regulations and possible changes therein
|
|
·
|
The ultimate resolution of pending litigation (such as the class action described under “Item 3. Legal Proceedings”)
|
|
·
|
Possible future litigation
|
Should one or more of these risks materialize (or the consequences of such a development worsen), or should the underlying assumptions prove incorrect, actual results could differ materially from those forecasted or expected. We disclaim any intention or obligation to update or revise any forward-looking statements whether as a result of changes in information, future events or otherwise.
- 2 -
PART I
ITEM 1. BUSINESS
General
Kronos Worldwide, Inc. (NYSE: KRO) (Kronos), a Delaware corporation, is a leading global producer and marketer of value-added titanium dioxide pigments ("TiO2"), a base industrial product used in a wide range of applications. We, along with our distributors and agents, sell and provide technical services for our products to over 4,000 customers in approximately 100 countries with the majority of sales in Europe and North America. We believe we have developed considerable expertise and efficiency in the manufacture, sale, shipment and service of our products in domestic and international markets.
TiO2 is a white inorganic pigment used in a wide range of products for its exceptional ability to impart whiteness, brightness, opacity and durability. TiO2 is a critical component of everyday applications, such as coatings, plastics and paper, as well as many specialty products such as inks, food and cosmetics. TiO2 is widely considered to be superior to alternative white pigments in large part due to its hiding power (or opacity), which is the ability to cover or mask other materials effectively and efficiently. TiO2 is designed, marketed and sold based on specific end-use applications.
TiO2 is the largest commercially used whitening pigment because it has a high refractive rating giving it more hiding power than any other commercially produced white pigment. In addition, TiO2 has excellent resistance to interaction with other chemicals, good thermal stability and resistance to ultraviolet degradation. Although there are other white pigments on the market, we believe there are no effective substitutes for TiO2 because no other white pigment has the physical properties for achieving comparable opacity and brightness or can be incorporated in as cost-effective a manner. Pigment extenders such as kaolin clays, calcium carbonate and polymeric opacifiers are used in a number of end-use markets as white pigments. However, these products are not able to duplicate the opacity performance characteristics of TiO2 and we believe these products are unlikely to have a significant impact on the use of TiO2.
TiO2 is considered a “quality-of-life” product. Demand for TiO2 has generally been driven by worldwide gross domestic product and has generally increased with rising standards of living in various regions of the world. According to industry estimates, TiO2 consumption, excluding China, has grown at a compound annual growth rate of approximately 2.6% since 1990. Per capita consumption of TiO2 in the United States and Western Europe far exceeds that in other areas of the world, and these regions are expected to continue to be the largest consumers of TiO2. We believe that North America and Western Europe account for approximately 24% and 33% of global TiO2 consumption, respectively. Markets for TiO2 are increasing in South America, Eastern Europe, the Far East and China and we believe they will become significant as economies in these regions continue to develop and quality-of-life products, including TiO2, experience greater demand.
- 3 -
In recent years, global production capacity for TiO2 has modestly increased primarily due to debottlenecking existing chloride production facilities. However, during 2008 and 2009, several TiO2 manufacturers permanently reduced capacity at high operating cost facilities in Europe, North America and China, in part in connection with environmental-related issues. Decreased capacity, along with the decline in customer inventories which occurred in the first half of 2009, led to industry-wide tightness in TiO2 inventories. As a result of these factors, TiO2 selling prices began to increase in the second half of 2009 and continued to increase during 2010. Further increases in TiO2 selling prices are expected to be implemented in 2011. We believe the decreased capacity, higher demand and improved pricing should result in improved operating rates and product margins for TiO2 producers.
At December 31, 2010, approximately 50% of our common stock was owned by Valhi, Inc. (NYSE: VHI) and approximately 30% was owned by NL Industries, Inc. (NYSE: NL). Valhi also owns approximately 83% of NL Industries’ outstanding common stock. Subsidiaries of Contran Corporation held approximately 94% of Valhi’s outstanding common stock. Substantially all of Contran Corporation’s outstanding voting stock is held by trusts established for the benefit of certain descendants of Harold C. Simmons (of which Mr. Simmons is trustee), or is held by persons or other entities related to Mr. Simmons. Consequently, Mr. Simmons may be deemed to control all of these companies.
Products and End-Use Markets
We, including our predecessors, have produced and marketed TiO2 in North America and Europe, our primary markets, for over 80 years. In Europe and North America, we estimate our current market share at 22% and 19%, respectively. We believe we are the largest producer of TiO2 in Europe with approximately one-half of our sales volumes attributable to markets in Europe. The table below shows our market share for our significant markets, Europe and North America, for the last three years.
|
2008
|
2009
|
2010
|
|
|
Europe
|
19%
|
19%
|
22%
|
|
North America
|
16%
|
16%
|
19%
|
We believe we are the leading seller of TiO2 in several countries, including Germany, with an estimated 14% share of worldwide TiO2 sales volume in 2010. Overall, we are the world’s third-largest producer of TiO2.
We offer our customers a broad portfolio of products that include over 40 different TiO2 pigment grades under the Kronos® trademark which provide a variety of performance properties to meet customers’ specific requirements. Our major customers include domestic and international paint, plastics and paper manufacturers. We ship TiO2 to our customers in either a powder or slurry form via rail, truck or ocean carrier. Sales of our core TiO2 pigments represented approximately 90% of our net sales in 2010. We and our agents and distributors primarily sell and provide technical services for our products in three major end-use markets: coatings, plastics and paper. The following tables show our approximate sales volume by geographic region and end use for the year ending December 31, 2010:
|
Sales Volumes Percentages
by Geographic Region
|
Sales Volumes Percentages
by End Use
|
|||
|
Europe
|
53%
|
Coatings
|
52%
|
|
|
North America
|
33%
|
Plastics
|
35%
|
|
|
Asia Pacific
|
10%
|
Other
|
8%
|
|
|
Rest of World
|
4%
|
Paper
|
5%
|
|
- 4 -
Some of the principal applications for our products include the following:
TiO2 for Coatings. Our TiO2 is used to provide opacity, durability, tinting strength and brightness in industrial coatings, as well as coatings for home interiors and exteriors, automobiles, aircraft, machines, appliances, traffic paint and other special purpose coatings. The amount of TiO2 used in coatings varies widely depending on the opacity, color and quality desired. Generally, the higher the opacity requirement of the coating, the greater the TiO2 content.
TiO2 for Plastics. We produce TiO2 pigments that improve the optical and physical properties in plastics, including whiteness and opacity. TiO2 is used to provide opacity in items such as containers and packaging materials, and vinyl products such as windows, door profiles and siding. TiO2 also generally provides hiding power, neutral undertone, brightness and surface durability for housewares, appliances, toys, computer cases and food packages. TiO2’s high brightness along with its opacity, is used in some engineering plastics to help mask their undesirable natural color. TiO2 is also used in masterbatch, which is a concentrate of TiO2 and other additives and is one of the largest uses for TiO2 in the plastics end-use market. In masterbatch, the TiO2 is dispersed at high concentrations into a plastic resin and is then used by manufacturers of plastic containers, bottles and packaging and agricultural films.
TiO2 for Paper. Our TiO2 is used in the production of several types of paper, including laminate (decorative) paper, filled paper and coated paper, to provide whiteness, brightness, opacity and color stability. Although we sell our TiO2 to all segments of the paper end-use market, our primary focus is on the TiO2 grades used in paper laminates, where several layers of paper are laminated together using melamine resin under high temperature and pressure. The top layer of paper contains TiO2 and is the layer that is printed with decorative patterns. Paper laminates are used to replace materials such as wood and tile for such applications as counter tops, furniture and wallboard. TiO2 is beneficial in these applications because it assists in preventing the material from fading or changing color after prolonged exposure to sunlight and other weathering agents.
TiO2 for Other Applications. We produce TiO2 to improve the opacity and hiding power of printing inks. TiO2 allows inks to achieve very high print quality while not interfering with the technical requirements of printing machinery, including low abrasion, high printing speed and high temperatures. Our TiO2 is also used in textile applications where TiO2 functions as an opacifying and delustering agent. In man-made fibers such as rayon and polyester, TiO2 corrects an otherwise undesirable glossy and translucent appearance. Without the presence of TiO2, these materials would be unsuitable for use in many textile applications.
We produce high purity sulfate process anatase TiO2 used to provide opacity, whiteness and brightness in a variety of cosmetic and personal care products, such as skin cream, lipstick, eye shadow and toothpaste. Our TiO2 is also found in food products, such as candy and confectionaries, and in pet foods where it is used to obtain uniformity of color and appearance. In pharmaceuticals, our TiO2 is used commonly as a colorant in pill and capsule coatings as well as in liquid medicines to provide uniformity of color and appearance. Kronos® purified anatase grades meet the applicable requirements of the CTFA (Cosmetics, Toiletries and Fragrances Association), USP and BP (United States Pharmacopoeia and British Pharmacopoeia) and the FDA (United States Food and Drug Administration).
- 5 -
Our TiO2 business is enhanced by the following three complementary businesses, which comprised approximately 10% of our net sales in 2010:
|
·
|
We own and operate two ilmenite mines in Norway pursuant to a governmental concession with an unlimited term. We commenced production from our second mine in 2009. Ilmenite is a raw material used directly as a feedstock by some sulfate-process TiO2 plants. We believe we have a significant competitive advantage because our mines supply our feedstock requirements for all of our European sulfate-process plants. We also sell ilmenite ore to third-parties, some of whom are our competitors. The mines have estimated ilmenite reserves that are expected to last at least 60 years.
|
|
·
|
We manufacture and sell iron-based chemicals, which are co-products and processed co-products of the sulfate and chloride process TiO2 pigment production. These co-product chemicals are marketed through our Ecochem division and are primarily used as treatment and conditioning agents for industrial effluents and municipal wastewater as well as in the manufacture of iron pigments, cement and agricultural products.
|
|
·
|
We manufacture and sell titanium oxychloride and titanyl sulfate, which are side-stream specialty products from the production of TiO2. Titanium oxychloride is used in specialty applications in the formulation of pearlescent pigments, production of electroceramic capacitors for cell phones and other electronic devices. Titanyl sulfate productions are used in pearlescent pigments, natural gas pipe and other specialty applications.
|
Manufacturing, Operations and Properties
We produce TiO2 in two crystalline forms: rutile and anatase. Rutile TiO2 is manufactured using both a chloride production process and a sulfate production process, whereas anatase TiO2 is only produced using a sulfate production process. Many end-use applications can use either form, especially during periods of TiO2 supply tightness such as we are currently experiencing. The chloride process is the preferred form for use in coatings and plastics, the two largest end-use markets. Due to environmental factors and customer considerations, the proportion of TiO2 industry sales represented by chloride process pigments has increased relative to sulfate process pigments and, in 2010, chloride process production facilities represented approximately 60% of industry capacity. The sulfate process represents a much smaller percentage of annual global TiO2 production and is preferred for use in selected paper products, ceramics, rubber tires, man-made fibers, food and cosmetics. Once an intermediate TiO2 pigment has been produced by either the chloride or sulfate process, it is “finished” into products with specific performance characteristics for particular end-use applications through proprietary processes involving various chemical surface treatments and intensive micronizing (milling).
|
·
|
Chloride Process. The chloride process is a continuous process in which chlorine is used to extract rutile TiO2. The chloride process typically has lower manufacturing costs than the sulfate process due to higher yield, less waste, lower energy requirements and lower labor costs. This process has also gained market share over the sulfate process because of the relatively lower upfront capital investment in plant and equipment required. The chloride process produces less waste than the sulfate process because much of the chlorine is recycled and feedstock bearing higher titanium content is used. The chloride process produces an intermediate base pigment with a wide range of properties.
|
|
·
|
Sulfate Process. The Sulfate process is a batch process in which sulfuric acid is used to extract the TiO2 from ilmenite or titanium slag. After separation from the impurities in the ore (mainly iron) the TiO2 is precipitated and calcined to form an intermediate base pigment ready for sale or can be upgraded through finishing treatment.
|
- 6 -
We produced 524,000 metric tons of TiO2 in 2010, up from the 402,000 metric tons we produced in 2009. Such production amounts include our 50% interest in the TiO2 manufacturing joint-venture discussed below. Our average production capacity utilization rates were near full capacity in 2008 and 2010 and approximately 76% in 2009. In late 2008, and as a result of the sharp decline in global demand, we experienced a build up in our inventory levels. In order to decrease our inventory levels and improve our liquidity, we implemented production curtailments during the first half of 2009. Consequently, our average production capacity utilization rates were approximately 58% during the first half of 2009 as compared to 94% during the second half of 2009.
We operate four TiO2 plants in Europe (one in each of Leverkusen, Germany; Nordenham, Germany; Langerbrugge, Belgium; and Fredrikstad, Norway). In North America, we have a TiO2 plant in Varennes, Quebec, Canada and, through the manufacturing joint venture described below in “TiO2 Manufacturing Joint Venture,” a 50% interest in a TiO2 plant in Lake Charles, Louisiana.
Our production capacity in 2010 was 532,000 metric tons, approximately three-fourths of which was from the chloride production process. The following table presents the division of our 2010 manufacturing capacity by plant location and type of manufacturing process:
|
% of Capacity by TiO2 Manufacturing Process
|
|||||||||
|
Facility
|
Description
|
Chloride
|
Sulfate
|
||||||
|
Leverkusen, Germany (1)
|
TiO2 production, chloride and sulfate process, co-products
|
41 | % | 26 | % | ||||
|
Nordenham, Germany
|
TiO2 production, sulfate process, co-products
|
- | 40 | ||||||
|
Langerbrugge, Belgium
|
TiO2 production, chloride process, co-products, titanium chemicals products
|
20 | - | ||||||
|
Fredrikstad, Norway (2)
|
TiO2 production, sulfate process, co-products
|
- | 20 | ||||||
|
Varennes, Canada
|
TiO2 production, chloride and sulfate process, slurry facility, titanium chemicals products
|
20 | 14 | ||||||
|
Lake Charles, Louisiana (3)
|
TiO2 production, chloride process
|
19 | - | ||||||
|
Total
|
100 | % | 100 | % | |||||
- 7 -
|
|
(1)
|
The Leverkusen facility is located within an extensive manufacturing complex owned by Bayer AG. We own the Leverkusen facility, which represents about one-third of our current TiO2 production capacity, but we lease the land under the facility from Bayer under a long term agreement which expires in 2050. Lease payments are periodically negotiated with Bayer for periods of at least two years at a time. Bayer or its affiliates provides some raw materials including chlorine, auxiliary and operating materials, utilities and services necessary to operate the Leverkusen facility under separate supplies and services agreements.
|
|
|
(2)
|
The Fredrikstad plant is located on public land and is leased until April 2013 with an option to extend the lease for an additional 50 years.
|
|
|
(3)
|
We operate this facility in a 50/50 joint venture with Tioxide Americas Inc., a subsidiary of Huntsman Corporation. See Note 5 to our Consolidated Financial Statements and “TiO2 Manufacturing Joint Venture.”
|
We own the land underlying all of our principle production facilities unless otherwise indicated in the table above.
Our production capacity has increased by approximately 30% over the past ten years due to debottlenecking programs, with only moderate capital expenditures. We believe that our annual attainable production capacity for 2011 is approximately 532,000 metric tons and we currently expect we will operate at near full production capacity for the year.
We also operate two ilmenite mines in Norway pursuant to a governmental concession with an unlimited term. In addition, we operate a rutile slurry manufacturing plant in Lake Charles, Louisiana, which converts dry pigment manufactured at the Lake Charles TiO2 facility into a slurry form that is then shipped to customers.
We have various corporate and administrative offices located in the U.S., Germany, Norway, Canada and Belgium and various sales offices located in the U.S., Canada, Belgium, France, the Netherlands and the U.K.
TiO2 Manufacturing Joint Venture
Kronos Louisiana, Inc., one of our subsidiaries, and a subsidiary of Huntsman Corporation each own a 50% interest in a manufacturing joint venture, Louisiana Pigment Company, L.P., or LPC. LPC owns and operates a chloride-process TiO2 plant located in Lake Charles, Louisiana. We and Huntsman share production from the plant equally pursuant to separate offtake agreements.
A supervisory committee directs the business and affairs of the joint venture, including production and output decisions. This committee is composed of four members, two of whom we appoint and two of whom Huntsman appoints. Two general managers manage the operations of the joint venture acting under the direction of the supervisory committee. We appoint one general manager and Huntsman appoints the other.
We are required to purchase one-half of the TiO2 produced by the joint venture. The joint venture is not consolidated in our financial statements, because we do not control it. We account for our interest in the joint venture by the equity method. The joint venture operates on a break-even basis and therefore we do not have any equity in earnings of the joint venture. We share all costs and capital expenditures equally with Huntsman with the exception of raw material and packaging costs for the pigment grades produced. Our share of net costs is reported as cost of sales as the TiO2 is sold. See Notes 5 and 14 to our Consolidated Financial Statements.
- 8 -
Raw Materials
The primary raw materials used in chloride process TiO2 are titanium-containing feedstock (natural rutile ore or purchased slag), chlorine and coke. Chlorine is available from a number of suppliers, while petroleum coke is available from a limited number of suppliers. Titanium-containing feedstock suitable for use in the chloride process is available from a limited but increasing number of suppliers principally in Australia, South Africa, Canada, India and the United States. We purchase chloride process grade slag from Rio Tinto Iron and Titanium under a long-term supply contract that expires at the end of 2011 and from Exxaro TSA Sands (PTY) LTD under a supply contract that expires in December 2013. We purchase upgraded slag from Q.I.T. Fer et Titane Inc. (a subsidiary of Rio Tinto Iron and Titanium) under a long-term supply contract that expires at the end of 2015. We purchase natural rutile ore primarily from Iluka Resources, Limited under contracts that expire at the end of 2011. In the past we have been, and we expect in the future, we will continue to be, successful in obtaining long-term extensions to these and other existing supply contracts prior to their expiration. We expect the raw materials purchased under these contracts to meet our chloride process feedstock requirements over the next several years.
The primary raw materials used in sulfate process TiO2 are titanium-containing feedstock, primarily ilmenite or purchased sulfate grade slag and sulfuric acid. Sulfuric acid is available from a number of suppliers. Titanium-containing feedstock suitable for use in the sulfate process is available from a limited number of suppliers principally in Norway, Canada, Australia, India and South Africa. As one of the few vertically-integrated producers of sulfate process TiO2, we operate two rock ilmenite mines in Norway, which provided all of the feedstock for our European sulfate process TiO2 plants in 2010. We expect ilmenite production from our mines to meet our European sulfate process feedstock requirements for the foreseeable future. For our Canadian sulfate process plant, we also purchase sulfate grade slag primarily from Q.I.T. Fer et Titane Inc. (a subsidiary of Rio Tinto Iron and Titanium), under a long-term supply contract that expires at the end of 2014. We expect the raw materials purchased under these contracts to meet our sulfate process feedstock requirements over the next several years.
Many of our raw material contracts contain fixed quantities we are required to purchase, although these contracts allow for an upward or downward adjustment in the quantity purchased. The pricing under these agreements is generally negotiated annually.
The following table summarizes our raw materials purchased or mined in 2010.
|
Production Process/Raw Material
|
Raw Materials Procured or Mined
|
|
(In thousands of metric tons)
|
|
|
Chloride process plants:
|
|
|
Purchased slag or natural rutile ore
|
439
|
|
Sulfate process plants:
|
|
|
Ilmenite ore mined and used internally
|
328
|
|
Purchased slag
|
31
|
- 9 -
Sales and Marketing
Our marketing strategy is aimed at developing and maintaining strong customer relationships with new and existing accounts. Because TiO2 represents a significant raw material cost for our customers, the purchasing decisions are often made by our customers’ senior management. We work to maintain close relationships with the key decision makers, through in-depth frequent in-person meetings. We endeavor to extend these commercial and technical relationships to multiple levels within our customers’ organization using our direct sales force and technical service group to accomplish this objective. We believe this has helped build customer loyalty to Kronos and strengthen our competitive position. Close cooperation and strong customer relationships enable us to stay closely attuned to trends in our customers’ businesses. Where appropriate, we work in conjunction with our customers to solve formulation or application problems by modifying specific product properties or developing new pigment grades. We also focus our sales and marketing efforts on those geographic and end-use market segments where we believe we can realize higher selling prices. This focus includes continuously reviewing and optimizing our customer and product portfolios.
Our marketing strategy is also aimed at working directly with customers to monitor the success of our products in their end-use applications, evaluate the need for improvements in product and process technology and identify opportunities to develop new product solutions for our customers. Our marketing staff closely coordinates with our sales force and technical specialists to ensure that the needs of our customers are met, and to help develop and commercialize new grades where appropriate.
We sell a majority of our products through our direct sales force operating from six sales offices in Europe and one sales office in North America. We also utilize sales agents and distributors who are authorized to sell our products in specific geographic areas. In Europe, our sales efforts are conducted primarily through our direct sales force and our sales agents. Our agents do not sell any TiO2 products other than Kronos® brand products. In North America, our sales are made primarily through our direct sales force and supported by a network of distributors. In addition to our direct sales force and sales agents, many of our sales agents also act as distributors to service our smaller customers in all regions. We offer the same high level of customer and technical service to the customers who purchase our products through distributors as we offer to our larger customers serviced by our direct sales force.
We sell to a diverse customer base and no single customer made up more than 10% of our sales for 2010. Our largest ten customers accounted for approximately 27% of sales in 2010.
Neither our business as a whole nor that of any of our principal product groups is seasonal to any significant extent. However, TiO2 sales are generally higher in the second and third quarters of the year, due in part to the increase in paint production in the spring to meet demand during the spring and summer painting seasons. We have historically operated our production facilities at near full capacity rates throughout the entire year, which among other things helps to minimize our per-unit production costs. As a result, we normally will build inventories during the first and fourth quarters of each year, in order to maximize our product availability during the higher demand periods normally experienced in the second and third quarters.
- 10 -
Competition
The TiO2 industry is highly competitive. We compete primarily on the basis of price, product quality, technical service and the availability of high performance pigment grades. Since TiO2 is not a traded commodity, its pricing is largely a product of negotiation between suppliers and their respective customers. Although certain TiO2 grades are considered specialty pigments, the majority of our grades and substantially all of our production are considered commodity pigments with price and availability being the most significant competitive factors along with quality and customer service. During 2010, we had an estimated 14% share of worldwide TiO2 sales volume, and based on sales volumes, we believe we are the leading seller of TiO2 in several countries, including Germany.
Our principal competitors are E.I. du Pont de Nemours & Co., or Dupont; Millennium Inorganic Chemicals, Inc. (a subsidiary of National Titanium Dioxide Company Ltd.), or Cristal; Huntsman Corporation; Tronox Incorporated; and Sachtleben Chemie GmbH. The top five TiO2 producers account for approximately 63% of the world’s production capacity. The following chart shows our estimate of worldwide production capacity in 2010:
|
Worldwide Production Capacity - 2010
|
||||
|
DuPont
|
23 | % | ||
|
Cristal
|
14 | % | ||
|
Kronos
|
10 | % | ||
|
Huntsman
|
9 | % | ||
|
Tronox
|
7 | % | ||
|
Other
|
37 | % | ||
DuPont has over one-half of total North American TiO2 production capacity and is our principal North American competitor. Tronox filed for Chapter 11 bankruptcy protection in January 2009, and has continued to operate as a debtor-in-possession until February 2011, at which time it emerged from Chapter 11. It remains unclear to what extent Tronox will compete in the TiO2 industry at the conclusion of Tronox’s bankruptcy proceedings.
Over the past ten years, we and our competitors have increased industry capacity through debottlenecking projects, which in part compensated for the shut down of TiO2 plants in France, the United States and China. Although overall industry pigment demand is expected to be higher in 2011 as compared to 2010 as a result of improving worldwide economic conditions, we do not expect any significant efforts will be undertaken by us or our competitors to further increase capacity for the foreseeable future, other than through debottlenecking projects. If actual developments differ from our expectations, ours and the TiO2 industry’s performance could be unfavorably affected.
The TiO2 industry is characterized by high barriers to entry consisting of high capital costs, proprietary technology and significant lead times (typically three to five years in our experience) required to construct new facilities or expand existing capacity. In addition, we believe the suppliers of titanium-containing feedstock do not currently have the ability to supply the raw materials that would be required to operate any such new TiO2 production capacity until they have invested in additional infrastructure required to expand their own production capacity, which we believe will take a few years to complete. We are not aware of any TiO2 plants currently under construction and we believe it is unlikely any new plants will be constructed in Europe or North America in the foreseeable future.
- 11 -
Research and Development
We employ scientists, chemists, process engineers and technicians who are engaged in research and development, process technology and quality assurance activities in Leverkusen, Germany. These individuals have the responsibility for improving chloride and sulfate production processes, improving product quality and strengthening our competitive position by developing new applications. Our expenditures for these activities were approximately $12 million in each of 2008 and 2009 and $13 million in 2010. We expect to spend $18 million to $20 million on research and development in 2011.
We continually seek to improve the quality of our grades and have been successful at developing new grades for existing and new applications to meet the needs of our customers and increase product life cycles. Since 2005, we have added four new grades for plastics and coatings.
Patents, Trademarks, Trade Secrets and Other Intellectual Property Rights
We have a comprehensive intellectual property protection strategy that includes obtaining, maintaining and enforcing our patents, primarily in the United States, Canada and Europe. We also protect our trademark and trade secret rights and have entered into license agreements with third parties concerning various intellectual property matters. We have also from time to time been involved in disputes over intellectual property.
Patents. We have obtained patents and have numerous patent applications pending that cover our products and the technology used in the manufacture of our products. Our patent strategy is important to us and our continuing business activities. In addition to maintaining our patent portfolio, we seek patent protection for our technical developments, principally in the United States, Canada and Europe. U.S. Patents are generally in effect for 20 years from the date of filing. Our U.S. patent portfolio includes patents having remaining terms ranging from one year to 20 years.
Trademarks and Trade Secrets. Our trademarks, including Kronos®, are covered by issued and or pending registrations, including in Canada and the United States. We protect the marks that we use in connection with the products we manufacture and sell and have developed goodwill in connection with our long-term use of our trademarks. We conduct research activities in secret and we protect the confidentiality of our trade secrets through reasonable measures, including confidentiality agreements and security procedures. We rely upon unpatented proprietary knowledge and continuing technological innovation and other trade secrets to develop and maintain our competitive position. Our proprietary chloride production process is an important part of our technology and our business could be harmed if we fail to maintain confidentiality of our trade secrets used in this technology.
Employees
As of December 31, 2010, we employed the following number of people:
|
Europe
|
2,000 | |||
|
Canada
|
400 | |||
|
United States (1)
|
40 | |||
|
Total
|
2,440 |
|
(1)
|
Excludes employees of our Louisiana joint venture.
|
The employees at each of our production facilities are organized by labor unions. In Europe, our union employees are covered by master collective bargaining agreements for the chemical industry that are generally renewed annually. In Canada, our union employees are covered by a collective bargaining agreement that expires in 2013.
- 12 -
Regulatory and Environmental Matters
Our operations and properties are governed by various environmental laws and regulations, which are complex, change frequently and have tended to become stricter over time. These environmental laws govern, among other things, the generation, storage, handling, use and transportation of hazardous materials; the emission and discharge of hazardous materials into the ground, air or water; and the health and safety of our employees. Certain of our operations are, or have been, engaged in the generation, storage, handling, manufacture or use of substances or compounds that may be considered toxic or hazardous within the meaning of applicable environmental laws and regulations. As with other companies engaged in similar businesses, certain of our past and current operations and products have the potential to cause environmental or other damage. We have implemented and continue to implement various policies and programs in an effort to minimize these risks. Our policy is to comply with applicable environmental laws and regulations at all our facilities and to strive to improve our environmental performance. It is possible that future developments, such as stricter requirements in environmental laws and enforcement policies, could adversely affect our operations, including production, handling, use, storage, transportation, sale or disposal of hazardous or toxic substances or require us to make capital and other expenditures to comply, and could adversely affect our consolidated financial position and results of operations or liquidity.
Our U.S. manufacturing operations are governed by federal, state and local environmental and worker health and safety laws and regulations. These include the Resource Conservation and Recovery Act, or RCRA, the Occupational Safety and Health Act, the Clean Air Act, the Clean Water Act, the Safe Drinking Water Act, the Toxic Substances Control Act and the Comprehensive Environmental Response, Compensation and Liability Act, as amended by the Superfund Amendments and Reauthorization Act, or CERCLA, as well as the state counterparts of these statutes. Some of these laws hold current or previous owners or operators of real property liable for the costs of cleaning up contamination, even if these owners or operators did not know of, and were not responsible for, such contamination. These laws also assess liability on any person who arranges for the disposal or treatment of hazardous substances, regardless of whether the affected site is owned or operated by such person. Although we have not incurred and do not currently anticipate any material liabilities in connection with such environmental laws, we may be required to make expenditures for environmental remediation in the future.
While the laws regulating operations of industrial facilities in Europe vary from country to country, a common regulatory framework is provided by the European Union, or the EU. Germany and Belgium are members of the EU and follow its initiatives. Norway is not a member but generally patterns its environmental regulatory actions after the EU.
At our sulfate plant facilities in Germany, we recycle spent sulfuric acid either through contracts with third parties or at our own facilities. In addition, at our German locations we have a contract with a third-party to treat certain sulfate-process effluents. At our Norwegian plant, we ship spent acid to a third party location where it is used as a neutralization agent. These contracts may be terminated by either party after giving three or four years advance notice, depending on the contract.
From time to time, our facilities may be subject to environmental regulatory enforcement under U.S. and non-U.S. statutes. Typically we establish compliance programs to resolve these matters. Occasionally, we may pay penalties. To date such penalties have not involved amounts having a material adverse effect on our consolidated financial position, results of operations or liquidity. We believe that all of our facilities are in substantial compliance with applicable environmental laws.
- 13 -
In December 2006, the EU approved Registration, Evaluation and Authorization of Chemicals, or REACH, which took effect on June 1, 2007 and will be phased in over an 11-year period from the implementation date. Under REACH, companies that manufacture or import more than one ton of a chemical substance per year in the EU will be required to register such chemical substances in a central data base. REACH affects our European operations by imposing a testing, evaluation and registration program for many of the chemicals we use or produce in Europe. Under REACH, substances of very high concern may require authorization for further use and may also be restricted in the future, which could increase our production costs. We have established a REACH team that is working to identify and list all substances purchased, manufactured or imported by or for us in the EU. We spent $.5 million in 2008, $.7 million in 2009 and $2.6 million in 2010 on REACH compliance and we do not anticipate that future compliance costs will be material to us.
Our capital expenditures related to ongoing environmental compliance, protection and improvement programs in 2010 were $20 million and are currently expected to be approximately $21 million in 2011.
Website and other available information
Our fiscal year ends December 31. Our annual reports on Form 10-K, quarterly reports on Form 10-Q, current reports on Form 8-K and any amendments to those reports are available on our website at www.kronosww.com. These reports are available on the website, without charge, as soon as is reasonably practicable after we file or furnish them electronically with the Securities and Exchange Commission (“SEC”). Additional information regarding us, including our Audit Committee charter, Code of Business Conduct and Ethics and our Corporate Governance Guidelines, can also be found at this website. Information contained on our website is not part of this report. We will also provide free copies of such documents upon written request. Such requests should be directed to the Corporate Secretary at our address on the cover page of this Form 10-K.
The public may read and copy any materials we file with the SEC at the SEC’s Public Reference Room at 100 F Street, N.E., Washington, D.C. 20549. The public may obtain information about the operation of the Public Reference Room by calling the SEC at 1-800-SEC-0330. We are an electronic filer and the SEC maintains an internet website that contains reports, proxy and information statements and other information regarding issuers that file electronically with the SEC at www.sec.gov.
ITEM 1A. RISK FACTORS
Below are certain risk factors associated with our business. In addition to the potential effect of these risk factors discussed below, any risk factor which could result in reduced earnings or operating losses, or reduced liquidity, could in turn adversely affect our ability to service our liabilities or pay dividends on our common stock or adversely affect the quoted market prices for our securities.
- 14 -
Demand for, and prices of, certain of our products are influenced by changing market conditions for our products, which may result in reduced earnings or operating losses.
Approximately 90% of our revenues are attributable to sales of TiO2. Pricing within the global TiO2 industry over the long term is cyclical and changes in economic conditions, especially in Western industrialized nations, can significantly impact our earnings and operating cash flows. Historically, the markets for many of our products have experienced alternating periods of increasing and decreasing demand. Relative changes in the selling prices for our products are one of the main factors that affect the level of our profitability. In periods of increasing demand, our selling prices and profit margins generally will tend to increase, while in periods of decreasing demand our selling prices and profit margins generally tend to decrease. In addition, pricing may affect customer inventory levels as customers may from time to time accelerate purchases of TiO2 in advance of anticipated price increases or defer purchases of TiO2 in advance of anticipated price decreases. Our ability to further increase capacity without additional investment in greenfield or brownfield capacity increases may be limited and as a result, our profitability may become even more dependent upon the selling prices of our products.
The demand for TiO2 during a given year is also subject to annual seasonal fluctuations. TiO2 sales are generally higher in the second and third quarters of the year. This is due in part to the increase in paint production in the spring to meet demand during the spring and summer painting season.
The TiO2 industry is concentrated and highly competitive and we face price pressures in the markets in which we operate, which may result in reduced earnings or operating losses.
The global market in which we operate our business is concentrated with the top five TiO2 producers accounting for 63% of the world’s production capacity and is highly competitive. Competition is based on a number of factors, such as price, product quality and service. Some of our competitors may be able to drive down prices for our products because their costs are lower than our costs. In addition, some of our competitors’ financial, technological and other resources may be greater than our resources and such competitors may be better able to withstand changes in market conditions. Our competitors may be able to respond more quickly than we can to new or emerging technologies and changes in customer requirements. Further, consolidation of our competitors or customers may result in reduced demand for our products or make it more difficult for us to compete with our competitors. The occurrence of any of these events could result in reduced earnings or operating losses.
Higher costs or limited availability of our raw materials may reduce our earnings and decrease our liquidity. In addition, many of our raw material contracts contain fixed quantities we are required to purchase.
The number of sources for and availability of certain raw materials is specific to the particular geographical region in which a facility is located. For example, titanium-containing feedstocks suitable for use in our TiO2 facilities are available from a limited number of suppliers around the world. Political and economic instability in the countries from which we purchase our raw material supplies could adversely affect their availability. If our worldwide vendors were unable to meet their contractual obligations and we were unable to obtain necessary raw materials, we could incur higher costs for raw materials or may be required to reduce production levels. In addition, we may also experience higher operating costs such as energy costs, which could affect our profitability. We may not always be able to increase our selling prices to offset the impact of any higher costs or reduced production levels, which could reduce our earnings and decrease our liquidity.
- 15 -
We have long-term supply contracts that provide for our TiO2 feedstock requirements that currently expire through 2015, some of which we may be able to renew. We may not be successful in renewing these contracts or in obtaining long-term extensions to these contracts prior to expiration. The agreements require us to purchase certain minimum quantities of feedstock with minimum purchase commitments aggregating approximately $592 million at December 31, 2010. In addition, we have other long-term supply and service contracts that provide for various raw materials and services. These agreements require us to purchase certain minimum quantities or services with minimum purchase commitments aggregating approximately $132 million at December 31, 2010. Our commitments under these contracts could adversely affect our financial results if we significantly reduce our production and were unable to modify the contractual commitments.
Our leverage may impair our financial condition or limit our ability to operate our businesses.
We currently have a significant amount of debt. As of December 31, 2010, our total consolidated debt was approximately $539.6 million, which relates primarily to our senior secured notes. Our level of debt could have important consequences to our stockholders and creditors, including:
|
·
|
making it more difficult for us to satisfy our obligations with respect to our liabilities;
|
|
·
|
increasing our vulnerability to adverse general economic and industry conditions;
|
|
·
|
requiring that a portion of our cash flows from operations be used for the payment of interest on our debt, which reduces our ability to use our cash flow to fund working capital, capital expenditures, dividends on our common stock, acquisitions or general corporate requirements;
|
|
·
|
limiting the ability of our subsidiaries to pay dividends to us;
|
|
·
|
limiting our ability to obtain additional financing to fund future working capital, capital expenditures, acquisitions or general corporate requirements;
|
|
·
|
limiting our flexibility in planning for, or reacting to, changes in our business and the industry in which we operate; and
|
|
·
|
placing us at a competitive disadvantage relative to other less leveraged competitors.
|
In addition to our indebtedness, we are party to various lease and other agreements pursuant to which, along with our indebtedness, we are committed to pay approximately $392.1 million in 2011. Our ability to make payments on and refinance our debt and to fund planned capital expenditures depends on our future ability to generate cash flow. To some extent, this is subject to general economic, financial, competitive, legislative, regulatory and other factors that are beyond our control. In addition, our ability to borrow funds under our subsidiaries’ credit facilities in the future will, in some instances, depend in part on these subsidiaries’ ability to maintain specified financial ratios and satisfy certain financial covenants contained in the applicable credit agreement.
Our business may not generate cash flows from operating activities sufficient to enable us to pay our debts when they become due and to fund our other liquidity needs. As a result, we may need to refinance all or a portion of our debt before maturity. We may not be able to refinance any of our debt in a timely manner on favorable terms, if at all, in the current credit markets. Any inability to generate sufficient cash flows or to refinance our debt on favorable terms could have a material adverse effect on our financial condition.
- 16 -
Global climate change legislation could negatively impact our financial results or limit our ability to operate our businesses.
We operate production facilities in several countries. In many of the countries in which we operate, legislation has been passed, or proposed legislation is being considered, to limit greenhouse gases through various means, including emissions permits and/or energy taxes. In several of our production facilities, we consume large amounts of energy, primarily electricity and natural gas. To date, the permit system in effect in the various countries in which we operate has not had a material adverse effect on our financial results. However, if further greenhouse gas legislation were to be enacted in one or more countries, it could negatively impact our future results from operations through increased costs of production, particularly as it relates to our energy requirements or our need to obtain emissions permits. If such increased costs of production were to materialize, we may be unable to pass price increases onto our customers to compensate for increased production costs, which may decrease our liquidity, operating income and results of operations.
|
ITEM 1B.
|
UNRESOLVED STAFF COMMENTS.
|
|
|
None.
|
|
ITEM 2.
|
PROPERTIES
|
|
|
Information on our properties is incorporated by reference to Item 1: Manufacturing, Operations and Properties above. Our corporate headquarters is located in Dallas, Texas. See Note 15 to our Consolidated Financial Statements for information on our leases.
ITEM 3. LEGAL PROCEEDINGS
We are involved in various environmental, contractual, intellectual property, product liability and other claims and disputes incidental to our business. Information called for by this Item is incorporated by reference to Note 15 to our Consolidated Financial Statements.
ITEM 4. RESERVED
- 17 -
PART II
|
ITEM 5.
|
MARKET FOR COMMON EQUITY AND RELATED STOCKHOLDER MATTERS
|
Our common stock is listed and traded on the New York Stock Exchange (symbol: KRO). As of February 28, 2011, there were approximately 3,000 holders of record of our common stock. The following table sets forth the high and low closing per share sales price for our common stock for the periods indicated according to Bloomberg and dividends paid during such periods. On February 28, 2011 the closing price of our common stock was $49.50.
|
High
|
Low
|
Cash
Dividends
Paid
|
||||||||||
|
Year ended December 31, 2009
|
||||||||||||
|
First Quarter
|
$ | 17.00 | $ | 5.25 | $ | - | ||||||
|
Second Quarter
|
8.90 | 6.50 | - | |||||||||
|
Third Quarter
|
10.31 | 5.85 | - | |||||||||
|
Fourth Quarter
|
17.34 | 9.59 | - | |||||||||
|
Year ended December 31, 2010
|
||||||||||||
|
First Quarter
|
$ | 17.20 | 13.56 | $ | - | |||||||
|
Second Quarter
|
20.25 | 14.65 | - | |||||||||
|
Third Quarter
|
39.84 | 18.15 | - | |||||||||
|
Fourth Quarter
|
44.77 | 36.15 | .25 | |||||||||
|
January 1, 2011 through
February 28, 2011
|
$ | 51.99 | $ | 40.02 | $ | 1.00 | ||||||
Prior to 2009, we paid a regular quarterly dividend to stockholders of $.25 per share. In February 2009, our board of directors decided to suspend our quarterly dividend after considering the challenges and uncertainties that existed in the TiO2 industry at the time. In October 2010, our board of directors determined to resume our regular quarterly dividend. In determining to resume the dividend, the board considered our results of operations, financial condition, cash requirements for our business, the current long-term outlook for our business and other factors deemed relevant by the board. In February 2011, our board of directors declared the first quarter 2011 regular quarterly dividend of $.25 per share, payable on March 24, 2011 to stockholders of record as of March 10, 2011. In addition, our board of directors also declared a special dividend of $1.00 per share to shareholders of record on February 21, 2011 which we paid on February 28, 2011. The declaration and payment of future dividends is discretionary, and the amount, if any, will be dependent upon such factors. There are currently no restrictions on our ability to pay dividends.
In November 2010, we completed a secondary public offering of 8.97 million shares of our common stock in an underwritten offering for net proceeds of $337.6 million. See Note 13 to our Consolidated Financial Statements. We intend to use the net proceeds of the offering for general corporate purposes, which may include possible acquisitions of additional TiO2 facilities that may become available in the future.
- 18 -
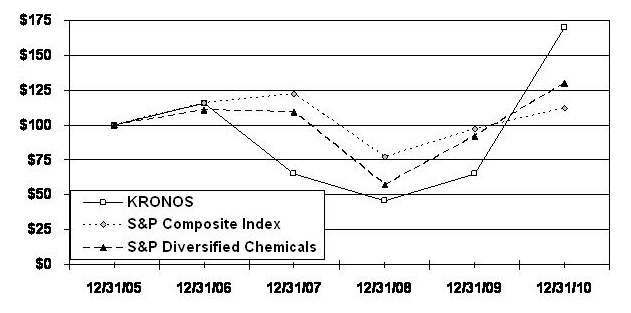
Performance graph
Set forth below is a table and line graph comparing the yearly change in our cumulative total stockholder return on our common stock against the cumulative total return of the S&P Composite 500 Stock Index and the S&P 500 Diversified Chemicals Index. The graph shows the value at December 31 of each year, assuming an original investment of $100 at December 31, 2005 and reinvestment of cash dividends and other distributions to stockholders.
|
2005
|
2006
|
2007
|
2008
|
2009
|
2010
|
|||||||||||||||||||
|
Kronos common stock
|
$ | 100 | $ | 116 | $ | 65 | $ | 46 | $ | 65 | $ | 170 | ||||||||||||
|
S&P 500 Composite Stock Index
|
100 | 116 | 122 | 77 | 97 | 112 | ||||||||||||||||||
|
S&P 500 Diversified Chemicals Index
|
100 | 111 | 109 | 57 | 92 | 130 | ||||||||||||||||||
The information contained in the performance graph shall not be deemed “soliciting material” or “filed” with the SEC, or subject to the liabilities of Section 18 of the Securities Exchange Act, except to the extent we specifically request that the material be treated as soliciting material or specifically incorporate this performance graph by reference into a document filed under the Securities Act or the Securities Exchange Act.
Equity compensation plan information
We have an equity compensation plan, which was approved by our stockholders, which provides for the discretionary grant to our employees and directors of, among other things, options to purchase our common stock and stock awards. As of December 31, 2010 there were no options outstanding to purchase shares of our common stock and approximately 115,500 shares were available for future grant or issuance. We do not have any equity compensation plans that were not approved by our stockholders. See Note 13 to our Consolidated Financial Statements.
- 19 -
|
ITEM 6.
|
SELECTED FINANCIAL DATA
|
The following selected financial data should be read in conjunction with our Consolidated Financial Statements and Item 7 - "Management's Discussion and Analysis of Financial Condition and Results of Operations."
|
Years ended December 31,
|
||||||||||||||||||||
|
2006(3)
|
2007
|
2008
|
2009
|
2010
|
||||||||||||||||
|
(In millions, except per share data
and TiO2 operating statistics)
|
||||||||||||||||||||
|
STATEMENTS OF OPERATIONS DATA:
|
||||||||||||||||||||
|
Net sales
|
$ | 1,279.4 | $ | 1,310.3 | $ | 1,316.9 | $ | 1,142.0 | $ | 1,449.7 | ||||||||||
|
Gross margin
|
310.5 | 251.4 | 220.6 | 130.3 | 345.3 | |||||||||||||||
|
Income (loss) from operations
|
143.2 | 84.9 | 47.2 | (15.7 | ) | 178.4 | ||||||||||||||
|
Net income (loss)
|
82.0 | (66.7 | ) | 9.0 | (34.7 | ) | 130.6 | |||||||||||||
|
Net income (loss) per share (1)
|
1.67 | (1.36 | ) | .18 | (.71 | ) | 2.59 | |||||||||||||
|
Cash dividends per share
|
1.00 | 1.00 | 1.00 | - | .25 | |||||||||||||||
|
BALANCE SHEET DATA (at year end):
|
||||||||||||||||||||
|
Total assets
|
$ | 1,421.5 | $ | 1,455.0 | $ | 1,358.7 | $ | 1,325.0 | $ | 1,707.6 | ||||||||||
|
Notes payable and long-term debt including current maturities
|
536.2 | 606.2 | 638.5 | 613.2 | 539.6 | |||||||||||||||
|
Common stockholders’ equity (1)
|
448.4 | 411.0 | 317.9 | 312.5 | 761.2 | |||||||||||||||
|
STATEMENTS OF CASH FLOW DATA:
|
||||||||||||||||||||
|
Net cash provided by (used in):
|
||||||||||||||||||||
|
Operating activities
|
$ | 71.9 | $ | 90.0 | $ | 2.7 | $ | 86.3 | $ | 126.0 | ||||||||||
|
Investing activities
|
(50.9 | ) | (47.4 | ) | (68.1 | ) | (23.7 | ) | (145.8 | ) | ||||||||||
|
Financing activities (1)
|
(35.0 | ) | (39.8 | ) | 10.3 | (49.8 | ) | 295.1 | ||||||||||||
|
TiO2 OPERATING STATISTICS:
|
||||||||||||||||||||
|
Sales volume(2)
|
511 | 519 | 478 | 445 | 528 | |||||||||||||||
|
Production volume(2)
|
516 | 512 | 514 | 402 | 524 | |||||||||||||||
|
Production capacity at beginning of year(2)
|
516 | 525 | 532 | 532 | 532 | |||||||||||||||
|
Production rate as a percentage of capacity
|
Full
|
98 | % | 97 | % | 76 | % | 99 | % | |||||||||||
|
________________________________
|
||||||||||||||||||||
|
(1)
|
In November, 2010, we completed a secondary public offering of 8.97 million shares of our common stock in an underwritten offering for net proceeds of $337.6 million. Net income per share for 2010 reflects the impact of the issuance of the 8.97 million shares of common stock in November 2010. See Item 5. Market for Common Equity and Related Stockholder Matters and Note 13 to our Consolidated Financial Statements.
|
|
(2)
|
Metric tons in thousands
|
|
(3)
|
We adopted the asset and liability recognition provisions of Accounting Standard Codification Topic 715, Compensation – Retirement Benefits, effective December 31, 2006. See Note 11 to our Consolidated Financial Statements.
|
- 20 -
|
ITEM 7.
|
MANAGEMENT'S DISCUSSION AND ANALYSIS OF FINANCIAL CONDITION AND RESULTS OF OPERATIONS
|
RESULTS OF OPERATIONS
Business overview
We are a leading global producer and marketer of value-added TiO2. TiO2 is used for a variety of manufacturing applications, including plastics, paints, paper and other industrial products. During 2010, approximately one-half of our sales volumes were sold into European markets. We believe we are the largest producer of TiO2 in Europe with an estimated 22% share of European TiO2 sales volumes in 2010. In addition, we estimate we have a 19% share of North American TiO2 sales volumes in 2010. Our production facilities are located throughout Europe and North America.
We consider TiO2 to be a “quality of life” product, with demand affected by gross domestic product (or “GDP”) and overall economic conditions in our markets located in various regions of the world. Over the long-term, we expect demand for TiO2 will grow by 2% to 3% per year, consistent with our expectations for the long-term growth in GDP. However, even if we and our competitors maintain consistent shares of the worldwide market, demand for TiO2 in any interim or annual period may not change in the same proportion as the change in GDP, in part due to relative changes in the TiO2 inventory levels of our customers. We believe our customers’ inventory levels are influenced in part by their expectation for future changes in market TiO2 selling prices as well as their expectation for future availability of product. The majority of our TiO2 grades and substantially all of our production are considered commodity pigment products; we compete for sales primarily on the basis of price.
The factors having the most impact on our reported operating results are:
|
·
|
Our TiO2 sales and production volumes,
|
|
·
|
TiO2 selling prices,
|
|
·
|
Currency exchange rates (particularly the exchange rate for the U.S. dollar relative to the euro, Norwegian krone and the Canadian dollar) and
|
|
·
|
Manufacturing costs, particularly raw materials, maintenance and energy-related expenses.
|
Our key performance indicators are our TiO2 average selling prices and our level of TiO2 sales and production volumes. TiO2 selling prices generally follow industry trends and prices will increase or decrease generally as a result of competitive market pressures.
In addition, our effective income tax rate in each of 2008, 2009 and 2010 has been impacted by certain favorable and unfavorable developments discussed below.
- 21 -
Executive Summary
We reported net income of $130.6 million, or $2.59 per diluted share for 2010, compared to a net loss of $34.7 million, or $.71 per diluted share for 2009. Our diluted earnings per share increased from 2009 to 2010 primarily due to (i) the net effects of higher income from operations in 2010 resulting principally from higher sales and production volumes and higher selling prices throughout 2010 and (ii) a non-cash deferred income tax benefit recognized in the first quarter of 2010.
We reported a net loss of $34.7 million, or $.71 per diluted share for 2009, compared to net income of $9.0 million, or $.18 per diluted share for 2008. Our diluted earnings per share decreased from 2008 to 2009 primarily due to the net effects of (i) lower income (loss) from operations in 2009 resulting principally from lower sales and production volumes and (ii) an income tax benefit we recognized in 2008. In late 2008, as a result of the sharp decline in global demand, we experienced a build up in our inventory levels. In order to decrease our inventory levels and improve our liquidity, we implemented production curtailments during the first half of 2009. In addition, throughout all of 2009 we implemented cost controls and reduced our capital spending. Through these actions we successfully reduced our inventory and increased our liquidity, although the resulting curtailments led to a net loss in 2009 due to the large amount of unabsorbed fixed production costs we charged to expense as incurred.
Net income for 2010 includes a $35.2 million first quarter non-cash income tax benefit ($.72 per diluted share) related to a European Court ruling that resulted in the favorable resolution of certain income tax issues in Germany and an increase in the amount of our German corporate and trade tax net operating loss carryforwards.
Net income for 2009 includes a $4.7 million non-cash income tax benefit ($.10 per diluted share) related to a net decrease in our reserve for uncertain tax positions.
Net income for 2008 includes a $7.2 million non-cash income tax benefit ($.15 per diluted share) related to a European Court ruling that resulted in the favorable resolution of certain income tax issues in Germany and an increase in the amount of our German corporate and trade tax net operating loss carryforwards.
Critical accounting policies and estimates
The accompanying "Management's Discussion and Analysis of Financial Condition and Results of Operations" is based upon our Consolidated Financial Statements, which we have prepared in accordance with accounting principles generally accepted in the United States of America ("GAAP"). The preparation of these financial statements requires us to make estimates and judgments that affect the reported amounts of assets and liabilities and disclosure of contingent assets and liabilities at the date of the financial statements and the reported amount of revenues and expenses during the reported period. On an on-going basis, we evaluate our estimates, including those related to, the recoverability of long-lived assets, pension and other postretirement benefit obligations and the underlying actuarial assumptions related thereto, the realization of deferred income tax assets and accruals for litigation, income tax and other contingencies. We base our estimates on historical experience and on various other assumptions which we believe to be reasonable under the circumstances, the results of which form the basis for making judgments about the reported amounts of assets, liabilities, revenues and expenses. Actual results may differ significantly from previously-estimated amounts under different assumptions or conditions.
- 22 -
The following critical accounting policies affect our more significant judgments and estimates used in the preparation of our Consolidated Financial Statements:
|
·
|
Long-lived assets. We recognize an impairment charge associated with our long-lived assets, including property and equipment, whenever we determine that recovery of such long-lived asset is not probable. Such determination is made in accordance with the applicable GAAP requirements of Accounting Standard Codification (“ASC”) Topic 360-10-35 Property, Plant and Equipment and is based upon, among other things, estimates of the amount of future net cash flows to be generated by the long-lived asset and estimates of the current fair value of the asset. Significant judgment is required in estimating such cash flows. Adverse changes in such estimates of future net cash flows or estimates of fair value could result in an inability to recover the carrying value of the long-lived asset, thereby possibly requiring an impairment charge to be recognized in the future. We do not assess our property and equipment for impairment unless certain impairment indicators specified in ASC Topic 360-10-35 are present. We did not evaluate any long-lived assets for impairment during 2010 because no such impairment indicators were present.
|
|
·
|
Benefit Plans. We maintain various defined benefit pension plans and postretirement benefits other than pensions (“OPEB”). The amounts recognized as defined benefit pension and OPEB expenses and the reported amounts of pension asset and accrued pension and OPEB costs are actuarially determined based on several assumptions, including discount rates, expected rates of returns on plan assets and expected health care trend rates. Variances from these actuarially assumed rates will result in increases or decreases, as applicable, in the recognized pension and OPEB obligations, pension and OPEB expenses and funding requirements. These assumptions are more fully described below under “Defined Benefit Pension Plans” and “OPEB Plans.”
|
|
·
|
Income taxes. We recognize deferred taxes for future tax effects of temporary differences between financial and income tax reporting. We record a valuation allowance to reduce our deferred income tax assets to the amount that is believed to be realized under the more-likely-than-not recognition criteria. While we have considered future taxable income and ongoing prudent and feasible tax planning strategies in assessing the need for a valuation allowance, it is possible that in the future we may change our estimate of the amount of the deferred income tax assets that would more-likely-than-not be realized in the future, resulting in an adjustment to the deferred income tax asset valuation allowance that would either increase or decrease, as applicable, reported net income in the period such change in estimate was made. For example, we have substantial net operating loss carryforwards in Germany (the equivalent of $952 million for German corporate purposes and $349 million for German trade tax purposes at December 31, 2010). At December 31, 2010, we have concluded that no deferred income tax asset valuation allowance is required to be recognized with respect to such carryforwards, principally because (i) such carryforwards have an indefinite carryforward period, (ii) we have utilized a portion of such carryforwards during the most recent three-year period and (iii) we currently expect to utilize the remainder of such carryforwards over the long term. However, prior to the complete utilization of such carryforwards, if we were to generate losses in our German operations for an extended period of time, it is possible that we might conclude the benefit of such carryforwards would no longer meet the more-likely-than-not recognition criteria, at which point we would be required to recognize a valuation allowance against some or all of the then-remaining tax benefit associated with the carryforwards.
|
We record a reserve for uncertain tax positions for tax positions where we believe it is more-likely-than-not our position will not prevail with the applicable tax authorities. It is possible that in the future we may change our assessment regarding the probability that our tax positions will prevail that would require an adjustment to the amount of our reserve for uncertain tax positions that could either increase or decrease, as applicable, reported net income in the period the change in assessment was made.
- 23 -
In addition, we evaluate at the end of each reporting period as to whether or not some or all of the undistributed earnings of our non-U.S. subsidiaries are permanently reinvested (as that term is defined in GAAP). While we may have concluded in the past that some of such undistributed earnings are permanently reinvested, facts and circumstances can change in the future and it is possible that a change in facts and circumstances, such as a change in the expectation regarding the capital needs of our non-U.S. subsidiaries, could result in a conclusion that some or all of such undistributed earnings are no longer permanently reinvested. In such an event, we would be required to recognize a deferred income tax liability in an amount equal to the estimated incremental U.S. income tax and withholding tax liability that would be generated if all of such previously-considered permanently reinvested undistributed earnings were distributed to the U.S.
|
·
|
Contingencies. We record accruals for legal and other contingencies when estimated future expenditures associated with such contingencies and commitments become probable and the amounts can be reasonably estimated. However, new information may become available or circumstances (such as applicable laws and regulations) may change, thereby resulting in an increase or decrease in the amount required to be accrued for such matters (and therefore a decrease or increase in reported net income in the period of such change).
|
Income (loss) from operations is impacted by certain of these significant judgments and estimates, such as allowance for doubtful accounts, reserves for obsolete or unmarketable inventories, impairment of equity method investments and long-lived assets, defined benefit pension plans and loss accruals. In addition, net income (loss) is impacted by the significant judgments and estimates for deferred income tax asset valuation allowances and loss accruals.
Comparison of 2010 to 2009 Results of Operations
|
Year ended
December 31,
|
||||||||||||||||
|
2009
|
2010
|
|||||||||||||||
|
(Dollars in millions)
|
||||||||||||||||
|
Net sales
|
$ | 1,142.0 | 100 | % | $ | 1,449.7 | 100 | % | ||||||||
|
Cost of sales
|
1,011.7 | 89 | 1,104.4 | 76 | ||||||||||||
|
Gross margin
|
130.3 | 11 | 345.3 | 24 | ||||||||||||
|
Other operating income and expenses, net
|
146.0 | 13 | 166.9 | 12 | ||||||||||||
|
Income (loss) from operations
|
$ | (15.7 | ) | (2 | )% | $ | 178.4 | 12 | % | |||||||
|
%
|
||||||||||||||||
|
Change
|
||||||||||||||||
|
TiO2 operating statistics:
|
||||||||||||||||
|
Sales volumes*
|
445 | 528 | 19 | % | ||||||||||||
|
Production volumes*
|
402 | 524 | 30 | % | ||||||||||||
|
Percent change in net sales:
|
||||||||||||||||
|
TiO2 product pricing
|
11 | % | ||||||||||||||
|
TiO2 sales volumes
|
19 | |||||||||||||||
|
TiO2 product mix
|
- | |||||||||||||||
|
Changes in currency exchange rates
|
(3 | ) | ||||||||||||||
|
Total
|
27 | % | ||||||||||||||
* Thousands of metric tons
- 24 -
Current industry conditions and 2010 overview – Throughout 2010, global customer demand for our TiO2 products continued to strengthen, and our production facilities operated at near full capacity rates. We believe that inventories throughout the TiO2 industry remain at historically low levels despite efforts of the major TiO2 producers to operate their facilities at near full capacity. As a result of improved TiO2 industry conditions, we implemented significant increases in TiO2 selling prices during 2010 that resulted in increased profitability and cash flows. Even with such increased profitability, we currently believe that profit margins are significantly lower than necessary to reasonably justify greenfield or other major expansions of TiO2 capacity. Provided global demand for TiO2 products remains strong, we expect the low level of worldwide TiO2 inventories to continue for several years, and anticipate further implementation of TiO2 selling price increases. Based on these positive market dynamics in the TiO2 industry, we expect our profitability and cash flows to significantly increase in 2011 and the foreseeable future.
Net sales – As a result of the above conditions in the TiO2 industry, our net sales increased 27% or $307.7 million for 2010 compared to 2009, primarily due to a 19% increase in sales volumes and an 11% increase in average selling prices. In addition, we estimate the unfavorable effect of changes in currency exchange rates decreased our net sales by approximately $36 million, or 3%, as compared to the same period in 2009. TiO2 selling prices will increase or decrease generally as a result of competitive market pressures and changes in the relative level of supply and demand. Based on the current conditions in the TiO2 industry, we currently expect average selling prices in 2011 to be significantly higher than the average selling prices in 2010.
Record sales volumes in 2010 increased 19% as compared to 2009 due to higher demand across all market segments resulting from the improvement in current economic conditions. We expect demand in 2011 will exceed 2010 levels.
Cost of sales - Cost of sales increased $92.7 million or 9% for 2010 compared to 2009 due to the net impact of a 30% increase in TiO2 production volumes to a new production record of 524,000 metric tons, a 19% increase in sales volumes, an increase in maintenance costs of $25.2 million, and higher raw material costs of $4.5 million. In addition, cost of sales for 2010 was negatively impacted by approximately $15 million as a result of higher production costs in 2010 at our ilmenite mines in Norway. Cost of sales as a percentage of net sales decreased to 76% in 2010 compared to 89% in 2009 primarily due to higher selling prices in 2010 and the significantly higher production volumes in 2010, as we implemented temporary plant curtailments during the first half of 2009 in order to reduce our finished goods inventories to an appropriate level. Such temporary plant curtailments resulted in approximately $80 million of unabsorbed fixed production costs which were charged directly to cost of sales in the first six months of 2009.
Income (loss) from operations – Income (loss) from operations increased by $194.1 million from an operating loss of $15.7 million in 2009 to operating income of $178.4 million in 2010. Income (loss) from operations as a percentage of net sales increased to 12% in 2010 from (2)% in 2009. This increase is driven by the improvement in gross margin, which increased to 24% for 2010 compared to 11% for 2009. Our gross margin has increased primarily because of higher sales volumes, higher selling prices and lower manufacturing costs per ton resulting from higher production volumes. However, changes in currency exchange rates have negatively affected our gross margin and income (loss) from operations. We estimate that changes in currency exchange rates decreased income (loss) from operations by approximately $27 million in 2010 as compared to 2009.
- 25 -
As a percentage of net sales, selling, general and administrative expenses were relatively consistent at approximately 12% and 13% for 2010 and 2009 respectively.
Interest expense – Interest expense decreased $2.6 million from $41.4 million in 2009 to $38.8 million in 2010 due to decreased average borrowings under our revolving credit facilities. The interest expense we recognize will vary with fluctuations in the euro exchange rate.
Income tax provision (benefit) – Our income tax provision was $9.7 million in 2010 compared to an income tax benefit of $22.2 million in 2009. See Note 10 to our Consolidated Financial Statements for a tabular reconciliation of our statutory income tax provision to our actual tax provision. Some of the more significant items impacting this reconciliation are summarized below.
|
·
|
Our income tax provision in 2010 includes a $35.2 million non-cash income tax benefit related to a European Court ruling that resulted in the favorable resolution of certain income tax issues in Germany and an increase in the amount of our German corporate and trade tax net operating loss carryforwards.
|
|
·
|
Our income tax benefit for 2009 includes a non-cash benefit of $4.7 million related to a net decrease in our reserve for uncertain tax positions, primarily as a result of the resolution of tax audits in Belgium and Germany in the third and fourth quarters.
|
Comparison of 2009 to 2008 Results of Operations
|
Year ended
December 31,
|
||||||||||||||||
|
2008
|
2009
|
|||||||||||||||
|
(Dollars in millions)
|
||||||||||||||||
|
Net sales
|
$ | 1,316.9 | 100 | % | $ | 1,142.0 | 100 | % | ||||||||
|
Cost of sales
|
1,096.3 | 83 | 1,011.7 | 89 | ||||||||||||
|
Gross margin
|
220.6 | 17 | 130.3 | 11 | ||||||||||||
|
Other operating income and expenses, net
|
173.4 | 13 | 146.0 | 13 | ||||||||||||
|
Income (loss) from operations
|
$ | 47.2 | 4 | % | $ | (15.7 | ) | (2 | )% | |||||||
|
%
|
||||||||||||||||
|
Change
|
||||||||||||||||
|
TiO2 operating statistics:
|
||||||||||||||||
|
Sales volumes*
|
478 | 445 | (7 | )% | ||||||||||||
|
Production volumes*
|
514 | 402 | (22 | )% | ||||||||||||
|
Percent change in net sales:
|
||||||||||||||||
|
TiO2 product pricing
|
(1 | )% | ||||||||||||||
|
TiO2 sales volumes
|
(7 | ) | ||||||||||||||
|
TiO2 product mix
|
(2 | ) | ||||||||||||||
|
Changes in currency exchange rates
|
(3 | ) | ||||||||||||||
|
Total
|
(13 | )% | ||||||||||||||
* Thousands of metric tons
- 26 -
Net sales – Net sales decreased 13% or $174.9 million for 2009 compared to 2008, primarily due to a 7% decrease in sales volumes and a 1% decrease in average selling prices. Variations in grades of products sold unfavorably impacted net sales by 2%. In addition, we estimate the unfavorable effect of changes in currency exchange rates decreased our net sales by approximately $35 million, or 3%, as compared to the same period in 2008. TiO2 selling prices generally follow industry trends and prices will increase or decrease generally as a result of competitive market pressures. As a result of these market pressures our average TiO2 prices in 2009 were 1% lower than the prior year. During the first half of 2009, our average selling prices were generally declining, as we faced weak demand and excessive inventory levels. Beginning in mid-2009, we and our competitors announced various price increases. A portion of these price increase announcements were implemented during the third and fourth quarters of 2009, and as a result our average selling price at the end of the second half of 2009 was 3% higher than at the end of the first half of 2009.
Our 7% decrease in sales volumes in 2009 was primarily due to lower sales volumes in Europe and North America as a result of a global weakening of demand due to poor overall economic conditions, principally in the first half of 2009.
Cost of sales - Cost of sales decreased 8% or $84.6 million for 2009, compared to 2008, primarily due to the net impact of a 7% decrease in sales volumes, lower raw material costs of $11.6 million, a decrease in maintenance costs of $29.8 million as part of our efforts to reduce operating costs where possible and currency fluctuations (primarily the euro). The cost of sales as a percentage of net sales increased to 89% in the year ended December 31, 2009 compared to 83% in the same period of 2008 primarily due to the unfavorable effects of the significant amount of unabsorbed fixed production costs resulting from reduced production volumes during the first six months of 2009. TiO2 production volumes decreased due to temporary plant curtailments during the first six months of 2009 that resulted in approximately $80 million of unabsorbed fixed production costs which were charged directly to cost of sales in the first six months of 2009.
Income (loss) from operations – Income (loss) from operations declined by $62.9 million from income from operations of $47.2 million in 2008 to a loss from operations of $15.7 million in 2009. Income (loss) from operations as a percentage of net sales declined to (2%) in 2009 from 4% in 2008. This decrease is driven by the decline in gross margin, which fell to 11% for 2009 compared to 17% for 2008. Our gross margin has decreased primarily because of the significant amount of unabsorbed fixed production costs resulting from the production curtailments we implemented during the first six months of 2009 as well as the effect of lower sales volumes. However, changes in currency rates positively affected our gross margin and income (loss) from operations. We estimate that changes in currency exchange rates increased income (loss) from operations by approximately $40 million in 2009 as compared to 2008.
As a percentage of net sales, selling, general and administrative expenses were relatively consistent at approximately 13% for both 2008 and 2009.
Other non-operating income and expense, net – Interest expense decreased $.8 million from $42.2 million in 2008 to $41.4 million in 2009 due to changes in currency exchange rates which offset the effect of increased average borrowings under our revolving credit facilities and higher interest rates on our European credit facility. The interest expense we recognize will vary with fluctuations in the euro exchange rate.
- 27 -
Income tax benefit – Our income tax benefit was $22.2 million in 2009 compared to $3.0 million in 2008. See Note 10 to our Consolidated Financial Statements for a tabular reconciliation of our statutory income tax benefit to our actual tax benefit. Some of the more significant items impacting this reconciliation are summarized below.
|
·
|
Our income tax benefit for 2009 includes a non-cash benefit of $4.7 million related to a net decrease in our reserve for uncertain tax positions, primarily as a result of the resolution of tax audits in Belgium and Germany in the third and fourth quarters.
|
|
·
|
Our income tax benefit for 2008 includes a non-cash benefit of $7.2 million relating to a European Court ruling that resulted in the favorable resolution of certain income tax issues in Germany and an increase in the amount of our German corporate and trade tax net operating loss carryforwards.
|
Effects of Currency Exchange Rates
We have substantial operations and assets located outside the United States (primarily in Germany, Belgium, Norway and Canada). The majority of our sales from non-U.S. operations are denominated in currencies other than the U.S. dollar, principally the euro, other major European currencies and the Canadian dollar. A portion of our sales generated from our non-U.S. operations is denominated in the U.S. dollar. Certain raw materials used worldwide, primarily titanium-containing feedstocks, are purchased in U.S. dollars, while labor and other production costs are purchased primarily in local currencies. Consequently, the translated U.S. dollar value of our non-U.S. sales and operating results are subject to currency exchange rate fluctuations which may favorably or unfavorably impact reported earnings and may affect the comparability of period-to-period operating results. In addition to the impact of the translation of sales and expenses over time, our non-U.S. operations also generate currency transaction gains and losses which primarily relate to the difference between the currency exchange rates in effect when non-local currency sales or operating costs are initially accrued and when such amounts are settled with the non-local currency.
Overall, we estimate that fluctuations in currency exchange rates had the following effects on our sales and income (loss) from operations for the periods indicated.
|
Impact of changes in currency exchange rates - 2009 vs 2010
|
||||||||||||||||||||
|
Transaction gains/(losses) recognized
|
Translation gain/loss-
impact of rate changes
|
Total currency impact
2009 vs 2010
|
||||||||||||||||||
|
2009
|
2010
|
Change
|
||||||||||||||||||
|
(in millions)
|
||||||||||||||||||||
|
Impact on:
|
||||||||||||||||||||
|
Net sales
|
$ | - | $ | - | $ | - | $ | (36 | ) | $ | (36 | ) | ||||||||
|
Income (loss)
from operations
|
10 | 8 | (2 | ) | (25 | ) | (27 | ) | ||||||||||||
|
Impact of changes in currency exchange rates - 2008 vs 2009
|
||||||||||||||||||||
|
Transaction gains/(losses) recognized
|
Translation gain/loss-
impact of rate changes
|
Total currency impact
2008 vs 2009
|
||||||||||||||||||
|
2008
|
2009
|
Change
|
||||||||||||||||||
|
(in millions)
|
||||||||||||||||||||
|
Impact on:
|
||||||||||||||||||||
|
Net sales
|
$ | - | $ | - | $ | - | $ | (35 | ) | $ | (35 | ) | ||||||||
|
Income (loss)
from operations
|
1 | 10 | 9 | 31 | 40 | |||||||||||||||
- 28 -
The negative impact on income (loss) from operations for the 2009 versus 2010 comparison is due to increased currency transaction losses in 2010 as compared to 2009 which were a function of the timing of currency exchange rate changes and the settlement of non-local currency receivables and payables. The positive impact on income (loss) from operations for the 2008 versus 2009 comparison is due to increased currency transaction gains in 2009 as compared to 2008 which were a function of the timing of currency exchange rate changes and the settlement of non-local currency receivables and payables.
Outlook
We operated our production facilities at near full capacity levels during 2010, and our production volumes in 2010 set a new record for us. Given the current TiO2 industry dynamics, we currently expect to continue to operate our facilities at near full capacity levels throughout 2011. While we will continue to work on debottlenecking projects in 2011 to increase our production capacity, we believe such debottlenecking projects are now only able to produce nominal increases in our capacity, and as a result our production volumes in 2011 are only expected to increase by a few thousand metric tons as compared to 2010.
The overall strong global demand for TiO2 we experienced in 2010 is expected to continue in 2011, and inventory levels throughout the TiO2 industry remain at historically low levels. As a result, in 2011 we expect we will be able to sell all of the TiO2 we produce. Given our expectations for the level of our increased production capacity in 2011 discussed above, we similarly expect our sales volumes in 2011 will only increase by a few thousand metric tons as compared to 2010.
During 2009 and 2010, we announced various TiO2 price increases, a portion of which were implemented during the second half of 2009 and throughout the year of 2010. Our average TiO2 selling prices were 11% higher for the full year 2010 as compared to the full year 2009, and our average selling prices at the end of 2010 were 22% higher as compared to the end of 2009. As discussed above, even with the increased profitability we achieved in 2010, we currently believe that profit margins are significantly lower than necessary to reasonably justify greenfield or other major expansions of TiO2 capacity. As a result, we anticipate our average selling prices will continue to increase significantly during 2011.
We also expect relative increases in our raw material, energy and freight costs during 2011, including more-than-normal-inflationary increases in the cost of our feedstock ore and petroleum coke. Overall, we currently expect our per metric ton cost of TiO2 we produce will increase approximately 6% to 10% in 2011 as compared to 2010. Given the current conditions in the TiO2 industry, if our costs of production exceed our current expectations in 2011, we believe we could recoup such higher costs through additional selling price increases.
Overall, we expect income from operations will be significantly higher in 2011 as compared to 2010, as the favorable effect of higher selling prices will more than offset the impact of higher production costs.
Our expectations as to the future of the TiO2 industry are based upon a number of factors beyond our control, including worldwide growth of gross domestic product, competition in the marketplace, continued operation of competitors, unexpected or earlier than expected capacity additions or reductions and technological advances. If actual developments differ from our expectations, our results of operations could be unfavorably affected.
- 29 -
LIQUIDITY AND CAPITAL RESOURCES
Consolidated cash flows
Operating activities
Trends in cash flows as a result of our operating activities (excluding the impact of significant asset dispositions and relative changes in assets and liabilities) are generally similar to trends in our earnings.
Cash flows from operating activities provided $126.0 million in 2010 compared to $86.3 million in 2009. This $39.7 million increase was primarily due to the net effects of the following items:
|
·
|
higher income (loss) from operations in 2010 of $194.1 million;
|
|
·
|
higher cash paid for income taxes in 2010 of $21.3 million resulting from our increased profitability;
|
|
·
|
lower cash paid for interest in 2010 of $3.1 due to lower average borrowings in 2010;
|
|
·
|
higher net cash used by related changes in our inventories, receivables, payables and accruals of $145.7 million in 2010 compared to 2009; and
|
|
·
|
lower net distribution from our TiO2 venture in 2010 of $5.3 million due to related changes in their cash requirements.
|
Cash flows from operating activities provided $86.3 million in 2009 compared to $2.7 million in 2008. This $83.6 million increase was primarily due to the net effects of the following items:
|
·
|
lower income (loss) from operations in 2009 of $62.9 million;
|
|
·
|
higher net cash provided by relative changes in our inventories, receivables, payables and accruals of $148.3 million in 2009 as compared to 2008, primarily due to relative changes in our inventory levels, as discussed below; and
|
|
·
|
lower net distributions from our TiO2 joint venture in 2009 of $2.3 million due to related changes in their cash requirements.
|
Changes in working capital are affected by accounts receivable and inventory changes. As shown below:
|
·
|
Our average days sales outstanding decreased at December 31, 2010 compared to December 31, 2009 due to the timing of collections on receivable balances; and
|
|
·
|
Our average days sales in inventory decreased at December 31, 2010 compared to December 31, 2009, as our TiO2 sales volumes in 2010 exceeded our production volumes.
|
For comparative purposes, we have provided prior year numbers below.
|
December 31,
|
December 31,
|
December 31,
|
|
|
2008
|
2009
|
2010
|
|
|
Days sales outstanding
|
64 days
|
56 days
|
55 days
|
|
Days sales in inventory
|
113 days
|
58 days
|
52 days
|
- 30 -
Investing activities
Our capital expenditures were $68.1 million in 2008, $23.7 million in 2009 and $37.7 million in 2010. Capital expenditures are primarily for maintenance to existing facilities. Our capital expenditures during the past three years include an aggregate of approximately $35 million ($20 million in 2010) for our ongoing environmental protection and compliance programs.
In November 2010, we entered into an unsecured revolving demand promissory note with Valhi whereby, as amended, we agreed to loan Valhi up to $175 million. For the year ended December 31, 2010, we loaned a net $61.9 million to Valhi under this agreement. It is likely we will loan additional amounts to Valhi during 2011. See Note 14 to our Consolidated Financial Statements.
During the fourth quarter of 2010, we purchased an aggregate of $49.7 million in marketable equity securities of related parties, including $3.6 million in trades which settled in early 2011. See Note 6 to our Consolidated Financial Statements.
Financing activities
During 2010, we:
|
·
|
repaid $16.7 million under our U.S. credit facility; and
|
|
·
|
repaid net euro 9 million ($8.5 million when borrowed/repaid) under our European credit facility.
|
In November, 2010, we completed a secondary public offering of 8.97 million shares of our common stock in an underwritten offering generating net proceeds of $337.6 million. See Item 5. Market for Common Equity and Related Stockholder Matters and Note 13 to our Consolidated Financial Statements.
During 2009, we:
|
·
|
borrowed a net of $3.0 million under our U.S. credit facility;
|
|
·
|
borrowed and repaid $31.5 million under our European credit facility; and
|
|
·
|
made net payments of $19.2 million on our credit facility with our affiliate NL.
|
During 2008, we:
|
·
|
made net payments of $1.7 million on our U.S. credit facility;
|
|
·
|
borrowed a net of $44.4 million on our European credit facility; and
|
|
·
|
borrowed a net of $19.2 million on our credit facility with our affiliate NL.
|
During 2008, we paid a quarterly dividend to our stockholders of $.25 per share for an aggregate dividend $49.0 million. In February 2009, our Board of Directors suspended the quarterly dividend after considering the challenges and opportunities that exist in the TiO2 industry at the time. We reinstated our quarterly dividend in the fourth quarter of 2010 and we paid a dividend of $.25 per share for an aggregate dividend of $14.5 million.
In February 2011, our board of directors declared a first quarter 2011 regular quarterly dividend of $.25 per share, payable on March 24, 2011 to stockholders of record as of March 10, 2011. In addition, our board of directors also declared a special dividend of $1.00 per share to shareholders of record on February 21, 2011 which we paid on February 28, 2011.
See Item 5. Market For Common Equity and Related Stockholder Matters.
- 31 -
Outstanding debt obligations and borrowing availability
At December 31, 2010, our consolidated debt was comprised of:
|
·
|
euro 400 million principal amount of our 6.5% Senior Secured Notes ($532.8 million) due in 2013; and
|
|
·
|
approximately $6.8 million of other indebtedness.
|
Certain of our credit agreements contain provisions which could result in the acceleration of indebtedness prior to their stated maturity for reasons other than defaults for failure to comply with applicable covenants. For example, certain credit agreements allow the lender to accelerate the maturity of the indebtedness upon a change of control (as defined in the agreement) of the borrower. In addition, certain credit agreements could result in the acceleration of all or a portion of the indebtedness following a sale of assets outside the ordinary course of business. We are in compliance with all of our debt covenants at December 31, 2010. See Note 9 to our Consolidated Financial Statements.
In addition to the outstanding indebtedness indicated above, at December 30, 2010 we have our euro 80 million European Credit Facility, for which no amounts were outstanding and the equivalent of $106.8 million was available for borrowing by our European subsidiaries. In addition, at December 31, 2010, one of our U.S. subsidiaries had a $70 million revolving credit facility, and our Canadian subsidiary had a Cdn. $20 million revolving credit facility, in each case with no outstanding borrowings at such date. We voluntarily terminated these U.S. and Canadian facilities in February 2011 and January 2011, respectively.
On February 17, 2011, we called for the redemption of euro 80 million principal amount of the 6.5% Notes on March 24, 2011. We intend to borrow under our European revolving credit facility discussed above in order to fund such redemption.
Our assets consist primarily of investments in operating subsidiaries, and our ability to service parent level obligations, including the Senior Secured Notes, depends in large part upon the distribution of earnings of our subsidiaries, whether in the form of dividends, advances or payments on account of intercompany obligations or otherwise. None of our subsidiaries have guaranteed the Senior Secured Notes, although KII has pledged 65% of the common stock or other ownership interests of certain of KII’s first-tier operating subsidiaries as collateral for the Senior Secured Notes. The terms of the indenture governing the Senior Secured Notes limits KII’s ability to pay dividends and make other restricted payments. At December 31, 2010, the maximum amount of dividends and other restricted payments that KII could make (the “Restricted Payment Basket”) was approximately $41.9 million.
Liquidity
Our primary source of liquidity on an ongoing basis is cash flows from operating activities which is generally used to (i) fund working capital expenditures, (ii) repay any short-term indebtedness incurred for working capital purposes and (iii) provide for the payment of dividends. From time-to-time we will incur indebtedness, generally to (i) fund short-term working capital needs, (ii) refinance existing indebtedness or (iii) fund major capital expenditures or the acquisition of other assets outside the ordinary course of business. We will also from time-to-time sell assets outside the ordinary course of business and use the proceeds to (i) repay existing indebtedness, (ii) make investments in marketable and other securities, (iii) fund major capital expenditures or the acquisition of other assets outside the ordinary course of business or (iv) pay dividends.
- 32 -
Pricing within the TiO2 industry is cyclical and changes in industry economic conditions significantly impact earnings and operating cash flows. Changes in TiO2 pricing, production volumes and customer demand, among other things, could significantly affect our liquidity.
We routinely evaluate our liquidity requirements, alternative uses of capital, capital needs and availability of resources in view of, among other things, our dividend policy, our debt service, our capital expenditure requirements and estimated future operating cash flows. As a result of this process, we have in the past and may in the future seek to reduce, refinance, repurchase or restructure indebtedness, raise additional capital, repurchase shares of our common stock, modify our dividend policy, restructure ownership interests, sell interests in our subsidiaries or other assets, or take a combination of these steps or other steps to manage our liquidity and capital resources. Such activities have in the past and may in the future involve related companies. In the normal course of our business, we may investigate, evaluate, discuss and engage in acquisition, joint venture, strategic relationship and other business combination opportunities in the TiO2 industry. In the event of any future acquisition or joint venture opportunity, we may consider using then-available liquidity, issuing our equity securities or incurring additional indebtedness.
At December 31, 2010, we had credit available under our European credit facility of approximately $106.8 million. At December 31, 2010, we could borrow such amount without violating any covenants in such facility. Based upon our expectation for the TiO2 industry and anticipated demands on cash resources, we expect to have sufficient liquidity to meet our short term obligations (defined as the twelve-month period ending December 31, 2011) and our long-term obligations (defined as the five-year period ending December 31, 2015, our time period for long-term budgeting). If actual developments differ from our expectations, our liquidity could be adversely affected.
Capital expenditures
We intend to spend approximately $58 million to maintain and improve our existing facilities during 2011, including approximately $21 million in the area of environmental protection and compliance. The majority of our expenditures in 2011 will be to maintain our facilities. Capital spending for 2011 is expected to be funded through cash on hand or borrowing under existing credit facilities.
Off-balance sheet financing
Other than operating lease commitments disclosed in Note 15 to our Consolidated Financial Statements, we are not party to any material off-balance sheet financing arrangements.
Cash, cash equivalents, restricted cash and marketable securities
At December 31, 2010 we had:
|
Held by
|
||||||||||||
|
U.S. Entities
|
Non-U.S. Entities
|
Total
|
||||||||||
|
Cash and cash equivalents
|
$ | 252.1 | $ | 52.6 | $ | 304.7 | ||||||
|
Restricted cash
|
- | 1.9 | 1.9 | |||||||||
|
Marketable equity securities
|
49.7 | - | 49.7 | |||||||||
- 33 -
Related party transactions
We are party to certain transactions with related parties. See Note 14 to our Consolidated Financial Statements. It is our policy to engage in transactions with related parties on terms, in our opinion, no less favorable to us than could be obtained from unrelated parties.
Commitments and contingencies
See Notes 10 and 15 to our Consolidated Financial Statements for a description of certain income tax examinations currently underway, certain legal proceedings and other commitments.
Recent accounting pronouncements
There have been no recent accounting pronouncements expected to have a material impact on our Consolidated Financial Statements for the period ended December 31, 2010.
Debt and Other Contractual Commitments
As more fully described in the Notes to the Consolidated Financial Statements, we are a party to various debt, lease and other agreements which contractually and unconditionally commit us to pay certain amounts in the future. See Notes 9, 14, 15 and 16 to our Consolidated Financial Statements. The timing and amount shown for our commitments in the table below are based upon the contractual payment amount and the contractual payment date for such commitments. The following table summarizes such contractual commitments of ours and our consolidated subsidiaries as of December 31, 2010 by the type and date of payment.
|
Payment due date
|
||||||||||||||||||||
|
Contractual commitment
|
2011
|
2012/ 2013 | 2014/ 2015 |
2016 and
after
|
Total
|
|||||||||||||||
|
(In millions)
|
||||||||||||||||||||
|
Indebtedness(1)
|
$ | 2.2 | $ | 536.2 | $ | .9 | $ | .3 | $ | 539.6 | ||||||||||
|
Interest payments onindebtedness (2)
|
34.9 | 46.4 | - | - | 81.3 | |||||||||||||||
|
Operating leases
|
10.4 | 11.6 | 6.1 | 18.0 | 46.1 | |||||||||||||||
|
Long-term supply contracts for the purchase of TiO2 feedstock (3)
|
260.0 | 185.0 | 147.0 | - | 592.0 | |||||||||||||||
|
Long-term service and other supply contracts (4)
|
53.4 | 50.8 | 26.6 | 1.2 | 132.0 | |||||||||||||||
|
Fixed asset acquisitions
|
23.4 | - | - | - | 23.4 | |||||||||||||||
|
Estimated tax obligations (5)
|
7.8 | - | - | - | 7.8 | |||||||||||||||
| $ | 392.1 | $ | 830.0 | $ | 180.6 | $ | 19.5 | $ | 1,422.2 | |||||||||||
- 34 -
|
(1)
|
A significant portion of the amount shown for indebtedness relates to our 6.5% Senior Secured Notes ($532.8 million at December 31, 2010). Such indebtedness is denominated in euro. See Item 7A – “Quantitative and Qualitative Disclosures About Market Risk” and Note 9 to the Consolidated Financial Statements.
|
|
(2)
|
The amounts shown for interest for any outstanding variable-rate indebtedness is based upon the December 31, 2010 interest rates and assumes that such variable-rate indebtedness remains outstanding until maturity.
|
|
(3)
|
Our contracts for the purchase of TiO2 feedstock contain fixed quantities that we are required to purchase, although certain of these contracts allow for an upward or downward adjustment in the quantity purchased, generally no more than 10%, based on our feedstock requirements. The pricing under these agreements is generally based on a fixed price with price escalation clauses primarily based on consumer price indices, as defined in the respective contracts. The timing and amount shown for our commitments related to the long-term supply contracts for TiO2 feedstock are based upon our current estimate of the quantity of material that will be purchased in each time period shown, the payment that would be due based upon such estimated purchased quantity and an estimate of the effect of the price escalation clause. The actual amount of material purchased and the actual amount that would be payable by us, may vary from such estimated amounts. Our obligation for the purchase of TiO2 feedstock is more fully described in Note 15 to our Consolidated Financial Statements and above in “Business – raw materials.”
|
|
(4)
|
The amounts shown for the long-term service and other supply contracts primarily pertain to agreements we have entered into with various providers of products or services which help to run our plant facilities (electricity, natural gas, etc.), utilizing December 31, 2010 exchange rates. See Note 15 to our Consolidated Financial Statements.
|
|
(5)
|
The amount shown for estimated tax obligations is the consolidated amount of net income taxes payable at December 31, 2010, which is assumed to be paid during 2011.
|
The above table does not reflect:
|
·
|
Any amounts we might pay to fund our defined benefit pension plans and OPEB plans, as the timing and amount of any such future fundings are unknown and dependent on, among other things, the future performance of defined benefit pension plan assets, interest rate assumptions and actual future retiree medical costs. We expect to be required to contribute approximately $28 million to our defined benefit pension plans and OPEB plans during 2011. Such defined benefit pension plans and OPEB plans are discussed below in greater detail. See Note 11 to our Consolidated Financial Statements.
|
|
·
|
Any amounts we might pay related to our asset retirement obligations as the terms and amounts of such future fundings are unknown;
|
|
·
|
Any amounts we might pay to settle any of our uncertain tax positions, as the timing and amount of any such future settlements are unknown and dependent on, among other things, the timing of tax audits. See Note 10 to our Consolidated Financial Statements; and
|
|
·
|
Any amounts we might pay to acquire TiO2 from our TiO2 manufacturing joint venture, as the timing and amount of such purchases are unknown and dependent on, among other things, the amount of TiO2 produced by the joint venture in the future and the joint venture’s future cost of producing such TiO2. However, the table does include amounts related to our share of the joint venture’s ore requirements necessary to produce TiO2 for us. See Item 1, “Business” and Note 5 to our Consolidated Financial Statements.
|
- 35 -
We occasionally enter into raw material supply arrangements to mitigate the short-term impact of future increases in raw material costs. While these arrangements do not necessarily commit us to a minimum volume of purchase, they generally provide for stated unit prices based upon achievement of specified volume purchase levels. This allows us to stabilize raw material purchase prices to a certain extent, provided the specified minimum monthly purchase quantities are met.
Defined benefit pension plans
We maintain various defined benefit pension plans in the U.S., Europe and Canada. See Note 11 to our Consolidated Financial Statements.
Under defined benefit pension plan accounting, defined benefit pension plan expense and pension assets and accrued pension costs are each recognized based on certain actuarial assumptions, principally the assumed discount rate, the assumed long-term rate of return on plan assets and the assumed increase in future compensation levels. We recognize the full funded status of our defined benefit pension plans as either an asset (for overfunded plans) or a liability (for underfunded plans) in our Consolidated Balance Sheet.
We recognized consolidated defined benefit pension plan expense of $8.8 million in 2008, $22.3 million in 2009 and $22.8 million in 2010. In the fourth quarter of 2008 we recognized a $6.9 million pension adjustment in connection with the correction of our pension expense previously recognized for 2006 and 2007. See Note 11 to our Consolidated Financial Statements. The amount of funding requirements for these defined benefit pension plans is generally based upon applicable regulations (such as ERISA in the U.S.) and will generally differ from pension expense for financial reporting purposes. We made contributions to all of our plans which aggregated $20.8 million in 2008, $23.1 million in 2009 and $24.6 million in 2010.
The discount rates we use for determining defined benefit pension expense and the related pension obligations are based on current interest rates earned on long-term bonds that receive one of the two highest ratings given by recognized rating agencies in the applicable country where the defined benefit pension benefits are being paid. In addition, we receive third-party advice about appropriate discount rates, and these advisors may in some cases use their own market indices. We adjust these discount rates as of each December 31 valuation date to reflect then-current interest rates on such long-term bonds. We use these discount rates to determine the actuarial present value of the pension obligations as of December 31 of that year. We also use these discount rates to determine the interest component of defined benefit pension expense for the following year.
At December 31, 2010, approximately 59%, 21%, 13% and 3% of the projected benefit obligations related to our plans in Germany, Canada, Norway and the U.S., respectively. We use several different discount rate assumptions in determining our consolidated defined benefit pension plan obligation and expense. This is because we maintain defined benefit pension plans in several different countries in Europe and North America and the interest rate environment differs from country to country.
We used the following discount rates for our defined benefit pension plans:
|
Discount rates used for:
|
||||||||||||
|
Obligations at
December 31, 2008
and expense in 2009
|
Obligations at December 31, 2009 and expense in 2010
|
Obligations at December 31, 2010 and expense in 2011
|
||||||||||
|
Germany
|
5.8 | % | 5.5 | % | 5.2 | % | ||||||
|
Canada
|
6.5 | % | 6.0 | % | 5.2 | % | ||||||
|
Norway
|
5.8 | % | 5.3 | % | 4.8 | % | ||||||
|
U.S.
|
6.1 | % | 5.7 | % | 5.1 | % | ||||||
- 36 -
The assumed long-term rate of return on plan assets represents the estimated average rate of earnings expected to be earned on the funds invested or to be invested in the plans’ assets provided to fund the benefit payments inherent in the projected benefit obligations. Unlike the discount rate, which is adjusted each year based on changes in current long-term interest rates, the assumed long-term rate of return on plan assets will not necessarily change based upon the actual short-term performance of the plan assets in any given year. Defined benefit pension expense each year is based upon the assumed long-term rate of return on plan assets for each plan, the actual fair value of the plan assets as of the beginning of the year and an estimate of the amount of contributions to and distributions from the plan during the year. Differences between the expected return on plan assets for a given year and the actual return are deferred and amortized over future periods based either upon the expected average remaining service life of the active plan participants (for plans for which benefits are still being earned by active employees) or the average remaining life expectancy of the inactive participants (for plans for which benefits are not still being earned by active employees).
At December 31, 2010, approximately 52%, 24%, 17% and 4% of the plan assets related to our plans in the Germany, Canada, Norway and the U.S., respectively. We use several different long-term rates of return on plan asset assumptions in determining our consolidated defined benefit pension plan expense. This is because the plan assets in different countries are invested in a different mix of investments and the long-term rates of return for different investments differ from country to country.
In determining the expected long-term rate of return on plan asset assumptions, we consider the long-term asset mix (e.g. equity vs. fixed income) for the assets for each of our plans and the expected long-term rates of return for such asset components. In addition, we receive third-party advice about appropriate long-term rates of return. Such assumed asset mixes are summarized below:
|
·
|
In Germany, the composition of our plan assets is established to satisfy the requirements of the German insurance commissioner.
|
|
·
|
In Canada, we currently have a plan asset target allocation of 55% to equity securities, 45% to fixed income securities and the remainder primarily to cash and liquid investments. We expect the long-term rate of return for such investments to average approximately 125 basis points above the applicable equity or fixed income index.
|
|
·
|
In Norway, we currently have a plan asset target allocation of 14% to equity securities, 72% to fixed income securities, and the remainder primarily to cash and liquid investments. The expected long-term rate of return for such investments is approximately 9.0%, 5.0%, and 4.0%, respectively.
|
|
·
|
In the U.S. substantially all of the assets are invested in The Combined Master Retirement Trust (“CMRT”), a collective investment trust sponsored by Contran to permit the collective investment by certain master trusts which fund certain employee benefits plans sponsored by Contran and certain of its affiliates. Harold C. Simmons is the sole trustee of the CMRT and is a member of the CMRT investment committee. The CMRT’s long-term investment objective is to provide a rate of return exceeding a composite of broad market equity and fixed income indices (including the S&P 500 and certain Russell indices), while utilizing both third-party investment managers as well as investments directed by Mr. Simmons. The CMRT holds TIMET common stock in its investment portfolio; however through December 31, 2009 we invested in a portion of the CMRT which does not include the TIMET holdings. Beginning in 2010, we now invest in the portion of the CMRT that holds such stock. During the history of the CMRT from its inception in 1988 through December 31, 2010, the average annual rate of return (excluding the CMRT’s investment in TIMET common stock) has been 12%, while such annual rate of return including TIMET common stock has been 15%.
|
- 37 -
Our pension plan weighted average asset allocations by asset category were as follows:
|
December 31, 2010
|
||||||||||||||||
|
Germany
|
Canada
|
Norway
|
CMRT
|
|||||||||||||
|
Equity securities and limited
partnerships
|
17 | % | 59 | % | 17 | % | 83 | % | ||||||||
|
Fixed income securities
|
61 | 39 | 68 | 16 | ||||||||||||
|
Real estate
|
11 | - | 2 | - | ||||||||||||
|
Cash, cash equivalents and other
|
11 | 2 | 13 | 1 | ||||||||||||
|
Total
|
100 | % | 100 | % | 100 | % | 100 | % | ||||||||
|
December 31, 2009
|
||||||||||||||||
|
Germany
|
Canada
|
Norway
|
CMRT
|
|||||||||||||
|
Equity securities and limited
partnerships
|
18 | % | 58 | % | 18 | % | 68 | % | ||||||||
|
Fixed income securities
|
61 | 40 | 80 | 31 | ||||||||||||
|
Real estate
|
12 | - | - | 1 | ||||||||||||
|
Cash, cash equivalents and other
|
9 | 2 | 2 | - | ||||||||||||
|
Total
|
100 | % | 100 | % | 100 | % | 100 | % | ||||||||
We regularly review our actual asset allocation for each non-US plan and will periodically rebalance the investments in each plan to more accurately reflect the targeted allocation when considered appropriate. The CMRT trustee and investment committee do not maintain a specific target asset allocation in order to achieve their objectives, but instead they periodically change the asset mix of the CMRT based upon, among other things, advice they receive from third-party advisors and their expectations regarding potential returns for various investment alternatives and what asset mix will generate the greatest overall return.
Our assumed long-term rates of return on plan assets for 2008, 2009 and 2010 were as follows:
|
2008
|
2009
|
2010
|
||||||||||
|
Germany
|
5.3 | % | 5.3 | % | 5.0 | % | ||||||
|
Canada
|
6.3 | % | 6.0 | % | 6.0 | % | ||||||
|
Norway
|
6.1 | % | 5.8 | % | 5.0 | % | ||||||
|
U.S.
|
10.0 | % | 10.0 | % | 10.0 | % | ||||||
We currently expect to use the same long-term rate of return on plan asset assumptions in 2011 as we used in 2010 for purposes of determining the 2011 defined benefit pension plan expense.
To the extent that a plan’s particular pension benefit formula calculates the pension benefit in whole or in part based upon future compensation levels, the projected benefit obligations and the pension expense will be based in part upon expected increases in future compensation levels. For all of our plans for which the benefit formula is so calculated, we generally base the assumed expected increase in future compensation levels upon average long-term inflation rates for the applicable country.
In addition to the actuarial assumptions discussed above, the amount of recognized defined benefit pension expense and the amount of net pension asset and net pension liability will vary based upon relative changes in currency exchange rates.
- 38 -
A reduction in the assumed discount rate generally results in an actuarial loss, as the actuarially-determined present value of estimated future benefit payments will increase. Conversely, an increase in the assumed discount rate generally results in an actuarial gain. In addition, an actual return on plan assets for a given year that is greater than the assumed return on plan assets results in an actuarial gain, while an actual return on plan assets that is less than the assumed return results in an actuarial loss. Other actual outcomes that differ from previous assumptions, such as individuals living longer or shorter than assumed in mortality tables, which are also used to determine the actuarially-determined present value of estimated future benefit payments, changes in such mortality table themselves or plan amendments, will also result in actuarial losses or gains. These amounts are recognized in other comprehensive income. In addition, any actuarial gains generated in future periods would reduce the negative amortization effect of any cumulative unrecognized actuarial losses, while any actuarial losses generated in future periods would reduce the favorable amortization effect of any cumulative unrecognized actuarial gains.
During 2010, all of our defined benefit pension plans generated a combined net actuarial loss of approximately $13.9 million. This actuarial loss resulted primarily from the net effects of (i) the overall return on plan assets being in excess of the assumed return and (ii) the general reduction in discount rates from December 31, 2009 to December 31, 2010.
Based on the actuarial assumptions described above and our current expectation for what actual average currency exchange rates will be during 2011, we expect our defined benefit pension expense will approximate $23 million in 2011. In comparison, we expect to be required to contribute approximately $28 million to such plans during 2011.
As noted above, defined benefit pension expense and the amounts recognized as accrued pension costs are based upon the actuarial assumptions discussed above. We believe all of the actuarial assumptions used are reasonable and appropriate. However, if we had lowered the assumed discount rate by 25 basis points for all plans as of December 31, 2010, our aggregate projected benefit obligations would have increased by approximately $16.5 million at that date and our defined benefit pension expense would be expected to increase by approximately $1.2 million during 2010. Similarly, if we lowered the assumed long-term rate of return on plan assets by 25 basis points for all of our plans, our defined benefit pension expense would be expected to increase by approximately $.8 million during 2010.
OPEB plans
Certain subsidiaries of ours in the U.S. and Canada currently provide certain health care and life insurance benefits for eligible retired employees. See Note 11 to the Consolidated Financial Statements. Under other postretirement employee benefits (OPEB) accounting, OPEB expense and accrued OPEB costs are based on certain actuarial assumptions, principally the assumed discount rate and the assumed rate of increases in future health care costs. We recognize the full unfunded status of our OPEB plans as a liability.
We recognized consolidated OPEB cost of approximately $.9 million in 2008, $.6 million in 2009 and $1.2 million in 2010. Similar to defined benefit pension benefits, the amount of funding will differ from the expense recognized for financial reporting purposes and contributions to the plans to cover benefit payments aggregated $.4 million in each of 2008 and 2009 and $.5 million in 2010. Substantially all of our U.S. accrued OPEB cost relates to benefits being paid to current retirees and their dependents and no material amount of OPEB benefits are being earned by current U.S. employees. Some of our Canadian employees are earning OPEB benefits. Due to continued increases in healthcare costs, it is expected that our OPEB expense for financial reporting purposes will be consistent with the past two years. Our expected OPEB benefit payments for 2011 are expected to be similar amounts.
- 39 -
The discount rates we use for determining OPEB expense and the related OPEB obligations are based on current interest rates earned on high-quality bond yields in the applicable country where the benefits are being paid. In addition, we receive third-party advice about appropriate discount rates, and these advisors may in some cases use their own market indices. We adjust these discount rates as of each valuation date to reflect then-current interest rates on such bonds. We use these discount rates to determine the actuarial present value of the OPEB obligations as of December 31 of that year. We also use these discount rates to determine the interest component of OPEB expense for the following year.
In estimating the health care cost trend rate, we consider our actual health care cost experience, future benefit structures, industry trends and advice from our third-party actuaries. During each of the past three years, we have assumed that the relative increase in health care costs will generally trend downward over the next several years, reflecting, among other things, assumed increases in efficiency in the health care system and industry-wide cost containment initiatives. For example, at December 31, 2010, the expected rate of increase in future health care costs ranges from 8.0% in 2011, declining to 5.0% in 2016 and thereafter.
Based on the actuarial assumptions described above and our current expectation for what actual average currency exchange rates will be during 2011, we expect our consolidated OPEB expense will approximate $.2 million in 2011. In comparison, we expect to be required to make approximately $.5 million of contributions to such plans during 2011.
In the fourth quarter of 2010, we amended our benefit formula for most participants of our plans effective January 1, 2011, resulting in a prior service credit of approximately $5.8 million as of December 31, 2010. Key assumptions including the health care cost trend rate as of December 31, 2010 now reflect these plan revisions to the benefit formula. As a result, our 2011 expected expense reflects the amortization of this credit.
We believe that all of the actuarial assumptions used are reasonable and appropriate. However, a 25 basis point change in assumed discount rates would have the following effects:
|
25 basis
point increase
|
25 basis
point decrease
|
|||||||
|
(In millions)
|
||||||||
|
Effect on net OPEB cost during 2010
|
$ | - | $ | - | ||||
|
Effect at December 31, 2010 on
postretirement obligation
|
(.4 | ) | .4 | |||||
Assumed health care cost trend rates have a significant effect on the amounts we report for health care plans. A one percent change in assumed health care trend rates would have the following effects:
|
1% Increase
|
1% Decrease
|
|||||||
|
(In millions)
|
||||||||
|
Effect on net OPEB cost during 2010
|
$ | .3 | $ | (.2 | ) | |||
|
Effect at December 31, 2010 on
postretirement obligation
|
.2 | (.2 | ) | |||||
- 40 -
Operations outside the United States
As discussed above, we have substantial operations located outside the United States for which the functional currency is not the U.S. dollar. As a result, the reported amount of our assets and liabilities related to our non-U.S. operations, and therefore our consolidated net assets, will fluctuate based upon changes in currency exchange rates. At December 31, 2010, we had substantial net assets denominated in the euro, Canadian dollar, Norwegian krone and United Kingdom pound sterling.
ITEM 7A. QUANTITATIVE AND QUALITATIVE DISCLOSURES ABOUT MARKET RISK
General
We are exposed to market risk from changes in interest rates, currency exchange rates and raw materials prices.
Interest rates
We are exposed to market risk from changes in interest rates, primarily related to indebtedness. At December 31, 2009 and 2010, the majority of our aggregate indebtedness was comprised of fixed-rate instruments. The large percentage of fixed-rate debt instruments minimizes earnings volatility that would result from changes in interest rates. The following table presents principal amounts and weighted average interest rates for our aggregate outstanding indebtedness at December 31, 2010. Information shown below for such non-U.S. dollar denominated indebtedness is presented in its U.S. dollar equivalent at December 31, 2010 using an exchange rate of 1.3350 U.S. dollars per euro. See Note 9 to our Consolidated Financial Statements.
|
Amount
|
||||||||||||||||
|
Indebtedness
|
Carrying
value
|
Fair
value
|
Interest
rate
|
Maturity
date
|
||||||||||||
|
(In millions)
|
||||||||||||||||
|
As of December 31, 2010:
|
||||||||||||||||
|
Fixed-rate indebtedness - euro-denominated:
|
||||||||||||||||
|
Senior Secured Notes
|
$ | 532.8 | $ | 536.0 | 6.5 | % | 2013 | |||||||||
|
As of December 31, 2009:
|
||||||||||||||||
|
Fixed-rate indebtedness - euro-denominated:
|
||||||||||||||||
|
Senior Secured Notes
|
$ | 574.6 | $ | 466.2 | 6.5 | % | 2013 | |||||||||
|
Variable rate indebtedness:
|
||||||||||||||||
|
U.S. credit facility – dollar denominated
|
$ | 16.7 | $ | 16.7 | 3.3 | % | 2011 | |||||||||
|
Europe credit facility – euro denominated
|
13.0 | 13.0 | 3.5 | % | 2013 | |||||||||||
| $ | 29.7 | $ | 29.7 | |||||||||||||
Currency exchange rates
We are exposed to market risk arising from changes in currency exchange rates as a result of manufacturing and selling our products worldwide. Earnings are primarily affected by fluctuations in the value of the U.S. dollar relative to the euro, the Canadian dollar, the Norwegian krone and the United Kingdom pound sterling.
As described above, at December 31, 2010, we had the equivalent of $532.8 million of outstanding euro-denominated indebtedness (at December 31, 2009 – the equivalent of $587.6 million of euro-denominated indebtedness). The potential increase in the U.S. dollar equivalent of the principal amount outstanding resulting from a hypothetical 10% adverse change in exchange rates at such date would be approximately $58.9 million and $53.4 million at December 31, 2009 and 2010, respectively.
- 41 -
Certain of our sales generated by our non-U.S. operations are denominated in U.S. dollars. We periodically use currency forward contracts to manage a very nominal portion of currency exchange rate risk associated with trade receivables denominated in a currency other than the holder's functional currency or similar exchange rate risk associated with future sales. We have not entered into these contracts for trading or speculative purposes in the past, nor do we currently anticipate entering into such contracts for trading or speculative purposes in the future.
At December 31, 2010, we had currency forward contracts to exchange:
|
·
|
an aggregate of $66.0 million for an equivalent value of Canadian dollars at exchange rates ranging from Cdn. $1.05 to Cdn. $1.08 per U.S. dollar. These contracts with Wachovia Bank, National Association, mature from January 2011 through December 2011 at a rate of $5.5 million per month, subject to early redemption provisions at our option.
|
|
·
|
an aggregate $20.1 million for an equivalent value of Norwegian kroner at exchange rates ranging from kroner 5.94 to kroner 6.60 per U.S. dollar. These contracts with DnB Nor Bank ASA mature from January 2011 through July 2011 at a rate of $2.3 million to $5.5 million per month.
|
|
·
|
an aggregate euro 17.8 million for an equivalent value of Norwegian kroner at exchange rates ranging from kroner 8.16 to kroner 8.28 per euro. These contracts with DnB Nor Bank ASA mature from January 2011 through August 2011 at a rate of euro 1.8 million to euro 2.5 million per month, subject to early redemption provisions at our option.
|
The estimated fair value of such currency forward contracts at December 31, 2010 was a $6.3 million net asset, which amount is recognized as part of Accounts and other receivables in our Consolidated Balance Sheet and a corresponding $6.3 million currency transaction gain in our Consolidated Statement of Operations. To the extent we held such contracts during 2008, 2009 and 2010, we did not use hedge accounting for any of our contracts.
See Note 16 to our Consolidated Financial Statements.
Marketable equity security prices
We are exposed to market risk due to changes in prices of the marketable equity securities which we own. The fair value of equity securities at December 31, 2010 was $49.7 million. The potential change in the aggregate fair value of these investments, assuming a 10% change in prices, would be approximately $5 million at December 31, 2010. We held no marketable equity securities at December 31, 2009.
Raw materials
We are exposed to market risk from changes in commodity prices relating to our raw materials. As discussed in Item 1 we generally enter into long-term supply agreements for certain of our raw material requirements including ore. Many of our raw material contracts contain fixed quantities we are required to purchase, although these contracts allow for an upward or downward adjustment in the quantity purchased. Raw material pricing under these agreements is generally negotiated annually. For certain raw material requirements we do not have long-term supply agreements either because we have assessed the risk of the unavailability of those raw materials and/or the risk of a significant change in the cost of those raw materials to be low, or because long-term supply agreements for those raw materials are generally not available.
- 42 -
Other
We believe there may be a certain amount of incompleteness in the sensitivity analyses presented above. For example, the hypothetical effect of changes in exchange rates discussed above ignores the potential effect on other variables which affect our results of operations and cash flows, such as demand for our products, sales volumes and selling prices and operating expenses. Accordingly, the amounts presented above are not necessarily an accurate reflection of the potential losses we would incur assuming the hypothetical changes in exchange rates were actually to occur.
The above discussion and estimated sensitivity analysis amounts include forward-looking statements of market risk which assume hypothetical changes in currency exchange rates. Actual future market conditions will likely differ materially from such assumptions. Accordingly, such forward-looking statements should not be considered to be projections by us of future events, gains or losses.
ITEM 8. FINANCIAL STATEMENTS AND SUPPLEMENTARY DATA
The information called for by this Item is contained in a separate section of this Annual Report. See "Index of Financial Statements and Schedules" (page F-1).
|
ITEM 9.
|
CHANGES IN AND DISAGREEMENTS WITH ACCOUNTANTS ON ACCOUNTING AND FINANCIAL DISCLOSURE
|
None.
ITEM 9A. CONTROLS AND PROCEDURES
Evaluation of Disclosure Controls and Procedures
We maintain a system of disclosure controls and procedures. The term "disclosure controls and procedures," as defined by Exchange Act Rule 13a-15(e), means controls and other procedures that are designed to ensure that information required to be disclosed in the reports that we file or submit to the SEC under the Securities Exchange Act of 1934, as amended (the "Act"), is recorded, processed, summarized and reported, within the time periods specified in the SEC's rules and forms. Disclosure controls and procedures include, without limitation, controls and procedures designed to ensure that information we are required to disclose in the reports we file or submit to the SEC under the Act is accumulated and communicated to our management, including our principal executive officer and our principal financial officer, or persons performing similar functions, as appropriate to allow timely decisions to be made regarding required disclosure. Each of Steven L. Watson, our Chief Executive Officer and Gregory M. Swalwell, our Executive Vice President and Chief Financial Officer, have evaluated the design and effectiveness of our disclosure controls and procedures as of December 31, 2010. Based upon their evaluation, these executive officers have concluded that our disclosure controls and procedures are effective as of December 31, 2010.
- 43 -
Scope of Management Report on Internal Control Over Financial Reporting
We also maintain internal control over financial reporting. The term “internal control over financial reporting,” as defined by Exchange Act Rule 13a-15(f) means a process designed by, or under the supervision of, our principal executive and principal financial officers, or persons performing similar functions, and effected by the board of directors, management and other personnel, to provide reasonable assurance regarding the reliability of financial reporting and the preparation of financial statements for external purposes in accordance with GAAP, and includes those policies and procedures that:
|
·
|
Pertain to the maintenance of records that in reasonable detail accurately and fairly reflect the transactions and dispositions of our assets,
|
|
·
|
Provide reasonable assurance that transactions are recorded as necessary to permit preparation of financial statements in accordance with GAAP, and that receipts and expenditures are being made only in accordance with authorizations of management and directors and
|
|
·
|
Provide reasonable assurance regarding prevention or timely detection of an unauthorized acquisition, use or disposition of assets that could have a material effect on our Condensed Consolidated Financial Statements.
|
Section 404 of the Sarbanes-Oxley Act of 2002 requires us to report on internal control over financial reporting in this Annual Report on Form 10-K for the year ended December 31, 2010. Under the rules of the SEC, our independent registered public accounting firm is not required to, and therefore has not, audited our internal control over financial reporting as of December 31, 2010.
As permitted by the SEC, our assessment of internal control over financial reporting excludes (i) internal control over financial reporting of equity method investees and (ii) internal control over the preparation of our financial statement schedules required by Article 12 of Regulation S-X. However, our assessment of internal control over financial reporting with respect to equity method investees did include controls over the recording of amounts related to our investment that are recorded in the consolidated financial statements, including controls over the selection of accounting methods for our investments, the recognition of equity method earnings and losses and the determination, valuation and recording of our investment account balances.
Changes in Internal Control Over Financial Reporting
There has been no change to our internal control over financial reporting during the quarter ended December 31, 2010 that has materially affected, or is reasonably likely to materially affect, our internal control over financial reporting.
Management’s Report on Internal Control Over Financial Reporting
Our management is responsible for establishing and maintaining adequate internal control over financial reporting, as such term is defined in Exchange Act Rules 13a-15(f) and 15d-15(f). Our evaluation of the effectiveness of internal control over financial reporting is based upon the criteria established in Internal Control – Integrated Framework issued by the Committee of Sponsoring Organizations of the Treadway Commission (commonly referred to as the “COSO” framework). Based on our evaluation under that framework, we have concluded that our internal control over financial reporting was effective as of December 31, 2010.
- 44 -
This annual report does not include an attestation report of our independent registered public accounting firm regarding our internal control over financial reporting. Management’s report was not subject to attestation by our independent registered public accounting firm pursuant to rules of the SEC that permit us to provide only management’s report in this annual report. See “Scope of Management’s Report on Internal Control Over Financial Reporting” above.
Certifications
Our chief executive officer is required to annually file a certification with the New York Stock Exchange (“NYSE”), certifying our compliance with the corporate governance listing standards of the NYSE. During 2010, our chief executive officer filed such annual certification with the NYSE. The 2010 certification was unqualified.
Our chief executive officer and chief financial officer are also required to, among other things, quarterly file certifications with the SEC regarding the quality of our public disclosures, as required by Section 302 of the Sarbanes-Oxley Act of 2002. The certifications for the quarter ended December 31, 2010 have been filed as Exhibits 31.1 and 31.2 to this Annual Report on Form 10-K.
ITEM 9B. OTHER INFORMATION
Not applicable.
PART III
ITEM 10. DIRECTORS, EXECUTIVE OFFICERS AND CORPORATE GOVERNANCE
The information required by this Item is incorporated by reference to our 2011 definitive proxy statement to be filed with the SEC pursuant to Regulation 14A within 120 days after the end of the fiscal year covered by this report.
ITEM 11. EXECUTIVE COMPENSATION
The information required by this Item is incorporated by reference to our 2011 proxy statement.
ITEM 12. SECURITY OWNERSHIP OF CERTAIN BENEFICIAL OWNERS AND MANAGEMENT AND RELATED STOCKHOLDER MATTERS
The information required by this Item is incorporated by reference to our 2011 proxy statement.
ITEM 13. CERTAIN RELATIONSHIPS AND RELATED TRANSACTIONS, AND DIRECTOR INDEPENDENCE
The information required by this Item is incorporated by reference to our 2011 proxy statement. See also Note 14 to our Consolidated Financial Statements.
ITEM 14. PRINCIPAL ACCOUNTING FEES AND SERVICES
The information required by the Item is incorporated by reference to our 2011 proxy statement.
- 45 -
PART IV
ITEM 15. EXHIBITS AND FINANCIAL STATEMENT SCHEDULES
(a) and (c) Financial Statements and Schedule
The Registrant
The consolidated financial statements and schedule of the Registrant listed on the accompanying Index of Financial Statements and Schedules (see page F-1) are filed as part of this Annual Report.
|
(b)
|
Exhibits
|
Included as exhibits are the items listed in the Exhibit Index. We will furnish a copy of any of the exhibits listed below upon payment of $4.00 per exhibit to cover our costs to furnish the exhibits. Pursuant to Item 601(b)(4)(iii) of Regulation S-K, any instrument defining the rights of holders of long-term debt issues and other agreements related to indebtedness which do not exceed 10% of consolidated total assets as of December 31, 2010 will be furnished to the Commission upon request.
We will also furnish, without charge, a copy of our Code of Business Conduct and Ethics, as adopted by the board of directors on February 19, 2004, upon request. Such requests should be directed to the attention of the Corporate Secretary at our corporate offices located at 5430 LBJ Freeway, Suite 1700, Dallas, TX 75240.
Item No. Exhibit Index
|
2.1
|
Form of Distribution Agreement between NL Industries, Inc. and Kronos Worldwide, Inc. – incorporated by reference to Exhibit 2.1 of the Registration Statement on Form 10 of the Registrant (File No. 001-31763).
|
|
3.1
|
First Amended and Restated Certificate of Incorporation of Kronos Worldwide, Inc. – incorporated by reference to Exhibit 3.1 of the Registration statement on Form 10 of the Registrant (File No. 001-31763).
|
|
3.2
|
Amended and Restated Bylaws of Kronos Worldwide, Inc. as of October 25, 2007 – incorporated by reference to Exhibit 3.1 of the Registrant’s Current Report on Form 8-K filed (File No. 001-31763) with the U.S. Securities and Exchange Commission on October 31, 2007.
|
|
4.1
|
Indenture governing the 6.5% Senior Secured Notes due 2013, dated as of April 11, 2006, between Kronos International, Inc. and Bank of New York, as trustee -
|
|
|
incorporated by reference to Exhibit 4.1 to the Current Report on Form 8-K of Kronos International, Inc. (File No. 333-100047) that was filed with the U.S. Securities and Exchange Commission on April 11, 2006.
|
|
4.2
|
Form of certificate of Series A 6.5% Senior Secured Note due 2013 - incorporated by reference to Exhibit 4.2 to the Current Report on Form 8-K of Kronos International, Inc. (File No. 333-100047) that was filed with the U.S. Securities and Exchange Commission on April 11, 2006.
|
- 46 -
|
4.3
|
Form of certificate of Series B 6.5% Senior Secured Note due 2013 - incorporated by reference to Exhibit 4.3 to the Current Report on Form 8-K of Kronos International, Inc. (File No. 333-100047) that was filed with the U.S. Securities and Exchange Commission on April 11, 2006.
|
|
4.4
|
Purchase Agreement dated April 5, 2006 between Kronos International, Inc. and Deutsche Bank AG London - incorporated by reference to Exhibit 4.1 to the Current Report on Form 8-K of Kronos International, Inc. (File No. 333-100047) that was filed with the U.S. Securities and Exchange Commission on April 11, 2006.
|
|
4.5
|
Registration Rights Agreement dated as of April 11, 2006 between Kronos International, Inc. and Deutsche Bank AG London - incorporated by reference to Exhibit 4.5 to the Current Report on Form 8-K of Kronos International, Inc. (File No. 333-100047) that was filed with the U.S. Securities and Exchange Commission on April 11, 2006.
|
|
4.6
|
Collateral Agency Agreement, dated April 11, 2006, among The Bank of New York, U.S. Bank, N.A. and Kronos International, Inc. - incorporated by reference to Exhibit 4.6 to the Current Report on Form 8-K of Kronos International, Inc. (File No. 333-100047) that was filed with the U.S. Securities and Exchange Commission on April 11, 2006.
|
|
4.7
|
Security Over Shares Agreement, dated April 11, 2006, between Kronos International, Inc. and The Bank of New York - incorporated by reference to Exhibit 4.7 to the Current Report on Form 8-K of Kronos International, Inc. (File No. 333-100047) that was filed with the U.S. Securities and Exchange Commission on April 11, 2006.
|
|
4.8
|
Pledge of Shares (shares in Kronos Denmark ApS), dated April 11, 2006, between Kronos International, Inc. and U.S. Bank, N.A. - incorporated by reference to Exhibit 4.8 to the Current Report on Form 8-K of Kronos International, Inc. (File No. 333-100047) that was filed with the U.S. Securities and Exchange Commission on April 11, 2006.
|
|
4.9
|
Pledge Agreement (shares in Societe Industrielle du Titane S.A.), dated April 11, 2006, between Kronos International, Inc. and U.S. Bank, N.A. - incorporated by reference to Exhibit 4.9 to the Current Report on Form 8-K of Kronos International, Inc. (File No. 333-100047) that was filed with the U.S. Securities and Exchange Commission on April 11, 2006.
|
|
4.10
|
Share Pledge Agreement (shares in Kronos Titan GmbH), dated April 11, 2006, between Kronos International, Inc. and U.S. Bank, N.A. - incorporated by reference to Exhibit 4.10 to the Current Report on Form 8-K of Kronos International, Inc. (File No. 333-100047) that was filed with the U.S. Securities and Exchange Commission on April 11, 2006.
|
|
10.1
|
Form of Tax Agreement between Valhi, Inc. and Kronos Worldwide, Inc. – incorporated by reference to Exhibit 10.1 of the Registration statement on Form 10 of the Registrant (File No. 001-31763).
|
|
10.2
|
Intercorporate Services Agreement by and between Contran Corporation and Kronos Worldwide, Inc., effective as of January 1, 2004 – incorporated by reference to Exhibit 10.2 to the Quarterly Report on Form 10-Q of the Registrant (File No. 001-31763) for the quarter ended March 31, 2004.
|
- 47 -
|
10.3*
|
Form of Kronos Worldwide, Inc. 2003 Long-Term Incentive Plan – incorporated by reference to Exhibit 10.4 of the Registration statement on Form 10 of the Registrant (File No. 001-31763).
|
|
10.4
|
Euro 80,000,000 Facility Agreement, dated June 25, 2002, among Kronos Titan GmbH & Co. OHG, Kronos Europe S.A./N.V., Kronos Titan A/S and Titania A/S, as borrowers, Kronos Titan GmbH & Co. OHG, Kronos Europe S.A./N.V. and Kronos Norge AS, as guarantors, Kronos Denmark ApS, as security provider, Deutsche Bank AG, as mandated lead arranger, Deutsche Bank Luxembourg S.A., as agent and security agent, and KBC Bank NV, as fronting bank, and the financial institutions listed in Schedule 1 thereto, as lenders - incorporated by reference to Exhibit 10.1 to the Quarterly Report on Form 10-Q of NL Industries, Inc. (File No. 001-00640) for the quarter ended June 30, 2002.
|
|
10.5
|
First Amendment Agreement, dated September 3, 2004, Relating to a Facility Agreement dated June 25, 2002 among Kronos Titan GmbH, Kronos Europe S.A./N.V., Kronos Titan AS and Titania A/S, as borrowers, Kronos Titan GmbH, Kronos Europe S.A./N.V. and Kronos Norge AS, as guarantors, Kronos Denmark ApS, as security provider, with Deutsche Bank Luxembourg S.A., acting as agent – incorporated by reference to Exhibit 10.1 of the Current Report on Form 8-K of the Registrant dated November 17, 2004 (File No. 333-119639).
|
|
10.6
|
Second Amendment Agreement Relating to a Facility Agreement dated June 25, 2002 executed as of June 14, 2005 by and among Deutsche Bank AG, as mandated lead arranger, Deutsche Bank Luxembourg S.A. as agent, the participating lenders, Kronos Titan GmbH, Kronos Europe S.A./N.V, Kronos Titan AS, Kronos Norge AS, Titania AS and Kronos Denmark ApS – incorporated by reference to Exhibit 10.3 to the Annual Report on Form 10-K of Kronos International, Inc.(File No. 333-100047) for the year ended December 31, 2009.
|
|
10.7
|
Third Amendment Agreement Relating to a Facility Agreement dated June 25, 2002 executed as of May 26, 2008 by and among Deutsche Bank AG, as mandated lead arranger, Deutsche Bank Luxembourg S.A., as agent, the participating lenders, Kronos Titan GmbH, Kronos Europe S.A.,/N.V, Kronos Titan AS, Kronos Norge AS, Titania AS and Kronos Denmark ApS – incorporated by reference to Exhibit 10.4 to the Annual Report on Form 10-K of Kronos International, Inc. (File No. 333-100047) for the year ended December 31, 2009.
|
|
10.8
|
Fourth Amendment Agreement Relating to a Facility Agreement dated June 25, 2002 executed as of September 15, 2009 by and among Deutsche Bank AG, as mandated lead arranger, Deutsche Bank Luxembourg S.A., as agent, the participating lenders, Kronos Titan GmbH, Kronos Europe S.A./N.V., Kronos Titan AS, Kronos Norge AS, Titania AS and Kronos Denmark ApS – incorporated by reference to Exhibit 10.5 to the Annual Report on Form 10-K of Kronos International, Inc. (File No. 333-1000947) for the year ended December 31, 2009.
|
|
10.9
|
Fifth Amendment Agreement Relating to a Facility Agreement dated June 25, 2002 executed as of October 28, 2010 by and among Deutsche Bank AG, as mandated lead arranger, Deutsche Bank Luxembourg S.A., as agent, the participating lenders, Kronos Titan GmbH, Kronos Europe S.A./N.V., Kronos Titan AS, Kronos Norge AS, Titania AS and Kronos Denmark ApS – incorporated by reference to Exhibit 10.1 to the Current Report on Form 8-K of Kronos International, Inc. dated October 28, 2010 (File No. 333-100047).
|
|
10.10
|
Lease Contract, dated June 21, 1952, between Farbenfabriken Bayer Aktiengesellschaft and Titangesellschaft mit beschrankter Haftung (German language version and English translation thereof)- incorporated by reference to Exhibit 10.14 to the Annual Report on Form 10-K (File No. 001-00640)of NL Industries, Inc. for the year ended December 31, 1985.
|
- 48 -
|
10.11
|
Master Technology Exchange Agreement, dated as of October 18, 1993, among Kronos Worldwide, Inc. (f/k/a Kronos, Inc.), Kronos Louisiana, Inc., Kronos International, Inc., Tioxide Group Limited and Tioxide Group Services Limited - incorporated by reference to Exhibit 10.8 to the Quarterly Report on Form 10-Q (File No. 001-00640) of NL Industries, Inc. for the quarter ended September 30, 1993.
|
|
10.12
|
Form of Assignment and Assumption Agreement, dated as of January 1, 1999, between Kronos Inc. (formerly known as Kronos (USA), Inc.) and Kronos International, Inc. - incorporated by reference to Exhibit 10.9 to Kronos International, Inc.'s Registration Statement on Form S-4 (File No. 333-100047).
|
|
10.13
|
Form of Cross License Agreement, effective as of January 1, 1999, between Kronos Inc. (formerly known as Kronos (USA), Inc.) and Kronos International, Inc. - incorporated by reference to Exhibit to Kronos International, Inc.'s Registration Statement on Form S-4 (File No. 333-100047).
|
|
10.14
|
Formation Agreement dated as of October 18, 1993 among Tioxide Americas Inc., Kronos Louisiana, Inc. and Louisiana Pigment Company, L.P. - incorporated by reference to Exhibit 10.2 to NL Industries, Inc.'s Quarterly Report on Form 10-Q (File No. 001-00640) for the quarter ended September 30, 1993.
|
|
10.15
|
Joint Venture Agreement dated as of October 18, 1993 between Tioxide Americas Inc. and Kronos Louisiana, Inc. - incorporated by reference to Exhibit 10.3 to NL Industries, Inc.'s Quarterly Report on Form 10-Q (File No. 001-00640) for the quarter ended September 30, 1993.
|
|
10.16
|
Kronos Offtake Agreement dated as of October 18, 1993 between Kronos Louisiana, Inc. and Louisiana Pigment Company, L.P. - incorporated by reference to Exhibit 10.4 to NL Industries, Inc.'s Quarterly Report on Form 10-Q (File No. 001-00640) for the quarter ended September 30, 1993.
|
|
10.17
|
Amendment No. 1 to Kronos Offtake Agreement dated as of December 20, 1995 between Kronos Louisiana, Inc. and Louisiana Pigment Company, L.P. - incorporated by reference to Exhibit 10.22 to NL Industries, Inc.'s Annual Report on Form 10-K (File No. 001-00640) for the year ended December 31, 1995.
|
|
10.18
|
Tioxide Americas Offtake Agreement dated as of October 18, 1993 between Tioxide Americas Inc. and Louisiana Pigment Company, L.P. - incorporated by reference to Exhibit 10.5 to NL Industries, Inc.'s Quarterly Report on Form 10-Q (File No. 001-00640) for the quarter ended September 30, 1993.
|
- 49 -
|
10.19
|
Amendment No. 1 to Tioxide Americas Offtake Agreement dated as of December 20, 1995 between Tioxide Americas Inc. and Louisiana Pigment Company, L.P. - incorporated by reference to Exhibit 10.24 to NL Industries, Inc.'s Annual Report on Form 10-K (File No. 001-00640) for the year ended December 31, 1995.
|
|
10.20
|
Parents' Undertaking dated as of October 18, 1993 between ICI American Holdings Inc. and Kronos Worldwide, Inc. (f/k/a Kronos, Inc.) - incorporated by reference to Exhibit 10.9 to NL Industries, Inc.'s Quarterly Report on Form 10-Q (File No. 001-00640) for the quarter ended September 30, 1993.
|
|
10.21
|
Allocation Agreement dated as of October 18, 1993 between Tioxide Americas Inc., ICI American Holdings, Inc., Kronos Worldwide, Inc. (f/k/a Kronos, Inc.) and Kronos Louisiana, Inc. - incorporated by reference to Exhibit 10.10 to NL Industries, Inc.'s Quarterly Report on Form 10-Q (File No. 001-00640) for the quarter ended September 30, 1993.
|
|
10.22
|
Insurance sharing agreement dated October 30, 2003 by and among CompX International Inc., Contran Corporation, Keystone Consolidated Industries, Inc., Titanium Metals Corp., Valhi, Inc., NL Industries, Inc. and Kronos Worldwide, Inc. – incorporated by reference to Exhibit 10.48 to NL Industries, Inc.’s Annual Report on Form 10-K (File No. 001-00640) for the year ended December 31, 2003.
|
|
21.1
|
Subsidiaries.
|
|
23.1
|
Consent of PricewaterhouseCoopers, LLP.
|
|
31.1
|
Certification.
|
|
31.2
|
Certification.
|
32.1 Certification.
___________________________________
* Management contract, compensatory plan or arrangement
- 50 -
SIGNATURES
Pursuant to the requirements of Section 13 or 15(d) of the Securities Exchange Act of 1934, the Registrant has duly caused this report to be signed on its behalf by the undersigned, thereunto duly authorized.
Kronos Worldwide, Inc.
(Registrant)
By: /s/ Steven L. Watson
Steven L. Watson
March 4, 2011
(Vice Chairman and Chief Executive Officer)
Pursuant to the requirements of the Securities Exchange Act of 1934, this report has been signed below by the following persons on behalf of the Registrant and in the capacities and on the dates indicated:
|
/s/ Steven L. Watson
|
|
|
Harold C. Simmons, March 4, 2011
|
Steven L. Watson, March 4, 2011
|
|
(Chairman of the Board)
|
(Vice Chairman and Chief Executive
|
|
|
Officer)
|
|
/s/ George E. Poston
|
/s/ Glenn R. Simmons
|
|
George E. Poston, March 4, 2011
|
Glenn R. Simmons, March 4, 2011
|
|
(Director)
|
(Director)
|
|
/s/ C. H. Moore, Jr.
|
/s/ Keith R. Coogan
|
|
C. H. Moore, Jr., March 4, 2011
|
Keith R. Coogan, March 4, 2011
|
|
(Director)
|
(Director)
|
|
/s/ R. Gerald Turner
|
/s/ Gregory M. Swalwell
|
|
R. Gerald Turner, March 4, 2011
|
Gregory M. Swalwell, March 4, 2011
|
|
(Director)
|
(Executive Vice President and Chief Financial Officer, Principal Financial
Officer)
|
|
/s/ Tim C. Hafer
|
|
|
Tim C. Hafer, March 4, 2011
|
|
|
(Vice President, Controller,
Principal Accounting Officer)
|
- 51 -
KRONOS WORLDWIDE, INC.
Annual Report on Form 10-K
Items 8, 15(a) and 15(c)
Index of Financial Statements and Schedules
|
Financial Statements
|
Page
|
|
Report of Independent Registered Public Accounting Firm
|
F-2
|
|
Consolidated Balance Sheets - December 31, 2009 and 2010
|
F-3
|
|
Consolidated Statements of Operations -
|
|
|
Years ended December 31, 2008, 2009 and 2010
|
F-5
|
|
Consolidated Statements of Comprehensive Income (Loss) -
|
|
|
Years ended December 31, 2008, 2009 and 2010
|
F-6
|
|
Consolidated Statements of Stockholders' Equity -
|
|
|
Years ended December 31, 2008, 2009 and 2010
|
F-7
|
|
Consolidated Statements of Cash Flows -
|
|
|
Years ended December 31, 2008, 2009 and 2010
|
F-8
|
|
Notes to Consolidated Financial Statements
|
F-10
|
|
Financial Statement Schedule
|
|
|
Schedule I – Condensed Financial Information of Registrant
|
S-1
|
|
Schedules II, III and IV are omitted because they are not applicable or the required amounts are either not material or are presented in the Notes to the Consolidated Financial Statements.
|
F - 1
REPORT OF INDEPENDENT REGISTERED PUBLIC ACCOUNTING FIRM
To the Stockholders and Board of Directors of Kronos Worldwide, Inc.:
In our opinion, the accompanying consolidated balance sheets and the related consolidated statements of operations, of comprehensive income (loss), of stockholders' equity and of cash flows present fairly, in all material respects, the financial position of Kronos Worldwide, Inc. and its subsidiaries at December 31, 2009 and 2010 and the results of their operations and their cash flows for each of the three years in the period ended December 31, 2010 in conformity with accounting principles generally accepted in the United States of America. In addition, in our opinion, the financial statement schedule listed in the accompanying index presents fairly, in all material respects, the information set forth therein when read in conjunction with the related consolidated financial statements. These financial statements and financial statement schedule are the responsibility of the Company's management. Our responsibility is to express an opinion on these financial statements and financial statement schedule based on our audits. We conducted our audits of these statements in accordance with the standards of the Public Company Accounting Oversight Board (United States). Those standards require that we plan and perform the audit to obtain reasonable assurance about whether the financial statements are free of material misstatement. An audit includes examining, on a test basis, evidence supporting the amounts and disclosures in the financial statements, assessing the accounting principles used and significant estimates made by management, and evaluating the overall financial statement presentation. We believe that our audits provide a reasonable basis for our opinion.
/s/ PricewaterhouseCoopers LLP
Dallas, Texas
March 4, 2011
F - 2
KRONOS WORLDWIDE, INC. AND SUBSIDIARIES
CONSOLIDATED BALANCE SHEETS
(In millions, except per share data)
|
ASSETS
|
December 31,
|
|||||||
|
2009
|
2010
|
|||||||
|
Current assets:
|
||||||||
|
Cash and cash equivalents
|
$ | 31.1 | $ | 304.7 | ||||
|
Restricted cash
|
1.7 | 1.9 | ||||||
|
Accounts and other receivables
|
189.5 | 231.2 | ||||||
|
Receivable from affiliate
|
.1 | - | ||||||
|
Inventories
|
294.8 | 275.8 | ||||||
|
Prepaid expenses
|
9.0 | 6.1 | ||||||
|
Deferred income taxes
|
3.7 | 4.6 | ||||||
|
Total current assets
|
529.9 | 824.3 | ||||||
|
Other assets:
|
||||||||
|
Investment in TiO2 manufacturing joint venture
|
98.7 | 96.2 | ||||||
|
Note receivable from Valhi
|
- | 61.9 | ||||||
|
Marketable equity securities
|
- | 49.7 | ||||||
|
Deferred income taxes
|
185.5 | 192.0 | ||||||
|
Other
|
11.2 | 9.9 | ||||||
|
Total other assets
|
295.4 | 409.7 | ||||||
|
Property and equipment:
|
||||||||
|
Land
|
46.8 | 44.3 | ||||||
|
Buildings
|
233.0 | 227.4 | ||||||
|
Equipment
|
1,027.4 | 1,008.6 | ||||||
|
Mining properties
|
115.7 | 115.9 | ||||||
|
Construction in progress
|
14.6 | 11.9 | ||||||
| 1,437.5 | 1,408.1 | |||||||
|
Less accumulated depreciation and amortization
|
937.8 | 934.5 | ||||||
|
Net property and equipment
|
499.7 | 473.6 | ||||||
|
Total assets
|
$ | 1,325.0 | $ | 1,707.6 | ||||
F - 3
KRONOS WORLDWIDE, INC. AND SUBSIDIARIES
CONSOLIDATED BALANCE SHEETS (CONTINUED)
(In millions, except per share data)
|
LIABILITIES AND STOCKHOLDERS’ EQUITY
|
December 31,
|
|||||||
|
2009
|
2010
|
|||||||
|
Current liabilities:
|
||||||||
|
Current maturities of long-term debt
|
$ | 2.1 | $ | 2.2 | ||||
|
Accounts payable and accrued liabilities
|
192.4 | 196.6 | ||||||
|
Payables to affiliates
|
12.6 | 9.6 | ||||||
|
Income taxes
|
3.6 | 7.0 | ||||||
|
Deferred income taxes
|
4.7 | 4.7 | ||||||
|
Total current liabilities
|
215.4 | 220.1 | ||||||
|
Noncurrent liabilities:
|
||||||||
|
Long-term debt
|
611.1 | 537.4 | ||||||
|
Deferred income taxes
|
31.1 | 33.2 | ||||||
|
Accrued pension cost
|
118.3 | 119.5 | ||||||
|
Accrued postretirement benefits cost
|
13.4 | 10.6 | ||||||
|
Other
|
23.2 | 25.6 | ||||||
|
Total noncurrent liabilities
|
797.1 | 726.3 | ||||||
|
Stockholders' equity:
|
||||||||
|
Common stock, $.01 par value; 60.0 shares authorized; 49.0 and 57.9 shares issued
|
.5 | .6 | ||||||
|
Additional paid-in capital
|
1,061.9 | 1,399.4 | ||||||
|
Retained deficit
|
(602.6 | ) | (486.5 | ) | ||||
|
Accumulated other comprehensive income (loss):
|
||||||||
|
Currency translation
|
(65.2 | ) | (65.1 | ) | ||||
|
Defined benefit pension plans
|
(81.0 | ) | (89.0 | ) | ||||
|
Postretirement benefit (OPEB) plans
|
(1.1 | ) | 1.8 | |||||
|
Total stockholders' equity
|
312.5 | 761.2 | ||||||
|
Total liabilities and stockholders' equity
|
$ | 1,325.0 | $ | 1,707.6 | ||||
Commitments and contingencies (Notes 10 and 15)
See accompanying notes to consolidated financial statements.
F - 4
KRONOS WORLDWIDE, INC. AND SUBSIDIARIES
CONSOLIDATED STATEMENTS OF OPERATIONS
(In millions, except per share data)
|
Years ended December 31,
|
||||||||||||
|
2008
|
2009
|
2010
|
||||||||||
|
Net sales
|
$ | 1,316.9 | $ | 1,142.0 | $ | 1,449.7 | ||||||
|
Cost of sales
|
1,096.3 | 1,011.7 | 1,104.4 | |||||||||
|
Gross margin
|
220.6 | 130.3 | 345.3 | |||||||||
|
Selling, general and administrative expense
|
167.4 | 148.2 | 166.7 | |||||||||
|
Other operating income (expense):
|
||||||||||||
|
Currency transaction gains, net
|
.6 | 9.9 | 7.8 | |||||||||
|
Disposition of property and equipment
|
(.9 | ) | (.9 | ) | (1.8 | ) | ||||||
|
Other income, net
|
.7 | .6 | 1.0 | |||||||||
|
Corporate expense
|
(6.4 | ) | (7.4 | ) | (7.2 | ) | ||||||
|
Income (loss) from operations
|
47.2 | (15.7 | ) | 178.4 | ||||||||
|
Other income (expense):
|
||||||||||||
|
Trade interest income
|
1.0 | .2 | .2 | |||||||||
|
Other interest income
|
- | - | .5 | |||||||||
|
Interest expense
|
(42.2 | ) | (41.4 | ) | (38.8 | ) | ||||||
|
Income (loss) before income taxes
|
6.0 | (56.9 | ) | 140.3 | ||||||||
|
Provision for income taxes (benefit)
|
(3.0 | ) | (22.2 | ) | 9.7 | |||||||
|
Net income (loss)
|
$ | 9.0 | $ | (34.7 | ) | $ | 130.6 | |||||
|
Net income (loss) per basic and diluted
share
|
$ | .18 | $ | (.71 | ) | $ | 2.59 | |||||
|
Basic and diluted weighted average shares used in the calculation of net income (loss) per share
|
49.0 | 49.0 | 50.4 | |||||||||
See accompanying notes to consolidated financial statements.
F - 5
KRONOS WORLDWIDE, INC. AND SUBSIDIARIES
CONSOLIDATED STATEMENTS OF COMPREHENSIVE INCOME (LOSS)
(In millions)
|
Years ended December 31,
|
||||||||||||
|
2008
|
2009
|
2010
|
||||||||||
|
Net income (loss)
|
$ | 9.0 | $ | (34.7 | ) | $ | 130.6 | |||||
|
Other comprehensive income (loss), net of tax:
|
||||||||||||
|
Currency translation
|
(42.8 | ) | 24.1 | .1 | ||||||||
|
Pension plans:
|
||||||||||||
|
Amortization of prior service cost, net transition obligation and net losses included in periodic pension cost
|
.5 | 5.1 | 4.9 | |||||||||
|
Net actuarial gain (loss) arising duringyear
|
(12.0 | ) | 2.5 | (10.2 | ) | |||||||
|
Plan amendments
|
- | - | (2.7 | ) | ||||||||
| (11.5 | ) | 7.6 | (8.0 | ) | ||||||||
|
OPEB plans:
|
||||||||||||
|
Amortization of prior service credit and net losses included in periodic OPEB cost
|
(.1 | ) | (.1 | ) | - | |||||||
|
Net actuarial gain (loss) arising during
year
|
1.2 | (2.4 | ) | (1.2 | ) | |||||||
|
Plan amendments
|
- | - | 4.1 | |||||||||
| 1.1 | (2.5 | ) | 2.9 | |||||||||
|
Total other comprehensive income (loss)
|
(53.2 | ) | 29.2 | (5.0 | ) | |||||||
|
Comprehensive income (loss)
|
$ | (44.2 | ) | $ | (5.5 | ) | $ | 125.6 | ||||
|
|
See accompanying notes to consolidated financial statements.
|
F - 6
KRONOS WORLDWIDE, INC. AND SUBSIDIARIES
CONSOLIDATED STATEMENTS OF STOCKHOLDERS' EQUITY
Years ended December 31, 2008, 2009 and 2010
(In millions)
|
Accumulated other
|
||||||||||||||||||||||||||||
|
comprehensive
|
||||||||||||||||||||||||||||
|
Additional
|
Retained
|
income (loss)
|
||||||||||||||||||||||||||
|
Common
|
paid-in
|
earnings
|
Currency
|
Pension
|
OPEB
|
|||||||||||||||||||||||
|
stock
|
capital
|
(deficit)
|
translation
|
plans
|
plans
|
Total
|
||||||||||||||||||||||
|
Balance at December 31, 2007
|
$ | .5 | $ | 1,061.7 | $ | (527.9 | ) | $ | (46.5 | ) | $ | (77.1 | ) | $ | .3 | $ | 411.0 | |||||||||||
|
Net income
|
- | - | 9.0 | - | - | - | 9.0 | |||||||||||||||||||||
|
Other comprehensive income (loss), net of tax
|
- | - | - | (42.8 | ) | (11.5 | ) | 1.1 | (53.2 | ) | ||||||||||||||||||
|
Issuance of common stock
|
- | .1 | - | - | - | - | .1 | |||||||||||||||||||||
|
Dividends paid - $1.00 per share
|
- | - | (49.0 | ) | - | - | - | (49.0 | ) | |||||||||||||||||||
|
Balance at December 31, 2008
|
.5 | 1,061.8 | (567.9 | ) | (89.3 | ) | (88.6 | ) | 1.4 | 317.9 | ||||||||||||||||||
|
Net loss
|
- | - | (34.7 | ) | - | - | - | (34.7 | ) | |||||||||||||||||||
|
Other comprehensive income (loss), net of tax
|
- | - | - | 24.1 | 7.6 | (2.5 | ) | 29.2 | ||||||||||||||||||||
|
Issuance of common stock
|
- | .1 | - | - | - | - | .1 | |||||||||||||||||||||
|
Balance at December 31, 2009
|
.5 | 1,061.9 | (602.6 | ) | (65.2 | ) | (81.0 | ) | (1.1 | ) | 312.5 | |||||||||||||||||
|
Net income
|
- | - | 130.6 | - | - | - | 130.6 | |||||||||||||||||||||
|
Other comprehensive income (loss), net of tax
|
- | - | - | .1 | (8.0 | ) | 2.9 | (5.0 | ) | |||||||||||||||||||
|
Issuance of common stock
|
.1 | 337.5 | - | 337.6 | ||||||||||||||||||||||||
|
Dividends paid - $.25 per share
|
- | - | (14.5 | ) | - | - | - | (14.5 | ) | |||||||||||||||||||
|
Balance at December 31, 2010
|
$ | .6 | $ | 1,399.4 | $ | (486.5 | ) | $ | (65.1 | ) | $ | (89.0 | ) | $ | 1.8 | $ | 761.2 | |||||||||||
See accompanying notes to consolidated financial statements.
F - 7
KRONOS WORLDWIDE, INC. AND SUBSIDIARIES
CONSOLIDATED STATEMENTS OF CASH FLOWS
(In millions)
|
Years ended December 31,
|
||||||||||||
|
2008
|
2009
|
2010
|
||||||||||
|
Cash flows from operating activities:
|
||||||||||||
|
Net income (loss)
|
$ | 9.0 | $ | (34.7 | ) | $ | 130.6 | |||||
|
Depreciation and amortization
|
51.3 | 47.0 | 44.7 | |||||||||
|
Deferred income taxes
|
(10.6 | ) | (21.9 | ) | (23.8 | ) | ||||||
|
Benefit plan expense greater (less) than cash funding:
|
||||||||||||
|
Defined benefit pension plans
|
(15.5 | ) | (1.2 | ) | (2.0 | ) | ||||||
|
Other postretirement benefit plans
|
.6 | .2 | .7 | |||||||||
|
Distributions from TiO2 manufacturing joint venture, net
|
10.0 | 7.7 | 2.4 | |||||||||
|
Other, net
|
5.1 | 5.1 | 5.4 | |||||||||
|
Change in assets and liabilities:
|
||||||||||||
|
Accounts and other receivables
|
20.0 | (5.6 | ) | (52.4 | ) | |||||||
|
Inventories
|
(93.9 | ) | 99.4 | 7.1 | ||||||||
|
Prepaid expenses
|
(1.6 | ) | (1.3 | ) | 2.7 | |||||||
|
Accounts payable and accrued liabilities
|
16.7 | 5.4 | (9.0 | ) | ||||||||
|
Income taxes
|
1.8 | .4 | 7.1 | |||||||||
|
Accounts with affiliates
|
4.1 | (3.7 | ) | (.7 | ) | |||||||
|
Other noncurrent assets
|
(2.3 | ) | .5 | (.4 | ) | |||||||
|
Other noncurrent liabilities
|
8.0 | (11.0 | ) | 13.6 | ||||||||
|
Net cash provided by operating activities
|
2.7 | 86.3 | 126.0 | |||||||||
|
Cash flows from investing activities:
|
||||||||||||
|
Capital expenditures
|
(68.1 | ) | (23.7 | ) | (37.7 | ) | ||||||
|
Loan to Valhi:
|
||||||||||||
|
Loans
|
- | - | (114.8 | ) | ||||||||
|
Collections
|
- | - | 52.9 | |||||||||
|
Purchase of:
|
||||||||||||
|
TIMET common stock
|
- | - | (43.5 | ) | ||||||||
|
Valhi common stock
|
- | - | (2.5 | ) | ||||||||
|
Other common stocks
|
- | - | (.1 | ) | ||||||||
|
Change in restricted cash
|
- | - | (.1 | ) | ||||||||
|
Net cash used in investing activities
|
(68.1 | ) | (23.7 | ) | (145.8 | ) | ||||||
|
Cash flows from financing activities:
|
||||||||||||
|
Indebtedness:
|
||||||||||||
|
Borrowings
|
398.5 | 284.5 | 229.0 | |||||||||
|
Principal payments
|
(338.0 | ) | (333.7 | ) | (256.2 | ) | ||||||
|
Deferred financing fees
|
(1.2 | ) | (.6 | ) | (.8 | ) | ||||||
|
Issuance of common stock
|
- | - | 337.6 | |||||||||
|
Dividends paid
|
(49.0 | ) | - | (14.5 | ) | |||||||
|
Net cash provided by (used in) financing activities
|
10.3 | (49.8 | ) | 295.1 | ||||||||
F - 8
KRONOS WORLDWIDE, INC. AND SUBSIDIARIES
CONSOLIDATED STATEMENTS OF CASH FLOWS (CONTINUED)
(In millions)
|
Years ended December 31,
|
||||||||||||
|
2008
|
2009
|
2010
|
||||||||||
|
Cash and cash equivalents - net change from:
|
||||||||||||
|
Operating, investing and financing activities
|
$ | (55.1 | ) | $ | 12.8 | $ | 275.3 | |||||
|
Currency translation
|
(3.5 | ) | 4.7 | (1.7 | ) | |||||||
|
Net change for the year
|
(58.6 | ) | 17.5 | 273.6 | ||||||||
|
Balance at beginning of year
|
72.2 | 13.6 | 31.1 | |||||||||
|
Balance at end of year
|
$ | 13.6 | $ | 31.1 | $ | 304.7 | ||||||
|
Supplemental disclosures –
Cash paid for:
|
||||||||||||
|
Interest
|
$ | 41.6 | $ | 39.4 | $ | 36.3 | ||||||
|
Income taxes
|
3.8 | 2.7 | 24.0 | |||||||||
|
Accrual for capital expenditures
|
6.5 | 4.4 | 9.6 | |||||||||
|
Capital lease obligation incurred
|
- | 5.9 | - | |||||||||
See accompanying notes to consolidated financial statements.
F - 9
KRONOS WORLDWIDE, INC. AND SUBSIDIARIES
NOTES TO CONSOLIDATED FINANCIAL STATEMENTS
Note 1 - Summary of significant accounting policies:
Organization and basis of presentation. At December 31, 2010, (i) Valhi, Inc. (NYSE:VHI) held approximately 50% of our outstanding common stock (ii) NL Industries, Inc. (NYSE:NL) held approximately 30% of our common stock, (iii) Valhi owned approximately 83% of NL's outstanding common stock and (iv) subsidiaries of Contran Corporation held approximately 94% of Valhi's outstanding common stock. Substantially all of Contran's outstanding voting stock is held by trusts established for the benefit of certain children and grandchildren of Harold C. Simmons (for which Mr. Simmons is the sole trustee), or is held by Mr. Simmons or other persons or related companies to Mr. Simmons. Consequently, Mr. Simmons may be deemed to control each of such companies.
Unless otherwise indicated, reference in this report to “we,” “us” or “our” refers to Kronos Worldwide, Inc. and its subsidiaries, taken as a whole.
Management’s estimates. In preparing our financial statements in conformity with accounting principles generally accepted in the United States of America (“GAAP”) we are required to make estimates and assumptions that affect the reported amounts of assets and liabilities and disclosure of contingent assets and liabilities at the date of the financial statements, and the reported amount of revenues and expenses during the reporting period. Actual results may differ significantly from previously-estimated amounts under different assumptions or conditions.
Principles of consolidation. The consolidated financial statements include our accounts and those of our majority-owned subsidiaries. We have eliminated all material intercompany accounts and balances.
Translation of currencies. We translate the assets and liabilities of our subsidiaries whose functional currency is other than the U.S. dollar at year-end rates of exchange, while we translate our revenues and expenses at average exchange rates prevailing during the year. We accumulate the resulting translation adjustments in stockholders’ equity as part of accumulated other comprehensive income (loss), net of related deferred income taxes. We recognize currency transaction gains and losses in income currently.
Derivatives and hedging activities. We recognize derivatives as either assets or liabilities measured at fair value. We recognize the effect of changes in the fair value of derivatives either in net income (loss) or other comprehensive income (loss), depending on the intended use of the derivative.
Cash and cash equivalents. We classify bank time deposits and U.S. Treasury securities purchased under short-term agreements to resell with original maturities of three months or less as cash equivalents.
F - 10
Marketable securities and securities transactions. We carry marketable debt and equity securities at fair value. Accounting Standard Codification (“ASC”) Topic 820, Fair Value Measurements and Disclosures, establishes a consistent framework for measuring fair value and (with certain exceptions) this framework is generally applied to all financial statement items required to be measured at fair value. The standard requires fair value measurements to be classified and disclosed in one of the following three categories:
|
|
·
|
Level 1 – Unadjusted quoted prices in active markets that are accessible at the measurement date for identical, unrestricted assets or liabilities;
|
|
|
·
|
Level 2 – Quoted prices in markets that are not active, or inputs which are observable, either directly or indirectly, for substantially the full term of the assets or liability; and
|
|
|
·
|
Level 3 – Prices or valuation techniques that require inputs that are both significant to the fair value measurement and unobservable.
|
We classify all of our marketable securities as available-for-sale, and unrealized gains or losses on these securities are recognized through other comprehensive income, except for any decline in value we conclude is other than temporary, which is accounted for as a realized loss. We base realized gains and losses upon the specific identification of the securities sold.
We evaluate our investments whenever events or conditions occur to indicate that the fair value of such investments has declined below their carrying amounts. If the carrying amount for an investment declines below its historical cost basis, we evaluate all available positive and negative evidence including, but not limited to, the extent and duration of the impairment, business prospects for the investee and our intent and ability to hold the investment for a reasonable period of time sufficient for the recovery of fair value. If we determine the decline in fair value is other than temporary, the carrying amount of the investment is written down to fair value.
See Notes 6, 11 and 16.
Accounts receivable. We provide an allowance for doubtful accounts for known and estimated potential losses arising from sales to customers based on a periodic review of these accounts.
Inventories and cost of sales. We state inventories at the lower of cost or market, net of allowance for obsolete and slow-moving inventories. We generally base inventory costs for all inventory categories on average cost that approximates the first-in, first-out method. Inventories include the costs for raw materials, the cost to manufacture the raw materials into finished goods and overhead. Depending on the inventory’s stage of completion, our manufacturing costs can include the costs of packing and finishing, utilities, maintenance, depreciation, salaries and benefits associated with our manufacturing process. We allocate fixed manufacturing overheads based on normal production capacity. Unallocated overhead costs resulting from periods with abnormally low production levels are charged to expense as incurred. As inventory is sold to third parties, we recognize the cost of sales in the same period that the sale occurs. We periodically review our inventory for estimated obsolescence or instances when inventory is no longer marketable for its intended use, and we record any write-down equal to the difference between the cost of inventory and its estimated net realizable value based on assumptions about alternative uses, market conditions and other factors.
Investment in TiO2 manufacturing joint venture. We account for our investment in a 50%-owned manufacturing joint venture by the equity method. See Note 5.
Property and equipment and depreciation. We state property and equipment at cost, including capitalized interest on borrowings during the actual construction period of major capital projects. Capitalized interest costs were $2.2 million in 2008, $1.1 million in 2009 and $.9 million in 2010. We compute depreciation of property and equipment for financial reporting purposes (including mining equipment) principally by the straight-line method over the estimated useful lives of the assets as follows:
F - 11
|
Asset
|
Useful lives
|
|
|
Buildings and improvements
|
10 to 40 years
|
|
|
Machinery and equipment
|
3 to 20 years
|
|
|
Mine development costs
|
Units-of-Production
|
We use accelerated depreciation methods for income tax purposes, as permitted. Upon the sale or retirement of an asset, we remove the related cost and accumulated depreciation from the accounts and recognize any gain or loss in income currently.
We expense costs incurred for maintenance, repairs and minor renewals (including planned major maintenance) while we capitalize expenditures for major improvements.
We have a governmental concession with an unlimited term to operate our ilmenite mines in Norway. Mining properties consist of buildings and equipment used in our Norwegian ilmenite mining operations and costs associated with the development of a new mine area which commenced production in 2009. While we own the land and ilmenite reserves associated with the mining operations, such land and reserves were acquired for nominal value and we have no material asset recognized for the land and reserves related to our mining operations.
We perform impairment tests when events or changes in circumstances indicate the carrying value may not be recoverable. We consider all relevant factors. We perform the impairment test by comparing the estimated future undiscounted cash flows (exclusive of interest expense) associated with the asset to the asset's net carrying value to determine if a write-down to market value or discounted cash flow value is required.
Long-term debt. We state long-term debt net of any unamortized original issue premium or discount. We classify amortization of deferred financing costs and any premium or discount associated with the issuance of indebtedness as interest expense and compute such amortization by the interest method over the term of the applicable issue.
Employee benefit plans. Accounting and funding policies for our retirement plans are described in Note 11.
Income taxes. We, Valhi and our qualifying subsidiaries are members of Contran’s consolidated U.S. federal income tax group (the "Contran Tax Group") and we and certain of our qualifying subsidiaries also file consolidated income tax returns with Contran in various U.S. state jurisdictions. As a member of the Contran Tax Group, we are jointly and severally liable for the federal income tax liability of Contran and the other companies included in the Contran Tax Group for all periods in which we are included in the Contran Tax Group. See Note 15. As a member of the Contran Tax Group, we are a party to a tax sharing agreement which provides that we compute our provision for U.S. income taxes on a separate-company basis using the tax elections made by Contran. Pursuant to the tax sharing agreement, we make payments to or receive payments from Valhi in amounts we would have paid to or received from the U.S. Internal Revenue Service or the applicable state tax authority had we not been a member of the Contran Tax Group. We made net payments of income taxes to Valhi of $.5 million in 2009 and $13.6 million in 2010, and we received net refunds from Valhi of $2.7 million in 2008.
F - 12
We recognize deferred income tax assets and liabilities for the expected future tax consequences of temporary differences between the income tax and financial reporting carrying amounts of assets and liabilities, including investments in our subsidiaries and affiliates who are not members of the Contran Tax Group and undistributed earnings of non U.S. subsidiaries which are not deemed to be permanently reinvested. The earnings of non U.S. subsidiaries subject to permanent reinvestment plans aggregated $666 million at December 31, 2009 and $767 million at December 31, 2010. It is not practical for us to determine the amount of the unrecognized deferred income tax liability related to such earnings due to the complexities associated with the U.S. taxation on earnings of non-U.S. subsidiaries repatriated to the U.S. We periodically evaluate our deferred tax assets in the various taxing jurisdictions in which we operate and adjust any related valuation allowance based on the estimate of the amount of such deferred tax assets that we believe does not meet the more-likely-than-not recognition criteria.
We record a reserve for uncertain tax positions for tax positions where we believe it is more-likely-than-not our position will not prevail with the applicable tax authorities. The amount of the benefit associated with our uncertain tax positions that we recognize is limited to the largest amount for which we believe the likelihood of realization is greater than 50%. We accrue penalties and interest on the difference between tax positions taken on our tax returns and the amount of benefit recognized for financial reporting purposes. We classify our reserves for uncertain tax positions in a separate current or noncurrent liability, depending on the nature of the tax position. See Note 10.
Net sales. We record sales when products are shipped and title and other risks and rewards of ownership have passed to the customer, or when services are performed. Shipping terms of products shipped are generally FOB shipping point, although in some instances shipping terms are FOB destination point (for which we do not recognize sales until the product is received by the customer). We state sales net of price, early payment and distributor discounts and volume rebates. We report any tax assessed by a governmental authority that we collect from our customers that is both imposed on and concurrent with our revenue-producing activities (such as sales, use, value added and excise taxes) on a net basis (meaning we do not recognize these taxes either in our revenues or in our costs and expenses).
Selling, general and administrative expense; shipping and handling costs. Selling, general and administrative expense includes costs related to marketing, sales, distribution, shipping and handling, research and development, legal, and administrative functions such as accounting, treasury and finance, and includes costs for salaries and benefits, travel and entertainment, promotional materials and professional fees. We include shipping and handling costs in selling, general and administrative expense and these costs were $91 million in 2008, $74 million in 2009, and $83 million in 2010. We expense advertising costs as incurred and these costs were $1 million in each of 2008, 2009 and 2010. We expense research, development and certain sales technical support costs as incurred and these costs approximated $12 million in each of 2008 and 2009 and $13 million in 2010.
Note 2 - Geographic information:
Our operations are associated with the production and sale of titanium dioxide pigments (“TiO2”). TiO2 is used to impart whiteness, brightness and opacity to a wide variety of products, including paints, plastics, paper, fibers and ceramics. At December 31, 2009 and 2010 the net assets of non-U.S. subsidiaries included in consolidated net assets approximated $177 million and $257 million, respectively.
For geographic information, we attribute net sales to the place of manufacture (point of origin) and to the location of the customer (point of destination); we attribute property and equipment to their physical location.
F - 13
|
Years ended December 31,
|
||||||||||||
|
2008
|
2009
|
2010
|
||||||||||
|
(In millions)
|
||||||||||||
|
Geographic areas
|
||||||||||||
|
Net sales – point of origin:
|
||||||||||||
|
Germany
|
$ | 694.8 | $ | 616.5 | $ | 714.2 | ||||||
|
United States
|
498.8 | 422.6 | 564.7 | |||||||||
|
Canada
|
197.2 | 177.2 | 245.4 | |||||||||
|
Belgium
|
207.7 | 164.4 | 209.1 | |||||||||
|
Norway
|
194.3 | 139.5 | 188.3 | |||||||||
|
Eliminations
|
(475.9 | ) | (378.2 | ) | (472.0 | ) | ||||||
|
Total
|
$ | 1,316.9 | $ | 1,142.0 | $ | 1,449.7 | ||||||
|
Net sales – point of destination:
|
||||||||||||
|
Europe
|
$ | 812.5 | $ | 669.6 | $ | 822.2 | ||||||
|
North America
|
368.8 | 319.5 | 417.8 | |||||||||
|
Other
|
135.6 | 152.9 | 209.7 | |||||||||
|
|
||||||||||||
|
Total
|
$ | 1,316.9 | $ | 1,142.0 | $ | 1,449.7 | ||||||
|
December 31,
|
||||||||
|
2009
|
2010
|
|||||||
|
(In millions)
|
||||||||
|
Identifiable assets -
|
||||||||
|
net property and equipment:
|
||||||||
|
Germany
|
$ | 263.1 | $ | 236.3 | ||||
|
Norway
|
101.2 | 95.2 | ||||||
|
Canada
|
66.1 | 68.4 | ||||||
|
Belgium
|
62.8 | 66.3 | ||||||
|
Other
|
6.5 | 7.4 | ||||||
|
Total
|
$ | 499.7 | $ | 473.6 | ||||
Note 3 - Accounts and other receivables:
|
December 31,
|
||||||||
|
2009
|
2010
|
|||||||
|
(In millions)
|
||||||||
|
Trade receivables
|
$ | 172.4 | $ | 202.2 | ||||
|
Recoverable VAT and other receivables
|
19.0 | 29.9 | ||||||
|
Refundable income taxes
|
.7 | 1.3 | ||||||
|
Allowance for doubtful accounts
|
(2.6 | ) | (2.2 | ) | ||||
|
Total
|
$ | 189.5 | $ | 231.2 | ||||
Note 4 - Inventories:
|
December 31,
|
||||||||
|
2009
|
2010
|
|||||||
|
(In millions)
|
||||||||
|
Raw materials
|
$ | 56.4 | $ | 52.1 | ||||
|
Work in process
|
18.2 | 13.6 | ||||||
|
Finished products
|
161.0 | 154.6 | ||||||
|
Supplies
|
59.2 | 55.5 | ||||||
|
Total
|
$ | 294.8 | $ | 275.8 | ||||
F - 14
Note 5 - Investment in TiO2 manufacturing joint venture:
We own a 50% interest in Louisiana Pigment Company, L.P. (“LPC”). LPC is a manufacturing joint venture whose other 50%-owner is Tioxide Americas Inc. (“Tioxide”). Tioxide is a wholly-owned subsidiary of Huntsman Corporation. LPC owns and operates a chloride-process TiO2 plant in Lake Charles, Louisiana.
We and Tioxide are both required to purchase one-half of the TiO2 produced by LPC. LPC operates on a break-even basis and, accordingly, we report no equity in earnings of LPC. Each owner’s acquisition transfer price for its share of the TiO2 produced is equal to its share of the joint venture’s production costs and interest expense, if any. Our share of net cost is reported as cost of sales as the related TiO2 acquired from LPC is sold. We report distributions we receive from LPC, which generally relate to excess cash generated by LPC from its non-cash production costs, and contributions we make to LPC, which generally relate to cash required by LPC when it builds working capital, as part of our cash flows from operating activities in our Consolidated Statements of Cash Flows. The components of our net distributions from LPC are shown in the table below.
|
Years ended December 31,
|
||||||||||||
|
2008
|
2009
|
2010
|
||||||||||
|
(In millions)
|
||||||||||||
|
Distributions from LPC
|
$ | 20.6 | $ | 22.7 | $ | 26.1 | ||||||
|
Contributions to LPC
|
(10.6 | ) | (15.0 | ) | (23.7 | ) | ||||||
|
Net distributions from
|
$ | 10.0 | $ | 7.7 | $ | 2.4 | ||||||
Summary balance sheets of LPC are shown below:
|
December 31,
|
||||||||
|
2009
|
2010
|
|||||||
|
(In millions)
|
||||||||
|
ASSETS
|
||||||||
|
Current assets
|
$ | 72.7 | $ | 68.6 | ||||
|
Property and equipment, net
|
166.3 | 154.4 | ||||||
|
Total assets
|
$ | 239.0 | $ | 223.0 | ||||
|
LIABILITIES AND PARTNERS’ EQUITY
|
||||||||
|
Other liabilities, primarily current
|
$ | 38.8 | $ | 27.9 | ||||
|
Partners’ equity
|
200.2 | 195.1 | ||||||
|
Total liabilities and partners’ equity
|
$ | 239.0 | $ | 223.0 | ||||
F - 15
Summary income statements of LPC are shown below:
|
Years ended December 31,
|
||||||||||||
|
2008
|
2009
|
2010
|
||||||||||
|
(In millions)
|
||||||||||||
|
Revenues and other income:
|
||||||||||||
|
Kronos
|
$ | 140.3 | $ | 121.2 | $ | 133.7 | ||||||
|
Tioxide
|
140.7 | 121.8 | 134.5 | |||||||||
| 281.0 | 243.0 | 268.2 | ||||||||||
|
Cost and expenses:
|
||||||||||||
|
Cost of sales
|
280.5 | 242.5 | 267.7 | |||||||||
|
General and administrative
|
.5 | .5 | .5 | |||||||||
| 281.0 | 243.0 | 268.2 | ||||||||||
|
Net income
|
$ | - | $ | - | $ | - | ||||||
Note 6 – Marketable equity securities:
Our marketable equity securities consist of investments in the publicly-traded shares of related parties: Titanium Metals Corporation (“TIMET”), Valhi, NL and CompX International Inc. (“CompX”). Contran, Mr. Harold Simmons and persons and other entities related to Mr. Simmons own a majority of TIMET’s outstanding common stock, and NL owns a majority of CompX’s outstanding common stock. All of our marketable securities, purchased during the fourth quarter of 2010, are accounted for as available-for-sale carried at fair value based on quoted market prices in active markets, a Level 1 input.
The following table summarizes our marketable equity securities as of December 31, 2010. We had no investments in marketable securities as of December 31, 2009.
|
Marketable security
|
Market
Value
|
Cost
Basis
|
Unrealized gains (losses)
|
|||||||||
|
(In millions)
|
||||||||||||
|
As of December 31, 2010:
|
||||||||||||
|
TIMET common stock
|
$ | 46.9 | $ | 46.9 | $ | - | ||||||
|
Valhi common stock
|
2.7 | 2.7 | - | |||||||||
|
NL and CompX common stocks
|
.1 | .1 | - | |||||||||
|
Total
|
$ | 49.7 | $ | 49.7 | $ | - | ||||||
At December 31, 2010, we held approximately 2.7 million shares, or 1.5%, of TIMET’s outstanding common stock and approximately .1 million shares, or less than .1%, of Valhi’s outstanding common stock. We also held a nominal number of shares of CompX and NL common stocks. At December 31, 2010, the quoted per share market price of TIMET’s and Valhi’s common stock was $17.18 and $22.11, respectively. Because we have classified all of our marketable securities as available-for-sale, any unrealized gains or losses on the securities are recognized through other comprehensive income.
The TIMET, Valhi, CompX and NL common stocks we own are subject to the restrictions on resale pursuant to certain provisions of the Securities and Exchange Commission (“SEC”) Rule 144. In addition, as a majority-owned subsidiary of Valhi we cannot vote our shares of Valhi common stock under Delaware Corporation Law, but we do receive dividends from Valhi on these shares, when declared and paid.
F - 16
Note 7 - Other noncurrent assets:
|
December 31,
|
||||||||
|
2009
|
2010
|
|||||||
|
(In millions)
|
||||||||
|
Deferred financing costs, net
|
$ | 5.9 | $ | 4.4 | ||||
|
Pension asset
|
.3 | .3 | ||||||
|
Other
|
5.0 | 5.2 | ||||||
|
Total
|
$ | 11.2 | $ | 9.9 | ||||
Note 8 - Accounts payable and accrued liabilities:
|
December 31,
|
||||||||
|
2009
|
2010
|
|||||||
|
(In millions)
|
||||||||
|
Accounts payable
|
$ | 117.1 | $ | 119.2 | ||||
|
Employee benefits
|
26.2 | 34.1 | ||||||
|
Accrued sales discounts and rebates
|
21.4 | 11.3 | ||||||
|
Accrued interest
|
8.0 | 7.4 | ||||||
|
Other
|
19.7 | 24.6 | ||||||
|
Total
|
$ | 192.4 | $ | 196.6 | ||||
Note 9 - Long-term debt:
|
December 31,
|
||||||||
|
2009
|
2010
|
|||||||
|
(In millions)
|
||||||||
|
Kronos International, Inc. 6.5% Senior Secured Notes
|
$ | 574.6 | $ | 532.8 | ||||
|
Revolving credit facilities:
|
||||||||
|
U.S. bank credit facility
|
16.7 | - | ||||||
|
European credit facility
|
13.0 | - | ||||||
|
Other
|
8.9 | 6.8 | ||||||
|
Total debt
|
613.2 | 539.6 | ||||||
|
Less current maturities
|
2.1 | 2.2 | ||||||
|
Total long-term debt
|
$ | 611.1 | $ | 537.4 | ||||
Senior Secured Notes. In April 2006, Kronos International, Inc. (“KII”), one of our wholly-owned subsidiaries, issued euro 400 million principal amount of 6.5% Senior Secured Notes (“6.5% Notes”) due 2013 at 99.306% of the principal amount ($498.5 million when issued). We collateralized the 6.5% Notes with a pledge of 65% of the common stock or other ownership interests of certain of our first-tier European operating subsidiaries: Kronos Titan GmbH, Kronos Denmark ApS, Kronos Limited and Société Industrielle du Titane, S.A. We issued the 6.5% Notes pursuant to an indenture which contains a number of covenants and restrictions which, among other things, restricts our ability to incur additional debt, incur liens, pay dividends or merge or consolidate with, or sell or transfer all or substantially all of the assets to, another entity. At our option, we may redeem the 6.5% Notes at redemption prices of 102.167% of the principal amount through October 2011, declining to 101.08% of the principal amount through October 2012 and 100% of the principal amount on or after October 15, 2012. In this regard, On February 17, 2011, we called for the redemption of euro 80 million principal amount of the 6.5% Notes on March 24, 2011. We intend to borrow under our European revolving credit facility discussed below in order to fund such redemption.
F - 17
In the event of a change of control, as defined in the agreement, we would be required to make an offer to purchase our 6.5% Notes at 101% of the principal amount. We would also be required to make an offer to purchase a specified portion of our 6.5% Notes at par value in the event we generate a certain amount of net proceeds from the sale of assets outside the ordinary course of business, and such net proceeds are not otherwise used for specified purposes within a specified time period. See Note 16. The indenture also contains certain cross-referenced provisions, as discussed below. The carrying amount of the 6.5% Notes includes unamortized original issue discount of euro 1.3 million ($1.9 million) and euro .9 million ($1.2 million) at December 31, 2009 and 2010, respectively.
Revolving credit facilities.
Europe - Our operating subsidiaries in Germany, Belgium, Norway and Denmark have a euro 80 million secured revolving bank credit facility that, as amended, matures in October 2013. We may denominate borrowings in euros, Norwegian kroner or U.S. dollars. We may also issue up to euro 5 million of letters of credit. Outstanding borrowings bear interest at rates ranging from LIBOR plus 1.75% to LIBOR plus 1.5%. The facility is collateralized by the accounts receivable and inventories of the borrowers, plus a limited pledge of all of the other assets of the Belgian borrower. The facility contains certain restrictive covenants that, among other things, restrict the ability of the borrowers to incur debt, incur liens, pay dividends or merge or consolidate with, or sell or transfer all or substantially all of the assets to, another entity. In addition, the credit facility contains customary cross-default provisions with respect to other debt and obligations of the borrowers, KII and its other subsidiaries. As of December 31, 2010, no amounts were outstanding under the European Credit Facility and the equivalent of $106.8 million was available for borrowing by the subsidiaries.
Other – At December 31, 2010, one of our U.S. subsidiaries had a $70 million revolving credit facility, and our Canadian subsidiary had a Cdn. $20 million revolving credit facility, in each case with no outstanding borrowings at such date. We voluntarily terminated these facilities in February 2011 and January 2011, respectively.
Note payable to affiliate. From time to time, companies related to Contran will have loans and advances outstanding between them and various related parties pursuant to term and demand notes. These loans and advances are generally entered into for cash management purposes, in which the lender is generally able to earn a higher rate of return on the loan than would have been earned if the lender invested the funds in other investments, and the borrower is able to pay a lower rate of interest than would be paid if the borrower had incurred third-party indebtedness. While certain of these loans may be of a lesser credit quality than cash equivalent instruments otherwise available to the lender, the lender will evaluate the credit risks involved and appropriately reflect those credit risks in the terms of the applicable loan. In this regard, in April 2010 we entered into an unsecured revolving credit note with Contran pursuant to which we may borrow up to $40 million from Contran. Our loans from Contran bear interest, payable quarterly, at the prime rate minus 0.5%, with all outstanding principal due on demand and in any event no later than December 31, 2011. The principal amount borrowed at any time is solely at the discretion of Contran. As of December 31, 2010 no amounts were outstanding under this facility. See Note 14.
F - 18
Restrictions and other. Aggregate maturities of long-term debt at December 31, 2010.
|
Years ending December 31,
|
Amount
|
|||
|
(In millions)
|
||||
|
2011
|
$ | 2.2 | ||
|
2012
|
2.2 | |||
|
2013
|
534.0 | |||
|
2014
|
.5 | |||
|
2015
|
.4 | |||
|
2016 and thereafter
|
.3 | |||
|
Total
|
$ | 539.6 | ||
Under the cross-default provisions of the 6.5% Notes, the 6.5% Notes may be accelerated prior to their stated maturity if KII or any of KII’s subsidiaries default under any other indebtedness in excess of $20 million due to a failure to pay the other indebtedness at its due date (including any due date that arises prior to the stated maturity as a result of a default under the other indebtedness). Under the cross-default provisions of the European revolving credit facility, any outstanding borrowings under the facility may be accelerated prior to their stated maturity if the borrowers or KII default under any other indebtedness in excess of euro 5 million due to a failure to pay the other indebtedness at its due date (including any due date that arises prior to the stated maturity as a result of a default under the other indebtedness). The European revolving credit facility contains provisions that allow the lender to accelerate the maturity of the applicable facility in the event of a change of control, as defined in the respective agreement, of the applicable borrower. In the event any of these cross-default or change-of-control provisions become applicable, and the indebtedness is accelerated, we would be required to repay the indebtedness prior to its stated maturity.
Our European credit facility described above requires the respective borrowers to maintain minimum levels of equity, require the maintenance of certain financial ratios, limit dividends and additional indebtedness and contain other provisions and restrictive covenants customary in lending transactions of this type. We are in compliance with all of our debt covenants at December 31, 2010. We believe we will be able to comply with the financial covenants contained in all of our credit facilities through the maturity of the respective facility; however if future operating results differ materially from our expectations we may be unable to maintain compliance.
At December 31, 2010, the restricted net assets of consolidated subsidiaries approximated $138.4 million. At December 31, 2010, there were no restrictions on our ability to pay dividends. The terms of the indenture governing the 6.5% Notes limits KII’s ability to pay dividends and make other restricted payments. At December 31, 2010, the maximum amount of dividends and other restricted payments that KII could make (the “Restricted Payment Basket”) was $41.9 million.
F - 19
Note 10 – Income taxes:
|
Years ended December 31,
|
||||||||||||
|
2008
|
2009
|
2010
|
||||||||||
|
(In millions)
|
||||||||||||
|
Pre-tax income (loss):
|
||||||||||||
|
U.S.
|
$ | (.2 | ) | $ | 17.5 | $ | 58.1 | |||||
|
Non-U.S.
|
6.2 | (74.4 | ) | 82.2 | ||||||||
|
Total
|
$ | 6.0 | $ | (56.9 | ) | $ | 140.3 | |||||
|
Expected tax expense (benefit), at U.S. federal statutory income tax rate of 35%
|
$ | 2.1 | $ | (19.9 | ) | $ | 49.1 | |||||
|
Non-U.S. tax rates
|
(.4 | ) | 1.4 | (3.9 | ) | |||||||
|
German tax attribute adjustments
|
(7.2 | ) | .2 | (35.2 | ) | |||||||
|
Incremental U.S. tax and rate differences on equity in earnings of non-tax group companies
|
(.1 | ) | - | .2 | ||||||||
|
Nondeductible expenses
|
2.3 | 2.0 | 1.9 | |||||||||
|
U.S. state income taxes, net
|
1.0 | .2 | 1.2 | |||||||||
|
Uncertain tax positions, net
|
.1 | (4.7 | ) | .7 | ||||||||
|
Non U.S. tax rate changes
|
(.1 | ) | - | (1.7 | ) | |||||||
|
Nontaxable income
|
(.9 | ) | (.9 | ) | (.9 | ) | ||||||
|
Other, net
|
.2 | (.5 | ) | (1.7 | ) | |||||||
|
Provision for income taxes (benefit)
|
$ | (3.0 | ) | $ | (22.2 | ) | $ | 9.7 | ||||
|
Years ended December 31,
|
||||||||||||
|
2008
|
2009
|
2010
|
||||||||||
|
(In millions)
|
||||||||||||
|
Components of income tax expense (benefit):
|
||||||||||||
|
Currently payable (refundable):
|
||||||||||||
|
U.S. federal and state
|
$ | (.1 | ) | $ | 1.9 | $ | 16.7 | |||||
|
Non-U.S.
|
7.7 | 2.5 | 16.2 | |||||||||
| 7.6 | 4.4 | 32.9 | ||||||||||
|
Deferred income taxes (benefit):
|
||||||||||||
|
U.S. federal and state
|
- | 2.5 | (3.4 | ) | ||||||||
|
Non-U.S.
|
(10.6 | ) | (29.1 | ) | (19.8 | ) | ||||||
| (10.6 | ) | (26.6 | ) | (23.2 | ) | |||||||
|
Provision for income taxes (benefit)
|
$ | (3.0 | ) | $ | (22.2 | ) | $ | 9.7 | ||||
|
Years ended December 31,
|
||||||||||||
|
2008
|
2009
|
2010
|
||||||||||
|
(In millions)
|
||||||||||||
|
Comprehensive provision for income taxes (benefit) allocable to:
|
||||||||||||
|
Income (loss) from operations
|
$ | (3.0 | ) | $ | (22.2 | ) | $ | 9.7 | ||||
|
Other comprehensive income -
|
||||||||||||
|
Pension plans
|
(6.2 | ) | 3.1 | (2.8 | ) | |||||||
|
OPEB
|
.4 | (.9 | ) | 1.3 | ||||||||
|
Total
|
$ | (8.8 | ) | $ | (20.0 | ) | $ | 8.2 | ||||
F - 20
The components of our net deferred income taxes at December 31, 2009 and 2010 are summarized in the following table.
|
December 31,
|
||||||||||||||||
|
2009
|
2010
|
|||||||||||||||
|
Assets
|
Liabilities
|
Assets
|
Liabilities
|
|||||||||||||
|
(In millions)
|
||||||||||||||||
|
Tax effect of temporary differences related to:
|
||||||||||||||||
|
Inventories
|
$ | 2.3 | $ | (4.0 | ) | $ | 2.0 | $ | (3.8 | ) | ||||||
|
Property and equipment
|
- | (61.5 | ) | - | (62.4 | ) | ||||||||||
|
Accrued postretirement benefits other than pension (“OPEB”) costs
|
4.1 | - | 3.1 | - | ||||||||||||
|
Accrued pension cost
|
3.6 | - | 7.4 | - | ||||||||||||
|
Other accrued liabilities and deductible differences
|
21.4 | - | 16.0 | - | ||||||||||||
|
Other taxable differences
|
- | (6.7 | ) | - | (5.5 | ) | ||||||||||
|
Tax on unremitted earnings of non-U.S. subsidiaries
|
- | (2.9 | ) | - | (3.2 | ) | ||||||||||
|
Tax loss and tax credit carryforwards
|
197.6 | - | 205.6 | - | ||||||||||||
|
Valuation allowance
|
(.5 | ) | - | (.5 | ) | - | ||||||||||
|
Adjusted gross deferred tax assets (liabilities)
|
228.5 | (75.1 | ) | 233.6 | (74.9 | ) | ||||||||||
|
Netting of items by tax
jurisdiction
|
(39.3 | ) | 39.3 | (37.0 | ) | 37.0 | ||||||||||
| 189.2 | (35.8 | ) | 196.6 | (37.9 | ) | |||||||||||
|
Less net current deferred tax asset (liability)
|
3.7 | (4.7 | ) | 4.6 | (4.7 | ) | ||||||||||
|
Net noncurrent deferred tax asset (liability)
|
$ | 185.5 | $ | (31.1 | ) | $ | 192.0 | $ | (33.2 | ) | ||||||
As a consequence of a European Court ruling that resulted in a favorable resolution of certain income tax issues in Germany, during the first quarter of 2010 the German tax authorities agreed to an increase in our German net operating loss carryforwards. Accordingly, we recognized a non-cash income tax benefit of $35.2 million in the first quarter of 2010.
Following the resolution of tax audits in Belgium and Germany in the third and fourth quarters of 2009, we de-recognized $4.7 million of our reserve for uncertain tax positions primarily related to the audit resolution.
During the second quarter of 2008, we recognized a $7.2 million non-cash deferred income tax benefit related to a European Court ruling that resulted in the favorable resolution of certain income tax issues in Germany and an increase in the amount of our German corporate and trade tax net operating loss carryforwards.
Tax authorities are examining certain of our non-U.S. tax returns and have or may propose tax deficiencies, including penalties and interest. Because of the inherent uncertainties involved in settlement initiatives and court and tax proceedings, we cannot guarantee that these tax matters will be resolved in our favor, and therefore our potential exposure, if any, is also uncertain. In September 2010, we received a revised notice of proposed adjustment from the Canadian tax authorities related to the years 2002 through 2004. We object to the proposed assessment and we are currently in discussions with the Canadian tax authorities regarding such proposed assessment. If the full amount of the proposed adjustment were ultimately to be assessed against us the net impact to our consolidated financial statements would be approximately $5.5 million. We believe we have adequate accruals for additional taxes and related interest expense which could ultimately result from tax examinations. We believe the ultimate disposition of tax examinations should not have a material adverse effect on our consolidated financial position, results of operations or liquidity.
F - 21
We accrue interest and penalties on our uncertain tax positions as a component of our provision for income taxes. The amount of interest and penalties we accrued during 2008, 2009 and 2010 was not material, and at December 31, 2008, 2009, and 2010, we had $2.7 million, $2.5 million, and $2.7 million, respectively, accrued for interest and penalties for our uncertain tax positions.
The following table shows the changes in the amount of our uncertain tax positions (exclusive of the effect of interest and penalties) during 2008, 2009 and 2010:
|
Year Ended December 31,
|
||||||||||||
|
2008
|
2009
|
2010
|
||||||||||
|
(In millions)
|
||||||||||||
|
Changes in unrecognized tax benefits:
|
||||||||||||
|
Unrecognized tax benefits at beginning of year
|
$ | 11.9 | $ | 10.4 | $ | 7.0 | ||||||
|
Net increase (decrease):
|
||||||||||||
|
Tax positions taken in prior periods
|
(1.1 | ) | (5.0 | ) | (.1 | ) | ||||||
|
Tax positions taken in current period
|
1.8 | .9 | .6 | |||||||||
|
Settlements with taxing authorities – cash paid
|
(.1 | ) | - | - | ||||||||
|
Lapse due to applicable statute of limitations
|
(.7 | ) | - | - | ||||||||
|
Change in currency exchange rates
|
(1.4 | ) | .7 | .4 | ||||||||
|
Unrecognized tax benefits at end of year
|
$ | 10.4 | $ | 7.0 | $ | 7.9 | ||||||
If our uncertain tax positions were recognized, a benefit of $13.1 million, $9.5 million, and $10.6 million would affect our effective income tax rates from continuing operations for 2008, 2009 and 2010 respectively. We currently estimate that our unrecognized tax benefits will not change materially during the next twelve months.
We file income tax returns in various U.S. federal, state and local jurisdictions. We also file income tax returns in various non-U.S. jurisdictions, principally in Germany, Canada, Belgium and Norway. Our U.S. income tax returns prior to 2007 are generally considered closed to examination by applicable tax authorities. Our non-U.S. income tax returns are generally considered closed to examination for years prior to 2006 for Germany, 2007 for Belgium, 2005 for Canada and 2001 for Norway.
At December 31, 2010, we had the equivalent of $952 million and $349 million of net operating loss carryforwards for German corporate and trade tax purposes, respectively. At December 31, 2010, we have concluded that no deferred income tax asset valuation allowance is required to be recognized with respect to such carryforwards, principally because (i) such carryforwards have an indefinite carryforward period, (ii) we have utilized a portion of such carryforwards during the most recent three-year period and (iii) we currently expect to utilize the remainder of such carryforwards over the long term. However, prior to the complete utilization of these carryforwards, particularly if the economic recovery were to be short-lived or we generate operating losses in our German operations for an extended period of time, it is possible we might conclude the benefit of the carryforwards would no longer meet the more-likely-than-not recognition criteria, at which point we would be required to recognize a valuation allowance against some or all of the then-remaining tax benefit associated with the carryforwards.
F - 22
Note 11 – Employee benefit plans:
Defined contribution plans. We maintain various defined contribution pension plans with our contributions based on matching or other formulas. Defined contribution plan expense approximated $.9 million in 2008, $1.0 million in 2009 and $1.2 million in 2010.
Accounting for defined benefit and postretirement benefits other than pensions (“OPEB”) plans. We recognize an asset or liability for the over or under funded status of each of our individual defined benefit pension plans on our Consolidated Balance Sheets. Changes in the funded status of these plans are recognized either in net income (loss), to the extent they are reflected in periodic benefit cost, or through other comprehensive income (loss). We used December 31 as a measurement date for our pension plans.
Defined benefit plans. We sponsor various defined benefit pension plans. Non-U.S. employees are covered by plans in their respective countries and a majority of U.S. employees are eligible to participate in a contributory savings plan. The benefits under our plans are based upon years of service and employee compensation. Our funding policy is to contribute annually the minimum amount required under ERISA (or equivalent non-U.S.) regulations plus additional amounts as we deem appropriate.
We expect to contribute the equivalent of approximately $27.6 million to all of our defined benefit pension plans during 2011. Benefit payments to plan participants out of plan assets are expected to be the equivalent of:
|
Years ending December 31,
|
Amount
|
|||
|
(In millions)
|
||||
|
2011
|
$ | 22.9 | ||
|
2012
|
25.5 | |||
|
2013
|
24.3 | |||
|
2014
|
24.6 | |||
|
2015
|
24.1 | |||
|
Next 5 years
|
129.4 | |||
F - 23
The funded status of our non-U.S. defined benefit pension plans is presented in the table below.
|
Years ended
|
||||||||
|
December 31,
|
||||||||
|
2009
|
2010
|
|||||||
|
(In millions)
|
||||||||
|
Change in projected benefit obligations (“PBO”):
|
||||||||
|
Benefit obligations at beginning of the year
|
$ | 375.5 | $ | 423.7 | ||||
|
Service cost
|
8.6 | 10.4 | ||||||
|
Interest cost
|
22.1 | 21.9 | ||||||
|
Participant contributions
|
1.6 | 1.7 | ||||||
|
Actuarial losses
|
12.2 | 24.9 | ||||||
|
Plan amendments
|
- | 3.8 | ||||||
|
Change in currency exchange rates
|
27.2 | (18.0 | ) | |||||
|
Benefits paid
|
(23.5 | ) | (22.4 | ) | ||||
|
Benefit obligations at end of the year
|
423.7 | 446.0 | ||||||
|
Change in plan assets:
|
||||||||
|
Fair value of plan assets at beginning of the year
|
252.8 | 306.9 | ||||||
|
Actual return on plan assets
|
31.4 | 26.7 | ||||||
|
Employer contributions
|
23.0 | 24.5 | ||||||
|
Participant contributions
|
1.6 | 1.7 | ||||||
|
Change in currency exchange rates
|
21.6 | (10.1 | ) | |||||
|
Benefits paid
|
(23.5 | ) | (22.4 | ) | ||||
|
Fair value of plan assets at end of year
|
306.9 | 327.3 | ||||||
|
Funded status
|
$ | (116.8 | ) | $ | (118.7 | ) | ||
|
Amounts recognized in the balance sheet:
|
||||||||
|
Noncurrent pension asset
|
$ | .3 | $ | .3 | ||||
|
Accrued pension costs:
|
||||||||
|
Current
|
(1.5 | ) | (1.3 | ) | ||||
|
Noncurrent
|
(115.6 | ) | (117.7 | ) | ||||
|
Total
|
$ | (116.8 | ) | $ | (118.7 | ) | ||
|
Accumulated other comprehensive loss:
|
||||||||
|
Actuarial losses
|
$ | 110.8 | $ | 119.7 | ||||
|
Prior service cost
|
4.8 | 7.7 | ||||||
|
Net transition obligations
|
2.7 | 2.2 | ||||||
|
Total
|
$ | 118.3 | $ | 129.6 | ||||
|
Accumulated benefit obligations (“ABO”)
|
$ | 389.8 | $ | 414.7 | ||||
In the fourth quarter of 2010, we amended our benefit formula for most participants of our Canadian and Belgium plans effective January 1, 2011, resulting in a prior service cost of approximately $3.8 million as of December 31, 2010. Key assumptions as of December 31, 2010 now reflect these plan revisions to the benefit formula.
The components of our net periodic defined benefit pension cost for our non-U.S. defined benefit pension plans are presented in the table below. In the fourth quarter of 2008 we recognized a $6.9 million adjustment in connection with the correction of our pension expense previously recognized for 2006 and 2007. The $6.9 million adjustment consisted of $2.0 million of service cost, $4.1 million of interest cost credit and $4.8 million of recognized actuarial gains. The amounts shown below for the amortization of prior service cost, net transition obligations and recognized actuarial losses for 2008, 2009 and 2010 were recognized as components of our accumulated other comprehensive income (loss) at December 31, 2007, 2008 and 2009, respectively, net of deferred income taxes.
F - 24
|
Years ended December 31,
|
||||||||||||
|
2008
|
2009
|
2010
|
||||||||||
|
(In millions)
|
||||||||||||
|
Net periodic pension cost:
|
||||||||||||
|
Service cost benefits
|
$ | 9.6 | $ | 8.6 | $ | 10.4 | ||||||
|
Interest cost on PBO
|
17.9 | 22.1 | 21.9 | |||||||||
|
Expected return on plan assets
|
(18.2 | ) | (15.4 | ) | (16.5 | ) | ||||||
|
Recognized actuarial losses (gains)
|
(.8 | ) | 5.5 | 5.5 | ||||||||
|
Amortization of prior service cost
|
.9 | .9 | .9 | |||||||||
|
Amortization of net transition obligations
|
.5 | .5 | .5 | |||||||||
|
Total
|
$ | 9.9 | $ | 22.2 | $ | 22.7 | ||||||
Certain information concerning our non-U.S. defined benefit pension plans is presented in the table below.
|
December 31,
|
||||||||
|
2009
|
2010
|
|||||||
|
(In millions)
|
||||||||
|
Plans for which the ABO exceeds plan assets:
|
||||||||
|
PBO
|
$ | 365.8 | $ | 386.2 | ||||
|
ABO
|
340.6 | 362.2 | ||||||
|
Fair value of plan assets
|
250.3 | 268.5 | ||||||
The weighted-average rate assumptions used in determining the actuarial present value of benefit obligations for our non-U.S. defined benefit pension plans as of December 31, 2009 and 2010 are presented in the table below.
|
Rate
|
December 31,
|
|||||||
|
|
2009
|
2010
|
||||||
|
Discount rate
|
5.5 | % | 5.1 | % | ||||
|
Increase in future compensation levels
|
3.1 | % | 3.1 | % | ||||
The weighted-average rate assumptions used in determining the net periodic pension cost for our non-U.S. defined benefit pension plans for 2008, 2009 and 2010 are presented in the table below.
|
Rate
|
Years ended December 31,
|
|||||||||||
|
2008
|
2009
|
2010
|
||||||||||
|
Discount rate
|
5.5 | % | 5.9 | % | 5.5 | % | ||||||
|
Increase in future compensation levels
|
3.0 | % | 3.2 | % | 3.1 | % | ||||||
|
Long-term return on plan assets
|
6.2 | % | 5.9 | % | 5.5 | % | ||||||
Variances from actuarially assumed rates will result in increases or decreases in accumulated pension obligations, pension expense and funding requirements in future periods.
F - 25
The funded status of our U.S. defined benefit pension plan is presented in the table below.
|
Years ended December 31,
|
||||||||
|
2009
|
2010
|
|||||||
|
(In millions)
|
||||||||
|
Change in PBO:
|
||||||||
|
Benefit obligations at beginning of the year
|
$ | 13.9 | $ | 14.6 | ||||
|
Interest cost
|
.8 | .9 | ||||||
|
Actuarial losses
|
.7 | 1.2 | ||||||
|
Benefits paid
|
(.8 | ) | (.8 | ) | ||||
|
Benefit obligations at end of the year
|
14.6 | 15.9 | ||||||
|
Change in plan assets:
|
||||||||
|
Fair value of plan assets at beginning of the year
|
11.1 | 11.8 | ||||||
|
Actual return on plan assets
|
1.4 | 2.9 | ||||||
|
Employer contributions
|
.1 | .1 | ||||||
|
Benefits paid
|
(.8 | ) | (.8 | ) | ||||
|
Fair value of plan assets at end of year
|
11.8 | 14.0 | ||||||
|
Funded status
|
$ | (2.8 | ) | $ | (1.9 | ) | ||
|
Amounts recognized in the balance sheet:
|
||||||||
|
Accrued pension costs:
|
||||||||
|
Current
|
$ | (.1 | ) | $ | (.1 | ) | ||
|
Noncurrent
|
(2.7 | ) | (1.8 | ) | ||||
|
Total
|
$ | (2.8 | ) | $ | (1.9 | ) | ||
|
Accumulated other comprehensive loss-
|
||||||||
|
actuarial losses
|
$ | 8.0 | $ | 7.1 | ||||
|
ABO
|
$ | 14.6 | $ | 15.9 | ||||
The components of our net periodic defined benefit pension cost for our U.S. defined benefit pension plan is presented in the table below. The amounts shown below for recognized actuarial losses for 2008, 2009 and 2010 were recognized as components of our accumulated other comprehensive income (loss) at December 31, 2007, 2008 and 2009 respectively, net of deferred income taxes.
|
Years ended December 31,
|
||||||||||||
|
2008
|
2009
|
2010
|
||||||||||
|
(In millions)
|
||||||||||||
|
Net periodic pension cost:
|
||||||||||||
|
Interest cost on PBO
|
$ | .9 | $ | .9 | $ | .9 | ||||||
|
Expected return on plan assets
|
(2.0 | ) | (1.1 | ) | (1.0 | ) | ||||||
|
Recognized actuarial losses
|
- | .3 | .2 | |||||||||
|
Total
|
$ | (1.1 | ) | $ | .1 | $ | .1 | |||||
The discount rate assumptions used in determining the actuarial present value of the benefit obligation for our U.S. defined benefit pension plan as of December 31, 2009 and 2010 are 5.7% and 5.1%, respectively. The impact of assumed increases in future compensation levels does not have an effect on the benefit obligation as the plan is frozen with regards to compensation.
F - 26
|
Rate
|
Years ended December 31,
|
|||||||||||
|
2008
|
2009
|
2010
|
||||||||||
|
Discount rate
|
6.1 | % | 6.1 | % | 5.7 | % | ||||||
|
Long-term return on plan assets
|
10.0 | % | 10.0 | % | 10.0 | % | ||||||
Variances from actuarially assumed rates will result in increases or decreases in accumulated pension obligations, pension expense and funding requirements in future periods.
The amounts shown in the above tables for actuarial losses, prior service cost and net transition obligations at December 31, 2009 and 2010 have not yet been recognized as components of our periodic defined benefit pension cost as of those dates. These amounts will be recognized as components of our periodic defined benefit cost in future years. These amounts, net of deferred income taxes, are recognized in our accumulated other comprehensive income (loss) at December 2009 and 2010. We expect approximately $6.5 million, $1.1 million and $.4 million of the unrecognized actuarial losses, prior service costs and net transition obligations, respectively, will be recognized as components of our consolidated net periodic defined benefit pension cost in 2011.
The table below details the changes in our consolidated other comprehensive income (loss) during 2008, 2009 and 2010.
|
Years Ended December 31,
|
||||||||||||
|
2008
|
2009
|
2010
|
||||||||||
|
(In millions)
|
||||||||||||
|
Changes in plan assets and benefit obligations
recognized in other comprehensive income (loss):
|
||||||||||||
|
Current year:
|
||||||||||||
|
Net actuarial gain (loss)
|
$ | (15.0 | ) | $ | 2.8 | $ | (13.9 | ) | ||||
|
Plan amendments
|
- | - | (3.8 | ) | ||||||||
|
Amortization of unrecognized:
|
||||||||||||
|
Net actuarial losses (gains)
|
(.8 | ) | 5.5 | 5.7 | ||||||||
|
Prior service cost
|
.9 | .8 | .9 | |||||||||
|
Net transition obligations
|
.5 | .5 | .5 | |||||||||
|
Total
|
$ | (14.4 | ) | $ | 9.6 | $ | (10.6 | ) | ||||
In determining the expected long-term rate of return on plan asset assumptions, we consider the long-term asset mix (e.g. equity vs. fixed income) for the assets for each of our plans and the expected long-term rates of return for such asset components. In addition, we receive third-party advice about appropriate long-term rates of return. Such assumed asset mixes are summarized below:
F - 27
|
·
|
In Germany, the composition of our plan assets is established to satisfy the requirements of the German insurance commissioner. Our German pension plan assets represent an investment in a large collective investment fund established and maintained by Bayer AG in which several pension plans, including our German pension plan and Bayer’s pension plans, have invested. These plan assets are a Level 3 input because there is not an active market that approximates the value of our investment in the Bayer investment fund. We determine the fair value of the Bayer plan assets based on periodic reports we receive from the managers of the Bayer plan which are subject to audit by the German pension regulator.
|
|
·
|
In Canada, we currently have a plan asset target allocation of 55% to equity securities and 45% to fixed income securities. We expect the long-term rate of return for such investments to average approximately 125 basis points above the applicable equity or fixed income index. The Canadian assets are Level 1 input because they are traded in active markets.
|
|
·
|
In Norway, we currently have a plan asset target allocation of 14% to equity securities, 72% to fixed income securities and the remainder primarily to liquid investments such as money markets. The expected long-term rate of return for such investments is approximately 9.0%, 5.0% and 4.0%, respectively. The majority of Norwegian plan assets are Level 1 inputs because they are traded in active markets; however a portion of our Norwegian plan assets are invested in certain individualized fixed income insurance contracts for the benefit of each plan participant as required by the local regulators and are therefore a Level 3 input.
|
|
·
|
In the U.S., substantially all of the assets were invested in The Combined Master Retirement Trust (“CMRT”), a collective investment trust sponsored by Contran to permit the collective investment by certain master trusts which fund certain employee benefit plans sponsored by Contran and certain of its affiliates.
|
The CMRT’s long-term investment objective is to provide a rate of return exceeding a composite of broad market equity and fixed income indices (including the S&P 500 and certain Russell indices) while utilizing both third-party investment managers as well as investments directed by Mr. Simmons. Mr. Simmons is the sole trustee of the CMRT. The trustee of the CMRT, along with the CMRT’s investment committee, of which Mr. Simmons is a member, actively manage the investments of the CMRT.
The CMRT trustee and investment committee do not maintain a specific target asset allocation in order to achieve their objectives, but instead they periodically change the asset mix of the CMRT based upon, among other things, advice they receive from third-party advisors and their expectations regarding potential returns for various investment alternatives and what asset mix will generate the greatest overall return. The CMRT holds TIMET common stock in its investment portfolio; however through December 31, 2009 we invested in a portion of the CMRT which does not include the TIMET holdings. Beginning in 2010, we now invest in the portion of the CMRT that holds such stock. During the history of the CMRT from its inception in 1988 through December 31, 2010, the average annual rate of return (excluding the CMRT’s investment in TIMET common stock) has been 12%, while such annual rate of return including TIMET common stock has been 15%. For the years ended December 31, 2008, 2009 and 2010, the assumed long-term rate of return for plan assets invested in the CMRT was 10%. In determining the appropriateness of the long-term rate of return assumption, we primarily rely on the historical rates of return achieved by the CMRT, although we consider other factors as well including, among other things, the investment objectives of the CMRT's managers and their expectation that such historical returns will in the future continue to be achieved over the long-term.
F - 28
The CMRT unit value is determined semi-monthly, and the plans have the ability to redeem all or any portion of their investment in the CMRT at any time based on the most recent semi-monthly valuation. However, the plans do not have the right to individual assets held by the CMRT and the CMRT has the sole discretion in determining how to meet any redemption request. For purposes of our plan asset disclosure, we consider the investment in the CMRT as a Level 2 input because (i) the CMRT value is established semi-monthly and the plans have the right to redeem their investment in the CMRT, in part or in whole, at anytime based on the most recent value and (ii) observable inputs from Level 1 or Level 2 were used to value approximately 79% and 84% of the assets of the CMRT at December 31, 2009 and 2010, respectively, as noted below. The aggregate fair value of all of the CMRT assets, including funds of Contran and its other affiliates that also invest in the CMRT, and supplemental asset mix details of the CMRT as of December 31, 2009 and 2010, are as follows:
|
2009
|
2010
|
|||||||
|
(In millions)
|
||||||||
|
CMRT asset value (portion which includes our U.S. plan assets)
|
$ | 407.3 | $ | 714.9 | ||||
|
CMRT fair value input (portion which includes our U.S. plan assets)
|
||||||||
|
Level 1
|
75 | % | 83 | % | ||||
|
Level 2
|
4 | 1 | ||||||
|
Level 3
|
21 | 16 | ||||||
| 100 | % | 100 | % | |||||
|
CMRT asset mix (portion which includes our U.S. plan assets)
|
||||||||
|
Domestic equities, principally publically traded
|
49 | % | 73 | % | ||||
|
International equities, publically traded
|
7 | 2 | ||||||
|
Fixed income securities, publically traded
|
31 | 16 | ||||||
|
Privately managed limited partnerships
|
11 | 8 | ||||||
|
Other
|
2 | 1 | ||||||
| 100 | % | 100 | % | |||||
|
·
|
We also have plan assets in Belgium and the United Kingdom. The Belgian plan assets are invested in certain individualized fixed income insurance contracts for the benefit of each plan participant as required by the local regulators and are therefore a Level 3 input. The United Kingdom plan assets consist of marketable securities which are Level 1 inputs because they trade in active markets.
|
We regularly review our actual asset allocation for each plan, and will periodically rebalance the investments in each plan to more accurately reflect the targeted allocation and/or maximize the overall long-term return when considered appropriate.
F - 29
The composition of our December 31, 2009 and 2010 pension plan assets by asset category and fair value level were as follows:
|
Fair Value Measurements at December 31, 2009
|
||||||||||||||||
|
Total
|
Quoted Prices in Active Markets (Level 1)
|
Significant Other Observable Inputs (Level 2)
|
Significant Unobservable Inputs (Level 3)
|
|||||||||||||
|
(In millions)
|
||||||||||||||||
|
Germany
|
$ | 172.3 | $ | - | $ | - | $ | 172.3 | ||||||||
|
Canada:
|
- | |||||||||||||||
|
Local currency equities
|
16.6 | 16.6 | - | - | ||||||||||||
|
Non local currency equities
|
24.3 | 24.3 | - | - | ||||||||||||
|
Local currency fixed income
|
26.2 | 26.2 | - | - | ||||||||||||
|
Non local currency fixed income
|
.2 | .2 | - | - | ||||||||||||
|
Cash and other
|
1.6 | 1.6 | - | - | ||||||||||||
|
Norway:
|
||||||||||||||||
|
Local currency equities
|
3.6 | 3.6 | - | - | ||||||||||||
|
Non local currency equities
|
6.4 | 6.4 | - | - | ||||||||||||
|
Local currency fixed income
|
31.9 | 7.7 | - | 24.2 | ||||||||||||
|
Non local currency fixed income
|
4.4 | 1.3 | - | 3.1 | ||||||||||||
|
Cash and other
|
10.4 | 9.7 | - | .7 | ||||||||||||
|
U.S. - CMRT
|
11.8 | - | 11.8 | - | ||||||||||||
|
Other
|
9.0 | 2.2 | - | 6.8 | ||||||||||||
|
Total
|
$ | 318.7 | $ | 99.8 | $ | 11.8 | $ | 207.1 | ||||||||
|
Fair Value Measurements at December 31, 2010
|
||||||||||||||||
|
Total
|
Quoted Prices in Active Markets (Level 1)
|
Significant Other Observable Inputs (Level 2)
|
Significant Unobservable Inputs (Level 3)
|
|||||||||||||
|
(In millions)
|
||||||||||||||||
|
Germany
|
$ | 176.2 | $ | - | $ | - | $ | 176.2 | ||||||||
|
Canada:
|
- | |||||||||||||||
|
Local currency equities
|
19.6 | 19.6 | - | - | ||||||||||||
|
Non local currency equities
|
28.3 | 28.3 | - | - | ||||||||||||
|
Local currency fixed income
|
30.7 | 30.7 | - | - | ||||||||||||
|
Non local currency fixed income
|
.2 | .2 | - | - | ||||||||||||
|
Cash and other
|
2.4 | 2.4 | - | - | ||||||||||||
|
Norway:
|
||||||||||||||||
|
Local currency equities
|
11.5 | 11.5 | - | - | ||||||||||||
|
Non local currency equities
|
.2 | .2 | - | - | ||||||||||||
|
Local currency fixed income
|
42.3 | 15.9 | - | 26.4 | ||||||||||||
|
Non local currency fixed income
|
3.5 | .5 | - | 3.0 | ||||||||||||
|
Cash and other
|
1.2 | .6 | - | .6 | ||||||||||||
|
U.S.
|
||||||||||||||||
|
CMRT
|
13.7 | - | 13.7 | - | ||||||||||||
|
Cash & other
|
.3 | .3 | - | - | ||||||||||||
|
Other
|
11.2 | 2.5 | - | 8.7 | ||||||||||||
|
Total
|
$ | 341.3 | $ | 112.7 | $ | 13.7 | $ | 214.9 | ||||||||
F - 30
A rollforward of the change in fair value of Level 3 assets follows.
|
2009
|
2010
|
|||||||
|
(In millions)
|
||||||||
|
Fair value at beginning of year
|
$ | 178.9 | $ | 207.1 | ||||
|
Gain on assets held at end of year
|
19.8 | 15.9 | ||||||
|
Gain (loss) on assets sold during the year
|
(1.4 | ) | 1.5 | |||||
|
Assets purchased
|
20.2 | 20.0 | ||||||
|
Assets sold
|
(19.0 | ) | (15.9 | ) | ||||
|
Currency exchange rate fluctuations
|
8.6 | (13.7 | ) | |||||
|
Fair value at end of year
|
$ | 207.1 | $ | 214.9 | ||||
Postretirement benefits other than pensions (“OPEB”). We provide certain health care and life insurance benefits for eligible retired employees. Certain of our Canadian employees may become eligible for such postretirement health care and life insurance benefits if they reach retirement age while working for us. In the U.S., employees who retired after 1998 are not entitled to any such benefits. The majority of all retirees are required to contribute a portion of the cost of their benefits and certain current and future retirees are eligible for reduced health care benefits at age 65. We use a December 31 measurement date for our OPEB plans. We have no OPEB plan assets, rather, we fund medical claims as they are paid. Benefit payments to OPEB plans are expected to be the equivalent of:
|
Years ending December 31,
|
Amount
|
|||
|
(In millions)
|
||||
|
2011
|
$ | .5 | ||
|
2012
|
.5 | |||
|
2013
|
.5 | |||
|
2014
|
.5 | |||
|
2015
|
.5 | |||
|
Next 5 years
|
2.4 | |||
F - 31
The funded status of our OPEB plans is presented in the table below:
|
Years ended December 31,
|
||||||||
|
2009
|
2010
|
|||||||
|
(In millions)
|
||||||||
|
Change in accumulated OPEB obligations:
|
||||||||
|
Obligations at beginning of the year
|
$ | 9.4 | $ | 14.2 | ||||
|
Service cost
|
.2 | .4 | ||||||
|
Interest cost
|
.6 | .8 | ||||||
|
Actuarial losses
|
3.2 | 1.6 | ||||||
|
Plan amendments
|
- | (5.8 | ) | |||||
|
Change in currency exchange rates
|
1.2 | .5 | ||||||
|
Benefits paid from employer contributions
|
(.4 | ) | (.5 | ) | ||||
|
Obligations at end of the year
|
14.2 | 11.2 | ||||||
|
Fair value of plan assets
|
- | - | ||||||
|
Funded status
|
$ | (14.2 | ) | $ | (11.2 | ) | ||
|
Amounts recognized in the balance sheet:
|
||||||||
|
Current accrued pension costs
|
$ | (.8 | ) | $ | (.6 | ) | ||
|
Noncurrent accrued pension costs
|
(13.4 | ) | (10.6 | ) | ||||
|
Total
|
$ | (14.2 | ) | $ | (11.2 | ) | ||
|
Accumulated other comprehensive (income) loss:
|
||||||||
|
Net actuarial losses
|
$ | 1.7 | $ | 3.2 | ||||
|
Prior service credit
|
(.5 | ) | (6.1 | ) | ||||
|
Total
|
$ | 1.2 | $ | (2.9 | ) | |||
The amounts shown in the table above for net actuarial losses and prior service credit at December 31, 2009 and 2010 have not yet been recognized as components of our periodic OPEB cost as of those dates. These amounts will be recognized as components of our periodic OPEB cost in future years. These amounts, net of deferred income taxes, are recognized in our accumulated other comprehensive income (loss). We expect to recognize approximately $.2 million of unrecognized actuarial losses and $.2 million of prior service credit as components of our periodic OPEB cost in 2011.
At December 31, 2010, the accumulated OPEB obligations for all OPEB plans was comprised of $1.4 million related to U.S. plans and $9.7 million related to our Canadian plan (2009 - $2.8 million and $11.4 million, respectively).
In the fourth quarter of 2010, we amended our benefit formula for most participants of our plans effective January 1, 2011, resulting in a prior service credit of approximately $5.8 million as of December 31, 2010. Key assumptions including the health care cost trend rate as of December 31, 2010 now reflect these plan revisions to the benefit formula.
The components of our periodic OPEB costs are presented in the table below. The amounts shown below for amortization of prior service credit and recognized actuarial losses for 2008, 2009 and 2010 were recognized as components of our accumulated other comprehensive income (loss) at December 31, 2007, 2008 and 2009, respectively, net of deferred income taxes.
F - 32
|
Years ended December 31,
|
||||||||||||
|
2008
|
2009
|
2010
|
||||||||||
|
(In millions)
|
||||||||||||
|
Net periodic OPEB cost (credit):
|
||||||||||||
|
Service cost
|
$ | .3 | $ | .2 | $ | .4 | ||||||
|
Interest cost
|
.7 | .6 | .8 | |||||||||
|
Amortization of prior service credit
|
(.2 | ) | (.2 | ) | (.2 | ) | ||||||
|
Recognized actuarial losses
|
.1 | - | .2 | |||||||||
|
Total
|
$ | .9 | $ | .6 | $ | 1.2 | ||||||
The table below details the changes in benefit obligations recognized in accumulated other comprehensive income (loss) during 2008, 2009 and 2010.
|
Years Ended December 31,
|
||||||||||||
|
2008
|
2009
|
2010
|
||||||||||
|
(In millions)
|
||||||||||||
|
Changes in benefit obligations recognized in
other comprehensive income (loss):
|
||||||||||||
|
Current year:
|
||||||||||||
|
Net actuarial gain (loss)
|
$ | 1.6 | $ | (3.2 | ) | $ | (1.6 | ) | ||||
|
Plan amendments
|
- | - | 5.8 | |||||||||
|
Amortization of unrecognized:
|
||||||||||||
|
Prior service cost (credit)
|
(.2 | ) | (.2 | ) | (.2 | ) | ||||||
|
Net actuarial gain (loss)
|
.1 | - |
.2
|
|||||||||
|
Total
|
$ | 1.5 | $ | (3.4 | ) | $ | 4.2 | |||||
A summary of our key actuarial assumptions used to determine the net benefit obligation as of December 31, 2009 and 2010 are presented in the table below. The weighted average discount rate was determined using the projected benefit obligation as of such dates. The impact of assumed increases in future compensation levels does not have a material effect on the actuarial present value of the benefit obligation as substantially all of such benefits relate solely to eligible retirees, for which compensation is not applicable.
|
2009
|
2010
|
|||||||
|
Healthcare inflation:
|
||||||||
|
Initial rate
|
7.5 | % | 7.5 | % | ||||
|
Ultimate rate
|
5.5 | % | 5.5 | % | ||||
|
Year of ultimate rate achievement
|
2014 | 2016 | ||||||
|
Weighted average discount rate
|
5.8 | % | 5.1 | % | ||||
Assumed health care cost trend rates have a significant effect on the amounts we report for health care plans. A one percent change in assumed health care trend rates would have the following effects:
|
1% Increase
|
1% Decrease
|
|||||||
|
(In millions)
|
||||||||
|
Effect on net OPEB cost during 2010
|
$ | .3 | $ | (.2 | ) | |||
|
Effect at December 31, 2010 on
postretirement obligation
|
.2 | (.2 | ) | |||||
F - 33
The weighted average discount rate used in determining the net periodic OPEB cost for 2010 was 5.8% (2009 – 6.5%; 2008 – 6.2%). Such weighted average rate was determined using the projected benefit obligation as of the beginning of each year. The impact of assumed increases in future compensation levels does not have a material effect on the net periodic OPEB cost as substantially all of such benefits relate solely to eligible retirees, for which compensation is not applicable. The impact of assumed rate of return on plan assets also does not have a material effect on the net periodic OPEB cost as there were no plan assets as of December 31, 2009 or 2010.
Variances from actuarially-assumed rates will result in additional increases or decreases in accumulated OPEB obligations, net periodic OPEB cost and funding requirements in future periods.
The Medicare Prescription Drug, Improvement and Modernization Act of 2003 provides a federal subsidy to sponsors of retiree health care benefit plans that provide a benefit that is at least actuarially equivalent to Medicare Part D. We are eligible for the federal subsidy. We account for the effect of this subsidy prospectively from the date we determined actuarial equivalence. The subsidy did not have a material impact on the applicable accumulated postretirement benefit obligation, and will not have a material impact on the net periodic OPEB cost going forward.
Note 12 – Other noncurrent liabilities:
|
December 31,
|
||||||||
|
2009
|
2010
|
|||||||
|
(In millions)
|
||||||||
|
Reserve for uncertain tax positions
|
$ | 9.5 | $ | 10.6 | ||||
|
Employee benefits
|
9.2 | 9.7 | ||||||
|
Insurance claims and expenses
|
.3 | .3 | ||||||
|
Other
|
4.2 | 5.0 | ||||||
|
Total
|
$ | 23.2 | $ | 25.6 | ||||
Note 13 – Common stock compensation and other stock transactions:
Secondary public offering of common stock. In November 2010, we completed a secondary public offering of 8.97 million shares of our common stock in an underwritten offering for net proceeds of $337.6 million. The price to the public was $40.00 per share, and the underwriting discount was 5.75% (or $2.30 per share). Costs of the offering (exclusive of the underwriting discount) were approximately $.7 million. The offering took place in two parts, and the first closing occurred on November 2, 2010 of 7.8 million shares of common stock that generated net proceeds of $293.5 million. The second closing (upon exercise of the underwriters’ over-allotment option) occurred on November 9, 2010 for an additional 1.17 million shares of common stock that generated additional net proceeds of $44.1 million. The shares of common stock issued in the secondary offering are identical to the previously issued outstanding shares in all respects, including par value, liquidation and dividend preference. All shares were sold to third-party investors; none of our affiliated companies purchased any shares in the offering. Upon completion of the offering, the Valhi consolidated aggregate ownership of Kronos was reduced from 95.2% (59.2% held by Valhi directly and 36.0% held by NL directly) to 80.4% (50.0% is held by Valhi directly and 30.4% is held by NL directly).
NL common stock options held by our employees. Certain of our employees have been granted nonqualified options to purchase NL common stock under the terms of certain option plans sponsored by NL. Generally, the stock options are granted at a price equal to or greater than 100% of the market price of NL's common stock at the date of grant, vest over a five-year period and expire ten years from the date of grant.
At December 31, 2010, our employees held options to purchase 43,150 shares of NL common stock, all of which were exercisable. These options were exercisable until February 2011 at an exercise price of $11.49 per share. At December 31, 2010, the quoted market price of NL’s common stock was $11.16 per share. During 2008, 2009 and 2010, 600, 6,950 and 10,350 options were exercised, respectively.
F - 34
Long-term incentive compensation plan. We have a long-term incentive compensation plan that provides for the discretionary grant of, among other things, qualified incentive stock options, nonqualified stock options, restricted common stock, stock awards and stock appreciation rights. Up to 150,000 shares of our common stock may be issued pursuant to this plan. As of December 31, 2010, no options had been granted pursuant to this plan, and 115,500 shares were available for future grants. During 2008, 2009 and 2010 we awarded an aggregate of 3,500, 10,500 and 7,000 shares of our common stock pursuant to this plan to members of our board of directors. Other than the issuance of these shares of our common stock, the only other change in our outstanding shares of common stock during the last three years was the issuance of 8.97 million shares of our common stock in the secondary public offering discussed above.
Special dividend declared. Our board of directors on February 10, 2011, declared a special dividend of $1.00 per share to shareholders of record on February 21, 2011 which we paid on February 28, 2011. The declaration and payment of future dividends is discretionary, and the amount, if any, will be dependent upon such factors. There are currently no restrictions on our ability to pay dividends.
Note 14 - Related party transactions:
We may be deemed to be controlled by Harold C. Simmons. See Note 1. Corporations that may be deemed to be controlled by or affiliated with Mr. Simmons sometimes engage in (a) intercorporate transactions such as guarantees, management and expense sharing arrangements, shared fee arrangements, joint ventures, partnerships, loans, options, advances of funds on open account, and sales, leases and exchanges of assets, including securities issued by both related and unrelated parties and (b) common investment and acquisition strategies, business combinations, reorganizations, recapitalizations, securities repurchases, and purchases and sales (and other acquisitions and dispositions) of subsidiaries, divisions or other business units, which transactions have involved both related and unrelated parties and have included transactions which resulted in the acquisition by one related party of a publicly-held noncontrolling interest in another related party. While no transactions of the type described above are planned or proposed with respect to us other than as set forth in these financial statements, we continuously consider, review and evaluate, and understand that Contran and related entities consider, review and evaluate such transactions. Depending upon the business, tax and other objectives then relevant, it is possible that we might be a party to one or more such transactions in the future.
Current receivables from and payables to affiliates are summarized in the table below.
|
December 31,
|
||||||||
|
2009
|
2010
|
|||||||
|
(In millions)
|
||||||||
|
Current receivable from affiliate
|
$ | .1 | $ | - | ||||
|
Noncurrent note receivable from Valhi
|
$ | - | $ | 61.9 | ||||
|
Current payables to affiliates:
|
||||||||
|
LPC
|
$ | 12.0 | $ | 7.4 | ||||
|
Income taxes payable to Valhi
|
.4 | 2.1 | ||||||
|
Other
|
.2 | .1 | ||||||
|
Total
|
$ | 12.6 | $ | 9.6 | ||||
F - 35
From time to time, we will have loans and advances outstanding between us and various related parties pursuant to term and demand notes. We generally enter into these loans and advances for cash management purposes. When we loan funds to related parties, we are generally able to earn a higher rate of return on the loan than we would earn if we invested the funds in other instruments. While certain of these loans may be of a lesser credit quality than cash equivalent instruments otherwise available to us, we believe we have considered the credit risks in the terms of the applicable loans. In this regard:
|
·
|
In November 2010, we entered into an unsecured revolving demand promissory note with Valhi whereby, as amended, we agreed to loan Valhi up to $175 million. Our loan to Valhi bears interest at prime plus 1.00%, payable quarterly, with all principal due on demand, but in any event no earlier than March 31, 2012 and later than December 31, 2012. The amount of our outstanding loans to Valhi at any time is at our discretion. As of December 31, 2010, we had loans outstanding to Valhi of $61.9 million;
|
|
·
|
In April 2010, we entered into an unsecured revolving credit note with Contran pursuant to which we may borrow up to $40 million from Contran. Our loans from Contran bear interest, payable quarterly, at the prime rate minus 0.5%, with all outstanding principal due on demand and in any event no later than December 31, 2011. The amount of our outstanding borrowing at any time is solely at the discretion of Contran. As of December 31, 2010 no amounts were outstanding under this facility; and
|
|
·
|
In October 2008, we entered into an unsecured revolving credit note with NL pursuant to which we could borrow up to $40 million from NL through December 31, 2009. Such revolving credit note terminated upon its maturity in December 2009.
|
Interest income on our loan to Valhi was $.5 million in 2010. Interest expense on our loans from Contran and NL was $.1 million in 2008, $.3 million in 2009 and $.2 million in 2010.
Amounts payable to LPC are generally for the purchase of TiO2 (see Note 5). Purchases of TiO2 from LPC were $140.3 million in 2008, $121.1 million in 2009 and $133.7 million in 2010.
Under the terms of various intercorporate services agreements ("ISAs") entered into between us and various related parties, including Contran, employees of one company will provide certain management, tax planning, financial and administrative services to the other company on a fee basis. Such charges are based upon estimates of the time devoted by the employees of the provider of the services to the affairs of the recipient, and the compensation and associated expenses of such persons. Because of the large number of companies affiliated with Contran, we believe we benefit from cost savings and economies of scale gained by not having certain management, financial and administrative staffs duplicated at each entity, thus allowing certain individuals to provide services to multiple companies but only be compensated by one entity. The net ISA fee charged to us, approved by the independent members of our board of directors, is included in selling, general and administrative expense and corporate expense and was $6.8 million in 2008, $7.4 million in 2009 and $8.3 million in 2010.
Tall Pines Insurance Company, and EWI RE, Inc. provide for or broker certain insurance policies for Contran and certain of its subsidiaries and affiliates, including ourselves. Tall Pines and EWI are subsidiaries of Valhi. Consistent with insurance industry practices, Tall Pines and EWI receive commissions from insurance and reinsurance underwriters and/or assess fees for the policies that they provide or broker. The aggregate premiums paid to Tall Pines and EWI by us and our joint venture were $8.5 million in 2008, $8.5 million in 2009 and $8.0 million in 2010. These amounts principally included payments for insurance and reinsurance premiums paid to third parties, but also included commissions paid to Tall Pines and EWI. Tall Pines purchases reinsurance for substantially all of the risks it underwrites. We expect these relationships with Tall Pines and EWI will continue in 2011.
F - 36
Contran and certain of its subsidiaries and affiliates, including us, purchase certain of their insurance policies as a group, with the costs of the jointly-owned policies being apportioned among the participating companies. With respect to certain of such policies, it is possible that unusually large losses incurred by one or more insureds during a given policy period could leave the other participating companies without adequate coverage under that policy for the balance of the policy period. As a result, Contran and certain of its subsidiaries and affiliates, including us, have entered into a loss sharing agreement under which any uninsured loss is shared by those entities who have submitted claims under the relevant policy. We believe the benefits, in the form of reduced premiums and broader coverage associated with the group coverage for such policies, justifies the risk associated with the potential for any uninsured loss.
Note 15 - Commitments and contingencies:
Environmental matters. Our operations are governed by various environmental laws and regulations. Certain of our operations are and have been engaged in the handling, manufacture or use of substances or compounds that may be considered toxic or hazardous within the meaning of applicable environmental laws and regulations. As with other companies engaged in similar businesses, certain of our past and current operations and products have the potential to cause environmental or other damage. We have implemented and continue to implement various policies and programs in an effort to minimize these risks. Our policy is to maintain compliance with applicable environmental laws and regulations at all of our facilities and to strive to improve our environmental performance. From time to time, we may be subject to environmental regulatory enforcement under U.S. and non U.S. statutes, resolution of which typically involves the establishment of compliance programs. It is possible that future developments, such as stricter requirements of environmental laws and enforcement policies thereunder, could adversely affect our production, handling, use, storage, transportation, sale or disposal of such substances. We believe all of our plants are in substantial compliance with applicable environmental laws.
Litigation matters. We are involved in various environmental, contractual, product liability, patent (or intellectual property), employment and other claims and disputes incidental to our business. We currently believe the disposition of all claims and disputes, individually or in the aggregate, should not have a material adverse effect on our consolidated financial condition, results of operations or liquidity.
In March 2010, we were served with two complaints which were subsequently consolidated as Haley Paint et al. v. E.I. Du Pont de Nemours and Company, et al. (United States District Court, Northern Division of Maryland, Case No. 1:10-cv-00318-RDB). The defendants include us, E.I. Du Pont de Nemours & Company, Huntsman International LLC, Millennium Inorganic Chemicals, Inc. and the National Titanium Dioxide Company Limited (d/b/a Cristal). Plaintiffs seek to represent a class consisting of all persons and entities that purchased titanium dioxide in the United States directly from one or more of the defendants on or after March 1, 2002. The complaint alleges that the defendants conspired and combined to fix, raise, maintain, and stabilize the price at which titanium dioxide was sold in the United States and engaged in other anticompetitive conduct. In May 2010, defendants filed a motion to dismiss, which plaintiffs opposed in June 2010. The case is proceeding in the trial court.
F - 37
Concentrations of credit risk. Sales of TiO2 accounted for approximately 90% of our sales during each of the past three years. The remaining sales result from the mining and sale of ilmenite ore (a raw material used in the sulfate pigment production process), and the manufacture and sale of iron-based water treatment chemicals and certain titanium chemical products (derived from co-products of the TiO2 production processes). TiO2 is generally sold to the paint, plastics and paper industries. Such markets are generally considered “quality-of-life” markets whose demand for TiO2 is influenced by the relative economic well-being of the various geographic regions. We sell TiO2 to over 4,000 customers, with the top ten customers approximating 27% of net sales in 2008 and 28% in 2009 and 27% in 2010. We did not have sales to a single customer comprising over 10% of our net sales in any of the previous three years. The table below shows the approximate percentage of our TiO2 sales by volume for our significant markets, Europe and North American, for the last three years.
|
2008
|
2009
|
2010
|
||||||||||
|
Europe
|
53 | % | 53 | % | 53 | % | ||||||
|
North America
|
34 | % | 32 | % | 33 | % | ||||||
Long-term contracts. We have long-term supply contracts that provide for our TiO2 feedstock requirements through 2014. The agreements require us to purchase certain minimum quantities of feedstock with minimum purchase commitments aggregating approximately $592 million at December 31, 2010. In addition, we have other long-term supply and service contracts that provide for various raw materials and services. These agreements require us to purchase certain minimum quantities or services with minimum purchase commitments aggregating approximately $132 million at December 31, 2010.
Operating leases. Our principal German operating subsidiary leases the land under its Leverkusen TiO2 production facility pursuant to a lease with Bayer AG that expires in 2050. The Leverkusen facility itself, which we own and which represents approximately one-third of our current TiO2 production capacity, is located within Bayer's extensive manufacturing complex. We periodically establish the amount of rent for the land lease associated with the Leverkusen facility by agreement with Bayer for periods of at least two years at a time. The lease agreement provides for no formula, index or other mechanism to determine changes in the rent for such land lease; rather, any change in the rent is subject solely to periodic negotiation between Bayer and us. We recognize any change in the rent based on such negotiations as part of lease expense starting from the time such change is agreed upon by both parties, as any such change in the rent is deemed “contingent rentals” under GAAP. Under a separate supplies and services agreement expiring in 2011, Bayer provides some raw materials, including chlorine, auxiliary and operating materials, utilities and services necessary to operate the Leverkusen facility.
We also lease various other manufacturing facilities and equipment. Some of the leases contain purchase and/or various term renewal options at fair market and fair rental values, respectively. In most cases we expect that, in the normal course of business, such leases will be renewed or replaced by other leases. Net rent expense approximated $12 million in 2008, $11 million in 2009 and $11 million in 2010. At December 31, 2010, future minimum payments under noncancellable operating leases having an initial or remaining term of more than one year were as follows:
|
Years ending December 31,
|
Amount
|
|||
|
(In millions)
|
||||
|
2011
|
$ | 10.4 | ||
|
2012
|
6.7 | |||
|
2013
|
4.9 | |||
|
2014
|
3.5 | |||
|
2015
|
2.6 | |||
|
2016 and thereafter
|
18.0 | |||
|
Total
|
$ | 46.1 | ||
F - 38
Approximately $19 million of the $46.1 million aggregate future minimum rental commitments at December 31, 2010 relates to our Leverkusen facility lease discussed above. The minimum commitment amounts for such lease included in the table above for each year through the 2050 expiration of the lease are based upon the current annual rental rate as of December 31, 2010. As discussed above, any change in the rent is based solely on negotiations between Bayer and ourselves, and any such change in the rent is deemed “contingent rentals” under GAAP which is excluded from the future minimum lease payments disclosed above.
Income taxes. We and Valhi have agreed to a policy providing for the allocation of tax liabilities and tax payments as described in Note 1. Under applicable law, we, along with every other member of the Contran Tax Group, are each jointly and severally liable for the aggregate federal income tax liability of Contran and the other companies included in the Contran Tax Group for all periods in which we are included in the Contran Tax Group. Valhi has agreed, however, to indemnify us for any liability for income taxes of the Contran Tax Group in excess of our tax liability previously computed and paid by us in accordance with the tax allocation policy.
Note 16 - Financial instruments:
The following table summarizes the valuation of our financial instruments recorded on a fair value basis as of December 31, 2009 and 2010:
|
Fair Value Measurements
|
||||||||||||||||
|
Total
|
Quoted Prices in Active Markets (Level 1)
|
Significant Other Observable Inputs (Level 2)
|
Significant Unobservable Inputs (Level 3)
|
|||||||||||||
|
(In millions)
|
||||||||||||||||
|
December 31, 2009
|
||||||||||||||||
|
Currency forward contracts
|
$ | 1.6 | $ | 1.6 | $ | - | $ | - | ||||||||
|
December 31, 2010
|
||||||||||||||||
|
Currency forward contracts
|
$ | 6.3 | $ | 6.3 | - | - | ||||||||||
|
Marketable equity securities
|
49.7 | 49.7 | - | - | ||||||||||||
Certain of our sales generated by our non-U.S. operations are denominated in U.S. dollars. We periodically use currency forward contracts to manage a very nominal portion of currency exchange rate risk associated with trade receivables denominated in a currency other than the holder's functional currency or similar exchange rate risk associated with future sales. We have not entered into these contracts for trading or speculative purposes in the past, nor do we currently anticipate entering into such contracts for trading or speculative purposes in the future. Derivatives used to hedge forecasted transactions and specific cash flows associated with financial assets and liabilities denominated in currencies other than the U.S. dollar and which meet the criteria for hedge accounting are designated as cash flow hedges. Consequently, the effective portion of gains and losses is deferred as a component of accumulated other comprehensive income and is recognized in earnings at the time the hedged item affects earnings. Contracts that do not meet the criteria for hedge accounting are marked-to-market at each balance sheet date with any resulting gain or loss recognized in income currently as part of net currency transactions. The fair value of the currency forward contracts is determined using Level 1 inputs based on the currency spot forward rates quoted by banks or currency dealers.
F - 39
At December 31, 2010, we had currency forward contracts to exchange:
|
·
|
an aggregate of $66.0 million for an equivalent value of Canadian dollars at exchange rates ranging from Cdn. $1.05 to Cdn. $1.08 per U.S. dollar. These contracts with Wachovia Bank, National Association, mature from January 2011 through December 2011 at a rate of $5.5 million per month, subject to early redemption provisions at our option.
|
|
·
|
an aggregate $20.1 million for an equivalent value of Norwegian kroner at exchange rates ranging from kroner 5.94 to kroner 6.60 per U.S. dollar. These contracts with DnB Nor Bank ASA mature from January 2011 through July 2011 at a rate of $2.3 million to $5.5 million per month.
|
|
·
|
an aggregate euro 17.8 million for an equivalent value of Norwegian kroner at exchange rates ranging from kroner 8.16 to kroner 8.28 per euro. These contracts with DnB Nor Bank ASA mature from January 2011 through August 2011 at a rate of euro 1.8 million to euro 2.5 million per month, subject to early redemption provisions at our option.
|
The estimated fair value of our currency forward contracts at December 31, 2010 was a $6.3 million net asset, which is included in our Consolidated Balance Sheet as $6.3 million recognized as part of Accounts and other receivables. There is also a corresponding $6.3 million currency transaction gain in our Consolidated Statement of Operations. We are not currently using hedge accounting for our outstanding currency forward contracts at December 2010, and we did not use hedge accounting for any of such contracts we previously held earlier in 2010 and during 2009.
The following table presents the financial instruments that are not carried at fair value but which require fair value disclosure as of December 31, 2009 and 2010.
|
December 31, 2009
|
December 31, 2010
|
|||||||||||||||
|
Carrying
Amount
|
Fair
Value
|
Carrying
Amount
|
Fair
Value
|
|||||||||||||
|
(In millions)
|
||||||||||||||||
|
Cash, cash equivalents and restricted cash
|
$ | 32.8 | $ | 32.8 | $ | 306.6 | $ | 306.6 | ||||||||
|
Notes payable and long-term debt:
|
||||||||||||||||
|
Fixed rate with market quotes -
|
||||||||||||||||
|
6.5% Senior Secured Notes
|
$ | 574.6 | $ | 466.2 | $ | 532.8 | $ | 536.0 | ||||||||
|
U.S. Bank credit facility
|
16.7 | 16.7 | - | - | ||||||||||||
|
European credit facility
|
13.0 | 13.0 | - | - | ||||||||||||
|
Common stockholders’ equity
|
312.5 | 795.8 | 761.2 | 2,462.2 | ||||||||||||
At December 31, 2009 and 2010, the estimated market price of the 6.5% Notes was approximately euro 809 and euro 1,004 per euro 1,000 principal amount, respectively. Fair value of our restricted marketable debt securities and the fair value of our common stockholders’ equity are based upon quoted market prices at each balance sheet date, which represent Level 1 inputs. The fair value of our 6.5% Notes are also based on quoted market prices at each balance sheet date; however, these quoted market prices represent Level 2 inputs because the markets in which the Notes trade are not active. The fair values of variable interest rate debt are deemed to approximate book value. Due to their near-term maturities, the carrying amounts of accounts receivable and accounts payable are considered equivalent to fair value. See Notes 1 and 6.
F - 40
Note 17 - Quarterly results of operations (unaudited):
|
Quarter ended
|
||||||||||||||||
|
_March 31_
|
_June 30_
|
September 30
|
December 31
|
|||||||||||||
|
(In millions, except per share data)
|
||||||||||||||||
|
Year ended December 31, 2009
|
||||||||||||||||
|
Net sales
|
$ | 248.0 | $ | 282.0 | $ | 310.1 | $ | 301.9 | ||||||||
|
Gross margin
|
4.1 | 14.1 | 59.5 | 52.6 | ||||||||||||
|
Net income (loss)
|
(26.6 | ) | (21.8 | ) | 8.6 | 5.1 | ||||||||||
|
Basic and diluted earnings (loss) per common share
|
$ | (.54 | ) | $ | (.45 | ) | $ | .17 | $ | .11 | ||||||
|
Year ended December 31, 2010
|
||||||||||||||||
|
Net sales
|
$ | 319.7 | $ | 380.1 | $ | 376.6 | $ | 373.3 | ||||||||
|
Gross margin
|
60.5 | 85.2 | 96.2 | 103.4 | ||||||||||||
|
Net income
|
42.8 | 19.3 | 32.1 | 36.4 | ||||||||||||
|
Basic and diluted earnings per common share
|
$ | .87 | $ | .39 | $ | .66 | $ | .66 | ||||||||
In the fourth quarter of 2009 we recognized a non-cash $4.7 million income tax benefit related to a net decrease in our reserve for uncertain tax positions. See Note 10. Also in the fourth quarter of 2009, we recognized a $.9 million adjustment ($.6 million, net of income taxes) in connection with the correction of our employee benefit expense previously recognized for 2007, 2008 and the first three quarters of 2009. See Note 11.
In the first quarter of 2010 we recognized a non-cash $35.2 million income tax benefit related an increase in our German net operating loss carryforwards. See Note 10.
In the fourth quarter of 2010 we completed a secondary public offering of 8.97 million shares of our common stock which dilutes our earnings per share for the fourth quarter. See Note 13.
The sum of the quarterly per share amounts may not equal the annual per share amounts due to relative changes in the weighted average number of shares used in the per share computations.
F - 41
KRONOS WORLDWIDE, INC. AND SUBSIDIARIES
SCHEDULE I - CONDENSED FINANCIAL INFORMATION OF REGISTRANT
Condensed Balance Sheets
(In millions)
|
December 31,
|
||||||||
|
2009
|
2010
|
|||||||
|
Current assets:
|
||||||||
|
Cash and equivalents
|
$ | - | $ | 209.9 | ||||
|
Receivables from subsidiary
|
28.8 | 51.9 | ||||||
|
Prepaid expenses
|
.3 | .3 | ||||||
|
Total current assets
|
29.1 | 262.1 | ||||||
|
Other assets:
|
||||||||
|
Investment in subsidiaries
|
612.1 | 733.5 | ||||||
|
Note receivable from Valhi
|
- | 61.9 | ||||||
|
Marketable equity securities
|
- | 49.7 | ||||||
|
Other
|
.4 | 1.1 | ||||||
|
Total other assets
|
612.5 | 846.2 | ||||||
|
Total assets
|
$ | 641.6 | $ | 1,108.3 | ||||
|
Current liabilities:
|
||||||||
|
Accounts payable and accrued liabilities
|
$ | .1 | $ | 4.0 | ||||
|
Payable to affiliate and subsidiary
|
63.9 | 76.9 | ||||||
|
Total current liabilities
|
64.0 | 80.9 | ||||||
|
Noncurrent liabilities:
|
||||||||
|
Notes payable to KII
|
235.1 | 217.7 | ||||||
|
Interest payable to KII
|
27.2 | 45.4 | ||||||
|
Deferred income taxes
|
2.8 | 3.1 | ||||||
|
Total noncurrent liabilities
|
265.1 | 266.2 | ||||||
|
Stockholders’ equity
|
312.5 | 761.2 | ||||||
|
Total liabilities and stockholders’ equity
|
$ | 641.6 | $ | 1,108.3 | ||||
The accompanying Notes are an integral part of the financial statements.
S - 1
KRONOS WORLDWIDE, INC. AND SUBSIDIARIES
SCHEDULE I - CONDENSED FINANCIAL INFORMATION OF REGISTRANT (Continued)
Condensed Statements of Operations
(In millions)
|
Years ended December 31,
|
||||||||||||
|
2008
|
2009
|
2010
|
||||||||||
|
Revenues and other income:
|
||||||||||||
|
Equity in earnings (loss) of subsidiaries
|
$ | 25.1 | $ | (18.2 | ) | $ | 145.4 | |||||
|
Interest income from affiliates
|
- | - | .6 | |||||||||
|
Total revenues and other income
|
25.1 | (18.2 | ) | $ | 146.0 | |||||||
|
Costs and expenses:
|
||||||||||||
|
General and administrative
|
2.8 | 3.4 | 3.0 | |||||||||
|
Intercompany interest and other
|
22.3 | 21.3 | 20.1 | |||||||||
|
Total costs and expenses
|
25.1 | 24.7 | 23.1 | |||||||||
|
Income (loss) before income taxes
|
- | (42.9 | ) | 122.9 | ||||||||
|
Income tax benefit
|
9.0 | 8.2 | 7.7 | |||||||||
|
Net income (loss)
|
$ | 9.0 | $ | (34.7 | ) | $ | 130.6 | |||||
The accompanying Notes are an integral part of the financial statements.
S - 2
KRONOS WORLDWIDE, INC. AND SUBSIDIARIES
SCHEDULE I - CONDENSED FINANCIAL INFORMATION OF REGISTRANT (Continued)
Condensed Statements of Cash Flows
(In millions)
|
Years ended December 31,
|
||||||||||||
|
2008
|
2009
|
2010
|
||||||||||
|
Cash flows from operating activities:
|
||||||||||||
|
Net income (loss)
|
$ | 9.0 | $ | (34.7 | ) | $ | 130.6 | |||||
|
Cash distributions from subsidiaries
|
35.1 | - | - | |||||||||
|
Depreciation and amortization
|
- | .1 | .3 | |||||||||
|
Deferred income taxes
|
(.3 | ) | (.1 | ) | .1 | |||||||
|
Equity in earnings of subsidiaries
|
(25.1 | ) | 18.2 | (145.4 | ) | |||||||
|
Other, net
|
.1 | .6 | .1 | |||||||||
|
Net change in assets and liabilities
|
11.4 | 35.3 | 10.0 | |||||||||
|
Net cash provided by (used in) operating activities
|
30.2 | 19.4 | (4.3 | ) | ||||||||
|
Cash flows from investing activities:
|
||||||||||||
|
Loan to Valhi:
|
||||||||||||
|
Loans
|
- | - | (114.8 | ) | ||||||||
|
Collections
|
- | - | 52.9 | |||||||||
|
Purchase of:
|
||||||||||||
|
Timet common stock
|
- | - | (43.5 | ) | ||||||||
|
Valhi common stock
|
- | - | (2.5 | ) | ||||||||
|
Other
|
- | - | (.1 | ) | ||||||||
|
Other, net
|
(.4 | ) | (.2 | ) | (.9 | ) | ||||||
|
Net cash used in investing activities
|
(.4 | ) | (.2 | ) | (108.9 | ) | ||||||
|
Cash flows from financing activities:
|
||||||||||||
|
Issuance of common stock
|
- | - | 337.6 | |||||||||
|
Loan from NL Industries, Inc.
|
19.2 | (19.2 | ) | - | ||||||||
|
Dividends paid
|
(49.0 | ) | - | (14.5 | ) | |||||||
|
Net cash provided by (used in) financing activities:
|
(29.8 | ) | (19.2 | ) | 323.1 | |||||||
|
Net change during the year from operating, investing and financing activities
|
- | - | 209.9 | |||||||||
|
Balance at beginning of year
|
- | - | - | |||||||||
|
Balance at end of year
|
$ | - | $ | - | $ | 209.9 | ||||||
The accompanying Notes are an integral part of the financial statements.
S - 3
KRONOS WORLDWIDE, INC. AND SUBSIDIARIES
SCHEDULE I - CONDENSED FINANCIAL INFORMATION OF REGISTRANT (Continued)
Notes to Condensed Financial Information
Note 1 - Basis of presentation:
The accompanying financial statements of Kronos Worldwide, Inc. reflect our investment in majority-owned subsidiaries on the equity method. The Consolidated Financial Statements of Kronos and its majority-owned subsidiaries (the “Company”) and the related Notes to Consolidated Financial Statements are incorporated herein by reference.
Note 2 - Receivable from (payable to) subsidiaries and affiliates:
|
December 31,
|
||||||||
|
2009
|
2010
|
|||||||
|
(In millions)
|
||||||||
|
Current:
|
||||||||
|
Receivable from:
|
||||||||
|
Kronos Louisiana, Inc. (“KLA”)
|
$ | 27.1 | $ | 44.4 | ||||
|
KLA – income taxes
|
1.7 | 7.5 | ||||||
|
Total
|
$ | 28.8 | $ | 51.9 | ||||
|
Payable to:
|
||||||||
|
Kronos (US), Inc.
|
$ | 63.5 | $ | 74.8 | ||||
|
Valhi – income taxes
|
.4 | 2.1 | ||||||
|
Total
|
$ | 63.9 | $ | 76.9 | ||||
|
Noncurrent:
|
||||||||
|
Note receivable from Valhi
|
$ | - | $ | 61.9 | ||||
|
Note payable to KII
|
$ | 262.3 | $ | 263.1 | ||||
Prior to 2008, KII loaned us an aggregate euro 163.1 million ($209.5 million at the borrowing date) instead of paying us cash dividends. The original notes provided for a December 31, 2010 maturity date and required interest to be paid quarterly at an annual rate of 9.25%. Effective October 1, 2008, the terms of these notes were modified to remove the requirements for quarterly interest payments and to extend the maturity date to December 31, 2013, and at December 31, 2009 and 2010 we had an aggregate of $27.2 million and $45.4 million, respectively, of accrued and unpaid interest on these loans. The notes are unsecured, contain no financial covenants and provide for default only upon our failure to pay any amount when due (subject to a short grace period). Due to the long-term investment nature of these notes, settlement of the principal and accrued interest balance of the notes is not contemplated within the foreseeable future. We currently expect that settlement of the principal and interest amount of the notes will occur through a capital transaction. We recognize interest expense on such notes as incurred. Until such time as the notes are settled, we will recognize interest expense on the promissory notes.
S - 4
Note 3 – Investment in subsidiaries:
|
December 31,
|
||||||||
|
2009
|
2010
|
|||||||
|
(In millions)
|
||||||||
|
Investment in:
|
||||||||
|
KLA
|
$ | 173.6 | $ | 214.3 | ||||
|
KC
|
73.6 | 76.9 | ||||||
|
KII
|
364.9 | 442.3 | ||||||
|
Total
|
$ | 612.1 | $ | 733.5 | ||||
|
2008
|
2009
|
2010
|
||||||||||
|
(In millions)
|
||||||||||||
|
Equity in earnings (loss) from continuing operations of subsidiaries:
|
||||||||||||
|
KLA
|
$ | 12.8 | $ | 14.4 | $ | 39.8 | ||||||
|
KC
|
(11.7 | ) | (.5 | ) | 5.8 | |||||||
|
KII
|
24.0 | (32.1 | ) | 99.8 | ||||||||
|
Total
|
$ | 25.1 | $ | (18.2 | ) | $ | 145.4 | |||||
S - 5