Attached files
Table of Contents
UNITED STATES
SECURITIES AND EXCHANGE COMMISSION
WASHINGTON, D.C. 20549
FORM 10-K
| x | ANNUAL REPORT PURSUANT TO SECTION 13 OR 15(d) OF THE SECURITIES EXCHANGE ACT OF 1934 |
For the Fiscal Year Ended December 31, 2010
OR
| ¨ | TRANSITION REPORT PURSUANT TO SECTION 13 OR 15(d) OF THE SECURITIES EXCHANGE ACT OF 1934 |
For the Transition Period from to
Commission File Number: 0-29375

SAVVIS, Inc.
(Exact Name of Registrant as Specified in its Charter)
| Delaware | 43-1809960 | |
| (State or Other Jurisdiction of Incorporation or Organization) |
(I.R.S. Employer Identification No.) |
1 SAVVIS Parkway
Town & Country, Missouri 63017
(Address of Principal Executive Offices) (Zip Code)
(314) 628-7000
(Registrant’s Telephone Number, Including Area Code)
Securities registered pursuant to Section 12(b) of the Act:
| Title of each class |
Name of each exchange on which registered | |
| Common stock, par value $0.01 per share | NASDAQ Stock Market LLC |
Securities registered pursuant to Section 12(g) of the Act: None
Indicate by check mark if the registrant is a well-known seasoned issuer, as defined in Rule 405 of the Securities Act. Yes x No ¨
Indicate by check mark if the registrant is not required to file reports pursuant to Section 13 or 15(d) of the Act. Yes ¨ No x
Indicate by check mark whether the registrant (1) has filed all reports required to be filed by Section 13 or 15(d) of the Securities Exchange Act of 1934 during the preceding 12 months (or for such shorter period that the registrant was required to file such reports), and (2) has been subject to such filing requirements for the past 90 days. Yes x No ¨
Indicate by check mark whether the registrant has submitted electronically and posted on its corporate Web site, if any, every Interactive Data File required to be submitted and posted pursuant to Rule 405 of Regulation S-T (§ 232.405 of this chapter) during the preceding 12 months (or for such shorter period that the registrant was required to submit and post such files). Yes ¨ No ¨
Indicate by check mark if disclosure of delinquent filers pursuant to Item 405 of Regulation S-K (§229.405 of this chapter) is not contained herein, and will not be contained, to the best of registrant’s knowledge, in definitive proxy or information statements incorporated by reference in Part III of this Form 10-K or any amendment to this Form 10-K. ¨
Indicate by check mark whether the registrant is a large accelerated filer, an accelerated filer, a non-accelerated filer, or a smaller reporting company. See the definitions of “large accelerated filer,” “accelerated filer” and “smaller reporting company” in Rule 12b-2 of the Exchange Act.
| Large accelerated filer | ¨ | Accelerated Filer | x | |||
| Non-accelerated filer | ¨ (Do not check if a smaller reporting company) | Smaller reporting Company | ¨ | |||
Indicate by check mark whether the registrant is a shell company (as defined in Rule 12b-2 of the Exchange Act). Yes ¨ No x
The aggregate market value of the voting and non-voting common equity held by non-affiliates of the registrant computed by reference to the price at which the common equity was last sold as of June 30, 2010 was approximately $586,285,449.
The number of shares of the registrant’s common stock outstanding as of February 23, 2011 was 56,953,981.
DOCUMENTS INCORPORATED BY REFERENCE
List hereunder the following documents incorporated by reference and the Part of the Form 10-K into which the document is incorporated:
Portions of the definitive proxy statement for the 2011 Annual Meeting of Stockholders to be held on May 12, 2011, to be filed within 120 days after the end of the registrant’s fiscal year, are incorporated by reference into Part III of this Form 10-K.
Table of Contents
REPORT ON FORM 10-K
TABLE OF CONTENTS
2
Table of Contents
Unless the context requires otherwise, references to ‘we,’ ‘us,’ ‘our,’ the ‘Company,’ and ‘SAVVIS’ refer to Savvis, Inc. and its subsidiaries. Certain statements in this report and in other materials filed with the Securities and Exchange Commission, or SEC, as well as information included in oral statements or other written statements made by the Company, are forward-looking statements. The Company intends for all such forward-looking statements to be covered by the safe harbor provisions for forward-looking statements within the meaning of the Private Securities Litigation Reform Act of 1995 and the provisions of Section 27A of the Securities Act of 1933 and Section 21E of the Securities Exchange Act of 1934. These forward-looking statements within the meaning of the Private Securities Litigation Reform Act of 1995 may contain, among others, statements regarding:
| • | projections and estimates of earnings, revenues, cost-savings, expenses, capital expenditures, taxes or other financial items; |
| • | expectations as to results of operations and operational initiatives; |
| • | expectations as to the effect of claims, lawsuits, commitments, contingent liabilities or agreements on the Company’s financial condition, results of operations or liquidity; |
| • | management’s plans, strategies and objectives for future operations, capital expenditures, proposed new services and other similar expressions concerning matters that are not historical facts, and management’s expectations as to future performance and operations and the time by which objectives will be achieved; and |
| • | future economic, industry or market conditions or performance and their effect on the Company’s financial condition, results of operations or liquidity. |
Forward-looking statements are typically identified by words or phrases such as ‘believe,’ ‘expect,’ ‘anticipate,’ ‘project,’ ‘estimate,’ ‘preliminary’ and similar expressions. The Company cautions against placing undue reliance on forward-looking statements, which reflect its good faith beliefs with respect to future events and are based on information currently available to it as of the date the forward-looking statement is made. Forward-looking statements should not be read as a guarantee of future performance or results and will not necessarily be accurate indications of the timing when, or by which, such performance or results will be achieved. Forward-looking statements are subject to a number of risks and uncertainties and actual performance or results could differ materially from those anticipated by any forward-looking statements. The Company undertakes no obligation to update or revise any forward-looking statement. If the Company does update any forward-looking statement, no inference should be drawn that the Company will make additional updates with respect to that statement or any other forward-looking statements. The following important factors, in addition to those discussed or referenced in Part I, Item 1A. Risk Factors and elsewhere in this Annual Report on Form 10-K, may cause actual results to differ materially from those contemplated by any forward-looking statements:
| • | uncertainties in economic conditions, including conditions that could pressure enterprise information technology spending; |
| • | introduction of, demand for and market acceptance of Savvis’ products and services; |
| • | whether or not Savvis is able to sign additional outsourcing deals; |
| • | variability in pricing for those products and services; |
| • | merger and acquisition activity by Savvis clients or other client activity that affects the level of business done with Savvis; |
| • | increasing competition, including that from consolidation in the industry; |
| • | rapid or unexpected evolution of technology; |
| • | changes in the operating environment; and |
| • | changes or proposed changes in, or introduction of new, regulatory schemes or environments that impact Savvis and/or its clients’ businesses. |
The forward-looking statements contained in this document speak only as of the date of publication, March 4, 2011. Subsequent events and developments may cause the Company’s forward-looking statements to change, and the Company will not undertake efforts to revise those forward-looking statements to reflect events after this date.
Other important assumptions and factors that could cause actual results to differ materially from those in the forward-looking statements are specified elsewhere in this report and in the Company’s other SEC reports, accessible on the SEC’s website at www.sec.gov and the Company’s website at www.savvis.net. Except as specified herein, the information on the Company’s website is not part of this Annual Report on Form 10-K.
3
Table of Contents
PART I
Overview
We provide information technology, or IT, services including cloud services, managed hosting, managed security, colocation, professional services and network services through our global infrastructure to businesses and government agencies around the world. Our services are designed to offer a flexible and comprehensive IT solution that meets the specific IT infrastructure and business needs of our clients. Our suite of products can be purchased individually, in various combinations, or as part of a total or partial outsourcing arrangement. Our colocation solutions meet the specific needs of clients who require control of their physical assets, while our managed hosting solution offerings provide clients with access to our services and infrastructure without the upfront capital costs associated with equipment acquisition. By partnering with us, our clients may drive down the costs of acquiring and managing IT infrastructure and achieve increased operational efficiency by taking advantage of our global monitoring, application performance support and other operational support systems and tools, which allow our clients to focus their resources on their core business while we focus on the delivery and performance of their IT infrastructure services.
We were incorporated in Delaware in 1998 and began providing high speed Internet service to enterprise clients and Internet service providers. In 2004, we acquired substantially all of the assets of Cable and Wireless USA, Inc. and Cable & Wireless Internet Services, Inc. together with the assets of certain of their affiliates, or CWA. With the acquisition of CWA, we acquired hosting assets in 15 data centers, an Internet Protocol network, a global Content Delivery Network, or CDN, and consulting expertise that enabled us to expand the scope of services we offer and the scale of our operations. In January 2007, we completed the sale of the assets related to our non-strategic CDN services, and in June 2007, we sold the assets and assigned the lease for two data centers in Santa Clara, California to Microsoft Corporation. We used the proceeds from these sales to develop or expand data centers in the United States, the United Kingdom and Singapore. In June 2010, we acquired Fusepoint, Inc., an independent provider of outsourced managed IT and infrastructure services to mid-market and larger enterprises in Canada, obtaining hosting assets in three data centers, which are located in Toronto, Vancouver and Montreal.
Our principal executive offices are located at 1 SAVVIS Parkway, Town & Country, Missouri 63017 and our telephone number is (314) 628-7000.
Our Services
We present our revenue in two categories of services: (1) hosting services and (2) network services.
Hosting Services provide the core facilities, computing, including cloud services, data storage, security and other infrastructure on which to run business applications. We manage 32 data centers located in the North America, Europe and Asia with approximately 1.54 million square feet of gross raised floor space; however, we provide managed services from 39 locations. Our hosting services are comprised of colocation and managed hosting and allow our clients to choose which parts of their IT infrastructure they own and operate versus those that we own and operate for them. Clients can scale their use of our services as their own requirements change and as clients learn the benefits of outsourcing IT infrastructure management.
| • | Colocation is designed for clients seeking data center space and power for their server and networking equipment needs. Our data centers provide our clients around the world with a secure, high-powered, purpose-built location for their IT equipment. |
| • | Managed Hosting Services provide a fully managed solution for a client’s IT infrastructure and network needs. In providing our managed hosting services, we deploy industry leading hardware and software platforms that are installed in our data centers to deliver the physical or virtualized services necessary for operating our clients’ applications. Managed hosting services include: |
| • | Cloud Services enable significant new levels of scalability, flexibility and cost efficiency for businesses. Cloud is a style of computing that aligns business needs with IT capacity to drive more efficient and effective use of a client’s infrastructure resources. The value of virtualized infrastructure, fully automated provisioning processes, security assurances in complex environments and flexible business terms can result in lower infrastructure and maintenance costs, preservation of capital, elasticity to respond to changing business needs and unanticipated load changes, acceleration of new application platforms, better end-user experience and reduction of carbon footprint through consolidation and lower energy consumption. |
4
Table of Contents
| • | Consulting Services are provided through our skilled personnel who assist our clients in getting maximum value from our service offerings. We offer assistance and consultation in security for network and hosting environments, virtualization, web-based applications, business recovery, software as a service, program management, infrastructure and migration. Our consulting services organization assists our clients with ongoing operational support, as well as assessing, designing, developing, implementing and managing outsourcing solutions. |
| • | Dedicated Hosting provides clients with managed hosting services on hardware and software that is isolated to a single client. Clients requiring dedicated infrastructure usually have either stringent internal requirements for application performance, security or data integrity, or they are attempting to become compliant with external industry or governing regulations. In a dedicated hosting scenario, clients are provided discrete hardware components. |
| • | Utility Computing and Storage provides clients with an available, secure applications platform that delivers scalability of an entire range of IT infrastructure at lower total cost than found with traditional service provider models. We achieve this combination of lower cost and better service through the use of virtualization technology. Through our managed network, we provide connectivity between the client and the utility computing platform housed in our data centers. With our utility computing and storage solution, our clients pay only for the services they currently need, while maintaining the ability to scale up or down the services to meet their changing business needs. |
| • | Managed Security Services provide global around-the-clock monitoring and management of security appliances, software and network-based controls, and incident response, for our managed hosting and network services clients. We utilize our advanced network tools to detect and filter malicious traffic before it reaches our clients’ infrastructures, in addition to providing virtualized security services using industry-standard virtualization technology in our data centers to reduce the need for our clients to pay for dedicated security equipment. |
Network Services are comprised of our managed network services, including managed VPN, hosting area network, or HAN, and bandwidth services.
| • | Managed VPN service is a fully managed, end-to-end solution that includes hardware, management systems and operations to transport an enterprise’s voice, video and data applications at corresponding quality-of-service levels, whether those applications are housed at our client’s site or in our data centers. Clients that purchase this service are generally geographically dispersed enterprises seeking to transmit latency-sensitive data more cost effectively in a secure environment among their multiple locations around the world. |
| • | Hosting Area Network is a dedicated network that provides secure, high speed Internet connectivity for hosting and cloud clients located in our data centers, along with value-added services such as load balancing and network-based firewalls. |
| • | Bandwidth Services are provided to enterprises and wholesale carrier clients. We offer Tier 1 Internet services in North America, Europe and Asia that are managed, unmanaged or integrated with our VPN. In addition, we offer carrier diversity by enabling connectivity either to Internet providers built into our data centers or to providers in carrier hotels that are connected to our data centers by our metro Ethernet rings. |
Our Segments
We manage our business based on two reportable service-based segments: hosting and network. Hosting services consist of colocation and managed hosting services and provide the core facilities, computing, data storage and network infrastructure on which to run business applications. Network services are comprised of managed network services, hosting area network, application transport and bandwidth services. Management evaluates the performance of the two segments primarily based on revenue and adjusted EBITDA. Financial information regarding each of our reportable segments is included in Item 7 - Management’s Discussion and Analysis of Financial Condition and Results of Operations, and in Note 20 of Notes to Consolidated Financial Statements.
5
Table of Contents
Industry Trends
The IT capabilities for many businesses have often been viewed as competitive advantages in the past; however, many businesses now recognize that while their IT infrastructure is important, it no longer provides a strategic or financial advantage. As a result, the IT strategy for many businesses has been increasingly focused on efforts to reduce costs, improve responsiveness to a changing business environment and focus internal resources on projects that deliver competitive advantages. As the core functions of IT, such as data storage, processing and transport, have become commonplace throughout all industries, these functions have become routine and increasingly thought of as simply costs of doing business. Many businesses are also recognizing the high cost and inefficiency of managing IT infrastructure themselves, including the difficulties of upgrading technology, training and retaining skilled personnel with domain expertise, and matching IT costs with actual benefits. Given these continuing trends in IT strategy, budget constraints and inefficient use of resources, businesses often look to outsource significant parts of their IT functions to trusted partners so they can focus on the areas that still provide competitive advantages, such as client or industry-specific applications.
Most businesses today will consider outsourcing when reviewing their IT strategies; however, traditional outsourcing approaches, such as colocation, do not often provide meaningful strategic, operational or financial benefits as many outsourcers simply operate a client’s infrastructure without fundamentally changing or updating the underlying technology or the way the infrastructure is managed or, in cases where holistic outsourcing agreements are in place, businesses lose control of differentiating IT applications. For example, an outsourcer may run the client’s current IT systems more efficiently but because they use legacy technology, the client will likely not achieve the benefits of an operating infrastructure utilizing the latest technology hardware, software and IT research and development.
We believe that businesses are moving away from long term, locked-in, full scale IT outsourcing, due to newer types of services available that allow clients greater economies and increased mid-term flexibility. As a result, we focus on developing and delivering services that allow clients more flexibility. We provide a broad range of infrastructure and consultative services that enable clients to improve the quality and lower the cost of their IT operations and increase the availability and flexibility of their IT systems. In addition, our solution may allow our clients to have visibility and control of their application performance while shifting our clients from a corporate model based on large capital investments for buying, maintaining and depreciating IT assets to a pay-as-you-go service model that allows clients to scale their IT infrastructure up or down as their business requirements change. Our approach enables us to be a flexible and scalable partner to our clients that can provide tailored, end-to-end IT infrastructure solutions on demand.
Our Strategy
We focus on providing complex, highly secure, highly available, high performance services to business enterprises, providing value through technology solutions and proactive service that enables these enterprises to gain a competitive advantage through their IT infrastructure. Because of our global infrastructure, management systems and business model, we have the unique capability to deliver fully managed and integrated IT solutions to enterprises with offices around the world. Our key growth strategies include the following:
| • | Target the right clients. We specifically target clients that we believe will receive the most economic value from using our services. Many mid-sized businesses have traditionally outsourced single IT service offerings, such as network services or hosting services, and have continued to own and manage portions of their IT infrastructure themselves. We believe that these businesses can lower the overall cost of their IT operations while improving the quality of their IT systems by purchasing our managed services and outsourcing the majority of their IT services rather than a single IT service. Additionally, we target large enterprises that wish to outsource specific components of their IT infrastructure or applications. In particular we focus on such clients in the financial services industry. We believe that pursuing these clients will allow us to increase revenues and profitability as these clients purchase our higher margin services while at the same time reducing their overall IT costs. |
| • | Offer targeted business solutions to solve specific clients’ needs. We develop, market and deliver solutions designed to satisfy the needs of our targeted clients. These end-to-end solutions are comprised primarily of our technical capabilities and our consulting services, which may encompass third party services. Examples of our solutions include proximity hosting for the financial industry, software as a service enablement services for the independent software vendor and software provider industry, and test and development solutions for companies looking to outsource their software testing and development infrastructure. Our client focused solutions allow us to offer more compelling value propositions to targeted client segments. |
| • | Deliver compelling and comprehensive technical capabilities. Our broad, integrated, comprehensive offering of IT services allows us to act as a full service provider to our clients. We offer a full range of solutions, including hosting, cloud, computing, storage, applications, network and security services. Our full service orientation creates incremental revenue growth as clients seek to minimize the number of outside vendors and demand “one-stop” service providers. Additionally, we can meet clients’ increasing IT demands through scalable solutions. |
6
Table of Contents
| • | Leverage our data centers and global network and take advantage of expansion opportunities. We currently operate 32 data centers around the world, and offer our services at an additional 7 leased locations, which we expect will provide us with significant operating leverage as we increase the amount of our revenue that is derived from managed services. By acquiring new managed services clients and migrating our existing clients that purchase only colocation or network services to purchasing our higher value managed services, we expect to be able to increase the revenues we derive from these data centers. In 2009, we began the expansion of our hosting facility located in Weehawken, New Jersey, which will add approximately 105,000 square feet of gross raised floor space over 5 years, approximately 35,000 of which has been completed to date; in 2010 we expanded data centers in Chicago, Illinois, Washington, D.C., and London. In 2011, we intend to continue expansions in targeted markets to enable further revenue growth, in addition to leveraging our agreements with Thomson Reuters and Bharti Airtel to offer our services in their existing data centers. |
Our Infrastructure
We provide our services through our global infrastructure that includes:
| • | 32 Data Centers in North America, Europe and Asia with approximately 1.54 million square feet of gross raised floor space, with managed services offered at an additional 7 leased locations; |
| • | Tier 1 OC-192 Internet Backbone with over 17,000 miles of fiber under IRU agreements; and |
| • | Operations Support System, or OSS, which provides automated provisioning, end-to-end management, and integration with commercial element management systems. |
We utilize virtualization and automation technologies to leverage our global infrastructure, which allows us to offer our services as part of a total outsourcing solution or on a utility, or as-needed, basis. By applying virtualization technology to our servers, storage, security and network devices, we are able to offer clients connected to our network access to a suite of services, without the client having to purchase, install and configure equipment and network services, and with the ability to easily scale the infrastructure to meet evolving client requirements.
For information regarding our revenue and long-lived assets by geographic region, please refer to Note 20 of Notes to Consolidated Financial Statements included in this Annual Report on Form 10-K.
Clients
We currently provide services to clients across all industries including the financial services, media and entertainment, software and government sectors. No single client accounted for more than 10% of our revenue during 2010; however, 27% of our revenue for 2010 was generated by clients in the financial services industry and 8% of that by our largest client, Thomson Reuters. Clients in the government sector did not account for a material percentage of our total revenue during 2010.
Our contracts with our clients are typically for one to three years in length. Many of our client contracts contain service level agreements that provide for service credits if we fail to maintain defined and specific quality levels of service.
Sales and Marketing
We reach potential new clients and sell new services to our existing clients through our direct sales force, indirect sales channels and marketing programs.
Direct Sales and Consultation. We have approximately 122 sales representatives that work directly with potential new and existing clients. Our direct sales force uses a ‘solution selling’ approach to understand a client’s IT infrastructure requirements. Since we tend to serve more complex environments and clients, we frequently employ consultative methods in order to win clients. An example is our ‘Savvis Transformation Workshop,’ where we work with potential clients to understand their current environment and issues, then design and propose solutions to these issues. By seeking detail on their applications and long term IT goals, combined with our years of experience, we are able to provide thought leadership and display high levels of competence and dependability to our potential clients. All direct sales representatives take part in an extensive training program designed to develop in-depth consultative selling skills.
Indirect Sales. We market our products and solutions through various indirect channels, including collaborations with existing clients and technology providers, telecommunications companies and system integrators. By working with these companies, we have opened new avenues for growth and see potential for significant opportunities to further enhance revenue growth through these types of relationships, as we have with our largest client, Thomson Reuters. The Thomson Reuters sales force is processing orders for our solutions in ten data centers, and we have their Elektron Hosting solution available in six of our own data centers, in addition to five other global data centers locations in which we have rented existing space to manage this solution. We have also recently entered into a marketing agreement with Bharti Airtel, in which we will provide our managed services from Bharti Airtel’s data centers located in India. We use these partnerships to expand our existing presence in countries in which we currently do business, as well as a way to expand into new markets.
7
Table of Contents
Marketing. We are a business-to-business company whose marketing programs are targeted at information technology executives, as well as line of business and finance executives. We use marketing campaigns to increase brand awareness, generate leads, accelerate the sales process, retain existing clients and promote new products to existing and prospective clients. We participate in industry conferences and trade shows. We use direct mail, e-newsletters, surveys, Internet marketing, on-line and on-site seminars, collateral materials and welcome kits to communicate with existing clients and to reach potential new clients. Our employees author and publish articles about industry trends and our services. Additionally, we work closely with industry analysts and the press so that they understand and can communicate the value of our services.
Competition
Prospective clients for our infrastructure solutions often weigh the advantages of outsourcing to a service provider against their ability to manage IT infrastructure internally. In those instances, the in-house solution is a source of competition. By offering a complete range of services that can be scaled up or down as needed and utilizing the latest technology hardware, software and IT research and development, we compete by providing meaningful strategic, operational or financial benefits that enable clients to improve the quality and lower the cost of their IT operations.
Our external competitors range from very large telecommunications companies, hardware manufacturers and system integrators that support the in-house IT operations for a business or offer outsourcing solutions, to smaller point solutions companies that sell individual IT services or solutions to selected industries.
Telecommunications companies such as AT&T Inc., Verizon Communications Inc., BT and Level 3 Communications have used their legacy voice and data business to expand into hosting and network services. System integrators like IBM, HP/EDS, Accenture and CSC focus on long-term systems integration projects and outsourcing contracts that include hiring a large portion of the clients’ staff. Due to the size of these companies, they may be able to offer more inexpensive solutions to clients; however, we feel we are able to successfully compete against these larger companies by offering tailored IT solutions that target specific clients, such as mid-size enterprise businesses, or specific client segments, such as the financial services industry.
Other external competitors focus on one part of IT infrastructure service, such as colocation, managed hosting, cloud or Internet access. This category includes companies such as Equinix, Inc., Rackspace Hosting, Inc., Terremark Worldwide, Inc. and Internap Network Services Corporation. Also, vendors such as Microsoft Corporation, Oracle and Saleforce.com focus on delivering their proprietary software and application offerings as a hosted service, or, in some cases, offer other hosted solutions into the market. Some competitors, including GoGrid and Amazon.com, Inc., focus on delivering cloud computing and software as a service to enterprise clients. We feel we are able to successfully compete with these competitors by offering a broad, integrated, comprehensive offering of IT services, our vendor neutral application strategy and our ability to provide clients a high level of client service in a global, “one-stop” target solution.
For further information on our competitive strategy, please refer to the Our Strategy section of Part I, Item 1. Business included in this Annual Report on Form 10-K.
Regulatory Matters
The following section describes material laws and regulatory developments that we believe are currently applicable to our business. It does not cover all present or pending federal, state, local or foreign regulations affecting the communications industry.
U.S. Regulatory Matters
Most of our existing services are not currently regulated by the Federal Communications Commission, or FCC, or any other government agency of the United States or public utility commissions of the individual states, other than regulations that apply to businesses generally, although our private line service is generally regulated by the FCC as a telecommunications service. As implemented by rules, policies and precedents issued by the FCC, the Telecommunications Act of 1996 regulates the provision of ‘telecommunications services’ and generally exempts ‘information services’ and ‘non-common carrier services’ from its regulation. We believe that many of the products and services we offer, whether on a facilities or resale basis, generally qualify as information services or non-common carrier services and are therefore not subject to federal regulation. However, in light of ongoing FCC proceedings and developing FCC case law, it is possible that some or all of the information services that we provide should or will become subject to certain regulatory requirements.
As a service provider to insured financial institutions, we are subject to the provisions of the Bank Service Company Act, which subjects the service provider to regulation, administrative jurisdiction and examination by the federal banking regulators with respect to the performance of services to insured depository institutions. These provisions have not had a material effect on our operations or expenses. Additionally, future legislation may potentially subject us to expanded regulation with respect to a broader class of clients and with respect to range and severity of regulatory actions to which we are exposed.
8
Table of Contents
International Regulatory Matters
Our principal markets outside the United States include countries in North America, South America, Europe and Asia. As is true in the United States, the market for our services in each of the major economies within these regions is open to foreign competition. We believe that we are authorized to provide our services under the applicable regulations in all countries where we derive substantial business. In certain countries throughout Asia, Latin America, the Middle East and Africa, regulatory and market access barriers, including foreign ownership limitations and entrenched monopolies, may require us to partner with local providers to provide certain services to our client or may prevent us from providing services directly to clients. As our business plan does not contemplate selling a significant amount of services in such countries in the near term, we do not believe that our inability to offer services directly to clients in these countries will impact us significantly.
Intellectual Property
We have a number of United States and international patents protecting aspects of our technology, and we are currently pursuing additional patent applications in the United States and internationally. We have registered trademarks for our business name and several product and service names and marketing slogans. In addition, we have applied for trademark protection for various products, services and marketing slogans. We have also registered various Internet domain names in connection with the SAVVIS public website.
Although we consider our intellectual property rights to be valuable, we do not believe that the expiration of any single patent, service mark or trademark would materially affect our consolidated results of operations.
Employees
As of December 31, 2010, we employed 2,440 full-time persons, of which 1,306 were engaged in engineering, global operations and client service; 235 in product development and product engineering; 598 in sales, sales support, product management and marketing; and 301 in finance and administration. None of our employees are represented by a labor union. We believe our relationship with our employees is good.
Executive Officers of the Company
Set forth below are the names, ages as of March 4, 2011, and current positions of our executive officers.
| Name |
Age | Title | ||
| James E. Ousley |
65 | Chief Executive Officer | ||
| Peter J. Bazil |
38 | Vice President, General Counsel and Secretary | ||
| Bryan S. Doerr |
47 | Chief Technology Officer | ||
| William D. Fathers |
42 | President | ||
| Gregory W. Freiberg |
43 | Senior Vice President, Chief Financial Officer | ||
| Paul S. Hott |
39 | Vice President, Human Resources | ||
| James D. Mori |
55 | Senior Vice President, Americas Sales | ||
| Jeffrey H. Von Deylen |
47 | Senior Vice President, Global Operations and Client Services | ||
Set forth below is a brief description of the principal occupation and business experience of each of our executive officers.
James E. Ousley has served as our Chief Executive Officer since March 2010. From January 2010 to March 2010, he had served as our interim Chief Executive Officer. Mr. Ousley has also served as our Chairman of the Board of Directors since May 2006 and as a director of our company since April 2002. Prior to holding the position of Chief Executive Officer, Mr. Ousley also served as a member of the board’s audit, compensation and business development committees. Mr. Ousley served as the President and Chief Executive Officer and Director of Vytek Corporation from 2001 until April 2004. From 1999 to 2002, Mr. Ousley also served as chairman, Chief Executive Officer and President of Syntegra Inc. (USA), a division of British Telecommunications. From September 1991 to August 1999, Mr. Ousley served as President and Chief Executive Officer of Control Data Systems. Mr. Ousley serves on the board of Datalink, Inc. Mr. Ousley received a B.S. degree from the University of Nebraska.
Peter J. Bazil has served as our Vice President, General Counsel and Secretary since July 2010. From 2007 to July 2010, Mr. Bazil was our Vice President, Associate General Counsel. Mr. Bazil joined our Company in 2003 as an Associate General Counsel and served in that role from 2003 to 2007. Prior to joining our Company, Mr. Bazil had served as Associate General Counsel for WAM!Net, Inc. since 2000. Mr. Bazil received his B.A. in Economics from the University of California- Berkeley, and holds a J.D. from the Pepperdine University School of Law.
9
Table of Contents
Bryan S. Doerr has served as our Chief Technology Officer since October 2003. From February 2002 to October 2003, Mr. Doerr was our Vice President, Software Development. Prior to this, Mr. Doerr held several positions in management, software technology research, and software development at Bridge Information Systems, Inc., The Boeing Company, and Johns Hopkins University Applied Physics Laboratory. Mr. Doerr received his B.S. in Electrical Engineering from the University of Missouri, a M.S. degree in Electrical Engineering from Johns Hopkins University, and a Masters in Information Management from Washington University in St. Louis, Missouri.
William D. Fathers was appointed President of our Company on February 24, 2011. Mr. Fathers had previously served as our Senior Vice President, Global Sales and Marketing since November 2009, prior to this as our Senior Vice President, Managing Director – U.S. since August 2008 and prior to that as our Senior Vice President, Engineering and Development since April 2007. Prior to joining us, Mr. Fathers was Global Head of Development for Reuters Limited from April 2005 to April 2007. From September 2003 to April 2005, Mr. Fathers was a Senior Vice President within Reuters Global Business Development team and was responsible for several major acquisition and post acquisition integration programs within the financial services market. From 2001 to 2003, Mr. Fathers held other senior technology positions within Reuters Limited. Prior to joining Reuters Limited, Mr. Fathers was a senior consultant at a telecom and media consultancy company, PA Consulting Group, and he served as an officer in the British Armed Forces. He received a Masters degree in Engineering from Cambridge University.
Gregory W. Freiberg has served as our Senior Vice President, Chief Financial Officer since April 2009. Prior to joining us, Mr. Freiberg served as the Senior Vice President and Chief Financial Officer for XO Holdings, Inc. and XO Communications, LLC from April 2006 to April 2009 and as Vice President of Finance and Controller from June 2005 to April 2006. Prior to joining XO Communications, Inc., Mr. Freiberg held positions as Senior Vice President of Finance with Asia Netcom and Asia Global Crossing from 2002 to 2005. Mr. Freiberg has served on the board of directors for joint ventures in Hong Kong, Japan, the Philippines and Singapore. Mr. Freiberg received a B.S. degree in Business Administration from the University of South Dakota, holds a CPA certificate from the State of Nebraska and served in the U.S. Army National Guard from 1986 to 1995.
Paul S. Hott has served as our Vice President, Human Resources since November 2009. Mr. Hott had previously served as Vice President, Talent Acquisition and Development since joining our company in January 2007. Prior to joining us, Mr. Hott was Senior Director, Human Resources at The Solae Company from 2005 to 2007. From 2002 to 2005, Mr. Hott held the positions of Senior Vice President, Leadership and Coaching Skill Development and Vice President, Learning and Organization Effectiveness at Bank of America. Prior to this, he held various management positions at GE Capital Fleet Services and The Pillsbury Company. Mr. Hott received a B.S. degree in Political Science and a M.B.A. from the University of Iowa.
James D. Mori has served as our Senior Vice President, Americas Sales since March 2010, and prior to that as our Senior Vice President, Global Client Services since March 2008. Mr. Mori served as our Senior Vice President, Client Services from November 2007 to March 2008, and prior to this, as our Managing Director, Americas since joining our company in October 1999. Previously, Mr. Mori served as Area Vice President for Sprint Corporation and in various other sales leadership positions with Sprint Corporation prior to that time. Mr. Mori received a B.S. degree in Business Administration from the University of Missouri.
Jeffrey H. Von Deylen has served as our Senior Vice President, Global Operations and Client Services since October 2008. Prior to that, Mr. Von Deylen served as our Chief Financial Officer from March 2003 to April 2009 and as a director of our company from March 2003 to May 2009. Prior to joining our company, Mr. Von Deylen held several financial positions at American Electric Power Company, Qwest Communications International, LCI International, Arthur Anderson and in Europe with Global Telesystems, Inc. and KPNQwest N.V. Mr. Von Deylen received a B.S. degree in Accountancy from Miami University.
Available Information
Our Internet site is at http://www.savvis.net. We are not including the information contained on our website as part of, or incorporating it by reference into, this filing. We make available to the public on our website, free of charge, our Annual Reports on Form 10-K, Quarterly Reports on Form 10-Q, Current Reports on Form 8-K, and amendments to those reports filed or furnished pursuant to Section 13(a) of the Securities Exchange Act of 1934 as soon as reasonably practicable after such material is electronically filed with, or furnished to, the U.S. Securities and Exchange Commission, or SEC. Our reports filed with, or furnished to, the SEC may be read and copied at the SEC’s Public Reference Room at 100 F Street, N.E., Washington, DC 20549. Investors may obtain information on the operation of the Public Reference Room by calling the SEC at 1-800-SEC-0330. These filings are also available on the SEC’s website at http://www.sec.gov.
10
Table of Contents
You should carefully consider the risks described below in addition to all other information provided to you in this document. Any of the following risks could materially and adversely affect our business, results of operations or financial condition. The risks and uncertainties described below are those that we currently believe may materially affect our company. Additional risks and uncertainties that we are unaware of or that we currently deem immaterial also may become important factors that affect our company.
Risks Related to Our Business
Our operating results may fluctuate significantly, which makes our future results difficult to predict and may cause our operating results to fall below expectations.
We incurred net losses of $54.0 million, $20.8 million and $22.0 million for the years ended December 31, 2010, 2009 and 2008, respectively, and we may incur net losses in the future. We may also have fluctuations in revenues, expenses and losses due to a number of factors, many of which are beyond our control, including the following:
| • | demand for and market acceptance of our hosting and network products; |
| • | our ability to retain key employees that maintain relationships with our clients; |
| • | the duration of the sales cycle for our services; |
| • | changes in clients’ budgets for information technology purchases and in the timing of their purchasing decisions; |
| • | the announcement or introduction of new or enhanced services by our competitors; |
| • | acquisitions and dispositions we may make; |
| • | our ability to implement internal systems for reporting, order processing, purchasing, billing and general accounting, among other functions; |
| • | our ability to meet performance standards under our agreements with our clients; |
| • | changes in the prices we pay for utilities, local access connections, Internet connectivity and longhaul backbone connections; |
| • | the timing and magnitude of capital expenditures, including costs relating to the expansion of operations, and of the replacement or upgrade of our network and hosting infrastructure; and |
| • | fluctuations in foreign currency exchange rates. |
Accordingly, our results of operations for any period may not be comparable to the results of operations for any other period and should not be relied upon as indications of future performance.
Demand for our services is vulnerable to economic downturns. If general economic conditions weaken, then our revenues and our financial condition may materially decline.
We are vulnerable to general downturns in the domestic and international economies. Demand for our services may decrease if our clients face a deterioration of their businesses or decide to delay capital spending out of uncertainty regarding the future. In addition, our clients may find it more difficult to raise capital in the future due to substantial limitations on the availability of credit and may be forced to delay upgrades to their IT infrastructure. Furthermore, our clients may demand better pricing terms and their ability to timely pay our invoices may be affected by a weakened economy. A deterioration of the economy could also result in a number of our clients facing bankruptcy. As a result, clients may reduce the services they purchase from us, merge with competitors or enter into bankruptcy, any of which could adversely affect our revenues. If the economy weakens, then our revenues and overall financial condition may be adversely affected.
11
Table of Contents
We operate in a rapidly evolving industry, which makes our future operating results difficult to predict.
We operate in an industry characterized by rapid technological innovation, changing client needs, evolving industry standards and frequent introductions of new products and services. Our success depends on our ability to implement managed, network and cloud services that anticipate and respond to rapid and continuing changes in technology, industry developments and client needs. As we encounter new client requirements and increasing competitive pressures, we will likely be required to modify, enhance, reposition or introduce new solutions and service offerings. We may not be successful in doing so in a timely, cost-effective and appropriately responsive manner, or at all. All of these factors make it difficult to predict our future operating results, which may impair our ability to manage our business and our investors’ ability to assess our prospects.
Our failure to meet performance standards under our client contracts could result in our clients terminating their relationships with us or our clients being entitled to receive financial compensation, which could lead to reduced revenues.
Our agreements with our clients contain various guarantees regarding our performance and our levels of service. If we fail to provide the levels of service or performance required by our agreements, our clients may be able to receive service credits for their accounts and other financial compensation, as well as terminate their relationship with us. In addition, any inability to meet our service level commitments or other performance standards could reduce the confidence of our clients and could consequently impair our ability to obtain and retain clients, which would adversely affect both our ability to generate revenues and our operating results.
We depend on a number of third-party providers, and the loss of, or problems with, one or more of these providers may cause financial losses, impede our growth or cause us to lose clients.
We are dependent on third-party providers to supply products and services. For example, we lease or otherwise procure equipment from equipment providers, bandwidth capacity from telecommunications network providers in the quantities and quality we require, data center space from third party landlords, power services from local utilities and other energy suppliers, and we source equipment maintenance through third parties. While we have entered into various agreements for equipment, carrier line capacity, data center space, power services and maintenance, any failure to obtain equipment, additional capacity or space, power services or maintenance, if required, would impede the growth of our business, harm our reputation and cause our financial results to suffer. The equipment that we purchase could be deficient in some way, thereby affecting our products and services. Our clients that use the equipment and facilities we lease or the services of these telecommunication providers may in the future experience difficulties due to failures unrelated to our systems. Additionally, any one of these third-party providers could suffer financial failure and, as a result, become incapable of supplying products and services to us. If, for any reason, these providers fail to provide the required services to us or our clients or suffer other failures, we may incur financial losses and our clients may lose confidence in our company, and we may not be able to retain these clients.
Our indebtedness could limit our ability to operate our business successfully.
As of December 31, 2010, the carrying amount of our debt, including capital and financing method lease obligations was $765.0 million, of which $2.9 million represented the book value of our $3.1 million convertible notes due in May 2012 and $533.3 million represented the book value of the $548.6 million remaining principal outstanding on our term loan. In addition, we expect from time to time to continue to incur additional indebtedness and other liabilities in the future. If we incur additional indebtedness or if we use more cash than we generate in the future, then the possibility that we may not have cash sufficient to pay, when due, the outstanding amount of our indebtedness will increase. If we do not have sufficient cash available to repay our debt obligations when they mature, we will have to refinance such obligations or we could be in default under the terms of our debt obligations, and there can be no assurance that we will be successful in such refinancing or that the terms of any refinancing will be acceptable to us. This also means that we will need to dedicate a substantial portion of our cash flow from operations to the payment of our indebtedness, reducing the funds available for operations, working capital, capital expenditures, sales and marketing initiatives, acquisitions and general corporate or other purposes. Our debt agreements also contain covenants that, among other things, restrict our ability to incur more debt, pay dividends and make distributions, make certain investments, repurchase stock, create liens, enter into transactions with affiliates, make capital expenditures, merge or consolidate, and transfer or sell assets without obtaining the approval of the lender. In addition, some of our debt agreements contain financial covenants that require us to maintain certain financial ratios and minimum performance levels. Our ability to comply with these provisions may be affected by events beyond our control. Failure to comply with these covenants could result in an event of default, which, if not cured or waived, could trigger cross-defaults and acceleration of repayment obligations.
12
Table of Contents
We may not be able to secure additional financing on favorable terms to meet our future capital needs.
If we do not have sufficient cash flow from our operations, we may need to raise additional funds through equity or debt financings in the future in order to meet our operating and capital needs. We may not be able to secure additional debt or equity financing on favorable terms, or at all, at the time when we need such funding. If we are unable to raise additional funds, we may not be able to pursue our growth strategy and our business could suffer. If we raise additional funds through further issuances of equity or convertible debt securities, our existing stockholders could suffer significant dilution in their percentage ownership of our company, and any new equity securities we issue could have rights, preferences and privileges senior to those of holders of our common stock. In addition, any debt financing that we may secure in the future could have restrictive covenants relating to our capital raising activities and other financial and operational matters, which may make it more difficult for us to obtain additional capital and to pursue business opportunities, including potential acquisitions. Furthermore, if we decide to raise funds through debt or convertible debt financings, we may be unable to meet our interest or principal payments.
We may make acquisitions or enter into joint ventures, strategic alliances or exclusivity agreements, each of which is accompanied by inherent risks.
If appropriate opportunities present themselves, we may make acquisitions or investments or enter into joint ventures, strategic alliances or exclusivity agreements with other companies. Risks commonly encountered in such transactions include:
| • | the difficulty of assimilating the operations and personnel of the combined companies; |
| • | the risk that we may not be able to integrate the acquired services, products or technologies with our current services, products and technologies; |
| • | the potential disruption of our ongoing business; |
| • | the diversion of management attention from our existing business; |
| • | the inability to retain key technical and managerial personnel; |
| • | the inability of management to maximize our financial and strategic position through the successful integration of acquired businesses; |
| • | difficulty in maintaining controls, procedures and policies; |
| • | the impairment of relationships with employees, suppliers and clients as a result of any integration; |
| • | the loss of an acquired or existing base of clients and accompanying revenue; |
| • | the assumption of leased facilities or other long-term commitments, or the assumptions of unknown liabilities, that could have a material adverse impact on our profitability and cash flow; and |
| • | dilution to our stockholders. |
As a result of these potential problems and risks, businesses that we may acquire or invest in may not produce the revenue, earnings or business synergies that we anticipated. These potential problems and risks may have an adverse impact on both our ability to provide services to our clients and our relationships with our clients. In addition, we cannot be assured that any potential transaction will be successfully identified and completed or that, if completed, the acquired businesses or investment will generate sufficient revenue to offset the associated costs or other potential harmful effects on our business.
13
Table of Contents
Our increasing use of strategic alliances could expose us to risks not present where we operate without such relationships.
We believe that in certain circumstances our business can be benefitted by establishing relationships with strategic partners, and we have entered into strategic alliances and exclusivity agreements to market and sell our services and may continue to do so in the future. In such relationships, we are typically relying on these partners to market our brand and, if our partners do not meet contractual commitments with clients or are unable to provide necessary services, Savvis’ brand may be negatively impacted, which could lead to a loss of existing clients and an inability to attract new clients. Where we rely on strategic alliance partners to support our operations in a particular country or region, we may experience operational problems attributable to the installation, implementation, integration, performance, features or functionality of software, systems or services, which could result in sustained equipment failure leading to claims for service credits under our service level guarantees and, ultimately, loss of business. While acting on our behalf, our partners may also violate applicable laws or regulations to which we are subject, including the U.S. Foreign Corrupt Practices Act or relevant foreign statutes. Such violations may result in audits, investigations, litigation, penalties or fines, which could have a significant impact on our financial condition, or prohibitions on doing business in certain countries or with governments, including the U.S. government, which could limit our growth opportunities.
A material reduction in revenue from our largest client or the loss of other key clients could harm our financial results to the extent not offset by cost reductions or additional revenue from new or other existing clients.
Thomson Reuters accounted for approximately 7% of our revenue in 2008 and 2009, and approximately 8% of our revenue in 2010. Investment companies, banks and other financial services companies, excluding Thomson Reuters, accounted for approximately 19% of our revenue in 2008, 2009 and 2010. The loss of Thomson Reuters or any of our other key clients, including our clients in the financial sector, due to the acquisition of such clients, their financial failure or bankruptcy, adverse economic or other reasons, or a considerable reduction in the amount of our services that these clients purchase, could materially reduce our revenues which, to the extent not offset by cost reductions or revenue from new or other existing clients, could materially reduce our cash flows and adversely affect our financial position. This may limit our ability to raise capital or fund our operations, working capital needs and capital expenditures in the future.
Bidding for and obtaining contracts to provide services to government and quasi-government entities imposes restrictions and costs on our business not present in our non-government client contracts.
We have sought and plan to continue to seek to provide our services to governments and government agencies, including the U.S. government. Bidding for government contracts can involve costs not present in seeking non-government contracts, such as costs associated with obtaining various levels of security clearances in compliance with applicable requirements. If we are not successful in obtaining sufficient revenue from government contracts to offset these costs, our ability to generate a profit could suffer.
If we are able to contract to provide services to a government or government agency, we may not be able to do so on favorable terms, and doing so may subject us to otherwise inapplicable regulation. Such contracts are typically subject to more onerous conditions than our contracts with non-government clients, including limited durations, profit, pricing and cost controls, modification or termination without cost and on short or no notice. In some cases, such contracts are subject to the contracting agency or entity obtaining appropriations or funding, which may not materialize. Breach of government contract terms or applicable regulations and requirements could lead to contract modification or termination, the assessment of penalties and fines and/or suspension or debarment from government contracting or subcontracting for a period of time or permanently, which could adversely affect our business and results of operations. For contracts involving classified information, any breach of security could make us ineligible to work on any future classified programs and subject us to penalties and fines, which could negatively impact our results of operations or financial condition.
Our operations could be adversely affected if we are unable to maintain peering arrangements with Internet Service Providers on favorable terms.
We enter into peering agreements with Internet Service Providers throughout our market which allow us to access the Internet and exchange traffic transparently with these providers. Previously, many providers agreed to exchange traffic without charging each other. However, some providers that previously offered peering transparency have reduced peering relationships or are seeking to impose charges for transit, especially for unbalanced traffic offered and received by us with these peering partners. For example, several network operators with large numbers of individual users claim that they should be able to charge network operators and businesses that send traffic to those users. Additionally, actions by government and regulatory authorities to adopt rules that would govern agreements we have with Internet Service Providers or other network operators, including those with respect to net neutrality, could impair or limit our ability to manage our network resources. Increases in costs associated with Internet and exchange traffic could have an adverse effect on our business. If we are not able to maintain our peering relationships on favorable terms, we may not be able to provide our clients with affordable services, which would adversely affect our results from operations.
14
Table of Contents
Failures in our products or services, including our network, hosting and colocation services, could disrupt our ability to provide services, increase our capital costs, result in a loss of clients or otherwise negatively affect our business.
Our ability to implement our business plan successfully depends upon our ability to provide high quality, reliable services. Interruptions in our ability to provide our services to our clients or failures in our products or services, through the occurrence of a natural disaster, human error, component or system failure, extreme temperature or other unanticipated problem, could adversely affect our clients’ businesses and our business and reputation. Additionally, expansions and developments in the products and services that we offer, including in particular advanced offerings such as cloud services, could increasingly add a measure of complexity that may overburden our data center and network resources and human capital, making service interruptions or failures more likely. For example, problems at one or more of our data center facilities could result in service interruptions or failures or could cause significant equipment damage. In addition, our network could be subject to unauthorized access, computer viruses and other disruptive problems caused by clients, employees or others. Unauthorized access, computer viruses or other disruptive problems could lead to interruptions, delays or cessation of service to our clients. In addition, we may be unable to implement disaster recovery or security measures in a timely manner or, if and when implemented, these measures may not be sufficient or could be circumvented through the reoccurrence of a natural disaster or other unanticipated problem, or as a result of accidental or intentional actions. Resolving network failures or alleviating security problems may also require interruptions, delays or cessation of service to our clients. Accordingly, failures in our products and services, including problems at our data centers, network interruptions or breaches of security on our network may result in significant liability, penalties, a loss of clients and damage to our reputation.
Our operations may be harmed and we could be subject to regulatory penalties and litigation if our network security is breached by unauthorized third parties.
If unauthorized third parties breach the security measures on our network, we could be subject to liability and could face reduced client confidence in our services. Unauthorized access could also potentially jeopardize the security of confidential information of our clients or our clients’ end-users, which might expose us to liability from clients and the government agencies that regulate us, including under an increasing number of information security and privacy laws, as well as deter potential clients from purchasing our services. Any internal or external breach in our network could severely harm our business and result in costly litigation and potential liability for us. Although we attempt to limit these risks contractually, there can be no assurance that we will limit the risk or avoid incurring financial penalties. To the extent our clients demand that we accept unlimited liability and to the extent there is a competitive trend to accept it, such a trend could affect our ability to retain these limitations in our contracts at the risk of losing the business.
Increased energy costs, power outages and limited availability of electrical resources may adversely affect our operating results.
Our data centers are susceptible to regional costs and supply of power and electrical power outages. We attempt to limit exposure to system downtime by using backup generators and power supplies. However, we may not be able to limit our exposure entirely even with these protections in place. In addition, our energy costs can fluctuate significantly or increase for a variety of reasons including increased pressure on legislators to pass green legislation. As energy costs increase, we may not always be able to pass on the increased costs of energy to our clients, which could harm our business. Power and cooling requirements at our data centers are also increasing as a result of the increasing power demands of today’s servers. Since we rely on third parties to provide our data centers with power sufficient to meet our clients’ power needs, our data centers could have a limited or inadequate amount of electrical resources. Our clients’ demand for power may also exceed the power capacity in our older data centers, which may limit our ability to fully utilize these data centers. This could adversely affect our relationships with our clients and hinder our ability to run our data centers, which could harm our business.
Concerns about the environmental impacts of greenhouse gas emissions and the global climate change may result in environmental taxes, charges, regulatory schemes, assessments or penalties, which could restrict or negatively impact our operations or reduce our profitability.
The impacts of human activity on global climate change have attracted considerable public and scientific attention, as well as the attention of the United States and other governments. Efforts are being made to reduce greenhouse emissions and energy consumption, including those from coal combustion by power plants. We rely on power from these power plants, and the added cost of any environmental regulation, taxes, charges, assessments or penalties levied or imposed on these power plants could be passed on to us, increasing the cost to run our data centers and reducing our profitability. There are a number of state and federal legislative and environmental regulatory initiatives, as well as those internationally, that could restrict or negatively impact our operations or increase our energy costs. Additionally, environmental regulation, taxes, charges, assessments or penalties could be levied or imposed directly on us. Any enactment of laws or passage of regulations regarding greenhouse gas emissions by the United States, or any domestic or foreign jurisdiction we perform business in, could adversely effect our operations and financial results.
15
Table of Contents
If we are unable to recruit or retain qualified personnel, our business could be harmed.
We must continue to identify, hire, train and retain IT professionals, technical engineers, operations employees, and sales and senior management personnel who maintain relationships with our clients and who can provide the technical, strategic and marketing skills required for our company to grow. There is a shortage of qualified personnel in these fields, and we compete with other companies for the limited pool of these personnel. The failure to recruit and retain necessary technical, managerial, sales and marketing personnel, including but not limited to members of our executive team, could harm our business and our ability to grow our company.
Our failure to implement our growth strategy successfully could harm our business.
Our growth strategy includes increasing revenue from our managed hosting, colocation and network services. We seek to sell managed hosting, colocation and network services to our clients, thereby strengthening the client relationship. While initially clients may only purchase one or two services, we believe that once the client sees the benefit of our infrastructure offerings to their business they will purchase additional services. We have developed new data center capabilities as part of our growth strategy. If we do not have sufficient client demand in the markets to support the new data centers we have built, our financial results may be harmed. There is no assurance that we will be able to implement these initiatives in a timely or cost effective manner, and this failure to implement our growth strategy could cause our operations and financial results to be negatively affected.
We have agreed to certain indemnification obligations which, if we are required to perform, may negatively affect our operations.
In connection with our sale of the assets related to our content delivery network, we agreed to indemnify the purchaser for certain losses that it may incur due to a breach of our representations and warranties. If we are required to perform such obligations should they arise, any actions we are required to take or payments we are required to make could harm our operations and prevent us from being able to engage in favorable business activities, consummate strategic acquisitions or otherwise fund capital needs.
We may be liable for the material that content providers distribute over our network.
The law relating to the liability of private network operators for information carried on, stored or disseminated through their networks is still unsettled. We may become subject to legal claims relating to the content disseminated on our network. For example, lawsuits may be brought against us claiming that material on our network on which someone relied was inaccurate. Claims could also involve matters such as defamation, invasion of privacy and copyright infringement. If we need to take costly measures to reduce our exposure to these risks, or are required to defend ourselves against such claims, our financial results could be negatively affected.
Difficulties presented by international economic, political, legal, accounting, tax and business factors could harm our business in international markets.
For the year ended December 31, 2010, 21% of our total revenue was generated in countries outside of the United States. Some risks inherent in conducting business internationally include:
| • | regulatory, tax, licensing, political or other business restrictions or requirements; |
| • | longer payment cycles and problems collecting accounts receivable; |
| • | uncertain regulations; |
| • | fluctuations in currency exchange rates; |
| • | our ability to secure and maintain the necessary physical and telecommunications infrastructure; |
| • | challenges in staffing and managing foreign operations; and |
| • | more restrictive laws or regulations, or more restrictive interpretations of existing laws or regulations, such as those related to content distributed over the Internet. |
Any one or more of these factors could adversely affect our business.
16
Table of Contents
Our inability to renew our data center leases, or renew on favorable terms, could have a negative impact on our financial results.
All of our data centers are leased and have lease terms that expire between 2011 and 2031. The majority of these leases provide us with the opportunity to renew the lease at our option for periods generally ranging from five to ten years. Many of these options however, if renewed, provide that rent for the renewal period will be equal to the fair market rental rate at the time of renewal. If the fair market rental rates are significantly higher than our current rental rates, we may be unable to offset these costs by charging more for our services, which could have a negative impact on our financial results. Additionally, the terms of a renewal may cause different accounting treatment for a lease, which could cause changes to our total debt position and have an adverse impact on our reported financial position or debt covenants. Also, it is possible that a landlord may insist on other financially unfavorable renewal terms or, where no further option to renew exists, elect not to renew all together.
Our right to undisturbed use of our leased data centers may be challenged if our landlords’ lenders exercise their rights due to our landlords’ default on their debt.
We lease the land and buildings which support our data centers. Continued economic degradation may negatively impact and create greater pressure in the commercial real estate market causing higher incidences of landlord default or lender foreclosure of properties, including perhaps the properties which support our data centers. While in most cases we maintain certain non-disturbance rights, it is not certain that such rights will in all cases be upheld, thereby jeopardizing our continued right of occupancy in such instances.
We may not be able to protect our intellectual property rights.
We rely upon a combination of internal and external nondisclosure safeguards including confidentiality agreements, as well as trade secret and other intellectual property laws and vehicles to protect our proprietary rights. We cannot, however, assure that the steps taken by us in this regard will be adequate to deter misappropriation of proprietary information or that we will be able to detect unauthorized use and take appropriate steps to enforce our intellectual property rights. We also are subject to the risk of litigation alleging infringement of third-party intellectual property rights. Any such claims could require us to spend significant sums in litigation, pay damages, develop non-infringing intellectual property or acquire licenses to the intellectual property that is the subject of the alleged infringement.
Our investment portfolio is subject to market fluctuations which may affect our liquidity.
Historically, we have invested in AAA-rated U.S. government agencies, AAA-rated money market funds meeting certain criteria, and A1/P1 rated commercial paper. The market value of these investments may decline due to general credit, liquidity, market, interest rate and issuer default risks, which subject us to the risk of declines in the market values of our investments in the future that could result in an adverse impact on our financial condition and operating results.
17
Table of Contents
Risks Related to Our Industry
The markets for our hosting, network and professional services are highly competitive, and we may not be able to compete effectively.
The markets for our hosting, network and professional services are extremely competitive. We expect that competition will intensify in the future, and we may not have the financial resources, technical expertise, sales and marketing abilities or support capabilities to compete successfully in these markets. Many of our current and potential competitors have longer operating histories, greater name recognition, access to larger client bases and greater market presence, lower costs of capital, and greater engineering and marketing capabilities and financial, technological and personnel resources than we do. As a result, as compared to us, our competitors may:
| • | develop and expand their networking infrastructures and service offerings more efficiently or more quickly; |
| • | adapt more rapidly to new or emerging technologies and changes in client requirements; |
| • | take advantage of acquisitions and other opportunities more effectively; |
| • | develop products and services that are superior to ours or have greater market acceptance; |
| • | adopt more aggressive pricing policies and devote greater resources to the promotion, marketing, sale, research and development of their products and services; |
| • | make more attractive price and performance offers to our existing and potential employees; |
| • | establish cooperative relationships with each other or with third parties; and |
| • | take advantage of existing relationships with clients more effectively or exploit their more widely recognized brand name to market and sell their services. |
Recent industry consolidation may increase the competitive advantages noted above. If we are unable to compete effectively, this could result in an adverse impact on our operating results and financial condition.
If the markets for outsourced information technology services decline, there may be insufficient demand for our services and, as a result, our business strategy and objectives may fail.
Our solutions are designed to enable a client to focus on its core business while we manage and ensure the quality of its information technology, or IT, infrastructure. Businesses may believe the risk of outsourcing is greater than the risk of managing their IT operations themselves. If businesses do not continue to recognize the high cost and inefficiency of managing IT themselves, including the difficulties of upgrading technology, training and retaining skilled personnel with domain expertise, and matching IT cost with actual benefits, they may not continue to outsource their IT infrastructure to companies within our industry. Additionally, outsourcing may be associated with larger companies, such as HP and IBM, and we may not be as successful as these companies. As a result of these risks, our business may suffer and it could adversely affect our business strategy and objectives and our ability to generate revenues.
Our failure to achieve desired price levels could affect our ability to achieve profitability or positive cash flow.
We have experienced and expect to continue to experience pricing pressure for some of the services that we offer. Prices for Internet services have decreased in recent years and may decline in the future. Colocation prices have stabilized throughout the past year; however, this stabilization may be challenged in the future as large wholesale vendors enter the enterprise colocation market. In addition, by bundling their services and reducing the overall cost of their services, telecommunications companies that compete with us may be able to provide clients with reduced communications costs in connection with their hosting, data networking or Internet access services, thereby significantly increasing pricing pressure on us. We may not be able to offset the effects of any such price reductions even with an increase in the number of our clients, higher revenues from enhanced services, cost reductions or otherwise. In addition, we believe that the data networking and VPN and Internet access and hosting industries are likely to continue to encounter consolidation which could result in greater efficiencies in the future. Increased price competition or consolidation in these markets could result in erosion of our revenues and operating margins and could have a negative impact on our profitability. Furthermore, larger consolidated telecommunications providers have indicated that they want to start billing companies delivering services over the Internet a premium charge for priority access to connected clients. If these providers are able to charge companies such as us for this, our costs will increase, and this could affect our results of operations.
18
Table of Contents
New technologies could displace our services or render them obsolete.
New technologies or industry standards, including those technologies protected by intellectual property rights, have the potential to replace or provide lower cost alternatives to our hosting, networking and Internet access services. The adoption of such new technologies or industry standards could render our data center technology and services obsolete, unmarketable, cause impairment of our existing assets, or require us to incur significant capital expenditures to expand and upgrade our technology to meet new standards. In addition, government regulation may adversely affect the demand for hosting services. We cannot guarantee that we will be able to identify new service opportunities successfully or, if identified, be able to develop and bring new products and services to market in a timely and cost-effective manner. In addition, we cannot guarantee that services or technologies developed by others will not render our current and future services non-competitive or obsolete or that our current and future services will achieve or sustain market acceptance or be able to effectively address the compatibility and interoperability issues raised by technological changes or new industry standards. If we fail to anticipate the emergence of, or obtain access to, a new technology or industry standard, we may incur increased costs if we seek to use those technologies and standards, or our competitors that use such technologies and standards may use them more cost-effectively than we do.
The data networking and Internet access industries are highly regulated in many of the countries in which we currently operate or plan to provide services, which could restrict our ability to conduct business in the United States and internationally.
We are subject to varying degrees of regulation in each of the jurisdictions in which we provide services. Local laws and regulations, and their interpretation and enforcement, differ significantly among those jurisdictions, and can change significantly over time. Future regulatory, judicial and legislative changes or interpretations may have a material adverse effect on our ability to deliver services within various jurisdictions. For example, the European Union enacted a data retention system that, once implemented by individual member states, will involve requirements to retain certain IP data that could have an impact on our operations in Europe. Moreover, national regulatory frameworks that are consistent with the policies and requirements of the World Trade Organization have only recently been, or are still being, put in place in many countries. Accordingly, many countries are still in the early stages of providing for and adapting to a liberalized telecommunications market. As a result, in these markets we may encounter more protracted and difficult procedures to obtain licenses.
Within the United States, the government continues to evaluate the data networking and Internet access industries. The Federal Communications Commission has a number of on-going proceedings that could affect our ability to provide services or to charge certain fees. Such regulations and policies may complicate, or make more costly or less profitable, our efforts to provide services in the future. Additionally, changing regulations or regulatory interpretations may cause regulated providers to increase the costs of certain services that we purchase. Our operations are dependent on licenses and authorizations from governmental authorities in many of the foreign jurisdictions in which we operate or plan to operate, and with respect to a limited number of our services, in the United States. These licenses and authorizations generally will contain clauses pursuant to which we may be fined or our license may be revoked on short notice. Consequently, we may not be able to obtain or retain the licenses necessary for our operations or be able to retain these licenses at costs which allow us to compete effectively.
A number of our clients are banks, brokerage firms, investment managers, operators of exchanges or trading systems and other participants in the financial services industry. As a service provider to some of these entities, we currently are subject to regulation and examination by regulatory authorities with jurisdiction over our clients and could in the future become subject to further requirements. Future legislation could subject us to expanded regulation if enacted. More aggressive use of current regulatory powers or the implementation of new regulatory regimes could increase our operating costs, subject us to potential penalties or affect our ability to continue serving the financial services market. In addition, securities trading operations of some securities firms, involving placing servers or leasing server space in the same location at or proximate to exchange facilities, have drawn increased public and regulatory scrutiny and are among the subjects of a broad review of equity market structure recently announced by the United States Securities and Exchange Commission. Rulemaking that arises from that review or otherwise could affect the cost, attractiveness or permissibility of certain of our services in ways that we cannot currently predict but that may have an adverse affect on our business, revenue and profitability.
Risks Related to Our Common Stock
Sales of a significant amount of our common stock in the public market could reduce our stock price or impair our ability to raise funds in new stock offerings.
We have approximately 57.0 million shares of common stock outstanding, the majority of which is held by a small number of investment firms, including Welsh, Carson, Anderson & Stowe, or Welsh Carson. As of February 23, 2011, investment partnerships sponsored by Welsh Carson own approximately 18% of our outstanding common stock, and since December 2006, Welsh Carson has distributed over 17.1 million shares of our common stock to its limited partners. These shares may and some have been sold in the public market immediately following such distributions. Also, as of February 23, 2011, Welsh Carson and individuals affiliated with Welsh Carson are entitled to certain registration rights with respect to 14.2 million shares of our common stock held by them. Sales of substantial amounts of shares of our common stock in the public market, including sales following Welsh Carson distributions or the perception that either of those sales will occur, could cause the market price of our common stock to decline. Those sales also might make it more difficult for us to sell equity and equity-related securities in the future at a time and at a price that we consider appropriate.
19
Table of Contents
Our stock price is subject to significant volatility.
Since February 1, 2010, until the present, the closing price per share of our common stock has ranged from a high of $36.29 per share to a low of $14.09 per share. Our stock price has been, and may continue to be, subject to significant volatility due to conditions in the technology industry or in the financial markets generally, sales of our securities by significant stockholders and the other risks and uncertainties described or incorporated by reference herein.
Our certificate of incorporation and Delaware law contain provisions that could discourage a takeover.
Our certificate of incorporation and Delaware law contain provisions which may make it more difficult for a third party to acquire us, including provisions that give the Board of Directors the power to issue shares of preferred stock. We have also chosen to be subject to Section 203 of the Delaware General Corporation Law, which, subject to certain exceptions, prevents a stockholder of more than 15% of a company’s voting stock from entering into business combinations set forth under Section 203 with that company.
ITEM 1B. UNRESOLVED STAFF COMMENTS.
As of the filing of this Annual Report on Form 10-K, there were no unresolved comments from the Staff of the United States Securities and Exchange Commission.
As of December 31, 2010, we leased 65 facilities occupying approximately 3.2 million square feet of gross floor space worldwide for our corporate offices, sales and administrative offices, warehouses, network equipment and data centers. This includes the 32 data centers that we currently operate worldwide with approximately 1.54 million square feet of gross raised floor space. The locations and approximate square footage of these facilities by major geographic areas of the world are as follows (in thousands):
| Geographic Area |
Gross Square Feet of Office Space and Warehouse Space |
Gross Square Feet of Hosting Space |
Gross Square Feet of Network Space |
|||||||||
| North America |
332 | 2,276 | 159 | |||||||||
| Europe, Middle East and Africa |
49 | 332 | 7 | |||||||||
| Asia |
19 | 40 | 1 | |||||||||
| Worldwide Total |
400 | 2,648 | 167 | |||||||||
We believe that our existing facilities are adequate for our current needs and that suitable additional or alternative space will be available in the future to meet our anticipated needs.
We are subject to various legal proceedings and actions arising in the normal course of our business. While the results of all such proceedings and actions cannot be predicted, management believes, based on facts known to management today, that the ultimate outcome of all such proceedings and actions will not have a material adverse effect on our consolidated financial position, results of operation or cash flows.
ITEM 4. (REMOVED AND RESERVED).
20
Table of Contents
PART II
ITEM 5. MARKET FOR REGISTRANT’S COMMON EQUITY, RELATED STOCKHOLDER MATTERS, AND ISSUER PURCHASES OF EQUITY SECURITIES.
Market Information
Our common stock, $0.01 par value per share, is traded on the NASDAQ Global Select Market under the symbol SVVS. The following table lists, on a per share basis for the periods indicated, the high and low closing sale prices for the common stock as reported by NASDAQ.
| Quarter Ended |
High | Low | ||||||
| March 31, 2010 |
$ | 17.98 | $ | 14.09 | ||||
| June 30, 2010 |
20.00 | 14.75 | ||||||
| September 30, 2010 |
22.00 | 14.84 | ||||||
| December 31, 2010 |
27.80 | 19.18 | ||||||
| March 31, 2009 |
$ | 8.48 | $ | 5.09 | ||||
| June 30, 2009 |
14.26 | 6.14 | ||||||
| September 30, 2009 |
17.94 | 9.96 | ||||||
| December 31, 2009 |
18.02 | 12.52 | ||||||
Holders of the Corporation’s Capital Stock
As of February 23, 2011, there were approximately 547 holders of record of our common stock.
Dividends
We have not declared or paid any cash dividends on our common stock since our inception. We do not intend to pay cash dividends on our common stock in the foreseeable future. We anticipate we will retain any earnings for use in our operations and expansion of our business. In addition, we are restricted from paying dividends by the terms of our financing arrangements.
For information regarding securities authorized for issuance under equity compensation plans, please refer to Item 12 – Security Ownership of Certain Beneficial Owners and Management and Related Stockholder Matters included in this Annual Report on Form 10-K.
Issuer Purchase of Equity Securities
There were no issuer purchases of equity securities in the fourth quarter of 2010.
Stockholder Return Performance Graph
The following performance graph and related information shall not be deemed ‘soliciting material’ or to be ‘filed’ with the U.S. Securities and Exchange Commission, nor shall such information be incorporated by reference into any future filing under the Securities Act of 1933 or Securities Exchange Act of 1934, each as amended, except to the extent that we specifically incorporate it by reference into such filing.
The following graph compares the cumulative total stockholder return on our common stock with the cumulative total return of the NASDAQ Composite Index and market weighted indexes of publicly traded peers. The returns are calculated by assuming an investment of $100 in our common stock and in each index on December 31, 2005. The peer group in the graph that we refer to as the old peer group, or Old Peer Group, is a specially constructed group that we used prior to this year for comparative purposes. The publicly traded companies included in this group are Equinix, Inc., Internap Network Services Corp., Switch & Data Facilities Company, and Terremark Worldwide, Inc. Switch & Data Facilities Company was acquired by Equinix, Inc. in 2010 and we believe this change has made the Old Peer Group less relevant for comparative purposes. We have accordingly adopted a new composite peer group index, or the New Peer Group, replacing Switch & Data Facilities Company with Rackspace Hosting, Inc. and Telecity Group. We believe this new composite index provides a representative sample of the companies in the primary lines of business in which we engage and the locations in which we engage in those lines of business and, therefore, provides a better basis for performance comparisons than the old peer group.
21
Table of Contents
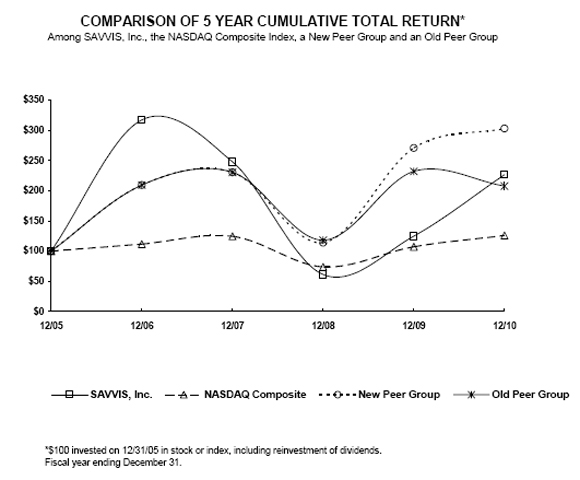
The points on the graph represent the following numbers:
| December 31, | ||||||||||||||||||||||||
| 2005 | 2006 | 2007 | 2008 | 2009 | 2010 | |||||||||||||||||||
| SAVVIS, Inc. |
$ | 100.00 | $ | 317.42 | $ | 248.09 | $ | 61.24 | $ | 124.89 | $ | 226.84 | ||||||||||||
| NASDAQ Composite |
100.00 | 111.74 | 124.67 | 73.77 | 107.12 | 125.93 | ||||||||||||||||||
| New Peer Group |
100.00 | 209.47 | 230.76 | 113.84 | 271.04 | 303.28 | ||||||||||||||||||
| Old Peer Group |
100.00 | 209.47 | 230.76 | 118.11 | 232.21 | 207.90 | ||||||||||||||||||
22
Table of Contents
ITEM 6. SELECTED FINANCIAL DATA.
The following consolidated statement of operations data for the years ended December 31, 2010, 2009, 2008, 2007 and 2006 and the consolidated balance sheet data as of December 31, 2010, 2009, 2008, 2007 and 2006 have been derived from our audited consolidated financial statements and the related notes to the financial statements. Our historical results are not necessarily indicative of the results to be expected for future periods. The following selected consolidated financial data for the years ended December 31, 2010, 2009 and 2008 and as of December 31, 2010 and 2009 should be read in conjunction with, and are qualified by reference to Item 7. Management’s Discussion and Analysis of Financial Condition and Results of Operations and our consolidated financial statements and related notes included elsewhere in this Annual Report on Form 10-K.
| Years Ended December 31, | ||||||||||||||||||||
| (dollars in thousands, except share data) |
2010 | 2009 | 2008 | 2007(1) | 2006 | |||||||||||||||
| Statement of Operations Data |
||||||||||||||||||||
| Total revenue |
$ | 932,984 | $ | 874,414 | $ | 857,041 | $ | 793,833 | $ | 763,971 | ||||||||||
| Income from continuing operations |
24,490 | 40,067 | 26,533 | 338,000 | 25,450 | |||||||||||||||
| Income (loss) from continuing operations, net of income taxes |
(54,020 | ) | (20,846 | ) | (21,966 | ) | 242,875 | (43,958 | ) | |||||||||||
| Income from discontinued operations, net of income taxes |
61 | — | — | — | — | |||||||||||||||
| Net income (loss) |
(53,959 | ) | (20,846 | ) | (21,966 | ) | 242,875 | (43,958 | ) | |||||||||||
| Basic income (loss) per common share(2) |
(0.98 | ) | (0.39 | ) | (0.41 | ) | 4.61 | (9.54 | ) | |||||||||||
| Diluted income (loss) per common share(2) |
(0.98 | ) | (0.39 | ) | (0.41 | ) | 4.51 | (9.54 | ) | |||||||||||
| Other Financial Data |
||||||||||||||||||||
| Net cash provided by operating activities |
$ | 177,741 | $ | 186,481 | $ | 145,558 | $ | 117,347 | $ | 118,701 | ||||||||||
| Net cash used in investing activities(3)(4) |
(313,885 | ) | (132,936 | ) | (246,166 | ) | (29,424 | ) | (87,092 | ) | ||||||||||
| Net cash provided by (used in) financing activities(5) |
99,190 | (14,473 | ) | 48,062 | (3,903 | ) | 8,433 | |||||||||||||
| Cash dividends per share |
— | — | — | — | — | |||||||||||||||
| December 31, | ||||||||||||||||||||
| (dollars in thousands) |
2010 | 2009 | 2008 | 2007(1) | 2006 | |||||||||||||||
| Balance Sheet Data |
||||||||||||||||||||
| Property and equipment, net(4) |
$ | 843,801 | $ | 783,852 | $ | 736,646 | $ | 616,584 | $ | 284,437 | ||||||||||
| Total assets |
1,183,650 | 1,024,758 | 949,695 | 888,274 | 467,019 | |||||||||||||||
| Long-term debt(6) |
530,649 | 376,089 | 360,249 | 285,002 | 269,436 | |||||||||||||||
| Capital and financing method lease obligations |
216,508 | 223,897 | 191,419 | 162,054 | 114,991 | |||||||||||||||
| Other long-term obligations |
74,937 | 76,452 | 71,588 | 59,182 | 82,941 | |||||||||||||||
| Stockholders’ equity (deficit) |
186,129 | 209,817 | 200,177 | 216,748 | (138,335 | ) | ||||||||||||||
| (1) | The significant changes in 2007 reflect the impact of gains on sale of certain data center assets of $180.5 million in June 2007 and CDN assets of $125.2 million in January 2007 and the impact of the loss on debt extinguishment of $45.1 million in June 2007 related to our subordinated notes. |
| (2) | For the years ended December 31, 2010, 2009, 2008 and 2006, the effects of including the incremental shares associated with options, warrants, unvested restricted stock and Series A Convertible Preferred Stock are anti-dilutive and are not included in the diluted weighted-average common shares outstanding. In addition, all common share information reflects the one-for-fifteen reverse stock split that occurred on June 6, 2006. |
| (3) | The significant increase in 2010 is a result of the $112.8 million acquisition of Fusepoint, Inc., net of cash received. |
| (4) | The significant increase in 2007 is a result of $225.8 million spent for the development or expansion of ten data centers, which were opened during 2007 and 2008. The significant increase in 2010 is a result of $49.9 million spent for the expansion of four data centers and the $23.7 million of assets acquired in the acquisition of Fusepoint, Inc. |
| (5) | The significant increase in 2010 is primarily the result of $110.0 million in borrowings to finance the acquisition of Fusepoint, Inc. |
| (6) | The significant increase in 2008 is a result of $47.9 million proceeds from borrowings on our Lombard loan agreement and $13.2 million in accretion on our convertible notes. The significant increase in 2010 is a result of an additional $110.0 million in borrowings to finance the acquisition of Fusepoint, Inc., in addition to the $14.2 million net impact of a debt refinancing transaction. |
23
Table of Contents
ITEM 7. MANAGEMENT’S DISCUSSION AND ANALYSIS OF FINANCIAL CONDITION AND RESULTS OF OPERATIONS.
Our Management’s Discussion and Analysis of Financial Condition and Results of Operations is provided in addition to the accompanying consolidated financial statements and notes thereto to assist readers in understanding our results of operations, financial condition and cash flows. The following discussion contains, in addition to historical information, forward-looking statements within the meaning of the Private Securities Litigation Reform Act of 1995, or the Act, that involve risks and uncertainties, including those set forth in Part I, Item 1A. of our Annual Report on Form 10-K and in subsequent United States Securities and Exchange Commission filings. These forward-looking statements within the meaning of the Act may contain, among others, statements regarding projections and estimates, expectations, and management’s plans, strategies and objectives which should not be read as a guarantee of future performance or results and will not necessarily be accurate indications of the timing when, or by which, such performance or results will be achieved. Forward-looking statements are typically identified by words or phrases such as ‘believe,’ ‘expect,’ ‘anticipate,’ ‘project,’ ‘estimate,’ ‘preliminary’ and similar expressions. We caution against placing undue reliance on forward-looking statements, which reflect our good faith beliefs with respect to future events and are based on information currently available to us as of the date the forward-looking statement is made. You should read the following discussion together with our consolidated financial statements and the related notes to those financial statements that are included in Part IV, Item 15. of this Annual Report on Form 10-K, beginning on page 52.
EXECUTIVE SUMMARY
Overview
We provide information technology, or IT, services including cloud services, managed hosting, managed security, colocation, professional and consultative services and network services through our global infrastructure to businesses and government agencies around the world. Our services are designed to offer a flexible and comprehensive IT solution that meets the specific IT infrastructure and business needs of our clients. Our suite of products can be purchased individually, in various combinations, or as part of a total or partial outsourcing arrangement. Our colocation solutions meet the specific needs of clients who require control of their physical assets, while our managed hosting solution offerings provide clients with access to our services and infrastructure without the upfront capital costs associated with equipment acquisition. By partnering with us, our clients may drive down the costs of acquiring and managing IT infrastructure and achieve increased operational efficiency by taking advantage of our global monitoring, application performance support and other operational support systems and tools, which allow our clients to focus their resources on their core business while we focus on the delivery and performance of their IT infrastructure services.
Significant trends for the year ended December 31, 2010 included hosting revenue growth of 11% over the year ended December 31, 2009 and revenue from the financial services industry of $252.7 million, a 10% increase over the year ended December 31, 2009. Our cloud revenue for the year ended December 31, 2010 was $15.2 million, an increase of 106% over the year ended December 31, 2009. As part of our strategic plan to expand our geographic presence around the world, we acquired a hosting provider in a strategic market for $121.8 million in cash in June 2010. In August, we restructured our debt profile and closed on our senior secured credit facilities, which include a $550.0 million term loan and a $75.0 million revolving credit facility. The proceeds were used to fund a tender offer on our 3% senior convertible notes, along with the repayment of other bank and vendor financing.
For further information on our business and services, please refer to Part I, Item 1. of this Annual Report on Form 10-K.
Business Trends and Outlook
To the extent that the global economic outlook begins to stabilize and improve, we believe that companies would increasingly consider adopting outsourced IT solutions as they focus on reducing their infrastructure and personnel spending while working to meet the increasing demands from their user communities. We believe we have considerable opportunity as our services model enables our enterprise clients to choose from a number of different strategies designed to reduce their IT costs. Our focus is to provide mission-critical, non-discretionary IT infrastructure outsourcing and we believe that our target client base considers us specialists in the areas of server management, storage, virtualization, security and network infrastructure. With the completion in 2008 of a significant phase of our global data center expansion, and additional expansion in key markets in 2010 and 2011, we believe we have the right footprint, operational plan and functionality in place to provide our clients with the products and services they need at the locations where they need it. Additionally, with our recent acquisition of Fusepoint, Inc., we have expanded our global footprint into Canada. We continue to work with our existing clients to understand their business needs and related geographic and product extension opportunities. We believe that the pursuit of this understanding will foster stronger, mutually beneficial relationships with our clients. We are also evaluating and entering into strategic alliances and marketing agreements, which allows us to extend our product offerings and enter new geographic markets with lower upfront costs of entry. Two examples include our agreement with Thomson Reuters, which provides managed hosting and network solutions to Thomson Reuters clients through our data centers and our marketing agreement with Bharti Airtel in which we will provide our managed services from Bharti Airtel’s data centers located in India.
24
Table of Contents
The center point of our strategy is to grow our hosting business through our managed hosting service offerings. We believe that we can show clients that we can decrease their costs by moving towards our managed hosting solutions for their IT needs. While colocation and network services play an important and foundational role, we remain intensely focused on growing our managed hosting business, specifically in our new offerings such as cloud services. In 2009, we launched the first of our cloud service offerings and in the second quarter of 2010 launched our advanced virtual private data center for cloud services. In the fourth quarter of 2009, we experienced revenue decreases from non-core, below-market margin colocation clients, including certain of those in the internet content business. In 2010, the colocation market has improved; however, we anticipate pricing challenges as wholesale vendors enter the enterprise colocation market. Additionally, we have increased our focus on our network services and have started to see stabilization in that segment of our business, while continuing to provide an integrated managed hosting and managed network solution, particularly in hosted applications requiring higher network performance characteristics; however, we do expect certain of our network products to continue to experience pricing pressure.
Based on current economic conditions and demand for our services, we will also continue to remain focused on initiatives that we believe will continue to improve and grow our business, including:
| • | Increasing the quality of our infrastructure and the reliability of our services through additional investments in systems; |
| • | Improving efficiencies in our services and support and our general and administrative areas through process and productivity improvements; |
| • | Expanding data center space to support growth in our hosting products and services; |
| • | Investing in cloud platforms and services; |
| • | Increasing client satisfaction through our delivery of differentiated services as reflected in responses to our client satisfaction surveys; and |
| • | Exploring options for acquisitions, divestitures and strategic alliances that facilitate the achievement of our business objectives. |
SIGNIFICANT EVENTS
Discontinued Operations
In our June 16, 2010 acquisition of Fusepoint, Inc., or Fusepoint, we acquired Fusepoint’s application services business, or FAS, which we did not consider core to our future operations and subsequently sold on December 13, 2010 for $1.5 million of cash proceeds. FAS, which was part of our hosting segment, provides service from two locations, Montreal and Quebec City, both of which provide clients with the design, development, integration and maintenance of mission critical e-business applications. We recognized a gain of $0.1 million on the sale of FAS in the year ended December 31, 2010, which was primarily related to the excess of cash proceeds received over the net book value. No gains or losses on the fair value were recorded on our financial statements prior to the sale, as FAS was recorded through acquisition accounting at its estimated fair value. The results of operations for FAS have been classified as discontinued operations in the consolidated statements of operations and the consolidated statement of cash flows for the year ended December 31, 2010.
Debt Refinancing
On August 4, 2010, we entered into senior secured credit facilities consisting of a $550.0 million six-year term loan facility, or the Term Loan, and a $75.0 million three-and-a-half-year revolving credit facility, or the Revolver, with a group of lenders for which Banc of America Securities LLC and Morgan Stanley Senior Funding, Inc. served as joint lead arrangers and joint bookrunners and Credit Suisse Securities (USA) LLC and Suntrust Robinson Humphrey, Inc. served as arrangers and joint bookrunners. The proceeds of the Term Loan were used, together with cash on hand, to repay existing indebtedness, including the $336.0 million principal and $2.2 million interest paid on tendered convertible notes, the $110.0 million outstanding on the Company’s existing revolving credit facility, which was terminated, with an additional $1.5 million in interest and fees, $16.9 million principal and $0.1 million interest on the loan agreement with Cisco Systems Capital Corporation, or Cisco, and $11.2 million of the $13.1 million outstanding on the lease agreements with Cisco, plus an additional $0.2 million in fees, the £35.0 million, or approximately $55.8 million, outstanding on the loan agreement with Lombard North Central, Plc., or Lombard, and the £2.0 million, or approximately $3.2 million, settlement of the interest rate swap related to the loan agreement with Lombard. The Term Loan requires 0.25% quarterly principal amortization payments beginning December 31, 2010, with the remaining balance payable on the maturity date, August 4, 2016. There was 3.0%, or $16.5 million, original issue discount associated with the Term Loan, which will be recognized as interest expense over the term of the loan. The Revolver contains a $40.0 million letter of credit provision and can be used to fund working capital, for capital expenditures and other general corporate purchases.
25
Table of Contents
Tender Offer
On July 1, 2010, we commenced a tender offer to purchase any and all of our outstanding 3.0% Convertible Senior Notes, or the Notes, due May 15, 2012 for an amount in cash equal to $990 per $1,000 principal amount of the Notes validly tendered and accepted for purchase plus accrued and unpaid interest up to, but not including, the date of purchase. The tender offer expired August 4, 2010, and we purchased 98.4% of the $345.0 million outstanding principal amount of the Notes, or $339.4 million, for $336.0 million. An additional $2.2 million was paid for accrued and unpaid interest. On September 14, 2010, at $990 per $1,000 principal amount, we purchased and extinguished $2.5 million of the remaining outstanding principal amount of the Notes for $2.5 million, including accrued and unpaid interest. As of December 31, 2010, $3.1 million principal amount of the Notes remained outstanding. As a result of both transactions, we recognized a loss on debt extinguishment of $4.3 million, which represents the $2.5 million unamortized debt issuance costs related to the extinguished Notes, the $1.4 million difference between the fair value attributed to the liability component and the carrying value of the Notes at extinguishment and the $0.4 million fees paid to third parties for the facilitation of the transactions.
Fusepoint Acquisition
On June 16, 2010, we completed our acquisition of Fusepoint, Inc., or Fusepoint. Fusepoint was an independent provider of outsourced managed IT and infrastructure services to mid-market and larger enterprises in Canada. With the acquisition of Fusepoint, we obtained hosting assets in three data centers which are located in Toronto, Vancouver and Montreal. We acquired Fusepoint for $121.8 million in cash, after adjustment for estimated working capital and debt levels. At the closing, $12.5 million of the purchase price was placed in escrow for possible application against this working capital adjustment, certain tax liabilities and indemnification claims that may be made in the first year following closing. We funded the acquisition through available cash on hand and the assumption of an additional $110.0 million of debt through the utilization of increased borrowing capacity under the Credit Agreement, which was amended and upsized to $150.0 million as described above. The acquisition has been accounted for using the acquisition method of accounting. Acquisition and integration related costs of $5.1 million were included in our consolidated statements of operations for the year ended December 31, 2010.
Option Exchange
In May 2009, pursuant to a plan approved by the stockholders at the 2009 annual meeting of stockholders, we offered our employees the opportunity to exchange some or all of their outstanding stock options with an exercise price per share greater than $17.85 and granted prior to May 29, 2008, whether vested or unvested, for a lesser number of stock options with an exercise price equal to the closing price of our common stock on the date of grant of the new options. Eligible employees tendered, and we accepted for cancellation, an aggregate of approximately 4.0 million shares of common stock, representing approximately 93.3% of the eligible options. On June 29, 2009, we granted approximately 3.0 million new options and cancelled the tendered eligible options.
Data Center Development and Expansion
During the year ended December 31, 2008, we spent $225.8 million for the development of ten new data centers that were opened as part of a global data center expansion plan. In addition, we commenced six operating leases for data centers that were opened in 2007 and 2008. In total, these new and expanded data centers added approximately 323,000 square feet of gross raised floor space, and enabled us to sell additional colocation and managed hosting services. In July 2009, we entered into a 20 year operating lease agreement for data center space, which will expand our hosting facility located in Weehawken, New Jersey by approximately 0.1 million square feet of raised floor space. In December 2009, we signed a lease agreement to assume additional space and extend the term of an existing operating lease related to a data center located in Chicago, Illinois, which changed the classification of the existing operating lease to a capital lease. In 2010, we expanded our existing data centers located in Washington, D.C. and London and in December 2010, signed a 16 year lease agreement to expand our data center facility in Piscataway, New Jersey.
26
Table of Contents
RESULTS OF OPERATIONS
The historical financial information included in this Annual Report on Form 10-K is not intended to represent the consolidated financial position, results of operations or cash flows that may be achieved in the future.
Year Ended December 31, 2010 Compared to Year Ended December 31, 2009
Executive Summary of Consolidated Results of Operations
Revenue increased $58.6 million, or 7%, for the year ended December 31, 2010 compared to the year ended December 31, 2009, primarily as a result of an 11% increase in hosting revenue, which was partially offset by a 3% decrease in network services revenue. Income from continuing operations decreased $15.6 million to $24.5 million for the year ended December 31, 2010 compared to income from continuing operations of $40.1 million for the year ended December 31, 2009, primarily due to increases in depreciation and other operating expenses. Loss from continuing operations before income taxes for the year ended December 31, 2010 was $55.0 million compared to $18.1 million for the year ended December 31, 2009.
The following table presents revenue and operating costs by category (dollars in thousands):
| Years Ended December 31, | ||||||||||||||||
| 2010 | 2009 | Dollar Change |
Percent Change |
|||||||||||||
| Revenue: |
||||||||||||||||
| Colocation |
$ | 358,390 | $ | 341,321 | $ | 17,069 | 5 | % | ||||||||
| Managed hosting |
314,962 | 265,975 | 48,987 | 18 | % | |||||||||||
| Total hosting |
673,352 | 607,296 | 66,056 | 11 | % | |||||||||||
| Network services |
259,632 | 267,118 | (7,486 | ) | (3 | )% | ||||||||||
| Total revenue |
932,984 | 874,414 | 58,570 | 7 | % | |||||||||||
| Cost of revenue(1) |
500,749 | 480,335 | (20,414 | ) | (4 | )% | ||||||||||
| Selling, general and administrative expenses(1) |
226,842 | 203,158 | (23,684 | ) | (12 | )% | ||||||||||
| (1) | Excludes depreciation, amortization and accretion, which is reported separately. |
Revenue. Revenue was $933.0 million for the year ended December 31, 2010, an increase of $58.6 million, or 7%, from $874.4 million for the year ended December 31, 2009. Revenue for the year ended December 31, 2009 included $8.9 million of non-recurring termination fees and $12.8 million of revenue from the American Stock Exchange, or AMEX, a client which was acquired by the New York Stock Exchange and subsequently cancelled its service with us in 2009. Total hosting revenue was $673.4 million for the year ended December 31, 2010, an increase of $66.1 million from $607.3 million for the year ended December 31, 2009. The increase was driven by a $49.0 million increase in managed hosting revenue, which included $9.2 million of incremental revenue resulting from our acquisition of Fusepoint. The growth in managed hosting revenue was moderated by the loss of $10.0 million in revenue from AMEX and $6.1 million in other one-time early termination fees in the year ended December 31, 2009. Offsetting this revenue loss was net growth of $55.9 million, which reflected growth in our dedicated hosting, storage and professional services products. Colocation revenue increased $17.1 million for the year ended December 31, 2010 compared to the year ended December 31, 2009, which included $9.9 million of incremental revenue resulting from our acquisition of Fusepoint. Organically, we experienced a $7.7 million increase in colocation revenue. Network services revenue was $259.6 million for the year ended December 31, 2010, a decrease of $7.5 million, or 3%, from $267.1 million for the year ended December 31, 2009. Included in network services revenue for the year ended December 31, 2009 was approximately $2.3 million of non-recurring revenue from AMEX. The remaining $5.2 million decrease in network revenue was primarily due to wholesale bandwidth client churn.
Cost of revenue. Cost of revenue includes costs of facility rentals, utilities, circuit costs and other operating costs for hosting space; third party costs associated with installing clients in our data centers; costs of leasing local access lines to connect clients to our Points of Presence, or PoPs; leasing backbone circuits to interconnect our PoPs; indefeasible rights of use, operations and maintenance; and salaries and related benefits for engineering, service delivery and provisioning, client service, consulting services and operations personnel who maintain our network, monitor network performance, resolve service issues and install new sites. Cost of revenue excludes depreciation, amortization and accretion, which is reported as a separate line item of operating expenses, and includes non-cash equity-based compensation. Cost of revenue was $500.7 million for the year ended December 31, 2010, an increase of $20.4 million, or 4%, from $480.3 million for the year ended December 31, 2009. This increase included $11.2 million of incremental costs resulting from our acquisition of Fusepoint, of which $0.7 million were integration costs. The remaining $9.2 million increase was primarily driven by a $6.7 million increase in software maintenance costs, a $5.2 million increase in third-party contractors to support hosting revenue growth, and a $0.4 million increase in non-cash equity-based compensation cost, partially offset by a $3.3 million decrease in client related costs related to the decrease in network revenue. Cost of revenue as a percentage of revenue decreased to 54% for the year ended December 31, 2010 compared to 55% for the year ended December 31, 2009.
27
Table of Contents
Sales, general and administrative expenses. Sales, general and administrative expenses include sales and marketing salaries and related benefits; product management, pricing and support salaries and related benefits; sales commissions and referral payments; advertising, direct marketing and trade show costs; occupancy costs; executive, financial, legal, tax and administrative support personnel and related costs; professional services, including legal, accounting, tax and consulting services; and bad debt expense. It excludes depreciation, amortization and accretion, which is reported as a separate line item of operating expenses, and includes non-cash equity-based compensation. Sales, general and administrative expenses were $226.8 million for the year ended December 31, 2010, an increase of $23.7 million, or 12% from $203.1 million for the year ended December 31, 2009. This increase included $4.9 million of incremental costs resulting from our acquisition of Fusepoint, of which $1.5 million were integration costs. The remaining $18.8 million increase was primarily driven by a $14.0 million increase in people costs primarily related to increased headcount and higher commissions on improved sales performance, in addition to increased bonus costs on an improvement in overall company performance, and a $3.2 million increase in marketing and legal costs. Sales, general and administrative expenses as a percentage of revenue were 24% for the year ended December 31, 2010 compared to 23% for the year ended December 31, 2009.
Depreciation, amortization and accretion. Depreciation, amortization and accretion expense consists primarily of the depreciation of property and equipment, amortization of intangible assets and accretion related to the aging of the discounted present value of certain liabilities and unfavorable long-term fixed price contracts assumed in acquisitions. Depreciation, amortization and accretion expense was $180.9 million for the year ended December 31, 2010, an increase of $30.0 million, or 20%, from $150.9 million for the year ended December 31, 2009. This increase included $7.6 million in depreciation on tangible assets acquired with our acquisition of Fusepoint, along with amortization of the acquired intangible assets. The remaining $22.4 million increase was due to the addition of new data centers and other capital expenditures of $32.9 million, which was partially offset by an $8.7 million decrease in depreciation due to certain assets becoming fully depreciated and $1.8 million decrease in depreciation due to foreign currency impact from assets in our international regions.
Loss on debt extinguishment. Loss on debt extinguishment was $8.7 million for the year ended December 31, 2010. This represents the loss incurred with the refinancing of our long-term debt, as described in the Significant Events section of this document, and consisted of $6.1 million unamortized deferred financing costs, a $1.4 million loss representing the difference between the fair value and carrying value of the Notes, and $1.2 million in costs primarily related to bank and legal fees.
Other income and expense. Other income and expense represents interest on our long-term debt, interest on our capital and financing lease obligations, certain other non-operating charges and interest income on our invested cash balances. Other income and expense was $70.8 million for the year ended December 31, 2010, an increase of $12.6 million, or 22%, from $58.2 million for the year ended December 31, 2009. The $9.6 million increase in interest expense for the year ended December 31, 2010 was primarily due to a $6.0 million increase in interest due to a debt refinancing that occurred in August 2010 and $4.8 million of interest related to the expansion of an existing data center in Chicago which resulted in the reclassification of the lease to a capital lease. Interest income decreased $0.1 million due to lower average interest rates and lower average daily cash balances invested during the year ended December 31, 2010. Other expense increased $2.9 million primarily due to the settlement of our interest rate swap during the year ended December 31, 2010.
The following table presents an overview of the components of net interest expense and other (dollars in thousands):
| Years Ended December 31, | ||||||||||||||||
| 2010 | 2009 | Dollar Change |
Percentage Change |
|||||||||||||
| Other (income) and expense |
||||||||||||||||
| Interest expense |
$ | 67,571 | $ | 57,976 | $ | 9,595 | 17 | % | ||||||||
| Interest income |
(126 | ) | (226 | ) | 100 | 44 | % | |||||||||
| Other (income) expense |
3,325 | 434 | 2,891 | 666 | % | |||||||||||
| Total other (income) and expense |
$ | 70,770 | $ | 58,184 | $ | 12,586 | 22 | % | ||||||||
Loss from continuing operations before income taxes. Loss from continuing operations before income taxes for the year ended December 31, 2010, was $55.0 million, a decline of $36.9 million, from a loss from continuing operations before income taxes of $18.1 million for the year ended December 31, 2009.
Income tax (benefit) expense. Income tax benefit for the year ended December 31, 2010 was $1.0 million compared to income tax expense of $2.7 million for the year ended December 31, 2009. The $3.7 million improvement was due to a tax benefit generated from Fusepoint operations, in addition to the expectation of a lower alternative minimum tax liability in 2010.
Loss from continuing operations, net of income taxes. Loss from continuing operations, net of income taxes for the year ended December 31, 2010 was $54.0 million, a decline of $33.2 million, from a loss from continuing operations, net of income taxes of $20.8 million for the year ended December 31, 2009, driven by the factors previously described.
Income from discontinued operations, net of income taxes. Income from discontinued operations, net of income taxes, was $0.1 million for the year ended December 31, 2010. This represents the gain from the sale of our applications services business acquired in our acquisition of Fusepoint, Inc., which was sold in December 2010.
28
Table of Contents
Net loss. Net loss for the year ended December 31, 2010, was $54.0 million, a decline of $33.2 million from a net loss of $20.8 million for the December 31, 2009, driven by the factors previously described.
Segment Information
Segment Adjusted EBITDA
The discussion of our results of operations by segment presented below includes references to and analysis of our segment adjusted EBITDA results. Adjusted EBITDA represents income from continuing operations before depreciation, amortization and accretion, and non-cash equity-based compensation. Adjusted EBITDA is reconciled below to its most comparable measure, income from continuing operations. Adjusted EBITDA is further reconciled to loss from continuing operations before income taxes in Note 20 of Notes to Consolidated Financial Statements included in this Annual Report on Form 10-K. We use adjusted EBITDA as a performance measure to evaluate our segments because we believe that such information is a relevant measure of a company’s operating financial performance and liquidity in our industry. The calculation of adjusted EBITDA is not specified by United States generally accepted accounting principles. As such, our calculation of adjusted EBITDA may not be comparable to similarly titled measures of other companies.
The following table presents revenue and adjusted EBITDA by segment, and excludes the results of our discontinued operations (dollars in thousands):
| Years Ended December 31, | ||||||||||||||||
| 2010 | 2009 | Dollar Change |
Percent Change |
|||||||||||||
| Revenue |
||||||||||||||||
| Hosting |
$ | 673,352 | $ | 607,296 | $ | 66,056 | 11 | % | ||||||||
| Network |
259,632 | 267,118 | (7,486 | ) | (3 | )% | ||||||||||
| Total revenue |
$ | 932,984 | $ | 874,414 | $ | 58,570 | 7 | % | ||||||||
| Adjusted EBITDA |
||||||||||||||||
| Hosting |
$ | 261,259 | $ | 239,290 | $ | 21,969 | 9 | % | ||||||||
| Network |
65,743 | 67,610 | (1,867 | ) | (3 | )% | ||||||||||
| Corporate - other (1) |
(95,931 | ) | (86,877 | ) | (9,054 | ) | (10 | )% | ||||||||
| Total adjusted EBITDA |
$ | 231,071 | $ | 220,023 | $ | 11,048 | 5 | % | ||||||||
| Adjusted EBITDA reconciliation |
||||||||||||||||
| Income from continuing operations |
$ | 24,490 | $ | 40,067 | ||||||||||||
| Depreciation, amortization and accretion |
180,903 | 150,854 | ||||||||||||||
| Non-cash equity-based compensation |
25,678 | 29,102 | ||||||||||||||
| Adjusted EBITDA |
$ | 231,071 | $ | 220,023 | ||||||||||||
| (1) | Includes all costs not directly associated with hosting services or network services, including $5.1 million acquisition and integration costs in the year ended December 31, 2010. |
Revenue
Hosting. Revenue from our hosting segment was $673.4 million for the year ended December 31, 2010, an increase of $66.1 million from $607.3 million for the year ended December 31, 2009. The increase was driven by a $49.0 million increase in managed hosting revenue, which included $9.2 million of incremental revenue resulting from our acquisition of Fusepoint. During the year ended December 31, 2009, we recorded approximately $6.1 million of non-recurring termination fees and approximately $10.0 million of revenue from AMEX. Offsetting this prior year non-recurring revenue was net growth of $55.9 million, which reflected growth in our dedicated hosting, storage and professional services products. Colocation revenue increased $17.1 million for the year ended December 31, 2010 compared to the year ended December 31, 2009, and included $9.9 million of incremental revenue from our acquisition of Fusepoint. Organically, we experienced a $7.7 million increase in colocation revenue.
Network. Network services revenue was $259.6 million for the year ended December 31, 2010, a decrease of $7.5 million, or 3%, from $267.1 million for the year ended December 31, 2009. Included in network services revenue for the year ended December 31, 2009 was approximately $2.3 million of non-recurring revenue from AMEX. The remaining $5.2 million decrease in network revenue was primarily due to wholesale bandwidth client churn.
29
Table of Contents
Adjusted EBITDA
Hosting. Adjusted EBITDA for our hosting segment was $261.3 million for the year ended December 31, 2010, an increase of $22.0 million, or 9%, from $239.3 million for the year ended December 31, 2009 which included $11.8 million of non-recurring termination fee revenue which had no associated costs. The increase was driven by a $66.1 million increase in revenue, partially offset by a $44.1 million increase in costs. Costs directly associated with our hosting segment include the costs of facility rentals, utilities, circuit costs and other operating costs for hosting space and the salaries and related benefits for personnel directly or indirectly associated with our hosting services. The $44.1 million increase in costs was primarily driven by an additional $15.6 million of costs for increased headcount and third party contractors to support increased managed hosting revenue and a $13.4 million increase in sales and marketing expense on higher commissions and expanded marketing efforts for hosting products. Additionally, software maintenance costs increased $6.3 million, primarily due to new business which resulted in increased license usage. Segment adjusted EBITDA as a percentage of segment revenue was 39% for the years ended December 31, 2010 and 2009.
Network. Adjusted EBITDA for our network segment was $65.7 million for the year ended December 31, 2010 and $67.6 million for the year ended December 31, 2009. The decrease was driven by the revenue decline of $7.5 million, which was primarily due to a decrease in bandwidth revenue, and was partially offset by a $5.6 million decrease in costs. Costs directly associated with our network segment include costs of leasing local access lines to connect clients to our PoPs, leasing backbone circuits to interconnect our PoPs, indefeasible rights of use, operations and maintenance, and salaries and related benefits for personnel directly or indirectly associated with our network services. The $5.6 million of cost savings due to a $3.5 million reduction in local loop and circuit costs that were driven by lower network revenue and $3.0 million of lower personnel costs. Segment adjusted EBITDA as a percentage of segment revenue was 25% for the years ended December 31, 2010 and 2009.
Corporate - other. Corporate - other adjusted EBITDA includes all operating costs not directly associated with our hosting or network segments, primarily general and administrative costs including executive, financial, legal, tax, internal IT and administrative support personnel and related costs, costs for professional services, including legal, accounting, tax and consulting services. These costs were $95.9 million for the year ended December 31, 2010 an increase of $9.0 million from $86.9 million for the year ended December 31, 2009. This was driven by $5.1 million of acquisition and integration costs related to our acquisition of Fusepoint, a $2.7 million increase in salaries, wages and benefits, and a $1.8 million increase in software maintenance and personal property taxes.
Year Ended December 31, 2009 Compared to Year Ended December 31, 2008
Executive Summary of Consolidated Results of Operations
Revenue increased $17.4 million, or 2%, for the year ended December 31, 2009 compared to the year ended December 31, 2008, primarily as a result of a 12% increase in colocation revenue. Income from operations increased to $40.1 million for the year ended December 31, 2009 compared to income from operations of $26.5 million for the year ended December 31, 2008. The increase in income from operations of $13.6 million was primarily due to an increase in revenues, partially offset by a slight increase in total operating expenses. Net loss for the year ended December 31, 2009 was $20.8 million, an improvement of $1.2 million from a net loss of $22.0 million for the year ended December 31, 2008.
The following table presents revenue and operating costs by category (dollars in thousands):
| Years Ended December 31, | ||||||||||||||||
| 2009 | 2008 | Dollar Change |
Percent Change |
|||||||||||||
| Revenue: |
||||||||||||||||
| Colocation |
$ | 341,321 | $ | 304,297 | $ | 37,024 | 12 | % | ||||||||
| Managed hosting |
265,975 | 260,212 | 5,763 | 2 | % | |||||||||||
| Total hosting |
607,296 | 564,509 | 42,787 | 8 | % | |||||||||||
| Network services |
267,118 | 292,532 | (25,414 | ) | (9 | )% | ||||||||||
| Total revenue |
874,414 | 857,041 | 17,373 | 2 | % | |||||||||||
| Cost of revenue(1) |
480,335 | 483,054 | (2,719 | ) | (1 | )% | ||||||||||
| Selling, general and administrative expenses(1) |
203,158 | 212,331 | (9,173 | ) | (4 | )% | ||||||||||
| (1) | Excludes depreciation, amortization and accretion, which is reported separately. |
30
Table of Contents
Revenue. Revenue was $874.4 million for the year ended December 31, 2009, an increase of $17.4 million, or 2%, from $857.0 million for the year ended December 31, 2008. Hosting revenue was $607.3 million for the year ended December 31, 2009, an increase of $42.8 million, or 8%, from $564.5 million for the year ended December 31, 2008. The increase included $11.8 million of non-recurring termination fees, which included $5.3 million related to the cancellation of our contract with AMEX and a decrease of $16.9 million in recurring revenue over the prior year due to the cancellation of our contract with AMEX, both of which were primarily reported in our managed hosting revenue. Colocation revenue increased $37.0 million primarily from sales into our new and expanded data centers. Network services revenue was $267.1 million for the year ended December 31, 2009, a decrease of $25.4 million, or 9%, from $292.5 million for the year ended December 31, 2008. The decrease was driven by a $24.4 million decline in our managed VPN product primarily due to pricing pressure and client churn, and included a $3.9 million decrease in recurring revenue due to the cancellation of our contract with AMEX.
Cost of revenue. Cost of revenue was $480.3 million for the year ended December 31, 2009, a decrease of $2.7 million, or 1%, from $483.1 million for the year ended December 31, 2008. This decrease was primarily driven by $10.1 million and $6.3 million decreases in client loops and circuit costs, respectively, which resulted from decreased network services revenue, and $3.7 million net decreases in other costs, primarily driven by utilities. These decreases were partially offset by a $9.1 million increase in rent resulting from increased hosting services revenue, a $3.3 million increase in salaries and wages, a $2.9 million increase in software maintenance, and a $2.2 million increase in non-cash equity-based compensation. Cost of revenue as a percentage of revenue decreased to 55% for the year ended December 31, 2009 compared to 56% for the year ended December 31, 2008.
Sales, general and administrative expenses. Sales, general and administrative expenses were $203.2 million for the year ended December 31, 2009, a decrease of $9.1 million, or 4% from $212.3 million for the year ended December 31, 2008. This decrease was driven by decreases in salaries, wages, and benefits of $4.7 million, bad debt expense of $4.7 million, travel and other costs of $1.8 million, and personal property taxes of $1.7 million, partially offset by a $3.9 million increase in non-cash equity-based compensation expense that was primarily the result of forfeiture rate adjustments in the prior year. Sales, general and administrative expenses as a percentage of revenue were 23% for the year ended December 31, 2009 compared to 25% for the year ended December 31, 2008.
Depreciation, amortization and accretion. Depreciation, amortization and accretion expense was $150.9 million for the year ended December 31, 2009, an increase of $15.8 million, or 12%, from $135.1 million for the year ended December 31, 2008. This increase was due to the addition and expansion of data centers asset and other capital expenditures.
Other income and expense. Other income and expense was $58.2 million for the year ended December 31, 2009, an increase of $12.7 million, or 28%, from $45.5 million for the year ended December 31, 2008. The $7.5 million increase in interest expense for the year ended December 31, 2009 was driven by a $2.8 million increase in interest on capital leases and the Cisco loan, a $3.2 million increase in interest on our loan agreement with Lombard, a $1.1 million increase in accreted interest on our Convertible Notes, and a $0.2 million decrease in capitalized interest. Interest income decreased $3.1 million due to lower average interest rates during the year ended December 31, 2009. Other income and expense decreased $2.0 million due to less favorable impact from currency revaluation of foreign denominated balances.
The following table presents an overview of the components of net interest expense and other (dollars in thousands):
| Years Ended December 31, | ||||||||||||||||
| 2009 | 2008 | Dollar Change |
Percentage Change |
|||||||||||||
| Other (income) and expense |
||||||||||||||||
| Interest expense |
$ | 57,976 | $ | 50,450 | $ | 7,526 | 15 | % | ||||||||
| Interest income |
(226 | ) | (3,364 | ) | 3,138 | 93 | % | |||||||||
| Other (income) expense |
434 | (1,583 | ) | 2,017 | 127 | % | ||||||||||
| Total other (income) and expense |
$ | 58,184 | $ | 45,503 | $ | 12,681 | 28 | % | ||||||||
Loss from continuing operations before income taxes. Loss from continuing operations before income taxes for the year ended December 31, 2009 was $18.1 million, an improvement of $0.9 million from loss from continuing operations before income taxes of $19.0 million for the year ended December 31, 2008.
Income tax expense. Income tax expense for the year ended December 31, 2009 was $2.7 million compared to $3.0 million for the year ended December 31, 2008. The $0.3 million decrease was due to lower alternative minimum taxes.
Loss from continuing operations, net of income taxes. Loss from continuing operations, net of income taxes for the year ended December 31, 2009 was $20.8 million, an improvement of $1.2 million from a loss from continuing operations, net of income taxes of $22.0 million for the year ended December 31, 2008, driven by the factors previously described.
Net loss. Net loss for the year ended December 31, 2009 was $20.8 million, an improvement of $1.2 million from a net loss of $22.0 million for the year ended December 31, 2008, driven by the factors previously described.
31
Table of Contents
Segment Information
Segment Adjusted EBITDA
The discussion of our results of operations by segment presented below includes references to and analysis of our segment adjusted EBITDA results. Adjusted EBITDA represents income from continuing operations before depreciation, amortization and accretion, and non-cash equity-based compensation. Adjusted EBITDA is reconciled below to its most comparable measure, income from continuing operations. Adjusted EBITDA is further reconciled to loss from continuing operations before income taxes in Note 20 of Notes to Consolidated Financial Statements included in this Annual Report on Form 10-K. We use adjusted EBITDA as a performance measure to evaluate our segments because we believe that such information is a relevant measure of a company’s operating financial performance and liquidity in our industry. The calculation of adjusted EBITDA is not specified by United States generally accepted accounting principles. As such, our calculation of adjusted EBITDA may not be comparable to similarly titled measures of other companies.
The following table presents revenue and adjusted EBITDA by segment, and excludes the results of our discontinued operations (dollars in thousands):
| Years Ended December 31, | ||||||||||||||||
| 2009 | 2008 | Dollar Change |
Percent Change |
|||||||||||||
| Revenue |
||||||||||||||||
| Hosting |
$ | 607,296 | $ | 564,509 | $ | 42,787 | 8 | % | ||||||||
| Network |
267,118 | 292,532 | (25,414 | ) | (9 | )% | ||||||||||
| Total revenue |
$ | 874,414 | $ | 857,041 | $ | 17,373 | 2 | % | ||||||||
| Adjusted EBITDA |
||||||||||||||||
| Hosting |
$ | 239,290 | $ | 204,831 | $ | 34,459 | 17 | % | ||||||||
| Network |
67,610 | 66,297 | 1,313 | 2 | % | |||||||||||
| Corporate - other (1) |
(86,877 | ) | (86,503 | ) | (374 | ) | 0 | % | ||||||||
| Total adjusted EBITDA |
$ | 220,023 | $ | 184,625 | $ | 35,398 | 19 | % | ||||||||
| Adjusted EBITDA reconciliation |
||||||||||||||||
| Income from continuing operations |
$ | 40,067 | $ | 26,533 | ||||||||||||
| Depreciation, amortization and accretion |
150,854 | 135,123 | ||||||||||||||
| Non-cash equity-based compensation |
29,102 | 22,969 | ||||||||||||||
| Adjusted EBITDA |
$ | 220,023 | $ | 184,625 | ||||||||||||
| (1) | Includes all costs not directly associated with hosting services or network services. |
Revenue
Hosting. Revenue from our hosting segment was $607.3 million for the year ended December 31, 2009, an increase of $42.8 million, or 8%, from $564.5 million for the year ended December 31, 2008, despite a loss of $16.9 million in recurring revenue due to the cancellation of our contract with AMEX. The increase was primarily due to a $37.0 million increase in colocation revenue from sales into new and expanded data centers and included $11.8 million on non-recurring termination fees, including $5.3 million related to the cancellation of our contract with AMEX, which were primarily reported in our managed hosting revenue.
Network. Revenue from our network segment was $267.1 million for the year ended December 31, 2009, a decrease of $25.4 million, or 9%, from $292.5 million for the year ended December 31, 2008, and included a $3.9 million decrease in recurring revenue due to the cancellation of our contract with AMEX. The decrease was driven by a $24.4 million decline in our managed IP VPN product primarily due to pricing pressure and client churn.
32
Table of Contents
Adjusted EBITDA
Hosting. Adjusted EBITDA for our hosting segment was $239.3 million for the year ended December 31, 2009, an increase of $34.5 million, or 17%, from $204.8 million for the year ended December 31, 2008. The increase was driven by the $42.8 million increase in revenue for the segment, partially offset by an $8.3 million increase in hosting costs. The $8.3 million increase in costs was primarily driven by revenue growth and data center related costs for rent and expansion in Europe. Segment adjusted EBITDA as a percentage of segment revenue increased to 39% for the year ended December 31, 2009 compared to 36% for the year ended December 31, 2008.
Network. Adjusted EBITDA for our network segment was $67.6 million for the year ended December 31, 2009, an increase of $1.3 million, or 2%, from $66.3 million for the year ended December 31, 2008. The increase was driven by a $26.7 million decrease in costs associated with our network segment, offset by a $25.4 million decline in network services revenue. The $26.7 million decrease in costs was directly related to the decline in revenue on client churn combined with more favorable telecom contracts. Segment adjusted EBITDA as a percentage of segment revenue increased to 25% for the year ended December 31, 2009 compared to 23% for the year ended December 31, 2008.
Corporate - other. Corporate - other adjusted EBITDA was $86.9 million for the year ended December 31, 2009, an increase of $0.4 million from $86.5 million for the year ended December 31, 2008. The increase was driven by increases in salaries, wages and benefits and legal services, partially offset by decreases in personal property tax, travel costs and audit fees.
LIQUIDITY AND CAPITAL RESOURCES
Sources and Use of Cash
As of December 31, 2010, our cash and cash equivalents balance was $120.3 million and we had $62.6 million of available capacity on our revolving credit facility. On July 1, 2010, we commenced a tender offer to purchase any and all of our outstanding convertible notes, or Notes, for an amount in cash equal to $990 per $1,000 principal amount of the Notes validly tendered and accepted for purchase plus accrued and unpaid interest up to, but not including, the date of purchase. The tender offer expired August 4, 2010, and we purchased 98.4% of the $345.0 million outstanding principal amount of the Notes, or $339.4 million, for $336.0 million, plus and additional $2.2 million of accrued and unpaid interest. On September 14, 2010, at $990 per $1,000 principal amount, we purchased and extinguished $2.5 million of the remaining outstanding principal amount of the Notes for $2.5 million, including accrued and unpaid interest. As of December 31, 2010, $3.1 million principal amount of the Notes remained outstanding. The repurchase of the Notes was funded through our entry into $625.0 million of senior secured credit facilities, which is comprised of a $550.0 million term loan maturing in 2016 and a $75.0 million revolving credit facility maturing in early 2014. The $550.0 million of term loan debt funded the repurchase of the Notes, the repayment of our Lombard loan for approximately $55.8 million, the settlement and subsequent termination of our revolving credit facility with Wells Fargo Capital Finance of $110.0 million, approximately $28.4 million of loans and leases with Cisco Systems Capital Corporation, including interest, and the settlement of the interest rate swap related to our Lombard loan for approximately $3.2 million. We believe we have sufficient cash to fund business operations and capital expenditures for at least twelve months from the date of this filing, from cash on hand, operations and available debt capacity. If favorable terms are made available to us, we may supplement this near-term liquidity with credit facilities and equity or debt financings, or we may refinance, reprice, or upsize our existing credit facilities and use the proceeds of such financing for working capital, investments in or extensions of credit to our subsidiaries, capital expenditures, stock repurchases, debt repayment or financing for acquisitions.
The following table presents our cash flows for the periods indicated (dollars in thousands):
| Years Ended December 31, | ||||||||||||
| 2010 | 2009 | 2008 | ||||||||||
| Cash provided by (used in): |
||||||||||||
| Operating activities |
$ | 177,741 | $ | 186,481 | $ | 145,558 | ||||||
| Investing activities |
(313,885 | ) | (132,936 | ) | (246,166 | ) | ||||||
| Financing activities |
99,190 | (14,473 | ) | 48,062 | ||||||||
| Effect of exchange rates on cash and cash equivalents |
(3,517 | ) | 459 | (9,311 | ) | |||||||
| Net increase (decrease) in cash and cash equivalents |
$ | (40,471 | ) | $ | 39,531 | $ | (61,857 | ) | ||||
33
Table of Contents
Operating activities. We generated $177.7 million of cash from operating activities during the year ended December 31, 2010, a decrease of $8.8 million in cash from operating activities of $186.5 million for the year ended December 31, 2009. This decrease was driven by the lengthening of collection cycles and increased prepayments for maintenance and rent related costs. We anticipate continuing to generate cash from operating activities during the next twelve months.
Investing activities. Net cash used in investing activities for the year ended December 31, 2010 was $313.9 million, an increase of $181.0 million from net cash used in investing activities of $132.9 million for the year ended December 31, 2009. The increase in cash used was driven by our net investment of $112.8 million in Fusepoint. Additionally, we incurred incremental data center expansion related capital expenditures of $28.7 million during the year ended December 31, 2010.
Financing activities. Net cash provided by financing activities for the year ended December 31, 2010 was $99.2 million, an increase of $113.7 million from net cash used by financing activities of $14.5 million for the year ended December 31, 2009. This increase primarily relates to $110.0 million in proceeds from long term debt, less related debt issuance costs of $2.6 million, used to fund our acquisition of Fusepoint, and $26.4 million proceeds from stock option exercises in the year ended December 31, 2010, partially offset by $12.9 million of net transaction costs related to our debt refinancing that occurred during the year ended December 31, 2010. While we anticipate our financing activities for the next twelve months to consist primarily of principal payments on our capital lease obligations and long-term debt, we continually assess our capital requirements and current debt and equity markets and may reprice, refinance or upsize our existing credit facilities if favorable terms are made available to us and use the proceeds of such financing for working capital, investments in or extensions of credit to our subsidiaries, capital expenditures, stock repurchases, debt repayment or financing for acquisitions.
Trade Accounts Receivable
Trade accounts receivable, net of allowance, was $65.1 million as of December 31, 2010, an increase of $19.3 million from $45.8 million at December 31, 2009, and included $3.2 million of trade accounts receivable, net acquired with Fusepoint. The remaining $16.1 million increase is driven by growth in revenue, a lengthening of the collection cycle through both more aggressive cash management strategies employed by and extended payment terms granted to certain clients. We continue to monitor and adjust our cash collection process and cash management strategies to mitigate any adverse impacts on our liquidity and cash flows from operations. Other than any financing activities we may pursue, client collections are our primary source of cash. As such, we are vulnerable to economic downturn and the impact it may have on our clients’ spending. We believe we have a strong client base with no one client accounting for more than 10% of our revenues; however, 27% of our revenue for the year ended December 31, 2010 was generated by clients in the financial services industry and 8% of that by our largest client, Thomson Reuters, who also represents 18% of our outstanding net accounts receivable balance. Given the ongoing economic environment and uncertainty in the financial services industry, we remain cautious regarding these clients and their future impact on our revenue and profitability.
Long-term Debt and Other Financing
Long-term debt. The following table sets forth our long-term debt and other financing as of December 31, 2010 and 2009 (dollars in thousands):
| December 31, | ||||||||
| 2010 | 2009 | |||||||
| Term loan (1) |
$ | 533,262 | $ | — | ||||
| Convertible notes |
2,887 | 305,921 | ||||||
| Lombard loan facility |
— | 55,973 | ||||||
| Other financing (2) |
— | 20,795 | ||||||
| Revolver |
— | — | ||||||
| Credit agreement |
— | — | ||||||
| Capital and financing method lease obligations (3) |
228,889 | 234,776 | ||||||
| Total long-term debt and other financing |
$ | 765,038 | $ | 617,465 | ||||
| (1) | The amount presented in the table above includes current amounts due of $5.5 million as of December 31, 2010. |
| (2) | Other financing includes borrowings under our Cisco loan agreement, for which the weighted-average interest rate was 6.50% as of December 31, 2009. The amount presented in the table above includes the current amount due of $6.6 million for December 31, 2009. The loan was paid in full on August 4, 2010. |
| (3) | Capital and financing method lease obligations include capital and financing method leases on certain of our facilities and equipment held under capital leases. The weighted-average interest rates for such leases were 12.84% as of December 31, 2010 and 15.32% as of December 31, 2009. The amounts presented in the table above include the current amounts due of $12.4 million as of December 31, 2010 and $10.9 million as of December 31, 2009. |
34
Table of Contents
Future principal payments. The following table sets forth our aggregate future principal payments of long-term debt and other financing as of December 31, 2010 (dollars in thousands):
| Future Principal Payments of Long-term Debt and Other Financing | ||||||||||||||||||||||||||||
| Total | 2011 | 2012 | 2013 | 2014 | 2015 | Thereafter | ||||||||||||||||||||||
| Term loan (1) |
$ | 548,625 | $ | 5,500 | $ | 5,500 | $ | 5,500 | $ | 5,500 | $ | 5,500 | $ | 521,125 | ||||||||||||||
| Convertible notes (1) |
3,106 | — | 3,106 | — | — | — | — | |||||||||||||||||||||
| Capital lease obligations (2) |
175,648 | 13,841 | 13,327 | 12,754 | 14,336 | 16,516 | 104,874 | |||||||||||||||||||||
| Revolver |
— | — | — | — | — | — | — | |||||||||||||||||||||
| Total |
$ | 727,379 | $ | 19,341 | $ | 21,933 | $ | 18,254 | $ | 19,836 | $ | 22,016 | $ | 625,999 | ||||||||||||||
| (1) | Represents principal amounts of the term loan and convertible notes. |
| (2) | Does not include future payments on our financing method lease obligations as they represent interest payments over the term of the lease. |
The weighted-average cash interest rate applicable to outstanding borrowings was 6.7% and 3.2% as of December 31, 2010 and 2009, respectively.
Term loan and revolver. On August 4, 2010, we entered into senior secured credit facilities consisting of a $550.0 million six-year term loan facility, or the Term Loan, and a $75.0 million three-and-a-half-year revolving credit facility, or the Revolver, with a group of lenders for which Banc of America Securities LLC and Morgan Stanley Senior Funding, Inc. served as joint lead arrangers and joint bookrunners and Credit Suisse Securities (USA) LLC and Suntrust Robinson Humphrey, Inc. served as arrangers and joint bookrunners. The Term Loan and Revolver contain various affirmative, negative and financial covenants which are measured on a quarterly or annual basis and restrict our ability to create liens, incur additional indebtedness and make capital expenditures, among other things, except as permitted by the terms of the agreement, and require maintenance of certain financial measures at defined levels. Our obligations under the Term Loan and the Revolver, and the guarantees of the Guarantors, are secured by a first-priority security interest in substantially all of our assets, interest in assets and proceeds thereof. We may elect to pay interest on a base or Eurodollar rate, plus applicable margin. The Term Loan requires 0.25% quarterly principal amortization payments beginning December 31, 2010, with the remaining balance payable on the maturity date, August 4, 2016. We incurred a 3.0%, or $16.5 million, original issue discount associated with the Term Loan. The Revolver contains a $40.0 million letter of credit provision, of which $12.4 million had been issued as of December 31, 2010. Unused commitments on the Revolver are subject to an annual commitment fee of 0.50% and a fee is applied to outstanding letters of credit of 4.75%. The applicable interest rate on Eurodollar loans under the Revolver would have been 5.01% at December 31, 2010; however, there were no outstanding borrowings. As of December 31, 2010, the applicable interest rate for the Term Loan was 6.75%, including the Eurodollar floor of 1.75%, and outstanding borrowings totaled $548.6 million. Unamortized original issue discount of $15.4 million on the Term Loan remained as of December 31, 2010.
Credit agreement. In August 2010, as part of a refinancing transaction, we repaid the $110.0 million outstanding, plus an additional $1.5 million in fees, and terminated our amended and restated credit agreement, or the Credit Agreement, with Wells Fargo Capital Finance. The Credit Agreement was amended in June 2010 to increase the available borrowing capacity in order to fund the purchase price of the Fusepoint acquisition. Under the amended terms of the Credit Agreement, we had borrowing capacity of $150.0 million which included a $40.0 million letter of credit provision. Borrowings under the Credit Agreement could be used to fund working capital, acquisitions, capital expenditures and other general corporate purposes. We elected to pay interest on a three month LIBOR rate, plus an applicable margin. The interest rate at the time of extinguishment was 6.50%. With the June 2010 amendment of the Credit Agreement, we incurred $2.6 million of additional debt issuance costs, the majority of which were recognized as a loss on debt extinguishment during the year ended December 31, 2010. As of December 31, 2010, there were approximately $3.5 million of outstanding letters of credit remaining with the terminated Credit Agreement provider, which are backed by a letter of credit issued under the Revolver.
Loan agreement and lease facility. We maintained a term loan and security agreement, or the Loan Agreement, and maintain a master lease agreement, or the Lease Agreement, with Cisco Systems Capital Corporation. The Loan Agreement provided for borrowings of up to $33.0 million, at an annual interest rate of 6.50%, to purchase network equipment, which were secured by a first-priority security interest in the equipment. The Lease Agreement provides a lease facility, or the Lease Facility, to purchase equipment with borrowings at the discretion of Cisco Systems Capital Corporation. The effective interest rate on current outstanding borrowings is 7.75%. On August 4, 2010, as part of a refinancing transaction, we repaid the outstanding $16.9 million in borrowings outstanding on the Loan Agreement, along with $0.1 million of interest, and $11.2 million of the $13.1 million outstanding leases under the Lease Facility. There was a $0.2 million loss on debt extinguishment associated with the repayment of the leases. As of December 31, 2010, we had $2.9 million in outstanding borrowings under Lease Facility.
35
Table of Contents
Lombard loan agreement. On August 4, 2010, as part of a refinancing transaction, we repaid and terminated, on behalf of our subsidiary SAVVIS UK Limited, or SAVVIS UK, the loan agreement, or the Lombard Loan Agreement, it maintained with Lombard North Central, Plc., or Lombard. The Lombard Loan Agreement had a five-year term and required monthly interest installments for the full term and quarterly principal installments that were to begin in 2011. We had guaranteed the obligations of SAVVIS UK under the Lombard Loan Agreement and the obligations were secured by a first priority security interest in substantially all of SAVVIS UK’s then existing data center assets and certain future assets. We maintained a letter of credit of $21.2 million, which was released with the termination of the agreement. A total of $55.8 million, or £35.0 million, was paid to Lombard, which included both the outstanding principal and accrued and unpaid interest. There were £0.4 million, or approximately $0.6 million, unamortized debt issuance costs related to the Lombard Loan Agreement recognized as a loss on debt extinguishment during the year ended December 31, 2010.
Interest rate swap. On August 2, 2010, as a result of the refinancing of the Lombard Loan Agreement, we terminated our interest rate swap agreement, or the Swap Agreement, with National Westminster Bank, Plc., or NatWest, for £2.0 million, or approximately $3.2 million. In January 2009, we had dedesignated our existing interest rate swap and redesignated a new interest rate swap by entering into the Swap Agreement. At the time of dedesignation, the fair value of the existing interest rate swap was £2.5 million, which represented the financing element of the Swap Agreement, and was to be amortized to earnings as the originally hedged cash flows affect earnings. The Swap Agreement hedged the monthly interest payments incurred and paid under the Lombard Loan Agreement during the three year period beginning January 1, 2009 and ending December 31, 2011. At settlement, the market value of the interest rate swap was a non-current liability of £2.0 million, or approximately $3.2 million. We recognized a loss on settlement of £2.0 million, or approximately $3.1 million.
Interest rate cap. On September 30, 2010, as required by the Term Loan, we entered into an interest rate cap hedge agreement, or the Cap Agreement, with Bank of America, N.A., or BOA. The Cap Agreement caps the three month Eurodollar interest rate paid to BOA on a beginning notional principal amount of $155.0 million of Term Loan outstanding. During the three year period beginning October 4, 2010 and ending October 3, 2013, the notional amount of the Cap Agreement declines by the 0.25% quarterly principal amortization of the Term Loan as it applies to the original notional principal amount. The Cap Agreement effectively caps the interest rates paid to BOA on the then outstanding capped notional principal amount of the Term Loan at 3.0% during year one, 3.5% during year two and 4.0% during year three. The fair value of the Cap Agreement was $0.5 million at December 31, 2010.
For further information on our long-term debt and related derivatives, please refer to Notes 9 and 10, respectively, of Notes to the Financial Statements located in this Annual Report on Form 10-K.
Debt Covenants
Under the terms of our Term Loan and Revolver agreements, we are required to comply with certain financial covenant ratios consisting of quarterly covenants for maximum total leverage and minimum fixed charge coverage ratios and annual maximum capital expenditures. As of December 31, 2010, we were in compliance with all such financial covenants.
The provisions of our debt agreements contain covenants including, but not limited to, restricting or limiting our ability to incur more debt, issue guarantees, pay dividends, make capital expenditures, and repurchase stock (subject to financial measures and other conditions). We were in compliance with all such covenants as of and during the year ended December 31, 2010, and anticipate compliance with all covenants for at least the next twelve months. However, the ability to comply with these provisions may be affected by events beyond our control. The breach of any of these covenants could result in a default under our debt agreements and could trigger cross defaults and acceleration of repayment obligations.
Commitments and Contingencies
Our client contracts generally span multiple periods, which result in us entering into arrangements with various suppliers of communications services that require us to maintain minimum spending levels, some of which increase over time, to secure favorable pricing terms. Our remaining aggregate minimum spending levels, allocated ratably over the terms of such contracts, are $41.8 million, $13.9 million, $9.7 million, $8.3 million, $8.3 million, and $43.7 million during the years ended December 31, 2011, 2012, 2013, 2014, 2015 and thereafter, respectively. Should we not meet the minimum spending levels in any given term, decreasing termination liabilities, representing a percentage of the remaining contractual amounts, may become immediately due and payable. Furthermore, certain of these termination liabilities are potentially subject to reduction should we experience the loss of a major client or suffer a loss of revenue from a general economic downturn. Before considering the effects of any potential reductions for the business downturn provisions, if we had terminated all of these agreements as of December 31, 2010, the maximum liability would have been $125.7 million. To mitigate this exposure, at times, we align our minimum spending commitments with client revenue commitments for related services.
We are subject to various legal proceedings and actions arising in the normal course of our business. While the results of all such proceedings and actions cannot be predicted, management believes, based on facts known to management today, that the ultimate outcome of all such proceedings and actions will not have a material adverse effect on our consolidated financial position, results of operation or cash flows.
36
Table of Contents
We have employment, confidentiality, severance and non-competition agreements with key executive officers that contain provisions with regard to base salary, bonus, equity-based compensation and other employee benefits. These agreements also provide for severance benefits in the event of employment termination or a change in control.
The following table presents our known undiscounted contractual obligations as of December 31, 2010 (dollars in thousands):
| Payments Due by Period | ||||||||||||||||||||
| Total | Less Than 1 Year |
1 - 3 Years |
3 - 5 Years |
More Than 5 Years |
||||||||||||||||
| Long-term debt obligations (1) |
$ | 776,837 | $ | 43,074 | $ | 88,154 | $ | 86,814 | $ | 558,795 | ||||||||||
| Capital (finance) lease obligations (2) |
369,966 | 41,814 | 77,669 | 75,478 | 175,005 | |||||||||||||||
| Operating lease obligations |
590,902 | 74,418 | 129,221 | 89,751 | 297,512 | |||||||||||||||
| Purchase obligations |
159,127 | 60,204 | 38,758 | 16,511 | 43,654 | |||||||||||||||
| Asset retirement obligations |
37,617 | 1,247 | 7,880 | 8,206 | 20,284 | |||||||||||||||
| Total contractual obligations |
$ | 1,934,449 | $ | 220,757 | $ | 341,682 | $ | 276,760 | $ | 1,095,250 | ||||||||||
| (1) | Includes interest payments of $225.1 million over the remaining term of the debt. |
| (2) | Includes interest payments of $132.8 million over the remaining term of our capital lease obligations and $61.5 million which represents interest payments over the remaining term of our financing method lease obligation. |
Off-Balance-Sheet Arrangements
As of December 31, 2010, we did not have any significant off-balance-sheet arrangements, as defined in Item 303(a)(4)(ii) of United States Securities and Exchange Regulation S-K. In the normal course of business, we are a party to certain guarantees and financial instruments with off-balance sheet risk as they are not reflected in our consolidated balance sheets, such as letters of credit, indemnifications, and operating leases under which certain facilities are leased. The agreements associated with such guarantees and financial instruments mature at various dates through January 2031, and may be renewed as circumstances warrant. As of December 31, 2010, we had $15.9 million in letters of credit outstanding, pledged as collateral to support certain facility leases and utility agreements. Also, in connection with the 2007 sale of our assets related to content delivery network services, we agreed to indemnify the purchaser should it incur certain losses due to a breach of our representations and warranties. We have not incurred a liability relating to these indemnification provisions in the past, and we believe that the likelihood of any future payout relating to these provisions is remote. Therefore, we have not recorded a liability during any period related to these indemnification provisions.
Our guarantees and financial instruments are valued based on the estimated amount of exposure and the likelihood of performance being required. Based on our past experience, no claims have been made against these guarantees and financial instruments nor do we expect exposure to material losses resulting therefrom. As a result, we determined such guarantees and financial instruments did not have significant value and have not recorded any related amounts in our consolidated financial statements.
CRITICAL ACCOUNTING ESTIMATES
We have identified the accounting policies below as critical to our business operations and to the understanding of our consolidated financial position and results of operations. For a detailed description on the application of these and other accounting policies, see Note 2 in the Notes to the Consolidated Financial Statements included in this Annual Report on Form 10-K. Note that our preparation of this Annual Report requires us to make estimates and assumptions that affect the reported amounts of assets and liabilities, disclosure of contingent assets and liabilities at the date of our financial statements, and the reported amounts of revenue and expenses during the reporting period. There can be no assurance that actual results will not differ from those estimates.
Revenue Recognition
We derive the majority of our revenue from recurring revenue streams, consisting primarily of hosting services, which includes managed hosting and colocation, and network services. We recognize revenue from those services as services are provided. Installation fees and related costs are deferred and recognized ratably over the life of the client contract. Fees for migration services are recognized as those services are performed. Termination fees are recognized when received. Revenue is recognized when the related service has been provided, there is persuasive evidence of an arrangement, the fee is fixed or determinable, and collection is reasonably assured.
37
Table of Contents
In addition, we have service level commitments pursuant to individual client contracts with a majority of our clients. To the extent that such service levels are not achieved, or are otherwise disputed due to performance or service issues, unfavorable weather or other service interruptions or conditions, we estimate the amount of credits to be issued and record a reduction to revenue, with a corresponding increase in the allowance for credits and uncollectibles. In the event that we provide credits or payments to clients related to service level claims, we may request recovery of such costs through third party insurance agreements. Insurance proceeds received under these agreements are recorded as an offset to previously recorded revenue reductions.
Allowance for Credits and Uncollectibles
As previously described herein, we have service level commitments with certain of our clients. To the extent that such service levels are not achieved, we estimate the amount of credits to be issued, based on historical credits issued and known disputes, and record a reduction to revenue, with a corresponding increase in the allowance for credits and uncollectibles.
We assess collectibility of account receivables based on a number of factors, including client payment history and creditworthiness. We generally do not request collateral from our clients although in certain cases we may obtain a security deposit. We maintain an allowance for uncollectibles when evaluating the adequacy of allowances, and we specifically analyze accounts receivable, current economic conditions and trends, historical bad debt write-offs, client concentrations, client payment history and creditworthiness and changes in client payment terms. Delinquent account balances are charged to expense after we have determined that the likelihood of collection is not probable.
Equity-Based Compensation
We calculate the fair value of total equity-based compensation for stock options and restricted preferred units using the Black-Scholes option pricing model, which utilizes certain assumptions and estimates that have a material impact on the amount of total compensation cost recognized in our consolidated financial statements. Total equity-based compensation costs for restricted stock units and restricted stock awards are calculated based on the market value of our common stock on the date of grant. An additional assumption is made on the number of awards expected to forfeit prior to vesting, which decreases the amount of total expense recognized. This assumption is evaluated and the estimate is revised on a quarterly or as needed basis. Total equity-based compensation is amortized to non-cash equity-based compensation expense over the vesting or performance period of the award, as applicable, which typically ranges from three to four years.
Other Critical Accounting Policies
While all of the significant accounting policies described in the Notes to the Consolidated Financial Statements are important, some of these policies may be viewed as being critical. Such policies are those that are most important to the portrayal of our financial condition and require our most difficult, subjective or complex estimates and assumptions that affect the reported amounts of assets and liabilities and the disclosure of contingent assets and liabilities at the date of our consolidated financial statements and the reported amounts of revenues and expenses during the reporting period. We base our estimates and assumptions on historical experience and various other factors that we believe to be reasonable under the circumstances. Actual results could differ from these estimates and assumptions. For further information regarding the application of these and other accounting policies, see Note 2 of Notes to Consolidated Financial Statements included in this Annual Report on Form 10-K.
For information on recently adopted and recently issued accounting pronouncements, please refer to Note 3 of Notes to the Financial Statements included in this Annual Report on Form 10-K.
ITEM 7A. QUANTITATIVE AND QUALITATIVE DISCLOSURES ABOUT MARKET RISK.
Interest Rate Risk
As of December 31, 2010, we had $548.6 million outstanding variable rate debt on our term loan, with an interest rate payable as of December 31, 2010 of Eurodollar floor plus margin of 6.75%. The Company entered into an interest rate cap agreement on September 30, 2010 to cap the interest on a portion of our term loan between 3.0% and 4.0% during the three year agreement. There was 3% original issue discount on the term loan, which is accreted over the life of the loan and recognized as interest expense. The carrying value of the term loan as of December 31, 2010 was $533.3 million. The remainder of our outstanding debt was fixed rate debt and was comprised of our convertible notes. The convertible notes bear cash interest on the $3.1 million principal at 3% per annum, and an additional 5.36% of interest expense is recognized as accretion of the discounted portion of the convertible notes. As of December 31, 2010, the carrying amount of the convertible notes was $2.9 million.
38
Table of Contents
Foreign Currency Exchange Rate Risk
We are subject to market risks arising from foreign currency exchange rates. We generally engage in foreign currency forwards hedging transactions to mitigate our foreign exchange risk. Our percentage of revenue generated and costs incurred that are denominated in currencies other than the U.S. Dollar is presented in the following table:
| Years Ended December 31, | ||||||||||||
| 2010 | 2009 | 2008 | ||||||||||
| Service revenue denominated in currencies other than the U.S. Dollar |
20 | % | 16 | % | 10 | % | ||||||
| Direct and operating costs incurred in currencies other than the U.S. Dollar (1) |
27 | % | 18 | % | 17 | % | ||||||
| (1) | Excludes depreciation, amortization and accretion, and non-cash equity-based compensation. |
We have performed a sensitivity analysis as of December 31, 2010, that measures the change in the financial position arising from a hypothetical 10% adverse movement in the exchange rates of the Euro, the British Pound, the Canadian Dollar, the Japanese Yen and the Singapore Dollar, our most widely used foreign currencies, relative to the U.S. Dollar with all variables held constant. The aggregate potential change in fair value resulting from a hypothetical 10% change in the above currencies was $4.2 million as of December 31, 2010 and $2.4 million as of December 31, 2009. A gain or loss in fair value associated with these currencies is generally recorded as an unrealized gain or loss on foreign currency translation within accumulated other comprehensive loss in stockholders’ equity of the accompanying consolidated balance sheets.
ITEM 8. FINANCIAL STATEMENTS AND SUPPLEMENTARY DATA.
The consolidated financial statements for the years ended December 31, 2010, 2009 and 2008 and as of December 31, 2010 and 2009 and related notes thereto required by this item begin on page 52 as listed in Item 15. of Part IV of this Annual Report on Form 10-K.
ITEM 9. CHANGES IN AND DISAGREEMENTS WITH ACCOUNTANTS ON ACCOUNTING AND FINANCIAL DISCLOSURE.
We had no disagreements on accounting or financial disclosure matters with our independent registered public accounting firm to report under this Item 9.
ITEM 9A. CONTROLS AND PROCEDURES.
Evaluation of Disclosure Controls and Procedures
We conducted an evaluation, under the supervision and with the participation of management, including the Chief Executive Officer (CEO) and Chief Financial Officer (CFO), of the effectiveness of the design and operation of our disclosure controls and procedures (as defined in Rules 13a-15(e) and 15d-15(e) under the Securities Exchange Act of 1934, as amended, (the Exchange Act)) as of the end of the period covered by this report. Based on management’s evaluation as of the end of the period covered by this report, our CEO and CFO have concluded that our disclosure controls and procedures were effective to provide reasonable assurance that information required to be disclosed by us in reports that we file or submit under the Exchange Act is recorded, processed, summarized and reported within the time periods specified in United States Securities and Exchange Commission rules and forms.
Changes in Internal Control over Financial Reporting
In September 2010, we implemented a new billing system for our global operations. As a result, we have updated our internal controls as necessary to accommodate the modifications to our business processes and accounting procedures. There have not been any other significant changes in our internal control over financial reporting (as defined in Rules 13a-15(f) and 15d-15(f) of the Exchange Act) during the period covered by this report that materially affected, or are reasonably likely to materially affect, our internal control over financial reporting.
39
Table of Contents
Management’s Report on Internal Control over Financial Reporting
Our management is responsible for establishing and maintaining adequate internal control over financial reporting, as such term is defined in Rule 13a-15(f) of the Exchange Act. Under the supervision and with the participation of our management, including our CEO and CFO, we conducted an evaluation of the effectiveness of our internal control over financial reporting based on the framework in Internal Control – Integrated Framework issued by the Committee of Sponsoring Organizations of the Treadway Commission.
Based on our evaluation under the framework in Internal Control – Integrated Framework, our management concluded that our internal control over financial reporting was effective as of December 31, 2010.
The effectiveness of our internal control over financial reporting as of December 31, 2010 has been audited by Ernst & Young LLP, an independent registered public accounting firm, as stated in their report which is included on page 41.
40
Table of Contents
Report of Independent Registered Public Accounting Firm
The Board of Directors and Stockholders of SAVVIS, Inc.
We have audited SAVVIS, Inc.’s internal control over financial reporting as of December 31, 2010, based on criteria established in Internal Control - Integrated Framework issued by the Committee of Sponsoring Organizations of the Treadway Commission (the COSO criteria). SAVVIS, Inc.’s management is responsible for maintaining effective internal control over financial reporting, and for its assessment of the effectiveness of internal control over financial reporting included in the accompanying Management’s Report on Internal Control Over Financial Reporting. Our responsibility is to express an opinion on the Company’s internal control over financial reporting based on our audit.
We conducted our audit in accordance with the standards of the Public Company Accounting Oversight Board (United States). Those standards require that we plan and perform the audit to obtain reasonable assurance about whether effective internal control over financial reporting was maintained in all material respects. Our audit included obtaining an understanding of internal control over financial reporting, assessing the risk that a material weakness exists, testing and evaluating the design and operating effectiveness of internal control based on the assessed risk, and performing such other procedures as we considered necessary in the circumstances. We believe that our audit provides a reasonable basis for our opinion.
A company’s internal control over financial reporting is a process designed to provide reasonable assurance regarding the reliability of financial reporting and the preparation of financial statements for external purposes in accordance with generally accepted accounting principles. A company’s internal control over financial reporting includes those policies and procedures that (1) pertain to the maintenance of records that, in reasonable detail, accurately and fairly reflect the transactions and dispositions of the assets of the company; (2) provide reasonable assurance that transactions are recorded as necessary to permit preparation of financial statements in accordance with generally accepted accounting principles, and that receipts and expenditures of the company are being made only in accordance with authorizations of management and directors of the company; and (3) provide reasonable assurance regarding prevention or timely detection of unauthorized acquisition, use, or disposition of the company’s assets that could have a material effect on the financial statements.
Because of its inherent limitations, internal control over financial reporting may not prevent or detect misstatements. Also, projections of any evaluation of effectiveness to future periods are subject to the risk that controls may become inadequate because of changes in conditions, or that the degree of compliance with the policies or procedures may deteriorate.
In our opinion, SAVVIS, Inc. maintained, in all material respects, effective internal control over financial reporting as of December 31, 2010, based on the COSO criteria.
We also have audited, in accordance with the standards of the Public Company Accounting Oversight Board (United States), the consolidated balance sheets of SAVVIS, Inc. and subsidiaries as of December 31, 2010 and 2009, and the related consolidated statements of operations, changes in stockholders’ equity, and cash flows for each of the three years in the period ended December 31, 2010 and our report dated March 4, 2011 expressed an unqualified opinion thereon.
| /s/ Ernst & Young LLP |
| St. Louis, Missouri |
| March 4, 2011 |
41
Table of Contents
No reportable information.
PART III
The information required by Item 10. (Directors, Executive Officers and Corporate Governance), Item 11. (Executive Compensation), Item 12. (Security Ownership of Certain Beneficial Owners and Management and Related Stockholder Matters), Item 13. (Certain Relationships and Related Transactions, and Director Independence) and Item 14. (Principal Accounting Fees and Services) of Form 10-K, unless disclosed in this Part III, will be included in our Proxy Statement for the 2011 Annual Meeting of Stockholders, which will be filed within 120 days after the close of the fiscal year ended December 31, 2010, and such information is incorporated herein by reference.
We have a Code of Conduct (the Code) applicable to all of our employees, officers and directors, including, without limitation, the Chief Executive Officer, the Chief Financial Officer and other senior financial officers. The Code may be found in the ‘Investors’ section of our website at www.savvis.net.
PART IV
ITEM 15. EXHIBITS, FINANCIAL STATEMENT SCHEDULES.
(a) The following documents are filed as a part of this report:
| 1. | Financial Statements |
| 2. | Financial Statement Schedules |
The financial statement schedule is included below. All other schedules have been omitted because they are not applicable, not required, or the information is included in the financial statements or notes thereto.
SCHEDULE II - VALUATION AND QUALIFYING ACCOUNTS
The following table presents valuation and qualifying accounts for the years ended December 31, 2010, 2009 and 2008 (in thousands):
| Description |
Balance at Beginning of Period |
Additions Charged to Costs and Expenses (1) |
Deductions | Balance at End of Period |
||||||||||||
| Allowance for Credits and Uncollectibles: |
||||||||||||||||
| Year ended December 31, 2010 |
$ | 8,133 | $ | 19,813 | $ | (18,356 | ) | $ | 9,590 | |||||||
| Year ended December 31, 2009 |
7,947 | 14,554 | (14,368 | ) | 8,133 | |||||||||||
| Year ended December 31, 2008 |
5,060 | 22,361 | (19,474 | ) | 7,947 | |||||||||||
| (1) | Includes bad debt provisions, an increase to sales, general, and administrative expense, and allowance for sales credits, a reduction of revenue. Pursuant to certain of our individual client contracts, we have service level commitments with certain of our clients. To the extent that such service levels are not achieved, or are otherwise disputed due to third party power or service issues or other service interruptions or conditions, we estimate the amount of credits to be issued and record a reduction to revenue, with a corresponding increase in the allowance for credits and uncollectibles. |
42
Table of Contents
| 3. | Exhibits |
The following exhibits are either provided with this Form 10-K or are incorporated herein by reference.
| Exhibit | Filed with the |
Incorporated by Reference | ||||||||
| Index |
Exhibit Description |
Form |
Form |
Filing Date with the SEC |
Exhibit Number | |||||
| 2.1 | Agreement and Plan of Merger dated May 28, 2010 by and among Fusepoint, Inc., Savvis, Inc., Blue Jay Merger Sub, Inc., and M/C Venture Partners V, L.P., as Stockholders’ Representative | 8-K | June 1, 2010 | 2.1 | ||||||
| 3.1 | Amended and Restated Certificate of Incorporation of the Registrant | S-1 | November 12, 1999 | 3.1 | ||||||
| 3.2 | Certificate of Amendment to Amended and Restated Certificate of Incorporation of the Registrant | S-1/A | January 31, 2000 | 3.2 | ||||||
| 3.3 | Certificate of Amendment to Amended and Restated Certificate of Incorporation of the Registrant | 10-Q | August 14, 2002 | 3.3 | ||||||
| 3.4 | Certificate of Amendment to Amended and Restated Certificate of Incorporation of the Registrant | 10-Q | August 13, 2004 | 3.4 | ||||||
| 3.5 | Certificate of Amendment to Amended and Restated Certificate of Incorporation of the Registrant | 10-Q | August 5, 2005 | 3.5 | ||||||
| 3.6 | Certificate of Amendment to Amended and Restated Certificate of Incorporation of the Registrant | 8-K | June 7, 2006 | 3.1 | ||||||
| 3.7 | Amended and Restated Bylaws of the Registrant | 10-Q | August 1, 2008 | 3.3 | ||||||
| 4.1 | Form of Common Stock Certificate | S-1/A | January 31, 2000 | 4.1 | ||||||
| 4.2 | Indenture, dated as of May 9, 2007, between Registrant and The Bank of New York, as trustee, including the Form of Global Note attached as Exhibit A thereto | 8-K | May 10, 2007 | 4.1 | ||||||
| 10.1* | 1999 Stock Option Plan, as amended | 10-K | April 17, 2001 | 10.1 | ||||||
| 10.2* | Amendment No. 1 to 1999 Stock Option Plan | 10-Q | August 14, 2002 | 10.1 | ||||||
| 10.3* | Amendment No. 2 to 1999 Stock Option Plan | 10-Q | August 14, 2002 | 10.2 | ||||||
| 10.4* | Amendment No. 3 to 1999 Stock Option Plan | 10-Q | August 14, 2002 | 10.3 | ||||||
| 10.5* | Amended and Restated 2003 Incentive Compensation Plan | 10-Q | May 5, 2006 | 10.4 | ||||||
| 10.6* | Amendment No. 1 to Amended and Restated 2003 Incentive Compensation Plan | 10-K | February 26, 2007 | 10.6 | ||||||
| 10.7* | Amendment No. 2 to Amended and Restated 2003 Incentive Compensation Plan | 8-K | May 15, 2007 | 10.1 | ||||||
| 10.8* | Amendment No. 3 to Amended and Restated 2003 Incentive Compensation Plan | 10-Q | July 31, 2007 | 10.3 | ||||||
| 10.9* | Amendment No. 4 to Amended and Restated 2003 Incentive Compensation Plan | 8-K | May 22, 2009 | 10.1 | ||||||
| 10.10* | Amendment No. 5 to Amended and Restated 2003 Incentive Compensation Plan | 8-K | May 22, 2009 | 10.2 | ||||||
| 10.11* | Amended and Restated Employee Stock Purchase Plan | 8-K | August 1, 2008 | 10.1 | ||||||
| 10.12* | Form of Incentive Stock Option Agreement under the 1999 Stock Option Plan | S-1/A | December 30, 1999 | 10.2 | ||||||
| 10.13* | Form of Non-Qualified Stock Option Agreement under the 1999 Stock Option Plan | 10-K | February 28, 2003 | 10.7 | ||||||
| 10.14* | Form of Non-Qualified Stock Option Agreement under the 2003 Incentive Compensation Plan | 10-Q | October 30, 2003 | 10.1 | ||||||
| 10.15* | Form of Stock Unit Agreement under the 2003 Incentive Compensation Plan | 8-K | August 23, 2005 | 10.1 | ||||||
| 10.16* | Form of Restricted Stock Agreement under the 2003 Incentive Compensation Plan | 10-K | February 28, 2006 | 10.12 | ||||||
| 10.17* | Form of Restricted Stock Agreement under the 2003 Incentive Compensation Plan for November 2009 performance-based equity awards | 10-K | March 5, 2010 | 10.17 | ||||||
| 10.18* | 2011 Annual Incentive Plan under the 2003 Incentive Compensation Plan | X | ||||||||
| 10.19* | Form of Employment, Confidentiality, Severance and Non-Competition Agreement for use after August 3, 2010 | 10-Q | November 5, 2010 | 10.3 | ||||||
43
Table of Contents
| 10.20* |
Form of Indemnification Agreement with Directors and Executive Officers | 10-Q | November 5, 2010 | 10.4 | ||||||
| 10.21* |
Employment Agreement dated March 10, 2010, between the Registrant and James E. Ousley. | 10-Q | May 6, 2010 | 10.1 | ||||||
| 10.22* |
Employment, Confidentiality, Severance and Non-Competition Agreement dated August 31, 2010 between the Registrant and James E. Ousley | 8-K | September 3, 2010 | 10.1 | ||||||
| 10.23* |
Employment Agreement dated March 13, 2006, between the Registrant and Philip J. Koen. | 10-Q | May 5, 2006 | 10.2 | ||||||
| 10.24* |
First Amendment to Employment Agreement dated as of August 31, 2006, between the Registrant and Philip J. Koen. | 10-Q | November 1, 2006 | 10.1 | ||||||
| 10.25* |
Second Amendment to Employment Agreement dated as of December 19, 2008, between the Registrant and Philip J. Koen | 10-K | February 27, 2009 | 10.18 | ||||||
| 10.26* |
Separation and General Release Agreement executed January 7, 2010, between the Registrant and Philip J. Koen | 8-K | January 13, 2010 | 10.1 | ||||||
| 10.27* |
Employment, Confidentiality, Severance and Non-Competition Agreement dated March 30, 2009, between the Registrant and Gregory W. Freiberg | 8-K | April 2, 2009 | 10.1 | ||||||
| 10.28* |
Letter Agreement, dated February 25, 2010, between the Registrant and Gregory W. Freiberg. | 8-K | March 3, 2010 | 10.1 | ||||||
| 10.29* |
Employment Agreement dated October 1, 2006, between the Registrant and Jeffrey H. Von Deylen | 8-K | September 29, 2006 | 10.1 | ||||||
| 10.30* |
First Amendment to Employment Agreement dated December 4, 2008 between the Registrant and Jeffrey H. Von Deylen | 10-K | February 27, 2009 | 10.23 | ||||||
| 10.31* |
Letter Agreement dated February 10, 2009 between the Registrant and Jeffrey H. Von Deylen | 10-K | February 27, 2009 | 10.24 | ||||||
| 10.32* |
Employment, Confidentiality, Severance and Non-Competition Agreement dated September 5, 2006 between the Registrant and Bryan Doerr | 10-K | February 27, 2009 | 10.30 | ||||||
| 10.33* |
First Amendment to Employment, Confidentiality, Severance and Non-Competition Agreement dated December 19, 2008 between the Registrant and Bryan Doerr | 10-K | February 27, 2009 | 10.31 | ||||||
| 10.34* |
Employment, Confidentiality, Severance and Non-Competition Agreement dated March 13, 2007 between the Registrant and William Fathers | 10-K | February 27, 2009 | 10.32 | ||||||
| 10.35* |
First Amendment to Employment, Confidentiality, Severance and Non-Competition Agreement dated December 19, 2008 between the Registrant and William Fathers | 10-K | February 27, 2009 | 10.33 | ||||||
| 10.36* |
Employment, Confidentiality, Severance and Non-Competition Agreement dated October 8, 2007 between the Registrant and Paul Goetz | 10-K | February 27, 2009 | 10.34 | ||||||
| 10.37* |
First Amendment to Employment, Confidentiality, Severance and Non-Competition Agreement dated December 19, 2008 between the Registrant and Paul Goetz | 10-K | February 27, 2009 | 10.35 | ||||||
| 10.38* |
Separation and General Release Agreement dated October 27, 2009 between the Registrant and Paul Goetz | 10-K | March 5, 2010 | 10.33 | ||||||
| 10.39* |
Employment, Confidentiality, Severance and Non-Competition Agreement dated January 9, 2009, between the Registrant and Thomas T. Riley | 10-K | March 5, 2010 | 10.34 | ||||||
| 10.40* |
Separation and General Release Agreement dated January 20, 2011 between the Registrant and Thomas T. Riley | 8-K | January 20, 2011 | 10.1 | ||||||
| 10.41* |
Form of Employment, Confidentiality, Severance and Non-Competition Agreement, for use prior to August 3, 2010. | 10-Q | November 1, 2006 | 10.3 | ||||||
| 10.42 |
Security Agreement dated June 10, 2005, by and among SAVVIS, the grantor parties thereto, and Wells Fargo Capital Finance, as the administrative agent for the lender parties | 8-K | June 16, 2005 | 10.2 | ||||||
| 10.43 |
Guaranty Agreement dated June 10, 2005, by and among SAVVIS, the grantor parties thereto, and Wells Fargo Capital Finance, as the administrative agent for the lender parties. | 8-K | June 16, 2005 | 10.3 | ||||||
| 10.44 |
Trademark Security Agreement dated June 10, 2005, by and among SAVVIS, the grantor parties thereto, and Wells Fargo Capital Finance, as the administrative agent for the lender parties | 8-K | June 16, 2005 | 10.4 | ||||||
44
Table of Contents
| 10.45 |
Patent Security Agreement dated June 10, 2005, by and among SAVVIS, the grantor parties thereto, and Wells Fargo Capital Finance, as the administrative agent for the lender parties | 8-K | June 16, 2005 | 10.5 | ||||||
| 10.46+ |
Amended and Restated Credit Agreement, dated December 8, 2008, by and among SAVVIS Communications Corporation, a Missouri corporation, Registrant, the lenders that are signatories thereto and Wells Fargo Capital Finance, as the arranger and the administrative agent for the Lenders | 8-K | December 8, 2008 | 10.1 | ||||||
| 10.47 |
Amendment No. 1 to the Amended and Restated Credit Agreement, dated December 12, 2008, by and among SAVVIS Communications Corporation, a Missouri corporation, Registrant, the lenders that are signatories thereto and Wells Fargo Capital Finance, as the arranger and the administrative agent for the Lenders | 10-K | February 27, 2009 | 10.55 | ||||||
| 10.48 |
Amendment No. 2 to the Amended and Restated Credit Agreement, dated February 26, 2009, by and among SAVVIS Communications Corporation, a Missouri Corporation, Registrant, the lenders that are signatories thereto and Wells Fargo Capital Finance, as the arranger and the administrative agent for the Lenders | 10-Q | August 6, 2009 | 10.1 | ||||||
| 10.49 |
Amendment No. 3 to the Amended and Restated Credit Agreement, dated April 30, 2009, by and among SAVVIS Communications Corporation, a Missouri Corporation, Registrant, the lenders that are signatories thereto and Wells Fargo Capital Finance, as the arranger and the administrative agent for the Lenders | 10-Q | August 6, 2009 | 10.2 | ||||||
| 10.50 |
Amendment No. 4 to the Amended and Restated Credit Agreement, dated December 23, 2009, by and among SAVVIS Communications Corporation, a Missouri Corporation, Registrant, the lenders that are signatories thereto and Wells Fargo Capital Finance, as the arranger and the administrative agent for the Lenders | 10-K | March 5, 2010 | 10.44 | ||||||
| 10.51 |
Amendment No. 5 to the Amended and Restated Credit Agreement, dated January 29, 2010, by and among SAVVIS Communications Corporation, a Missouri Corporation, Registrant, the lenders that are signatories thereto and Wells Fargo Capital Finance, as the arranger and the administrative agent for the Lenders | 10-Q | August 5, 2010 | 10.4 | ||||||
| 10.52 |
Amendment No. 6 to the Amended and Restated Credit Agreement, dated March 31, 2010, by and among SAVVIS Communications Corporation, a Missouri Corporation, Registrant, the lenders that are signatories thereto and Wells Fargo Capital Finance, as the arranger and the administrative agent for the Lenders | 10-Q | August 5, 2010 | 10.5 | ||||||
| 10.53 |
Amendment No. 7 to the Amended and Restated Credit Agreement, dated May 28, 2010, by and among SAVVIS Communications Corporation, a Missouri Corporation, Registrant, the lenders that are signatories thereto and Wells Fargo Capital Finance, as the arranger and the administrative agent for the Lenders | 8-K | June 1, 2010 | 10.1 | ||||||
| 10.54 |
Amendment No. 8 to the Amended and Restated Credit Agreement, dated June 16, 2010, by and among SAVVIS Communications Corporation, a Missouri Corporation, Registrant, the lenders that are signatories thereto and Wells Fargo Capital Finance, as the arranger and the administrative agent for the Lenders | 8-K | June 17, 2010 | 10.1 | ||||||
| 10.55 |
Charge of Shares in SAVVIS UK Limited, dated December 8, 2008, by and between the Registrant and Wells Fargo Capital Finance | 8-K | December 8, 2008 | 10.2 | ||||||
| 10.56 |
Trademark Security Agreement, dated as of December 8, 2008, among certain grantors listed on the signature pages thereto and Wells Fargo Capital Finance Capital Finance | 8-K | December 8, 2008 | 10.3 | ||||||
45
Table of Contents
| 10.57 | First Amendment to Trademark Security Agreement, dated as of December 8, 2008, by and between the Borrower and Wells Fargo Capital Finance | 8-K | December 8, 2008 | 10.4 | ||||
| 10.58 | Supplement No. 1 to the Security Agreement, dated June 16, 2010, by and among the grantor parties thereto, and Wells Fargo Capital Finance, as the administrative agent for the lender parties | 8-K | June 17, 2010 | 10.2 | ||||
| 10.59 | Guarantor Joinder Agreement, dated June 16, 2010, by and among Blue Jay Merger Sub, Inc., the loan parties to the Amended and Restated Credit Agreement, and Wells Fargo Capital Finance, as administrative agent for the lender parties | 8-K | June 17, 2010 | 10.3 | ||||
| 10.60 | Patent Security Agreement, dated as of December 8, 2008, among certain grantors listed on the signature pages thereto and Wells Fargo Capital Finance | 8-K | December 8, 2008 | 10.6 | ||||
| 10.61 | First Amendment to Patent Security Agreement, dated as of December 8, 2008, by and between the Borrower and Wells Fargo Capital Finance | 8-K | December 8, 2008 | 10.5 | ||||
| 10.62 | Loan and Security Agreement dated December 18, 2006, by and between SAVVIS and Cisco Systems Capital Corporation | 8-K | December 20, 2006 | 10.1 | ||||
| 10.63 | First Amendment to Loan and Security Agreement dated July 31, 2007, by and between SAVVIS and Cisco Systems Capital Corporation | 10-Q | October 31, 2007 | 10.2 | ||||
| 10.64 | Second Amendment to Loan and Security Agreement dated December 21, 2007, by and between SAVVIS and Cisco Systems Capital Corporation | 10-K | February 26, 2008 | 10.38 | ||||
| 10.65 | Guaranty Agreement dated December 18, 2006, by and between the Registrant and Cisco Systems Capital Corporation | 8-K | December 20, 2006 | 10.2 | ||||
| 10.66 | Facility Agreement dated June 27, 2008, by and among SAVVIS UK Limited, Registrant, and Lombard North Central Plc | 8-K | July 2, 2008 | 10.1 | ||||
| 10.67 | Asset Security Agreement dated June 27, 2008, by and among SAVVIS UK Limited, Registrant, a Delaware corporation, and Lombard North Central Plc | 8-K | July 2, 2008 | 10.2 | ||||
| 10.68 | Deed of Guarantee, Priority and Acknowledgement dated October 31, 2008, by and among Lombard North Central Plc, SAVVIS UK Limited, Registrant, SAVVIS Communications Corporation and National Westminster Bank Plc | 10-Q | November 3, 2008 | 10.4 | ||||
| 10.69 | Asset Security Agreement dated October 31, 2008, by and among SAVVIS UK Limited, Registrant and National Westminster Bank Plc | 10-Q | November 3, 2008 | 10.5 | ||||
| 10.70 | Credit Agreement dated August 4, 2010 by and among SAVVIS Communications Corporation, SAVVIS, Inc., each lender from time to time party thereto, and Bank of America, N.A., as Administrative Agent, Swing Line Lender and L/C Issuer | 8-K | August 11, 2010 | 10.1 | ||||
| 10.71 | Investor Rights Agreement, dated as of March 6, 2002, among the registrant, Welsh, Carson, Anderson & Stowe VIII, L.P., the various entities and individuals affiliated with Welsh, Carson, Anderson & Stowe VIII, L.P. listed on the signature pages thereto, Reuters Holdings Switzerland SA and the other Investors (as defined therein) | 8-K | March 27, 2002 | 10.2 | ||||
| 10.72 | Amendment No. 1, dated June 28, 2002, to the Investor Rights Agreement, dated as of March 6, 2002, among the registrant, Welsh, Carson, Anderson & Stowe VIII, L.P., the various entities and individuals affiliated with Welsh, Carson, Anderson & Stowe VIII, L.P. listed on the signature pages thereto, Reuters Holdings Switzerland SA and the Other Investors (as defined therein) | 8-K | July 8, 2002 | 10.2 | ||||
| 10.73 | Amendment No. 2, dated as of May 10, 2006, to the Investors Rights Agreement, among the Registrant, Welsh, Carson, Andersen & Stowe VIII, L.P., and the other investors named therein | 8-K | July 5, 2006 | 10.1 | ||||
46
Table of Contents
| 10.74 | Lease Agreement, dated as of May 24, 2002, by and between Duke Realty Limited Partnership and SAVVIS | 10-Q | August 14, 2002 | 10.6 | ||||
| 10.75 | Office Lease between WGP Associates, LLC and SAVVIS | 10-K | March 30, 2000 | 10.27 | ||||
| 10.76+ | Lease Agreement, dated as of March 5, 2004, between SAVVIS Asset Holdings, Inc. and Meerkat SC Office LLC | 10-Q | November 15, 2004 | 10.2 | ||||
| 10.77+ | Lease Agreement, dated as of March 5, 2004, between SAVVIS Asset Holdings, Inc. and Meerkat LA1 LLC | 10-Q | November 15, 2004 | 10.3 | ||||
| 10.78+ | Lease Agreement, dated as of March 5, 2004, between SAVVIS Asset Holdings, Inc. and Meerkat SC4 LLC | 10-Q | November 15, 2004 | 10.4 | ||||
| 10.79+ | Lease Agreement, dated as of March 5, 2004, between SAVVIS Asset Holdings, Inc. and Meerkat SC5 LLC. | 10-Q | November 15, 2004 | 10.5 | ||||
| 10.80+ | Lease Agreement, dated as of March 5, 2004, between SAVVIS Asset Holdings, Inc. and Meerkat SC8 LLC | 10-Q | November 15, 2004 | 10.6 | ||||
| 10.81+ | Amended and Restated Lease Agreement dated June 30, 2006, between SAVVIS and Digital Centreport, L.P. | 10-Q | July 31, 2006 | 10.5 | ||||
| 10.82 | Data Center Lease dated December 21, 2006, by and between SAVVIS and Digital Piscataway, LLC | 8-K | December 28, 2006 | 10.1 | ||||
| 10.83+ | Cost Sharing and IRU Agreement, dated as of May 25, 1999, between Level 3 Communications, LLC and Cable & Wireless USA, Inc. | 10-Q | November 15, 2004 | 10.7 | ||||
| 10.84+ | First Amendment, dated as of August 11, 2000, to Cost Sharing and IRU Agreement, dated as of May 25, 1999, between Level 3 Communications, LLC and Cable & Wireless USA, Inc. | 10-Q | November 15, 2004 | 10.8 | ||||
| 10.85+ | Second Amendment, dated as of August 11, 2000, to Cost Sharing and IRU Agreement, dated as of May 25, 1999, between Level 3 Communications, LLC and Cable & Wireless USA, Inc. | 10-Q | November 15, 2004 | 10.9 | ||||
| 10.86+ | Third Amendment, dated as of November 22, 2000, to Cost Sharing and IRU Agreement, dated as of May 25, 1999, between Level 3 Communications, LLC and Cable & Wireless USA, Inc. | 10-Q | November 15, 2004 | 10.10 | ||||
| 10.87+ | Fourth Amendment, dated as of January, 2001, to Cost Sharing and IRU Agreement, dated as of May 25, 1999, between Level 3 Communications, LLC and Cable & Wireless USA, Inc. | 10-Q | November 15, 2004 | 10.11 | ||||
| 10.88+ | Fifth Amendment, dated as of February 15, 2001, to Cost Sharing and IRU Agreement, dated as of May 25, 1999, between Level 3 Communications, LLC and Cable & Wireless USA, Inc. | 10-Q | November 15, 2004 | 10.12 | ||||
| 10.89+ | Sixth Amendment, dated as of August 7, 2001, to Cost Sharing and IRU Agreement, dated as of May 25, 1999, between Level 3 Communications, LLC and Cable & Wireless USA, Inc. | 10-Q | November 15, 2004 | 10.13 | ||||
| 10.90+ | Seventh Amendment, dated as of March 6, 2002, to Cost Sharing and IRU Agreement, dated as of May 25, 1999, between Level 3 Communications, LLC and Cable & Wireless USA, Inc. | 10-Q | November 15, 2004 | 10.14 | ||||
| 10.91+ | Eighth Amendment, dated as of March 23, 2002, to Cost Sharing and IRU Agreement, dated as of May 25, 1999, between Level 3 Communications, LLC and Cable & Wireless USA, Inc. | 10-Q | November 15, 2004 | 10.15 | ||||
| 10.92+ | Ninth Amendment, dated as of March 23, 2002, to Cost Sharing and IRU Agreement, dated as of May 25, 1999, between Level 3 Communications, LLC and Cable & Wireless USA, Inc. | 10-Q | November 15, 2004 | 10.16 | ||||
| 10.93+ | Tenth Amendment, dated as of August 27, 2003, to Cost Sharing and IRU Agreement, dated as of May 25, 1999, between Level 3 Communications, LLC and Cable & Wireless USA, Inc. | 10-Q | November 15, 2004 | 10.17 | ||||
| 10.94+ | Eleventh Amendment, dated as of March, 2004, to Cost Sharing and IRU Agreement, dated as of May 25, 1999, between Level 3 Communications, LLC and Cable & Wireless USA, Inc. | 10-Q | November 15, 2004 | 10.18 | ||||
47
Table of Contents
| 21.1 | Subsidiaries of the Registrant | X | ||||||||
| 23.1 | Consent of Ernst & Young LLP | X | ||||||||
| 31.1 | Certification of Principal Executive Officer pursuant to Section 302 of the Sarbanes-Oxley Act of 2002 | X | ||||||||
| 31.2 | Certification of Principal Financial Officer pursuant to Section 302 of the Sarbanes-Oxley Act of 2002 | X | ||||||||
| 32.1 | Certification of Chief Executive Officer pursuant to 18 U.S.C. Section 1350, as adopted pursuant to Section 906 of the Sarbanes-Oxley Act of 2002 | X | ||||||||
| 32.2 | Certification of Chief Financial Officer pursuant to 18 U.S.C. Section 1350, as adopted pursuant to Section 906 of the Sarbanes-Oxley Act of 2002 | X | ||||||||
| + | Confidential treatment has been granted for this exhibit. The copy filed as an exhibit omits the information subject to the request for confidential treatment. |
| * | Compensation plans or arrangements. |
48
Table of Contents
Pursuant to the requirements of Section 13 or 15(d) of the Securities Exchange Act of 1934, the registrant has duly caused this report to be signed on its behalf by the undersigned, thereunto duly authorized, on March 4, 2011.
| SAVVIS, Inc. |
| By: /s/ James E. Ousley |
| James E. Ousley |
| Chief Executive Officer and Chairman of the Board of Directors |
Pursuant to the requirements of the Securities Exchange Act of 1934, this report has been signed by the following persons on behalf of the registrant, in the capacities indicated below and on the dates indicated.
| Signature |
Title |
Date | ||
| /s/ JAMES E. OUSLEY James E. Ousley |
Chief Executive Officer (principal executive officer) and Chairman of the Board of Directors |
March 4, 2011 | ||
| /s/ GREGORY W. FREIBERG Gregory W. Freiberg |
Chief Financial Officer (principal financial officer and principal accounting officer) |
March 4, 2011 | ||
| /s/ RANDY E. DOBBS Randy E. Dobbs |
Director | March 4, 2011 | ||
| /s/ CLYDE A. HEINTZELMAN Clyde A. Heintzelman |
Director | March 4, 2011 | ||
| /s/ THOMAS E. MCINERNEY Thomas E. McInerney |
Director | March 4, 2011 | ||
| /s/ JAMES P. PELLOW James P. Pellow |
Director | March 4, 2011 | ||
| /s/ DAVID C. PETERSCHMIDT David C. Peterschmidt |
Director | March 4, 2011 | ||
| /s/ MERCEDES A. WALTON Mercedes A. Walton |
Director | March 4, 2011 | ||
| /s/ PATRICK J. WELSH Patrick J. Welsh |
Director | March 4, 2011 | ||
49
Table of Contents
INDEX TO CONSOLIDATED FINANCIAL STATEMENTS
50
Table of Contents
Report of Independent Registered Public Accounting Firm
The Board of Directors and Stockholders
SAVVIS, Inc.
We have audited the accompanying consolidated balance sheets of SAVVIS, Inc. and subsidiaries (the Company) as of December 31, 2010 and 2009, and the related consolidated statements of operations, changes in stockholders’ equity, and cash flows for each of the three years in the period ended December 31, 2010. Our audits also included the financial statement schedule listed in the index at Item 15a. These financial statements and schedule are the responsibility of the Company’s management. Our responsibility is to express an opinion on these financial statements and schedule based on our audits.
We conducted our audits in accordance with the standards of the Public Company Accounting Oversight Board (United States). Those standards require that we plan and perform the audit to obtain reasonable assurance about whether the financial statements are free of material misstatement. An audit includes examining, on a test basis, evidence supporting the amounts and disclosures in the financial statements. An audit also includes assessing the accounting principles used and significant estimates made by management, as well as evaluating the overall financial statement presentation. We believe that our audits provide a reasonable basis for our opinion.
In our opinion, the financial statements referred to above present fairly, in all material respects, the consolidated financial position of SAVVIS, Inc. and subsidiaries at December 31, 2010 and 2009, and the consolidated results of their operations and their cash flows for each of the three years in the period ended December 31, 2010, in conformity with U.S. generally accepted accounting principles. Also, in our opinion, the related financial statement schedule, when considered in relation to the basic financial statements taken as a whole, presents fairly in all material respects the information set forth therein.
We also have audited, in accordance with the standards of the Public Company Accounting Oversight Board (United States), SAVVIS, Inc.’s internal control over financial reporting as of December 31, 2010, based on criteria established in Internal Control – Integrated Framework issued by the Committee of Sponsoring Organizations of the Treadway Commission, and our report dated March 4, 2011, expressed an unqualified opinion thereon.
/s/ Ernst & Young LLP
St. Louis, Missouri
March 4, 2011
51
Table of Contents
CONSOLIDATED BALANCE SHEETS
(in thousands, except per share data)
| December 31, | ||||||||
| 2010 | 2009 | |||||||
| ASSETS | ||||||||
| Current Assets: |
||||||||
| Cash and cash equivalents |
$ | 120,344 | $ | 160,815 | ||||
| Trade accounts receivable, less allowance for credits and uncollectibles of $9,590 and $8,133 as of December 31, 2010 and 2009, respectively |
65,058 | 45,754 | ||||||
| Prepaid expenses and other current assets |
32,359 | 21,217 | ||||||
| Total Current Assets |
217,761 | 227,786 | ||||||
| Property and equipment, net |
843,801 | 783,852 | ||||||
| Goodwill |
75,883 | — | ||||||
| Intangible assets, net |
19,540 | 404 | ||||||
| Other non-current assets |
26,665 | 12,716 | ||||||
| Total Assets |
$ | 1,183,650 | $ | 1,024,758 | ||||
| LIABILITIES AND STOCKHOLDERS’ EQUITY | ||||||||
| Current Liabilities: |
||||||||
| Payables and other trade accruals |
$ | 73,445 | $ | 52,710 | ||||
| Current portion of long-term debt and lease obligations |
17,881 | 17,479 | ||||||
| Other current accrued liabilities |
84,101 | 68,314 | ||||||
| Total Current Liabilities |
175,427 | 138,503 | ||||||
| Long-term debt, net of current portion |
530,649 | 376,089 | ||||||
| Capital and financing method lease obligations, net of current portion |
216,508 | 223,897 | ||||||
| Other non-current accrued liabilities |
74,937 | 76,452 | ||||||
| Total Liabilities |
997,521 | 814,941 | ||||||
| Commitments and Contingencies (see Note 15) |
||||||||
| Stockholders’ Equity: |
||||||||
| Common stock; $0.01 par value, 1,500,000 shares authorized; 56,604 and 54,337 shares issued and outstanding as of December 31, 2010 and 2009, respectively |
566 | 545 | ||||||
| Additional paid-in capital |
886,593 | 862,834 | ||||||
| Accumulated deficit |
(688,388 | ) | (634,429 | ) | ||||
| Accumulated other comprehensive loss |
(12,642 | ) | (19,133 | ) | ||||
| Total Stockholders’ Equity |
186,129 | 209,817 | ||||||
| Total Liabilities and Stockholders’ Equity |
$ | 1,183,650 | $ | 1,024,758 | ||||
The accompanying notes are an integral part of these consolidated financial statements.
52
Table of Contents
CONSOLIDATED STATEMENTS OF OPERATIONS
(in thousands, except per share data)
| Years Ended December 31, | ||||||||||||
| 2010 | 2009 | 2008 | ||||||||||
| Revenue |
$ | 932,984 | $ | 874,414 | $ | 857,041 | ||||||
| Operating Expenses: |
||||||||||||
| Cost of revenue (including non-cash equity-based compensation expense of $5,919, $5,498 and $3,339) (1) |
500,749 | 480,335 | 483,054 | |||||||||
| Sales, general and administrative expenses (including non-cash equity-based compensation expense of $19,759, $23,604 and $19,630) (1) |
226,842 | 203,158 | 212,331 | |||||||||
| Depreciation, amortization and accretion |
180,903 | 150,854 | 135,123 | |||||||||
| Total Operating Expenses |
908,494 | 834,347 | 830,508 | |||||||||
| Income from Continuing Operations |
24,490 | 40,067 | 26,533 | |||||||||
| Loss on debt extinguishment |
8,735 | — | — | |||||||||
| Other (income) and expense |
70,770 | 58,184 | 45,503 | |||||||||
| Loss from Continuing Operations before Income Taxes |
(55,015 | ) | (18,117 | ) | (18,970 | ) | ||||||
| Income tax (benefit) expense |
(995 | ) | 2,729 | 2,996 | ||||||||
| Loss from Continuing Operations net of Income Taxes |
(54,020 | ) | (20,846 | ) | (21,966 | ) | ||||||
| Income from discontinued operations, net of income taxes |
61 | — | — | |||||||||
| Net Loss |
$ | (53,959 | ) | $ | (20,846 | ) | $ | (21,966 | ) | |||
| Loss per Share from Continuing Operations |
||||||||||||
| Basic loss per share |
$ | (0.98 | ) | $ | (0.39 | ) | $ | (0.41 | ) | |||
| Diluted loss per share |
$ | (0.98 | ) | $ | (0.39 | ) | $ | (0.41 | ) | |||
| Weighted-Average Common Shares Outstanding |
||||||||||||
| Basic |
55,312 | 53,786 | 53,317 | |||||||||
| Diluted |
55,312 | 53,786 | 53,317 | |||||||||
| (1) | Excludes depreciation, amortization and accretion, which is reported separately. |
The accompanying notes are an integral part of these consolidated financial statements.
53
Table of Contents
CONSOLIDATED STATEMENTS OF CASH FLOWS
(in thousands)
| Years Ended December 31, | ||||||||||||
| 2010 | 2009 | 2008 | ||||||||||
| Cash Flows from Operating Activities: |
||||||||||||
| Net loss |
$ | (53,959 | ) | $ | (20,846 | ) | $ | (21,966 | ) | |||
| Income from discontinued operations, net of income taxes |
61 | — | — | |||||||||
| Loss from continuing operations, net of income taxes |
(54,020 | ) | (20,846 | ) | (21,966 | ) | ||||||
| Reconciliation of net loss to net cash provided by operating activities: |
||||||||||||
| Depreciation, amortization and accretion |
180,903 | 150,854 | 135,123 | |||||||||
| Non-cash equity-based compensation |
25,678 | 29,102 | 22,969 | |||||||||
| Accrued interest |
10,511 | 4,578 | 5,260 | |||||||||
| Amortization of debt discount |
10,127 | 14,319 | 13,194 | |||||||||
| Loss on debt extinguishment |
7,535 | — | — | |||||||||
| Other, net |
4,244 | 943 | 852 | |||||||||
| Net changes in operating assets and liabilities: |
||||||||||||
| Trade accounts receivable, net |
(15,504 | ) | 6,331 | (1,241 | ) | |||||||
| Prepaid expenses and other current and non-current assets |
(19,559 | ) | 5,893 | (5,591 | ) | |||||||
| Payables and other trade accruals |
17,553 | 2,322 | (1,360 | ) | ||||||||
| Other accrued liabilities |
9,652 | (7,015 | ) | (1,682 | ) | |||||||
| Net cash provided by continuing operations |
177,120 | 186,481 | 145,558 | |||||||||
| Net cash provided by discontinued operations |
621 | — | — | |||||||||
| Net cash provided by operating activities |
177,741 | 186,481 | 145,558 | |||||||||
| Cash Flows from Investing Activities: |
||||||||||||
| Payments for capital expenditures |
(202,554 | ) | (132,936 | ) | (246,166 | ) | ||||||
| Acquisition of Fusepoint, Inc., net of cash received |
(112,790 | ) | — | — | ||||||||
| Cash received for sale of business |
1,459 | — | — | |||||||||
| Net cash used in investing activities |
(313,885 | ) | (132,936 | ) | (246,166 | ) | ||||||
| Cash Flows from Financing Activities: |
||||||||||||
| Proceeds from long-term debt |
643,500 | 2,865 | 62,292 | |||||||||
| Principal payments on long-term debt |
(525,619 | ) | (6,600 | ) | (5,129 | ) | ||||||
| Payments for debt extinguishment costs |
(1,179 | ) | — | — | ||||||||
| Payments for debt issuance costs |
(12,805 | ) | — | (1,885 | ) | |||||||
| Proceeds from stock option exercises |
26,367 | 367 | 907 | |||||||||
| Payments for employee taxes on equity-based instruments |
(3,326 | ) | (1,749 | ) | (2,298 | ) | ||||||
| Principal payments under capital lease obligations |
(23,141 | ) | (7,145 | ) | (5,825 | ) | ||||||
| Other, net |
(4,607 | ) | (2,211 | ) | — | |||||||
| Net cash provided by (used in) financing activities |
99,190 | (14,473 | ) | 48,062 | ||||||||
| Effect of exchange rate changes on cash and cash equivalents |
(3,517 | ) | 459 | (9,311 | ) | |||||||
| Net increase (decrease) in cash and cash equivalents |
(40,471 | ) | 39,531 | (61,857 | ) | |||||||
| Cash and cash equivalents, beginning of year |
160,815 | 121,284 | 183,141 | |||||||||
| Cash and cash equivalents, end of year |
$ | 120,344 | $ | 160,815 | $ | 121,284 | ||||||
| Supplemental Disclosures of Cash Flow Information: |
||||||||||||
| Cash paid for interest |
$ | 45,584 | $ | 37,228 | $ | 32,380 | ||||||
| Cash paid for income taxes, net |
1,030 | 1,747 | 1,714 | |||||||||
| Non-cash Investing and Financing Activities: |
||||||||||||
| Assets acquired and obligations incurred under capital leases |
$ | 6,864 | $ | 43,000 | $ | 36,160 | ||||||
| Assets acquired and obligations incurred under financing agreements |
— | — | 24,160 | |||||||||
The accompanying notes are an integral part of these consolidated financial statements.
54
Table of Contents
CONSOLIDATED STATEMENTS OF CHANGES IN STOCKHOLDERS’ EQUITY
AND OTHER COMPREHENSIVE LOSS
(in thousands)
| Shares of Common Stock Outstanding |
Common Stock |
Additional Paid-In Capital |
Accumulated Deficit |
Accumulated Other Comprehensive Loss |
Total Stockholders’ Equity |
|||||||||||||||||||
| Balance at December 31, 2007 |
52,977 | $ | 530 | $ | 811,559 | $ | (591,617 | ) | $ | (3,724 | ) | $ | 216,748 | |||||||||||
| Issuance of common stock |
487 | 5 | 2,836 | — | — | 2,841 | ||||||||||||||||||
| Payments for employee taxes on equity-based instruments |
— | — | (2,298 | ) | — | — | (2,298 | ) | ||||||||||||||||
| Recognition of equity-based compensation costs |
— | — | 22,785 | — | — | 22,785 | ||||||||||||||||||
| Comprehensive loss: |
||||||||||||||||||||||||
| Net loss |
— | — | — | (21,966 | ) | — | (21,966 | ) | ||||||||||||||||
| Foreign currency translation adjustments |
— | — | — | — | (14,381 | ) | (14,381 | ) | ||||||||||||||||
| Change in derivatives |
— | — | — | — | (3,552 | ) | (3,552 | ) | ||||||||||||||||
| Net comprehensive loss |
— | — | — | (21,966 | ) | (17,933 | ) | (39,899 | ) | |||||||||||||||
| Balance at December 31, 2008 |
53,464 | 535 | 834,882 | (613,583 | ) | (21,657 | ) | 200,177 | ||||||||||||||||
| Issuance of common stock |
873 | 10 | 1,203 | — | — | 1,213 | ||||||||||||||||||
| Payments for employee taxes on equity-based instruments |
— | — | (1,749 | ) | — | — | (1,749 | ) | ||||||||||||||||
| Recognition of equity-based compensation costs |
— | — | 28,498 | — | — | 28,498 | ||||||||||||||||||
| Comprehensive loss |
||||||||||||||||||||||||
| Net loss |
— | — | — | (20,846 | ) | — | (20,846 | ) | ||||||||||||||||
| Foreign currency translation adjustment |
— | — | — | — | 2,502 | 2,502 | ||||||||||||||||||
| Change in derivatives |
— | — | — | — | 22 | 22 | ||||||||||||||||||
| Net comprehensive loss |
— | — | — | (20,846 | ) | 2,524 | (18,322 | ) | ||||||||||||||||
| Balance at December 31, 2009 |
54,337 | 545 | 862,834 | (634,429 | ) | (19,133 | ) | 209,817 | ||||||||||||||||
| Issuance of common stock |
2,267 | 21 | 27,535 | — | — | 27,556 | ||||||||||||||||||
| Payments for employee taxes on equity-based instruments |
— | — | (3,326 | ) | — | — | (3,326 | ) | ||||||||||||||||
| Recognition of equity-based compensation costs |
— | — | 24,587 | — | — | 24,587 | ||||||||||||||||||
| Convertible notes settlement |
— | — | (25,037 | ) | — | — | (25,037 | ) | ||||||||||||||||
| Comprehensive loss |
||||||||||||||||||||||||
| Net loss |
— | — | — | (53,959 | ) | — | (53,959 | ) | ||||||||||||||||
| Foreign currency translation adjustment |
— | — | — | — | 3,313 | 3,313 | ||||||||||||||||||
| Change in derivatives |
— | — | — | — | 3,178 | 3,178 | ||||||||||||||||||
| Net comprehensive loss |
— | — | — | (53,959 | ) | 6,491 | (47,468 | ) | ||||||||||||||||
| Balance at December 31, 2010 |
56,604 | $ | 566 | $ | 886,593 | $ | (688,388 | ) | $ | (12,642 | ) | $ | 186,129 | |||||||||||
The accompanying notes are an integral part of these consolidated financial statements.
55
Table of Contents
NOTES TO CONSOLIDATED FINANCIAL STATEMENTS
(dollars in thousands, except share data and where indicated)
NOTE 1—DESCRIPTION OF BUSINESS AND BASIS OF PRESENTATION
SAVVIS, Inc. (the Company) provides information technology (IT) services including cloud services, managed hosting, managed security, colocation, professional services and network services through its global infrastructure to businesses and government agencies around the world.
The accompanying consolidated financial statements include the accounts of the Company and its wholly-owned subsidiaries and have been prepared in accordance with United States (U.S.) generally accepted accounting principles, under the rules and regulations of the U.S. Securities and Exchange Commission (the SEC). All intercompany balances and transactions have been eliminated in consolidation and, in the opinion of management, all normal recurring adjustments considered necessary for a fair presentation have been included. Material subsequent events have been evaluated through the report issuance date and the Company determined that there were no material subsequent events that would impact the Company’s consolidated financial statements for the annual period ended December 31, 2010.
Reclassifications
Certain amounts in the prior periods presented have been reclassified to conform to the current period financial statement presentation.
During the first quarter of 2009, the Company underwent an evaluation of job functions, which resulted in a realignment of costs from cost of revenue to sales, general and administrative expenses, which the Company believes more accurately presents the components of operating costs. To reflect the impact this change would have made if implemented in the prior period, the cost of revenue and sales, general and administrative expenses for the year ended December 31, 2008 have been adjusted to reflect the $12.2 million reclassification. Total operating expenses and net loss were not impacted by the change.
NOTE 2—SUMMARY OF SIGNIFICANT ACCOUNTING POLICIES
Cash and Cash Equivalents
The Company classifies cash on hand and deposits in banks, including commercial paper, money market accounts and other investments it may hold from time to time, with a maturity to the Company of three months or less, as cash and cash equivalents.
Concentrations of Credit Risk
The Company invests excess cash with high credit, quality financial institutions, which bear minimal risk and, by policy, limits the amount of credit exposure to any one financial institution. The Company’s concentrations of credit risk are principally in accounts receivable. The Company periodically reviews the credit quality of its clients and generally does not require collateral. Given the economic environment and uncertainty in the recent past, the Company continues to remain cautious regarding clients and their potential impact on the Company’s revenue and accounts receivable collectibility.
Trade Accounts Receivable
The Company classifies as trade accounts receivable amounts due within twelve months, arising from the provision of services in the normal course of business.
Allowance for Credits and Uncollectibles
The Company has service level commitments with certain of its clients. To the extent that such service levels are not achieved, the Company estimates the amount of credits to be issued, based on historical credits issued and known disputes, and records a reduction to revenue, with a corresponding increase in the allowance for credits and uncollectibles.
The Company assesses collectibility of accounts receivable based on a number of factors, including client payment history and creditworthiness. The Company generally does not request collateral from its clients although in certain cases it may obtain a security deposit. The Company maintains an allowance for uncollectibles and, when evaluating the adequacy of allowances, specifically analyzes accounts receivable, current economic conditions and trends, historical bad debt write-offs, client concentrations, client payment history and creditworthiness and changes in client payment terms. Delinquent account balances are written off after management has determined that the likelihood of collection is not probable.
56
Table of Contents
Property and Equipment
The Company’s property and equipment primarily include communications and data center equipment, facilities and leasehold improvements, software and office equipment, which are recorded at cost and depreciated using the straight-line method over their estimated useful lives. Software, equipment and leasehold improvements have useful lives that range between three and fifteen years and leased assets are depreciated over the shorter of their useful lives or lease terms. Maintenance and repair costs are expensed as incurred.
Goodwill
The Company has goodwill attributable to its hosting segment of $75.9 million as of December 31, 2010. There was no goodwill attributed to the network segment. The Company performs annual impairment tests on its goodwill by comparing the fair value of the reporting segment to its carrying value. If the fair value exceeds the carrying value, the goodwill is not impaired and no further testing will be needed. If the carrying value exceeds the fair value, the implied fair value of the goodwill will be determined and compared to the carrying value, and the Company will recognize an impairment loss equal to the difference.
Intangible Assets
The Company’s intangible assets primarily include client relationships acquired with our acquisition of Fusepoint, Inc., and are amortized over the remaining contract terms of the applicable client relationships, as they impact revenue. The remainder of the Company’s intangible assets consists of other client relationships, trademarks, patents and peering agreements, which are amortized using the straight-line method over their estimated useful lives. Useful lives of the Company’s intangible assets are four years for trademarks, eleven to fifteen years for patents, three to six years for client relationships and seven years for peering agreements.
Valuation of Long-Lived Assets
The Company evaluates its long-lived assets for impairment annually or whenever events or changes in circumstances indicate that carrying amounts may not be recoverable. If the Company determines that the carrying value of a long-lived asset may not be recoverable, a permanent impairment charge is recorded for the amount by which the carrying value of the long-lived asset exceeds its fair value. Fair value is measured based on a discounted cash flow method using a discount rate determined by management. The estimates of cash flows and discount rates are subject to change due to the economic environment, including such factors as interest rates, expected market returns and volatility of markets served. Management believes its estimates of future cash flows, discount rates and fair values are reasonable; however, changes in estimates could result in impairment charges. The Company had no asset impairment charges during the years ended December 31, 2010, 2009 or 2008.
Depreciation, Amortization and Accretion
Depreciation and amortization expense consists primarily of depreciation of property and equipment and assets held under capital lease, as well as amortization of intangible assets and leasehold improvements. Property, plant and equipment are recorded at cost and depreciation and amortization are calculated using the straight-line method over the useful lives of the related assets. The Company’s client relationship intangible asset is amortized over the life of the applicable client relationships, as they impact revenue. The remainder of the Company’s intangible assets are amortized using the straight-line method over the useful lives of the related assets. Accretion expense results from aging of the discounted present value of various liabilities, including asset retirement obligations.
Fair Value of Financial Instruments
The Company has estimated the fair value of its financial instruments as of December 31, 2010 and 2009 using available market information or other appropriate valuation methods. Assets and liabilities are categorized as Level 1, Level 2 or Level 3, dependant on the reliability of the inputs used in the valuation. Level 1 is considered more reliable than Level 3, as Level 3 depends on management’s assumptions. The definitions of the levels are as follows:
| • | Level 1: Inputs are unadjusted quoted prices in active markets for identical assets or liabilities that the reporting entity has the ability to access at the measurement date. |
| • | Level 2: Inputs other than quoted prices included within Level 1 that are observable for the asset or liability, directly or indirectly, such as a quoted price for similar assets or liabilities in active markets. |
| • | Level 3: Inputs are unobservable and are only used to measure fair value when observable inputs are not available. The inputs reflect the entity’s own assumptions and are based on the best information available. This allows for the fair value of an asset or liability to be measured when no active market for that asset or liability exists. |
57
Table of Contents
The carrying amounts of cash and cash equivalents, trade accounts receivable, other current assets, payables and other trade accruals, and other current liabilities approximate fair value because of the short-term nature of such instruments. As of December 31, 2010 and December 31, 2009, substantially all of the Company’s $120.3 million and $160.8 million, respectively, of cash and cash equivalents were held in money market accounts, which are valued using Level 1 inputs. On August 4, 2010, the Company entered into a variable interest rate term loan agreement (the Term Loan) and a revolving facility agreement (the Revolver). The proceeds from the Term Loan were used to extinguish portions of its then existing long-term debt, including 98.4% of its convertible notes (the Notes), its revolving credit facility (the Credit Agreement), its loan agreement with Cisco Systems Capital Corporation (the Cisco Loan) and its loan agreement with Lombard North Central Plc (the Lombard Loan Agreement). The fair value of the Notes was estimated based on Level 1 inputs of the recent trading values, as provided by a third party. The Company is exposed to interest rate volatility with respect to the variable interest rates of its Term Loan and Revolver. The Term Loan and the Revolver bear interest at current market rates plus applicable margin. The variable interest rate of the Term Loan is subject to an interest rate cap, as described in Note 10. The fair values of the Term Loan, Revolver, Credit Agreement, Lombard Loan Agreement and Cisco Loan, none of which are traded on an active market, are estimated by considering the Company’s credit rating, current rates available to the Company for debt of the same remaining maturities, and the terms of the debt. The fair value of the interest rate swap associated with the Lombard Loan Agreement, the interest rate cap associated with the Term Loan and the Company’s foreign currency hedges are valued using Level 2 market value inputs as provided by a third party, adjusted for the Company’s credit risk.
The following table presents the carrying values and estimated fair values of the Company’s long-term debt and derivative instruments as of the dates indicated:
| December 31, 2010 | December 31, 2009 | |||||||||||||||
| Carrying Value |
Fair Value | Carrying Value |
Fair Value | |||||||||||||
| Assets: |
||||||||||||||||
| Interest rate cap |
$ | 470 | $ | 470 | $ | — | $ | — | ||||||||
| Liabilities: |
||||||||||||||||
| Term Loan |
$ | 533,262 | $ | 564,610 | $ | — | $ | — | ||||||||
| Notes |
2,887 | 3,095 | 305,921 | 310,069 | ||||||||||||
| Lombard Loan Agreement |
— | — | 55,973 | 60,881 | ||||||||||||
| Cisco Loan |
— | — | 20,795 | 20,667 | ||||||||||||
| Credit Agreement |
— | — | — | — | ||||||||||||
| Revolver |
— | — | — | — | ||||||||||||
| Interest rate swap |
— | — | 3,177 | 3,177 | ||||||||||||
| Foreign currency hedges |
— | — | 116 | 116 | ||||||||||||
Derivatives
The Company is exposed to certain risks relating to its ongoing business operations. The primary risks managed by using derivative instruments are foreign currency exchange rate risk and variable interest rate risk. The fair value of the Company’s cash flow hedges are recorded as assets or liabilities, as applicable, on the balance sheet with the offset in accumulated other comprehensive loss. To the extent that the periodic changes in the fair value of the derivatives are not effective, or if the hedge ceases to qualify for hedge accounting, the ineffective portions of the non-cash changes are recognized immediately in the consolidated statement of operations in the period of the change. As the hedged items impact earnings, the related hedging gains or losses are reclassified from accumulated other comprehensive loss and recognized in the consolidated statements of operations.
As of December 31, 2010, the Company maintains an interest rate cap agreement with Bank of America, N.A., to cap the three month Eurodollar interest rate paid on a portion of the Term Loan. For further information regarding the Company’s derivatives, please refer to Note 10.
Assets Held Under Capital Lease
The Company leases certain of its property and equipment under capital lease agreements. The assets held under capital lease and related obligations are recorded at the lesser of the present value of aggregate future minimum lease payments, including estimated bargain purchase options, or the fair value of the assets held under capital lease. Such assets are amortized over the shorter of the terms of the leases, or the estimated useful lives of the assets, which typically range from two to fifteen years.
58
Table of Contents
Operating Leases
The Company has various operating leases for property and equipment. Terms of equipment leases typically range from three to five years and terms of property leases typically range from one to fifteen years. The Company’s property leases generally include rent increases and, in certain cases, rent holidays, which are recorded on a straight-line basis over the underlying lease terms.
Asset Retirement Obligations
The Company records asset retirement obligations for estimated costs to remove leasehold improvements and return leased facilities to original condition. The fair value of the obligation is assessed as the present value of the expected future payments to perform these activities, discounted using a credit adjusted interest rate. The associated costs of the asset retirement obligation are capitalized and depreciated over the related leasehold improvements’ lease term.
Revenue Recognition
The Company derives the majority of its revenue from recurring revenue streams, consisting primarily of hosting services, which includes managed hosting and colocation, and network services. The Company recognizes revenue for these services as they are provided. Installation fees and related costs are deferred and recognized ratably over the life of the client contract. Fees for migration services are recognized as those services are performed. Revenue is recognized when the related service has been provided, there is persuasive evidence of an arrangement, the fee is fixed or determinable and collection is reasonably assured.
In addition, the Company has service level commitments pursuant to individual client contracts with certain of its clients. To the extent that such service levels are not achieved or are otherwise disputed due to performance or service issues or other service interruptions or conditions, the Company estimates the amount of credits to be issued and records a reduction to revenue, with a corresponding increase in the allowance for credits and uncollectibles. In the event that the Company provides credits or payments to clients related to service level claims, the Company may recover such costs through third party insurance agreements. Insurance proceeds received under these agreements are recorded as an offset to previously recorded revenue reductions.
Cost of Revenue
Cost of revenue includes costs of facility rentals, utilities, circuit costs and other operating costs for hosting space; costs of leasing local access lines to connect clients to our Points of Presence (PoPs); leasing backbone circuits to interconnect our PoPs; indefeasible rights of use, operations and maintenance; and salaries and related benefits for engineering, service delivery and provisioning, client service, consulting services and operations personnel who maintain our network, monitor network performance, resolve service issues and install new sites. Cost of revenue excludes depreciation, amortization and accretion and includes non-cash equity-based compensation.
Equity-Based Compensation
The Company calculates the fair value of total equity-based compensation for stock options and restricted preferred units using the Black-Scholes option pricing model which utilizes certain assumptions and estimates that have a material impact on the amount of total compensation cost recognized in the Company’s consolidated financial statements. Total equity-based compensation costs for restricted stock units and restricted stock awards are calculated based on the market value of the Company’s common stock on the date of grant. An additional assumption is made on the number of awards expected to forfeit prior to vesting, which decreases the amount of total expense recognized. This assumption is evaluated, and the estimate is revised, on a quarterly or as needed basis. Total equity-based compensation is amortized to non-cash equity-based compensation expense over the vesting or performance period of the award, as applicable, which typically ranges from three to four years.
Advertising Costs
The Company expenses advertising costs as incurred. For the years ended December 31, 2010, 2009 and 2008, the Company expensed $6.2 million, $3.9 million and $4.3 million, respectively, in advertising costs.
Foreign Currency
Results of operations of the Company’s foreign subsidiaries are translated from the applicable functional currency to the U.S. Dollar using average exchange rates during the reporting period, while assets and liabilities are translated at the exchange rate in effect at the reporting date. Resulting gains or losses from translating foreign currency financial statements are included in accumulated other comprehensive loss, a separate component of stockholders’ equity. Foreign currency transaction gains and losses are recorded in the consolidated statements of operations. For the years ended December 31, 2010 and 2009, the Company recorded foreign currency transaction losses of $0.2 million and $0.4 million, respectively. For the year ended December 31, 2008, the Company recorded a foreign currency transaction gain of $3.3 million.
59
Table of Contents
Income Taxes
Income taxes are accounted for using the asset and liability method, which provides for the establishment of deferred tax assets and liabilities for the net tax effects of temporary differences between the carrying amounts of assets and liabilities for financial reporting purposes and for income tax purposes, applying the enacted statutory tax rates in effect for the years in which differences are expected to reverse. Valuation allowances are established when it is more likely than not that recorded deferred tax assets will not be realized. With the exception of the net deferred tax position on the post-acquisition operations of Fusepoint, Inc., the Company has provided a full valuation allowance on deferred tax assets arising primarily from tax loss carryforwards and other potential tax benefits because the future realization of such benefit is uncertain. As a result, to the extent that those benefits are realized in future periods, they will favorably affect net income or loss.
Loss per Share
The Company computes basic loss per common share by dividing net loss by the weighted-average number of common shares outstanding during the period, excluding unvested restricted stock awards subject to cancellation. Diluted loss per common share is computed using the weighted-average number of common shares and, if dilutive, potential common shares outstanding during the period. Potential common shares represent the incremental common shares issuable for stock option and restricted preferred unit exercises, unvested restricted stock units and restricted stock awards that are subject to repurchase or cancellation, and conversion of debt securities. The Company calculates the dilutive effect of outstanding stock options, restricted preferred units, restricted stock units and restricted stock awards on loss per share by application of the treasury stock method. The dilutive effect from convertible securities is calculated by application of the if-converted method. The Company had no dilutive securities for the years ended December 31, 2010, 2009 and 2008.
The following tables set forth the computation of basic and diluted loss per common share:
| Years Ended December 31, | ||||||||||||
| 2010 | 2009 | 2008 | ||||||||||
| Loss from continuing operations, net of income taxes |
$ | (54,020 | ) | $ | (20,846 | ) | $ | (21,966 | ) | |||
| Income from discontinued operations, net of income taxes |
61 | — | — | |||||||||
| Net loss |
$ | (53,959 | ) | $ | (20,846 | ) | $ | (21,966 | ) | |||
| Weighted-average shares outstanding – basic |
55,312 | 53,786 | 53,317 | |||||||||
| Effect of dilutive securities (1): |
||||||||||||
| Stock options (2) |
— | — | — | |||||||||
| Restricted preferred units (2) (3) |
— | — | — | |||||||||
| Restricted stock units and restricted stock awards (2) |
— | — | — | |||||||||
| Weighted-average shares outstanding – diluted |
55,312 | 53,786 | 53,317 | |||||||||
| Basic loss per common share: |
||||||||||||
| Loss from continuing operations |
$ | (0.98 | ) | $ | (0.39 | ) | $ | (0.41 | ) | |||
| Income from discontinued operations |
— | — | — | |||||||||
| Net loss |
$ | (0.98 | ) | $ | (0.39 | ) | $ | (0.41 | ) | |||
| Diluted loss per common share: |
||||||||||||
| Loss from continuing operations |
$ | (0.98 | ) | $ | (0.39 | ) | $ | (0.41 | ) | |||
| Income from discontinued operations |
— | — | — | |||||||||
| Net loss |
$ | (0.98 | ) | $ | (0.39 | ) | $ | (0.41 | ) | |||
| (1) | For the year ended December 31, 2010 the effects of including the 0.04 million incremental shares associated with the convertible notes and the assumed conversion of 5.2 million equity instruments into common stock were anti-dilutive and, therefore, excluded from the calculation of diluted loss per common share. For the year ended December 31, 2009, the effects of including the 4.9 million incremental shares associated with the convertible notes and the assumed conversion of 6.7 million equity instruments into common stock was anti-dilutive and, therefore, excluded from the calculation of diluted loss per common share. |
| (2) | As of December 31, 2010, the Company had 3.2 million stock options and 2.0 million shares of restricted stock units and restricted stock awards outstanding. As of December 31, 2009, the Company had 5.5 million stock options, 0.2 million restricted preferred units and 1.0 million shares of restricted stock units and restricted stock awards outstanding. |
| (3) | As of December 31, 2010, there were no outstanding restricted preferred units. |
60
Table of Contents
Use of Estimates
The preparation of financial statements in conformity with U.S. generally accepted accounting principles requires management to make estimates and assumptions that affect the reported amounts of assets and liabilities and disclosure of contingent assets and liabilities at the date of the financial statements and the reported amounts of revenue and expenses during the reporting period. Actual results could differ from such estimates and assumptions. Estimates used in the Company’s consolidated financial statements include, among others, the allowance for credits and uncollectibles and assumptions used to value equity-based compensation awards.
NOTE 3—RECENT ACCOUNTING PRONOUNCEMENTS
Recently Issued Accounting Pronouncements
In December 2010, new accounting guidance on disclosures about supplementary pro forma information for business combinations was issued. The guidance amends existing disclosure criteria, specifying that if a public entity presents comparative financial statements it should disclose revenue and earnings of the combined entity as though the business combination occurred as of the beginning of the comparable prior year annual reporting period only. The guidance also expands the supplemental pro forma disclosures to include descriptions of the nature and amount of material, nonrecurring pro forma adjustments directly attributable to the business combination that are included in the reported pro forma revenue and earnings. The guidance is prospective and is effective for business combinations occurring after January 1, 2011. As the new guidance is disclosure only, adoption will not have a material effect on the Company’s consolidated financial position, results of operations or cash flows.
NOTE 4—ACQUISITION OF FUSEPOINT, INC.
On June 16, 2010, the Company completed its acquisition of Fusepoint, Inc. (Fusepoint), an independent provider of outsourced managed IT and infrastructure services to mid-market and larger enterprises in Canada. With the acquisition of Fusepoint, the Company obtained hosting assets in three data centers, which are located in Toronto, Vancouver and Montreal.
The Company acquired Fusepoint for $121.8 million in cash, after adjustment for estimated working capital and debt levels. At the closing, $12.5 million of the purchase price was placed in escrow for possible application against the working capital adjustment, certain tax liabilities, and indemnification claims that may be made in the first year following closing. The Company funded the acquisition through available cash on hand and an additional $110.0 million of debt through the utilization of increased borrowing capacity under the Company’s revolving credit facility, which was amended and upsized to $150.0 million. The acquisition has been accounted for using the acquisition method of accounting. Acquisition and integration related costs of $5.1 million were included in the Company’s consolidated statements of operations for the year ended December 31, 2010. The Company finalized all valuation and acquisition accounting in 2010.
Allocation of Purchase Price
The following presents the purchase price for the acquisition of Fusepoint, which was subject to adjustment based upon the difference between the estimated net working capital and debt transferred on the date of closing and the actual amount of net working capital and debt transferred on the date of closing. The purchase price was finalized on August 26, 2010.
| Aggregate cash purchase price for the acquisition |
$ | 124,500 | ||
| Working capital adjustment |
(2,705 | ) | ||
| Purchase price |
$ | 121,795 | ||
Of the $121.8 million purchase price, $110.0 million was funded through borrowings on the Company’s then existing revolving credit facility and the remaining $11.8 million through available cash on hand.
61
Table of Contents
The following presents the purchase price allocation, including goodwill and intangible assets, based on the fair values of the acquired assets and assumed liabilities of Fusepoint as of the date of acquisition, June 16, 2010:
| Current assets |
$ | 15,002 | ||
| Property and equipment, net |
23,729 | |||
| Goodwill |
73,971 | |||
| Intangible assets |
22,519 | |||
| Other noncurrent assets |
1,164 | |||
| Current liabilities |
(6,786 | ) | ||
| Capital lease obligations, net of current portion |
(5,640 | ) | ||
| Other non-current liabilities |
(2,164 | ) | ||
| Purchase price |
$ | 121,795 | ||
| Less cash assumed in acquisition |
(9,005 | ) | ||
| Purchase price, net |
$ | 112,790 | ||
The intangible assets acquired consisted of the client relationships of Fusepoint assumed through the acquisition. The excess of the purchase price over net tangible and intangible assets acquired resulted in goodwill of $74.0 million, which represents the Company’s ability to implement operational synergies, the value of the expansion into new markets and the acquired workforce of Fusepoint. The goodwill is not expected to be deductible for U.S. income tax purposes. All assets acquired, including goodwill, are included in the Company’s hosting segment.
The consolidated financial statements for the year ended December 31, 2010 include $21.0 million and $1.7 million of revenue and net loss from continuing operations, respectively, which reflect the operating results of Fusepoint since the date of acquisition. The following unaudited pro forma information presents a summary of the combined results of operations of the Company and of Fusepoint for the periods presented as if the acquisition had occurred on January 1, 2009 along with certain pro forma adjustments. These pro forma adjustments give effect to the incremental interest expense incurred by the Company with the assumption of additional debt to finance the acquisition and the amortization of the acquired intangible assets. The results of operations for Fusepoint’s application services business have been excluded from this unaudited pro forma information, as this business was sold in December 2010. The following unaudited pro forma information has been prepared for comparative purposes only and is not necessarily indicative of the results of operations as they would have been had the acquisition occurred on the assumed date, nor is it necessarily an indication of future operating results.
| Year Ended December 31, | ||||||||
| 2010 | 2009 | |||||||
| Revenue |
$ | 951,191 | $ | 907,550 | ||||
| Cost of revenue |
509,866 | 496,976 | ||||||
| Selling, general and administrative expenses |
229,162 | 209,587 | ||||||
| Income from continuing operations |
24,884 | 38,829 | ||||||
| Net loss from continuing operations |
(61,271 | ) | (28,957 | ) | ||||
NOTE 5—DISCONTINUED OPERATIONS
On June 16, 2010, the Company acquired Fusepoint as described in Note 4. As a part of this transaction, the Company acquired Fusepoint’s applications services business (FAS), which the Company did not consider core to its future operations and sold on December 13, 2010 for $1.5 million of cash proceeds. FAS, which was a part of the Company’s hosting segment, provides service from two locations, Montreal and Quebec City, both of which provide clients with the design, development, integration and maintenance of mission critical e-business applications. The Company recognized a gain of $0.1 million on the sale of FAS in the year ended December 31, 2010, which was primarily related to the excess of cash proceeds received over the net book value. No gains or losses on the fair value were recorded on the Company’s financial statements prior to the sale, as FAS was recorded through acquisition accounting at its estimated fair value. The results of operations for FAS have been classified as discontinued operations in the consolidated statements of operations and the consolidated statement of cash flows for the year ended December 31, 2010.
62
Table of Contents
NOTE 6—PROPERTY AND EQUIPMENT
The following table presents property and equipment, by major category, as of December 31, 2010 and 2009:
| December 31, | ||||||||
| 2010 | 2009 | |||||||
| Facilities and leasehold improvements |
$ | 858,199 | $ | 719,597 | ||||
| Communications and data center equipment |
561,545 | 543,908 | ||||||
| Software |
141,861 | 103,498 | ||||||
| Office equipment |
31,633 | 27,572 | ||||||
| 1,593,238 | 1,394,575 | |||||||
| Less accumulated depreciation and amortization |
(749,437 | ) | (610,723 | ) | ||||
| Property and equipment, net |
$ | 843,801 | $ | 783,852 | ||||
Depreciation and amortization expense for property and equipment was $174.4 million, $146.9 million and $129.8 million for the years ended December 31, 2010, 2009 and 2008, respectively.
The following table presents property and equipment held under capital and financing method leases, by major category, which represent components of property and equipment included in the preceding table, as of December 31, 2010 and 2009:
| December 31, | ||||||||
| 2010 | 2009 | |||||||
| Facilities and leasehold improvements |
$ | 157,478 | $ | 157,478 | ||||
| Communications and data center equipment |
95,282 | 105,093 | ||||||
| 252,760 | 262,571 | |||||||
| Less accumulated amortization |
(126,229 | ) | (120,386 | ) | ||||
| Property and equipment held under capital and financing method leases, net |
$ | 126,531 | $ | 142,185 | ||||
As described further in Note 9, the Company maintains a master lease agreement with Cisco Systems Capital Corporation, under which the Company acquired $3.2 million and $0.9 million of equipment during the years ended December 31, 2010 and 2009, respectively.
Amortization expense for assets held under capital and financing method leases was $19.6 million, $14.7 million and $14.2 million for the years ended December 31, 2010, 2009 and 2008, respectively.
63
Table of Contents
NOTE 7—PREPAID EXPENSES AND OTHER ASSETS
The following table presents the components of prepaids and other current and non-current assets as of December 31, 2010 and 2009:
| December 31, 2010 |
December 31, 2009 |
|||||||
| Prepaids and other current assets: |
||||||||
| Prepaid maintenance |
$ | 13,407 | $ | 8,632 | ||||
| Prepaid rent |
723 | 229 | ||||||
| Prepaid insurance |
1,488 | 1,533 | ||||||
| Deferred install costs |
11,103 | 7,202 | ||||||
| Other prepaids |
3,238 | 2,318 | ||||||
| Other current assets |
2,400 | 1,303 | ||||||
| Total prepaids and other current assets |
$ | 32,359 | $ | 21,217 | ||||
| Other non-current assets: |
||||||||
| Deferred financing costs |
$ | 11,142 | $ | 6,596 | ||||
| Other deferred costs |
4,582 | 2,644 | ||||||
| Non-current prepaids |
3,126 | 1,297 | ||||||
| Other non-current assets |
7,815 | 2,179 | ||||||
| Total other non-current assets |
$ | 26,665 | $ | 12,716 | ||||
NOTE 8—GOODWILL AND INTANGIBLE ASSETS
The following table presents the Company’s goodwill and intangible assets as of December 31, 2010 and 2009:
| December 31, 2010 |
December 31, 2009 |
|||||||
| Goodwill: |
||||||||
| Hosting |
$ | 75,883 | $ | — | ||||
| Intangible assets: |
||||||||
| Client relationships |
36,261 | 13,160 | ||||||
| Other intangible assets |
2,437 | 2,437 | ||||||
| 38,698 | 15,597 | |||||||
| Accumulated amortization |
(19,158 | ) | (15,193 | ) | ||||
| Intangible assets, net |
19,540 | 404 | ||||||
| Total goodwill and intangible assets, net |
$ | 95,423 | $ | 404 | ||||
As described in Note 4, as part of the acquisition of Fusepoint, the Company recorded $74.0 million of goodwill, which represented the Company’s ability to implement operational synergies, the value of the expansion into new markets and the acquired workforce of Fusepoint, and $22.5 million of intangible assets, which represent the client relationships assumed through the acquisition. Both the goodwill and the intangible assets from the Fusepoint acquisition are denominated in Canadian Dollars and, as such, are subject to foreign currency fluctuations. The Company’s foreign currency translation gain and losses, including those related to goodwill and other intangible assets, are a component of other comprehensive loss.
Amortization expense for intangible assets was $3.9 million, $0.3 million and $0.5 million for the years ended December 31, 2010, 2009 and 2008, respectively. Estimated future amortization expense related to these intangible assets is as follows:
| 2011 |
$ | 6,267 | ||
| 2012 |
5,371 | |||
| 2013 |
4,399 | |||
| 2014 |
3,288 | |||
| 2015 |
213 | |||
| Thereafter |
2 | |||
| Total future amortization of intangible assets |
$ | 19,540 | ||
64
Table of Contents
NOTE 9—LONG-TERM DEBT
The following table presents the carrying value of long-term debt as of December 31, 2010 and 2009:
| December 31, 2010 |
December 31, 2009 |
|||||||
| Term loan, net of current portion of $5,500 and $0, respectively |
$ | 527,762 | $ | — | ||||
| Convertible notes |
2,887 | 305,921 | ||||||
| Lombard loan agreement |
— | 55,973 | ||||||
| Cisco loan agreement, net of current portion of $0 and $6,600, respectively |
— | 14,195 | ||||||
| Revolver |
— | — | ||||||
| Credit agreement |
— | — | ||||||
| Long-term debt |
$ | 530,649 | $ | 376,089 | ||||
Credit Facilities
Term loan and revolver. On August 4, 2010, the Company entered into senior secured credit facilities consisting of a $550.0 million six-year term loan facility (the Term Loan) and a $75.0 million three-and-a-half-year revolving credit facility (the Revolver) with a group of lenders for which Banc of America Securities LLC and Morgan Stanley Senior Funding, Inc. served as joint lead arrangers and joint bookrunners and Credit Suisse Securities (USA) LLC and Suntrust Robinson Humphrey, Inc. served as arrangers and joint bookrunners. The Term Loan and Revolver contain various affirmative, negative and financial covenants which are measured on a quarterly or annual basis and restrict the ability of the Company to create liens, incur additional indebtedness and make capital expenditures, among other things, except as permitted by the terms of the agreement, and require maintenance of certain financial measures at defined levels. The Company’s obligations under the Term Loan and the Revolver, and the guarantees of the guarantors, are secured by a first-priority security interest in substantially all of the Company’s assets, interest in assets and proceeds thereof. The Company may elect to pay interest on a base or Eurodollar rate, plus applicable margin. The Term Loan requires 0.25% quarterly principal amortization payments beginning December 31, 2010, with the remaining balance payable on the maturity date, August 4, 2016. The Company incurred a 3.0%, or $16.5 million, original issue discount associated with the Term Loan. The Revolver contains a $40.0 million letter of credit provision, of which $12.4 million had been issued as of December 31, 2010. Unused commitments on the Revolver are subject to an annual commitment fee of 0.50% and a fee is applied to outstanding letters of credit of 4.75%. The applicable interest rate on Eurodollar loans under the Revolver would have been 5.01% at December 31, 2010; however, there were no outstanding borrowings. As of December 31, 2010, the applicable interest rate for the Term Loan was 6.75%, including the Eurodollar floor of 1.75%, and outstanding borrowings totaled $548.6 million. Unamortized original issue discount of $15.4 million on the Term Loan remained as of December 31, 2010.
Credit agreement. In August 2010, as part of a refinancing transaction, the Company repaid the $110.0 million outstanding, plus an additional $1.5 million in fees, and terminated the Company’s amended and restated credit agreement with Wells Fargo Capital Finance (the Credit Agreement). The Credit Agreement was amended in June 2010 to increase the available borrowing capacity in order to fund the purchase price of the Fusepoint acquisition. Under the amended terms of the Credit Agreement the Company had borrowing capacity of $150.0 million which included a $40.0 million letter of credit provision. Borrowings under the Credit Agreement could be used to fund working capital, acquisitions, capital expenditures and other general corporate purposes. The Company elected to pay interest on a three month LIBOR rate, plus an applicable margin. The interest rate at the time of extinguishment was 6.50%. With the June 2010 amendment of the Credit Agreement, the Company incurred $2.6 million of additional debt issuance costs, the majority of which were recognized as a loss on debt extinguishment during the year ended December 31, 2010. As of December 31, 2010, there were approximately $3.5 million of outstanding letters of credit remaining with the terminated Credit Agreement provider, which are backed by letters of credit issued under the Revolver.
Loan agreement and lease facility. The Company maintained a term loan and security agreement (the Loan Agreement) and maintains a master lease agreement (the Lease Agreement) with Cisco Systems Capital Corporation. The Loan Agreement provided for borrowings of up to $33.0 million, at an annual interest rate of 6.50%, to purchase network equipment, which were secured by a first-priority security interest in the equipment. The Lease Agreement provides a lease facility (the Lease Facility) to purchase equipment with borrowings at the discretion of Cisco Systems Capital Corporation. The effective interest rate on current borrowings is 7.75%. On August 4, 2010, as part of a refinancing transaction, the Company repaid the $16.9 million in borrowings outstanding on the Loan Agreement, along with $0.1 million of interest, and $11.2 million of the $13.1 million outstanding leases under the Lease Facility. There was a $0.2 million loss on debt extinguishment associated with the repayment of the leases. As of December 31, 2010, the Company had $2.9 million borrowings outstanding under Lease Facility.
65
Table of Contents
Lombard loan agreement. On August 4, 2010, as part of a refinancing transaction, the Company repaid and terminated, on behalf of its subsidiary SAVVIS UK Limited (SAVVIS UK), the loan agreement (the Lombard Loan Agreement) it maintained with Lombard North Central, Plc. (Lombard). The Lombard Loan Agreement had a five-year term and required monthly interest installments for the full term and quarterly principal installments that were to begin in 2011. The Company had guaranteed the obligations of SAVVIS UK under the Lombard Loan Agreement and the obligations were secured by a first priority security interest in substantially all of SAVVIS UK’s then existing data center assets and certain future assets. The Company maintained a letter of credit of $21.2 million, which was released with the termination of the agreement. A total of $55.8 million, or £35.0 million, was paid to Lombard, which included both the outstanding principal and accrued and unpaid interest. There were £0.4 million, or approximately $0.6 million, of unamortized debt issuance costs related to the Lombard Loan Agreement which were recognized as a loss on debt extinguishment during the year ended December 31, 2010.
Convertible Notes
In May 2007, the Company issued $345.0 million aggregate principal amount of 3.0% Convertible Senior Notes due May 15, 2012 (the Notes). Interest is payable semi-annually on May 15 and November 15 of each year and commenced November 15, 2007.
The Notes are governed by an Indenture dated May 9, 2007, between the Company, as issuer, and The Bank of New York, as trustee (the Indenture). The Indenture does not contain any financial covenants or restrictions on the payment of dividends, the incurrence of senior debt or other indebtedness or the issuance or repurchase of securities by the Company. The Notes are unsecured and are effectively subordinated to the Company’s existing or future secured debts to the extent of the assets securing such debt.
Upon conversion, holders will receive, at the Company’s election, cash, shares of the Company’s common stock or a combination thereof. However, the Company may at any time irrevocably elect for the remaining term of the Notes to satisfy its conversion obligation in cash up to 100% of the principal amount of the Notes converted, with any remaining amount to be satisfied, at the Company’s election, in cash, shares of its common stock or a combination thereof.
The initial conversion rate is 14.2086 shares of common stock per $1,000 principal amount of Notes, subject to adjustment. This represents an initial conversion price of approximately $70.38 per share of common stock. Holders of the Notes may convert their Notes prior to maturity upon the occurrence of specified circumstances, which includes certain trading levels of the Company’s common stock, the occurrence of certain distributions or corporate events, such as distribution to stockholders, consolidation, merger or sale of all or substantially all of the Company’s assets, or any time on or after February 15, 2012. Upon conversion, due to the conversion formulas associated with the Notes, if the Company’s stock is trading at levels exceeding the conversion price per share of common stock, and if the Company elects to settle the obligation in cash, additional consideration beyond the $345.0 million of gross proceeds received would be required. At December 31, 2010, the Notes did not meet any of the criteria to allow the Notes to be redeemed at the holders’ discretion and are therefore not considered redeemable or convertible.
The Notes contain settlement features that require the Company to account for the liability and equity components of the Notes separately. The Company has calculated the fair value of the liability component using an interest rate of 8.36% per annum.
On July 1, 2010 the Company commenced a tender offer to purchase any and all of the outstanding Notes for an amount in cash equal to $990 per $1,000 principal amount of the Notes validly tendered and accepted for purchase plus accrued and unpaid interest up to, but not including, the date of purchase. The tender offer expired August 4, 2010, and the Company purchased and extinguished 98.4% of the $345.0 million outstanding principal amount of the Notes, or $339.4 million, for $336.0 million. An additional $2.2 million was paid for accrued and unpaid interest. On September 14, 2010, at $990 per $1,000 principal amount, the Company purchased and extinguished $2.5 million of the remaining outstanding principal amount of the Notes for $2.5 million, including accrued and unpaid interest. As of December 31, 2010, $3.1 million principal amount of the Notes remained outstanding. Of the $338.5 million paid, $25.0 million was attributed to the reacquisition of the equity component of the Notes. As a result of both transactions, the Company recognized a loss on debt extinguishment of $4.3 million, which represents the $2.5 million unamortized debt issuance costs related to the extinguished Notes, the $1.4 million difference between the fair value attributed to the liability component and the carrying value of the Notes at extinguishment and the $0.4 million fees paid to third parties for the facilitation of the transactions.
The following table summarizes the carrying amounts of the equity and liability components of the Notes, along with the unamortized discount and net carrying amount of the liability component.
| December 31, | ||||||||
| 2010 | 2009 | |||||||
| Equity component |
$ | 654 | $ | 72,609 | ||||
| Liability component: |
||||||||
| Principal amount |
$ | 3,106 | $ | 345,000 | ||||
| Unamortized discount |
(219 | ) | (39,079 | ) | ||||
| Net carrying amount |
$ | 2,887 | $ | 305,921 | ||||
66
Table of Contents
The following table summarizes the amount of interest cost recognized for the periods relating to both the contractual interest and the accretion of the discount of the liability component of the Notes:
| Year Ended December 31, | ||||||||||||
| 2010 | 2009 | 2008 | ||||||||||
| Interest at 3% stated coupon rate |
$ | 6,196 | $ | 10,350 | $ | 10,350 | ||||||
| Discount amortization |
8,989 | 14,320 | 13,194 | |||||||||
| Total interest expense |
$ | 15,185 | $ | 24,670 | $ | 23,544 | ||||||
The debt issuance costs related to the Notes, net of accumulated amortization, were $0.02 million as of December 31, 2010.
Debt Covenants
Under the terms of the Company’s Term Loan and Revolver agreements, we are required to comply with certain financial covenant ratios consisting of quarter covenants for maximum total leverage and minimum fixed charge coverage ratios and annual maximum capital expenditures. As of December 31, 2010, the Company was in compliance with such financial covenants.
The provisions of the Company’s debt agreements contain covenants including, but not limited to, maintaining specified financial conditions, restricting or limiting the Company’s ability to incur more debt, issue guarantees, pay dividends, make capital expenditures and repurchase stock (subject to financial measures and other conditions). The Company was in compliance with all such covenants as of and during the year ended December 31, 2010, and anticipates compliance with all covenants for at least the next twelve months. However, the ability to comply with these provisions may be affected by events beyond the Company’s control. The breach of any of these covenants could result in a default under the Company’s debt agreements and could trigger cross defaults and acceleration of repayment.
Loss on Debt Extinguishment
As a result of the August 4, 2010 refinancing transaction and September 14, 2010 Notes retirement, the Company recognized an $8.7 million loss on debt extinguishment during the year ended December 31, 2010. This loss on debt extinguishment consisted of $6.1 million unamortized deferred financing costs, a $1.4 million loss representing the difference between the fair value and carrying value of the Notes, and $1.2 million in costs primarily related to bank and legal fees.
Future Principal Payments
As of December 31, 2010, aggregate future principal payments of long-term debt were $5.5 million, $8.6 million, $5.5 million, $5.5 million, $5.5 million and $521.1 million for the years ended December 31, 2011, 2012, 2013, 2014, 2015 and thereafter, respectively. Depending on settlement options at the Company’s election, the Notes, which mature in May 2012, may be settled in cash, shares, or a combination thereof. The weighted-average cash interest rate applicable to outstanding borrowings was 6.7% and 3.2% as of December 31, 2010 and 2009, respectively.
NOTE 10—DERIVATIVES
The Company is exposed to certain risks relating to its ongoing business operations. The primary risks managed by using derivative instruments are foreign currency exchange rate risk and variable interest rate risk. The fair value of the Company’s cash flow hedges are recorded as assets or liabilities, as applicable, on the balance sheet with the offset in accumulated other comprehensive loss. To the extent that the periodic changes in the fair value of the derivatives are not effective, or if the hedge ceases to qualify for hedge accounting, the ineffective portion of the non-cash changes are recognized immediately in the consolidated statement of operations in the period of the change. As the hedged items impact earnings, the related hedging gains or losses are reclassified from accumulated other comprehensive loss and recognized in the consolidated statements of operations.
Foreign Currency Hedges
The Company engages in foreign currency hedging transactions to mitigate its foreign currency exchange risk. The Company had recorded a foreign currency hedge liability of $0.1 million as of December 31, 2009. There were no foreign currency hedges in place as of December 31, 2010.
67
Table of Contents
Interest Rate Swap
On August 2, 2010, the Company terminated its interest rate swap agreement (the Swap Agreement) with National Westminster Bank, Plc (NatWest), for £2.0 million, or approximately $3.2 million. In January 2009, the Company had dedesignated its existing interest rate swap and redesignated a new interest rate swap by entering into the Swap Agreement. At the time of dedesignation, the fair value of the existing interest rate swap was £2.5 million, which represented the financing element of the Swap Agreement, and was to be amortized to earnings as the originally hedged cash flows affect earnings. The Swap Agreement hedged the monthly interest payments incurred and paid under the Lombard Loan Agreement during the three year period beginning January 1, 2009 and ending December 31, 2011. Under the terms of the Swap Agreement, the Company owed monthly interest to NatWest at a fixed LIBOR rate of 5.06%, and received from NatWest payments based on the same variable notional amount at the one month LIBOR interest rate set at the beginning of each month. The Swap Agreement effectively fixed the interest payments paid under the Lombard Loan Agreement at 7.86%. During the year ended December 31, 2010, the Company recognized a $0.8 million gain on hedge ineffectiveness in the consolidated statement of operations, which was offset by $0.8 million in amortization of the financing element of the Swap Agreement. At settlement, the market value of the interest rate swap was a non-current liability of £2.0 million, or approximately $3.2 million. The Company recognized a loss on settlement of £2.0 million, or approximately $3.1 million, in other income and expense.
Interest Rate Cap
On September 30, 2010, the Company, as required by the Term Loan, entered into an interest rate cap hedge agreement (the Cap Agreement) with Bank of America, N.A. (BOA). The Cap Agreement caps the three month Eurodollar interest rate paid to BOA on a beginning notional principal amount of $155.0 million of Term Loan outstanding. During the three year period beginning October 4, 2010 and ending October 3, 2013, the notional amount of the Cap Agreement declines by the 0.25% quarterly principal amortization of the Term Loan as it applies to the original notional principal amount. The Cap Agreement effectively caps the interest rates paid to BOA on the then outstanding capped notional principal amount of the Term Loan at 3.0% during year one, 3.5% during year two and 4.0% during year three. During the year ended December 31, 2010, the Company did not recognize any gains or losses on the Cap Agreement. The fair value of the Cap Agreement was $0.5 million at December 31, 2010.
The following table presents the terms of the Cap Agreement:
| December 31, 2010 |
October 4, 2011 |
October 4, 2012 |
October 3, 2013 |
|||||||||||||
| Cap Agreement |
||||||||||||||||
| Notional amount |
$ | 155,000 | $ | 153,450 | $ | 151,900 | $ | 150,738 | ||||||||
| Interest rate |
3.0 | % | 3.5 | % | 4.0 | % | 4.0 | % | ||||||||
Balance Sheet Presentation
The Company’s interest rate cap is presented within other current assets. The foreign currency hedges and the interest rate swap were presented on a net basis in other current or non-current accrued liabilities.
The following table summarizes the fair value of the derivatives on a net basis:
| December 31, 2010 |
December 31, 2009 |
|||||||
| Assets: |
||||||||
| Interest rate cap |
$ | 470 | $ | — | ||||
| Liabilities: |
||||||||
| Interest rate swap |
— | (3,177 | ) | |||||
| Foreign currency hedges |
— | (116 | ) | |||||
| $ | 470 | $ | (3,293 | ) | ||||
Income Statement Presentation
Realized gains and losses represent amounts related to the settlement of derivative instruments, which are reported on the consolidated statement of operations in other income and expense. All of the Company’s derivative instruments are cash flow hedges; as such, unrealized gains and losses, which represent the change in fair value of the derivative instruments, are recorded as a component of other comprehensive loss.
68
Table of Contents
The following table presents the Company’s realized gains and losses on derivative instruments:
| Year Ended December 31, | ||||||||||||
| 2010 | 2009 | 2008 | ||||||||||
| Realized gains (losses) |
||||||||||||
| Interest rate swap (1) |
$ | (4,568 | ) | $ | (937 | ) | $ | — | ||||
| Interest rate cap |
— | — | — | |||||||||
| Foreign currency hedges |
(167 | ) | 167 | — | ||||||||
| $ | (4,735 | ) | $ | (770 | ) | $ | — | |||||
| (1) | The year ended December 31, 2010 includes the $3.1 million realized loss on the settlement of the interest rate swap. |
NOTE 11—CAPITAL AND FINANCING METHOD LEASE OBLIGATIONS
The following table presents future minimum lease payments under capital and financing method leases as of December 31, 2010:
| Years Ended December 31, |
||||
| 2011 |
$ | 41,814 | ||
| 2012 |
39,882 | |||
| 2013 |
37,787 | |||
| 2014 |
37,666 | |||
| 2015 |
37,812 | |||
| Thereafter |
175,005 | |||
| Total capital and financing method lease obligations |
369,966 | |||
| Less amount representing interest |
(191,676 | ) | ||
| Less current portion |
(12,381 | ) | ||
| Capital and financing method lease obligations, net |
$ | 165,909 | ||
Financing method lease obligation payments represent interest payments over the term of the lease; as such, the table above excludes a $50.6 million deferred gain that will be realized upon termination of the lease in accordance with accounting rules for financing method leases.
In December 2010, the Company signed a lease agreement for a new data center facility located in Piscataway, New Jersey. The approximately $35.4 million of capital lease obligation related to this 16 year agreement are not included in the above table, as payments do not commence until the data center construction is complete.
NOTE 12—OPERATING LEASES
The following table presents future minimum lease payments under non-cancelable operating leases as of December 31, 2010:
| Years Ended December 31, |
||||
| 2011 |
$ | 74,418 | ||
| 2012 |
67,968 | |||
| 2013 |
61,253 | |||
| 2014 |
46,678 | |||
| 2015 |
43,073 | |||
| Thereafter |
297,512 | |||
| Total future minimum lease payments |
$ | 590,902 | ||
Rental expense under non-cancelable operating leases was $80.2 million, $81.3 million and $71.5 million for the years ended December 31, 2010, 2009 and 2008, respectively.
69
Table of Contents
NOTE 13—OTHER ACCRUED LIABILITIES
The following table presents the components of other current and non-current accrued liabilities as of December 31, 2010 and 2009:
| December 31, 2010 |
December 31, 2009 |
|||||||
| Other current accrued liabilities: |
||||||||
| Deferred revenue |
$ | 25,129 | $ | 20,829 | ||||
| Wages, employee benefits, and related taxes |
22,024 | 18,470 | ||||||
| Taxes payable |
3,365 | 4,221 | ||||||
| Other current liabilities |
33,583 | 24,794 | ||||||
| Total other current accrued liabilities |
$ | 84,101 | $ | 68,314 | ||||
| Other non-current accrued liabilities: |
||||||||
| Asset retirement obligations |
$ | 30,567 | $ | 29,653 | ||||
| Deferred rent |
17,524 | 16,622 | ||||||
| Acquired contractual obligations in excess of fair value and other |
12,131 | 13,823 | ||||||
| Deferred revenue |
13,873 | 8,728 | ||||||
| Other non-current liabilities |
842 | 7,626 | ||||||
| Total other non-current accrued liabilities |
$ | 74,937 | $ | 76,452 | ||||
Acquired contractual obligations in excess of fair value and other as of December 31, 2010 and 2009 represent amounts remaining from acquisitions related to fair market value adjustments of acquired facility leases and idle capacity on acquired long-term maintenance contracts that the Company did not intend to utilize.
NOTE 14—ASSET RETIREMENT OBLIGATIONS
The Company records asset retirement obligations (AROs) related to contractual requirements of the Company to restore and remove certain leasehold improvements. Accordingly, the Company records corresponding increases to the carrying values of the related long-lived assets at the time a lease agreement is executed. The Company depreciates the leasehold improvements using the straight-line method and recognizes accretion expense over their estimated useful lives.
The following table presents a reconciliation of AROs as of December 31, 2010 and 2009:
| December 31, | ||||||||
| 2010 | 2009 | |||||||
| Balance at beginning of year |
$ | 29,653 | $ | 27,750 | ||||
| Liabilities incurred or acquired |
213 | 90 | ||||||
| Liabilities settled |
(1,429 | ) | (152 | ) | ||||
| Revisions in expected cash flows |
— | (22 | ) | |||||
| Accretion expense |
2,130 | 1,987 | ||||||
| Balance at end of year |
$ | 30,567 | $ | 29,653 | ||||
NOTE 15—COMMITMENTS, CONTINGENCIES, AND OFF-BALANCE SHEET ARRANGEMENTS
The Company’s client contracts generally span multiple periods, which results in the Company entering into arrangements with various suppliers of communications services that require the Company to maintain minimum spending levels, some of which increase over time, to secure favorable pricing terms. The Company’s remaining aggregate minimum spending levels, allocated ratably over the terms of such contracts, are $41.8 million, $13.9 million, $9.7 million, $8.3 million, $8.3 million, and $43.7 million during the years ended December 31, 2011, 2012, 2013, 2014, 2015 and thereafter, respectively. Should the Company not meet the minimum spending levels in any given term, decreasing termination liabilities representing a percentage of the remaining contractual amounts may become immediately due and payable. Furthermore, certain of these termination liabilities are potentially subject to reduction should the Company experience the loss of a major client or suffer a loss of revenue from a general economic downturn. Before considering the effects of any potential reductions for the business downturn provisions, if the Company had terminated all of these agreements as of December 31, 2010, the maximum termination liability would have been $125.7 million. To mitigate this exposure, at times, the Company aligns its minimum spending commitments with client revenue commitments for related services.
70
Table of Contents
In the normal course of business, the Company is a party to certain guarantees and financial instruments with off-balance sheet risk as they are not reflected in the accompanying consolidated balance sheets, such as letters of credit, indemnifications and operating leases under which certain facilities are leased. The agreements associated with such guarantees and financial instruments mature at various dates through January 2031, and may be renewed as circumstances warrant. As discussed in Note 9, the Company had $15.9 million in letters of credit outstanding at December 31, 2010, which are pledged as collateral to primarily support certain facility leases and utility agreements. Also, in connection with its 2007 sale of the assets related to its content delivery network services, the Company agreed to indemnify the purchaser should it incur certain losses due to a breach of the Company’s representations and warranties. The Company has not incurred a liability relating to these indemnification provisions in the past, and management believes that the likelihood of any future payout relating to these provisions is remote. As such, the Company has not recorded a liability during any period related to these indemnification provisions.
The Company’s guarantees and financial instruments are valued based on the estimated amount of exposure and the likelihood of performance being required. To management’s knowledge, no claims have been made against these guarantees and financial instruments nor does it expect exposure to material losses resulting therefrom. As a result, the Company determined such guarantees and financial instruments do not have significant value and has not recorded any related amounts in its consolidated financial statements.
The Company is subject to various legal proceedings and actions arising in the normal course of its business. While the results of all such proceedings and actions cannot be predicted, management believes, based on facts known to management today, that the ultimate outcome of all such proceedings and actions will not have a material adverse effect on the Company’s consolidated financial position, results of operations or cash flows.
The Company has employment agreements with key executive officers that contain provisions with regard to base salary, bonus, equity-based compensation and other employee benefits. These agreements also provide for severance benefits in the event of employment termination or a change in control of the Company.
NOTE 16—ACCUMULATED OTHER COMPREHENSIVE LOSS
The following table presents accumulated other comprehensive loss as of December 31, 2010 and 2009:
| December 31, 2010 |
December 31, 2009 |
|||||||
| Foreign currency translation |
$ | (12,625 | ) | $ | (15,938 | ) | ||
| Unrealized loss on derivatives (1) |
(17 | ) | (3,195 | ) | ||||
| Accumulated other comprehensive loss |
$ | (12,642 | ) | $ | (19,133 | ) | ||
| (1) | Includes foreign currency cash flow hedges, interest rate swap and interest rate cap. |
NOTE 17—EQUITY-BASED COMPENSATION
As of December 31, 2010, the Company had two equity-based compensation plans – the Amended and Restated 2003 Incentive Compensation Plan and the 1999 Stock Option Plan, as amended, collectively referred to as the Plans. The Plans provide for the grant of stock options, stock appreciation rights, restricted stock, unrestricted stock, stock units, dividend equivalent rights and cash awards. Any of these awards may be granted as incentives to reward and encourage individual contributions to the Company. As of December 31, 2010, the Plans had 15.9 million shares authorized for grants of equity-based instruments, of which 5.2 million shares were associated with outstanding instruments. Stock options generally expire 10 years from the date of grant and have graded vesting over four years. Restricted stock awards granted to non-employee directors have graded vesting over three years and awards granted to certain employees have graded vesting over periods between one and two years. Restricted stock units granted to certain employees have performance features and graded vesting over periods up to four years. Restricted preferred units granted to certain executives have graded vesting over four years. The Company generally issues new shares of common stock upon exercise of equity-based compensation awards.
Equity-based compensation expense is recognized on a straight-line basis over the vesting period for equity-based awards. The Company recognized total non-cash equity-based compensation expense of $25.7 million, $29.1 million and $23.0 million for the years ended December 31, 2010, 2009 and 2008, respectively. The majority of these amounts were reflected in selling, general and administrative expenses in the accompanying consolidated statements of operations, with the remainder included in cost of revenue. As of December 31, 2010, the Company had $28.9 million, net of estimated forfeitures, of unrecognized compensation cost related to unvested equity-based compensation that is expected to be ultimately recognized, which includes 2.0 million restricted stock units, 0.02 million shares of restricted common stock, and 3.2 million stock options with a weighted-average exercise price of $12.65 per common share. As the restricted preferred units have an exercise price, the Company accounts for them as stock appreciation rights. The unrecognized compensation cost is expected to be recognized over a weighted-average period of 2.6 years.
71
Table of Contents
The following table presents information associated with the Company’s non-cash equity-based compensation awards for the year ended December 31, 2010 (in thousands, except weighted-average figures):
| Year Ended December 31, 2010 | ||||||||||||||||||||||||
| Restricted Stock Units |
Restricted Stock |
Options and Restricted Preferred Units |
Weighted- Average Exercise Price |
Weighted- Average Remaining Life |
Total Intrinsic Value of Options |
|||||||||||||||||||
| Outstanding at beginning of year |
712 | 319 | 5,706 | $ | 12.28 | |||||||||||||||||||
| Granted |
1,673 | 22 | 778 | 15.60 | ||||||||||||||||||||
| Exercised |
(115 | ) | (293 | ) | (2,235 | ) | 20.03 | |||||||||||||||||
| Forfeited |
(196 | ) | (17 | ) | (925 | ) | 15.10 | |||||||||||||||||
| Cancelled |
(69 | ) | (7 | ) | (159 | ) | 12.29 | |||||||||||||||||
| Outstanding at end of year |
2,005 | 24 | 3,165 | 12.65 | 8.01 years | $ | 41,085 | |||||||||||||||||
| Exercisable at end of year |
1,195 | 12.13 | 7.02 years | 16,292 | ||||||||||||||||||||
Total intrinsic value represents the value of the Company’s closing stock price on the last trading day of the fiscal period in excess of the exercise price multiplied by the number of options outstanding or exercisable. Total intrinsic value of options and restricted preferred units (RPUs) at the time of exercise was $18.6 million, $0.2 million and $3.1 million for the years ended December 31, 2010, 2009 and 2008, respectively.
During the year ended December 31, 2010, certain restricted stock units (RSUs) and restricted stock awards (RSAs) vested and were exchanged or exercised by employees for shares of common stock. Under the terms of the award agreements, the Company withheld 0.2 million shares of common stock upon vesting to satisfy minimum employee tax withholding requirements that arose in connection with such vesting. As a result, the Company cash funded the statutory minimum tax withholdings which resulted in a reduction of additional paid-in capital of $3.3 million for the year ended December 31, 2010.
During 2010, the Company granted 0.8 million stock options under the 2003 Plan, with total compensation expense of $7.2 million to be recognized over the vesting period, using the Black-Scholes option pricing model. Compensation expense associated with stock options was $13.0 million, $18.4 million and $11.6 million in the years ended December 31, 2010, 2009 and 2008, respectively.
The following table presents the Company’s assumptions utilized in the Black-Scholes option pricing model in the determination of the grant date fair value of stock options and RPUs:
| Years Ended December 31, | ||||||
| 2010 | 2009 | 2008 | ||||
| Weighted-average fair value |
$9.26 | $6.04 | $8.96 | |||
| Expected volatility |
52.3% - 81.73% | 76.3% - 80.3% | 68.0% - 77.5% | |||
| Risk-free interest rate |
2.0% - 3.5% | 1.6% - 2.1% | 1.7% - 2.9% | |||
| Expected option life (in years) |
1.0 - 4.0 | 3.3 - 4.0 | 3.1 - 4.0 | |||
| Dividend yield |
— | — | — | |||
Expected volatility is determined based on historical stock volatility over the expected term of the award. The risk-free interest rate is determined using an interest rate yield on U.S. Treasury instruments with a term equivalent to the award at the date of grant. The expected option life is the calculated term of options based on historical employee exercise patterns experienced for similar awards. The dividend yield is assumed to be zero based on the Company’s intent to not declare dividends in the foreseeable future.
Due to increases in forfeiture activity in 2008, the Company revised the forfeiture rate used to calculate non-cash equity-based compensation expense. As a result, the Company recorded a cumulative adjustment of $12.2 million, of which $6.8 million related to 2006 and 2007, reducing non-cash equity-based compensation expense during the year ended December 31, 2008. An additional adjustment was made in the fourth quarter of 2009 resulting in a $2.2 million reduction of non-cash equity-based compensation expense during the year ended December 31, 2009.
In addition to granting stock options, RSAs, RSUs and RPUs, the Company established an employee stock purchase plan (ESPP) in 2007 that allows employees to purchase Company stock at a specified discount. The Company recognized expense of $1.1 million, $0.6 million and $0.4 million for the years ended December 31, 2010, 2009 and 2008, respectively. Shares purchased under the ESPP were 0.1 million, 0.1 million and 0.1 million for the years ended December 31, 2010, 2009 and 2008, respectively.
72
Table of Contents
NOTE 18—INCOME TAXES
The following table presents the components of loss from continuing operations before income taxes for the years ended December 31, 2010, 2009 and 2008:
| Years Ended December 31, | ||||||||||||
| 2010 | 2009 | 2008 | ||||||||||
| Domestic operations |
$ | (55,420 | ) | $ | (14,251 | ) | $ | (17,865 | ) | |||
| Foreign operations |
405 | (3,866 | ) | (1,105 | ) | |||||||
| Loss from continuing operations before income taxes |
$ | (55,015 | ) | $ | (18,117 | ) | $ | (18,970 | ) | |||
For the year ended December 31, 2008, the Company had taxable income without ability to utilize NOL carryforwards and, accordingly, recorded income tax expense of $3.0 million, of which $2.0 million related to alternative minimum taxes. This amount was comprised of $1.2 million for federal taxes and $0.8 million for state taxes. For the year ended December 31, 2009, the Company has taxable income without ability to utilize NOL carryforwards and, accordingly, recorded income tax expense of $2.7 million, of which $2.4 million related to alternative minimum taxes. This amount is comprised of $1.2 million for federal taxes and $1.2 million for state taxes. For the year ended December 31, 2010, the Company has recorded an overall income tax benefit of $1.0 million, which is primarily attributable to the $1.1 million deferred tax benefit recorded on the post-acquisition Fusepoint tax losses, which are expected to be utilized in future periods.
With the exception of the net deferred tax asset position on Fusepoint operations, the Company maintains a full valuation allowance on net deferred tax assets arising primarily from NOL carryforwards and other tax attributes because the future realization of such benefits is uncertain. As a result, to the extent that those benefits are realized in future periods, they will favorably affect tax expense and net income. The deferred tax assets on the Company’s legacy business, including NOL and minimum tax credit carryforwards, have been fully offset by a valuation allowance of $160.9 million and $132.7 million as of December 31, 2010 and 2009, respectively.
The following table presents the components of deferred income tax assets and liabilities as of December 31, 2010 and 2009:
| December 31, | ||||||||||
| 2010 | 2009 | |||||||||
| Deferred income tax assets: |
||||||||||
| Net operating loss carryforwards |
$ | 72,635 | $ | 65,189 | ||||||
| Deferred revenue |
5,387 | 6,342 | ||||||||
| Accrued payroll |
3,477 | 2,222 | ||||||||
| Allowance for doubtful accounts |
3,009 | 3,141 | ||||||||
| Non-cash equity-based compensation |
28,387 | 22,791 | ||||||||
| Fixed assets including leases |
29,944 | 28,765 | ||||||||
| Alternative minimum tax credit carryforward |
4,613 | 4,681 | ||||||||
| Interest on convertible notes |
(85 | ) | (15,207 | ) | ||||||
| Other |
13,634 | 14,790 | ||||||||
| Total deferred tax assets |
161,001 | 132,714 | ||||||||
| Valuation allowance |
(160,853 | ) | (132,714 | ) | ||||||
| Net deferred tax assets |
$ | 148 | $ | — | ||||||
Section 382 of the Internal Revenue Code (IRC) limits the Company’s ability to utilize its U.S. NOLs and other attribute carryforwards against future U.S. taxable income in the event of an ownership change. Management believes that ownership changes, as defined by Section 382 of the IRC, occurred in 2002 and 2007 and that Section 382 would restrict the utilization of pre-2003 NOLs to $4.6 million per year. Management has concluded that the 2007 tax ownership change should not affect the Company’s ability to utilize its post-2002 NOLs.
73
Table of Contents
As of December 31, 2010, the Company had approximately $154.2 million in U.S. NOLs scheduled to expire between 2020 and 2030, of which $56.6 million is estimated to be subject to the Section 382 annual limitation relating to the ownership change that occurred in 2002 and $62.1 million is estimated to be subject to the Section 382 annual limitation relating to the ownership change that occurred in 2007. This carryforward excludes $69.1 million of additional NOLs due to recognition limitations prescribed by equity-based compensation guidance, which are available from an income tax return perspective.
As of December 31, 2010, the Company’s foreign subsidiaries have approximately $33.6 million in NOLs, primarily in the countries of Canada, Switzerland, the Netherlands, Singapore, Japan and Hong Kong, each having unlimited carryforward periods.
For the years ended December 31, 2010, 2009 and 2008, income tax expense differed from the statutory federal income tax expense as follows:
| Years Ended December 31, | ||||||||||||
| 2010 | 2009 | 2008 | ||||||||||
| Federal tax (benefit) expense, at corporate statutory rate |
$ | (19,446 | ) | $ | (6,341 | ) | $ | (6,639 | ) | |||
| State tax (benefit) expense, net of federal tax |
(2,139 | ) | (684 | ) | (778 | ) | ||||||
| Change in valuation allowance, primarily due to NOLs |
16,578 | 6,564 | 5,872 | |||||||||
| Change in valuation allowance, alternative minimum taxes |
76 | 2,784 | 2,108 | |||||||||
| Uncertain tax position adjustments |
11 | (56 | ) | 888 | ||||||||
| Foreign rate differential |
197 | — | — | |||||||||
| Permanent items |
3,728 | 462 | 1,545 | |||||||||
| Income tax (benefit) expense |
$ | (995 | ) | $ | 2,729 | $ | 2,996 | |||||
The following table provides a reconciliation of unrecognized tax benefits for the year ended December 31, 2010:
| Years Ended December 31, | ||||||||||||
| 2010 | 2009 | 2008 | ||||||||||
| Unrecognized tax benefits at beginning of year |
$ | 1,583 | $ | 1,639 | $ | 751 | ||||||
| Adjustments to unrecognized tax benefits: |
||||||||||||
| Tax positions taken in prior periods |
— | — | — | |||||||||
| Tax positions taken in the current period |
11 | (56 | ) | 888 | ||||||||
| Unrecognized tax benefits at end of year |
$ | 1,594 | $ | 1,583 | $ | 1,639 | ||||||
The Company has not expensed, and does not maintain any accrual balances, for interest and penalties related to unrecognized tax benefits. For future periods in which the Company may incur unrecognized tax benefits or uncertainties, the Company would classify any associated interest and penalties as a component of its income tax provision.
The Company’s income tax returns for all tax years remain open to examination by federal and state taxing authorities due to the Company’s NOLs. In addition, the Company is also subject to examination by local tax authorities in certain foreign jurisdictions in which the Company has major operations.
NOTE 19—RETIREMENT SAVINGS PLAN
The Company has a 401(k) retirement savings plan for the benefit of qualified employees. All active employees at least 21 years of age are eligible to participate and may contribute a portion of their compensation to the plan. The Company matched 50% of employee contributions up to a maximum of 8% of total compensation in 2010, 2009 and 2008. Company contributions under the plan vest over three years. The Company recorded $5.3 million, $5.0 million and $4.9 million in employer matching contribution expense during the years ended December 31, 2010, 2009 and 2008, respectively.
74
Table of Contents
NOTE 20—INDUSTRY SEGMENT AND GEOGRAPHIC REPORTING
Operating segments are defined as components of an enterprise about which separate financial information is available that is evaluated on a regular basis by the chief operating decision maker in deciding how to allocate resources to an individual segment and in assessing performance of the segment. During the fourth quarter of 2009, the Company’s chief operating decision maker, which is defined as the chief executive officer, began to manage the Company’s business differently, separating management by product and using different information than was previously used. As a result, the Company now has two reportable segments based on services: hosting and network. Hosting services consist of colocation and managed hosting services and provide the core facilities, computing, data storage and network infrastructure on which to run business applications. Network services are comprised of managed network services, hosting area network, application transport and bandwidth services.
Management of the Company evaluates the performance of the two segments primarily based on revenue and adjusted EBITDA. Adjusted EBITDA is defined as income from continuing operations before depreciation, amortization and accretion, and non-cash equity-based compensation. The Company uses adjusted EBITDA as a performance measure because they believe that such information is a relevant measure of a company’s operating performance and liquidity in their industry. The calculation of adjusted EBITDA is not specified by U.S. generally accepted accounting principles. The Company’s calculation of adjusted EBITDA may not be comparable to similarly titled measures of other companies.
The follow table presents operating segment results for the years indicated, and excludes the results of the Company’s discontinued operations:
| For the year ended December 31 | ||||||||||||
| 2010 | 2009 | 2008 | ||||||||||
| Revenue |
||||||||||||
| Hosting |
$ | 673,352 | $ | 607,296 | $ | 564,509 | ||||||
| Network |
259,632 | 267,118 | 292,532 | |||||||||
| Total revenue |
$ | 932,984 | $ | 874,414 | $ | 857,041 | ||||||
| Adjusted EBITDA |
||||||||||||
| Hosting |
$ | 261,259 | $ | 239,290 | $ | 204,831 | ||||||
| Network |
65,743 | 67,610 | 66,297 | |||||||||
| Corporate – other (1) |
(95,931 | ) | (86,877 | ) | (86,503 | ) | ||||||
| Total adjusted EBITDA |
$ | 231,071 | $ | 220,023 | $ | 184,625 | ||||||
| Capital Expenditures (2) |
||||||||||||
| Hosting |
$ | 159,307 | $ | 96,606 | ||||||||
| Network |
28,873 | 21,372 | ||||||||||
| Other capital expenditures (3) |
14,374 | 14,958 | ||||||||||
| Total capital expenditures |
$ | 202,554 | $ | 132,936 | ||||||||
| (1) | Corporate - other adjusted EBITDA includes all general and administrative costs not directly associated with hosting services or network services. Costs not directly associated with hosting services or network services include, but are not limited to, acquisition and integration costs and costs related to the finance, accounting, legal, human resources, and internal IT departments. |
| (2) | In 2009, the Company began evaluating its business based on a segmented product view and using different information than was previously utilized. Additionally, the Company implemented a new enterprise resource planning system in 2009, which allows the Company to track capital expenditures by segment. Due to these factors, the Company does not have the necessary information to disclose cash capital expenditures by segment for the year ended December 31, 2008. |
| (3) | Other cash capital expenditures includes general office equipment, capitalized costs and equipment related to administrative space, systems upgrades, and any other capital expenditures not directly associated with the Company’s hosting or network segments. |
As the Company’s segments are based on services, with the exception of non-cash equity-based compensation and depreciation, amortization and accretion, the components of cost of revenue can be directly tied to the appropriate segment. Total selling, general and administrative costs can be broken down into sales and marketing and general and administrative. A portion of sales and marketing expenses are directly related to a specific service, such as the direct sales forces, and the remainder of the costs are allocated to segments based on a percentage of client installations or bookings, as applicable, during the period and, as a result, may fluctuate. The majority of general and administrative costs are allocated to the corporate – other segment, as the costs primarily relate to corporate groups such as finance, legal, human resources and internal IT. Less than 10% of the general and administrative costs can be attributed directly to a segment, and these consist of costs for the Company’s WAM!Net engineering and cloud teams. The Company does not allocate the components of other income and expense or tax expense to segments.
75
Table of Contents
Total assets, depreciation, amortization and accretion, non-cash equity-based compensation, interest income and expense, and income tax expense by segment have not been disclosed by segment as the information is not available to the Company’s chief operating decision maker.
The following table presents a reconciliation of adjusted EBITDA to income from continuing operations and a reconciliation of adjusted EBITDA to loss from continuing operations before income taxes:
| Years Ended December 31, | ||||||||||||
| 2010 | 2009 | 2008 | ||||||||||
| Adjusted EBITDA reconciliation |
||||||||||||
| Income from continuing operations |
$ | 24,490 | $ | 40,067 | $ | 26,533 | ||||||
| Depreciation, amortization and accretion |
180,903 | 150,854 | 135,123 | |||||||||
| Non-cash equity-based compensation |
25,678 | 29,102 | 22,969 | |||||||||
| Adjusted EBITDA |
$ | 231,071 | $ | 220,023 | $ | 184,625 | ||||||
| Reconciliation of adjusted EBITDA to loss from continuing operations before income taxes |
||||||||||||
| Adjusted EBITDA |
$ | 231,071 | $ | 220,023 | $ | 184,625 | ||||||
| Depreciation, amortization and accretion |
(180,903 | ) | (150,854 | ) | (135,123 | ) | ||||||
| Non-cash equity-based compensation |
(25,678 | ) | (29,102 | ) | (22,969 | ) | ||||||
| Interest income |
126 | 226 | 3,364 | |||||||||
| Interest expense |
(67,571 | ) | (57,976 | ) | (50,450 | ) | ||||||
| Loss on debt extinguishment |
(8,735 | ) | — | — | ||||||||
| Other income (expense) |
(3,325 | ) | (434 | ) | 1,583 | |||||||
| Loss from continuing operations before income taxes |
$ | (55,015 | ) | $ | (18,117 | ) | $ | (18,970 | ) | |||
| The table below presents selected financial information for the Company’s three geographic regions: Americas, EMEA (Europe, Middle East and Africa) and Asia, as of and for the years ended December 31, 2010, 2009 and 2008: | ||||||||||||
| Years Ended December 31, | ||||||||||||
| 2010 | 2009 | 2008 | ||||||||||
| Revenue |
||||||||||||
| Americas |
$ | 756,293 | $ | 724,269 | $ | 721,742 | ||||||
| EMEA |
128,781 | 110,084 | 101,303 | |||||||||
| Asia |
47,910 | 40,061 | 33,996 | |||||||||
| Total revenue |
$ | 932,984 | $ | 874,414 | $ | 857,041 | ||||||
| December 31, | ||||||||||||
| 2010 | 2009 | |||||||||||
| Property and equipment, net |
||||||||||||
| Americas |
$ | 701,841 | $ | 678,163 | ||||||||
| EMEA |
115,745 | 82,329 | ||||||||||
| Asia |
26,215 | 23,360 | ||||||||||
| Property and equipment, net |
$ | 843,801 | $ | 783,852 | ||||||||
For the years ended December 31, 2010, 2009 and 2008, revenue earned in the Americas represented approximately 81%, 83% and 84% of total revenue, respectively. Substantially all of the Company’s other non-current assets reside in the Americas geographic region.
76
Table of Contents
NOTE 21—QUARTERLY FINANCIAL DATA (UNAUDITED)
| Year Ended December 31, 2010 (by quarter) | ||||||||||||||||
| First | Second | Third | Fourth | |||||||||||||
| Revenue |
$ | 216,587 | $ | 221,756 | $ | 241,901 | $ | 252,740 | ||||||||
| Cost of revenue (1) |
119,368 | 120,221 | 131,597 | 129,563 | ||||||||||||
| Income from continuing operations (2) |
4,763 | 2,217 | 3,469 | 14,041 | ||||||||||||
| Loss from continuing operations (2) |
(11,349 | ) | (13,340 | ) | (26,225 | ) | (3,106 | ) | ||||||||
| Income (loss) from discontinued operations |
— | (90 | ) | (9 | ) | 160 | ||||||||||
| Net loss (2) |
(11,349 | ) | (13,430 | ) | (26,234 | ) | (2,946 | ) | ||||||||
| Basic loss per share from continuing operations (3) |
(0.21 | ) | (0.24 | ) | (0.47 | ) | (0.06 | ) | ||||||||
| Diluted loss per share from continuing operations (3) |
(0.21 | ) | (0.24 | ) | (0.47 | ) | (0.06 | ) | ||||||||
| Year Ended December 31, 2009 (by quarter) | ||||||||||||||||
| First | Second | Third | Fourth | |||||||||||||
| Revenue |
$ | 221,523 | $ | 219,861 | $ | 213,211 | $ | 219,819 | ||||||||
| Cost of revenue (1) |
120,521 | 121,441 | 117,945 | 120,428 | ||||||||||||
| Income from continuing operations (2) |
15,598 | 9,537 | 4,514 | 10,418 | ||||||||||||
| Loss from continuing operations (2) |
617 | (6,174 | ) | (9,930 | ) | (5,359 | ) | |||||||||
| Income (loss) from discontinued operations |
— | — | — | — | ||||||||||||
| Net loss (2) |
617 | (6,174 | ) | (9,930 | ) | (5,359 | ) | |||||||||
| Basic loss per share from continuing operations (3) |
0.01 | (0.12 | ) | (0.18 | ) | (0.10 | ) | |||||||||
| Diluted loss per share from continuing operations (3) |
0.01 | (0.12 | ) | (0.18 | ) | (0.10 | ) | |||||||||
| (1) | Excludes depreciation, amortization, and accretion, which are reported separately, and includes non-cash equity-based compensation expense of $1.6 million, $1.5 million, $1.5 million, $1.3 million, $1.5 million, $1.5 million, $1.5 million and $1.0 million for the first, second, third and fourth quarters of 2010 and 2009, respectively. |
| (2) | Includes non-cash equity-based compensation expense of $8.5 million, $6.5 million, $5.4 million, $5.2 million, $6.9 million, $7.8 million, $8.5 million and $6.0 million for the first, second, third and fourth quarters of 2010 and 2009, respectively. |
| (3) | Quarterly and annual computations are prepared independently. Therefore, the sum of per share amounts for the quarters may not agree exactly with per share amounts for the year. |
NOTE 22—SUBSEQUENT EVENTS
None.
77