Attached files
| file | filename |
|---|---|
| EX-12 - EXHIBIT 12 - IBERIABANK CORP | dex12.htm |
| EX-21 - EXHIBIT 21 - IBERIABANK CORP | dex21.htm |
| EX-31.1 - EXHIBIT 31.1 - IBERIABANK CORP | dex311.htm |
| EX-23.1 - EXHIBIT 23.1 - IBERIABANK CORP | dex231.htm |
| EX-99.1 - EXHIBIT 99.1 - IBERIABANK CORP | dex991.htm |
| EX-31.2 - EXHIBIT 31.2 - IBERIABANK CORP | dex312.htm |
| EX-32.1 - EXHIBIT 32.1 - IBERIABANK CORP | dex321.htm |
| EX-32.2 - EXHIBIT 32.2 - IBERIABANK CORP | dex322.htm |
| 10-K - FORM 10-K - IBERIABANK CORP | d10k.htm |
Exhibit 13
MANAGEMENT’S DISCUSSION AND ANALYSIS OF FINANCIAL CONDITION AND RESULTS OF OPERATIONS
The following discussion and analysis is intended to assist readers in understanding the consolidated financial condition and results of operations of IBERIABANK Corporation (the “Company”) and its wholly owned subsidiaries, IBERIABANK, Lenders Title Company (“LTC”), IBERIA Capital Partners, LLC (“ICP”), IB Aircraft Holdings, LLC, IBERIA Asset Management Inc. (“IAM”), and IBERIA CDE, LLC, as of December 31, 2010 and 2009 and for the years ended December 31, 2008 through 2010. This discussion should be read in conjunction with the audited consolidated financial statements, accompanying footnotes and supplemental financial data included herein.
The Company offers commercial and retail banking products and services to customers in locations in six states through IBERIABANK. The Company also operates mortgage production offices in 12 states through IBERIABANK’s subsidiary, IBERIABANK Mortgage Company (“IMC”), and offers a full line of title insurance and closing services throughout Arkansas and Louisiana through LTC and its subsidiaries. ICP provides equity research, institutional sales and trading, and corporate finance services. IB Aircraft Holdings, LLC owns a fractional share of an aircraft used by management of the Company and its subsidiaries. IAM provides wealth management and trust services for commercial and private banking clients. CDE is utilized to purchase tax credits.
EXECUTIVE OVERVIEW
The Company’s results of operations and financial condition were impacted by a number of significant events during 2010. Management undertook these strategic initiatives to position the Company for future growth through core earnings and provide additional capital to fund the Company’s growing operations.
During the year, the Company had solid growth in its balance sheet, both organically and through acquisitions, and continued growth in most core earnings drivers. During 2010, the Company fortified its capital position, enhanced its liquidity, expanded its customer base, created a new noninterest income channel through its capital markets group, and expanded its wealth management business. In addition, the Company successfully integrated and converted its recent Florida acquisitions to IBERIABANK’s processes and systems.
Acquisition Activity during 2010 and 2009
Consistent with the Company’s growth strategy over the past 12 years, the Company completed four acquisitions during 2010 and 2009 that significantly grew the Company’s asset base and extended the Company’s footprint into two new states. The Company’s results of operations, financial condition, and liquidity for the years ended December 31, 2010 and 2009 were significantly impacted by IBERIABANK’s whole-bank purchase and assumption of assets and liabilities of CapitalSouth Bank, a full-service commercial bank headquartered in Birmingham, Alabama (“CSB”), from the Federal Deposit Insurance Corporation (“FDIC”) on August 21, 2009; the whole-bank purchase and assumption of assets and liabilities of Orion Bank (“Orion”), a full-service Florida-chartered commercial bank headquartered in Naples, Florida, and Century Bank, FSB (“Century”), a full-service federal thrift headquartered in Sarasota, Florida, from the FDIC, each on November 13, 2009; and the whole-bank purchase and assumption of assets and liabilities of Sterling Bank (“Sterling”), a Florida state-chartered bank headquartered in Lantana, Florida, on July 23, 2010. As a result of the CSB acquisition, IBERIABANK now operates 10 former CSB branches in four Metropolitan Statistical Areas (“MSAs”): Birmingham, Montgomery, and Huntsville, Alabama, and Jacksonville, Florida. IBERIABANK now operates 23 former Orion branches in five Florida MSAs and 11 former Century branches in Sarasota and Bradenton, Florida after the Orion and Century acquisitions. IBERIABANK now operates six former Sterling branches in southeast Florida.
The four acquisitions were accounted for under the purchase method of accounting in accordance with Accounting Standards Codification (“ASC”) Topic No. 805. Major categories of assets purchased and liabilities assumed, as well as the gain recorded (if any) on each transaction (shown as total equity), are presented in the following table. Both the purchased assets and assumed liabilities were recorded at their respective acquisition date fair values. Identifiable intangible assets, including core deposit intangible assets, were recorded at fair value. Because the fair value of assets acquired and intangible assets created as a result of the acquisition exceeds the fair value of liabilities assumed in the CSB, Orion, and Century acquisitions, the provisions of ASC 805 allow the Company to record a gain resulting from each of these acquisitions in its consolidated statements of income in the period of acquisition. During the first quarter of 2010, the Company received notification of additional settlement items from the
FDIC and increased the total gain recorded on the transactions by $3.8 million. This gain adjustment is included in noninterest income on the Company’s consolidated statements of income for the year ended December 31, 2010.
During 2010, the Company revised its settlement liability with the FDIC on the Orion acquisition, the result of which was an increase in net income of $7.1 million for the year ended December 31, 2009. The final settlement liability was identified in 2010 through the operation of the Company’s internal control over financial reporting as it related to the Company’s acquisition accounting. As a result, the information included in this discussion, as well as the consolidated financial statements and footnotes, includes the effect this correction had on the previously reported financial statements for the year ended December 31, 2009. For additional information on this change, see Note 1 of the footnotes to the consolidated financial statements.
SUMMMARY OF 2010 AND 2009 ACQUISITION ACTIVITY
| (dollars in thousands) | CapitalSouth | Orion | Century | Sterling | Total | |||||||||||||||
| Assets |
||||||||||||||||||||
| Investment securities |
$ | 46,027 | $ | 230,968 | $ | 22,128 | $ | 53,551 | $ | 352,674 | ||||||||||
| Loans |
363,117 | 961,094 | 417,561 | 151,301 | 1,893,073 | |||||||||||||||
| Other real estate owned |
10,244 | 28,505 | 21,150 | 5,725 | 65,624 | |||||||||||||||
| Core deposit intangible |
377 | 10,421 | 2,243 | 1,568 | 14,609 | |||||||||||||||
| FDIC loss share receivable |
88,093 | 711,756 | 232,053 | 66,826 | 1,098,728 | |||||||||||||||
| Goodwill |
— | — | — | 7,148 | 7,148 | |||||||||||||||
| Other assets |
102,805 | 434,507 | 116,874 | 28,099 | 682,285 | |||||||||||||||
| Total Assets |
610,663 | 2,377,251 | 812,009 | 314,218 | 4,114,141 | |||||||||||||||
| Liabilities |
||||||||||||||||||||
| Interest-bearing deposits |
461,348 | 1,748,749 | 504,875 | 260,750 | 2,975,722 | |||||||||||||||
| Noninterest-bearing deposits |
56,543 | 134,337 | 110,940 | 26,264 | 328,084 | |||||||||||||||
| Borrowings |
30,619 | 344,690 | 143,006 | 26,295 | 544,610 | |||||||||||||||
| Other liabilities |
4,916 | 15,642 | 1,586 | 909 | 23,053 | |||||||||||||||
| Total Liabilities |
553,425 | 2,243,418 | 760,407 | 314,218 | 3,871,469 | |||||||||||||||
| Total Equity |
57,238 | 133,833 | 51,602 | — | 242,673 | |||||||||||||||
| Total Liabilities and Equity |
$ | 610,663 | $ | 2,377,251 | $ | 812,009 | $ | 314,218 | $ | 4,114,141 | ||||||||||
Other Acquisition Activity
In addition to the acquisitions completed during 2009 and 2010, the Company has been an active acquirer over the previous six years. From 2003 through 2008, the Company completed the following acquisitions, presented with intangible assets created and selected assets and liabilities acquired for each acquisition:
SUMMARY OF ACQUISITION ACTIVITY FROM 2003 TO 2008
| (dollars in millions) |
||||||||||||||||||||||||
| Acquisition |
Acquisition Date |
Total Assets Acquired |
Total Loans Acquired |
Total Deposits Acquired |
Goodwill | Other Intangible Assets |
||||||||||||||||||
| Acadiana Bancshares, Inc. |
2003 | $ | 308.1 | $ | 189.6 | $ | 210.0 | $ | 24.1 | $ | 4.4 | |||||||||||||
| Alliance Bank of Baton Rouge |
2004 | 71.7 | 53.1 | 61.8 | 5.2 | 1.2 | ||||||||||||||||||
| American Horizons Bancorp, Inc. |
2005 | 243.8 | 194.7 | 192.7 | 28.1 | 5.0 | ||||||||||||||||||
| Pulaski Investment Corporation |
2007 | 477.2 | 367.7 | 422.6 | 92.4 | 10.9 | ||||||||||||||||||
| Pocahontas Bankcorp, Inc. |
2007 | 700.2 | 409.9 | 582.4 | 42.0 | 7.0 | ||||||||||||||||||
| United Title of Louisiana, Inc. |
2007 | 0.4 | — | — | 4.2 | 1.2 | ||||||||||||||||||
| Kingdom Capital Management, Inc. |
2008 | 0.7 | — | — | 0.6 | — | ||||||||||||||||||
| American Abstract and Title Company |
2008 | 5.1 | — | — | 5.0 | — | ||||||||||||||||||
| ANB Financial, N.A. |
2008 | 239.9 | 1.9 | 189.7 | — | 1.9 | ||||||||||||||||||
| Total Acquisitions, 2003-2008 |
$ | 2,047.1 | $ | 1,216.9 | $ | 1,659.2 | $ | 201.6 | $ | 31.6 | ||||||||||||||
Balance Sheet Position and Results of Operations
The Company’s income available to common shareholders for 2010 totaled $48.8 million, or $1.88 per share on a diluted basis, a 68.5% decrease compared to the $155.0 million earned for 2009. On a per share basis, this represents a 77.6% decrease from the $8.41 per diluted share earned in 2009. The decrease in per share earnings was primarily a result of the gains the Company recorded on its three acquisitions in 2009. Total acquisition gains of $238.9 million drove earnings in 2009. Key components of the Company’s 2010 performance are summarized below.
| • | Total assets at December 31, 2010 were $10.0 billion, up $330.8 million, or 3.4%, from $9.7 billion at December 31, 2009. The increase was primarily the result of assets acquired from the Sterling acquisition completed in July 2010. Assets acquired totaled $314.2 million at the time of acquisition, which included loans of $151.3 million and a loss share receivable of $66.8 million. |
| • | Total loans at December 31, 2010 were $6.0 billion, an increase of $251.0 million, or 4.3%, from $5.8 billion at December 31, 2009. Loan growth was a result of $151.3 million in loans acquired, as well as organic growth of $99.7 million, or 1.7%. Excluding loans covered by loss share agreements (“covered loans”) with the FDIC, organic growth was $319.6 million, or 7.8%, during the year. |
| • | Total customer deposits increased $359.0 million, or 4.8%, from $7.6 billion at December 31, 2009 to $7.9 billion at December 31, 2010. The increase was primarily the result of the $287.0 million in deposits obtained in the acquisition completed during 2010, but also includes organic growth of $72.0 million. Total interest-bearing deposits increased $355.1 million, or 5.3%, during 2010. Total noninterest-bearing accounts increased $3.9 million, or 0.4%, during 2010. Although deposit competition remained intense through much of 2010, the Company was able to generate strong organic growth across its many deposit products. Organic deposit growth was driven by growth in the Company’s newer markets of Mobile and Houston, as well as growth in many of the Company’s core markets. |
| • | Shareholders’ equity increased $342.1 million, or 35.6%, from $961.3 million at December 31, 2009 to $1.3 billion at December 31, 2010. The increase is the result of earnings for the year and the Company’s common stock issuance of 6.0 million shares during the first quarter of 2010. |
| • | Net interest income increased $108.8 million, or 63.0%, in 2010 when compared to 2009. This increase is largely attributable to a $3.6 billion increase in average net earning assets. From 2009 to 2010, the corresponding net interest margin ratio on a tax-equivalent basis decreased four basis points to 3.05% from 3.09% due to changes in the volume and mix of the Company’s assets and liabilities and rate decreases driven by federal funds, Treasury, and other Company borrowing rate decreases during 2010. Most of the Company’s variable rate loans and deposits are tied to these rates and thus the repricing of these assets and liabilities during 2010 decreased both the average earning asset yield and the interest-bearing liability rate. |
| • | Noninterest income decreased $210.6 million, or 61.1%, for 2010 when compared to 2009. The decrease was primarily driven by gains from the Company’s acquisitions in 2009. Offsetting the decrease in acquisition gains were increases of $12.6 million in gains on the sale of loans, primarily from IBERIABANK fsb’s mortgage origination subsidiary, IBERIABANK Mortgage Company (“IMC”), and broker commissions of $2.9 million. |
| • | Noninterest expense increased $81.0 million, or 36.3%, for 2010 when compared to 2009. The increase was attributed to higher salaries and employee benefits from the acquisitions, as well as increased occupancy, equipment, and other branch expenses resulting from the Company’s expanded footprint. In addition to personnel and other costs related to the expanding size of the Company, noninterest expenses were driven higher in 2010 with conversion- and integration-related expenses from the Company’s three Florida acquisitions during 2009 and 2010. |
| • | The Company recorded a provision for loan losses of $42.5 million during 2010, compared to a provision of $45.4 million in 2009. The provision was primarily the result of net charge-offs in 2010 of $27.0 million, or 0.47% of average loans, but also included a provision of $15.5 million for loan growth and changes in asset quality during the year. As of December 31, 2010, the allowance for loan losses as a percent of total loans was 2.26%, compared to 0.96% at December 31, 2009. |
| • | Despite the tough market conditions experienced in the industry during 2010, the Company paid cash dividends totaling $1.36 per common share, consistent with dividends paid in 2009. The Company’s dividend payout ratio to common shareholders was 74.7%. |
The Company’s focus is that of a high performing institution. Management believes that improvement in core earnings drives shareholder value and has adopted a mission statement that is designed to provide guidance for management, our associates and Board of Directors regarding the sense of purpose and direction of the Company. We are very shareholder and client focused, expect high performance from our associates, believe in a strong sense of community and strive to make the Company a great place to work.
During 2010, the Company continued to execute its business model successfully, as evidenced by its completion of the Sterling acquisition and new branch expansion, expanding the Company’s presence in Florida. In addition, the Company experienced solid organic loan and deposit growth during the year, despite the challenges the entire industry faced in 2010. The Company remains well positioned for future growth opportunities, as evidenced by abundant liquidity, core funding, and capitalization levels.
APPLICATION OF CRITICAL ACCOUNTING POLICIES
In preparing financial reports, management is required to apply significant judgment to various accounting, reporting and disclosure matters. Management must use assumptions and estimates to apply these principles where actual measurement is not possible or practical. The accounting principles and methods used by the Company conform with accounting principles generally accepted in the United States and general banking practices. Estimates and assumptions most significant to the Company relate primarily to the calculation of the allowance for loan losses, the valuation of goodwill, intangible assets and other purchase accounting adjustments, the valuation of share-based compensation, and the accounting for acquired loans and the related FDIC loss share receivable. These significant estimates and assumptions are summarized in the following discussion and are further analyzed in the footnotes to the consolidated financial statements.
Allowance for Loan Losses
The determination of the allowance for loan losses, which represents management’s estimate of probable losses inherent in the Company’s loan portfolio, involves a high degree of judgment and complexity. The Company’s policy is to establish reserves for estimated losses on delinquent and other problem loans when it is determined that losses are expected to be incurred on such loans. Management’s determination of the adequacy of the allowance is based on various factors, including an evaluation of the portfolio, past loss experience, current economic conditions, the volume and type of lending conducted by the Company, composition of the portfolio, the amount of the Company’s classified assets, seasoning of the loan portfolio, the status of past due principal and interest payments, and other relevant factors. Changes in such estimates may have a significant impact on the financial statements. For further discussion of the allowance for loan losses, see the Asset Quality and Allowance for Loan Losses sections of this analysis and Note 1 and Note 6 of the footnotes to the consolidated financial statements.
Valuation of Goodwill, Intangible Assets and Other Purchase Accounting Adjustments
The Company accounts for acquisitions in accordance with ASC Topic No. 805, which requires the use of the purchase method of accounting. For purchase acquisitions, the Company is required to record the assets acquired, including identified intangible assets, and liabilities assumed, at their fair value, which in many instances involves estimates based on third party valuations, such as appraisals, or internal valuations based on discounted cash flow analyses or other valuation techniques. The determination of the useful lives of intangible assets is subjective as is the appropriate amortization period for such intangible assets. In addition, purchase acquisitions typically result in recording goodwill. The Company performs a goodwill valuation at least annually. Impairment testing of goodwill is a two step process that first compares the fair value of goodwill with its carrying amount, and second measures impairment loss by comparing the implied fair value of goodwill with the carrying amount of that goodwill. Based on management’s goodwill impairment test, there was no impairment of goodwill at October 1, 2010. In 2009, LTC had an impairment of goodwill of $9.7 million, and the Company recorded the charge through its statement of income for the year ended December 31, 2009. For additional information on goodwill and intangible assets, see Note 1 and Note 9 of the footnotes to the consolidated financial statements.
Share-based Compensation
Management utilizes the Black-Scholes option valuation model to estimate the fair value of stock options. The option valuation model requires the input of highly subjective assumptions, including expected stock price volatility and option life. These subjective input assumptions materially affect the fair value estimate.
For additional discussion of the Company’s stock options plans, sees Notes 1 and 18 of the footnotes to the consolidated financial statements.
Accounting For Acquired Loans and Related FDIC Loss Share Receivable
The Company accounts for its acquisitions under ASC Topic No. 805, Business Combinations, which requires the use of the purchase method of accounting. All identifiable assets acquired, including loans, are recorded at fair value. No allowance for loan losses related to the acquired loans is recorded on the acquisition date as the fair value of the loans acquired incorporates assumptions regarding credit risk. Loans acquired are recorded at fair value in accordance with the fair value methodology prescribed in ASC Topic No. 820, exclusive of the shared-loss agreements with the FDIC. These fair value estimates associated with the loans include estimates related to expected prepayments and the amount and timing of undiscounted expected principal, interest and other cash flows.
Over the life of the acquired loans, the Company continues to estimate cash flows expected to be collected on individual loans or on pools of loans sharing common risk characteristics. The Company evaluates at each balance sheet date whether the estimated cash flows and corresponding present value of its loans determined using the effective interest rates has decreased and if so, recognizes a provision for loan loss in its consolidated statement of income. For any increases in cash flows expected to be collected, the Company adjusts the amount of accretable yield recognized on a prospective basis over the loan’s or pool’s remaining life.
Because the FDIC will reimburse the Company for certain acquired loans should the Company experience a loss, an indemnification asset, the FDIC loss share receivable, is recorded at fair value at the acquisition date. The indemnification asset is recognized at the same time as the indemnified loans, and measured on the same basis, subject to collectability or contractual limitations. The shared loss agreements on the acquisition date reflect the reimbursements expected to be received from the FDIC, using an appropriate discount rate, which reflects counterparty credit risk and other uncertainties.
The shared loss agreements continue to be measured on the same basis as the related indemnified loans. Because the acquired loans are subject to the accounting prescribed by ASC Topic 310, subsequent changes to the basis of the shared loss agreements also follow that model. Deterioration in the credit quality of the loans (immediately recorded as an adjustment to the allowance for loan losses) would immediately increase the basis of the shared loss agreements, with the offset recorded through the consolidated statement of income. Improvements in the credit quality or cash flows of loans (reflected as an adjustment to yield and accreted into income over the remaining life of the loans) decrease the basis of the shared loss agreements, with such decrease being amortized into income over 1) the same period or 2) the life of the shared loss agreements, whichever is shorter. Loss assumptions used in the basis of the indemnified loans are consistent with the loss assumptions used to measure the indemnification asset. Fair value accounting incorporates into the fair value of the indemnification asset an element of the time value of money, which is accreted back into income over the life of the shared loss agreements.
Upon the determination of an incurred loss the indemnification asset will be reduced by the amount owed by the FDIC. A corresponding claim receivable is recorded until cash is received from the FDIC.
For further discussion of the Company’s acquisitions and loan accounting, see Note 3 and Note 5 of the footnotes to the consolidated financial statements.
FINANCIAL CONDITION
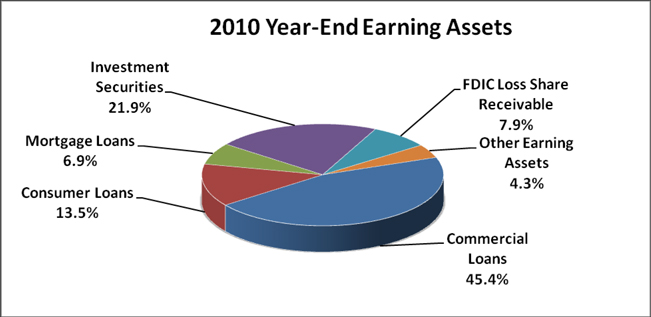
EARNING ASSETS
Interest income associated with earning assets is the Company’s primary source of income. Earning assets are composed of interest or dividend-earning assets, including loans, securities, short-term investments and loans held for sale. Earning assets averaged $9.4 billion during 2010, a $3.6 billion, or 63.2%, increase when compared to 2009. The increase is the result of earning assets acquired during 2009 and 2010.
The year-end mix of earning assets is shown in the following chart.
Loans and Leases
The loan portfolio increased $251.0 million, or 4.3%, to $6.0 billion at December 31, 2010, compared to $5.8 billion at December 31, 2009. The increase was primarily from loans acquired in the Sterling acquisition. Excluding the $151.3 million in loans acquired, the Company experienced organic growth of $99.7 million, or 1.7%, during 2010. Organic growth was tempered by a decrease in loans covered by loss share agreements of $219.9 million, or 13.2%, acquired from the 2009 acquisitions of CSB, Orion, and Century. Excluding the covered loan decrease, organic growth was $319.6 million, or 7.8%, during 2010, with growth in both the IBERIABANK and IBERIABANK fsb portfolios.
Non-covered Loans
Because of the loss protection provided by the FDIC, the risks of the CSB, Orion, Century, and Sterling loans and foreclosed real estate are significantly different from those assets not covered under loss share agreements. Accordingly, the Company presents loans subject to the loss share agreements as “covered loans” in the information below and loans that are not subject to the loss share agreement as “non-covered loans.”
The following is a summary of the major categories of non-covered loans outstanding at December 31:
NON-COVERED LOANS RECEIVABLE BY LOAN TYPE
| (dollars in thousands) | December 31, | |||||||
| Non-covered Loans |
2010 | 2009 | ||||||
| Residential mortgage loans: |
||||||||
| Residential 1-4 family |
$ | 355,164 | $ | 434,956 | ||||
| Construction/ Owner-occupied |
14,822 | 18,198 | ||||||
| Total residential mortgage loans |
369,986 | 453,154 | ||||||
| Commercial loans: |
||||||||
| Real estate |
1,781,758 | 1,659,844 | ||||||
| Business |
1,341,338 | 1,086,860 | ||||||
| Total commercial loans |
3,123,096 | 2,746,704 | ||||||
| Consumer loans: |
||||||||
| Indirect automobile |
255,322 | 259,339 | ||||||
| Home equity |
555,749 | 512,087 | ||||||
| Other |
148,432 | 142,615 | ||||||
| Total consumer loans |
959,503 | 914,041 | ||||||
| Total non-covered loans receivable |
$ | 4,452,585 | $ | 4,113,899 | ||||
Covered Loans
The carrying amount of the covered loans at December 31, 2010 consisted of loans accounted for in accordance with ASC Topic 310-30 and loans not subject to ASC Topic 310-30 as detailed in the following table.
COVERED LOANS RECEIVABLE BY LOAN TYPE
| (dollars in thousands) | ||||||||||||
| Covered Loans |
ASC
310-30 Loans |
Non- ASC
310-30 Loans |
Total
Covered Loans |
|||||||||
| Residential mortgage loans: |
||||||||||||
| Residential 1-4 family |
$ | 50,566 | $ | 210,820 | $ | 261,386 | ||||||
| Construction/ Owner-occupied |
— | — | — | |||||||||
| Total residential mortgage loans |
50,566 | 210,820 | 261,386 | |||||||||
| Commercial loans: |
||||||||||||
| Real estate |
146,331 | 719,032 | 865,363 | |||||||||
| Business |
6,119 | 168,385 | 174,504 | |||||||||
| Total commercial loans |
152,450 | 887,417 | 1,039,867 | |||||||||
| Consumer loans: |
||||||||||||
| Indirect automobile |
— | — | — | |||||||||
| Home equity |
59,689 | 219,402 | 279,091 | |||||||||
| Other |
543 | 1,860 | 2,403 | |||||||||
| Total consumer loans |
60,232 | 221,262 | 281,494 | |||||||||
| Total covered loans receivable |
$ | 263,248 | $ | 1,319,499 | $ | 1,582,747 | ||||||
The Company’s year-end loan portfolio is segregated into various components in the following charts.
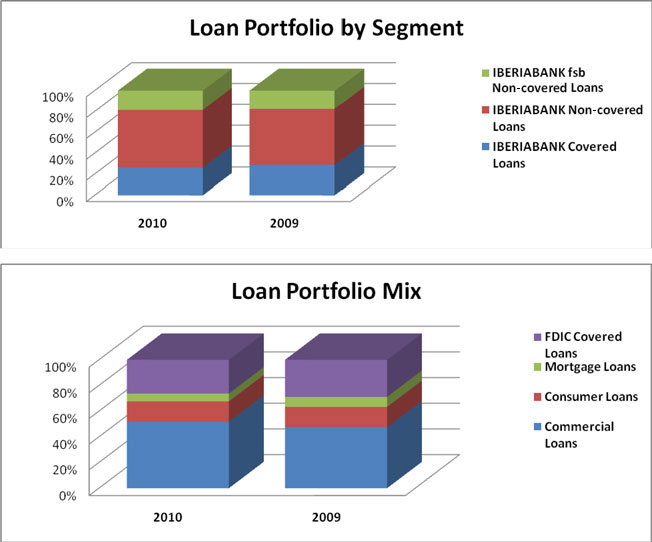
The Company’s loan to deposit ratio at December 31, 2010 and December 31, 2009 was 76.3% and 76.6%, respectively. The percentage of fixed rate loans to total loans increased slightly from 48.2% at the end of 2009 to 48.4% as of December 31, 2010. The table below sets forth the composition of the Company’s loan portfolio as of December 31st for the years indicated, with a discussion of activity by major loan types following.
TOTAL LOANS RECEIVABLE BY LOAN TYPE
| (dollars in thousands) | 2010 | 2009 | December 31, 2008 |
2007 | 2006 | |||||||||||||||||||||||||||||||||||
| Commercial loans: |
||||||||||||||||||||||||||||||||||||||||
| Real estate |
$ | 2,647,107 | 44 | % | $ | 2,500,433 | 43 | % | $ | 1,522,965 | 41 | % | $ | 1,369,882 | 40 | % | $ | 750,051 | 34 | % | ||||||||||||||||||||
| Business |
1,515,856 | 25 | 1,217,326 | 21 | 775,625 | 21 | 634,495 | 18 | 461,048 | 21 | ||||||||||||||||||||||||||||||
| Total commercial loans |
4,162,963 | 69 | 3,717,759 | 64 | 2,298,590 | 62 | 2,004,377 | 58 | 1,211,099 | 55 | ||||||||||||||||||||||||||||||
| Mortgage loans: |
||||||||||||||||||||||||||||||||||||||||
| Residential 1-4 family |
616,550 | 10 | 975,395 | 17 | 498,740 | 13 | 515,912 | 15 | 431,585 | 19 | ||||||||||||||||||||||||||||||
| Construction/Owner- occupied |
14,822 | — | 32,857 | 1 | 36,693 | 1 | 60,558 | 2 | 45,285 | 2 | ||||||||||||||||||||||||||||||
| Total mortgage loans |
631,372 | 10 | 1,008,252 | 18 | 535,433 | 14 | 576,470 | 17 | 476,870 | 21 | ||||||||||||||||||||||||||||||
| Loans to individuals: |
||||||||||||||||||||||||||||||||||||||||
| Indirect automobile |
255,322 | 4 | 259,339 | 4 | 265,722 | 7 | 240,860 | 7 | 228,301 | 10 | ||||||||||||||||||||||||||||||
| Home equity |
834,840 | 14 | 649,821 | 11 | 501,036 | 13 | 424,716 | 12 | 233,885 | 10 | ||||||||||||||||||||||||||||||
| Other |
150,835 | 3 | 149,194 | 3 | 143,621 | 4 | 183,616 | 6 | 83,847 | 4 | ||||||||||||||||||||||||||||||
| Total consumer loans |
1,240,997 | 21 | 1,058,354 | 18 | 910,379 | 24 | 849,192 | 25 | 546,033 | 24 | ||||||||||||||||||||||||||||||
| Total loans receivable |
$ | 6,035,332 | 100 | % | $ | 5,784,365 | 100 | % | $ | 3,744,402 | 100 | % | $ | 3,430,039 | 100 | % | $ | 2,234,002 | 100 | % | ||||||||||||||||||||
Commercial Loans
Commercial real estate and commercial business loans generally have shorter repayment periods and more frequent repricing opportunities than residential 1-4 family loans. Total commercial loans increased $445.2 million, or 12.0% during 2010, with $376.4 million of the increase, or 84.5%, due to the legacy IBERIABANK and IBERIABANK fsb loans. The Company’s focus on growing its commercial loan portfolio continued in 2010 as commercial loans as a percentage of total loans increased from 64% at December 31, 2009 to 69% at December 31, 2010.
The Company has increased its investment in commercial real estate loans from $2.5 billion, or 43% of the total loan portfolio at December 31, 2009, to $2.6 billion, or 44% of the total loan portfolio at December 31, 2010. The Company’s underwriting standards generally provide for loan terms of three to five years, with amortization schedules of generally no more than twenty years. Low loan-to-value ratios are maintained and usually limited to no more than 80%. In addition, the Company obtains personal guarantees of the principals as additional security for most commercial real estate loans.
As of December 31, 2010, the Company’s commercial business loans totaled $1.5 billion, or 25% of the Company’s total loan portfolio. This represents a $298.5 million, or 24.5% increase from December 31, 2009. The Company originates commercial business loans on a secured and, to a lesser extent, unsecured basis. The Company’s commercial business loans may be structured as term loans or revolving lines of credit. Term loans are generally structured with terms of no more than three to five years, with amortization schedules of generally no more than seven years. The Company’s commercial business term loans are generally secured by equipment, machinery or other corporate assets. The Company also provides for revolving lines of credit generally structured as advances upon perfected security interests in accounts receivable and inventory. Revolving lines of credit generally have an annual maturity. The Company obtains personal guarantees of the principals as additional security for most commercial business loans.
On a portfolio basis, total IBERIABANK commercial loans, excluding covered loans, increased $267.8 million, or 13.1%, and IBERIABANK fsb commercial loans increased 15.4%, or $108.6 million. Growth in the legacy IBERIABANK portfolio was due primarily to the newer markets the Company entered in 2009, as the Mobile, Alabama market grew its loan portfolio $35.7 million, or 83.2%. The Birmingham, Alabama market, which IBERIABANK entered in 2009, also grew $155.1 million during the year. In IBERIABANK’s more mature markets, Baton Rouge, Louisiana growth of $41.5 million, or 20.0%, also contributed to the overall commercial loan portfolio increase. Offsetting these increases were decreases in the Lafayette, Louisiana and Shreveport, Louisiana markets, which were due primarily to loan payments. The increase in IBERIABANK fsb commercial loans was driven by loan growth in the Houston, Texas, Little Rock, Arkansas, and Memphis, Tennessee markets. The Houston market
grew its loan portfolio $140.2 million, or 231.9%, during the year. The Little Rock commercial loan portfolio increased $18.5 million, or 9.3%, while the Memphis market recorded growth of $22.8 million, or 17.9%, in its commercial portfolio.
Mortgage Loans
Residential 1-4 family loans comprise most of the Company’s mortgage loans. The vast majority of the Company’s residential 1-4 family mortgage loan portfolio is secured by properties located in its market areas and originated under terms and documentation which permit their sale in the secondary market. Larger mortgage loans of private banking clients and prospects are generally retained to enhance relationships, and also due to the expected shorter durations and relatively lower servicing costs associated with loans of this size. The Company does not originate or hold high loan to value, negative amortization, option ARM, or other exotic mortgage loans in its portfolio.
The Company continues to sell the majority of conforming mortgage loan originations in the secondary market and recognize the associated fee income rather than assume the rate risk associated with these longer term assets. The Company also releases the servicing of these loans upon sale. Total residential mortgage loans decreased $376.9 million, or 37.4%, compared to December 31, 2009. Of the total mortgage loan decrease from December 31, 2009, $293.7 million, or 52.9%, was a result of a decrease in mortgage loans covered by loss share agreements, partially the result of the reclassification of a portion of covered loans as home equity loans upon system conversion to conform to the Company’s reporting guidelines. The remaining decrease was attributable to legacy assets, as loans were paid down and new mortgage loan originations slowed. At December 31, 2010, $329.3 million, or 52.2%, of the Company’s residential 1-4 family mortgage and construction loans were fixed rate loans and $302.0 million, or 47.8%, were adjustable rate loans.
Consumer Loans
The Company offers consumer loans in order to provide a full range of retail financial services to its customers. The Company originates substantially all of such loans in its primary market areas. At December 31, 2010, $1.2 billion, or 21%, of the Company’s total loan portfolio was comprised of consumer loans, compared to $1.1 billion, or 18% at the end of 2009. The $182.6 million increase in total consumer loans compared to December 31, 2009 was driven by home equity loan growth of $185.0 million, primarily the result of the loan reclassification mentioned previously, offset by decreases in the Company’s indirect automobile portfolios. Consumer loan growth in the Company’s non-covered loan portfolio was impacted by the Company’s tightened underwriting standards, a response to a weakened national and regional economy.
Consistent with 2009, home equity loans comprised the largest component of the Company’s consumer loan portfolio at December 31, 2010. The balance of home equity loans increased $185.0 million, or 28.5%, from $649.8 million at December 31, 2009 to $834.8 million at December 31, 2010. Non-covered IBERIABANK home equity loans increased $44.7 million, or 13.0%, during 2010, while IBERIABANK fsb home equity loans decreased only $1.0 million, or less than 1%. IBERIABANK fsb home equity loan originations were offset by customer payments and charge-offs.
Indirect automobile loans comprised the second largest component of the Company’s consumer loan portfolio. Independent automobile dealerships originate these loans and forward applications to Company personnel for approval or denial. The Company relies on the dealerships, in part, for loan qualifying information. To that extent, there is risk inherent in indirect automobile loans associated with fraud or negligence by the automobile dealership. To limit this risk, an emphasis is placed on established dealerships that have demonstrated reputable behavior, both within the communities we serve and through long-term relationships with the Company. The balance of indirect automobile loans decreased $4.0 million during 2010, from $259.3 million at December 31, 2009 to $255.3 million at December 31, 2010, as the Company retained its focus on prime or low risk paper. The indirect portfolio remained steady at 4% of the total loan portfolio.
The remainder of the consumer loan portfolio at December 31, 2010 was composed of direct automobile loans, credit card loans and other consumer loans, and comprised 2.5% of the overall loan portfolio. At December 31, 2010, the Company’s direct automobile loans totaled $31.3 million, a $0.7 million increase over December 31, 2009. The Company’s credit card loans totaled $44.1 million, a 1.1% decrease from December 31, 2009, and the Company’s other personal consumer loans amounted to $75.5 million, a 1.9% increase from December 31, 2009.
Loan Maturities
The following table sets forth the scheduled contractual maturities of the Company’s loan portfolio at December 31, 2010, unadjusted for scheduled principal reductions, prepayments or repricing opportunities. Demand loans, loans having no stated schedule of repayments and no stated maturity and overdraft loans are reported as due in one year or less. The average life of a loan may be substantially less than the contractual terms because of prepayments. As a result, scheduled contractual amortization of loans is not reflective of the expected term of the Company’s loan portfolio. Of the loans with maturities greater than one year, approximately 80.0% of the value of these loans bears a fixed rate of interest.
LOAN MATURITIES BY LOAN TYPE
| (dollars in thousands) | One Year Or Less |
One Through Five Years |
After Five Years |
Total | ||||||||||||
| Commercial real estate |
$ | 1,363,904 | $ | 1,027,259 | $ | 255,944 | $ | 2,647,107 | ||||||||
| Commercial business |
778,557 | 457,352 | 279,947 | 1,515,856 | ||||||||||||
| Mortgage |
69,125 | 107,664 | 454,583 | 631,372 | ||||||||||||
| Consumer |
486,683 | 379,280 | 375,034 | 1,240,997 | ||||||||||||
| Total loans receivable |
$ | 2,698,270 | $ | 1,971,555 | $ | 1,365,507 | $ | 6,035,332 | ||||||||
Mortgage Loans Held for Sale
Loans held for sale increased $17.0 million, or 25.3%, to $83.9 million at December 31, 2010, compared to $66.9 million at December 31, 2009. The increase in the balance during 2010 was a result of increased origination. The Company originated $1.8 billion in mortgage loans during 2010, with $516.1 million during the fourth quarter alone. Originations were $185.4 million, 11.7% higher than during 2009. In the fourth quarter of 2010, originations were 47.3% higher than the same period of 2009. Sales of mortgage loans totaled $1.8 billion during 2010, an 11.4% increase over 2009. Fourth quarter sales were 79.9% higher than in the fourth quarter of 2009.
Loans held for sale have primarily been fixed rate single-family residential mortgage loans under contract to be sold in the secondary market. In most cases, loans in this category are sold within thirty days. Buyers generally have recourse to return a purchased loan to the Company under limited circumstances. Recourse conditions may include fraud in the origination, breach of representations or warranties, and documentation deficiencies. At December 31, 2010, the Company has $2.7 million in loans that have recourse conditions for which a buyer has notified the Company of potential recourse action. The Company has recorded a reserve of $0.8 million for the potential repurchase at December 31, 2010. During 2010, an insignificant number of loans were returned to the Company.
Asset Quality
Over time, the Company’s loan portfolio has transitioned to be more representative of a commercial bank. Accordingly, there is the potential for a higher level of return for investors, but also the potential for higher charge-off and nonperforming levels. As a result, in previous years management has tightened underwriting guidelines and procedures, adopted more conservative loan charge-off and nonaccrual guidelines, rewritten the loan policy and developed an internal loan review function to address the changing risk of the Company’s loan portfolio. As a result of management’s enhancements to underwriting risk/return dynamics within the loan portfolio over time, the credit quality of the Company’s assets has remained strong. Despite declines in asset quality in portions of the Company’s total loan portfolio, management believes asset quality remains favorable when compared to its peers. Management also believes that historically it has recognized and disclosed significant problem loans quickly and taken prompt action in addressing material weaknesses in those credits. Deterioration in asset quality during 2010 was primarily attributable to a limited number of larger isolated credits and not a significant shift in overall portfolio quality and this impact is described in the “Covered Loans” section below. Consistent with 2009, the Company’s purchase and assumption of assets and liabilities of CSB, Orion, Century, and Sterling significantly impacted overall asset quality. Management seeks to recognize and disclose significant problem loans quickly and take prompt action to address material weaknesses in those credits. The Company will continue to closely monitor the risk-adjusted level of return within the loan portfolio.
Written underwriting standards established by the Board of Directors and management govern the lending activities of the Company. The commercial credit department, in conjunction with senior lending personnel, underwrites all commercial business and commercial real estate loans. The Company provides centralized underwriting of all residential mortgage, construction and consumer loans. Established loan origination procedures require appropriate documentation including financial data and credit reports. For loans secured by real property, the Company generally requires property appraisals, title insurance or a title opinion, hazard insurance and flood insurance, where appropriate.
Loan payment performance is monitored and late charges are assessed on past due accounts. A centralized department administers delinquent loans. Every effort is made to minimize any potential loss, including instituting legal proceedings, as necessary. Commercial loans of the Company are periodically reviewed through a loan review process. All other loans are also subject to loan review through a periodic sampling process.
The Company utilizes an asset risk classification system in compliance with guidelines established by the Federal Reserve Board as part of its efforts to improve commercial asset quality. In connection with examinations of insured institutions, both federal and state examiners also have the authority to identify problem assets and, if appropriate, classify them. There are three
classifications for problem assets: “substandard,” “doubtful” and “loss.” Substandard assets have one or more defined weaknesses and are characterized by the distinct possibility that the insured institution will sustain some loss if the deficiencies are not corrected. Doubtful assets have the weaknesses of substandard assets with the additional characteristic that the weaknesses make collection or liquidation in full questionable and there is a high probability of loss based on currently existing facts, conditions and values. An asset classified as loss is not considered collectable and of such little value that continuance as an asset of the Company is not warranted. Commercial loans with adverse classifications are reviewed by the Loan Committee of the Board of Directors at least monthly. Loans are placed on nonaccrual status when they are 90 days or more past due, unless in the judgment of management, the probability of collection of interest is deemed to be sufficient to warrant further accrual. When a loan is placed on nonaccrual status, previously accrued but unpaid interest for the current year is deducted from interest income. Prior year interest is charged-off to the allowance for loan losses.
Real estate acquired by the Company as a result of foreclosure or by deed-in-lieu of foreclosure is classified as other real estate owned (“OREO”) until sold, and is carried at the balance of the loan at the time of acquisition or at estimated fair value less estimated costs to sell, whichever is less.
Under generally accepted accounting principles, the Company is required to account for certain loan modifications or restructurings as “troubled debt restructurings”. In general, the modification or restructuring of a debt constitutes a troubled debt restructuring if the Company for economic or legal reasons related to the borrower’s financial difficulties grants a concession to the borrower that the Company would not otherwise consider under current market conditions. Debt restructurings or loan modifications for a borrower do not necessarily constitute troubled debt restructurings, however, and troubled debt restructurings do not necessarily result in nonaccrual loans.
Nonperforming Assets
The Company defines nonperforming assets as nonaccrual loans, accruing loans more than 90 days past due, and OREO and foreclosed property.
Due to the significant difference in the accounting for the covered loans and the loss sharing agreements with the FDIC, the Company believes that asset quality measures excluding the covered loans are generally more meaningful. Purchased impaired loans had evidence of deterioration in credit quality prior to acquisition, and thus the fair value of these loans as of the acquisition date included an estimate of credit losses. These loans, as well as acquired loans with no evidence of credit deterioration at acquisition, are accounted for on a pool basis, and these pools are considered to be performing. Purchased impaired loans were not classified as nonperforming assets at December 31, 2010 or 2009, as the loans are considered to be performing under FASB ASC Topic 310-30. As a result, interest income, through the accretion of the difference between the carrying value of the loans and the expected cash flows, is being recognized on all purchased loans accounted for under FASB ASC Topic 310-30. Therefore, management has included asset quality measures that exclude covered loans in the table in this section.
Nonperforming assets not covered by FDIC loss share agreements totaled $69.4 million at December 31, 2010, an increase of $9.4 million, or 15.6%, from December 31, 2009. The following table sets forth the composition of the Company’s non-covered nonperforming assets, including accruing loans past due 90 or more days, as of the dates indicated.
NONPERFORMING ASSETS AND TROUBLED DEBT RESTRUCTURINGS
| December 31, | ||||||||||||||||||||
| (dollars in thousands) | 2010 | 2009 | 2008 | 2007 | 2006 | |||||||||||||||
| Nonaccrual loans: |
||||||||||||||||||||
| Commercial, financial and agricultural |
$ | 35,457 | $ | 31,029 | $ | 21,433 | $ | 30,740 | $ | 745 | ||||||||||
| Mortgage |
5,917 | 3,314 | 2,423 | 2,098 | 353 | |||||||||||||||
| Loans to individuals |
8,122 | 5,504 | 3,969 | 3,268 | 1,603 | |||||||||||||||
| Total nonaccrual loans |
49,496 | 39,847 | 27,825 | 36,107 | 2,701 | |||||||||||||||
| Accruing loans 90 days or more past due |
1,455 | 4,960 | 2,481 | 2,655 | 310 | |||||||||||||||
| Total nonperforming loans (1) |
50,951 | 44,807 | 30,306 | 38,762 | 3,011 | |||||||||||||||
| Foreclosed property |
18,496 | 15,281 | 16,312 | 9,413 | 2,008 | |||||||||||||||
| Total nonperforming assets (1) |
69,447 | 60,088 | 46,618 | 48,175 | 5,019 | |||||||||||||||
| Troubled debt restructurings in compliance with modified terms (2) |
14,968 | — | — | — | — | |||||||||||||||
| Total nonperforming assets and troubled debt restructurings (1) |
$ | 84,415 | $ | 60,088 | $ | 46,618 | $ | 48,175 | $ | 5,019 | ||||||||||
| Nonperforming loans to total loans (1) |
1.14 | % | 1.09 | % | 0.81 | % | 1.13 | % | 0.13 | % | ||||||||||
| Nonperforming assets to total assets (1) |
0.91 | % | 0.91 | % | 0.83 | % | 0.98 | % | 0.16 | % | ||||||||||
| Nonperforming assets and troubled debt restructurings to total assets (1) |
1.10 | % | 0.91 | % | 0.83 | % | 0.98 | % | 0.16 | % | ||||||||||
| Allowance for loan losses to nonperforming loans (3) |
122.59 | % | 124.14 | % | 134.87 | % | 98.77 | % | 993.76 | % | ||||||||||
| Allowance for loan losses to total loans (3) |
1.40 | % | 1.36 | % | 1.09 | % | 1.12 | % | 1.34 | % | ||||||||||
| (1) | Nonperforming loans and assets include accruing loans 90 days or more past due. |
| (2) | Troubled debt restructurings for December 31, 2010 do not include $2,504,000 in troubled debtrestructurings included in total nonaccrual loans of $49,496,000 above. |
| (3) | The allowance for loan losses excludes the portion of the allowance related to covered loans discussed below |
Nonperforming loans were 1.14% of total non-covered loans at December 31, 2010, five basis points higher than at December 31, 2009. If covered loans meeting nonperforming criteria are included, nonperforming loans would have been 14.40% of total loans before discounts (i.e., based on the contractual unpaid principal balance) at December 31, 2010, and 13.33% at December 31, 2009. The allowance for loan losses as a percentage of nonperforming loans was 122.59% at December 31, 2010 and 124.14% at December 31, 2009. Including covered assets, the allowance coverage of total loans before application of covered loan discounts would have been 2.02% at December 31, 2010 and 0.79% at December 31, 2009.
The increase in nonperforming assets from December 31, 2009 was primarily a result of additional nonaccrual loans at December 31, 2010, as these nonaccrual loans increased $9.6 million, or 24.2%. Offsetting this increase was a decrease of $3.5 million, or 70.7%, in accruing loan balances greater than 90 days past due. IBERIABANK accounted for the increase in nonaccrual loans, as IBERIABANK fsb’s nonaccrual loans decreased $0.7 million, or 2.4%, from December 31, 2009. Nonperforming assets totaled $69.4 million at December 31, 2010, with IBERIABANK accounting for $28.1 million, or 40.5%, of nonperforming assets at December 31, 2010, and IBERIABANK fsb accounting for 59.5%, or $41.3 million.
Nonperforming assets at IBERIABANK increased $9.0 million, or 47.4%, from December 31, 2009. Increases in nonaccrual loans and OREO properties were offset by a decrease of $3.2 million in accruing loans 90 days past due. Nonaccrual loans at IBERIABANK increased $10.3 million, or 86.8%, from December 31, 2009. The increase was primarily the result of four credits at IBERIABANK which totaled $11.7 million at December 31, 2010. The four credits were put on nonaccrual status during the year based on their payment history. These credits have been reviewed for impairment and had specific reserves on their outstanding balance at December 31, 2010 to cover probable losses. The increase in nonaccrual loans was primarily from these isolated credits and did not reflect a significant decline in overall portfolio quality.
IBERIABANK fsb’s nonperforming assets totaled $41.3 million at December 31, 2010, including $27.3 million of nonaccrual loans, compared to $41.0 million in nonperforming assets at December 31, 2009. The $0.3 million increase since the end of 2009
was primarily the result of an increase in OREO properties of $1.3 million, offset by decrease in nonperforming loans of $1.0 million, or 3.4%. The Company’s efforts to address risk in the IBERIABANK fsb portfolio led to the decrease in nonperforming assets at IBERIABANK fsb.
Nonperforming asset balances as a percentage of total assets have remained at a relatively low level. Total nonperforming assets were 0.91% of non-covered assets at December 31, 2010, consistent with December 31, 2009. In response to a slight decline in asset quality during 2010, the Company increased its reserve for loan losses, which in turn increased the reserve coverage of total non-covered loans to 1.40% at December 31, 2010, four basis points above December 31, 2009.
Loans defined as troubled debt restructurings (“TDR’s”) not included in nonperforming assets increased to $15.0 million at December 31, 2010. These loans were restructured during 2010, as there were no TDR’s that were considered performing at December 31, 2009. Five commercial relationships account for 98.7%, or $14.8 million, of that total. These five credits were current or less than 30 days past due at December 31, 2010. Total TDRs not covered by loss share agreements totaled $17.5 million at December 31, 2010, with $15.1 million at IBERIABANK and $2.4 million at IBERIBANK fsb.
Management continually monitors loans and transfers loans to nonaccrual status when warranted. Net charge-offs on non-covered loans in 2010 were $26.7 million, or 0.63% of average loans, as compared to $30.6 million, or 0.79%, for 2009. The decrease in net charge-offs from 2009 was primarily a result of a significant decrease in IBERIABANK fsb charge-offs during the current year, primarily in the commercial portfolio, as the Company experienced some asset quality deterioration in the third quarter of 2009.
At December 31, 2010, excluding loans covered by the FDIC loss share agreements, the Company had $102.2 million of commercial assets classified as substandard, $3.6 million of assets classified as doubtful, and no assets classified as loss. At such date, the aggregate of the Company’s classified assets amounted to 1.05% of total assets, 1.75% of total loans, and 2.37% of non-covered loans. At December 31, 2009, the aggregate of the Company’s classified assets, $67.7 million, amounted to 0.70% of total assets, 1.17% of total loans, and 1.41% of non-covered loans.
Of the $102.2 million in substandard loans at December 31, 2010, substandard loans at IBERIABANK totaled $41.4 million, or 40.5% of all substandard loans, and substandard loans at IBERIABANK fsb were $60.8 million, or 59.5%. Eight relationships at IBERIABANK accounted for 82.8% of total substandard loans. At IBERIABANK fsb, twelve relationships accounted for $45.5 million, or 75.8%, of total substandard loans. A reserve for loan losses has been recorded for all substandard loans at December 31, 2010 according to the Company’s allowance policy.
In addition to the problem loans described above, excluding covered loans, there were $55.7 million of loans classified special mention at December 31, 2010, which in management’s opinion were subject to potential future rating downgrades. Special mention loans are defined as loans where known information about possible credit problems of the borrower cause management to have some doubt as to the ability of these borrowers to comply with the present loan repayment terms and which may result in future disclosure of these loans as nonperforming. Special mention loans decreased $12.6 million, or 18.4%, from December 31, 2009. Loans rated as special mention totaled $42.9 million at IBERIABANK, or 0.87% of the total IBERIABANK loan portfolio and 1.28% of the non-covered loan portfolio, at December 31, 2010. Total special mention loans decreased $2.9 million, or 6.3%, this year. Ten relationships accounted for $32.6 million, or 76.1%, of total IBERIABANK special mention loans. At IBERIABANK fsb, special mention loans totaled $12.9 million, or 1.16%, of the total IBERIABANK fsb loan portfolio. Special mention loans at IBERIABANK fsb decreased $9.6 million, or 42.8%, during the year. Five relationships accounted for $8.8 million, or 68.6%, of total IBERIABANK fsb special mention loans.
Past Due Loans
Past due status is based on the contractual terms of loans. At December 31, 2010, loans past due 30 days or more excluding covered loans were 0.96% of total IBERIABANK loans and 2.87% of total IBERIABANK fsb loans. On a consolidated basis, total past due loans excluding covered loans were 1.44% of total loans at December 31, 2010, a decrease of 25 basis points from December 31, 2009. Including covered loans, loans past due 30 days or more would have been 14.54% of total loans before discount adjustments at December 31, 2010 and 16.30% at December 31, 2009. Past due loans by portfolio are presented in the following table.
PAST DUE LOANS TO TOTAL LOANS
| December 31, 2010 | December 31, 2009 | |||||||
| IBERIABANK |
||||||||
| (Excluding FDIC Covered Loans) |
||||||||
| 30+ days past due |
0.30 | % | 0.58 | % | ||||
| Non-accrual loans |
0.66 | % | 0.38 | % | ||||
| Total past due loans |
0.96 | % | 0.96 | % | ||||
| IBERIABANK fsb |
||||||||
| 30+ days past due |
0.41 | % | 1.12 | % | ||||
| Non-accrual loans |
2.46 | % | 2.78 | % | ||||
| Total past due loans |
2.87 | % | 3.90 | % | ||||
| IBERIABANK Corporation |
||||||||
| (Excluding FDIC Covered Loans) |
||||||||
| 30+ days past due |
0.33 | % | 0.72 | % | ||||
| Non-accrual loans |
1.11 | % | 0.97 | % | ||||
| Total past due loans |
1.44 | % | 1.69 | % | ||||
At IBERIABANK fsb, past due loans decreased $7.4 million, or 18.9%, from December 31, 2009, to $31.8 million, and drove the 25 basis point decrease in consolidated past due loans. The decrease was a result of the Company’s efforts to address the credit quality issues in its portfolio. Loans past due less than 90 days decreased to $3.1 million, or 0.28% of loans, which was a decrease of $6.4 million, or 67.6%, from December 31, 2009.
IBERIABANK past due loans (including nonaccrual loans) increased $2.4 million, or 7.9%, from December 31, 2009 and was the result of the larger commercial nonaccrual credits mentioned previously. Accruing loans past due decreased $7.9 million, or 43.7%, from December 31, 2009. Total IBERIABANK loans past due held steady at 0.96% of total loans.
Covered Loans
The loans and foreclosed real estate that were acquired in the CSB, Orion, Century, and Sterling acquisitions in 2009 and 2010 are covered by loss share agreements between the FDIC and IBERIABANK, which afford IBERIABANK significant loss protection. As a result of the loss protection provided by the FDIC, the risk of loss on the acquired loans and foreclosed real estate is significantly different from those assets not covered under the loss share agreements.
At their acquisition dates, covered assets were recorded at their fair value, which included an estimate of credit losses. The Company estimated the fair value of the total acquired loan portfolios by segregating the total portfolio into loan pools with similar characteristics, which included loan performance at the time of acquisition, loan type based on regulatory reporting guidelines, the nature of collateral, interest rate type, and loan payment type. Covered assets were segregated by pools with evidence of credit deterioration and pools considered to be performing at the time of acquisition. From these pools, the Company used certain loan information, including outstanding principal balance, weighted average maturity, weighted average term to re-price (if a variable rate loan), weighted average margin, and weighted average interest rate to estimate the expected cash flow for each loan pool. Each loan pool was then recorded at fair value based on the Company’s estimate of cash flows expected to be collected on each loan pool sharing common risk characteristics.
Although covered loans are not included in the Company’s nonperforming assets, in accordance with bank regulatory reporting standards, both acquired loans considered impaired at the time of acquisition and those performing at the time of acquisition that meet the Company’s definition of a nonperforming loan at each balance sheet date are discussed below. Included in the discussion are all covered loans that are contractually past due based on the number of days past due. Certain measures of the asset quality of covered loans are discussed below. Loan balances are reported before consideration of applied loan discounts, as these discounts were recorded based on the estimated cash flow of the total loan pool and not on a specific loan basis. Because of the loss share agreements, balances discussed below are for general comparative purposes only and do not represent the Company’s risk of loss on covered assets. Because these assets are covered by the loss share agreements with the FDIC, 80% of incurred losses are reimbursable from the FDIC.
Total covered loans past due at December 31, 2010 totaled $916.4 million before discounts, a decrease of $160.7 million, or 14.9%, from December 31, 2009. The decrease in nonperforming loans was a result of a decrease of $73.8 million, or 33.0%, in accruing loans past due and a decrease of $86.8 million, or 10.2%, in nonaccrual loans. Past due loans included $766.7 million in
loans that would otherwise meet the Company’s definition of nonaccrual loans and $149.7 million in accruing loans past due. Of the $149.7 million in accruing loans past due, $98.0 million, or 65.5%, were past due less than 90 days. The indemnification agreements on covered assets include a provision for recapture of a portion of interest if the interest is included in total losses on the covered asset.
Allowance for Loan Losses
The determination of the allowance for loan losses, which represents management’s estimate of probable losses inherent in the Company’s credit portfolio, involves a high degree of judgment and complexity. The Company establishes general reserves on the Company’s loan portfolios described in detail below and specific reserves for estimated losses on delinquent and other problem loans when it is determined that losses are probable on such loans. Management’s determination of the adequacy of the allowance is based on various factors, including an evaluation of the portfolio, past loss experience, current economic conditions, the volume and type of lending conducted by the Company, composition of the portfolio, the amount of the Company’s classified assets, seasoning of the loan portfolio, the status of past due principal and interest payments, and other relevant factors. Changes in such estimates may have a significant impact on the consolidated financial statements.
The foundation of the allowance for the Company’s commercial segment is the credit risk rating of each relationship within the portfolio. The credit risk of each borrower is assessed, and a risk grade is assigned. The portfolios are further segmented by facility or collateral ratings. The dual risk grade for each loan is determined by the relationship manager and other approving officers and changed from time to time to reflect an ongoing assessment of the risk. Grades are reviewed on specific loans by senior management and as part of the Company’s internal loan review process. The commercial loan loss allowance is determined for all pass-rated borrowers based upon the borrower risk rating, the expected default probabilities of each rating category, and the outstanding loan balances by risk grade. For borrowers that are rated special mention or below, the higher of the migration analysis and Company established minimum reserve percentages apply. In addition, consideration is given to historical loss experience by internal risk rating, current economic conditions, industry performance trends, geographic or borrower concentrations within each portfolio segment, the current business strategy and credit process, loan underwriting criteria, loan workout procedures, and other pertinent information.
Reserves are determined for each impaired commercial loan based on management’s evaluation of the borrower’s overall financial condition, resources, and payment record; the prospects for support from any financially responsible guarantors; and the realizable value of any collateral. Reserves are established for these loans based upon an estimate of probable losses for the individual loans deemed to be impaired. This estimate considers all available evidence including the present value of the expected future cash flows and the fair value of collateral less disposal costs. Loans for which impaired reserves are provided are excluded from the general reserve calculations described above to prevent duplicate reserves.
The allowance also consists of reserves for unimpaired loans that encompass qualitative economic factors and specific market risk components. The foundation for the general consumer allowance is a review of the loan portfolios and the performance of those portfolios. This review is accomplished by first segmenting the portfolio into homogenous pools. Residential mortgage loans, direct consumer loans, consumer home equity, indirect consumer loans, credit card, and the business banking portfolio each are considered separately. The historical performance of each of these pools is analyzed by examining the level of charge-offs over a specific period of time. The historical average charge-off level for each pool is updated at least quarterly.
In addition to this base analysis, the consumer portfolios are also analyzed for specific risks within each segment. The risk analysis considers the Company’s current strategy for each segment, the maturity of each segment, expansion into new markets, the deployment of newly developed products and any other significant factors impacting that segment. Current regional and national economic factors are an important dimension of the assessment and impact each portfolio segment. The general economic factors are evaluated and adjusted quarterly, if necessary.
Loan portfolios tied to acquisitions made during the year are incorporated into the Company’s allowance process. If the acquisition has an impact on the level of exposure to a particular segment, industry or geographic market, this increase in exposure is factored into the allowance determination process. Generally, acquisitions have higher levels of risk of loss based on differences in credit culture and portfolio management practices.
Acquired loans follow the reserve standard set in ASC Topic No. 310-30. At acquisition, the Company reviews each loan or loan pool to determine whether there is evidence of deterioration in credit quality since origination and if it is probable that the Company will be unable to collect all amounts due according to the loan’s contractual terms. The Company considers expected prepayments and estimates the amount and timing of undiscounted expected principal, interest and other cash flows for each loan meeting the criteria above, and determines the excess of the loan’s scheduled contractual principal and contractual interest payments over all cash flows expected at acquisition as an amount that should not be accreted (nonaccretable difference). The remaining amount, representing the excess of the loan’s or pool’s cash flows expected to be collected over the book value of the loan, is accreted into interest income over the remaining life of the loan or pool (accretable yield). The Company records a
discount on these loans at acquisition to record them at their realizable cash flow. As a result, acquired loans subject to ASC Topic No. 310-30 are excluded from the calculation of loan loss reserves at the acquisition date.
Loans acquired in the CSB, Orion, Century, and Sterling acquisitions were recorded at their acquisition date fair value, which was based on expected cash flows and included an estimation of expected future loan losses. Under current accounting principles, information regarding the Company’s estimate of loan fair values may be adjusted for a period of up to one year as the Company continues to refine its estimate of expected future cash flows in the acquired portfolio. Within a one-year period, if the Company discovers that it has materially underestimated the loan losses inherent in the loan portfolio at the acquisition date, it will retroactively reduce or eliminate the gain recorded on the acquisition. If the Company determines that losses arose after the acquisition date, the additional losses are reflected as a provision for loan losses. Because acquired impaired loans follow the reserve standard set in ASC Topic No. 310-30, and acquired performing loans follow the same standard by analogy, the Company estimates the current amount and timing of expected principal, interest, and other cash flows for each loan pool and compares the total expected cash flow of the loan pools to the book value of the loan pools. If the expected cash flow is below the recorded book value, the Company records an allowance on the loan pool through an adjustment to its provision for loan losses and the FDIC loss share receivable. During the year ended December 31, 2010, the Company recorded an allowance for loan losses of $73.6 million to reserve for the portion of probable losses arising in the covered loan portfolio after the respective acquisition dates. Because the Company has addressed deterioration in the covered loan portfolio on a pool basis, the Company has recorded an allowance for the full amount of expected losses in loan pools identified as having evidence of additional deterioration arising after acquisition. For loan pools that have exhibited an improvement in asset quality since acquisition, the Company will accrete the improvement in cash flows into income over the life of the loan pool.
Based on facts and circumstances available, management of the Company believes that the allowance for loan losses is adequate at December 31, 2010 to cover probable losses in the Company’s loan portfolio. However, future adjustments to the allowance may be necessary, and the Company’s results of operations could be adversely affected, if circumstances differ substantially from the assumptions used by management in determining the allowance for loan losses.
The following tables set forth the activity in the Company’s allowance for loan losses during the periods indicated.
SUMMARY OF ACTIVITY IN THE ALLOWANCE FOR LOAN LOSSES
| Year Ended December 31, | ||||||||||||||||||||
| (dollars in thousands) | 2010 | 2009 | 2008 | 2007 | 2006 | |||||||||||||||
| Balance, beginning of period |
$ | 55,768 | $ | 40,872 | $ | 38,285 | $ | 29,922 | $ | 38,082 | ||||||||||
| Addition due to purchase transaction |
— | — | — | 8,746 | — | |||||||||||||||
| Adjustment for loans transferred to held for sale |
— | — | — | — | — | |||||||||||||||
| Provision charged (reversed) to operations |
42,451 | 45,370 | 12,568 | 1,525 | (7,803 | ) | ||||||||||||||
| Provision recorded through the FDIC loss share receivable |
64,922 | 147 | — | — | — | |||||||||||||||
| Charge-offs: |
||||||||||||||||||||
| Commercial, financial and agricultural |
23,634 | 25,204 | 7,696 | 956 | 336 | |||||||||||||||
| Mortgage |
1,068 | 311 | 128 | 56 | 97 | |||||||||||||||
| Loans to individuals |
9,156 | 7,752 | 5,057 | 3,694 | 2,188 | |||||||||||||||
| Total charge-offs |
33,858 | 33,267 | 12,881 | 4,706 | 2,621 | |||||||||||||||
| Recoveries: |
||||||||||||||||||||
| Commercial, financial and agricultural |
4,863 | 1,016 | 1,164 | 1,118 | 539 | |||||||||||||||
| Mortgage |
77 | 67 | 56 | 84 | 36 | |||||||||||||||
| Loans to individuals |
1,877 | 1,563 | 1,680 | 1,597 | 1,689 | |||||||||||||||
| Total recoveries |
6,817 | 2,646 | 2,900 | 2,799 | 2,264 | |||||||||||||||
| Net charge-offs |
27,041 | 30,621 | 9,981 | 1,907 | 357 | |||||||||||||||
| Balance, end of period |
$ | 136,100 | $ | 55,768 | $ | 40,872 | $ | 38,285 | $ | 29,922 | ||||||||||
| Allowance for loan losses to nonperforming assets (1) (2) |
89.9 | % | 92.6 | % | 87.7 | % | 79.5 | % | 596.2 | % | ||||||||||
| Allowance for loan losses to total loans at end of period |
2.26 | % | 0.96 | % | 1.09 | % | 1.12 | % | 1.34 | % | ||||||||||
| Net charge-offs to average loans |
0.47 | % | 0.73 | % | 0.28 | % | 0.06 | % | 0.02 | % | ||||||||||
| (1) | Nonperforming assets include accruing loans 90 days or more past due. |
| (2) | For December 31, 2010 and 2009, the allowance for loan losses in the calculation does not include the allowance allocated to covered assets. |
| December 31, 2010 | ||||||||||||||||
| IBERIABANK | ||||||||||||||||
| (dollars in thousands) | Covered Loans |
Non-covered loans |
IBERIABANK fsb | Total | ||||||||||||
| Balance, beginning of period |
$ | 145 | $ | 34,286 | $ | 21,337 | $ | 55,768 | ||||||||
| Provision for loan losses before benefit attributable to FDIC loss share agreements |
73,819 | 21,180 | 12,374 | 107,373 | ||||||||||||
| Benefit attributable to FDIC loss share agreements |
(64,922 | ) | — | — | (64,922 | ) | ||||||||||
| Net provision for loan losses |
8,897 | 21,180 | 12,374 | 42,451 | ||||||||||||
| Increase in FDIC loss share receivable |
64,922 | — | — | 64,922 | ||||||||||||
| Loans charged-off |
(325 | ) | (18,311 | ) | (15,222 | ) | (33,858 | ) | ||||||||
| Recoveries |
1 | 4,856 | 1,960 | 6,817 | ||||||||||||
| Balance, end of period |
$ | 73,640 | $ | 42,011 | $ | 20,449 | $ | 136,100 | ||||||||
| December 31, 2009 | ||||||||||||||||
| IBERIABANK | ||||||||||||||||
| (dollars in thousands) | Covered Loans |
Non-covered loans |
IBERIABANK fsb | Total | ||||||||||||
| Balance, beginning of period |
$ | — | $ | 26,671 | $ | 14,201 | $ | 40,872 | ||||||||
| Provision for loan losses before benefit attributable to FDIC loss share agreements |
— | 18,577 | 26,793 | 45,370 | ||||||||||||
| Benefit attributable to FDIC loss share agreements |
— | — | — | — | ||||||||||||
| Net provision for loan losses |
— | 18,577 | 26,793 | 45,370 | ||||||||||||
| Increase in FDIC loss share receivable |
147 | — | — | 147 | ||||||||||||
| Loans charged-off |
(2 | ) | (12,957 | ) | (20,309 | ) | (33,267 | ) | ||||||||
| Recoveries |
— | 1,995 | 651 | 2,646 | ||||||||||||
| Balance, end of period |
$ | 145 | $ | 34,286 | $ | 21,337 | $ | 55,768 | ||||||||
The following table presents the allocation of the allowance for loan losses and the percentage of the total amount of loans in each loan category listed as of the dates indicated.
ALLOCATION OF THE ALLOWANCE FOR LOAN LOSSES
| December 31, | ||||||||||||||||||||||||||||||||||||||||
| 2010 | 2009 | 2008 | 2007 | 2006 | ||||||||||||||||||||||||||||||||||||
| Reserve % |
% of Loans |
Reserve % |
% of Loans |
Reserve % |
% of Loans |
Reserve % |
% of Loans |
Reserve % |
% of Loans |
|||||||||||||||||||||||||||||||
| Commercial, financial and agricultural |
59 | % | 69 | % | 78 | % | 64 | % | 78 | % | 62 | % | 68 | % | 58 | % | 71 | % | 55 | % | ||||||||||||||||||||
| Real estate – mortgage |
22 | 10 | 3 | 17 | 3 | 13 | 4 | 17 | 4 | 19 | ||||||||||||||||||||||||||||||
| Real estate – construction |
— | 1 | — | 1 | — | 1 | 7 | 1 | — | 2 | ||||||||||||||||||||||||||||||
| Loans to individuals |
19 | 20 | 19 | 18 | 19 | 24 | 21 | 24 | 25 | 24 | ||||||||||||||||||||||||||||||
| Unallocated |
— | — | — | — | — | — | — | — | — | — | ||||||||||||||||||||||||||||||
| Total allowance for loan losses |
100 | % | 100 | % | 100 | % | 100 | % | 100 | % | 100 | % | 100 | % | 100 | % | 100 | % | 100 | % | ||||||||||||||||||||
The allowance for loan losses amounted to $136.0 million, or 2.26% of total loans, at December 31, 2010, $80.3 million higher than at December 31, 2009. The allowance as a percentage of loans was 130 basis points above the 0.96% at December 31, 2009. Of the total allowance, $115.7 million related to the IBERIABANK loan portfolio and $20.4 million related to the IBERIABANK fsb portfolio, and represents 2.35% and 1.84% of respective loan portfolio balances at December 31, 2010. Since December 31, 2009, the IBERIABANK allowance has increased $81.2 million, or 235.9%, while IBERIABANK fsb’s allowance decreased slightly to $20.4 million.
The increase in the IBERIABANK portfolio was primarily related to increased reserves on the covered loan portfolio based on the Company’s estimate of expected cash flows from these portfolios at December 31, 2010. The allowance for loan losses on covered loans increased $73.5 million from December 31, 2009, or 90.5% of the total IBERIABANK increase over December 31, 2009. Expected cash flows on certain of the Company’s acquired loan pools decreased during 2010, and thus a reserve was established to cover additional expected losses in these portfolios. The total increase in the allowance for covered loans based on these cash flows was recorded as an $8.9 million provision for loan losses in the Company’s consolidated statement of income for the year ended December 31, 2010 and a $64.9 million increase in the Company’s FDIC loss share receivable.
The allowance for loan losses on the non-covered portion of the Company’s loan portfolio increased due to a decline in asset quality and additional specific reserves on commercial credits at IBERIABANK. The allowance for loan losses was affected by net charge-offs of $26.7 million in 2010. Of the $26.7 million, $13.5 million, or 50.4%, were IBERIABANK charge-offs while $13.3 million, or 49.6%, were IBERIABANK fsb charge-offs. Net charge-offs as a percentage of total loans at IBERIABANK were 0.42% of average loans and 1.29% of average loans at IBERIABANK fsb at December 31, 2010. Excluding charge-off
replacement, the Company recorded a provision of $6.8 million to reserve for loan growth and changes in asset quality during the year to address the increased risk of loss inherent in the Company’s legacy loan portfolio at December 31, 2010.
Because of the increase in the allowance during 2010, the allowance for loan losses covers nonperforming loans 1.23 times, consistent with nonperforming loan coverage at December 31, 2009. The allowance for loan losses on non-covered loans covers total past due loans 97.2% at December 31, 2010, an increase compared to the December 31, 2009 coverage of 80.3%.
FDIC Loss Share Receivable
As part of the three FDIC-assisted acquisitions during 2009, the Company recorded a $1.0 billion receivable from the FDIC, which represents the fair value of the expected reimbursable losses covered by the loss share agreements. The FDIC loss share receivable decreased $307.9 million, or 29.8%, during 2010 as the Company moved current expected reimbursements resulting from loan charge-offs to the receivable due from the FDIC, included in other assets discussed below. Offsetting the decreases due to reimbursements was a $66.8 million increase due to the Sterling acquisition during the third quarter of 2010 and $64.9 million to account for a decrease in expected cash flows from original loss estimates on some of the Company’s covered loan pools.
The following table sets forth the activity in the FDIC loss share receivable asset for the periods indicated.
| December 31, | ||||||||
| (dollars in thousands) | 2010 | 2009 | ||||||
| Balance, beginning of period |
$ | 1,034,734 | $ | — | ||||
| Acquisition |
66,826 | 1,031,902 | ||||||
| Increase due to a decrease in cash flow estimates |
64,922 | 44 | ||||||
| Amortization |
(13,024 | ) | 2,788 | |||||
| Submission of reimbursable losses to the FDIC |
(424,258 | ) | — | |||||
| Decrease due to an increase in cash flow estimates |
(2,329 | ) | — | |||||
| Balance, end of period |
$ | 726,871 | $ | 1,034,734 | ||||
Investment Securities
The following table shows the carrying values of securities by category as of the dates indicated.
CARRYING VALUE OF SECURITIES
| December 31, | ||||||||||||||||||||||||||||||||||||||||
| (dollars in thousands) | 2010 | 2009 | 2008 | 2007 | 2006 | |||||||||||||||||||||||||||||||||||
| Securities available for sale: |
||||||||||||||||||||||||||||||||||||||||
| U.S. Government- sponsored enterprise obligations |
$ | 422,800 | 21 | % | $ | 241,168 | 15 | % | $ | 76,617 | 9 | % | $ | 65,174 | 8 | % | $ | 169,805 | 29 | % | ||||||||||||||||||||
| Obligations of state and political subdivisions |
40,169 | 2 | 50,460 | 3 | 44,681 | 5 | 44,769 | 6 | 40,654 | 7 | ||||||||||||||||||||||||||||||
| Mortgage backed securities |
1,263,869 | 63 | 1,020,939 | 65 | 706,472 | 79 | 634,466 | 79 | 348,373 | 60 | ||||||||||||||||||||||||||||||
| Other securities |
2,956 | — | 7,909 | — | 973 | — | 974 | — | — | — | ||||||||||||||||||||||||||||||
| Total securities available for sale |
1,729,794 | 86 | 1,320,476 | 83 | 828,743 | 93 | 745,383 | 93 | 558,832 | 96 | ||||||||||||||||||||||||||||||
| Securities held to maturity: |
||||||||||||||||||||||||||||||||||||||||
| U.S. Government- sponsored enterprise obligations |
180,479 | 9 | 155,713 | 10 | 5,031 | 1 | 8,050 | 1 | 8,063 | 1 | ||||||||||||||||||||||||||||||
| Obligations of state and political subdivisions |
75,768 | 4 | 65,540 | 4 | 52,745 | 6 | 47,648 | 6 | 9,038 | 2 | ||||||||||||||||||||||||||||||
| Mortgage backed securities |
33,773 | 1 | 39,108 | 3 | 2,957 | — | 3,796 | — | 5,419 | 1 | ||||||||||||||||||||||||||||||
| Total securities held to maturity |
290,020 | 14 | 260,361 | 17 | 60,733 | 7 | 59,494 | 7 | 22,520 | 4 | ||||||||||||||||||||||||||||||
| Total securities |
$ | 2,019,814 | 100 | % | $ | 1,580,837 | 100 | % | $ | 889,476 | 100 | % | $ | 804,877 | 100 | % | $ | 581,352 | 100 | % | ||||||||||||||||||||
All of the Company’s mortgage-backed securities are agency securities. The Company does not hold any Fannie Mae or Freddie Mac preferred stock, corporate equity, collateralized debt obligations, collateralized loan obligations, structured investment vehicles, private label collateralized mortgage obligations, sub-prime, Alt-A, or second lien elements in its investment portfolio.
Investment securities increased by $439.0 million, or 27.8%, to $2.0 billion at December 31, 2010. The increase was due to the acquisition of $53.6 million in securities from the Sterling acquisition, as well as purchases of securities during the year using the Company’s available cash. The Company purchased $1.2 billion in available for sale securities and $96.4 million in held to maturity securities during the year to invest cash in higher-yielding products.
The following table summarizes activity in the Company’s investment securities portfolio during 2010. There were no transfers of securities between investment categories during the year.
| (dollars in thousands) | Available for Sale | Held to Maturity | ||||||
| Balance, beginning of period |
$ | 1,320,476 | $ | 260,361 | ||||
| Purchases |
1,197,891 | 96,375 | ||||||
| Acquisitions |
53,551 | — | ||||||
| Sales, net of gains |
(243,836 | ) | — | |||||
| Principal maturities, prepayments and calls |
(576,139 | ) | (66,011 | ) | ||||
| Amortization of premiums and accretion of discounts |
(14,345 | ) | (705 | ) | ||||
| Increase (Decrease) in market value |
(7,287 | ) | — | |||||
| Other than temporary impairment |
(517 | ) | — | |||||
| Balance, end of period |
$ | 1,729,794 | $ | 290,020 | ||||
During the third quarter of 2010, management assessed the operating environment of a bond issuer as adverse and thus concluded that the Company had one unrated revenue municipal bond that warranted a $0.5 million other-than-temporary impairment charge during the year ended December 31, 2010. The specific impairment was related to the loss of the contracted revenue source required for bond repayment. The bond was acquired in 2007 and was impaired 10% during the year ended December 31, 2007 based on significant delays in construction of the project. The additional charge in the current period brings the total
impairment to 30% of the par value of the bond and provides a fair value of the bonds that is consistent with current market pricing. Because adverse conditions were noted in the operations of the bond issuer, the Company recorded the other-than-temporary impairment, but notes the bond does have insurance coverage from one of the remaining monocline insurers and the Company is current on its receipt of interest related to the bonds. As a result of the Company’s analysis, no other declines in the market value of the Company’s investment securities are deemed to be other-than-temporary at December 31, 2010. At December 31, 2010, the Company’s investment portfolio did not contain any securities that are directly backed by subprime or Alt-A mortgages.
Funds generated as a result of sales and prepayments are used to fund loan growth and purchase other securities. The Company continues to monitor market conditions and take advantage of market opportunities with appropriate rate and risk return elements. Note 4 of the Consolidated Financial Statements provides further information on the Company’s investment securities.
Short-term Investments
Short-term investments result from excess funds that fluctuate daily depending on the funding needs of the Company and are currently invested overnight in interest-bearing deposit accounts at the FHLB of Dallas and Atlanta, the total balance of which earns interest at the current FHLB discount rate.
The balance in interest-bearing deposits at other institutions increased $162.1 million, or 200.8%, from $80.7 million at December 31, 2009 to $242.8 million at December 31, 2010. The Company has deployed a portion of the $329.0 million in net proceeds from its common stock issuance to fund loan growth, invest in additional investment securities, and pay down its short-term and long-term debt, all in an attempt to improve the average rate earned on interest-earning assets, since the average rate paid on these funds was 0.25% during 2010 and 0.23% during 2009. These uses of funds were offset by deposit growth and cash acquired in the Sterling acquisition during the third quarter of 2010. The Company’s cash activity is further discussed in the “Liquidity” section below.
Other Assets
The following table details the changes in other asset balances at the dates indicated.
OTHER ASSETS COMPOSITION
| December 31, | ||||||||||||||||||||
| (dollars in thousands) | 2010 | 2009 | 2008 | 2007 | 2006 | |||||||||||||||
| Other Earning Assets |
||||||||||||||||||||
| FHLB and FRB stock |
$ | 57,280 | $ | 61,716 | $ | 29,673 | $ | 37,998 | $ | 22,378 | ||||||||||
| Fed funds sold |
9,038 | 261,421 | 9,866 | — | — | |||||||||||||||
| Other interest-bearing assets (1) |
3,358 | 3,358 | 3,358 | 3,141 | 1,630 | |||||||||||||||
| Total earning assets |
69,676 | 326,495 | 42,897 | 41,139 | 24,008 | |||||||||||||||
| Other Assets |
||||||||||||||||||||
| Premises and equipment |
208,403 | 137,426 | 131,404 | 122,452 | 71,007 | |||||||||||||||
| Bank-owned life insurance |
72,536 | 70,813 | 67,921 | 64,955 | 46,705 | |||||||||||||||
| Goodwill |
234,228 | 227,080 | 236,761 | 231,177 | 92,779 | |||||||||||||||
| Core deposit intangibles |
22,975 | 26,342 | 16,193 | 16,736 | 6,291 | |||||||||||||||
| Title plant and other intangible assets |
6,722 | 6,722 | 6,729 | 6,714 | — | |||||||||||||||
| Accrued interest receivable |
34,250 | 32,869 | 19,633 | 22,842 | 15,514 | |||||||||||||||
| Other real estate owned |
69,218 | 74,092 | 16,312 | 9,414 | 2,008 | |||||||||||||||
| Derivative market value |
37,320 | 32,697 | 20,559 | 4,623 | 2,840 | |||||||||||||||
| Receivable due from the FDIC |
42,494 | 6,817 | — | — | — | |||||||||||||||
| Investment in new market tax credit entities |
112,296 | 104,200 | — | — | — | |||||||||||||||
| Other |
49,049 | 68,836 | 22,153 | 19,475 | 17,274 | |||||||||||||||
| Total |
$ | 959,167 | $ | 1,114,389 | $ | 580,562 | $ | 539,527 | $ | 278,426 | ||||||||||
| (4) | Other interest-bearing assets are composed primarily of trust preferred common securities. |
The $4.4 million decrease in FHLB stock is the result of $13.0 million in repurchases of stock during 2010. The repurchases are mandatory for eligible stock based on FHLB regulations. The repurchases were offset partially by $5.2 million in additional FRB stock purchases and $1.0 million in FHLB stock purchases during 2010, as well as $2.3 million in stock acquired from Sterling.
Fed funds sold decreased $252.4 million since December 31, 2009. Fed funds sold represent short-term excess liquidity, and the balance varies based on the daily requirements of short-term liquidity needed by the Company and its subsidiaries for loan growth and other operating activities.
The $71.0 million increase in premises and equipment in 2010 was a result of the purchase of $45.0 million in branch premises and equipment from the FDIC as part of the CSB, Orion, and Century acquisitions, as well as additional capitalized expenditures at the Company’s branches during 2010. The investment in additional branch property is part of the Company’s growth strategy and expansion into new markets.
The $1.7 million increase in the Company’s bank-owned life insurance balance was a result of earnings on existing policies during 2010.
The Sterling acquisition accounted for the entire $7.1 million increase in goodwill during 2010. There were no other changes to goodwill during 2010. The decrease of $9.7 million from December 31, 2008 to December 31, 2009 was the result of an impairment charge at the Company’s LTC subsidiary. The fair value of goodwill was determined to be less than the current carrying amount of the goodwill, and thus the impairment charge was included in the Company’s operating results for the twelve months of 2009.
The $3.4 million decrease in core deposit intangibles was due to amortization expense of $4.9 million during 2010. Offsetting the amortization expense was a $1.6 million core deposit intangible asset recorded as part of the Sterling acquisition during July 2010.
The $1.4 million increase in accrued interest receivable from December 31, 2009 is attributable primarily to loan growth, but was offset partially by the timing of interest payments during the year.
Other real estate includes all real estate, other than bank premises used in bank operations, that is owned or controlled by the Company, including real estate acquired in settlement of loans and former bank premises no longer used. The $4.9 million decrease in the Company’s OREO balance from December 31, 2009 was a result of the sales of numerous OREO properties during 2010. IBERIABANK OREO properties decreased $6.2 million, or 9.9%, while IBERIABANK fsb OREO properties increased $1.3 million, or 11.8%.
The decrease in OREO at IBERIABANK was a result of the movement of covered OREO balances out of the portfolio both because properties were sold and charged off during 2010. The decrease in covered OREO balances of $8.1 million, or 13.8%, accounted for the majority of the change at IBERIABANK, as legacy IBERIABANK OREO increased $1.9 million. The $1.9 million increase in the legacy IBERIABANK portfolio includes the addition in 2010 of $1.6 million in former bank properties, and was not the result of significant additional properties acquired in foreclosure.
The increase in OREO at IBERIABANK fsb was primarily from one property addition of $2.2 million in 2010. Excluding this property, total IBERIABANK fsb OREO properties would have decreased $0.9 million, or 8.1%.
The $4.6 million increase in the market value of the Company’s derivatives was attributable to $5.5 million in additional derivatives recorded on the Company’s equity-linked CD product. Despite the increase in notional amounts of customer derivative agreements during 2010, the fair value adjustments on existing customer derivative agreements recorded during 2010 offset the increase in fair value from CD-product derivatives.
The balance due to the Company from the FDIC in accordance with the loss share agreements increased $35.7 million during 2010. The increase in the balance was a result of the charge off of incurred losses on covered loans and OREO properties from their respective portfolios. The balance due from the FDIC includes the reimbursable portion of incurred losses and reimbursable expenses, as well as a portion of settlement items from the initial acquisitions.
The $8.1 million increase in the Company’s investments in new market tax credits represents additional tax credit investments made during 2010 of $11.8 million, offset by the amortization of the tax credits as they are recognized in the Company’s income tax provision calculation.
The $19.8 million decrease in other assets since December 31, 2009 was primarily the result of two events. First, the Company’s prepaid deposit insurance assessments to the FDIC decreased $10.2 million, or 43.7%, from December 31, 2009. The $13.2 million balance at December 31, 2010 is based on an estimate of the Company’s deposit insurance liability for the next two years and changes as updated assessments are received from the FDIC. In addition, the Company’s clearing account for investments sold decreased $9.4 million from December 31, 2009. The Company sold securities before the end of the year in 2009 for which
the proceeds from the sale were not received until after December 31, 2009. There were no significant sales of investment securities around year-end in 2010.
There was no significant change in the Company’s other interest bearing assets, title plant or other intangible asset balances since December 31, 2009.
FUNDING SOURCES
Deposits obtained from clients in its primary market areas are the Company’s principal source of funds for use in lending and other business purposes. The Company attracts local deposit accounts by offering a wide variety of accounts, competitive interest rates and convenient branch office locations and service hours. Increasing core deposits through acquisitions and the development of client relationships is a continuing focus of the Company. Borrowings have become an increasingly important funding source as the Company has grown. Other funding sources include short-term and long-term borrowings, subordinated debt and shareholders’ equity. The following discussion highlights the major changes in the mix of deposits and other funding sources during 2010.
Deposits
The Company’s ability to attract and retain customer deposits is critical to the Company’s continued success. During 2010, deposits increased $359.0 million, or 4.8%, totaling $7.9 billion at December 31, 2010. $287.0 million, or 80.0%, of the 2010 growth was a result of acquired deposits. The Company had organic deposit growth of $72.0 million during the year, accounting for 20.0% of total growth.
Total deposit growth was driven by a $657.0 million increase in savings and money market accounts, but was offset primarily by a 7.5%, or $232.2 million, decrease in time deposits.
The following tables set forth the composition of the Company’s deposits at the dates indicated.
DEPOSIT COMPOSITION
| December 31, | ||||||||||||||||||||||||||||||||||||||||
| (dollars in thousands) | 2010 | 2009 | 2008 | 2007 | 2006 | |||||||||||||||||||||||||||||||||||
| Noninterest-bearing DDA |
$ | 878,768 | 11 | % | $ | 874,885 | 11 | % | $ | 620,637 | 16 | % | $ | 468,001 | 13 | % | $ | 354,961 | 15 | % | ||||||||||||||||||||
| NOW accounts |
1,281,825 | 16 | 1,351,609 | 18 | 821,649 | 20 | 828,099 | 24 | 628,541 | 26 | ||||||||||||||||||||||||||||||
| Savings and money market |
2,910,114 | 37 | 2,253,065 | 30 | 954,408 | 24 | 766,429 | 22 | 588,202 | 24 | ||||||||||||||||||||||||||||||
| Certificates of deposit |
2,844,399 | 36 | 3,076,589 | 41 | 1,599,122 | 40 | 1,422,299 | 41 | 850,878 | 35 | ||||||||||||||||||||||||||||||
| Total deposits |
$ | 7,915,106 | 100 | % | $ | 7,556,148 | 100 | % | $ | 3,995,816 | 100 | % | $ | 3,484,828 | 100 | % | $ | 2,422,582 | 100 | % | ||||||||||||||||||||
| IBERIABANK | IBERIABANK fsb | |||||||||||||||||||||||||||||||
| (dollars in thousands) | 2010 | 2009 | 2010 | 2009 | ||||||||||||||||||||||||||||
| Noninterest-bearing DDA |
$ | 706,101 | 11 | % | $ | 722,004 | 11 | % | $ | 172,667 | 13 | % | $ | 152,881 | 13 | % | ||||||||||||||||
| NOW accounts |
1,080,104 | 16 | 1,148,426 | 18 | 201,721 | 16 | 203,183 | 18 | ||||||||||||||||||||||||
| Savings and money market |
2,500,026 | 38 | 1,947,749 | 30 | 410,088 | 32 | 305,316 | 27 | ||||||||||||||||||||||||
| Certificates of deposit |
2,333,725 | 35 | 2,588,534 | 41 | 510,674 | 39 | 488,055 | 42 | ||||||||||||||||||||||||
| Total deposits |
$ | 6,619,956 | 100 | % | $ | 6,406,713 | 100 | % | $ | 1,295,150 | 100 | % | $ | 1,149,435 | 100 | % | ||||||||||||||||
IBERIABANK total deposits increased $213.2 million, or 3.3%, during the year, with savings and money market deposits accounting for the increase. Noninterest-bearing deposits, NOW accounts, and Certificates of Deposit (“CDs”) decreased 2.2%, 5.9%, and 9.8%, respectively. The decrease in CDs from 2009 is primarily a result of maturing CDs from IBERIABANK’s Florida deposits, as acquired CDs were repriced during 2010.
From a market perspective, deposit growth was seen primarily in IBERIABANK’s newer Mobile, Alabama market, as well as the Baton Rouge and Northshore (Louisiana) markets. Mobile experienced growth of $78.3 million, six-fold growth from 2009 deposit levels. The Baton Rouge and Northshore markets contributed deposit growth of $104.6 million (46.2% growth) and $36.6 million (41.2% growth), respectively. Market growth was offset by deposit runoff in the Shreveport, Louisiana and Jacksonville, Florida markets.
Total deposits at IBERIABANK fsb increased $145.7 million, or 12.7%, during 2010, with growth in the savings and money market accounts of $104.8 million driving the overall increase. At a market level, the Houston, Texas market increased customer deposits $102.6 million, a four-fold increase over 2009. The Memphis, Tennessee market continues to expand, as total customer deposits increased $27.3 million, or 21.5%, in that market during 2010.
Total CDs decreased $232.2 million, or 7.5%, during the year. CDs $100,000 and over decreased $94.3 million, or 5.9%, from $1.6 billion at December 31, 2009 to $1.5 billion at December 31, 2010. The following table details large-denomination certificates of deposit by remaining maturities.
REMAINING MATURITY OF CDS $100,000 AND OVER
| (dollars in thousands) | 2010 | December 31, 2009 |
2008 | |||||||||
| 3 months or less |
$ | 361,761 | $ | 442,853 | $ | 216,704 | ||||||
| Over 3 – 12 months |
764,771 | 752,056 | 290,452 | |||||||||
| Over 12 – 36 months |
305,257 | 383,897 | 134,396 | |||||||||
| More than 36 months |
82,245 | 29,516 | 44,087 | |||||||||
| Total |
$ | 1,514,034 | $ | 1,608,322 | $ | 685,639 | ||||||
Additional information regarding deposits is provided in Note 11 of the Consolidated Financial Statements.
Short-term Borrowings
The Company may obtain advances from the FHLB of Dallas based upon the common stock it owns in the FHLB of Dallas and certain of its real estate loans and investment securities, provided certain standards related to the Company’s creditworthiness have been met. These advances are made pursuant to several credit programs, each of which has its own interest rate and range of maturities. The level of short-term borrowings can fluctuate significantly on a daily basis depending on funding needs and the source of funds chosen to satisfy those needs.
Total short-term borrowings decreased $43.0 million, or 16.3%, to $220.3 million at December 31, 2010 compared to $263.4 million at December 31, 2009. The decrease in borrowings was a result of a decrease in the Company’s short-term FHLB borrowings of $90.0 million from December 31, 2009, due primarily to the repayment of all outstanding short-term advances before year-end. The Company’s liquidity from cash and fed funds sold was able to fund short-term cash needs. The decrease in FHLB advances during the year was offset partially by an increase of $47.0 million in the Company’s securities sold under agreements to repurchase. Total short-term debt was 2.5% of total liabilities and 33.8% of total borrowings at December 31, 2010, which compares favorably to 3.0% and 26.1%, respectively, at December 31, 2009.
On an average basis, short-term borrowings in 2010 were $216.1 million, compared to $199.5 million in 2009. The increase can be attributed to customer repurchase agreements, as the Company’s average short-term advances consistently decreased as the year wore on. The weighted average rate on short-term borrowings was 0.37% for 2010, compared to 0.66% for 2009. For additional information regarding short-term borrowings, see Note 12 of the Consolidated Financial Statements.
Long-term Debt
The Company’s long-term borrowings decreased $313.6 million, or 42.0%, to $432.3 million at December 31, 2010, compared to $745.9 million at December 31, 2009. The decrease in borrowings from December 31, 2009 is a result of repayments of maturing long-term FHLB advances and the Company’s $25.0 million subordinated note to a correspondent bank during 2010.
During the second quarter of 2010, the Company repaid $168.4 million of FHLB advances assumed from CSB and Century in 2009. The Company paid $168.7 million to repay the advances, incurring $0.3 million in prepayment penalties that are included in the Company’s statement of operation for the year ended December 31, 2010. During the third quarter of 2010, the Company repaid an additional $74.3 million in FHLB advances and incurred a prepayment penalty of $3.5 million that is also included in the Company’s statement of operations for December 31, 2010. Also in the third quarter, the Company repaid all $26.3 million of advances assumed from Sterling in July 2010. The repayment of the $25.0 million subordinated note included a $0.2 million write-off of prepaid structuring fees associated with the subordinated debt that also affected operating results for the year.
On average, the Company’s long-term debt increased $10.6 million, or 1.8%, during 2010, despite the acquisition of $26.3 million in debt from Sterling. Average long-term debt was 6.6% of total liabilities for 2010, a decrease from 10.4% during 2009. On a period-end basis, long-term debt was less than 5.0% of total liabilities at December 31, 2010.
The Company’s long-term borrowings at December 31, 2010 included $269.2 million in fixed-rate advances from the FHLB of Dallas and Atlanta which cannot be paid off without incurring substantial prepayment penalties. The Company’s remaining debt consists of $111.2 million of junior subordinated deferrable interest debentures of the Company and $51.8 million in notes payable on investments in the Company’s new market tax credit entities. The debentures are issued to statutory trusts that were funded by the issuance of floating rate capital securities of the trusts and qualify as Tier 1 Capital for regulatory purposes. Interest is payable quarterly and may be deferred at any time at the election of the Company for up to 20 consecutive quarterly periods. During any deferral period, the Company is subject to certain restrictions, including being prohibited from declaring dividends to its common shareholders. During 2010, the Company did not issue additional trust preferred securities. The securities are redeemable by the Company in whole or in part after five years, or earlier under certain circumstances.
The following table summarizes each outstanding issue of junior subordinated debt. For additional information, see Note 13 of the Consolidated Financial Statements.
JUNIOR SUBORDINATED DEBT COMPOSITION
| (dollars in thousands) | ||||||||||||||
| Date Issued |
Term | Callable After(4) | Interest Rate(5) | Amount | ||||||||||
| Junior subordinated debt |
||||||||||||||
| March 2000(1) |
30 years | - | 10.875% | $ | 7,544 | |||||||||
| March 2001(2) |
30 years | - | 10.180% | 7,824 | ||||||||||
| November 2002 |
30 years | 5 years | LIBOR plus 3.250% | 10,310 | ||||||||||
| June 2003 |
30 years | 5 years | LIBOR plus 3.150% | 10,310 | ||||||||||
| March 2003 (3) |
30 years | 5 years | LIBOR plus 3.150% | 6,186 | ||||||||||
| September 2004 |
30 years | 5 years | LIBOR plus 2.000% | 10,310 | ||||||||||
| October 2006 |
30 years | 5 years | LIBOR plus 1.600% | 15,464 | ||||||||||
| June 2007 |
30 years | 5 years | LIBOR plus 1.435% | 10,310 | ||||||||||
| November 2007 |
30 years | 5 years | LIBOR plus 2.640% | 25,775 | ||||||||||
| March 2008 |
30 years | 5 years | LIBOR plus 3.500% | 7,217 | ||||||||||
| Balance, December 31, 2010 |
$ | 111,250 | ||||||||||||
| (1) | Obtained via the PIC acquisition |
| (2) | Obtained via the Pocahontas acquisition |
| (3) | Obtained via the American Horizons acquisition. |
| (4) | Subject to regulatory requirements. |
| (5) | The interest rate on the Company’s junior subordinated debt, excluding the debt acquired in the PIC and Pocahontas acquisitions, is indexed to LIBOR and is based on the 3-month LIBOR rate. At December 31, 2010, the 3-month LIBOR rate was 0.30281%. |
SHAREHOLDERS’ EQUITY
Shareholders’ equity provides a source of permanent funding, allows for future growth and provides the Company with a cushion to withstand unforeseen adverse developments. At December 31, 2010, shareholders’ equity totaled $1.3 billion, an increase of $342.1 million, or 35.6%, compared to $961.3 million at December 31, 2009. The following table details the changes in shareholders’ equity during 2010.
CHANGES IN SHAREHOLDERS’ EQUITY
| (dollars in thousands) |
Amount | |||
| Balance, beginning of period |
$ | 961,318 | ||
| Common stock issued |
328,980 | |||
| Net income |
48,826 | |||
| Reissuance of treasury stock under management incentive plans, net of shares surrendered |
767 | |||
| Cash dividends declared- common stock |
(36,495 | ) | ||
| Increase in other comprehensive income |
(7,736 | ) | ||
| Share-based compensation cost |
7,797 | |||
| Balance, end of period |
$ | 1,303,457 | ||
In March 2010, the Company completed the sale of 5,973,207 shares of its common stock in an underwritten public offering at a price of $57.75 per share. The shares include 778,402 shares pursuant to the exercise of the underwriters’ over-allotment option. The net proceeds of the offering, after deducting underwriting discounts and commissions and estimated offering expenses, were $329.0 million.
Although the issuance of the common stock in March 2010 did not have a dilutive effect on the per share results of operations for the years ended December 31, 2009 or 2008, the outstanding shares affect per share results in 2010.
In April 2007, the Board of Directors of the Company authorized a share repurchase program authorizing the repurchase of up to 300,000 shares of the Company’s outstanding common stock, or approximately 1.1% of total shares outstanding. As of December 31, 2010, the Company had 149,029 shares remaining for repurchase under the plan.
Stock repurchases generally are affected through open market purchases, and may be made through unsolicited negotiated transactions. During 2010, the Company did not repurchase any shares of its common stock on the open market.
For more information on the Company’s common stock issuance, see Note 23 of the footnotes to the consolidated financial statements.
CAPITAL RESOURCES
Federal regulations impose minimum regulatory capital requirements on all institutions with deposits insured by the Federal Deposit Insurance Corporation. The Federal Reserve Board (“FRB”) imposes similar capital regulations on bank holding companies. Compliance with bank and bank holding company regulatory capital requirements, which include leverage and risk-based capital guidelines, are monitored by the Company on an ongoing basis. Under the risk-based capital method, a risk weight is assigned to balance sheet and off-balance sheet items based on regulatory guidelines. At December 31, 2010, the Company exceeded all regulatory capital ratio requirements with a Tier 1 leverage capital ratio of 11.24%, a Tier 1 risk-based capital ratio of 18.48% and a total risk-based capital ratio of 19.74%.
At December 31, 2010, both IBERIABANK and IBERIABANK fsb also exceeded all regulatory capital ratio requirements with Tier 1 leverage capital ratios of 8.14% and 10.83%, Tier 1 risk-based capital ratios of 14.39% and 12.74% and total risk-based capital ratios of 15.66% and 13.98%, respectively. Upon the merger of IBERIABANK fsb with and into IBERIABANK as of the close of business on December 31, 2010, IBERIABANK continued to exceed all regulatory capital ratio requirements.
Throughout 2010, the Company’s regulatory capital ratios and those of the Banks were in excess of the levels established for “well-capitalized” institutions as well, as shown in the following graph and table.
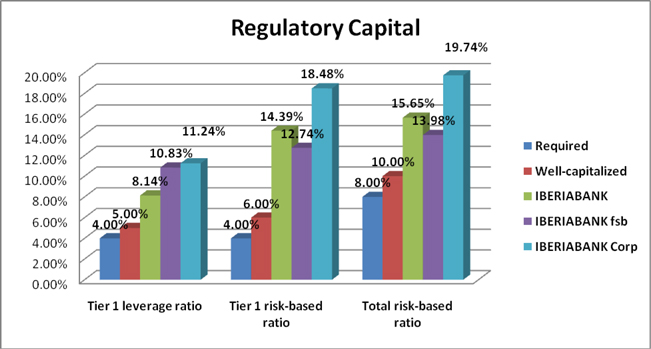
| At December 31, 2010 | ||||||||||||||||
| (dollars in thousands) |
Entity |
“Well- Capitalized” Minimums |
Actual | Excess | ||||||||||||
| Ratio |
||||||||||||||||
| Tier 1 Leverage Ratio |
Consolidated | 5.00 | % | 11.24 | % | $ 628,956 | ||||||||||
| IBERIABANK | 5.00 | 8.14 | 266,609 | |||||||||||||
| IBERIABANK fsb | 5.00 | 10.83 | 88,142 | |||||||||||||
| Tier 1 risk-based capital ratio |
Consolidated | 6.00 | 18.48 | 764,921 | ||||||||||||
| IBERIABANK | 6.00 | 14.39 | 402,734 | |||||||||||||
| IBERIABANK fsb | 6.00 | 12.74 | 86,638 | |||||||||||||
| Total risk-based capital ratio |
Consolidated | 10.00 | 19.74 | 597,089 | ||||||||||||
| IBERIABANK | 10.00 | 15.65 | 271,420 | |||||||||||||
| IBERIABANK fsb | 10.00 | 13.98 | 51,146 | |||||||||||||
For additional information on the Company’s capital ratios, see Note 17 to the Consolidated Financial Statements.
RESULTS OF OPERATIONS
The Company reported income available to common shareholders of $48.8 million, $155.0 million, and $39.6 million for the years ended December 31, 2010, 2009 and 2008, respectively. Earnings per share (“EPS”) on a diluted basis were $1.88 for 2010, $8.41 for 2009, and $2.97 for 2008. During 2010, net interest income increased $108.8 million, or 63.0%, as interest income increased $126.0 million, or 46.6%. Partially offsetting the increase in interest income was a $17.1 million, or 17.6%, increase in interest expense. The increase in net interest income was a result of additional customer volume in 2010, resulting from both acquisition and organic growth. Income available to common shareholders was also positively impacted by a $2.9 million decrease in the Company’s provision for loan losses.
The decrease in income available to common shareholders was most affected by a $210.6 million, or 61.1%, decrease in noninterest income from 2010, as well as an $81.0 million increase in noninterest expense during the current year. The decrease in noninterest income from 2009 was primarily the result of the gains the Company recorded on the three acquisitions in 2009. Total gains on these acquisitions totaled $238.9 million for the year ended December 31, 2009. Additional settlement items from
the Orion acquisition led to the $3.8 million in gains taken in 2010. The Company’s 2010 acquisition of Sterling resulted in $7.1 million in goodwill, and as a result no gain was recorded on the acquisition during 2010. The increased size and complexity of the Company, as well as significant conversion and integration expenses, led to the overall increase in noninterest expense over 2009.
The $179.9 million decrease in income before income taxes reduced income tax expense $70.3 million in 2010. Cash earnings, defined as net income before the net of tax amortization of acquisition intangibles, amounted to $52.0 million, $156.9 million and $41.5 million for the years ended December 31, 2010, 2009 and 2008, respectively.
The following discussion provides additional information on the Company’s operating results for the years ended December 31, 2010, 2009, and 2008, segregated by major income statement caption.
Net Interest Income
Net interest income is the difference between interest realized on earning assets and interest paid on interest-bearing liabilities and is also the driver of core earnings. As such, it is subject to constant scrutiny by management. The rate of return and relative risk associated with earning assets are weighed to determine the appropriateness and mix of earning assets. Additionally, the need for lower cost funding sources is weighed against relationships with clients and future growth requirements. The Company’s average interest rate spread, which is the difference between the yields earned on earning assets and the rates paid on interest-bearing liabilities, was 2.84%, 2.78%, and 2.67% during the years ended December 31, 2010, 2009, and 2008, respectively. The Company’s net interest margin on a taxable equivalent (TE) basis, which is net interest income (TE) as a percentage of average earning assets, was 3.05%, 3.09%, and 3.03% during the years ended December 31, 2010, 2009 and 2008, respectively.
Net interest income increased $108.8 million, or 63.0%, in 2010 to $281.6 million from $172.8 million in 2009. The improvement in net interest income was the result of an increase in average earning assets, but was tempered by a decrease in the average yield of interest-earning assets. The decrease in yields on earning assets is consistent with industry-wide interest rate trends over the past 12 months and the Company’s expectations.
In 2009, net interest income increased $35.1 million, or 25.5%, to $172.8 million compared to $137.6 million in 2008. This increase was due to a $6.6 million, or 2.5%, increase in interest income, along with a $28.6 million, or 22.7%, decrease in interest expense. The improvement in net interest income was the result of increased volume due to growth, as well as an improved mix of earning assets and deposits. Although earnings improved through increased net interest income, the related net interest spread and margin ratios compressed, a result of a decrease in short-term interest rates during 2009 and the associated repricing of the Company’s assets.
Average loans made up 61.3% of average earning assets in 2010 and 72.7% in 2009. Average loans increased $1.6 billion, or 37.6%, in 2010. The increase in average loans was funded by increased customer deposits and other borrowings. Average investment securities made up 18.4% of average earning assets at December 31, 2010 compared to 18.6% at December 31, 2009. Other significant components of earning assets during 2010 included the Company’s FDIC loss share receivable (9.9% of average earning assets) and excess liquidity (8.7% of earning assets on average), defined as fed funds sold and interest bearing cash. In 2009, the Company’s FDIC loss share receivable and excess liquidity was 6.8% of average earning assets.
Average interest-bearing deposits made up 89.9% of average interest-bearing liabilities during 2010 compared to 83.9% during 2009. Average short- and long-term borrowings made up 2.7% and 7.4% of average interest-bearing liabilities in 2010, respectively, compared to 4.1% and 12.0% during 2009.
The following table sets forth, for the periods indicated, information regarding (i) the total dollar amount of interest income of the Company from earning assets and the resultant average yields; (ii) the total dollar amount of interest expense on interest-bearing liabilities and the resultant average rate; (iii) net interest income; (iv) net interest spread; and (v) net interest margin. Information is based on average daily balances during the indicated periods. Investment security market value adjustments and trade-date accounting adjustments are not considered to be earning assets and, as such, the net effect is included in nonearning assets. Tax equivalent (TE) yields are calculated using a marginal tax rate of 35%.
AVERAGE BALANCES, NET INTEREST INCOME AND INTEREST YIELDS / RATES
| Years Ended December 31, | ||||||||||||||||||||||||||||||||||||
| (dollars in thousands) | 2010 | 2009 | 2008 | |||||||||||||||||||||||||||||||||
| Average Balance |
Interest | Average Yield/ Rate |
Average Balance |
Interest | Average Yield/ Rate |
Average Balance |
Interest | Average Yield/ Rate |
||||||||||||||||||||||||||||
| Earning assets: |
||||||||||||||||||||||||||||||||||||
| Loans receivable: |
||||||||||||||||||||||||||||||||||||
| Mortgage loans |
$ | 809,515 | $ | 55,267 | 6.83 | % | $ | 600,317 | $ | 32,412 | 5.40 | % | $ | 554,943 | $ | 32,633 | 5.88 | % | ||||||||||||||||||
| Commercial loans (TE) |
3,798,264 | 222,151 | 5.93 | 2,622,856 | 127,630 | 4.96 | 2,113,145 | 119,234 | 5.68 | |||||||||||||||||||||||||||
| Consumer and other loans |
1,139,275 | 75,810 | 6.65 | 954,109 | 60,240 | 6.31 | 867,715 | 61,787 | 7.12 | |||||||||||||||||||||||||||
| Total loans |
5,747,054 | 353,228 | 6.20 | 4,177,282 | 220,282 | 5.33 | 3,535,803 | 213,654 | 6.07 | |||||||||||||||||||||||||||
| Loans held for sale |
98,548 | 3,945 | 4.00 | 72,489 | 3,450 | 4.76 | 59,551 | 3,471 | 5.83 | |||||||||||||||||||||||||||
| Investment securities (TE) |
1,727,531 | 49,407 | 3.00 | 1,070,551 | 42,707 | 4.20 | 876,380 | 42,404 | 5.08 | |||||||||||||||||||||||||||
| FDIC loss share receivable |
927,758 | (13,024 | ) | -1.38 | 158,691 | 2,788 | 1.73 | — | — | — | ||||||||||||||||||||||||||
| Other earning assets |
875,937 | 2,815 | 0.32 | 267,258 | 1,160 | 0.43 | 188,694 | 4,298 | 2.28 | |||||||||||||||||||||||||||
| Total earning assets |
9,376,828 | 396,371 | 4.27 | 5,746,271 | 270,387 | 4.78 | 4,660,428 | 263,827 | 5.72 | |||||||||||||||||||||||||||
| Allowance for loan losses |
(85,231 | ) | (44,735 | ) | (39,138 | ) | ||||||||||||||||||||||||||||||
| Nonearning assets |
1,011,545 | 688,943 | 585,074 | |||||||||||||||||||||||||||||||||
| Total assets |
$ | 10,303,142 | $ | 6,390,479 | $ | 5,206,364 | ||||||||||||||||||||||||||||||
| Interest-bearing liabilities: |
||||||||||||||||||||||||||||||||||||
| Deposits: |
||||||||||||||||||||||||||||||||||||
| NOW accounts |
$ | 1,323,367 | $ | 9,148 | 0.69 | % | $ | 983,304 | $ | 7,961 | 0.81 | % | $ | 817,708 | $ | 12,131 | 1.48 | % | ||||||||||||||||||
| Savings and money market accounts |
2,759,442 | 35,641 | 1.29 | 1,285,540 | 18,533 | 1.44 | 937,026 | 19,957 | 2.13 | |||||||||||||||||||||||||||
| Certificates of deposit |
3,096,524 | 50,968 | 1.65 | 1,816,365 | 49,189 | 2.71 | 1,604,973 | 64,288 | 4.01 | |||||||||||||||||||||||||||
| Total interest-bearing deposits |
7,179,333 | 95,757 | 1.33 | 4,085,209 | 75,683 | 1.85 | 3,359,707 | 96,376 | 2.87 | |||||||||||||||||||||||||||
| Short-term borrowings |
216,116 | 814 | 0.37 | 199,480 | 1,328 | 0.66 | 205,120 | 4,458 | 2.14 | |||||||||||||||||||||||||||
| Long-term debt |
593,942 | 18,173 | 3.02 | 583,307 | 20,591 | 3.48 | 554,288 | 25,349 | 4.50 | |||||||||||||||||||||||||||
| Total interest-bearing liabilities |
7,989,391 | 114,744 | 1.43 | 4,867,996 | 97,602 | 2.00 | 4,119,115 | 126,183 | 3.05 | |||||||||||||||||||||||||||
| Noninterest-bearing demand deposits |
841,739 | 614,714 | 509,769 | |||||||||||||||||||||||||||||||||
| Noninterest-bearing liabilities |
222,247 | 116,333 | 49,314 | |||||||||||||||||||||||||||||||||
| Total liabilities |
9,053,377 | 5,599,043 | 4,678,198 | |||||||||||||||||||||||||||||||||
| Shareholders’ equity |
1,249,765 | 791,436 | 528,166 | |||||||||||||||||||||||||||||||||
| Total liabilities and shareholders’ equity |
$ | 10,303,142 | $ | 6,390,479 | $ | 5,206,364 | ||||||||||||||||||||||||||||||
| Net earning assets |
$ | 1,387,437 | $ | 878,275 | $ | 541,313 | ||||||||||||||||||||||||||||||
| Net interest spread |
$ | 281,627 | 2.84 | % | $ | 172,785 | 2.78 | % | $ | 137,644 | 2.67 | % | ||||||||||||||||||||||||
| Net interest income (TE) /Net interest margin (TE) |
$ | 289,405 | 3.05 | % | $ | 179,067 | 3.09 | % | $ | 142,546 | 3.03 | % | ||||||||||||||||||||||||
The following table displays the dollar amount of changes in interest income and interest expense for major components of earning assets and interest-bearing liabilities. The table distinguishes between (i) changes attributable to volume (changes in average volume between periods times the average yield/rate for the two periods), (ii) changes attributable to rate (changes in average rate between periods times the average volume for the two periods), and (iii) total increase (decrease).
SUMMARY OF CHANGES IN NET INTEREST INCOME
| 2010 / 2009 | 2009 / 2008 | |||||||||||||||||||||||
| Change Attributable To | Change Attributable To | |||||||||||||||||||||||
| (dollars in thousands) |
Volume | Rate | Total Increase (Decrease) |
Volume | Rate | Total Increase (Decrease) |
||||||||||||||||||
| Earning assets: |
||||||||||||||||||||||||
| Loans receivable: |
||||||||||||||||||||||||
| Mortgage loans |
$ | 12,993 | $ | 9,862 | $ | 22,855 | $ | 2,548 | $ | (2,769 | ) | $ | (221 | ) | ||||||||||
| Commercial loans (TE) |
64,727 | 29,794 | 94,521 | 25,491 | (17,095 | ) | 8,396 | |||||||||||||||||
| Consumer and other loans |
11,090 | 4,480 | 15,570 | 4,147 | (5,694 | ) | (1,547 | ) | ||||||||||||||||
| Loans held for sale |
1,104 | (609 | ) | 495 | 679 | (700 | ) | (21 | ) | |||||||||||||||
| Investment securities (TE) |
20,754 | (14,054 | ) | 6,700 | 8,518 | (8,215 | ) | 303 | ||||||||||||||||
| FDIC loss share receivable |
(4,215 | ) | (11,597 | ) | (15,812 | ) | 2,788 | — | 2,788 | |||||||||||||||
| Other earning assets |
1,726 | (71 | ) | 1,655 | 1,114 | (4,252 | ) | (3,138 | ) | |||||||||||||||
| Total net change in income on earning assets |
108,179 | 17,805 | 125,984 | 45,285 | (38,725 | ) | 6,560 | |||||||||||||||||
| Interest-bearing liabilities: |
||||||||||||||||||||||||
| Deposits: |
||||||||||||||||||||||||
| NOW accounts |
2,470 | (1,283 | ) | 1,187 | 2,113 | (6,283 | ) | (4,170 | ) | |||||||||||||||
| Savings and money market accounts |
17,814 | (706 | ) | 17,108 | 7,611 | (9,035 | ) | (1,424 | ) | |||||||||||||||
| Certificates of deposit |
25,930 | (24,151 | ) | 1,779 | 7,676 | (22,775 | ) | (15,099 | ) | |||||||||||||||
| Borrowings |
477 | (3,409 | ) | (2,932 | ) | 650 | (8,538 | ) | (7,888 | ) | ||||||||||||||
| Total net change in expense on interest- bearing liabilities |
46,691 | (29,549 | ) | 17,142 | 18,050 | (46,631 | ) | (28,581 | ) | |||||||||||||||
| Change in net interest spread |
$ | 61,488 | $ | 47,354 | $ | 108,842 | $ | 27,235 | $ | 7,906 | $ | 35,141 | ||||||||||||
Interest income includes interest income earned on earning assets as well as applicable loan fees earned. Interest income that would have been earned on nonaccrual loans had they been on accrual status is not included in the data reported above.
For the year ended December 31, 2010, average earning asset volume accounted for 85.9% of the increase in interest income, while average rate increases accounted for 14.1% of the total increase. Average loan balances increased $1.6 billion, or 37.6%, from December 31, 2009. The increase can be attributed to the loans acquired from Sterling, Orion, Century, and CSB. In addition to an increase in volume, the yield on loans increased 87 basis points during 2010, from 5.33% in 2009 to 6.20% in 2010.
Average investment securities increased $657.0 million during 2010, as the Company purchased higher-yielding investment securities with available cash to improve earning asset yields. Despite a decrease of 120 basis points from 2009, investment securities yielded 3.00% in 2010. The 3.00% earned on the securities was well above the yield on interest bearing cash and fed funds sold of 0.25% for 2010.
Interest income growth was tempered partially by a decrease in the yield from the Company’s FDIC loss share receivable. The amortization of the loss share receivable was $15.8 million lower than in 2009, which can be attributable to the related increase in expected cash flow from the covered assets. As expected cash flow on the covered loan and OREO portfolios increases, the fair value of the FDIC loss share receivable decreases, with the difference recorded as an adjustment to earnings. The negative yield in 2010 of 1.38% was 311 basis points below the 2009 yield of 1.73%.
Despite a decrease of 57 basis points in the rate paid on interest-bearing liabilities during 2010, interest expense increased $17.1 million, or 17.6%, from the year ended December 31, 2009. The increase in interest expense was a result of a $3.1 billion increase in average deposit liabilities during 2010, as the 2009 CSB, Orion, and Century acquired deposits, as well as the deposits acquired in 2010 from Sterling, impacted 2010 average deposit volume. The rate the Company paid on interest-bearing deposits decreased 52 basis points in 2010, as demand deposits and maturing certificates of deposit repriced. Higher-yielding deposits acquired from the 2009 and 2010 Alabama and Florida acquisitions either matured or were repriced during 2010, contributing to the 57 basis point decrease.
Although average interest-bearing deposits increased $3.1 billion during 2010, total interest-bearing debt increased only 3.5% during the current year. The small increase was a result of debt acquired from Sterling, as the Company was able to pay-off or
pay down much of its debt with available cash. Interest rates on short- and long-term borrowings decreased 29 and 46 basis points, respectively, during 2010.
For the year ended December 31, 2009, assets acquired and liabilities assumed in the CSB, Orion, and Century transactions contributed to the $35.1 million increase in net interest income over 2008, as net interest income was positively affected by higher earning asset volume. Increases in both interest income and expense were attributable to growth in the portfolios, as average rates declines offset increases in volume. Average earnings assets in 2009 increased $1.1 billion, or 23.3%, during 2009. Average earning asset growth was a result of a $641.5 million, or 18.1%, increase in average loans, and a 22.2%, or $194.2 million, increase in average investment securities. The yield on average loans and investment securities decreased 74 and 88 basis points, respectively. The decrease in yields on the earnings assets was consistent with industry-wide trends in 2009.
Following the interest-earning asset volume and rate trends in 2009, total interest-bearing liabilities increased $748.9 million, or 18.2%, during 2009. The increase in interest-bearing deposits of $725.5 million, or 21.6%, drove the total growth, as interest-bearing debt increased only 3.1%, or $23.4 million. The significant driver of growth was also the result of the acquisitions of CSB, Orion, and Century transactions during 2009. The average rate paid on interest-bearing liabilities offset the volume growth, as deposit rates decreased 102 basis points during 2009. The average rate paid on the Company’s debt also decreased 113 basis points to 2.80% for the year ended December 31, 2009. The decrease in average interest rates is consistent with the rate decreases seen on the Company’s assets during 2009.
Provision for Loan Losses
Management of the Company assesses the allowance for loan losses monthly and will make provisions for loan losses as deemed appropriate in order to maintain the adequacy of the allowance for loan losses. Increases in the allowance for loan losses are achieved through provisions for loan losses that are charged against income. Adjustments to the allowance may also result from purchase accounting associated with loans acquired.
On a consolidated basis, the Company recorded a provision for loan losses of $42.5 million in 2010, a decrease of $2.9 million, or 6.4%, from the provision recorded in 2009. The Company’s provision of $42.5 million was recorded to replace 2010 charge-offs of $26.7 million in non-covered loan charge-offs, to record additional provision on covered assets of $8.9 million to account for a change in expected cash flow on a limited number of loan pools, to record $6.0 million to cover loan growth, and to reverse $0.1 million to account for a net improvement in asset quality. Excluding the provision recorded on the covered loan portfolio, the Company’s provision for loan losses for the year would have been $11.8 million, or 26.0%, below the 2009 provision of $45.4 million.
The decrease in the provision from 2009 was primarily the result of a lower level of charge-offs at both IBERIABANK and IBERIABANK fsb. In total, charge-offs decreased $3.6 million from 2009. Offsetting the decrease in charge-offs from 2009 was the additional $5.9 million provision recorded for loan growth and a change in the Company’s asset quality during 2010.
By segment portfolio, IBERIABANK recorded a provision of $30.1 million during 2010, while IBERIABANK fsb recorded a provision for loan losses of $12.4 million for the year ended December 31, 2010. The IBERIABANK provision of $30.1 million was split between a provision of $21.2 million on non-covered loans and $8.9 million on covered loans.
Loans past due in the consolidated loan portfolio totaled $64.3 million at December 31, 2010, a decrease of $5.0 million from December 31, 2009. Past due loans, including nonaccrual loans, were 1.44% of total loans at December 31, 2010, a 25 basis point decrease from December 31, 2009. In the IBERIABANK loan portfolio, past due loans remained at 96 basis points of total loans, while IBERIABANK fsb’s past due ratio of 2.87% at December 31, 2010 is 103 basis points below the 3.90% at December 31, 2009. The decrease in past due loans at IBERIABANK fsb can be attributed to improved asset quality at December 31, 2010, as well as the charge-off during the year of problem loans.
Net charge-offs were $27.0 million in 2010, or an annualized charge-off percentage of 0.47%. Net charge-offs for 2009 were 0.73% of the consolidated loan portfolio. Year-to-date charge-offs totaled $13.8 million in the IBERIABANK loan portfolio and $13.3 million in the IBERIABANK fsb loan portfolio. The decrease in net charge-offs from 2009 was a result of decreased IBERIABANK fsb charge-offs during the current year, primarily in the commercial loan portfolio, as the Company experienced more significant asset quality deterioration in 2009. Net charge-offs during 2010 included recoveries of $6.8 million, an increase of $4.2 million from 2009.
The Company believes the allowance was adequate at December 31, 2010 to cover probable losses in the Company’s loan portfolio. The allowance for loan losses as a percentage of outstanding loans, net of unearned income, increased 130 basis points from 0.96% at December 31, 2009 to 2.26% at December 31, 2010.
Excluding loans covered by the FDIC loss share agreements, the Company’s allowance was 1.40% of non-covered loans at December 31, 2010. On the same basis, the Company’s allowance at December 31, 2010 was 122.6% of total nonperforming loans. The ratios compare favorably to December 31, 2009 ratios of 1.36% of total non-covered loans and 124.1% of nonperforming loans. The Company’s provision for loan losses covered net charge-offs in 2010 1.3 times and covered 65.9% of nonperforming loans not subject to loss share reimbursement.
Noninterest Income
The Company’s operating results included noninterest income of $133.9 million in 2010, compared to $344.5 million for 2009 and $91.9 million in 2008. The following table illustrates the primary components of noninterest income for the years indicated.
NONINTEREST INCOME
| (dollars in thousands) | 2010 | 2009 | Percent Increase (Decrease) |
2008 | Percent Increase (Decrease) |
|||||||||||||||
| Service charges on deposit accounts |
$ | 24,375 | $ | 22,986 | 6.0 | % | $ | 23,025 | (0.2 | )% | ||||||||||
| ATM/debit card fee income |
10,117 | 7,975 | 26.9 | 6,820 | 16.9 | |||||||||||||||
| Income from bank owned life insurance |
3,100 | 2,892 | 7.2 | 2,966 | (2.5 | ) | ||||||||||||||
| Gain on sale of loans, net |
47,689 | 35,108 | 35.8 | 25,295 | 38.8 | |||||||||||||||
| Gain (loss) on sale of assets |
(76 | ) | (644 | ) | (88.2 | ) | 832 | (177.4 | ) | |||||||||||
| Gain on sale of investments, net |
5,251 | 6,736 | (22.0 | ) | 1,137 | 492.4 | ||||||||||||||
| Gain on acquisitions |
3,781 | 238,893 | (98.4 | ) | — | 100.0 | ||||||||||||||
| Impairment of investment securities |
(517 | ) | — | 100.0 | — | — | ||||||||||||||
| Title revenue |
18,083 | 18,476 | (2.1 | ) | 19,003 | (2.8 | ) | |||||||||||||
| Broker commission income |
7,530 | 4,592 | 64.0 | 5,528 | (16.9 | ) | ||||||||||||||
| Other income |
14,557 | 7,523 | 93.5 | 7,326 | 2.7 | |||||||||||||||
| Total noninterest income |
$ | 133,890 | $ | 344,537 | (61.1 | )% | $ | 91,932 | 274.8 | % | ||||||||||
Service charges on deposit accounts increased $1.4 million in 2010 due to higher non-sufficient fund (“NSF”), analysis and service fees from the Company’s expanded customer base. Growth in Florida, Alabama, and Houston drove the increase in total service charges over 2009. Service charges decreased slightly in 2009 as a result of lower NSF fees charged to customers. The $0.8 million decrease in NSF fees from 2008 to 2009 was offset by a similar increase in analysis and service fees attributable to the Company’s larger customer base.
An expanding cardholder base led to a $2.1 million increase in ATM and debit card income in 2010 and a $1.2 million increase in 2009 over the respective prior years. ATM/debit card fee income increased in 2010 and 2009 due to the expanded cardholder base and increased usage by customers.
Income earned from bank owned life insurance increased $0.2 million during 2010. This increase is consistent with market performance and current yields, which are slightly higher than in 2009. The $0.1 million decrease in income earned from bank owned life insurance in 2009 was attributable to slightly lower returns on the Company’s policies during 2009. There were no additional policies purchased during 2010 or 2009.
Increasing volumes of mortgage loan originations and sales, fueled in part by loan refinancings, increased gains on sales of loans $12.6 million during 2010. Proceeds from mortgage loan sales during 2010 were $1.8 billion, $184.5 million higher than in 2009. Gains on sales of loans increased $9.8 million in 2009 when compared to the same period in 2008. Total 2009 sales of $1.6 billion were $653 million, or 70.3%, higher than in 2008.
A $0.1 million loss on sales of assets was recorded in 2010. The loss in 2010 was primarily from the disposal of automobiles at the former Orion branches, as well as the sale of a modular branch building. The Company’s loss of $0.6 million on the sale of assets during 2009 was primarily from the disposal of Pulaski Bank and PMC signage in connection with the entity’s name change to IBERIABANK fsb and IBERIABANK Mortgage Company. There were no significant disposals during the same periods in 2008.
Gains on sales of investments decreased slightly during 2010, as sales volume decreased 26.4% from 2009. Gains were recorded on the sale of $243.8 million in securities in the current year, compared to the sale of $331.4 million in agency and mortgage-backed securities, as well as collateralized mortgage obligations (“CMOs”), during 2009, with the proceeds used to invest in higher yielding securities. Gains increased $5.6 million in 2009, also due to a higher volume of sales activity. The Company sold $58.8 million in investment securities during 2008.
The Company recorded a gain of $3.8 million during 2010 on the FDIC-assisted Orion transaction from 2009 due to additional settlement items with the FDIC. There was no gain recorded on the Sterling acquisition, completed in the third quarter of 2010, as the cash paid as part of the acquisition exceeded the net assets acquired. During 2009, the Company recorded a gain of $238.9 million on the CSB, Orion and Century transactions.
As a result of a decrease in title insurance activity, title income decreased $0.4 million during 2010 and $0.5 million during 2009. The decrease in title insurance activity is a result of slower residual business from mortgage originations.
Broker commissions increased $2.9 million from 2009 due to increased sales activity during 2010. Broker commissions during 2010 also include income from the Company’s issuance of an equity-linked CD product, which commenced in July 2010. A decreased volume of dealer transactions led to the $0.9 million decrease in broker commissions in 2009 from 2008 year to date commissions. The decreased volume was attributable to a weakened overall economy and the availability of excess customer capital.
Other noninterest income increased $7.0 million during 2010, primarily the result of additional credit card income from the Company’s expanded cardholder base. The Florida acquisitions during 2009 and 2010 added additional credit card volume that led to income above 2009 levels. The Company also recorded income of $1.9 million from its investment in new market tax credit entities during the fourth quarter of 2009 and the first two quarters of 2010. In addition to the tax credits the Company receives, income is generated on the investment the Company has made in these entities. There were no significant changes in other noninterest income during 2009 when compared to prior periods.
Noninterest Expense
The Company’s operating results for 2010 include noninterest expenses of $304.2 million, $81.0 million above 2009 noninterest expenses of $223.3 million. Ongoing attention to expense control is part of the Company’s corporate culture. However, the Company’s continued focus on growth through new branches, acquisitions and product expansion have caused related increases in several components of noninterest expense.
The following table illustrates the primary components of noninterest expense for the years indicated.
NONINTEREST EXPENSE
| (dollars in thousands) | 2010 | 2009 | Percent Increase (Decrease) |
2008 | Percent Increase (Decrease) |
|||||||||||||||
| Salaries and employee benefits |
$ | 161,482 | $ | 114,379 | 41.2 | % | $ | 88,971 | 28.6 | % | ||||||||||
| Occupancy and equipment |
33,837 | 24,337 | 39.0 | 23,294 | 4.5 | |||||||||||||||
| Franchise and shares tax |
2,718 | 3,242 | (16.2 | ) | 2,244 | 44.5 | ||||||||||||||
| Communication and delivery |
9,643 | 6,522 | 47.9 | 6,495 | 0.4 | |||||||||||||||
| Marketing and business development |
6,288 | 5,640 | 11.5 | 3,342 | 68.8 | |||||||||||||||
| Data processing |
12,133 | 6,922 | 75.3 | 6,399 | 8.2 | |||||||||||||||
| Printing, stationery and supplies |
2,987 | 2,411 | 23.9 | 2,065 | 16.8 | |||||||||||||||
| Amortization of acquisition intangibles |
4,935 | 2,893 | 70.6 | 2,408 | 20.1 | |||||||||||||||
| Professional services |
13,473 | 8,164 | 65.0 | 5,137 | 58.9 | |||||||||||||||
| Goodwill impairment |
— | 9,681 | (100.0 | ) | — | 100.0 | ||||||||||||||
| Other expenses |
56,753 | 39,069 | 45.3 | 20,871 | 87.2 | |||||||||||||||
| Total noninterest expense |
$ | 304,249 | $ | 223,260 | 36.3 | % | $ | 161,226 | 38.5 | % | ||||||||||
Salaries and employee benefits increased $47.1 million during 2010. This increase was primarily a result of increased staffing due to the growth of the Company. 2010 expenses include the full impact of additional CSB, Orion, and Century personnel, as well as personnel from the Company’s Houston and Mobile markets. Salaries and employee benefits in 2010 also included additional personnel from the Sterling branches acquired in July 2010, as well as increased share-based incentive compensation due to additional restricted stock and option grants in 2010 and 2009. Salaries and employee benefits increased $25.4 million during 2009 due to higher mortgage incentives paid, as well as increased staffing due to the growth of the Company. The Company expanded into Alabama and Florida during 2009 and began staffing these new markets.
Occupancy and equipment expense increased $9.5 million during 2010 due primarily to the cost of facilities associated with the Florida and Alabama transactions. These increased costs include repairs and maintenance on branches, depreciation, utilities, rentals and property taxes. An increase in the Company’s rent expense due to new locations drove occupancy and equipment expense up $1.0 million in 2009 when compared to 2008. In addition to the locations added in the 2009, the Company incurred merger-related occupancy expenses in the latter part of 2009 and into 2010. The increased size of the Company also contributed to higher repairs and maintenance expense at the Company’s locations in 2009.
Franchise and shares tax expense decreased $0.5 million during 2010 after an increase of $1.0 million during 2009. This decrease in 2010 was due to a decrease in shares tax expense as a result of a lower assessment base for the shares tax calculation for IBERIABANK. A significant portion of shares tax is based on the percentage of deposits located within Louisiana. With IBERIABANK’s expansion into Alabama and Florida, the percentage of deposits located in Louisiana decreased to 55.2% in 2010 from 100% in prior years. The increase in franchise and shares tax expense from 2008 to 2009 was a result of the increased IBERIABANK deposit base from 2008.
The Company’s expansion in the third and fourth quarters of 2009 led to an increase in communication and delivery, data processing charges, and printing and supplies expenses. Communication and delivery expenses increased 47.9%, or $3.1 million, from 2009 to 2010. The increase in these expenses was a result of higher postage expenses from customer mailings, as significant expenses were incurred to notify Sterling customers of the Company’s acquisition of that entity. In addition, postage and courier expenses increased as a result of the increase in the Company’s number of branches and locations across multiple states. Data line and telephone expenses were also higher in 2010 as a result of the expanded Company footprint.
Data processing charges increased $5.2 million from 2009, as the size of the Company has led to higher processing volume and additional maintenance expenses. In addition, in 2010, the Company incurred $2.2 million in merger-related data expenses, which primarily relate to system conversion expenses for the three Florida transactions’ (Orion, Century, and Sterling) general ledger, loan, and deposit systems. Merger-related data expenses were $0.3 million during 2009, and related to the conversion of CSB.
Communication and delivery expenses, as well as data processing expenses, remained stable with 2009 when compared to 2008. Excluding expenses incurred with the disposal of business forms, stationary, and other office supplies due to the name change to IBERIABANK fsb and IBERIABANK Mortgage Company, company-wide expenses for printing and supplies remained consistent with 2008. Disposal of unusable forms and supplies using the Pulaski and PMC logos totaled $0.1 million in 2009.
Marketing and business development expenses increased $0.6 million during 2010 as a result of additional expenses associated with the Company’s expansion in Florida and Alabama. The $2.3 million increase in marketing and business development expenses during 2009 is a result of the expenses associated with customer mailings regarding the IBERIABANK fsb name change and the CSB, Orion, and Century transactions. Expenses totaled $0.1 million for the name change and $0.4 million for the acquisitions. Because the Company entered into new states in 2009, the Company increased advertising and media expenses by $0.5 million in 2009 to promote the franchise in Florida and Alabama. The Company also increased its community relations expense by $0.6 million in 2009 to continue to promote the franchise.
The core deposit intangible assets created in the Sterling acquisition in 2010 and the three acquisitions in the third quarter of 2009 contributed to the $2.0 million increase in amortization expense of the Company’s intangible assets in 2010 when compared to 2009. The core deposits created in the CSB, Orion, and Century transactions during 2009 contributed to the $0.5 million increase in amortization of intangible assets in 2009 when compared to 2008.
Additional legal, audit and consulting expenses as a result of the 2009 and 2010 transactions, as well as expenses incurred as part of the Company’s common stock offering in March 2010, contributed to the $5.3 million increase in professional services expense during 2010. Professional services expense was $3.0 million higher in 2009 when compared to 2008, as the Company incurred additional legal, audit, and consulting expenses as a result of the Company’s preferred stock redemption, warrant and fair value valuations, CSB, Orion, and Century transactions, and the overall increase in size and complexity of the Company.
In 2010, other noninterest expenses increased $17.7 million over 2009. Travel expenses increased $3.0 million as a result of additional travel due to the Florida and Alabama expansions.
Other noninterest expenses also include credit and loan related expenses. In 2010, these expenses increased $6.9 million, reflecting the additional volume of activity resulting from the growth of the Company. The increase in credit-related expenses stems primarily from the Company’s covered loan portfolio. The credit quality issues inherent in the portfolio covered by loss share agreements with the FDIC drove appraisal and inspection, collections, and credit bureau expenses higher in 2010. $5.5 million, or 43.1%, of total credit-related expenses in 2010 were incurred on behalf of the covered loan portfolio.
Other noninterest expenses also include the prepayment of a portion of the Company’s debt during the third quarter of 2010. The Company incurred $3.5 million in prepayment penalties for retiring a portion of its long-term debt before its scheduled maturity. The Company also wrote off remaining financing fees of $0.2 million on the $25.0 million subordinated note that was also repaid during the third quarter. The Company did not incur similar expenses in either 2009 or 2008.
Total other noninterest expenses also include a $1.7 million, or 18.0%, increase in FDIC insurance assessments during 2010 from the Company’s increased deposit base.
Finally, the Company incurred two new expenses in 2010 for which there were no comparable expenses in 2009 or 2009: An amortization expense of $3.8 million on its investment in new market tax credit entities, and $2.4 million in brokerage expense on its equity-linked CD product.
Offsetting these increases in other noninterest expenses over 2009 were decreases in the Company’s net costs of OREO properties. During 2010, the Company’s costs decreased $4.5 million, or 58.4%, from 2009. The decrease was primarily from a decrease in write-downs taken to mark the Company’s former bank premises and foreclosed assets to market value in 2010. Write-downs decreased $3.0 million from 2009 to 2010. In addition, the Company recorded gains on the sale of OREO properties above 2009 gains, but these improvements were offset by higher insurance, appraisal, and maintenance expenses on held properties before their sale.
From 2008 to 2009, other noninterest expenses increased $18.2 million to $39.1 million. Included in total other noninterest expenses were insurance and bond expenses of $10.2 million for the year ended December 31, 2009. Similar expenses in 2008 totaled $3.4 million. The largest increase in expenses was the result of these additional FDIC assessments in 2009. The size of the Company’s deposits, as well as a special assessment imposed on all financial institutions during the first and second quarters of 2009, increased the Company’s deposit insurance $6.8 million for year ended December 31, 2009 over 2008.
Both credit and loan-related expense and ATM/debit card expenses in 2009 reflected the additional locations and volume of activity resulting from the growth during 2009 of the IBERIABANK and IBERIABANK fsb franchises during 2009. In 2009,
credit-related expenses increased $1.4 million, while ATM expenses increased $1.1 million. Travel and entertainment expenses increased $1.4 million over 2008, as the Company incurred significant acquisition-related travel expenses as a result of the Alabama and Florida acquisitions. Other expense types, including credit card expenses, bank service charges, and stock market and registration agent fees, did not experience a significant fluctuation from 2008.
Net costs of OREO property increased $6.5 million in 2009, as the Company increased its collection efforts on its properties included in OREO. The increase in expenses was consistent with the increase in the size of the IBERIABANK and IBERIABANK fsb portfolios, as OREO balances increased $57.8 million, or 354.2%, from 2008 to December 31, 2009. In 2009, the Company incurred $5.9 million in property writedowns that were included in those net costs. In addition, the number of properties included in OREO during 2009 resulted in increased appraisal, property tax, and maintenance expenses. Many of those same expenses were offset by gains on sales taken in 2008.
Income Taxes
For the years ended December 31, 2010, 2009, and 2008, the Company incurred income tax expense of $20.0 million, $90.3 million, and $15.9 million, respectively. The Company’s effective tax rate amounted to 29.1%, 36.3%, and 28.5% during 2010, 2009 and 2008, respectively. The difference between the effective tax rate and the statutory tax rate primarily relates to variances in items that are non-taxable or non-deductible, primarily the effect of tax-exempt income, the non-deductibility of part of the amortization of acquisition intangibles, and various tax credits taken.
The difference in the effective tax rates for the periods presented is primarily the result of the relative tax-exempt interest income levels during the respective periods, but is also a result of the Company’s investment in tax credits during 2010. The decrease in the effective tax rate for the year ended December 31, 2010 was a result of the relative effective tax rates of the Company’s subsidiaries. The Company’s largest subsidiary, IBERIABANK, had a lower overall effective rate in the current year as a result of its investment in tax credits that commenced in the fourth quarter of 2009. As a result, IBERIABANK’s effective tax rate decreased significantly from the prior year. The Company’s IBERIABANK fsb, Lenders Title, and ICP subsidiaries, as well as the holding company, all had income tax benefits during 2010, either from nontaxable income deductions at IBERIABANK fsb or, in the case of the other legal entities, net losses for the year.
The increase in the Company’s effective tax rate in 2009 was primarily caused by an increase in income taxes at the Company’s IBERIABANK subsidiary. With IBERIABANK’s expansion into Florida and Alabama in 2009, income generated in those states, including the Company’s gain on acquisitions, was subject to state taxes and therefore increased income tax expense over 2008.
For more information on the Company’s income taxes and effective tax rates, see Note 15 of the Consolidated Financial Statements.
LIQUIDITY
The Company’s liquidity, represented by cash and cash equivalents, is a product of its operating, investing and financing activities. The Company manages its liquidity with the objective of maintaining sufficient funds to respond to the needs of depositors and borrowers and to take advantage of earnings enhancement opportunities. The primary sources of funds for the Company are deposits, borrowings, repayments and maturities of loans and investment securities, securities sold under agreements to repurchase, as well as funds provided from operations. Certificates of deposit scheduled to mature in one year or less at December 31, 2010 totaled $2.1 billion. Based on past experience, management believes that a significant portion of maturing deposits will remain with the Company. Additionally, the majority of the investment security portfolio is classified by the Company as available-for-sale which provides the ability to liquidate securities as needed. Due to the relatively short planned duration of the investment security portfolio, the Company continues to experience significant cash flows on a normal basis.
Total cash inflows totaled $162.4 million during 2010, an increase of $332.8 million from net cash outflow of $170.5 million during 2009.
The following table summarizes the Company’s cash flows for the years ended December 31, 2010, 2009, and 2008.
CASH FLOW ACTIVITY BY TYPE
| (dollars in thousands) | 2010 | 2009 | 2008 | |||||||||
| Cash flow provided by (used in) operations |
$ | 149,724 | $ | (122,956 | ) | $ | 46,365 | |||||
| Cash flow provided by (used in) investing activities |
7,617 | (346,037 | ) | (220,268 | ) | |||||||
| Cash flow provided by financing activities |
5,040 | 298,525 | 396,663 | |||||||||
| Net (decrease) increase in cash and cash equivalents |
$ | 162,381 | $ | (170,468 | ) | $ | 222,760 | |||||
The Company had operating cash inflow of $149.7 million during 2010, $272.7 million higher than in the same period of 2009. The Company had a decrease in other assets during 2010, with the most significant decrease in fed funds sold of $252.4 million. Operating cash flow was also positively affected by a $20.4 million increase in net cash inflow from mortgage loans held for sale.
Cash flow from investing activities increased $353.7 million during 2010 when compared to 2009, primarily due to the reimbursement of $438.9 million in recoverable covered asset losses from the FDIC. Offsetting the reimbursement was a decrease in the cash the Company received on its acquisitions. In 2009, the Company acquired $496.0 million in cash from its three acquisitions, $471.9 million higher than the cash received from the Company’s Sterling acquisition in 2010. Investing cash flow was also affected by an increase in investment purchases during 2010. Net cash used in available for sale investment purchases increased $180.1 million, from $193.6 million in purchases in 2009 to $373.7 million for 2010.
Net financing cash flows decreased $293.5 million during 2010 when compared to 2009, primarily due to a decrease in cash from customer deposits of $441.9 million. Offsetting the decrease from customer deposits was an increase in cash proceeds from the Company’s common stock issuance of $164.3 million over 2009. Financing cash flow in 2009 was adversely affected by the Company’s redemption of its preferred stock for $89.1 million. 2009 cash outflow also included a $3.4 million dividend paid on the preferred stock.
From 2008 to 2009, the Company’s operating cash flows decreased $169.3 million, primarily as a result of two factors. First, the Company sold fed funds of $261.4 million at December 31, 2009 due to excess liquidity. Liquidity exceeded short-term funding needs due to the cash acquired from the Orion and Century banks, as well as cash paid by the FDIC in settlement of the acquisitions. Funds sold were offset by net income of $158.4 million and a noncash provision for loan losses of $45.4 million.
Cash used in investing activities was $125.8 million higher in 2009 than in 2008. Investing cash flows were negatively affected by the use of funds to purchase investment securities and invest in new market tax credit entities during 2009. Net cash outflow for investment security activity was $362.2 million higher than in 2008. Net investment purchases totaled $393.2 million for 2009. The Company invested $104.5 million in new market tax credits during 2009. Cash flow was positively affected by cash received in acquisition transactions of $496.0 million, which includes both the cash at the acquiring institutions and cash paid by the FDIC.
Cash provided by financing activities was $298.5 million in 2009, $98.1 million lower than in 2008. The decrease was primarily a result of the repayments of long-term debt in 2009, as the Company repaid $380.7 million of long-term FHLB advances and subordinated debt in 2009. In addition, the Company repaid its outstanding preferred stock and redeemed the associated warrants for $89.1 million and paid common and preferred stock dividends of $26.7 million. Cash received from the Company’s common stock issuance in July 2009 offset these uses of cash. Total proceeds from the 4.4 million shares issued were $164.6 million. In addition, the Company had an increase in deposits, net of acquired deposits, of $529.4 million, $202.5 million higher than in 2008.
The Company believes it has adequate liquidity to fund ongoing operations. During the first quarter of 2010, the Company raised $329.0 million in net proceeds in a publicly underwritten common stock issuance. In addition, the Company has adequate availability of funds from deposits, borrowings, repayments and maturities of loans and investment securities to provide the Company working capital.
While scheduled cash flows from the amortization and maturities of loans and securities are relatively predictable sources of funds, deposit flows and prepayments of loan and investment securities are greatly influenced by general interest rates, economic conditions and competition. The FHLB of Dallas provides an additional source of liquidity to make funds available for general requirements and also to assist with the variability of less predictable funding sources. At December 31, 2010, the Company had $269.2 million of outstanding advances from the FHLB of Dallas. Additional advances available at December 31, 2010 from the FHLB amounted to $1.5 billion. The Company and IBERIABANK also have various funding arrangements with commercial
banks providing up to $115.0 million in the form of federal funds and other lines of credit. At December 31, 2010, there was no balance outstanding on these lines and all of the funding was available to the Company.
Liquidity management is both a daily and long-term function of business management. Excess liquidity is generally invested in short-term investments such as overnight deposits. On a longer-term basis, the Company maintains a strategy of investing in various lending and investment security products. The Company uses its sources of funds primarily to meet its ongoing commitments and fund loan commitments. The Company has been able to generate sufficient cash through its deposits, as well as borrowings, and anticipates it will continue to have sufficient funds to meet its ongoing liquidity requirements.
ASSET/ LIABILITY MANAGEMENT AND MARKET RISK
The principal objective of the Company’s asset and liability management function is to evaluate the interest rate risk included in certain balance sheet accounts, determine the appropriate level of risk given the Company’s business focus, operating environment, capital and liquidity requirements and performance objectives, establish prudent asset concentration guidelines and manage the risk consistent with Board approved guidelines. Through such management, the Company seeks to reduce the vulnerability of its operations to changes in interest rates. The Company’s actions in this regard are taken under the guidance of the Senior Management Planning Committee. The Senior Management Planning Committee normally meets monthly to review, among other things, the sensitivity of the Company’s assets and liabilities to interest rate changes, local and national market conditions and interest rates. In connection therewith, the Senior Management Planning Committee generally reviews the Company’s liquidity, cash flow needs, maturities of investments, deposits, borrowings and capital position.
The objective of interest rate risk management is to control the effects that interest rate fluctuations have on net interest income and on the net present value of the Company’s earning assets and interest-bearing liabilities. Management and the Board are responsible for managing interest rate risk and employing risk management policies that monitor and limit this exposure. Interest rate risk is measured using net interest income simulation and asset/liability net present value sensitivity analyses. The Company uses financial modeling to measure the impact of changes in interest rates on the net interest margin and predict market risk. Estimates are based upon numerous assumptions including the nature and timing of interest rate levels including yield curve shape, prepayments on loans and securities, deposit decay rates, pricing decisions on loans and deposits, reinvestment/replacement of asset and liability cash flows and others. These analyses provide a range of potential impacts on net interest income and portfolio equity caused by interest rate movements.
Included in the modeling are instantaneous parallel rate shifts scenarios, which are utilized to establish exposure limits. These scenarios are known as “rate shocks” because all rates are modeled to change instantaneously by the indicated shock amount, rather than a gradual rate shift over a period of time that has traditionally been more realistic.
The Company’s interest rate risk model indicated that the Company was slightly asset sensitive in terms of interest rate sensitivity. Based on the Company’s interest rate risk model at December 31, 2010, the table below illustrates the impact of an immediate and sustained 100 and 200 basis point increase or decrease in interest rates on net interest income.
CHANGE IN NET INTEREST INCOME FROM INTEREST RATE CHANGES
| Shift in Interest Rates (in bps) |
% Change in Projected Net Interest Income | |
| +200 |
2.3% | |
| +100 |
0.8 | |
| - 100 |
0.4 | |
| - 200 |
-0.7 | |
The influence of using the forward curve as of December 31, 2010 as a basis for projecting the interest rate environment would approximate a 0.1% increase in net interest income. The computations of interest rate risk shown above do not necessarily include certain actions that management may undertake to manage this risk in response to anticipated changes in interest rates.
The rate environment is a function of the monetary policy of the FRB. The principal tools of the FRB for implementing monetary policy are open market operations, or the purchases and sales of U.S. Treasury and federal agency securities. The FRB’s objective for open market operations has varied over the years, but the focus has gradually shifted toward attaining a specified level of the federal funds rate to achieve the long-run goals of price stability and sustainable economic growth. The federal funds rate is the basis for overnight funding and drives the short end of the yield curve. Longer maturities are influenced by FRB purchases and sales and also expectations of monetary policy going forward. The FRB began to increase the targeted level for the federal funds rate in June 2004 after reaching a then-low of 1.00% in mid-2003. The targeted fed funds rate decreased three times in 2007 by 100 total basis points and ended 2007 at 4.25%. In response to growing concerns about the banking industry
and customer liquidity, the fed funds rate decreased seven times to a new all-time low of 0.25% at the end of 2008. The fed funds rate remained at 0.25% through 2010. The decrease in the fed funds rate has resulted in compressed net interest margin for the Company, as assets have repriced more quickly than the Company’s liabilities. Although management believes that the Company is not significantly affected by changes in interest rates over an extended period of time, any flattening of the yield curve will exert downward pressure on the net interest margin and net interest income.
As part of its asset/liability management strategy, the Company has emphasized the origination of commercial and consumer loans, which typically have shorter terms than residential mortgage loans and/or adjustable or variable rates of interest. The majority of fixed-rate, long-term residential loans are sold in the secondary market to avoid assumption of the rate risk associated with longer duration assets in the current low rate environment. As of December 31, 2010, $3.1 billion, or 51.6%, of the Company’s total loan portfolio had adjustable interest rates. IBERIABANK and IBERIABANK fsb had no significant concentration to any single loan component or industry segment.
The Company’s strategy with respect to liabilities in recent periods has been to emphasize transaction accounts, particularly noninterest or low interest-bearing transaction accounts, which are not sensitive to changes in interest rates. At December 31, 2010, 64.1% of the Company’s deposits were in transaction and limited-transaction accounts, compared to 59.3% at December 31, 2009. Noninterest bearing transaction accounts totaled 11.1% of total deposits at December 31, 2010, compared to 11.6% of total deposits at December 31, 2009.
As part of an overall interest rate risk management strategy, off-balance sheet derivatives may also be used as an efficient way to modify the repricing or maturity characteristics of on-balance sheet assets and liabilities. Management may from time to time engage in interest rate swaps to effectively manage interest rate risk. The interest rate swaps of the Company were executed to modify net interest sensitivity to levels deemed appropriate.
OTHER OFF-BALANCE SHEET ACTIVITIES
In the normal course of business, the Company is a party to a number of activities that contain credit, market and operational risk that are not reflected in whole or in part in the Company’s consolidated financial statements. Such activities include traditional off-balance sheet credit-related financial instruments, commitments under operating leases and long-term debt. The Company provides customers with off-balance sheet credit support through loan commitments, lines of credit and standby letters of credit. Many of the unused commitments are expected to expire unused or be only partially used; therefore, the total amount of unused commitments does not necessarily represent future cash requirements. The Company anticipates it will continue to have sufficient funds together with available borrowings to meet its current commitments. At December 31, 2010, the Company’s approved loan commitments outstanding totaled $152.5 million. At the same date, commitments under unused lines of credit, including credit card lines, amounted to $1.1 billion. Included in these totals are commercial commitments amounting to $804.4 million as shown in the following table.
COMMERCIAL COMMITMENT EXPIRATION PER PERIOD
| (dollars in thousands) |
Less Than 1 year |
1-3 Years | 3-5 Years | Over 5 Years |
Total | |||||||||||||||
| Unused commercial lines of credit |
$ | 550,344 | $ | 179,791 | $ | 64,092 | $ | 10,149 | $ | 804,376 | ||||||||||
| Unfunded loan commitments |
152,545 | — | — | — | 152,545 | |||||||||||||||
| Standby letters of credit |
27,433 | 985 | 5,028 | — | 33,446 | |||||||||||||||
| Total |
$ | 730,322 | $ | 180,776 | $ | 69,120 | $ | 10,149 | $ | 990,367 | ||||||||||
The Company has entered into a number of long-term leasing arrangements to support the ongoing activities of the Company. The required payments under such commitments and other debt commitments at December 31, 2010 are shown in the following table.
CONTRACTUAL OBLIGATIONS AND OTHER DEBT COMMITMENTS
| (dollars in thousands) |
2011 | 2012 | 2013 | 2014 | 2015 | 2016 and After |
Total | |||||||||||||||||||||
| Operating leases |
$ | 8,359 | $ | 7,316 | $ | 6,265 | $ | 5,123 | $ | 4,816 | $ | 29,769 | $ | 61,648 | ||||||||||||||
| Certificates of deposit |
2,072,843 | 528,826 | 91,248 | 47,976 | 103,323 | 183 | 2,844,399 | |||||||||||||||||||||
| Short-term borrowings |
220,328 | — | — | — | — | — | 220,328 | |||||||||||||||||||||
| Long-term debt |
46,485 | 59,293 | 20,789 | 112,331 | 1,220 | 192,133 | 432,251 | |||||||||||||||||||||
| Total |
$ | 2,348,015 | $ | 595,435 | $ | 118,302 | $ | 165,430 | $ | 109,359 | $ | 222,085 | $ | 3,558,626 | ||||||||||||||
IMPACT OF INFLATION AND CHANGING PRICES
The consolidated financial statements and related financial data presented herein have been prepared in accordance with generally accepted accounting principles, which generally require the measurement of financial position and operating results in terms of historical dollars, without considering changes in relative purchasing power over time due to inflation. Unlike most industrial companies, the majority of the Company’s assets and liabilities are monetary in nature. As a result, interest rates generally have a more significant impact on the Company’s performance than does the effect of inflation. Although fluctuations in interest rates are neither completely predictable nor controllable, the Company regularly monitors its interest rate position and oversees its financial risk management by establishing policies and operating limits. Interest rates do not necessarily move in the same direction or in the same magnitude as the prices of goods and services, since such prices are affected by inflation to a larger extent than interest rates. Although not as critical to the banking industry as to other industries, inflationary factors may have some impact on the Company’s growth, earnings, total assets and capital levels. Management does not expect inflation to be a significant factor in 2011.
SELECTED CONSOLIDATED FINANCIAL AND OTHER DATA(1)
| Years Ended December 31, | ||||||||||||||||||||
| (dollars in thousands, except per share data) |
2010 | 2009 | 2008 | 2007 | 2006 | |||||||||||||||
| Balance Sheet Data |
||||||||||||||||||||
| Total assets |
$ | 10,026,766 | $ | 9,695,955 | $ | 5,583,226 | $ | 4,916,958 | $ | 3,203,036 | ||||||||||
| Cash and cash equivalents |
337,778 | 175,397 | 345,865 | 123,105 | 84,905 | |||||||||||||||
| Loans receivable |
6,035,332 | 5,784,365 | 3,744,402 | 3,430,039 | 2,234,002 | |||||||||||||||
| Investment securities |
2,019,814 | 1,580,837 | 889,476 | 804,877 | 581,352 | |||||||||||||||
| Goodwill and other intangibles |
263,925 | 260,144 | 259,683 | 254,627 | 99,070 | |||||||||||||||
| Deposit accounts |
7,915,106 | 7,556,148 | 3,995,816 | 3,484,828 | 2,422,582 | |||||||||||||||
| Borrowings |
652,579 | 1,009,215 | 776,692 | 893,770 | 439,602 | |||||||||||||||
| Shareholders’ equity |
1,303,457 | 961,318 | 734,208 | 498,059 | 319,551 | |||||||||||||||
| Book value per share (2) |
$ | 48.50 | $ | 46.38 | $ | 40.53 | $ | 38.99 | $ | 31.07 | ||||||||||
| Tangible book value per share (2) (4) |
38.68 | 33.88 | 24.20 | 19.06 | 21.43 | |||||||||||||||
| Years Ended December 31, | ||||||||||||||||||||
| (dollars in thousands, except per share data) |
2010 | 2009 | 2008 | 2007 | 2006 | |||||||||||||||
| Income Statement Data |
||||||||||||||||||||
| Interest income |
$ | 396,371 | $ | 270,387 | $ | 263,827 | $ | 262,246 | $ | 165,292 | ||||||||||
| Interest expense |
114,744 | 97,602 | 126,183 | 138,727 | 73,770 | |||||||||||||||
| Net interest income |
281,627 | 172,785 | 137,644 | 123,519 | 91,522 | |||||||||||||||
| Provision for (reversal of) loan losses |
42,451 | 45,370 | 12,568 | 1,525 | (7,803 | ) | ||||||||||||||
| Net interest income after provision for |
239,176 | 127,415 | 125,076 | 121,994 | 99,325 | |||||||||||||||
| Noninterest income |
133,890 | 344,537 | 91,932 | 76,594 | 23,450 | |||||||||||||||
| Noninterest expense |
304,249 | 223,260 | 161,226 | 140,118 | 72,545 | |||||||||||||||
| Income before income taxes |
68,817 | 248,692 | 55,782 | 58,470 | 50,230 | |||||||||||||||
| Income taxes |
19,991 | 90,338 | 15,870 | 17,160 | 14,535 | |||||||||||||||
| Net income |
48,826 | 158,354 | 39,912 | 41,310 | 35,695 | |||||||||||||||
| Earnings per share – basic |
$ | 1.90 | $ | 8.49 | $ | 3.04 | $ | 3.31 | $ | 3.67 | ||||||||||
| Earnings per share – diluted |
1.88 | 8.41 | 2.97 | 3.21 | 3.48 | |||||||||||||||
| Cash earnings per share – diluted |
2.01 | 8.52 | 3.09 | 3.32 | 3.56 | |||||||||||||||
| Cash dividends per share |
1.36 | 1.36 | 1.36 | 1.34 | 1.22 | |||||||||||||||
| At or For the Years Ended December 31, | ||||||||||||||||||||
| 2010 | 2009 | 2008 | 2007 | 2006 | ||||||||||||||||
| Key Ratios (3) |
||||||||||||||||||||
| Return on average assets |
0.47 | % | 2.48 | % | 0.77 | % | 0.90 | % | 1.19 | % | ||||||||||
| Return on average common equity |
3.91 | 20.08 | 7.59 | 8.87 | 12.86 | |||||||||||||||
| Return on average tangible common equity (4) |
5.27 | 30.66 | 15.64 | 18.86 | 21.94 | |||||||||||||||
| Equity to assets at end of period |
13.00 | 9.91 | 13.15 | 10.13 | 9.98 | |||||||||||||||
| Earning assets to interest-bearing liabilities |
119.27 | 118.34 | 113.14 | 111.83 | 116.07 | |||||||||||||||
| Interest rate spread (5) |
2.84 | 2.78 | 2.67 | 2.73 | 2.99 | |||||||||||||||
| Net interest margin (TE) (5) (6) |
3.05 | 3.09 | 3.03 | 3.13 | 3.42 | |||||||||||||||
| Noninterest expense to average assets |
2.95 | 3.49 | 3.10 | 3.06 | 2.41 | |||||||||||||||
| Efficiency ratio (7) |
73.22 | 43.16 | 70.23 | 70.02 | 63.10 | |||||||||||||||
| Tangible efficiency ratio (TE) (6) (7) |
70.43 | 41.96 | 67.27 | 66.71 | 59.70 | |||||||||||||||
| Common stock dividend payout ratio |
74.75 | 16.13 | 46.98 | 41.61 | 33.64 | |||||||||||||||
| Asset Quality Data |
||||||||||||||||||||
| Nonperforming assets to total assets at end of period (8) |
0.91 | % | 0.91 | % | 0.83 | % | 0.98 | % | 0.16 | % | ||||||||||
| Allowance for loan losses to nonperforming loans at end of period (8) |
122.59 | 124.14 | 134.87 | 98.77 | 993.76 | |||||||||||||||
| Allowance for loan losses to total loans at end of period |
1.40 | 1.36 | 1.09 | 1.12 | 1.34 | |||||||||||||||
| Consolidated Capital Ratios |
||||||||||||||||||||
| Tier 1 leverage capital ratio |
11.24 | % | 9.99 | % | 11.27 | % | 7.42 | % | 9.01 | % | ||||||||||
| Tier 1 risk-based capital ratio |
18.48 | 13.34 | 14.07 | 9.32 | 11.81 | |||||||||||||||
| Total risk-based capital ratio |
19.74 | 14.71 | 15.69 | 10.37 | 13.06 | |||||||||||||||
| (1) | 2007 Balance Sheet, Income Statement, and Asset Quality Data, as well as Key Ratios and Capital Ratios, are impacted by the Company’s acquisitions of PIC on January 31, 2007 and Pocahontas on February 1, 2007. 2009 Balance Sheet, Income Statement, and Asset Quality Data, as well as Key Ratios and Capital Ratios, are impacted by the Company’s acquisitions of CSB on August 21, 2009 and Orion and Century on November 13, 2009. 2010 Balance Sheet, Income Statement, and Asset Quality Data, as well as Key Ratios and Capital Ratios, are impacted by the Company’s acquisitions of Sterling on July 23, 2010. |
| (2) | Shares used for book value purposes exclude shares held in treasury and unreleased shares held by the Employee Stock Ownership Plan at the end of the period. |
| (3) | With the exception of end-of-period ratios, all ratios are based on average daily balances during the respective periods. |
| (4) | Tangible calculations eliminate the effect of goodwill and acquisition related intangible assets and the corresponding amortization expense on a tax-effected basis where applicable. |
| (5) | Interest rate spread represents the difference between the weighted average yield on earning assets and the weighted average cost of interest-bearing liabilities. Net interest margin represents net interest income as a percentage of average earning assets. |
| (6) | Fully taxable equivalent (TE) calculations include the tax benefit associated with related income sources that are tax-exempt using a marginal tax rate of 35%. |
| (7) | The efficiency ratio represents noninterest expense as a percentage of total revenues. Total revenues are the sum of net interest income and noninterest income. |
| (8) | Nonperforming loans consist of nonaccruing loans and loans 90 days or more past due. Nonperforming assets consist of nonperforming loans and repossessed assets. |
MANAGEMENT REPORT ON INTERNAL CONTROL OVER FINANCIAL REPORTING
To the Board of Directors of
IBERIABANK Corporation
The management of IBERIABANK Corporation (the “Company”) is responsible for establishing and maintaining adequate internal control over financial reporting. The Company’s internal control system was designed to provide reasonable assurance to the Company’s management and board of directors regarding the preparation and fair presentation of published financial statements.
All internal control systems, no matter how well designed, have inherent limitations. Therefore, even those systems determined to be effective can provide only reasonable assurance with respect to financial statement preparation and presentation.
The Company’s management assessed the effectiveness of the Company’s internal control over financial reporting as of December 31, 2010. In making this assessment, it used the criteria set forth by the Committee of Sponsoring Organizations of the Treadway Commission (COSO) in Internal Control—Integrated Framework. Based on our assessment, management believes that, as of December 31, 2010, the Company’s internal control over financial reporting is effective based on those criteria.
The Company’s independent registered public accounting firm has also issued an attestation report on the effectiveness of the Company’s internal control over financial reporting as of December 31, 2010.
| /s/ Daryl G. Byrd |
/s/ Anthony J. Restel | |||
| Daryl G. Byrd | Anthony J. Restel | |||
| President and Chief Executive Officer | Senior Executive Vice President and Chief Financial Officer |
REPORT OF INDEPENDENT REGISTERED PUBLIC ACCOUNTING FIRM
The Board of Directors and Shareholders
IBERIABANK Corporation
We have audited IBERIABANK Corporation’s internal control over financial reporting as of December 31, 2010, based on criteria established in Internal Control—Integrated Framework issued by the Committee of Sponsoring Organizations of the Treadway Commission (the COSO criteria). IBERIABANK Corporation’s management is responsible for maintaining effective internal control over financial reporting, and for its assessment of the effectiveness of internal control over financial reporting included in the accompanying Management Report on Internal Control Over Financial Reporting. Our responsibility is to express an opinion on the Company’s internal control over financial reporting based on our audit.
We conducted our audit in accordance with the standards of the Public Company Accounting Oversight Board (United States). Those standards require that we plan and perform the audit to obtain reasonable assurance about whether effective internal control over financial reporting was maintained in all material respects. Our audit included obtaining an understanding of internal control over financial reporting, assessing the risk that a material weakness exists, testing and evaluating the design and operating effectiveness of internal control based on the assessed risk, and performing such other procedures as we considered necessary in the circumstances. We believe that our audit provides a reasonable basis for our opinion.
A company’s internal control over financial reporting is a process designed to provide reasonable assurance regarding the reliability of financial reporting and the preparation of financial statements for external purposes in accordance with generally accepted accounting principles. A company’s internal control over financial reporting includes those policies and procedures that (1) pertain to the maintenance of records that, in reasonable detail, accurately and fairly reflect the transactions and dispositions of the assets of the company; (2) provide reasonable assurance that transactions are recorded as necessary to permit preparation of financial statements in accordance with generally accepted accounting principles, and that receipts and expenditures of the company are being made only in accordance with authorizations of management and directors of the company; and (3) provide reasonable assurance regarding prevention or timely detection of unauthorized acquisition, use, or disposition of the company’s assets that could have a material effect on the financial statements.
Because of its inherent limitations, internal control over financial reporting may not prevent or detect misstatements. Also, projections of any evaluation of effectiveness to future periods are subject to the risk that controls may become inadequate because of changes in conditions, or that the degree of compliance with the policies or procedures may deteriorate.
In our opinion, IBERIABANK Corporation maintained, in all material respects, effective internal control over financial reporting as of December 31, 2010, based on the COSO criteria.
We also have audited, in accordance with the standards of the Public Company Accounting Oversight Board (United States), the consolidated balance sheets of IBERIABANK Corporation as of December 31, 2010 and 2009, and the related consolidated statements of income, shareholders’ equity, and cash flows for each of the three years in the period ended December 31, 2010 and our report dated March 4, 2011, expressed an unqualified opinion thereon.
/s/ Ernst & Young LLP
New Orleans, Louisiana
March 4, 2011
REPORT OF INDEPENDENT REGISTERED PUBLIC ACCOUNTING FIRM
The Board of Directors and Shareholders
IBERIABANK Corporation
We have audited the accompanying consolidated balance sheets of IBERIABANK Corporation as of December 31, 2010 and 2009, and the related consolidated statements of income, shareholders’ equity, and cash flows for each of the three years in the period ended December 31, 2010. These financial statements are the responsibility of the Company’s management. Our responsibility is to express an opinion on these financial statements based on our audits.
We conducted our audits in accordance with the standards of the Public Company Accounting Oversight Board (United States). Those standards require that we plan and perform the audit to obtain reasonable assurance about whether the financial statements are free of material misstatement. An audit includes examining, on a test basis, evidence supporting the amounts and disclosures in the financial statements. An audit also includes assessing the accounting principles used and significant estimates made by management, as well as evaluating the overall financial statement presentation. We believe that our audits provide a reasonable basis for our opinion.
In our opinion, the financial statements referred to above present fairly, in all material respects, the consolidated financial position of IBERIABANK Corporation at December 31, 2010 and 2009, and the consolidated results of its operations and its cash flows for each of the three years in the period ended December 31, 2010 in conformity with U.S. generally accepted accounting principles.
As discussed in Note 1 to the consolidated financial statements, IBERIABANK Corporation changed its method of accounting for business combinations during 2009.
We also have audited, in accordance with the standards of the Public Company Accounting Oversight Board (United States), IBERIABANK Corporation’s internal control over financial reporting as of December 31, 2010, based on criteria established in Internal Control-Integrated Framework issued by the Committee of Sponsoring Organizations of the Treadway Commission and our report dated March 4, 2011, expressed an unqualified opinion thereon.
/s/ Ernst & Young LLP
New Orleans, Louisiana
March 4, 2011
IBERIABANK CORPORATION AND SUBSIDIARIES
Consolidated Balance Sheets
December 31, 2010 and 2009
| (dollars in thousands, except share data) | 2010 | 2009 | ||||||
| Assets |
||||||||
| Cash and due from banks |
$ | 94,941 | $ | 94,674 | ||||
| Interest-bearing deposits in banks |
242,837 | 80,723 | ||||||
| Total cash and cash equivalents |
337,778 | 175,397 | ||||||
| Fed funds sold |
9,038 | 261,421 | ||||||
| Securities available for sale, at fair value |
1,729,794 | 1,320,476 | ||||||
| Securities held to maturity, fair values of $291,994 and $260,798, respectively |
290,020 | 260,361 | ||||||
| Mortgage loans held for sale |
83,905 | 66,945 | ||||||
| Loans covered by loss share agreement |
1,582,747 | 1,670,466 | ||||||
| Non-covered loans, net of unearned income |
4,452,585 | 4,113,899 | ||||||
| Total loans, net of unearned income |
6,035,332 | 5,784,365 | ||||||
| Allowance for loan losses |
(136,100 | ) | (55,768 | ) | ||||
| Loans, net |
5,899,232 | 5,728,597 | ||||||
| FDIC loss share receivable |
726,871 | 1,034,734 | ||||||
| Premises and equipment, net |
208,403 | 137,426 | ||||||
| Goodwill |
234,228 | 227,080 | ||||||
| Other assets |
507,497 | 483,518 | ||||||
| Total Assets |
$ | 10,026,766 | $ | 9,695,955 | ||||
| Liabilities |
||||||||
| Deposits: |
||||||||
| Noninterest-bearing |
$ | 878,768 | $ | 874,885 | ||||
| Interest-bearing |
7,036,338 | 6,681,263 | ||||||
| Total deposits |
7,915,106 | 7,556,148 | ||||||
| Short-term borrowings |
220,328 | 263,351 | ||||||
| Long-term debt |
432,251 | 745,864 | ||||||
| Other liabilities |
155,624 | 169,274 | ||||||
| Total Liabilities |
8,723,309 | 8,734,637 | ||||||
| Shareholders’ Equity |
||||||||
| Preferred stock, $1 par value and liquidation value per share of $1,000; 5,000,000 shares authorized |
— | — | ||||||
| Common stock, $1 par value - 50,000,000 shares authorized; 28,079,841 and 22,106,659 shares issued, respectively |
28,080 | 22,107 | ||||||
| Additional paid-in capital |
956,864 | 632,086 | ||||||
| Retained earnings |
361,055 | 348,724 | ||||||
| Accumulated other comprehensive income |
14,680 | 22,416 | ||||||
| Treasury stock at cost - 1,205,228 and 1,359,411 shares, respectively |
(57,222 | ) | (64,015 | ) | ||||
| Total Shareholders’ Equity |
1,303,457 | 961,318 | ||||||
| Total Liabilities and Shareholders’ Equity |
$ | 10,026,766 | $ | 9,695,955 | ||||
The accompanying Notes are an integral part of these Consolidated Financial Statements.
IBERIABANK CORPORATION AND SUBSIDIARIES
Consolidated Statements of Income
Years Ended December 31, 2010, 2009, and 2008
| (dollars in thousands, except per share data) |
2010 | 2009 | 2008 | |||||||||
| Interest and Dividend Income |
||||||||||||
| Loans, including fees |
$ | 353,228 | $ | 220,282 | $ | 213,654 | ||||||
| Mortgage loans held for sale, including fees |
3,945 | 3,450 | 3,471 | |||||||||
| Investment securities: |
||||||||||||
| Taxable interest |
44,936 | 38,487 | 38,547 | |||||||||
| Tax-exempt interest |
4,471 | 4,220 | 3,857 | |||||||||
| Accretion (amortization) of FDIC loss share receivable, net |
(13,024 | ) | 2,788 | — | ||||||||
| Other |
2,815 | 1,160 | 4,298 | |||||||||
| Total interest and dividend income |
396,371 | 270,387 | 263,827 | |||||||||
| Interest Expense |
||||||||||||
| Deposits |
95,757 | 75,683 | 96,376 | |||||||||
| Short-term borrowings |
814 | 1,328 | 4,458 | |||||||||
| Long-term debt |
18,173 | 20,591 | 25,349 | |||||||||
| Total interest expense |
114,744 | 97,602 | 126,183 | |||||||||
| Net interest income |
281,627 | 172,785 | 137,644 | |||||||||
| Provision for loan losses |
42,451 | 45,370 | 12,568 | |||||||||
| Net interest income after provision for loan losses |
239,176 | 127,415 | 125,076 | |||||||||
| Noninterest Income |
||||||||||||
| Service charges on deposit accounts |
24,375 | 22,986 | 23,025 | |||||||||
| ATM/debit card fee income |
10,117 | 7,975 | 6,820 | |||||||||
| Income from bank owned life insurance |
3,100 | 2,892 | 2,966 | |||||||||
| Gain on sale of loans, net |
47,689 | 35,108 | 25,295 | |||||||||
| (Loss) gain on sale of assets |
(76 | ) | (644 | ) | 832 | |||||||
| Gain on acquisition |
3,781 | 238,893 | — | |||||||||
| Gain on sale of investments, net |
5,251 | 6,736 | 1,137 | |||||||||
| Gains (losses) on swaps |
3 | 202 | (280 | ) | ||||||||
| Net cash settlements on swaps |
(1,646 | ) | (326 | ) | 5 | |||||||
| Title revenue |
18,083 | 18,476 | 19,003 | |||||||||
| Broker commissions |
7,530 | 4,592 | 5,528 | |||||||||
| Other income |
15,683 | 7,647 | 7,601 | |||||||||
| Total noninterest income |
133,890 | 344,537 | 91,932 | |||||||||
| Noninterest Expense |
||||||||||||
| Salaries and employee benefits |
161,482 | 114,379 | 88,971 | |||||||||
| Occupancy and equipment |
33,837 | 24,337 | 23,294 | |||||||||
| Franchise and shares tax |
2,718 | 3,242 | 2,244 | |||||||||
| Communication and delivery |
9,643 | 6,522 | 6,495 | |||||||||
| Marketing and business development |
6,288 | 5,640 | 3,342 | |||||||||
| Data processing |
12,133 | 6,922 | 6,399 | |||||||||
| Printing, stationery and supplies |
2,987 | 2,411 | 2,065 | |||||||||
| Amortization of acquisition intangibles |
4,935 | 2,893 | 2,408 | |||||||||
| Professional services |
13,473 | 8,164 | 5,137 | |||||||||
| Goodwill impairment |
— | 9,681 | — | |||||||||
| Other expenses |
56,753 | 39,069 | 20,871 | |||||||||
| Total noninterest expense |
304,249 | 223,260 | 161,226 | |||||||||
| Income before income tax expense |
68,817 | 248,692 | 55,782 | |||||||||
| Income tax expense |
19,991 | 90,338 | 15,870 | |||||||||
| Net Income |
48,826 | 158,354 | 39,912 | |||||||||
| Preferred Stock Dividends |
— | (3,350 | ) | (348 | ) | |||||||
| Income Available to Common Shareholders - Basic |
$ | 48,826 | $ | 155,004 | $ | 39,564 | ||||||
| Earnings Allocated to Unvested Restricted Stock |
(971 | ) | (3,910 | ) | (1,045 | ) | ||||||
| Earnings Available to Common Shareholders - Diluted |
47,855 | 151,094 | 38,519 | |||||||||
| Earnings per common share - Basic |
$ | 1.90 | $ | 8.49 | $ | 3.04 | ||||||
| Earnings per common share - Diluted |
$ | 1.88 | $ | 8.41 | $ | 2.97 | ||||||
| Cash dividends declared per common share |
$ | 1.36 | $ | 1.36 | $ | 1.36 | ||||||
The accompanying Notes are an integral part of these Consolidated Financial Statements.
IBERIABANK CORPORATION AND SUBSIDIARIES
Consolidated Statements of Shareholders’ Equity
Years Ended December 31, 2010, 2009, and 2008
| (dollars in thousands, except share and per share data) |
Preferred Stock |
Common Stock |
Additional Paid-In Capital |
Retained Earnings |
Accumulated Other Comprehensive Income |
Treasury Stock |
Total | |||||||||||||||||||||
| Balance, December 31, 2007 |
$ | — | $ | 14,800 | $ | 361,746 | $ | 197,911 | $ | 5,725 | $ | (82,123 | ) | $ | 498,059 | |||||||||||||
| Cumulative effect adjustment -Adoption of EITF 06-4 |
(71 | ) | (71 | ) | ||||||||||||||||||||||||
| Balance after adjustment, December 31, 2007 |
— | 14,800 | 361,746 | 197,840 | 5,725 | (82,123 | ) | 497,988 | ||||||||||||||||||||
| Comprehensive income: |
||||||||||||||||||||||||||||
| Net income |
39,912 | 39,912 | ||||||||||||||||||||||||||
| Change in unrealized gain on securities available for sale, net of deferred taxes |
7,099 | 7,099 | ||||||||||||||||||||||||||
| Change in fair value of derivatives used for cash flow hedges, net of tax effect |
(530 | ) | (530 | ) | ||||||||||||||||||||||||
| Total comprehensive income |
46,481 | |||||||||||||||||||||||||||
| Cash dividends declared, $1.36 per share |
(33 | ) | (18,586 | ) | (18,619 | ) | ||||||||||||||||||||||
| Cash dividends declared, preferred stock |
(348 | ) | (348 | ) | ||||||||||||||||||||||||
| Equity contribution to joint venture |
10 | 10 | ||||||||||||||||||||||||||
| Reissuance of treasury stock under incentive plan, net of shares surrendered in payment, including tax benefit, 168,860 shares |
919 | 2,788 | 3,707 | |||||||||||||||||||||||||
| Common stock issued for recognition and retention plan |
(2,766 | ) | 2,766 | — | ||||||||||||||||||||||||
| Common stock issued, net of issuance costs |
2,877 | 106,978 | 109,855 | |||||||||||||||||||||||||
| Preferred stock issued and common stock warrants |
87,779 | 2,249 | 90,028 | |||||||||||||||||||||||||
| Share-based compensation cost |
5,106 | 5,106 | ||||||||||||||||||||||||||
| Balance, December 31, 2008 |
$ | 87,779 | $ | 17,677 | $ | 474,209 | $ | 218,818 | $ | 12,294 | $ | (76,569 | ) | $ | 734,208 | |||||||||||||
| Comprehensive income: |
||||||||||||||||||||||||||||
| Net income |
158,353 | 158,353 | ||||||||||||||||||||||||||
| Change in unrealized gain on securities available for sale, net of deferred taxes |
(2,592 | ) | (2,592 | ) | ||||||||||||||||||||||||
| Change in fair value of derivatives used for cash flow hedges, net of tax effect |
12,714 | 12,714 | ||||||||||||||||||||||||||
| Total comprehensive income |
168,475 | |||||||||||||||||||||||||||
| Cash dividends declared, $1.36 per share |
(25,002 | ) | (25,002 | ) | ||||||||||||||||||||||||
| Preferred stock dividend and accretion |
99 | (3,350 | ) | (3,251 | ) | |||||||||||||||||||||||
| Preferred stock redemption |
(87,878 | ) | (87,878 | ) | ||||||||||||||||||||||||
| Redemption of preferred warrant |
(1,200 | ) | (1,200 | ) | ||||||||||||||||||||||||
| Reissuance of treasury stock under incentive plan, net of shares surrendered in payment, including tax benefit, 192,685 shares |
(497 | ) | 5,328 | 4,831 | ||||||||||||||||||||||||
| Common stock issued |
4,430 | 160,214 | 164,644 | |||||||||||||||||||||||||
| Common stock issued for recognition and retention plan |
(7,226 | ) | 7,226 | — | ||||||||||||||||||||||||
| Share-based compensation cost |
6,586 | 6,586 | ||||||||||||||||||||||||||
| Equity contribution to joint venture |
(95 | ) | (95 | ) | ||||||||||||||||||||||||
| Balance, December 31, 2009 |
$ | — | $ | 22,107 | $ | 632,086 | $ | 348,724 | $ | 22,416 | $ | (64,015 | ) | $ | 961,318 | |||||||||||||
| Comprehensive income: |
||||||||||||||||||||||||||||
| Net income |
48,826 | 48,826 | ||||||||||||||||||||||||||
| Change in unrealized gain on securities available for sale, net of deferred taxes |
(5,066 | ) | (5,066 | ) | ||||||||||||||||||||||||
| Change in fair value of derivatives used for cash flow hedges, net of tax effect |
(2,670 | ) | (2,670 | ) | ||||||||||||||||||||||||
| Total comprehensive income |
41,090 | |||||||||||||||||||||||||||
| Cash dividends declared, $1.36 per share |
(36,495 | ) | (36,495 | ) | ||||||||||||||||||||||||
| Reissuance of treasury stock under incentive plan, net of shares surrendered in payment, including tax benefit, 69,057 shares |
(611 | ) | 1,378 | 767 | ||||||||||||||||||||||||
| Common stock issued |
5,973 | 323,007 | 328,980 | |||||||||||||||||||||||||
| Common stock issued for recognition and retention plan |
(5,415 | ) | 5,415 | — | ||||||||||||||||||||||||
| Share-based compensation cost |
7,797 | 7,797 | ||||||||||||||||||||||||||
| Balance, December 31, 2010 |
$ | — | $ | 28,080 | $ | 956,864 | $ | 361,055 | $ | 14,680 | $ | (57,222 | ) | $ | 1,303,457 | |||||||||||||
The accompanying Notes are an integral part of these Consolidated Financial Statements.
IBERIABANK CORPORATION AND SUBSIDIARIES
Consolidated Statements of Cash Flows
Years Ended December 31, 2010, 2009, and 2008
| (dollars in thousands) |
2010 | 2009 | 2008 | |||||||||
| Cash Flows from Operating Activities |
||||||||||||
| Net income |
$ | 48,826 | $ | 158,354 | $ | 39,912 | ||||||
| Adjustments to reconcile net income to net cash provided by operating activities: |
||||||||||||
| Depreciation and amortization |
11,042 | 10,377 | 11,333 | |||||||||
| Amortization of purchase accounting adjustments |
(52,850 | ) | (7,051 | ) | 883 | |||||||
| Provision for loan losses |
42,451 | 45,370 | 12,568 | |||||||||
| Noncash compensation expense |
7,797 | 6,586 | 5,106 | |||||||||
| Loss (gain) on sale of assets |
76 | 644 | (832 | ) | ||||||||
| Other-than-temporary impairment |
517 | — | — | |||||||||
| Gain on sale of credit card receivables |
— | — | (6,901 | ) | ||||||||
| Gain on sale of investments |
(5,251 | ) | (6,736 | ) | (1,137 | ) | ||||||
| Gain on acquisition |
(3,781 | ) | (238,893 | ) | — | |||||||
| Goodwill impairment |
— | 9,681 | — | |||||||||
| Loss on abandonment of fixed assets |
— | 154 | — | |||||||||
| Amortization of premium/discount on investments |
15,050 | 3,719 | (1,044 | ) | ||||||||
| Derivative (gains) losses on swaps |
(3 | ) | (198 | ) | 275 | |||||||
| (Benefit) provision for deferred income taxes |
(3,607 | ) | 82,297 | (305 | ) | |||||||
| Mortgage loans held for sale |
||||||||||||
| Originations |
(1,772,486 | ) | (1,587,095 | ) | (928,915 | ) | ||||||
| Proceeds from sales |
1,803,214 | 1,618,761 | 941,500 | |||||||||
| Gain on sale of loans, net |
(47,689 | ) | (35,108 | ) | (18,394 | ) | ||||||
| Excess tax benefits from share-based payment arrangements |
(637 | ) | (1,346 | ) | (1,650 | ) | ||||||
| Decrease (increase) in other assets |
161,217 | (207,697 | ) | (13,925 | ) | |||||||
| Other operating activities, net |
(54,162 | ) | 25,225 | 7,891 | ||||||||
| Net Cash Provided by (Used in) Operating Activities |
149,724 | (122,956 | ) | 46,365 | ||||||||
| Cash Flows from Investing Activities |
||||||||||||
| Proceeds from sales of securities available for sale |
249,008 | 338,096 | 59,895 | |||||||||
| Proceeds from maturities, prepayments and calls of securities available for sale |
576,139 | 413,221 | 327,851 | |||||||||
| Purchases of securities available for sale |
(1,198,853 | ) | (944,914 | ) | (415,312 | ) | ||||||
| Proceeds from maturities, prepayments and calls of securities held to maturity |
66,091 | 349,019 | 10,286 | |||||||||
| Purchases of securities held to maturity |
(96,375 | ) | (548,647 | ) | (13,768 | ) | ||||||
| Proceeds from sale of loans |
— | — | 37,402 | |||||||||
| FDIC reimbursement of recoverable covered asset losses |
438,870 | — | — | |||||||||
| Increase in loans receivable, net, excluding loans acquired and sale of credit card receivable |
(58,373 | ) | (344,310 | ) | (361,971 | ) | ||||||
| Proceeds from sale of premises and equipment |
1,324 | 70 | 3,164 | |||||||||
| Purchases of premises and equipment |
(38,063 | ) | (16,212 | ) | (7,492 | ) | ||||||
| Proceeds from disposition of real estate owned |
49,072 | 15,011 | 2,148 | |||||||||
| Investment in new market tax credit entities |
(11,875 | ) | (104,200 | ) | — | |||||||
| Cash received in excess of cash paid for acquisition |
24,134 | 496,015 | 128,464 | |||||||||
| Other investing activities, net |
6,518 | 814 | 9,065 | |||||||||
| Net Cash Provided by (Used in) Investing Activities |
7,617 | (346,037 | ) | (220,268 | ) | |||||||
| Cash Flows from Financing Activities |
||||||||||||
| Increase in deposits, net of deposits acquired |
87,498 | 529,415 | 326,954 | |||||||||
| Net change in short-term borrowings, net of borrowings acquired |
(43,023 | ) | 42,561 | (227,933 | ) | |||||||
| Proceeds from long-term debt |
45,233 | 53,531 | 157,666 | |||||||||
| Repayments of long-term debt |
(380,004 | ) | (380,659 | ) | (45,684 | ) | ||||||
| Dividends paid to shareholders |
(34,412 | ) | (23,355 | ) | (17,870 | ) | ||||||
| Preferred stock dividend paid |
— | (3,350 | ) | — | ||||||||
| Proceeds from sale of treasury stock for stock options exercised |
1,631 | 4,449 | 2,787 | |||||||||
| Payments to repurchase common stock |
(1,500 | ) | (979 | ) | (762 | ) | ||||||
| Preferred stock issued and common stock warrants |
— | (87,878 | ) | 90,000 | ||||||||
| Common stock issued |
328,980 | 164,644 | 109,855 | |||||||||
| Redemption of preferred stock warrant |
— | (1,200 | ) | — | ||||||||
| Excess tax benefits from share-based payment arrangements |
637 | 1,346 | 1,650 | |||||||||
| Net Cash Provided by Financing Activities |
5,040 | 298,525 | 396,663 | |||||||||
| Net Increase (Decrease) In Cash and Cash Equivalents |
162,381 | (170,468 | ) | 222,760 | ||||||||
| Cash and Cash Equivalents at Beginning of Period |
175,397 | 345,865 | 123,105 | |||||||||
| Cash and Cash Equivalents at End of Period |
$ | 337,778 | $ | 175,397 | $ | 345,865 | ||||||
| Supplemental Schedule of Noncash Activities |
||||||||||||
| Acquisition of real estate in settlement of loans |
$ | 49,886 | $ | 19,254 | $ | 8,746 | ||||||
| Common stock issued in acquisition |
$ | — | $ | — | $ | — | ||||||
| Transfers of property into Other Real Estate |
$ | 49,886 | $ | 20,575 | $ | 531 | ||||||
| Exercise of stock options with payment in company stock |
$ | — | $ | 290 | $ | 187 | ||||||
| Supplemental Disclosures |
||||||||||||
| Cash paid for: |
||||||||||||
| Interest on deposits and borrowings |
$ | 117,810 | $ | 104,228 | $ | 128,940 | ||||||
| Income taxes, net |
$ | 24,494 | $ | 17,127 | $ | 7,493 | ||||||
The accompanying Notes are an integral part of these Consolidated Financial Statements.
NOTE 1 – SUMMARY OF SIGNIFICANT ACCOUNTING POLICIES
PRINCIPLES OF CONSOLIDATION
The consolidated financial statements include the accounts of IBERIABANK Corporation and its wholly owned subsidiaries, IBERIABANK, IBERIABANK fsb, Lenders Title Company (“LTC”), IBERIA Capital Partners LLC (“ICP”), IB Aircraft Holdings, LLC, IBERIA Asset Management Inc. (“IAM”), and IBERIA CDE, LLC (“CDE”). All significant intercompany balances and transactions have been eliminated in consolidation. All normal, recurring adjustments which, in the opinion of management, are necessary for a fair presentation of the financial statements, have been included.
NATURE OF OPERATIONS
The Company offers commercial and retail banking products and services to customers throughout locations in six states through IBERIABANK and IBERIABANK fsb. The Company also operates mortgage production offices in twelve states through IBERIABANK fsb’s subsidiary, IBERIABANK Mortgage Company (“IMC”), and offers a full line of title insurance and closing services throughout Arkansas and Louisiana through LTC and its subsidiaries. ICP provides equity research, institutional sales and trading, and corporate finance services. IB Aircraft Holdings, LLC owns a fractional share of an aircraft used by management of the Company and its subsidiaries. IAM provides wealth management and trust services for commercial and private banking clients. CDE is utilized to purchase tax credits. During the first quarter of 2011, the Company merged IBERIABANK fsb into IBERIABANK. Upon the merger of the Company’s two financial institution subsidiaries, IMC became a wholly-owned subsidiary of IBERIABANK.
RECLASSIFICATION
Certain amounts reported in prior periods have been reclassified to conform to the current period presentation. During the current year, the Company converted the former Orion Bank loan, deposit, and general ledger systems to the Company’s systems. In the process of conversion, the Company reviewed the acquired bank’s general ledger and noted some deposit products were not appropriately segregated between interest-bearing and noninterest-bearing general ledger accounts. Upon conversion, the Company has segregated these interest-bearing deposit accounts and has included these accounts in total interest-bearing deposits as of December 31, 2010 and 2009. As a result of the conversion, $110,368,000 of noninterest-bearing deposits at December 31, 2009 were reclassified and included in total interest-bearing deposits on the Company’s consolidated balance sheet. The reclassification had no effect on previously reported total deposits, total liabilities, shareholders’ equity, net interest margin or income available to common shareholders.
CORRECTION OF AN ERROR IN THE FINANCIAL STATEMENTS
The Company has corrected its historical financial statements for the year ended December 31, 2009 for the impact of an error in accounting for its Orion acquisition totaling $11,551,000, the result of which was an increase in net income of $7,104,000. The error was identified in 2010 through the operation of the Company’s internal controls over financial reporting as it related to the Company’s acquisition accounting. Using accounting guidance provided in Accounting Standards Codification (“ASC”) Topic 250, the Company assessed these items and determined the error, although immaterial to the consolidated financial statements for the year ended December 31, 2009, would be considered material to the consolidated financial statements for the year ended December 31, 2010. As a result, the information included in these consolidated financial statements and footnotes includes the effect this correction has on the previously reported financial statements for the year ended December 31, 2009.
The following table presents the effect this correction has on the Consolidated Statement of Income for the year ended December 31, 2009.
| (dollars in thousands) | As Previously Reported |
Adjustment | As Adjusted | |||||||||
| Selected Income Statement Data |
||||||||||||
| Gain on acquisition |
$ | 227,342 | $ | 11,551 | $ | 238,893 | ||||||
| Income tax expense |
85,891 | 4,447 | 90,338 | |||||||||
| Net Income |
151,250 | 7,104 | 158,354 | |||||||||
| Income Available to Common Shareholders - Basic |
147,900 | 7,104 | 155,004 | |||||||||
| Income Available to Common Shareholders - Diluted |
144,167 | 6,927 | 151,094 | |||||||||
| Earnings per common share - Basic |
$ | 8.10 | $ | 0.39 | $ | 8.49 | ||||||
| Earnings per common share - Diluted |
$ | 8.03 | $ | 0.38 | $ | 8.41 | ||||||
The following table presents the effect of this correction on the Company’s Consolidated Balance Sheet at December 31, 2009.
| (dollars in thousands) | As Previously Reported |
Adjustment | As Adjusted | |||||||||
| Selected Balance Sheet Data |
||||||||||||
| Other assets |
$ | 487,965 | $ | (4,447 | ) | $ | 483,518 | |||||
| Total Assets |
9,700,402 | (4,447 | ) | 9,695,955 | ||||||||
| Other liabilities |
$ | 180,824 | $ | (11,551 | ) | $ | 169,274 | |||||
| Total Liabilities |
8,746,187 | (11,551 | ) | 8,734,637 | ||||||||
| Retained earnings |
$ | 341,621 | $ | 7,104 | $ | 348,724 | ||||||
| Total Shareholders’ Equity |
954,215 | 7,104 | 961,318 | |||||||||
The correction did not have an effect on the Company’s operating cash flows for the year ended December 31, 2009. The following table presents the effect on the individual line items within operating cash flows on the Company’s Consolidated Statement of Cash Flows at December 31, 2009.
| (dollars in thousands) | As Previously Reported |
Adjustment | As Adjusted | |||||||||
| Selected Cash Flow Data |
||||||||||||
| Net income |
$ | 151,250 | $ | 7,104 | $ | 158,354 | ||||||
| Provision for deferred income taxes |
77,850 | 4,447 | 82,297 | |||||||||
| Gain on acquisition |
(227,342 | ) | (11,551 | ) | (238,893 | ) | ||||||
USE OF ESTIMATES
The preparation of financial statements in conformity with generally accepted accounting principles requires management to make estimates and assumptions that affect the amounts reported in the consolidated financial statements and accompanying notes. Actual results could differ from those estimates. Material estimates that are susceptible to significant change in the near term are the allowance for loan losses, valuation of and accounting for loans covered by loss sharing arrangements with the FDIC and the related loss share receivable, valuation of goodwill, intangible assets and other purchase accounting adjustments, and share-based compensation.
CONCENTRATION OF CREDIT RISKS
Most of the Company’s business activity is with customers located within the States of Louisiana, Florida, Arkansas, Alabama, Texas, and Tennessee. The Company’s lending activity is concentrated in its market areas in those states. The Company has emphasized originations of commercial loans and private banking loans, defined as loans to larger consumer clients. Repayment of loans is expected to come from cash flows of the borrower. Losses on secured loans are limited by the value of the collateral upon default of the borrowers. The Company does not have any significant concentrations to any one industry or customer.
CASH AND CASH EQUIVALENTS
For purposes of presentation in the consolidated statements of cash flows, cash and cash equivalents are defined as cash, interest-bearing deposits and noninterest-bearing demand deposits at other financial institutions with original maturities less than three months. IBERIABANK and IBERIABANK fsb may be required to maintain average balances on hand or with the Federal Reserve Bank to meet regulatory reserve and clearing requirements. At December 31, 2010 and 2009, the required reserve balances were $4,909,000 and $6,864,000, respectively, for IBERIABANK and $25,000 for both 2010 and 2009 for IBERIABANK fsb. Both IBERIABANK and IBERIABANK fsb had enough cash deposited with the Federal Reserve at December 31, 2010 to cover the required reserve balance.
INVESTMENT SECURITIES
Debt securities that management has the ability and intent to hold to maturity are classified as held to maturity and carried at cost, adjusted for amortization of premiums and accretion of discounts using methods approximating the interest method. Securities not classified as held to maturity or trading, including equity securities with readily determinable fair values, are classified as available for sale and recorded at fair value, with unrealized gains and losses excluded from earnings and reported in other comprehensive income. Declines in the value of individual held to maturity and available for sale securities below their cost that are other than temporary are included in earnings as realized losses. In estimating other than temporary impairment losses, management considers 1) the length of time and the extent to which the fair value has been less than cost, 2) the financial condition and near-term prospects of the issuer, 3) the intent and ability of the Company to retain its investment in the issuer for a period of time sufficient to allow for any anticipated recovery in fair value, and 4) for debt securities, the recovery of contractual principal and interest. Gains/losses on securities sold are recorded on the trade date, using the specific identification method.
MORTGAGE LOANS HELD FOR SALE
Mortgage loans originated and intended for sale in the secondary market are carried at the lower of cost or estimated fair value in the aggregate. Net unrealized losses, if any, are recognized through a valuation allowance that is recorded as a charge to income. Loans held for sale have primarily been fixed rate single-family residential mortgage loans under contract to be sold in the secondary market. In most cases, loans in this category are sold within thirty days. These loans are generally sold with the mortgage servicing rights released. Buyers generally have recourse to return a purchased loan to the Company under limited circumstances. Recourse conditions may include early payment default, breach of representations or warranties, and documentation deficiencies. During 2010, an insignificant number of loans were returned to the Company.
LOANS
The Company grants mortgage, commercial and consumer loans to customers. Loans receivable that management has the intent and ability to hold for the foreseeable future or until maturity or payoff are stated at the unpaid principal balances, less the allowance for loan losses and net deferred loan origination fees and unearned discounts. Deferred loan origination fees were $6,791,000 and $5,098,000 and deferred loan expenses were $4,469,000 and $4,586,000 at December 31, 2010 and 2009, respectively. In addition to loans issued in the normal course of business, the Company considers overdrafts on customer deposit accounts to be loans and reclassifies these overdrafts as loans in its consolidated balance sheets. At December 31, 2010 and 2009, overdrafts of $2,270,000 and $2,117,000, respectively, have been reclassified to loans receivable.
Interest income on loans is accrued over the term of the loans based on the principal balance outstanding. Loan origination fees, net of certain direct origination costs, are deferred and recognized as an adjustment of the related loan yield, using the effective interest method.
The accrual of interest on loans is discontinued at the time the loan is 90 days delinquent unless the credit is well-secured and in process of collection. Mortgage, credit card and other personal loans are typically charged down to net collateral value, less cost to sell, no later than 180 days past due. Past due status is based on the contractual terms of loans. In all cases, loans are placed on nonaccrual status or charged off at an earlier date if collection of principal or interest is considered doubtful.
A loan is considered impaired when, based on current information and events, it is probable that the Company will be unable to collect the scheduled payments of principal or interest when due according to the contractual terms of the loan agreement. Factors considered by management in determining impairment include payment status, collateral value, and the probability of collecting scheduled principal and interest payments when due. Loans that experience insignificant payment delays and payment shortfalls generally are not classified as impaired. The impairment loss is measured on a loan by loan basis for commercial and construction loans by either the present value of expected future cash flows discounted at the loan’s effective interest rate, the loan’s obtainable market price, or the fair value of the collateral if the loan is collateral dependent.
In general, all interest accrued but not collected for loans that are placed on nonaccrual status or charged off is reversed against interest income. The interest on these loans is accounted for on the cash-basis method or cost-recovery method, until qualifying for a return to accrual status. Loans are returned to accrual status when all principal and interest amounts contractually due are brought current and future payments are reasonably assured.
ALLOWANCE FOR LOAN LOSSES
The allowance for loan losses is established as losses are estimated to have occurred through a provision charged to earnings, and for loans covered by loss share agreements with the FDIC, through a charge to earnings and an indemnification asset, the FDIC loss share receivable. Loan losses are charged against the allowance when management believes the uncollectibility of a loan balance is confirmed. Subsequent recoveries, if any, are credited to the allowance. Allowances for impaired loans are generally determined based on collateral values or the present value of estimated cash flows. Changes in the allowance related to impaired loans are charged or credited to the provision for loan losses.
The allowance for loan losses is maintained at a level which, in management’s opinion, is adequate to absorb credit losses inherent in the portfolio. The Company utilizes both peer group analysis, as well as a historical analysis of the Company’s portfolio to validate the overall adequacy of the allowance for loan losses. In addition to these objective criteria, the Company subjectively assesses the adequacy of the allowance for loan losses with consideration given to current economic conditions, changes to loan policies, the volume and type of lending, composition of the portfolio, the level of classified and criticized credits, seasoning of the loan portfolio, payment status and other factors.
In connection with acquisitions, the Company acquires certain loans considered impaired and accounts for these loans under the provisions of ASC Topic 310, which require the initial recognition of these loans at the present value of amounts expected to be received. The allowance for loan losses previously associated with these loans does not carry over. Any deterioration in the credit quality of these loans subsequent to acquisition would be considered in the allowance for loan losses. For any increases in cash flows expected to be collected, the Company adjusts the amount of accretable yield recognized on a prospective basis over the loan’s or pool’s remaining life.
ACCOUNTING FOR ACQUIRED LOANS AND RELATED FDIC LOSS SHARE RECEIVABLE
Beginning in 2009, the Company accounts for its acquisitions under ASC Topic 805, which requires the use of the purchase method of accounting. All identifiable assets acquired, including loans, are recorded at fair value. No allowance for loan losses related to the acquired loans is recorded on the acquisition date as the fair value of the loans acquired incorporates assumptions regarding credit risk. Loans acquired are recorded at fair value in accordance with the fair value methodology prescribed in ASC Topic No. 820, exclusive of the shared-loss agreements with the FDIC. The fair value estimates associated with the loans include estimates related to expected prepayments and the amount and timing of undiscounted expected principal, interest and other cash flows.
Over the life of the acquired loans, the Company continues to estimate cash flows expected to be collected on individual loans or on pools of loans sharing common risk characteristics. The Company evaluates at each balance sheet date whether the estimated cash flows and corresponding present value of its loans, determined using the effective interest rates, has decreased and if so, recognizes a provision for loan loss in its consolidated statement of income. For any increases in cash flows expected to be collected, the Company adjusts the amount of accretable yield recognized on a prospective basis over the loan’s or pool’s remaining life.
Because the FDIC will reimburse the Company for certain acquired loans should the Company experience a loss, an indemnification asset is recorded at fair value at the acquisition date. The indemnification asset is recognized at the same time as the indemnified loans, and measured on the same basis, subject to collectability or contractual limitations. The shared loss agreements on the acquisition date reflect the reimbursements expected to be received from the FDIC, using an appropriate discount rate, which reflects counterparty credit risk and other uncertainties.
The shared loss agreements continue to be measured on the same basis as the related indemnified loans, and the loss share receivable is impacted by changes in estimated cash flows associated with these loans. Deterioration in the credit quality on expected cash flows of the loans (immediately recorded as an adjustment to the allowance for loan losses) would immediately increase the loss share receivable, with the offset recorded through the consolidated statement of income. Increases in the credit quality or cash flows of loans (reflected as an adjustment to yield and accreted into income over the remaining life of the loans) decrease the basis of the shared loss agreements, with such decrease being amortized into income over 1) the life of the loan or 2) the life of the shared loss agreements, whichever is shorter. Loss assumptions used in the basis of the indemnified loans are consistent with the loss assumptions used to measure the indemnification asset. Fair value accounting incorporates into the fair value of the indemnification asset an element of the time value of money, which is accreted back into income over the life of the shared loss agreements.
Pursuant to an AICPA letter dated December 18, 2009, the AICPA summarized the SEC staff’s view regarding the accounting in subsequent periods for discount accretion associated with loan receivables acquired in a business combination or asset purchase. Regarding the accounting for such loan receivables that, in the absence of further standard setting, the AICPA understands that the SEC staff would not object to an accounting policy based on contractual cash flows (ASC Topic 310-20 approach) or an accounting policy based on expected cash flows (ASC 310-30 approach). The Company believes analogizing to ASC Topic 310-30 is the more appropriate option to follow in accounting for the fair value discount.
Upon the determination of an incurred loss the indemnification asset will be reduced by the amount owed by the FDIC. A corresponding claim receivable is recorded in other assets until cash is received from the FDIC.
For further discussion of the Company’s acquisitions and loan accounting, see Note 3 and Note 5 to the consolidated financial statements.
OFF-BALANCE SHEET CREDIT RELATED FINANCIAL INSTRUMENTS
The Company accounts for its guarantees in accordance with the provisions of ASC Topic 460. In the ordinary course of business, the Company has entered into commitments to extend credit, including commitments under credit card arrangements, commercial letters of credit and standby letters of credit. Such financial instruments are recorded when they are funded.
DERIVATIVE FINANCIAL INSTRUMENTS
ASC Topic 815 requires that all derivatives be recognized as assets or liabilities in the balance sheet at fair value. The Company may enter into derivative contracts to manage exposure to interest rate risk or to meet the financing needs of its customers.
Interest rate swap agreements
The Company utilizes interest rate swap agreements to convert a portion of its variable-rate debt to a fixed rate (cash flow hedge). Interest rate swaps are contracts in which a series of interest rate flows are exchanged over a prescribed period. The notional amount on which the interest payments are based is not exchanged.
For derivatives designated as hedging the exposure to changes in the fair value of an asset or liability (fair value hedge), the gain or loss is recognized in earnings in the period of change together with the offsetting gain or loss to the hedged item attributable to the risk being hedged. Earnings will be affected to the extent to which the hedge is not effective in achieving offsetting changes in
fair value. For derivatives designated as hedging exposure to variable cash flows of a forecasted transaction (cash flow hedge), the effective portion of the derivative’s gain or loss is initially reported as a component of other comprehensive income and subsequently reclassified into earnings when the forecasted transaction affects earnings or when the hedge is terminated. The ineffective portion of the gain or loss is reported in earnings immediately. For derivatives that are not designated as hedging instruments, changes in the fair value of the derivatives are recognized in earnings immediately.
In applying hedge accounting for derivatives, the Company establishes a method for assessing the effectiveness of the hedging derivative and a measurement approach for determining the ineffective aspect of the hedge upon the inception of the hedge. These methods are consistent with the Company’s approach to managing risk.
Rate lock commitments
The Company enters into commitments to originate loans whereby the interest rate on the prospective loan is determined prior to funding (“rate lock commitments”). Rate lock commitments on mortgage loans that are intended to be sold are considered to be derivatives. Accordingly, such commitments, along with any related fees received from potential borrowers, are recorded at fair value as derivative assets or liabilities, with changes in fair value recorded in net gain or loss on sale of mortgage loans. The fair value of rate lock commitments was immaterial in 2010 and 2009.
Equity-indexed certificates of deposit
Beginning in 2010, IBERIABANK offers its customers a certificate of deposit that provides the purchaser a guaranteed return of principal at maturity plus potential equity return, which allows IBERIABANK to identify a known cost of funds. The rate of return is based on the performance of ten large cap U.S. stocks in the S&P 500 stock index, representing a variety of industry segments. Because it is based on an equity index, the rate of return represents an embedded derivative that is not clearly and closely related to the host instrument. ASC Topic 815 therefore requires the certificate of deposit be separated into two components: a zero coupon certificate of deposit (the host instrument) and a written option purchased by the depositor (an embedded derivative). The discount on the zero coupon deposit is amortized over the life of the deposit, and the written option is carried at fair value on the Company’s consolidated balance sheet, with changes in fair value recorded through earnings. IBERIABANK offsets the risks of the written option by purchasing an option with terms that mirror the written option and that is also carried at fair value on the Company’s consolidated balance sheet.
PREMISES AND EQUIPMENT
Land is carried at cost. Buildings and equipment are carried at cost, less accumulated depreciation computed on a straight line basis over the estimated useful lives of 10 to 40 years for buildings and 5 to 15 years for furniture, fixtures and equipment.
OTHER REAL ESTATE
Other real estate includes all real estate, other than bank premises used in bank operations, owned or controlled by the Company, including real estate acquired in settlement of loans. Properties are recorded at the balance of the loan or at estimated fair value less estimated selling costs, whichever is less, at the date acquired. Subsequent to foreclosure, management periodically performs valuations and the assets are carried at the lower of cost or fair value less estimated selling costs. Revenue and expenses from operations, gain or loss on sale and changes in the valuation allowance are included in net expenses from foreclosed assets.
For further discussion of the Company’s other real estate owned, see Note 10 to the consolidated financial statements.
GOODWILL AND OTHER INTANGIBLE ASSETS
Goodwill is accounted for in accordance with ASC Topic 350, and accordingly is not amortized but is evaluated at least annually for impairment. Definite-lived intangible assets continue to be amortized over their useful lives and evaluated at least quarterly for impairment.
The Company records its title plant assets in accordance with ASC Topic 950. Under ASC Topic 950, costs incurred to construct a title plant, including the costs incurred to obtain, organize, and summarize historical information, are capitalized until the title plant can be used to perform title searches. Purchased title plant, including a purchased undivided interest in title plant, is recorded at cost at the date of acquisition. For title plant acquired separately or as part of a company acquisition, cost is measured as the fair value of the consideration given. Capitalized costs of title plant are not depreciated or charged to income unless circumstances indicate that the carrying amount of the title plant has been impaired. Impairment identifiers include a change in legal requirements or statutory practices, identification of obsolescence, and abandonment of the title plant, among others identifiers.
TRANSFERS OF FINANCIAL ASSETS
Transfers of financial assets are accounted for as sales when control over the assets has been surrendered. Control over transferred assets is deemed to be surrendered when 1) the assets have been isolated from the Company, 2) the transferee obtains the right, free of conditions that constrain it from taking advantage of that right, to pledge or exchange the transferred assets, and 3) the Company does not maintain effective control over the transferred assets through an agreement to repurchase them before their maturity.
INCOME TAXES
The Company and all subsidiaries file a consolidated federal income tax return on a calendar year basis. The Company files income tax returns in the U.S. federal jurisdiction and various state jurisdictions through IBERIABANK, IBERIABANK fsb, LTC and their subsidiaries. In lieu of Louisiana state income tax, IBERIABANK is subject to the Louisiana bank shares tax, which is included in noninterest expense or income tax expense in the Company’s consolidated financial statements. With few exceptions, the Company is no longer subject to U.S. federal, state or local income tax examinations for years before 2008.
Deferred income tax assets and liabilities are determined using the liability (or balance sheet) method. Under this method, the net deferred tax asset or liability is determined based on the tax effects of the temporary differences between the book and tax bases of the various balance sheet assets and liabilities and gives current recognition to changes in tax rates and laws. The measurement of deferred tax assets is reduced, if necessary, by the amount of any tax benefits that, based on available evidence, are not expected to be realized.
STOCK COMPENSATION PLANS
The Company issues stock options and restricted stock under various plans to directors, officers and other key employees. The Company accounts for its stock compensation plans in accordance with ASC Topics 718 and 505. Under those provisions, the Company has adopted a fair value based method of accounting for employee stock compensation plans, whereby compensation cost is measured at the grant date based on the value of the award and is recognized over the service period, which is usually the vesting period. As a result, compensation expense relating to stock options and restricted stock is reflected in net income as part of “Salaries and employee benefits” on the consolidated statements of income. The Company’s practice has been to grant options at no less than the fair market value of the stock at the grant date.
See Note 18 for additional information on the Company’s share-based compensation plans.
EARNINGS PER COMMON SHARE: Basic earnings per share represents income available to common shareholders divided by the weighted average number of common shares outstanding during the period. Diluted earnings per share reflect additional common shares that would have been outstanding if dilutive potential common shares had been issued, as well as any adjustment to income that would result from the assumed issuance. Potential common shares that may be issued by the Company relate to outstanding stock options and warrants and are determined using the two-class method.
See Note 2 for additional information on the Company’s calculation of earnings per share.
TREASURY STOCK
The purchase of the Company’s common stock is recorded at cost. At the date of retirement or subsequent reissuance, treasury stock is reduced by the cost of such stock with differences recorded in additional paid-in capital or retained earnings, as applicable.
COMPREHENSIVE INCOME
Accounting principles generally require that recognized revenue, expenses, gains and losses be included in net income. Although certain changes in assets and liabilities, such as unrealized gains and losses on available for sale securities and cash flow hedges, are reported as a separate component of the equity section of the balance sheet, such items, along with net income, are components of comprehensive income.
SEGMENT INFORMATION
ASC Topic 280 requires the reporting of information about a company’s operating segments using a “management approach”. The Statement requires that reportable segments be identified based upon those revenue-producing components for which separate financial information is produced internally and are subject to evaluation by the chief operating decision maker in deciding how to allocate resources to segments.
The Company reports the results of its operations through three business segments: IBERIABANK, IBERIABANK fsb, and Lenders Title Company.
See Note 16 for additional information on the Company’s segments.
RECENT ACCOUNTING PRONOUNCEMENTS
International Financial Reporting Standards (“IFRS”)
In November 2009, the SEC issued a proposed roadmap regarding the potential use by U.S. issuers of financial statements prepared in accordance with IFRS. IFRS is a comprehensive series of accounting standards published by the International Accounting Standards Board (“IASB”). Under the proposed roadmap, the Company may be required to prepare financial statements in accordance with IFRS as early as 2014. The SEC will make a determination in 2011 regarding the mandatory
adoption of IFRS. The Company is currently assessing the impact that this potential change would have on its operating results and financial condition, and will continue to monitor the development of the potential implementation of IFRS.
Accounting Standards Update No. 2010-06
In 2010, the Company adopted the provisions of Accounting Standards Update (“ASU”) No. 2010-06, Fair Value Measurements and Disclosures (Topic 820): Improving Disclosures about Fair Value Measurements, which provide amendments to ASC Subtopic 820-10 that require new disclosures related to fair value measurements. The update requires new disclosures for transfers in and out of Levels 1 and 2 fair value measurements, as well as a description of the reasons for the transfers. In addition, the update requires enhanced disclosure of Level 3 fair value measurement activity, including disclosure of separate information for purchases, sales, issuances, and settlements of Level 3 measurements on a gross basis. Finally, the update provides amendments that clarify existing disclosures about the level of disaggregation of data and input and valuation techniques used to measure fair value on both a recurring and nonrecurring basis.
The additional disclosures required are incorporated in Note 21 in these consolidated financial statements.
ASU No. 2010-11
In 2010, the Company adopted the provisions of ASU No. 2010-11, Derivatives and Hedging (Topic 815): Scope Exception Related to Embedded Credit Derivatives, which clarifies the type of embedded credit derivative that is exempt from bifurcation requirements. Under the provisions of the ASU, the only form of embedded credit derivative that qualifies for the exemption is an embedded credit derivative that is related to the subordination of one financial statement to another.
The adoption of this ASU did not have a material impact on the Company’s operating results, financial position, or liquidity.
ASU No. 2010-18
In 2010, the Company adopted the provisions of ASU No. 2010-18, Receivables (Topic 310): Effect of a Loan Modification When the Loan Is Part of a Pool That Is Accounted for as a Single Asset—a consensus of the FASB Emerging Issues Task Force, which provide guidance on the accounting for troubled debt restructurings (“TDRs”). Under the ASU, modifications of loans that are accounted for within a pool under Subtopic 310-30 do not result in the removal of those loans from the pool even if the modification of those loans would otherwise be considered a TDR. The Company is required to consider whether the pool of assets in which the loan is included is impaired if expected cash flows for the pool change. The amendments in this ASU do not affect the accounting for loans under the scope of Subtopic 310-30 that are not accounted for within pools. Loans accounted for individually under Subtopic 310-30 continue to be subject to the troubled debt restructuring accounting provisions within generally accepted accounting principles.
The Company prospectively adopted the provisions of these amendments for modifications of loans accounted for within pools under Subtopic 310-30 occurring after July 15, 2010. As a result, loans accounted for within pools that were considered TDRs before July 15, 2010 continue to be considered TDRs in these consolidated financial statements.
ASU No. 2010-20 and ASU No. 2011-01
In 2010, the Company adopted the provisions of Accounting Standards Update (“ASU”) No. 2010-20, Receivables (Topic 310): Disclosures about the Credit Quality of Financing Receivables and the Allowance for Credit Losses”, which require the Company to provide new disclosures in its financial statements to improve the transparency of financial reporting by requiring enhanced disclosures about the Company’s allowance for credit losses as well as the credit quality of the Company’s loan portfolio.
The additional disclosures required are incorporated in Note 6 in these consolidated financial statements.
In January 2011, the Financial Accounting Standards Board (“FASB”) issued ASU No 2011-01, Receivables (Topic 310): Deferral of the Effective Date of Disclosures about Troubled Debt Restructurings in Update No. 2010-20, that temporarily delays the effective date of the disclosures about troubled debt restructurings (“TDRs”) that are included in ASU No 2010-20. The TDR disclosure guidance will be coordinated with the FASB’s proposed guidance for determining what constitutes a TDR and is currently anticipated to be effective for interim and annual periods ending after July 15, 2011.
ASU No. 2010-28
In 2010, the Company adopted the provisions of ASU No. 2010-28, Intangibles—Goodwill and Other (Topic 350): When to Perform Step 2 of the Goodwill Impairment Test for Reporting Units with Zero or Negative Carrying Amounts (a consensus of the FASB Emerging Issues Task Force), which provides guidance on assessing goodwill impairment for reporting units that have carrying amounts that are zero or negative. The provisions of the ASU require the Company to assess whether it is more likely than not that goodwill of a reporting unit with a negative carrying amount is impaired. If the Company determines that it is more likely than not that the goodwill of one or more of its reporting units is impaired, the Company is required to perform Step 2 of the goodwill impairment test for that reporting unit.
The adoption of this ASU did not have a material impact on the Company’s operating results, financial position, or liquidity.
NOTE 2 – EARNINGS PER SHARE
ASC Topic 260 clarifies share-based payment awards that entitle holders to receive non-forfeitable dividends before vesting should be considered participating securities and thus included in the calculation of basic earnings per share. Effective January 1, 2009, these awards are now included in the calculation of basic earnings per share under the two-class method, a change that reduces both basic and diluted earnings per share. The two-class method allocates earnings for the period between common shareholders and other security holders. The participating awards receiving dividends will be allocated the same amount of income as if they were outstanding shares.
The following table presents the calculation of basic and diluted earnings per share for the years ended December 31, 2010, 2009, and 2008.
| For the Years Ended December 31, | ||||||||||||
| 2010 | 2009 | 2008 | ||||||||||
| Income available to common shareholders |
$ | 48,826,000 | $ | 155,004,000 | $ | 39,564,000 | ||||||
| Distributed and undistributed earnings to unvested restricted stock |
(981,000 | ) | (4,217,000 | ) | (1,032,000 | ) | ||||||
| Distributed and undistributed earnings to common shareholders – Basic(1) |
47,845,000 | 150,787,000 | 38,532,000 | |||||||||
| Undistributed earnings reallocated to unvested restricted stock |
10,000 | 307,000 | (13,000 | ) | ||||||||
| Distributed and undistributed earnings to common shareholders – Diluted |
$ | 47,855,000 | $ | 151,094,000 | $ | 38,519,000 | ||||||
| Weighted average shares outstanding- Basic (3) |
25,681,266 | 18,210,867 | 13,045,855 | |||||||||
| Weighted average shares outstanding - Diluted |
25,394,120 | 17,956,674 | 12,970,054 | |||||||||
| Earnings per common share – Basic(1) |
$ | 1.90 | $ | 8.49 | $ | 3.04 | ||||||
| Earnings per common share - Diluted |
$ | 1.88 | $ | 8.41 | $ | 2.97 | ||||||
| Earnings per unvested restricted stock share – Basic (2) |
$ | 1.97 | $ | 9.22 | $ | 2.89 | ||||||
| Earnings per unvested restricted stock share - Diluted |
$ | 1.95 | $ | 8.55 | $ | 2.93 | ||||||
| (1) | Total earnings available to common shareholders include distributed earnings of $35,772,000, or $1.42 per weighted average share, and undistributed earnings of $12,073,000, or $0.48 per weighted average share for the year ended December 31, 2010. Total earnings available to common shareholders include distributed earnings of $24,491,000, or $1.38 per weighted average share, and undistributed earnings of $126,296,000, or $7.11 per weighted average share for the year ended December 31, 2009. Total earnings available to common shareholders include distributed earnings of $21,061,000, or $1.66 per weighted average share, and undistributed earnings of $17,471,000, or $1.38 per weighted average share for the year ended December 31, 2008. |
| (2) | Total earnings available to unvested restricted stock include distributed earnings of $733,000, or $1.47 per weighted average share, and undistributed earnings of $248,000, or $0.50 per weighted average share for the year ended December 31, 2010. Total earnings available to unvested restricted stock include distributed earnings of $685,000, or $1.50 per weighted average share, and undistributed earnings of $3,532,000, or $7.73 per weighted average share, under the two-class method for the year ended December 31, 2009. Total earnings available to unvested restricted stock include distributed earnings of $564,000, or $1.58 per weighted average share, and undistributed earnings of $468,000, or $1.31 per weighted average share for the year ended December 31, 2008. |
| (3) | Weighted average basic shares outstanding include 498,692, 457,213 and 357,114 shares of unvested restricted stock for the years ended December 31, 2010, 2009 and 2008, respectively. |
For the years ended December 31, 2010, 2009, and 2008, the calculations for basic shares outstanding exclude: (a) the weighted average shares owned by the Recognition and Retention Plan (“RRP”) of 560,767, 513,107, and 391,230, respectively, and (b) the weighted average shares in Treasury Stock of 1,256,418, 1,569,063, and 1,884,549, respectively.
The effect from the assumed exercise of 477,665, 696,026, and 373,390 stock options was not included in the computation of diluted earnings per share for the years ended December 31, 2010, 2009, and 2008, respectively, because such amounts would have had an antidilutive effect on earnings per share.
NOTE 3 – ACQUISITION ACTIVITY
FDIC-assisted purchase and assumption of assets and liabilities of CapitalSouth Bank, Orion Bank, and Century Bank, FSB
IBERIABANK entered into three purchase and assumption agreements with loss share arrangements with the Federal Deposit Insurance Corporation (“FDIC”) as receiver during 2009. As part of these agreements, the FDIC also granted IBERIABANK an option to purchase at appraised value the premises, furniture, fixtures, and equipment of the acquired institutions and assume the leases associated with these offices.
On August 21, 2009, IBERIABANK acquired certain assets, assumed all of the deposits, and assumed certain other liabilities of CapitalSouth Bank, Birmingham, Alabama (“CSB”) from the FDIC in a whole-bank acquisition of CSB, a full-service commercial bank headquartered in Birmingham, Alabama. IBERIABANK now operates ten former CSB branches in four Metropolitan Statistical Areas (“MSAs”): Birmingham, Montgomery, and Huntsville, Alabama, and Jacksonville, Florida.
On November 13, 2009, IBERIABANK acquired certain assets and assumed certain deposit and other liabilities of Orion Bank (“Orion”) from the FDIC in a whole-bank acquisition of Orion, a full-service Florida-chartered commercial bank headquartered in Naples, Florida. IBERIABANK now operates 23 former Orion branches in five MSAs: Naples, Sarasota, Fort Myers, and Palm Beach, Florida, as well as the Florida Keys.
Also on November 13, 2009, IBERIABANK acquired certain assets and assumed certain deposit and other liabilities of Century Bank, FSB (“Century”) in a whole-bank acquisition of Century, a full-service federal thrift headquartered in Sarasota, Florida. IBERIABANK now operates 11 former Century branches in two Florida MSAs: Sarasota and Bradenton.
The acquisitions were accounted for under the purchase method of accounting in accordance with ASC Topic 805. The net assets acquired as of August 21, 2009 for CSB and November 13, 2009 for Orion and Century, as well as the gains recorded on the transactions (total equity as shown in the table), are presented in the following table. Both the purchased assets and liabilities assumed were recorded at their respective acquisition date fair values. Identifiable intangible assets, all of which represented core deposit intangible assets, were recorded at fair value. Because the fair value of assets acquired and intangible assets created as a result of the acquisitions exceeded the fair value of liabilities assumed, the provisions of ASC 805 allow the Company to record a gain resulting from the acquisitions in its consolidated statements of income for the year ended December 31, 2009 and December 31, 2010. The gains totaled $242,673,000, of which $3,781,000 is included in noninterest income on the Company’s consolidated statements of income for the year ended December 31, 2010, and $238,893,000 is included in noninterest income for the year ended December 31, 2009. The gain in the current year is a result of additional settlement items between the FDIC and the Company. During the current year, the FDIC reimbursed the Company for items the Company deemed uncollectible. As a result of the gains recorded on the transactions, the Company recorded a deferred tax liability of $91,974,000 in its consolidated balance sheet at the acquisition dates and an additional $1,456,000 during 2010 for its estimate of the federal and state income tax expense incurred in the transactions.
The loans and other real estate owned acquired are covered by loss share agreements between IBERIABANK and the FDIC which afford IBERIABANK significant protection against future losses. Under the agreements, the FDIC will cover 80% of losses on the disposition of loans and OREO up to certain thresholds presented in the following table, and 95% of losses that exceed these thresholds. The term for loss sharing on single-family residential real estate loans is ten years, while the term for loss sharing on non-residential loans is five years and IBERIABANK reimbursement to the FDIC for a total of eight years for recoveries. The reimbursable losses from the FDIC are based on the book value of the relevant loans as determined by the FDIC at the date of the transaction. New loans made after that date are not covered by the provisions of the loss share agreements. As part of the agreements, IBERIABANK has recorded a receivable from the FDIC that represents the estimated fair value of the FDIC’s portion of the losses that are expected to be incurred and reimbursed to the Company. The following table also presents the value of the receivables at the respective acquisition dates.
| (dollars in thousands) | Loss Threshold |
80% of Loss Threshold |
Value of Loss Share Receivable |
|||||||||
| CapitalSouth |
$ | 135,000 | $ | 108,000 | $ | 88,093 | ||||||
| Orion |
550,000 | 440,000 | 711,756 | |||||||||
| Century |
285,000 | 228,000 | 232,053 | |||||||||
| Total |
$ | 970,000 | $ | 776,000 | $ | 1,031,902 | ||||||
Subsequent to the acquisition, the adequacy of the allowance for loan losses for loans acquired in FDIC-assisted transactions is determined with consideration given to the amounts recoverable through loss sharing agreements (since the acquired loans were recorded at estimated recoverable amounts). The provision for loan losses on these covered assets represents expected losses above the estimated losses inherent in the portfolio at acquisition.
Due to the significant fair value adjustments recorded, as well as the nature of the FDIC loss sharing agreements in place, CSB, Orion, and Century historical results are not believed to be relevant to the Company’s results, and thus no pro forma information is presented.
The acquired assets and liabilities are presented in the following table at fair value at each entity’s respective acquisition date. Cash acquired from the FDIC is included as a component of other assets to arrive at the total assets acquired.
| (dollars in thousands) | CapitalSouth | Orion | Century | Total | ||||||||||||
| Assets |
||||||||||||||||
| Investment securities |
$ | 46,649 | $ | 230,968 | $ | 22,128 | $ | 299,745 | ||||||||
| Loans |
362,723 | 961,094 | 417,561 | 1,741,378 | ||||||||||||
| Other real estate owned |
10,244 | 28,505 | 21,150 | 59,899 | ||||||||||||
| Core deposit intangible |
377 | 10,421 | 2,243 | 13,041 | ||||||||||||
| FDIC loss share receivable |
88,093 | 711,756 | 232,053 | 1,031,902 | ||||||||||||
| Other assets |
102,805 | 430,494 | 116,874 | 650,173 | ||||||||||||
| Total Assets |
$ | 610,891 | $ | 2,373,238 | $ | 812,009 | $ | 3,796,138 | ||||||||
| Liabilities |
||||||||||||||||
| Interest-bearing deposits |
461,348 | 1,748,749 | 504,875 | 2,714,972 | ||||||||||||
| Noninterest-bearing deposits |
56,543 | 134,337 | 110,940 | 301,820 | ||||||||||||
| Borrowings |
30,613 | 344,690 | 143,006 | 518,309 | ||||||||||||
| Other liabilities |
4,916 | 15,642 | 1,586 | 22,144 | ||||||||||||
| Total Liabilities |
$ | 553,420 | $ | 2,243,418 | $ | 760,407 | $ | 3,557,245 | ||||||||
| Total Equity |
57,471 | 129,820 | 51,602 | 238,893 | ||||||||||||
| Total Liabilities and Equity |
$ | 610,891 | $ | 2,373,238 | $ | 812,009 | $ | 3,796,138 | ||||||||
FDIC-assisted purchase and assumption of assets and liabilities of Sterling Bank
On July 23, 2010, the Company announced IBERIABANK had entered into a purchase and assumption agreement with a loss share arrangement with the Federal Deposit Insurance Corporation, as receiver of Sterling Bank, a Florida state-chartered bank headquartered in Lantana, Florida (“Sterling”). IBERIABANK assumed certain deposits and other liabilities and acquired certain assets and now operates six former Sterling branches in southeast Florida.
The FDIC has granted IBERIABANK an option to purchase at appraised value the premises, furniture, fixtures, and equipment of Sterling and assume the leases associated with these offices. The Company had not exercised the option to purchase the assets at December 31, 2010, but anticipates exercising the option during the first quarter of 2011. Purchase of the assets will not have a material effect on the Company’s net asset position or results of operations.
Excluding certain immaterial consumer loans, the loans and other real estate owned acquired are covered by a loss share agreement between IBERIABANK and the FDIC which affords IBERIABANK significant protection against future losses. Under the agreement, the FDIC will cover 80% of losses on the disposition of covered loans and OREO. The term for loss sharing on single family residential real estate loans is 10 years, while the term for loss sharing on non-residential real estate loans is 8 years with respect to losses. The reimbursable losses from the FDIC are based on the book value of the relevant loans as determined by the FDIC at the date of the transaction. New loans made after that date are not covered by the provisions of the loss share agreement. IBERIABANK has recorded a receivable from the FDIC of $66,826,000, which represents the estimated fair value of the FDIC’s portion of the losses that are expected to be incurred and reimbursed to the Company.
The acquisition was accounted for under the purchase method of accounting in accordance with ASC Topic 805. Both the purchased assets and liabilities assumed were recorded at their respective acquisition date fair values. Identifiable intangible assets, including core deposit intangible assets, were recorded at fair value. The acquired assets and liabilities, as well as the adjustments to record the assets and liabilities at fair value, are presented in the following table. Cash paid to the FDIC is included in the fair value adjustments to arrive at the total assets acquired. Because the consideration paid to the FDIC was greater than the net fair value of the acquired assets and liabilities, the Company recorded goodwill as part of the acquisition.
| (dollars in thousands) | Acquired from the FDIC |
Fair Value Adjustments |
As recorded by IBERIABANK |
|||||||||
| Assets |
||||||||||||
| Cash and cash equivalents |
$ | 34,942 | $ | (10,808 | ) (a) | $ | 24,134 | |||||
| Investment securities |
53,551 | — | 53,551 | |||||||||
| Loans |
236,052 | (84,751 | ) (b) | 151,301 | ||||||||
| Other real estate owned |
6,148 | (423 | ) (c) | 5,725 | ||||||||
| Core deposit intangible |
— | 1,568 | (d) | 1,568 | ||||||||
| FDIC loss share receivable |
— | 66,826 | (e) | 66,826 | ||||||||
| Goodwill |
— | 7,148 | 7,148 | |||||||||
| Other assets |
3,965 | — | 3,965 | |||||||||
| Total Assets |
$ | 334,658 | $ | (20,440 | ) | $ | 314,218 | |||||
| Liabilities |
||||||||||||
| Interest-bearing deposits |
257,922 | 2,828 | (f) | 260,750 | ||||||||
| Noninterest-bearing deposits |
26,264 | — | 26,264 | |||||||||
| Borrowings |
24,124 | 2,171 | (g) | 26,295 | ||||||||
| Other liabilities |
909 | — | 909 | |||||||||
| Total Liabilities |
$ | 309,219 | $ | 4,999 | $ | 314,218 | ||||||
| Total Equity |
— | |||||||||||
| Total Liabilities and Equity |
$ | 314,218 | ||||||||||
Explanation of certain fair value adjustments
| (a) | The adjustment represents the cash paid to the FDIC as settlement of the purchase and assumption agreement. |
| (b) | The adjustment represents the write down of the book value of Sterling’s loans to their estimated fair value based on expected cash flows which includes an estimate of expected future loan losses. |
| (c) | The adjustment represents the write down of the book value of Sterling’s OREO properties to their estimated fair value at the acquisition date based on their appraised value, as adjusted for costs to sell. |
| (d) | The adjustment represents the value of the core deposit base assumed in the acquisition. The core deposit asset was recorded as an identifiable intangible asset and will be amortized on an accelerated basis over the average life of the deposit base, estimated to be ten years. |
| (e) | The adjustment is to record the fair value of the amount the Company estimates it will receive from the FDIC under its loss sharing arrangement. The value of the receivable represents the fair value of expected cash flows as a result of future loan losses. |
| (f) | The adjustment is necessary because the weighted average interest rate of Sterling’s CD’s exceeded the cost of similar funding at the time of acquisition. The fair value adjustment will be amortized to reduce interest expense on a declining basis over the life of the portfolio, which is estimated at 60 months. |
| (g) | The adjustment is necessary because the interest rate of Sterling’s fixed rate borrowings exceeded current interest rates on similar borrowings. The Company paid off the borrowings acquired from Sterling during 2010 and amortized the fair value adjustment to reduce interest expense in the corresponding period. |
Subsequent to the acquisition, the allowance for loan losses for loans acquired in FDIC-assisted transactions is determined without giving consideration to the amounts recoverable through loss sharing agreements (since the loss sharing agreement are separately accounted for and thus presented “gross” on the balance sheet). The provision for loan losses is reported net of changes in the amount recoverable under the loss sharing agreements.
The Company’s operating results for the year ended December 31, 2010 include the operating results of the acquired assets and assumed liabilities for the 161 days subsequent to the July 23, 2010 acquisition date. The interest income from the loan assets acquired totaled $5,033,000 for the 161-day period. Due to the significant fair value adjustments recorded, as well as the nature of the FDIC loss sharing agreement in place, Sterling’s historical results are not believed to be relevant to the Company’s results, and thus no pro forma information is presented.
During the year ended December 31, 2010, the Company paid $8,626,000 in identifiable expenses for the CSB, Orion, Century, and Sterling acquisitions. These expenses included system conversion expenses, salaries and personnel costs of temporary employees, travel expenses, and legal and professional services. These costs were expensed as incurred and are included in noninterest expense on the Company’s statements of income. During the year ended December 31, 2009, the Company paid $3,691,000 in similar expenses for the CSB, Orion, and Century acquisitions.
Acquisition of OMNI Bancshares, Inc. subsequent to December 31, 2010
On February 22, 2011, the Company announced the signing of a definitive agreement to acquire OMNI BANCSHARES, Inc. (“OMNI”), the holding company of OMNI BANK, headquartered in Metairie, Louisiana with 14 offices in the New Orleans and Baton Rouge, LA markets. Based on available information, at December 31, 2010, OMNI had total assets of $735 million, including total loans of $517 million, and total deposits of $646 million.
Under terms of the agreement, shareholders of OMNI will receive 0.3313 shares of the Company’s common stock per share of OMNI common stock, subject to certain adjustments. The agreement has been approved by the Board of Directors of each company and is expected to close in the second quarter of 2011. Completion of the transaction is subject to customary closing conditions, including the receipt of required regulatory approvals and the approval of OMNI shareholders.
Because of the date of the agreement, an estimate of the impact of the acquisition on the Company’s subsequent consolidated financial statements cannot be made at this time.
Purchase of certain assets of Florida Trust Company subsequent to December 31, 2010
On February 22, 2011, the Company announced the signing of a definitive agreement for IBERIABANK to purchase certain assets of the Florida Trust Company, a wholly-owned subsidiary of the Bank of Florida Corporation. Florida Trust Company operates offices in Naples and Ft. Lauderdale, Florida. The Florida Trust Company will become part of the trust and asset management division of IBERIABANK.
Under terms of the agreement, IBERIABANK will pay the Bank of Florida Corporation $0.7 million and a contingent payment of up to $0.7 million for the acquisition of the assets of Florida Trust Company. The contingent payment will be paid approximately one year after the consummation of the transaction and will be determined based on the amount of revenue realized by IBERIABANK during that period generated from the former Florida Trust Company clients.
Because of the date of the agreement, an estimate of the impact of the acquisition on the Company’s subsequent consolidated financial statements cannot be made at this time.
NOTE 4 – INVESTMENT SECURITIES
The amortized cost and fair values of investment securities, with gross unrealized gains and losses, consist of the following:
| (dollars in thousands) | Amortized Cost |
Gross Unrealized Gains |
Gross Unrealized Losses |
Fair Value |
||||||||||||
| December 31, 2010 |
||||||||||||||||
| Securities available for sale: |
||||||||||||||||
| U.S. Government-sponsored enterprise obligations |
$ | 424,180 | $ | 2,414 | $ | (3,794 | ) | $ | 422,800 | |||||||
| U.S. Treasury securities |
— | — | — | — | ||||||||||||
| Obligations of state and political subdivisions |
39,896 | 668 | (395 | ) | 40,169 | |||||||||||
| Mortgage backed securities |
1,255,624 | 19,508 | (11,263 | ) | 1,263,869 | |||||||||||
| Other securities |
2,882 | 74 | — | 2,956 | ||||||||||||
| Total securities available for sale |
$ | 1,722,582 | $ | 22,664 | $ | (15,452 | ) | $ | 1,729,794 | |||||||
| Securities held to maturity: |
||||||||||||||||
| U.S. Government-sponsored enterprise obligations |
$ | 180,479 | $ | 2,549 | $ | (68 | ) | $ | 182,960 | |||||||
| Obligations of state and political subdivisions |
75,768 | 480 | (1,728 | ) | 74,520 | |||||||||||
| Mortgage backed securities |
33,773 | 741 | — | 34,514 | ||||||||||||
| Total securities held to maturity |
$ | 290,020 | $ | 3,770 | $ | (1,796 | ) | $ | 291,994 | |||||||
| December 31, 2009 |
||||||||||||||||
| Securities available for sale: |
||||||||||||||||
| U.S. Government-sponsored enterprise obligations |
$ | 240,611 | $ | 1,156 | $ | (599 | ) | $ | 241,168 | |||||||
| U.S. Treasury securities |
4,998 | 1 | — | 4,999 | ||||||||||||
| Obligations of state and political subdivisions |
50,317 | 887 | (744 | ) | 50,460 | |||||||||||
| Mortgage backed securities |
1,006,223 | 20,481 | (5,765 | ) | 1,020,939 | |||||||||||
| Other securities |
2,878 | 32 | — | 2,910 | ||||||||||||
| Total securities available for sale |
$ | 1,305,027 | $ | 22,557 | $ | (7,108 | ) | $ | 1,320,476 | |||||||
| Securities held to maturity: |
||||||||||||||||
| U.S. Government-sponsored enterprise obligations |
$ | 155,713 | $ | 123 | $ | (126 | ) | $ | 155,710 | |||||||
| Obligations of state and political subdivisions |
65,540 | 987 | (288 | ) | 66,239 | |||||||||||
| Mortgage backed securities |
39,108 | 180 | (439 | ) | 38,849 | |||||||||||
| Total securities held to maturity |
$ | 260,361 | $ | 1,290 | $ | (853 | ) | $ | 260,798 | |||||||
Securities with carrying values of $1,230,358,000 and $1,210,189,000 were pledged to secure public deposits and other borrowings at December 31, 2010 and 2009, respectively.
Management evaluates securities for other-than-temporary impairment at least quarterly, and more frequently when economic or market concerns warrant such evaluation. Consideration is given to 1) the length of time and the extent to which the fair value has been less than amortized cost, 2) the financial condition and near-term prospects of the issuer, and 3) the intent and ability of the Company to retain its investment in the issuer for a period of time sufficient to allow for any anticipated recovery in fair value
above amortized cost. In analyzing an issuer’s financial condition, management considers whether the securities are issued by the federal government or its agencies, whether downgrades by bond rating agencies have occurred, and industry analysts’ reports.
Information pertaining to securities with gross unrealized losses at December 31, 2010 and 2009, aggregated by investment category and length of time that individual securities have been in a continuous loss position, follows:
| Less Than Twelve Months | Over Twelve Months | Total | ||||||||||||||||||||||
| (dollars in thousands) | Gross Unrealized Losses |
Fair Value |
Gross Unrealized Losses |
Fair Value |
Gross Unrealized Losses |
Fair Value |
||||||||||||||||||
| December 31, 2010 |
||||||||||||||||||||||||
| Securities available for sale: |
||||||||||||||||||||||||
| U.S. Government-sponsored enterprise obligations |
$ | (3,794 | ) | $ | 195,785 | $ | — | $ | — | $ | (3,794 | ) | $ | 195,785 | ||||||||||
| Obligations of state and political subdivisions |
(395 | ) | 6,771 | — | — | (395 | ) | 6,771 | ||||||||||||||||
| Mortgage backed securities |
(10,678 | ) | 528,280 | (585 | ) | 20,908 | (11,263 | ) | 549,188 | |||||||||||||||
| Total securities available for sale |
$ | (14,867 | ) | $ | 730,836 | $ | (585 | ) | $ | 20,908 | $ | (15,452 | ) | $ | 751,744 | |||||||||
| Securities held to maturity: |
||||||||||||||||||||||||
| U.S. Government-sponsored enterprise obligations |
$ | (68 | ) | $ | 7,075 | $ | — | $ | — | $ | (68 | ) | $ | 7,075 | ||||||||||
| Obligations of state and political subdivisions |
(1,526 | ) | 36,646 | (202 | ) | 1,128 | (1,728 | ) | 37,774 | |||||||||||||||
| Mortgage backed securities |
— | — | — | — | — | — | ||||||||||||||||||
| Total securities held to maturity |
$ | (1,594 | ) | $ | 43,721 | $ | (202 | ) | $ | 1,128 | $ | (1,796 | ) | $ | 44,849 | |||||||||
| December 31, 2009 |
||||||||||||||||||||||||
| Securities available for sale: |
||||||||||||||||||||||||
| U.S. Government-sponsored enterprise obligations |
$ | (599 | ) | $ | 51,228 | $ | — | $ | — | $ | (599 | ) | $ | 51,228 | ||||||||||
| Obligations of state and political subdivisions |
(35 | ) | 7,137 | (709 | ) | 2,500 | (744 | ) | 9,637 | |||||||||||||||
| Mortgage backed securities |
(5,765 | ) | 317,222 | — | 22 | (5,765 | ) | 317,244 | ||||||||||||||||
| Total securities available for sale |
$ | (6,399 | ) | $ | 375,587 | $ | (709 | ) | $ | 2,522 | $ | (7,108 | ) | $ | 378,109 | |||||||||
| Securities held to maturity: |
||||||||||||||||||||||||
| U.S. Government-sponsored enterprise obligations |
$ | (126 | ) | $ | 45,575 | $ | — | $ | — | $ | (126 | ) | $ | 45,575 | ||||||||||
| Obligations of state and political subdivisions |
(276 | ) | 12,772 | (12 | ) | 234 | (288 | ) | 13,006 | |||||||||||||||
| Mortgage backed securities |
(439 | ) | 15,212 | — | — | (439 | ) | 15,212 | ||||||||||||||||
| Total securities held to maturity |
$ | (841 | ) | $ | 73,559 | $ | (12 | ) | $ | 234 | $ | (853 | ) | $ | 73,793 | |||||||||
At December 31, 2010, 142 debt securities have unrealized losses of 2.1% of the securities’ amortized cost basis and 0.9% of the Company’s total amortized cost basis. The unrealized losses for each of the 142 securities relate to market interest rate changes. Ten of the 142 securities have been in a continuous loss position for over twelve months. These ten securities have an aggregate amortized cost basis and unrealized loss of $22,822,000 and $787,000, respectively. The ten securities were issued by either Federal National Mortgage Association (Fannie Mae), Federal Home Loan Mortgage Corporation (Freddie Mac) or by state and political subdivisions (Municipals). The Fannie Mae and Freddie Mac securities are rated AAA.
At December 31, 2009, 163 debt securities have unrealized losses of 1.8% of the securities’ amortized cost basis and 0.5% of the Company’s total amortized cost basis. The unrealized losses for each of the 163 securities relate principally to market interest rate changes. Six of the 163 securities have been in a continuous loss position for over twelve months. These six securities have an aggregate amortized cost basis and unrealized loss of $3,477,000 and $722,000, respectively. The six securities were issued by either Federal National Mortgage Association (Fannie Mae), Federal Home Loan Mortgage Corporation (Freddie Mac) or by state and political subdivisions (Municipals). The Fannie Mae and Freddie Mac securities are rated AAA.
The Company has assessed the nature of the losses in its portfolio as of December 31, 2010 and 2009 to determine if there are losses that are deemed other-than-temporary. In its analysis of these securities, management considered numerous factors to determine whether there were instances where the amortized cost basis of the debt securities would not be fully recoverable, including, but not limited to:
| • | the length of time and extent to which the fair value of the securities was less than their amortized cost, |
| • | whether adverse conditions were present in the operations, geographic area, or industry of the issuer, |
| • | the payment structure of the security, including scheduled interest and principal payments, including the issuer’s failures to make scheduled payments, if any, and the likelihood of failure to make scheduled payments in the future, |
| • | changes to the rating of the security by a rating agency, and |
| • | subsequent recoveries or additional declines in fair value after the balance sheet date. |
Management believes it has considered these factors, as well as all relevant information available, when determining the expected future cash flows of the securities in question. Except for the bond discussed below, in each instance, management has determined the cost basis of the securities would be fully recoverable. Management also has the intent and ability to hold debt securities until their maturity or anticipated recovery if the security is classified as available for sale. In addition, management does not believe the Company will be required to sell debt securities before the anticipated recovery of the amortized cost basis of the security.
During 2010, management assessed the operating environment of a bond issuer as adverse and thus concluded that the Company had one unrated revenue municipal bond that warranted a $517,000 other-than-temporary impairment charge during the year ended December 31, 2010. The specific impairment was related to the loss of the contracted revenue source required for bond repayment. The bond was acquired in 2007 and was impaired 10% during the year ended December 31, 2007 based on significant delays in construction of the project. The additional charge in the current period brings the total impairment to 30% of the par value of the bond and provides a fair value of the bonds that is consistent with current market pricing. Because adverse conditions were noted in the operations of the bond issuer, the Company recorded the other-than-temporary impairment, but notes the bond does have insurance coverage from one of the remaining monoline insurers and the Company is current on its receipt of interest related to the bonds. As a result of the Company’s analysis, no other declines in the market value of the Company’s investment securities are deemed to be other-than-temporary at December 31, 2010. The Company did not record an other-than-temporary impairment charge for the year ended December 31, 2009.
The amortized cost and estimated fair value by maturity of investment securities at December 31, 2010 are shown in the following table. Securities are classified according to their contractual maturities without consideration of principal amortization, potential prepayments or call options. Accordingly, actual maturities may differ from contractual maturities.
| Securities Available for Sale |
Securities Held to Maturity |
|||||||||||||||||||||||
| (dollars in thousands) |
Weighted Average Yield |
Amortized Cost |
Fair Value |
Weighted Average Yield |
Amortized Cost |
Fair Value |
||||||||||||||||||
| Within one year or less |
1.01 | % | $ | 36,546 | $ | 36,696 | 3.92 | % | $ | 1,980 | $ | 1,983 | ||||||||||||
| One through five years |
1.98 | 292,416 | 294,651 | 2.14 | 187,944 | 190,551 | ||||||||||||||||||
| After five through ten years |
2.64 | 556,179 | 558,933 | 3.62 | 26,792 | 26,912 | ||||||||||||||||||
| Over ten years |
2.62 | 837,441 | 839,514 | 3.15 | 73,304 | 72,548 | ||||||||||||||||||
| Totals |
2.48 | % | $ | 1,722,582 | $ | 1,729,794 | 2.54 | % | $ | 290,020 | $ | 291,994 | ||||||||||||
The following is a summary of realized gains and losses from the sale of securities classified as available for sale.
| Years Ended December 31, | ||||||||||||
| (dollars in thousands) | 2010 | 2009 | 2008 | |||||||||
| Realized gains |
$ | 5,172 | $ | 6,775 | $ | 1,138 | ||||||
| Realized losses |
— | (40 | ) | (36 | ) | |||||||
| Net realized gains (losses) |
$ | 5,172 | $ | 6,735 | $ | 1,102 | ||||||
In addition to the gains above, the Company realized certain immaterial gains on the calls of held to maturity securities.
At December 31, 2010, the Company’s exposure to four investment security issuers individually exceeded 10% of shareholders’ equity:
| (dollars in thousands) | Amortized Cost | Market Value | ||||||
| Federal National Mortgage Association (Fannie Mae) |
$ | 978,765 | $ | 984,381 | ||||
| Federal Home Loan Bank |
203,453 | 203,922 | ||||||
| Government National Mortgage Association (Ginnie Mae) |
246,837 | 247,437 | ||||||
| Federal Home Loan Mortgage Corporation (Freddie Mac) |
449,539 | 452,593 | ||||||
| Total |
$ | 1,878,594 | $ | 1,888,333 | ||||
NOTE 5 – LOANS RECEIVABLE
Loans receivable at December 31, 2010 and 2009 consist of the following:
| (dollars in thousands) | 2010 | 2009 | ||||||
| Residential mortgage loans: |
||||||||
| Residential 1-4 family |
$ | 616,550 | $ | 975,395 | ||||
| Construction/ Owner Occupied |
14,822 | 32,857 | ||||||
| Total residential mortgage loans |
631,372 | 1,008,252 | ||||||
| Commercial loans: |
||||||||
| Real estate |
2,647,107 | 2,500,433 | ||||||
| Business |
1,515,856 | 1,217,326 | ||||||
| Total commercial loans |
4,162,963 | 3,717,759 | ||||||
| Consumer loans: |
||||||||
| Indirect automobile |
255,322 | 259,339 | ||||||
| Home equity |
834,840 | 649,821 | ||||||
| Other |
150,835 | 149,194 | ||||||
| Total consumer loans |
1,240,997 | 1,058,354 | ||||||
| Total loans receivable |
$ | 6,035,332 | $ | 5,784,365 | ||||
During 2010, the Company reclassified $149,665,000 in residential mortgage loans upon system conversion of the former Orion Bank to conform to the Company’s reporting guidelines. At the time, the reclassification increased the Company’s home equity, commercial business, and commercial real estate loans by $81,243,000, $61,911,000, and $6,511,000, respectively. The reclassification in the current year had no effect on the Company’s total loans receivable at December 31, 2009.
As discussed in Note 3 above, on August 21, 2009 the Company acquired substantially all of the assets and liabilities of CSB, and on November 13, 2009, acquired certain assets and assumed certain deposit and other liabilities of Orion and Century. On July 23, 2010, the Company acquired certain assets and assumed certain deposit and other liabilities of Sterling. The loans and foreclosed real estate that were acquired in these transactions are covered by loss share agreements between the FDIC and IBERIABANK, which afford IBERIABANK significant loss protection. Under the loss share agreements, the FDIC will cover 80% of covered loan and foreclosed real estate losses up to certain thresholds for all four acquisitions and 95% of losses that exceed those thresholds for CSB, Orion, and Century only.
Because of the loss protection provided by the FDIC, the risks of the CSB, Orion, Century, and Sterling loans and foreclosed real estate are significantly different from those assets not covered under the loss share agreement. Accordingly, the Company presents loans subject to the loss share agreements as “covered loans” in the information below and loans that are not subject to the loss share agreement as “non-covered loans.”
Non-covered Loans
The following is a summary of the major categories of non-covered loans outstanding as of December 31:
| (dollars in thousands) | ||||||||
| Non-covered loans | 2010 | 2009 | ||||||
| Residential mortgage loans: |
||||||||
| Residential 1-4 family |
$ | 355,164 | $ | 434,956 | ||||
| Construction/ Owner Occupied |
14,822 | 18,198 | ||||||
| Total residential mortgage loans |
369,986 | 453,154 | ||||||
| Commercial loans: |
||||||||
| Real estate |
1,781,744 | 1,660,434 | ||||||
| Business |
1,341,352 | 1,086,172 | ||||||
| Total commercial loans |
3,123,096 | 2,746,606 | ||||||
| Consumer loans: |
||||||||
| Indirect automobile |
255,322 | 259,339 | ||||||
| Home equity |
555,749 | 512,087 | ||||||
| Other |
148,432 | 142,713 | ||||||
| Total consumer loans |
959,503 | 914,139 | ||||||
| Total non-covered loans receivable |
$ | 4,452,585 | $ | 4,113,899 | ||||
The following table provides an analysis of the aging of non-covered loans as of December 31, 2010.
| Past Due | ||||||||||||||||||||||||||||
| (dollars in thousands) | 30-59 days |
60-89 days |
Greater than 90 days |
Total past due |
Current | Total loans, net of unearned income |
Recorded investment > 90 days and accruing |
|||||||||||||||||||||
| December 31, 2010 |
||||||||||||||||||||||||||||
| Residential |
||||||||||||||||||||||||||||
| Prime |
$ | 421 | $ | 1,002 | $ | 6,196 | $ | 7,620 | $ | 362,366 | $ | 369,986 | $ | 280 | ||||||||||||||
| Subprime |
— | — | — | — | — | — | — | |||||||||||||||||||||
| Commercial |
||||||||||||||||||||||||||||
| Real Estate - Construction |
— | 486 | 9,850 | 10,336 | 254,912 | 265,248 | 13 | |||||||||||||||||||||
| Real Estate- Other |
3,568 | 1,975 | 24,788 | 30,331 | 1,486,165 | 1,516,496 | 1,018 | |||||||||||||||||||||
| Commercial Business |
406 | — | 1,993 | 2,399 | 1,338,953 | 1,341,352 | 144 | |||||||||||||||||||||
| Consumer |
||||||||||||||||||||||||||||
| Indirect Automobile |
1,002 | 165 | 1,046 | 2,213 | 253,109 | 255,322 | — | |||||||||||||||||||||
| Home Equity |
2,464 | 1,199 | 986 | 4,648 | 551,101 | 555,749 | — | |||||||||||||||||||||
| Credit Card |
146 | 94 | 378 | 618 | 42,298 | 42,916 | — | |||||||||||||||||||||
| Other |
303 | 80 | 5,713 | 6,096 | 99,420 | 105,516 | — | |||||||||||||||||||||
| Total |
$ | 8,310 | $ | 5,001 | $ | 50,950 | $ | 64,261 | $ | 4,388,324 | $ | 4,452,585 | $ | 1,455 | ||||||||||||||
Included in certain loan categories in the table above are troubled debt restructurings (“TDRs”) of $17,471,000 at December 31, 2010. Of that amount, $10,215,000 were current and $7,257,000 were past due.
All TDRs at December 31, 2010 were commercial loans, including $1,047,000 of construction loans, $16,368,000 of commercial real estate loans, and $56,000 of commercial business loans.
The Company had no TDRs on its non-covered loan portfolio at December 31, 2009.
The following table provides an analysis of non-covered loans on nonaccrual status at December 31, 2010 and 2009.
| (dollars in thousands) | 2010 | 2009 | ||||||
| Residential |
||||||||
| Prime |
$ | 5,916 | $ | 3,313 | ||||
| Subprime |
— | — | ||||||
| Commercial |
||||||||
| Real Estate - Construction |
9,837 | 5,575 | ||||||
| Real Estate- Other |
23,770 | 24,567 | ||||||
| Commercial Business |
1,849 | 887 | ||||||
| Consumer |
||||||||
| Indirect Automobile |
1,046 | 996 | ||||||
| Home Equity |
986 | — | ||||||
| Credit Card |
378 | — | ||||||
| Other |
5,714 | 4,508 | ||||||
| Total |
$ | 49,496 | $ | 39,847 | ||||
The nonaccrual loans in the table above include $2,504,000 of TDRs on nonaccrual status at December 31, 2010. At December 31, 2009, the Company had no TDRs on nonaccrual status.
The amount of interest income that would have been recorded in 2010, 2009 and 2008 if total nonaccrual loans had been current in accordance with their original terms was approximately $2,198,000, 1,388,000, and $1,244,000, respectively.
Covered Loans
Loans acquired are recorded at fair value in accordance with the fair value methodology prescribed in ASC Topic 820, exclusive of the shared-loss agreements with the FDIC. The fair value estimates associated with the loans include estimates related to expected prepayments and the amount and timing of undiscounted expected principal, interest and other cash flows. At the time of acquisition, the Company estimated the fair value of the total acquired loan portfolio by segregating the total portfolio into loan pools with similar characteristics, which included:
| • | whether the loan was performing according to contractual terms at the time of acquisition |
| • | the loan type based on regulatory reporting guidelines, namely whether the loan was a mortgage, consumer, or commercial loan |
| • | the nature of collateral |
| • | the interest rate type, whether fixed or variable rate |
| • | the loan payment type, primarily whether the loan was amortizing or interest-only |
From these pools, the Company used certain loan information, including outstanding principal balance, estimated expected losses, weighted average maturity, weighted average term to re-price (if a variable rate loan), weighted average margin, and weighted average interest rate to estimate the expected cash flow for each loan pool.
Over the life of the acquired loans, the Company continues to estimate cash flows expected to be collected on each loan pool. The Company evaluates, at each balance sheet date, whether the present value of the cash flows from the loan pools, determined using the effective interest rates, has decreased and if so, recognizes a provision for loan loss in its consolidated statement of income. For any increases in cash flows expected to be collected, the Company adjusts the amount of accretable yield recognized on a prospective basis over the loan’s or pool’s remaining life. During the year ended December 31, 2010, the Company increased its allowance for loan losses $73,819,000 to reserve for estimated additional losses in a limited number of loan pools at December 31, 2010. The increase in the allowance was recorded by a charge to the provision for loan losses of $8,897,000 and an increase of $64,922,000 in its indemnification asset for the portion of the losses recoverable from the FDIC in accordance with the loss sharing agreements.
The carrying amount of the acquired covered loans at December 31, 2010 and 2009 consisted of loans determined to be impaired at the time of acquisition, which are accounted for in accordance with ASC Topic 310-30, and loans that were considered to be performing at the acquisition date, accounted for by analogy to ASC Topic 310-30, as detailed in the following tables.
| (dollars in thousands) | December 31, 2010 | |||||||||||
| Covered loans |
ASC 310-30 Loans |
Non- ASC
310-30 Loans |
Total Covered Loans |
|||||||||
| Residential mortgage loans: |
||||||||||||
| Residential 1-4 family |
$ | 50,566 | $ | 210,820 | $ | 261,386 | ||||||
| Construction/ Owner Occupied |
— | — | — | |||||||||
| Total residential mortgage loans |
50,566 | 210,820 | 261,386 | |||||||||
| Commercial loans: |
||||||||||||
| Real estate |
146,331 | 719,032 | 865,363 | |||||||||
| Business |
6,119 | 168,385 | 174,504 | |||||||||
| Total commercial loans |
152,450 | 887,417 | 1,039,867 | |||||||||
| Consumer loans: |
||||||||||||
| Indirect automobile |
— | — | — | |||||||||
| Home equity |
59,689 | 219,402 | 279,091 | |||||||||
| Other |
543 | 1,860 | 2,403 | |||||||||
| Total consumer loans |
60,232 | 221,262 | 281,494 | |||||||||
| Total covered loans receivable |
$ | 263,248 | $ | 1,319,499 | $ | 1,582,747 | ||||||
| (dollars in thousands) | December 31, 2009 | |||||||||||
| Covered loans |
ASC
310-30 Loans |
Non- ASC
310-30 Loans |
Total Covered Loans |
|||||||||
| Residential mortgage loans: |
||||||||||||
| Residential 1-4 family |
$ | 108,453 | $ | 431,986 | $ | 540,439 | ||||||
| Construction/ Owner Occupied |
4,256 | 10,403 | 14,659 | |||||||||
| Total residential mortgage loans |
112,709 | 442,389 | 555,098 | |||||||||
| Commercial loans: |
||||||||||||
| Real estate |
71,716 | 768,283 | 839,999 | |||||||||
| Business |
363 | 130,791 | 131,154 | |||||||||
| Total commercial loans |
72,079 | 899,074 | 971,153 | |||||||||
| Consumer loans: |
||||||||||||
| Indirect automobile |
— | — | — | |||||||||
| Home equity |
8,575 | 129,159 | 137,734 | |||||||||
| Other |
1,251 | 5,230 | 6,481 | |||||||||
| Total consumer loans |
9,826 | 134,389 | 144,215 | |||||||||
| Total covered loans receivable |
$ | 194,614 | $ | 1,475,852 | $ | 1,670,466 | ||||||
Included in certain loan categories in the table above are troubled debt restructurings (“TDRs”) of $84,851,000 at December 31, 2010. Of that amount, $31,917,000 were current and $52,934,000 were past due. Of the past due TDRs, $49,673,000 were on nonaccrual status at December 31, 2010.
At December 31, 2010, the Company had $11,032,000 in mortgage loans, $51,121,000 in commercial real estate loans, $3,566,000 in commercial business loans, $19,084,000 in home equity loans, and $48,000 in other consumer loans classified as TDRs.
ASC 310-30 loans
The Company acquired certain impaired loans through the CSB, Orion, Century, Pulaski Investment Corporation (“PIC”), and Pocahontas Bancorp, Inc. (“Pocahontas”) acquisitions which are subject to ASC Topic 310-30. The Company’s allowance for loan losses for all acquired loans subject to ASC Topic 310-30 would reflect only those losses incurred after acquisition.
Revision of disclosure from the prior year
We have revised our historical consolidated financial statements for the year ended December 31, 2009 to amend disclosure of the amount of nonaccretable difference and accretable yield for loans acquired in the CSB, Orion, and Century acquisitions during 2009 which are subject to ASC Topic 310-30. The result of this revision is an increase in the amount of nonaccretable difference and accretable yield being disclosed. This revision has no impact on previously recorded amounts for interest income, net income, total assets or equity as IBERIABANK used two separate methods to calculate and record actual entries to its financial statements and to determine accretable and non accretable yield reported in the disclosure. The information included in these notes to the consolidated financial statements sets forth the effects of this revision on the previously reported disclosure contained in the consolidated financial statements for the year ended December 31, 2009.
The following is a summary of the loans acquired in the CSB, Orion, and Century acquisitions during 2009 as previously reported and as revised.
| (dollars in thousands) | As Previously Reported |
Adjustment | As Adjusted | |||||||||
| Loans acquired subject to ASC Topic 310-30 |
||||||||||||
| Contractually required principal and interest at acquisition |
$ | 3,283,960 | $ | 142,224 | $ | 3,426,184 | ||||||
| Nonaccretable difference (expected losses and foregone interest) |
(1,519,619 | ) | 86,007 | (1,433,612 | ) | |||||||
| Cash flows expected to be collected at acquisition |
1,764,341 | 228,231 | 1,992,572 | |||||||||
| Accretable yield |
(22,569 | ) | (228,231 | ) | (250,800 | ) | ||||||
| Basis in acquired loans at acquisition |
$ | 1,741,772 | $ | — | $ | 1,741,772 | ||||||
The following is a summary of the loans acquired as of the dates of acquisition. Loans acquired in 2007 include impaired loans acquired from PIC and Pocahontas. Loans acquired in 2009 include loans acquired from CSB, Orion, and Century, while loans acquired in 2010 were part of the Sterling acquisition.
| (dollars in thousands) | 2007 | 2009 | 2010 | Total | ||||||||||||
| Contractually required principal and interest at acquisition |
$ | 18,688 | $ | 3,426,184 | $ | 254,977 | $ | 3,699,849 | ||||||||
| Nonaccretable difference (expected losses and foregone interest) |
(5,718 | ) | (1,433,612 | ) | (92,726 | ) | (1,532,056 | ) | ||||||||
| Cash flows expected to be collected at acquisition |
12,970 | 1,992,572 | 162,251 | 2,167,793 | ||||||||||||
| Accretable yield |
(2,087 | ) | (250,800 | ) | (11,050 | ) | (263,937 | ) | ||||||||
| Basis in acquired loans at acquisition |
$ | 10,883 | $ | 1,741,772 | $ | 151,201 | $ | 1,903,856 | ||||||||
The carrying amount of the loans acquired during 2010 consisted of loans determined to be impaired at the time of acquisition, which are accounted for in accordance with ASC Topic 310-30, and loans that were considered to be performing at the acquisition date, accounted for by analogy to ASC Topic 310-30, as detailed in the following table.
| (dollars in thousands) | Acquired Impaired Loans |
Acquired Performing Loans |
Total Covered Loans |
|||||||||
| Contractually required principal and interest at acquisition |
$ | 49,823 | $ | 205,154 | $ | 254,977 | ||||||
| Nonaccretable difference (expected losses and foregone interest) |
(30,890 | ) | (61,836 | ) | (92,726 | ) | ||||||
| Cash flows expected to be collected at acquisition |
18,933 | 143,318 | 162,251 | |||||||||
| Accretable yield |
(207 | ) | (10,843 | ) | (11,050 | ) | ||||||
| Basis in acquired loans at acquisition |
$ | 18,726 | $ | 132,475 | $ | 151,201 | (1) | |||||
| (1) | Excludes overdraft balances included in total loans at the acquisition date. |
The following is a summary of changes in the accretable yields of acquired loans during 2010 and 2009.
| (dollars in thousands)
December 31, 2010 |
Acquired Impaired Loans |
Acquired Performing Loans |
Total Acquired Loan Portfolio |
|||||||||
| Balance, beginning of period |
$ | 6,598 | $ | 222,986 | $ | 229,584 | ||||||
| Additions due to acquisitions |
207 | 10,843 | 11,050 | |||||||||
| Transfers from nonaccretable difference to accretable yield |
89,217 | 520,364 | 609,581 | |||||||||
| Accretion |
(13,641 | ) | (128,003 | ) | (141,644 | ) | ||||||
| Balance, end of period |
$ | 82,381 | $ | 626,190 | $ | 708,571 | ||||||
| (dollars in thousands)
December 31, 2009 |
Acquired Impaired Loans |
Acquired Performing Loans |
Total Acquired Loan Portfolio |
|||||||||
| Balance, beginning of period |
$ | 317 | $ | — | $ | 317 | ||||||
| Additions due to acquisitions |
5,910 | 244,890 | 250,800 | |||||||||
| Transfers from nonaccretable difference to accretable yield |
432 | — | 432 | |||||||||
| Accretion |
(61 | ) | (21,904 | ) | (21,965 | ) | ||||||
| Balance, end of period |
$ | 6,598 | $ | 222,986 | $ | 229,584 | ||||||
The following is a summary of the year to date activity in the FDIC loss share receivable.
| (dollars in thousands) | December 31, | |||||||
| 2010 | 2009 | |||||||
| Balance, beginning of period |
$ | 1,034,734 | $ | — | ||||
| Acquisition |
66,826 | 1,031,902 | ||||||
| Increase due to a decrease in cash flow estimates |
64,922 | 44 | ||||||
| Amortization |
(13,024 | ) | 2,788 | |||||
| Submission of reimbursable losses to the FDIC |
(424,258 | ) | — | |||||
| Decrease due to an increase in cash flow estimates |
(2,329 | ) | ||||||
| Balance, end of period |
$ | 726,871 | $ | 1,034,734 | ||||
NOTE 6 – ALLOWANCE FOR LOAN LOSSES
A summary of changes in the allowance for loan losses, in total and by segment portfolio, for the years ended December 31, 2010, 2009 and 2008 is as follows:
| (dollars in thousands) | 2010 | 2009 | 2008 | |||||||||
| Balance, beginning of period |
$ | 55,768 | $ | 40,872 | $ | 38,285 | ||||||
| Provision charged to operations |
42,451 | 45,370 | 12,568 | |||||||||
| Provision recorded through FDIC loss share receivable |
64,922 | 147 | — | |||||||||
| Loans charged-off |
(33,858 | ) | (33,267 | ) | (12,882 | ) | ||||||
| Recoveries |
6,817 | 2,646 | 2,901 | |||||||||
| Balance, end of period |
$ | 136,100 | $ | 55,768 | $ | 40,872 | ||||||
| December 31, 2010 | ||||||||||||||||
| (dollars in thousands) | IBERIABANK | |||||||||||||||
| Covered Loans |
Non- covered loans |
IBERIABANK fsb | Total | |||||||||||||
| Balance, beginning of period |
$ | 145 | $ | 34,286 | $ | 21,337 | $ | 55,768 | ||||||||
| Provision for loan losses before benefit attributable to FDIC loss share agreements |
73,819 | 21,180 | 12,374 | 107,373 | ||||||||||||
| Benefit attributable to FDIC loss share agreements |
(64,922 | ) | — | — | (64,922 | ) | ||||||||||
| Net provision for loan losses |
8,897 | 21,180 | 12,374 | 42,451 | ||||||||||||
| Increase in FDIC loss share receivable |
64,922 | — | — | 64,922 | ||||||||||||
| Loans charged-off |
(325 | ) | (18,311 | ) | (15,222 | ) | (33,858 | ) | ||||||||
| Recoveries |
1 | 4,856 | 1,960 | 6,817 | ||||||||||||
| Balance, end of period |
$ | 73,640 | $ | 42,011 | $ | 20,449 | $ | 136,100 | ||||||||
| (dollars in thousands) | December 31, 2009 | |||||||||||||||
| IBERIABANK | ||||||||||||||||
| Covered Loans |
Non- covered loans |
IBERIABANK fsb | Total | |||||||||||||
| Balance, beginning of period |
$ | — | $ | 26,671 | $ | 14,201 | $ | 40,872 | ||||||||
| Provision for loan losses before benefit attributable to FDIC loss share agreements |
— | 18,577 | 26,793 | 45,370 | ||||||||||||
| Benefit attributable to FDIC loss share agreements |
— | — | — | — | ||||||||||||
| Net provision for loan losses |
— | 18,577 | 26,793 | 45,370 | ||||||||||||
| Increase in FDIC loss share receivable |
147 | — | — | 147 | ||||||||||||
| Loans charged-off |
(2 | ) | (12,957 | ) | (20,308 | ) | (33,267 | ) | ||||||||
| Recoveries |
— | 1,995 | 651 | 2,646 | ||||||||||||
| Balance, end of period |
$ | 145 | $ | 34,286 | $ | 21,337 | $ | 55,768 | ||||||||
A summary of changes in the allowance for loan losses for non-covered loans, by loan portfolio type, for the year ended December 31, 2010 is as follows:
| (dollars in thousands) | Commercial Real Estate |
Commercial Business |
Consumer | Mortgage | Unallocated | Total | ||||||||||||||||||
| December 31, 2010 |
||||||||||||||||||||||||
| Allowance for loan losses |
||||||||||||||||||||||||
| Balance, beginning of period |
$ | 30,771 | $ | 12,845 | $ | 10,664 | $ | 1,342 | $ | — | $ | 55,622 | ||||||||||||
| Provision for loan losses |
18,563 | 4,407 | 9,898 | 687 | — | 33,554 | ||||||||||||||||||
| Increase in FDIC loss share receivable |
— | — | — | — | — | — | ||||||||||||||||||
| Loans charged off |
(22,671 | ) | (914 | ) | (9,108 | ) | (840 | ) | — | (33,533 | ) | |||||||||||||
| Recoveries |
4,727 | 135 | 1,878 | 76 | — | 6,816 | ||||||||||||||||||
| Balance, end of period |
31,390 | 16,473 | 13,332 | 1,265 | — | 62,460 | ||||||||||||||||||
| Allowance on loans individually evaluated for impairment |
206 | — | — | — | — | 206 | ||||||||||||||||||
| Allowance on loans collectively evaluated for impairment |
31,184 | 16,473 | 13,332 | 1,265 | — | 62,254 | ||||||||||||||||||
| Loans, net of unearned income |
||||||||||||||||||||||||
| Balance, end of period |
$ | 1,781,744 | $ | 1,341,352 | $ | 959,503 | $ | 369,986 | $ | — | $ | 4,452,585 | ||||||||||||
| Balance, end of period: Loans individually evaluated for impairment |
29,222 | 4,955 | — | — | — | 34,177 | ||||||||||||||||||
| Balance, end of period: Loans collectively evaluated for impairment |
1,752,522 | 1,336,397 | 959,503 | 369,986 | — | 4,418,408 | ||||||||||||||||||
| Balance, end of period: Loans acquired with deteriorated credit quality |
645 | — | — | — | — | 645 | ||||||||||||||||||
| Loans, Net |
||||||||||||||||||||||||
A summary of changes in the allowance for loan losses for covered loans, by loan portfolio type, for the year ended December 31, 2010 is as follows:
| (dollars in thousands) | Commercial Real Estate |
Commercial Business |
Consumer | Mortgage | Unallocated | Total | ||||||||||||||||||
| December 31, 2010 |
||||||||||||||||||||||||
| Allowance for loan losses |
||||||||||||||||||||||||
| Balance, beginning of period |
$ | — | $ | — | $ | — | $ | 145 | $ | — | $ | 145 | ||||||||||||
| Provision for loan losses |
3,192 | 802 | 1,476 | 3,426 | — | 8,897 | ||||||||||||||||||
| Increase in FDIC loss share receivable |
23,294 | 5,855 | 10,773 | 25,000 | — | 64,922 | ||||||||||||||||||
| Loans charged off |
(49 | ) | — | (48 | ) | (228 | ) | — | (325 | ) | ||||||||||||||
| Recoveries |
1 | — | — | — | — | 1 | ||||||||||||||||||
| Balance, end of period |
26,439 | 6,657 | 12,201 | 28,343 | — | 73,640 | ||||||||||||||||||
| Loans, net of unearned income |
||||||||||||||||||||||||
| Balance, end of period |
$ | 865,363 | $ | 174,504 | $ | 281,494 | $ | 261,386 | $ | — | $ | 1,582,747 | ||||||||||||
| Balance, end of period: Loans individually evaluated for impairment |
— | — | — | — | — | — | ||||||||||||||||||
| Balance, end of period: Loans collectively evaluated for impairment |
865,363 | 174,504 | 281,494 | 261,386 | — | 1,582,747 | ||||||||||||||||||
| Balance, end of period: Loans acquired with deteriorated credit quality |
146,331 | 6,119 | 60,232 | 50,566 | — | 263,248 | ||||||||||||||||||
Credit Quality
The Company utilizes an asset risk classification system in compliance with guidelines established by the Federal Reserve Board as part of its efforts to improve commercial asset quality. “Special mention” loan are defined as loans that in management’s opinion are subject to potential future rating downgrades. For assets with identified credit issues, the Company has two primary classifications for problem assets: “substandard” and “doubtful.” Substandard assets have one or more defined weaknesses and are characterized by the distinct possibility that the Company will sustain some loss if the deficiencies are not corrected. Doubtful assets have the weaknesses of substandard assets with the additional characteristic that the weaknesses make collection or liquidation in full questionable and there is a high probability of loss based on currently existing facts, conditions and values.
The Company’s investment in non-covered loans by credit quality indicator for the years ended December 31, 2010 and 2009 is presented in the following table.
| (dollars in thousands) | Commercial Real Estate Construction |
Commercial Real Estate- Other |
Commercial Business | |||||||||||||||||||||
| Credit risk by internally assigned grade | 2010 | 2009 | 2010 | 2009 | 2010 | 2009 | ||||||||||||||||||
| Pass |
236,830 | 246,080 | 1,422,506 | 1,299,607 | 1,322,977 | 1,067,550 | ||||||||||||||||||
| Special Mention |
17,918 | 16,370 | 25,524 | 40,283 | 7,455 | 8,412 | ||||||||||||||||||
| Substandard |
10,204 | 15,317 | 68,005 | 42,777 | 8,105 | 10,210 | ||||||||||||||||||
| Doubtful |
296 | — | 461 | — | 2,815 | — | ||||||||||||||||||
| Total |
265,248 | 277,767 | 1,516,496 | 1,382,667 | 1,341,352 | 1,086,172 | ||||||||||||||||||
| Mortgage – Prime | Mortgage- Subprime | |||||||||||||||||||||||
| Credit risk by payment activity | 2010 | 2009 | 2010 | 2009 | ||||||||||||||||||||
| Current |
362,366 | 445,224 | — | — | ||||||||||||||||||||
| Past Due |
7,620 | 7,930 | — | — | ||||||||||||||||||||
| Total |
369,986 | 453,154 | — | — | ||||||||||||||||||||
| Indirect Automobile | Credit Card | |||||||||||||||||||||||
| Credit risk by payment activity | 2010 | 2009 | 2010 | 2009 | ||||||||||||||||||||
| Current |
253,109 | 256,246 | 42,298 | 42,444 | ||||||||||||||||||||
| Past Due |
2,213 | 3,093 | 618 | 533 | ||||||||||||||||||||
| Total |
255,322 | 259,339 | 42,916 | 42,977 | ||||||||||||||||||||
| Home Equity | Consumer - Other | |||||||||||||||||||||||
| Credit risk by payment activity | 2010 | 2009 | 2010 | 2009 | ||||||||||||||||||||
| Current |
551,101 | 505,555 | 99,420 | 93,680 | ||||||||||||||||||||
| Past Due |
4,648 | 6,532 | 6,096 | 6,056 | ||||||||||||||||||||
| Total |
555,749 | 512,087 | 105,516 | 99,736 | ||||||||||||||||||||
The Company’s investment in covered loans by credit quality indicator for the year ended December 31, 2010 is presented in the following table.
| (dollars in thousands)
|
Commercial | |||||||||||||||||||
| Real Estate | ||||||||||||||||||||
| Credit risk by internally assigned grade | Construction | Other | Business | Total | ||||||||||||||||
| Pass |
144,423 | 385,910 | 126,176 | 656,509 | ||||||||||||||||
| Special Mention |
27,783 | 104,228 | 7,475 | 139,486 | ||||||||||||||||
| Substandard |
245,872 | 402,397 | 39,462 | 687,731 | ||||||||||||||||
| Doubtful |
5,245 | 17,951 | 1,390 | 24,586 | ||||||||||||||||
| Total |
423,323 | 910,486 | 174,503 | 1,508,312 | ||||||||||||||||
| Discount | (468,445 | ) | ||||||||||||||||||
| Covered commercial loans, net | 1,039,867 | |||||||||||||||||||
| Mortgage | ||||||||||||||||||||
| Credit risk by payment activity | Prime | Subprime | Total | |||||||||||||||||
| Current |
294,399 | — | 294,399 | |||||||||||||||||
| Past Due |
107,744 | — | 107,744 | |||||||||||||||||
| Total |
402,143 | — | 402,143 | |||||||||||||||||
| Discount | (140,757 | ) | ||||||||||||||||||
| Covered mortgage loans, net | 261,386 | |||||||||||||||||||
| Consumer | ||||||||||||||||||||
| Credit risk by payment activity | Indirect Automobile |
Credit Card |
Home Equity |
Other | Total | |||||||||||||||
| Current |
— | 1,079 | 169,264 | 67,099 | 237,442 | |||||||||||||||
| Past Due |
— | 76 | 63,635 | 79,950 | 143,661 | |||||||||||||||
| Total |
— | 1,155 | 232,899 | 147,049 | 381,103 | |||||||||||||||
| Discount | (99,609 | ) | ||||||||||||||||||
| Covered consumer loans, net |
|
281,494 | ||||||||||||||||||
Impaired Loans
Information on the Company’s investment in impaired loans as of December 31, 2010 and 2009 is presented in the following table.
| (dollars in thousands)
December 31, 2010 |
Recorded Investment |
Unpaid Principal Balance |
Related Allowance |
Average Recorded Investment |
Interest Income Recognized |
|||||||||||||||
| With no related allowance recorded |
||||||||||||||||||||
| Mortgage Loans |
||||||||||||||||||||
| Residential – Prime |
$ | 5,916 | $ | 5,916 | $ | — | $ | 4,412 | $ | 215 | ||||||||||
| Residential – Subprime |
— | — | — | — | — | |||||||||||||||
| Commercial Loans |
— | |||||||||||||||||||
| Real Estate |
21,539 | 21,539 | — | 25,433 | 936 | |||||||||||||||
| Business |
6,761 | 6,761 | — | 6,847 | 278 | |||||||||||||||
| Consumer Loans |
||||||||||||||||||||
| Indirect automobile |
1,046 | 1,046 | — | 980 | 59 | |||||||||||||||
| Credit card |
378 | 378 | — | 376 | — | |||||||||||||||
| Home equity |
986 | 986 | — | 960 | 239 | |||||||||||||||
| Other |
5,713 | 5,713 | — | 4,612 | 26 | |||||||||||||||
| With an allowance recorded |
||||||||||||||||||||
| Commercial Real Estate |
6,532 | 6,738 | (206 | ) | 6,745 | 302 | ||||||||||||||
| Total |
||||||||||||||||||||
| Mortgage Loans |
5,916 | 5,916 | — | 4,412 | 215 | |||||||||||||||
| Commercial Loans |
34,832 | 35,038 | (206 | ) | 39,025 | 1,516 | ||||||||||||||
| Consumer Loans |
8,122 | 8,122 | — | 6,928 | 324 | |||||||||||||||
| December 31, 2009 |
Recorded Investment |
Unpaid Principal Balance |
Related Allowance |
Average Recorded Investment |
Interest Income Recognized |
|||||||||||||||
| With no related allowance recorded |
||||||||||||||||||||
| Mortgage Loans |
||||||||||||||||||||
| Residential – Prime |
$ | 3,313 | $ | 3,313 | $ | — | $ | 2,190 | $ | 115 | ||||||||||
| Residential – Subprime |
— | — | — | — | — | |||||||||||||||
| Commercial Loans |
||||||||||||||||||||
| Real Estate |
17,285 | 17,285 | — | 16,912 | 766 | |||||||||||||||
| Business |
4,242 | 4,242 | — | 4,843 | 255 | |||||||||||||||
| Consumer Loans |
||||||||||||||||||||
| Indirect automobile |
996 | 996 | — | 863 | 64 | |||||||||||||||
| Credit card |
— | — | — | — | — | |||||||||||||||
| Home equity |
— | — | — | — | — | |||||||||||||||
| Other |
4,508 | 4,508 | — | 3,824 | 180 | |||||||||||||||
| With an allowance recorded |
||||||||||||||||||||
| Commercial Real Estate |
6,725 | 9,811 | (3,086 | ) | 10,484 | 426 | ||||||||||||||
| Commercial Business |
95 | 112 | (17 | ) | 112 | 9 | ||||||||||||||
| Total |
||||||||||||||||||||
| Mortgage Loans |
3,313 | 3,313 | — | 2,190 | 115 | |||||||||||||||
| Commercial Loans |
28,347 | 31,450 | (3,103 | ) | 32,351 | 1,456 | ||||||||||||||
| Consumer Loans |
5,504 | 5,504 | — | 4,687 | 244 | |||||||||||||||
As of December 31, 2010, the Company was not committed to lend additional funds to any customer whose loan was classified as impaired.
NOTE 7 – LOAN SERVICING
Loans serviced for others, consisting primarily of commercial loan participations sold, are not included in the accompanying consolidated balance sheets. The unpaid principal balances of loans serviced for others were $170,505,000 and $87,676,000 at December 31, 2010 and 2009, respectively. Custodial escrow balances maintained in connection with the foregoing portfolio of loans serviced for others, and included in demand deposits, were immaterial at December 31, 2010 and December 31, 2009.
NOTE 8 – PREMISES AND EQUIPMENT
Premises and equipment at December 31, 2010 and 2009 consists of the following:
| (dollars in thousands) | 2010 | 2009 | ||||||
| Land |
$ | 54,323 | $ | 36,526 | ||||
| Buildings |
154,420 | 105,649 | ||||||
| Furniture, fixtures and equipment |
72,846 | 59,541 | ||||||
| Total premises and equipment |
281,589 | 201,716 | ||||||
| Less: accumulated depreciation |
73,186 | 64,290 | ||||||
| Total premises and equipment, net |
$ | 208,403 | $ | 137,426 | ||||
Depreciation expense was $10,359,000, $8,287,000, and $8,600,000 for the years ended December 31, 2010, 2009, and 2008, respectively.
The Company actively engages in leasing office space available in buildings it owns. Leases have different terms ranging from monthly rental to five-year leases. At December 31, 2010, income from these leases averaged $123,000 per month. Total lease income for 2010, 2009, and 2008 was $1,574,000, $1,398,000, and $1,867,000, respectively. Income from leases is reported as a reduction in occupancy and equipment expense. The total allocated cost of the portion of the buildings held for lease at December 31, 2010 and 2009 was $8,375,000 and $11,222,000, respectively, with related accumulated depreciation of $2,042,000 and $2,828,000, respectively.
The Company leases certain branch and corporate offices, land and ATM facilities through non-cancelable operating leases with terms that range from one to thirty years, with renewal options thereafter. Certain of the leases have escalation clauses and renewal options ranging from monthly renewal to 30 years. Total rent expense for the years ended December 31, 2010, 2009, and 2008 amounted to $7,108,000, $4,586,000, and $4,075,000, respectively.
Minimum future annual rent commitments under these agreements for the indicated periods follow:
| (dollars in thousands) | Amount | |||
| Year Ending December 31, |
||||
| 2011 |
$ | 8,359 | ||
| 2012 |
7,316 | |||
| 2013 |
6,265 | |||
| 2014 |
5,123 | |||
| 2015 |
4,816 | |||
| 2016 and thereafter |
29,769 | |||
| Total |
$ | 61,648 | ||
NOTE 9 – GOODWILL AND OTHER INTANGIBLE ASSETS
Goodwill
Changes to the carrying amount of goodwill for the years ended December 31, 2010 and 2009 are provided in the following table.
| (dollars in thousands) | Amount | |||
| Balance, December 31, 2008 |
$ | 236,761 | ||
| Goodwill acquired during the year |
— | |||
| Goodwill impairment |
(9,681 | ) | ||
| Balance, December 31, 2009 |
$ | 227,080 | ||
| Goodwill acquired during the year |
7,148 | |||
| Balance, December 31, 2010 |
$ | 234,228 | ||
The goodwill acquired during the year ended December 31, 2010 was a result of the Sterling acquisition on July 23, 2010.
At December 31, 2010, goodwill is allocated to the Company’s reportable segments as follows:
| (dollars in thousands) | Amount | |||
| IBERIABANK |
$ | 100,558 | ||
| IBERIABANK fsb |
124,942 | |||
| Lenders Title Company |
8,728 | |||
| Balance, December 31, 2010 |
$ | 234,228 | ||
The Company performed the required annual impairment tests of goodwill as of October 1, 2010. The Company’s annual impairment test did not indicate impairment at any of the Company’s reporting units as of the testing date, and subsequent to that date, management is not aware of any events or changes in circumstances since the impairment test that would indicate that goodwill might be impaired.
As a result of a decrease in operating revenue and income at the Company’s LTC subsidiary in 2009, the Company determined that it was more likely than not that the fair value of LTC may have been reduced below its carrying amount. To estimate the fair value, the Company used a discounted cash flow model derived from internal five-year cash flow estimates with a terminal value based on estimated future growth rates. The fair value estimate indicated that the carrying amount of the LTC subsidiary exceeded its estimated fair value. As a result, Step 2 testing was required for this reporting unit. The Company determined, as a result of the Step 2 analysis, that the goodwill allocated to LTC was partially impaired, primarily due to a decrease in expected cash flows for LTC. During 2009, the Company recorded a non-cash goodwill impairment charge of $9,681,000, representing 52.6% of total LTC goodwill. The impairment charge is included in other noninterest expense on the Company’s consolidated statement of income for the year ended December 31, 2009.
Title plant
The Company had title plant assets totaling $6,722,000 at December 31, 2010 and 2009, respectively. No events or changes in circumstances occurred during 2010 or 2009 to suggest the carrying value of the title plant was not recoverable.
Intangible assets subject to amortization
The Company’s purchase accounting intangible assets from prior acquisitions which are subject to amortization include core deposit intangibles, amortized on a straight line or accelerated basis over a 10 year average life, and mortgage servicing rights, amortized over the remaining servicing life of the loans, with consideration given to prepayment assumptions. The definite-lived intangible assets had the following carrying values at December 31:
| 2010 | 2009 | |||||||||||||||||||||||
| (dollars in thousands) | Gross Carrying Amount |
Accumulated Amortization |
Net Carrying Amount |
Gross Carrying Amount |
Accumulated Amortization |
Net Carrying Amount |
||||||||||||||||||
| Core deposit intangibles |
$ | 39,399 | $ | 16,424 | $ | 22,975 | $ | 37,831 | $ | 11,489 | $ | 26,342 | ||||||||||||
| Non-compete agreements |
18 | 18 | — | 18 | 18 | — | ||||||||||||||||||
| Mortgage servicing rights |
345 | 161 | 184 | 331 | 102 | 229 | ||||||||||||||||||
| Total |
$ | 39,762 | $ | 16,603 | $ | 23,159 | $ | 38,180 | $ | 11,609 | $ | 26,571 | ||||||||||||
During 2010, the Company recorded $1,568,000 in core deposit intangible assets related to the deposits acquired in the Sterling acquisition.
During 2009, the Company recorded $13,041,000 in core deposit intangible assets related to the deposits acquired in the CSB, Orion, and Century acquisitions. During 2009, the Company also recorded additional mortgage servicing rights of $134,000 at the Company’s IMC subsidiary.
The related amortization expense of purchase accounting intangible assets is as follows:
| (dollars in thousands) |
Amount | |||
| Aggregate amortization expense: |
||||
| For the year ended December 31, 2008 |
$ | 2,456 | ||
| For the year ended December 31, 2009 |
3,008 | |||
| For the year ended December 31, 2010 |
5,061 | |||
| Estimated amortization expense: |
||||
| For the year ended December 31, 2011 |
$ | 4,529 | ||
| For the year ended December 31, 2012 |
4,119 | |||
| For the year ended December 31, 2013 |
3,794 | |||
| For the year ended December 31, 2014 |
3,525 | |||
| For the year ended December 31, 2015 |
2,797 | |||
| For the years ended December 31, 2016 and thereafter |
4,395 | |||
NOTE 10 – OTHER REAL ESTATE OWNED
Other real estate owned and foreclosed property totaled $69,217,000 and $74,092,000 at December 31, 2010 and 2009, respectively. There was no allowance for losses on foreclosed property at December 31, 2010 and 2009. Other real estate owned consists of the following:
| (dollars in thousands) | 2010 | 2009 | ||||||
| Real estate owned acquired by foreclosure |
$ | 64,408 | $ | 72,423 | ||||
| Other foreclosed property |
163 | 36 | ||||||
| Real estate acquired for development or resale |
4,646 | 1,633 | ||||||
| Total other real estate owned and foreclosed property |
$ | 69,217 | $ | 74,092 | ||||
At December 31, 2010 and 2009, other real estate at the Company’s reportable segments is as follows:
| (dollars in thousands) | IBERIABANK | |||||||||||||||
| December 31, 2010 | Non-covered properties |
Covered properties |
IBERIABANK fsb |
Total | ||||||||||||
| Real estate owned acquired by foreclosure |
$ | 1,758 | $ | 50,568 | $ | 12,082 | $ | 64,408 | ||||||||
| Other foreclosed property |
9 | 154 | — | 163 | ||||||||||||
| Real estate acquired for development or resale |
4,121 | — | 525 | 4,646 | ||||||||||||
| Total other real estate owned and foreclosed property |
$ | 5,888 | $ | 50,722 | $ | 12,607 | $ | 69,217 | ||||||||
| (dollars in thousands) | IBERIABANK | |||||||||||||||
| December 31, 2009 | Non-covered properties |
Covered properties |
IBERIABANK fsb |
Total | ||||||||||||
| Real estate owned acquired by foreclosure |
$ | 2,797 | $ | 58,811 | $ | 10,815 | $ | 72,423 | ||||||||
| Other foreclosed property |
36 | — | — | 36 | ||||||||||||
| Real estate acquired for development or resale |
1,167 | — | 466 | 1,633 | ||||||||||||
| Total other real estate owned and foreclosed property |
$ | 4,000 | $ | 58,811 | $ | 11,281 | $ | 74,092 | ||||||||
NOTE 11 – DEPOSITS
Certificates of deposit with a balance of $100,000 and over were $1,514,034,000 and $1,608,322,000 at December 31, 2010 and 2009, respectively.
A schedule of maturities of all certificates of deposit as of December 31, 2010 is as follows:
| (dollars in thousands) | Amount | |||
| Year Ending December 31, |
||||
| 2011 |
$ | 2,072,843 | ||
| 2012 |
528,826 | |||
| 2013 |
91,248 | |||
| 2014 |
47,976 | |||
| 2015 |
103,323 | |||
| 2016 and thereafter |
183 | |||
| Total certificate of deposits |
$ | 2,844,399 | ||
NOTE 12 – SHORT-TERM BORROWINGS
Short-term borrowings at December 31, 2010 and 2009 are summarized as follows:
| (dollars in thousands) | 2010 | 2009 | ||||||
| Federal Home Loan Bank advances |
$ | — | $ | 90,000 | ||||
| Securities sold under agreements to repurchase |
220,328 | 173,351 | ||||||
| Total short-term borrowings |
$ | 220,328 | $ | 263,351 | ||||
Securities sold under agreements to repurchase, which are classified as secured borrowings, generally mature daily. Securities sold under agreements to repurchase are reflected at the amount of cash received in connection with the transaction. The Company may be required to provide additional collateral based on the fair value of the underlying securities.
The short-term borrowings at December 31, 2009 consisted of FHLB advances with maturity terms between 4 and 365 days, at fixed interest rates between 0.120% and 0.500%.
Additional information on the Company’s short-term borrowings for the years indicated is as follows:
| (dollars in thousands) | 2010 | 2009 | 2008 | |||||||||
| Outstanding at December 31st |
$ | 220,328 | $ | 263,351 | $ | 208,213 | ||||||
| Maximum month-end outstanding balance |
289,248 | 263,351 | 293,000 | |||||||||
| Average daily outstanding balance |
216,116 | 197,824 | 80,394 | |||||||||
| Average rate during the year |
0.38 | % | 0.66 | % | 2.14 | % | ||||||
| Average rate at year end |
0.24 | % | 0.48 | % | 0.50 | % | ||||||
NOTE 13 – LONG-TERM DEBT
Long-term debt at December 31, 2010 and 2009 is summarized as follows:
| (dollars in thousands) | 2010 | 2009 | ||||||
| Federal Home Loan Bank notes at: |
||||||||
| 0.000 to 0.238% variable, 3 month LIBOR(1) index |
$ | — | $ | 20,000 | ||||
| 1.636 to 7.040% fixed |
269,237 | 552,734 | ||||||
| Notes payable – Investment fund contributions |
||||||||
| 7 to 40 year term, 0.50 to 5.00% fixed |
51,764 | 36,531 | ||||||
| Junior subordinated debt: |
||||||||
| Correspondent Bank Capital Note, 3 month LIBOR(1) plus 3.00% |
— | 25,000 | ||||||
| Statutory Trust I, 3 month LIBOR(1) plus 3.25% |
10,310 | 10,310 | ||||||
| Statutory Trust II, 3 month LIBOR(1) plus 3.15% |
10,310 | 10,310 | ||||||
| Statutory Trust III, 3 month LIBOR(1) plus 2.00% |
10,310 | 10,310 | ||||||
| Statutory Trust IV, 3 month LIBOR(1) plus 1.60% |
15,464 | 15,464 | ||||||
| American Horizons Statutory Trust I, 3 month LIBOR(1) plus 3.15% |
6,186 | 6,186 | ||||||
| Statutory Trust V, 3 month LIBOR(1) plus 1.435% |
10,310 | 10,310 | ||||||
| Statutory Trust VI, 3 month LIBOR(1) plus 2.75% |
12,372 | 12,372 | ||||||
| Statutory Trust VII, 3 month LIBOR(1) plus 2.54% |
13,403 | 13,403 | ||||||
| Pocahontas Capital Trust I, Fixed rate of 10.18% |
7,824 | 7,692 | ||||||
| Pulaski Capital Trust I, Fixed rate of 10.875% |
7,544 | 8,024 | ||||||
| Statutory Trust VIII, 3 month LIBOR(1) plus 3.50% |
7,217 | 7,217 | ||||||
| Total long-term debt |
$ | 432,251 | $ | 745,864 | ||||
| (1) | The interest rate on the Company’s long-term debt indexed to LIBOR is based on the 3-month LIBOR rate. At December 31, 2010, the 3-month LIBOR rate was 0.30281%. |
FHLB advance repayments are amortized over periods ranging from two to thirty years, and have a balloon feature at maturity. Advances are collateralized by a blanket pledge of mortgage loans and a secondary pledge of FHLB stock and FHLB demand deposits. Total additional advances available from the FHLB at December 31, 2010 were $1,532,859,000 under the blanket floating lien and $679,632,000 with a pledge of investment securities. The weighted average advance rate at December 31, 2010 was 4.09%.
The Company has various funding arrangements with commercial banks providing up to $115,000,000 in the form of federal funds and other lines of credit. At December 31, 2010, there were no balances outstanding on these lines and all of the funding was available to the Company.
Junior subordinated debt consists of a total of $111,250,000 in Junior Subordinated Deferrable Interest Debentures of the Company issued to statutory trusts that were funded by the issuance of floating rate capital securities of the trusts. Issuances of $10,310,000 each were completed in November 2002, June 2003, September 2004, and June 2007 and an issuance of $15,464,000 was completed in October 2006. The issue of $6,186,000 completed in March 2003 was assumed in the American Horizons acquisition. Issuances of $7,824,000 and $7,544,000 were assumed in the Pocahontas and PIC acquisitions, respectively. The Company issued $25,775,000 in November 2007 and $7,217,000 in March 2008 to provide funding for various business activities, primarily loan growth.
The term of the securities is 30 years, and they are callable at par by the Company anytime after 5 years. Interest is payable quarterly and may be deferred at any time at the election of the Company for up to 20 consecutive quarterly periods. During a deferral period, the Company is subject to certain restrictions, including being prohibited from declaring dividends to its common shareholders.
The debentures qualify as Tier 1 Capital and the capital note qualifies as Tier 2 capital for regulatory purposes.
Advances and long-term debt at December 31, 2010 have maturities or call dates in future years as follows:
| (dollars in thousands) | Amount | |||
| Year Ending December 31, | ||||
| 2011 |
$ | 46,485 | ||
| 2012 |
59,293 | |||
| 2013 |
20,789 | |||
| 2014 |
112,331 | |||
| 2015 |
1,220 | |||
| 2016 and thereafter |
192,133 | |||
| Total |
$ | 432,251 | ||
NOTE 14 – ON-BALANCE SHEET DERIVATIVE INSTRUMENTS AND HEDGING
ACTIVITIES
In the course of its business operations, the Company is exposed to certain risks, including interest rate, liquidity, and credit risk. The Company manages its risks through the use of derivative financial instruments, primarily through management of exposure due to the receipt or payment of future cash amounts based on interest rates. The Company’s derivative financial instruments manage the differences in the timing, amount, and duration of expected cash receipts and payments.
The Company accounts for its derivative financial instruments in accordance with ASC Topic 815, which requires that all derivatives be recognized as assets or liabilities in the balance sheet at fair value.
The primary types of derivatives used by the Company include interest rate swap agreements and interest rate lock commitments.
Interest rate swap agreements
As part of its activities to manage interest rate risk due to interest rate movements, the Company has engaged in interest rate swap transactions to manage exposure to interest rate risk through modification of the Company’s net interest sensitivity to levels deemed to be appropriate. The Company utilizes these interest rate swap agreements to convert a portion of its variable-rate debt to a fixed rate (cash flow hedge). The notional amount on which the interest payments are based is not exchanged. The Company had notional amounts of $70,000,000 and $95,000,000 in derivative contracts on its debt at December 31, 2010 and 2009, respectively.
In addition to using derivative instruments as an interest rate risk management tool, the Company also enters into derivative instruments to help its commercial customers manage their exposure to interest rate fluctuations. To mitigate the interest rate risk associated with these customer contracts, the Company enters into offsetting derivative contract positions. The Company manages its credit risk, or potential risk of default by its commercial customers, through credit limit approval and monitoring procedures. At December 31, 2010, the Company had notional amounts of $247,292,000 on interest rate contracts with corporate customers and $247,292,000 in offsetting interest rate contracts with other financial institutions to mitigate the Company’s rate exposure on its corporate customers’ contracts. At December 31, 2009, the Company had notional amounts of $184,015,000 on both interest rate contracts with corporate customers and offsetting contracts with other financial institutions.
Because the swap agreements used to manage interest rate risk have been designated as hedging exposure to variable cash flows of a forecasted transaction, the effective portion of the derivative’s gain or loss is initially reported as a component of other comprehensive income and subsequently reclassified into earnings when the forecasted transaction affects earnings or when the hedge is terminated. The ineffective portion of the gain or loss is reported in earnings immediately.
In applying hedge accounting for derivatives, the Company establishes a method for assessing the effectiveness of the hedging derivative and a measurement approach for determining the ineffective aspect of the hedge upon the inception of the hedge. These methods are consistent with the Company’s approach to managing risk.
For interest rate swap agreements that are not designated as hedging instruments, changes in the fair value of the derivatives are recognized in earnings immediately.
Rate lock commitments
The Company enters into commitments to originate loans whereby the interest rate on the prospective loan is determined prior to funding (“rate lock commitments”). Rate lock commitments on mortgage loans that are intended to be sold are considered to be derivatives. Accordingly, such commitments, along with any related fees received from potential borrowers, are recorded at fair value as derivative assets or liabilities, with changes in fair value recorded in net gain or loss on sale of mortgage loans. The fair value of rate lock commitments was immaterial as of December 31, 2010 and 2009.
Equity-indexed certificates of deposit
Beginning in 2010, IBERIABANK offers its customers a certificate of deposit that provides the purchaser a guaranteed return of principal at maturity plus potential return, which allows IBERIABANK to identify a known cost of funds. The rate of return is based on the performance of ten large cap U.S. stocks in the S&P 500 stock index, representing a variety of industry segments. Because it is based on an equity index, the rate of return represents an embedded derivative that is not clearly and closely related to the host instrument. ASC Topic 815 therefore requires the certificate of deposit be separated into two components: a zero coupon certificate of deposit (the host instrument) and a written option purchased by the depositor (an embedded derivative). The discount on the zero coupon deposit is amortized over the life of the deposit, and the written option is carried at fair value on the Company’s consolidated balance sheet, with changes in fair value recorded through earnings. IBERIABANK offsets the risks of the written option by purchasing an option with terms that mirror the written option and that is also carried at fair value on the Company’s consolidated balance sheet. At December 31, 2010, the Company had equity-indexed certificates of deposit of $74,171,000 with offsetting written options having a notional amount of $74,171,000. There were no equity-indexed certificates of deposit at December 31, 2009.
At December 31, the information pertaining to outstanding derivative instruments is as follows.
| Asset Derivatives | Liability Derivatives |
|||||||||||||||||||||||
| Balance Sheet Location |
Fair Value | Balance Sheet Location |
Fair Value | |||||||||||||||||||||
| (dollars in thousands) | 2010 | 2009 | 2010 | 2009 | ||||||||||||||||||||
| Derivatives designated as hedging instruments under ASC Topic 815 |
||||||||||||||||||||||||
| Interest rate contracts |
Other assets | $ | 14,414 | $ | 19,000 | |
Other liabilities |
|
$ | — | $ | 478 | ||||||||||||
| Total derivatives designated as hedging instruments under ASC Topic 815 |
$ | 14,414 | $ | 19,000 | $ | — | $ | 478 | ||||||||||||||||
| Derivatives not designated as hedging instruments under ASC Topic 815 |
||||||||||||||||||||||||
| Interest rate contracts |
Other assets | $ | 17,420 | $ | 13,697 | |
Other liabilities |
|
$ | 17,418 | $ | 13,697 | ||||||||||||
| Written and purchased options |
5,486 | 5,486 | ||||||||||||||||||||||
| Total derivatives not designated as hedging instruments under ASC Topic 815 |
$ | 22,906 | $ | 13,697 | $ | 22,904 | $ | 13,697 | ||||||||||||||||
At December 31, 2010, the Company was not required to post collateral for any derivative transactions. The Company does not anticipate additional assets will be required to be posted as collateral, nor does it believe additional assets would be required to settle its derivative instruments immediately if contingent features were triggered at December 31, 2010. As permitted by generally-accepted accounting principles, the Company does not offset fair value amounts recognized for the right to reclaim cash collateral or the obligation to return cash collateral against recognized fair value amounts of derivatives executed with the same counterparty under a master netting agreement.
At December 31, the information pertaining to the effect of the derivative instruments on the consolidated financial statements is as follows.
| (dollars in thousands) | Amount of Gain
(Loss) Recognized in OCI, net of taxes (Effective Portion) |
Location of
Gain (Loss) Reclassified from Accumulated OCI into Income (Effective Portion) |
Amount of
Gain (Loss) Reclassified from Accumulated OCI into Income (Effective Portion) |
Location of
Gain (Loss) Recognized in Income on Derivative (Ineffective Portion and Amount Excluded from Effectiveness Testing) |
Amount of
Gain (Loss) Recognized in Income on Derivative (Ineffective Portion and Amount Excluded from Effectiveness Testing) |
|||||||||||||||||||||||||||
| Derivatives in ASC Topic 815 Cash Flow Hedging Relationships |
2010 | 2009 | 2010 | 2009 | 2010 | 2009 | ||||||||||||||||||||||||||
| Interest rate contracts |
$ | 9,370 | $ | 12,040 |
|
Interest income (expense) |
|
$ | 1,646 | $ | 326 |
|
Other income (expense) |
|
$ | — | $ | — | ||||||||||||||
| Total |
$ | 9,370 | $ | 12,040 | $ | 1,646 | $ | 326 | $ | — | $ | — | ||||||||||||||||||||
| (dollars in thousands) | Location of Gain
(Loss) Recognized in Income on Derivatives |
Amount of Gain (Loss) Recognized in Income on Derivatives |
||||||||||
| Derivatives Not Designated as Hedging Instruments under ASC Topic 815 |
2010 | 2009 | ||||||||||
| Interest rate contracts |
Other income (expense) | $ | 3 | $ | 202 | |||||||
| Total |
$ | 3 | $ | 202 | ||||||||
During the years ended December 31, 2010 and 2009, the Company has not reclassified into earnings any gain or loss as a result of the discontinuance of cash flow hedges because it was probable the original forecasted transaction would not occur by the end of the originally specified term.
At December 31, 2010, the fair value of derivatives that will mature within the next twelve months is $163,000. The Company does not expect to reclassify any amount from accumulated other comprehensive income into interest income over the next twelve months for derivatives that will be settled.
At December 31, 2010 and 2009, the information pertaining to outstanding interest rate swap agreements is as follows:
| (dollars in thousands) | 2010 | 2009 | ||||||
| Notional amount |
$ | 568,755 | $ | 463,031 | ||||
| Weighted average pay rate |
4.5 | % | 4.6 | % | ||||
| Weighted average receive rate |
0.5 | % | 0.6 | % | ||||
| Weighted average maturity in years |
6.7 | 8.5 | ||||||
| Unrealized gain (loss) relating to interest rate swaps |
$ | 14,414 | $ | 18,523 | ||||
Changes in the fair value of interest rate swaps designated as hedging the variability of cash flows associated with long-term debt are reported in other comprehensive income. These amounts subsequently are reclassified into interest income and interest expense as a yield adjustment in the same period in which the related interest on the long-term debt affects earnings. As a result of these interest rate swaps, interest expense was decreased by $1,646,000 and $326,000 for the years ended December 31, 2010 and 2009, respectively.
NOTE 15 – INCOME TAXES
The provision for income tax expense consists of the following:
| Years Ended December 31, | ||||||||||||
| (dollars in thousands) | 2010 | 2009 | 2008 | |||||||||
| Current expense |
$ | 28,562 | $ | 12,330 | $ | 15,063 | ||||||
| Deferred expense (benefit) |
(3,607 | ) | 82,297 | (305 | ) | |||||||
| Tax credits |
(6,214 | ) | (5,489 | ) | (760 | ) | ||||||
| Tax benefits attributable to items charged to equity and goodwill |
1,250 | 1,200 | 1,872 | |||||||||
| Total income tax expense |
$ | 19,991 | $ | 90,338 | $ | 15,870 | ||||||
There was a balance receivable of $5,700,000 and a balance receivable of $9,875,000 for federal and state income taxes at December 31, 2010 and 2009, respectively. The provision for federal income taxes differs from the amount computed by applying the federal income tax statutory rate of 35 percent on income from operations as indicated in the following analysis:
| Years Ended December 31, | ||||||||||||
| (dollars in thousands) | 2010 | 2009 | 2008 | |||||||||
| Federal tax based on statutory rate |
$ | 24,086 | $ | 87,042 | $ | 19,524 | ||||||
| Increase (decrease) resulting from: |
||||||||||||
| Effect of tax-exempt income |
(5,935 | ) | (5,175 | ) | (4,227 | ) | ||||||
| Interest and other nondeductible expenses |
1,295 | 1,009 | 770 | |||||||||
| State taxes |
3,615 | 9,261 | 987 | |||||||||
| Tax credits |
(6,214 | ) | (5,489 | ) | (760 | ) | ||||||
| Goodwill impairment |
— | 2,808 | — | |||||||||
| Other |
3,144 | 882 | (424 | ) | ||||||||
| Total income tax expense |
$ | 19,991 | $ | 90,338 | $ | 15,870 | ||||||
| Effective rate |
29.1 | % | 36.3 | % | 28.5 | % | ||||||
The net deferred tax liability at December 31, 2010 and 2009 is as follows:
| (dollars in thousands) | 2010 | 2009 | ||||||
| Deferred tax asset: |
||||||||
| Allowance for loan losses |
$ | 23,270 | $ | 20,112 | ||||
| Discount on purchased loans |
162 | 269 | ||||||
| Deferred compensation |
1,644 | 1,562 | ||||||
| Investments acquired |
407 | 714 | ||||||
| Borrowings |
— | 29 | ||||||
| Swap loss |
— | 2 | ||||||
| Other |
6,103 | 4,782 | ||||||
| Subtotal |
31,586 | 27,470 | ||||||
| Deferred tax liability: |
||||||||
| Basis difference in acquired assets |
(80,986 | ) | (90,208 | ) | ||||
| FHLB stock |
(497 | ) | (650 | ) | ||||
| Premises and equipment |
(9,402 | ) | (8,087 | ) | ||||
| Acquisition intangibles |
(9,525 | ) | (9,377 | ) | ||||
| Deferred loan costs |
(1,559 | ) | (1,593 | ) | ||||
| Unrealized gain on investments classified as available for sale |
(2,856 | ) | (5,406 | ) | ||||
| Unrealized gain on cash flow hedges |
(5,045 | ) | (6,483 | ) | ||||
| Swap gain |
(1 | ) | — | |||||
| Other |
(6,772 | ) | (4,042 | ) | ||||
| Subtotal |
(116,643 | ) | (125,846 | ) | ||||
| Deferred tax liability, net |
$ | (85,057 | ) | $ | (98,376 | ) | ||
Retained earnings at December 31, 2010 and 2009 included approximately $21,864,000 accumulated prior to January 1, 1987 for which no provision for federal income taxes has been made. If this portion of retained earnings is used in the future for any purpose other than to absorb bad debts, it will be added to future taxable income.
The Company does not believe it has any unrecognized tax benefits included in its consolidated financial statements. The Company has not had any settlements in the current period with taxing authorities, nor has it recognized tax benefits as a result of a lapse of the applicable statute of limitations.
The Company recognizes interest and penalties accrued related to unrecognized tax benefits, if applicable, in noninterest expense. During the years ended December 31, 2010, 2009, and 2008, the Company did not recognize any interest or penalties in its consolidated financial statements, nor has it recorded an accrued liability for interest or penalty payments.
NOTE 16 – SEGMENTS
The Company’s segments reflect the manner in which financial information is currently evaluated. The Company strategically manages and reports the results of its business through three operating segment levels: IBERIABANK, IBERIABANK fsb, IMC, and LTC.
The Company’s IBERIABANK and IBERIABANK fsb segments offer commercial and retail banking products and services to customers throughout locations in six states. IBERIABANK provides these products and services in Louisiana, Alabama, and Florida, while IBERIABNK fsb provides similar services in Arkansas, Tennessee, and Texas. As a Louisiana-chartered commercial bank and a member of the Federal Reserve System, IBERIABANK is subject to regulation, supervision and examination by the Office of Financial Institutions of the State of Louisiana, IBERIABANK’s chartering authority, and the Board of Governors of the Federal Reserve System (the “FRB”), IBERIABANK’s primary federal regulator. As a federal savings association, IBERIABANK fsb is subject to regulation, supervision and examination by the Office of Thrift Supervision (the “OTS”).
The IBERIABANK and IBERIABANK fsb segments are considered reportable segments based on quantitative thresholds applied for reportable segments provided by ASC Topic 280, and are disclosed separately. The Company’s LTC segment does not meet the thresholds provided, but is reported because management believes information about this segment will be useful to readers of these consolidated financial statements. The Other segment includes the results of operations and financial condition of the
Company’s other subsidiaries, as well as the activities of the Company’s holding company, which include corporate business activities, including payment of employee salary and benefits and marketing, business development, legal, professional, and other corporate expenses. Certain expenses not directly attributable to a specific segment are allocated to segments based on pre-determined means that reflect utilization.
The Company maintains its books and records on a legal entity basis for the preparation of financial statements in conformity with GAAP. The following tables present information prepared from the Company’s internal management information system, which is maintained on a line of business level through allocations from the consolidated financial results.
The following tables present certain information regarding our continuing operations by segment, including a reconciliation of segment results to reported operating results for the periods presented. Reconciling items between segment results and reported results include:
| • | Elimination of interest income earned by the Company on an intercompany note payable with the Company’s LTC segment |
| • | Elimination of interest income and interest expense representing interest earned by IBERIABANK and IBERIABANK fsb on interest-bearing checking accounts held by related companies, as well as the elimination of the related deposit balances at the IBERIABANK and IBERIABANK fsb segments |
| • | Elimination of investment in subsidiary balances on certain operating segments included in total segment assets |
| • | Elimination of intercompany due to/due from balances on certain operating segments that are included in total segment assets. |
There were no discontinued operations for the years ended December 31, 2010, 2009, or 2008.
| (dollars in thousands) | Year ended December 31, 2010 | |||||||||||||||||||||||
| IBERIABANK | IBERIABANK fsb |
LTC | Other | Eliminations | Total Reported |
|||||||||||||||||||
| Interest income |
$ | 330,546 | $ | 65,600 | $ | (116 | ) | $ | 2,635 | $ | (2,294 | ) | $ | 396,371 | ||||||||||
| Interest expense |
93,340 | 19,832 | — | 3,865 | (2,294 | ) | 114,744 | |||||||||||||||||
| Net interest income |
237,206 | 45,768 | (116 | ) | (1,230 | ) | — | 281,627 | ||||||||||||||||
| Provision for loan losses |
30,077 | 12,374 | — | — | — | 42,451 | ||||||||||||||||||
| Gain on acquisition |
3,781 | 251 | — | — | (251 | ) | 3,781 | |||||||||||||||||
| Gain (Loss) on sale of loans |
(2 | ) | 47,691 | — | — | — | 47,689 | |||||||||||||||||
| Title income |
— | — | 18,083 | — | — | 18,083 | ||||||||||||||||||
| Other noninterest income |
50,529 | 14,545 | 16 | (750 | ) | (3 | ) | 64,337 | ||||||||||||||||
| Core deposit intangible amortization |
3,735 | 1,451 | — | — | (251 | ) | 4,935 | |||||||||||||||||
| Other noninterest expenses |
162,249 | 81,969 | 18,414 | 36,685 | (3 | ) | 299,314 | |||||||||||||||||
| Income tax provision (benefit) |
30,013 | 4,188 | (1,113 | ) | (13,097 | ) | — | 19,991 | ||||||||||||||||
| Net income (loss) |
$ | 65,439 | $ | 8,273 | $ | 682 | $ | (25,568 | ) | $ | — | $ | 48,826 | |||||||||||
| Total loans |
$ | 4,925,996 | $ | 1,109,336 | $ | — | $ | — | $ | — | $ | 6,035,332 | ||||||||||||
| Total assets |
8,311,579 | 1,646,055 | 19,319 | 1,417,000 | (1,367,187 | ) | 10,026,766 | |||||||||||||||||
| Total deposits |
6,853,714 | 1,296,025 | — | — | (234,633 | ) | 7,915,106 | |||||||||||||||||
| (dollars in thousands) | Year ended December 31, 2009 | |||||||||||||||||||||||
| IBERIABANK | IBERIABANK fsb |
LTC | Other | Eliminations | Total Reported |
|||||||||||||||||||
| Interest income |
$ | 208,410 | $ | 61,695 | $ | 128 | $ | 1,528 | $ | (1,374 | ) | $ | 270,387 | |||||||||||
| Interest expense |
70,662 | 23,565 | 286 | 4,464 | (1,374 | ) | 97,602 | |||||||||||||||||
| Net interest income |
137,748 | 38,130 | (158 | ) | (2,936 | ) | — | 172,785 | ||||||||||||||||
| Provision for loan losses |
18,577 | 26,793 | — | — | — | 45,370 | ||||||||||||||||||
| Gain on acquisition |
238,893 | — | — | — | — | 238,893 | ||||||||||||||||||
| Gain (Loss) on sale of loans |
18 | 35,090 | — | — | — | 35,108 | ||||||||||||||||||
| Title income |
— | — | 18,476 | — | — | 18,476 | ||||||||||||||||||
| Other noninterest income |
35,603 | 16,442 | (1 | ) | 16 | — | 52,060 | |||||||||||||||||
| Goodwill impairment |
— | — | 9,681 | — | — | 9,681 | ||||||||||||||||||
| Core deposit intangible amortization |
1,442 | 1,451 | — | — | — | 2,893 | ||||||||||||||||||
| Other noninterest expenses |
99,240 | 76,045 | 17,690 | 17,711 | — | 210,686 | ||||||||||||||||||
| Income tax provision (benefit) |
102,684 | (5,478 | ) | 253 | (7,121 | ) | — | 90,338 | ||||||||||||||||
| Net income (loss) |
$ | 190,319 | $ | (9,148 | ) | $ | (9,307 | ) | $ | (13,510 | ) | $ | — | $ | 158,354 | |||||||||
| Total loans |
$ | 4,778,728 | $ | 1,005,637 | $ | — | $ | — | $ | — | $ | 5,784,365 | ||||||||||||
| Total assets |
8,052,479 | 1,528,108 | 18,967 | 1,068,368 | (971,967 | ) | 9,695,955 | |||||||||||||||||
| Total deposits |
6,467,287 | 1,150,948 | — | — | (62,087 | ) | 7,556,148 | |||||||||||||||||
| (dollars in thousands) | Year ended December 31, 2008 | |||||||||||||||||||||||
| IBERIABANK | IBERIABANK fsb |
LTC | Other | Eliminations | Total Reported |
|||||||||||||||||||
| Interest income |
$ | 192,701 | $ | 70,645 | $ | 234 | $ | 693 | $ | (446 | ) | $ | 263,827 | |||||||||||
| Interest expense |
81,402 | 37,398 | 446 | 7,383 | (446 | ) | 126,183 | |||||||||||||||||
| Net interest income |
111,299 | 33,247 | (212 | ) | (6,690 | ) | — | 137,644 | ||||||||||||||||
| Provision for loan losses |
4,200 | 8,368 | — | — | — | 12,568 | ||||||||||||||||||
| Gain (Loss) on sale of loans |
(210 | ) | 25,505 | — | — | — | 25,295 | |||||||||||||||||
| Title income |
— | — | 19,003 | — | — | 19,003 | ||||||||||||||||||
| Other noninterest income |
32,474 | 15,494 | 16 | (351 | ) | — | 47,634 | |||||||||||||||||
| Core deposit intangible amortization |
1,035 | 1,373 | — | — | — | 2,408 | ||||||||||||||||||
| Other noninterest expenses |
66,240 | 61,841 | 20,262 | 10,474 | — | 158,818 | ||||||||||||||||||
| Income tax provision (benefit) |
22,110 | 223 | (530 | ) | (5,933 | ) | — | 15,870 | ||||||||||||||||
| Net income (loss) |
$ | 49,978 | $ | 2,441 | $ | (925 | ) | $ | (11,582 | ) | $ | — | $ | 39,912 | ||||||||||
| Total loans |
$ | 2,901,397 | $ | 843,005 | $ | — | $ | — | $ | — | $ | 3,744,402 | ||||||||||||
| Total assets |
3,864,066 | 1,511,688 | 28,125 | 861,407 | (682,060 | ) | 5,583,226 | |||||||||||||||||
| Total deposits |
2,842,113 | 1,154,464 | — | — | (761 | ) | 3,995,816 | |||||||||||||||||
Significant segment activity that affects comparability
During the year ended December 31, 2010 and 2009, the Company recorded a gain on the CSB, Orion, and Century acquisitions of $3,781,000 and $238,893,000, respectively, which was included in noninterest income on the Company’s consolidated financial statements. See Note 3 to these consolidated financial statements for further information on the gain recorded. There was no similar gain recorded for the year ended December 31, 2008. The acquisitions mentioned above (as well as the Sterling acquisition during 2010) resulted in a significant increase in IBERIABANK’s total loans, total deposits, and total assets for the year ended December 31, 2010 and 2009.
Also during 2009, the Company recorded an impairment of LTC’s goodwill of $9,681,000, which is included in noninterest expense in the Company’s consolidated financial statements. See Note 8 to these consolidated financial statements for further information on the impairment charge. There was no impairment of the Company’s goodwill for the years ended December 31, 2010 and 2008.
NOTE 17 – CAPITAL REQUIREMENTS AND OTHER REGULATORY MATTERS
The Company, IBERIABANK, and IBERIABANK fsb are subject to various regulatory capital requirements administered by the federal and state banking agencies. Failure to meet minimum capital requirements can initiate certain mandatory and possibly additional discretionary actions by regulators that, if undertaken, could have a direct material effect on the Company’s financial statements. Under capital adequacy guidelines and the regulatory framework for prompt corrective action, the Company, IBERIABANK, and IBERIABANK fsb must meet specific capital guidelines that involve quantitative measures of their assets, liabilities and certain off-balance sheet items as calculated under regulatory accounting practices. The capital amounts and classification are also subject to qualitative judgments by the regulators about components, risk weightings and other factors. Prompt corrective action provisions are not applicable to bank holding companies.
Quantitative measures established by regulation to ensure capital adequacy require the Company, IBERIABANK, and IBERIABANK fsb to maintain minimum amounts and ratios of total and Tier 1 capital to risk-weighted assets and of Tier 1 capital to average assets. Management believes, as of December 31, 2010 and 2009, that the Company, IBERIABANK, and IBERIABANK fsb met all capital adequacy requirements to which they are subject.
As of December 31, 2010, the most recent notification from the Federal Deposit Insurance Corporation categorized IBERIABANK and IBERIABANK fsb as well capitalized under the regulatory framework for prompt corrective action. To be categorized as well capitalized, an institution must maintain minimum total risk-based, Tier 1 risk-based and Tier 1 leverage ratios as set forth in the following table. There are no conditions or events since the notification that management believes have changed either entity’s category. The Company’s, IBERIABANK’s, and IBERIABANK fsb’s actual capital amounts and ratios as of December 31, 2010 and 2009 are presented in the following table.
| Actual | Minimum | Well Capitalized | ||||||||||||||||||||||
| (dollars in thousands) | Amount | Ratio | Amount | Ratio | Amount | Ratio | ||||||||||||||||||
| December 31, 2010 |
||||||||||||||||||||||||
| Tier 1 leverage capital: |
||||||||||||||||||||||||
| IBERIABANK Corporation |
$ | 1,132,777 | 11.24 | % | $ | 403,057 | 4.00 | % | $ | N/A | N/A | % | ||||||||||||
| IBERIABANK |
690,771 | 8.14 | 339,330 | 4.00 | 424,162 | 5.00 | ||||||||||||||||||
| IBERIABANK fsb |
163,764 | 10.83 | 60,498 | 4.00 | 75,622 | 5.00 | ||||||||||||||||||
| Tier 1 risk-based capital: |
||||||||||||||||||||||||
| IBERIABANK Corporation |
1,132,777 | 18.48 | 245,236 | 4.00 | N/A | N/A | ||||||||||||||||||
| IBERIABANK |
690,771 | 14.39 | 192,025 | 4.00 | 288,037 | 6.00 | ||||||||||||||||||
| IBERIABANK fsb |
163,764 | 12.74 | 51,417 | 4.00 | 77,126 | 6.00 | ||||||||||||||||||
| Total risk-based capital: |
||||||||||||||||||||||||
| IBERIABANK Corporation |
1,210,180 | 19.74 | 490,472 | 8.00 | N/A | N/A | ||||||||||||||||||
| IBERIABANK |
751,481 | 15.65 | 384,049 | 8.00 | 480,062 | 10.00 | ||||||||||||||||||
| IBERIABANK fsb |
179,689 | 13.98 | 102,834 | 8.00 | 128,543 | 10.00 | ||||||||||||||||||
| December 31, 2009 |
||||||||||||||||||||||||
| Tier 1 leverage capital: |
||||||||||||||||||||||||
| IBERIABANK Corporation |
$ | 787,026 | 9.99 | % | $ | 315,094 | 4.00 | % | $ | N/A | N/A | % | ||||||||||||
| IBERIABANK |
555,232 | 8.51 | 261,100 | 4.00 | 326,375 | 5.00 | ||||||||||||||||||
| IBERIABANK fsb |
144,128 | 10.35 | 55,689 | 4.00 | 69,612 | 5.00 | ||||||||||||||||||
| Tier 1 risk-based capital: |
||||||||||||||||||||||||
| IBERIABANK Corporation |
787,026 | 13.34 | 235,920 | 4.00 | N/A | N/A | ||||||||||||||||||
| IBERIABANK |
555,232 | 12.35 | 179,796 | 4.00 | 269,694 | 6.00 | ||||||||||||||||||
| IBERIABANK fsb |
144,128 | 12.45 | 46,307 | 4.00 | 69,461 | 6.00 | ||||||||||||||||||
| Total risk-based capital: |
||||||||||||||||||||||||
| IBERIABANK Corporation |
867,807 | 14.71 | 471,840 | 8.00 | N/A | N/A | ||||||||||||||||||
| IBERIABANK |
614,663 | 13.67 | 359,592 | 8.00 | 449,490 | 10.00 | ||||||||||||||||||
| IBERIABANK fsb |
158,506 | 13.69 | 92,614 | 8.00 | 115,768 | 10.00 | ||||||||||||||||||
NOTE 18 – SHARE-BASED COMPENSATION
The Company has various types of share-based compensation plans. These plans are administered by the Compensation Committee of the Board of Directors, which selects persons eligible to receive awards and determines the number of shares and/or options subject to each award, the terms, conditions and other provisions of the awards.
Stock option plans
The Company issues stock options under various plans to directors, officers and other key employees. The option exercise price cannot be less than the fair value of the underlying common stock as of the date of the option grant and the maximum option term cannot exceed ten years. The stock options granted were issued with vesting periods ranging from one-and-a half to seven years. At December 31, 2010, future awards of 312,549 shares could be made under approved incentive compensation plans.
The stock option plans also permit the granting of Stock Appreciation Rights (“SARs”). SARs entitle the holder to receive, in the form of cash or stock, the increase in the fair value of Company stock from the date of grant to the date of exercise. No SARs have been issued under the plans.
The Company’s net income for the year ended December 31, 2010, 2009, and 2008 included $1,301,000, $721,000, and $689,000 of compensation costs and $455,000, $252,000, and $241,000 of income tax benefits related to stock options granted under share-based compensation arrangements, respectively. The impact on basic and diluted earnings per share was $0.03 each for the year ended December 31, 2010, $0.04 each for the year ended December 31, 2009, and $0.04 and $0.03, respectively, for the year ended December 31, 2008.
The Company reported $637,000, $1,346,000, and $1,650,000 of excess tax benefits as financing cash inflows during the years ended December 31, 2010, 2009, and 2008, respectively, related to the exercise and vesting of share-based compensation grants. Net cash proceeds from the exercise of stock options were $1,631,000, $4,449,000, and $2,787,000 for the years ended December 31, 2010, 2009, and 2008.
The Company uses the Black-Scholes option pricing model to estimate the fair value of share-based awards with the following weighted-average assumptions for the indicated periods:
| For the Year Ended December 31, | ||||||||||||
| 2010 | 2009 | 2008 | ||||||||||
| Expected dividends |
2.3 | % | 2.1 | % | 2.1 | % | ||||||
| Expected volatility |
31.4 | % | 24.2 | % | 24.0 | % | ||||||
| Risk-free interest rate |
3.7 | % | 4.5 | % | 4.6 | % | ||||||
| Expected term (in years) |
6.0 | 7.0 | 7.0 | |||||||||
| Weighted-average grant-date fair value |
$ | 16.55 | $ | 15.45 | $ | 15.67 | ||||||
The assumptions above are based on multiple factors, including historical stock option exercise patterns and post-vesting employment termination behaviors, expected future exercise patterns and the expected volatility of the Company’s stock price.
At December 31, 2010, there was $5,170,000 of unrecognized compensation cost related to stock options which is expected to be recognized over a weighted-average period of 3.8 years.
The following table represents the activity related to stock options:
| Number of shares | Weighted average exercise price |
Weighted average remaining contract life |
||||||||||
| Outstanding options, December 31, 2007 |
1,536,883 | $ | 37.09 | |||||||||
| Granted |
26,500 | 47.45 | ||||||||||
| Exercised |
(178,953 | ) | 19.29 | |||||||||
| Forfeited or expired |
(26,689 | ) | 52.12 | |||||||||
| Outstanding options, December 31, 2008 |
1,357,741 | $ | 39.35 | |||||||||
| Granted |
98,600 | 53.22 | ||||||||||
| Exercised |
(192,682 | ) | 21.84 | |||||||||
| Forfeited or expired |
(3,785 | ) | 58.36 | |||||||||
| Outstanding options, December 31, 2009 |
1,259,874 | $ | 43.05 | |||||||||
| Granted |
120,866 | 59.67 | ||||||||||
| Exercised |
(69,057 | ) | 23.62 | |||||||||
| Forfeited or expired |
(10,144 | ) | 56.57 | |||||||||
| Outstanding options, December 31, 2010 |
1,301,539 | $ | 45.52 | 4.5 Years | ||||||||
| Outstanding exercisable at December 31, 2008 |
1,092,758 | $ | 35.11 | |||||||||
| Outstanding exercisable at December 31, 2009 |
946,463 | $ | 38.89 | |||||||||
| Outstanding exercisable at December 31, 2010 |
938,532 | $ | 41.12 | 3.3 Years | ||||||||
The following table presents the weighted average remaining life as of December 31, 2010 for options outstanding within the stated exercise prices:
| Options Outstanding | Options Exercisable | |||||||||||||||||||||
| Exercise Price Range Per Share |
Number of Options |
Weighted Average Exercise Price |
Weighted Average Remaining Life |
Number of Options |
Weighted Average Exercise Price |
|||||||||||||||||
| $19.51 to $29.90 |
190,036 | $ | 22.36 | 0.8 years | 190,036 | $ | 22.36 | |||||||||||||||
| $29.91 to $39.85 |
165,712 | 32.06 | 2.2 years | 165,712 | 32.06 | |||||||||||||||||
| $39.86 to $49.79 |
443,886 | 46.52 | 4.0 years | 419,028 | 46.55 | |||||||||||||||||
| $49.80 to $51.11 |
10,500 | 50.51 | 6.6 years | 4,929 | 50.71 | |||||||||||||||||
| $51.12 to $54.91 |
90,350 | 54.38 | 8.9 years | 18,514 | 54.40 | |||||||||||||||||
| $54.92 to $60.00 |
401,055 | 58.50 | 6.8 years | 140,313 | 58.00 | |||||||||||||||||
| Total options |
1,301,539 | $ | 45.52 | 4.5 years | 938,532 | $ | 41.12 | |||||||||||||||
Shares reserved for future stock option grants to employees and directors under existing plans were 312,549 at December 31, 2010. At December 31, 2010, the aggregate intrinsic value of shares underlying outstanding stock options and underlying exercisable stock options was $17,833,000 and $16,909,000. Total intrinsic value of options exercised was $2,314,000 for the year ended December 31, 2010.
Restricted stock plans
The Company issues restricted stock under various plans for certain officers and directors. A supplemental stock benefit plan adopted in 1999 and the 2001, 2005, 2008, and 2010 Incentive Plans allow grants of restricted stock. The plans allow for the issuance of restricted stock awards that may not be sold or otherwise transferred until certain restrictions have lapsed. The holders of the restricted stock receive dividends and have the right to vote the shares. The fair value of the restricted stock shares awarded under these plans is recorded as unearned share-based compensation, a contra-equity account. The unearned compensation related to these awards is amortized to compensation expense over the vesting period (generally three to seven years). The total share-based compensation expense for these awards is determined based on the market price of the Company’s common stock at the date of grant applied to the total number of shares granted and is amortized over the vesting period. As of December 31, 2010, unearned share-based compensation associated with these awards totaled $23,447,000. For the years ended December 31, 2010, 2009, and 2008, the amount included in compensation expense related to restricted stock grants was $6,187,000, $4,925,000, and $3,853,000, respectively. The weighted average grant date fair value of the restricted stock granted during the years ended December 31, 2010, 2009, and 2008 was $59.34, $45.84, and $47.26, respectively.
The following table represents unvested restricted stock award activity for the years ended December 31, 2010, 2009, and 2008, respectively:
| For the Year Ended December 31, | ||||||||||||
| 2010 | 2009 | 2008 | ||||||||||
| Balance, beginning of period |
550,518 | 414,788 | 401,917 | |||||||||
| Granted |
122,123 | 235,557 | 116,850 | |||||||||
| Forfeited |
(8,933 | ) | (5,367 | ) | (17,338 | ) | ||||||
| Earned and issued |
(124,513 | ) | (94,460 | ) | (86,641 | ) | ||||||
| Balance, end of period |
539,195 | 550,518 | 414,788 | |||||||||
401(k) profit sharing plan
The Company has a 401(k) Profit Sharing Plan covering substantially all of its employees. Annual employer contributions to the plan are set by the Board of Directors. The Company made contributions of $739,000, $723,000, and $651,000 for the years ended December 31, 2010, 2009, and 2008, respectively. The Plan provides, among other things, that participants in the Plan be able to direct the investment of their account balances within the Profit Sharing Plan into alternative investment funds. Participant deferrals under the salary reduction election may be matched by the employer based on a percentage to be determined annually by the employer.
Phantom stock awards
As part of the 2008 Incentive Compensation Plan and 2009 Phantom Stock Plan, the Company issues phantom stock awards to certain key officers and employees. The award is subject to a vesting period of seven years and is paid out in cash upon vesting. The amount paid per vesting period is calculated as the number of vested “share equivalents” multiplied by the closing market price of a share of the Company’s common stock on the vesting date. Share equivalents are calculated on the date of grant as the total award’s dollar value divided by the closing market price of a share of the Company’s common stock on the grant date. Award recipients are also entitled to a “dividend equivalent” on each unvested share equivalent held by the award recipient. A dividend equivalent is a dollar amount equal to the cash dividends that the participant would have been entitled to receive if the participant’s share equivalents were issued in shares of common stock. Dividend equivalents will be deemed to be reinvested as share equivalents that will vest and be paid out on the same date as the underlying share equivalents on which the dividend equivalents were paid. The number of share equivalents acquired with a dividend equivalent shall be determined by dividing the aggregate of dividend equivalents paid on the unvested share equivalents by the closing price of a share of the Company’s common stock on the dividend payment date.
The following table represents share and dividend equivalent share award activity during the years ended December 31, 2010, 2009 and 2008.
| Number of share equivalents |
Dividend equivalents |
Total share equivalents |
Value of
share equivalents(1) |
|||||||||||||
| Balance, December 31, 2007 |
— | — | — | $ | — | |||||||||||
| Granted |
34,947 | 403 | 35,350 | 1,696,800 | ||||||||||||
| Forfeited share equivalents |
— | — | — | — | ||||||||||||
| Vested share equivalents |
— | — | — | — | ||||||||||||
| Balance, December 31, 2008 |
34,947 | 403 | 35,350 | 1,696,800 | ||||||||||||
| Granted |
32,414 | 1,483 | 33,897 | 1,824,000 | ||||||||||||
| Forfeited share equivalents |
— | — | — | — | ||||||||||||
| Vested share equivalents |
— | — | — | — | ||||||||||||
| Balance, December 31, 2009 |
67,361 | 1,886 | 69,247 | $ | 3,726,000 | |||||||||||
| Granted |
58,124 | 2,847 | 60,971 | 3,605,000 | ||||||||||||
| Forfeited share equivalents |
(1,250 | ) | (9 | ) | (1,259 | ) | 74,000 | |||||||||
| Vested share equivalents |
(5,041 | ) | (983 | ) | (6,024 | ) | 356,000 | |||||||||
| Balance, December 31, 2010 |
119,194 | 3,741 | 122,935 | $ | 7,269,000 | |||||||||||
| (1) | Value of share equivalents is calculated based on the market price of the Company’s stock at the end of the respective periods. The market price of the Company’s stock was $59.13, $53.81 and $48.00 on December 31, 2010, 2009 and 2008, respectively. |
During the years ended December 31, 2010, 2009 and 2008, the Company recorded $381,000, $322,000 and $54,000, respectively, in compensation expense based on the number of share equivalents vested at the end of the period and the current market price of $59.13, $53.81, and $48.00 per share of common stock. There were no awards vested during the years ended December 31, 2009 and 2008 according to the vesting provisions of the plan and thus no cash payments were made to award recipients.
NOTE 19 – RELATED PARTY TRANSACTIONS
In the ordinary course of business, the Company has granted loans to executive officers and directors and their affiliates amounting to $705,000 and $1,277,000 at December 31, 2010 and 2009, respectively. During the year ended December 31, 2010, total principal additions were $67,000 and total principal payments were $444,000. Unfunded commitments to executive officers and directors and their affiliates totaled $179,000 and $45,000 at December 31, 2010 and 2009, respectively. None of the related party loans were classified as nonaccrual, past due, restructured or potential problem loans at December 31, 2010 or 2009.
Deposits from related parties held by the Company through IBERIABANK and IBERIABANK fsb at December 31, 2010 and 2009 amounted to $6,604,000 and $8,002,000, respectively.
NOTE 20 – COMMITMENTS AND CONTINGENCIES
Off-balance sheet commitments
The Company is a party to financial instruments with off-balance sheet risk in the normal course of business to meet the financing needs of its customers. These financial instruments include commitments to extend credit and standby letters of credit. Such commitments involve, to varying degrees, elements of credit and interest rate risk in excess of the amount recognized in the consolidated balance sheets. The same credit policies are used in these commitments as for on-balance sheet instruments. The Company’s exposure to credit loss in the event of nonperformance by the other parties is represented by the contractual amount of the financial instruments. At December 31, 2010, the fair value of guarantees under commercial and standby letters of credit was $334,000. This amount represents the unamortized fee associated with these guarantees and is included in the consolidated balance sheet of the Company. This fair value will decrease over time as the existing commercial and standby letters of credit approach their expiration dates.
At December 31, 2010 and 2009, the Company had the following financial instruments outstanding, whose contract amounts represent credit risk:
| Contract Amount | ||||||||
| (dollars in thousands) | 2010 | 2009 | ||||||
| Commitments to grant loans |
$ | 152,545 | $ | 131,145 | ||||
| Unfunded commitments under lines of credit |
1,121,895 | 1,014,145 | ||||||
| Commercial and standby letters of credit |
33,446 | 30,222 | ||||||
Commitments to extend credit are agreements to lend to a customer as long as there is no violation of any condition established in the contract. Commitments generally have fixed expiration dates or other termination clauses and may require payment of a fee. Since many of the commitments are expected to be drawn upon, the total commitment amounts generally represent future cash requirements. The Company evaluates each customer’s creditworthiness on a case-by-case basis. The amount of collateral, if deemed necessary by the Company upon extension of credit, is based on management’s credit evaluation of the counterparty.
Unfunded commitments under commercial lines-of-credit, revolving credit lines and overdraft protection agreements are commitments for possible future extensions of credit to existing customers. Many of these types of commitments do not contain a specified maturity date and may not be drawn upon to the total extent to which the Company is committed.
Legal proceedings
The nature of the business of the Company’s banking and other subsidiaries ordinarily results in a certain amount of claims, litigation, investigations and legal and administrative cases and proceedings, all of which are considered incidental to the normal conduct of business. Some of these claims are against entities or assets of which the Company is a successor or acquired in business acquisitions, and certain of these claims will be covered by loss sharing agreements with the FDIC. For additional information, see Note 4 to these consolidated financial statements. The Company believes it has meritorious defenses to the claims asserted against it in its currently outstanding legal proceedings and, with respect to such legal proceedings, intends to continue to defend itself vigorously, litigating or settling cases according to management’s judgment as to what is in the best interest of the Company and its shareholders.
The Company assesses its liabilities and contingencies in connection with outstanding legal proceedings utilizing the latest information available. Where it is probable that the Company will incur a loss and the amount of the loss can be reasonably estimated, the Company records a liability in its consolidated financial statements. These legal reserves may be increased or decreased to reflect any relevant developments on a quarterly basis. Where a loss is not probable or the amount of loss is not estimable, the Company does not accrue legal reserves. While the outcome of legal proceedings is inherently uncertain, based on information currently available, advice of counsel and available insurance coverage, the Company’s management believes that it has established adequate legal reserves. Any liabilities arising from pending legal proceedings are not expected to have a material adverse effect on the Company’s consolidated financial position, consolidated results of operations or consolidated cash flows. However, in the event of unexpected future developments, it is possible that the ultimate resolution of these matters, if unfavorable, may be material to the Company’s consolidated financial position, consolidated results of operations or consolidated cash flows.
IBERIABANK and the Company have been named as defendants in two putative class actions relating to the imposition of overdraft fees on customer accounts. The first such case, Eivet v. IBERIABANK, is pending in the United States District Court for the Southern District of Florida and presently bears Case No. 1:10-CV-23790-JLK. The case was originally filed in Florida and in October 2010 was transferred to the Southern District of Florida for coordinated pre-trial proceedings as part of a multi-district litigation involving numerous defendant banks, In re Checking Account Overdraft Litigation, Case No. 09-MD-02036-JLK. Plaintiff challenges IBERIABANK’s practices relating to the imposition of overdraft fees and non-sufficient fund fees on consumer checking accounts. Plaintiff alleges that IBERIABANK’s methodology for posting transactions to customer accounts is
designed to maximize the generation of overdraft fees and brings claims for breach of contract and of a covenant of good faith and fair dealing, unconscionability, conversion, unjust enrichment and violations of state unfair trade practices laws. Plaintiff seeks a range of remedies, including restitution, disgorgement, injunctive relief, punitive damages and attorneys’ fees.
The second of the two cases, Sachar v. IBERIABANK Corporation, Case No. 60CV2011-0770, was filed in Pulaski County, Arkansas Circuit Court on February 18, 2011. Plaintiff asserts that IBERIABANK Corporation engaged in the practice of re-sequencing customers’ accounts in high-to-low order by posting the largest transactions first and the smallest transactions last which is alleged to increase the number of overdraft fees. The complaint seeks damages for allegedly deceptive trade practices under Arkansas state law, for breach of contract, for unjust enrichment, for conversion, and for injunctive relief.
Currently there is uncertainty around whether either putative class will ultimately be certified, the dimensions of any such class, and the range of remedies that might be sought on any certified claims.
NOTE 21 – FAIR VALUE MEASUREMENTS
The Company follows the provisions of ASC Topic 820 when determining fair value. ASC Topic 820 clarifies the principle that fair value should be based on the assumptions market participants would use when pricing the asset or liability and establishes a fair value hierarchy that prioritizes the inputs used to develop those assumptions and measure fair value. The hierarchy requires the Company to maximize the use of observable inputs and minimize the use of unobservable inputs. The three levels of inputs used to measure fair value are as follows:
| • Level 1 - |
Quoted prices in active markets for identical assets or liabilities. | |
| • Level 2 - |
Observable inputs other than quoted prices included in Level 1, such as quoted prices for similar assets and liabilities in active markets; quoted prices for identical or similar assets and liabilities in markets that are not active; or other inputs that are observable or can be corroborated by observable market data. | |
| • Level 3 - |
Unobservable inputs that are supported by little or no market activity and that are significant to the fair value of the assets or liabilities. This includes certain pricing models, discounted cash flow methodologies and similar techniques that use significant unobservable inputs. | |
A description of the valuation methodologies used for instruments measured at fair value follows, as well as the classification of such instruments within the valuation hierarchy.
Securities available for sale
Securities are classified within Level 1 where quoted market prices are available in an active market. Inputs include securities that have quoted prices in active markets for identical assets. If quoted market prices are unavailable, fair value is estimated using quoted prices of securities with similar characteristics, at which point the securities would be classified within Level 2 of the hierarchy. Examples may include certain collateralized mortgage and debt obligations. The Company’s portfolio includes only one Level 3 security as of December 31, 2010. An other-than-temporary impairment was recorded on this security during the year ended December 31, 2010, and thus the security was recorded at management’s estimate of the security’s fair value based on the input assumptions discussed in detail below.
Mortgage loans held for sale
As of December 31, 2010, the Company has $83,905,000 of conforming mortgage loans held for sale. Mortgage loans originated and held for sale are carried at the lower of cost or estimated fair value. The Company obtains quotes or bids on these loans directly from purchasing financial institutions. Typically these quotes include a premium on the sale and thus these quotes indicate the fair value of the held for sale loans is greater than cost. At December 31, 2010, the entire balance of $83,905,000 is recorded at cost.
Impaired loans
Loans are measured for impairment using the methods permitted by ASC Topic 310. Fair value of impaired loans is measured by either the loans obtainable market price, if available (Level 1), the fair value of the collateral if the loan is collateral dependent (Level 2), or the present value of expected future cash flows, discounted at the loans effective interest rate (Level 3). Fair value of the collateral is determined by appraisals or independent valuation.
Other real estate owned
As of December 31, 2010, the Company has $69,217,000 in OREO and foreclosed property, which includes all real estate, other than bank premises used in bank operations, owned or controlled by the Company, including real estate acquired in settlement of loans. Properties are recorded at the balance of the loan or at estimated fair value less estimated selling costs, whichever is less, at the date acquired. Fair values of OREO at December 31, 2010 are determined by sales agreement or appraisal, and costs to sell are based on estimation per the terms and conditions of the sales agreement or amounts commonly used in real estate transactions. Inputs include appraisal values on the properties or recent sales activity for similar assets in the property’s market, and thus OREO measured at fair value would be classified within Level 2 of the hierarchy. In accordance with the OREO treatment described, the Company included property writedowns of $2,943,000 and $5,926,000 in earnings for the years ended December 31, 2010 and 2009, respectively.
Derivative financial instruments
The Company utilizes interest rate swap agreements to convert a portion of its variable-rate debt to a fixed rate (cash flow hedge). The Company also enters into commitments to originate loans whereby the interest rate on the prospective loan is determined prior to funding (“rate lock commitments”). Rate lock commitments on mortgage loans that are intended to be sold are considered to be derivatives. Fair value of the interest rate swap and interest rate lock commitments are estimated using prices of financial instruments with similar characteristics, and thus the commitments are classified within Level 2 of the fair value hierarchy.
The Company has segregated all financial assets and liabilities that are measured at fair value on a recurring basis into the most appropriate level within the fair value hierarchy based on the inputs used to determine the fair value at the measurement date in the table below.
| (dollars in thousands) | Fair Value Measurements Using | |||||||||||||||
| Quoted Prices in | Significant | Significant | ||||||||||||||
| Recurring Basis | Active Markets for | Other Observable | Unobservable | |||||||||||||
| Identical Assets | Inputs | Inputs | ||||||||||||||
| Description | December 31, 2010 | (Level 1) | (Level 2) | (Level 3) | ||||||||||||
| Assets |
||||||||||||||||
| Available -for-sale securities |
$ | 1,728,204 | $ | 54,926 | $ | 1,673,278 | $ | — | ||||||||
| Derivative instruments |
37,320 | — | 37,320 | — | ||||||||||||
| Total |
$ | 1,765,524 | $ | 54,926 | $ | 1,710,598 | $ | — | ||||||||
| Liabilities |
||||||||||||||||
| Derivative instruments |
22,906 | — | 22,906 | — | ||||||||||||
| Total |
$ | 22,906 | $ | — | $ | 22,906 | $ | — | ||||||||
Gains and losses (realized and unrealized) included in earnings (or changes in net assets) during 2010 related to assets and liabilities measured at fair value on a recurring basis are reported in noninterest income or other comprehensive income as follows:
| (dollars in thousands) | Noninterest income | Other comprehensive income |
||||||
| Total gains (losses) included in earnings (or changes in net assets) |
$ | 5,174 | $ | — | ||||
| Change in unrealized gains (losses) relating to assets still held at December 31, 2010 |
$ | — | $ | (7,736 | ) | |||
The Company has segregated all financial assets and liabilities that are measured at fair value on a nonrecurring basis into the most appropriate level within the fair value hierarchy based on the inputs used to determine the fair value at the measurement date in the table below.
| (dollars in thousands) | Fair Value Measurements Using | |||||||||||||||
| Quoted Prices in | Significant | Significant | ||||||||||||||
| Nonrecurring Basis | Active Markets for | Other Observable | Unobservable | |||||||||||||
| Identical Assets | Inputs | Inputs | ||||||||||||||
| Description | December 31, 2010 | (Level 1) | (Level 2) | (Level 3) | ||||||||||||
| Assets |
||||||||||||||||
| Loans |
$ | 6,532 | $ | — | $ | 6,532 | $ | — | ||||||||
| Available-for-sale securities |
1,590 | — | — | 1,590 | ||||||||||||
| OREO |
3,938 | — | 3,938 | — | ||||||||||||
| Total |
$ | 12,060 | $ | — | $ | 10,470 | $ | 1,590 | ||||||||
Assets and liabilities measured at fair value on a nonrecurring basis above do not include the assets acquired and liabilities assumed as part of the CSB, Orion, Century, and Sterling acquisitions. The fair values of the acquired assets and assumed liabilities would be classified in the table above as Level 2 for the investment securities and OREO properties acquired and Level 3 for the other assets acquired and the liabilities assumed. Fair value measurement of the acquired assets and liabilities is discussed further in Note 3.
In accordance with the provisions of ASC Topic 310, the Company records loans considered impaired at their fair value. A loan is considered impaired if it is probable the Company will be unable to collect all amounts due according to the contractual terms of the loan agreement. Fair value is measured at the fair value of the collateral for collateral-dependent loans. Impaired non-covered loans with an outstanding balance of $6,738,000 were recorded at their fair value at December 31, 2010. These loans include a reserve of $206,000 included in the Company’s allowance for loan losses.
The available-for-sale security included in the table above was recorded at its current market pricing, which includes an other-than-temporary impairment writedown for the year ended December 31, 2010. See Note 4 to these consolidated financial statements for additional information on the nature of the fair value adjustment.
Excluding liabilities recorded as part of the acquisitions, the Company did not record any liabilities at fair value for which measurement of the fair value was made on a nonrecurring basis during the year ended December 31, 2010.
ASC Topic 825 provides the Company with an option to report selected financial assets and liabilities at fair value. The fair value option established by this Statement permits the Company to choose to measure eligible items at fair value at specified election dates and report unrealized gains and losses on items for which the fair value option has been elected in earnings at each reporting date subsequent to implementation. The Company has currently chosen not to elect the fair value option for any items that are not already required to be measured at fair value in accordance with generally accepted accounting principles, and as such has not included any gains or losses in earnings for the year ended December 31, 2010.
NOTE 22 – FAIR VALUE OF FINANCIAL INSTRUMENTS
The fair value of a financial instrument is the current amount that would be exchanged between willing parties, other than in a forced liquidation. Fair value is best determined based upon quoted market prices. However, in many instances, there are no quoted market prices for the Company’s various financial instruments. In cases where quoted market prices are not available, fair values are based on estimates using present value or other valuation techniques. Those techniques are significantly affected by the assumptions used, including the discount rate and estimates of future cash flows. Accordingly, the fair value estimates may not be realized in an immediate settlement of the instrument. ASC Topic 825 excludes certain financial instruments and all non-financial instruments from its disclosure requirements. Accordingly, the aggregate fair value amounts presented may not necessarily represent the underlying fair value of the Company.
The following methods and assumptions were used to estimate the fair value of each class of financial instruments for which it is practicable to estimate that value:
Cash and cash equivalents
The carrying amounts of cash and short-term instruments approximate their fair value.
Investment securities
Fair value equals quoted market prices in an active market. If quoted market prices are unavailable, fair value is estimated using pricing models or quoted prices of securities with similar characteristics.
Loans
The fair value of non-covered mortgage loans receivable was estimated based on present values using entry-value rates at December 31, 2010 and 2009, weighted for varying maturity dates. Other non-covered loans receivable were valued based on present values using entry-value interest rates at December 31, 2010 and 2009 applicable to each category of loans. Fair values of mortgage loans held for sale are based on commitments on hand from investors or prevailing market prices. Covered loans are recorded in the consolidated financial statements at fair value in accordance with the fair value methodology prescribed in ASC Topic 820, exclusive of the shared-loss agreements with the FDIC. The fair value estimates associated with the loans include estimates related to expected prepayments and the amount and timing of undiscounted expected principal, interest and other cash flows.
Accrued Interest Receivable and Accrued Interest Payable: The carrying amount of accrued interest approximates fair value because of the short maturity of these financial instruments.
FDIC Loss Share Receivable: The fair value is determined to be projected cash flows from loss sharing agreements based on expected reimbursements for losses at the applicable loss sharing percentages based on the terms of the loss share agreements. Cash flows are discounted to reflect the timing and receipt of the loss sharing reimbursements from the FDIC.
Deposits
The fair value of NOW accounts, money market deposits and savings accounts was the amount payable on demand at the reporting date. Certificates of deposit were valued using a weighted average rate calculated based upon rates at December 31, 2010 and 2009 for deposits of similar remaining maturities.
Short-term borrowings
The carrying amounts of short-term borrowings maturing within ninety days approximate their fair values.
Long-term debt
The fair values of long-term debt are estimated using discounted cash flow analyses based on the Company’s current incremental borrowing rates for similar types of borrowing arrangements.
Derivative instruments
Fair values for interest rate swap agreements are based upon the amounts required to settle the contracts.
Off-balance sheet items
The Company has outstanding commitments to extend credit and standby letters of credit. These off-balance sheet financial instruments are generally exercisable at the market rate prevailing at the date the underlying transaction will be completed. At December 31, 2010 and 2009, the fair value of guarantees under commercial and standby letters of credit was immaterial.
The estimated fair values and carrying amounts of the Company’s financial instruments as of December 31 are as follows:
| 2010 | 2009 | |||||||||||||||
| (dollars in thousands) |
Carrying Amount |
Fair Value |
Carrying Amount |
Fair Value |
||||||||||||
| Financial Assets |
||||||||||||||||
| Cash and cash equivalents |
$ | 337,778 | $ | 337,778 | $ | 175,397 | $ | 175,397 | ||||||||
| Investment securities |
2,019,814 | 2,021,788 | 1,580,837 | 1,581,274 | ||||||||||||
| Loans and loans held for sale |
6,119,237 | 6,362,961 | 5,851,310 | 5,851,067 | ||||||||||||
| FDIC loss share receivable |
726,871 | 392,484 | 1,034,734 | 1,034,734 | ||||||||||||
| Derivative instruments |
37,320 | 37,320 | 32,697 | 32,697 | ||||||||||||
| Accrued interest receivable |
34,250 | 34,250 | 32,869 | 32,869 | ||||||||||||
| Financial Liabilities |
||||||||||||||||
| Deposits |
$ | 7,915,106 | $ | 7,764,569 | $ | 7,556,148 | $ | 7,367,867 | ||||||||
| Short-term borrowings |
220,328 | 220,328 | 263,351 | 263,351 | ||||||||||||
| Long-term debt |
432,251 | 441,902 | 745,864 | 743,361 | ||||||||||||
| Derivative instruments |
22,904 | 22,904 | 14,175 | 14,175 | ||||||||||||
| Accrued interest payable |
8,583 | 8,583 | 11,398 | 11,398 | ||||||||||||
The fair value estimates presented herein are based upon pertinent information available to management as of December 31, 2010 and 2009. Although management is not aware of any factors that would significantly affect the estimated fair value amounts, such amounts have not been comprehensively revalued for purposes of these financial statements since that date and, therefore, current estimates of fair value may differ significantly from the amounts presented herein.
NOTE 23 – SHAREHOLDERS’ EQUITY AND COMPREHENSIVE INCOME
Comprehensive income
Comprehensive income is the total of net income and all other non-shareholder changes in equity. Items recognized as components of comprehensive income or loss are displayed in the Company’s consolidated statements of changes in shareholders’ equity. The following is a summary of the changes in the components of other comprehensive income:
| Years Ended December 31, | ||||||||||||
| (dollars in thousands) | 2010 | 2009 | 2008 | |||||||||
| Balance at beginning of period |
$ | 10,376 | $ | 12,969 | $ | 5,869 | ||||||
| Unrealized gain (loss) on securities available for sale |
(2,620 | ) | 2,746 | 12,025 | ||||||||
| Reclassification adjustment for net (gains) losses realized in net income |
(5,172 | ) | (6,735 | ) | (1,102 | ) | ||||||
| Net unrealized gain (loss) |
(7,792 | ) | (3,989 | ) | 10,923 | |||||||
| Tax effect |
(2,726 | ) | (1,397 | ) | 3,823 | |||||||
| Net of tax change |
(5,066 | ) | (2,592 | ) | 7,100 | |||||||
| Balance at end of period |
$ | 5,310 | $ | 10,376 | $ | 12,969 | ||||||
| Balance at beginning of period |
$ | 12,040 | $ | (675 | ) | $ | (144 | ) | ||||
| Unrealized gain (loss) on cash flow hedges |
(4,109 | ) | 19,561 | (817 | ) | |||||||
| Tax effect |
1,439 | (6,847 | ) | 286 | ||||||||
| Net of tax change |
(2,670 | ) | 12,714 | (531 | ) | |||||||
| Balance at end of period |
9,370 | 12,040 | (675 | ) | ||||||||
| Total change in other comprehensive income (loss), net of income taxes |
(7,736 | ) | 10,122 | 6,569 | ||||||||
| Total balance in other comprehensive income (loss), net of income taxes |
$ | 14,680 | $ | 22,416 | $ | 12,294 | ||||||
Public stock offering – March 8, 2010
On March 8, 2010, the Company completed the sale of 5,973,207 shares of its common stock in an underwritten public offering at a price of $57.75 per share. The shares include 778,402 shares pursuant to the exercise of the underwriters’ over-allotment option. The net proceeds of the offering, after deducting underwriting discounts and commissions and estimated offering expenses, were $328,980,000.
Redemption of preferred stock
On December 5, 2008, the Company completed the issuance and sale of 90,000 shares of its $1.00 par value, $1,000 liquidation value Fixed Rate Cumulative Perpetual Preferred Stock, Series A (“preferred stock”), to the U.S. Department of the Treasury as part of the announced Capital Purchase Program (“CPP”). The preferred shares included a 10-year warrant to purchase up to 138,490 shares of the Company’s common stock at an exercise price of $48.74 per share, for an aggregate purchase price of $6,750,000. The exercise price of the warrant and the market price for determining the number of shares of common stock subject to the warrant, were determined on the date of the preferred investment (calculated on a 20-trading day trailing average).
The fair value allocation of the $90,000,000 proceeds between the preferred shares and the warrant resulted in $87,779,000 allocated to the preferred shares and $2,221,000 allocated to the warrant. The issuance required the Company to pay the U.S. Treasury a 5.0% annual dividend on a quarterly basis, or $4,500,000 annually, for each of the first five years of the investment, and 9.0% thereafter.
On February 26, 2009, the Company announced it had filed notice to the U.S. Treasury that the Company would redeem all of the 90,000 outstanding shares of its preferred stock at a total redemption price of $90,575,000, which included the unpaid accrued interest. On the March 31, 2009 redemption date, the Company paid $90,575,000 to the U.S Treasury to redeem the preferred stock. At the time of payment, all rights of the Treasury, as the holder of the preferred stock, terminated. At the time of payment, the preferred stock had a carrying value of $87,843,000. The remaining $2,732,000 included an accrued dividend of $575,000 and an accelerated deemed dividend of $2,157,000. As a result, for the year ended December 31, 2009, the dividend paid on the preferred shares totaled $3,350,000.
NOTE 24 – RESTRICTIONS ON DIVIDENDS, LOANS AND ADVANCES
IBERIABANK is restricted under applicable laws in the payment of dividends to an amount equal to current year earnings plus undistributed earnings for the immediately preceding year, unless prior permission is received from the Commissioner of Financial Institutions for the State of Louisiana. Dividends payable by IBERIABANK in 2011 without permission will be limited to 2011 earnings plus an additional $65,439,000.
IBERIABANK fsb is restricted under applicable laws in the payment of dividends to an amount equal to current year earnings plus undistributed earnings for the immediately preceding two years, unless prior permission is received from the Office of Thrift Supervision. Because IBERIABANK fsb reported an undistributed loss for the preceding two years that exceeds undistributed earnings for the year ended December, 31, 2010, IBERIABANK fsb will not be able to pay dividends in 2011 without permission.
Funds available for loans or advances by IBERIABANK or IBERIABANK fsb to the Company amounted to $99,132,000. In addition, dividends paid by IBERIABANK or IBERIABANK fsb to the Company would be prohibited if the effect thereof would cause IBERIABANK’s or IBERIABANK fsb’s capital to be reduced below applicable minimum capital requirements.
NOTE 25 – CONDENSED PARENT COMPANY ONLY FINANCIAL STATEMENTS
Condensed financial statements of IBERIABANK Corporation (parent company only) are shown below. The parent company has no significant operating activities.
Condensed Balance Sheets
December 31, 2010 and 2009
| (dollars in thousands) | 2010 | 2009 | ||||||
| Assets |
||||||||
| Cash in bank |
$ | 234,006 | $ | 62,025 | ||||
| Investment in subsidiaries |
1,123,168 | 960,305 | ||||||
| Other assets |
49,980 | 53,028 | ||||||
| Total assets |
$ | 1,407,154 | $ | 1,075,358 | ||||
| Liabilities and Shareholders’ Equity |
||||||||
| Liabilities |
$ | 103,697 | $ | 114,040 | ||||
| Shareholders’ equity |
1,303,457 | 961,318 | ||||||
| Total liabilities and shareholders’ equity |
$ | 1,407,154 | $ | 1,075,358 | ||||
Condensed Statements of Income
Years Ended December 31, 2010, 2009 and 2008
| (dollars in thousands) | 2010 | 2009 | 2008 | |||||||||
| Operating income |
||||||||||||
| Dividends from subsidiaries |
$ | — | $ | — | $ | 25,200 | ||||||
| Reimbursement of management expenses |
41,313 | 34,280 | 28,980 | |||||||||
| Other income |
1,209 | 1,544 | 343 | |||||||||
| Total operating income |
42,522 | 35,824 | 54,523 | |||||||||
| Operating expenses |
||||||||||||
| Interest expense |
3,865 | 4,464 | 7,383 | |||||||||
| Salaries and employee benefits expense |
49,816 | 35,719 | 27,483 | |||||||||
| Other expenses |
24,744 | 16,241 | 11,971 | |||||||||
| Total operating expenses |
78,425 | 56,424 | 46,837 | |||||||||
| Income (loss) before income tax (expense) benefit and increase in equity in undistributed earnings of subsidiaries |
(35,903 | ) | (20,600 | ) | 7,686 | |||||||
| Income tax benefit |
12,113 | 7,108 | 5,933 | |||||||||
| Income (loss) before equity in undistributed earnings of subsidiaries |
(23,790 | ) | (13,492 | ) | 13,619 | |||||||
| Equity in undistributed earnings of subsidiaries |
72,616 | 171,845 | 26,293 | |||||||||
| Net income |
48,826 | 158,354 | 39,912 | |||||||||
| Preferred Stock Dividends |
— | (3,350 | ) | (348 | ) | |||||||
| Income available to common shareholders |
$ | 48,826 | $ | 155,004 | $ | 39,564 | ||||||
Condensed Statements of Cash Flows
Years Ended December 31, 2010, 2009, and 2008
| (dollars in thousands) | 2010 | 2009 | 2008 | |||||||||
| Cash flows from operating activities |
||||||||||||
| Net income |
$ | 48,826 | $ | 158,354 | $ | 39,912 | ||||||
| Adjustments to reconcile net income to net cash provided by operating activities: |
||||||||||||
| Depreciation and amortization |
(892 | ) | (937 | ) | (226 | ) | ||||||
| Net income of subsidiaries |
(72,616 | ) | (171,845 | ) | (40,793 | ) | ||||||
| Noncash compensation expense |
7,797 | 6,586 | 5,106 | |||||||||
| Gain on sale of assets |
(3 | ) | — | (3 | ) | |||||||
| Derivative (gains) losses on swaps |
— | (198 | ) | (549 | ) | |||||||
| Increase in dividend receivable from subsidiaries |
— | — | — | |||||||||
| Cash retained from tax benefit associated with share-based payment arrangements |
(637 | ) | (1,346 | ) | (1,650 | ) | ||||||
| Other, net |
(5,953 | ) | (13,649 | ) | 12,105 | |||||||
| Net cash (used in) provided by operating activities |
(23,478 | ) | (23,035 | ) | 13,902 | |||||||
| Cash flows from investing activities |
||||||||||||
| Cash received in excess of cash paid in acquisition |
— | — | 128,464 | |||||||||
| Proceeds from sale of premises and equipment |
3 | — | 17 | |||||||||
| Purchases of premises and equipment |
(4,586 | ) | (1,217 | ) | 487 | |||||||
| Capital contributed to subsidiary |
(94,561 | ) | (130,730 | ) | — | |||||||
| Acquisition |
(733 | ) | — | (163,487 | ) | |||||||
| Net cash used in investing activities |
(99,877 | ) | (131,947 | ) | (34,519 | ) | ||||||
| Cash flows from financing activities |
||||||||||||
| Dividends paid to shareholders |
(34,412 | ) | (23,355 | ) | (17,870 | ) | ||||||
| Proceeds from long-term debt |
— | — | 7,000 | |||||||||
| Common stock issued |
328,980 | 164,644 | 109,855 | |||||||||
| Preferred stock and common stock warrants (repaid) issued |
— | (89,078 | ) | 90,000 | ||||||||
| Repayments of long-term debt |
— | (8,333 | ) | (6,667 | ) | |||||||
| Costs of issuance of common stock |
— | — | — | |||||||||
| Payments to repurchase common stock |
(1,500 | ) | (979 | ) | (762 | ) | ||||||
| Proceeds from sale of treasury stock for stock options exercised |
1,631 | 4,449 | 2,787 | |||||||||
| Cash retained from tax benefit associated with share-based payment arrangements |
637 | 1,346 | 1,650 | |||||||||
| Net cash provided by financing activities |
295,336 | 48,694 | 185,993 | |||||||||
| Net (decrease) increase in cash and cash equivalents |
171,981 | (106,288 | ) | 165,376 | ||||||||
| Cash and cash equivalents at beginning of period |
62,025 | 168,313 | 2,937 | |||||||||
| Cash and cash equivalents at end of period |
$ | 234,006 | $ | 62,025 | $ | 168,313 | ||||||
NOTE 26 – QUARTERLY RESULTS OF OPERATIONS (UNAUDITED)
| (dollars in thousands, except per share data) | First Quarter |
Second Quarter |
Third Quarter |
Fourth Quarter |
||||||||||||
| Year ended December 31, 2010 |
||||||||||||||||
| Total interest income |
$ | 97,620 | $ | 101,217 | $ | 99,818 | $ | 97,716 | ||||||||
| Total interest expense |
28,414 | 31,078 | 29,885 | 25,367 | ||||||||||||
| Net interest income |
69,206 | 70,139 | 69,933 | 72,349 | ||||||||||||
| Provision for loan losses |
13,201 | 12,899 | 5,128 | 11,224 | ||||||||||||
| Net interest income after provision for loan losses |
56,005 | 57,240 | 64,805 | 61,125 | ||||||||||||
| Gain (Loss) on sale of investments, net |
922 | 60 | 4,176 | 93 | ||||||||||||
| Other noninterest income |
27,431 | 30,644 | 32,605 | 37,959 | ||||||||||||
| Noninterest expense |
67,000 | 75,775 | 80,371 | 81,102 | ||||||||||||
| Income before income taxes |
17,358 | 12,169 | 21,215 | 18,075 | ||||||||||||
| Income tax expense |
4,354 | 3,329 | 7,275 | 5,033 | ||||||||||||
| Net income |
$ | 13,004 | $ | 8,840 | $ | 13,940 | $ | 13,042 | ||||||||
| Preferred stock dividends |
— | — | — | — | ||||||||||||
| Income available to common shareholders |
$ | 13,004 | $ | 8,840 | $ | 13,940 | $ | 13,042 | ||||||||
| Earnings allocated to unvested restricted stock |
(252 | ) | (189 | ) | (288 | ) | (261 | ) | ||||||||
| Earnings available to common shareholders - Diluted |
$ | 12,752 | $ | 8,651 | $ | 13,652 | $ | 12,781 | ||||||||
| Earnings per share – basic |
$ | 0.60 | $ | 0.33 | $ | 0.52 | $ | 0.49 | ||||||||
| Earnings per share – diluted |
0.59 | 0.33 | 0.52 | 0.48 | ||||||||||||
| The results of operations for the fourth quarter of 2009 have been restated from the previously disclosed amounts to reflect the correction of an error from the Orion acquisition. See Note 1 to these consolidated financial statements for additional information. | ||||||||||||||||
| (dollars in thousands, except per share data) | First Quarter |
Second Quarter |
Third Quarter |
Fourth Quarter |
||||||||||||
| Year Ended December 31, 2009 |
||||||||||||||||
| Total interest income |
$ | 60,321 | $ | 60,974 | $ | 63,554 | $ | 85,538 | ||||||||
| Total interest expense |
24,034 | 22,698 | 22,888 | 27,981 | ||||||||||||
| Net interest income |
36,287 | 38,276 | 40,666 | 57,557 | ||||||||||||
| Provision for loan losses |
3,032 | 7,783 | 25,295 | 9,260 | ||||||||||||
| Net interest income after provision for loan losses |
33,255 | 30,493 | 15,371 | 48,297 | ||||||||||||
| Gain (Loss) on sale of investments, net |
3 | 5,879 | (25 | ) | 878 | |||||||||||
| Other noninterest income |
23,727 | 26,151 | 81,259 | 206,665 | ||||||||||||
| Noninterest expense |
43,792 | 49,814 | 54,540 | 75,114 | ||||||||||||
| Income before income taxes |
13,193 | 12,709 | 42,065 | 180,726 | ||||||||||||
| Income tax expense |
4,048 | 4,235 | 17,113 | 64,942 | ||||||||||||
| Net income |
$ | 9,145 | $ | 8,474 | 24,952 | $ | 115,784 | |||||||||
| Preferred stock dividends |
(3,350 | ) | — | — | — | |||||||||||
| Income available to common shareholders |
$ | 5,795 | $ | 8,474 | $ | 24,952 | $ | 115,784 | ||||||||
| Earnings allocated to unvested restricted stock |
(169 | ) | (250 | ) | (608 | ) | (2,888 | ) | ||||||||
| Earnings available to common shareholders - Diluted |
$ | 5,626 | $ | 8,224 | $ | 24,344 | $ | 112,896 | ||||||||
| Earnings per share – basic |
$ | 0.36 | $ | 0.53 | $ | 1.23 | $ | 5.61 | ||||||||
| Earnings per share – diluted |
0.36 | 0.52 | 1.22 | 5.56 | ||||||||||||