Attached files
Table of Contents
UNITED STATES
SECURITIES AND EXCHANGE COMMISSION
Washington, D.C. 20549
FORM 10-K
| x | ANNUAL REPORT PURSUANT TO SECTION 13 OR 15(d) OF THE SECURITIES EXCHANGE ACT OF 1934 |
For the fiscal year ended December 31, 2010
OR
| ¨ | TRANSITION REPORT PURSUANT TO SECTION 13 OR 15(d) OF THE SECURITIES EXCHANGE ACT OF 1934 |
For the transition period from to .
Commission file number: 000-50050
CENTER FINANCIAL CORPORATION
(Exact Name of Registrant as Specified in its Charter)
| California | 52-2380548 | |
| (State or Other Jurisdiction of Incorporation or Organization) | (IRS Employer Identification No.) |
3435 Wilshire Boulevard, Suite 700 Los Angeles, California 90010
(Address of Principal Executive Offices) (Zip Code)
(213) 251-2222
Registrant’s telephone number, including area code
Securities registered pursuant to Section 12(b) of the Act:
| Title of Each Class |
Name of Each Exchange on Which Registered | |
| Common Stock, No Par Value | The NASDAQ Stock Market LLC |
Securities registered pursuant to Section 12(g) of the Act: None
Indicate by check mark if the registrant is a well-known seasoned issuer, as defined in rule 405 of the Securities Act. ¨ Yes x No
Indicate by check mark if the registrant is not required to file reports pursuant to Section 13 or 15 (d) of the Act. ¨ Yes x No
Indicate by check mark whether the registrant (1) has filed all reports required to be filed by Section 13 or 15(d) of the Securities Exchange Act of 1934 during the preceding 12 months (or for such shorter period that the registrant was required to file such reports), and (2) has been subject to such filing requirements for the past 90 days. x Yes ¨ No
Indicate by check mark whether the registrant has submitted electronically and posted on its corporate Web site, if any, every Interactive Data File required to be submitted and posted pursuant to Rule 405 of Regulation S-T (§232.405 of this chapter) during the preceding 12 months (or for such shorter period that the registrant was required to submit and post such files). ¨ Yes ¨ No
Indicate by check mark if disclosure of delinquent filers pursuant to Item 405 of Regulation S-K (§ 229.405 of this chapter) is not contained herein, and will not be contained, to the best of registrant’s knowledge, in definitive proxy or information statements incorporated by reference in Part III of this Form 10-K or any amendment to this Form 10-K. x
Indicate by check mark whether the registrant is a “large accelerated filer”, an “accelerated filer”, a “non-accelerated filer” or a “smaller reporting company”. See definition of “accelerated filer and large accelerated filer” in Rule 12b-2 of Exchange Act:
| Large accelerated filer |
¨ | Accelerated Filer | x | Non-accelerated filer | ¨ | Smaller reporting company | ¨ | |||||||
| (Do not check if a smaller reporting company) |
||||||||||||||
Indicate by check mark whether the registrant is a shell company (as defined in rule 12b-2 of the Act). ¨ Yes x No
As of June 30, 2010, the aggregate market value of the voting stock held by nonaffiliates of the Registrant computed by reference to the reported closing sale price of $5.15 on such date was $182.8 million. Excluded from this computation are 4,407,141 shares held by all directors and executive officers as a group on that date.
This determination of the affiliate status is not necessarily a conclusive determination for other purposes.
The number of shares of Common Stock of the registrant outstanding as of February 28, 2011 was 39,893,864.
DOCUMENTS INCORPORATED BY REFERENCE:
Portions of the definitive proxy statement for the 2011 Annual Meeting of Shareholders to be filed with the Securities and Exchange Commission pursuant to SEC Regulation 14A are incorporated by reference in Part III, Items 10-14.
Table of Contents
| PART I | 3 | |||||
| ITEM 1. | 3 | |||||
| ITEM 1A. | 17 | |||||
| ITEM 1B. | 31 | |||||
| ITEM 2. | 31 | |||||
| ITEM 3. | 32 | |||||
| ITEM 4. | 32 | |||||
| PART II | 33 | |||||
| ITEM 5. | 33 | |||||
| ITEM 6. | 36 | |||||
| ITEM 7. | MANAGEMENT’S DISCUSSION AND ANALYSIS OF FINANCIAL CONDITION AND RESULTS OF OPERATIONS |
38 | ||||
| ITEM 7A. | 71 | |||||
| ITEM 8. | 72 | |||||
| ITEM 9. | CHANGES IN AND DISAGREEMENTS WITH ACCOUNTANTS ON ACCOUNTING AND FINANCIAL DISCLOSURE |
131 | ||||
| ITEM 9A. | 131 | |||||
| ITEM 9B. | 134 | |||||
| PART III | 135 | |||||
| ITEM 10. | 135 | |||||
| ITEM 11. | 135 | |||||
| ITEM 12. | SECURITY OWNERSHIP OF CERTAIN BENEFICIAL OWNERS AND MANAGEMENT AND RELATED SHAREHOLDER MATTERS |
135 | ||||
| ITEM 13. | CERTAIN RELATIONSHIPS AND RELATED TRANSACTIONS AND DIRECTOR INDEPENDENCE |
135 | ||||
| ITEM 14. | 135 | |||||
| PART IV | 136 | |||||
| ITEM 15. | 136 | |||||
| SIGNATURES | 138 | |||||
Table of Contents
Forward-Looking Statements
This Annual Report on Form 10-K contains forward-looking statements within the meaning of Section 27A of the Securities Act of 1933, as amended (the “Securities Act”), and Section 21E of the Securities Exchange Act of 1934, as amended (the “Exchange Act”). Such statements are based on the current beliefs of the Company’s management as well as assumptions made by and information currently available to management. All statements other than statements of historical fact included in this Annual Report, including without limitation, statements under “Recent Developments,” “Risk Factors,” “Legal Proceedings,” “Management’s Discussion and Analysis of Financial Condition and Results of Operations,” and “Business” regarding the Company’s financial position, business strategy and plans and objectives of management for future operations, are forward-looking statements. Forward-looking statements often use words such as “anticipate,” “believe,” “estimate,” “expect”, “seek”, “plan” and “intend” and words or phrases of similar meaning. Although management believes that the expectations reflected in such forward-looking statements are reasonable, it can give no assurance that such expectations will prove to have been correct. Risk factors that could cause actual results to differ materially from those described in forward-looking statements are disclosed in Item 1A of this Annual Report, and include, but are not limited to, continued deterioration in economic conditions in the Company’s service areas; risks associated with fluctuations in interest rates; liquidity risks; increases in nonperforming assets and net credit losses that could occur, particularly in times of weak economic conditions or rising interest rates; the Company’s ability to secure buyers for foreclosed properties; the loss in market value of available-for-sale securities that could result if interest rates change substantially or an issuer has real or perceived financial difficulties; risks associated with the pending merger with Nara Bancorp, including risks and uncertainties relating to the receipt of regulatory and shareholder approvals and the satisfaction of other conditions to the closing, the integration of the companies’ businesses and the anticipated cost savings arising from the merger; the Company’s ability to attract and retain skilled employees; customer disintermediation and competitive product and pricing pressures in the geographic and business areas in which the Company conducts its operations; and the Company’s ability to successfully deploy new technology. Based upon changing conditions, or if any one or more of these risks or uncertainties materialize, or if any underlying assumptions prove incorrect, actual results may vary materially from those expressed or implied herein. The Company disclaims any obligations or undertaking to publicly release any updates or revisions to any forward-looking statement contained herein (or elsewhere) to reflect any change in the Company’s expectations with regard thereto or any change in events, conditions or circumstances on which any such statement is based.
GENERAL
Center Financial Corporation
Center Financial Corporation (“Center Financial”) is a California corporation registered as a bank holding company under the Bank Holding Company Act of 1956, as amended (the “BHC Act”), and is headquartered in Los Angeles, California. Center Financial was incorporated in April 2000 and acquired all of the outstanding shares of Center Bank (the “Bank”) in October 2002. Center Financial’s principal subsidiary is Center Bank. Center Financial exists primarily for the purpose of holding the stock of the Bank and of such other subsidiaries as it may acquire or establish. Currently, Center Financial’s only other direct subsidiary is Center Capital Trust I, a Delaware statutory business trust that was formed in December 2003 solely to facilitate the issuance of capital trust pass-through securities. (See Note 16 to the Financial Statements in Item 8 herein.) As used herein, the term “Center Financial” is used to designate Center Financial Corporation only, the term the “Bank” is used to designate Center Bank, and the term the “Company”, “we”, “us”, or “our” refers collectively to Center Financial Corporation, the Bank and Center Capital Trust I, unless the context otherwise requires.
Center Financial’s principal source of income has historically been dividends from the Bank, though payment of such dividends currently requires prior regulatory approval due to an informal agreement entered into with the Federal Deposit Insurance Corporation (the “FDIC”) and the California Department of Financial Institutions (the “DFI”) (see “Current Developments—Informal Regulatory Agreements”). The payment of dividends by Center Financial and the Bank is further restricted under federal and state law. In particular, since the Bank’s losses in 2009 exceeded combined earnings for 2008 and 2010, the Bank must obtain prior DFI approval before paying dividends pursuant to the California Financial Code (see “Item 5—MARKET FOR REGISTRANT’S COMMON EQUITY, RELATED SHAREHOLDER MATTERS AND ISSUER PURCHASES OF EQUITY SECURITIES—Dividends”). Center Financial also intends to explore supplemental sources of income in the future. Expenditures, including (but not limited to) the payment of dividends to shareholders, if and when declared by the board of directors, and the cost of servicing debt, will generally be paid from such payments made to Center Financial by the Bank. The Company’s liabilities include $18.6 million in debt obligations due to Center Capital Trust I, related to capital trust pass-through securities issued by that entity.
3
Table of Contents
At December 31, 2010, the Company had consolidated assets of $2.3 billion, deposits of $1.8 billion and shareholders’ equity of $274.0 million.
The Company’s and the Bank’s headquarters are located at 3435 Wilshire Boulevard, Suite 700, Los Angeles, California 90010 and its telephone number is (213) 251-2222. Our Website address is www.centerbank.com. Information contained on the website is not part of this report.
Center Bank
The Bank is a California state-chartered and FDIC-insured financial institution, which was incorporated in 1985 and commenced operations in March 1986. The Bank provides comprehensive financial services for small to medium sized business owners, primarily in Southern California. The Bank specializes in commercial loans, most of which are secured by real property, to small business customers. In addition, the Bank is a Preferred Lender of Small Business Administration (“SBA”) loans and provides trade finance loans. The Bank’s primary market is the Southern California area including Los Angeles, Orange, San Bernardino, and San Diego counties, primarily focused in areas with high concentrations of Korean-Americans. The Bank currently has 22 full-service branch offices, 16 of which are located in Southern California. The Bank also operates three branches in Northern California which it acquired through an FDIC-assisted acquisition in April 2010. The Bank also operates Loan Production Offices in Seattle and Denver.
The Bank’s primary focus is on small to medium sized Korean-American businesses, professionals and other individuals in its market area, with particular emphasis on the growth of deposits, the origination of commercial and real estate secured loans and consumer banking services. The Bank offers bilingual services to its customers in English and Korean and has a network of ATM’s located in twenty of its branch offices.
The Bank engages in a full complement of lending activities, including the origination of construction loans, commercial real estate loans, commercial business loans, working capital lines, SBA loans, trade financing, automobile loans and other personal loans. The Bank has offered SBA loans since 1989, providing financing for various purposes for small businesses under guarantee of the SBA, a federal agency created to provide financial assistance for small businesses. The Bank is a Preferred SBA Lender with full loan approval authority on behalf of the SBA.
The Bank regularly sells a portion of the guaranteed and unguaranteed portion of the SBA loans it originates. The Bank retains the obligation to service the loans and receives a servicing fee. As of December 31, 2010 and 2009, the Bank was servicing $270.0 million and $113.0 million of sold SBA loans, respectively.
As of December 31, 2010, the principal areas of focus related to the Bank’s lending activities, and the percentage of total loan portfolio composition for each of these areas, were as follows: commercial real estate loans 60.8% and commercial business loans 19.7%. The Bank funds its lending activities primarily with demand deposits, savings and time deposits (obtained through its branch network) and Federal Home Loan Bank (“FHLB”) borrowings. The Bank’s deposit products include demand deposit accounts, money market accounts, and savings accounts, time certificates of deposit and fixed maturity installment savings. The Bank’s deposits are insured under the Federal Deposit Insurance Act, up to the maximum applicable limits thereof. Like most state-chartered banks of the Bank’s size in California, it is not currently a member of the Federal Reserve System. As of December 31, 2010, the Bank had approximately 56,000 deposit accounts with balances totaling approximately $1.8 billion. As of December 31, 2010, the Bank had $397.0 million or 22.4% in non-interest bearing demand deposits; $471.1 million or 26.6% in money market and Negotiable Order Withdrawal (“NOW”) checking accounts; $87.5 million or 4.9% in savings accounts; $334.3 million or 18.9% in time deposits less than $100,000; and $481.1 million or 27.2% in time deposits of $100,000 or more. As of December 31, 2010, the Bank had $115.0 million of State municipal time deposits and $101.2 million of brokered deposits.
The Bank also offers international banking services such as letters of credit, acceptances and wire transfers, as well as merchant deposit services, cash management services, travelers’ checks, debit cards and safe deposit boxes.
The Bank provides Internet banking services to allow its customers to access their loan and deposit accounts through the Internet. Customers can obtain transaction history and account information, transfer funds between the Bank’s accounts and process bill payments.
The Bank does not hold any patents or licenses (other than licenses required to be obtained from appropriate banking regulatory agencies), franchises or concessions. The Bank’s business is generally not seasonal. Federal, state and local environmental regulations have not had any material effect upon our capital expenses, earnings or competitive position.
The majority of the Bank’s customers are Korean-American small businesses and individuals. Approximately 60.8% of the Bank’s loan portfolio as of December 31, 2010 was concentrated in commercial real estate loans. Most of our customers are
4
Table of Contents
concentrated in the greater Los Angeles area but continuous efforts have been made to diversify the geographic risk with branches in Northern California, San Diego, Chicago and Seattle.
The Bank has not engaged in any material research activities relating to the development of new services or the improvement of existing banking services during the last three fiscal years. However, the Bank, with its officers and employees, is engaged continually in marketing activities, including the evaluation and development of new services, which enable it to retain and improve our competitive position in our service area.
Recent Developments
Merger Agreement with Nara Bancorp
On December 9, 2010, Center Financial and Nara Bancorp, Inc. (“Nara Bancorp”) entered into a definitive agreement to merge. Under the terms of the merger agreement, Center Financial shareholders will receive a fixed ratio of 0.7804 of a share of Nara Bancorp common stock in exchange for each share of Center Financial common stock they own. At the closing date of merger, Nara Bancorp shareholders will own approximately 55% of the combined company and Center Financial shareholders will own approximately 45%. The combined company will operate under a new name that will be determined prior to the closing. In addition, at the closing or as soon as possible thereafter, it is anticipated that Nara Bank, a California state-chartered bank and a wholly owned subsidiary of Nara Bancorp, will merge with and into the Bank, with the Bank as the surviving bank after the bank merger.
The boards of directors of both companies have unanimously approved the transaction. The transaction is subject to regulatory approval, the approval of the shareholders of both Center Financial and Nara Bancorp, and other customary closing conditions. We anticipate that the regulatory approval process will take several months and, therefore, do not expect to complete the merger before the second half of 2011. There is no assurance, however, that the bank regulators will approve the merger within our anticipated time frame, or at all.
Please see our current report on Form 8-K filed with the Securities and Exchange Commission (“SEC”) on December 9, 2010 for a more complete description of the merger agreement. In addition, in connection with the proposed merger, Nara Bancorp will file with the SEC a Registration Statement on Form S-4 that will include a Joint Proxy Statement/Prospectus of Center Financial and Nara Bancorp, as well as other relevant documents concerning the proposed transaction. Shareholders are urged to read the Registration Statement and the Joint Proxy Statement/Prospectus regarding the merger when it becomes available and any other relevant documents filed with the SEC, as well as any amendments or supplements to those documents, because they will contain important information. You will be able to obtain a free copy of the Joint Proxy Statement/Prospectus, as well as other filings containing information about Center Financial and Nara Bancorp at the SEC’s Internet site (www.sec.gov). You will also be able to obtain these documents, free of charge, from Center Financial at www.centerbank.com under the tab “Investor Relations” and then under the heading “SEC Filings”.
FDIC-assisted Acquisition
On April 16, 2010, the DFI closed Innovative Bank, Oakland, California, and appointed the FDIC as its receiver. On the same date, Center Bank assumed the banking operations of Innovative Bank from the FDIC under a purchase and assumption agreement with loss sharing. Through this agreement, Center Bank now operates three additional branches in California.
Center Bank assumed both the insured and non-insured deposits balance, at a premium of 0.5 percent. The loss sharing agreement between the FDIC and Center Bank, which covers all loans and other real estate owned that have been assumed and the business combination fair value adjustments, mitigates the risk of future loss on the loan portfolio acquired. Under the terms of the loss sharing agreement, the FDIC will absorb 80% of losses and share in 80% of loss recoveries. The reimbursed losses from the FDIC are based on the book value of the relevant loan as determined by the FDIC at the date of the assumption. New loans made after that date are not covered by the loss sharing agreement.
Informal Regulatory Agreements
Effective December 28, 2010, the Bank entered into a memorandum of understanding (“MOU”) with the FDIC and the DFI replacing the previous MOU dated December 18, 2009. The MOU is an informal administrative agreement pursuant to which the Bank has agreed to take various actions and comply with certain requirements to facilitate improvement in its financial condition. In accordance with the MOU, the Bank agreed among other things to (a) develop and implement strategic plans to restore profitability; (b) maintain a Leverage Capital Ratio of not less than 9% and a Total Risk-Based Capital Ratio of not less than 13%; (c) refrain from paying dividends without prior written regulatory approval; (d) eliminate all or half its assets classified “Loss” or “Doubtful”; (e) reduce the combined total of assets classified “Substandard” or “Doubtful” to not more than
5
Table of Contents
40% of Tier 1 Capital plus the allowance for loan and lease losses (“ALLL”); (f) develop and implement certain specified policies and procedures relating to the asset disposition plan for certain classified assets, loan impairment and note sale transactions; (g) notify the FDIC and the DFI prior to appointing any new director or senior executive officer; (h) implement a program to monitor compliance of the MOU and review and record its review of compliance; (i) refrain from establishing any new offices without prior regulatory approval; and (j) submit written quarterly progress reports to the FDIC and the DFI detailing the form and manner of any actions taken to secure compliance with the MOU and the results thereof.
On December 9, 2009, the Company entered into an MOU with the Federal Reserve Bank of San Francisco (the “FRB”) pursuant to which the Company agreed, among other things, to (i) take steps to ensure that the Bank complies with the Bank’s MOU; (ii) implement a capital plan addressing specified items and submit the plan to the FRB for approval; (iii) submit annual cash flow projections to the FRB; (iv) refrain from paying cash dividends, receiving cash dividends from the Bank, increasing or guaranteeing debt, redeeming or repurchasing its stock, or issuing any additional trust preferred securities, without prior FRB approval; and (v) submit written quarterly progress reports to the FRB detailing compliance with the MOU.
The MOUs will remain in effect until modified or terminated by the FRB, the FDIC and the DFI. We do not expect the actions called for by the MOUs to change our business strategy in any material respect, although they may have the effect of limiting or delaying the Bank’s or the Company’s ability or plans to expand. The board of directors and management of the Bank and the Company have taken various actions to comply with the MOUs, and will diligently endeavor to take all actions necessary for compliance. Management believes that the Bank and the Company are currently in substantial compliance with the terms of the MOUs, although formal determinations of compliance with the MOUs can only be made by the regulatory authorities. In this regard, the Bank’s Leverage Capital Ratio and Total Risk-Based Capital ratios as of December 31, 2010 were 12.50% and 18.53% considerably in excess of the required ratios for the Bank.
Recent Accounting Pronouncements
For information regarding the recently issued accounting standards, see Note 2, entitled “Summary of Significant Accounting Policies,” to the Company’s consolidated financial statements presented elsewhere herein.
Competition
The current banking business and intended future strategic market areas are highly competitive with respect to virtually all products and services and have become increasingly so in recent years. While the Company’s primary market area is generally dominated by a relatively small number of major banks with many offices operating over a wide geographic area, the Company’s direct competitors in the niche markets are three Korean-American banks of which are approximately 30% larger in asset size, which also focus their business strategy on Korean-American consumers and businesses. There are also a number of smaller Korean-American community banks that compete in the same market as the Company.
There is significant competition within this specific market. In the greater Los Angeles, Chicago and Seattle metropolitan areas, the Company’s main competitors are locally owned and operated Korean-American banks and subsidiaries of Korean banks. These competitors have branches located in many of the same neighborhoods as the Company, provide similar types of products and services, and use the same Korean language publications and media for their marketing purposes.
A less significant source of competition in the Los Angeles metropolitan area is a small number of branches of major banks which maintain a limited bilingual staff for Korean-speaking customers. While such banks have not traditionally focused their marketing efforts on the Company’s customer base primarily in Southern California, the competitive influence of these major bank branches could increase in the event they choose to focus on this market. Large commercial bank competitors have, among other advantages, the ability to finance wide-ranging and effective advertising campaigns and to allocate their investment resources to areas of highest yield and demand. Many of the major banks operating in our market area offer certain services, which the Company does not offer directly (some of which the Company can offer through the use of correspondent institutions). By virtue of their greater total capitalization, such banks also have substantially higher lending limits than the Company and may have access to lower cost of funds.
In addition to other banks, competitors include savings institutions, credit unions, and numerous non-banking institutions, such as finance companies, leasing companies, insurance companies, brokerage firms, and investment banking firms. In recent years, increased competition has also developed from specialized finance and non-finance companies that offer money market and mutual funds, wholesale finance, credit card, and other consumer finance services, including on-line banking services and personal finance software. Strong competition for deposit and loan products affects the rates of those products as well as the terms on which they are offered to customers. To the extent that the Company is affected by more general competitive trends in the industry, we believe those trends are towards increased consolidation and competition. Unregulated competitors have entered banking markets with strategies directly targeted at the Company’s customers. Many largely unregulated competitors are able to compete across geographic boundaries and provide customers with increasing access to meaningful alternatives to banking services in nearly all significant products. Consolidation of the banking industry has placed additional pressure on
6
Table of Contents
surviving community banks within the industry to streamline their operations, reduce expenses and increase revenues to remain competitive. Competition has also intensified due to federal and state interstate banking laws, which permit banking organizations to expand geographically, and the California market has historically been particularly attractive to out-of-state institutions.
Technological innovations have also resulted in increased competition in the financial services industry. Such innovations have, for example, made it possible for non-depository institutions to offer customers automated transfer payment services that previously have been considered traditional banking products. In addition, many customers now expect a choice of several delivery systems and channels, including telephone, mail, home computer, ATM’s, self-service branches and/or in-store branches. Other sources of competition for such hi-tech products include savings associations, credit unions, brokerage firms, money market and other mutual funds, asset management groups, finance and insurance companies, and mortgage banking firms.
In order to compete with the other financial services providers, the Company endeavors to provide quality, personalized, friendly service and fast decision making to better serve our customers’ needs. For customers whose loan demands exceed the Company’s lending limit, the Company has attempted to establish relationships with correspondent banks for the development of such loans on a participation basis. The Company also maintains an international trade finance department to meet the growing needs of the business communities within our niche market. In order to compete on the technological front, the Company offers Internet banking services to allow its customers to access their loan and deposit accounts through the Internet. Customers can obtain transaction history and account information, transfer funds between bank accounts and process bill payments.
Employees
As of December 31, 2010, the Company had 324 full-time equivalent employees and 314 full-time employees as compared to 273 and 265 as of December 31, 2009.
Supervision and Regulation
Both federal and state laws extensively regulate banks and bank holding companies. These regulations are intended primarily for the protection of depositors and the deposit insurance fund and not for the benefit of shareholders. The following is a summary of certain statutes, regulations and regulatory guidance affecting Center Financial and the Bank. This summary is not intended to be a complete explanation of such statutes, regulations and guidance and their effects on Center Financial and the Bank and is qualified in its entirety by such statutes, regulations and guidance.
Regulation of Center Financial Corporation Generally
Center Financial’s stock is traded on the NASDAQ Global Select Market under the symbol “CLFC”, and as such the Company is subject to NASDAQ rules and regulations including those related to corporate governance. Center Financial is also subject to the periodic reporting requirements of Section 13 of the Exchange Act, which requires us to file annual, quarterly, current and other reports with the SEC. The Company is also subject to additional regulations including, but not limited to, the proxy and tender offer rules promulgated by the SEC under Sections 13 and 14 of the Exchange Act; the reporting requirements of directors, executive officers and principal shareholders regarding transactions in Center Financial’s common stock and short-swing profits rules promulgated by the SEC under Section 16 of the Exchange Act; and certain additional reporting requirements to Center Financial’s principal shareholders promulgated by the SEC under Section 13 of the Exchange Act. The Company is classified as an “accelerated filer” for purposes of its Exchange Act filing requirements. In addition to accelerated time frames for filing SEC periodic reports, this also means that the Company is subject to the requirements of Section 404 of the Sarbanes-Oxley Act of 2002 with regard to documenting, testing, and attesting to internal controls over financial reporting.
Center Financial is a bank holding company within the meaning of the Bank Holding Company Act of 1956 and is registered as such with the Federal Reserve Board. A bank holding company is required to file with the Federal Reserve Board annual reports and other information regarding its business operations and those of its subsidiaries. It is also subject to examination by the Federal Reserve Board and is required to obtain Federal Reserve Board approval before acquiring, directly or indirectly, ownership or control of any voting shares of any bank if, after such acquisition, it would directly or indirectly own or control more than 5% of the voting stock of that bank, unless it already owns a majority of the voting stock of that bank.
The Federal Reserve Board has determined by regulation certain activities in which a bank holding company may or may not conduct business. A bank holding company must engage, with certain exceptions, in the business of banking or managing or controlling banks or furnishing services to or performing services for its subsidiary banks. The principal exceptions to these prohibitions involve non-bank activities identified by statute, by Federal Reserve regulation, or by Federal Reserve order as activities so closely related to the business of banking or of managing or controlling banks as to be a proper incident thereto, including securities brokerage services, investment advisory services, fiduciary services, and management advisory and data
7
Table of Contents
processing services, among others. A bank holding company that also qualifies as and elects to become a “financial holding company” may engage in a broader range of activities that are financial in nature (and complementary to such activities), specifically non-bank activities identified by the Gramm-Leach-Bliley Act of 1999 or by Federal Reserve and Treasury regulation as financial in nature or incidental to a financial activity. Activities that are defined as financial in nature include securities underwriting, dealing, and market making, sponsoring mutual funds and investment companies, engaging in insurance underwriting and agency activities, and making merchant banking investments in non-financial companies. To become and remain a financial holding company, a bank holding company and its subsidiary banks must be well capitalized, well managed, and, except in limited circumstances, have at least a satisfactory rating under the Community Reinvestment Act.
Center Financial and the Bank are deemed to be affiliates of each other within the meaning set forth in the Federal Reserve Act and are subject to Sections 23A and 23B of the Federal Reserve Act. The Federal Reserve Board has also issued Regulation W, which codifies prior regulations under Sections 23A and 23B of the Federal Reserve Act and interpretative guidance with respect to affiliate transactions. This means, for example, that there are limitations on loans by the Bank to affiliates, and that all affiliate transactions must satisfy certain limitations and otherwise be on terms and conditions at least as favorable to the Bank as would be available for non-affiliates. In addition, we must comply with the Federal Reserve Act and Regulation O issued by the Federal Reserve Board, which require that loans and extensions of credit to our executive officers, directors and principal stockholders, or any company controlled by any such persons, shall, among other conditions, be made on substantially the same terms and follow credit-underwriting procedures no less stringent than those prevailing at the time for comparable transactions with non-insiders.
Regulations and policies of the Federal Reserve Board require a bank holding company to serve as a source of financial and managerial strength to its subsidiary banks. It is the Federal Reserve Board’s policy that a bank holding company should stand ready to use available resources to provide adequate capital funds to a subsidiary bank during periods of financial stress or adversity and should maintain the financial flexibility and capital-raising capacity to obtain additional resources for assisting a subsidiary bank. Under certain conditions, the Federal Reserve Board may conclude that certain actions of a bank holding company, such as a payment of a cash dividend, would constitute an unsafe and unsound banking practice.
The Federal Reserve Board also has the authority to regulate bank holding companies’ debt, including the authority to impose interest rate ceilings and reserve requirements on such debt. Under certain circumstances, the Federal Reserve Board may require a bank holding company to file written notice and obtain its approval prior to purchasing or redeeming its equity securities, unless certain conditions are met. Pursuant to the Company’s MOU with the FRB, the Company may not redeem or repurchase its stock without the prior approval of the FRB. See “Informal Regulatory Agreements” above.
Regulation of Center Bank Generally
As a California state-chartered bank whose accounts are insured by the FDIC up to the maximum limits thereof, the Bank is subject to regulation, supervision and regular examination by the DFI and the FDIC. In addition, while the Bank is not a member of the Federal Reserve System, the Bank is subject to certain regulations of the Federal Reserve Board. The regulations of these agencies govern most aspects of our business, including the making of periodic reports, and activities relating to dividends, investments, loans, borrowings, capital requirements, certain check-clearing activities, branching, mergers and acquisitions, reserves against deposits and numerous other areas. Supervision, legal action and examination by the FDIC are generally intended to protect depositors and are not intended for the protection of shareholders.
The earnings and growth of the Bank are largely dependent on its ability to maintain a favorable differential or “spread” between the yield on its interest-earning assets and the rate paid on its deposits and other interest-bearing liabilities. As a result, the Bank’s performance is influenced by general economic conditions, both domestic and foreign, the monetary and fiscal policies of the federal government and the policies of the regulatory agencies, particularly the Federal Reserve Board. The Federal Reserve Board implements national monetary policies (such as, for example, seeking to curb inflation and combat recession) by its open-market operations in United States Government securities, by adjusting the required level of reserves for financial institutions subject to its reserve requirements and by varying the discount rate applicable to borrowings by banks which are members of the Federal Reserve System. The actions of the Federal Reserve Board in these areas influence the growth of bank loans, investments and deposits and also affect interest rates charged on loans and deposits. The nature and impact of any future changes in monetary policies cannot be predicted.
Capital Adequacy Requirements
Center Financial and the Bank are subject to the regulations of the Federal Reserve Board and the FDIC, respectively, governing capital adequacy. Each of the federal regulators has established risk-based and leverage capital guidelines for the banks or bank holding companies it regulates, which set total capital requirements and define capital in terms of “core capital elements,” or Tier 1 capital; and “supplemental capital elements,” or Tier 2 capital. Tier 1 capital is generally defined as the sum of the core capital elements less goodwill and certain other deductions, notably the unrealized net gains or losses (after tax
8
Table of Contents
adjustments) on investment securities available for sale carried at fair market value. The following items are defined as core capital elements: (i) common shareholders’ equity; (ii) qualifying non-cumulative perpetual preferred stock and related surplus (and, in the case of holding companies, senior perpetual preferred stock issued to the U.S. Treasury Department pursuant to the Troubled Asset Relief Program); and (iii) minority interests in the equity accounts of consolidated subsidiaries. Supplementary capital elements include: (i) allowance for loan and lease losses (but not more than 1.25% of an institution’s risk-weighted assets); (ii) perpetual preferred stock and related surplus not qualifying as core capital; (iii) hybrid capital instruments, perpetual debt and mandatory convertible debt instruments; and (iv) term subordinated debt and intermediate-term preferred stock and related surplus. The maximum amount of supplemental capital elements, which qualify as Tier 2 capital, is limited to 100% of Tier 1 capital.
The minimum required ratio of qualifying total capital to total risk-weighted assets (“Total Risk-Based Capital Ratio”) is 8.0%, at least one-half of which must be in the form of Tier 1 capital, and the minimum required ratio of Tier 1 capital to total risk-weighted assets (“Tier 1 Risk-Based Capital Ratio”) is 4.0%. Risk-based capital ratios are calculated to provide a measure of capital that reflects the degree of risk associated with a banking organization’s operations for both transactions reported on the statements of financial condition as assets, and transactions, such as letters of credit and recourse arrangements, which are recorded as off-balance sheet items. Under the risk-based capital guidelines, the nominal dollar amounts of assets and credit-equivalent amounts of off-balance sheet items are multiplied by one of several risk adjustment percentages, which range from 0% for assets with low credit risk, such as certain U. S. Treasury securities, to 100% for assets with relatively high credit risk, such as business loans. In addition, pursuant to the Bank’s MOU with the FDIC and the DFI, the Bank is required to maintain a Total Risk-Based Capital Ratio of 13% (see “Informal Regulatory Agreements” above). As of December 31, 2010 and 2009, Total Risk-Based Capital Ratios and Tier 1 Risk-Based Capital Ratios of the Bank considerably exceeded the required ratios.
The risk-based capital requirements also take into account concentrations of credit involving collateral or loan type and the risks of “non-traditional” activities (those that have not customarily been part of the banking business). The regulations require institutions with high or inordinate levels of risk to operate with higher minimum capital standards, and authorize the regulators to review an institution’s management of such risks in assessing an institution’s capital adequacy.
Additionally, the regulatory Statements of Policy on risk-based capital include exposure to interest rate risk as a factor that the regulators will consider in evaluating an institution’s capital adequacy, although interest rate risk does not impact the calculation of risk-based capital ratios. Interest rate risk is the exposure of a bank’s current and future earnings and equity capital arising from adverse movements in interest rates. While interest rate risk is inherent in a bank’s role as financial intermediary, it introduces volatility to bank earnings and to the economic value of the bank or bank holding company.
The FDIC and the Federal Reserve Board also require the maintenance of a leverage capital ratio designed to supplement the risk-based capital guidelines. Banks and bank holding companies that have received the highest rating of the five categories used by regulators to rate such institutions and are not anticipating or experiencing any significant growth must maintain a ratio of Tier 1 capital, net of all intangibles, to adjusted total assets (“Leverage Capital Ratio”) of at least 3%. All other institutions are required to maintain a leverage ratio of at least 100 to 200 basis points above the 3% minimum, for a minimum of 4% to 5%. Pursuant to federal regulations, banking institutions must maintain capital levels commensurate with the level of risk to which they are exposed, including the volume and severity of problem loans, and federal regulators may set, however, higher capital requirements when an institution’s particular circumstances warrant. In addition, pursuant to the Bank’s MOU with the FDIC and the DFI, the Bank is required to maintain a Leverage Capital Ratio of 9% (see “Informal Regulatory Agreements” above). Both the Company and the Bank were well capitalized as of December 31, 2010, and the Bank’s leverage capital ratio considerably exceeded the required ratio.
On March 1, 2005, the Federal Reserve Board adopted a final rule that allows the continued inclusion of trust preferred securities in the Tier 1 capital of bank holding companies. However, under the final rule, after a five-year transition period, the aggregate amount of trust preferred securities and certain other capital elements that could qualify as Tier 1 capital would be limited to 25 percent of Tier 1 capital elements. As of December 31, 2010, trust preferred securities made up 6.2% of the Company’s Tier 1 capital. In addition, since the Company had less than $15 billion in assets at December 31, 2009, under the Dodd-Frank Act, the Company will be able to continue to include its existing trust preferred securities in Tier 1 capital to the extent permitted by FRB guidelines.
9
Table of Contents
The following table sets forth Center Financial’s and the Bank’s capital ratios at December 31, 2010 and 2009:
Risk Based Ratios
| 2010 | 2009 | |||||||||||||||
| Center Financial | Center Bank | Center Financial | Center Bank | |||||||||||||
| Total Capital (to Risk-Weighted Assets) |
18.87 | % | 18.53 | % | 17.77 | % | 17.22 | % | ||||||||
| Tier I Capital (to Risk-Weighted Assets) |
17.60 | % | 17.26 | % | 16.50 | % | 15.94 | % | ||||||||
| Tier I Capital (to Average Assets) |
12.74 | % | 12.50 | % | 12.40 | % | 12.00 | % | ||||||||
Prompt Corrective Action Provisions
Federal law requires each federal banking agency to take prompt corrective action to resolve the problems of insured financial institutions, including but not limited to those that fall below one or more prescribed minimum capital ratios. The federal banking agencies have defined by regulation the following five capital categories:
| • Well capitalized: |
Total Risk-Based Capital Ratio of 10%; Tier 1 Risk-Based Capital Ratio of 6%; and Leverage Ratio of 5%; | |
| • Adequately capitalized: |
Total Risk-Based Capital Ratio of 8%; Tier 1 Risk-Based Capital Ratio of 4%; and Leverage Ratio of 4% or 3% if the institution receives the highest rating from its primary regulator; | |
| • Undercapitalized: |
Total Risk-Based Capital Ratio of less than 8%; Tier 1 Risk-Based Capital Ratio of less than 4%; or Leverage Ratio of less than 4% or 3% if the institution receives the highest rating from its primary regulator; | |
| • Significantly undercapitalized: |
Total Risk-Based Capital Ratio of less than 6%; Tier 1 Risk-Based Capital Ratio of less than 3%; or Leverage Ratio of less than 3%; and | |
| • Critically undercapitalized: |
Tangible equity to total assets of less than 2%. |
As of December 31, 2010 and 2009, both the Company and the Bank were deemed to be well capitalized for regulatory capital purposes. A bank may be treated as though it were in the next lower capital category if after notice and the opportunity for a hearing, the appropriate federal agency finds an unsafe or unsound condition or practice so warrants, but no bank may be treated as “critically undercapitalized” unless its actual capital ratio warrants such treatment.
At each successively lower capital category, an insured bank is subject to increased restrictions on its operations. For example, a bank is generally prohibited from paying management fees to any controlling persons or from making capital distributions if to do so would make the bank “undercapitalized.” Asset growth and branching restrictions apply to undercapitalized banks, which are required to submit written capital restoration plans meeting specified requirements (including a guarantee by the parent holding company, if any). “Significantly undercapitalized” banks are subject to broad regulatory authority, including among other things, capital directives, forced mergers, restrictions on the rates of interest they may pay on deposits, restrictions on asset growth and activities and prohibitions on paying bonuses or increasing compensation to senior executive officers without FDIC approval. Even more severe restrictions apply to critically undercapitalized banks. Most importantly, except under limited circumstances, not later than 90 days after an insured bank becomes critically undercapitalized, the appropriate federal banking agency is required to appoint a conservator or receiver for the bank.
In addition to measures taken under the prompt corrective action provisions, insured banks may be subject to potential actions by the federal regulators for unsafe or unsound practices in conducting their businesses or for violations of any law, rule, regulation or any condition imposed in writing by the agency or any written agreement with the agency. Enforcement actions may include the issuance of cease and desist orders, termination of insurance of deposits (in the case of a bank), the imposition of civil money penalties, the issuance of directives to increase capital, formal and informal agreements, or removal and prohibition orders against “institution-affiliated” parties.
Safety and Soundness Standards
The federal banking agencies have also adopted guidelines establishing safety and soundness standards for all insured depository institutions. Those guidelines relate to internal controls, information systems, internal audit systems, loan underwriting and documentation, compensation and interest rate exposure. In general, the standards are designed to assist the federal banking agencies in identifying and addressing problems at insured depository institutions before capital becomes impaired. If an institution fails to meet these standards, the appropriate federal banking agency may require the institution to submit a compliance plan and institute enforcement proceedings if an acceptable compliance plan is not submitted.
10
Table of Contents
Dodd-Frank Wall Street Reform and Consumer Protection Act of 2010
On July 21, 2010, President Obama signed into law the Dodd-Frank Wall Street Reform and Consumer Protection Act (the “Dodd-Frank Act”), a landmark financial reform bill that significantly changes the current bank regulatory structure and affects the lending, investment, trading and operating activities of financial institutions and their holding companies. Among other things, the Dodd-Frank Act dramatically impacts the rules governing the provision of consumer financial products and services. The new law includes, among other things, the following:
| • | The Dodd-Frank Act establishes a new Financial Stability Oversight Counsel to monitor systemic financial risks. The Board of Governors of the Federal Reserve are given extensive new authorities to impose strict controls on large bank holding companies with total consolidated assets equal to or in excess of $50 billion and systemically significant non-bank financial companies to limit the risk they might pose for the economy and to other large interconnected companies. The Dodd-Frank Act also grants to the Treasury Department, FDIC and the FRB broad new powers to seize, close and wind-down “too big to fail” financial institutions (including non-bank institutions) in an orderly fashion. |
| • | The Dodd-Frank Act also establishes a new independent Federal regulatory body for consumer protection within the Federal Reserve System known as the Bureau of Consumer Financial Protection (the “Bureau”), which will assume responsibility for most consumer protection laws. It will also be in charge of setting appropriate consumer banking fees and caps. The Bureau has examination and enforcement authority over all banks and savings institutions with more than $10 billion in assets. Banks and savings institutions with $10 billion or less in assets, like the Bank, will continue to be examined by their applicable bank regulators. |
| • | The Dodd-Frank Act restricts the amount of trust preferred securities (“TPS”) that may be considered Tier 1 Capital. For depository institution holding companies below $15 billion in total assets, TPS issued before May 19, 2010 will be grandfathered, so their status as Tier 1 capital does not change. However going forward, TPS will be disallowed as Tier 1 capital. Since the Company had less than $15 billion in assets at December 31, 2009, under the Dodd-Frank Act, the Company will be able to continue to include its existing TPS in Tier 1 capital to the extent permitted by FRB guidelines. |
| • | The Dodd-Frank Act effects changes in the FDIC assessment base with stricter oversight. A new council of regulators led by the U.S. Treasury will set higher requirements for the amount of cash banks must keep on hand. The minimum reserve ratio is to be increased from 1.15 percent to 1.35 percent; however, financial institutions with assets of less than $10 billion like Center Bank are to be exempt from the cost of the increase. FDIC insurance coverage is made permanent at the $250 thousand level retroactive to January 1, 2008 and unlimited FDIC insurance is provided for non-interest-bearing demand deposits, which coverage will continue until December 31, 2012. |
| • | Under the Dodd-Frank Act, the Comptroller of the Currency’s ability to preempt state consumer protection laws was made more difficult by raising the applicable preemption standards and state attorneys general are granted greater authority to enforce state consumer protection laws against national banks and their operating subsidiaries. |
| • | The Dodd-Frank Act adopts the so-called “Volcker rule,” which, subject to certain exceptions, prohibits any banking entity from engaging in proprietary trading, or sponsoring or investing in a hedge fund or private equity fund. |
The Company is currently evaluating the potential impact the Dodd-Frank Act will have on its business, financial condition, results of operations and prospects and expects that some provisions of the Dodd-Frank Act may have adverse effects on the Company, such as the cost of complying with the numerous new regulations and reporting requirements mandated by the Dodd-Frank Act. Many aspects of the Dodd-Frank Act are subject to rulemaking and will take effect over several years, making it difficult to anticipate the overall financial impact on the Company and the financial services industry more generally. Provisions in the legislation that affect deposit insurance assessments, and payment of interest on demand deposits could increase the costs associated with deposits.
The Emergency Economic Stabilization Act of 2008 and the Troubled Asset Relief Program
In response to unprecedented market turmoil and the financial crises affecting the overall banking system and financial markets in the United States, the Emergency Economic Stabilization Act of 2008 (“EESA”) was enacted in October 2008. On February 17, 2009, the American Recovery and Reinvestment Act of 2009 (the “Stimulus Bill”) was enacted, which among other things augmented certain provisions of the EESA. Under the EESA, the U.S. Treasury Department was given the authority, among other things, to purchase up to $700 billion in mortgage loans, mortgage-related securities and certain other
11
Table of Contents
financial instruments, including debt and equity securities issued by financial institutions in the Troubled Asset Relief Program (the “TARP”). The purpose of the TARP was to restore confidence and stability to the U.S. banking system and to encourage financial institutions to increase their lending to customers and to each other.
Pursuant to the EESA, the U.S. Treasury Department was initially authorized to use $350 billion for the TARP. Of this amount, the U.S. Treasury Department allocated $250 billion to the TARP Capital Purchase Program (see description below). On January 15, 2009, the second $350 billion of TARP monies was released to the U.S. Treasury Department.
The TARP Capital Purchase Program (“CPP”) was developed to purchase $250 billion in senior preferred stock from qualifying financial institutions, and was designed to strengthen the capital and liquidity positions of viable institutions and to encourage banks and thrifts to increase lending to creditworthy borrowers. The amount of the U.S. Treasury Department’s preferred stock a particular qualifying financial institution could be approved to issue would be not less than 1% of risk-weighted assets and not more than the lesser of $25 billion or 3% of risk-weighted assets.
The general terms of the TARP CPP include:
| • | Dividends on the U.S. Treasury Department’s preferred stock at a rate of five percent for the first five years and nine percent thereafter; |
| • | Common stock dividends cannot be increased for three years while the U.S. Treasury Department is an investor unless preferred stock is redeemed or consent from the Treasury is received; |
| • | The U.S. Treasury Department’s preferred stock cannot be redeemed for three years unless the participating institution receives the approval of its applicable banking regulator and the U.S. Treasury Department, after demonstrating to those agencies that the participating institution is financially sound without the TARP proceeds; |
| • | The U.S. Treasury Department must consent to any buyback of other stock (common or other preferred); |
| • | The U.S. Treasury Department’s preferred stock will have the right to elect two directors if dividends have not been paid for six periods; |
| • | The U.S. Treasury Department receives warrants equal to 15 percent of the U.S. Treasury Department’s total investment in the participating institution; and |
| • | The participating institution’s executives must agree to certain compensation restrictions, and restrictions on the amount of executive compensation that is tax deductible. |
The Company elected to participate in the TARP CPP and in December 2008 issued $55.0 million worth of preferred stock to the U.S. Treasury Department pursuant to this program. See “Item 7 – Management’s Discussion and Analysis of Financial Condition and Results of Operations—Capital Resources.”
The EESA also established a Temporary Liquidity Guarantee Program (“TLGP”) that gave the FDIC the ability to provide a guarantee for newly-issued senior unsecured debt and non-interest bearing transaction deposit accounts at eligible insured institutions. The Company is currently participating in the transaction account guarantee program. This program was initially scheduled to continue through December 31, 2010, but the Dodd-Frank Act has extended full deposit insurance coverage for non-interest bearing transaction accounts through December 31, 2012, and all financial institutions are required to participate in this extended guarantee program. For non-interest bearing transaction deposit accounts, a 10 basis point annual FDIC insurance premium surcharge was applied to deposit amounts in excess of $250,000 through December 31, 2009, and a risk-based surcharge of between 15 and 25 basis points was applied beginning January 1, 2010. The amounts of these surcharges were $65,000 and $168,000 for 2009 and 2010, respectively. As of December 31, 2010 we had approximately $160.7 million in non-interest bearing accounts exceeding $250,000.
Deposit Insurance
The Bank’s deposits are insured under the Federal Deposit Insurance Act, up to the maximum applicable limits by the Deposit Insurance Fund (“DIF”) of the FDIC and are subject to deposit insurance assessments to maintain the DIF. Effective January 1, 2007 the FDIC adopted a new risk-based insurance assessment system designed to tie what banks pay for deposit insurance more closely to the risks they pose to the insurance fund. The FDIC also adopted a new base schedule of rates that the FDIC could adjust up or down, depending on the needs of the DIF, and set initial premiums for 2007 that ranged from 5 cents per $100 of domestic deposits in the lowest risk category to 43 cents per $100 of domestic deposits for banks in the highest risk category. The new assessment system resulted in annual assessments on the Bank’s deposits of 5 cents per $100 of domestic deposits. The Bank’s deposit insurance premiums for 2010 and 2009 were $3.5 million and $3.4 million, respectively.
12
Table of Contents
On October 16, 2008, in response to the problems facing the financial markets and the economy, the FDIC published a restoration plan (“Restoration Plan”) designed to replenish the DIF such that the reserve ratio would return to 1.15 percent within five years. On December 16, 2008, the FDIC adopted a final rule increasing risk-based assessment rates uniformly by seven basis points, on an annual basis, for the first quarter 2009.
On February 27, 2009, the FDIC concluded that the problems facing the financial services sector and the economy at large constituted extraordinary circumstances and amended the Restoration Plan and extended the time within which the reserve ratio would return to 1.15 percent from five to seven years (“Amended Restoration Plan”). In May 2009, Congress amended the statutory provision governing establishment and implementation of a Restoration Plan to allow the FDIC eight years to bring the reserve ratio back to 1.15 percent, absent extraordinary circumstances.
On May 22, 2009, the FDIC adopted a final rule imposing a five basis point special assessment on each insured depository institution’s assets minus Tier 1 capital as of June 30, 2009. The Bank paid $1.0 million for its special assessment which was collected in September 30, 2009.
In a final rule issued on September 29, 2009, the FDIC amended the Amended Restoration Plan as follows:
| • | The period of the Amended Restoration Plan was extended from seven to eight years. |
| • | The FDIC announced that it will not impose any further special assessments under the final rule it adopted in May 2009. |
| • | The FDIC announced plans to maintain assessment rates at their current levels through the end of 2010. The FDIC also immediately adopted a uniform three basis point increase in assessment rates effective January 1, 2011 to ensure that the DIF returns to 1.15 percent within the Amended Restoration Plan period of eight years. |
| • | The FDIC announced that, at least semi-annually following the adoption of the Amended Restoration Plan, it will update its loss and income projections for the DIF. The FDIC also announced that it may, if necessary, adopt a new rule prior to the end of the eight-year period to increase assessment rates in order to return the reserve ratio to 1.15 percent. |
On November 12, 2009, the FDIC adopted a final rule to require insured institutions to prepay their quarterly risk-based deposit insurance assessments for the fourth quarter of 2009, and for all of 2010, 2011 and 2012, on December 30, 2009. Our prepaid FDIC assessment at December 31, 2010 and 2009 was $7.8 million and $11.4 million, respectively.
The Dodd-Frank Act has set a new minimum reserve ratio of not less than 1.35% of estimated insured deposits and requires the FDIC to take steps necessary to attain the 1.35% ratio by September 30, 2020. However, financial institutions like Center Bank with assets of less than $10 billion are exempt from the cost of this increase.
In addition, banks must pay an amount which fluctuates but is currently 0.255 cents per $100 of insured deposits per quarter, towards the retirement of the Financing Corporation bonds issued in the 1980’s to assist in the recovery of the savings and loan industry. These assessments will continue until the Financing Corporation bonds mature in 2019.
The enactment of the EESA (discussed above) temporarily raised the basic limit on federal deposit insurance coverage from $100,000 to $250,000 per depositor. The temporary increase in deposit insurance coverage became effective on October 3, 2008 and was scheduled to continue through December 31, 2013. However, the recently enacted Dodd-Frank Act has permanently increased the statutory maximum deposit insurance amount to $250,000. In addition, pursuant to the guarantee program for non-interest bearing transaction deposit accounts under the TLGP in which the Bank has elected to participate, its customers receive a temporary unlimited guarantee of funds in non-interest bearing accounts, as defined, through December 31, 2010. See “The Emergency Economic Stabilization Act of 2008 and the Troubled Asset Relief Program” above. The Dodd-Frank Act has extended the provision of insurance on non-interest bearing transaction accounts through December 31, 2012, and participation in this program is mandatory for financial institutions.
Restrictions on Dividends
As a bank holding company which currently has no significant assets other than its equity interest in the Bank, Center Financial’s ability to pay dividends primarily depends upon the dividends received from the Bank. The Bank and Center Financial have each entered into MOUs with the respective regulatory agency or agencies, pursuant to which both the Bank and Center Financial must obtain prior regulatory approval to pay dividends. See “Informal Regulatory Agreements” above. The ability of the Bank and Center Financial to pay dividends is also subject to further restrictions imposed under the TARP Capital Purchase Program and under state and federal laws as described under “Item 5—MARKET FOR REGISTRANT’S COMMON
13
Table of Contents
EQUITY, RELATED SHAREHOLDER MATTERS AND ISSUER PURCHASES OF EQUITY SECURITIES—Dividends” below.
Community Reinvestment Act
The Bank is subject to certain requirements and reporting obligations involving Community Reinvestment Act (“CRA”) activities. The CRA generally requires the federal banking agencies to evaluate the record of a financial institution in meeting the credit needs of its local communities, including low and moderate-income neighborhoods. The CRA further requires the agencies to take a financial institution’s record of meeting its community credit needs into account when evaluating applications for, among other things, domestic branches, consummating mergers or acquisitions, or holding company formations. In measuring a bank’s compliance with its CRA obligations, the regulators utilize a performance-based evaluation system which bases CRA ratings on the bank’s actual lending service and investment performance, rather than on the extent to which the institution conducts needs assessments, documents community outreach activities or complies with other procedural requirements. In connection with its assessment of CRA performance, the FDIC assigns a rating of “outstanding,” “satisfactory,” “needs to improve” or “substantial noncompliance.” The Bank was last examined for CRA compliance in 2009 and received a “satisfactory” CRA Assessment Rating.
Privacy and Data Security
The Gramm-Leach-Bliley Act, also known as the Financial Modernization Act of 1999 (“GLBA”) imposed requirements on financial institutions with respect to consumer privacy. The statute generally prohibits disclosure of consumer information to non-affiliated third parties unless the consumer has been given the opportunity to object and has not objected to such disclosure. Financial institutions are further required to disclose their privacy policies to consumers annually. Financial institutions, however, are required to comply with state law if it is more protective of consumer privacy than the GLBA. The statute also directed federal regulators, including the Federal Reserve and the FDIC, to prescribe standards for the security of consumer information. The Company and the Bank are subject to such standards, as well as standards for notifying consumers in the event of a security breach.
Other Consumer Protection Laws and Regulations
Activities of all insured banks are subject to a variety of statutes and regulations designed to protect consumers, including the Fair Credit Reporting Act, Equal Credit Opportunity Act, and Truth-in-Lending Act. Interest and other charges collected or contracted for by the Bank are also subject to state usury laws and certain other federal laws concerning interest rates. The Bank’s loan operations are also subject to federal laws and regulations applicable to credit transactions. Together, these laws and regulations include provisions that:
| • | govern disclosures of credit terms to consumer borrowers; |
| • | require financial institutions to provide information to enable the public and public officials to determine whether a financial institution is fulfilling its obligation to help meet the housing needs of the community it serves; |
| • | prohibit discrimination on the basis of race, creed, or other prohibited factors in extending credit; |
| • | govern the use and provision of information to credit reporting agencies; and |
| • | govern the manner in which consumer debts may be collected by collection agencies. |
The Bank’s deposit operations are also subject to laws and regulations that:
| • | impose a duty to maintain the confidentiality of consumer financial records and prescribe procedures for complying with administrative subpoenas of financial records; and |
| • | govern automatic deposits to and withdrawals from deposit accounts and customers’ rights and liabilities arising from the use of automated teller machines and other electronic banking services |
On November 17, 2009, the Board of Governors of the Federal Reserve System promulgated a rule entitled “Electronic Fund Transfers”, with an effective date of January 19, 2010 and a mandatory compliance date of July 1, 2010. The rule, which applies to all FDIC-regulated institutions, prohibits financial institutions from assessing an overdraft fee for paying automated teller machine (ATM) and one-time point-of-sale debit card transactions, unless the customer affirmatively opts in to the overdraft service for those types of transactions. The opt-in provision establishes requirements for clear disclosure of fees and terms of overdraft services for ATM and one-time debit card transactions. The rule does not apply to other types of transactions, such as check, automated clearinghouse (ACH) and recurring debit card transactions. Since a small portion of the Company’s service charges on deposits are in the form of overdraft fees on point-of-sale transactions, this would not have a significant
14
Table of Contents
adverse impact on our noninterest income. However, the impact ultimately depends on the level of customer opt-in and cannot be predicted with any degree of certainty.
Interstate Banking and Branching
The Riegle-Neal Interstate Banking and Branching Efficiency Act of 1994 (the “Interstate Banking Act”) regulates the interstate activities of banks and bank holding companies and establishes a framework for nationwide interstate banking and branching. Since 1995, adequately capitalized and managed bank holding companies have been permitted to acquire banks located in any state, subject to two exceptions: first, any state may still prohibit bank holding companies from acquiring a bank which is less than five years old; and second, no interstate acquisition can be consummated by a bank holding company if the acquirer would control more than 10% of the deposits held by insured depository institutions nationwide or 30% or more of the deposits held by insured depository institutions in any state in which the target bank has branches.
In 1995, California enacted legislation to implement important provisions of the Interstate Banking Act and to repeal California’s previous interstate banking laws, which were largely preempted by the Interstate Banking Act.
A bank may establish and operate de novo branches in any state in which the bank does not maintain a branch if that state has enacted legislation to expressly permit all out-of-state banks to establish branches in that state. However, California law expressly prohibits an out-of-state bank which does not already have a California branch office from (i) purchasing a branch office of a California bank (as opposed to purchasing the entire bank) and thereby establishing a California branch office or (ii) establishing a de novo branch in California.
The changes effected by the Interstate Banking Act and California laws have increased competition in the environment in which the Bank operates to the extent that out-of-state financial institutions directly or indirectly enter the Bank’s market areas. It appears that the Interstate Banking Act has also contributed to the accelerated consolidation of the banking industry, with many large out-of-state banks having entered the California market as a result of this legislation.
USA Patriot Act of 2001
The impact of the USA Patriot Act of 2001 (the “Patriot Act”) on financial institutions of all kinds has been significant and wide ranging. The Patriot Act substantially enhanced existing anti-money laundering and financial transparency laws, and required appropriate regulatory authorities to adopt rules to promote cooperation among financial institutions, regulators, and law enforcement entities in identifying parties that may be involved in terrorism or money laundering. Under the Patriot Act, financial institutions are subject to prohibitions regarding specified financial transactions and account relationships, as well as enhanced due diligence and “know your customer” standards in their dealings with foreign financial institutions and foreign customers. The Patriot Act also requires all financial institutions to establish anti-money laundering programs. To fulfill the anti-money laundering requirements of the Patriot Act, the Bank expanded its Bank Secrecy Act (“BSA”) Compliance Department and intensified due diligence procedures concerning the opening of new accounts. The Bank also implemented new systems and procedures to identify suspicious activity reports and reports any such activity to the Financial Crimes Enforcement Network (“FINCEN”).
The Sarbanes-Oxley Act of 2002
Center Financial is subject to the Sarbanes-Oxley Act of 2002 (“Sarbanes-Oxley”) which addresses, among other issues, corporate governance, auditing and accounting, executive compensation and enhanced and timely disclosure of corporate information. Among other things, Sarbanes-Oxley mandates chief executive and chief financial officer certifications of periodic financial reports, additional financial disclosures concerning off-balance sheet items, and speedier transaction reporting requirements for executive officers, directors and 10% shareholders than were previously required. In addition, Sarbanes-Oxley heightened penalties for non-compliance with the Exchange Act. SEC rules promulgated pursuant to Sarbanes-Oxley impose obligations and restrictions on auditors and audit committees intended to enhance their independence from management, and include extensive additional disclosure, corporate governance and other related rules.
Commercial Real Estate Lending and Concentrations
On December 2, 2006, the federal bank regulatory agencies released Guidance on Concentrations in Commercial Real Estate (“CRE”) Lending, Sound Risk Management Practices (“the Guidance”). The Guidance, which was issued in response to the agencies’ concern that rising CRE concentrations might expose institutions to unanticipated earnings and capital volatility in the event of adverse changes in the commercial real estate market, reinforces existing regulations and guidelines for real estate lending and loan portfolio management.
Highlights of the Guidance include the following:
| • | The agencies have observed that CRE concentrations have been rising over the past several years with small to mid-size institutions showing the most significant increase in CRE concentrations over the last decade. However, some institutions’ risk management practices are not evolving with their increasing CRE concentrations, and therefore, |
15
Table of Contents
| the Guidance reminds institutions that strong risk management practices and appropriate levels of capital are important elements of a sound CRE lending program. |
| • | The Guidance applies to national banks and state-chartered banks and is also broadly applicable to bank holding companies. For purposes of the Guidance, CRE loans include loans for land development and construction, other land loans and loans secured by multifamily and non-farm residential properties. The definition also extends to loans to real estate investment trusts and unsecured loans to developers if their performance is closely linked to the performance of the general CRE market. |
| • | The agencies recognize that banks serve a vital role in their communities by supplying credit for business and real estate development. Therefore, the Guidance is not intended to limit banks’ CRE lending. Instead, the Guidance encourages institutions to identify and monitor credit concentrations, establish internal concentration limits, and report all concentrations to management and the board of directors on a periodic basis. |
| • | The agencies recognized that different types of CRE lending present different levels of risk, and therefore, institutions are encouraged to segment their CRE portfolios to acknowledge these distinctions. However, the CRE portfolio should not be divided into multiple sections simply to avoid the appearance of risk concentration. |
| • | Institutions should address the following key elements in establishing a risk management framework for identifying, monitoring, and controlling CRE risk: (1) board of directors and management oversight; (2) portfolio management; (3) management information systems; (4) market analysis; (5) credit underwriting standards; (6) portfolio stress testing and sensitivity analysis; and (7) credit review function. |
| • | As part of the ongoing supervisory monitoring processes, the agencies will use certain criteria to identify institutions that are potentially exposed to significant CRE concentration risk. An institution that has experienced rapid growth in CRE lending, has notable exposure to a specific type of CRE, or is approaching or exceeds specified supervisory criteria may be identified for further supervisory analysis. |
The Bank believes that the Guidance is applicable to it, as it has a relatively high level concentration in CRE loans. The Bank and its board of directors have discussed the Guidance and believe that the Bank’s underwriting policy, management information systems, independent credit administration process and monthly monitoring of real estate loan concentrations will be sufficient to address the Guidance.
Allowance for Loan and Lease Losses
On December 13, 2006, the federal bank regulatory agencies released Interagency Policy Statement on the Allowance for Loan and Lease Losses (“ALLL”), which revised and replaced the banking agencies’ 1993 policy statement on the ALLL. The revised statement was issued to ensure consistency with U.S. generally accepted accounting principles (“GAAP”) and more recent supervisory guidance. The revised statement also extended the applicability of the policy to credit unions. Additionally, the agencies issued 16 FAQs to assist institutions in complying with both GAAP and ALLL supervisory guidance.
Highlights of the revised statement include the following:
| • | The revised statement emphasizes that the ALLL represents one of the most significant estimates in an institution’s financial statements and regulatory reports and that an assessment of the appropriateness of the ALLL is critical to an institution’s safety and soundness. |
| • | Each institution has a responsibility to develop, maintain, and document a comprehensive, systematic, and consistently applied process for determining the amounts of the ALLL. An institution must maintain an ALLL that is sufficient to cover estimated credit losses on individual impaired loans as well as estimated credit losses inherent in the remainder of the portfolio. |
| • | The revised statement updated the previous guidance on the following issues regarding ALLL: (1) responsibilities of the board of directors, management, and bank examiners; (2) factors to be considered in the estimation of ALLL; and (3) objectives and elements of an effective loan review system. |
The Bank and its board of directors have discussed the revised statement and believe that the Bank’s ALLL methodology is comprehensive, systematic, and consistently applied across the Bank. The Bank believes its management information systems, independent credit administration process, policies and procedures are sufficient to address the guidance.
Fiscal and Monetary Policy
Banking is a business that depends on interest rate differentials. In general, the difference between the interest paid by a bank on its deposits and its other borrowings, and the interest received by a bank on its loans and securities holdings, constitutes
16
Table of Contents
the major portion of a bank’s earnings. Thus, the Company’s earnings and growth will be subject to the influence of economic conditions generally, both domestic and foreign, and also to the monetary and fiscal policies of the United States and its agencies, particularly the Federal Reserve. The Federal Reserve regulates the supply of money through various means, including open market dealings in United States government securities, the discount rate at which banks may borrow from the Federal Reserve, and the reserve requirements on deposits.
These policies have a direct effect on the amount of the Company’s loans and deposits and on the interest rates charged on loans and paid on deposits, with the result that federal policies may have a material effect on the Company’s earnings. Policies that are directed toward changing the supply of money and credit and raising or lowering interest rates may have an effect on the Company’s earnings. It is not possible to predict the conditions in the national and international economies and money markets, the actions and changes in policy by monetary and fiscal authorities, or their effect on the Company’s operations.
Other Pending and Proposed Legislation
Other legislative and regulatory initiatives, which could affect Center Financial, the Bank and the banking industry, in general are pending, and additional initiatives may be proposed or introduced, before the United States Congress, the California legislature and other governmental bodies in the future. Such proposals, if enacted, may further alter the structure, regulation and competitive relationship among financial institutions, and may subject Center Financial and the Bank to increased regulation, disclosure and reporting requirements. In addition, the various banking regulatory agencies often adopt new rules and regulations to implement and enforce existing legislation. It cannot be predicted whether, or in what form, any such legislation or regulations may be enacted or the extent to which the business of Center Financial or the Bank would be affected thereby.
You should carefully consider the following risk factors and all other information contained in this Annual Report before making investment decisions concerning the Company’s common stock. The risks and uncertainties described below are not the only ones the Company faces. Additional risks and uncertainties not presently known to the Company or that the Company currently believes are immaterial but may also adversely impact the Company’s business. If any of the events described in the following risk factors occur, the Company’s business, results of operations and financial condition could be materially adversely affected. In addition, the trading price of the Company’s common stock could decline due to any of the events described in these risks.
Risks Relating to Our Bank and the Banking Business
Center Financial and the Bank have each entered into MOUs with their respective regulatory agencies and may be subject to future additional regulatory restrictions and enforcement actions if they fail to comply with the MOUs or if their financial condition should further deteriorate.
Center Financial and the Bank have each entered into MOUs with their respective regulatory agencies Under the terms of the MOUs, we have agreed to take various actions to facilitate an improvement to our financial condition, including specific actions directed at reducing our nonperforming assets, resolving perceived weaknesses in lending and other banking operations and attaining and maintaining specified, higher than normal, regulatory capital ratios, as further described above under “Informal Regulatory Agreements”. The Company incurred a substantial loss for the 2009 fiscal year, and reflected a substantial increase in the level of nonperforming assets between from year-end 2008 to year-end 2009. While the Company achieved consolidated net income of $22.7 million in 2010 and reduced the level of nonperforming assets considerably, the MOUs will remain in effect until modified or terminated by the FRB, the FDIC and the DFI.
Although our results of operations in 2010 and financial condition at December 31, 2010 improved over 2009 in virtually all respects, in light of the current challenging operating environment, along with our level of nonperforming and adversely classified assets and our operating results in 2009, we are subject to increased regulatory scrutiny as a result of the potential risk of loss in our loan portfolio in the form of the MOUs described above. If we fail to comply with the terms of the MOUs or if our business or financial condition worsens, future corrective actions could require us to limit our lending activities and reduce our levels of certain categories of loans and classified or non-performing assets within specified timeframes, which might prevent us from maximizing the price which might otherwise be received for the underlying properties. In addition, future corrective action, could require us to, among other things, increase our allowance for loan losses, further increase our capital ratios, or enter into a strategic transaction, whether by merger or otherwise, with a third party.
Under federal and state laws and regulations pertaining to the safety and soundness of insured depository institutions, the regulatory agencies have the authority to compel or restrict certain actions if the Bank’s capital should fall below adequate capital standards as a result of operating losses, or if its regulators otherwise determine that it has insufficient capital or is otherwise operating in an unsafe and unsound manner. The corrective actions may include, but are not limited to, requiring Center Financial or the Bank to enter into formal enforcement orders, including written agreements or consent or cease and
17
Table of Contents
desist orders, or more drastic measures should circumstances warrant. In addition, the FDIC has the power to deem the Bank only adequately capitalized even though its capital ratios meet the well capitalized standard. In such event, the Bank would be prohibited from using brokered deposits, which have been a source of funds for us in recent years, and rates on deposits would be limited to market rates determined by the FDIC, potentially adversely affecting our liquidity. The terms of any such corrective action could have a material adverse effect on our business, our financial condition and the value of our common stock.
Our business has been and may continue to be adversely affected by volatile conditions in the financial markets and deteriorating economic conditions generally.
From December 2007 through June 2009, the U.S. economy was in recession. Business activity across a wide range of industries and regions in the U. S. was greatly reduced. The financial markets and the financial services industry in particular suffered unprecedented disruption, causing a number of institutions to fail or requiring government intervention to avoid failure. The California economy had been particularly hard hit by the recession, and the economic decline in California was a major factor leading to substantial increases in the Company’s nonperforming loans since December 31, 2007, including construction, development and land loans, and unsecured commercial and consumer loans.
Although economic conditions have begun to improve, certain sectors, such as real estate, remain weak and unemployment remains high nationally and in the State of California. Local governments and many businesses are still in serious difficulty due to lower consumer spending and the lack of liquidity in the credit markets. In addition, the values of the real estate collateral supporting many commercial loans and home mortgages have declined and may continue to decline. Continued negative market developments also may continue to adversely affect consumer confidence levels and payment patterns, which could cause delinquencies and default rates to continue at high levels, which could continue to adversely affect our levels of nonperforming assets and allowance for loan losses.
While improving economic conditions have resulted in a substantial decrease in our nonperforming loans and assets from year-end 2009 to year-end 2010, the levels were still significantly higher than at the end of 2008 or 2007. In particular, total non-covered nonperforming assets decreased to $46.5 million at December 31, 2010 from $67.7 million at December 31, 2009 and increased from $20.5 million at December 31, 2008, representing 2.98%, 4.12% and 1.19% of total non-covered loans owned at December 31, 2010, 2009 and 2008, respectively. Total non-covered nonperforming assets, net of SBA guarantees, decreased to $43.2 million at December 31, 2010 from $64.9 million at December 31, 2009 and increased from $18.3 million at December 31, 2008, representing 3.04%, 4.39% and 1.19% of total non-covered loans and other real estate owned at December 31, 2010, 2009 and 2008, respectively. The Company had non-covered nonperforming commercial real estate loans of $29.2 million, $39.9 million and $13.1 million as of December 31, 2010, 2009 and 2008, and no subprime mortgage loans as of any of those dates. Throughout this Annual Report, “non-covered” loans refer to all of the Bank’s loans other than those loans acquired in the Bank’s April 16, 2010 FDIC-assisted transaction, which are referred to as “covered loans.” See “Item 1 – BUSINESS – Recent Developments –FDIC-assisted Acquisition” above.
Overall, during 2010, the business environment has been adverse for many households and businesses in the United States and worldwide. While economic conditions in the State of California, the United States and worldwide have begun to improve, there can be no assurance that this improvement will continue. A sustained weakness or weakening in business and economic conditions generally or specifically in the principal markets in which we do business could have one or more of the following adverse effects on our business:
| • | a decrease in the demand for loans or other products and services offered by us; |
| • | a decrease in the value of our loans or other assets secured by residential or commercial real estate; |
| • | a decrease in deposit balances due to overall reductions in the accounts of customers; |
| • | an impairment of our investment securities; and |
| • | an increase in the number of borrowers who become delinquent, file for protection under bankruptcy laws or default on their loans or other obligations to us. An increase in the number of delinquencies, bankruptcies or defaults could result in a higher level of nonperforming assets, net charge-offs and provision for credit losses, which would reduce our earnings |
18
Table of Contents
Concentrations of real estate loans could subject us to increased risks in the event of a prolonged real estate recession or natural disaster.
Our loan portfolio is heavily concentrated in real estate loans, particularly commercial real estate. Approximately $928.8 million or 60.8% and $1.0 billion or 66.9% of the Company’s loan portfolio were concentrated in commercial real estate and construction loans at December 31, 2010 and 2009, respectively. Although commercial loans generally provide for higher interest rates and shorter terms than single-family residential loans, such loans generally involve a higher degree of risk, as the ability of borrowers to repay these loans is often dependent upon the profitability of the borrowers’ businesses. Commercial real estate loans, however, typically involve larger loan balances to single borrowers or groups of related borrowers compared to residential loans. Consequently, an adverse development with respect to one commercial loan or one credit relationship exposes us to a significantly greater risk of loss compared to an adverse development with respect to one residential mortgage loan.
During the past few years, the real estate market in Southern California deteriorated significantly, as evidenced by declining market values, reduced transaction volume, and increased foreclosure rates, and this deterioration resulted in an increase in the level of the Company’s nonperforming loans, particularly commercial real estate loans. The levels of nonperforming loans and assets generally, and of commercial real estate loans specifically, are set forth above under “—Our business has been and may continue to be adversely affected by volatile conditions in the financial markets and deteriorating economic conditions generally.” Even though the Company continues to reduce the concentration of real estate loans, if economic conditions and the real estate markets do not improve or worsen, the result will likely be reduced income, increased expenses, and less cash available for lending and other activities, which would have a material adverse impact on the Company’s financial condition and results of operations.
As the primary collateral for many of the Company’s loans rests on commercial real estate properties, deterioration in the real estate market in the areas the Company serves could reduce the value of the collateral for many of the Company’s loans and negatively impact the repayment ability of many of its borrowers. Such deterioration would likely also reduce the amount of loans the Company makes to businesses in the construction and real estate industry, which could negatively impact the Company’s business. Similarly, the occurrence of a natural disaster like those California has experienced in the past, including earthquakes, brush fires, and flooding, could impair the value of the collateral we hold for real estate secured loans and negatively impact the Company’s results of operations.
In addition, banking regulators now give commercial real estate loans extremely close scrutiny, due to risks relating to the cyclical nature of the real estate market and related risks for lenders with high concentrations of such loans. The regulators have required banks with relatively high levels of commercial real estate loans to implement enhanced underwriting standards, internal controls, risk management policies and portfolio stress testing, which has resulted in higher allowances for possible loan losses. Expectations for higher capital levels have also materialized. Any increase in our allowance for loan losses would adversely affect our net income, and any requirement that we maintain higher capital levels could adversely impact financial performance measures such as earnings per share. Pursuant to the Bank’s MOU with the FDIC and the DFI, we are currently subject to higher than normal capital requirements. See “Item 1 – BUSINESS – Informal Regulatory Agreements” above.
Repayment of our commercial loans is often dependent on the cash flows of the borrower, which may be unpredictable, and the collateral securing these loans may fluctuate in value.
At December 31, 2010, we had $315.3 million, or 20.6% of total loans, in commercial loans. Commercial lending involves risks that are different from those associated with commercial real estate lending. Real estate lending is generally considered to be collateral based lending with loan amounts based on predetermined loan to collateral values and liquidation of the underlying real estate collateral being viewed as the primary source of repayment in the event of borrower default. Our commercial loans are primarily made based on the cash flow of the borrower and secondarily on the underlying collateral provided by the borrower. The borrower’s cash flow may be unpredictable, and collateral securing these loans may fluctuate in value. Although commercial loans are often collateralized by equipment, inventory, accounts receivable, or other business assets, the liquidation of collateral in the event of default is often an insufficient source of repayment because accounts receivable may be uncollectible and inventories may be obsolete or of limited use, among other things. Accordingly, the repayment of commercial loans depends primarily on the cash flow and credit worthiness of the borrower and secondarily on the underlying collateral provided by the borrower.
Nonperforming assets take significant time to resolve and adversely affect our results of operations and financial condition.
Our nonperforming assets adversely affect our net income in various ways. While our non-covered nonperforming assets decreased by nearly 31.4% from year-end 2009 to year-end 2010, the levels are still substantial on a historic basis. Until
19
Table of Contents
economic and market conditions improve, we expect that our level of non-covered nonperforming loans will continue to impact our earnings, and could have a substantial adverse impact if conditions deteriorate further. We do not record interest income on non-accrual loans, thereby adversely affecting our level of interest income. Additionally, our noninterest expense has increased due to the costs of reappraising adversely classified assets, legal and other costs associated with loan collections, operating costs related to foreclosed assets, and various other expenses that would not typically be incurred in a normal operating environment. Furthermore, when we receive collateral through foreclosures and similar proceedings, we are required to mark the related loan to the then fair market value of the collateral less estimated selling costs, which may result in a loss. An increase in the level of nonperforming assets also increases our risk profile and may impact the capital levels our regulators believe is appropriate in light of such risks. We utilize various techniques such as loan sales, workouts and restructurings to manage our problem assets. Decreases in the value of these problem assets, the underlying collateral, or in the borrowers’ performance or financial condition, could adversely affect our business, results of operations and financial condition. In addition, the resolution of nonperforming assets requires a significant commitment of time from management and staff, which can be detrimental to performance of their other responsibilities. There can be no assurance that we will avoid further increases in nonperforming loans in the future.
We may experience loan and lease losses in excess of our allowance for loan and lease losses.
We endeavor to limit the risk that borrowers might fail to repay; nevertheless, losses can and do occur. We maintain an allowance for estimated loan and lease losses in our accounting records, through our loan underwriting process based on estimates of the following:
| • | historical loss experience with our loans; |
| • | evaluation of economic conditions; |
| • | assessment of risk factors for loans with exposure to the economies of southern California and Pacific Rim countries; |
| • | regular reviews of the quality mix and size of the overall loan portfolio; |
| • | a detailed cash flow analysis for non-performing loans; |
| • | regular reviews of delinquencies; and |
| • | the quality of the collateral underlying our loans. |
We maintain an allowance for loan and lease losses at a level that we believe is adequate to absorb any specifically identified losses as well as any other losses inherent in our loan portfolio at a given date. While we strive to carefully monitor credit quality and to identify loans that may become nonperforming, at any time there are loans in the portfolio that could result in losses, but that have not been identified as nonperforming or potential problem loans. We cannot be sure that we will be able to identify deteriorating loans before they become nonperforming assets, or that we will be able to limit losses on those loans that have been identified. In 2010 our asset quality metrics appear to have stabilized, so that for the year ended December 31, 2010, we recorded a provision for loan losses of $22.0 million (including $1.0 million for covered loans) and incurred net loan charge-offs of $27.5 million, respectively, as compared to $77.5 million and $57.1 million, respectively, for 2009. At December 31, 2010, our total non-covered nonperforming assets, net of SBA guarantees, had decreased to $43.2 million from $67.7 million at December 31, 2009. Continued weak economic conditions, particularly in the construction and real estate markets, as well as other factors such as changes in interest rates and other factors which are beyond our control, could again cause our estimate of probable losses or actual loan losses to exceed our current allowance. In addition, the FDIC and the DFI, as part of their supervisory functions, periodically review our allowance for loan and lease losses. Such agencies may require us to increase our provision for loan and lease losses or to recognize further losses, based on their judgments, which may be different from those of our management. Any such increase in the allowance required by the FDIC or the DFI could also hurt our business.
Our use of appraisals in deciding whether to make a loan on or secured by real property does not ensure the value of the real property collateral.
In considering whether to make a loan secured by real property, we generally require an appraisal of the property. However, an appraisal is only an estimate of the value of the property at the time the appraisal is made and appraisers may make mistakes of fact or judgment which adversely affect the reliability of their appraisal. If the appraisal does not reflect the amount that may be obtained upon any sale or foreclosure of the property, we may not realize an amount equal to the indebtedness secured by the property. In addition, events occurring after the initial appraisal may cause the value of the real estate to decrease.
20
Table of Contents
As a result of any of these factors, there may be less security than anticipated at the time the loan was originally made. If there is less security and a default occurs, we may not recover the outstanding balance of the loan.
Our expenses have increased and are likely to continue to increase as a result of increases in FDIC insurance premiums.
The FDIC, absent extraordinary circumstances, must establish and implement a plan to restore the deposit insurance reserve ratio to 1.35% of estimated insured deposits or the comparable percentage of the assessment base at any time that the reserve ratio falls below 1.35%. Recent bank failures have depleted the deposit insurance fund balance, which has been in a negative position since the end of 2009, and the FDIC currently has until September 30, 2020 to bring the reserve ratio back to the statutory minimum. The FDIC has stated that it expects insured institution failures to peak in 2010, which will result in continued charges against the Deposit Insurance Fund, and they have implemented a restoration plan that changes both its risk-based assessment system and its base assessment rates. As part of this plan, the FDIC adopted a final rule revising its risk-based assessment system, effective April 1, 2009. The changes to the assessment system involve adjustments to the risk-based calculation of an institution’s unsecured debt, secured liabilities and brokered deposits. The FDIC also imposed a special assessment in 2009 and required the prepayment of three years of FDIC insurance premiums at the end of 2009. The prepayments are designed to help address liquidity issues created by potential timing differences between the collection of premiums and charges against the DIF, but it is generally expected that assessment rates will continue to increase in the near term due to the significant cost of bank failures and the relatively large number of troubled banks. In addition, as with many institutions, our FDIC deposit insurance premiums have increased since the beginning of the recession due to the relative condition of the Bank. Any further significant premium increases or special assessments could have a material adverse effect on our financial condition and results of operations.
We may not be able to continue to attract and retain banking customers, and our efforts to compete may reduce our profitability.
Competition in the banking industry in the markets we serve may limit our ability to continue to attract and retain banking customers. The banking business in our current and intended future market areas is highly competitive with respect to virtually all products and services. While our primary market area is generally dominated by a relatively small number of major banks with many offices operating over a wide geographic area, our three main competitors in our niche markets are three Korean-American banks all of which are approximately 30% larger in asset size. These three competitors also focus their business strategies on Korean-American consumers and businesses. Primary competitors in the greater San Francisco, Chicago and Seattle metropolitan areas are also locally owned and operated Korean-American banks and subsidiaries of Korean banks. These competitors have branches located in many of the same neighborhoods as the Company, provide similar types of products and services and use the same Korean language publications and media for their marketing purposes. There is a high level of competition within this specific market, limiting organic growth opportunities. While major banks have not historically focused their marketing efforts on the Korean-American customer base in Southern California, their competitive influence could increase in the future. Such banks have substantially greater lending limits than the Company, offer certain services the Company cannot, may have access to lower cost of funds and often operate with “economies of scale” that result in lower operating costs than the Company on a per loan or per asset basis.
In addition to competitive factors impacting our specific market niche, we are affected by more general competitive trends in the banking industry, including intra-state and interstate consolidation, competition from non-bank sources, and technological innovations. Technology and other changes are allowing parties to complete financial transactions that historically have involved banks through alternative methods. For example, consumers can maintain funds that would have historically been held as bank deposits in brokerage accounts or mutual funds. Consumers can also complete transactions such as paying bills and/or transferring funds directly without the assistance of banks. The process of eliminating banks as intermediaries, known as “disintermediation,” could result in the loss of fee income, as well as the loss of customer deposits and the related income generated from those deposits. The loss of these revenue streams and the lower cost deposits as a source of funds could have a material adverse effect on the Company’s financial condition and results of operations.
In addition, with the increase in bank failures, customers increasingly are concerned about the extent to which their deposits are insured by the FDIC. Customers may withdraw deposits in an effort to ensure that the amount they have on deposit with their bank is fully insured. Decreases in deposits may adversely affect our funding costs and net income. Ultimately, competition can and does increase our cost of funds, reduce loan yields and drive down our net interest margin, thereby reducing profitability. It can also make it more difficult for us to continue to increase the size of our loan portfolio and deposit base, and could cause us to rely more heavily on wholesale borrowings, which are generally more expensive than deposits.
21
Table of Contents
Recently enacted legislation and our participation in the TARP Capital Purchase Program may increase costs and limit our ability to pursue business opportunities.
The Emergency Economic Stabilization Act of 2008 (the “EESA”), as augmented by the American Recovery and Reinvestment Act of 2009 (the “Stimulus Bill”), was intended to stabilize and provide liquidity to the U.S. financial markets. The programs established or to be established under the EESA and the Troubled Asset Relief Program (“TARP Capital Purchase Program”) may result in increased regulation of the industry in general and/or TARP Capital Purchase Program participants in particular. Specifically, so long as shares of Center Financial’s Series A Preferred Stock issued as part of the TARP Capital Purchase Program remain outstanding, Center Financial may not declare or pay any dividends on its common stock, or repurchase or redeem any of its common stock, unless all accrued and unpaid dividends on the Series A Preferred Stock are fully paid. In addition, Center Financial must comply with the U.S. Treasury’s standards for executive compensation and corporate governance. Such standards restricts our ability to pay certain compensation, including bonuses, incentive compensation, and severance payments, to our Senior Executive Officers (as defined in the ARRA) as well as other specified, highly-compensated employees. Compliance with such regulations may increase the Company’s costs and limit its ability to pursue business opportunities.
We are subject to a variety of operational risks, including reputational risk, legal risk and compliance risk, and the risk of fraud or theft by employees or outsiders, which may adversely affect our business and results of operations.
We are exposed to many types of operational risks, including reputational risk, legal and compliance risk, the risk of fraud or theft by employees or outsiders, and unauthorized transactions by employees or operational errors, including clerical or record-keeping errors or those resulting from faulty or disabled computer or telecommunications systems.
If personal, non-public, confidential or proprietary information of customers in our possession were to be mishandled or misused, we could suffer significant regulatory consequences, reputational damage and financial loss. Such mishandling or misuse could include, for example, if such information were erroneously provided to parties who are not permitted to have the information, either by fault of our systems, employees, or counterparties, or where such information is intercepted or otherwise inappropriately taken by third parties.
Because the nature of the financial services business involves a high volume of transactions, certain errors may be repeated or compounded before they are discovered and successfully rectified. Our necessary dependence upon automated systems to record and process transactions and our large transaction volume may further increase the risk that technical flaws or employee tampering or manipulation of those systems will result in losses that are difficult to detect. We also may be subject to disruptions of our operating systems arising from events that are wholly or partially beyond our control (for example, computer viruses or electrical or telecommunications outages, or natural disasters, disease pandemics or other damage to property or physical assets) which may give rise to disruption of service to customers and to financial loss or liability. We are further exposed to the risk that our external vendors may be unable to fulfill their contractual obligations (or will be subject to the same risk of fraud or operational errors by their respective employees as we are) and to the risk that we (or our vendors’) business continuity and data security systems prove to be inadequate. The occurrence of any of these risks could result in a diminished ability of us to operate our business (for example, by requiring us to expend significant resources to correct the defect), as well as potential liability to clients, reputational damage and regulatory intervention, which could adversely affect our business, financial condition and results of operations, perhaps materially.
Recently enacted and potential further financial regulatory reforms could have a significant impact on our business, financial condition and results of operations.
On July 21, 2010, President Obama signed the Dodd-Frank Wall Street Reform and Consumer Protection Act (the “Dodd-Frank Act”) into law. The Dodd-Frank Act is expected to have a broad impact on the financial services industry, including significant regulatory and compliance changes. Many of the requirements called for in the Dodd-Frank Act will be implemented over time and most will be subject to implementing regulations over the course of several years. Given the uncertainty associated with the manner in which the provisions of the Dodd-Frank Act will be implemented by the various regulatory agencies and through regulations, the full extent of the impact such requirements will have on our operations is unclear. The changes resulting from the Dodd-Frank Act may impact the profitability of business activities, require changes to certain business practices, impose more stringent capital, liquidity and leverage requirements or otherwise adversely affect our business. In particular, the potential impact of the Dodd-Frank Act on our operations and activities, both currently and prospectively, include, among others:
| • | a reduction in the ability to generate or originate revenue-producing assets as a result of compliance with heightened capital standards; |
22
Table of Contents
| • | increased cost of operations due to greater regulatory oversight, supervision and examination of banks and bank holding companies, and higher deposit insurance premiums; |
| • | the limitation on the ability to raise new capital through the use of trust preferred securities, as any new issuances of these securities will no longer be included as Tier 1 capital going forward; |
| • | a potential reduction in fee income due to limits on interchange fees applicable to larger institutions which could effectively reduce the fees we can charge; and |
| • | the limitation on the ability to expand consumer product and service offerings due to anticipated stricter consumer protection laws and regulations. |
Further, we may be required to invest significant management attention and resources to evaluate and make any changes necessary to comply with new statutory and regulatory requirements under the Dodd-Frank Act, which may negatively impact results of operations and financial condition.
Additionally, we cannot predict whether there will be additional proposed laws or reforms that would affect the U.S. financial system or financial institutions, whether or when such changes may be adopted, how such changes may be interpreted and enforced or how such changes may affect us. However, the costs of complying with any additional laws or regulations could have a material adverse effect on our financial condition and results of operations.
We may be adversely affected by the soundness of other financial institutions.
Our ability to engage in routine funding transactions could be adversely affected by the actions and liquidity of other financial institutions. Financial services institutions are inter-connected as a result of trading, clearing, counterparty, or other relationships. We have exposure to many different industries and counterparties, and routinely execute transactions with counterparties in the financial services industry, including commercial banks, brokers and dealers, investment banks, and other institutional clients. Many of these transactions expose us to credit risk in the event of a default by a counterparty or client. In addition, our credit risk may be exacerbated when collateral held by us cannot be liquidated at prices sufficient to recover the full amount of the credit or derivative exposure due to us. Any such losses could adversely affect our business, financial condition or results of operations.
Liquidity risk could impair our ability to fund operations and jeopardize our financial condition.
Liquidity is essential to the Company’s business. An inability to raise funds through traditional deposits, brokered deposits, borrowings, the sale of securities or loans and other sources could have a substantial negative effect on the Company’s liquidity. The Company’s access to funding sources in amounts adequate to finance the Company’s activities or the terms of which are acceptable could be impaired by factors that affect the Company specifically or the financial services industry or economy in general. The Company’s access to liquidity sources could be detrimentally impacted by a decrease in the level of the Company’s business activity as a result of a downturn in the markets in which the Company’s loans are concentrated. The Company’s ability to borrow could also be impaired by more general factors such as a disruption in the financial markets or negative views and expectations about the prospects for the financial services industry in light of the recent turmoil faced by banking organizations and the continued deterioration in credit markets.
The Company relies on commercial and retail deposits, brokered deposits, advances from the Federal Home Loan Bank of San Francisco (“FHLB”) and other borrowings to fund its operations. Although the Company has historically been able to replace maturing deposits and advances as necessary, it might not be possible to replace such funds in the future if, among other things, the Company’s results of operations or financial condition or the results of operations or financial condition of the FHLB or market conditions were to change.
Although the Company considers these sources of funds adequate for its liquidity needs, the Company may be compelled to seek additional sources of financing in the future. Likewise, the Company may seek additional financing in the future to achieve our business objectives, and additional borrowings may or may not be available and, if available, may not be so on favorable terms. Bank and holding company stock prices have been negatively affected by the recent adverse economic trend, as has the ability of banks and holding companies to raise capital or borrow in the debt markets compared to recent years. If additional financing sources are unavailable or are not available on reasonable terms, the Company’s financial condition, results of operations and future prospects could be materially adversely affected.
The Company actively monitors the depository institutions that hold its federal funds sold and due from banks cash balances. Access to the Company’s cash equivalents and federal funds sold could be impacted by adverse conditions in the financial markets. The Company’s emphasis is primarily on safety of principal, and the Company diversifies its due from banks and federal funds sold among counterparties to minimize exposure to any one of these entities. The financial conditions of the counterparties are routinely reviewed as part of the Company’s asset/liability management process. Balances in the Company’s
23
Table of Contents
accounts with financial institutions in the U.S. may exceed the FDIC insurance limits. While the Company monitors and adjusts the balances in our accounts as appropriate, these balances could be impacted if the financial institutions fail and could be subject to other adverse conditions in the financial markets.
In addition, due to the nature of the market the Company serves, a significant portion of its deposits are held by customers with ties to South Korea who may be inclined to transfer such deposits to South Korea depending on the relative value of the U. S. dollar and the South Korean currency. During the fourth quarter of 2008, the Company experienced a significant loss of deposits when customers transferred deposits to South Korea as a result of the devaluation of South Korean currency to the U. S. dollar. To date, these deposits have been replaced by retail deposits and wholesale funding. If an additional sustained withdrawal of deposits under similar circumstances should occur in the future, the Company’s liquidity position could be significantly and adversely impacted.
The value of securities in our investment portfolio may be negatively affected by continued disruptions in securities markets.
The market for some of the investment securities held in the Company’s portfolio has been volatile over the past twelve months. Volatile market conditions may detrimentally affect the value of these securities, such as through reduced valuations due to the perception of heightened credit, liquidity risks and illiquid markets for certain securities. There can be no assurance that the declines in market value associated with these disruptions will not result in other than temporary impairments of these assets, which would lead to accounting charges that could have a material adverse effect on the Company’s net income and capital levels.
In connection with Center Bank’s assumption of the banking operations of Innovative Bank from the FDIC, if our assumptions in entering into assumption agreements with loss-share are incorrect, we may sustain losses that are not covered by the FDIC’s loss share receivable, which could adversely affect our operating results.
The Company’s decision regarding the fair value of the assets acquired as part of the Innovative Bank transaction, including the FDIC loss share receivable, could be inaccurate, which could materially and adversely affect the Company’s business, financial condition, results of operations, and future prospect. Management makes various assumptions and judgments about the collectability of the acquired loans, including the creditworthiness of borrowers and the value of the real estate and other assets serving as collateral for the repayment of secured loans. In FDIC-assisted acquisitions that include loss sharing agreements, the Company may record a loss sharing asset that the Company considers adequate to absorb future losses which may occur in the acquired loan portfolio. In determining the size of the loss sharing asset, the Company analyzes the loan portfolio based on historical loss experience, volume and classification of loans, volume and trends in delinquencies and nonaccruals, local economic conditions, and other pertinent information.
If the Company’s assumptions are incorrect, the balance of the FDIC loss share receivable may at any time be insufficient to cover future loan losses, and credit loss provisions may be needed to respond to different economic conditions or adverse developments in the acquired loan portfolio. Any increase in future loan losses could have a negative effect on the Company’s operating results.
The Company’s ability to obtain reimbursement under the loss sharing agreement on covered assets depends on the Company’s compliance with the terms of the loss sharing agreements. Management must certify to the FDIC on a quarterly basis the Company’s compliance with the terms of the FDIC loss sharing agreements as a prerequisite to obtaining reimbursement from the FDIC for realized losses on covered assets. The required terms of the agreements are extensive and failure to comply with any of the guidelines could result in a specific asset or group of assets permanently losing their loss sharing coverage. Additionally, management may decide to forgo loss share coverage on certain assets to allow greater flexibility over the management of certain assets. As of December 31, 2010, $116.3 million, or 5.1% of the Company’s assets, were covered by the aforementioned FDIC loss sharing agreements.
Under the terms of the FDIC loss sharing agreements, the assignment or transfer of a loss sharing agreement to another entity generally requires the written consent of the FDIC. In addition, the Bank may not assign or otherwise transfer a loss sharing agreement during its term without the prior consent of the FDIC. No assurance can be given that the Company will manage the covered assets in such a way as to always maintain loss share coverage on all such assets.
We may engage in additional FDIC-assisted transactions, which could present additional risks to our business.
We acquired Innovative Bank in FDIC-assisted transaction in 2010. We may have additional opportunities to acquire the assets and liabilities of failed banks in FDIC-assisted transactions. Although these FDIC-assisted transactions typically provide for FDIC assistance to an acquirer to mitigate certain risks, such as sharing exposure to loan losses and providing indemnification against certain liabilities of the failed institution, we are (and would be in future transactions) subject to many of
24
Table of Contents
the same risks we would face in acquiring another bank in a negotiated transaction, including risks associated with maintaining customer relationships and failure to realize the anticipated acquisition benefits in the amounts and within the timeframes we expect. In addition, because these acquisitions are structured in a manner that would not allow us the time and access to information normally associated with preparing for and evaluating a negotiated acquisition, we may face additional risks in FDIC-assisted transactions, including additional strain on management resources, management of problem loans, problems related to integration of personnel and operating systems and impact to our capital resources requiring us to raise additional capital. We cannot assure you that we will be successful in overcoming these risks or any other problems encountered in connection with FDIC-assisted transactions. Our inability to overcome these risks could have a material adverse effect on our business, financial condition and results of operations.
Financial services companies depend on the accuracy and completeness of information about customers and counterparties.
In deciding whether to extend credit or enter into other transactions, the Company may rely on information furnished by or on behalf of customers and counterparties, including financial statements, credit reports and other financial information. The Company may also rely on representations of those customers, counterparties or other third parties, such as independent auditors, as to the accuracy and completeness of that information. Reliance on inaccurate or misleading financial statements, credit reports or other financial information could have a material adverse impact on the Company’s business and, in turn, on the Company’s financial condition and results of operations.
If our information systems were to experience a system failure or a breach in network security, our business and reputation could suffer.
The Company relies heavily on communications and information systems to conduct its business. The computer systems and network infrastructure we use could be vulnerable to unforeseen problems. The Company’s operations are dependent upon its ability to protect its computer equipment against damage from fire, power loss, telecommunications failure or a similar catastrophic event. In addition, the Company must be able to protect its computer systems and network infrastructure against physical damage, security breaches and service disruption caused by the Internet or other users. Such computer break-ins and other disruptions would jeopardize the security of information stored in and transmitted through the Company’s computer systems and network infrastructure. The Company has policies and procedures designed to prevent or limit the effect of the failure, interruption or security breach of its information systems and with the help of third-party service providers, will continue to implement security technology and monitor and update operational procedures to prevent such damage. However, if such failures, interruptions or security breaches were to occur, they could result in damage to the Company’s reputation, a loss of customer business, increased regulatory scrutiny, or possible exposure to financial liability, any of which could have a material adverse effect on the Company’s financial condition and results of operations.
As a result of our participation in the TARP Capital Purchase Program, we are subject to significant restrictions on compensation payable to our executive officers and other key employees.
Our ability to attract and retain key officers and employees may be impacted by legislation and regulation affecting the financial services industry. In 2009, the American Recovery and Reinvestment Act (“ARRA”) became law. The ARRA, through the implementing regulations of the U.S. Treasury, significantly expanded the executive compensation restrictions originally imposed on TARP participants, including us. Among other things, these restrictions limit our ability to pay bonuses and other incentive compensation and make severance payments. These restrictions will continue to apply to us for as long as the preferred stock we issued pursuant to the TARP Capital Purchase Program remains outstanding. These restrictions may negatively affect our ability to attract and retain key personnel and otherwise compete with financial institutions that are not subject to the same limitations.
Changes in interest rates could adversely affect our profitability, business and prospects.
Banking companies’ earnings depend largely on the relationship between the cost of funds, primarily deposits and borrowings, and the yield on earning assets, such as loans and investment securities. This relationship, known as the interest rate spread, is subject to fluctuation and is affected by the monetary policies of the Federal Reserve Board and the international interest rate environment, as well as by economic, regulatory and competitive factors which influence interest rates, the volume and mix of interest-earning assets and interest-bearing liabilities, and the level of nonperforming assets. Many of these factors are beyond the Company’s control. The Company is subject to interest rate risk to the degree that interest-bearing liabilities reprice or mature more slowly or more rapidly or on a different basis than interest-earning assets. For example, if the rate of interest we pay on interest-bearing deposits, borrowings, and other liabilities increases more than the rate of interest we receive on loans, securities, and other interest-earning assets, our net interest income and therefore our earnings could be adversely affected. Our earnings could also be adversely affected if the rates on our loans and other investments fall more quickly than those on our deposits and other liabilities. Given the current volume and mix of interest-bearing liabilities and interest-earning
25
Table of Contents
assets, the interest rate spread could be expected to decrease during times of rising interest rates and, conversely, to increase during times of falling interest rates. Therefore, significant fluctuations in interest rates may have an adverse or a positive effect on results of operations.
In addition, fluctuations in interest rates affect the demand of customers for products and services. For example, rising interest rates generally are associated with a lower volume of loan originations while lower interest rates are usually associated with increased loan originations. Conversely, in rising interest rate environments loan repayment rates generally decline and in a falling interest rate environment loan repayment rates generally increase. In addition, an increase in the general level of interest rates may adversely affect the ability of certain borrowers to pay the interest on and principal of their obligations. Interest rates also affect how much money we can lend. When rates rise, the cost of borrowing increases. Accordingly, changes in market interest rates could materially and adversely affect our net interest spread, asset quality, loan origination volume, business, financial condition, results of operations, and cash flows.
We are subject to extensive regulation that could limit or restrict our activities.
The Company operates in a highly regulated industry and is subject to examination, supervision, and comprehensive regulation by various federal and state agencies. The Company’s compliance with these regulations is costly and restricts certain of its activities, including payment of dividends, mergers and acquisitions, investments, loans and interest rates charged, interest rates paid on deposits and locations of offices. The Company is also subject to capitalization guidelines established by its regulators, which require the Company to maintain adequate capital to support its growth.
The laws and regulations applicable to the banking industry could change at any time, and the Company cannot predict the effects of these changes on its business and profitability. Because government regulation greatly affects the business and financial results of all commercial banks and bank holding companies, the Company’s cost of compliance could adversely affect its ability to operate profitably.
The Sarbanes-Oxley Act of 2002, and the related rules and regulations promulgated by the SEC and NASDAQ that are now applicable to the Company, have increased the scope, complexity and cost of corporate governance, reporting and disclosure practices. In addition, as a participant in the TARP Capital Purchase Program, the Company is subject to certain additional restrictions on its dividend and repurchase activities and compensation arrangements, and the U.S. Congress or federal bank regulatory agencies could adopt additional regulatory requirements or restrictions in response to the threats to the financial system which may apply to all banking institutions, or may instead be more specifically targeted at TARP Capital Purchase Program participants.
If we are not able to successfully keep pace with technological changes affecting the industry, our business could be hurt.
The financial services industry is constantly undergoing rapid technological change with frequent introductions of new technology-driven products and services. The effective use of technology increases efficiency and enables financial institutions to better service clients and reduce costs. Our future success depends, in part, upon our ability to address the needs of our clients by using technology to provide products and services that will satisfy client demands, as well as create additional efficiencies within our operations. Some of our competitors have substantially greater resources to invest in technological improvements. We may not be able to effectively implement new technology-driven products and services or be successful in marketing these products and services to our clients. Failure to successfully keep pace with technological change in the financial services industry could have a material adverse impact on our business and, in turn, on our financial condition and results of operations.
We may incur additional costs for environmental clean up.
The cost of cleaning up or paying damages or penalties associated with environmental problems could increase the Company’s operating expenses. If a borrower defaults on a loan secured by real property, the Company will often purchase the property in foreclosure or accept a deed to the property surrendered by the borrower. The Company also could be compelled to assume the management responsibilities of commercial properties whose owners have defaulted on their loans. The Company also leases premises for its branch operations and corporate office in locations where environmental problems may exist. Although the Company has lending and facility leasing guidelines intended to identify properties with an unreasonable risk of contamination, hazardous substances may exist on some of these properties. As a result, environmental laws could force the Company to clean up the hazardous waste located on these properties (at the Company’s expense) and cost might exceed their fair market value. Further, even if environmental laws did not hold the Company responsible for the environmental clean up of such properties, it might be difficult or impossible to sell properties until the environmental problems were remediated.
26
Table of Contents
Adverse conditions in South Korea could adversely affect our business.
A substantial number of our customers have economic and cultural ties to South Korea and, as a result, we are likely to feel the effects of adverse economic and political conditions in South Korea. If economic conditions in South Korea deteriorate, we could, among other things, be exposed to economic and transfer risk, and could experience an outflow of deposits by those of our customers with connections to South Korea. Transfer risk may result when an entity is unable to obtain the foreign exchange needed to meet its obligations or to provide liquidity. This may adversely impact the recoverability of investments with or loans made to such entities. Adverse economic conditions in South Korea may also negatively impact asset values and the profitability and liquidity of our customers who operate in this region.
The recent repeal of federal prohibitions on payment of interest on demand deposits could increase our interest expense.
All federal prohibitions on the ability of financial institutions to pay interest on demand deposit accounts were repealed as part of the Dodd-Frank Act. As a result, beginning on July 21, 2011, financial institutions could commence offering interest on demand deposits to compete for clients. We do not yet know what interest rates other institutions may offer. Our interest expense will increase and our net interest margin will decrease if we begin offering interest on demand deposits to attract additional customers or maintain current customers, which could have a material adverse effect on our business, financial condition and results of operations.
Risks Relating to the Proposed Merger with Nara Bancorp
Because the exchange ratio is fixed and the market price of our stock and Nara Bancorp’s stock will fluctuate, our shareholders cannot be sure of the market value of the Merger consideration they may receive.
On December 9, 2010, we entered into a Merger Agreement with Nara Bancorp. If the proposed Merger is completed, each of our outstanding shares will convert into 0.7804 shares of Nara Bancorp’s common stock (the “Exchange Ratio”). The Exchange Ratio was fixed so that, after completing the proposed Merger, our shareholders would own approximately 45% of the post-Merger combined company, and Nara Bancorp’s shareholders would own approximately 55% of the combined company. The Exchange Ratio is not subject to adjustment based on changes in the trading price of our stock or Nara Bancorp’s common stock before the closing of the proposed Merger. As a result, our shareholders cannot be sure of the market value of the Merger consideration they will receive if the Merger is completed. Because the Exchange Ratio is fixed, the value of the Merger consideration will not reflect changes in the price of our stock or Nara Bancorp’s stock, nor will it reflect the relative performance of Center Financial and Nara Bancorp between December 9, 2010 and the closing of the Merger.
We may be unable to fully realize the benefits anticipated by the proposed Merger, including estimated cost savings and synergies, or it may take longer than anticipated to achieve such benefits.
The realization of the benefits anticipated as a result of the proposed Merger, including cost savings and synergies, will depend in part on the successful integration of our operations with Nara Bancorp’s operations. There can be no assurance that such operations will be integrated successfully. Moreover, the integration process may take substantially longer than anticipated. The dedication of management resources to such integration may detract attention from our day-to-day business and the integration costs may be substantial. In addition, the integration process entails a risk that key employees will leave or major customers will take their business elsewhere. Such effects, including, but not limited to, incurrence of unexpected costs or delays in connection with such integration, may have a material adverse effect on the financial results of the combined company.
Required regulatory approvals may not be received, may take longer to receive than expected or may impose conditions that are not anticipated or cannot be met.
Before the Merger may be completed, various approvals must be obtained from the bank regulatory authorities. Although Center Financial and Nara Bancorp have each reported profits in recent quarters, both companies have had significant quarterly losses within the past two years and have been the subject of informal regulatory action. We entered into an MOU with bank regulatory authorities and Nara Bancorp adopted board resolutions at the request of bank regulatory authorities, in each case directed toward reducing nonperforming assets, resolving perceived weaknesses in lending and specified other banking operations and, in our case, attaining and maintaining specified, higher than normal, regulatory capital ratios. To obtain regulatory approval of the proposed Merger, we and Nara Bancorp must provide adequate information to the regulatory authorities that we have satisfactorily addressed these regulatory concerns. We anticipate that this may result in a longer than normal regulatory approval process and therefore do not expect to be able to complete the proposed Merger before the second half of 2011. If we are unable to satisfy the regulators’ concerns, we will not be able to complete the proposed Merger. In addition, the relevant bank regulatory authorities may impose conditions on the completion of the Merger or require changes to
27
Table of Contents
the terms of the Merger Agreement. Such conditions or changes may have the effect of delaying completion of the transactions contemplated in the Merger Agreement or imposing additional costs on or limiting the revenues of the combined company, any of which may have a material adverse effect on the combined company following consummation of the proposed Merger.
Uncertainties related to the pending Merger may adversely affect our business.
Uncertainty about the effect of the proposed Merger may have adverse consequences for our employee and customer relations. We may find it difficult to attract, retain and motivate key personnel. Some employees may choose to leave as a result of uncertainty regarding their future role in the combined company. Customers and others that deal with us may terminate their business relationship with us or may defer expanding existing relationships while the Merger is pending. The loss of key employees or important customer relationships could have a material adverse effect upon our future business.
We are subject to various contractual restrictions while the proposed Merger is pending.
The Merger Agreement provides various contractual restrictions upon our operations. Without Nara Bancorp’s consent, we may not pursue acquisition or certain other business opportunities that may arise while the proposed Merger is pending. In addition, certain corporate actions will require Nara Bancorp’s prior consent. These restrictions will impair our flexibility and may prevent us from pursuing attractive business opportunities that may arise prior to the completion or abandonment of the proposed Merger.
If the proposed Merger does not close, we will have incurred substantial expenses without realizing the expected benefits.
We have incurred and are continuing to incur substantial expenses in connection with the proposed Merger for investment banking, legal and accounting fees and other transaction costs. These expenses may materially reduce our earnings. If the Merger does not close, such expenses will have been incurred without realization of the expected benefits.
Termination of the Merger Agreement may negatively affect us.
If the Merger Agreement is terminated, we may suffer various adverse consequences, including:
| • | our business may have been adversely impacted by the failure to pursue other beneficial opportunities due to the focus of management on the proposed Merger, without realizing any of the anticipated benefits of completing the Merger; |
| • | the market price of our common stock might decline to the extent that the market price prior to termination reflects a market assumption that the proposed Merger will be completed; and |
| • | the payment of a termination fee, if required under the circumstances, may adversely affect our financial condition and liquidity. The Merger Agreement provides for a potential termination fee of $10 million or $2.5 million, depending on the circumstances. |
Risks Related to Our Securities
The price of our common stock may fluctuate significantly, and this may make it difficult for you to sell shares of common stock at times or at prices you find attractive.
The trading price of our common stock may fluctuate widely as a result of a number of factors, many of which are outside our control. In addition, the stock market is subject to fluctuations in the share prices and trading volumes that affect the market prices of the shares of many companies. These broad market fluctuations could adversely affect the market price of our common stock. Among the factors that could affect our common stock price in the future are:
| • | formal regulatory action against us; |
| • | actual or anticipated quarterly fluctuations in our operating results and financial condition; |
| • | changes in revenue or earnings estimates or publication of research reports and recommendations by financial analysts; |
| • | failure to meet analysts’ revenue or earnings estimates; |
| • | speculation in the press or investment community; |
28
Table of Contents
| • | strategic actions by us or our competitors, such as acquisitions or restructurings; |
| • | acquisitions of other banks or financial institutions, through FDIC-assisted transactions or otherwise; |
| • | actions by shareholders; |
| • | fluctuations in the stock price and operating results of our competitors; |
| • | general market conditions and, in particular, developments related to market conditions for the financial services industry; |
| • | fluctuations in the stock price and operating results of our competitors; |
| • | proposed or adopted regulatory changes or developments; |
| • | anticipated or pending investigations, proceedings, or litigation that involve or affect us; and |
| • | domestic and international economic factors unrelated to our performance. |
The stock market and, in particular, the market for financial institution stocks, has experienced significant volatility. As a result, the market price of our common stock may be volatile. In addition, the trading volume in our common stock may fluctuate more than usual and cause significant price variations to occur. The trading price of the shares of our common stock and the value of our other securities will depend on many factors, which may change from time to time, including, without limitation, our financial condition, performance, creditworthiness and prospects, future sales of our equity or equity related securities, and other factors identified above in “Forward-Looking Statements” and elsewhere in this “RISK FACTORS” section. The capital and credit markets have been experiencing volatility and disruption for several years, at times reaching unprecedented levels. In some cases, the markets have produced downward pressure on stock prices and credit availability for certain issuers without regard to those issuers’ underlying financial strength. A significant decline in our stock price could result in substantial losses for individual shareholders and could lead to costly and disruptive securities litigation.
The Company is currently prohibited from paying cash dividends on its capital stock without the prior approval of federal banking regulators and the U.S. Treasury Department, and there can be no assurance that the Company will be able to pay dividends in the future.
The Company has entered into an MOU with the FRB pursuant to which the Company must obtain the prior approval of the FRB in order to pay cash dividends. See “Item 1—BUSINESS —Informal Regulatory Agreements” above. In addition, under the terms of the Series A Preferred Stock issued to the U.S. Treasury Department on December 12, 2008 under the TARP Capital Purchase Program, the Company must obtain the prior approval of the U.S. Treasury Department prior to paying any dividends on its capital stock before December 12, 2011. Accordingly, without the prior approval of federal and state banking regulators and the U.S. Treasury Department, the Company cannot pay any cash dividends on its common stock. The prior approval of the FRB is also required for the payment of dividends on the Series A Preferred Stock, or the payment of interest on the Company’s subordinated debt securities. In view of its current capital levels, it is anticipated that the Company will likely continue to receive approval to pay the dividends on the Series A Preferred Stock and interest on the subordinated debt securities, although no assurance can be given that such approvals will be granted. Any failure to pay such dividends or interest when due could adversely affect the market value of our common stock.
Moreover, during any period in which the Company has deferred payment of interest otherwise due and payable on its subordinated debt securities, or any unpaid dividends on the Series A Preferred Stock, the Company may not make any dividends or distributions with respect to its capital stock, including the common stock. The Company’s ability to pay dividends is further limited by California corporation law.
Notwithstanding the foregoing legal limitations, the Board of Directors retains in its full discretion the authority to declare dividends, and there can be no assurance that the Board will authorize any dividends on the common stock in the future.
The Company relies heavily on the payment of dividends from its subsidiary, Center Bank, and such dividends are subject to federal and state regulatory requirements and approvals.
The Company’s ability to pay dividends and to service its own obligations depends on the Bank’s ability to pay dividends to the Company, as the Company has no other independent source of significant income. However, as a result of the MOU and banking regulatory requirements generally, the Bank is limited in its ability to pay cash dividends and must obtain prior regulatory approval in order to do so.
29
Table of Contents
As a general matter, the payment of dividends by the Bank is affected by the requirement to maintain adequate capital pursuant to the capital adequacy guidelines issued by the FDIC. All banks and bank holding companies are required to maintain a minimum ratio of qualifying total capital to total risk-weighted assets of 8%, at least one-half of which must be in the form of Tier 1 capital, and a ratio of Tier 1 capital to average adjusted assets of 4%. If (i) any of these required ratios are increased; (ii) the total of risk-weighted assets of a bank increases significantly; and/or (iii) a bank’s income decreases significantly, a bank may decide to or be required to retain a greater portion of its earnings to achieve and maintain the required capital or asset ratios, thereby reducing the amount of funds available for the payment of dividends by a bank to its parent holding company. In addition, the FDIC has the power to prohibit a bank from paying dividends if, in its view, such payments would constitute unsafe or unsound banking practices.
The MOU the Bank has entered into with the FDIC and the DFI requires the Bank to maintain a minimum Tier 1 leverage capital ratio of not less than 9% and a total risk-based capital ratio of not less than 13% while the MOU remains in effect. The Bank’s regulatory capital ratios as of December 31, 2010 exceeded these requirements. Also under the Bank’s MOU, the Bank must receive prior approval from the FDIC to pay dividends to the Company, and under the Company’s MOU with the FRB, the Company must receive the prior approval of the FRB to receive dividends from the Bank.
The Bank’s ability to pay dividends to the Company is also limited by California corporation law and the California Financial Code. As a result of the Bank’s 2009 financial performance, the Bank is still required by the California Financial Code to obtain the prior approval of the DFI to pay dividends to the Company. Further, whether dividends are paid and their frequency and amount will depend on the financial condition and performance, and the discretion of the Board of Directors of the Bank.
The foregoing restrictions on dividends paid by the Bank may limit the Company’s ability to obtain funds from such dividends for its cash needs, including funds for payment of its debt service requirements and operating expenses and for payment of cash dividends to the Company’s shareholders.
Your investment may be diluted because of the ability of management to offer stock to others and stock options.
The shares of the Company do not have preemptive rights. This means that you may not be entitled to buy additional shares if shares are offered to others in the future. We are authorized to issue 100,000,000 shares of common stock and 10,000,000 shares of preferred under our Articles of Incorporation. As of December 31, 2010 we had 39,914,686 shares of common stock outstanding and 55,000 shares of Series A Preferred Stock outstanding.
Nothing restricts management’s ability to offer additional shares of stock for fair value to others in the future. In addition, when our directors, executive officers and other employees exercise outstanding stock options, your ownership in the Company will be diluted. As of December 31, 2010 there were outstanding options to purchase an aggregate of 571,777 shares of our common stock with an average exercise price of $17.30 per share. There were also an additional 2,255,179 shares available remaining for grant of options or restricted stock awards under our 2006 Stock Incentive Plan, as amended.
Shares of our preferred stock eligible for future issuance and sale could also have a dilutive effect on the market for the shares of our common stock. Although our board of directors has no present intent to issue shares of preferred stock, such shares could be issued in the future. If such shares of preferred stock are made convertible into shares of common stock, there could be a dilutive effect on the shares of common stock then outstanding. In addition, shares of preferred stock may be provided a preference over holders of common stock upon our liquidation or with respect to the payment of dividends, in respect of voting rights or in the redemption of our common stock. The rights, preferences, privileges and restrictions applicable to any series or preferred stock would be determined by resolution of our board of directors. We also have a Warrant outstanding to the U S. Treasury Department to purchase 432,290 shares of the Company’s authorized but unissued common stock at an exercise price of $9.54 per share until December 12, 2018.
The holders of our Series A perpetual preferred stock have rights that are senior to those of our common shareholders.
In December 2008, the Company issued and sold $55.0 million worth of its Series A Preferred Stock to the U.S. Treasury Department. The terms of the Series A Preferred Stock could reduce investment returns to the Company’s common shareholders by restricting dividends, diluting existing shareholders’ ownership interests, and restricting capital management practices. The Company’s board of directors suspended its quarterly cash dividends beginning in the first quarter of 2009, and unless the Series A Preferred Stock has been redeemed, the Company will not be able to resume paying cash dividends without the consent of the U.S. Treasury Department. The Company will also be prohibited paying any dividends on its common stock in the event of any unpaid dividends on the Series A Preferred Stock. The Series A Preferred Stock also ranks senior to the Company’s common stock on liquidation. The liquidation amount of the Series A Preferred Stock is $1,000 per share. The Series B Preferred Stock ranks pari passu to the outstanding Series A Preferred Stock, which means that if all dividends payable on the Series B Preferred
30
Table of Contents
Stock have not been paid in full, any dividend declared on the Series A Preferred Stock shall be declared and paid pro rata with respect to the Series B Preferred Stock.
If we are unable to redeem our Series A Preferred Stock by December 12, 2013, the cost of this capital to us will increase substantially.
If we are unable to redeem our Series A Preferred Stock prior to December 12, 2013, the cost of this capital to us will increase substantially on that date, from 5% per annum (approximately $2.7 million annually) to 9% per annum (approximately $5.0 million annually). Depending on our financial condition at the time, this increase in the annual dividend rate on the Series A Preferred Stock could have a material negative effect on our earnings.
The holders of our junior subordinated debentures have rights that are senior to those of the shareholders.
As of December 31, 2010, we had $18.0 million in junior subordinated debentures outstanding that were issued to our statutory trust. The trust purchased the junior subordinated debentures from us using the proceeds from the sale of trust preferred securities to third party investors. Payments of the principal and interest on the trust preferred securities are conditionally guaranteed by the Company to the extent not paid or made by each trust, provided the trust has funds available for such obligations.
The junior subordinated debentures are senior to our shares of common stock, and Series A Preferred Stock. As a result, we must make payments on the junior subordinated debentures (and the related trust preferred securities) before any dividends can be paid on our common stock or preferred stock and, in the event of bankruptcy, dissolution or liquidation, the holders of the debentures must be satisfied before any distributions can be made to shareholders. If certain conditions are met, we have the right to defer interest payments on the junior subordinated debentures (and the related trust preferred securities) at any time or from time to time for a period not to exceed 20 consecutive quarters in a deferral period, during which time no dividends may be paid to holders of our common stock or any series of preferred stock.
Provisions in our articles of incorporation may delay or prevent changes in control of our corporation or our management.
These provisions make it more difficult for another company to acquire us, which could reduce the market price of our common stock and the price that you receive if you sell your shares in the future. These provisions include the following:
| • | no cumulative voting in the election of directors; and |
| • | The requirement that our board of directors consider the potential social and economic effects on our employees, depositors, customers and the communities we serve as well as certain other factors, when evaluating a possible tender offer, merger or other acquisition of the Company. |
These provisions will not affect the pending merger with Nara Bancorp, which has been unanimously approved by Center Financial’s Board of Directors and is being recommended by the Board for approval by the shareholders at the appropriate time.
| ITEM 1B. | UNRESOLVED STAFF COMMENTS |
There are no material unresolved written comments that were received from the SEC’s Staff 180 days or more before the end of the Company’s fiscal year 2010 relating to the Company’s periodic or current reports filed under the Securities Exchange Act of 1934.
| ITEM 2. | PROPERTIES |
Properties
The Company’s headquarters are located at 3435 Wilshire Boulevard, Los Angeles, California 90010. The Company leases approximately 25,000 square feet, which includes administrative offices located on the third and seventh floor of the building. The lease term expires in early 2012.
As of December 31, 2010, the Company operated full-service branches at twenty leased locations. Expiration dates of the Company’s leases range from May 2011 to November 2020. The Company owns two facilities, the Olympic and Western branches, with carrying values (including land value) of $2.0 million and $4.1 million, respectively, at December 31, 2010. Certain properties currently leased have renewal options, which could extend the use of the facility for additional specified terms. In the opinion of management, all properties are adequately covered by insurance and existing facilities are considered adequate for present and anticipated future use.
31
Table of Contents
From time to time, the Company is a party to claims and legal proceedings arising in the ordinary course of business. It is management’s opinion that the resolution of any such claims or legal proceedings would not have a material adverse effect on the Company’s financial condition or results of operations.
32
Table of Contents
| ITEM 5. | MARKET FOR COMMON EQUITY, RELATED SHAREHOLDER MATTERS AND ISSUER PURCHASES OF EQUITY SECURITIES |
Trading History
Center Financial’s common stock is listed on the NASDAQ Global Select Market under the symbol “CLFC”. The information in the following table indicates the high and low sales prices and approximate volume of trading for the Company’s common stock for the periods indicated, based upon information provided by the NASDAQ Stock Market, LLC.
| Calendar Quarter Ended |
Market Value | Approximate Trading Volume |
||||||||||
| High | Low | |||||||||||
| March 31, 2009 |
$ | 6.71 | $ | 2.22 | 8,162,000 | |||||||
| June 30, 2009 |
3.75 | 2.51 | 5,481,000 | |||||||||
| September 30, 2009 |
4.98 | 2.15 | 4,820,000 | |||||||||
| December 31, 2009 |
5.55 | 3.71 | 4,439,000 | |||||||||
| March 31, 2010 |
5.47 | 4.55 | 5,292,000 | |||||||||
| June 30, 2010 |
7.20 | 4.81 | 16,661,000 | |||||||||
| September 30, 2010 |
5.59 | 4.45 | 13,489,000 | |||||||||
| December 31, 2010 |
7.88 | 4.71 | 12,071,000 | |||||||||
Holders
As of February 24, 2011, there were approximately 210 shareholders of record of the common stock, and about 1,900 street name holders.
Dividends
As a bank holding company which currently has no significant assets other than its equity interest in the Bank, Center Financial’s ability to pay dividends primarily depends upon the dividends received from the Bank. The dividend practice of the Bank, like the Company’s dividend practice, will depend upon its earnings, financial position, current and anticipated cash requirements and other factors deemed relevant by the Bank’s board of directors at that time. In addition, the Bank and the Company have each entered into MOUs with the respective regulatory agency or agencies, pursuant to which both the Bank and the Company must obtain prior regulatory approval to pay dividends. See “Item 1—BUSINESS—Informal Regulatory Agreements” above.
From October 2003 to January 2009, Center Financial paid quarterly cash dividends to its shareholders. Center Financial paid cash dividends of 4 cents per share throughout 2006 and in January and April 2007, and 5 cents per share from July 2007 to January 2009. On March 25, 2009, the Company’s board of directors suspended its quarterly cash dividends based on adverse economic conditions and a reduction in the Company’s earnings. The board of directors determined that this is a prudent, safe and sound practice to preserve capital, and does not expect to resume the payment of cash dividends in the foreseeable future. Unless the preferred stock issued to the U.S. Treasury Department in the TARP Capital Purchase Program has been redeemed, the Company will not be permitted to resume paying cash dividends without the consent of the U.S. Treasury Department until December 2011. In addition, as noted above, both the Bank and the Company must obtain prior regulatory approval to pay dividends pursuant to the terms of their MOU. Once the Company is no longer restricted in its ability to pay cash dividends by any specific regulatory requirements, the amount of any such dividends will be determined each quarter by our board of directors in its discretion, based on the factors described in the next paragraph. No assurance can be given that future performance will justify the payment of dividends in any particular quarter.
The Bank’s ability to pay cash dividends is also subject to certain legal limitations. Under California law, banks may declare a cash dividend out of their net profits up to the lesser of retained earnings or the net income for the last three fiscal years (less any distributions made to shareholders during such period), or with the prior written approval of the Commissioner of Financial Institutions, in an amount not exceeding the greatest of (i) the retained earnings of the Bank, (ii) the net income of the Bank for its last fiscal year or (iii) the net income of the Bank for its current fiscal year. Since the Bank’s net loss for 2009 exceeded its combined earnings for 2008 and 2010, in addition to the regulatory approval requirements of the MOU, the Bank will need to obtain the prior written approval of the Commissioner to pay any dividends until the Bank’s net income for the previous three fiscal years is again greater than the amount of any such dividend. In addition, under federal law, banks are prohibited from paying any dividends if after making such payment they would fail to meet any of the minimum regulatory capital requirements. The federal regulators also have the authority to prohibit banks from engaging in any business practices
33
Table of Contents
which are considered to be unsafe or unsound, and in some circumstances the regulators might prohibit the payment of dividends on that basis even though such payments would otherwise be permissible.
Center Financial’s ability to pay dividends is also limited by state corporation law. The California General Corporation Law allows dividends to the company’s shareholders if the company’s retained earnings equal at least the amount of the proposed dividend. If a California corporation does not have sufficient retained earnings available for the proposed dividend, it may still pay a dividend to its shareholders if immediately after giving effect to the dividend the sum of the company’s assets (exclusive of goodwill and deferred charges) would be at least equal to 125% of its liabilities (not including deferred taxes, deferred income and other deferred liabilities) and the current assets of the company would be at least equal to its current liabilities, or, if the average of its earnings before taxes on income and before interest expense for the two preceding fiscal years was less than the average of its interest expense for the two preceding fiscal years, at least equal to 125% of its current liabilities. In addition, during any period in which Center Financial has deferred payment of interest otherwise due and payable on its subordinated debt securities, or any unpaid dividends on the preferred stock issued to the U.S. Treasury Department, it may not make any dividends or distributions with respect to its capital stock. See “Item 7, Management’s Discussion and Analysis of Financial Condition and Results of Operations—Capital Resources.”
Securities Authorized for Issuance under Equity Compensation Plans
The following table provides information as of December 31, 2010 with respect to stock options and restricted stock awards outstanding and available under our 2006 Stock Incentive Plan, as amended, which is our only equity compensation plan other than an employee benefit plan meeting the qualification requirements of Section 401(a) of the Internal Revenue Code:
| Plan Category |
Number of Securities to be Issued Upon Exercise of Outstanding Options, Warrants or Rights |
Weighted-Average Exercise Price of Outstanding Options, Warrants or Rights |
Number of Securities Remaining Available for Future Issuance |
|||||||||
| Equity compensation plans approved by security holders |
571,777 | $ | 17.30 | 2,255,179 | ||||||||
| Equity compensation plans not approved by security holders |
— | — | — | |||||||||
34
Table of Contents
Performance Graph
The graph below compares the yearly percentage change in cumulative total shareholders’ return on the Company’s stock with the cumulative total return of (i) of the NASDAQ market index; (ii) all banks and bank holding companies listed on NASDAQ; and (iii) an index comprised of banks and bank holding companies located throughout the United States with total assets of between $1.0 billion and $5.0 billion. The latter two peer group indexes were compiled by SNL Financial of Charlottesville, Virginia. The Company reasonably believes that the members of the third group listed above constitute peer issuers for the period from December 31, 2005 through December 31, 2010. The graph assumes an initial investment of $100 and reinvestment of dividends. The graph is not necessarily indicative of future price performance.
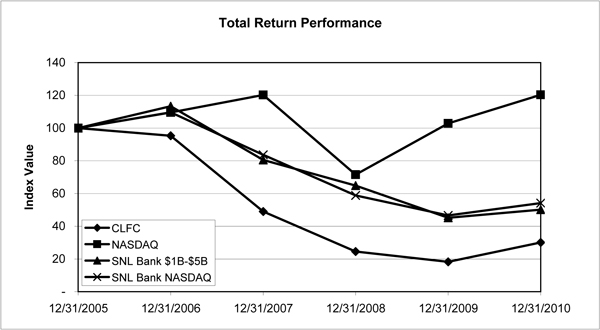
| Index |
Period Ending | |||||||||||||||||||||||
| 12/31/05 | 12/31/06 | 12/31/07 | 12/31/08 | 12/31/09 | 12/31/10 | |||||||||||||||||||
| Center Financial Corporation |
100.00 | 95.27 | 48.97 | 24.52 | 18.28 | 30.13 | ||||||||||||||||||
| NASDAQ Composite |
100.00 | 109.52 | 120.27 | 71.51 | 102.89 | 120.29 | ||||||||||||||||||
| SNL Bank $1B-$5B |
100.00 | 113.35 | 80.54 | 64.82 | 45.15 | 50.09 | ||||||||||||||||||
| SNL Bank NASDAQ |
100.00 | 109.62 | 83.63 | 58.82 | 46.61 | 54.10 | ||||||||||||||||||
35
Table of Contents
ITEM 6. SELECTED FINANCIAL DATA
The following table presents selected historical financial information concerning the Company, which should be read in conjunction with the Company’s audited consolidated financial statements, including the related notes and “Management’s Discussion and Analysis of Financial Condition and Results of Operations,” included elsewhere herein. All per share information has been adjusted for dividends declared by the Company.
| As of and For the Year Ended December 31, | ||||||||||||||||||||
| 2010 | 2009 | 2008 | 2007 | 2006 | ||||||||||||||||
| (Dollars in thousands, except share data) | ||||||||||||||||||||
| STATEMENTS OF OPERATIONS: |
||||||||||||||||||||
| Interest income |
$ | 95,831 | $ | 103,811 | $ | 131,207 | $ | 143,241 | $ | 124,729 | ||||||||||
| Interest expense |
27,893 | 42,584 | 56,607 | 66,986 | 53,319 | |||||||||||||||
| Net interest income before provision for loan losses |
67,938 | 61,227 | 74,600 | 76,255 | 71,410 | |||||||||||||||
| Provision for loan losses |
22,010 | 77,472 | 26,178 | 6,494 | 5,666 | |||||||||||||||
| Net interest income (loss) after provision for loan losses |
45,928 | (16,245 | ) | 48,422 | 69,761 | 65,744 | ||||||||||||||
| Noninterest income |
26,088 | 13,979 | 5,487 | 13,535 | 22,226 | |||||||||||||||
| Noninterest expense |
48,017 | 46,070 | 55,336 | 47,707 | 45,327 | |||||||||||||||
| Income (loss) before income tax expense (benefit) |
23,999 | (48,336 | ) | (1,427 | ) | 35,589 | 42,643 | |||||||||||||
| Income tax expense (benefit) |
1,316 | (5,834 | ) | (1,647 | ) | 13,646 | 16,485 | |||||||||||||
| Net income (loss) |
22,683 | (42,502 | ) | 220 | 21,943 | 26,158 | ||||||||||||||
| Preferred stock dividends and accretion of preferred stock discount(1) |
(31,996 | ) | (2,954 | ) | (155 | ) | — | — | ||||||||||||
| Net income (loss) available to common shareholders |
$ | (9,313 | ) | $ | (45,456 | ) | $ | 65 | $ | 21,943 | $ | 26,158 | ||||||||
| SHARE DATA: |
||||||||||||||||||||
| Net income (loss) per common share |
||||||||||||||||||||
| Basic |
$ | (0.26 | ) | $ | (2.66 | ) | $ | 0.00 | $ | 1.32 | $ | 1.58 | ||||||||
| Diluted |
(0.26 | ) | (2.66 | ) | 0.00 | 1.31 | 1.57 | |||||||||||||
| Book value per common share |
5.49 | 6.54 | 9.42 | 9.62 | 8.46 | |||||||||||||||
| Cash dividend per common share |
— | — | 0.20 | 0.19 | 0.16 | |||||||||||||||
| Weighted average common shares outstanding: |
||||||||||||||||||||
| Basic |
35,263,251 | 17,077,352 | 16,525,761 | 16,649,495 | 16,535,189 | |||||||||||||||
| Diluted |
35,263,251 | 17,077,352 | 16,560,309 | 16,731,694 | 16,666,768 | |||||||||||||||
| STATEMENTS OF FINANCIAL CONDITION: |
||||||||||||||||||||
| Total assets |
$ | 2,270,279 | $ | 2,192,800 | $ | 2,056,609 | $ | 2,080,663 | $ | 1,843,312 | ||||||||||
| Total investment securities |
289,551 | 370,427 | 182,694 | 139,710 | 159,504 | |||||||||||||||
| Net loans(2) |
1,592,163 | 1,479,142 | 1,679,340 | 1,789,635 | 1,537,176 | |||||||||||||||
| Total deposits |
1,770,994 | 1,747,671 | 1,603,519 | 1,577,674 | 1,429,399 | |||||||||||||||
| Total shareholders’ equity |
274,012 | 256,058 | 214,567 | 157,453 | 140,734 | |||||||||||||||
| 1 | Preferred stock dividends for 2010 include the effect of the beneficial conversion feature of $29.0 million (see Note 18). |
| 2 | Net loans represent gross non-covered and covered loans less the allowance for loan losses, net deferred fees, and discount on SBA loans. |
36
Table of Contents
| As of and For the Year Ended December 31, | ||||||||||||||||||||
| 2010 | 2009 | 2008 | 2007 | 2006 | ||||||||||||||||
| PERFORMANCE RATIOS: |
||||||||||||||||||||
| Return on average assets(3) |
1.01 | % | (1.96 | )% | 0.01 | % | 1.14 | % | 1.53 | % | ||||||||||
| Return on average equity(4) |
8.57 | (20.29 | ) | 0.13 | 14.33 | 20.66 | ||||||||||||||
| Net interest spread(5) |
2.92 | 2.51 | 3.01 | 3.06 | 3.36 | |||||||||||||||
| Net interest margin(6) |
3.33 | 3.03 | 3.80 | 4.23 | 4.53 | |||||||||||||||
| Efficiency ratio(7) |
51.07 | 61.26 | 69.09 | 53.13 | 48.41 | |||||||||||||||
| Net loans to total deposits at period end |
89.90 | 84.64 | 104.73 | 113.44 | 107.54 | |||||||||||||||
| Dividend payout ratio |
— | — | 48.78 | 14.50 | 10.19 | |||||||||||||||
| CAPITAL RATIOS |
||||||||||||||||||||
| Leverage capital ratio |
||||||||||||||||||||
| Consolidated Company |
12.74 | % | 12.40 | % | 11.28 | % | 8.49 | % | 8.62 | % | ||||||||||
| Center Bank |
12.50 | 12.00 | 10.64 | 8.28 | 8.51 | |||||||||||||||
| Tier 1 risk-based capital ratio |
||||||||||||||||||||
| Consolidated Company |
17.60 | 16.50 | 12.58 | 9.31 | 9.45 | |||||||||||||||
| Center Bank |
17.26 | 15.94 | 11.87 | 9.08 | 9.33 | |||||||||||||||
| Total risk-based capital ratio |
||||||||||||||||||||
| Consolidated Company |
18.87 | 17.77 | 13.84 | 10.42 | 10.54 | |||||||||||||||
| Center Bank |
18.53 | 17.22 | 13.13 | 10.19 | 10.42 | |||||||||||||||
| ASSET QUALITY RATIOS |
||||||||||||||||||||
| Non-performing loans to total gross loans(8)(9) |
3.68 | % | 4.12 | % | 1.19 | % | 0.35 | % | 0.21 | % | ||||||||||
| Non-performing assets to total gross loans and other real estate owned(10) |
3.82 | 4.39 | 1.19 | 0.37 | 0.21 | |||||||||||||||
| Net charge-offs to average gross non-covered loans |
1.84 | 3.49 | 0.47 | 0.21 | 0.16 | |||||||||||||||
| Allowance for loan losses to total gross loans(9) |
3.22 | 3.81 | 2.22 | 1.13 | 1.12 | |||||||||||||||
| Allowance for loan losses to non-performing loans(9) |
88 | 92 | 187 | 327 | 534 | |||||||||||||||
| 3 | Net income divided by average total assets. |
| 4 | Net income divided by average shareholders’ equity. |
| 5 | Represents the weighted average yield on interest-earning assets less the weighted average cost of interest-bearing liabilities. |
| 6 | Represents net interest income as a percentage of average interest-earning assets. |
| 7 | Represents the ratio of non-interest expense to the sum of net interest income before provision for loan losses and total non-interest income. |
| 8 | Nonperforming loans consist of non-accrual loans and loans past due 90 days or more. |
| 9 | Total gross loans consist of non-covered and covered loans. |
| 10 | Nonperforming assets consist of non-performing loans and other real estate owned. |
37
Table of Contents
| ITEM 7. | MANAGEMENT’S DISCUSSION AND ANALYSIS OF FINANCIAL CONDITION AND RESULTS OF OPERATIONS |
This discussion presents management’s analysis of the Company’s financial condition and results of operations as of, and for each of the years in the three-year period ended December 31, 2010, and includes the statistical disclosures required by SEC Guide 3 (“Statistical Disclosure by Bank Holding Companies”). The discussion should be read in conjunction with the financial statements of the Company and the notes related thereto which appear elsewhere in this Form 10-K Annual Report (See Item 8 below). This discussion and analysis contains forward-looking statements that involve risks, uncertainties and assumptions. Our actual results may differ materially from those anticipated in these forward-looking statements as a result of many factors, including those set forth under Item 1A “Risk Factors” and elsewhere in this Report.
Critical Accounting Policies
Our significant accounting policies are disclosed in Note 2 to the consolidated financial statements contained in “Item 8 – Financial Statements and Supplementary Data.” Accounting estimates and assumptions discussed in this section are those that the Company considers to be the most critical to an understanding of its financial statements because they inherently involve significant judgments and uncertainties. The financial information contained in these statements is, to a significant extent, based on approximate measures of the financial effects of transactions and events that have already occurred. These critical accounting policies are those that involve subjective decisions and assessments and have the potential impact on the Company’s results of operations. Management has identified its most critical accounting policies to be those relating to the following: investment securities and securities available for sale, non-covered and covered loans, impaired loans and allowance for loan losses, non-covered and covered OREO, FDIC loss share receivable and deferred income taxes. The following is a summary of these accounting policies. In each area, the Company has identified the variables most important in the estimation process. The Company has used the best information available to make the estimations necessary to value the related assets and liabilities. Actual performance that differs from the Company’s estimates and future changes in the key variables could change future valuations and impact net income.
Investment Securities Available for Sale
The Company classifies its investment securities according to their purpose and holding period. As of December 31, 2010 and 2009, there were no trading account securities or held-to-maturity securities in the investment portfolio. Investment securities available for sale are reported at estimated fair value. Unrealized gains or losses on securities available for sale are, excluded from operations, reported as a separate component of accumulated other comprehensive income or loss, net of tax, in shareholders’ equity.
The fair values of the investment securities are generally determined by reference to the quoted market prices obtained from independent external brokers or independent external pricing service providers who have experience in valuing these securities.
The Company evaluates its investment securities portfolio, at each reporting date, for indicators of other-than-temporary impairment (“OTTI”). This determination requires significant judgment. The Company assesses whether OTTI has occurred when the fair value of a debt security is less than the amortized cost basis at the balance sheet date. Under these circumstances, OTTI is considered to have occurred (1) if the Company intends to sell the security; (2) if it is more likely than not the Company will be required to sell the security before recovery of its amortized cost basis; or (3) the expected cash flows are not sufficient to recover all contractually required principal and interest payments. Furthermore, securities which fail the criteria above (1 through 3) must be evaluated to determine what portion of the impairment is related to credit or noncredit related OTTI. For securities that the Company does not intend to sell or it is more likely than not to be required to sell, the OTTI is separated into credit and noncredit components. The credit related OTTI, represented by the expected loss in principal, is recognized in noninterest income, while noncredit related OTTI is recognized in other comprehensive income. Noncredit related OTTI results from other factors, including increased liquidity spreads and extension of the security. For securities the Company does expect to sell, entire OTTI is recognized in earnings.
Securities transactions are recognized on the trade date (the date the order to buy or sell is executed). The carrying value plus any related OCI balance of sold securities is used to compute realized gains and losses. Interest and dividends on securities are included in interest income. Amortization of premiums and accretion of discounts on securities are recorded as yield adjustments on such securities using the effective interest method. The specific identification method is used for purposes of determining cost in computing realized gains and losses on investment securities sold.
38
Table of Contents
Non-covered Loans
As a result of the Innovative Bank acquisition, we have a class of loans called “covered loans” that are covered by a loss sharing agreement with the FDIC. When we refer to non-covered loans, we are referring to loans not covered by the FDIC loss sharing agreement.
Interest on loans is credited to income as earned and is accrued only if deemed collectible. Accrual of interest is discontinued when a loan is over 90 days delinquent or if management believes that collection is highly uncertain. When interest accrual is discontinued, all unpaid accrued interest is reversed against interest income. Generally, payments received on non-accrual loans are recorded as principal reductions. Interest income is recognized after all principal has been repaid or an improvement in the condition of the loan has occurred that would warrant resumption of interest accruals. A loan is returned to accrual status when the borrower has demonstrated a satisfactory payment trend subject to management’s assessment of the borrower’s ability to repay the loan.
Covered Loans
Loans acquired in a FDIC-assisted acquisition that are subject to the FDIC loss sharing agreement are referred to as covered loans. Covered loans are reported exclusive of the expected cash flow reimbursements expected from the FDIC. The Company considered most of its acquired loans, except for a small population of cash secured loans and overdrafts, credit impaired loans under the provisions of Accounting Standards Codification (“ASC”) 310-30, Loans and Debt Securities Acquired with Deteriorated Credit Quality, for the Innovative Bank acquisition.
Acquired loans are valued as of acquisition date in accordance with ASC 805, Business Combinations. Loans purchased with evidence of credit deterioration since origination for which it is probable that all contractually required payments will not be collected are accounted for under ASC 310-30.
Under ASC 805 and ASC 310-30, loans are recorded at fair value at acquisition date, factoring in credit losses expected to be incurred over the life of the loan. Accordingly, an allowance for loan losses is not carried over or recorded as of the acquisition date. In accordance with ASC 310-30, acquired loans were aggregated into pools based on individually evaluated common risk characteristics (including whether the loans were currently in nonperforming status) and expected cash flows were estimated on a pool basis. A pool was accounted for as a single asset with a single interest rate, cumulative loss rate and cash flow expectation. The Company aggregated all of the loans, with the exception of a small population of loans, acquired in the FDIC-assisted acquisition of Innovative Bank, into seven different pools. A loan will be removed from a pool of loans only if the loan is sold, foreclosed, assets are received in satisfaction of the loan, or the loan is written off, and will be removed from the pool at the carrying value.
The cash flows expected to be received over the life of the pool were estimated by management with the assistance of a third party valuation specialist. These cash flows were utilized in calculating the carrying values of the pools and underlying loans, book yields, effective interest income and impairment, if any, based on actual and projected events. Default rates, loss severity, and prepayment speeds assumptions will be periodically reassessed and updated within the accounting model to update the expectation of future cash flows. The excess of the cash flows expected to be collected over the pool’s carrying value is considered to be the accretable yield and is recognized as interest income over the estimated life of the loan or pool using the effective yield method. The accretable yield will change due to changes in the timing and amounts of expected cash flows. Changes in the accretable yield will be disclosed quarterly.
The excess of the contractual balances due over the cash flows expected to be collected is considered to be the nonaccretable difference. The nonaccretable difference represents the Company’s estimate of the credit losses expected to occur and was considered in determining the fair value of the loans as of the acquisition date. Subsequent to the acquisition date, any increases in expected cash flows over those expected at purchase date in excess of fair value are adjusted through the accretable difference on a prospective basis. Any subsequent decreases in expected cash flows over those expected at the purchase date are recognized by recording a provision for loan losses. Any disposals of loans, including sales of loans, payments in full or foreclosures, result in the removal of the loan from the pool at its carrying amount. The difference between actual prepayments and expected prepayments will not affect the nonaccretable difference.
39
Table of Contents
The covered loan portfolio also includes cash secured loans and overdrafts which were not accounted for under ASC 310-30. These loans were accounted for under ASC 805 at fair value at the acquisition date with fair value discount or premium being accreted to interest income using the interest method.
Impaired Loans and Allowance for Loan Losses on Non-covered Loans
The Company’s allowance for loan loss methodologies incorporate a variety of risk considerations, both quantitative and qualitative, in establishing an allowance for loan losses that management believes is appropriate at each reporting date. Quantitative factors include the Company’s historical loss experience, delinquency and charge-off trends, collateral values, changes in nonperforming loans, and other factors. Quantitative factors also incorporate known information about individual loans, including borrowers’ sensitivity to interest rate movements and to quantifiable external factors including commodity and finished good prices as well as acts of nature (earthquakes, floods, fires, etc.) that occur in a particular period. Qualitative factors include the general economic environment in the Company’s markets and, in particular, the state of certain industries. Size and complexity of individual credits, loan structure, extent and nature of waivers of existing loan policies and pace of portfolio growth are other qualitative factors that are considered in its methodologies. As the Company adds new products, increases the complexity of the loan portfolio, and expands its geographic coverage, the Company will enhance the methodologies to keep pace with the size and complexity of the loan portfolio. Changes in any of the above factors could have significant impact to the allowance for loan loss calculation. The Company believes that its methodologies continue to be appropriate given its size and level of complexity.
The allowance consists of specific and general components. The specific component relates to loans that are individually classified as impaired. Loans over $300,000, with internal risk grade of substandard or below, are individually evaluated for impairment. Large group of smaller balance homogeneous loans, such as consumer loans, are collectively evaluated for impairment. The general component covers non-impaired loans and is based on historical loss experience adjusted for current factors. The historical experience is determined by portfolio segment and is based on the actual loss history experienced by the Company over the most recent six quarters. The following portfolio segments have been identified: real estate loans (construction and commercial), commercial loans (commercial business, trade finance and SBA) and others (consumer and other loans). The construction loan portfolio has the highest qualitative adjustments for economic and other credit risk factors, such as the incomplete status of the collateral and detrimental effect of the recent economic downturn on these types of properties, but total balance in this portfolio is not a concentration in the overall portfolio. The commercial real estate loan portfolio as a whole had the next highest level of qualitative adjustments due to the effect of local economies on the underlying collateral property values, as well as for industry concentrations and risks related to the commercial business tenants. Commercial real estate loans secured by hotel/motels, golf courses, gas station/car washes pose an industry concentration risk within this portfolio, have historically shown higher credit risk than in other collateral property types, and were negatively impacted by the effect of the recent poor economy on the hospitality and recreation industries as well as increasing fuel and travel costs, resulting in higher qualitative adjustment made to this portfolio. Within commercial loans portfolio, risk analysis is performed based on concentrations within industries, as well as by individual loan type. Commercial business loans granted under SBA-guaranteed programs show higher historical risks as these loans are made to small businesses which were more negatively impacted by the weak economy for the past few years. This impact resulted in increased qualitative adjustments for this portfolio during the year. Trade finance loans show minimal historical losses and have the lowest level of inherent risk as they are generally structured for transaction based funding and businesses within this portfolio were less impacted by local economic downturn. Accordingly, qualitative adjustments made to this portfolio are generally minor.
Loans are measured for impairment when it is probable that not all amounts, including principal and interest, will be collected in accordance with the contractual terms of the loan agreement. The amount of impairment and any subsequent changes are recorded through the provision for loan losses as an adjustment to the allowance for loan losses. Impairment is measured either based on the present value of the loan’s expected future cash flows or the estimated fair value of the collateral less related liquidation costs. This evaluation is inherently subjective as it requires estimates that are susceptible to significant revision as more information becomes available. The Company’s policy is to record cash receipts received on nonperforming loans first as reductions to principal and then to interest income.
A loan is classified as a troubled debt restructured when a borrower is experiencing financial difficulties that lead to a restructuring of the loan, and the Company grants concessions to the borrower in the restructuring that it would not otherwise consider. These concessions may include interest rate reductions, principal forgiveness, extension of maturity date and other actions intended to minimize potential losses. Loans restructured at a rate equal to or greater than that of a new loan with comparable risk at the time the loan is modified may be excluded from restructured loan disclosures in years subsequent to the restructuring if the loans are in compliance with their modified terms. Generally, a nonaccrual loan that is restructured remains on nonaccrual for a period of six months to demonstrate that the borrower can meet the restructured terms. However, the borrower’s performance prior to the restructuring, or other significant events at the time of restructuring may be considered in assessing whether the borrower can meet the new terms and may result in the loan being returned to accrual status after a shorter
40
Table of Contents
performance period. If the borrower’s performance under the new terms is not reasonably assured, the loan remains classified as a nonaccrual loan.
Loan losses are charged, and recoveries are credited to the allowance account. Additions to the allowance account are charged to the provision for loan losses. The allowance for loan losses is maintained at a level considered adequate by management to absorb inherent losses in the loan portfolio. The adequacy of the allowance for loan losses is determined by management based upon an evaluation and review of the loan portfolio, consideration of historical loan loss experience, current economic conditions, and changes in the composition of the loan portfolio, analysis of collateral values, and other pertinent factors. While management uses available information to recognize possible losses on loans, future additions to the allowance may be necessary based on changes in economic conditions. In addition, various regulatory agencies, as an integral part of their examination process, periodically review the Company’s allowance for loan losses. Such agencies may require the Company to recognize additional allowance based on their judgments about information available to them at the time of their examination.
Non-covered Other Real Estate Owned (“OREO”)
Non-covered OREO, which represents real estate acquired through foreclosure in satisfaction of commercial and real estate loans, is stated at fair value less estimated selling cost Loan balances in excess of the fair value of the real estate acquired at the date of foreclosure are charged to the allowance for loan losses. Any subsequent decline in the fair value of non-covered OREO is recognized as a charge to operations and a corresponding increase to the valuation allowance of non-covered OREO. Gains and losses from sales and net operating expenses of non-covered OREO are included in current operations.
Covered OREO
All OREO acquired in FDIC-assisted acquisitions that are subject to a FDIC loss sharing agreement are referred to as “covered OREO” and reported separately in the consolidated statements of financial condition. Covered OREO is reported exclusive of expected reimbursement cash flows from the FDIC. Foreclosed covered loan collateral is transferred into covered OREO at the loan’s fair value, inclusive of the acquisition date fair value discount.
Covered OREO was initially recorded at its estimated fair value on the acquisition date based on similar market comparable valuations less estimated selling costs. Any subsequent valuation adjustments due to declines in fair value will be charged to non-interest expense, and will be offset, in part, by non-interest income representing the corresponding increase to the FDIC loss share receivable. Any recoveries of previous valuation adjustments will be credited to non-interest expense with a corresponding charge to non-interest income for the portion of the recovery that is due to the FDIC.
FDIC Loss Share Receivable
The Company accounts for amounts receivable under the loss sharing agreement with the FDIC as FDIC loss share receivable in accordance with ASC 805. The FDIC loss share receivable was initially recorded at fair value, based on the discounted value of expected future cash flows under the loss sharing agreement. The difference between the present value and the undiscounted cash flows the Company expects to collect from the FDIC will be accreted into non-interest income over the life of the FDIC loss share receivable.
The FDIC loss share receivable is reviewed quarterly and adjusted for any changes in expected cash flows based on recent performance and expectations for future performance of the covered portfolio. These adjustments are measured on the same basis as the related covered loans and covered OREO. Any increases in the cash flows of the covered assets over those expected will reduce the FDIC loss share receivable and any decreases in cash flows of the covered assets under those expected will increase the FDIC loss share receivable. Increases and decreases to the FDIC loss share receivable are recorded as adjustments to non-interest income.
Income Taxes
Income tax expense is the total of the current year income tax due or refundable and the change in deferred tax assets and liabilities. Deferred income taxes are provided for using an asset and liability approach. Deferred income tax assets and liabilities represent the tax effects, based on current tax law, of future deductible or taxable amounts attributable to events that have been recognized in the consolidated financial statements.
A valuation allowance is established against deferred tax assets due to an uncertainty of realization. The valuation allowance is reviewed in each period to analyze whether there is a sufficient positive or negative evidence to support a change in management’s judgment about the realizability of the related deferred tax assets.
41
Table of Contents
In assessing the future realization of deferred tax assets, management considers whether it is more likely than not that some portion or all of the deferred tax assets will not be realized. The ultimate realization of deferred tax assets is dependent upon the generation of future taxable income during the periods in which those temporary differences become deductible. Management considers the scheduled reversal of deferred tax liabilities, the projected future taxable income, and tax-planning strategies in making this assessment. A tax position is recognized as a benefit only if it is more likely than not that the tax position would be sustained in a tax examination, with a tax examination being presumed to occur. For tax positions not meeting the “more likely than not” criteria, no tax benefit is recorded.
The Company’s policy is to record any interest or penalties paid in connection with income taxes in other operating expenses of the consolidated statements of operations.
42
Table of Contents
Executive Overview
Consolidated net income for the year ended December 31, 2010 was $22.7 million and consolidated net loss available to common shareholders was $9.3 million, or a loss of $0.26 per diluted common share compared to a consolidated net loss of $42.5 million, consolidated net loss available to common shareholders of $45.5 million, or a loss of $2.66 per diluted common share for the year ended December 31, 2009 and a consolidated net income of $220,000, consolidated net income available to common shareholders of $65,000 or $0.00 per diluted common share for the year ended December 31, 2008. The following were significant factors related to 2010 results as compared to 2009 and 2008:
| • | The 2010 provision for loan losses decreased to $22.0 million compared to $77.5 million in 2009 and $26.2 million in 2008, due primarily to decrease in charge-offs and the more stabilized risk assessment of the loan portfolio. Management’s assessment of the credit risk inherent in the portfolio is based on a migration, quantitative and qualitative analyses, and other historical factors and trends. |
| • | The Company recorded a bargain purchase gain of $5.9 million, net of expense related to equity appreciation rights exercised by the FDIC, in 2010 as a result of the FDIC-assisted acquisition of Innovative Bank on April 16, 2010. |
| • | The Company’s efficiency ratio for 2010 improved to 51.1% compared to 61.3% for 2009 and 69.1% for 2008. The improvement primarily resulted from the increases in net interest income due to a decrease in interest expenses on deposits and the increase in non-interest income due mainly to gain on business acquisition of $5.9 million, gain on sale of securities available for sale of $2.2 million and gain on sale of SBA loans of $1.5 million in 2010. The improvement in 2009 compared to 2008 was due primarily to nonrecurring expenses incurred in 2008 such as OTTI of $9.9 million and litigation settlement expenses of $7.5 million. |
| • | Net interest income before provision for loan losses for 2010 increased to $67.9 million as compared to $61.2 million for 2009 and $74.6 million in 2008. The increase in 2010 was due primarily to a decline in interest rates for deposits to a greater extent than that for loans and investments. In particular, the reduction in interest rates paid for time certificates of deposits contributed to the decline in interest expense in 2010. The decrease in 2009 compared to 2008 was due primarily to reduction in net earning assets, which resulted from de-leveraging of loans, and the margin compression. |
| • | The net interest margin for the years ended December 31, 2010, 2009 and 2008 was 3.33%, 3.03%, and 3.80%, respectively. The 30 basis point increase in net interest margin in 2010 was due primarily to a decrease in deposit cost and management’s efforts to change the deposit mix focusing more on lower cost deposits during the past year offset by a reduction in interest rates on loans and investments to a lesser extent. The decrease in 2009 was due mainly to a reduction in the Federal Reserve lending rates. |
| • | The return on average assets and return on average equity for 2010 increased to 1.01% and 8.57%, respectively, compared to (1.96)% and (20.29)% in 2009 and 0.01% and 0.13% in 2008. Return on average assets and the return on average equity increased due to the Company’s return to profitability primarily resulting from the improvement in the net interest margin, a decrease in the loan loss provision and an increase in total noninterest income including the bargain purchase gain in 2010 as compared to 2009. The consolidated net loss in 2009 contributed to decreases in both ratios in 2009. |
| • | The beneficial conversion feature included in the Series B preferred stock issued in December 2009 was recognized upon conversion to common stock on March 29, 2010 as a dividend and was accounted for as a charge to retained earnings and a reduction of net income available to common shareholders in the earnings per share computation in the amount of $29.0 million. |
The following are important factors in understanding the Company’s financial condition and liquidity:
| • | The Company’s gross non-covered loans decreased by $10.6 million, or 0.7%, in 2010. Despite increase in SBA loans, trade finance and commercial business loans of $103.6 million offset by the decreases in real estate loans of $100.0 million, and consumer and other loans of $14.2 million at December 31, 2010. |
| • | Total non-covered nonperforming loans decreased to $45.5 million as of December 31, 2010 from $63.5 million as of December 31, 2009. The decrease in 2010 primarily resulted from the decreases in nonperforming commercial real estate loans of $13.5 million and construction real estate loans of $2.3 million and trade finance of $1.5 million and commercial loans of $2.6 million offset by the increases in nonperforming SBA loans of $1.7 million. |
43
Table of Contents
| • | Total deposits increased $23.3 million or 1.3% to $1.77 billion at December 31, 2010 compared to $1.75 billion at December 31, 2009. The increase resulted mainly from the assumption of Innovative Bank’s deposits. |
| • | As a result of the increase in loans to a greater extent than the increase in deposits, the ratio of net loans to total deposits increased to 89.9% at December 31, 2010 as compared to 84.6% at December 31, 2009. |
Results of Operations
Net Interest Income
The Company’s earnings depend largely upon its net interest income, which is the difference between the income received from its loan portfolio and other interest-earning assets and the interest paid on its deposits and other funding liabilities. The Company’s net interest income is affected by the change in the level and the mix of interest-earning assets and interest-bearing liabilities, referred to as volume changes. The Company’s net interest income is also affected by changes in the yields earned on assets and rates paid on liabilities, referred to as rate changes. Interest rates charged on loans are affected principally by the demand for such loans, the supply of money available for lending purposes, and competitive factors. Those factors are, in turn, affected by general economic conditions and other factors beyond the Company’s control, such as federal economic policies, the general supply of money in the economy, legislative tax policies, governmental budgetary matters and the actions of the Federal Reserve Board. Interest rates on deposits are affected primarily by rates charged by competitors.
The following table sets forth, for the periods indicated, the dollar amount of changes in interest earned and interest paid for interest-earning assets and interest-bearing liabilities and the amount of change attributable to (i) changes in average daily balances (volume) and (ii) changes in interest rates (rate):
| Year Ended December 31, 2010 vs. 2009 Increase (Decrease) Due to Change In |
Year Ended December 31, 2009 vs. 2008 Increase (Decrease) Due to Change In |
|||||||||||||||||||||||
| Volume | Rate | Total | Volume | Rate | Total | |||||||||||||||||||
| (Dollars in thousands) | ||||||||||||||||||||||||
| Interest-earning assets: |
||||||||||||||||||||||||
| Interest income: |
||||||||||||||||||||||||
|
Loans(11) |
$ | (2,824 | ) | $ | (4,327 | ) | $ | (7,151 | ) | $ | (12,401 | ) | $ | (16,464 | ) | $ | (28,865 | ) | ||||||
| Federal funds sold |
5 | (9 | ) | (4 | ) | 480 | (167 | ) | 313 | |||||||||||||||
| Investments(12) |
2,319 | (3,144 | ) | (825 | ) | 3,066 | (1,910 | ) | 1,156 | |||||||||||||||
| Total interest-earning assets |
(500 | ) | (7,480 | ) | (7,980 | ) | (8,855 | ) | (18,541 | ) | (27,396 | ) | ||||||||||||
| Interest-bearing liabilities: |
||||||||||||||||||||||||
| Interest expense: |
||||||||||||||||||||||||
| Money market and super NOW accounts |
92 | (3,379 | ) | (3,287 | ) | 3,166 | (5,004 | ) | (1,838 | ) | ||||||||||||||
| Savings deposits |
656 | (511 | ) | 145 | 505 | (80 | ) | 425 | ||||||||||||||||
| Time Certificates of deposits |
(1,181 | ) | (10,000 | ) | (11,181 | ) | 1,058 | (10,836 | ) | (9,778 | ) | |||||||||||||
| Other borrowings |
176 | (453 | ) | (277 | ) | (3,847 | ) | 1,528 | (2,319 | ) | ||||||||||||||
| Long-term subordinated debentures |
— | (91 | ) | (91 | ) | — | (513 | ) | (513 | ) | ||||||||||||||
| Total interest-bearing liabilities |
(257 | ) | (14,434 | ) | (14,691 | ) | 882 | (14,905 | ) | (14,023 | ) | |||||||||||||
| Net interest income |
$ | (243 | ) | $ | 6,954 | $ | 6,711 | $ | (9,737 | ) | $ | (3,636 | ) | $ | (13,373 | ) | ||||||||
| 11 | Loans are net of the allowance for loan losses, deferred fees and discount on SBA loans retained. Loan fees included in loan income were approximately $0.3 million, $0.7 million and $1.4 million for the years ended December 31, 2010, 2009 and 2008, respectively. Amortized loan fees have been included in the calculation of net interest income. Non-accrual loans have been included in the table for computation purposes, but the foregone interest of such loans is excluded. |
| 12 | Interest income on a tax equivalent basis for tax-advantaged investments was not included in the computation of yields. Such income amounted to $0, $0 and $85,000 for the years ended December 31, 2010, 2009 and 2008, respectively. |
Net interest income was $67.9 million, $61.2 million and $74.6 million for the years ended December 31, 2010, 2009 and 2008, respectively. The 2010 increase in net interest income was due to a decline in interest rates for deposits to a greater extent than that for loans and investments. In particular, the reduction in interest rates paid for time certificates of deposits contributed to the decline in interest expense in 2010. The 2009 decrease in net interest income of $13.4 million, or 17.9% was due to a sharp decline in interest rates during the comparable periods. This decline was mostly attributed to the Federal Open Market Committee of the Federal Reserve System (“FOMC”) decreasing interest rates over the comparable periods.
44
Table of Contents
Net Interest Margin
The following table shows the Company’s average balances of assets, liabilities and shareholders’ equity; the amount of interest income and interest expense; the average yield or rate for each category of interest-earning assets and interest-bearing liabilities; and the net interest spread and the net interest margin for the periods indicated:
| For the Year Ended December 31, | ||||||||||||||||||||||||||||||||||||
| 2010 | 2009 | 2008 | ||||||||||||||||||||||||||||||||||
| Average Balance |
Interest Income/ Expense |
Annualized Average Rate/Yield |
Average Balance |
Interest Income/ Expense |
Annualized Average Rate/Yield |
Average Balance |
Interest Income/ Expense |
Annualized Average Rate/Yield |
||||||||||||||||||||||||||||
| (Dollars in thousands) | ||||||||||||||||||||||||||||||||||||
| Assets: | ||||||||||||||||||||||||||||||||||||
| Interest-earning assets: |
||||||||||||||||||||||||||||||||||||
| Loans(13) |
$ | 1,538,520 | $ | 86,408 | 5.62 | % | $ | 1,587,336 | $ | 93,559 | 5.89 | % | $ | 1,779,420 | $ | 122,424 | 6.88 | % | ||||||||||||||||||
| Federal funds sold |
183,420 | 414 | 0.23 | 181,037 | 418 | 0.23 | 6,144 | 105 | 1.71 | |||||||||||||||||||||||||||
| Investments(14) |
320,870 | 9,009 | 2.81 | 251,921 | 9,834 | 3.90 | 179,066 | 8,678 | 4.85 | |||||||||||||||||||||||||||
| Total interest-earning assets |
2,042,810 | 95,831 | 4.69 | 2,020,294 | 103,811 | 5.14 | 1,964,630 | 131,207 | 6.68 | |||||||||||||||||||||||||||
| Noninterest - earning assets: |
||||||||||||||||||||||||||||||||||||
| Cash and due from banks |
103,723 | 66,698 | 52,851 | |||||||||||||||||||||||||||||||||
| Bank premises and equipment, net |
13,259 | 14,168 | 14,509 | |||||||||||||||||||||||||||||||||
| Customers’ acceptances outstanding |
2,174 | 2,830 | 4,156 | |||||||||||||||||||||||||||||||||
| Accrued interest receivables |
5,699 | 7,045 | 7,651 | |||||||||||||||||||||||||||||||||
| Other assets |
83,075 | 57,020 | 40,675 | |||||||||||||||||||||||||||||||||
| Total noninterest-earning assets |
207,930 | 147,761 | 119,842 | |||||||||||||||||||||||||||||||||
| Total assets |
$ | 2,250,740 | $ | 2,168,055 | $ | 2,084,472 | ||||||||||||||||||||||||||||||
| Liabilities and Shareholders’ Equity: |
||||||||||||||||||||||||||||||||||||
| Interest-bearing liabilities: |
||||||||||||||||||||||||||||||||||||
| Deposits: |
||||||||||||||||||||||||||||||||||||
| Money market and NOW accounts |
$ | 501,573 | $ | 5,549 | 1.11 | % | $ | 496,342 | $ | 8,836 | 1.78 | % | $ | 363,356 | $ | 10,674 | 2.94 | % | ||||||||||||||||||
| Savings |
91,858 | 2,401 | 2.61 | 68,926 | 2,256 | 3.27 | 53,601 | 1,832 | 3.42 | |||||||||||||||||||||||||||
| Time certificate of deposits over $100,000 |
510,360 | 7,632 | 1.50 | 627,703 | 14,779 | 2.35 | 724,384 | 28,805 | 3.98 | |||||||||||||||||||||||||||
| Other time certificate of deposits |
286,304 | 5,030 | 1.76 | 247,824 | 9,064 | 3.66 | 124,741 | 4,815 | 3.86 | |||||||||||||||||||||||||||
| 1,390,095 | 20,612 | 1.48 | 1,440,795 | 34,935 | 2.42 | 1,266,082 | 46,126 | 3.64 | ||||||||||||||||||||||||||||
| Other borrowed funds |
167,313 | 6,698 | 4.00 | 163,120 | 6,975 | 4.28 | 258,151 | 9,294 | 3.60 | |||||||||||||||||||||||||||
| Long-term subordinated debentures |
18,557 | 583 | 3.14 | 18,557 | 674 | 3.63 | 18,557 | 1,187 | 6.40 | |||||||||||||||||||||||||||
| Total interest-bearing liabilities |
1,575,965 | 27,893 | 1.77 | 1,622,472 | 42,584 | 2.62 | 1,542,790 | 56,607 | 3.67 | |||||||||||||||||||||||||||
| Noninterest-bearing liabilities: |
||||||||||||||||||||||||||||||||||||
| Demand deposits |
375,728 | 318,534 | 349,902 | |||||||||||||||||||||||||||||||||
| Total funding liabilities |
1,951,693 | 1.43 | % | 1,941,006 | 2.19 | % | 1,892,692 | 2.99 | % | |||||||||||||||||||||||||||
| Other liabilities |
34,289 | 17,569 | 24,020 | |||||||||||||||||||||||||||||||||
| Shareholders’ equity |
264,758 | 209,480 | 167,760 | |||||||||||||||||||||||||||||||||
| Total liabilities and shareholders’ equity |
$ | 2,250,740 | $ | 2,168,055 | $ | 2,084,472 | ||||||||||||||||||||||||||||||
| Net interest income |
$ | 67,938 | $ | 61,227 | $ | 74,600 | ||||||||||||||||||||||||||||||
| Cost of deposits |
1.17 | % | 1.99 | % | 2.85 | % | ||||||||||||||||||||||||||||||
| Net interest spread(15) |
2.92 | % | 2.51 | % | 3.01 | % | ||||||||||||||||||||||||||||||
| Net interest margin(16) |
3.33 | % | 3.03 | % | 3.80 | % | ||||||||||||||||||||||||||||||
| 13 | Loans are net of the allowance for loan losses, deferred fees and discount on SBA loans retained. Loan fees included in loan income were approximately $0.3 million, $0.7 million and $1.4 million for the years ended December 31, 2010, 2009 and 2008, respectively. Amortized loan fees have been included in the calculation of net interest income. Non-accrual loans have been included in the table for computation purposes, but the foregone interest of such loans is excluded. |
| 14 | Interest income on a tax equivalent basis for tax-advantaged investments was not included in the computation of yields. Such income amounted to $0, $0 and $85,000 for the years ended December 31, 2010, 2009 and 2008, respectively. |
| 15 | Represents the weighted average yield on interest-earning assets less the weighted average cost of interest-bearing liabilities. |
| 16 | Represents net interest income before the provision for loan losses measured as a percentage of average interest-earning assets. |
The net interest margin for the years ended December 31, 2010, 2009 and 2008 was 3.33%, 3.03%, and 3.80%, respectively. The 30 basis point increase in net interest margin in 2010 was due primarily to a decrease in deposit cost and management’s efforts to change the deposit mix focusing more on lower cost deposits during the past year offset by a reduction in interest rates on loans and investments to a lesser extent. The 77 basis point decrease in net interest margin in 2009 was due primarily to a reduction in the Federal Reserve lending rates by the FOMC during the year and to a lesser extent, a change in the loan portfolio mix resulting in a higher portion of the loan originations being variable rate in 2009 as compared to 2008.
The average yield on loans decreased to 5.62% in 2010 compared to the decrease to 5.89% in 2009 from 6.88% in 2008, a decrease of 27 and 99 basis points, respectively. The declining loan yields in 2010 were mainly attributable to adjustable and variable rate loans repricing to lower current market interest rates. The declining loan yields in 2009 were attributable to (i) increase in variable rate loans; (ii) adjustable and variable rate loans repricing to lower current market interest rates; and (iii) interest income on non-accrual loans not recognized in the amount of $3.8 million during 2009 as compared to $0.5 million in 2008.
45
Table of Contents
The average yield on the investment portfolio was 2.81% in 2010, as compared to 3.90% and 4.85% in 2009 and 2008, respectively, decreases of 109 and 95 basis points, respectively. The decrease in the investment portfolio yield for 2010 was attributed to reinvestments made at lower market yields than the overall portfolio yield in order to reposition the portfolio to better withstand a wider array of ongoing economic scenarios, thus resulting in a slightly more conservative portfolio. The decrease in the investment portfolio yield for 2009 was attributed to maturities and calls of securities with weighted average yields greater than the remaining portfolio, and also due to reinvestments made at lower market yields than the overall portfolio yield.
The Company’s overall cost of interest-bearing liabilities decreased to 1.77% in 2010 from 2.62% and 3.67% in 2009 and 2008, respectively. The decrease in cost of interest-bearing liabilities for 2010 and 2009 was primarily a result of a decrease in the average rate paid on the time certificate of deposit, money market and savings portfolios due to the portfolios repricing to lower market rates.
The Company’s ratio of average interest-earning assets to interest-bearing liabilities has remained relatively stable at 129.6%, 124.5% and 127.3% for 2010, 2009 and 2008, respectively.
Provision for Loan Losses
The Company sets aside an allowance for potential loan losses through charges to earnings, which are reflected in the consolidated statements of operations as the provision for loan losses. Specifically, the provision for loan losses represents the amount charged against current period earnings to achieve an allowance for loan losses that in management’s judgment is adequate to address inherent risks in the Company’s loan portfolio.
Due to a decrease in net charge-offs and a stabilization of risk factors for our loan portfolio, the provision for non-covered loan losses decreased to $21.0 million for the year ended December 31, 2010, compared to $77.5 million and $26.2 million for 2009 and 2008, respectively. During 2010, net charge-offs were $27.5 million as compared to $57.1 million and $8.5 million in 2009 and 2008, respectively. While management believes that the allowance for loan losses of 3.41% of total non-covered loans was adequate at December 31, 2010, future additions to the allowance will be subject to continuing evaluation of estimated and known, as well as inherent, risks in the loan portfolio. The procedures for monitoring the adequacy of the allowance, as well as detailed information concerning the allowance itself, are included below under “—Allowance for Loan Losses”.
Covered loans are valued as of acquisition date in accordance with ASC 805. Loans purchased with evidence of credit deterioration since origination for which it is probable that all contractually required payments will not be collected are accounted for under ASC 310-30.
If credit deterioration is experienced subsequent to the initial acquisition fair value amount, such deterioration will be measured, and a provision for loan losses will be charged to earnings and the carrying value of the covered loans will be decreased. The effect of the provision for loan losses on covered loans will be offset, to the extent of the 80% loss share, by an increase to the FDIC loss share receivable. Any increase in the FDIC loss share receivable will be recognized in noninterest income. Through December 31, 2010, provisions for loan losses of $1.0 million have been recorded related to the covered loan portfolio. This provision reflects credit deterioration since the acquisition date based on decreases in expected cash flows as of December 31, 2010 compared to the acquisition date.
46
Table of Contents
Non-interest Income
The following table sets forth the various components of the Company’s non-interest income for the periods indicated:
| For the Year Ended December 31, | ||||||||||||||||||||||||||||
| Increase (Decrease) | Increase (Decrease) | |||||||||||||||||||||||||||
| 2010 | Amount | Percent | 2009 | Amount | Percent | 2008 | ||||||||||||||||||||||
| (Dollars in thousands) | ||||||||||||||||||||||||||||
| Customer service fees |
$ | 8,108 | $ | 95 | 1.2 | % | $ | 8,013 | $ | 355 | 4.6 | % | $ | 7,658 | ||||||||||||||
| Fee income from trade finance transactions |
2,812 | 546 | 24.1 | 2,266 | (254 | ) | (10.1 | ) | 2,520 | |||||||||||||||||||
| Wire transfer fees |
1,268 | 148 | 13.2 | 1,120 | (33 | ) | (2.9 | ) | 1,153 | |||||||||||||||||||
| Net gain on sale of loans |
1,361 | 1,361 | 100.0 | — | (1,017 | ) | (100.0 | ) | 1,017 | |||||||||||||||||||
| Net gain on sale of securities available for sale |
2,209 | 2,209 | 100.0 | — | — | 0.0 | — | |||||||||||||||||||||
| Loan service fees |
1,625 | 811 | 99.6 | 814 | (543 | ) | (40.0 | ) | 1,357 | |||||||||||||||||||
| Impairment loss of securities available for sale |
— | — | 0.0 | — | 9,889 | (100.0 | ) | (9,889 | ) | |||||||||||||||||||
| Gain on business acquisition |
5,900 | 5,900 | 100.0 | — | — | 0.0 | — | |||||||||||||||||||||
| Increase in FDIC loss share receivable |
1,110 | 1,110 | 100.0 | — | — | 1.0 | — | |||||||||||||||||||||
| Other income |
1,695 | (71 | ) | (4.0 | ) | 1,766 | 95 | 5.7 | 1,671 | |||||||||||||||||||
| Total noninterest income |
$ | 26,088 | $ | 12,109 | 86.6 | $ | 13,979 | $ | 8,492 | 154.8 | $ | 5,487 | ||||||||||||||||
The 2010 increase in non-interest income was primarily due to the gain on business acquisition of $5.9 million, gain on sale of securities available for sale of $2.2 million, and gain on sale of SBA loans of $1.5 million. For the year ended December 31, 2010, non-interest income as a percentage of average earning assets increased to 1.3% compared to 0.7% and 0.3% for the years ended December 31, 2010, 2009 and 2008, respectively. The 2009 increase in non-interest income was due primarily to the OTTI loss of securities available for sale of $9.9 million incurred in 2008 which did not incur in 2009. The primary sources of recurring non-interest income continued to be customer service fee charges on deposit accounts, fees from trade finance transactions and wire transfer service fees.
Customer service fees increased $95,000, or 1.2%, from 2009 to 2010, and increased $355,000, or 4.6%, from 2008 to 2009. These increases are relevant to constant increase in the number of deposit accounts of 56,000 in 2010 compared to 51,000 and 49,000 in 2009 and 2008, respectively. Customer service fees amounted to 31.1% of total non-interest income in 2010, compared to 57.3% and 139.6% in 2009 and 2008, respectively.
Fee income from trade finance transactions increased $546,000, or 24.1%, from 2009 to 2010, and decreased $254,000, or 10.1%, from 2008 to 2009. Due to increased Asia Pacific trade activities in 2010 compared to prior years, trade finance transactions increased. Fee income from trade finance transactions amounted to 10.78% of total non-interest income for 2010, as compared to 16.21% and 45.9% in 2009 and 2008, respectively.
Fee income from wire transfer transactions increased $148,000, or 13.2% from 2009 to 2010 whereas it decreased $33,000, or 2.9%, from 2008 to 2009. The increase in deposit accounts both in the number of accounts and amounts in 2009 contributed to the relatively high level of such fee income in 2010 and 2009. The slight decrease in such fee income from 2008 to 2009 was due to the unusually high level of wire transfer activities in 2008 where a significant increase in wire transfer activities to South Korea occurred due to significant changes in the foreign exchange rate in favor of U.S. customers, especially during the second half of 2008. Wire transfer fee income represented 4.9% of total non-interest income for 2010, as compared to 8.0% and 21.0% in 2009 and 2008, respectively.
The Company resumed sale of loans during the year 2010 whereas there was no gain on sale of loans during the year 2009. The Company sold $18.3 million of its SBA loans and $96.6 million of its non-SBA loans. The net gain on sale of loans of $1.4 million amounted to 5.2% of total non-interest income for 2010. Higher demand, partially due to substantially no activities in the secondary market in 2009, created attractive premium in 2010. Due to less activity in the secondary market especially during 2009, the Company did not execute any sales in 2009. Management evaluates on a quarterly basis whether to sell SBA loans or hold them in the loan portfolio.
Loan service fees increased $811,000, or 99.6%, from 2009 to 2010, and decreased $543,000, or 40.0%, from 2008 to 2009. Fluctuation in this fee depends on loan origination activities. The substantial increase in loan originations resulted in a significant increase in such fee income in 2010 as compared to 2009 where we experienced substantial decrease in loan origination compared to 2008. Loan service fees amounted to 6.23% of total non-interest income for 2010, compared to 5.82% and 24.7% in 2009 and 2008, respectively.
There was no OTTI of investments available for sale in 2010 and 2009 as compared to $9.9 million in 2008. The Company determined that there was no OTTI in the fair value for the corporate trust preferred security in 2010 and 2009 compared to $9.9 million impairment that was other than temporary in 2008.
47
Table of Contents
Increase in FDIC loss share receivable represents a decrease in cash flows expected to be realized under the loss share agreement with the FDIC in connection with Innovative Bank acquisition.
Non-interest Expense
The following table sets forth the non-interest expenses for the periods indicated:
| For the Year Ended December 31, | ||||||||||||||||||||||||||||
| Increase (Decrease) | Increase (Decrease) | |||||||||||||||||||||||||||
| 2010 | Amount | Percent | 2009 | Amount | Percent | 2008 | ||||||||||||||||||||||
| (Dollars in thousands) | ||||||||||||||||||||||||||||
| Salaries and employee benefits |
$ | 18,726 | $ | 922 | 5.2 | % | $ | 17,804 | $ | (5,922 | ) | (25.0 | )% | $ | 23,726 | |||||||||||||
| Occupancy |
5,392 | 516 | 10.6 | 4,876 | 396 | 8.8 | 4,480 | |||||||||||||||||||||
| Furniture, fixtures, and equipment |
2,575 | 165 | 6.8 | 2,410 | 307 | 14.6 | 2,103 | |||||||||||||||||||||
| Data processing |
2,680 | 400 | 17.5 | 2,280 | 111 | 5.1 | 2,169 | |||||||||||||||||||||
| Legal fees |
1,481 | 394 | 36.2 | 1,087 | (1,116 | ) | (50.7 | ) | 2,203 | |||||||||||||||||||
| Accounting and other professional fees |
1,514 | (115 | ) | (7.1 | ) | 1,629 | 267 | 19.6 | 1,362 | |||||||||||||||||||
| Business promotion and advertising |
1,515 | 89 | 6.2 | 1,426 | (474 | ) | (24.9 | ) | 1,900 | |||||||||||||||||||
| Supplies and communication |
1,578 | 21 | 1.3 | 1,557 | (549 | ) | (26.1 | ) | 2,106 | |||||||||||||||||||
| Security service |
1,133 | 95 | 9.2 | 1,038 | (93 | ) | (8.2 | ) | 1,131 | |||||||||||||||||||
| Regulatory assessment |
4,129 | 694 | 20.2 | 3,435 | 2,170 | 171.5 | 1,265 | |||||||||||||||||||||
| KEIC litigation settlement |
— | — | — | — | (7,522 | ) | (100.0 | ) | 7,522 | |||||||||||||||||||
| Impairment of goodwill and intangible asset |
— | (1,413 | ) | (100.0 | ) | 1,413 | 1,413 | 100.0 | — | |||||||||||||||||||
| Merger related expenses |
846 | 846 | 100.0 | — | — | — | — | |||||||||||||||||||||
| Net OREO related expenses |
1,970 | 60 | 3.1 | 1,910 | 1,907 | 63,566.7 | 3 | |||||||||||||||||||||
| Other operating expenses |
4,478 | (727 | ) | (14.0 | ) | 5,205 | (160 | ) | (3.0 | ) | 5,365 | |||||||||||||||||
| Total noninterest expense |
$ | 48,017 | $ | 1,947 | 4.2 | $ | 46,070 | $ | (9,265 | ) | (16.7 | ) | $ | 55,335 | ||||||||||||||
| As a percentage of average earning assets |
2.35 | % | 2.28 | % | 2.82 | % | ||||||||||||||||||||||
| Efficiency ratio |
51.07 | % | 61.26 | % | 69.09 | % | ||||||||||||||||||||||
Non-interest expense increased $1.9 million, or 4.2 % from 2009 to 2010 and decreased $9.3 million, or 16.7% from 2008 to 2009. The 2010 increase in non-interest expense was mainly due to increased expenses related to the three additional branches that were acquired through the FDIC-assisted transaction in April 2010. The 2009 decrease was mainly due to the non-recurring KEIC litigation settlement expense of $7.5 million and the associated legal expenses incurred in 2008.
The efficiency ratio, defined as the ratio of non-interest expense to the sum of net interest income before provision for loan losses and non-interest income, was 51.1% for the year ended December 31, 2010, compared to 61.3% and 69.1% for the years ended December 31, 2009 and 2008, respectively. The increase in the efficiency ratio from 2009 to 2010 was due primarily to the improvement in net interest margin and the increase in non-interest income which was larger than the increase in non-interest expenses. The decrease in the efficiency ratio from 2008 to 2009 was a result of the increase in nonrecurring non-interest expense due primarily to OTTI charges and KEIC settlement expenses in 2008, combined with the decrease in net interest income before provision for loan losses in 2009.
Salaries and employee benefits increased $922,000, or 5.2%, from 2009 to 2010, and decreased $5.9 million, or 25.0%, from 2008 to 2009. The increase in 2010 was mainly due to the increase in the number of employees throughout the year and distribution of year-end bonuses which did not incur in 2009. The number of total full-time equivalent employees increased from 265 to 324 during 2010 due in part to the acquisition of three new branches. The decrease in 2009 was mainly due to reduction in the number of employees throughout the year and reduction in performance compensation and certain benefit expenses.
The increase in regulatory assessment expense in 2010 was due to the FDIC’s rate increase and the increase in deposits acquired from Innovative Bank. The increase from 2008 to 2009 was mainly due to the one-time special assessment in 2009 and a steady increase in customer deposits.
The Company incurred $1.4 million of impairment of goodwill and intangible asset in 2009 due to weakened market conditions and the adverse economic conditions which had a negative impact on the Company’s valuation.
Merger related expenses of approximately $846,000 have been incurred in 2010 in relation to FDIC-assisted transactions and the announced potential merger with Nara Bancorp as discussed in Item 1, Business – Recent Developments. No similar expenses incurred in 2009 or 2008.
48
Table of Contents
Provision for Income Taxes
For the years ended December 31, 2010, 2009 and 2008, the income tax provision (benefit) was $1.3 million, $(5.8) million and $(1.6) million, representing effective tax rates of approximately 5.5%, (12.1)% and (115.4)%, respectively. The primary reasons for the difference from the statutory federal tax rate of 35.0% for 2010, 2009 and 2008 are the reductions related to tax advantaged investments in low-income housing, municipal obligations, dividend exclusions, treatment of share-based payments amortization, increase in cash surrender value of bank owned life insurance, and California enterprise zone interest deductions and hiring credits, and changes in the deferred tax valuation allowance in 2010 and 2009.
Deferred income tax assets or liabilities reflect the estimated future tax effects attributable to differences as to when certain items of income or expense are reported in the financial statements versus when they are reported in the tax returns. The Company’s net deferred tax assets were $14.4 million, net of a valuation allowance of $10.7 million as of December 31, 2010 as compared to $11.6 million, net of a valuation allowance of $16.3 million as of December 31, 2009.
As a result of the loss incurred during 2009, management determined that a portion of the Company’s net deferred tax asset did not meet the more likely than not criteria for realization. Accordingly, a valuation allowance of $16.3 million was recorded in 2009. In 2010, management updated its assessment of the amount of the deferred tax asset that was considered to be more likely than not to be realized and adjusted the valuation allowance accordingly. The reduction in the valuation allowance reduced income tax expense by $6.0 million for 2010. The reduction is primarily due to the expected utilization of deferred tax assets related to the 2010 tax year for state income tax purposes. The continued generation of taxable income supports a reduction in the valuation allowance. As of December 31, 2010 and 2009, the Company’s deferred tax assets were primarily due to the allowance for loans losses, basis difference of acquired loans from Innovative Bank (applicable to 2010), goodwill from Innovative Bank acquisition, offset by deferred tax liability related to FDIC loss share receivable and impairment losses on securities available for sale.
The Company’s net deferred tax asset before the valuation allowance increased during 2010 due primarily to a decrease in the valuation allowance. To the extent that the allowance for loan losses is not allocable to specific loans, it represents future tax benefits which would be realized when actual charge-offs are made against the allowance. As a result of the loss incurred during 2009, management has assessed, by year, the future reversal of all temporary differences to determine which deductions would be available to carry back to tax years with taxable income or could be utilized by projected future taxable income.
The Company generally reduces current taxes payable utilizing tax credits from investments in the low-income housing projects and California Enterprise Zone Credits. The Company utilized such credit of $2.4 million, $0 and $1.2 million for the years ended December 31, 2010, 2009 and 2008, respectively. Of $2.4 million credits utilized in 2010, $662,000 was related to 2009, which had been deferred due to taxable loss in 2009.
Financial Condition
Summary
Total assets increased by $77.5 million, or 3.5%, to $2.27 billion at December 31, 2010 compared to $2.19 billion at December 31, 2009. The increase in total assets was mainly due to a $116.3 million increase in covered loans, a $24.0 million increase in FDIC loss share receivable and a $26.1 million increase in cash and cash equivalents offset by a $80.9 million reduction in investment securities.
Total assets increased by $136.2 million, or 6.6%, to $2.19 billion at December 31, 2009 compared to $2.06 billion at December 31, 2008. The increase in total assets was mainly due to a $187.7 million increase in investment securities and a $134.6 million increase in cash and cash equivalents offset by a $200.2 million reduction in net loans. Net loans (including loans held for sale), investment securities, and money market and short-term investments as a percentage of total assets were 70.1%, 13.4% and 4.1%, respectively, as of December 31, 2010, as compared to 67.5%, 17.6% and 2.4%, respectively, as of December 31, 2009.
Non-covered Loan Portfolio
The Company’s loan portfolio represents the largest single portion of earning assets, substantially greater than the investment portfolio or any other asset category. The quality and diversification of the Company’s loan portfolio are important considerations when reviewing the Company’s results of operations. The Company offers a range of products designed to meet the credit needs of its borrowers. The Company’s lending activities consist of commercial real estate lending, construction loans, commercial business and trade finance loans, and consumer loans.
49
Table of Contents
As of December 31, 2010 and 2009, gross non-covered loans represented 67.3% and 70.2%, respectively, of total assets. The commercial real estate portfolio decreased by $93.8 million whereas the SBA loans and trade finance loans portfolio balance increased by $51.8 million and $31.9 million, respectively. The decrease in the loan portfolio was mainly the result of management’s decision to rebalance the concentration of real estate loans in the loan portfolio. The loan portfolio composition table below reflects the gross and net amounts of loans outstanding as of December 31 of each year from 2006 to 2010.
As of December 31, 2010, no single industry or business category represented more than 10% of the loan portfolio. The Company also monitors the diversification of collateral of the real estate loan portfolio by area, by type of building, and by the type of building usage.
The following table sets forth the composition of the Company’s non-covered loan portfolio, segregated by class of loans, as of the dates indicated:
| As of December 31, | ||||||||||||||||||||||||||||||||||||||||
| 2010 | 2009 | 2008 | 2007 | 2006 | ||||||||||||||||||||||||||||||||||||
| Amount | Percent of Total |
Amount | Percent of Total |
Amount | Percent of Total |
Amount | Percent of Total |
Amount | Percent of Total |
|||||||||||||||||||||||||||||||
| (Dollars in thousands) | ||||||||||||||||||||||||||||||||||||||||
| Real Estate: |
||||||||||||||||||||||||||||||||||||||||
| Construction |
$ | 14,803 | 1.0 | % | $ | 21,014 | 1.4 | % | $ | 61,983 | 3.6 | % | $ | 68,143 | 3.8 | % | $ | 43,508 | 2.8 | % | ||||||||||||||||||||
| Commercial - Real Estate(17) |
914,003 | 59.8 | 1,007,794 | 65.5 | 1,134,793 | 66.0 | 1,197,104 | 66.0 | 1,042,562 | 66.9 | ||||||||||||||||||||||||||||||
| Commercial: |
||||||||||||||||||||||||||||||||||||||||
| Commercial - Business |
315,285 | 20.6 | 295,289 | 19.2 | 334,350 | 19.4 | 310,962 | 17.2 | 277,296 | 17.8 | ||||||||||||||||||||||||||||||
| Trade Finance(18) |
71,174 | 4.7 | 39,290 | 2.6 | 63,479 | 3.7 | 66,964 | 3.7 | 66,925 | 4.3 | ||||||||||||||||||||||||||||||
| SBA(19) |
101,683 | 6.7 | 49,933 | 3.2 | 37,027 | 2.2 | 70,517 | 3.9 | 50,606 | 3.2 | ||||||||||||||||||||||||||||||
| Others: |
||||||||||||||||||||||||||||||||||||||||
| Consumer |
71,279 | 4.7 | 75,523 | 4.8 | 88,396 | 5.1 | 98,943 | 5.4 | 77,567 | 5.0 | ||||||||||||||||||||||||||||||
| Other(20) |
40,039 | 2.6 | 50,037 | 3.3 | 27 | — | 26 | — | 115 | — | ||||||||||||||||||||||||||||||
| Total Non-covered Loans |
1,528,266 | 100.0 | 1,538,880 | 100.0 | 1,720,055 | 100.0 | 1,812,659 | 100.0 | 1,558,579 | 100.0 | ||||||||||||||||||||||||||||||
| Less: |
||||||||||||||||||||||||||||||||||||||||
| Allowance for Losses |
52,047 | 58,543 | 38,172 | 20,477 | 17,412 | |||||||||||||||||||||||||||||||||||
| Deferred Loan Fees, net(21) |
(523 | ) | 331 | 1,359 | 1,847 | 2,347 | ||||||||||||||||||||||||||||||||||
| Discount on SBA Loans Retained |
862 | 864 | 1,184 | 700 | 1,644 | |||||||||||||||||||||||||||||||||||
| Total Net Non-covered Loans and Loans Held for Sale |
$ | 1,475,880 | $ | 1,479,142 | $ | 1,679,340 | $ | 1,789,635 | $ | 1,537,176 | ||||||||||||||||||||||||||||||
| 17 | Real estate commercial loans are loans secured by first deeds of trust on real estate. |
| 18 | Includes advances on trust receipts, clean advances, cash advances, acceptances discounted, and documentary negotiable advances under commitments. |
| 19 | Includes SBA loans held for sale of $46.4 million, $23.3 million, $9.9 million, $41.5 million and $18.5 million, at the lower of cost or fair value, at December 31, 2010, 2009, 2008, 2007 and 2006, respectively. |
| 20 | Consists of term fed funds sold for maturity of greater than 1 day, transactions in process and overdrafts. |
| 21 | Negative balance in 2010 was due to origination of SBA loans significantly higher than non-SBA loans as SBA loans incur net deferred loan costs upon origination. |
Real Estate Construction Loans. The Company finances the construction of various projects within the Company’s market area, including motels, industrial buildings, tax-credit low-income apartment complexes and single-family residences. The future condition of the local economy could negatively impact the collateral values of such loans.
The Company’s construction loans typically have the following characteristics: (i) maturity of two years or less; (ii) a floating interest rate based on the Company’s prime rate; (iii) advance of anticipated interest cost during construction; (iv) advance of fees; (v) first lien position on the underlying real estate; (vi) average LTV ratio of 65%; and (vii) recourse against the borrower or guarantor in the event of default. The Company does not participate in joint ventures or make equity investments in connection with its construction lending.
Construction loans involve additional risks compared to loans secured by existing improved real property. These risks include the following: (i) the uncertain value of the project prior to completion; (ii) the inherent uncertainty in estimating construction costs, which is often beyond the control of the borrower; (iii) construction delays and cost overruns; and (iv) the difficulty in accurately evaluating the market value of the completed project.
As a result of these uncertainties, construction lending often involves the disbursement of substantial funds with repayment dependent, in part, on the success of the ultimate project rather than on the ability of the borrower or guarantor to repay principal and interest. If the Company is forced to foreclose on a project prior to or at completion due to a default, there can be no assurance that the Company will be able to recover all of the unpaid balance of and its accrued interest on the construction loan.
Real estate construction loans totaled $14.8 million or 1.0% of total loans and $21.0 million or 1.4% of total loans at December 31, 2010 and 2009, respectively. The Company’s real estate construction portfolio varies from year to year as
50
Table of Contents
management is selective in financing construction projects given the unique credit risk associated with these types of loans and the timing of the completion of construction and associated loan payoffs.
Commercial Real Estate Loans. Real estate lending involves risks associated with the potential decline in the value of the underlying real estate collateral and the cash flow from the income producing properties. Declines in real estate values and cash flows can be caused by a number of factors, including adversity in general economic conditions, rising interest rates, changes in tax and other governmental and other policies affecting real estate holdings, environmental conditions, governmental and other use restrictions, development of competitive properties and increasing vacancy rates. The Company’s dependence on real estate values increases the risk of loss both in the Company’s loan portfolio and with respect to any other real estate owned when real estate values decline.
The Company offers commercial real estate loans secured by industrial buildings, retail stores or office buildings, where the property’s repayment source generally comes from tenants or businesses that fully or partially occupy the building. When real estate collateral is owner-occupied, the value of the real estate collateral must be supported by a formal appraisal in accordance with applicable regulations, subject to certain exceptions. The majority of the properties securing these loans are located in Los Angeles County and Orange County in California.
The Company has established general underwriting guidelines for commercial property real estate loans typically requiring a maximum loan-to-value (“LTV”) ratio of 65%. The Company’s underwriting policies also generally require that the properties securing commercial real estate loans have debt service coverage ratios of at least 1.25:1 for investor-owned property. Additionally, for owner-occupied properties, the Company expects additional debt service capacity from the business itself. As additional security, the Company generally requires personal guarantees when commercial real estate loans are extended to corporations, limited partnerships and other legal entities.
Commercial real estate loans are, in most cases, secured by first deeds of trust, generally for terms extending generally no more than seven years, and are amortized over periods of up to 25 years. The majority of the commercial real estate loans currently being originated contain interest rates tied to the Company’s prime rate that adjusts with changes in the national prime rate. The Company also extends commercial real estate loans with fixed rates.
Payments on loans secured by such properties are often dependent on the successful operation or management of the properties. Repayment of such loans may therefore be affected by adverse conditions in the real estate market or the economy. The Company seeks to minimize these risks in a variety of ways, including limiting the size of such loans and evaluating the properties securing the loans. The Company generally obtains loan guarantees from financially capable parties. The Company’s lending personnel inspect most of the properties collateralizing the Company’s real estate loans before such loans are made.
As of December 31, 2010, commercial real estate loans totaled $914.0 million, representing 59.8% of total loans, compared to $1.0 billion or 65.5% of total loans at December 31, 2009.
Commercial Business Loans. The Company offers commercial loans for intermediate and short-term credit. Commercial loans may be unsecured, partially secured or fully secured. The majority of the originations of commercial loans are in Los Angeles County or Orange County, California. The Company originates commercial business loans to facilitate term working capital and to finance business acquisitions, fixed asset purchases, accounts receivable and inventory financing. These term loans to businesses generally have terms of up to five years, have interest rates tied to the Company’s prime rate and may be secured in whole or in part by owner- occupied real estate or time deposits at the Company. For a term loan, the Company typically requires monthly payments of both principal and interest. In addition, the Company grants commercial lines of credit to finance accounts receivable and inventory on a short-term basis, usually one year or less. Short-term business loans are generally intended to finance current transactions and typically provide for principal payments with interest payable monthly. The Company requires a complete re-analysis before considering any extension. The Company finances primarily small and middle market businesses in a wide spectrum of industries. In general, it is the Company’s intent to take collateral whenever possible regardless of the purpose of the loan. Collateral may include liens on inventory, accounts receivable, fixtures and equipment and in some cases leasehold improvements and real estate. As a matter of policy, the Company generally requires all principals of a business to be co-obligors on all loan instruments, and all significant shareholders of corporations to execute a specific debt guaranty. All borrowers must demonstrate the ability to service and repay not only the debt with the Company but also all outstanding business debt, exclusive of collateral, on the basis of historical earnings or reliable projections.
Commercial loans typically involve relatively large loan balances and are generally dependent on the businesses’ cash flows and thus may be subject to adverse conditions in the general economy or in a specific industry.
As of December 31, 2010 and 2009, commercial business loans totaled $315.3 million and $295.3 million, respectively. Commercial business loans increased slightly as a percentage of total loans to 20.6% at December 31, 2010 from 19.2% at December 31, 2009.
51
Table of Contents
Trade Finance Loans. For the purpose of financing overseas transactions, the Company provides short term trade financing to local borrowers in connection with the issuance of letters of credit to overseas suppliers/sellers. In accordance with these letters of credit, the Company extends credit to the borrower by providing assurance to the borrower’s foreign suppliers that payment will be made upon shipment of goods. Upon shipment of goods, and when the foreign suppliers negotiate the letters of credit, the borrower’s inventory is financed by the Company under the approved line of credit facility. The underwriting procedure for this type of credit is the same as for commercial business loans.
As of December 31, 2010, trade finance loans totaled $71.2 million, compared to $39.3 million as of December 31, 2009. The increase was due to the overall increase in Asia Pacific trade activities. These loans as a percentage of total loans increased to 4.7% at December 31, 2010 as compared to 2.6% at December 31, 2009.
Small Business Administration (SBA) Loans. The Company provides financing for various purposes for small businesses under guarantee of the Small Business Administration, a federal agency created to provide financial assistance for small businesses. The Company is a Preferred SBA Lender with full loan approval authority on behalf of the SBA. It also participates in the SBA’s Export Working Capital Program. SBA loans consist of both real estate and business loans. The SBA guarantees on such loans currently range from 75% to 80% of the principal and accrued interest. Under certain circumstances, the guarantee of principal and interest may be less than 75%. In general, the guaranteed percentage is less than 75% for loans over $1.0 million. The Company typically requires that SBA loans be secured by first or second lien deeds of trust on real property. SBA loans have terms ranging from 7 to 25 years depending on the use of proceeds. To qualify for an SBA loan, a borrower must demonstrate the capacity to service and repay the loan, exclusive of the collateral, on the basis of historical earnings or reliable projections.
During 2010 and 2009, the Company originated $85.6 million, and $20.8 million, respectively, in SBA loans. The Company sold $18.3 million of SBA loans in 2010 as compared to none in 2009. The Company has historically sold the guaranteed portion of the SBA loans and retained the loan servicing obligation, for a fee. The primary reason for the increase in 2010 was the higher premiums compared to prior years due to greater activity in the secondary market for SBA loans resulting from increased reliance on governmental guarantee. As of December 31, 2010, the Company was servicing $270.0 million of sold SBA loans, compared to $113.0 million as of December 31, 2009. SBA loans as a percentage of total loans increased to 6.7% in 2010 as compared to 3.2% in 2009 primarily due to the higher origination of SBA loans in 2010.
Consumer Loans. Consumer loans, also termed loans to individuals, are extended for a variety of purposes. Most are to finance the purchase of automobiles. Other consumer loans include secured and unsecured personal loans, home equity lines, overdraft protection loans and unsecured lines of credit. The Company grants a small portfolio of credit card loans, mainly to the owners of its corporate customers. Management assesses the borrower’s ability to repay the debt through a review of credit history and ratings, verification of employment and other income, review of debt-to-income ratios and other measures of repayment ability. Although creditworthiness of the applicant is of primary importance, the underwriting process also includes a comparison of the value of the security, if any, to the proposed loan amount. The Company generally makes these loans in amounts of 80% or less of the value of collateral. An appraisal is obtained from a qualified real estate appraisal for substantially all loans secured by real estate. Most of the Company’s consumer loans are repayable on an installment basis.
Consumer loans are generally unsecured or secured by rapidly depreciating assets such as automobiles. In such cases, any repossessed collateral for a defaulted consumer loan may not provide an adequate source of repayment of the outstanding loan balance, because the collateral is more likely to suffer damage, loss or depreciation. The remaining deficiency often does not warrant further collection efforts against the borrower beyond obtaining a deficiency judgment. In addition, the collection of loans to individuals is dependent on the borrower’s continuing financial stability, and thus is more likely to be adversely affected by job loss, divorce, illness or personal bankruptcy. Furthermore, various federal and state laws, including federal and state bankruptcy and insolvency laws, often limit the amount which a lender can recover on consumer loans. Consumer loans may also give rise to claims and defenses by consumer loan borrowers against the lender on these loans, such as the Company, and a borrower may be able to assert against such assignee claims and defenses that it has against the seller or the underlying collateral.
Consumer loans slightly decreased to 4.7 % of total loans as of December 31, 2010 as compared to 4.8% as of December 31, 2009. Automobile loans are the largest component of consumer loans, representing 41% and 45% of total consumer loans as of December 31, 2010 and 2009, respectively.
Covered Loan Portfolio and Allowance for Loan Losses on Covered Loans
Covered loans are valued as of acquisition date in accordance with FASB ASC 805, Business Combinations. Loans purchased with evidence of credit deterioration since origination for which it is probable that all contractually required payments will not be collected are accounted for under FASB ASC 310-30, Loans and Debt Securities Acquired with Deteriorated Credit
52
Table of Contents
Quality. In addition, because of the significant discounts associated with the acquired portfolios, the Company elected to account for all of the acquired loans, with the exception of a small population of loans, under ASC 310-30 in the amount of $125.2 million at acquisition. Certain cash secured loans and overdrafts in the amount of $923,000 were not accounted for under ASC 310-30. Under ASC 805 and ASC 310-30, loans are recorded at fair value at acquisition date, factoring in credit losses expected to be incurred over the life of the loan. Accordingly, an allowance for loan losses was not carried over or recorded as of the acquisition date.
If credit deterioration is experienced subsequent to the initial acquisition fair value amount, such deterioration will be measured, and a provision for credit losses will be charged to earnings. The effect of the provision for credit losses on covered loans will be offset, to the extent of the 80% loss share, by an increase to the FDIC loss share receivable. Any increase in the FDIC loss share receivable will be recognized in non-interest income. Through December 31, 2010, provisions for credit losses of $1.0 million have been recorded related to the covered loan portfolio. This provision reflects credit deterioration since the acquisition date based on decreases in expected cash flows as of December 31, 2010 compared to the acquisition date.
At December 31, 2010, total covered loan, inclusive of fair value adjustments, amounted to $117.3 million as compared to $126.2 million at acquisition date. The following table represents covered loans, segregated by class of loans, as of April 16, 2010 (the acquisition date) and December 31, 2010:
| December 31, 2010 | April 16, 2010 | |||||||
| (Dollars in thousands) | ||||||||
| Commercial - Real Estate |
$ | 72,249 | $ | 78,430 | ||||
| Commercial - Business |
8,977 | 12,336 | ||||||
| SBA |
35,152 | 34,478 | ||||||
| Other |
915 | 923 | ||||||
| Total covered loans |
117,293 | 126,167 | ||||||
| Less: |
||||||||
| ALLL due to decrease in expected cash flows |
1,010 | — | ||||||
| Total covered loans |
$ | 116,283 | $ | 126,167 | ||||
The covered loans are subject to loss sharing agreement with the FDIC. Under the terms of the loss sharing agreement, the FDIC will absorb 80% of losses and share in 80% of loss recoveries. The reimbursed losses from the FDIC are based on the book value of the relevant loan as determined by the FDIC at the date of the assumption. New loans made after that date are not covered by the loss sharing agreement. See also “ITEM 1A - Risk Factors—In connection with Center Bank’s assumption of the banking operations of Innovative Bank from the FDIC, if our assumptions in entering into assumption agreements with loss-share are incorrect, we may sustain losses that are not covered by the FDIC’s loss share receivable, which could adversely affect our operating results.”
53
Table of Contents
Loan Maturities and Sensitivity to Changes in Interest Rates
The following table shows the maturity distribution of the Company’s outstanding non-covered and covered loans as of December 31, 2010. In addition, the table shows the distribution of such loans with floating interest rates and those with fixed interest rates. The table includes non-covered nonperforming loans of $45.6 million and covered nonperforming loans of $15.0 million.
| As of December 31, 2010 | ||||||||||||||||
| Within One Year |
After One But Within Five Years |
After Five Years |
Total | |||||||||||||
| (Dollars in thousands) | ||||||||||||||||
| Non-covered loans |
||||||||||||||||
| Real Estate |
||||||||||||||||
| Construction |
$ | 14,803 | $ | — | $ | — | $ | 14,803 | ||||||||
| Commercial - Real Estate |
193,720 | 615,674 | 104,609 | 914,003 | ||||||||||||
| Commercial |
||||||||||||||||
| Commercial - Business |
205,032 | 106,684 | 3,569 | 315,285 | ||||||||||||
| Trade Finance(22) |
71,174 | — | — | 71,174 | ||||||||||||
| SBA |
38,498 | 33,853 | 29,331 | 101,683 | ||||||||||||
| Others |
||||||||||||||||
| Consumer and other(23) |
87,535 | 22,255 | 1,528 | 111,318 | ||||||||||||
| Total non-covered loans |
$ | 610,762 | $ | 778,466 | $ | 139,037 | $ | 1,528,266 | ||||||||
| Loans with predetermined (fixed) interest rates |
$ | 155,331 | $ | 418,434 | $ | 44,946 | $ | 618,711 | ||||||||
| Loans with variable (floating) interest rates |
$ | 455,434 | $ | 360,032 | $ | 94,092 | $ | 909,558 | ||||||||
| Covered loans |
||||||||||||||||
| Real Estate |
||||||||||||||||
| Construction |
$ | — | $ | — | $ | — | $ | — | ||||||||
| Commercial - Real Estate |
25,330 | 45,488 | 1,431 | 72,249 | ||||||||||||
| Commercial |
||||||||||||||||
| Commercial - Business |
6,471 | 2,467 | 39 | 8,977 | ||||||||||||
| Trade Finance |
— | — | — | — | ||||||||||||
| SBA |
13,077 | 17,731 | 4,345 | 35,152 | ||||||||||||
| Others |
||||||||||||||||
| Consumer and other |
915 | — | — | 915 | ||||||||||||
| Total covered loans |
$ | 45,793 | $ | 65,686 | $ | 5,815 | $ | 117,293 | ||||||||
| Loans with predetermined (fixed) interest rates |
$ | 13,738 | $ | 19,706 | $ | 1,744 | $ | 35,188 | ||||||||
| Loans with variable (floating) interest rates |
$ | 32,055 | $ | 45,980 | $ | 4,070 | $ | 82,105 | ||||||||
| 22 | Includes advances on trust receipts, clean advances, cash advances, acceptances discounted and documentary negotiable advances under commitments. |
| 23 | Other consists of term Fed Funds sold for maturity of greater than 1 day, transactions in process and overdrafts. |
Non-covered Nonperforming Assets
Nonperforming assets are defined as loans on non-accrual status, loans 90 days or more past due but not on non-accrual status, restructured loans, and Other Real Estate Owned (“OREO”). Management generally places loans on non-accrual status when they become 90 days past due, unless they are both fully secured and in process of collection. OREO consists of real property acquired through foreclosure or similar means that management intends to offer for sale. Loans may be restructured by management when a borrower has experienced some change in financial status causing an inability to meet the original repayment terms, where the Company believes the borrower will eventually overcome those circumstances and repay the loan in full. Troubled Debt Restructurings (“TDR”) are considered non-performing assets for regulatory purposes even though they are fully performing, and they are required to be disclosed in the following table. Performing TDRs are not considered non-covered nonperforming assets for purposes of computing the ratio of nonperforming assets as a percentage of total non-covered loans and OREO.
Management’s classification of a loan as non-accrual is an indication that there is reasonable doubt as to the full collectibility of principal or interest on the loan. At this point, the Company stops recognizing income from the interest on the
54
Table of Contents
loan and reverses any uncollected interest that had been accrued but unpaid. The remaining balance of the loan will be charged off if the loan deteriorates further due to a borrower’s bankruptcy or similar financial problems, unsuccessful collection efforts or a loss classification by regulators and/or internal credit examiners. These loans may or may not be collateralized, but collection efforts are continuously pursued.
The Company records the OREO property at the lower of its carrying value or its fair value less anticipated disposal costs. Any write-down of OREO is charged to earnings. The Company may make loans to potential buyers of OREO to facilitate the sale of OREO. In those cases, all loans made to such buyers must be reviewed under the same guidelines as those used for making customary loans, and must conform to the terms and conditions consistent with the Company’s loan policy. Any deviations from this policy must be specifically noted and reported to the appropriate lending authority. Profit on real estate sales transactions shall not be recognized by the full accrual method until all of the following criteria are met:
| • | A sale is consummated; |
| • | The buyer’s initial and continuing investments are adequate to demonstrate a commitment to pay for the property; |
| • | The seller’s receivable is not subject to future subordination; and |
| • | The seller has transferred to the buyer the usual risks and rewards of ownership in a transaction that is in substance a sale and does not have a substantial continuing involvement with the property. |
The restructuring of a debt is considered a TDR when the Company, for economic or legal reasons related to the borrower’s financial difficulties, grants a concession to the borrower that the Company would not otherwise grant. TDRs may include changing repayment terms, reducing the stated interest rate or reducing the amounts of principal and/or interest due or extending the maturity date. The restructuring of a loan is intended to recover as much of the Company’s investment as possible and to achieve the highest yield possible. At December 31, 2010 and 2009, TDRs amounted to $39.1million and $27.1 million, respectively. Of these amounts, $21.4 million and $4.4 million were fully performing at December 31, 2010 and 2009, respectively. There were no unfunded commitments to the borrowers whose terms have been modified as a TDR as of December 31, 2010 and 2009, respectively.
The following table provides information with respect to the components of the Company’s non-covered nonperforming assets as of the dates indicated:
| As of December 31, | ||||||||||||||||||||
| 2010 | 2009 | 2008 | 2007 | 2006 | ||||||||||||||||
| (Dollars in thousands) | ||||||||||||||||||||
| Non-covered nonperforming loans: |
||||||||||||||||||||
| Real Estate |
||||||||||||||||||||
| Construction |
$ | 6,108 | $ | 8,441 | $ | 1,951 | $ | — | $ | — | ||||||||||
| Commercial - Real Estate |
29,167 | 42,678 | 13,128 | — | — | |||||||||||||||
| Commercial |
||||||||||||||||||||
| Commercial - Business |
5,696 | 8,290 | 2,272 | 1,775 | 1,502 | |||||||||||||||
| Trade Finance |
— | 1,498 | 1,196 | — | — | |||||||||||||||
| SBA |
3,896 | 2,207 | 1,538 | 4,033 | 1,330 | |||||||||||||||
| Others |
||||||||||||||||||||
| Consumer |
651 | 339 | 369 | 457 | 429 | |||||||||||||||
| Other |
— | — | — | — | — | |||||||||||||||
| Total non-covered nonperforming loans |
45,518 | 63,453 | 20,454 | 6,265 | 3,261 | |||||||||||||||
| Non-covered OREO |
937 | 4,278 | — | 380 | — | |||||||||||||||
| Total non-covered nonperforming assets |
46,455 | 67,731 | 20,454 | 6,645 | 3,261 | |||||||||||||||
| SBA guaranteed portion of non-covered nonperforming loans |
3,293 | 2,816 | 2,110 | 2,740 | 973 | |||||||||||||||
| Total non-covered nonperforming assets, net of SBA guarantee |
$ | 43,162 | $ | 64,915 | $ | 18,344 | $ | 3,905 | $ | 2,288 | ||||||||||
| Performing TDR’s not included above |
$ | 21,377 | $ | 4,414 | $ | — | $ | — | $ | — | ||||||||||
| Non-covered nonperforming loans as a percent of total non-covered loans(25) |
2.98 | % | 4.12 | % | 1.19 | % | 0.35 | % | 0.21 | % | ||||||||||
| Non-covered nonperforming assets as a percent of non-covered loans and OREO(24)(25) |
3.04 | % | 4.39 | % | 1.19 | % | 0.37 | % | 0.21 | % | ||||||||||
| Allowance for loan losses to nonperforming loans(25) |
114.34 | % | 92.26 | % | 186.62 | % | 326.85 | % | 534.00 | % | ||||||||||
| 24 | The TDRs are not included in non-covered nonperforming assets for purposes of computing the ratio of non-covered nonperforming assets as a percentage of total non-covered loans and OREO. |
| 25 | SBA guaranteed portion of non-covered nonperforming loans is included in all ratios. |
55
Table of Contents
Non-covered nonperforming loans totaled $45.5 million at December 31, 2010, a decrease of $17.9 million as compared to $63.5 million at December 31, 2009. Non-covered nonperforming loans as a percentage of total non-covered loans decreased to 2.98% at December 31, 2010 as compared to 4.12% at December 31, 2009. Gross interest income of approximately $2.1 million and $3.8 million would have been recorded for the year ended December 31, 2010 and 2009, respectively, if these loans had been paid in accordance with their original terms and had been outstanding throughout the applicable period then ended or, if not outstanding throughout the applicable period then ended, since origination. At December 31, 2010 and 2009, SBA non-accrual loans represented 8.6% and 3.5% of total non-covered nonperforming loans, respectively. At December 31, 2010 and 2009, the SBA guaranteed portion of nonperforming SBA loans was $3.3 million and $2.8 million, respectively, and total non-covered nonperforming assets were $43.2 million and $64.9 million, net of the SBA guaranteed portion, representing 3.04% and 4.39% of total loans and other real estate owned, respectively.
Loans are considered impaired when it is probable that the Company will be unable to collect all amounts due as scheduled according to the contractual terms of the loan agreement, including contractual interest payments and contractual principal payments. The amount of impairment is based on the present value of expected future cash flows discounted at the loan’s effective interest rate, the loan’s observable market price, or the fair value of the collateral if the loan is collateral dependent. Loans are identified for specific allowances from information provided by several sources including asset classification, third party reviews, delinquency reports, periodic updates to financial statements, public records, and industry reports. All loan types are subject to impairment evaluation for a specific allowance once identified as impaired. As of December 31, 2010 and 2009, impaired loans with specific reserves were in the amount of $37.7 million and $22.0 million, respectively. Total specific reserves of $11.6 million and $2.7 million represented 30.9% and 12.0% of total impaired loans with specific reserves of $37.7 million and $22.0 million at December 31, 2010 and 2009, respectively.
Covered Nonperforming Assets
Covered nonperforming assets totaled $16.5 million at December 31, 2010. These covered nonperforming assets are subject to loss sharing agreement with the FDIC. The covered nonperforming assets at December 31, 2010 are as follows:
| December 31, 2010 | ||||
| (Dollars in thousands) | ||||
| Covered loans on non-accrual status |
$ | 15,021 | ||
| Covered other real estate owned |
1,459 | |||
| Total covered nonperforming assets |
$ | 16,480 | ||
| Covered nonperforming loans to net covered loans |
12.92 | % | ||
Loans accounted for under ASC 310-30 are generally considered accruing and performing loans as the loans accrete the accretable discount to interest income over the estimate life of the loan when cash flows are reasonably estimable. Accordingly, acquired impaired loans that are contractually past due are still considered to be accruing and performing loans. The loans may be classified as nonaccrual if the timing and amount of future cash flows is not reasonably estimable.
Allowance for Loan Losses on Non-covered Loans
The following table sets forth the composition of the allowance for loan losses on non-covered loans as of dates indicated:
| As of December 31, | ||||||||||||||||||||
| 2010 | 2009 | 2008 | 2007 | 2006 | ||||||||||||||||
| (Dollars in thousands) | ||||||||||||||||||||
| Specific (impaired loans) |
$ | 11,643 | $ | 2,656 | $ | 12,467 | $ | 100 | $ | 329 | ||||||||||
| Formula (non-homogeneous) |
39,939 | 55,539 | 25,122 | 19,867 | 16,621 | |||||||||||||||
| Homogeneous |
465 | 348 | 583 | 510 | 462 | |||||||||||||||
| Allowance for loan losses on non-covered loans |
$ | 52,047 | $ | 58,543 | $ | 38,172 | $ | 20,477 | $ | 17,412 | ||||||||||
The Company’s allowance for loan loss methodologies incorporate a variety of risk considerations, both quantitative and qualitative, in establishing an allowance for loan loss that management believes is appropriate at each reporting date. Quantitative factors include the Company’s historical loss experience, delinquency and charge-off trends, collateral values, changes in nonperforming loans, and other factors. Quantitative factors also incorporate known information about individual loans, including borrowers’ sensitivity to interest rate movements and to quantifiable external factors including commodity and
56
Table of Contents
finished good prices as well as acts of nature (earthquakes, floods, fires, etc.) that occur in a particular period. Qualitative factors include the general economic environment in the Company’s markets and, in particular, the state of certain industries. Size and complexity of individual credits, loan structure, extent and nature of waivers of existing loan policies and pace of portfolio growth are other qualitative factors that are considered in its methodologies. As the Company adds new products, increases the complexity of the loan portfolio, and expands its geographic coverage, the Company will enhance the methodologies to keep pace with the size and complexity of the loan portfolio. Changes in any of the above factors could have significant impact to the allowance for loan loss calculation. The Company believes that its methodologies continue to be appropriate given its size and level of complexity.
The allowance for loan losses reflects management’s judgment of the level of allowance adequate to provide for probable losses inherent in the loan portfolio as of the date of the consolidated statements of financial condition. On a quarterly basis, the Company assesses the overall adequacy of the allowance for loan losses, utilizing a disciplined and systematic approach which includes the application of a specific allowance for identified problem loans, a formula allowance for identified graded loans and an allocated allowance for large groups of smaller balance homogenous loans.
Allowance for Specifically Identified Problem Loans. A specific allowance is established for impaired loans. A loan is impaired when, based on current information and events, it is probable that a creditor will be unable to collect all amounts due according to the contractual terms of the loan agreement. The specific allowance is determined based on the present value of expected future cash flows discounted at the loan’s effective interest rate, except that as a practical expedient, the Company may measure impairment based on a loan’s observable market price, or the fair value of the collateral if the loan is collateral dependent. The Company measures impairment based on the fair value of the collateral, adjusted for the cost related to liquidation of the collateral.
Formula Allowance for Identified Graded Loans. Non-homogenous loans such as commercial real estate, construction, commercial business, trade finance and SBA loans that are not subject to the allowance for specifically identified loans discussed above are not reviewed individually and are subject to a formula allowance. The formula allowance is calculated by applying loss factors to outstanding Pass, Special Mention, Substandard and Doubtful loans. The evaluation of the inherent loss for these loans involves a high degree of uncertainty, subjectivity and judgment because probable loan losses are not identified with a specific loan. In determining the formula allowance, the Company relies on a mathematical calculation that incorporates a six-quarter rolling average of historical losses, which has been adjusted from the twelve quarter analysis used historically. The Company started using the six-quarter rolling average beginning in the fourth quarter of 2008. Current quarter losses are measured against previous quarter loan balances to develop the loss factor. Loans risk rated Pass, Special Mention and Substandard for the most recent three quarters are adjusted to an annual basis as follows:
| • | the most recent quarter is weighted 4/1; |
| • | the second most recent is weighted 4/2; |
| • | the third most recent is weighted 4/3. |
The formula allowance may be further adjusted to account for the following qualitative factors which have been established at a minimum of 50 basis points:
| • | Changes in lending policies and procedures, including underwriting standards and collection, charge-off, and recovery practices; |
| • | Changes in national and local economic and business conditions and developments, including the condition of various market segments; |
| • | Changes in the nature and volume of the loan portfolio; |
| • | Changes in the experience, ability, and depth of lending management and staff; |
| • | Changes in the trend of the volume and severity of past due and classified loans, and trends in the volume of non-accrual loans and troubled debt restructurings, and other loan modifications; |
| • | Changes in the quality of the Company’s loan review system and the degree of oversight by the directors; |
| • | The existence and effect of any concentrations of credit, and changes in the level of such concentrations; and |
| • | The effect of external factors such as competition and legal and regulatory requirements on the level of estimated losses in the Company’s loan portfolio. |
57
Table of Contents
Allowance for Large Groups of Smaller Balance Homogenous Loans. The portion of the allowance allocated to large groups of smaller balance homogenous loans is focused on loss experience for the pool rather than on an analysis of individual loans. Large groups of smaller balance homogenous loans mainly consist of consumer loans to individuals. The allowance for groups of performing loans is based on historical losses over a six-quarter period. In determining the level of allowance for delinquent groups of loans, the Company classifies groups of homogenous loans based on the number of days delinquent and other qualitative factors and trends.
The table below summarizes the activity in the Company’s allowance for loan losses on non-covered loans for the periods indicated.
| As of and For the Year Ended December 31, | ||||||||||||||||||||
| 2010 | 2009 | 2008 | 2007 | 2006 | ||||||||||||||||
| (Dollars in thousands) | ||||||||||||||||||||
| Balances |
||||||||||||||||||||
| Average total non-covered loans outstanding during the period(26) |
$ | 1,493,526 | $ | 1,637,703 | $ | 1,800,972 | $ | 1,656,842 | $ | 1,356,169 | ||||||||||
| Total non-covered loans outstanding at end of period(26) |
$ | 1,527,928 | $ | 1,537,685 | $ | 1,717,511 | $ | 1,810,112 | $ | 1,554,588 | ||||||||||
| Allowance for Loan Losses (Non-covered loans): |
||||||||||||||||||||
| Balance at beginning of period before reserve for losses on commitments at beginning of period |
$ | 58,543 | $ | 38,172 | $ | 20,477 | $ | 17,412 | $ | 13,871 | ||||||||||
| Charge-offs: |
||||||||||||||||||||
| Construction |
947 | 6,844 | 402 | — | — | |||||||||||||||
| Commercial - Real Estate |
20,296 | 23,742 | 319 | — | 258 | |||||||||||||||
| Commercial - Business |
8,114 | 23,795 | 4,403 | 2,725 | 1,635 | |||||||||||||||
| Trade Finance |
1,448 | 911 | 1,144 | — | — | |||||||||||||||
| SBA |
1,075 | 941 | 581 | 609 | 473 | |||||||||||||||
| Consumer |
767 | 1,599 | 2,040 | 218 | 333 | |||||||||||||||
| Total loan charge-offs |
32,647 | 57,832 | 8,889 | 3,552 | 2,699 | |||||||||||||||
| Recoveries |
||||||||||||||||||||
| Construction |
561 | — | — | — | 424 | |||||||||||||||
| Commercial |
1,357 | — | — | — | — | |||||||||||||||
| Commercial |
2,890 | 269 | 128 | 34 | 43 | |||||||||||||||
| Trade Finance |
— | 1 | 12 | — | — | |||||||||||||||
| SBA |
189 | 67 | 135 | 17 | 6 | |||||||||||||||
| Consumer |
154 | 394 | 131 | 72 | 101 | |||||||||||||||
| Total recoveries |
5,151 | 731 | 406 | 123 | 574 | |||||||||||||||
| Net loan charge-offs |
27,496 | 57,101 | 8,483 | 3,429 | 2,125 | |||||||||||||||
| Provision for loan losses |
21,000 | 77,472 | 26,178 | 6,494 | 5,666 | |||||||||||||||
| Balance at end of period |
$ | 52,047 | $ | 58,543 | $ | 38,172 | $ | 20,477 | $ | 17,412 | ||||||||||
| Ratios (Non-covered loans): |
||||||||||||||||||||
| Net loan charge-offs to average total non-covered loans |
1.84 | % | 3.49 | % | 0.47 | % | 0.21 | % | 0.16 | % | ||||||||||
| Provision for loan losses to average total non-covered loans |
1.41 | 4.73 | 1.45 | 0.39 | 0.42 | |||||||||||||||
| Allowance for loan losses to total non-covered loans at end of period |
3.41 | 3.81 | 2.22 | 1.13 | 1.12 | |||||||||||||||
| Allowance for loan losses to total non-covered nonperforming loans |
114.34 | 92.26 | 186.62 | 326.85 | 534.00 | |||||||||||||||
| Net loan charge-offs to allowance for loan losses at end of period |
52.83 | 97.54 | 22.22 | 16.75 | 12.20 | |||||||||||||||
| Net loan charge-offs to provision for loan losses |
130.93 | 73.71 | 32.41 | 52.80 | 37.50 | |||||||||||||||
| 26 | Net of deferred loan fees and discount on SBA loans sold. |
The process of assessing the adequacy of the allowance for loan losses involves judgmental discretion, and eventual losses may therefore differ from the most recent estimates. The balance of the allowance for loan losses decreased to $52.0 million as of December 31, 2010 compared to $58.5 million as of December 31, 2009. This decrease was mainly due to decreases in charge-offs and a stabilized credit risk, based on the management’s assessment, inherent in the portfolio.
The Bank generally writes down nonperforming collateral dependent impaired loans to the value of the underlying collateral. The collateral value is generally updated every six months and the impairment amount is generally charged off during the quarter in which collateral value is updated. The performing impaired loans, such as performing TDRs, are allocated with specific reserve and are not generally charged off. The performing impaired loans typically continue to make contractual payments according to its restructured terms and conditions.
Total charge-offs decreased to $32.6 million for 2010 from $57.8 million for 2009. Charge-offs for 2010 and 2009 were primarily in the following industries: real estate development for 51.43% and 46.2%, general merchandise wholesalers for
58
Table of Contents
16.34% and 16.5%, hospitality for 13.93% and 11.9%, and others including restaurants and retail business for 18.30% and 25.4%. The Company continued to provide loan loss provisions to adequately address the inherent credit risk in the loan portfolio as of December 31, 2010. The Company provides an allowance for the credits based on the migration analysis and other qualitative factors and trends. The ratio of the allowance for loan losses to non-covered nonperforming loans increased to 114.3% at December 31, 2010 as compared to 92% and 187% in 2009 and 2008, respectively.
Management is committed to maintaining the allowance for loan losses at a level that is considered commensurate with estimated and known risks in the portfolio. Although the adequacy of the allowance is reviewed quarterly, management performs an ongoing assessment of the risks inherent in the portfolio. As of December 31, 2010, management believes the allowance to be adequate based on its assessment of the estimated and known risks in the portfolio, migration analysis of charge-off history and other qualitative factors and trends. However, no assurance can be given that economic conditions, which adversely affect the Company’s service areas or other circumstances, will not result in an increase in the loan loss provision or loan losses.
Allowance for loan losses for non-covered nonperforming assets were $46.5 million as of December 31, 2010 compared to $67.7 million as of December 31, 2009. The 2010 decrease was primarily due to a decrease in charge-offs and the stabilized credit risk inherent in the loans portfolio. The provision for loan losses in 2010, 2009, and 2008 was $22.0 million (including $1.0 million for covered loans), $77.5 million and $26.2 million, respectively. Total charge-offs in 2010, 2009 and 2008 were $32.6 million, $57.8 million and $8.9 million, respectively. Net charge-offs were $27.5 million, $57.1 million and $8.5 million in 2010, 2009 and 2008, respectively.
Allocation of Allowance for Loan Losses on Total Loans
The following table provides a breakdown of the allowance for loan losses on total loans (including both covered and non-covered loans) by class of loans as of the dates indicated:
| As of December 31, | ||||||||||||||||||||||||||||||||||||||||
| 2010 | 2009 | 2008 | 2007 | 2006 | ||||||||||||||||||||||||||||||||||||
| (Dollars in thousands) | ||||||||||||||||||||||||||||||||||||||||
| Amount | % of Loans in Category to Total Loans |
Amount | % of Loans in Category to Total Loans |
Amount | % of Loans in Category to Total Loans |
Amount | % of Loans in Category to Total Loans |
Amount | % of Loans in Category to Total Loans |
|||||||||||||||||||||||||||||||
| Construction |
$ | 600 | 0.9 | % | $ | 949 | 1.4 | % | $ | 6,913 | 3.6 | % | $ | 807 | 3.8 | % | $ | 422 | 2.8 | % | ||||||||||||||||||||
| Commercial - Real Estate |
26,820 | 59.9 | 32,843 | 65.5 | 15,338 | 66.0 | 12,781 | 66.0 | 10,300 | 66.9 | ||||||||||||||||||||||||||||||
| Commercial - Business |
18,298 | 19.7 | 16,064 | 19.2 | 11,185 | 19.4 | 4,192 | 17.2 | 3,795 | 17.8 | ||||||||||||||||||||||||||||||
| Trade Finance |
2,244 | 4.3 | 1,253 | 2.6 | 1,828 | 3.7 | 790 | 3.7 | 762 | 4.3 | ||||||||||||||||||||||||||||||
| SBA |
1,493 | 8.3 | 1,683 | 3.2 | 731 | 2.2 | 943 | 3.9 | 1,190 | 3.2 | ||||||||||||||||||||||||||||||
| Consumer |
1,750 | 4.3 | 1,939 | 4.8 | 1,177 | 5.1 | 964 | 5.4 | 786 | 5.0 | ||||||||||||||||||||||||||||||
| Other |
— | 2.5 | — | 3.3 | — | — | — | — | — | — | ||||||||||||||||||||||||||||||
| Unallocated |
1,852 | — | 3,812 | — | 1,000 | — | — | — | 157 | — | ||||||||||||||||||||||||||||||
| $ | 53,057 | 100.0 | $ | 58,543 | 100.0 | $ | 38,172 | 100.0 | $ | 20,477 | 100.0 | $ | 17,412 | 100.0 | ||||||||||||||||||||||||||
During 2010 the allowance for loan losses decreased by $5.5 million or 9.4% from 2009 compared to the increase of $20.4 million or 53.4% from 2008. The decreases in 2010 were primarily due to the allocation decreases of $8.0 million or 21.8% for commercial real estate loans which was offset by the increase of $2.2 million or 13.9% for commercial loans as compared to 2009. The allowance for loan losses provided by loan type at December 31, 2010 was 1.1% for construction real estate loans, 54.0% for commercial real estate loans, 34.5% for commercial loans, 4.2% for trade finance loans, 2.8% for SBA loans and 3.3% for consumer loans as compared to 1.6%, 62.6%, 27.4%, 2.1%, 2.9% and 3.3% at December 31, 2009, respectively.
The allocated allowance for construction real estate loans decreased by $349,000, or 36.8%, to $0.6 million at December 31, 2010, compared to $0.9 million at December 31, 2009. Real estate construction loans represented 0.9% of the loan portfolio and 1.1% of the allocated allowance for loan losses at December 31, 2010.
The allocated allowance for commercial real estate loans decreased by $8.0 million or 21.8% to $28.7 million at December 31, 2010, compared to $36.7 million at December 31, 2009. Real estate commercial loans represented 59.9% of the loan portfolio and 54.0% of the allocated allowance for loan losses at December 31, 2010.
59
Table of Contents
The allocated allowance for commercial business loans increased by $2.2 million, or 13.9%, to $18.3 million at December 31, 2010, compared to $16.1 million at December 31, 2009. Commercial business loans represented 19.7% of the loan portfolio and 34.5% of the allocated loan loss allowance at December 31, 2010.
The allocated allowance for trade finance loans increased by $0.9 million, or 79.1%, to $2.2 million at December 31, 2010, compared to $1.3 million at December 31, 2009. Trade finance loans represented 4.3% of the loan portfolio and 4.2% of allocated loan loss allowance at December 31, 2010.
The Company has considered and evaluated recent trends in the loan portfolio in the determination of its allocation of allowance for loan losses in the periods discussed above. The historical risk factors were reviewed based on six-quarter weighted average instead of twelve-quarter to better reflect directional consistency and adequately address the trends regarding the weakening economy including increasing unemployment and jobless claims.
Business Concentration
No individual or single group of related accounts is considered material in relation to our total assets or deposits, or in relation to our overall business. However, approximately 60.8% of our loan portfolio at December 31, 2010 consisted of real estate-related loans, including construction loans and commercial loans secured by real estate. Moreover, our business activities are currently focused primarily in Southern California, with the majority of our business concentrated in Los Angeles and Orange County. Consequently, our results of operations and financial condition are dependent upon the general trends in the Southern California economies and, in particular, the commercial real estate markets. In addition, the concentration of our operations in Southern California exposes us to greater risk than other banking companies with a wider geographic base in the event of catastrophes, such as earthquakes, fires, and floods in this region.
Investment Portfolio
The following table summarizes the amortized cost, fair value, and distribution of the Company’s investment securities as of the dates indicated:
| As of December 31, | ||||||||||||||||||||||||
| 2010 | 2009 | 2008 | ||||||||||||||||||||||
| Amortized Cost |
Fair Value | Amortized Cost |
Fair Value | Amortized Cost |
Fair Value | |||||||||||||||||||
| (Dollars in thousands) | ||||||||||||||||||||||||
| Available-for-Sale: |
||||||||||||||||||||||||
| U.S. Treasury |
$ | 300 | $ | 300 | $ | 300 | $ | 300 | $ | 299 | $ | 300 | ||||||||||||
| U.S. Governmental agencies securities and U.S. Government sponsored enterprise securities |
58,994 | 58,607 | 74,001 | 74,270 | 23,997 | 24,510 | ||||||||||||||||||
| U.S. Governmental agencies and U.S. Government sponsored and enterprise mortgage-backed securities |
154,149 | 157,099 | 206,975 | 212,175 | 117,814 | 119,137 | ||||||||||||||||||
| Corporate trust preferred securities |
2,738 | 759 | 2,713 | 2,404 | 1,111 | 1,111 | ||||||||||||||||||
| Mutual Funds backed by adjustable rate mortgages |
5,000 | 5,073 | 4,500 | 4,533 | 4,500 | 4,495 | ||||||||||||||||||
| Collateralized mortgage obligations |
67,063 | 67,713 | 76,533 | 76,745 | 23,511 | 24,280 | ||||||||||||||||||
| Total available-for-sale |
$ | 288,244 | $ | 289,551 | $ | 365,022 | $ | 370,427 | $ | 171,232 | $ | 173,833 | ||||||||||||
| Held-to-Maturity: |
||||||||||||||||||||||||
| U.S. Government agencies and U.S. Government sponsored enterprise mortgage-backed securities |
$ | — | $ | — | $ | — | $ | — | $ | 3,852 | $ | 3,861 | ||||||||||||
| Municipal securities |
— | — | — | — | 5,009 | 5,018 | ||||||||||||||||||
| Total held-to-maturity |
$ | — | $ | — | $ | — | $ | — | $ | 8,861 | $ | 8,879 | ||||||||||||
| Total investment securities |
$ | 288,244 | $ | 289,551 | $ | 365,022 | $ | 370,427 | $ | 180,093 | $ | 182,712 | ||||||||||||
The Company’s investment securities portfolio is classified into two categories: Held-to-Maturity or Available-for-Sale. The Company had no investment securities in trading securities category for any of the reported periods. The Company classifies securities that it has the ability and intent to hold to the maturity as held-to-maturity securities, to be sold only in the event of concerns with an issuer’s credit worthiness, a change in tax law that eliminates their tax-exempt status, or other infrequent situations. All other securities are classified as available-for-sale. The securities classified as held-to-maturity are presented at net amortized cost and available-for-sale securities are carried at their estimated fair values.
60
Table of Contents
The Company aims to maintain an investment portfolio with an adequate mix of fixed-rate and adjustable-rate securities with relatively short maturities to minimize overall interest rate risk. The Company’s investment securities portfolio consists of U.S. Treasury securities, U.S. Government agency securities, U.S. Government sponsored enterprise debt securities, mortgage-backed securities, corporate debt, and U.S. Government sponsored enterprise equity securities. The mortgage backed securities and collateralized mortgage obligations (“CMO”) are all agency-guaranteed residential mortgages. The Company regularly models, evaluates and analyzes each agency CMO to capture its unique allocation of principal and interest.
The Company performs regular impairment analyses on the investment securities portfolio. If the Company determines that a decline in fair value is other-than-temporary, an impairment write-down is recognized in current earnings. Other-than-temporary declines in fair value are assessed based on the duration the security has been in a continuous unrealized loss position, the severity of the decline in value, the rating of the security and the Company’s ability and intent on holding the securities until the fair values recover. The securities that have been in a continuous unrealized loss position for less than twelve months at December 31, 2010 had investment grade ratings upon purchase. The issuers of these securities have not, to the Company’s knowledge, established any cause for default on these securities and the various rating agencies have reaffirmed these securities’ long-term investment grade status at December 31, 2010. These securities have fluctuated in value since their purchase dates as market interest rates have fluctuated. However, the Company does not intend to sell these securities and it is not more than likely than not that the Company will be required to sell these securities before recovery of their amortized cost basis. As such, the Company does not consider these investments to be other-than-temporarily impaired at December 31, 2010.
The Company owns one collateralized debt obligation (“CDO”) security that is backed by trust preferred securities (“TRUPS”) issued by banks and thrifts. This security has been in a continuous unrealized loss position for twelve months or more at December 31, 2010. The Company recognized an OTTI impairment during 2008 of $9.9 million to reduce the CDO TRUPS to fair value of $1.1 million. The CDO TRUPS securities market, since 2007 and continuing into the past several quarters, has been severely impacted by the liquidity crunch and concern over the banking industry. If the weight of the evidence indicates the market is not orderly, a reporting entity shall place little, if any, weight compared with other indications of fair value on that transaction price when estimating fair value or market risk premiums. Factors that were considered to determine whether there has been a significant decrease in the volume and level of activity for the CDO TRUPS securities market when compared with normal activity include:
| • | There are few recent transactions. |
| • | Price quotations are not based on current information. |
| • | Price quotations vary substantially either over time or among market makers. |
| • | Indexes that were previously highly correlated with the fair values of the asset or liability are demonstrably uncorrelated with recent indications of fair value for that asset or liability. |
| • | There is a significant increase in implied liquidity risk premiums. Yields or performance indicators (such as delinquency rates or loss severities) for observed transactions or quoted prices when compared with the reporting entity’s estimate of expected cash flows, considering all available market data about credit and other nonperformance risk for the asset or liability. |
| • | There is a wide bid-ask spread or significant increase in the bid-ask spread. |
| • | There is a significant decline or absence of new market issuances for the asset or liability. |
| • | Little information is publicly available. |
In order to determine the fair value of the CDO TRUPS security, the Company uses Level 3 fair value measurement. The fair value of the CDO TRUPS security has traditionally been based on the average of at least two quoted market prices obtained from independent brokers. However, as a result of the global financial crisis and illiquidity in the U.S. markets, the market for these securities has become increasingly inactive since mid-2007. The current broker price for the CDO TRUPS securities is based on forced liquidation or distressed sale values in very inactive markets that may not be representative of the economic value of these securities. As such, the fair value of the CDO TRUPS security has been below cost since the advent of the financial crisis. Additionally, most, if not all, of these broker quotes are nonbinding.
The Company considered whether to place little, if any, weight on transactions that are not orderly when estimating fair value. Although length of time and severity of impairment are among the factors to consider when determining whether a security that is other than temporarily impaired, the CDO TRUPS securities have only exhibited deep declines in value since the credit crisis began. The Company therefore believes that this is an indicator that the decline in price is primarily the result of the lack of liquidity in the market for these securities.
61
Table of Contents
The Company uses Moody’s Analytics to compute the fair value of the CDO TRUPS security. Moody’s continues to update their valuation process in order to refine and improve the estimate of default probabilities to align the valuation methodology with industry practices.
Moody’s approach to valuing CDO TRUPS includes asset and liability analyses to arrive at an Estimated Fundamental Value (EFV), then applies a liquidity spread to discount the EFV to the value that would be received in an orderly liquidation.
| • | Asset Credit Quality Analysis: The credit quality of collateral supporting each CDO TRUPS is determined using Probability of Default values for each underlying issuer and Loss Given Default values by asset type. |
| • | Liability Analysis: The EFV of CDO TRUPS liabilities is determined through asset and liability modeling, specifically including (a) Forecasting cash flows generated by underlying collateral, (b) Establishing priority-of-claims distribution to each CDO tranche, and (c) Simulating the distribution of cash flows to each CDO tranche using a Monte Carlo simulation model. |
| • | Liquidity discount factor: A regression model is run based on historical data to determine an appropriate spread for the security in a liquid market. Using that liquid market spread plus current market interest rates, the EFV cash flows are discounted to arrive an orderly liquid exit value |
The Company considers numerous factors to determine any OTTI for the CDO TRUPS security including review of trustee reports, monitoring of “break in yield” tests, analysis of current defaults and deferrals and the expectation for future defaults and deferrals. The Company reviews the key financial characteristics for individual issuers (commercial banks or thrifts) in the CDO TRUPS security and considers capital ratios, leverage ratios, nonperforming loan and nonperforming asset ratios, in addition to the credit ratings. The credit ratings of the Company’s CDO TRUPS security are “Ca” (Moody’s) and “C” (Fitch) at December 31, 2010.
The Company uses cash flow projections for the purpose of assessing OTTI on CDO TRUPS security which incorporates certain credit events in the underlying collaterals and prepayment assumptions. The projected issuer default rates are assumed at a rate equivalent to 150 basis points applied annually and have a 0% recovery factor after the initial default date. The principal is assumed to be prepaying at 1% annually and at 100% at maturity.
Based on the results from the cash flow model, the CDO TRUPS security did not experience an adverse change in its cash flow status. As such, based on all of these factors, the Company determined that there was no OTTI adjustment required at December 31, 2010. The risk of future OTTI will be highly dependent upon the performance of the underlying issuers. The Company does not have the intention to sell and does not believe it will be required to sell the CDO TRUPS security.
As of December 31, 2010, investment securities totaled $289.6 million or 12.8% of total assets, compared to $370.4 million or 16.9% of total assets at December 31, 2009. The Company sold $57 million of securities available for sale in the first quarter of 2010. The decrease in the investment portfolio was primarily due to the Company’s continued asset liability management (ALM) process as a part of the Company’s strategy to mitigate interest rate risk, increase the balance sheet flexibility, and reduce market volatility.
As of December 31, 2010, available-for-sale securities totaled $289.6 million, compared to $370.4 million as of December 31, 2009. Available-for-sale securities as a percentage of total assets decreased to 12.8% as of December 31, 2010 from 16.9% as of December 31, 2009. For the year ended December 31, 2010, the yield on the average investment portfolio was 2.81%, representing a decrease of 109 basis points as compared to 3.90% for 2009.
The investment securities purchased by the Company generally include U.S. agency and government sponsored entities (“GSE”), mortgage-backed securities (“MBS”) and collateralized mortgage obligations (“CMO”) as well as agency debentures. The Company increased its holdings of Ginnie Mae (“GNMA”) securities during 2010 since GNMA securities are backed by the full faith and credit of the U.S. government and carry a zero risk weight for regulatory capital purposes.
As of December 31, 2010, the Company had securities with total fair value of $81.7 million and unrealized losses of $3.2 million as compared to total fair value of $83.3 million and unrealized losses of $1.0 million at December 31, 2009. At December 31, 2010, the market value of securities which have been in a continuous loss position for 12 months or more totaled $0.8 million with an unrealized loss of $2.0 million compared to $3.3 million with an unrealized loss of $0.3 million, respectively, at December 31, 2009.
62
Table of Contents
The following table summarizes, as of December 31, 2010, the contractual maturity characteristics of the investment portfolio. Expected remaining maturities may differ from remaining contractual maturities because obligors may have the right to prepay certain obligations with or without penalties.
| Within one Year |
After One But Within Five Years |
After Five But Within Ten Years |
After Ten Years |
Total | ||||||||||||||||||||||||||||||||||||
| Amount | Yield | Amount | Yield | Amount | Yield | Amount | Yield | Amount | Yield | |||||||||||||||||||||||||||||||
| (Dollars in thousands) | ||||||||||||||||||||||||||||||||||||||||
| Available-for-Sale (Fair Value): |
||||||||||||||||||||||||||||||||||||||||
| U.S. Governmental agencies securities and U.S. Government sponsored enterprise securities |
$ | 10,300 | 0.49 | % | $ | 48,607 | 1.18 | % | $ | — | — | % | $ | — | — | % | $ | 58,907 | 1.06 | % | ||||||||||||||||||||
| U.S. Governmental agencies and U.S. Government sponsored and enterprise mortgage-backed securities |
4 | 5.51 | 1,601 | 4.59 | 53,397 | 2.76 | 102,097 | 3.20 | 157,099 | 3.06 | ||||||||||||||||||||||||||||||
| Corporate trust preferred securities |
— | — | — | — | — | — | 759 | 11.61 | 759 | 11.61 | ||||||||||||||||||||||||||||||
| Mutual Funds backed by adjustable rate mortgages |
5,073 | 3.05 | — | — | — | — | — | — | 5,073 | 3.05 | ||||||||||||||||||||||||||||||
| Fixed rate collateralized mortgage obligations |
— | — | — | — | 18,553 | 1.87 | 49,160 | 1.41 | 67,713 | 1.54 | ||||||||||||||||||||||||||||||
| Total available-for-sale |
$ | 15,377 | 1.34 | % | $ | 50,208 | 1.29 | % | $ | 71,950 | 2.53 | % | $ | 152,016 | 2.66 | % | $ | 289,551 | 2.32 | % | ||||||||||||||||||||
| Total investment securities |
$ | 15,377 | 1.34 | % | $ | 50,208 | 1.29 | % | $ | 71,950 | 2.53 | % | $ | 152,016 | 2.66 | % | $ | 289,551 | 2.32 | % | ||||||||||||||||||||
Interest Earning Short-Term Investments
The Company invests its short-term excess available funds in overnight Fed Funds and money market funds. As of December 31, 2010 and 2009, the Company had $136.2 million and $145.8 million, respectively, invested in overnight Fed Funds. As of December 31, 2010 and 2009, the amounts invested in money market funds and interest-bearing deposits in other banks were $93.5 million and $52.7 million, respectively. The investment in Fed Funds averaged $183.4 million and $181.0 million for the year ended December 31, 2010 and 2009, respectively. Interest earned on these funds resulted in effective yields of 0.23% in 2010 and 2009, respectively.
Other Assets
The Company’s investment in the FHLB stock totaled $15.0 million and $15.7 million as of December 31, 2010 and 2009, respectively. FHLB stock is required in order to utilize a borrowing facility when needed. The Company did not purchase any additional FHLB stock in 2010 or 2009.
Member banks own investments in stocks issued by the FHLB. The FHLBs are government-sponsored entities (“GSE”). In January 2009 the FHLB suspended the payment of stock dividends starting from the first quarter of 2009 and temporarily ceased to repurchase excess capital stock. However, the Company received cash dividends during 2010.
Federal Home Loan Bank stock is recorded at cost and is periodically reviewed for impairment based on the ultimate recovery of par value. No ready market exists for the FHLB stock and is only redeemable by the FHLB. It has no quoted market value and is carried at cost. The cost approximates fair market value based upon the redemption requirements of the FHLB, and this investment is not considered impaired at December 31, 2010. The FHLB repurchased $1.9 million of its own stock from the Company in 2010. However, stricter capital requirements for the FHLB system could adversely impact the value of the FHLB stock in the future.
When evaluating FHLB stock for impairment, its value should be determined based on the ultimate recoverability of the par value rather than by recognizing temporary declines in value. In summary,
| 1) | A decline in market values of the FHLBs’ assets does not necessarily equate to an economic decline in net assets. The focus is on economic losses rather than market losses, which Moody’s notes can be absorbed. |
| 2) | FHLBs are meeting their debt obligations. Although the responsibility to repay debt may be shared among FHLBs in the event that one FHLB cannot pay, to date, an FHLB has never been required to pay the consolidated obligation of another FHLB. |
| 3) | With the exception of the Housing Act, enacted July 20, 2008, there are no pending legislative or regulatory changes that would impact the customer base of the FHLBs. |
| 4) | Because the FHLBs’ primary source of funds is debt obligations, the Moody’s conclusion—that the credit ratings are not expected to change—is one of the important factors to consider. The FHLBs have an additional source of liquidity beyond traditional debt obligations: the secured funding available to the GSEs through the U.S. Treasury. Under their lending agreements, the FHLB may borrow based on pledging eligible collateral. |
63
Table of Contents
Based on the observations noted above, the Company has concluded that its FHLB stock is not impaired at December 31, 2010 and the Company will ultimately recover the par value of its investment in this stock, which is held for long periods of time.
Pacific Coast Bankers Bank (“PCBB”) also requires its members to purchase PCBB stock. No ready market exists for the PCBB stock and it is only redeemable by PCBB. The Bank holds 4,000 shares at $15 per share. There has not been any adverse change in the financial position or condition of PCBB and the investment is not considered impaired at December 31, 2010.
Investments in affordable housing partnerships, totaling $10.8 million and $11.5 million as of December 31, 2010 and 2009, respectively, represent limited partnership interests owned by the Company in affordable housing projects for lower income tenants. Investments in these projects enable the Company to obtain CRA credit and federal and state income tax credits, as previously discussed in “Provision for Income Taxes.”
The Company invested $10.0 million in bank owned life insurance (“BOLI”) in December 2003. The policies were purchased from MassMutual, Midland National Life, and New York Life, and totaled $10 million at purchase. BOLI is an insurance policy with a single premium paid at policy commencement. Its initial cash surrender value is equivalent to the premium paid, and the value grows through non-taxable increases in its cash surrender value through interest earned on the policy, net of the cost of insurance plus any death benefits ultimately received by the Company. The cash surrender value of BOLI as of December 31, 2010 and 2009 was $12.8 million and $12.4 million, respectively. The Company reviews the insurance carriers annually and based on the most recent assessment, the investment is not considered impaired at December 31, 2010.
| Carrier ratings at 12/31/10 |
Moody’s | S&P | Fitch | |||||||||
| Mass Mutual |
Aa2 | AA+ | AA+ | |||||||||
| Midland National Life |
n/a | A+ | n/a | |||||||||
| New York Life |
Aaa | AAA | AAA | |||||||||
Even though BOLI and the investment in affordable housing partnerships generally enhance profitability, they are not classified as interest-earning assets.
Cash on hand and balances due from correspondent banks represent the largest component of the Company’s non-earning assets. Cash on hand and balances due from correspondent banks represented 1.3% and 1.6% of total assets at December 31, 2010 and 2009, respectively. The outstanding balance of cash and due from banks was $29.2 million and $34.3 million as of December 31, 2010 and 2009, respectively.
The Company maintained balances at correspondent banks to cover daily in-clearings and other activities. The average reserve balance requirements were approximately $9.0 million and $7.8 million as of December 31, 2010 and 2009, respectively, most of which was covered by cash on hand and vault cash held (no additional balances were maintained with the Federal Reserve Bank for this purpose).
A significant component of non-earning assets is Premises and Equipment, which is stated at cost less accumulated depreciation and amortization. Depreciation is charged to income over the estimated useful lives of the assets and leasehold improvements are amortized over the terms of the related leases, or the estimated useful lives of the improvements, whichever is shorter. Depreciation expenses totaled $2.1 million and $2.2 million in 2010 and 2009, respectively. The net book value of the Company’s premises and equipment totaled $13.5 million at December 31, 2010 compared to $13.4 million at December 31, 2009.
Prepaid regulatory assessment fees—On November 12, 2009, the FDIC adopted a final rule amending the assessment regulations to require insured depository institutions to prepay their quarterly risk-based assessments for the fourth quarter of 2009, and for all of 2010, 2011, and 2012, on December 30, 2009, along with each institution’s risk-based assessment for the third quarter of 2009. The Company’s unamortized prepaid assessment for FDIC amounted to $7.8 million and $11.4 million at December 31, 2010 and 2009, respectively. The prepaid regulatory assessment includes prepaid annual assessments for the DFI of approximately $78,000 and $90,000 at December 31, 2010 and 2009, respectively.
Other assets increased by $1.5 million to $6.3 million as of December 31, 2010 compared to $4.8 million at December 31, 2009. The increase was mainly due to a receivable from the FDIC in the amount of $1.3 million as a part of FDIC-assisted transaction.
64
Table of Contents
Deposits
The composition and cost of the Company’s deposit base are important components in analyzing its net interest margin and balance sheet liquidity characteristics, both of which are discussed in greater detail in other sections herein. Net interest margin is improved to the extent that growth in deposits can be concentrated in historically lower-cost core deposits, namely non-interest-bearing demand, interest-bearing Negotiable Order Withdrawal (“NOW”) checking accounts, savings accounts and money market deposit accounts. Liquidity is impacted by the volatility of deposits or other funding instruments, or in other words their propensity to leave the institution for rate-related or other reasons. Potentially, the most volatile deposits in a financial institution are large certificates of deposit (e.g., generally time deposits with balances exceeding $100,000). Because these deposits (particularly when considered together with a customer’s other specific deposits) may exceed FDIC insurance limits, depositors may select shorter maturities to offset perceived risk elements associated with such deposits.
Information concerning the average balance and average rates paid on deposits by deposit type for the past three fiscal years is contained in the Distribution, Rate, and Yield table in the previous section entitled “Results of Operations—Net Interest Margin”. The following table sets forth the distribution of deposits as of the dates indicated:
| As of December 31, | ||||||||
| 2010 | 2009 | |||||||
| (Dollars in thousands) | ||||||||
| Demand deposits (noninterest-bearing) |
$ | 396,973 | $ | 352,395 | ||||
| Money market accounts and NOW |
471,132 | 528,331 | ||||||
| Savings |
87,484 | 86,567 | ||||||
| 955,589 | 967,293 | |||||||
| Time deposits |
||||||||
| Less than $100,000 |
334,341 | 256,020 | ||||||
| $100,000 or more |
481,064 | 524,358 | ||||||
| Total |
$ | 1,770,994 | $ | 1,747,671 | ||||
The following table summarizes the composition of deposits as a percentage of total deposits as of the dates indicated:
| As of December 31, | ||||||||
| 2010 | 2009 | |||||||
| Demand deposits (noninterest-bearing) |
22.4 | % | 20.2 | % | ||||
| Money market accounts and NOW |
26.6 | 30.2 | ||||||
| Savings |
4.9 | 5.0 | ||||||
| Time deposits |
||||||||
| Less than $100,000 |
18.9 | 14.6 | ||||||
| $100,000 or more |
27.2 | 30.0 | ||||||
| Total |
100.0 | 100.0 | ||||||
The Company offers a wide variety of retail deposit account products to both consumer and commercial deposit customers. Time deposits, which are the Company’s highest cost deposits, consist primarily of retail fixed-rate certificates of deposit, and comprised 46.1% and 44.6% of the deposit portfolio at December 31, 2010 and 2009, respectively. The ratio of noninterest-bearing deposits to total deposits was 22.4% and 20.2% at December 31, 2010, and 2009, respectively. All other deposits, which include NOW accounts, savings and money market accounts, accounted for the remaining 31.5% and 35.2% of the deposit portfolio at December 31, 2010 and 2009, respectively.
Deposit growth remains challenging as the Company continues to experience heightened market competition. Deposits increased 1.3% to $1.77 billion at December 31, 2010, from $1.75 billion at December 31, 2009, largely due to increases in time deposits less than $100,000 of $78.3 million and demand deposits of $44.6 million, offset by the decreases in money market accounts of $57.2 million and time deposits of $100,000 or more of $43.3 million. Total time deposits amounted to $815.4 million and $780.4 million and represented 46.1% and 44.6% of total deposits at December 31, 2010 and 2009, respectively. Brokered deposits were $101.2 million and $260.2 million at December 31, 2010 and 2009, respectively.
As of December 31, 2010 and 2009, time deposits of $100,000 or more totaled $481.1 million and $524.4 million, respectively, representing 27.2% and 30.0% of the total deposit portfolio, respectively. These accounts, consisting primarily of consumer deposits and deposits from the State of California, had a weighted average interest rate of 1.31% and 1.99% at December 31, 2010 and 2009, respectively.
65
Table of Contents
The following table provides the remaining maturities of the Company’s time deposits in denominations of $100,000 or greater as of December 31, 2010 and 2009:
| As of December 31, | ||||||||
| 2010 | 2009 | |||||||
| (Dollars in thousands) | ||||||||
| Three months or less |
$ | 209,964 | $ | 254,173 | ||||
| Over three months through six months |
64,599 | 178,528 | ||||||
| Over six months through twelve months |
125,801 | 83,021 | ||||||
| Over twelve months |
80,700 | 8,636 | ||||||
| Total |
$ | 481,064 | $ | 524,358 | ||||
The Company’s average deposit cost decreased to 1.17% during 2010 from 1.99% in 2009.
Other Borrowed Funds
The Company regularly uses FHLB advances as an alternate funding source to provide operating liquidity and to fund loan originations. As of December 31, 2010, the Company borrowed $166.5 million as compared to $146.8 million at December 31, 2009 from the FHLB with note terms from less than 1 year to 15 years. Notes of 10-year and 15-year terms are amortizing at the predetermined schedules over the life of the notes. Of the $166.5 million outstanding, $145.0 million is composed of six fixed rate term advances, each with an option to be called by the FHLB after the lockout dates varying from 6 months to 2 years. If market interest rates are higher than the advances’ stated rates at that time, the advances will be called by the FHLB and the Company will be required to repay the FHLB. If market interest rates are lower after the lockout period, then the advances will not be called by the FHLB. If the advances are not called by the FHLB, then they will mature on the maturity date ranging from 4 years to 10 years. The Company may repay the advances with a prepayment penalty at any time. If the advances are called by the FHLB, there is no prepayment penalty.
Under the FHLB borrowing agreement, the Company has pledged under a blanket lien all qualifying commercial and residential loans as collateral with a total carrying value of $828.0 million at December 31, 2010 as compared to $812.9 million at December 31, 2009. Total interest expense on FHLB borrowings was $6.7 million and $6.9 million for the years ended December 31, 2010 and 2009, respectively, reflecting average interest rates of 4.16% and 4.30%, respectively.
The Company also regularly uses short-term borrowing from the U.S. Treasury to manage Treasury Tax and Loan payments. Notes issued to the U.S. Treasury amounted to $963,000 as of December 31, 2010 compared to $1.6 million as of December 31, 2009. Interest expense on these borrowings was $0 and $0 in 2010 and 2009, respectively, reflecting average interest rates of 0.00% and 0.00%, respectively. The details of these borrowings for the years 2010, 2009, and 2008 are presented in Note 15 to the consolidated financial statements in Item 8 herein.
In addition, the issuance of a long-term subordinated debenture at the end of 2004 in connection with the issuance of $18.6 million in “pass-through” trust preferred securities provided an additional source of funding. (See Note 16 to the consolidated financial statements in Item 8 herein).
Short-term borrowings principally include overnight fed funds purchased and advances from the FHLB. The details of these borrowings for the years 2010, 2009, and 2008 are presented below:
| 2010 | 2009 | 2008 | ||||||||||
| (Dollars in thousands) | ||||||||||||
| Federal funds purchased: |
||||||||||||
| Balance at December 31, |
$ | — | $ | — | $ | — | ||||||
| Average amount outstanding |
41 | 211 | 6,144 | |||||||||
| Maximum amount outstanding at any month end |
— | — | — | |||||||||
| Average interest rate for the year |
0.76 | % | 0.34 | % | 1.71 | % | ||||||
| FHLB borrowings: |
||||||||||||
| Balance at December 31, |
$ | 166,477 | $ | 146,838 | $ | 192,181 | ||||||
| Average amount outstanding |
160,973 | 161,886 | 255,928 | |||||||||
| Maximum amount outstanding at any month end |
166,720 | 192,153 | 295,237 | |||||||||
| Average interest rate for the year |
4.16 | % | 4.30 | % | 3.62 | % | ||||||
In December, 2010, the Company transferred SBA loans of $20.5 million which were accounted for as a secured financing as of December 31, 2010. Pursuant to ASC 860, Transfers and Servicing, such SBA loan transfer is treated as a secured financing until the recourse period expires which is generally 90 days.
66
Table of Contents
Contractual Obligations
The following table presents, as of December 31, 2010, the Company’s significant fixed and determinable contractual obligations, within the categories described below, by payment date. These contractual obligations, except for the operating lease obligations, are included in the Consolidated Statements of Financial Condition. The payment amounts represent those amounts contractually due to the recipient.
| Payments due by period | ||||||||||||||||||||||||||||
| 2011 | 2012 | 2013 | 2014 | 2015 | Thereafter | Total | ||||||||||||||||||||||
| (Dollars in thousands) | ||||||||||||||||||||||||||||
| Debt obligations(27) |
$ | — | $ | — | $ | — | $ | — | $ | — | $ | 18,557 | $ | 18,557 | ||||||||||||||
| FHLB advances |
41,023 | 105,389 | 157 | 167 | 176 | 20,301 | 167,213 | |||||||||||||||||||||
| Deposits |
691,555 | 119,808 | 37,689 | 9,328 | 4,324 | 199 | 862,903 | |||||||||||||||||||||
| Operating lease obligations |
2,587 | 2,166 | 1,718 | 1,184 | 926 | 1,552 | 10,133 | |||||||||||||||||||||
| Total contractual obligations |
$ | 735,165 | $ | 227,363 | $ | 39,564 | $ | 10,679 | $ | 5,426 | $ | 40,609 | $ | 1,058,806 | ||||||||||||||
| 27 | Includes principal payments only. The debentures will mature on January 7, 2034. The debentures may be redeemed by the debenture issuer, in whole or in part, on any January 7, April 7, July 7 or October 7 on or after January 7, 2009 at the redemption price, upon not less than 30 nor more than 60 days’ notice to holders of such debentures. |
Off-Balance Sheet Arrangements
The Company may also have liabilities under certain contractual agreements contingent upon the occurrence of certain events.
As part of its service to its small to medium-sized business customers, the Company from time to time issues formal commitments and lines of credit. These commitments can be either secured or unsecured and 90% are short-term, or less than one year. They may be in the form of revolving lines of credit for seasonal working capital needs. However, these commitments may also take the form of standby letters of credit and commercial letters of credit. Commercial letters of credit facilitate import trade. Standby letters of credit are conditional commitments issued by the Company to guarantee the performance of a customer to a third party.
Total unused commitments to extend credit were $158.8 million and $187.1 million at December 31, 2010 and 2009, respectively. Unused commitments represented 10.4% and 12.2% of outstanding gross loans at December 31, 2010 and 2009, respectively. The Company’s standby letters of credit and commercial letters of credit at December 31, 2010 were $27.9 million and $30.3 million, respectively, as compared to $21.3 million and $22.2 million, respectively, at December 31, 2009.
Liabilities for losses on outstanding commitments of $244,000 and $246,000 were reported separately in other liabilities at December 31, 2010 and 2009.
A discussion of significant contractual arrangements under which the Company may be held contingently liable, including guarantee arrangements, is included in Note 17—”Commitments and Contingencies” and Note 21—”Financial Instruments with Off-Balance Sheet Risk” to the Consolidated Financial Statements Item 8 herein.
Impact of Inflation
The primary impact of inflation on the Company is its effect on interest rates. The Company’s primary source of income is net interest income, which is affected by changes in interest rates. The Company attempts to mitigate the impact of inflation on its net interest margin through the management of rate-sensitive assets and liabilities and the analysis of interest rate sensitivity. The effect of inflation on premises and equipment as well as non-interest expenses has not been significant for the periods covered in this Annual Report.
Market Risk and Asset Liability Management
Market risk is the risk of loss from adverse changes in market prices and rates. The Company’s market risk arises primarily from interest rate risk inherent in its lending, investment and deposit taking activities. The Company’s profitability is affected by fluctuations in interest rates. A sudden and substantial change in interest rates may adversely impact the Company’s earnings to the extent that the interest rates borne by assets and liabilities do not change at the same speed, to the same extent or on the same basis. To that end, management actively monitors and manages its interest rate risk exposure.
67
Table of Contents
The Company’s strategy for asset and liability management is formulated and monitored by the Company’s Asset/Liability Board Committee (the “Board Committee”). This Board Committee is composed of four non-employee directors and the President. The Board Committee meets quarterly to review and adopt recommendations of the Asset/Liability Management Committee (“ALCO”).
The ALCO consists of executive and manager level officers from various areas of the Company including lending, investment, and deposit gathering, in accordance with policies approved by the board of directors. The primary goal of the Company’s ALCO is to manage the financial components of the Company’s balance sheet to optimize the net income under varying interest rate environments. The focus of this process is the development, analysis, implementation, and monitoring of earnings enhancement strategies, which provide stable earnings and capital levels during periods of changing interest rates.
The ALCO meets regularly to review, among other matters, the sensitivity of the Company’s assets and liabilities to interest rate changes, the book and market values of assets and liabilities, unrealized gains and losses, and maturities of investments and borrowings. The ALCO also approves and establishes pricing and funding decisions with respect to overall asset and liability composition, and reports regularly to the Board Committee and the board of directors.
Interest Rate Risk
Interest rate risk occurs when assets and liabilities reprice at different times as interest rates change. In general, the interest the Company earns on its assets and pays on its liabilities are established contractually for specified periods of time. Market interest rates change over time and if a financial institution cannot quickly adapt to changes in interest rates, it may be exposed to volatility in earnings. For instance, if the Company were to fund long-term fixed rate assets with short-term variable rate deposits, and interest rates were to rise over the term of the assets, the short-term variable deposits would rise in cost, adversely affecting net interest income. Similar risks exist when rate sensitive assets (for example, prime rate based loans) are funded by longer-term fixed rate liabilities in a falling interest rate environment.
The Company’s overall strategy is to minimize the adverse impact of immediate incremental changes in market interest rates (rate shock) on net interest income and economic value of equity. Economic value of equity (“EVE”) is defined as the present value of assets, minus the present value of liabilities and off-balance sheet instruments. The attainment of this goal requires a balance between profitability, liquidity and interest rate risk exposure. To minimize the adverse impact of changes in market interest rates, the Company simulates the effect of instantaneous interest rate changes on net interest income and EVE on a quarterly basis. The table below shows the estimated impact of changes in interest rates on our net interest income and market value of equity as of December 31, 2010 and 2009, respectively, assuming a parallel shift of 100 to 300 basis points in both directions.
| Net Interest Income(28) | Economic Value of Equity (EVE)(29) | |||||||
| Change (In Basis Points) |
December 31, 2010 % Change |
December 31, 2009 % Change |
December 31, 2010 % Change |
December 31, 2009 % Change | ||||
| +300 | 19.81% | 21.71% | -20.97% | -16.73% | ||||
| +200 | 12.83% | 14.04% | -13.60% | -10.53% | ||||
| +100 | 6.46% | 6.65% | -6.77% | -4.77% | ||||
| Level | ||||||||
| -100 | 1.25% | 0.46% | 4.45% | 2.10% | ||||
| -200 | 4.09% | 3.56% | 10.06% | 3.54% | ||||
| -300 | 3.95% | 3.48% | 10.67% | 4.48% | ||||
| 28 | The percentage change represents net interest income for twelve months in a stable interest rate environment versus net interest income in the various rate scenarios. |
| 29 | The percentage change represents economic value of equity of the Company in a stable interest rate environment versus economic value of equity in the various rate scenarios. |
All interest-earning assets and interest-bearing liabilities are included in the interest rate sensitivity analysis at December 31, 2010 and 2009, respectively. At December 31, 2010 and 2009, respectively, our estimated changes in net interest income and economic value of equity were within the ranges established by the Board of Directors.
The primary analytical tool used by the Company to gauge interest rate sensitivity is a simulation model used by many community banks, which is based upon the actual maturity and repricing characteristics of interest-rate-sensitive assets and liabilities. The model attempts to forecast changes in the yields earned on assets and the rates paid on liabilities in relation to changes in market interest rates. As an enhancement to the primary simulation model, other factors are incorporated into the model, including prepayment assumptions and market rates of interest provided by independent broker/dealer quotations, an independent pricing model, and other available public information. The model also factors in projections of anticipated activity
68
Table of Contents
levels of the Company’s product lines. Management believes that the assumptions it uses to evaluate the vulnerability of the Company’s operations to changes in interest rates approximate actual experience and considers them reasonable; however, the interest rate sensitivity of the Company’s assets and liabilities and the estimated effects of changes in interest rates on the Company’s net interest income and EVE could vary substantially if different assumptions were used or if actual experience were to differ from the historical experience on which they are based.
Liquidity
The objective of liquidity risk management is to ensure that the Company has the continuing ability to maintain cash flows that are adequate to fund operations and meet its other obligations on a timely and cost-effective basis in various market conditions. Changes in the composition of its balance sheet, the ongoing diversification of its funding sources, risk tolerance levels and market conditions are among the factors that influence the Company’s liquidity profile. The Company establishes liquidity guidelines and maintains contingency liquidity plans that provide for specific actions and timely responses to liquidity stress situations.
As a means of augmenting the liquidity sources, the Company has available a combination of borrowing sources comprised of FHLB advances, federal funds lines with various correspondent banks, and access to the wholesale markets. The Company believes these liquidity sources to be stable and adequate. At December 31, 2010, the Company was not aware of any information that was reasonably likely to have a material adverse effect on our liquidity position.
The liquidity of the Company is primarily dependent on the payment of cash dividends by its subsidiary, Center Bank, subject to limitations imposed by the laws of the State of California.
As part of the Company’s liquidity management, the Company utilizes FHLB borrowings to supplement our deposit source of funds. Therefore, there could be fluctuations in these balances depending on the short-term liquidity and longer-term financing need of the Company. The Company’s primary sources of liquidity are derived from financing activities, which include customer and broker deposits, federal funds facilities, and advances from the Federal Home Loan Bank of San Francisco.
Because the Company’s primary sources and uses of funds are deposits and loans, respectively, the relationship between net loans and total deposits provides one measure of the Company’s liquidity. Typically, if the ratio is over 100%, the Company relies more on borrowings, wholesale deposits and repayments from the loan portfolio to provide liquidity. Alternative sources of funds such as FHLB advances and brokered deposits and other collateralized borrowings provide liquidity as needed from liability sources are an important part of the Company’s asset liability management strategy.
| At December 31, 2010 | At December 31, 2009 | |||||||
| (Dollars in thousands) | ||||||||
| Net loans |
$ | 1,592,163 | $ | 1,479,142 | ||||
| Deposits |
$ | 1,770,994 | $ | 1,747,671 | ||||
| Net loan to deposit ratio |
89.9 | % | 84.6 | % | ||||
As of December 31, 2010, the Company’s liquidity ratio, which is the ratio of available liquid funds to net deposits and short term liabilities, was 18.5%, compared to 23.5% at December 31, 2009. The Company’s liquidity ratio decreased as a result of decrease in short-term marketable assets offset by the increase in net deposits and short-term liabilities during 2010. Total available liquidity as of December 31, 2010 and 2009 was $335.6 million and $411.6 million, respectively, mainly consisting of cash holdings or balances in due from banks, overnight fed funds sold, money market funds and unpledged available-for-sale securities.
The Company’s net non-core fund dependence ratio was 28.11% under applicable regulatory guidelines, which assumes all certificates of deposit over $100,000 (“Jumbo CD’s”) as volatile sources of funds. The Company has identified approximately $205 million of Jumbo CD’s as stable and core sources of funds based on past historical analysis. The net non-core fund dependence ratio was 17.20% at December 31, 2010 assuming this $205 million is stable and core fund sources and certain portions of money market account as volatile. The net non-core fund dependence ratio is the ratio of net short-term investments less non-core liabilities divided by long-term assets. All of the ratios were in compliance with internal guidelines as of and for the year ended December 31, 2010.
At December 31, 2010, the Company had available $35 million in federal funds lines, $239.3 million FHLB borrowings, and $111.5 million with FRB totaling $385.7 million of available funding sources. This does not include the Company’s ability to purchase wholesale brokered deposits. Additionally, $70.8 million in investment securities may be pledged as collateral for repurchase agreements and other credit facilities. The Company’s application for the Borrower In Custody arrangement was approved by the Federal Reserve Bank of San Francisco in January 2009. Collateral held in such an arrangement may be used to
69
Table of Contents
secure advances and/or credit for the discount window program and will provide the Company with additional source of liquidity. The following table presents the details of available liquidity at December 31, 2010.
| FHLB | Fed Funds Facility |
FRB | Total | |||||||||||||
| (Dollars in thousands) | ||||||||||||||||
| Total capacity |
$ | 405,760 | $ | 35,000 | $ | 111,456 | $ | 552,216 | ||||||||
| Used |
(166,477 | ) | — | — | (166,477 | ) | ||||||||||
| Available |
$ | 239,283 | $ | 35,000 | $ | 111,456 | $ | 385,739 | ||||||||
Capital Resources
Shareholders’ equity as of December 31, 2010 was $274.0 million, compared to $256.1 million as of December 31, 2009. The increase in capital primarily resulted from the net consolidated income for the year offset by dividends on the preferred stock issued under the TARP Capital Purchase Program.
The Company entered into Securities Purchase Agreements with a limited number of institutional and other accredited investors, including insiders, to sell a total of 73,500 shares of mandatorily convertible non-cumulative non-voting perpetual preferred stock, series B, without par value (the “Series B Preferred Stock”) at a price of $1,000 per share, for an aggregate gross purchase price of $73.5 million. This private placement closed on December 31, 2009, and the Company issued an aggregate of 73,500 shares of Series B Preferred Stock upon its receipt of consideration in cash. The Series B Preferred Stock converted into 19,599,981 shares of common stock effective March 29, 2010, following shareholder approval of such conversion. The conversion ratio was equal to the quotient obtained by dividing the $1,000 per share purchase price by the conversion price of $3.75. The shares issued in this private placement were registered on a Form S-3 Registration Statement, as amended, which became effective April 8, 2010, thus removing the restrictions on resale.
The conversion price of $3.75 per share was less than the fair value of $5.23 per share of our common stock on December 29, 2009, the commitment date for the issuance of the Series B Preferred Stock. The Series B Preferred Stock was thus issued with a beneficial conversion feature with an intrinsic value of $1.48 per share or at a discount of $29,007,972. On the effective date of the conversion, the unamortized discount due to the beneficial conversion feature was immediately recognized as a dividend and accounted for as a charge to retained earnings and a reduction of net income available to common shareholders in the earnings per share computation.
The Company also issued 3,360,000 shares of common stock in a private placement which closed on November 30, 2009 (the “November Private Placement”), at a price per share of $3.71 to non-affiliated investors and $4.69 to certain directors and employees of the Company. The difference in the purchase price was necessary to comply with NASDAQ Listing Rule 5635(c). The Company obtained shareholder approval of the November Private Placement at a special meeting held on March 24, 2010 so that all investors in the November Private Placement could be treated equally. Following receipt of shareholder approval, 85,045 additional shares were issued to the directors and employees who invested in the November Private Placement, in order to effectuate this result. The shares issued in the November Private Placement were registered on a Form S-3 Registration Statement which became effective April 8, 2010, thus removing the restrictions on resale.
As part of the TARP Capital Purchase Program, the Company entered into a purchase agreement with the U.S. Treasury Department on December 12, 2008, pursuant to which the Company issued and sold 55,000 shares of fixed-rate cumulative perpetual preferred stock for a purchase price of $55 million and 10-year warrants to purchase 864,780 shares of the Company’s common stock at an exercise price of $9.54 per share. The Company will pay the U.S. Treasury Department a five percent dividend annually for each of the first five years of the investment and a nine percent dividend thereafter until the shares are redeemed. As a result of “qualified equity offerings” (as defined in the Securities Purchase Agreement with the U.S. Treasury Department) in the fourth quarter of 2009 aggregating in excess of $55.0 million (specifically $86.3 million) in gross proceeds, the number of common shares underlying the warrant was reduced to 432,290.
The Company issued trust preferred securities of $18 million in 2004 through its wholly owned subsidiary, Center Capital Trust I. On March 1, 2005, the Federal Reserve Board adopted a final rule that allows the continued inclusion of trust preferred securities in the Tier 1 capital of bank holding companies. However, under the final rule, after a five-year transition period, the aggregate amount of trust preferred securities and certain other capital elements that represent Tier 1 capital would be limited to 25 percent of Tier 1 capital elements. In addition, since the Company had less than $15 billion in assets at December 31, 2009, under the Dodd-Frank Act, the Company will be able to continue to include its existing trust preferred securities in Tier 1 capital to the extent permitted by FRB guidelines. Trust preferred securities currently make up 6.2% of the Company’s Tier 1 capital. Shareholders’ equity is also affected by increases and decreases in unrealized losses on securities classified as available-for-sale and share-based compensation expense.
70
Table of Contents
The Company is committed to maintaining capital at a level sufficient to assure shareholders, customers and regulators that the Company is financially sound and able to support its growth from its retained earnings. From October 2003 to January 2009 Center Financial paid quarterly cash dividends to its shareholders. In accordance with this policy, the Company paid quarterly cash dividends of 5 cents per share in 2008, for a total of $3.3 million.
On March 25, 2009, the Company’s board of directors suspended its quarterly cash dividends based on adverse economic conditions and reduction in earnings of the Company. The Company has determined that this is a prudent, safe and sound practice to preserve capital. The Company would be required to obtain the U.S. Treasury Department’s approval to reestablish common stock dividend in the future until it has redeemed the preferred stock issued under TARP CPP. The Company is also required to obtain prior approval of the FRB to pay dividends pursuant to its MOU with the FRB (see “Item 1—Business—Informal Regulatory Agreements” and “Item 5—Market for Common Equity, Related Shareholder Matters and Issuer Purchases of Equity Securities” above).
The Company is subject to risk-based capital guidelines adopted by the federal banking regulators. These guidelines are used to evaluate capital adequacy and are based on an institution’s asset risk profile and off-balance sheet exposures. The risk-based capital guidelines assign risk weightings to assets both on and off-balance sheet and place increased emphasis on common equity. According to the regulations, institutions whose Tier 1 risk based capital ratio, total risk based capital ratio and leverage ratio meet or exceed 6%, 10% and 5%, respectively, are deemed to be “well-capitalized.” As of December 31, 2010 and 2009, all of the Company’s capital ratios were above the minimum regulatory requirements for a “well-capitalized” institution.
The MOU the Bank has entered into with the FDIC and the DFI requires the Bank to maintain a minimum Tier 1 leverage capital ratio of not less than 9% and a total risk-based capital ratio of not less than 13%. The Bank’s regulatory capital ratios as of December 31, 2010 exceeded these requirements.
The following table compares Center Financial’s and the Bank’s actual capital ratios at December 31, 2010 and 2009, to those required by regulatory agencies for capital adequacy and well-capitalized classification purposes:
Risk Based Ratios
| Center Financial |
Center Bank |
Minimum Regulatory Requirements |
Well Capitalized Requirements |
|||||||||||||
| 2010 |
||||||||||||||||
| Total Capital (to Risk-Weighted Assets) |
18.87 | % | 18.53 | % | 8.00 | % | 10.00 | % | ||||||||
| Tier 1 Capital (to Risk-Weighted Assets) |
17.60 | % | 17.26 | % | 4.00 | % | 6.00 | % | ||||||||
| Tier 1 Capital (to Average Assets) |
12.74 | % | 12.50 | % | 4.00 | % | 5.00 | % | ||||||||
| Center Financial |
Center Bank |
Minimum Regulatory Requirements |
Well Capitalized Requirements |
|||||||||||||
| 2009 |
||||||||||||||||
| Total Capital (to Risk-Weighted Assets) |
17.77 | % | 17.22 | % | 8.00 | % | 10.00 | % | ||||||||
| Tier 1 Capital (to Risk-Weighted Assets) |
16.50 | % | 15.94 | % | 4.00 | % | 6.00 | % | ||||||||
| Tier 1 Capital (to Average Assets) |
12.40 | % | 12.00 | % | 4.00 | % | 5.00 | % | ||||||||
ITEM 7A. QUANTITATIVE AND QUALITATIVE DISCLOSURES ABOUT MARKET RISK
The information concerning quantitative and qualitative disclosures about market risk called for by Item 305 of Regulation S-K is included as part of Item 7 above. See “Management’s Discussion and Analysis of Financial Condition and Results of Operations—Market Risk”, “Asset Liability Management”, “Interest Rate Risk” and “Interest Rate Sensitivity”.
71
Table of Contents
ITEM 8. FINANCIAL STATEMENTS AND SUPPLEMENTARY DATA
The following financial statements and independent registered public accounting firms’ reports are included herein:
| Page | ||||
| 73 | ||||
| 74 | ||||
| 75 | ||||
| 76 | ||||
| Consolidated Statement of Shareholders’ Equity and Comprehensive Income (Loss) |
77 | |||
| 79 | ||||
| 81 | ||||
72
Table of Contents
REPORT OF INDEPENDENT REGISTERED PUBLIC ACCOUNTING FIRM
The Board of Directors and Shareholders
Center Financial Corporation:
We have audited the accompanying consolidated statement of financial condition of Center Financial Corporation and subsidiaries as of December 31, 2010, and the related consolidated statements of operations, shareholders’ equity and comprehensive income (loss), and cash flows for the year then ended. These consolidated financial statements are the responsibility of Center Financial Corporation’s management. Our responsibility is to express an opinion on these consolidated financial statements based on our audit.
We conducted our audit in accordance with the standards of the Public Company Accounting Oversight Board (United States). Those standards require that we plan and perform the audit to obtain reasonable assurance about whether the financial statements are free of material misstatement. An audit includes examining, on a test basis, evidence supporting the amounts and disclosures in the financial statements. An audit also includes assessing the accounting principles used and significant estimates made by management, as well as evaluating the overall financial statement presentation. We believe that our audit provides a reasonable basis for our opinion.
In our opinion, the consolidated financial statements referred to above present fairly, in all material respects, the financial position of Center Financial Corporation and subsidiaries as of December 31, 2010, and the results of their operations and their cash flows for the year then ended, in conformity with U.S. generally accepted accounting principles.
We also have audited, in accordance with the standards of the Public Company Accounting Oversight Board (United States), Center Financial Corporation’s internal control over financial reporting as of December 31, 2010, based on criteria established in the Internal Control-Integrated Framework issued by the Committee of Sponsoring Organizations of the Treadway Commission (COSO), and our report dated March 3, 2011 expressed an unqualified opinion on the effectiveness of Center Financial Corporation’s internal control over financial reporting.
/s/ KPMG LLP
Los Angeles, California
March 3, 2011
73
Table of Contents
REPORT OF INDEPENDENT REGISTERED PUBLIC ACCOUNTING FIRM
Board of Directors and Shareholders
Center Financial Corporation
We have audited the accompanying consolidated statement of financial condition of Center Financial Corporation (a California corporation) and subsidiaries as of December 31, 2009, and the related consolidated statements of operations, shareholders’ equity and comprehensive income (loss), and cash flows for each of the two years in the period ended December 31, 2009. These financial statements are the responsibility of the Company’s management. Our responsibility is to express an opinion on these financial statements based on our audits.
We conducted our audits in accordance with the standards of the Public Company Accounting Oversight Board (United States). Those standards require that we plan and perform the audit to obtain reasonable assurance about whether the financial statements are free of material misstatement. An audit includes examining, on a test basis, evidence supporting the amounts and disclosures in the financial statements. An audit also includes assessing the accounting principles used and significant estimates made by management, as well as evaluating the overall financial statement presentation. We believe that our audits provide a reasonable basis for our opinion.
In our opinion, the consolidated financial statements referred to above present fairly, in all material respects, the financial position of Center Financial Corporation as of December 31, 2009, and the results of its operations and its cash flows for each of the two years in the period ended December 31, 2009 in conformity with accounting principles generally accepted in the United States of America.
/s/ GRANT THORNTON LLP
Los Angeles, California
March 12, 2010
74
Table of Contents
CONSOLIDATED STATEMENTS OF FINANCIAL CONDITION
| December 31, | ||||||||
| 2010 | 2009 | |||||||
| (Dollars in thousands) | ||||||||
| ASSETS |
| |||||||
| Cash and due from banks |
$ | 29,237 | $ | 34,294 | ||||
| Federal funds sold |
136,180 | 145,810 | ||||||
| Money market funds and interest-bearing deposits in other banks |
93,503 | 52,698 | ||||||
| Cash and cash equivalents |
258,920 | 232,802 | ||||||
| Securities available for sale, at fair value |
289,551 | 370,427 | ||||||
| Non-covered loans held for sale, at the lower of cost or fair value |
60,234 | 23,318 | ||||||
| Federal Home Loan Bank and Pacific Coast Bankers Bank stock, at cost |
15,019 | 15,673 | ||||||
| Non-covered loans, net of allowance for loan losses of $52,047 as of December 31, 2010 and $58,543 as of December 31, 2009 |
1,415,646 | 1,455,824 | ||||||
| Covered loans |
116,283 | — | ||||||
| Premises and equipment, net |
13,532 | 13,368 | ||||||
| Core deposit intangibles, net |
464 | — | ||||||
| Customers’ liability on acceptances |
2,287 | 2,341 | ||||||
| Non-covered other real estate owned, net |
937 | 4,278 | ||||||
| Covered other real estate owned, net |
1,459 | — | ||||||
| Accrued interest receivable |
5,509 | 6,879 | ||||||
| Deferred income taxes, net |
14,383 | 11,551 | ||||||
| Investments in affordable housing partnerships |
10,824 | 11,522 | ||||||
| Cash surrender value of life insurance |
12,791 | 12,392 | ||||||
| Income tax receivable |
14,277 | 16,140 | ||||||
| Prepaid regulatory assessment fees |
7,864 | 11,483 | ||||||
| FDIC loss share receivable |
23,991 | — | ||||||
| Other assets |
6,308 | 4,802 | ||||||
| Total |
$ | 2,270,279 | $ | 2,192,800 | ||||
| LIABILITIES AND SHAREHOLDERS’ EQUITY |
||||||||
| Liabilities |
||||||||
| Deposits: |
||||||||
| Noninterest-bearing |
$ | 396,973 | $ | 352,395 | ||||
| Interest-bearing |
1,374,021 | 1,395,276 | ||||||
| Total deposits |
1,770,994 | 1,747,671 | ||||||
| Acceptances outstanding |
2,287 | 2,341 | ||||||
| Accrued interest payable |
5,113 | 5,803 | ||||||
| Other borrowed funds |
188,670 | 148,443 | ||||||
| Long-term subordinated debentures |
18,557 | 18,557 | ||||||
| Accrued expenses and other liabilities |
10,646 | 13,927 | ||||||
| Total liabilities |
1,996,267 | 1,936,742 | ||||||
| Commitments and Contingencies |
— | — | ||||||
| Shareholders’ Equity |
||||||||
| Preferred stock, no par value, 10,000,000 shares authorized; issued and outstanding, 55,000 shares and 128,500 shares as of December 31, 2010 and 2009, respectively |
||||||||
| Series A, cumulative, issued and outstanding 55,000 shares as of December 31, 2010 and 2009 |
53,409 | 53,171 | ||||||
| Series B, non-cumulative, convertible, issued and outstanding none and 73,500 shares as of December 31, 2010 and 2009, respectively |
— | 70,000 | ||||||
| Common stock, no par value; 100,000,000 and 40,000,000 shares authorized; issued and outstanding, 39,914,686 shares and 20,160,726 shares (including 76,809 shares and 10,050 shares of unvested restricted stock) as of December 31, 2010 and 2009, respectively |
187,754 | 88,060 | ||||||
| Retained earnings |
32,000 | 41,314 | ||||||
| Accumulated other comprehensive income, net of tax |
849 | 3,513 | ||||||
| Total shareholders’ equity |
274,012 | 256,058 | ||||||
| Total |
$ | 2,270,279 | $ | 2,192,800 | ||||
See accompanying notes to consolidated financial statements.
75
Table of Contents
CONSOLIDATED STATEMENTS OF OPERATIONS
| For the year ended December 31, |
||||||||||||
| 2010 | 2009 | 2008 | ||||||||||
| (Dollars in thousands, except per share data) |
||||||||||||
| Interest and Dividend Income: |
||||||||||||
| Interest and fees on loans |
$ | 86,408 | $ | 93,559 | $ | 122,424 | ||||||
| Interest on federal funds sold |
414 | 418 | 105 | |||||||||
| Interest on taxable investment securities |
8,939 | 9,721 | 7,746 | |||||||||
| Interest on tax-advantaged investment securities |
— | 12 | 205 | |||||||||
| Dividends on equity stock |
55 | 37 | 610 | |||||||||
| Money market funds and interest-earning deposits |
15 | 64 | 117 | |||||||||
| Total interest and dividend income |
95,831 | 103,811 | 131,207 | |||||||||
| Interest Expense: |
||||||||||||
| Interest on deposits |
20,612 | 34,935 | 46,126 | |||||||||
| Interest expense on long-term subordinated debentures |
583 | 674 | 1,187 | |||||||||
| Interest on borrowed funds |
6,698 | 6,975 | 9,294 | |||||||||
| Total Interest expense |
27,893 | 42,584 | 56,607 | |||||||||
| Net interest income before provision for loan losses |
67,938 | 61,227 | 74,600 | |||||||||
| Provision for loan losses |
22,010 | 77,472 | 26,178 | |||||||||
| Net interest income (loss) after provision for loan losses |
45,928 | (16,245 | ) | 48,422 | ||||||||
| Noninterest Income: |
||||||||||||
| Customer service fees |
8,108 | 8,013 | 7,658 | |||||||||
| Fee income from trade finance transactions |
2,812 | 2,266 | 2,520 | |||||||||
| Wire transfer fees |
1,268 | 1,120 | 1,153 | |||||||||
| Gain on sale of loans |
1,361 | — | 1,017 | |||||||||
| Net gain on sale of securities available for sale |
2,209 | — | — | |||||||||
| Loan service fees |
1,625 | 814 | 1,357 | |||||||||
| Impairment loss on securities available for sale |
— | — | (9,889 | ) | ||||||||
| Gain on business acquisition |
5,900 | — | — | |||||||||
| Increase in FDIC loss share receivable |
1,110 | — | — | |||||||||
| Other income |
1,695 | 1,766 | 1,671 | |||||||||
| Total noninterest income |
26,088 | 13,979 | 5,487 | |||||||||
| Noninterest Expense: |
||||||||||||
| Salaries and employee benefits |
18,726 | 17,804 | 23,726 | |||||||||
| Occupancy |
5,392 | 4,876 | 4,480 | |||||||||
| Furniture, fixtures, and equipment |
2,575 | 2,410 | 2,103 | |||||||||
| Data processing |
2,680 | 2,280 | 2,169 | |||||||||
| Legal fees |
1,481 | 1,087 | 2,203 | |||||||||
| Accounting and other professional service fees |
1,514 | 1,629 | 1,362 | |||||||||
| Business promotion and advertising |
1,515 | 1,426 | 1,900 | |||||||||
| Supplies and communications |
1,578 | 1,557 | 2,106 | |||||||||
| Security service |
1,133 | 1,038 | 1,131 | |||||||||
| Regulatory assessment |
4,129 | 3,435 | 1,265 | |||||||||
| KEIC litigation settlement |
— | — | 7,522 | |||||||||
| Impairment of goodwill and intangible asset |
— | 1,413 | — | |||||||||
| Merger related expenses |
846 | — | — | |||||||||
| Net OREO related expenses |
1,970 | 1,910 | — | |||||||||
| Other operating expenses |
4,478 | 5,205 | 5,369 | |||||||||
| Total noninterest expense |
48,017 | 46,070 | 55,336 | |||||||||
| Income (loss) before income tax provision (benefit) |
23,999 | (48,336 | ) | (1,427 | ) | |||||||
| Income tax provision (benefit) |
1,316 | (5,834 | ) | (1,647 | ) | |||||||
| Net income (loss) |
22,683 | (42,502 | ) | 220 | ||||||||
| Preferred stock dividends and accretion of preferred stock discount |
(31,996 | ) | (2,954 | ) | (155 | ) | ||||||
| Net income (loss) available to common shareholders |
$ | (9,313 | ) | $ | (45,456 | ) | $ | 65 | ||||
| Earnings (loss) per common share: |
||||||||||||
| Basic |
$ | (0.26 | ) | $ | (2.66 | ) | $ | — | ||||
| Diluted |
(0.26 | ) | (2.66 | ) | — | |||||||
See accompanying notes to consolidated financial statements.
76
Table of Contents
CONSOLIDATED STATEMENT OF SHAREHOLDERS’ EQUITY
AND COMPREHENSIVE INCOME (LOSS)
YEARS ENDED DECEMBER 31, 2010, 2009, AND 2008
| Common Stock | Accumulated | |||||||||||||||||||||||||||
| Preferred Stock |
Number of Shares |
Amount | Common Stock Warrants |
Retained Earnings |
Other Comprehensive Income (Loss) |
Total Shareholders’ Equity |
||||||||||||||||||||||
| (Dollars and Share Numbers in thousands) | ||||||||||||||||||||||||||||
| BALANCE, JANUARY 1, 2008 |
$ | — | 16,367 | $ | 67,006 | $ | — | $ | 89,096 | $ | (94 | ) | $ | 156,008 | ||||||||||||||
| Comprehensive income |
||||||||||||||||||||||||||||
| Net income |
— | — | — | — | 220 | — | 220 | |||||||||||||||||||||
| Other comprehensive income, net of tax |
||||||||||||||||||||||||||||
| Change in unrealized gain on securities available for sale |
— | — | — | — | — | 1,602 | 1,602 | |||||||||||||||||||||
| Total Comprehensive income |
1,822 | |||||||||||||||||||||||||||
| Issuance of preferred stock (55,000 shares) |
52,949 | — | — | — | — | — | 52,949 | |||||||||||||||||||||
| Issuance of common stock warrants |
— | — | — | 2,051 | — | — | 2,051 | |||||||||||||||||||||
| Accretion of preferred stock discount |
10 | — | — | — | (10 | ) | — | — | ||||||||||||||||||||
| Common stock issued |
— | 415 | 4,000 | — | — | — | 4,000 | |||||||||||||||||||||
| Stock options exercised |
— | 4 | 22 | — | — | — | 22 | |||||||||||||||||||||
| Restricted stock, net of forfeitures |
— | 3 | 29 | — | — | — | 29 | |||||||||||||||||||||
| Share-based compensation |
— | — | 1,146 | — | — | — | 1,146 | |||||||||||||||||||||
| Cash dividends: |
||||||||||||||||||||||||||||
| Preferred stock (5% per share) |
— | — | — | — | (145 | ) | — | (145 | ) | |||||||||||||||||||
| Common stock ($0.20 per share) |
— | — | — | — | (3,315 | ) | — | (3,315 | ) | |||||||||||||||||||
| BALANCE, DECEMBER 31, 2008 |
$ | 52,959 | 16,789 | $ | 72,203 | $ | 2,051 | $ | 85,846 | $ | 1,508 | $ | 214,567 | |||||||||||||||
| Comprehensive loss |
||||||||||||||||||||||||||||
| Net loss |
$ | — | — | $ | — | $ | — | $ | (42,502 | ) | $ | — | $ | (42,502 | ) | |||||||||||||
| Other comprehensive loss, net of tax |
||||||||||||||||||||||||||||
| Change in unrealized gain on securities available for sale |
— | — | — | — | 922 | 2,005 | 2,927 | |||||||||||||||||||||
| Total Comprehensive loss |
— | — | — | — | — | — | (39,575 | ) | ||||||||||||||||||||
| Issuance of preferred stock, Series B (73,500 shares) |
70,000 | — | — | — | — | — | 70,000 | |||||||||||||||||||||
| Accretion of preferred stock discount |
212 | — | — | — | (212 | ) | — | — | ||||||||||||||||||||
| Common stock issued |
— | 3,360 | 12,781 | — | — | — | 12,781 | |||||||||||||||||||||
| Stock options exercised |
— | 13 | 47 | — | — | — | 47 | |||||||||||||||||||||
| Restricted stock, net of forfeitures |
— | (1 | ) | 19 | — | — | — | 19 | ||||||||||||||||||||
| Share-based compensation |
— | — | 959 | — | — | — | 959 | |||||||||||||||||||||
| Cash dividends: |
||||||||||||||||||||||||||||
| Preferred stock, Series A (5% per share) |
— | — | — | — | (2,740 | ) | — | (2,740 | ) | |||||||||||||||||||
| Common stock |
— | — | — | — | — | — | — | |||||||||||||||||||||
| BALANCE, DECEMBER 31, 2009 |
$ | 123,171 | 20,161 | $ | 86,009 | $ | 2,051 | $ | 41,314 | $ | 3,513 | $ | 256,058 | |||||||||||||||
| Comprehensive income |
||||||||||||||||||||||||||||
| Net income |
$ | — | — | $ | — | $ | — | $ | 22,683 | $ | — | $ | 22,683 | |||||||||||||||
| Other comprehensive income, net of tax |
||||||||||||||||||||||||||||
| Change in unrealized loss on securities available for sale |
— | — | — | — | — | (2,664 | ) | (2,664 | ) | |||||||||||||||||||
| Total Comprehensive income |
— | — | — | — | — | — | 20,019 | |||||||||||||||||||||
| Accretion of preferred stock discount |
238 | — | 29,008 | — | (29,246 | ) | — | — | ||||||||||||||||||||
| Restricted stock, net of forfeitures |
— | 69 | 99 | — | — | — | 99 | |||||||||||||||||||||
| Share-based compensation |
— | — | 587 | — | — | — | 587 | |||||||||||||||||||||
| Common stock issuance |
— | 19,685 | — | — | ||||||||||||||||||||||||
| Preferred stock, Series B conversion |
(70,000 | ) | — | 70,000 | — | — | — | — | ||||||||||||||||||||
| Cash dividends: |
||||||||||||||||||||||||||||
| Preferred stock, Series A (5% per share) |
— | — | — | — | (2,751 | ) | — | (2,751 | ) | |||||||||||||||||||
| Common stock |
— | — | — | — | — | — | — | |||||||||||||||||||||
| BALANCE, DECEMBER 31, 2010 |
$ | 53,409 | 39,915 | $ | 185,703 | $ | 2,051 | $ | 32,000 | $ | 849 | $ | 274,012 | |||||||||||||||
(Continued)
See accompanying notes to consolidated financial statements.
77
Table of Contents
CENTER FINANCIAL CORPORATION
CONSOLIDATED STATEMENT OF SHAREHOLDERS’ EQUITY
AND COMPREHENSIVE INCOME (LOSS)—(Continued)
YEAR ENDED DECEMBER 31,
| 2010 | 2009 | 2008 | ||||||||||
| (Dollars in thousands) | ||||||||||||
| Disclosures of reclassification amounts for the years ended December 31, |
||||||||||||
| Unrealized holding (loss) gain arising during period, net of tax (benefit) expenses of ($1,435) in 2010, $798 in 2009, and $1,160 in 2008 |
$ | (2,664 | ) | $ | 2,005 | $ | 1,602 | |||||
| Less reclassification adjustment for amounts included in net loss, net of tax expense of $0 in 2010, $669 in 2009, and $0 in 2008 |
— | 922 | — | |||||||||
| Net change in unrealized (loss) gain on securities available for sale, net of tax (benefit) expense of ($1,435) in 2010, $1,467 in 2009, and $1,160 in 2008 |
$ | (2,664 | ) | $ | 2,927 | $ | 1,602 | |||||
(Concluded)
See accompanying notes to consolidated financial statements.
78
Table of Contents
CONSOLIDATED STATEMENTS OF CASH FLOWS
YEAR ENDED DECEMBER 31,
| 2010 | 2009 | 2008 | ||||||||||
| (Dollars in thousands) | ||||||||||||
| Cash flows from operating activities: |
||||||||||||
| Net income (loss) |
$ | 22,683 | $ | (42,502 | ) | $ | 220 | |||||
| Adjustments to reconcile net income (loss) to net cash provided by (used in) operating activities: |
||||||||||||
| Compensation expenses related to stock options and restricted stocks |
686 | 978 | 1,175 | |||||||||
| Depreciation and amortization |
6,866 | 4,117 | 3,539 | |||||||||
| Amortization of deferred fees and accretion of discount |
(6,361 | ) | (738 | ) | (1,406 | ) | ||||||
| Amortization of premium, net of accretion of discount, on securities available for sale and held to maturity |
2,168 | 767 | 35 | |||||||||
| Provision for loan losses |
22,010 | 77,472 | 26,178 | |||||||||
| Gain on business acquisition |
(5,900 | ) | — | — | ||||||||
| Impairment loss on securities available for sale |
— | — | 9,889 | |||||||||
| Common stock issued for legal settlement |
— | — | 4,000 | |||||||||
| Net loss on sale of premises and equipment |
— | 8 | — | |||||||||
| Net (gain) loss on sale of securities available for sale |
(2,209 | ) | 55 | — | ||||||||
| Net increase in loans held for sale |
(77,907 | ) | (13,454 | ) | (11,198 | ) | ||||||
| Gain on sale of loans |
(1,361 | ) | — | (1,017 | ) | |||||||
| Proceeds from sale of loans |
42,352 | — | 43,843 | |||||||||
| Net loss (gain) on sale of non-covered OREO |
(44 | ) | — | (137 | ) | |||||||
| Valuation adjustment on non-covered OREO |
1,432 | — | — | |||||||||
| Deferred tax (benefit) expense provision |
(1,398 | ) | 6,912 | (7,874 | ) | |||||||
| Federal Home Loan Bank stock dividend |
— | — | (775 | ) | ||||||||
| Decrease in accrued interest receivable |
1,370 | 598 | 1,409 | |||||||||
| Net increase in cash surrender value of life insurance policy |
(399 | ) | (400 | ) | (409 | ) | ||||||
| Decrease (increase) in income tax receivable |
1,863 | (13,813 | ) | (2,327 | ) | |||||||
| Decrease (increase) in prepaid assessment |
— | (11,483 | ) | — | ||||||||
| Increase in other assets |
(2,355 | ) | (6,559 | ) | (3,031 | ) | ||||||
| Decrease in accrued interest payable |
(2,482 | ) | (1,465 | ) | (5,945 | ) | ||||||
| (Decrease) increase in accrued expenses and other liabilities |
(3,336 | ) | (2,764 | ) | 3,927 | |||||||
| Net cash provided by (used in) operating activities |
(2,322 | ) | (2,271 | ) | 60,096 | |||||||
| Cash flows from investing activities: |
||||||||||||
| Purchase of securities available for sale |
(154,739 | ) | (268,964 | ) | (98,826 | ) | ||||||
| Proceeds from principal repayment, maturity or call of available-for-sale securities |
183,720 | 79,774 | 43,082 | |||||||||
| Proceeds from sale of securities available for sale |
59,745 | 4,954 | 3,537 | |||||||||
| Proceeds from matured, called or principal repayment on securities held to maturity |
— | — | 2,062 | |||||||||
| Net decrease in investment in Federal Home Loan Bank and other equity stock |
1,872 | — | 321 | |||||||||
| Net (increase) decrease in non-covered loans |
(29,853 | ) | 105,986 | 27,637 | ||||||||
| Net decrease in covered loans |
13,263 | — | — | |||||||||
| Proceeds from sale of loans acquired for investment |
39,620 | 30,201 | 23,606 | |||||||||
| Proceeds from recoveries of loans previously charged off |
5,151 | 731 | 406 | |||||||||
| Proceeds from FDIC loss share receivable |
2,419 | — | — | |||||||||
| Net increase in premises and equipment |
(2,289 | ) | (838 | ) | (3,202 | ) | ||||||
| Proceeds from sale of non-covered OREO |
6,412 | 6,000 | 2,383 | |||||||||
| Proceeds from sale of covered OREO |
2,155 | — | — | |||||||||
| Net cash acquired from business combination, inclusive of settlement received from FDIC |
71,505 | — | — | |||||||||
| Net increase in investments in affordable housing partnerships |
— | — | (2,147 | ) | ||||||||
| Net cash provided by (used in) investing activities |
198,981 | (42,156 | ) | (1,141 | ) | |||||||
(Continued)
See accompanying notes to consolidated financial statements.
79
Table of Contents
CENTER FINANCIAL CORPORATION
CONSOLIDATED STATEMENTS OF CASH FLOWS—(Continued)
YEAR ENDED DECEMBER 31,
| 2010 | 2009 | 2008 | ||||||||||
| (Dollars in thousands) | ||||||||||||
| Cash flows from financing activities: |
||||||||||||
| Net (decrease) increase in deposits |
(185,985 | ) | 144,151 | 25,845 | ||||||||
| Net increase (decrease) in other borrowed funds |
18,195 | (44,578 | ) | (106,585 | ) | |||||||
| Net proceeds from issuance of preferred stock |
— | 70,000 | 55,000 | |||||||||
| Proceeds from issuance of common stock |
— | 12,781 | — | |||||||||
| Proceeds from stock options exercised |
— | 47 | 22 | |||||||||
| Payment of cash dividend |
(2,751 | ) | (3,383 | ) | (3,315 | ) | ||||||
| Purchases of common stock |
— | — | — | |||||||||
| Net cash (used in) provided by financing activities |
(170,541 | ) | 179,018 | (29,033 | ) | |||||||
| Net increase in cash and cash equivalents |
26,118 | 134,591 | 29,922 | |||||||||
| Cash and cash equivalents, beginning of the year |
232,802 | 98,211 | 68,289 | |||||||||
| Cash and cash equivalents, end of the year |
$ | 258,920 | $ | 232,802 | $ | 98,211 | ||||||
| Supplemental disclosure of cash flow information: |
||||||||||||
| Interest paid |
$ | 31,022 | $ | 44,049 | $ | 62,552 | ||||||
| Income taxes paid, net of refunds |
1,048 | 3,461 | 8,350 | |||||||||
| Supplemental schedule of noncash investing, operating, and financing activities: |
||||||||||||
| Cash dividend accrual for preferred stock |
344 | 344 | 145 | |||||||||
| Cash dividend accrual for common stock |
— | — | 840 | |||||||||
| Accretion of preferred stock discount |
29,246 | 212 | 10 | |||||||||
| Transfer of non-covered loans to non-covered loans held for sale |
26,596 | — | — | |||||||||
| Transfer of non-covered loans to non-covered OREO |
4,560 | 11,978 | 2,246 | |||||||||
| Transfer of covered loans to covered OREO |
1,672 | — | — | |||||||||
| Transfer of investment securities from held-to-maturity to available-for-sale |
— | 4,131 | — | |||||||||
| Conversion of preferred stock to common stock |
70,000 | — | — | |||||||||
| Acquisition: |
||||||||||||
| Assets acquired |
219,797 | — | — | |||||||||
| Liabilities assumed |
234,966 | — | — | |||||||||
(Concluded)
See accompanying notes to consolidated financial statements.
80
Table of Contents
NOTES TO CONSOLIDATED FINANCIAL STATEMENTS
1. THE NATURE OF OPERATIONS
Center Financial Corporation (“Center Financial”) was incorporated on April 19, 2000 and acquired all of the issued and outstanding shares of Center Bank (the “Bank”) in October 2002. Currently, Center Financial’s direct subsidiaries include the Bank and Center Capital Trust I. Center Financial exists primarily for the purpose of holding the stock of the Bank and of other subsidiaries. Center Financial and the Bank are collectively referred to herein as the “Company.”
The Bank is a California state-chartered and Federal Deposit Insurance Corporation (“FDIC”) insured financial institution, which was incorporated in 1985 and commenced operations in March 1986. The Bank changed its name from California Center Bank to Center Bank in December 2002. The Bank’s headquarters are located at 3435 Wilshire Boulevard, Suite 700, Los Angeles, California 90010. The Bank provides comprehensive financial services for small to medium sized business owners, primarily in Southern California. The Bank specializes in commercial loans, most of which are secured by real property, to small business customers. In addition, the Bank is a Preferred Lender of Small Business Administration (“SBA”) loans and provides trade finance loans. The Bank’s primary market is the Southern California area, including Los Angeles, Orange, San Bernardino, and San Diego counties, primarily focused in areas with high concentrations of Korean-Americans.
The Bank currently has 22 full-service branch offices, 19 branches of which are located in California. The Bank also operates two Loan Production Offices in Seattle and Denver. In December 2003, Center Financial formed a wholly owned subsidiary, Center Capital Trust I, a Delaware statutory business trust, for the exclusive purpose of issuing and selling trust preferred securities. Center Financial’s principal source of income is generally dividends from the Bank and equity earnings in the Bank. The expenses of Center Financial, including interest on junior subordinated debentures issued to Center Capital Trust I, legal and accounting fees and NASDAQ listing fees have been and will generally be paid by the cash on hand or from dividends paid by the Bank.
As discussed in Note 3, on April 16, 2010, the California Department of Financial Institutions closed Innovative Bank, Oakland, California, and appointed the FDIC as its receiver. On the same date, Center Bank assumed the banking operations of Innovative Bank from the FDIC under a purchase and assumption agreement with loss sharing.
On December 9, 2010, Center Financial and Nara Bancorp, Inc. (“Nara Bancorp”) entered into a definitive agreement to merge. Under the terms of the merger agreement, Center Financial shareholders will receive a fixed ratio of 0.7804 of a share of Nara Bancorp common stock in exchange for each share of Center Financial common stock they own. At the closing date of the merger, Nara Bancorp shareholders will own approximately 55% of the combined company and Center Financial shareholders will own approximately 45%. The combined company will operate under a new name that will be determined prior to the closing. In addition, at the closing or as soon as possible thereafter, it is anticipated that Nara Bank, a California state-chartered bank and a wholly-owned subsidiary of Nara Bancorp, will merge with and into the Bank, with the Bank as the surviving bank after the bank merger.
The boards of directors of both companies have unanimously approved the transaction. The transaction is subject to regulatory approval, the approval of the shareholders of both Center Financial and Nara Bancorp, and other customary closing conditions. The Company anticipates that the regulatory approval process will take several months and, therefore, does not expect to complete the merger before the second half of 2011. There is no assurance, however, that the bank regulators will approve the merger within this time frame, or at all.
Please see the Company’s current report on Form 8-K filed with the Securities and Exchange Commission (the “SEC”) on December 10, 2010 for a more complete description of the merger agreement. In addition, in connection with the proposed merger, Nara Bancorp will file with the SEC a Registration Statement on Form S-4 that will include a Joint Proxy Statement/Prospectus of Center Financial and Nara Bancorp, as well as other relevant documents concerning the proposed transaction. Shareholders are urged to read the Registration Statement and the Joint Proxy Statement/Prospectus regarding the merger when it becomes available and any other relevant documents filed with the SEC, as well as any amendments or supplements to those documents, because they will contain important information.
81
Table of Contents
2. SUMMARY OF SIGNIFICANT ACCOUNTING POLICIES
Basis of Presentation and Consolidation
The consolidated financial statements include the accounts of Center Financial and the Bank. Intercompany transactions and accounts have been eliminated in consolidation. Center Capital Trust I is not consolidated as described in Note 16.
The consolidated financial statements are presented in accordance with U.S. generally accepted accounting principles (“US GAAP”) and general practices within the banking industry.
Significant Group Concentration of Credit Risk
Most of the Company’s activities are with customers located within the greater Los Angeles region. Note 6 discusses the Company’s investment securities and Note 7 discusses the Company’s lending activities.
Use of Estimates
The preparation of consolidated financial statements in conformity with U.S. GAAP requires management to make estimates and assumptions that affect the reported amounts of assets and liabilities and disclosure of contingent assets and liabilities at the date of the consolidated financial statements and the reported amounts of revenues and expenses during the reporting period. Actual results could differ from those estimates. Material estimates subject to change in the near term include, among other items, the allowance for credit losses, investment securities, the carrying value of other real estate owned, the carrying value of intangible assets, the carrying value of the FDIC loss share receivable and the realization of deferred tax assets.
As discussed in Note 3, the acquired assets and assumed liabilities of Innovative Bank in an FDIC-assisted transaction were measured at estimated fair value. Management made significant estimates and exercised significant judgment in estimating fair value and accounting for the acquisition of Innovative Bank.
Cash and Cash Equivalents
Cash and cash equivalents include cash and due from banks, overnight federal funds sold, money market funds, and interest-bearing deposits in other banks, all of which have original maturities of less than 90 days.
The Company is required to maintain minimum reserve balances in cash with the Federal Reserve Bank. The average reserve balance requirement was approximately $9.0 million and $7.8 million during 2010 and 2009, respectively. The Company did not have a restricted balance in its due from banks at December 31, 2010 and 2009, respectively.
Investment Securities Available for Sale
The Company classifies its investment securities according to their purpose and holding period. As of December 31, 2010 and 2009, there were no trading account securities or held-to-maturity securities in the investment portfolio. Securities available for sale are reported at estimated fair value.
The fair values of the investment securities are generally determined by reference to the quoted market prices obtained from independent external brokers or independent external pricing service providers who have experience in valuing these securities.
The Company evaluates its investment securities portfolio, at each reporting date, for indicators of other-than-temporary impairment (“OTTI”). This determination requires significant judgment. The Company assesses whether OTTI has occurred when the fair value of a debt security is less than the amortized cost basis at the balance sheet date. Under these circumstances, OTTI is considered to have occurred (1) if the Company intends to sell the security; (2) if it is more likely than not the Company will be required to sell the security before recovery of its amortized cost basis; or (3) the expected cash flows are not sufficient to recover all contractually required principal and interest payments. Furthermore, securities which fail the criteria above (1 through 3) must be evaluated to determine what portion of the impairment is related to credit or noncredit related OTTI. For securities that the Company does not intend to sell or it is more likely than not to be required to sell, the OTTI is separated into credit and noncredit components. The credit related OTTI, represented by the expected loss in principal, is recognized in noninterest income, while noncredit related OTTI is recognized in other comprehensive income. Noncredit related OTTI results from other factors, including increased liquidity spreads and extension of the security. For securities the Company does expect to sell, entire OTTI is recognized in earnings.
82
Table of Contents
Securities transactions are recognized on the trade date (the date the order to buy or sell is executed). The carrying value plus any related OCI balance of sold securities is used to compute realized gains and losses. Interest and dividends on securities are included in interest income. Amortization of premiums and accretion of discounts on securities are recorded as yield adjustments on such securities using the effective interest method. The specific identification method is used for purposes of determining cost in computing realized gains and losses on investment securities sold.
Federal Home Loan Bank and Other Equity Stock
As a member of the Federal Home Loan Bank (“FHLB”) of San Francisco, the Company is required to own common stock in the FHLB based upon the Company’s balance of residential mortgage loans, mortgage-backed securities, and outstanding advances. The Company’s investment in FHLB stock totaled $15.0 million and $15.6 million as of December 31, 2010 and 2009, respectively. In addition, the Company had invested $60,000 in Pacific Coast Bankers’ Bank stock as of December 31, 2010 and 2009. The instruments are carried at cost in the Consolidated Statements of Financial Condition and are evaluated for impairment.
Non-covered Loans Held for Sale and Servicing Assets
As a result of the Innovative Bank acquisition, we have a class of loans called “covered loans” that are covered by a loss sharing agreement with the FDIC. When we refer to non-covered loans, we are referring to loans not covered by the FDIC loss sharing agreement.
Certain Small Business Administration loans that the Company has the intent to sell prior to maturity are designated as held for sale typically at origination and recorded at the lower of cost or market value, on an aggregate basis. Upon management’s decision, certain loans in the portfolio that were originated for investment may be reclassified to the held for sale category prior to any commitment by the Company to sell the loans. Such decision is usually made to rebalance the loan portfolio and to better manage the Company’s liquidity and capital resources. A valuation allowance is established if the market value of such loans is lower than their cost, and operations are charged or credited for valuation adjustments. A portion of the premium on sale of loans is recognized as other operating income at the time of the sale. The remaining portion of the premium relating to the portion of the loan retained is deferred and amortized over the remaining life of the loan as an adjustment to yield. Servicing assets or liabilities are recorded when loans are sold with servicing retained, based on the present value of the contractually specified servicing fee, net of servicing costs, over the estimated life of the loan, using a discount rate based on the related note rate plus 1% to 2%. Net servicing assets, or servicing assets net of servicing liabilities, are amortized in proportion to and over the period of estimated future servicing income. Management periodically evaluates the net servicing asset for impairment, which is the carrying amount of the net servicing asset in excess of the related fair value. The fair value of servicing assets was determined using a weighted average discount rate of 10 percent and constant prepayment rate of 13.4 percent and 14.7 percent at December 31, 2010 and 2009, respectively. Impairment, if it occurs, is recognized as a write-down in the period of impairment.
Non-covered Loans
Interest on loans is credited to income as earned and is accrued only if deemed collectible. Accrual of interest is discontinued when a loan is over 90 days delinquent or if management believes that collection is highly uncertain. When interest accrual is discontinued, all unpaid accrued interest is reversed against interest income. Generally, payments received on non-accrual loans are recorded as principal reductions. Interest income is recognized after all principal has been repaid or an improvement in the condition of the loan has occurred that would warrant resumption of interest accruals. A loan is returned to accrual status when the borrower has demonstrated a satisfactory payment trend subject to management’s assessment of the borrower’s ability to repay the loan.
Nonrefundable fees, net of certain direct costs associated with the origination of loans, are deferred and recognized as an adjustment of the loan yield over the life of the loan. Other loan fees and charges, representing service costs for the prepayment of loans, delinquent payments, or miscellaneous loan services, are recorded as income when collected.
Covered Loans
Loans acquired in a FDIC-assisted acquisition that are subject to a FDIC shared-loss agreement are referred to as covered loans. Covered loans are reported exclusive of the expected cash flow reimbursements expected from the FDIC. The Company considered most of its acquired loans, except for a small population of cash secured loans and overdrafts, credit impaired loans under the provisions of Accounting Standards Codification (“ASC”) 310-30, Loans and Debt Securities Acquired with Deteriorated Credit Quality, for the Innovative Bank acquisition.
83
Table of Contents
Acquired loans are valued as of acquisition date in accordance with ASC 805, Business Combinations. Loans purchased with evidence of credit deterioration since origination for which it is probable that all contractually required payments will not be collected are accounted for under ASC 310-30.
Under ASC 805 and ASC 310-30, loans are recorded at fair value at acquisition date, factoring in credit losses expected to be incurred over the life of the loan. Accordingly, an allowance for loan losses is not carried over or recorded as of the acquisition date. In accordance with ASC 310-30, acquired loans were aggregated into pools based on individually evaluated common risk characteristics (including whether the loan was currently in nonperforming status) and expected cash flows were estimated on a pool basis. A pool was accounted for as a single unit of account with a single interest rate, cumulative loss rate and cash flow expectation. The Company aggregated all of the loans, with the exception of a small population of loans including cash secured loans and overdrafts, acquired in the FDIC-assisted acquisition of Innovative Bank into seven different pools. A loan will be removed from a pool of loans only if the loan is sold, foreclosed, assets are received in satisfaction of the loan, or the loan is written off, and will be removed from the pool at the carrying value.
The cash flows expected to be received over the life of the pool were estimated by management with the assistance of a third party valuation specialist. These cash flows were utilized in calculating the carrying values of the pools and underlying loans, book yields, effective interest income and impairment, if any, based on actual and projected events. Default rates, loss severity, and prepayment speeds assumptions will be periodically reassessed and updated within the accounting model to update the expectation of future cash flows. The excess of the cash flows expected to be collected over the pool’s carrying value is considered to be the accretable yield and is recognized as interest income over the estimated life of the loan or pool using the effective yield method. The accretable yield will change due to changes in the timing and amounts of expected cash flows, which are affected by changes in assumptions on default rates, loss severity, or prepayment speeds. Changes in the accretable yield will be disclosed quarterly.
The excess of the contractual balances due over the cash flows expected to be collected is considered to be the nonaccretable difference. The nonaccretable difference represents the Company’s estimate of the credit losses expected to occur and was considered in determining the fair value of the loans as of the acquisition date. Subsequent to the acquisition date, any subsequent decreases in expected cash flows over those expected at the purchase date are recognized by recording a provision for loan losses. Any subsequent increases in expected cash flows over those expected at purchase date in excess of fair value are adjusted through the accretable difference on a prospective basis and will reduce post-acquisition allowance, if any, and result in recalculation of the accretable yield amount. Any disposals of loans, including sales of loans, payments in full or foreclosures, result in the removal of the loan from the pool at its carrying amount. The difference between actual prepayments and expected prepayments will not affect the nonaccretable difference.
The covered loan portfolio also includes a small population of loans including cash secured loans and overdrafts which were not accounted for under ASC 310-30. These loans were accounted for under ASC 805 at fair value at the acquisition date with fair value discount or premium being accreted to interest income using the interest method.
Impaired Loans and Allowance for Loan Losses on Non-covered Loans
The Company’s allowance for loan loss methodologies incorporate a variety of risk considerations, both quantitative and qualitative, in establishing an allowance for loan losses that management believes is appropriate at each reporting date. Quantitative factors include the Company’s historical loss experience, delinquency and charge-off trends, collateral values, changes in nonperforming loans, and other factors. Quantitative factors also incorporate known information about individual loans, including borrowers’ sensitivity to interest rate movements and to quantifiable external factors including commodity and finished good prices as well as acts of nature (earthquakes, floods, fires, etc.) that occur in a particular period. Qualitative factors include the general economic environment in the Company’s markets and, in particular, the state of certain industries. Size and complexity of individual credits, loan structure, extent and nature of waivers of existing loan policies and pace of portfolio growth are other qualitative factors that are considered in its methodologies. As the Company adds new products, increases the complexity of the loan portfolio, and expands its geographic coverage, the Company will enhance the methodologies to keep pace with the size and complexity of the loan portfolio. Changes in any of the above factors could have significant impact to the allowance for loan loss calculation. The Company believes that its methodologies continue to be appropriate given its size and level of complexity.
The allowance consists of specific and general components. The specific component relates to loans that are individually classified as impaired. Loans over $300,000, with internal risk grade of substandard or below, are individually evaluated for impairment. Large group of smaller balance homogeneous loans, such as consumer loans, are collectively evaluated for impairment. The general component covers non-impaired loans and is based on historical loss experience adjusted for current factors. The historical experience is determined by portfolio segment and is based on the actual loss history experienced by the Company over the most recent six quarters. The following portfolio segments have been identified: real estate loans
84
Table of Contents
(construction and commercial), commercial loans (commercial business, trade finance and SBA) and others (consumer and other loans). The construction loan portfolio has the highest qualitative adjustments for economic and other credit risk factors, such as the incomplete status of the collateral and detrimental effect of the recent economic downturn on these types of properties, but total balance in this portfolio is not a concentration in the overall portfolio. The commercial real estate loan portfolio as a whole had the next highest level of qualitative adjustments due to the effect of local economies on the underlying collateral property values, as well as for industry concentrations and risks related to the commercial business tenants. Commercial real estate loans secured by hotel/motels, golf courses, gas station/car washes pose an industry concentration risk within this portfolio, have historically shown higher credit risk than in other collateral property types, and were negatively impacted by the effect of the recent poor economy on the hospitality and recreation industries as well as increasing fuel and travel costs, resulting in higher qualitative adjustment made to this portfolio. Within commercial loans portfolio, risk analysis is performed based on concentrations within industries, as well as by individual loan type. Commercial business loans granted under SBA-guaranteed programs show higher historical risks as these loans are made to small businesses which were more negatively impacted by the weak economy for the past few years. This impact resulted in increased qualitative adjustments for this portfolio during the year. Trade finance loans show minimal historical losses and have the lowest level of inherent risk as they are generally structured for transaction based funding and businesses within this portfolio were less impacted by local economic downturn. Accordingly, qualitative adjustments made to this portfolio are generally minor.
Loans are measured for impairment when it is probable that not all amounts, including principal and interest, will be collected in accordance with the contractual terms of the loan agreement. The amount of impairment and any subsequent changes are recorded through the provision for loan losses as an adjustment to the allowance for loan losses. Impairment is measured either based on the present value of the loan’s expected future cash flows or the estimated fair value of the collateral less related liquidation costs. This evaluation is inherently subjective as it requires estimates that are susceptible to significant revision as more information becomes available. The Company’s policy is to record cash receipts received on nonperforming loans first as reductions to principal and then to interest income.
A loan is classified as a troubled debt restructured when a borrower is experiencing financial difficulties that lead to a restructuring of the loan, and the Company grants concessions to the borrower in the restructuring that it would not otherwise consider. These concessions may include interest rate reductions, principal forgiveness, extension of maturity date and other actions intended to minimize potential losses. Loans restructured at a rate equal to or greater than that of a new loan with comparable risk at the time the loan is modified may be excluded from restructured loan disclosures in years subsequent to the restructuring if the loans are in compliance with their modified terms. Generally, a nonaccrual loan that is restructured remains on nonaccrual for a period of six months to demonstrate that the borrower can meet the restructured terms. However, the borrower’s performance prior to the restructuring, or other significant events at the time of restructuring may be considered in assessing whether the borrower can meet the new terms and may result in the loan being returned to accrual status after a shorter performance period. If the borrower’s performance under the new terms is not reasonably assured, the loan remains classified as a nonaccrual loan.
Loan losses are charged, and recoveries are credited to the allowance account. Additions to the allowance account are charged to the provision for loan losses. The allowance for loan losses is maintained at a level considered adequate by management to absorb inherent losses in the loan portfolio. The adequacy of the allowance for loan losses is determined by management based upon an evaluation and review of the loan portfolio, consideration of historical loan loss experience, current economic conditions, and changes in the composition of the loan portfolio, analysis of collateral values, and other pertinent factors. While management uses available information to recognize possible losses on loans, future additions to the allowance may be necessary based on changes in economic conditions. In addition, various regulatory agencies, as an integral part of their examination process, periodically review the Company’s allowance for loan losses. Such agencies may require the Company to recognize additional allowance based on their judgments about information available to them at the time of their examination.
Premises and Equipment
Premises and equipment are stated at cost less accumulated depreciation and amortization. Depreciation and amortization of premises and equipment are computed on the straight-line method over the following estimated useful lives:
| Buildings | 30 years | |
| Furniture, fixture, and equipment | 5 to 10 years | |
| Computer equipment | 3 years | |
| Leasehold improvements | life of lease or improvements, whichever is shorter |
Other Real Estate Owned (“OREO”)
OREO, which represents real estate acquired through foreclosure in satisfaction of commercial and real estate loans, is stated at fair value less estimated selling costs Loan balances in excess of the fair value of the real estate acquired at the date of
85
Table of Contents
foreclosure are charged to the allowance for loan losses. Any subsequent decline in the fair value of OREO is recognized as a charge to operations and a corresponding increase to the valuation allowance of OREO. Gains and losses from sales and net operating expenses of OREO are included in current operations.
Covered OREO
All OREO acquired in FDIC-assisted acquisitions that are subject to a FDIC loss sharing agreement are referred to as “covered OREO” and reported separately in the consolidated statements of financial condition. Covered OREO is reported exclusive of expected reimbursement cash flows from the FDIC. Foreclosed covered loan collateral is transferred into covered OREO at the loan’s fair value, inclusive of the acquisition date fair value discount.
Covered OREO was initially recorded at its estimated fair value on the acquisition date based on similar market comparable valuations less estimated selling costs. Any subsequent valuation adjustments due to declines in fair value will be charged to non-interest expense, and will be offset, in part, by non-interest income representing the corresponding increase to the FDIC loss share receivable. Any recoveries of previous valuation adjustments will be credited to non-interest expense with a corresponding charge to non-interest income for the portion of the recovery that is due to the FDIC.
Goodwill and Intangible Assets
Goodwill represents the excess of purchase price over the fair value of net assets acquired, as a result of past acquisition. If the consideration paid is less than the fair value of the net assets acquired, the Company will record a bargin purchase gain. Goodwill is not amortized and is reviewed for impairment on an annual basis on December 31, or on an interim basis if an event occurs or circumstances change that would reduce the fair value of a reporting unit below its carrying value. Premiums on deposits, which represent the intangible value of depositor relationships resulting from deposit liabilities assumed in acquisitions, are amortized over the projected useful lives of the deposits, which is typically 7 to 9 years. Core deposit intangibles are reviewed for impairment whenever events or changes in circumstances indicate that the carrying value may not be recoverable. Impairment on goodwill and premiums on deposits is recognized by writing down the asset to the extent that the carrying value exceeds the estimated fair value.
Investments in Affordable Housing Partnerships
The Company owns limited partnership interests in projects of affordable housing for lower income tenants. The investments in which the Company has significant influence are recorded using the equity method of accounting. For those investments in limited partnerships for which the Company does not have a significant influence, such investments are accounted for using the cost method of accounting and the annual amortization is based on the proportion of tax credits received in the current year to the total estimated tax credits to be allocated to the Company. The tax credits are recognized in the consolidated financial statements to the extent they are utilized on the Company’s tax returns.
FDIC Loss Share Receivable
The Company accounts for amounts receivable under the loss sharing agreement with the FDIC as FDIC loss share receivable in accordance with FASB ASC 805. The FDIC loss share receivable was initially recorded at fair value, based on the discounted value of expected future cash flows under the loss sharing agreement. The difference between the present value and the undiscounted cash flows the Company expects to collect from the FDIC will be accreted into non-interest income over the life of the FDIC loss share receivable.
The FDIC loss share receivable is reviewed quarterly and adjusted for any changes in expected cash flows based on recent performance and expectations for future performance of the covered portfolio. These adjustments are measured on the same basis as the related covered loans and covered OREO. Any increases in the cash flows of the covered assets over those expected will reduce the FDIC loss share receivable and any decreases in cash flows of the covered assets under those expected will increase the FDIC loss share receivable. Increases and decreases to the FDIC loss share receivable are recorded as adjustments to non-interest income.
Income Taxes
Income tax expense is the total of the current year income tax due or refundable and the change in deferred tax assets and liabilities. Deferred income taxes are provided for using an asset and liability approach. Deferred income tax assets and liabilities represent the tax effects, based on current tax law, of future deductible or taxable amounts attributable to events that have been recognized in the consolidated financial statements.
86
Table of Contents
A valuation allowance is established against deferred tax assets due to an uncertainty of realization. The valuation allowance is reviewed in each period to analyze whether there is a sufficient positive or negative evidence to support a change in management’s judgment about the realizability of the related deferred tax assets.
In assessing the future realization of deferred tax assets, management considers whether it is more likely than not that some portion or all of the deferred tax assets will not be realized. The ultimate realization of deferred tax assets is dependent upon the generation of future taxable income during the periods in which those temporary differences become deductible. Management considers the scheduled reversal of deferred tax liabilities, the projected future taxable income, and tax-planning strategies in making this assessment. A tax position is recognized as a benefit only if it is more likely than not that the tax position would be sustained in a tax examination, with a tax examination being presumed to occur. For tax positions not meeting the “more likely than not” criteria, no tax benefit is recorded.
The Company’s policy is to record any interest or penalties paid in connection with income taxes in other operating expenses of the consolidated statements of operations.
Stock-Based Compensation
The Company recognizes compensation expense for all share-based payments made to employees and directors based on the fair value of the share-based payment on the date of grant. For share-based payments granted subsequent to January 1, 2006, compensation expense, based on the fair value on the date of grant, is recognized in the Consolidated Statements of Operations on a straight-line basis over the vesting period. In determining the fair value of stock options, the Company uses the Black-Scholes option-pricing model that employs the following assumptions:
| • | Expected volatility—based on the weekly historical volatility of our stock price, over the expected life of the option. |
| • | Expected term of the option—based on historical employee stock option exercise behavior, the vesting terms of the respective option and a contractual life of ten years. |
| • | Risk-free rate of return—based upon the rate on a zero coupon U.S. Treasury bill, for periods within the contractual life of the option, in effect at the time of grant. |
| • | Dividend yield—calculated as the ratio of historical dividends paid per share of common stock to the stock price on the date of grant. |
The Company’s stock price volatility and option lives involve management’s best estimates at that time, both of which impact the fair value of the option calculated under the Black-Scholes methodology and, ultimately, the expense that will be recognized over the life of the option.
Earnings (Loss) per Common Share
Effective January 1, 2009, the Company adopted new accounting guidance under ASC 260, Earnings Per Share, which provides that unvested share-based payment awards that contain nonforfeitable rights to dividends or dividend equivalents (whether paid or unpaid) are participating securities and shall be included in the computation of earnings per share pursuant to the two-class method. The Company has determined that its outstanding non-vested restricted stock awards are participating securities. Accordingly, effective January 1, 2009, earnings per common share is computed using the two-class method prescribed under ASC 260.
Under the two-class method, basic earnings per common share is computed by dividing net earnings allocated to common stock by the weighted-average number of common shares outstanding during the applicable period, excluding outstanding participating securities. Diluted earnings per common share is computed using the weighted-average number of shares determined for the basic earnings per common share computation plus the dilutive effect of stock compensation using the treasury stock method. A reconciliation of the weighted-average shares used in calculating basic earnings per common share and the weighted average common shares used in calculating diluted earnings per common share for the reported periods is provided in Note 20 – Earnings (Loss) Per Common Share. Exercise of options is not assumed if the result would be anti-dilutive such as when a loss from continuing operations is reported. There was no change to previously reported earnings per share for prior periods upon adoption of this guidance.
Business Segments
We have determined that we have one reportable business segment, banking operations.
87
Table of Contents
Comprehensive Income (Loss)
Accounting principles generally require that recognized revenue, expenses, gains, and losses be included in net income (loss). Although certain changes in assets and liabilities, such as unrealized gains and losses on securities available for sale, are reported as a separate component of the shareholders’ equity section of the Consolidated Statements of Financial Condition, such items, along with net income (loss), are components of comprehensive income (loss).
Business Combinations
Business combinations are accounted for under the acquisition method of accounting in accordance with ASC 805, Business Combinations. Under the acquisition method the acquiring entity in a business combination recognizes 100 percent of the acquired assets and assumed liabilities, regardless of the percentage owned, at their estimated fair values as of the date of acquisition. Any excess of the purchase price over the fair value of net assets and other identifiable intangible assets acquired is recorded as goodwill. To the extent the fair value of net assets acquired, including other identifiable assets, exceed the purchase price, a bargain purchase gain is recognized. Assets acquired and liabilities assumed from contingencies must also be recognized at fair value, if the fair value can be determined during the measurement period. Results of operations of an acquired business are included in the statement of earnings from the date of acquisition. Acquisition-related costs, including conversion and restructuring charges, are expensed as incurred. We adopted this guidance as of January 1, 2009 and applied it to the Innovative Bank acquisition.
Reclassifications
Reclassifications have been made to the prior year financial statements to conform to the current year presentation.
Recent Accounting Pronouncements
In June 2009, the FASB issued FASB Accounting Standards Update (“ASU”) 2009-16, Accounting for Transfers of Financial Assets (Statement 166), which amends ASC Topic 860 (FASB Statement No. 140, Accounting for Transfers and Servicing of Financial Assets and Extinguishments of Liabilities). These eliminate the Qualified Special Purpose Entity (“QSPE”) concept, creates more stringent conditions for reporting a transfer of a portion of a financial asset as a sale, clarifies the derecognition criteria, revises how retained interests are initially measured, and removes the guaranteed mortgage securitization recharacterization provisions. This ASU requires additional disclosures for non-public companies that are similar to the disclosures previously required for public companies by FASB Staff Position FAS 140-4 and FIN 46(R)-8, “Disclosures by Public Entities (Enterprises) about Transfers of Financial Assets and Interests in Variable Interest Entities.” This ASU is effective as of the beginning of a company’s first fiscal year that begins after November 15, 2009 (January 1, 2010 for calendar year-end companies), and for subsequent interim and annual reporting periods. The disclosure requirements must be applied to transfers that occurred before and after its effective date. Early adoption is prohibited. The Company adopted this new accounting pronouncement as of January 1, 2010 and the impact of adoption was not material on the consolidated financial statements.
In January 2010, the FASB issued FASB ASU 2010-06, Improving Disclosures about Fair Value Measurements, which amends ASC 820 to require additional disclosures regarding fair value measurements. Specifically, the ASU requires disclosure of the amounts of significant transfers between Level 1 and Level 2 of the fair value hierarchy and the reasons for these transfers, the reasons for any transfers in or out of Level 3, and information in the reconciliation of recurring Level 3 measurements about purchases, sales, issuances and settlements on a gross basis. In addition to these new disclosure requirements, the ASU also amends ASC 820 to clarify certain existing disclosure requirements. For example, the ASU clarifies that reporting entities are required to provide fair value measurement disclosures for each class of assets and liabilities. Previously separate fair value disclosures were required for each major category of assets and liabilities. ASU 2010-06 also clarifies the requirement to disclose information about both the valuation techniques and inputs used in estimating Level 2 and Level 3 fair value measurements. Except for the requirement to disclose information about purchases, sales, issuances, and settlements in the reconciliation of recurring Level 3 measurements on a gross basis, these disclosures are effective for the quarter ended March 31, 2010. The requirement to separately disclose purchases, sales, issuances, and settlements of recurring Level 3 measurements becomes effective for the Corporation for the quarter ended March 31, 2011. The Company adopted this new accounting pronouncement as of January 1, 2010 and the impact of adoption was not material on the consolidated financial statements.
The FASB issued FASB ASU 2010-18, Effect of a Loan Modification When The Loan Is Part of a Pool That Is Accounted for as a Single Asset, a consensus of the FASB Emerging Issues Task Force (Issue No. 09-I), which amends This ASU amends FASB ASC Subtopic 310-30, Receivables—Loans and Debt Securities Acquired with Deteriorated Credit Quality, so that
88
Table of Contents
modifications of loans that are accounted for within a pool under that Subtopic do not result in the removal of the loans from the pool even if the modifications of the loans would otherwise be considered a troubled debt restructuring. A one-time election to terminate accounting for loans in a pool, which may be made on a pool-by-pool basis, is provided upon adoption of the new guidance. An entity will continue to be required to consider whether the pool of assets in which the loan is included is impaired if expected cash flows for the pool change. The amendments in this ASU are effective prospectively for modifications of loans accounted for within pools under Subtopic 310-30 occurring in the first interim or annual period ending on or after July 15, 2010. The Company adopted this new accounting pronouncement as of July 1, 2010 and the impact of adoption was not material on the consolidated financial statements.
In July 2010, the FASB issued FASB ASU 2010-20, Receivables (Topic 310) – Disclosures about the Credit Quality of Financing Receivables and the Allowance for Credit Losses, which will required more information about credit quality. The ASU introduces the term “financing receivables”, which includes loans, trade accounts receivable, notes receivable, credit cards, leveraged leases, direct financing leases, and sales-type leases. The term does not include receivables measured at fair value or the lower of cost of fair value and debt securities among others. It also defines two levels of disaggregation for disclosure: portfolio segment and class of financing receivables. A portfolio segment is defined as the level at which an entity determines its allowance for credit losses. A class of financing receivable is defined as a group of finance receivables determined on the basis of their initial measurement attribute (i.e., amortized cost of purchased credit impaired), risk characteristics, and an entity’s method for monitoring and assessing credit risk. The ASU requires an entity to provide additional disclosures including, but not limited to, a rollforward schedule of the allowance for credit losses (with the ending allowance balance further disaggregated based on impairment methodology) and the related ending balance of the finance receivable presented by portfolio segment, and the aging of past due financing receivables at the end of the period, the nature and extent of troubled debt restructurings that occurred during the period and their impact on the allowance for credit losses, the nature and extend of troubled debt restructurings that occurred within the last year, that have defaulted in the current reporting period, and their impact on the allowance for credit losses, the nonaccrual status of financing receivables, and impaired financing receivables, presented by class. The extensive new disclosures of information as of the end of a reporting period will become effective for both interim and annual reporting periods ending after December 15, 2010 for public companies. Specific items regarding activity that occurred before the issuance of the ASU, such as the allowance rollforward and modification disclosures will be required for periods beginning after December 15, 2010 for public companies. The Company adopted this pronouncement as disclosed in Note 7.
In December 2010, the FASB issued FASB ASU 2010-28, “Intangibles — Goodwill and Other (Topic 350), When to Perform Step 2 of the Goodwill Impairment Test for Reporting Units with Zero or Negative Carrying Amounts”, which affects all entities that have recognized goodwill and have one or more reporting units whose carrying amount for purposes of performing Step 1 of the goodwill impairment test is zero or negative. The ASU modifies Step 1 so that for those reporting units, an entity is required to perform Step 2 of the goodwill impairment test if it is more likely than not that a goodwill impairment exists. In determining whether it is more likely than not that goodwill impairment exists, an entity should consider whether there are any adverse qualitative factors indicating that an impairment may exist. The qualitative factors are consistent with existing guidance, which requires that goodwill of a reporting unit be tested for impairment between annual tests if an event occurs or circumstances change that would more likely than not reduce the fair value of a reporting unit below its carrying amount. For public entities, this guidance is effective for fiscal years, and interim periods within those years, beginning after December 15, 2010. The guidance is effective for a public entity’s first annual period that ends on or after December 15, 2010. Adoption of ASU 2010-28 is not expected to have a significant impact on our consolidated financial statements.
In December 2010, the FASB issued FASB ASU 2010-29, Disclosure of Supplementary ProForma Information for Business Combinations, a consensus of the FASB Emerging Issues Task Force (Issue No. 10-G), which requires that the pro forma information be presented at if the business combination occurred at the beginning of the prior annual reporting period for purposes of calculating both the current reporting period and the prior reporting period pro forma financial information. The ASU also requires that this disclosure be accompanied by a narrative description of the amount and nature of material nonrecurring pro forma adjustments. The amendments in this ASU are effective for business combinations with effective dates on or after the beginning of the first annual reporting period beginning on or after December 15, 2010. Prospective application is required with early adoption permitted. The Company is currently assessing the impact of the adoption of this ASU on the consolidated financial statements.
In January 2011, the FASB issued FASB ASU 2011-01, Receivables (Topic 310) – Deferral of the Effective Date of Disclosures about Troubled Debt Restructurings in Update No. 2010-20, which deferred the effective date of the disclosure requirements for public entities about troubled debt restructurings in ASU 2010-20, to be concurrent with the effective date of the guidance for troubled debt restructuring which is currently anticipated to be effective for interim and annual periods after June 15, 2011. The Company does not anticipate the new guidance will have a material impact on the consolidated financial statements.
89
Table of Contents
3. BUSINESS COMBINATION
On April 16, 2010, the California Department of Financial Institutions closed Innovative Bank, Oakland, California, and appointed the Federal Deposit Insurance Corporation (“FDIC”) as its receiver. On the same date, Center Bank acquired assets and assumed liabilities related to the banking operations of Innovative Bank from the FDIC under a purchase and assumption agreement with loss sharing.
Center Bank assumed both the insured and non-insured deposits balance, at a premium of 0.5 percent. The loss sharing agreement between the FDIC and Center Bank, which covers all loans and other real estate owned that have been assumed, and the business combination fair value adjustments, mitigates the risk of future loss on the loan portfolio acquired. Under the terms of the loss sharing agreement, the FDIC will absorb 80% of losses and share in 80% of loss recoveries. The reimbursed losses from the FDIC are based on the book value of the relevant loan as determined by the FDIC at the date of the assumption. New loans made after that date are not covered by the loss sharing agreement.
Upon closing of the transaction, Center Bank was entitled to receive approximately $20.0 million, of which $18.9 million was received in April 2010, in cash for asset discount and negative transaction equity, net of the deposit premium. As part of the transaction, the FDIC received one million Equity Appreciation Instruments (“EAI”) based on Center Financial’s stock price and exercised all EAI’s realizing a gain of approximately $1.4 million on April 26, 2010. The value of the EAI in the amount of $1.4 million was included as additional acquisition cost in the calculation of the bargain purchase gain.
The acquired loan portfolio and other real estate owned are referred to as “covered loans” and “covered other real estate owned”, respectively, and these are presented as separate line items in the Consolidated Statements of Financial Condition. Collectively these balances are referred to as “covered assets”.
The assets acquired and liabilities assumed for Innovative Bank have been accounted for under the acquisition method of accounting (formerly referred to as the purchase method) in accordance with FASB ASC 805, Business Combinations. The assets and liabilities were recorded at their estimated fair values as of the acquisition date. The foregoing fair value amounts are subject to change for up to one year after the closing date of the acquisition as additional information relating to closing date fair values becomes available. The amounts are also subject to adjustments based upon final settlement with the FDIC. In addition, the tax treatment of FDIC assisted acquisitions is complex and subject to interpretations that may result in future adjustments of deferred taxes as of the acquisition date. The terms of the agreements provide for the FDIC to indemnify the Bank against claims with respect to liabilities of Innovative Bank not assumed by the Bank and certain other types of claims identified in the agreement.
In FDIC-assisted transactions, only certain assets and liabilities are transferred to the acquirer and, depending on the nature and amount of the acquirer’s bid, the FDIC may be required to make a cash payment to the acquirer. In the Innovative Bank acquisition, cost basis net assets (liabilities) of $(1.5) million were transferred to the Bank. The bargain purchase gain represents the excess of the estimated fair value of the assets acquired over the estimated fair value of the liabilities assumed.
The Bank did not immediately acquire all the real estate, banking facilities, furniture or equipment as part of the purchase and assumption agreement. However, pursuant to an option to purchase or lease the real estate and furniture and equipment from the FDIC, which expired 90 days from the acquisition date, the Company acquired certain furniture and equipment from the FDIC in July 2010. Acquisition costs of the furniture and equipment were based on current appraisals and determined at the purchase date.
90
Table of Contents
A summary of the net assets (liabilities) received from the FDIC and the estimated fair value adjustments resulting in the bargain purchase gain are presented below:
| Received from FDIC |
Fair Value Adjustments |
Recorded by Center |
||||||||||
| (Dollars in thousands) | ||||||||||||
| Assets acquired: |
||||||||||||
| Cash and due from banks |
$ | 49,905 | $ | — | $ | 49,905 | ||||||
| Investment securities |
11,907 | — | 11,907 | |||||||||
| FHLB stock |
1,218 | — | 1,218 | |||||||||
| Fed Fund Sold |
2,700 | — | 2,700 | |||||||||
| Loans, net |
162,248 | (36,081 | ) | 126,167 | ||||||||
| OREO |
2,132 | (190 | ) | 1,942 | ||||||||
| FDIC loss share receivable |
— | 25,300 | 25,300 | |||||||||
| Core deposit intangible |
— | 510 | 510 | |||||||||
| Other assets |
(467 | ) | 615 | 148 | ||||||||
| Total assets acquired |
229,643 | (9,846 | ) | 219,797 | ||||||||
| Liabilities assumed: |
||||||||||||
| Deposits |
209,309 | — | 209,309 | |||||||||
| FHLB borrowings |
20,045 | 1,384 | 21,429 | |||||||||
| Deferred tax liability |
— | — | 2,481 | |||||||||
| Other liabilities |
1,747 | — | 1,747 | |||||||||
| Total liabilities assumed |
231,101 | 1,384 | 234,966 | |||||||||
| Net assets (liabilities) acquired |
$ | (1,458 | ) | $ | (11,230 | ) | $ | (15,169 | ) | |||
| Aggregate fair value adjustments |
$ | (11,230 | ) | |||||||||
| Net assets (liabilities) acquired |
$ | (15,169 | ) | |||||||||
| Net settlement from FDIC |
20,024 | |||||||||||
| Value of equity appreciation instrument to FDIC |
(1,436 | ) | ||||||||||
| Bargain purchase gain on Innovative acquisition, net of deferred tax |
$ | 3,419 | ||||||||||
Due primarily to the Company acquiring only certain assets and liabilities of Innovative Bank, the significant amount of fair value adjustments, and the FDIC loss sharing agreement, the historical results of Innovative Bank are not material to the Company’s results, and as a result, no pro forma information is presented.
4. FAIR VALUE MEASUREMENTS
Fair value is measured in accordance with a three-level valuation hierarchy for disclosure of fair value measurement. The valuation hierarchy is based upon the transparency of inputs to the valuation of an asset or liability as of the measurement date. The three levels are defined as follows:
| Ÿ | Level 1 — | inputs to the valuation methodology are quoted prices (unadjusted) for identical assets or liabilities in active markets. | ||
| Ÿ | Level 2 — | inputs to the valuation methodology include quoted prices for similar assets and liabilities in active markets, and inputs that are observable for the asset or liability, either directly or indirectly, for substantially the full term of the financial instrument. | ||
| Ÿ | Level 3 — | inputs to the valuation methodology are unobservable and significant to the fair value measurement. | ||
Following is a description of the valuation methodologies used for instruments measured at fair value, as well as the general classification of such instruments pursuant to the valuation hierarchy:
Assets
Securities Available for Sale
U.S. Treasury—The Company measures fair value of these securities by using quoted market prices, a level 1 measurement.
91
Table of Contents
U.S. Governmental agencies securities and U.S. Governmental sponsored enterprise securities—The Company measures fair value of these securities by using quoted market prices for similar securities or dealer quotes, a level 2 measurement.
U.S. Governmental agencies securities and U.S. Governmental sponsored enterprise mortgage-backed securities—The Company measures fair value of these securities by using quoted market prices for similar securities or dealer quotes, a level 2 measurement.
Mutual funds backed by adjustable rate mortgages—The Company measures fair value of residential mortgage-backed securities by using quoted market prices for similar securities or dealer quotes, a level 2 measurement.
Fixed rate collateralized mortgage obligations—The Company measures fair value of collateralized mortgage obligations by using quoted market prices for similar securities or dealer quotes, a level 2 measurement.
Corporate trust preferred security—The Company owns one collateralized debt obligation (“CDO”) security that is backed by trust preferred securities (“TRUPS”) issued by banks and thrifts. The Company measures the fair value of the CDO TRUPS security by using a Level 3 fair value measurement. The fair value of the CDO TRUPS security has traditionally been based on the average of at least two quoted market prices obtained from independent brokers. However, as a result of the global financial crisis and illiquidity in the U.S. markets, the market for these securities has become increasingly inactive since mid-2007. The current broker price for the CDO TRUPS securities is based on forced liquidation or distressed sale values in very inactive markets that may not be representative of the economic value of these securities. As such, the fair value of the CDO TRUPS security has been below cost since the advent of the financial crisis. Additionally, most, if not all, of these broker quotes are nonbinding.
The Company considered whether to place little, if any, weight on transactions that are not orderly when estimating fair value. Although length of time and severity of impairment are among the factors to consider when determining whether a security that is other than temporarily impaired, the CDO TRUPS securities have only exhibited deep declines in value since the credit crisis began. The Company therefore believes that this is an indicator that the decline in price is primarily the result of the lack of liquidity in the market for these securities.
The Company uses Moody’s Analytics to compute the fair value of the CDO TRUPS security. Moody’s continues to update their valuation process in order to refine and improve the estimate of default probabilities to align the valuation methodology with industry practices.
Moody’s approach to valuing CDO TRUPS includes asset and liability analyses to arrive at an Estimated Fundamental Value (EFV), then applies a liquidity spread to discount the EFV to the value that would be received in an orderly liquidation.
| • | Asset Credit Quality Analysis: The credit quality of collateral supporting each CDO TRUPS is determined using Probability of Default values for each underlying issuer and Loss Given Default values by asset type. |
| • | Liability Analysis: The EFV of CDO TRUPS liabilities is determined through asset and liability modeling, specifically including (a) Forecasting cash flows generated by underlying collateral, (b) Establishing priority-of-claims distribution to each CDO tranche, and (c) Simulating the distribution of cash flows to each CDO tranche using a Monte Carlo simulation model. |
| • | Liquidity discount factor: A regression model is run based on historical data to determine an appropriate spread for the security in a liquid market. Using that liquid market spread plus current market interest rates, the EFV cash flows are discounted to arrive an orderly liquid exit value |
The Company considers numerous factors to determine any OTTI for the CDO TRUPS security including review of trustee reports, monitoring of “break in yield” tests, analysis of current defaults and deferrals and the expectation for future defaults and deferrals. The Company reviews the key financial characteristics for individual issuers (commercial banks or thrifts) in the CDO TRUPS security and considers capital ratios, leverage ratios, nonperforming loan and nonperforming asset ratios, in addition to the credit ratings. The credit ratings of the Company’s CDO TRUPS security are “Ca” (Moody’s) and “C” (Fitch) at December 31, 2010.
The Company uses cash flow projection for the purpose of assessing OTTI on CDO TRUPS security which incorporates certain credit events in the underlying collaterals and prepayment assumptions. The projected issuer
92
Table of Contents
default rates are assumed at a rate equivalent to 150 basis points applied annually and have a 0% recovery factor after the initial default date. The principal is assumed to be prepaying at 1% annually and at 100% at maturity.
Based on the results from the cash flow model, the CDO TRUPS security did not experience an adverse change in its cash flow status. As such, based on all of these factors, the Company determined that there was no OTTI adjustment in the current quarter. The risk of future OTTI will be highly dependent upon the performance of the underlying issuers. The Company does not have the intention to sell and does not believe it will be required to sell the CDO TRUPS security.
Non-covered SBA Loans held for sale- Loans held for sale are measured at the lower of cost or fair value. As of December 31, 2010 and 2009, the Company had $46.4 million and $23.3 million of loans held for sale, respectively. Management obtains quotes, bids or pricing indication sheets on all or part of these loans directly from the purchasing financial institutions. Premiums received or to be received on the quotes, bids or pricing indication sheets are indicative of the fact that cost is lower than fair value. At December 31, 2010 and 2009, the entire balance of loans held for sale was recorded at its cost. The Company records loans held for sale on a nonrecurring basis with Level 2 inputs.
Non-covered Nonperforming loans held for sale- The Company reclassifies certain nonperforming loans when the decision to sell those loans is made. The fair value of nonperforming loans held for sale is generally based upon the quotes, bids or sales contract price which approximate the fair value. Nonperforming loans held for sale are recorded at estimated fair value less anticipated liquidation cost. As of December 31, 2010, the Company had $13.8 million of nonperforming loans held for sale. The Company measures nonperforming loans held for sale at fair value on a nonrecurring basis with Level 3 inputs.
Impaired loans- A loan is considered impaired when it is probable that all of the principal and interest due may not be collected according to the original underwriting terms of the loan. Impaired loans are measured at the lower of its carrying value or at an observable market price if available or at the fair value of the loan’s collateral if the loan is collateral dependent. Fair value of the loan’s collateral when the loan is dependent on collateral, is determined by appraisals or independent valuation, which is then adjusted for the cost associated with liquidating the collateral. The Company measures impaired loans at fair value on a nonrecurring basis with Level 3 inputs.
Non-covered Other Real Estate Owned (OREO)- Non-covered OREO is transferred at fair value and is carried at the lower of its carrying value or its fair value less anticipated disposal cost. Fair value of the non-covered OREO is determined by appraisals or independent valuation, which is then adjusted for the cost associated with liquidating the property. The Company measures non-covered OREO at fair value on a nonrecurring basis with Level 3 inputs.
Covered OREO- Covered OREO was initially recorded at its estimated fair value on the acquisition date based on similar market comparable valuations less estimated selling costs. Any subsequent valuation adjustments due to declines in fair value will be charged to non-interest expense, and will be offset, in part, by non-interest income representing the corresponding increase to the FDIC loss share receivable. Any recoveries of previous valuation adjustments will be credited to non-interest expense with a corresponding charge to non-interest income for the portion of the recovery that is due to the FDIC. The Company measures covered OREO at fair value on a nonrecurring basis with Level 3 inputs.
93
Table of Contents
Assets measured at fair value on a recurring basis at December 31, 2010 and 2009, respectively, are as follows:
| Fair Value Measurements at Reporting Date Using | ||||||||||||||||
| (Dollars in thousands) | ||||||||||||||||
| Description | 12/31/10 | Quoted Prices in Active Markets for Identical Assets (Level 1) |
Significant Other Observable Inputs (Level 2) |
Significant Unobservable Inputs (Level 3) |
||||||||||||
| Assets measured at fair value on a recurring basis |
||||||||||||||||
| Available-for-sale securities: |
||||||||||||||||
| U.S. Treasury |
$ | 300 | $ | 300 | $ | — | $ | — | ||||||||
| U.S. Governmental agencies securities and U.S. Government sponsored enterprise securities |
58,607 | — | 58,607 | — | ||||||||||||
| U.S. Governmental agencies and U.S. Government sponsored enterprise mortgage-backed securities |
157,099 | — | 157,099 | — | ||||||||||||
| Corporate trust preferred securities |
759 | — | — | 759 | ||||||||||||
| Mutual Funds backed by adjustable rate mortgages |
5,073 | — | 5,073 | — | ||||||||||||
| Fixed rate collateralized mortgage obligations |
67,713 | — | 67,713 | — | ||||||||||||
| Total available-for-sale securities |
$ | 289,551 | $ | 300 | $ | 288,492 | $ | 759 | ||||||||
| 12/31/09 | Quoted Prices in Active Markets for Identical Assets (Level 1) |
Significant Other Observable Inputs (Level 2) |
Significant Unobservable Inputs (Level 3) |
|||||||||||||
| Available-for-sale securities: |
||||||||||||||||
| U.S. Treasury |
$ | 300 | $ | 300 | $ | — | $ | — | ||||||||
| U.S. Governmental agencies securities and U.S. Government sponsored enterprise securities |
74,270 | — | 74,270 | — | ||||||||||||
| U.S. Governmental agencies and U.S. Government sponsored enterprise mortgage-backed securities |
212,175 | — | 212,175 | — | ||||||||||||
| Corporate trust preferred securities |
2,404 | — | — | 2,404 | ||||||||||||
| Mutual Funds backed by adjustable rate mortgages |
4,533 | — | 4,533 | — | ||||||||||||
| Fixed rate collateralized mortgage obligations |
76,745 | — | 76,745 | — | ||||||||||||
| Total available-for-sale securities |
$ | 370,427 | $ | 300 | $ | 367,723 | $ | 2,404 | ||||||||
There were no transfers between Level 1 and Level 2 of the fair value hierarchy in 2010 and 2009. The Company recognizes transfers at the end of the reporting period for Level 1 and Level 2 transfers. There were no transactions in and/or out of the Level 3 hierarchy in 2010 and 2009. The Company recognizes transfers at the end of the reporting period for Level 3 transfers.
The following table presents the Company’s reconciliation and statement of operations classification of gains and losses for all assets measured at fair value on a recurring basis using significant unobservable inputs (Level 3) for the years ended December 31, 2010 and 2009, respectively.
| For the Year ended December 31, | ||||||||
| 2010 | 2009 | |||||||
| (Dollars in thousands) | ||||||||
| Balance, beginning of period |
$ | 2,404 | $ | — | ||||
| Purchases, Issuances and Settlements |
— | — | ||||||
| Gain (Loss) in Earnings (Expenses) |
— | — | ||||||
| Gain (Loss) in Other Comprehensive Income |
(1,645 | ) | 2,087 | |||||
| Transfer in/out of Level 3 |
— | 317 | ||||||
| Balance, end of period |
$ | 759 | $ | 2,404 | ||||
The following table presents the aggregated balance of assets measured at fair value on a nonrecurring basis as of December 31, 2010 and 2009, respectively. For the year ended December 31, 2010, the total losses resulting from these fair value adjustments for SBA loans held for sale, nonperforming loans held for sale, impaired loans, and non-covered OREO amounted to $4,000, $3.4 million, $14.5 million, and $438,000, respectively:
94
Table of Contents
| As of December 31, 2010 | ||||||||||||||||
| Level 1 | Level 2 | Level 3 | Total | |||||||||||||
| (Dollars in thousands) | ||||||||||||||||
| SBA Loans held for sale |
$ | — | $ | 23 | $ | — | $ | 23 | ||||||||
| Nonperforming Loans held for sale |
— | — | 15,347 | 15,347 | ||||||||||||
| Impaired Loans |
— | — | 49,571 | 49,571 | ||||||||||||
| Non-covered OREO |
— | — | 980 | 980 | ||||||||||||
| Total |
$ | — | $ | 23 | $ | 65,898 | $ | 65,921 | ||||||||
| As of December 31, 2009 | ||||||||||||||||
| Level 1 | Level 2 | Level 3 | Total | |||||||||||||
| (Dollars in thousands) | ||||||||||||||||
| Impaired Loans |
$ | — | $ | 74,447 | $ | — | $ | 74,447 | ||||||||
| Non-covered OREO |
— | 4,278 | — | 4,278 | ||||||||||||
| Total |
$ | — | $ | 78,725 | $ | — | $ | 78,725 | ||||||||
5. FAIR VALUE OF FINANCIAL INSTRUMENTS
The Company, using available market information and appropriate valuation methodologies available to management at December 31, 2010 and 2009, has determined the estimated fair value of financial instruments. However, considerable judgment is required to interpret market data in order to develop estimates of fair value. Accordingly, the estimates presented herein are not necessarily indicative of the amounts the Company could realize in a current market exchange. The use of different market assumptions and/or estimation methodologies may have a material effect on the estimated fair value amounts. Furthermore, fair values disclosed hereinafter do not reflect any premium or discount that could result from offering the instruments for sale. Potential taxes and other expenses that would be incurred in an actual sale or settlement are not reflected in the disclosed amounts.
95
Table of Contents
The estimated fair values and related carrying amounts of the Company’s financial instruments as of December 31, 2010 and 2009, respectively, are as follows:
| December 31, 2010 | December 31, 2009 | |||||||||||||||
| Carrying or Contract Amount |
Estimated Fair Value |
Carrying or Contract Amount |
Estimated Fair Value |
|||||||||||||
| (Dollars in thousands) | ||||||||||||||||
| Assets |
||||||||||||||||
| Cash and cash equivalents |
$ | 258,920 | $ | 258,920 | $ | 232,802 | $ | 232,802 | ||||||||
| Investment securities available for sale |
289,551 | 289,551 | 370,427 | 370,427 | ||||||||||||
| Non-covered loans held for sale, at the lower of cost or fair value |
60,234 | 61,162 | 23,318 | 23,551 | ||||||||||||
| Federal Home Loan Bank and other equity stock |
15,019 | 15,019 | 15,673 | 15,673 | ||||||||||||
| Non-covered loans, net |
1,415,646 | 1,522,475 | 1,455,824 | 1,449,412 | ||||||||||||
| Covered loans, net |
116,283 | 116,283 | — | — | ||||||||||||
| FDIC loss share receivable |
23,991 | 23,991 | — | — | ||||||||||||
| Customers’ liability on acceptances |
2,287 | 2,287 | 2,341 | 2,341 | ||||||||||||
| Accrued interest receivable |
5,509 | 5,509 | 6,879 | 6,879 | ||||||||||||
| Income tax receivable |
14,277 | 14,277 | 16,140 | 16,140 | ||||||||||||
| Liabilities |
||||||||||||||||
| Deposits |
1,770,994 | 1,727,320 | 1,747,671 | 1,704,176 | ||||||||||||
| Other borrowed funds |
188,670 | 197,781 | 148,443 | 157,593 | ||||||||||||
| Acceptances outstanding |
2,287 | 2,287 | 2,341 | 2,341 | ||||||||||||
| Accrued interest payable |
5,113 | 5,113 | 5,803 | 5,803 | ||||||||||||
| Long-term subordinated debentures |
18,557 | 14,452 | 18,557 | 13,790 | ||||||||||||
| Accrued expenses and other liabilities |
10,646 | 10,646 | 13,927 | 13,927 | ||||||||||||
| Off-balance sheet items |
||||||||||||||||
| Commitments to extend credit |
158,828 | 204 | 187,148 | 240 | ||||||||||||
| Standby letter of credit |
27,931 | 418 | 21,284 | 319 | ||||||||||||
| Commercial letters of credit |
30,341 | 114 | 22,190 | 84 | ||||||||||||
| Performance bonds |
222 | 3 | 651 | 9 | ||||||||||||
The methods and assumptions used to estimate the fair value of each class of financial instruments for which it is practicable to estimate that value are explained below:
Cash and Cash Equivalents—The carrying amounts approximate fair value due to the short-term nature of these instruments.
Investment Securities Available for Sale—The fair value of securities available for sale is generally determined either by obtaining quoted market price (Level 1) or by obtaining quoted prices of similar assets or liabilities (Level 2) or by developing estimated prices reflecting our own assumptions that market participants would use in pricing an asset or liability (Level 3).
Non-covered Loans Held for Sale—The fair value of non-covered loans held for sale is derived from current market prices and comparative current sales.
Federal Home Loan Bank and Other Equity Stock—The carrying amounts approximate fair value, as the stocks may be sold back to the Federal Home Loan Bank and other bank at carrying value.
Non-covered Loans—Fair values are estimated for portfolios of loans with similar financial characteristics, primarily fixed and adjustable rate interest terms. The fair values of fixed rate loans are based on discounted cash flows utilizing applicable risk-adjusted spreads relative to the current pricing of similar fixed rate loans, as well as anticipated repayment schedules. The fair value of adjustable rate loans is based on the estimated discounted cash flows utilizing the discount rates that approximate the pricing of loans collateralized by similar properties or assets. The estimated fair value is net of allowance for loan losses, net deferred loan fees, and deferred gain on SBA loans, and is not an exit price.
Covered Loans—Covered loans were measured at estimated fair value on the date of acquisition. Carrying value is calculated as the present value of expected cash flows and approximates fair value.
96
Table of Contents
FDIC Loss Share Receivable— The fair value of FDIC loss share receivable is based on the discounted value of expected future cash flows under the loss sharing agreement with the FDIC.
Accrued Interest Receivable, Income Tax Receivable and Accrued Interest Payable—The carrying amounts approximate fair value due to the short-term nature of these assets and liabilities.
Customer’s Liability on Acceptances and Acceptances Outstanding—The carrying amounts approximate fair value due to the short-term nature of these items.
Deposits —The fair value of nonmaturity deposits is the amount payable on demand at the reporting date. Nonmaturity deposits include non-interest-bearing demand deposits, savings accounts, NOW accounts, and money market accounts. Discounted cash flows have been used to value term deposits such as certificates of deposit. The discount rate used is based on interest rates currently being offered by the Company on comparable deposits as to amount and term.
Other Borrowed Funds—These funds mostly consist of FHLB advances. The fair values of FHLB advances are estimated based on the discounted value of contractual cash flows, using rates currently offered by the Federal Home Loan Bank of San Francisco for fixed-rate credit advances with similar remaining maturities at each reporting date.
Long-term Subordinated Debentures—The fair value of long-term subordinated debentures are estimated by discounting the cash flows through maturity based on prevailing rates offered on the 30-year Treasury bond at each reporting date.
Loan Commitments, Letters of Credit, and Performance Bond—The fair value of loan commitments, standby letters of credit, commercial letters of credit and performance bonds is estimated using the fees currently charged to enter into similar agreements.
6. INVESTMENT SECURITIES
The following is a summary of the investment securities at December 31, 2010 and 2009:
| Amortized Cost |
Gross Unrealized Gain |
Gross Unrealized Loss |
Estimated Fair Value |
|||||||||||||
| (Dollars in thousands) | ||||||||||||||||
| At December 31, 2010 |
||||||||||||||||
| Available-for-Sale: |
||||||||||||||||
| U.S. Treasury |
$ | 300 | $ | — | $ | — | $ | 300 | ||||||||
| U.S. Governmental agencies securities and U.S. Government sponsored enterprise securities |
58,994 | 94 | (481 | ) | 58,607 | |||||||||||
| U.S. Governmental agencies and U.S. Government sponsored enterprise mortgage-backed securities |
154,149 | 3,549 | (599 | ) | 157,099 | |||||||||||
| Corporate trust preferred security |
2,738 | — | (1,979 | ) | 759 | |||||||||||
| Mutual funds backed by adjustable rate mortgages |
5,000 | 73 | — | 5,073 | ||||||||||||
| Collateralized mortgage obligations |
67,063 | 816 | (166 | ) | 67,713 | |||||||||||
| Total available-for-sale |
$ | 288,244 | $ | 4,532 | $ | (3,225 | ) | $ | 289,551 | |||||||
| At December 31, 2009 |
||||||||||||||||
| Available-for-Sale: |
||||||||||||||||
| U.S. Treasury |
$ | 300 | $ | — | $ | — | $ | 300 | ||||||||
| U.S. Governmental agencies securities and U.S. Government sponsored enterprise securities |
74,001 | 274 | (5 | ) | 74,270 | |||||||||||
| U.S. Governmental agencies and U.S. Government sponsored enterprise mortgage-backed securities |
206,975 | 5,358 | (158 | ) | 212,175 | |||||||||||
| Corporate trust preferred security |
2,713 | — | (309 | ) | 2,404 | |||||||||||
| Mutual funds backed by adjustable rate mortgages |
4,500 | 33 | — | 4,533 | ||||||||||||
| Collateralized mortgage obligations |
76,533 | 728 | (516 | ) | 76,745 | |||||||||||
| Total available-for-sale |
$ | 365,022 | $ | 6,393 | $ | (988 | ) | $ | 370,427 | |||||||
Accrued interest and dividends receivable on investment securities totaled $1.0 million and $1.5 million at December 31, 2010 and 2009, respectively. For the years ended December 31, 2010, 2009, and 2008, proceeds from sales of securities
97
Table of Contents
available for sale amounted to $59.7 million, $5.0 million and $3.5 million, respectively, with net realized gain of $2.2 million, net realized losses of $55,000, and $0, respectively.
The amortized cost and estimated fair value of investment securities at December 31, 2010, by contractual maturity, are shown below. Although mortgage-backed securities and collateralized mortgage obligations have contractual maturities through 2037, expected maturities may differ from contractual maturities because borrowers may have the right to call or prepay obligations with or without call or prepayment penalties.
The amortized cost and estimated fair value of securities available for sale at December 31, 2010, by contractual maturity, are shown below:
| Amortized Cost | Fair Value | |||||||
| (Dollars in thousands) | ||||||||
| Within 1 year |
$ | 10,300 | $ | 10,300 | ||||
| Over 1 year through 5 years |
48,994 | 48,607 | ||||||
| Over 5 years through 10 years |
— | — | ||||||
| Over 10 years |
2,738 | 759 | ||||||
| 62,032 | 59,666 | |||||||
| U.S. Governmental agencies and U.S. Government sponsored enterprise mortgage-backed securities |
154,149 | 157,099 | ||||||
| Mutual funds backed by adjustable rate mortgages |
5,000 | 5,073 | ||||||
| Collateralized mortgage obligations |
67,063 | 67,713 | ||||||
| Total |
$ | 288,244 | $ | 289,551 | ||||
The company has pledged securities with fair values totaling $212.9 million (amortized cost of $209.2 million) and $191.6 million (amortized cost of $186.3 million), respectively, as of December 31, 2010 and December 31, 2009 to secure other various borrowing lines of credit, including the State of California time deposits, as required and permitted by law.
The following table shows the Company’s investment securities with gross unrealized losses and fair value, aggregated by investment category and length of time that individual securities have been in a continuous unrealized loss position at December 31, 2010 and 2009.
| As of December 31, 2010 | ||||||||||||||||||||||||
| Less than 12 months | 12 months or more | Total | ||||||||||||||||||||||
| Fair Value | Unrealized Loss |
Fair Value | Unrealized Loss |
Fair Value | Unrealized Loss |
|||||||||||||||||||
| (Dollars in thousands) | ||||||||||||||||||||||||
| U.S. Governmental agencies and U.S. Government sponsored enterprise securities |
$ | 33,486 | $ | (481) | $ | — | $ | — | $ | 33,486 | $ | (481) | ||||||||||||
| U.S. Governmental agencies and U.S. Government sponsored enterprise mortgage-backed securities |
27,084 | (599) | — | — | 27,084 | (599) | ||||||||||||||||||
| Collateralized mortgage obligations |
20,369 | (166) | — | — | 20,369 | (166) | ||||||||||||||||||
| Corporate trust preferred security |
— | — | 759 | (1,979) | 759 | (1,979) | ||||||||||||||||||
| Total |
$ | 80,939 | $ | (1,246) | $ | 759 | $ | (1,979) | $ | 81,698 | $ | (3,225) | ||||||||||||
| As of December 31, 2009 | ||||||||||||||||||||||||
| Less than 12 months | 12 months or more | Total | ||||||||||||||||||||||
| Fair Value | Unrealized Loss |
Fair Value | Unrealized Loss |
Fair Value | Unrealized Loss |
|||||||||||||||||||
| (Dollars in thousands) | ||||||||||||||||||||||||
| U.S. Governmental agencies and U.S. Government sponsored enterprise securities |
$ | 7,988 | $ | (5) | $ | — | $ | — | $ | 7,988 | $ | (5) | ||||||||||||
| U.S. Governmental agencies and U.S. Government sponsored enterprise mortgage-backed securities |
30,070 | (144) | 937 | (14) | 31,007 | (158) | ||||||||||||||||||
| Collateralized mortgage obligations |
41,880 | (516) | — | — | 41,880 | (516) | ||||||||||||||||||
| Corporate trust preferred security |
— | — | 2,404 | (309) | 2,404 | (309) | ||||||||||||||||||
| Total |
$ | 79,938 | $ | (665) | $ | 3,341 | $ | (323) | $ | 83,279 | $ | (988) | ||||||||||||
As of December 31, 2010, the Company had securities with total fair value of $81.7 million and unrealized losses of $3.2 million as compared to total fair value of $83.3 million and unrealized losses of $1.0 million at December 31, 2009. At December 31, 2010, the market value of securities which have been in a continuous loss position for 12 months or more totaled $0.8 million with an unrealized loss of $2.0 million compared to $3.3 million with an unrealized loss of $0.3 million, respectively, at December 31, 2009.
The Company evaluates its investment securities portfolio, at each reporting date, for indicators of other-than-temporary impairment (“OTTI”). This determination requires significant judgment. The Company assesses whether OTTI has occurred
98
Table of Contents
when the fair value of a debt security is less than the amortized cost basis at the balance sheet date. Under these circumstances, OTTI is considered to have occurred (1) if the Company intends to sell the security; (2) if it is more likely than not the Company will be required to sell the security before recovery of its amortized cost basis; or (3) the expected cash flows are not sufficient to recover all contractually required principal and interest payments. Furthermore, securities which fail the criteria above (1 through 3) must be evaluated to determine what portion of the impairment is related to credit or noncredit related OTTI. For securities that the Company does not intend to sell or it is more likely than not to be required to sell, the OTTI is separated into credit and noncredit components. The credit related OTTI, represented by the expected loss in principal, is recognized in noninterest income, while noncredit related OTTI is recognized in other comprehensive income. Noncredit related OTTI results from other factors, including increased liquidity spreads and extension of the security. For securities the Company does expect to sell, entire OTTI is recognized in earnings.
For investment securities in an unrealized loss position at December 31, 2010, the Company does not intend to sell and it is not likely that the Company will be required to sell these investment securities before the full recovery of their amortized cost bases.
All individual securities that have been in a continuous unrealized loss position for less than twelve months at December 31, 2010 had investment grade ratings upon purchase. The issuers of these securities, except as noted below, have not, to the Company’s knowledge, established any cause for default on these securities and the various rating agencies have reaffirmed these securities’ long-term investment grade status at December 31, 2010.
The Company owns one collateralized debt obligation (“CDO”) security that is backed by trust preferred securities issued by banks and thrifts. This security has been in a continuous unrealized loss position for twelve months or more at December 31, 2010. The market for this security at December 31, 2010 is not active and markets for similar securities are also not active. The inactivity was evidenced first by a significant widening of the bid-ask spread in the brokered markets in which these CDO’s trade and then by a significant decrease in the volume of trades relative to historical level. There are currently very few market participants who are willing and able to transact for these securities.
Moody’s downgraded the security to non-investment grade for credit impairment on November 13, 2008. As a result of the Company’s periodic reviews for impairment, the corporate trust preferred security was written down by $9.9 million and charged to OTTI during 2008 and the book value of the security held in the available-for-sale investment portfolio was adjusted to $1.1 million as of December 31, 2008.
As of April 1, 2009, the Company adopted a new guidance in ASC 320, Investments – Debt and Equity Securities, (formerly FSP 115-2), under which the Company analyzed the security where OTTI of $9.9 million had been previously recognized. Based on our assessment that we did not intend to sell a security and it was not likely that we would be required to sell the security but we did not expect to recover the entire amortized cost basis of the security, we determined that $1.6 million of the previous OTTI was noncredit related. As a result, $1.6 million was reinstated to the amortized cost of the security and we recorded a cumulative effect adjustment, net of tax, and other comprehensive income in the amount of $0.9 million.
At December 31, 2010, the fair value of the security was $0.8 million due to the decline in the fair value which is considered temporary. The methodologies for measuring fair value of this security and assessing whether the impairment is other than temporary are discussed in Note 4 to the consolidated financial statements.
The Company considers numerous factors to determine any OTTI for the CDO TRUPS security including review of trustee reports, monitoring of “break in yield” tests, analysis of current defaults and deferrals and the expectation for future defaults and deferrals. The Company reviews the key financial characteristics for individual issuers (commercial banks or thrifts) in the CDO TRUPS security and considers capital ratios, leverage ratios, nonperforming loan and nonperforming asset ratios, in addition to the credit ratings. The credit ratings of the Company’s CDO TRUPS security are “Ca” (Moody’s) and “C” (Fitch) at December 31, 2010.
The Company uses cash flow projection for the purpose of assessing OTTI on CDO TRUPS security which incorporates certain credit events in the underlying collaterals and prepayment assumptions. The projected issuer default rates are assumed at a rate equivalent to 150 basis points applied annually and have a 0% recovery factor after the initial default date. The principal is assumed to be prepaying at 1% annually and at 100% at maturity.
Based on the results from the cash flow model, the CDO TRUPS security did not experience an adverse change in its cash flow status. As such, based on all of these factors, the Company determined that there was no OTTI adjustment as of December 31, 2010. The risk of future OTTI will be highly dependent upon the performance of the underlying issuers. The Company does not have the intention to sell and does not believe it will be required to sell the CDO TRUPS security.
99
Table of Contents
7. NON-COVERED LOANS AND ALLOWANCE FOR LOAN LOSSES
Non-covered loans, segregated by class of loans, consist of the following at December 31, 2010 and 2009:
| 2010 | 2009 | |||||||
| (Dollars in thousands) | ||||||||
| Construction |
$ | 14,803 | $ | 21,014 | ||||
| Commercial - Real Estate |
914,003 | 1,007,794 | ||||||
| Commercial - Business |
315,285 | 295,289 | ||||||
| Trade Finance |
71,174 | 39,290 | ||||||
| SBA |
101,683 | 49,933 | ||||||
| Consumer |
71,279 | 75,523 | ||||||
| Other |
40,039 | 50,037 | ||||||
| Total non-covered loans and loans held for sale (1) |
1,528,266 | 1,538,880 | ||||||
| Allowance for Losses |
(52,047 | ) | (58,543 | ) | ||||
| Net deferred Loan Fees (2) |
523 | (331 | ) | |||||
| Discount on SBA Loans Retained |
(862 | ) | (864 | ) | ||||
| Net non-covered loans and loans held for sale |
$ | 1,475,880 | $ | 1,479,142 | ||||
| 1 | This includes loans held for sale of $60.2 million and $23.3 million at the lower of cost or fair value at December 31, 2010 and 2009, respectively. |
| 2 | Net deferred loan fees are net of origination costs. In 2010 origination costs exceeded fees on SBA origination. |
As of December 31, 2010, the Company has pledged, under a blanket lien, all qualifying commercial and residential loans as collateral under the borrowing agreement with FHLB with a total carrying value of $828.0 million.
The following is a summary of activity in the allowance for loan losses on non-covered loans for the years ended December 31, 2010, 2009 and 2008:
| 2010 | 2009 | 2008 | ||||||||||
| (Dollars in thousands) | ||||||||||||
| Balance at beginning of period |
$ | 58,543 | $ | 38,172 | $ | 20,477 | ||||||
| Provision for loan losses |
21,000 | 77,472 | 26,178 | |||||||||
| Charge-offs |
(32,647 | ) | (57,832 | ) | (8,889 | ) | ||||||
| Recoveries of charge-offs |
5,151 | 731 | 406 | |||||||||
| Balance at end of period |
$ | 52,047 | $ | 58,543 | $ | 38,172 | ||||||
100
Table of Contents
The activity in the allowance for loan losses on total loans (including non-covered loans and covered loans) by portfolio segment for the years ended December 31, 2010 and 2009 is as follows:
| Real Estate | Commercial | Consumer / Others |
Total | |||||||||||||
| (Dollars in thousands) | ||||||||||||||||
| Year ended December 31, 2010 |
||||||||||||||||
| Beginning balance |
$ | 37,604 | $ | 19,000 | $ | 1,939 | $ | 58,543 | ||||||||
| Charge-offs |
(21,243 | ) | (10,637 | ) | (767 | ) | (32,647 | ) | ||||||||
| Recoveries |
1,918 | 3,079 | 154 | 5,151 | ||||||||||||
| Provision |
10,993 | 10,593 | 424 | 22,010 | ||||||||||||
| Ending balance |
$ | 29,272 | $ | 22,035 | $ | 1,750 | $ | 53,057 | ||||||||
| Period-end amount allocated to: |
||||||||||||||||
| Loans individually evaluated for impairment |
$ | 2,349 | $ | 8,965 | $ | 329 | $ | 11,643 | ||||||||
| Loans collectively evaluated for impairment |
26,923 | 12,060 | 1,421 | 40,404 | ||||||||||||
| Loans acquired with deteriorated credit quality |
— | 1,010 | — | 1,010 | ||||||||||||
| Ending balance |
$ | 29,272 | $ | 22,035 | $ | 1,750 | $ | 53,057 | ||||||||
| Year ended December 31, 2009 |
||||||||||||||||
| Beginning balance |
$ | 23,251 | $ | 13,744 | $ | 1,177 | $ | 38,172 | ||||||||
| Charge-offs |
(30,586 | ) | (25,647 | ) | (1,599 | ) | (57,832 | ) | ||||||||
| Recoveries |
— | 337 | 394 | 731 | ||||||||||||
| Provision |
44,939 | 30,566 | 1,967 | 77,472 | ||||||||||||
| Ending balance |
$ | 37,604 | $ | 19,000 | $ | 1,939 | $ | 58,543 | ||||||||
| Period-end amount allocated to: |
||||||||||||||||
| Loans individually evaluated for impairment |
$ | 2,453 | $ | 138 | $ | 66 | $ | 2,657 | ||||||||
| Loans collectively evaluated for impairment |
35,151 | 18,862 | 1,873 | 55,886 | ||||||||||||
| Loans acquired with deteriorated credit quality |
— | — | — | — | ||||||||||||
| Ending balance |
$ | 37,604 | $ | 19,000 | $ | 1,939 | $ | 58,543 | ||||||||
| Financing receivables: | ||||||||||||||||
| Real Estate | Commercial | Consumer / Others |
Total | |||||||||||||
| (Dollars in thousands) | ||||||||||||||||
| 2010 |
||||||||||||||||
| Loans individually evaluated for impairment |
$ | 69,287 | $ | 26,830 | $ | 1,460 | $ | 97,577 | ||||||||
| Loans collectively evaluated for impairment |
859,519 | 461,312 | 109,858 | 1,430,689 | ||||||||||||
| Loans acquired with deteriorated credit quality |
72,249 | 44,129 | 915 | 117,293 | ||||||||||||
| Ending balance |
$ | 1,001,055 | $ | 532,271 | $ | 112,233 | $ | 1,645,559 | ||||||||
| 2009 |
||||||||||||||||
| Loans individually evaluated for impairment |
$ | 65,243 | $ | 11,137 | $ | 723 | $ | 77,103 | ||||||||
| Loans collectively evaluated for impairment |
963,565 | 373,375 | 124,837 | 1,461,777 | ||||||||||||
| Loans acquired with deteriorated credit quality |
— | — | — | — | ||||||||||||
| Ending balance |
$ | 1,028,808 | $ | 384,512 | $ | 125,560 | $ | 1,538,880 | ||||||||
Although the Company has a diversified loan portfolio, a substantial portion of its debtors’ ability to honor their contracts is dependent upon the real estate market in California. Should the real estate market experience an overall decline in property values, the ability of borrowers to make timely scheduled principal and interest payments on the Company’s loans may be adversely affected and, in turn, may result in increased delinquencies and foreclosures. In the event of foreclosures, the value of the property acquired may be less than the appraised value when the loan was originated and may, in some instances, result in
101
Table of Contents
insufficient proceeds upon disposition to recover the Company’s investment in the foreclosed property. Furthermore, although most of the Company’s trade finance activities are related to trade with Asia, these loans are generally made to companies domiciled or with collateral in the United States of America.
The Bank generally writes down nonperforming collateral dependent impaired loans to the value of the underlying collateral. The collateral value is generally updated every six months and the impairment amount is generally charged off during the quarter in which collateral value is updated. The performing impaired loans, such as performing TDRs, are allocated with specific reserve and are not generally charged off. The performing impaired loans typically continue to make contractual payments according to its restructured terms and conditions.
| As of December 31, | ||||||||
| 2010 | 2009 | |||||||
| (Dollars in thousands) | ||||||||
| Impaired loans with specific reserves |
||||||||
| Without charge-offs |
$ | 35,109 | $ | 15,951 | ||||
| With charge-offs |
2,575 | 6,094 | ||||||
| Impaired loans without specific reserves |
||||||||
| Without charge-offs |
49,043 | 32,768 | ||||||
| With charge-offs |
10,850 | 22,290 | ||||||
| Total impaired loans |
97,577 | 77,103 | ||||||
| Allowance on impaired loans |
(11,643 | ) | (2,656 | ) | ||||
| Net recorded investment in impaired loans |
$ | 85,934 | $ | 74,447 | ||||
| Total non-covered nonperforming loans |
$ | 45,518 | $ | 63,453 | ||||
Non-covered nonperforming loans totaled $45.5 million at December 31, 2010, a decrease of $17.9 million as compared to $63.5 million at December 31, 2009. Non-covered nonperforming loans as a percentage of total non-covered loans decreased to 2.98% at December 31, 2010 as compared to 4.12% at December 31, 2009. Gross interest income of approximately $2.1 million and $3.8 million would have been recorded for the year ended December 31, 2010 and 2009, respectively, if these loans had been paid in accordance with their original terms and had been outstanding throughout the applicable period then ended or, if not outstanding throughout the applicable period then ended, since origination.
The following table shows non-covered nonperforming loans by class of loans as of December 2010 and 2009, respectively:
| As of December 31, | ||||||||
| 2010 | 2009 | |||||||
| (Dollars in thousands) | ||||||||
| Real Estate |
||||||||
| Construction |
$ | 6,108 | $ | 8,441 | ||||
| Commercial - Real Estate |
29,167 | 42,678 | ||||||
| Commercial |
||||||||
| Commercial - Business |
5,696 | 8,290 | ||||||
| Trade Finance |
— | 1,498 | ||||||
| SBA |
3,896 | 2,207 | ||||||
| Others |
||||||||
| Consumer |
651 | 339 | ||||||
| Other |
— | — | ||||||
| Total |
$ | 45,518 | $ | 63,453 | ||||
102
Table of Contents
The following table provides information on impaired loans, segregated by class of loans, for the periods indicated:
| As of and For the Year Ended December 31, 2010 | ||||||||||||||||||||
| Recorded Investment (1) |
Unpaid Principal Balance |
Related Allowance |
Average Recorded Investment |
Interest Income Recognized |
||||||||||||||||
| (Dollars in thousands) | ||||||||||||||||||||
| With no related allowance recorded: |
|
|||||||||||||||||||
| Real Estate |
||||||||||||||||||||
| Construction |
$ | 3,514 | $ | 3,501 | $ | — | $ | 2,841 | $ | 20 | ||||||||||
| Commercial - Real Estate |
45,251 | 45,042 | — | 53,451 | 798 | |||||||||||||||
| Commercial |
||||||||||||||||||||
| Commercial - Business |
10,277 | 10,216 | — | 8,746 | 277 | |||||||||||||||
| Trade Finance |
— | — | — | 80 | 4 | |||||||||||||||
| SBA |
490 | 488 | — | 383 | 41 | |||||||||||||||
| Others |
||||||||||||||||||||
| Consumer |
646 | 646 | — | 538 | 21 | |||||||||||||||
| Other |
— | — | — | — | — | |||||||||||||||
| Total |
$ | 60,178 | $ | 59,893 | $ | — | $ | 66,039 | $ | 1,161 | ||||||||||
| With an allowance recorded: |
||||||||||||||||||||
| Real Estate |
||||||||||||||||||||
| Construction |
$ | 2,606 | $ | 2,607 | $ | 223 | $ | 3,289 | $ | — | ||||||||||
| Commercial - Real Estate |
18,263 | 18,137 | 2,126 | 26,981 | 659 | |||||||||||||||
| Commercial |
||||||||||||||||||||
| Commercial - Business |
13,758 | 13,649 | 8,022 | 6,111 | 165 | |||||||||||||||
| Trade Finance |
1,219 | 1,199 | 633 | 915 | 53 | |||||||||||||||
| SBA |
1,275 | 1,278 | 310 | 710 | 57 | |||||||||||||||
| Others |
||||||||||||||||||||
| Consumer |
817 | 814 | 329 | 637 | 20 | |||||||||||||||
| Other |
— | — | — | — | — | |||||||||||||||
| Total |
$ | 37,938 | $ | 37,684 | $ | 11,643 | $ | 38,643 | $ | 954 | ||||||||||
| Total |
||||||||||||||||||||
| Real Estate |
||||||||||||||||||||
| Construction |
$ | 6,120 | $ | 6,108 | $ | 223 | $ | 6,130 | $ | 20 | ||||||||||
| Commercial - Real Estate |
63,514 | 63,179 | 2,126 | 80,432 | 1,457 | |||||||||||||||
| Commercial |
||||||||||||||||||||
| Commercial - Business |
24,035 | 23,865 | 8,022 | 14,857 | 442 | |||||||||||||||
| Trade Finance |
1,219 | 1,199 | 633 | 995 | 57 | |||||||||||||||
| SBA |
1,765 | 1,766 | 310 | 1,093 | 98 | |||||||||||||||
| Others |
||||||||||||||||||||
| Consumer |
1,463 | 1,460 | 329 | 1,175 | 41 | |||||||||||||||
| Other |
— | — | — | — | — | |||||||||||||||
| Total |
$ | 98,116 | $ | 97,577 | $ | 11,643 | $ | 104,682 | $ | 2,115 | ||||||||||
| 1 | Includes unpaid principal balance plus any accrued interest, net deferred fees. |
103
Table of Contents
| As of and For the Year Ended December 31, 2009 | ||||||||||||||||||||
| Recorded Investment (1) |
Unpaid Principal Balance |
Related Allowance |
Average Recorded Investment |
Interest Income Recognized |
||||||||||||||||
| (Dollars in thousands) | ||||||||||||||||||||
| With no related allowance recorded: |
|
|||||||||||||||||||
| Real Estate |
||||||||||||||||||||
| Construction |
$ | 4,345 | $ | 4,332 | $ | — | $ | 3,482 | $ | 47 | ||||||||||
| Commercial - Real Estate |
40,165 | 39,961 | — | 17,171 | 271 | |||||||||||||||
| Commercial |
||||||||||||||||||||
| Commercial - Business |
9,813 | 9,718 | — | 6,249 | 206 | |||||||||||||||
| Trade Finance |
301 | 303 | — | 86 | 2 | |||||||||||||||
| SBA |
261 | 260 | — | 405 | 47 | |||||||||||||||
| Others |
||||||||||||||||||||
| Consumer |
486 | 484 | — | 651 | 18 | |||||||||||||||
| Other |
— | — | — | — | — | |||||||||||||||
| Total |
$ | 55,371 | $ | 55,058 | $ | — | $ | 28,044 | $ | 591 | ||||||||||
| With an allowance recorded: |
||||||||||||||||||||
| Real Estate |
||||||||||||||||||||
| Construction |
$ | 4,176 | $ | 4,109 | $ | 544 | $ | 7,924 | $ | 75 | ||||||||||
| Commercial - Real Estate |
16,900 | 16,840 | 1,908 | 42,773 | 1,366 | |||||||||||||||
| Commercial |
||||||||||||||||||||
| Commercial - Business |
561 | 553 | 108 | 27,775 | 590 | |||||||||||||||
| Trade Finance |
304 | 304 | 30 | 1,641 | 101 | |||||||||||||||
| SBA |
— | — | — | 523 | 11 | |||||||||||||||
| Others |
||||||||||||||||||||
| Consumer |
239 | 239 | 66 | 522 | 13 | |||||||||||||||
| Other |
— | — | — | — | — | |||||||||||||||
| Total |
$ | 22,180 | $ | 22,045 | $ | 2,656 | $ | 81,158 | $ | 2,156 | ||||||||||
| Total |
||||||||||||||||||||
| Real Estate |
||||||||||||||||||||
| Construction |
$ | 8,521 | $ | 8,441 | $ | 544 | $ | 11,406 | $ | 122 | ||||||||||
| Commercial - Real Estate |
57,065 | 56,801 | 1,908 | 59,944 | 1,637 | |||||||||||||||
| Commercial |
||||||||||||||||||||
| Commercial - Business |
10,374 | 10,271 | 108 | 34,024 | 796 | |||||||||||||||
| Trade Finance |
605 | 607 | 30 | 1,727 | 103 | |||||||||||||||
| SBA |
261 | 260 | — | 928 | 58 | |||||||||||||||
| Others |
||||||||||||||||||||
| Consumer |
725 | 723 | 66 | 1,173 | 31 | |||||||||||||||
| Other |
— | — | — | — | — | |||||||||||||||
| Total |
$ | 77,551 | $ | 77,103 | $ | 2,656 | $ | 109,202 | $ | 2,747 | ||||||||||
| 1 | Includes unpaid principal balance plus any accrued interest, net deferred fees. |
104
Table of Contents
The following table provides aging information on non-covered past due loans, segregated by class of loans, as of dates indicated:
| December 31, 2010 | 30-59 Days Past Due |
60-89 Days Past Due |
Greater Than 90 Days |
Total Past Due |
Current | Total Financing Receivables |
||||||||||||||||||
| (Dollars in thousands) | ||||||||||||||||||||||||
| Real Estate |
||||||||||||||||||||||||
| Construction |
$ | — | $ | — | $ | 6,108 | $ | 6,108 | $ | 8,695 | $ | 14,803 | ||||||||||||
| Commercial - Real Estate |
4,569 | 5,023 | 29,167 | 38,759 | 875,244 | 914,003 | ||||||||||||||||||
| Commercial |
||||||||||||||||||||||||
| Commercial - Business |
291 | 1,018 | 5,696 | 7,005 | 308,280 | 315,285 | ||||||||||||||||||
| Trade Finance |
254 | 28 | — | 282 | 70,892 | 71,174 | ||||||||||||||||||
| SBA |
1,383 | 1,074 | 3,896 | 6,353 | 95,330 | 101,683 | ||||||||||||||||||
| Others |
||||||||||||||||||||||||
| Consumer |
386 | 177 | 651 | 1,214 | 70,065 | 71,279 | ||||||||||||||||||
| Other |
— | — | — | — | 40,039 | 40,039 | ||||||||||||||||||
| Total |
$ | 6,883 | $ | 7,320 | $ | 45,518 | $ | 59,721 | $ | 1,468,545 | $ | 1,528,266 | ||||||||||||
| December 31, 2009 | 30-59 Days Past Due |
60-89 Days Past Due |
Greater Than 90 Days |
Total Past Due |
Current | Total Financing Receivables |
||||||||||||||||||
| (Dollars in thousands) | ||||||||||||||||||||||||
| Real Estate |
||||||||||||||||||||||||
| Construction |
$ | — | $ | — | $ | 8,441 | $ | 8,441 | $ | 12,573 | $ | 21,014 | ||||||||||||
| Commercial - Real Estate |
8,150 | 532 | 42,678 | 51,360 | 956,434 | 1,007,794 | ||||||||||||||||||
| Commercial |
||||||||||||||||||||||||
| Commercial - Business |
1,945 | 495 | 8,290 | 10,730 | 284,559 | 295,289 | ||||||||||||||||||
| Trade Finance |
— | — | 1,498 | 1,498 | 37,792 | 39,290 | ||||||||||||||||||
| SBA |
787 | 989 | 2,207 | 3,983 | 45,950 | 49,933 | ||||||||||||||||||
| Others |
||||||||||||||||||||||||
| Consumer |
461 | 80 | 339 | 880 | 74,643 | 75,523 | ||||||||||||||||||
| Other |
— | — | — | — | 50,037 | 50,037 | ||||||||||||||||||
| Total |
$ | 11,343 | $ | 2,096 | $ | 63,453 | $ | 76,892 | $ | 1,461,988 | $ | 1,538,880 | ||||||||||||
The Company utilizes a risk grading matrix to assign a risk grade to its loan portfolio. The Company categorizes loans into risk categories based on relevant information about the ability of borrowers to service their debt such as current financial information, historical payment experience, credit documentation, public information, and current economic trends, among other factors. Loans, excluding homogeneous loans, are individually analyzed by classifying loans as to credit risk and are graded on a scale of 1 to 7 at least on a quarterly basis. A description of the general characteristics of the seven risk grades is as follows:
Grade 1 - This grade includes loans secured by cash or listed securities. The borrowers generally have significant capital strength with unquestionable ability to service the debt.
Grades 2 and 3 - These grades include “pass grade” loans to borrowers of solid or acceptable credit quality and risk. The borrowers generally have sufficient capital strength with highly reliable or adequate primary source of repayment.
Grade 3A - This grade includes loans on management’s “watch list” and is intended to be utilized on a temporary basis for pass grade borrowers. The borrowers generally experiencing a temporary setback and may have weakening primary source of repayment.
Grade 4 - This grade is for “Special Mentioned” in accordance with regulatory guidelines. This grade includes borrowers that require close credit monitoring. The borrowers generally have inconclusive earnings history and access to alternate sources of financing are limited.
Grade 5 - This grade includes “Substandard” loans in accordance with regulatory guidelines. The borrowers typically have well-defined weaknesses with possibility of payment default or some loss if the weakness is not corrected.
Grade 6 - This grade includes “Doubtful” loans in accordance with regulatory guidelines. Such loans are placed on non-accrual status and the liquidation of collateral in full is highly questionable or improbable.
105
Table of Contents
Grade 7 - This grade includes “Loss” loans in accordance with regulatory guidelines. Such loans are deemed uncollectible and are to be charged off or charged down. This classification is not intended to imply that the loan or some portion of it will never be paid.
The following table presents the credit risk profile of non-covered loans, segregated by class of loans, as of dates indicated:
| As of December 31, 2010 | ||||||||||||||||||||
| Grade 1 - 3A | Grade 4 | Grade 5 | Grade 6 | Total | ||||||||||||||||
| (Dollars in thousands) | ||||||||||||||||||||
| Non-covered loans |
||||||||||||||||||||
| Real estate |
||||||||||||||||||||
| Construction |
$ | 7,689 | $ | — | $ | 7,114 | $ | — | $ | 14,803 | ||||||||||
| Commercial - Real Estate |
794,291 | 47,873 | 71,498 | 341 | 914,003 | |||||||||||||||
| Commercial |
||||||||||||||||||||
| Commercial - Business |
255,828 | 18,759 | 40,080 | 618 | 315,285 | |||||||||||||||
| Trade Finance |
68,598 | 1,100 | 1,476 | — | 71,174 | |||||||||||||||
| SBA |
95,838 | 880 | 4,956 | 9 | 101,683 | |||||||||||||||
| Others |
||||||||||||||||||||
| Consumer |
69,598 | — | 1,681 | — | 71,279 | |||||||||||||||
| Other |
40,039 | — | — | — | 40,039 | |||||||||||||||
| Total |
$ | 1,331,881 | $ | 68,612 | $ | 126,805 | $ | 968 | $ | 1,528,266 | ||||||||||
| As of December 31, 2009 | ||||||||||||||||||||
| Grade 1 - 3A | Grade 4 | Grade 5 | Grade 6 | Total | ||||||||||||||||
| (Dollars in thousands) | ||||||||||||||||||||
| Non-covered loans |
||||||||||||||||||||
| Real estate |
||||||||||||||||||||
| Construction |
$ | 12,499 | $ | — | $ | 8,515 | $ | — | $ | 21,014 | ||||||||||
| Commercial - Real Estate |
881,488 | 46,519 | 79,787 | — | 1,007,794 | |||||||||||||||
| Commercial |
||||||||||||||||||||
| Commercial - Business |
213,143 | 50,771 | 30,544 | 831 | 295,289 | |||||||||||||||
| Trade Finance |
36,856 | 663 | 1,771 | — | 39,290 | |||||||||||||||
| SBA |
45,302 | 2,119 | 2,395 | 117 | 49,933 | |||||||||||||||
| Others |
||||||||||||||||||||
| Consumer |
72,222 | 1,612 | 1,689 | — | 75,523 | |||||||||||||||
| Other |
50,037 | — | — | — | 50,037 | |||||||||||||||
| Total |
$ | 1,311,547 | $ | 101,684 | $ | 124,701 | $ | 948 | $ | 1,538,880 | ||||||||||
The Company’s allowance for loan loss methodologies incorporate a variety of risk considerations, both quantitative and qualitative, in establishing an allowance for loan losses that management believes is appropriate at each reporting date. Quantitative factors include the Company’s historical loss experience, delinquency and charge-off trends, collateral values, changes in nonperforming loans, and other factors. Quantitative factors also incorporate known information about individual loans, including borrowers’ sensitivity to interest rate movements and to quantifiable external factors including commodity and finished good prices as well as acts of nature (earthquakes, floods, fires, etc.) that occur in a particular period. Qualitative factors include the general economic environment in the Company’s markets and, in particular, the state of certain industries. Size and complexity of individual credits, loan structure, extent and nature of waivers of existing loan policies and pace of portfolio growth are other qualitative factors that are considered in its methodologies. As the Company adds new products, increases the complexity of the loan portfolio, and expands its geographic coverage, the Company will enhance the methodologies to keep pace with the size and complexity of the loan portfolio. Changes in any of the above factors could have significant impact to the allowance for loan loss calculation. The Company believes that its methodologies continue to be appropriate given its size and level of complexity.
The allowance for loan losses reflects management’s judgment of the level of allowance adequate to provide for probable losses inherent in the loan portfolio as of the date of the consolidated statements of financial condition. On a quarterly basis, the Company assesses the overall adequacy of the allowance for loan losses, utilizing a disciplined and systematic approach which includes the application of a specific allowance for identified problem loans, a formula allowance for identified graded loans and an allocated allowance for large groups of smaller balance homogenous loans.
106
Table of Contents
Allowance for Specifically Identified Problem Loans. A specific allowance is established for impaired loans. A loan is impaired when, based on current information and events, it is probable that a creditor will be unable to collect all amounts due according to the contractual terms of the loan agreement. The specific allowance is determined based on the present value of expected future cash flows discounted at the loan’s effective interest rate, except that as a practical expedient, the Company may measure impairment based on a loan’s observable market price, or the fair value of the collateral if the loan is collateral dependent. The Company measures impairment based on the fair value of the collateral, adjusted for the cost related to liquidation of the collateral.
Formula Allowance for Identified Graded Loans. Non-homogenous loans such as commercial real estate, construction, commercial business, trade finance and SBA loans that are not subject to the allowance for specifically identified loans discussed above are not reviewed individually and are subject to a formula allowance. The formula allowance is calculated by applying loss factors to outstanding Pass, Special Mention, Substandard and Doubtful loans. The evaluation of the inherent loss for these loans involves a high degree of uncertainty, subjectivity and judgment because probable loan losses are not identified with a specific loan. In determining the formula allowance, the Company relies on a mathematical calculation that incorporates a six-quarter rolling average of historical losses, which has been adjusted from the twelve quarter analysis used historically. The Company started using the six-quarter rolling average beginning in the fourth quarter of 2008 instead of the twelve-quarter rolling average that the Company had historically been applying. Current quarter losses are measured against previous quarter loan balances to develop the loss factor. Loans risk rated Pass, Special Mention and Substandard for the most recent three quarters are adjusted to an annual basis as follows:
| • | the most recent quarter is weighted 4/1; |
| • | the second most recent is weighted 4/2; |
| • | the third most recent is weighted 4/3. |
The formula allowance may be further adjusted to account for the following qualitative factors:
| • | Changes in lending policies and procedures, including underwriting standards and collection, charge-off, and recovery practices; |
| • | Changes in national and local economic and business conditions and developments, including the condition of various market segments; |
| • | Changes in the nature and volume of the loan portfolio; |
| • | Changes in the experience, ability, and depth of lending management and staff; |
| • | Changes in the trend of the volume and severity of past due and classified loans, and trends in the volume of non-accrual loans and troubled debt restructurings, and other loan modifications; |
| • | Changes in the quality of the Company’s loan review system and the degree of oversight by the directors; |
| • | The existence and effect of any concentrations of credit, and changes in the level of such concentrations; and |
| • | The effect of external factors such as competition and legal and regulatory requirements on the level of estimated losses in the Company’s loan portfolio. |
Allowance for Large Groups of Smaller Balance Homogenous Loans. The portion of the allowance allocated to large groups of smaller balance homogenous loans is focused on loss experience for the pool rather than on an analysis of individual loans. Large groups of smaller balance homogenous loans mainly consist of consumer loans to individuals. The allowance for groups of performing loans is based on historical losses over a six-quarter period. In determining the level of allowance for delinquent groups of loans, the Company classifies groups of homogenous loans based on the number of days delinquent and other qualitative factors and trends.
A loan is classified as a troubled debt restructured (“TDR”) when a borrower is experiencing financial difficulties that lead to a restructuring of the loan, and the Company grants concessions to the borrower in the restructuring that it would not otherwise consider. These concessions may include interest rate reductions, principal forgiveness, extension of maturity date and other actions intended to minimize potential losses. Loans restructured at a rate equal to or greater than that of a new loan with comparable risk at the time the loan is modified may be excluded from restructured loan disclosures in years subsequent to the restructuring if the loans are in compliance with their modified terms. Generally, a nonaccrual loan that is restructured remains on nonaccrual for a period of six months to demonstrate that the borrower can meet the restructured terms. However, the
107
Table of Contents
borrower’s performance prior to the restructuring, or other significant events at the time of restructuring may be considered in assessing whether the borrower can meet the new terms and may result in the loan being returned to accrual status after a shorter performance period. If the borrower’s performance under the new terms is not reasonably assured, the loan remains classified as a nonaccrual loan.
The restructuring of a loan is intended to recover as much of the Company’s investment as possible and to achieve the highest yield possible. At December 31, 2010 and 2009, TDRs amounted to $39.1 million and $27.1 million, respectively, of which $21.4 million and $4.4 million were fully performing at December 31, 2010 and 2009, respectively. There were no unfunded commitments to the borrowers whose terms have been modified as a TDR as of December 31, 2010 and 2009, respectively.
The following table shows activities in servicing assets and liabilities for the years ended December 31, 2010 and 2009:
| December 31, 2009 |
Net Purchases, Sales and Settlements |
Accretion (Amortization) |
December 31, 2010 |
|||||||||||||
| (Dollars in thousands) | ||||||||||||||||
| Servicing assets |
$ | 902 | $ | 1,360 | $ | (664 | ) | $ | 1,598 | |||||||
| Servicing liabilities |
(246 | ) | — | 80 | (166 | ) | ||||||||||
| $ | 656 | $ | 1,360 | $ | (584 | ) | $ | 1,432 | ||||||||
| December 31, 2008 |
Net Purchases, Sales and Settlements |
Accretion (Amortization) |
December 31, 2009 |
|||||||||||||
| (Dollars in thousands) | ||||||||||||||||
| Servicing assets |
$ | 1,244 | $ | — | $ | (342 | ) | $ | 902 | |||||||
| Servicing liabilities |
(333 | ) | — | 87 | (246 | ) | ||||||||||
| $ | 911 | $ | — | $ | (255 | ) | $ | 656 | ||||||||
At December 31, 2010 and 2009, the Company serviced loans sold to unaffiliated parties in the amounts of $270.0 million and $113.0 million, respectively. The Company recorded an addition to servicing assets of $1.4 million and $0 and net amortization of servicing assets of $584,000 and $255,000 during the years ended December 31, 2010, and 2009, respectively. There was no valuation allowance for the servicing assets at December 31, 2010 and 2009. The servicing assets, net of servicing liabilities, are included in other assets in the accompanying Consolidated Statements of Financial Condition. The net servicing assets balance as of December 31, 2010 and 2009 was $1.4 million and $656,000, respectively.
Loan servicing assets and servicing liabilities represent the value associated with servicing loans sold. The value is determined through a discounted cash flow analysis which uses interest rates, prepayments speed and adequate compensation assumptions as inputs. The following table presents activities in servicing assets and servicing liabilities during the periods indicated:
The following is an analysis of all loans to officers and directors of the Company and its affiliates as of December 31, 2010 and 2009. All such loans were made under terms that are consistent with the Company’s normal lending policies.
| 2010 | 2009 | |||||||
| (Dollars in thousands) | ||||||||
| Balance at beginning of period |
$ | 1,707 | $ | 10,904 | ||||
| New loans or disbursements |
1,757 | 233 | ||||||
| 3,464 | 11,137 | |||||||
| Less: repayments |
(162 | ) | (9,430 | ) | ||||
| Balance at end of period |
$ | 3,302 | $ | 1,707 | ||||
| Available lines of credit at end of period |
$ | 2,432 | $ | 307 | ||||
Directors of the Company guaranteed loan balances of $4.0 million and $0.3 million at December 31, 2010 and 2009, respectively.
108
Table of Contents
8. COVERED ASSETS AND FDIC LOSS SHARE RECEIVABLE
Covered Loans
Loans acquired in an FDIC-assisted acquisition that are subject to a loss sharing agreement are referred to as “covered loans” and reported separately in the consolidated statements of financial condition. Covered loans are reported exclusive of the expected cash flow reimbursements expected from the FDIC. There were no acquired loans accounted for as debt securities.
Covered loans are valued as of acquisition date in accordance with FASB ASC 805, Business Combinations. Loans purchased with evidence of credit deterioration since origination for which it is probable that all contractually required payments will not be collected are accounted for under FASB ASC 310-30, Loans and Debt Securities Acquired with Deteriorated Credit Quality. In addition, because of the significant discounts associated with the acquired portfolios, the Company elected to account for all of the acquired loans, with the exception of a small population of loans, under ASC 310-30 (formerly known as SOP 03-3) in the amount of $125.2 million at acquisition. Certain cash secured loans and overdrafts in the amount of $923,000 were not accounted for under ASC 310-30. Under ASC 805 and ASC 310-30, loans are recorded at fair value at acquisition date, factoring in credit losses expected to be incurred over the life of the loan. Accordingly, an allowance for loan losses is not carried over or recorded as of the acquisition date.
The following table reflects the estimated fair value of the acquired loans at the acquisition date:
| April 16, 2010 | ||||
| (Dollars in thousands) | ||||
| Gross loans acquired |
$ | 162,248 | ||
| Discount |
(36,081 | ) | ||
| Covered loans, net |
$ | 126,167 | ||
If credit deterioration is experienced subsequent to the initial acquisition fair value amount, such deterioration of the expected cash flows will be measured, and a provision for credit losses will be charged to earnings. The effect of the provision for credit losses on covered loans will be offset, to the extent of the 80% loss share, by an increase to the FDIC loss share receivable. Any increase in the FDIC loss share receivable will be recognized in non-interest income. Through December 31, 2010, provisions for credit losses of $1.0 million have been recorded related to the covered loan portfolio. This provision reflects credit deterioration since the acquisition date based on decreases in expected cash flows as of December 31, 2010 compared to the acquisition date.
The outstanding principal balance of covered loans, excluding fair value adjustments, at December 31, 2010 was $147.6 million. At December 31, 2010, total covered loan, inclusive of fair value adjustments, amounted to $117.3 million. The following table presents covered loans, segregated by class of loans, as of April 16, 2010 (the acquisition date) and December 31, 2010:
| December 31, 2010 | April 16, 2010 | |||||||
| (Dollars in thousands) | ||||||||
| Commercial - Real Estate |
$ | 72,249 | $ | 78,430 | ||||
| Commercial - Business |
8,977 | 12,336 | ||||||
| SBA |
35,152 | 34,478 | ||||||
| Other |
915 | 923 | ||||||
| Total covered loans |
117,293 | 126,167 | ||||||
| Less: |
||||||||
| ALLL due to decrease in expected cash flows |
1,010 | — | ||||||
| Net covered loans |
$ | 116,283 | $ | 126,167 | ||||
109
Table of Contents
The following table presents outstanding principal balance and related fair value adjustments of covered loans, segregated by class of loans, as of April 16, 2010 (the acquisition date) and December 31, 2010:
| December 31, 2010 | April 16, 2010 | |||||||||||||||
| Amount | Percent of Total |
Amount | Percent of Total |
|||||||||||||
| (Dollars in thousands) | ||||||||||||||||
| Real Estate: |
||||||||||||||||
| Construction |
$ | — | — | % | $ | 100 | 0.1 | % | ||||||||
| Commercial - Real Estate |
74,193 | 50.3 | 81,889 | 50.5 | ||||||||||||
| Commercial: |
||||||||||||||||
| Commercial - Business |
20,277 | 13.7 | 23,501 | 14.5 | ||||||||||||
| Trade Finance |
— | — | — | — | ||||||||||||
| SBA |
52,681 | 35.7 | 56,190 | 34.6 | ||||||||||||
| Others: |
||||||||||||||||
| Consumer |
486 | 0.3 | 496 | 0.3 | ||||||||||||
| Other |
— | — | 72 | — | ||||||||||||
| Total Covered Loans |
147,637 | 100.0 | 162,248 | 100.0 | ||||||||||||
| Covered discount |
(30,344 | ) | (36,081 | ) | ||||||||||||
| Net valuation of loans |
117,293 | 126,167 | ||||||||||||||
| Less: |
||||||||||||||||
| Allowance for Losses |
1,010 | — | ||||||||||||||
| Total Net Covered Loans |
$ | 116,283 | $ | 126,167 | ||||||||||||
In estimating the fair value of the covered loans at the acquisition date, the Company (i) calculated the contractual amount and timing of undiscounted principal and interest payments of $185.6 million and (ii) estimated the amount and timing of undiscounted expected principal and interest payments of $145.7 million. The difference between these two amounts represents the nonaccretable difference. The nonaccretable difference was $39.9 million at April 16, 2010. The nonaccretable difference represents an estimate of the undiscounted loss exposure in the covered loan portfolio at the acquisition date.
On the acquisition date, the amount by which the undiscounted expected cash flows exceed the estimated fair value of the acquired loans is the “accretable yield”. The accretable yield is then measured at each financial reporting date and represents the difference between the remaining undiscounted expected cash flows and the current carrying value of the loans.
The following table presents the carrying amounts for the covered loans as of December 31, 2010 and April 16, 2010 (acquisition date), respectively:
| December 31, 2010 | April 16, 2010 | |||||||
| (Dollars in thousands) | ||||||||
| Undiscounted contractual cash flows |
$ | 165,355 | $ | 185,576 | ||||
| Nonaccretable difference |
(36,107 | ) | (39,920 | ) | ||||
| Undiscounted cash flows expected to be collected |
129,248 | 145,656 | ||||||
| Accretable difference |
(13,880 | ) | (20,412 | ) | ||||
| Covered loans under ASC 310-30 |
115,368 | 125,244 | ||||||
| Covered loans excluded from ASC 310-30 |
915 | 923 | ||||||
| Total covered loans |
$ | 116,283 | $ | 126,167 | ||||
110
Table of Contents
Changes in the carrying amount of covered loans and the accretable yield were as follows for the year ended December 31, 2010:
| Year Ended December 31, 2010 | ||||||||
| Carrying amount | Accretable | |||||||
| of Loans | Yield | |||||||
| (Dollars in thousands) | ||||||||
| Balance at beginning of period |
$ | — | $ | — | ||||
| Acquisition |
126,167 | 20,412 | ||||||
| Accretion |
6,061 | (6,061 | ) | |||||
| Net payments received |
(13,263 | ) | — | |||||
| Decrease in expected cash flows |
(1,010 | ) | (471 | ) | ||||
| Transfer to OREO |
(1,672 | ) | — | |||||
| Balance at end of period |
$ | 116,283 | $ | 13,880 | ||||
Net payment received includes all cash receipts related to the covered loans, net of the disbursements that are required to repurchase the participation sold portion of the SBA loans prior to collecting this guaranteed balance from the SBA.
Credit Quality Indicators—The covered loans acquired are and will continue to be subject to the Bank’s internal and external credit review and monitoring. The covered loans have the same credit quality indicators as the non-covered loans, to enable the monitoring of the borrower’s credit and the likelihood of repayment.
Loans are risk rated based on analysis of the current state of the borrower’s credit quality. The analysis of credit quality includes review of all sources of repayment, the borrower’s current financial and liquidity status and all other relevant information. The Company utilizes an seven-grade risk rating system, where a higher grade represents a higher level of credit risk. The seven-grade risk rating system can be generally classified by the following categories: Pass or Watch, Special Mention, Substandard, Doubtful and Loss. The risk ratings reflect the relative strength of the sources of repayment. Refer to Note 7 for full discussion of risk grades.
| As of December 31, 2010 | ||||||||||||||||||||||||
| Grade 1 - 3A | Grade 4 | Grade 5 | Grade 6 | Grade 7 | Total | |||||||||||||||||||
| (Dollars in thousands) | ||||||||||||||||||||||||
| Covered loans |
||||||||||||||||||||||||
| Real estate |
||||||||||||||||||||||||
| Construction |
$ | — | $ | — | $ | — | $ | — | $ | — | $ | — | ||||||||||||
| Commercial - Real Estate |
49,703 | 8,482 | 15,735 | 272 | — | 74,192 | ||||||||||||||||||
| Commercial |
||||||||||||||||||||||||
| Commercial - Business |
12,915 | 2,351 | 4,718 | 294 | — | 20,278 | ||||||||||||||||||
| Trade Finance |
— | — | — | — | — | — | ||||||||||||||||||
| SBA |
42,763 | 401 | 7,379 | 601 | 1,537 | 52,681 | ||||||||||||||||||
| Others |
||||||||||||||||||||||||
| Consumer |
486 | — | — | — | — | 486 | ||||||||||||||||||
| Other |
— | — | — | — | — | — | ||||||||||||||||||
| Total Covered Loans |
$ | 105,867 | $ | 11,234 | $ | 27,832 | $ | 1,167 | $ | 1,537 | $ | 147,637 | ||||||||||||
Covered OREO
All OREO acquired in FDIC-assisted acquisitions that are subject to a FDIC loss sharing agreement are referred to as “covered OREO” and reported separately in the consolidated statements of financial condition. Covered OREO is reported exclusive of expected reimbursement cash flows from the FDIC. Foreclosed covered loan collateral is transferred into covered OREO at the loan’s fair value, inclusive of the acquisition date fair value discount.
Covered OREO was initially recorded at its estimated fair value on the acquisition date based on similar market comparable valuations less estimated selling costs. Any subsequent valuation adjustments due to declines in fair value will be charged to non-interest expense, and will be offset, in part, by non-interest income representing the corresponding increase to the FDIC loss share receivable. Any recoveries of previous valuation adjustments will be credited to non-interest expense with a corresponding charge to non-interest income for the portion of the recovery that is due to the FDIC.
111
Table of Contents
The activities related to the covered OREO for the year ended December 31, 2010 are as follows:
| Year Ended December 31, 2010 |
||||
| (Dollars in thousands) | ||||
| Balance at beginning of period |
$ | — | ||
| Acquisition |
1,942 | |||
| Additions to covered OREO |
1,672 | |||
| Fair value adjustment during the period |
— | |||
| Dispositions of covered OREO |
(2,155 | ) | ||
| Balance at end of period |
$ | 1,459 | ||
Covered Nonperforming Assets
Covered nonperforming assets totaled $16.5 million at December 31, 2010. These covered nonperforming assets are subject to loss sharing agreement with the FDIC. The covered nonperforming assets at December 31, 2010 are as follows:
| December 31, 2010 | ||||
| (Dollars in thousands) | ||||
| Covered loans on non-accrual status |
$ | 15,021 | ||
| Covered other real estate owned |
1,459 | |||
| Total covered nonperforming assets |
$ | 16,480 | ||
Loans accounted for under ASC 310-30 are generally considered accruing and performing loans as the loans accrete the accretable discount to interest income over the estimated life of the loan when cash flows are reasonably estimable. Accordingly, acquired impaired loans that are contractually past due are still considered to be accruing and performing loans. The loans may be classified as nonaccrual if the timing and amount of future cash flows is not reasonably estimable.
FDIC Loss Share Receivable
The Company has elected to account for amounts receivable under the loss sharing agreement with the FDIC as FDIC loss share receivable in accordance with FASB ASC 805, Business Combinations. The FDIC loss share receivable was initially recorded at fair value, based on the discounted value of expected future cash flows under the loss sharing agreement. The difference between the present value and the undiscounted cash flows the Company expects to collect from the FDIC will be accreted into non-interest income over the life of the FDIC loss share receivable.
The FDIC loss share receivable is reviewed quarterly and adjusted for any changes in expected cash flows based on recent performance and expectations for future performance of the covered portfolio. These adjustments are measured on the same basis as the related covered loans and covered other real estate owned. Any increases in the cash flows of the covered assets over those expected will reduce the FDIC loss share receivable and any decreases in cash flows of the covered assets under those expected will increase the FDIC loss share receivable. Increases and decreases to the FDIC loss share receivable are recorded as adjustments to non-interest income.
The FDIC loss share receivable was determined to be $25.3 million at the acquisition date. Changes in the FDIC loss share receivable for the year ended December 31, 2010 are as follows:
| Year Ended December 31, 2010 |
||||
| (Dollars in thousands) | ||||
| Balance at beginning of period |
$ | — | ||
| Acquisition |
25,300 | |||
| Payment received from FDIC |
(2,419 | ) | ||
| Accretion |
1,110 | |||
| Balance at end of period |
$ | 23,991 | ||
112
Table of Contents
9. NON-COVERED OTHER REAL ESTATE OWNED
The Company had two and five OREO properties as of December 31, 2010 and 2009, respectively. The Company disposed of four properties for $6.4 million and incurred fair value adjustment of $1.4 million during 2010 compared to four properties for $6.3 million with fair value adjustment of $1.3 million during 2009.
| 2010 | 2009 | |||||||
| (Dollars in thousands) | ||||||||
| Balance at beginning of period |
$ | 4,278 | $ | — | ||||
| Acquisition due to foreclosures at fair value |
4,560 | 11,978 | ||||||
| Disposition due to sales |
(6,368 | ) | (6,289 | ) | ||||
| Valuation Adjustment subsequent to foreclosures |
(1,432 | ) | (1,339 | ) | ||||
| Transfer to other receivable |
(101 | ) | (72 | ) | ||||
| Balance at end of period |
$ | 937 | $ | 4,278 | ||||
The following table provides the composition of OREO expenses and realized loss on sale for 2010 and 2009:
| 2010 | 2009 | |||||||
| (Dollars in thousands) | ||||||||
| Provision |
$ | 1,432 | $ | 1,339 | ||||
| OREO operating expenses |
538 | 571 | ||||||
| Balance at end of period |
$ | 1,970 | $ | 1,910 | ||||
| Loss on sale |
$ | 59 | $ | 18 | ||||
10. PREMISES AND EQUIPMENT
The following is a summary of the major components of premises and equipment as of December 31, 2010 and 2009:
| 2010 | 2009 | |||||||
| (Dollars in thousands) | ||||||||
| Land |
$ | 3,333 | $ | 3,333 | ||||
| Building |
5,179 | 5,115 | ||||||
| Furniture, fixture, and equipment |
12,251 | 10,805 | ||||||
| Leasehold improvements |
9,575 | 8,793 | ||||||
| FF&E and construction in progress |
6 | 8 | ||||||
| 30,344 | 28,054 | |||||||
| Accumulated depreciation |
(16,812 | ) | (14,686 | ) | ||||
| Premises and equipment, net |
$ | 13,532 | $ | 13,368 | ||||
Depreciation expense for the years ended December 31, 2010, 2009, and 2008 amounted to $2.1 million, $2.2 million, and $2.1 million, respectively.
113
Table of Contents
11. GOODWILL AND INTANGIBLES
In April 2010, the Company recorded a core deposit intangible of $510,000 for the acquisition of Innovative Bank. The Company amortizes premiums on acquired deposits using the straight-line method over 7 to 9 years. The Company’s amortization expense for core deposit intangible was $46,000 for 2010 resulting in a core deposit intangible net of amortization of $464,000 at December 31, 2010. Estimated amortization expense for five succeeding fiscal years is as follows:
| Year |
Amount | |||
| (Dollars in thousands) | ||||
| 2011 |
$ | 62 | ||
| 2012 |
62 | |||
| 2013 |
62 | |||
| 2014 |
62 | |||
| 2015 |
62 | |||
| Thereafter |
154 | |||
| Total |
$ | 464 | ||
In April 2004, the Company purchased the Chicago branch of Korea Exchange Bank and recorded goodwill of $1.3 million and a core deposit intangible of $462,000. Amortization expense for core deposit intangible was $53,000 for year ended December 31, 2009. Based on the annual impairment analysis of such goodwill and core deposit intangible at December 31, 2009, the Company determined that the goodwill and core deposit intangible were impaired in their entirety and, as a result, the entire amounts were written off on the same date.
12. INCOME TAXES
The following is a summary of income tax (benefit) expense for the years ended December 31, 2010, 2009 and 2008:
| 2010 | 2009 | 2008 | ||||||||||
| (Dollars in thousands) | ||||||||||||
| Current |
||||||||||||
| Federal |
$ | 2,077 | $ | (12,428 | ) | $ | 4,855 | |||||
| State |
637 | (318 | ) | 1,372 | ||||||||
| Total current income tax expense (benefit) |
$ | 2,714 | $ | (12,746 | ) | $ | 6,227 | |||||
| Deferred |
||||||||||||
| Federal |
$ | 3,206 | $ | (2,788 | ) | $ | (5,782 | ) | ||||
| State |
1,358 | (6,442 | ) | (2,092 | ) | |||||||
| Valuation allowance increase (decrease) |
(5,962 | ) | 16,142 | — | ||||||||
| Total deferred income tax expense (benefit) |
$ | (1,398 | ) | $ | 6,912 | $ | (7,874 | ) | ||||
| Total |
||||||||||||
| Federal |
$ | 5,283 | $ | (15,216 | ) | $ | (927 | ) | ||||
| State |
1,995 | (6,760 | ) | (720 | ) | |||||||
| Valuation allowance increase (decrease) |
(5,962 | ) | 16,142 | — | ||||||||
| Total |
$ | 1,316 | $ | (5,834 | ) | $ | (1,647 | ) | ||||
114
Table of Contents
As of December 31, 2010 and 2009, the cumulative temporary differences, as tax affected, are as follows:
| 2010 | 2009 | |||||||
| (Dollars in thousands) | ||||||||
| Deferred tax assets: |
||||||||
| Allowance for loan losses |
$ | 22,889 | $ | 25,876 | ||||
| Deferred loan fees |
— | 154 | ||||||
| Depreciation |
854 | 695 | ||||||
| Impairment of securities available for sale |
1,407 | 1,407 | ||||||
| Affordable housing partnership income |
253 | 36 | ||||||
| Capital loss carryforwards |
638 | 613 | ||||||
| Loans held for sale |
1,064 | 107 | ||||||
| Deferral of gain on SBA loan sale |
874 | — | ||||||
| Reserve for losses |
— | 121 | ||||||
| Accrued non-qualified stock option expense |
856 | 673 | ||||||
| Reserve for uncollected interest |
434 | 629 | ||||||
| Net operating loss carryforward |
4,355 | 4,680 | ||||||
| Amortization |
457 | 510 | ||||||
| Tax credits |
— | 901 | ||||||
| Basis differences of acquired loans |
5,706 | — | ||||||
| Goodwill |
1,644 | — | ||||||
| Other |
234 | 215 | ||||||
| Total deferred tax assets |
41,665 | 36,617 | ||||||
| Deferred tax liabilities: |
||||||||
| Basis differences—1031 like-kind exchange |
(239 | ) | (239 | ) | ||||
| Federal Home Loan Bank stock |
(923 | ) | (923 | ) | ||||
| State taxes |
(3,444 | ) | (4,190 | ) | ||||
| Net unrealized gain on securities available for sale |
(549 | ) | (2,941 | ) | ||||
| Excess tax liability |
(229 | ) | (229 | ) | ||||
| Net legal settlement receivable |
— | (221 | ) | |||||
| FDIC loss share receivable |
(10,998 | ) | — | |||||
| Deferred loan fees |
(250 | ) | — | |||||
| Total deferred tax liabilities |
(16,632 | ) | (8,743 | ) | ||||
| Net deferred tax asset before valuation allowance |
25,033 | 27,874 | ||||||
| Valuation allowance |
(10,650 | ) | (16,323 | ) | ||||
| Net deferred tax asset |
$ | 14,383 | $ | 11,551 | ||||
In assessing the future realization of deferred tax assets, management considers whether it is more likely than not that some portion or all of the deferred tax assets will not be realized. The ultimate realization of deferred tax assets is dependent upon the generation of future taxable income during the periods in which those temporary differences become deductible. Management considers the scheduled reversal of deferred tax liabilities, the projected future taxable income, and tax-planning strategies in making this assessment.
Deferred income tax assets or liabilities reflect the estimated future tax effects attributable to differences as to when certain items of income or expense are reported in the financial statements versus when they are reported in the tax returns. The Company’s net deferred tax assets were $14.4 million, net of a valuation allowance of $10.7 million as of December 31, 2010 as compared to $11.6 million, net of a valuation allowance of $16.3 million as of December 31, 2009.
As a result of the loss incurred during 2009, management assessed, by year, the future reversal of all temporary differences to determine which deductions would be available to carry back to tax years with taxable income or could be utilized by projected future taxable income. As a result of this analysis, management determined that a portion of the Company’s net deferred tax asset did not meet the more likely than not criteria for realization at December 31, 2009. Accordingly, the Company recorded a valuation allowance of $16.3 million. The net deferred tax asset valuation allowance included a valuation allowance for capital losses, established in 2008, due to the uncertainty surrounding the realization of the benefits of these losses that may result from future capital gain.
At December 31, 2010, as a result of a full year of profitable operations, management’s assessment of the portion of the Company’s net deferred tax asset that does not meet the more likely than not criteria for realization was reduced to $10.7 million. The reduction in the valuation allowance reduced income tax expenses by $6.0 million for 2010.
As of December 31, 2010 and 2009, the Company’s deferred tax assets were primarily due to the allowance for loans losses, basis difference of acquired loans from Innovative Bank (applicable to 2010), goodwill from Innovative Bank
115
Table of Contents
acquisition, offset by deferred tax liability related to FDIC loss share receivable and impairment losses on securities available for sale. The Company’s net deferred tax asset increased during 2010 due primarily to a decrease in the valuation allowance. To the extent that the allowance for loan losses is not allocable to specific loans, it represents future tax benefits which would be realized when actual charge-offs are made against the allowance.
The Company generally reduces current taxes payable by utilizing the tax credits from investments in the low-income housing projects and California Enterprise Zones. The Company utilized such credit of $2.4 million, $0 and $1.2 million for the years ended December 31, 2010, 2009 and 2008, respectively.
Applicable income tax provisions (benefits) in 2010, 2009, and 2008 resulted in effective tax rates of 5.5%, (12.1)%, and (115.4)%, respectively. The primary reasons for the differences from the federal statutory tax rate of 35.0% are as follows for the years ended December 31, 2010, 2009 and 2008:
| 2010 | 2009 | 2008 | ||||||||||
| (Dollars in thousands) | ||||||||||||
| Income tax expense (benefit) at federal statutory rate |
$ | 8,397 | $ | (16,917 | ) | $ | (500 | ) | ||||
| State franchise tax expense (benefit), net of federal income tax expense (benefit) |
1,297 | (3,406 | ) | (101 | ) | |||||||
| Low income housing and other tax credits |
(2,411 | ) | (1,247 | ) | (1,042 | ) | ||||||
| Tax-advantaged interest income |
— | — | (62 | ) | ||||||||
| Bank-owned life insurance cash surrender value |
(140 | ) | (168 | ) | (172 | ) | ||||||
| Dividend received deduction for stock investments |
(40 | ) | (66 | ) | (143 | ) | ||||||
| Grant of incentive stock option |
100 | 340 | 202 | |||||||||
| Changes in others |
26 | (512 | ) | 171 | ||||||||
| Valuation allowance change |
(5,913 | ) | 16,142 | — | ||||||||
| Income tax provision (benefit) |
$ | 1,316 | $ | (5,834 | ) | $ | (1,647 | ) | ||||
Income taxes receivable of $14.3 million at December 31, 2010 mainly consists of tax refunds of $11.6 million due to the Federal carryback of net operating losses. Additionally, the Company has state tax credits of $167,000 available to reduce future tax liabilities and state net operating losses of $40.2 million available to reduce future taxable income (expiring in 2031).
Income taxes receivable of $16.1 million at December 31, 2009 mainly consists of $12.6 million due to the Federal carryback of net operating losses. Additionally, the Company had available federal tax credits of $735,000 available to reduce future tax liabilities, state tax credits of $167,000 available to reduce future tax liabilities and state net operating losses of $43.2 million available to reduce future taxable income (expiring in 2029).
The Company is required to determine whether it is more likely than not that a tax position will be sustained upon examination based on the technical merits of the position. A tax position that meets the more likely than not recognition threshold is measured to determine the amount of benefit to be recognized in the consolidated financial statements. The Company has concluded that neither it, nor the Bank, has any uncertain tax positions that require recognition in the consolidated financial statements. Therefore, no reserve related to uncertainty is necessary at either December 31, 2010 or December 31, 2009. This determination was based on tax years that remain subject to examination by the relevant tax authorities. The Internal Revenue Service (the “IRS”) and the Franchise Tax Board (the “FTB”) have examined the Company’s consolidated federal income tax returns for tax years up to and including 2007. As of December 31, 2010, the Company was under examination by the FTB for the tax years 2005 through 2007 and there is no open examination by the IRS. The Company does not anticipate any material changes as a result of the examination. In addition, the Company does not have any unrecognized tax benefits subject to significant increase or decrease as a result of uncertainty.
13. INVESTMENTS IN AFFORDABLE HOUSING PARTNERSHIPS
The Company has invested in certain limited partnerships that were formed to develop and operate several apartment complexes designed as high-quality affordable housing for lower income tenants throughout the State of California and other states. The Company’s ownership in each limited partnership varies from under 2% to 21%. At December 31, 2010 and 2009, the investments in these limited partnerships amounted to $10.8 million and $11.5 million, respectively. Two of the eleven limited partnerships invested in by the Company are accounted for using the equity method of accounting, since the Company has significant influence over the partnership. For those investments in limited partnerships for which the Company does not have a significant influence, such investments are accounted for using the cost method of accounting and the annual amortization is based on the proportion of tax credits received in the current year to total estimated tax credits to be allocated to the Company. Each of the partnerships must meet the regulatory minimum requirements for affordable housing for a minimum 15-year compliance period to fully utilize the tax credits. If the partnerships cease to qualify during the compliance period, the credit may be denied for any period in which the project is not in compliance and a portion of the credit previously taken is subject to recapture with interest.
116
Table of Contents
The approximate remaining federal and state tax credits to be utilized over a multiple-year period are $8.6 million and $10.0 million at December 31, 2010 and 2009, respectively. The Company’s usage of tax credits was $2.4 million, $0, and $1.2 million for the years ended December 31, 2010, 2009 and 2008, respectively. Investment amortization amounted to $0.7 million, $1.4 million, and $1.0 million for the years ended December 31, 2010, 2009 and 2008, respectively.
14. DEPOSITS
Deposits consist of the following at December 31, 2010 and 2009:
| As of December 31, | ||||||||
| 2010 | 2009 | |||||||
| (Dollars in thousands) | ||||||||
| Demand deposits (noninterest-bearing) |
$ | 396,973 | $ | 352,395 | ||||
| Money market accounts and NOW |
471,132 | 528,331 | ||||||
| Savings |
87,484 | 86,567 | ||||||
| 955,589 | 967,293 | |||||||
| Time deposits |
||||||||
| Less than $100,000 |
334,341 | 256,020 | ||||||
| $100,000 or more |
481,064 | 524,358 | ||||||
| Total |
$ | 1,770,994 | $ | 1,747,671 | ||||
Time deposits by maturity dates are as follows at December 31, 2010:
| Year |
$100,000 or greater |
Less than $100,000 |
Total | |||||||||
| (Dollars in thousands) | ||||||||||||
| 2011 |
$ | 400,364 | $ | 269,922 | $ | 670,286 | ||||||
| 2012 |
51,910 | 56,438 | 108,348 | |||||||||
| 2013 |
22,452 | 6,933 | 29,385 | |||||||||
| 2014 |
3,762 | 611 | 4,373 | |||||||||
| 2015 and thereafter |
2,576 | 437 | 3,013 | |||||||||
| Total |
$ | 481,064 | $ | 334,341 | $ | 815,405 | ||||||
A summary of interest expense on deposits for the years ended December 31 is as follows:
| 2010 | 2009 | 2008 | ||||||||||
| (Dollars in thousands) | ||||||||||||
| Money market accounts and NOW |
$ | 5,549 | $ | 8,836 | $ | 10,674 | ||||||
| Savings |
2,401 | 2,256 | 1,832 | |||||||||
| Time deposits |
||||||||||||
| Less than $100,000 |
5,030 | 9,064 | 8,459 | |||||||||
| $100,000 or more |
7,632 | 14,779 | 25,161 | |||||||||
| Total |
$ | 20,612 | $ | 34,935 | $ | 46,126 | ||||||
The company participates in the State of California Time Deposit Program. These deposits totaled $115.0 million at December 31, 2010 and 2009. The Company is required to pledge eligible collateral of at least 110% of outstanding deposits. At December 31, 2010 and 2009, securities with fair values of approximately $129.9 million (amortized cost of $126.9 million) and $135.4 million (amortized cost of $131.6 million), respectively, were pledged as collateral for these deposits
In the ordinary course of business, the Company has received deposits from certain directors, executive officers and businesses with which they are associated. At December 31, 2010 and 2009, the total of these deposits amounted to $1.6 million and $1.8 million, respectively.
15. OTHER BORROWED FUNDS
The Company borrows funds from the FHLB and the Treasury, Tax, and Loan Investment Program. Other borrowed funds totaled $188.7 million and $148.4 million at December 31, 2010 and 2009, respectively. Interest expense on total borrowed funds was $6.7 million in 2010, $7.0 million in 2009, and $9.3 million in 2008, reflecting weighted average interest rates of 4.13%, 4.28% and 3.61%, respectively. The following table represents the composition of other borrowed funds as of dates indicated:
117
Table of Contents
| 12/31/10 | 12/31/09 | |||||||
| (Dollars in thousands) | ||||||||
| FHLB |
$ | 167,213 | $ | 146,838 | ||||
| US Treasury |
963 | 1,605 | ||||||
| Secured financing - SBA loan transfer |
20,494 | — | ||||||
| Total other borrowed funds |
$ | 188,670 | $ | 148,443 | ||||
As of December 31, 2010, the Company borrowed $167.2 million as compared to $146.8 million at December 31, 2009 from the FHLB with note terms from less than 1 year to 15 years. Notes of 10-year and 15-year terms are amortizing at the predetermined schedules over the life of the notes. Of the $167.2 million outstanding, $145.0 million is composed of six fixed rate term advances, each with an option to be called by the FHLB after the lockout dates varying from 6 months to 2 years. If market interest rates are higher than the advances’ stated rates at that time, the advances may be called by the FHLB and the Company will be required to repay the FHLB. If market interest rates are lower after the lockout period, then the advances may not be called by the FHLB. If the advances are not called by the FHLB, then they will mature on the maturity dates ranging from 4 years to 10 years. The Company may repay the advances with a prepayment penalty at any time. If the advances are called by the FHLB, there is no prepayment penalty.
The Company has pledged, under a blanket lien (all qualifying commercial and residential loans) as collateral under the borrowing agreement with Federal Home Loan Bank, with a total carrying value of $828.0 million and $812.9 million at December 31, 2010 and 2009, respectively. Total interest expense on the notes was $6.7 million, $6.9 million and $9.3 million for the years ended December 31, 2010, 2009 and 2008, respectively, reflecting average interest rates of 4.16%, 4.30% and 3.62%, respectively.
Federal Home Loan Bank advances outstanding as of December 31, 2010, with an average interest rate of 4.46%, mature as follows:
| Year |
Amount | |||
| (Dollars in thousands) | ||||
| 2011 |
$ | 41,023 | ||
| 2012 |
105,389 | |||
| 2013 |
157 | |||
| 2014 |
167 | |||
| 2015 |
176 | |||
| Thereafter |
20,301 | |||
| Total |
$ | 167,213 | ||
Borrowings obtained from the Treasury Tax and Loan Investment Program mature within a month from the transaction date. Under the program, the Company receives funds from the U.S. Treasury Department in the form of open-ended notes, up to a total of $2.2 million. The Company has pledged U.S. government agencies and/or mortgage-backed securities with a total carrying value of $1.5 million and $2.2 million at December 31, 2010 and 2009, respectively, as collateral to participate in the program. The total borrowed amount under the program, outstanding at December 31, 2010 and 2009 was $963,000 and $1.6 million, respectively. Interest expense on notes was $0, $0, and $9,000 for the years ended December 31, 2010, 2009 and 2008, respectively, reflecting average interest rates of 0.00%, 0.00% and 1.21%, respectively.
In December, 2010, the Company transferred SBA loans of $20.5 million which were accounted for as a secured financing as of December 31, 2010. Pursuant to ASC 860, Transfers and Servicing, such SBA loan transfer is treated as a secured financing until the recourse period expires which is generally 90 days.
16. LONG-TERM SUBORDINATED DEBENTURES
Center Capital Trust I is a Delaware business trust formed by the Company for the sole purpose of issuing trust preferred securities fully and unconditionally guaranteed by the Company. During the fourth quarter of 2004, Center Capital Trust I issued 18,000 Capital Trust Preferred Securities (“TP Securities”), with liquidation value of $1,000 per security, for gross proceeds of $18,000,000. The entire proceeds of the issuance were invested by Center Capital Trust I in $18,000,000 of Junior Long-term Subordinated Debentures (the “Subordinated Debentures”) issued by the Company, with identical maturity, repricing and payment terms as the TP Securities. The Subordinated Debentures represent the sole assets of Center Capital Trust I. The Subordinated Debentures mature on January 7, 2034 and bear a current interest rate of 3.14% (based on 3-month LIBOR plus 2.85%), with repricing and payments due quarterly in arrears on January 7, April 7, July 7, and October 7 of each year commencing April 7, 2004. The Subordinated Debentures are redeemable by the Company, subject to receipt by the Company
118
Table of Contents
of prior approval from the Federal Reserve Bank to the extent then required, on any January 7th, April 7th, July 7th, and October 7th on or after April 7, 2009 at the Redemption Price. Redemption Price means 100% of the principal amount of Subordinated Debentures being redeemed plus accrued and unpaid interest on such Subordinated Debentures to the Redemption Date, or in case of redemption due to the occurrence of a Special Event, to the Special Redemption Date if such Redemption Date is on or after April 7, 2009. The TP Securities are subject to mandatory redemption to the extent of any early redemption of the Subordinated Debentures and upon maturity of the Subordinated Debentures on January 7, 2034.
Holders of the TP Securities are entitled to a cumulative cash distribution on the liquidation amount of $1,000 per security at a current rate per annum of 3.14%. The distribution rate is a per annum rate which resets quarterly, equal to LIBOR (as in effect) immediately preceding each interest payment date (January 7, April 7, July 7, and October 7 of each year) plus 2.85%. The prior approval of the FRB is required for the payment of interest on the Company’s subordinated debt securities. In view of its current capital levels, it is anticipated that the Company will likely continue to receive approval to pay interest on the subordinated debt securities, although no assurance can be given that such approvals will be granted. Any failure to pay such interest when due could adversely affect the market value of our common stock. The distributions on the TP Securities are treated as interest expense in the consolidated statements of operations. The Company has the option to defer payment of the distributions for a period of up to five years, as long as the Company is not in default on the payment of interest on the Subordinated Debentures. The TP Securities issued in the offering were sold in private transactions pursuant to an exemption from registration under the Securities Act of 1933, as amended. The Company has guaranteed, on a subordinated basis, distributions and other payments due on the TP Securities.
On March 1, 2005, the Federal Reserve Board adopted a final rule that allows the continued inclusion of trust-preferred securities in the Tier 1 capital of bank holding companies. However, under the final rule, after a five-year transition period, the aggregate amount of trust preferred securities and certain other capital elements that could be included in Tier 1 capital would be limited to 25 percent of Tier 1 capital elements. In addition, since the Company had less than $15 billion in assets at December 31, 2009, under the Dodd-Frank Act, the Company will be able to continue to include its existing TPS in Tier 1 capital to the extent permitted by FRB guidelines. Trust preferred securities currently make up 6.2% of the Company’s Tier 1 capital.
As of December 31, 2010 and 2009, Center Capital Trust I is not reported on a consolidated basis pursuant to ASC 810, Consolidation. Therefore, the capital securities of $18,000,000 are not presented on the consolidated statements of financial condition. Instead, the long-term subordinated debentures of $18,557,000 issued by Center Financial to Center Capital Trust I and the investment in Center Capital Trust I’s common stock of $557,000 (included in other assets) are separately reported.
17. COMMITMENTS AND CONTINGENCIES
The Company leases its premises under noncancelable operating leases. At December 31, 2010, future minimum rental commitments under these leases are as follows:
| Year |
Amount | |||
| (Dollars in thousands) | ||||
| 2011 |
$ | 2,587 | ||
| 2012 |
2,166 | |||
| 2013 |
1,718 | |||
| 2014 |
1,184 | |||
| 2015 |
926 | |||
| Thereafter |
1,552 | |||
| $ | 10,133 | |||
Rental expense recorded under such leases amounted to approximately $3.3 million, $3.0 million, and $2.5 million in 2010, 2009 and 2008, respectively.
Litigation
From time to time, the Company is a party to claims and legal proceedings arising in the ordinary course of business. It is the management’s opinion that the resolution of any such claims or legal proceedings would not have a material adverse effect on the Company’s financial condition or results of operations.
On August 6, 2008, the Bank entered into a Settlement Agreement with Korea Export Insurance Corporation (“KEIC”) (the “KEIC Settlement Agreement”). Pursuant to the KEIC Settlement Agreement, KEIC dismissed with prejudice its complaints against the Bank in both the Superior Court of the State of California and in federal court and assigned to Center
119
Table of Contents
Bank its rights and claims as against certain other defendants. In consideration of its dismissal of such claims and assignment of such rights, the Bank agreed to pay consideration of $10.5 million to KEIC, consisting of cash consideration of $6.5 million in scheduled installments over a three-year period and the issuance of 415,369 shares of the common stock of the Company valued at $4.0 million.
Pursuant to separate agreement, KEIC and nine Korean banks mutually dismissed all claims against one another arising out of or related to the KEIC action. The Bank also entered into a settlement agreement with Korea Data Systems (USA), Inc (“KDS-USA”) and Lap Shun (John) Hui, pursuant to which KDS-USA agreed to pay the Bank a total of $2.5 million in cash payable in scheduled installments over a two-year period in consideration for Center Bank dismissing with prejudice all claims against KDS-USA.
The Company recognized net expense of $7.5 million based on the present value of long-term receivables and payables during 2008. In December 2009, the Company paid KEIC $3.2 million for the remaining balance of the cash consideration. In 2010, the Company received the final payment of $0.5 million from Mr. Hui. At December 31, 2010 and 2009, the Company had a long-term receivable of $0 and $0.5 million, respectively.
Employment Agreement
On January 6, 2011, the Company and its subsidiary, Center Bank, entered into an at-will employment letter agreement with Richard S. Cupp in connection with his appointment as Chief Executive Officer and President of the Company and Center Bank (the “Employee Agreement”). Mr. Cupp has agreed to serve as Chief Executive Officer and President until the earlier of the date when the Company completes its proposed merger with Nara Bancorp, Inc. or December 31, 2011 (the “Term”). Mr. Cupp will report to the Board of Directors and perform those duties customarily associated with the Chief Executive Officer and President position. He will be paid a base salary at an annual rate of $300,000 during the Term and will also receive those employee benefits and perquisites which the Company generally makes available to its executive officers.
The Company has also agreed to pay Mr. Cupp a cash bonus of $30,000 if he remains employed with the Company through the end of the Term and his employment is not terminated by him or by reason of his death or disability. In addition, the Company granted Mr. Cupp restricted stock awards (“RSAs”) with an aggregate award value of $30,000 effective as of January 6, 2011. The number of shares was determined based on the closing price of the Company’s common stock on the grant date and based on such further terms and conditions as contained in Restricted Stock Award Agreements entered into by and between Company and Mr. Cupp pursuant to the terms of Center Financial’s 2006 Stock Incentive Plan. Such RSAs shall vest if and only if Mr. Cupp remains employed with the Company through the end of the Term and his employment is not terminated by him or by reason of his death or disability.
Effective January 6, 2011, the Employment Agreement, dated January 13, 2010, among the Company, Center Bank and Jae Whan Yoo was terminated. No severance was payable to Mr. Yoo due to the termination of his employment agreement.
Effective January 13, 2010, the Company and Center Bank entered into an employment agreement with Mr. Jae Whan Yoo, President and Chief Executive Officer of the Company, (the “Agreement”) for a term of three years, at an annual base salary of $300,000 for the first year of the term, with annual increases thereafter based on increases in the applicable Consumer Price Index, not to exceed 7% per year. Mr. Yoo will also receive RSAs of 28,301 shares of the Company’s common stock, 14,151 shares of which will vest on January 15, 2012 and 14,150 shares on January 15, 2013. Upon termination effective January 6, 2011, all of such RSAs were forfeited.
Pursuant to the Securities Purchase Agreement with the U.S. Treasury Department, the Company agreed that, until such time as the U.S. Treasury Department ceases to own any securities acquired from the Company pursuant to the Securities Purchase Agreement, the Company will take all necessary action to ensure that the benefit plans with respect to the Company’s senior executive officers comply with Section 111(b) of the Emergency Economic Stabilization Act of 2008 (“EESA”) as implemented by any guidance or regulation under Section 111(b) of EESA that has been issued and is in effect as of the date of issuance of the Series A Preferred Stock and the Warrants and not adopt any benefit plans with respect to, or which cover, our senior executive officers that do not comply with EESA. All of Center Financial’s senior executive officers have consented to the foregoing, and have executed either amendments to their employment agreement or agreements concerning their compensation arrangements in order to comply with EESA.
18. SHAREHOLDERS’ EQUITY
On March 25, 2009, the Company’s board of directors suspended its quarterly cash dividends based on adverse economic conditions and a reduction in the Company’s earnings. No quarterly cash dividends have been declared since the suspension. (See “Quarterly Dividends” below).
120
Table of Contents
As a bank holding company, the Company’s ability to pay dividends primarily depends upon the dividends received from the Bank. The dividend practice of the Bank, like the Company’s dividend practice, will depend upon its earnings, financial position, current and anticipated cash requirements and other factors deemed relevant by Center Bank’s board of directors at that time. The dividend practices of both the Bank and Center Financial are restricted by state and federal law as well as by regulatory requirements and potentially by contractual requirements, in each case as more fully described below.
Quarterly Dividends—Center Financial paid cash dividends of 4 cents (adjusted for two-for-one stock split paid in March 2004) per share from the fourth quarter of 2003 through the first quarter of 2007, and 5 cents per share from the second quarter of 2007 through the fourth quarter of 2008. On March 25, 2009, the Company’s board of directors suspended its quarterly cash dividends based on adverse economic conditions and a reduction in the Company’s earnings. The board of directors determined that this is a prudent, safe and sound practice to preserve capital, and does not expect to resume the payment of cash dividends in the foreseeable future. Unless the preferred stock issued to the U.S. Treasury Department in the TARP Capital Purchase Program has been redeemed, the Company will not be permitted to resume paying cash dividends without the consent of the U.S. Treasury Department until December 2011. In addition, the Bank and the Company have each entered into MOUs with the respective regulatory agency or agencies, pursuant to which both the Bank and the Company must obtain prior regulatory approval to pay dividends. See Note 22—Regulatory Matters. Once the Company is no longer restricted in its ability to pay cash dividends by any specific regulatory requirements, the amount of any such dividend will be determined each quarter by the Company’s board of directors in its discretion, based on the factors described in the previous paragraph. No assurance can be given that the Bank’s and the Company’s future performance will justify the payment of dividends in any particular quarter and any such dividend will be at the sole discretion of Center Financial’s board of directors.
The Bank’s ability to pay cash dividends to Center Financial is also subject to certain legal limitations. Under California law, banks may declare a cash dividend out of their net profits up to the lesser of retained earnings or the net income for the last three fiscal years (less any distributions made to shareholders during such period), or with the prior written approval of the Commissioner of Financial Institutions, in an amount not exceeding the greatest of (i) the retained earnings of the bank, (ii) the net income of the bank for its last fiscal year, or (iii) the net income of the bank for its current fiscal year. Since the Bank’s net loss for 2009 exceeded its combined earnings for 2008 and 2007, in addition to the regulatory approval requirements of the MOU, the Bank will need to obtain the prior written approval of the Commissioner to pay any dividends until the Bank’s net income for the previous three fiscal years is again greater than the amount of any such dividend. In addition, under federal law, banks are prohibited from paying any dividends if after making such payment they would fail to meet any of the minimum regulatory capital requirements. The federal regulators also have the authority to prohibit banks from engaging in any business practices which are considered to be unsafe or unsound, and in some circumstances the regulators might prohibit the payment of dividends on that basis even though such payments would otherwise be permissible.
The Company’s ability to pay dividends is also limited by state corporation law. The California General Corporation Law allows dividends to the company’s shareholders if the company’s retained earnings equal at least the amount of the proposed dividend. If a California corporation does not have sufficient retained earnings available for the proposed dividend, it may still pay a dividend to its shareholders if, immediately after giving effect to the dividend, the sum of the company’s assets (exclusive of goodwill and deferred charges) would be at least equal to 125% of its liabilities (not including deferred taxes, deferred income and other deferred liabilities) and the current assets of the company would be at least equal to its current liabilities, or, if the average of its earnings before taxes on income and before interest expense for the two preceding fiscal years was less than the average of its interest expense for the two preceding fiscal years, at least equal to 125% of its current liabilities. In addition, during any period in which the Company has deferred payment of interest otherwise due and payable on its subordinated debt securities, or any unpaid dividends on the preferred stock issued to the U.S. Treasury Department, it may not make any dividends or distributions with respect to its capital stock.
Stock-Based Compensation—The Company has a Stock Incentive Plan which was adopted by the Board of Directors in April 2006, approved by the shareholders in May 2006, and amended by the Board in June 2007 (the “2006 Plan”). The 2006 Plan provides for the granting of incentive stock options to officers and employees, and non-qualified stock options and restricted stock awards to employees (including officers) and non-employee directors. The 2006 Plan replaced the Company’s former stock option plan (the “1996 Plan”) which expired in February 2006, and all options under the 1996 Plan which were outstanding on April 12, 2006 were transferred to and made part of the 2006 Plan. The option prices of all options granted under the 2006 Plan (including options transferred from the 1996 Plan) must be not less than 100% of the fair market value at the date of grant. All options granted generally vest at the rate of 20% per year except that the options granted to the non-employee directors vest at the rate of 33 1/3% per year. All options not exercised generally expire ten years after the date of grant. Vesting of RSAs is discretionary with the Board of Directors or the Compensation Committee, but awards granted to date generally vest at the rate of 50% on the third anniversary of the grant date and 25% per year for the next two years. However, the RSAs granted to the Chief Executive Officer and the Chief Credit Officer in 2010 vest 50% on the second anniversary of the grant date and the remaining 50% the following year. RSAs granted to our former Chief Executive Officer were forfeited upon termination of his employment effective January 6, 2011. RSAs granted to senior executive officers are also subject to restrictions on
121
Table of Contents
transfer even after vesting for as long as the Company has preferred stock outstanding to the U.S. Treasury Department pursuant to the TARP Capital Purchase Program.
The Company’s pre-tax compensation expense for stock-based employees and directors’ compensation was $0.7 million, $1.0 million, and $1.2 million ($560,000, $640,000, and $876,000 after tax effect of non-qualified stock options) for the years ended December 31, 2010, 2009 and 2008, respectively.
Stock Option Awards
The fair value of the stock options granted was estimated on the date of grant using the Black-Scholes option valuation model that uses the assumptions noted in the following table. The risk-free rate is based on the U.S. Treasury yield curve in effect at the time of grant. Beginning in 2006, the expected life (estimated period of time outstanding) of options granted with a 10-year term was determined using the average of the vesting period and term. Expected volatility was based on historical volatility for a period equal to the stock option’s expected life, ending on the day of grant, and calculated on a weekly basis. There were no option grants during 2010.
| Year ended December 31, | ||||||
| 2010 | 2009 | 2008 | ||||
| Risk-free interest rate |
— | 1.71% - 3.60% | 1.59% - 6.11% | |||
| Expected life |
— | 3 - 6.5 years | 3 - 6.5 years | |||
| Expected volatility |
— | 70% - 113% | 28% - 36% | |||
| Expected dividend yield |
— | 0.00% - 3.50% | 0.00% - 3.50% | |||
A summary of the Company’s stock option activity and related information for the years ended December 31, 2010 and 2009 is set forth in the following table:
| 2010 | 2009 | 2008 | ||||||||||||||||||||||||||||||||||
| Shares Available For Grant |
Options Outstanding |
Weighted Average Exercise Price |
Shares Available For Grant |
Options Outstanding |
Weighted Average Exercise Price |
Shares Available For Grant |
Options Outstanding |
Weighted Average Exercise Price |
||||||||||||||||||||||||||||
| Balance at beginning of period |
2,266,612 | 760,245 | $ | 16.93 | 2,190,252 | 850,151 | $ | 16.78 | 2,077,452 | 967,271 | $ | 17.05 | ||||||||||||||||||||||||
| Options granted |
— | — | — | (30,000 | ) | 30,000 | 4.71 | (3,000 | ) | 3,000 | 11.23 | |||||||||||||||||||||||||
| Options forfeited |
68,401 | (68,401 | ) | 16.73 | 106,360 | (106,360 | ) | 14.02 | 115,800 | (115,800 | ) | 19.35 | ||||||||||||||||||||||||
| Options exercised |
— | — | — | — | (13,546 | ) | 3.43 | — | (4,320 | ) | 5.00 | |||||||||||||||||||||||||
| Balance at end of period |
2,335,013 | 691,844 | $ | 16.95 | 2,266,612 | 760,245 | $ | 16.93 | 2,190,252 | 850,151 | $ | 16.78 | ||||||||||||||||||||||||
| Options exercisable at year-end |
571,777 | $ | 17.30 | 444,012 | $ | 17.01 | 340,286 | $ | 14.91 | |||||||||||||||||||||||||||
| Weighted-average fair value of options granted during the year |
$ | — | $ | 2.09 | $ | 1.77 | ||||||||||||||||||||||||||||||
Information pertaining to stock options outstanding at December 31, 2010 and 2009 is as follows:
| Options Outstanding | Options Exercisable | |||||||||||||||||||||||
| Range of |
Options Outstanding |
Weighted- Average Remaining Contractual Life in Years |
Weighted- Average Exercise Price |
Options Exercisable |
Weighted- Average Remaining Contractual Life in Years |
Weighted- Average Exercise Price |
||||||||||||||||||
| $ 2.59 – $ 8.00 |
52,744 | 5.12 | $ | 5.02 | 32,077 | 3.13 | $ | 5.23 | ||||||||||||||||
| $ 8.01 – $ 20.00 |
453,100 | 5.92 | $ | 16.04 | 374,900 | 5.80 | $ | 16.01 | ||||||||||||||||
| $ 20.01 – $ 25.10 |
186,000 | 5.90 | $ | 22.56 | 164,800 | 5.87 | $ | 22.59 | ||||||||||||||||
| Outstanding at December 31, 2010 |
691,844 | 5.86 | $ | 16.95 | 571,777 | 5.67 | $ | 17.30 | ||||||||||||||||
| $ 2.59 – $ 8.00 |
52,745 | 6.12 | $ | 5.02 | 22,745 | 2.07 | $ | 5.43 | ||||||||||||||||
| $ 8.01 – $ 20.00 |
521,500 | 6.91 | $ | 16.12 | 307,000 | 6.52 | $ | 15.77 | ||||||||||||||||
| $ 20.01 – $ 25.10 |
186,000 | 6.83 | $ | 22.56 | 114,267 | 6.77 | $ | 22.64 | ||||||||||||||||
| Outstanding at December 31, 2009 |
760,245 | 6.83 | $ | 16.93 | 444,012 | 6.36 | $ | 17.01 | ||||||||||||||||
The aggregate intrinsic value of options outstanding and options exercisable at December 31, 2010 was approximately $135,000 and $75,000, respectively. The aggregate intrinsic value of options outstanding and options exercisable at December 31, 2009 was $2,000 and $0, respectively. Aggregate intrinsic value represents the difference between the Company’s closing stock price on the last trading day of the period, which was $7.58 and $4.60 as of December 31, 2010 and 2009,
122
Table of Contents
respectively, and the exercise price multiplied by the number of options outstanding. Total intrinsic value of options exercised was $0, $7,000 and $36,000 for the years ended December 31, 2010, 2009 and 2008, respectively. Total fair value of shares vested was $1.2 million, $1.3 million and $1.4 million for the years ended December 31, 2010, 2009 and 2008, respectively.
A summary of the Company’s non-vested options as of December 31, 2010 is as follows:
| Number of Options |
Weighted Average Grant Date Fair Value |
|||||||
| Balance at December 31, 2009 |
316,233 | $ | 6.44 | |||||
| Granted |
— | — | ||||||
| Vested |
(169,967 | ) | 7.24 | |||||
| Forfeited |
(26,199 | ) | 2.40 | |||||
| Balance at December 31, 2010 |
120,067 | $ | 6.19 | |||||
| Balance at December 31, 2008 |
509,865 | $ | 6.85 | |||||
| Granted |
30,000 | 2.09 | ||||||
| Vested |
(153,832 | ) | 7.09 | |||||
| Forfeited |
(69,800 | ) | 6.13 | |||||
| Balance at December 31, 2009 |
316,233 | $ | 6.44 | |||||
As of December 31, 2010 and 2009, the Company had approximately $460,000 and $1.0 million of unrecognized compensation costs related to unvested options, respectively. The Company expects to recognize these costs over a weighted average period of 1.45 years and 2.17 years at December 31, 2010 and 2009, respectively.
Restricted Stock Awards
The market price of the Company’s common stock at the date of grant is used to estimate the fair value of restricted stock awards. Restricted stock activity under the 2006 Plan as of December 31, 2010, and changes during the years ended December 31, 2010 and 2009, respectively, are as follows:
| For the Year Ended December 31, | ||||||||||||||||
| 2010 | 2009 | |||||||||||||||
| Number of Shares |
Weighted-Average Grant-Date Fair Value per Share |
Number of Shares |
Weighted-Average Grant-Date Fair Value per Share |
|||||||||||||
| Restricted Stock: |
||||||||||||||||
| Nonvested, beginning of period |
10,050 | $ | 13.59 | 10,400 | $ | 14.72 | ||||||||||
| Granted |
71,409 | 5.24 | 1,150 | 3.07 | ||||||||||||
| Vested |
(3,025 | ) | 16.88 | — | — | |||||||||||
| Cancelled and forfeited |
(1,625 | ) | 10.21 | (1,500 | ) | 16.24 | ||||||||||
| Nonvested, at end of period |
76,809 | 5.77 | 10,050 | 13.59 | ||||||||||||
The Company recorded compensation cost of $99,000 and $18,000 related to the restricted stock granted under the 2006 Plan for the years ended December 31, 2010 and 2009, respectively. At December 31, 2010 and 2009, the Company had approximately $304,000 and $44,000 of unrecognized compensation costs related to unvested restricted stocks, respectively. The costs are expected to be recognized over a weighted-average period of 2.98 years and 1.54 years as of December 31, 2010 and 2009, respectively. There were approximately 3,000 shares vested during the year ended December 31, 2010 as compared to none in 2009.
Preferred Stock, Common Stock and Common Stock Warrants—The Company entered into Securities Purchase Agreements with a limited number of institutional and other accredited investors, including insiders, to sell a total of 73,500 shares of mandatorily convertible non-cumulative non-voting perpetual preferred stock, series B, without par value (the “Series B Preferred Stock”) at a price of $1,000 per share, for an aggregate gross purchase price of $73.5 million. This private placement closed on December 31, 2009, and the Company issued an aggregate of 73,500 shares of Series B Preferred Stock upon its receipt of consideration in cash. The Series B Preferred Stock converted into 19,599,981 shares of common stock effective March 29, 2010, following shareholder approval of such conversion. The conversion ratio was equal to the quotient obtained by dividing the $1,000 per share purchase price by the conversion price of $3.75. The shares issued in this private placement were registered on a Form S-3 Registration Statement, as amended, which became effective April 8, 2010, thus removing the restrictions on resale.
123
Table of Contents
The conversion price of $3.75 per share was less than the fair value of $5.23 per share of our common stock on December 29, 2009, the commitment date for the issuance of the Series B Preferred Stock. The Series B Preferred Stock was thus issued with a beneficial conversion feature with an intrinsic value of $1.48 per share or at a discount of $29,007,972. On the effective date of the conversion, the unamortized discount due to the beneficial conversion feature was immediately recognized as a dividend and accounted for as a charge to retained earnings and a reduction of net income available to common shareholders in the earnings per share computation.
The Company also issued 3,360,000 shares of common stock in a private placement which closed on November 30, 2009 (the “November Private Placement”), at a price per share of $3.71 to non-affiliated investors and $4.69 to certain directors and employees of the Company. The difference in the purchase price was necessary to comply with NASDAQ Listing Rule 5635(c). The Company obtained shareholder approval of the November Private Placement at a special meeting held on March 24, 2010 so that all investors in the November Private Placement could be treated equally. Following receipt of shareholder approval, 85,045 additional shares were issued to the directors and employees who invested in the November Private Placement, in order to effectuate this result. The shares issued in the November Private Placement were registered on a Form S-3 Registration Statement which became effective April 8, 2010, thus removing the restrictions on resale.
The Company entered into a purchase agreement with the U.S. Treasury Department on December 12, 2008, pursuant to which the Company issued and sold 55,000 shares of the Company’s fixed-rate cumulative perpetual preferred stock for a total purchase price of $55.0 million, and a 10-year warrant to purchase 864,780 shares of the Company’s common stock at an exercise price of $9.54 per share. The Company will pay the U.S. Treasury Department a five percent dividend annually for each of the first five years of the investment and a nine percent dividend thereafter until the shares are redeemed. The cumulative dividend for the preferred stock is accrued for and payable on February 15, May 15, August 15 and November 15 of each year.
As a result of “qualified equity offerings” (as defined in the Securities Purchase Agreement with the U.S. Treasury Department) in the fourth quarter of 2009 aggregating in excess of $55.0 million (specifically $86.3 million) in gross proceeds, the number of common shares underlying the warrant was reduced to 432,290.
The Company allocated total proceeds of $55.0 million, based on the relative fair value of preferred stock and common stock warrants, to preferred stock for $52.9 million and common stock warrants for $2.1 million, respectively, on December 12, 2008. The preferred stock discount will be accreted, on an effective yield method, to preferred stock over the 10 years.
In determination of the fair value of preferred stock and common stock warrants, certain assumptions were made. The Binomial Lattice model was used with the following assumptions for common stock warrants:
| • | Risk-free interest rate: The constant maturities par yield curve based on Treasury yields provided by Federal Reserve, after interpolating the yield curve beyond the maturities provided in the release data, was used to derive a risk-free interest rate curve. |
| • | Stock price volatility: The volatility assumption utilized in the valuation should represent the “expected” volatility, which may or may not be the same as historical volatility. Since market events of the second half of 2008 are not likely to repeat given the current government ownership of major banks, the high market volatility during the second half of the year should be assigned a lower weighting in the 10-year term of the historical volatility. As a result of this adjustment, expected volatility of 32.0% was used in the valuation as compared to 36.5% of historical volatility. |
| • | Dividend rate: The Company utilized a constant dividend payment assumption in the model. The $0.05 per share per quarter constant payment is consistent with the Company’s then current policy and Management’s intention. |
For preferred stock, the Company used a discount cash flow model to calculate the fair value with the following assumptions:
| • | Dividend rate of 5% from year 1 to year 5 and 9% thereafter was used in accordance with the terms and conditions of the preferred stock. Expected life was assumed 10 years, considering the contractual term of 10 years. Risk-free interest rate was assumed at 3.66%, which is the 10-year U.S. Treasury Constant Maturity Rate for 2008. The assumed discount rate was 12% based on review of certain references. Certain actual preferred equity offerings rates in 2008 ranged from 7% to 12%. TARP is considered cheaper financing for capital and one of the objectives of the TARP is providing cheaper financing to help the capital situation in the banking sector. In this regard, the assumed discount rate should be higher than the coupon rate of 9%. |
Using these assumptions, the fair value of common stock warrants amounted to $1.4 million and the fair value of the preferred stock amounted to $37.2 million. The relative fair values of preferred stock and common stock warrants were 96.3% and 3.7%, respectively. The total proceeds of $55 million were allocated, based on the relative fair value, to preferred stock in
124
Table of Contents
the amount of $52.9 million for preferred stock and $2.1 million for common stock warrants on December 12, 2008, respectively.
The Company paid cash dividends for preferred stock of $2.8 million for the year ended December 31, 2010 and 2009 and the accretion of preferred stock discount amounted to $29.2 million (including effect of beneficial conversion of $29.0 million) and $212,000 for the year ended December 31, 2010 and 2009, respectively, The Company had accrued for cash dividends in the amount of $344,000 at December 31, 2010 and 2009, respectively.
19. EARNINGS (LOSS) PER COMMON SHARE
The following is a reconciliation of the numerators and denominators of the basic and diluted earnings (loss) per share computations for the years ended December 31, 2010, 2009, and 2008.
| Net Income (Loss) |
Weighted Average Number of Shares |
Per Share Amount |
||||||||||
| (Dollars in thousands, except earnings per share) | ||||||||||||
| 2010 |
||||||||||||
| Basic EPS |
||||||||||||
| Net income |
$ | 22,683 | 35,263 | $ | 0.64 | |||||||
| Less : preferred stock dividends and accretion of preferred stock discount |
(31,996 | ) | — | $ | (0.90 | ) | ||||||
| Income available to common shareholders |
(9,313 | ) | 35,263 | $ | (0.26 | ) | ||||||
| Effect of dilutive securities: |
||||||||||||
| Stock options, restricted stocks and warrants |
— | — | — | |||||||||
| Diluted EPS |
||||||||||||
| Income available to common shareholders |
$ | (9,313 | ) | 35,263 | $ | (0.26 | ) | |||||
| 2009 |
||||||||||||
| Basic EPS |
||||||||||||
| Net loss |
$ | (42,502 | ) | 17,077 | $ | (2.49 | ) | |||||
| Less : preferred stock dividends and accretion of preferred stock discount |
(2,954 | ) | — | (0.17 | ) | |||||||
| Loss available to common shareholders |
(45,456 | ) | 17,077 | (2.66 | ) | |||||||
| Effect of dilutive securities: |
||||||||||||
| Stock options, restricted stocks and warrants |
— | — | — | |||||||||
| Diluted EPS |
||||||||||||
| Loss available to common shareholders |
$ | (45,456 | ) | 17,077 | $ | (2.66 | ) | |||||
| 2008 |
||||||||||||
| Basic EPS |
||||||||||||
| Net income |
$ | 220 | 16,526 | $ | 0.01 | |||||||
| Less : preferred stock dividends and accretion of preferred stock discount |
(155 | ) | — | (0.01 | ) | |||||||
| Income available to common shareholders |
65 | 16,526 | 0.00 | |||||||||
| Effect of dilutive securities: |
||||||||||||
| Stock options, restricted stocks and warrants |
— | 34 | — | |||||||||
| Diluted EPS |
||||||||||||
| Income available to common shareholders |
$ | 65 | 16,560 | $ | 0.00 | |||||||
Options not included in the computation of diluted earnings (loss) per share because they would have had an anti-dilutive effect amounted to approximately 692,000 shares, 760,000 shares and 840,000 shares for the years ended December 31, 2010, 2009 and 2008, respectively.
20. EMPLOYEE BENEFIT PLAN
The Company has an Employees’ Profit Sharing and Savings Plan (the “Plan”), for the benefit of substantially all of its employees who have reached a minimum age of 21 years. Each employee is allowed to contribute to the Plan up to the maximum percentage allowable, not to exceed the limits of IRS Code Sections 401(k), 404 and 415. As of May 1, 2009, the Company has suspended its matching contribution, which has resumed effective January 1, 2011. The Company may make a discretionary contribution, which is not limited to the current or accumulated net profit, as well as a qualified non-elective
125
Table of Contents
contribution, with both amounts determined by the Company. For the years ended December 31, 2010, 2009, and 2008, the Company made matching contributions of $0, $98,000, and $369,000, respectively, and no discretionary contributions.
21. FINANCIAL INSTRUMENTS WITH OFF-BALANCE SHEET RISK
The Company is a party to financial instruments with off-balance-sheet risk in the normal course of business to meet the financing needs of its customers. These financial instruments include commitments to extend credit, commercial letters of credit, standby letters of credit and performance bonds. These instruments involve, to varying degrees, elements of credit and interest rate risk in excess of the amount recognized in the balance sheets.
The Company’s exposure to credit loss is represented by the contractual notional amount of these instruments. The Company uses the same credit policies in making commitments and conditional obligations as it does for on-balance-sheet instruments.
Commitments to extend credit are agreements to lend to a customer provided there is no violation of any condition established in the contract. Commitments generally have fixed expiration dates or other termination clauses and may require payment of a fee. Since certain of the commitments are expected to expire without being drawn upon, the total commitment amounts do not necessarily represent future cash requirements. The Company evaluates each customer’s creditworthiness on a case-by-case basis. The amount of the collateral obtained, if deemed necessary by the Company upon extension of credit, is based on management’s credit evaluation of the borrower.
Commercial letters of credit, standby letters of credit, and performance bonds are conditional commitments issued by the Company to guarantee the performance of a customer to a third party. The credit risk involved in issuing letters of credit is essentially the same as that involved in making loans to customers. The Company generally holds collateral supporting those commitments if deemed necessary.
The following is a summary of the notional amounts of the Company’s financial instruments relating to extension of credit with off-balance-sheet risk at December 31, 2010 and 2009:
| December 31, 2010 | December 31, 2009 | |||||||
| (Dollars in thousands) | ||||||||
| Loans |
$ | 158,828 | $ | 187,148 | ||||
| Standby letters of credit |
27,931 | 21,284 | ||||||
| Performance bonds |
222 | 651 | ||||||
| Commercial letters of credit |
30,341 | 22,190 | ||||||
Liabilities for losses on outstanding commitments of $244,000 and $246,000 were separately reported in other liabilities at December 31, 2010 and 2009.
The Company’s exposure to credit loss in the event of non-performance by the customer is represented by the contractual amount of those instruments. Consistent credit policies are used by the Company for both on- and off- balance sheet items. The Company evaluates credit risk associated with the loan portfolio at the same time as it evaluates credit risk associated with commitments to extend credit and letters of credits.
22. REGULATORY MATTERS
Risk-Based Capital—The Company and the Bank are subject to various regulatory capital requirements administered by the federal banking agencies, including the FDIC. Failure to meet minimum capital requirements can initiate certain mandatory actions by regulators that, if undertaken, could have a direct material effect on the Company’s financial statements. Under capital adequacy guidelines, the Company and the Bank must meet specific capital guidelines that involve quantitative measures of the assets, liabilities and certain off-balance sheet items as calculated under regulatory accounting practices. The capital amounts and classification are also subject to qualitative judgments by the regulators about components, risk weightings and other factors.
Effective December 28, 2010, the Bank entered into a memorandum of understanding (“MOU”) with the FDIC and the California Department of Financial Institutions (the “DFI”) replacing the previous MOU dated December 18, 2009. The MOU is an informal administrative agreement pursuant to which the Bank has agreed to take various actions and comply with certain requirements to facilitate improvement in its financial condition. In accordance with the MOU, the Bank agreed among other things to (a) develop and implement strategic plans to restore profitability; (b) maintain a Leverage Capital Ratio of not less than 9% and a Total Risk-Based Capital Ratio of not less than 13%; (c) refrain from paying dividends without prior written regulatory approval; (d) eliminate all or half its assets classified “Loss” or “Doubtful”; (e) reduce the combined total of assets classified “Substandard” or “Doubtful” to not more than 40% of Tier 1 Capital plus the allowance for loan and lease losses (“ALLL”); (f) develop and implement certain specified policies and procedures relating to the asset disposition plan for certain
126
Table of Contents
classified assets, loan impairment and note sale transactions; (g) notify the FDIC and the DFI prior to appointing any new director or senior executive officer; (h) implement a program to monitor compliance of the MOU and review and record its review of compliance; (i) refrain from establishing any new offices without prior regulatory approval; and (j) submit written quarterly progress reports to the FDIC and the DFI detailing the form and manner of any actions taken to secure compliance with the MOU and the results thereof.
On December 9, 2009, the Company entered into an MOU with the Federal Reserve Bank of San Francisco (the “FRB”) pursuant to which the Company agreed, among other things, to (i) take steps to ensure that the Bank complies with the Bank’s MOU; (ii) implement a capital plan addressing specified items and submit the plan to the FRB for approval; (iii) submit annual cash flow projections to the FRB; (iv) refrain from paying cash dividends, receiving cash dividends from the Bank, increasing or guaranteeing debt, redeeming or repurchasing its stock, or issuing any additional trust preferred securities, without prior FRB approval; and (v) submit written quarterly progress reports to the FRB detailing compliance with the MOU.
The MOUs will remain in effect until modified or terminated by the FRB, the FDIC and the DFI. The Company does not expect the actions called for by the MOUs to change its business strategy in any material respect, although they may have the effect of limiting or delaying the Bank’s or the Company’s ability or plans to expand. The board of directors and management of the Bank and the Company have taken various actions to comply with the MOUs, and will diligently endeavor to take all actions necessary for compliance. Management believes that the Bank and the Company are currently in substantial compliance with the terms of the MOUs, although formal determinations of compliance with the MOUs can only be made by the regulatory authorities. In that regard, the Bank’s Leverage Capital Ratio and Total Risk-Based Capital ratios as of December 31, 2010 were 12.50% and 18.53%, considerably in excess of the required ratios for the Bank. Management will continue to work closely with the FRB, the FDIC and the DFI in order to continue to comply with the terms of the MOUs.
On March 1, 2005, the Federal Reserve Board (“FRB”) adopted a final rule that allows the continued inclusion of trust preferred securities in the Tier 1 capital of bank holding companies. However, under the final rule, after a five-year transition period, the aggregate amount of trust preferred securities and certain other capital elements would be limited to 25% of Tier 1 capital elements. Trust preferred securities currently make up 6.2% of the Company’s Tier 1 capital. In addition, since the Company had less than $15 billion in assets at December 31, 2009, under the Dodd-Frank Act, the Company will be able to continue to include its existing trust preferred securities in Tier 1 capital to the extent permitted by FRB guidelines.
To be categorized as “well capitalized”, the Company must maintain specific total risk-based, Tier 1 risk-based, and Tier 1 leverage ratios as set forth in the table below. The actual and required capital amounts and ratios at December 31, 2010 and 2009 are as follows:
| To Be Well Capitalized Under Prompt Corrective Action Provisions |
||||||||||||||||||||||||
| For Capital Adequacy Purposes |
||||||||||||||||||||||||
| Actual | ||||||||||||||||||||||||
| Amount | Ratio | Amount | Ratio | Amount | Ratio | |||||||||||||||||||
| (Dollars in thousands) | ||||||||||||||||||||||||
| As of December 31, 2010 |
||||||||||||||||||||||||
| Total Capital (to Risk-Weighted Assets) |
||||||||||||||||||||||||
| Center Financial Corporation |
$ | 311,651 | 18.87 | % | $ | 132,125 | 8.00 | % | $ | 165,157 | 10.00 | % | ||||||||||||
| Center Bank |
$ | 306,184 | 18.53 | % | $ | 132,190 | 8.00 | % | $ | 165,237 | 10.00 | % | ||||||||||||
| Tier 1 capital (to Risk-Weighted Assets) |
||||||||||||||||||||||||
| Center Financial Corporation |
$ | 290,608 | 17.60 | % | $ | 66,047 | 4.00 | % | $ | 99,071 | 6.00 | % | ||||||||||||
| Center Bank |
$ | 285,128 | 17.26 | % | $ | 66,078 | 4.00 | % | $ | 99,117 | 6.00 | % | ||||||||||||
| Tier 1 capital (to Average Assets) |
||||||||||||||||||||||||
| Center Financial Corporation |
$ | 290,608 | 12.74 | % | $ | 91,243 | 4.00 | % | $ | 114,053 | 5.00 | % | ||||||||||||
| Center Bank |
$ | 285,128 | 12.50 | % | $ | 91,241 | 4.00 | % | $ | 114,051 | 5.00 | % | ||||||||||||
| As of December 31, 2009 |
||||||||||||||||||||||||
| Total Capital (to Risk-Weighted Assets) |
||||||||||||||||||||||||
| Center Financial Corporation |
$ | 291,205 | 17.77 | % | $ | 131,100 | 8.00 | % | $ | 163,875 | 10.00 | % | ||||||||||||
| Center Bank |
$ | 282,314 | 17.22 | % | $ | 131,156 | 8.00 | % | $ | 163,945 | 10.00 | % | ||||||||||||
| Tier 1 capital (to Risk-Weighted Assets) |
||||||||||||||||||||||||
| Center Financial Corporation |
$ | 270,253 | 16.50 | % | $ | 65,516 | 4.00 | % | $ | 98,274 | 6.00 | % | ||||||||||||
| Center Bank |
$ | 261,349 | 15.94 | % | $ | 65,583 | 4.00 | % | $ | 98,375 | 6.00 | % | ||||||||||||
| Tier 1 capital (to Average Assets) |
||||||||||||||||||||||||
| Center Financial Corporation |
$ | 270,253 | 12.40 | % | $ | 87,178 | 4.00 | % | $ | 108,973 | 5.00 | % | ||||||||||||
| Center Bank |
$ | 261,349 | 12.00 | % | $ | 87,116 | 4.00 | % | $ | 108,895 | 5.00 | % | ||||||||||||
127
Table of Contents
As of December 31, 2010, the most recent notification from the FDIC categorized the Bank as well capitalized under the regulatory framework for prompt corrective action.
23. QUARTERLY FINANCIAL DATA (UNAUDITED)
Summarized quarterly financial data follows for the periods indicated:
| Three Months Ended | ||||||||||||||||
| March 31 | June 30 | September 30 | December 31 | |||||||||||||
| (Dollars in thousands, except per share data) | ||||||||||||||||
| 2010 |
||||||||||||||||
| Interest Income |
$ | 23,632 | $ | 24,349 | $ | 24,139 | $ | 23,712 | ||||||||
| Interest Expense |
7,204 | 6,874 | 7,039 | 6,776 | ||||||||||||
| Net interest income before provision for loan losses |
16,428 | 17,475 | 17,100 | 16,936 | ||||||||||||
| Provision for loan losses |
7,000 | 5,000 | 4,000 | 6,010 | ||||||||||||
| Net income (loss) |
2,767 | 7,502 | 5,963 | 6,450 | ||||||||||||
| Preferred stock dividends and accretion of preferred stock discount * |
29,752 | 746 | 748 | 750 | ||||||||||||
| Net income (loss) available to common shareholders |
(26,985 | ) | 6,756 | 5,215 | 5,700 | |||||||||||
| Earnings (loss) per common share: |
||||||||||||||||
| Basic |
(1.27 | ) | 0.17 | 0.13 | 0.14 | |||||||||||
| Diluted |
(1.27 | ) | 0.17 | 0.13 | 0.14 | |||||||||||
| 2009 |
||||||||||||||||
| Interest Income |
$ | 26,637 | $ | 27,199 | $ | 25,716 | $ | 24,259 | ||||||||
| Interest Expense |
10,735 | 11,876 | 10,923 | 9,050 | ||||||||||||
| Net interest income before provision for loan losses |
15,902 | 15,323 | 14,793 | 15,209 | ||||||||||||
| Provision for loan losses |
14,451 | 29,835 | 10,561 | 22,625 | ||||||||||||
| Net income (loss) |
(2,726 | ) | (12,787 | ) | (2,524 | ) | (24,465 | ) | ||||||||
| Preferred stock dividends and accretion of preferred stock discount |
730 | 739 | 742 | 743 | ||||||||||||
| Net income (loss) available to common shareholders |
(3,456 | ) | (13,526 | ) | (3,266 | ) | (25,208 | ) | ||||||||
| Earnings (loss) per common share: |
||||||||||||||||
| Basic |
(0.21 | ) | (0.81 | ) | (0.19 | ) | (1.41 | ) | ||||||||
| Diluted |
(0.21 | ) | (0.81 | ) | (0.19 | ) | (1.41 | ) | ||||||||
| 2008 |
||||||||||||||||
| Interest Income |
$ | 35,679 | $ | 33,298 | $ | 32,619 | $ | 29,611 | ||||||||
| Interest Expense |
17,080 | 14,603 | 13,150 | 11,774 | ||||||||||||
| Net interest income before provision for loan losses |
18,599 | 18,695 | 19,469 | 17,837 | ||||||||||||
| Provision for loan losses |
2,162 | 2,047 | 2,121 | 19,848 | ||||||||||||
| Net income (loss) |
4,220 | 5,279 | (3,159 | ) | (6,120 | ) | ||||||||||
| Preferred stock dividends and accretion of preferred stock discount |
— | — | — | (155 | ) | |||||||||||
| Net income (loss) available to common shareholders |
4,220 | 5,279 | (3,159 | ) | (6,275 | ) | ||||||||||
| Earnings (loss) per common share: |
||||||||||||||||
| Basic |
0.26 | 0.32 | (0.19 | ) | (0.37 | ) | ||||||||||
| Diluted |
0.26 | 0.32 | (0.19 | ) | (0.37 | ) | ||||||||||
| * | Preferred stock dividends for the quarter ended March 31, 2010 include the effect of beneficial conversion feature of $29.0 million (see Note 18). |
128
Table of Contents
24. PARENT ONLY CONDENSED FINANCIAL STATEMENTS
The information below is presented as of December 31, 2010 and 2009 and for the years ended December 31 2010, 2009 and 2008.
CONDENSED STATEMENTS OF FINANCIAL CONDITION
| As of December 31, | ||||||||
| 2010 | 2009 | |||||||
| (Dollars in thousands) | ||||||||
| Assets: |
||||||||
| Cash |
$ | 5,463 | $ | 13,801 | ||||
| Investment in subsidiaries |
287,089 | 265,711 | ||||||
| Other assets |
828 | 1,023 | ||||||
| Total assets |
$ | 293,380 | $ | 280,535 | ||||
| Liabilities: |
||||||||
| Long-term subordinated debentures |
$ | 18,557 | $ | 18,557 | ||||
| Other liabilities |
811 | 5,920 | ||||||
| Total liabilities |
19,368 | 24,477 | ||||||
| Shareholders’ equity: |
||||||||
| Preferred stock, no par value, 10,000,000 shares authorized; issued and outstanding, 55,000 shares and 128,500 shares as of December 31, 2010 and 2009, respectively |
||||||||
| Series A, cumulative, issued and outstanding 55,000 shares as of December 31, 20010 and 2009 |
53,409 | 53,171 | ||||||
| Series B, non-cumulative, convertible, issued and outstanding none and 73,500 shares as of December 31, 2010 and 2009, respectively |
— | 70,000 | ||||||
| Common stock, no par value; 100,000,000 and 40,000,000 shares authorized; issued and outstanding, 39,914,686 shares and 20,160,726 shares (including 76,809 shares and 10,050 shares of unvested restricted stock) as of December 31, 2010 and 2009, respectively |
187,754 | 88,060 | ||||||
| Retained earnings |
32,000 | 41,314 | ||||||
| Accumulated other comprehensive income, net of tax |
849 | 3,513 | ||||||
| Total shareholders’ equity |
274,012 | 256,058 | ||||||
| Total liabilities and shareholders’ equity |
$ | 293,380 | $ | 280,535 | ||||
CONDENSED STATEMENTS OF OPERATIONS
| Year Ended December 31, | ||||||||||||
| 2010 | 2009 | 2008 | ||||||||||
| (Dollars in thousands) | ||||||||||||
| Cash dividend from Center Bank |
$ | — | $ | — | $ | — | ||||||
| Equity in undistributed earnings of Center Bank |
24,043 | (40,595 | ) | 4,242 | ||||||||
| Other operating expenses, net |
(1,360 | ) | (1,907 | ) | (4,022 | ) | ||||||
| Net income (loss) |
$ | 22,683 | $ | (42,502 | ) | $ | 220 | |||||
129
Table of Contents
CONDENSED STATEMENTS OF CASH FLOWS
| 2010 | 2009 | 2008 | ||||||||||
| (Dollars in thousands) | ||||||||||||
| Cash flows from operating activities: |
||||||||||||
| Net income (loss) |
$ | 22,683 | $ | (42,502 | ) | $ | 220 | |||||
| Adjustment to reconcile net income (loss) to net cash (used in) provided by operating activities |
||||||||||||
| Equity in undistributed (income) loss of the Bank |
(24,043 | ) | 40,595 | (4,242 | ) | |||||||
| Stock option compensation |
686 | 978 | 1,175 | |||||||||
| Decrease (increase) in other assets |
196 | (407 | ) | (331 | ) | |||||||
| (Decrease) increase in liabilities |
(5,110 | ) | 4,542 | 616 | ||||||||
| Net cash (used in) provided by operating activities |
(5,588 | ) | 3,206 | (2,562 | ) | |||||||
| Cash flows used in investing activities: |
||||||||||||
| Payment for investments in and advances to subsidiary |
— | (82,781 | ) | (40,000 | ) | |||||||
| Net cash used in investing activities |
— | (82,781 | ) | (40,000 | ) | |||||||
| Cash flows (used in) provided by financing activities: |
||||||||||||
| Net proceeds from issuance of preferred stock |
— | 70,000 | 55,000 | |||||||||
| Proceeds from issuance of common stock |
— | 12,781 | — | |||||||||
| Proceeds from stock options exercised |
— | 47 | 22 | |||||||||
| Payment of cash dividend |
(2,750 | ) | (3,383 | ) | (3,315 | ) | ||||||
| Net cash (used in) provided by financing activities |
(2,750 | ) | 79,445 | 51,707 | ||||||||
| Net (decrease) increase in cash |
(8,338 | ) | (130 | ) | 9,145 | |||||||
| Cash, beginning of year |
13,801 | 13,931 | 4,786 | |||||||||
| Cash, end of year |
$ | 5,463 | $ | 13,801 | $ | 13,931 | ||||||
25. SUBSEQUENT EVENTS
The Company has evaluated subsequent events for recognition or disclosure and determined there were no significant events that required disclosure in its consolidated financial statements.
130
Table of Contents
| ITEM 9. | CHANGES IN AND DISAGREEMENTS WITH ACCOUNTANTS ON ACCOUNTING AND FINANCIAL DISCLOSURE |
Not applicable.
| ITEM 9A. | CONTROLS AND PROCEDURES |
Evaluation of Disclosure Controls and Procedures
The Company’s principal executive officer and its principal financial officer, after evaluating the effectiveness of the Company’s disclosure controls and procedures (as defined in Exchange Act Rules 13(a)–15(e) as of the end of the period covered by this report (the “Evaluation Date”) have concluded that as of the Evaluation Date, the Company’s disclosure controls and procedures were adequate and effective to ensure that material information relating to the Company and its consolidated subsidiaries would be made known to them by others within those entities, particularly during the period in which this annual report was being prepared.
Disclosure controls and procedures are designed to ensure that information required to be disclosed by us in the reports that we file or submit under the Exchange Act is recorded, processed, summarized and reported, within the time periods specified in the Securities and Exchange Commission’s rules and forms. Disclosure controls and procedures include, without limitation, controls and procedures designed to ensure that information required to be disclosed by us in the reports that we file under the Exchange Act is accumulated and communicated to our management, including our principal executive officer and our principal financial officer, as appropriate to allow timely decisions regarding required disclosure.
Management’s Annual Report on Internal Control over Financial Reporting
Management is responsible for the preparation, integrity and reliability of the consolidated financial statements and related financial information contained in this annual report. The financial statements were prepared in accordance with generally accepted accounting principles and prevailing practices of the banking industry. Where amounts must be based on estimates and judgments, they represent the best estimates and judgments of management.
Management has established and is responsible for maintaining an adequate internal control structure designed to provide reasonable, but not absolute, assurance as to the integrity and reliability of the financial statements, safeguarding of assets against loss from unauthorized use or disposition and the prevention and detection of fraudulent financial reporting. The internal control structure includes: a financial accounting environment; a comprehensive internal audit function; an independent audit committee of the board of directors; and extensive financial and operating policies and procedures. Management also recognizes its responsibility for fostering a strong ethical climate which is supported by a code of conduct, appropriate levels of management authority and responsibility, an effective corporate organizational structure and appropriate selection and training of personnel.
The board of directors, primarily through its audit committee, oversees the adequacy of the Company’s internal control structure. The audit committee, whose members are neither officers nor employees of the Company, meets periodically with management, internal auditors and internal credit examiners to review the functioning of each and to ensure that each is properly discharging its responsibilities. In addition, KPMG LLP, an independent registered public accounting firm, was engaged to audit the Company’s consolidated financial statements and express an opinion as to the fairness of presentation of such financial statements. KPMG LLP has issued an audit report on the effectiveness of the Company’s internal control over financial reporting based on criteria established in “Internal Control-Integrated Framework” issued by the Committee of Sponsoring Organizations of the Treadway Commission (“COSO”).
Management recognizes that there are inherent limitations in the effectiveness of any internal control structure. Because of its inherent limitations, internal control over financial reporting may not prevent or detect misstatements. Also, projections of any evaluation of effectiveness to future periods are subject to the risk that controls may become inadequate because of changes in conditions, or that the degree of compliance with the policies or procedures may deteriorate.
Management assessed the effectiveness of the Company’s internal control over financial reporting as of December 31, 2010 based upon the criteria for effective internal control over financial reporting described in “Internal Control—Integrated Framework” issued by COSO. Based upon this assessment, management believes that, as of December 31, 2010, the Company maintained effective control over financial reporting.
131
Table of Contents
Changes in Internal Controls
There were no significant changes in the Company’s internal controls or in other factors that could significantly affect the Company’s internal controls over financial reporting during the quarter ended December 31, 2010, except for the remediation of the material weakness described below.
Management previously disclosed a material weakness in internal control over financial reporting in its quarterly report on Form 10-Q for the quarter ended March 31, 2010, as amended, and each of the quarterly reports thereafter during 2010, relating to our internal controls over the review process utilized to interpret the applicable accounting literature for computing and allocating the amount attributable to the beneficial conversion feature related to the issuance of preferred stock. To remediate this material weakness, management implemented an additional financial reporting review process in case of unusual or non-routine transactions. As a result, management of the Company believes this material weakness has been satisfactorily remediated as of December 31, 2010.
132
Table of Contents
REPORT OF INDEPENDENT REGISTERED PUBLIC ACCOUNTING FIRM
The Board of Directors and Shareholders
Center Financial Corporation:
We have audited Center Financial Corporation’s internal control over financial reporting as of December 31, 2010, based on criteria established in the Internal Control-Integrated Framework issued by the Committee of Sponsoring Organizations of the Treadway Commission (COSO). Center Financial Corporation’s management is responsible for maintaining effective internal control over financial reporting and for its assessment of the effectiveness of internal control over financial reporting, included in the accompanying Management’s Report on Internal Controls Over Financial Reporting. Our responsibility is to express an opinion on Center Financial Corporation’s internal control over financial reporting based on our audit.
We conducted our audit in accordance with the standards of the Public Company Accounting Oversight Board (United States). Those standards require that we plan and perform the audit to obtain reasonable assurance about whether effective internal control over financial reporting was maintained in all material respects. Our audit included obtaining an understanding of internal control over financial reporting, assessing the risk that a material weakness exists, and testing and evaluating the design and operating effectiveness of internal control based on the assessed risk. Our audit also included performing such other procedures as we considered necessary in the circumstances. We believe that our audit provides a reasonable basis for our opinion.
A company’s internal control over financial reporting is a process designed to provide reasonable assurance regarding the reliability of financial reporting and the preparation of financial statements for external purposes in accordance with generally accepted accounting principles. A company’s internal control over financial reporting includes those policies and procedures that (1) pertain to the maintenance of records that, in reasonable detail, accurately and fairly reflect the transactions and dispositions of the assets of the company; (2) provide reasonable assurance that transactions are recorded as necessary to permit preparation of financial statements in accordance with generally accepted accounting principles, and that receipts and expenditures of the company are being made only in accordance with authorizations of management and directors of the company; and (3) provide reasonable assurance regarding prevention or timely detection of unauthorized acquisition, use, or disposition of the company’s assets that could have a material effect on the financial statements.
Because of its inherent limitations, internal control over financial reporting may not prevent or detect misstatements. Also, projections of any evaluation of effectiveness to future periods are subject to the risk that controls may become inadequate because of changes in conditions, or that the degree of compliance with the policies or procedures may deteriorate.
In our opinion, Center Financial Corporation maintained, in all material respects, effective internal control over financial reporting as of December 31, 2010, based on criteria established in the Internal Control-Integrated Framework issued by the COSO.
We also have audited, in accordance with the standards of the Public Company Accounting Oversight Board (United States), the consolidated statement of financial condition of Center Financial Corporation and subsidiaries as of December 31, 2010, and the related consolidated statements of operations, shareholders’ equity and comprehensive income (loss), and cash flows for the year ended December 31, 2010, and our report dated March 3, 2011 expressed an unqualified opinion on those consolidated financial statements.
/s/ KPMG LLP
Los Angeles, California
March 3, 2011
133
Table of Contents
None
134
Table of Contents
ITEM 10. DIRECTORS, EXECUTIVE OFFICERS, AND CORPORATE GOVERNANCE
The information required to be furnished pursuant to this item with respect to Directors and Executive Officers of the Company will be set forth under the caption “Election of Directors” in the Company’s proxy statement for the 2011 Annual Meeting of Shareholders (the “Proxy Statement”), which the Company will file with the SEC within 120 days after the close of the Company’s 2010 fiscal year in accordance with SEC Regulation 14A under the Securities Exchange Act of 1934. Such information is hereby incorporated by reference.
The information required to be furnished pursuant to this item with respect to compliance with Section 16(a) of the Exchange Act will be set forth under the caption “Section 16(a) Beneficial Ownership Reporting Compliance” in the Proxy Statement, and is incorporated herein by reference.
The information required to be furnished pursuant to this item with respect to the Company’s Code of Ethics and corporate governance matters will be set forth under the caption “Corporate Governance” in the Proxy Statement, and is incorporated herein by reference.
ITEM 11. EXECUTIVE COMPENSATION
The information required to be furnished pursuant to this item will be set forth under the caption “Executive Officer and Director Compensation” and “Compensation Discussion and Analysis” in the Proxy Statement, and is incorporated herein by reference.
ITEM 12. SECURITY OWNERSHIP OF CERTAIN BENEFICIAL OWNERS AND MANAGEMENT
Securities Authorized for Issuance Under Equity Compensation Plans
The information required by Item 12 with respect to securities authorized for issuance under equity compensation plans is set forth under “Item 5—Market for Registrant’s Common Equity and Issuer Repurchases of Equity Securities” above.
Other Information Concerning Security Ownership of Certain Beneficial Owners and Management
The remainder of the information required by Item 12 will be set forth under the captions “Security Ownership of Certain Beneficial Owners and management” and “Election of Directors” in the Proxy Statement, and is incorporated herein by reference.
ITEM 13. CERTAIN RELATIONSHIPS AND RELATED TRANSACTIONS AND DIRECTOR INDEPENDENCE
The information required to be furnished pursuant to this item will be set forth under the caption “Related Party Transactions” and “Corporate Governance-Director Independence” in the Proxy Statement, and is incorporated herein by reference.
ITEM 14. PRINCIPAL ACCOUNTANT FEES AND SERVICES.
The information required to be furnished pursuant to this item will be set forth under the caption “Ratification of Appointment of Independent Registered Public Accounting Firm—Fees” in the Proxy Statement, and is incorporated herein by reference
135
Table of Contents
ITEM 15. EXHIBITS, FINANCIAL STATEMENTS SCHEDULES
(a) Exhibits
| Exhibit No. |
Description | |
| 2.1 | Agreement and Plan of Merger dated as of December 9, 2010, between Nara Bancorp, Inc. and Center Financial Corporation11 | |
| 3.1 | Restated Articles of Incorporation of Center Financial Corporation1 | |
| 3.2 | Amended and Restated Bylaws of Center Financial Corporation2 | |
| 3.3 | Amendment to Bylaws of Center Financial Corporation3 | |
| 3.4 | Amendment to Articles of Incorporation of Center Financial Corporation4 | |
| 4.1 | Certificate of Determination for Series A Preferred Stock of Center Financial Corporation3 | |
| 10.1 | Employment Letter Agreement between Center Financial Corporation and Richard S. Cupp effective January 6, 20115 | |
| 10.2 | 2006 Stock Incentive Plan, as Amended and Restated June 13, 20076 | |
| 10.3 | Lease for Corporate Headquarters Office7 | |
| 10.4 | Indenture dated as of December 30, 2003 between Wells Fargo Bank, National Association, as Trustee, and Center Financial Corporation, as Issuer8 | |
| 10.5 | Amended and Restated Declaration of Trust of Center Capital Trust I, dated as of December 30, 20038 | |
| 10.6 | Guarantee Agreement between Center Financial and Wells Fargo Bank, National Association dated as of December 30, 20038 | |
| 10.7 | Deferred compensation plan and list of participants9 | |
| 10.8 | Split dollar plan and list of participants9 | |
| 10.9 | Survivor income plan and list of participants9 | |
| 10.10 | Warrant to Purchase Common Stock3 | |
| 10.11 | Letter Agreement, dated as of December 12, 2008, including the Securities Purchase Agreement—Standard Terms incorporated by reference therein, between Center Financial Corporation and the United States Department of the Treasury3 | |
| 11 | Statement of Computation of Per Share Earnings (included in Note 19 to Consolidated Financial Statements included herein.) | |
| 12.1 | Computation of Ratio of Earnings to Fixed Charges | |
| 21 | Subsidiaries of Registrant10 | |
| 23.1 | Consent of KPMG LLP | |
| 23.2 | Consent of Grant Thornton LLP | |
| 31.1 | Certification of Principal Executive Officer (Section 302 Certification) | |
| 31.2 | Certification of Principal Financial Officer (Section 302 Certification) | |
| 32 | Certification of Periodic Financial Report (Section 906 Certification) | |
| 99.1 | Certification of Principal Executive Officer and Principal Financial Officer (Pursuant to Section 111 of EESA) | |
| 1 | Filed as an Exhibit of the same number to the Form 10-Q for the quarterly period ended June 30, 2008 and incorporated herein by reference |
| 2 | Filed as an Exhibit to the Form 8-K filed with the Commission on May 12, 2006 and incorporated herein by reference |
| 3 | Filed as an Exhibit to the Form 8-K filed with the SEC on December 16, 2008 and incorporated herein by reference |
136
Table of Contents
| 4 | Filed as an exhibit of the same number to the Form 10-Q for the quarterly period ended March 31, 2010 and incorporated herein by reference |
| 5 | Filed as an Exhibit to the Form 8-K filed with the Commission on January 7, 2011 and incorporated herein by reference |
| 6 | Filed as an Exhibit of the same number to the Form 10-Q for the quarterly period ended June 30, 2007 and incorporated herein by reference |
| 7 | Filed as an Exhibit of the same number to the Company’s Registration Statement on Form S-4 filed with the Securities and Exchange Commission (the “Commission”) on June 14, 2002 and incorporated herein by reference |
| 8 | Filed as an Exhibit of the same number to the Form 10-K for the fiscal year ended December 31, 2003 and incorporated herein by reference |
| 9 | Filed as an Exhibit of the same number to the Form 10-Q for the quarterly period ended March 31, 2006 and incorporated herein by reference |
| 10 | Filed as an Exhibit of the same number to the Form 10-K for the fiscal year ended December 31, 2007 and incorporated herein by reference |
| 11 | Filed as an Exhibit to the Form 8-K filed with the Commission on December 10, 2010 and incorporated herein by reference |
(b) Financial Statement Schedules
Schedules to the financial statements are omitted because the required information is not applicable or because the required information is presented in the Company’s Consolidated Financial Statements or related notes.
137
Table of Contents
Pursuant to the requirements of Section 13 or 15(d) of the Securities Exchange Act of 1934, the Company has duly caused this report to be signed on its behalf by the undersigned thereunto duly authorized:
| Date: March 3, 2011 | /S/ RICHARD S. CUPP | |||
| Richard S. Cupp President & Chief Executive Officer | ||||
Pursuant to the requirements of the Securities Exchange Act of 1934, this report has been signed below by the following persons on behalf of the registrant and in the capacity and the dates indicated.
| Signature |
Title |
Date | ||
| /S/ RICHARD S. CUPP | Chief Executive Officer & President (Principal Executive Officer) |
March 3, 2011 | ||
| Richard S. Cupp | ||||
| /S/ JIN CHUL JHUNG | Chairman of the Board |
March 3, 2011 | ||
| Jin Chul Jhung | ||||
| /S/ DAVID Z. HONG | Director |
March 3, 2011 | ||
| David Z. Hong | ||||
| /S/ CHANG HWI KIM | Director |
March 3, 2011 | ||
| Chang Hwi Kim | ||||
| /S/ PETER Y. S. KIM | Director |
March 3, 2011 | ||
| Peter Y. S. Kim | ||||
| /S/ SANG HOON KIM | Director |
March 3, 2011 | ||
| Sang Hoon Kim | ||||
| /S/ CHUNG HYUN LEE | Director |
March 3, 2011 | ||
| Chung Hyun Lee | ||||
| /S/ KEVIN SUNG KIM | Director |
March 3, 2011 | ||
| Kevin Sung Kim | ||||
| /S/ HWA KYUNG KIM | Vice President and Controller (Principal Financial Officer and Principal Accounting Officer) |
March 3, 2011 | ||
| Hwa Kyung Kim | ||||
138