Attached files
| file | filename |
|---|---|
| 8-K - FORM 8-K - TEXAS INDUSTRIES INC | f8k_030311.htm |

1
TEXAS INDUSTRIES, INC.
DAVENPORT & COMPANY
INFRASTRUCTURE AND BASIC INDUSTRY CONFERENCE
MARCH 3, 2011

2
FORWARD-LOOKING STATEMENT
Certain statements contained in this presentation are “forward-looking statements”
within the meaning of the Private Securities Litigation Reform Act of 1995. Such
statements are subject to risks, uncertainties and other factors, which could cause
actual results to differ materially from future results expressed or implied by such
forward-looking statements. Potential risks and uncertainties include, but are not
limited to, the impact of competitive pressures and changing economic and financial
conditions on Texas Industries’ business; changes in economic conditions specific to
any one or more of Texas Industries’ markets; the cyclical and seasonal nature of
Texas Industries’ business; the level of construction activity in Texas Industries’
markets; changes in demand; abnormal periods of inclement weather; unexpected
periods of equipment downtime; changes in costs of raw materials, fuel and energy;
changes in the cost or availability of transportation; unexpected operational
difficulties; changes in interest rates; the timing and amount of federal, state and local
funding for infrastructure; delays in announced capacity expansions; ongoing volatility
and uncertainty in the capital or credit markets; the impact of environmental laws,
regulations and claims, and changes in governmental and public policy; and other
risks and uncertainties described in Texas Industries’ reports on SEC Forms 10-K, 10-
Q and 8-K. Forward-looking statements speak only as of the date hereof, and Texas
Industries assumes no obligation to publicly update such statements.

3
A BUILDING MATERIALS COMPANY
¨ Cement, Aggregate and Concrete
¨ Used in all types of construction
¨ Cement accounts for approximately 75% of
operating earnings over time
operating earnings over time

4
SUMMARY
¨ Cement Capacity (millions of tons)
North Texas 2.2
Central Texas 0.9
California 2.3
TOTAL CEMENT CAPACITY 5.4
Central Texas Expansion 1.4
North Texas Expansion 0.8
TOTAL TARGETED CAPACITY 7.6
¨ Shipment Recovery/Expansion
◊ with construction recovery
◊ with completion and utilization of new capacity
¨ Margin Expansion
◊ with improving shipments
◊ with recovery of prices
◊ with positive impact of new capacity
¨ TXI’s Strategy Remains Intact

5
LONG TERM DRIVERS OF CEMENT
DEMAND
DEMAND

6
PUBLIC WORKS - 50%

7
RESIDENTIAL - 25%
NON-RESIDENTIAL - 25%

9
FAVORABLE INDUSTRY STRUCTURE

10
FAVORABLE INDUSTRY STRUCTURE
¨ U. S. cement consumption has historically exceeded
domestic production capacity
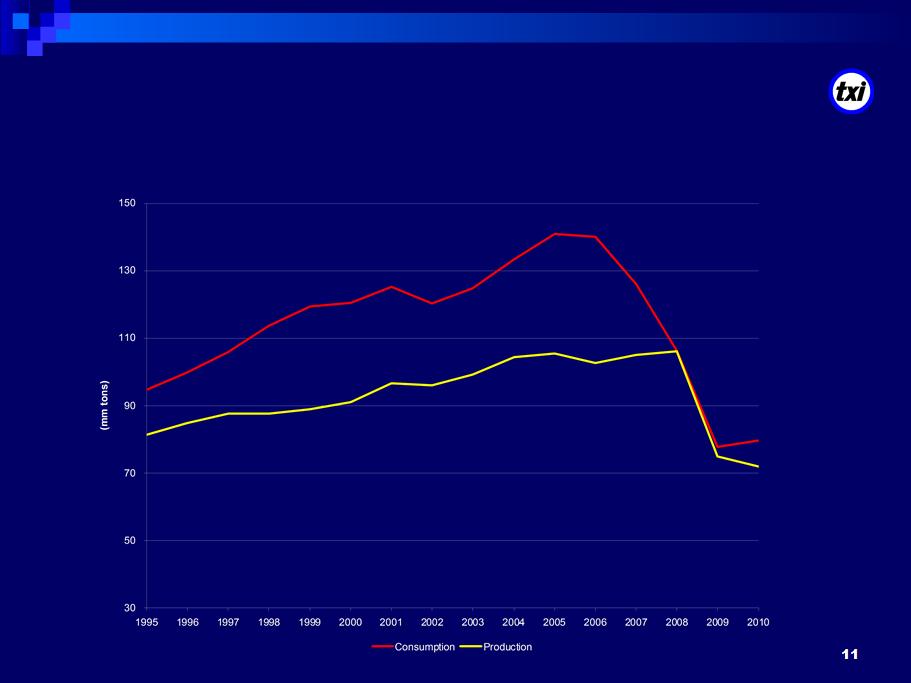
U.S. CEMENT CONSUMPTION AND PRODUCTION
1995 - 2010
1995 - 2010

12
FAVORABLE INDUSTRY STRUCTURE
¨ U. S. cement consumption has historically exceeded
domestic production capacity
¨ U.S. cement capacity and import terminals are largely owned
or controlled by international producers
¨ Significant barriers to entry exist for new cement capacity
¨ Significant transportation costs lead to regional markets

13
TEXAS AND CALIFORNIA
ATTRACTIVE LONG-TERM MARKETS
ATTRACTIVE LONG-TERM MARKETS

14
TEXAS AND CALIFORNIA
ATTRACTIVE LONG-TERM MARKETS
ATTRACTIVE LONG-TERM MARKETS
¨ The two largest cement markets in the U.S.
¨ Account for almost 25% of cement consumption
¨ Receive the largest shares of federal transportation
funding
funding
¨ Favorable demographics
◊ Large populations
◊ Above average population growth rates

TEXAS CEMENT
CONSUMPTION AND CAPACITY
CONSUMPTION AND CAPACITY

TEXAS CONSTRUCTION
RESIDENTIAL AND NON-RESIDENTIAL
RESIDENTIAL AND NON-RESIDENTIAL


CALIFORNIA CEMENT
CONSUMPTION AND CAPACITY
CONSUMPTION AND CAPACITY

19

20
CALIFORNIA CONSTRUCTION
NON-BUILDING AND HIGHWAY CONTRACT AWARDS
NON-BUILDING AND HIGHWAY CONTRACT AWARDS

21
TEXAS MARKET - 1980, 2000 AND 2020
Sources: U. S. Census Bureau, Portland Cement Association (PCA), USGS

22
Sources: U.S. Census Bureau, Portland Cement Association (PCA), USGS

23
STRONG COMPETITIVE POSITION

24
STRONG COMPETITIVE POSITIONS
¨ Texas
◊ Accounts for approximately 80% of TXI sales
◊ TXI is the largest cement supplier in the state
◊ TXI is a low cost cement supplier
◊ Aggregate and ready mix operations are concentrated in Texas
◊ Largest expanded shale and clay supplier in Texas
¨ California
◊ Cement plant expansion makes TXI one of the largest competitors in
southern California
southern California
◊ Expansion gives TXI low cost cement capacity

25
LOW COST OPERATIONS ARE KEY
Notes:
1 North Texas productivity from the dry kiln for the twelve months ended May 31, 2008
1 North Texas productivity from the dry kiln for the twelve months ended May 31, 2008
2 Old California productivity for the twelve months ended May 31, 2007
3 Expected California productivity for the new kiln at full capacity
4 Current Central Texas productivity for the twelve months ended May 31, 2008
5 Values reflect the expected combined operations of the current and new kilns at TXI’s Central Texas plant
6 U.S. and Canadian Labor - Energy Input Survey, Portland Cement Association
North
Texas
1
Old
California
2
New
California
3
Current
Texas
5
PCA
Comps
6
Labor Productivity
Tons per man hour
6.0
2.6
6.1
2.8
3.6
Energy Efficiency
Mmbtu / ton
3.2
5.0
3.7
2.6
3.3
Kwh / ton
118.6
164.6
115.0
124.6
136.0
High Productivity and Efficiency
2.5
Central
New Central
Current and
Texas
6.4
110.0
4
PCA
Best
6
5.8
2.0
115.0

26
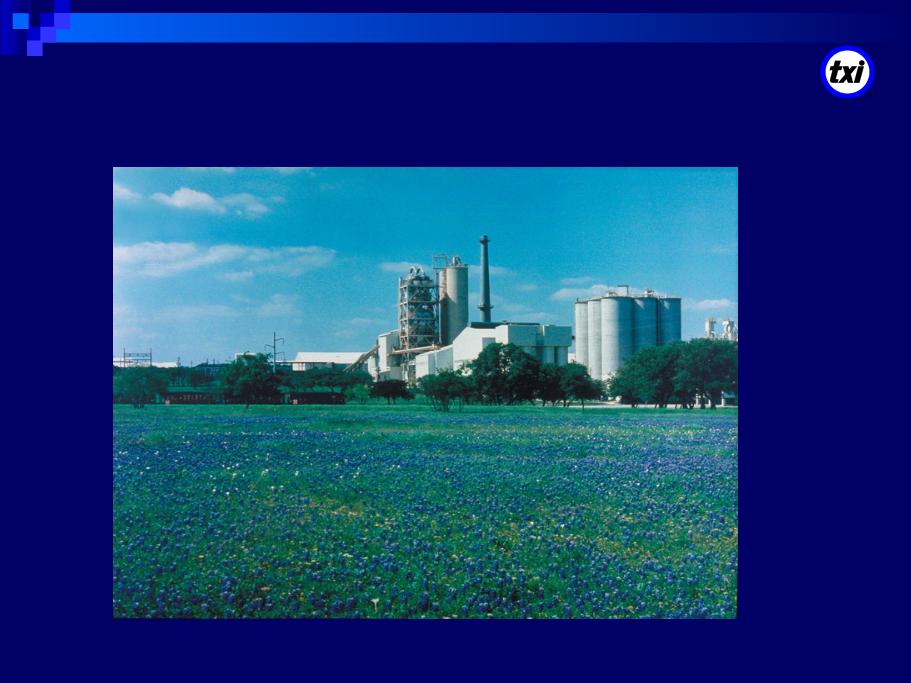
OVERVIEW OF OPERATIONS

27
NORTH TEXAS CEMENT PLANT
28
CENTRAL TEXAS CEMENT PLANT
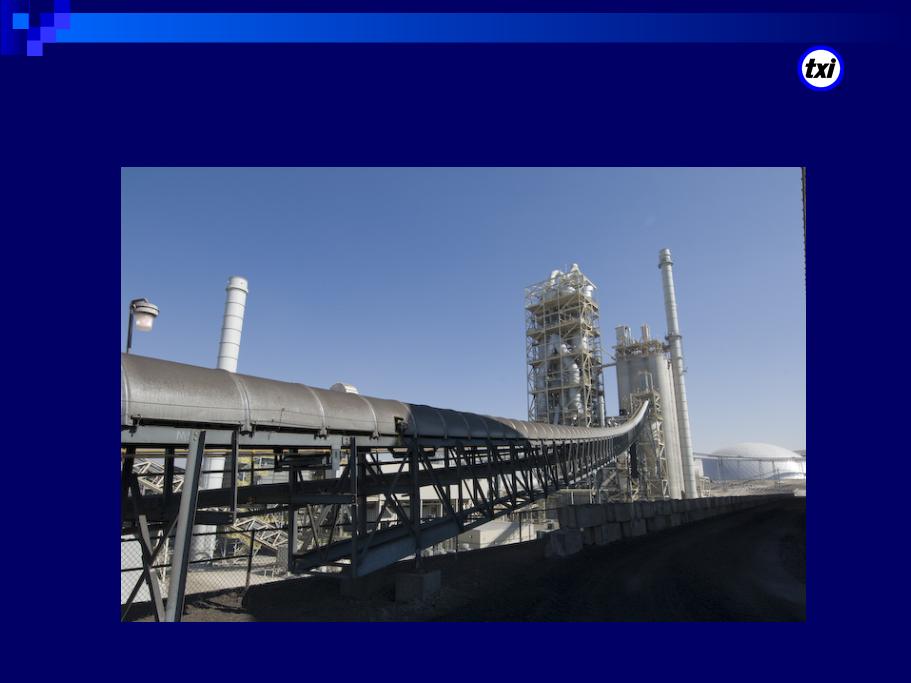
29
NEW CALIFORNIA CEMENT PLANT

30
STONE PLANT IN OKLAHOMA

31
READY-MIX CONCRETE

32
CURRENT MARKET CONDITIONS

33
CURRENT ECONOMIC CONDITIONS
¨ The Texas economy continues to be one of the better economies in
the nation
the nation
¨ California economic activity continues to be weak
¨ Energy costs have been volatile in recent years
¨ Credit markets have begun to heal

34
INFRASTRUCTURE DEVELOPMENT
¨ The current federal stimulus program calls for approximately $27 -
30 billion to be invested in highways and bridges
30 billion to be invested in highways and bridges
¨ Total recent annual U.S. investment (all sources) in highways and
bridges has approximated $75 billion
bridges has approximated $75 billion
¨ Roadbuilding:
◊ Creates jobs
◊ Creates a foundation for further growth and development
¨ Texas and California have received stimulus funding for
infrastructure projects of $2.25 billion and $2.6 billion, respectively
infrastructure projects of $2.25 billion and $2.6 billion, respectively
¨ Approximately 50% of the highway stimulus funding remains to be
invested
invested
¨ Several large highway projects in North Texas have begun

35
FOCUS ON LIQUIDITY
¨ CASH BALANCE OF $140 MILLION AT NOVEMBER 30, 2010
¨ $200 MILLION BANK CREDIT LINE
◊ Matures August 2012
◊ Utilization at May 31, 2010 - $31.1 million of letters of credit
¨ $650 MILLION 9.25% NOTES
◊ Mature August 2020
◊ Refinancing of existing bonds was executed in July 2010
¨ CAPITAL EXPENDITURES HAVE DECLINED DRAMATICALLY

36
EARNINGS POTENTIAL AND STRATEGY

37
EARNINGS POTENTIAL
|
($, tons and cubic yards in millions)
|
Shipments
|
Sales
|
Normalized
Margin |
Potential
Operating
Profit
|
|
|
|
|
|
|
|
Cement (tons)
|
7.6
|
$722
|
30%
|
$217
|
|
Aggregates (tons)
|
25.0
|
200
|
20
|
40
|
|
Ready-mix (cubic yards)
|
4.5
|
405
|
9
|
37
|
|
Other
|
|
130
|
20
|
26
|
|
Combined Operating Profit
|
|
|
|
320
|
|
Corporate Expenses, Net
|
|
|
|
(30)
|
|
Depreciation
|
|
|
|
85
|
|
EBITDA
|
|
|
|
375
|
|
FY10 EBITDA
|
|
|
|
54
|
|
Note: Potential values assume a recovery in construction activity, cement consumption equal to or greater than cement capacity
in Texas and California, normalized industry margins, and expected performance from new cement operations. |
||||

38
TXI’S STRATEGY REMAINS INTACT
¨ Expand TXI’s most important business line - Cement
◊ All projects are at existing sites
s They utilize infrastructure already in place
s Growth is organic rather than through acquisitions
◊ All projects are in attractive long-term markets
◊ All projects should improve production efficiencies
◊ All projects should reduce per ton emissions
¨ Expand and improve efficiencies in TXI’s other business lines

39
TXI MANAGEMENT TEAM
n Mel G. Brekhus, CEO
n Kenneth R. Allen, CFO
n J. Lynn Davis, VP-CEMENT
n Stephen D. Mayfield, VP-AGGREGATES
n Ronnie A. Pruitt, VP-CEMENT AND AGGREGATE MARKETING AND
SALES
SALES
n James B. Rogers, VP-CONSUMER PRODUCTS
n Barry M. Bone, VP-REAL ESTATE
n Lyndon Zielke, VP-Purchasing
Average Company / Industry Experience 29 Years

40

41
ADDENDUM - RECONCILIATION
EBITDA TO NET INCOME
EBITDA TO NET INCOME

42
RECONCILIATION OF EBITDA TO NET INCOME
IN $ MILLIONS
IN $ MILLIONS
FY 2010
EBITDA Reconciled
Net loss from Continuing Operations (39)
Plus (minus):
Interest 52
Income Taxes (23)
Depreciation, Depletion & Amortization 64
EBITDA 54
EBITDA represents income from continuing operations before interest, income taxes, depreciation and amortization
EBITDA is presented because we believe it is a useful indicator of our performance and our ability to meet debt service and capital expenditure requirements. It is not, however,
intended as an alternative measure of operating results or cash flow from operations as determined in accordance with generally accepted accounting principles.
intended as an alternative measure of operating results or cash flow from operations as determined in accordance with generally accepted accounting principles.
EBITDA is not necessarily comparable to similarly titled measures used by other companies.

43
COMPANY COLORS
Blue:
R = 0
G = 0
B = 255
Beige:
R = 251
G = 248
B = 216
TEXAS INDUSTRIES, INC.
DAVENPORT & COMPANY
INFRASTRUCTURE AND BASIC INDUSTRY CONFERENCE
MARCH 3, 2011
DRAFT