Attached files
| file | filename |
|---|---|
| 8-K - FORM 8-K - HollyFrontier Corp | c13552e8vk.htm |
Exhibit 99.1

| Holly Corporation Winter 2011 |

| 2 Holly Corporation Disclosure Statement Statements made during the course of this presentation that are not historical facts are "forward- looking statements" within the meaning of the U.S. Private Securities Litigation Reform Act of 1995. Forward-looking statements are inherently uncertain and necessarily involve risks that may affect the business prospects and performance of Holly Corporation and/or Holly Energy Partners, L.P., and actual results may differ materially from those discussed during the presentation. Such risks and uncertainties include but are not limited to risks and uncertainties with respect to the actions of actual or potential competitive suppliers and transporters of refined petroleum products in Holly's and Holly Energy Partners' markets, the demand for and supply of crude oil and refined products, the spread between market prices for refined products and market prices for crude oil, the possibility of constraints on the transportation of refined products, the possibility of inefficiencies or shutdowns in refinery operations or pipelines, effects of governmental regulations and policies, the availability and cost of financing to Holly and Holly Energy Partners, the effectiveness of Holly's and Holly Energy Partners' capital investments and marketing and acquisition strategies, the possibility of terrorist attacks and the consequences of any such attacks, general economic conditions, and risks and uncertainties with respect to our proposed "merger of equals" with Frontier Oil Corporation, including our ability to complete the merger in the anticipated timeframe or at all, the diversion of management in connection with the merger and our ability to realize fully or all the anticipated benefits of the merger. Additional information on risks and uncertainties that could affect the business prospects and performance of Holly and Holly Energy Partners is provided in the most recent reports of Holly and Holly Energy Partners filed with the Securities and Exchange Commission. All forward-looking statements included in this presentation are expressly qualified in their entirety by the foregoing cautionary statements. Holly and Holly Energy Partners undertake no obligation to publicly update or revise any forward-looking statements, whether as a result of new information, future events or otherwise. |

| Our Mission Our mission is to be a premier U.S. petroleum refining, pipeline and terminal company as measured by superior financial performance and sustainable, profitable growth. We seek to accomplish this by operating safely, reliably and in a environmentally responsible manner, effectively and efficiently operating our existing assets, offering superior products and services, and growing organically and through strategic acquisitions. We strive to outperform our competition due to the quality and development of our people and our assets. We endeavor to maintain an inclusive and stimulating work environment that enables each employee to fully contribute to and participate in the Company's success. Our Values Health & Safety: We put health and safety first. We conduct our business with high regard for the health and safety of our employees, contractors, and neighboring communities. We continuously strive to raise the bar, guided by our stringent health and safety performance standards. Environmental Stewardship: We care about the environment. We are committed to minimizing environmental impacts by reducing wastes, emissions, and other releases. We understand that it is a privilege to conduct our business in the communities where we operate. Corporate Citizenship: We obey the law. We are committed to promoting sustainable social and economic benefits wherever we operate. Honesty & Respect: We tell the truth and respect others. We uphold high standards of business ethics and integrity, enforce strict principles of corporate governance, and support transparency in all our operations. One of our greatest assets is our reputation for acting ethically in the interests of employees, shareholders, customers, business partners, and the communities where we operate. Continuous Improvement: We must continually improve. Innovation and high-performance are our way of life. Our culture creates a fulfilling environment which enables employees to reach their full potential. We believe a positive attitude toward constructive change is essential. 3 |

| Presentation Topics HOC Company Overview Financial Performance and Competitiveness Focused Growth Orientation Summary Appendix 4 |

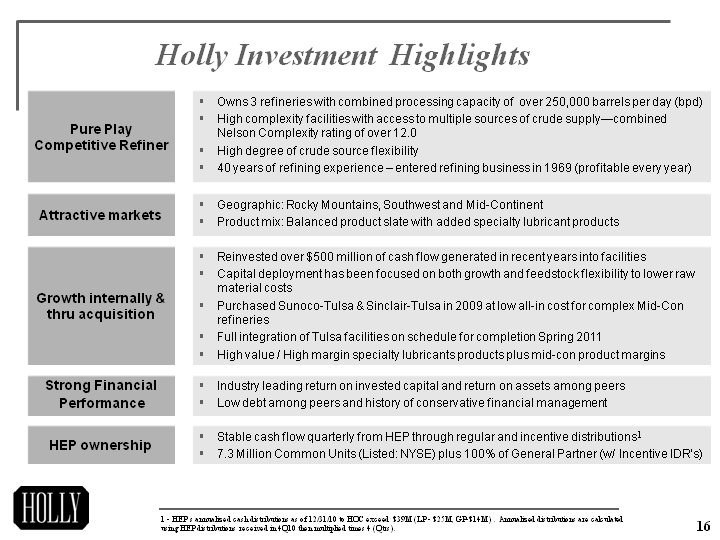
| Holly Investment Highlights Holly Investment Highlights 5 1 - HEP's annualized cash distributions as of 12/31/10 to HOC exceed $39M (LP - $25M, GP-$14M) . Annualized distributions are calculated using HEP distributions received in 4Q10 then multiplied times 4 (Qtrs). 1 |

| Overview of Holly and HEP Holly Corporation: Refineries operate in Southwest, Rockies & Mid-Continent markets Over 250,000 bpsd of refining capacity and average complexity of over 12.0 Refineries directly connected to local, Cushing or Canadian crude trading hubs Owns 100% of GP and 7.3 million LP units of Holly Energy Partners (NYSE: HEP) Holly Energy Partners: Over 2,500 miles of refined product & crude pipelines 11 Terminals & 8 loading rack facilities in 7 Western and Mid-continent states Over 6 million bbls of refined product & crude oil storage 25% interest in Salt Lake pipeline, a joint venture with Plains, delivering crude oil into the Salt Lake valley 6 |

| U.S. Population Growth By State (2000 - 2010) Traditionally High Growth, Niche Markets States served by Holly are among the fastest growing in the country UNEV project to provide greater access to Nevada and southern Utah markets Source: U.S. Census Bureau. Reflects 2010 Census Results. 7 7 RI DC Loss 0 - 5% 5 - 15% 15 - 25% 25% + NH VT MA CT NJ DE MD PR Legend Area Served by HOC RI DC Loss 0 - 5% 5 - 15% 15 - 25% 25% + NH VT MA CT NJ DE MD PR Legend Area Served by H |

| Presentation Topics HOC Company Overview Financial Performance and Competitiveness Focused Growth Orientation Summary Appendix 8 |

| (CHART) 9 Holly Historical EBITDA (in millions) 1- HEP formed in July 2004 2- Sold Montana Refinery Company (8,000 bpd) while increasing Navajo Refinery capacity (8,000 bpd) 3 - Increased from 111,000 bpd over course of late 2008/2009 4- Acquired the two Tulsa refineries in Jun and Dec 2009 *Definition for non-GAAP measures such as EBITDA or Margins are located on page 32. * Record '05-'07 EBITDA achieved w/ less than half current refining capacity Year 20041 2005 20062 2007 2008 20093,4 2010 Refining Capacity (kbpd) 107 109 109 109 111 256 256 Gross Margin ($/bbl) $9.20 $12.62 $15.78 $16.74 $10.96 $7.21 $8.79 EBITDA $mm's GM $/bbl |

| Strong Returns on Capital 10 * Supporting calculations /details are located on page 31 - 32. Highest ROIC among peers 3 4 * * |

| Conservative Balance Sheet 11 * Debt levels exclude Sunoco Logistics (SLX) debt; HOC debt excludes HEP debt; Supporting calculations /details are located on page 31-32. 3 |

| Presentation Topics HOC Company Overview Financial Performance and Competitiveness Focused Growth Orientation Summary Appendix 12 |

| HOC Growth - Thru Strategic Investments & Acquisitions Approx $500mm invested for enhanced feedstock flexibility & modest growth Synergistic acquisitions of Tulsa refineries at less than $1,000 per daily bbl* Uniquely positioned among peers to enter up-cycle at more than 2008 capacity *After accounting for sales of Tulsa logistics assets, see slide 27 for more details. 13 |

| UNEV Pipeline & Refinery Economics Overview: 400 mile, 12" refined products pipeline from Salt Lake City to Las Vegas with terminals in Cedar City, UT and Las Vegas, NV Holly owns 75% interest (Sinclair 25%) Completion Date - Summer 2011 Benefits: Las Vegas gasoline trades at premium to Salt Lake Lowers impact of Salt Lake City seasonal demand reduction Provides access to growth market for Rocky Mountain refiners HEP Purchase Option: At pipeline startup, HEP will have option to purchase HOC's interest in the pipeline JV for 180 days from completion of project at HOC's cost (estimated to be $244 mm) plus a 7% per annum carrying cost 14 |

| Presentation Topics HOC Company Overview Financial Performance and Competitiveness Focused Growth Orientation Summary Appendix 15 |
| Holly Investment Highlights Holly Investment Highlights 1 - HEP's annualized cash distributions as of 12/31/10 to HOC exceed $39M (LP - $25M, GP-$14M) . Annualized distributions are calculated using HEP distributions received in 4Q10 then multiplied times 4 (Qtrs). 1 16 |

| Holly Corporation (NYSE: HOC) 100 Crescent Court, Suite 1600 Dallas, Texas 75201 (214) 871-3555 Neale Hickerson, Vice President, Investor Relations Neale.hickerson@hollycorp.com 214-871-3555 www.hollycorp.com 17 |

| 18 Appendix |

| Navajo Refinery Product Sales Mix (12/31/10) Overview 561 acre site located in Artesia, NM with crude capacity of 100,000 BPSD (expanded in Q1 2009) Ability to process sour and heavy (Canadian) crude oils into high value light products Distributes to high margin markets in Arizona, New Mexico and West Texas Nelson Complexity rating of 11.8 Last turnaround completed in Q1 2009. Annual maintenance capex approximately $10 million Operating Summary *Definition for non-GAAP measures such as EBITDA or Margins are located on page 32. * 19 |

| Woods Cross Refinery Product Sales Mix (12/31/10) Overview 200 acre site located in Woods Cross, UT (near Salt Lake City) with crude oil capacity of 31,000 BPD Processes regional sweet and lower cost black wax crude as well as Canadian sour crude oils Distributes to high margin markets in Utah, Idaho, Nevada, Wyoming, and eastern Washington Nelson Complexity rating of 12.5 Last turnaround completed in Q3 2008. Annual maintenance capex approximately $5 million Operating Summary * *Definition for non-GAAP measures such as EBITDA or Margins are located on page 32. 20 |
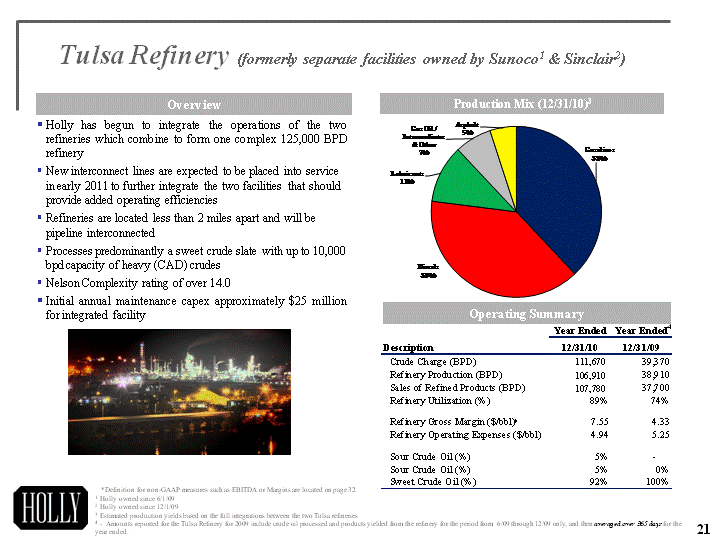
| 21 Tulsa Refinery (formerly separate facilities owned by Sunoco1 & Sinclair2) Production Mix (12/31/10)3 Overview Holly has begun to integrate the operations of the two refineries which combine to form one complex 125,000 BPD refinery New interconnect lines are expected to be placed into service in early 2011 to further integrate the two facilities that should provide added operating efficiencies Refineries are located less than 2 miles apart and will be pipeline interconnected Processes predominantly a sweet crude slate with up to 10,000 bpd capacity of heavy (CAD) crudes Nelson Complexity rating of over 14.0 Initial annual maintenance capex approximately $25 million for integrated facility Operating Summary * 4 1 Holly owned since 6/1/09 2 Holly owned since 12/1/09 3 Estimated production yields based on the full integrations between the two Tulsa refineries 4 - Amounts reported for the Tulsa Refinery for 2009 include crude oil processed and products yielded from the refinery for the period from 6/09 through 12/09 only, and then averaged over 365 days for the year ended. *Definition for non-GAAP measures such as EBITDA or Margins are located on page 32. |

| HOC's Advantaged Markets * Gasoline and Diesel cracks are determined using NYMEX crude oil (WTI) & spot market postings for each respective period and market. These are not HOC specific cracks and are intended to display general market trends with respect to both gasoline and diesel. 1 HOC's Markets consistently trade above Gulf Coast Benchmarks * 22 |

| Holly (stand alone) $millions Cash $230 Senior notes $300 Revolver capacity $400 Balance - Credit Ratings BB stable Ba3 stable Balance Sheet / Liquidity Balance Sheet Highlights and Liquidity Other: HEP has an option to purchase HOC's interest in the UNEV pipeline JV180 days from completion of project at HOC's cost (estimated to be $244mm) plus a 7% per annum carrying cost 1 - Excludes $480M of HEP debt that is nonrecourse to HOC. 2 - As of 12/31/2010 1 2 23 |

| Past investments make legacy refineries stronger 24 Capital Expenditure Overview 1- Excludes HEP capex; net of contributions from UNEV JV partner; includes turnaround expenditures; excludes asset acquisitions 2- As of 12/30/10; excludes HEP capex and cash. Strong balance sheet and liquidity going forward 1 Cash balance: $229M (excludes HEP cash) $400 mm credit facility $300 mm of Holly senior unsecured notes 2011 Capex Estimate - $185mm $118mm - Refining (including maintenance, capex and turnarounds) $67mm - UNEV 7.3M common units of HEP and 100% GP ownership 2 |

| Tulsa (Sunoco) Acquisition - Transaction Summary Asset Summary: Tulsa (West) refinery has crude capacity of 85,000 BPSD High complexity: 11.4 Nelson complexity factor Produces high value specialty products and transportation fuels Strategic location - direct pipeline connection to Cushing crude oil hub and Magellan product system that supplies the Mid-Continent market Assets include 3.2 million bbls of storage & related logistic assets Assignment of the Sunoco specialty product trademark for N. America and license for S. America Purchase Summary: $65 million in cash to purchase refinery property, plant and equipment Inventory purchased at closing market prices Closed: June 1, 2009 Off-take Agreement: Five year off-take agreement for gas oil to Sunoco Environmental Indemnification: Sunoco would retain responsibility for certain environmental liabilities for 20 years resulting from operations of the refinery prior to closing EPA Waiver: EPA waiver granted which extends the existing ULSD compliance deadline to November 2011 25 |

| 26 Sinclair Refinery - Transaction Summary Holly purchased Sinclair's Tulsa refinery December 1, 2009 Holly's portion of the purchase price consisted of $74.0 million in Holly stock (2.8M shares @ $26.53) and $54.5 million of cash at closing (for total of $128.5) At closing Sinclair entered into a long-term off take agreement for up to 50,000 BPD of gasoline/diesel to supply their Mid-Con branded and unbranded marketing network Holly has entered into a contract for storage and logistics services with HEP relating to the assets that HEP purchased from Sinclair Sinclair's Tulsa refinery is a 75,000 barrel per stream day ("bpsd") cracking refinery located approximately 2 miles southeast of Holly's Tulsa West facility(1) Holly purchased approximately 500,000 barrels of inventory from Sinclair at closing 1 Combined fully integrated capacity of Holly's existing Tulsa refinery and Sinclair's refinery is projected to be approximately 125,000 bpsd |

| 27 Holly is in process of further integrating the two Tulsa facilities to form one complex 125,000 BPD refinery Constructing interconnect pipelines that will transfer various intermediate streams between facilities and optimize blending, increase yields and reduce operating expenses Refinery integration results in net capex savings of approximately $125 million that would have otherwise been required for the Sunoco refinery: Eliminates an estimated $110 million of project capital requirements Reduces MSAT 2 compliance capex by about $15 million Diesel Hydrotreater expansion ($20M) at East facility to satisfy ULSD requirements anticipated to be completed by the end of 1Q 2011 Strategic Acquisitions at Historically Low Multiples 1 - Full integration could take up to 18 months but gas oil upgrade is available immediately. 2 - Purchase price does not include inventory. 3 - Includes $89 million Tulsa portion of the $93 million dropdown transaction completed on 3/31/10. $2,000 $1,186 $ / Complexity BBL $18,000 $11,325 $ / BBL of capacity High Average Refinery industry acquisitions over the last five years: 2 3 1 |

| Enhanced Competitive Position at Legacy Refineries 28 Recently Completed Refinery Enhancements Increased capacity 19% Increased lower cost black wax and Canadian crude processing from 20 to 50% Increased ULSD production percentage Enhanced black wax and Canadian heavy receiving capabilities Increased capacity 17% (to 100,000 bpd) Allows 100% sour crude oil processing Increased ULSD production percentage Increased intermediates processing Provides access to Cushing crude oil hub and a variety of cost advantaged crudes Enables refinery to shift up to 40% of its crude slate to lower priced heavy crudes |

| Estimated Effects of Capital Projects at Holly's Legacy Refineries Illustrative computations of impact of expansion & gross margins 29 Gross Margin/bbl Consolidated Navajo Woods Cross 2003 $7.23 $7.43 $6.10 2004 $9.20 $10.16 $6.00 2005 $12.62 $13.61 $9.62 2006 $15.78 $15.37 $17.10 2007 $16.74 $15.58 $20.69 2008 $10.96 $9.55 $16.60 2009 $7.21 $7.20 $11.27 For every +/- $1/bbl change in gross margin: NRC equals $5.475 million -- WX equals $1.825 million INCREMENTAL GROSS MARGIN FROM REFINERY EXPANSIONS: Wood Cross completion Q3 '08 -- Operational Q4 '08 / Navajo completion Q1 '09 -- Operational Q2 '09 (in $millions) Margin/ bbl assumption: $6.00 $8.00 $10.00 $12.00 $14.00 NRC: at 15,000 bpsd expansion $33 $44 $55 $66 $77 WX: at 5,000 bpsd expansion $11 $15 $18 $22 $26 |

| 30 Estimated Effects of Capital Projects at Holly's Legacy Refineries Illustrative computations of impact of crude mix changes Every +/- $1 change in net feedstock costs equals $3.65 million Every +/- $1 change in net feedstock costs equals $14.6 million All dollar values are for a full year impact and assume operating rates are at full utilization with no operating downtime FEEDSTOCK FLEXIBILITY: WOODS CROSS REFINERY Completion Q3 '08 -- Operational Q4 '08 (in $ millions) Increase cost advantaged bbls by 10,000 bpsd WTI-Heavy Diff. / bbl assumption: (net of transportation & yield changes) $5.00 $10.00 $15.00 $20.00 Annual gross margin improvement from feedstock flexibility $18 $36 $54 $73 FEEDSTOCK FLEXIBILITY: NAVAJO REFINERY Completion Q3 '09 -- Operational Q1 '10 (in $ millions) Change crude charge mix from 100% WTS crude to include 40% cost-advantaged bbls WTS-Heavy Diff. / bbl assumption: (net of transportation & yield changes) $5.00 $10.00 $15.00 $20.00 Annual gross margin improvement from feedstock flexibility $73 $146 $219 $292 |

| Financial metrics* 31 * Debt levels for Sunoco exclude Sunoco Logistics (SLX) debt; Holly debt excludes HEP debt; All amounts are based on publicly-available financial statements, which we have assumed to be accurate. |

| 32 Definitions Non GAPP measurements: We report certain financial measures that are not prescribed or authorized by U. S. generally accepted accounting principles ("GAAP"). We discuss management's reasons for reporting these non-GAAP measures below. Although management evaluates and presents these non-GAAP measures for the reasons described below, please be aware that these non-GAAP measures are not alternatives to revenue, operating income, income from continuing operations, net income, or any other comparable operating measure prescribed by GAAP. In addition, these non-GAAP financial measures may be calculated and/or presented differently than measures with the same or similar names that are reported by other companies, and as a result, the non-GAAP measures we report may not be comparable to those reported by others. Refining gross margin or refinery gross margin: the difference between average net sales price and average costs of products per barrel of produced refined products. This does not include the associated depreciation, depletion and amortization costs. Refining gross margin or refinery gross margin is a non-GAAP performance measure that is used by our management and others to compare our refining performance to that of other companies in our industry. This margin does not include the effect of depreciation, depletion and amortization. Other companies in our industry may not calculate this performance measure in the same manner. Our historical refining gross margin or refinery gross margin is reconciled to net income under "Reconciliation to Amounts Reported Under Generally Accepted Accounting Principles" of Holly Corporation's 2009 10-K filed February 26, 2010. Net Operating Margin: Net operating margin is a non-GAAP performance measure that is used by our management and others to compare our refining performance to that of other companies in our industry. This margin does not include the effect of depreciation, depletion and amortization. Other companies in our industry may not calculate this performance measure in the same manner. Our historical net operating margin is reconciled to net income under "Reconciliation to Amounts Reported Under Generally Accepted Accounting Principles" of Holly Corporation's 2009 10-K filed February 26, 2010. EBITDA: Earnings before interest, taxes, depreciation and amortization, which we refer to as EBITDA, is calculated as net income plus (i) interest expense net of interest income, (ii) income tax provision, and (iii) depreciation, depletion and amortization. EBITDA is not a calculation provided for under accounting principles generally accepted in the United States; however, the amounts included in the EBITDA calculation are derived from amounts included in our consolidated financial statements. EBITDA should not be considered as an alternative to net income or operating income as an indication of our operating performance or as an alternative to operating cash flow as a measure of liquidity. EBITDA is not necessarily comparable to similarly titled measures of other companies. EBITDA is presented here because it is a widely used financial indicator used by investors and analysts to measure performance. EBITDA is also used by our management for internal analysis and as a basis for financial covenants. Our historical EBITDA is reconciled to net income under "Reconciliation to Amounts Reported Under Generally Accepted Accounting Principles" of Holly Corporation's 2010 10-K filed February 25, 2011. Debt-To-Capital: A measurement of a company's financial leverage, calculated as the company's long term debt divided by its total capital. Debt includes all long-term obligations. Total capital includes the company's debt and shareholders' equity. 5 Year Return on Invested Capital: A measurement which for our purposes is calculated using the 5 year average Net Income divided by the sum of the 5 year average of Total Equity and Long Term Debt. We consider ROIC to be a meaningful indicator of our financial performance, and we evaluate this metric because it measures how effectively we use the money invested in our operations. IDR: Incentive Distribution Rights BPD: the number of barrels per calendar day of crude oil or petroleum products. BPSD: the number of barrels per stream day of crude oil or petroleum products. MMSCFD: million standard cubic feet per day. Gas Oil Hydrocracker: a refinery unit which uses catalyst at high pressure and temperature and in the presence of hydrogen to convert high boiling point hydrocarbons to light transportation fuels and low sulfur FCC feedstock. Solvent deasphalter / residuum oil supercritical extraction ("ROSE"): a refinery unit that uses a light hydrocarbon like propane or butane to extract non asphaltene heavy oils from asphalt or atmospheric reduced crude. These deasphalted oils are then further converted to gasoline and diesel in the FCC process. The remaining asphaltenes are either sold, blended to fuel oil or blended with other asphalt as a hardener.. |