Attached files
| file | filename |
|---|---|
| 8-K - VECTREN CORP | vc_8k0302.htm |
| EX-99.2 - CAUTIONARY STATEMENT - VECTREN CORP | vc_8k0302ex992.htm |
Exhibit 99.1

New York & Boston
Presentations to the Financial
Community
Community
Carl Chapman - President and CEO
Jerry Benkert - Executive Vice President and CFO
March 3-4, 2011

2
Forward-Looking Statements
All statements other than statements of historical fact are forward-looking statements made
in good faith by the company and are intended to qualify for the safe harbor from liability
established by the Private Securities Litigation Reform Act of 1995. Such statements are
based on management’s beliefs, as well as assumptions made by and information currently
available to management and include such words as “believe”, “anticipate”, ”endeavor”,
“estimate”, “expect”, “objective”, “projection”, “forecast”, “goal”, “likely”, and similar
expressions intended to identify forward-looking statements.
Vectren cautions readers that the assumptions forming the basis for forward-looking
statements include many factors that are beyond Vectren’s ability to control or estimate
precisely and actual results could differ materially from those contained in this document.
Forward-looking statements speak only as of the date on which our statement is made, and
we assume no duty to update them. More detailed information about these factors is set
forth in Vectren’s filings with the Securities and Exchange Commission, including Vectren’s
2010 annual report on Form 10-K filed on February 17, 2011.
Robert L. Goocher, Treasurer and VP - Investor Relations
rgoocher@vectren.com
812-491-4080

Ø NYSE Symbol: VVC
Ø 8-10% Target Annual Total
Shareholder Return
Shareholder Return
• Annual dividends paid increased
51st consecutive year in Dec. 2010
to annualized rate of $1.38 per
share
51st consecutive year in Dec. 2010
to annualized rate of $1.38 per
share
Ø Over 1.1 million utility customers
in Indiana and Ohio
in Indiana and Ohio
• Operate in constructive regulatory
environments with revenue
stabilization mechanisms
environments with revenue
stabilization mechanisms
Ø Well diversified nonutility portfolio
linked to core utility
linked to core utility
Ø $4.8 billion in assets
Ø $2.1 billion in revenues
Ø $2.1 billion market cap
Ø S&P: A-, Moody’s: A3
Stable outlook for both
Stable outlook for both
Utility Net Income
Consolidated Net Income*
Three Year Average (’08-’10)
Utility
84%
Nonutility
16%
Electric
50%
Gas
50%
3
* Excludes the 2009 Liberty charge of $11.9 million.
Vectren Corporation Overview

* Jointly owned (61%) with a subsidiary of Citizens Energy Group.
Vectren
Utility
Vectren
Nonutility
Vectren North
Indiana Gas
Vectren South
SIGECO -
Electric
Electric
Vectren South
SIGECO - Gas
Vectren Ohio
VEDO
Infrastructure
Services
Services
Energy
Services
Services
Coal Mining
Energy
Marketing
Marketing
Miller Pipeline
Energy
Systems Group
Prosperity Mine
Oaktown Mine 1
Oaktown Mine 2
(under development)
ProLiance
Energy*
Vectren
Source
4
Vectren at a Glance

5
Nonutility Business Operations - Offices
Vectren Energy Delivery of Indiana - North
Vectren Energy Delivery of Indiana - South
Vectren Energy Delivery of Ohio
Utility Service Territories
Vectren’s Footprint
OH
IN
Indianapolis
Columbus
Louisville
Cincinnati
Birmingham
Little Rock
York
South River
Kansas City
New Smyrna
Beach
Dayton
Evansville
St. Louis
Atlanta
Johnson City
Richmond
Raleigh
Nashville
Clearwater
Ft. Worth
Mobile
Houston
Greenville
Lansing
Traverse
City
Miller Pipeline
Energy Systems Group
Vectren Fuels
ProLiance Energy
Vectren Source

6
Looking Ahead - Strategies for 2011 and Beyond
Utility
Ø Execute strategies to consistently achieve annual utility earnings growth target of 3%
• Earn allowed returns in gas and electric utilities
– Implement new electric rates from pending base rate case
– Aggressively manage costs through performance management and strategic sourcing
– Seek continued support for alternative regulatory solutions that encourage customer
conservation and also reduce the size and frequency of traditional base rate cases
conservation and also reduce the size and frequency of traditional base rate cases
• Disciplined allocation of capital to operate at cash flow neutral
– Reinvest earnings to support necessary rate base growth
– Reduce external financing requirements
Nonutility
Ø Continued growth and profitability of existing portfolio of nonutility businesses
• Increase investments in Infrastructure and Energy Services businesses to drive longer term
earnings growth
earnings growth
• As demand continues to recover, open Oaktown #2 coal mine in 2012 and ramp up to full
production
production
• Focus on dramatically improving ProLiance’s profitability prospects through customer growth and
significant reductions in fixed cost structure
significant reductions in fixed cost structure

7
Generation Portfolio
Ø 5 Coal-fired base units - 1,000 MW
• 100% scrubbed for SO2
• 90% controlled for NOx
• Combination of pollution controls, including
fabric filter technology, have the co-benefit
of removing substantial levels of mercury
and particulate matter
fabric filter technology, have the co-benefit
of removing substantial levels of mercury
and particulate matter
Ø 6 Gas-fired peak-use turbines - 295 MW
Ø Purchased capacity - 100 MW thru 2012
Ø Renewable energy ~ 5%
• Land-fill gas generation facility - 3 MW
• Wind energy - 80 MW via purchased power
Vectren North - Indiana Gas
560,000 Gas Customers
Vectren South - SIGECO
110,000 Gas Customers
Vectren Ohio - VEDO
310,000 Gas Customers
Vectren South - SIGECO
141,000 Electric Customers
Vectren Utility
Holdings, Inc.
The Utility Group
8
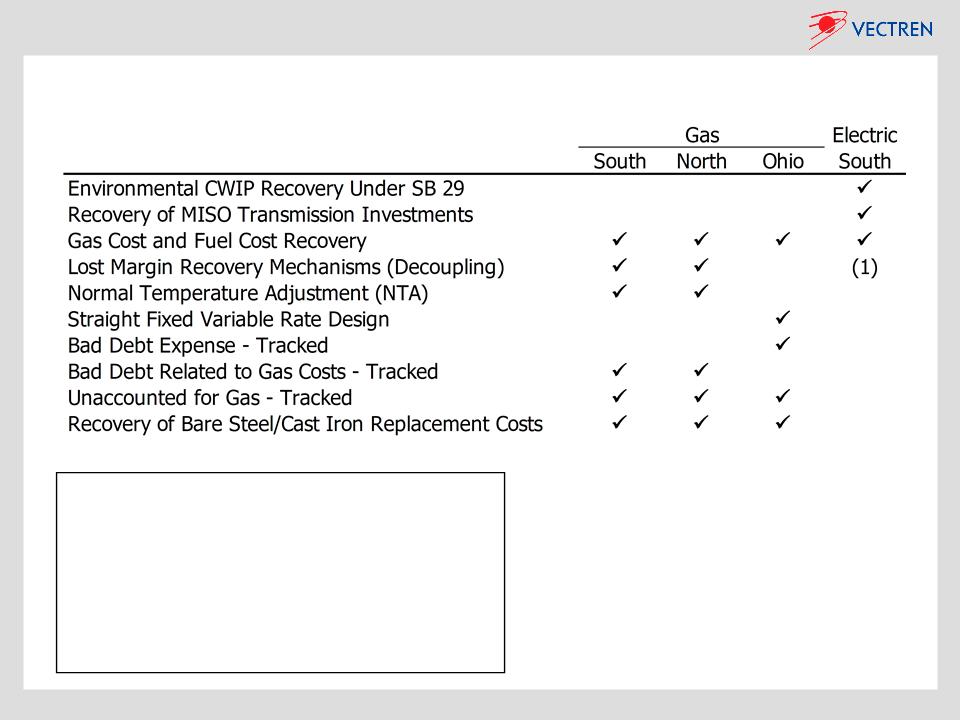
Constructive Utility Regulation - Mitigating Risk
(1)
Ø Electric base rate increase expected beginning in
1st half of 2011
1st half of 2011
• $34 million request at 10.7% ROE
• 2011 guidance includes ~$15-20 million of
revenue, which reflects partial year
revenue, which reflects partial year
• Decoupling rate design requested
Ø Gas Utilities’ Rate Base: ~$1.2 billion
• ~$0.9 billion Indiana
• ~$0.3 billion Ohio
Ø Electric Utility Rate Base: ~$1.3 billion
• All Indiana
Ø ~10.2% Total Gas & Electric Allowed ROE

9
Utility Investments and Cash Flow
Ø Anticipate achieving free cash flow neutral in 2011-2013, similar to 2010
• Depreciation & amortization expense of $190 to $200 million expected through 2013
Ø Favorable regulatory support in recovering capital spend on significant utility expenditures
• Incremental margins expected in 2011 from regulatory mechanisms for current recovery of Ohio bare steel/cast
iron (BS/CI) expenditures, and favorable BS/CI accounting treatment in IN
iron (BS/CI) expenditures, and favorable BS/CI accounting treatment in IN
• Total investment of ~$90 million in high voltage electric transmission line, timely recovered at FERC-approved
equity return of 12.38%, with completion in 2012; 2011 earnings to reflect a return on ~$75 million of the total
investment (~$30 million in 2010)
equity return of 12.38%, with completion in 2012; 2011 earnings to reflect a return on ~$75 million of the total
investment (~$30 million in 2010)
Ø Utilize cash generated from bonus depreciation to reduce external financing requirements and
accelerate planned funding of pension plans ($25 million)
accelerate planned funding of pension plans ($25 million)
• Estimate will generate ~$100 million of incremental cash in 2011-2013

Ø Utility Outlook
• 2011 earnings expected to grow roughly 3% from weather-normalized 2010 earnings
• New electric base rate increase expected to increase earnings beginning in 1st half of 2011
• Industrial gas and electric sales expected to be comparable to improved 2010 levels, as
economy in service territories continues to improve
economy in service territories continues to improve
• Aggressively manage costs with focus on improving processes and operating efficiencies
– 2011 O&M includes an $8 million increase for planned maintenance on several electric generating units
10
Utility Guidance & Outlook
(1) Net income in 2007 and 2008 includes significant pipeline integrity work and strong pre-recession operating margins
~15% CAGR
2006-2011E
11
Nonutility Outlook
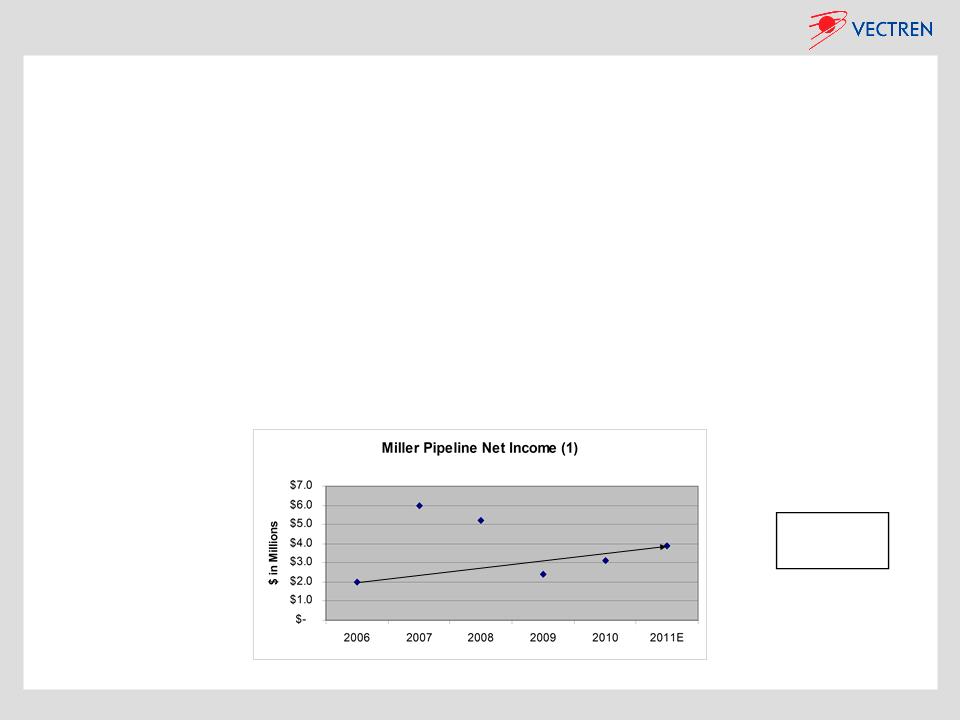
Infrastructure Services - Miller Pipeline
Ø 2011 earnings projected to increase ~25% over 2010; significant drivers for future growth include:
• New and existing customers - more projects as economy continues to rebound; availability of bonus depreciation
– Bare steel/cast iron replacement programs, along with waste water and sewer rehabilitation projects
– Increased emphasis on growing gas transmission construction business, building off successful 2010 projects
– Competing for growing number of new shale gas pipeline infrastructure projects
– Significant work expected related to gas pipeline infrastructure integrity assessments resulting from San Bruno
and other recent incidents
and other recent incidents
• Utilization of technology and other workforce improvement measures to drive improved productivity, efficiency and
control costs
control costs
• Infrastructure is a focused growth area for Vectren and may include strategic acquisitions in the future

(1) Net income in 2008 & 2009 included a significant renewables project each year
~20% CAGR
2006-2011E
12
Nonutility Outlook
Energy Services - Energy Systems Group (ESG)
Ø 2011 earnings projected to increase ~5% over 2010, even with ramp up of personnel
• Positive impacts on earnings of record backlog of $118 million at 12/31/10 ($70 million at beginning of 2010)
• Continue to expand geographic footprint, including Texas, Colorado, New Mexico, and the U.S. Virgin Islands
• On 2/8/11, selected to design, construct and operate a landfill gas-to-recycled natural gas processing facility for
DeKalb County, Georgia
DeKalb County, Georgia
• Competing for additional renewable energy projects; including making direct investments in strategic projects
• Projected earnings decrease by $2-3 million as additional employees and supporting infrastructure are added to
more aggressively grow the business
more aggressively grow the business

~35% CAGR
2006-2011E
13
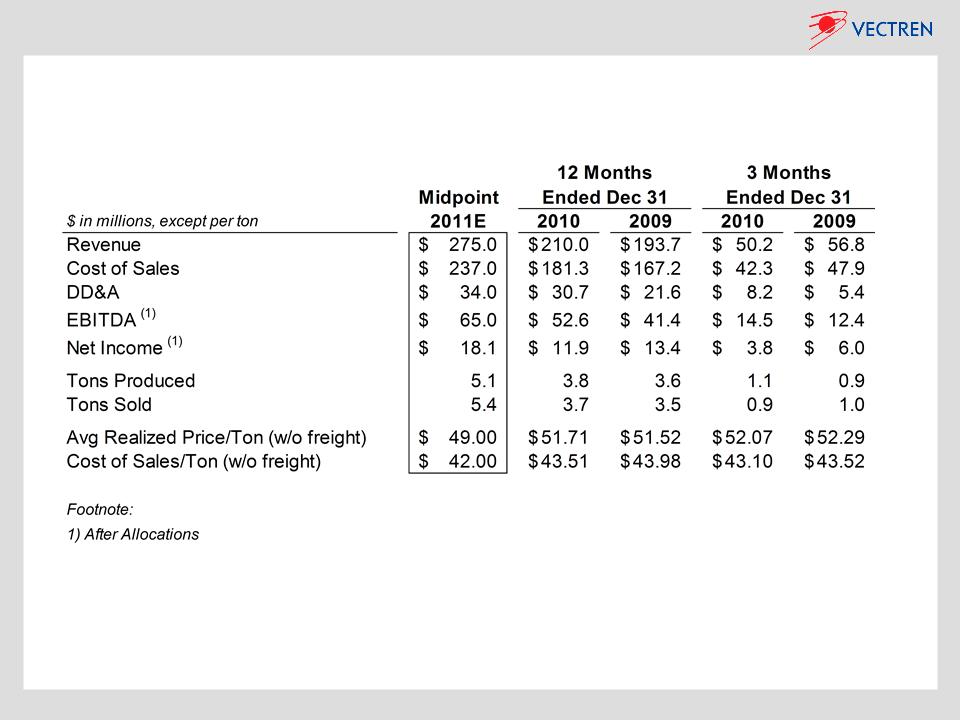
Nonutility Outlook
Coal Mining - Vectren Fuels
Ø 2011 earnings expected to increase ~50% over 2010
• Increasing volumes of coal produced of 5.1 million tons and sales of 5.4 million tons (sales of 3.7 million tons in ’10)
– Over 90% of 2011 total expected sales is already contracted and priced
– Vectren utilities expect to purchase 1.9 million tons in 2011, including 200k tons deferred from prior years
– Approximately 40% and 15%, respectively, of 2012 and 2013 expected production already contracted and priced
– 3rd and final section of continuous miners at 1st Oaktown mine expected to be in production in March 2011
• Reduced costs at Oaktown 1 due to additional volumes
• Aggressively managing mine production costs, including reconfiguration of older Prosperity mine
• As 2nd Oaktown mine comes online in 2012, production costs per ton expected to decline
– Will enable cost sharing of investments already made in wash plant, rail spur, etc., plus other operating efficiencies
• Through December 2010, $185 million in development costs already incurred of expected $205 million total for both
Oaktown mines
Oaktown mines

(1) Net income in 2009 resulted from market conditions as revenues on variable priced sales contracts fell more
slowly than unusually high natural gas costs
slowly than unusually high natural gas costs
~40% CAGR
2007-2011E
14
Nonutility Outlook
Energy Marketing - Vectren Source
Ø 2011 earnings projected to increase ~10% over 2010
• Growing customer base
– Projected to grow to 290,000 in 2011 from 227,000 in 2010
– Successfully competed in Ohio auction to provide gas to an additional 28,000 Vectren Ohio customers
beginning April 2011
beginning April 2011
• Considering expanding footprint to markets in additional states
• Evaluating additional products and service offerings for customer base

15
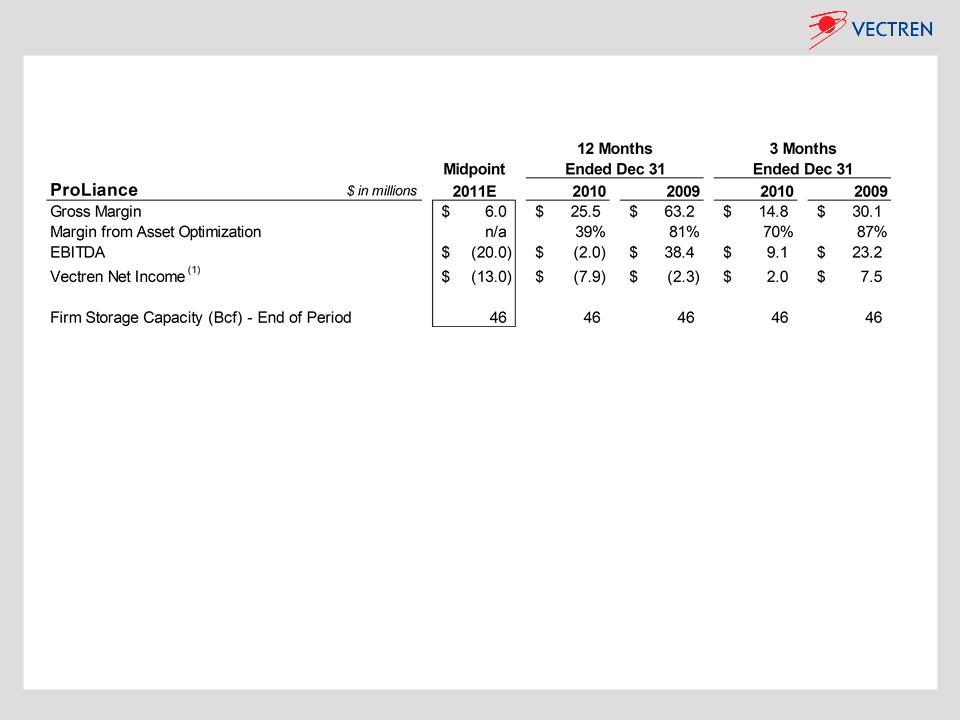
Nonutility Outlook
Energy Marketing - ProLiance
Ø 2011 results projected to reflect a net loss of ~$13 million
• Loss projected for 1st quarter 2011 estimated to be in the $9-13 million range
– Compares to ~$4 million of net income in the 1st quarter of 2010
– Driven by no seasonal storage value and virtually no cash to NYMEX being realized in the
quarter
quarter
• Near breakeven results projected for remainder of 2011 based on:
– For quarters 2 - 4 the forward price curve is currently in contango offering the month-to-month
price spreads needed for better storage optimization and cash to NYMEX opportunities
price spreads needed for better storage optimization and cash to NYMEX opportunities
– Summer to winter seasonal spread budgeted at $0.50 - $0.55/Dth beginning in the 4th quarter;
current spread is indicated to be ~$0.55/Dth
current spread is indicated to be ~$0.55/Dth
– Demand costs for pipeline and storage capacity are highest in the 1st quarter
– Indicated locational basis spreads are better for the remainder of the year
– For example, Panhandle Eastern Pipeline production area basis is indicated to be $0.15
- $0.20/Dth in the 1st quarter and $0.25 - $0.30/Dth during the remainder of the year
- $0.20/Dth in the 1st quarter and $0.25 - $0.30/Dth during the remainder of the year

16
Nonutility Outlook
Energy Marketing - ProLiance - cont’d
Ø ProLiance’s business model is being adapted to evolving market dynamics for long-term success
• Implementing new trading strategies, but within VaR limit of $2.5 million
• Initiatives underway to reduce G&A costs further; to date, reduced 15% vs. 2010 (annualized)
• Creating new margin opportunities by increasing sales to existing and new commercial and industrial (C&I) customers
through enhanced marketing programs
through enhanced marketing programs
– C&I customer count is up ~15% in 2010 vs. 2009
– C&I and power generation customers’ annual volumes up ~30% in 2010 vs. 2009
• Exploring various renegotiation strategies for transportation and storage contracts, including
– $25 million or one-third of contracts that expire over next 3 years and $40 million or half over next 5 years
Ø Forward price curve indicates potential for improved margins; each $0.10 change in seasonal storage
spreads equates to $4 million of margin at the ProLiance level
spreads equates to $4 million of margin at the ProLiance level
Ø Although there can be no assurance, current forward price curve of basis and seasonal spreads and
expected profitability improvement measures indicate ProLiance results may be breakeven in 2013 at the
Vectren level
expected profitability improvement measures indicate ProLiance results may be breakeven in 2013 at the
Vectren level
Ø Resources with optionality and highly rated marketer
• 46 Bcf of natural gas storage and diverse pipeline transportation network under contract
• Ranked #2 out of 32 gas marketers in 2010 Mastio customer satisfaction survey; in top 4 each of the past 5 years
• Unanimous settlement filed in IN for ProLiance’s continued provision of gas supply services to Vectren & Citizens for
an additional five years
an additional five years

17
Nonutility Guidance

Ø As ProLiance repositions itself in the marketplace, Vectren believes earnings-based multiples of a
projected loss do not accurately capture the long-term value of the business
projected loss do not accurately capture the long-term value of the business
• Balance sheet - $209 million of members’ equity (book value) at 12/31/10, virtually no debt or corporate guarantees
– Vectren’s 61% share of members’ equity is ~$127 million, partially funded with debt
• Although there can be no assurance, current forward price curve of basis and seasonal spreads and expected
profitability improvement measures indicate ProLiance results may be breakeven in 2013 at the Vectren level
profitability improvement measures indicate ProLiance results may be breakeven in 2013 at the Vectren level
• ProLiance has contributed significant earnings and cash dividends to Vectren over the years, though Vectren’s
common stock dividend is not contingent upon ProLiance’s earnings
common stock dividend is not contingent upon ProLiance’s earnings
• ProLiance has saved the customers of its parent companies a combined total of nearly $200 million in gas costs
since its inception
since its inception
ProLiance Valuation Considerations
18
Vectren Valuation Considerations Excluding ProLiance
Ø 2011 EPS Guidance Midpoint without ProLiance: $1.87 per share
Ø 2011 Combination Co. Peer Median PE: ~14 to 14.5 times; Gas Co. Peer Median PE: ~16.5 to 17 times
Ø Attractive total shareholder return targeted at 8-10% annually
• Including attractive dividend, with current yield > 5%; 51 consecutive years of increasing annual dividends paid
Ø Utilities operate in constructive regulatory environments with many revenue stabilization mechanisms
• Utility results make up 80% of 2011 guidance excluding ProLiance
Ø Well diversified nonutility portfolio linked to core utility
• Upside earnings opportunity on top of solid utility earnings prospects

19
* Reaffirmed with no change from conference call date of February 17, 2011.
2011 EPS Guidance*
Consolidated: $1.60 to $1.85 per share
Utility: $1.45 to $1.55 per share
Nonutility, excl. ProLiance: $0.32 to $0.42 per share
ProLiance: $(0.20) to $(0.10) per share
Notes on Adjustments
Ø Utility of ($0.08) - weather vs. normal
Ø Nonutility of $0.08 - charges related to legacy investments

20
Summary - Investment Fundamentals
Ø Attractive total shareholder return targeted at 8-10% annually
Ø Over 1.1 million utility customers in Indiana and Ohio
• Operate in constructive regulatory environments with numerous revenue stabilization mechanisms
• Utility growth driven by reinvestment of earnings in recoverable infrastructure improvements, increasing large
customer demand and implementation of new electric base rates
customer demand and implementation of new electric base rates
• Disciplined management of cap ex and operating expenses
• Resulting in more predictable earnings growth opportunities and strong cash flow
Ø Well diversified nonutility portfolio linked to core utility
• Upside earnings opportunity on top of solid utility earnings prospects
• Long-term growth primarily focused on significant growth in infrastructure and energy services businesses, along
with ramp up of coal mines to full production
with ramp up of coal mines to full production
• Executing on strategies to grow the Source customer base and return ProLiance to profitability
Ø Stable ‘A’ rated company (both Moody’s & S&P) with strong balance sheet, liquidity, and cash flows
Ø Experienced management team
Ø Attractive dividend
• 51 consecutive years of increasing annual dividends paid
• Attractive dividend yield

21
Appendix

22
(This page intentionally left blank.)

23
Appendix
Review of 2010 Highlights
Ø Utility Group
• Solid recovery year for large customer usage
• Summer cooling weather was significantly warmer than normal and 2009
• Continued progress on high voltage transmission line - earning a timely return on the investment
• Electric rate case process complete - awaiting final Commission order
Ø Nonutility Group
• Solid year for most businesses - on plan
• Well positioned for growth in 2011 and beyond, including continued progress on Oaktown mines
• Challenging year for gas marketers, including ProLiance; loss for the year and will continue into
2011
2011
Ø Other Highlights
• Strengthened liquidity profile via successful debt offerings, renewed credit facilities
• Moody’s upgrade to A3 - now ‘A’ rated by both Moody’s and S&P
• 51st consecutive year of dividend increases
• Carl Chapman becomes Vectren CEO as Niel Ellerbrook retires

24
Appendix
Consolidated 2010 Results

25
Infrastructure Services - Miller Pipeline
Ø Provides underground pipeline
construction and repair services for
natural gas, water and wastewater
companies
construction and repair services for
natural gas, water and wastewater
companies
• 2010 revenues of $197 million
• Over 1,600 employees
• Over 50 years in construction business
• Acquired 5 small regional pipeline
construction companies over past 4 years,
expanding location and scope of operation
construction companies over past 4 years,
expanding location and scope of operation
Ø Operates primarily in the Midwest, Mid-
Atlantic and Southern regions
Atlantic and Southern regions
• Major customers include Vectren,
NiSource, Duke, LG&E, Alagasco and
Citizens
NiSource, Duke, LG&E, Alagasco and
Citizens
• Continue to expand into new areas and
add new customers
add new customers
Ø Bare steel/cast iron replacement
programs as utilities receive regulatory
support and increase capital spending
programs as utilities receive regulatory
support and increase capital spending
Ø Significant work expected related to gas
pipeline infrastructure integrity
assessments resulting from San Bruno
and other recent incidents
pipeline infrastructure integrity
assessments resulting from San Bruno
and other recent incidents
Ø Longer-term opportunities expected from
the development and construction of
gathering and pipeline interconnects to
support the development and
transportation of shale gas
the development and construction of
gathering and pipeline interconnects to
support the development and
transportation of shale gas
Appendix

Appendix
26
Nonutility Metrics - Infrastructure Services

27
Energy Services - Energy Systems Group (ESG)
Ø Performance contracting and renewable
energy project group
energy project group
• 2010 revenues of $147 million
• More than 225 employees
Ø Operates primarily in the Midwest, Mid-
Atlantic and Southern regions, recently
expanding its territorial reach including Texas
and Arkansas
Atlantic and Southern regions, recently
expanding its territorial reach including Texas
and Arkansas
• Major customers include hospitals, universities,
governments and schools (HUGS)
governments and schools (HUGS)
Ø Provides energy-saving performance
contracting
contracting
• Design facility improvements that pay for
themselves from energy savings and
operational improvements
themselves from energy savings and
operational improvements
Ø Designs, constructs, manages and owns
renewable energy projects
renewable energy projects
• Successfully completed three landfill gas projects
• Recently selected to design, construct and
operate a landfill gas-to-recycled natural gas
processing facility in Georgia
operate a landfill gas-to-recycled natural gas
processing facility in Georgia
Ø ESG is partnering with eight gas/electric
utilities as conservation and renewable
energy contractor
utilities as conservation and renewable
energy contractor
• Subcontractor under the federal “area
wide” contractor mechanism to develop
energy efficiency conservation projects to
federal installations
wide” contractor mechanism to develop
energy efficiency conservation projects to
federal installations
Ø Energy Efficient Commercial Building
federal income tax deductions (Revenue
Code 179D) available through 2013
federal income tax deductions (Revenue
Code 179D) available through 2013
Appendix

Appendix
28
Nonutility Metrics - Energy Services

29
Coal Mining
Ø Mines and sells Indiana coal to Vectren’s
utility operations and other third parties
utility operations and other third parties
• 2010 revenues of $210 million
• 750 contract mining jobs with completion of
Oaktown mines
Oaktown mines
Ø Competitive location - 13 power plants
within 50 mile radius of underground mines
within 50 mile radius of underground mines
Ø 2011 sales estimated at 5.4 million tons
compared to 3.7 million in 2010
compared to 3.7 million in 2010
• Estimated margin of ~$7 per ton
Ø Prosperity Mine
• 33 million tons of reserves
• 4.0 lbs SO2 - 11,300 BTU
• Est. max annual production up to 3 million tons
Ø Prosperity Mine phase one reconfiguration
to be completed by 1st quarter 2011
to be completed by 1st quarter 2011
• Driving cost reductions
Ø Oaktown Mines 1 & 2
• 105 million tons of reserves
• Less than 6.0 lbs SO2 - 11,200 BTU
• Oaktown #1 - shipped coal in Feb 2010
• Oaktown #2 - In service 2012
• Est. max annual production
– Oaktown #1 up to 3 million tons
– Oaktown #2 up to 2 million tons
Ø Ramp up in production dependent on
contracts, negotiations continue
contracts, negotiations continue
Ø Long-term Illinois Basin coal demand
expected to continue increasing as economy
improves, inventory levels reduced, and
lower Appalachian production
expected to continue increasing as economy
improves, inventory levels reduced, and
lower Appalachian production
Appendix
Appendix
30
Nonutility Metrics - Coal Mining

31
Energy Marketing - ProLiance Energy
Ø Energy marketing affiliate with Vectren
(61%) and Citizens Energy Group (39%) -
equity accounting
(61%) and Citizens Energy Group (39%) -
equity accounting
• 2010 revenues of $1.5 billion
• 100 employees
• Operates throughout the Midwest and
Southeast U.S
Southeast U.S
Ø Provides bundled gas services, including
base load, peaking sales, risk management,
and other ancillary services
base load, peaking sales, risk management,
and other ancillary services
• Retail services to over 1,750 Commercial and
industrial customers
industrial customers
• Wholesale services to utilities, municipals,
power generators
power generators
Ø Storage & Transportation optimization is
the primary earnings driver (includes
arbitrage opportunities for price differences
across time and location in physical and
financial markets)
the primary earnings driver (includes
arbitrage opportunities for price differences
across time and location in physical and
financial markets)
• 46 Bcf of storage
• Balanced book approach - VaR capped at $2.5
million
million
Ø Margins associated with optimizing the
transportation and storage portfolio
reduced
transportation and storage portfolio
reduced
• General compression of natural gas prices
and reduction of firm transportation spread
values between the production areas and the
Midwest market area due to:
and reduction of firm transportation spread
values between the production areas and the
Midwest market area due to:
– Lower industrial demand
– New shale gas supplies
– New pipeline infrastructure in service
– Lower relative gas prices
Ø Near-term focus to improve margin
opportunities
opportunities
• Maintain flexibility to take advantage of price
volatility and widening seasonal spreads
volatility and widening seasonal spreads
• Focus on growing commercial and industrial
customer segment
customer segment
• Cost reductions
• Looking for opportunities to renegotiate
transportation and storage contracts
transportation and storage contracts
– $25 million (one-third) of contracts expire
over next 3 years and $40 million (half)
over next 5 years
over next 3 years and $40 million (half)
over next 5 years
Appendix
Appendix
32
Nonutility Metrics - Energy Marketing

33
Energy Marketing - Vectren Source
Ø Source provides natural gas and other
related products and services to retail
customers in the Midwest and Northeast
related products and services to retail
customers in the Midwest and Northeast
• 2010 revenues of $143 million
• Current staffing of over 50 FTE’s
• Operates in 7 LDC territories in 3 states -
Ohio, Indiana and New York, with highest
customer concentration in Ohio
Ohio, Indiana and New York, with highest
customer concentration in Ohio
Ø 12/31/10 customer count of 227,000, an
increase of 38,000 year over year
increase of 38,000 year over year
Ø Focus on customer retention with a
contract renewal rate above 90%
contract renewal rate above 90%
Ø Conservative risk management practices
• Good mix of fixed and variable price
customers
customers
Ø Ohio is transitioning to a fully deregulated
market, providing growth opportunities as
energy delivery companies exit the
merchant function of buying natural gas for
its customers
market, providing growth opportunities as
energy delivery companies exit the
merchant function of buying natural gas for
its customers
• Successfully bid on one tranche of Vectren
Ohio’s customers in the regulatory approved
auction to sell the gas commodity to specific
customers for a 12-month period
Ohio’s customers in the regulatory approved
auction to sell the gas commodity to specific
customers for a 12-month period
Ø Developing a residential energy efficiency
service with a pilot offering available in
Cleveland under GreenStreet Solutions SM
service with a pilot offering available in
Cleveland under GreenStreet Solutions SM
• General contractor role in home energy audits
and complete service to implement
recommendations
and complete service to implement
recommendations
• Positioned to take advantage of Home Star
program if approved by Congress
program if approved by Congress
• Will be expanding into Cincinnati/Dayton
market in 2011
market in 2011
Appendix

Appendix
34
Nonutility Metrics - Energy Marketing

Per share earnings contributions of the Utility Group, Nonutility Group, and Corporate and Other
are presented herein and are non-GAAP measures. Such per share amounts are based on the
earnings contribution of each group included in Vectren’s consolidated results divided by
Vectren’s basic average shares outstanding during the period. The earnings per share of the
groups do not represent a direct legal interest in the assets and liabilities allocated to the
groups, but rather represent a direct equity interest in Vectren Corporation's assets and
liabilities as a whole. These non-GAAP measures are used by management to evaluate the
performance of individual businesses. In addition, other items giving rise to period over period
variances, such as weather, are presented on an after tax and per share basis. These amounts
are calculated at a statutory tax rate divided by Vectren’s basic average shares outstanding
during the period. Accordingly, management believes these measures are useful to investors in
understanding each business’ contribution to consolidated earnings per share and in analyzing
consolidated period to period changes and the potential for earnings per share contributions in
future periods. Reconciliations of the non-GAAP measures to their most closely related GAAP
measure of consolidated earnings per share are included throughout the presentation
presented. The non-GAAP financial measures disclosed by the Company should not be
considered a substitute for, or superior to, financial measures calculated in accordance with
GAAP, and the financial results calculated in accordance with GAAP.
Appendix
Use of Non-GAAP Performance Measures and Per Share Measures