Attached files
Table of Contents
UNITED STATES SECURITIES AND EXCHANGE COMMISSION
Washington, D.C. 20549
Form 10-K
| x | ANNUAL REPORT PURSUANT TO SECTION 13 OR 15(d) OF THE SECURITIES EXCHANGE ACT OF 1934 For the Fiscal Year Ended December 31, 2010 |
OR
| ¨ | TRANSITION REPORT PURSUANT TO SECTION 13 OR 15(d) OF THE SECURITIES EXCHANGE ACT OF 1934 |
For the Transition period from to .
Commission file number: 0-31265
TELIK, INC.
(Exact name of Registrant as specified in its charter)
| Delaware | 93-0987903 | |
| (State or other jurisdiction of incorporation or organization) | (I.R.S. Employer Identification No.) |
700 Hansen Way, Palo Alto, CA 94304
(Address of principal executive offices) (Zip Code)
Registrant’s telephone number, including area code: (650) 845-7700
Securities registered pursuant to Section 12(b) of the Act:
| Title of Each Class |
Name of Each Exchange on Which Registered | |
| Common Stock, $0.01 par value per share | Nasdaq Capital Market |
Securities registered pursuant to Section 12(g) of the Act:
None
(Title of Class)
Indicate by check mark if the registrant is a well-known seasoned issuer, as defined in Rule 405 of the Securities Act. YES ¨ NO x
Indicate by check mark if the registrant is not required to file reports pursuant to Section 13 or Section 15(d) of the Act. YES ¨ NO x
Indicate by check mark whether the Registrant (1) has filed all reports required to be filed by Section 13 or 15(d) of the Securities Exchange Act of 1934 during the preceding 12 months (or for such shorter period that the Registrant was required to file such reports) and (2) has been subject to such filing requirements for the past 90 days. YES x NO ¨
Indicate by check mark whether the registrant has submitted electronically and posted on its corporate Web site, if any, every Interactive Data File required to be submitted and posted pursuant to Rule 405 of Regulation S-T (§ 232.405 of this chapter) during the preceding 12 months (or for such shorter period that the registrant was required to submit and post such files). YES ¨ NO ¨
Indicate by check mark if disclosure of delinquent filers pursuant to Item 405 of Regulation S-K (§229.405 of this Chapter) is not contained herein, and will not be contained to the best of Registrant’s knowledge, in definitive proxy or information statements incorporated by reference in Part III of this Form 10-K or any amendment to this Form 10-K. x
Indicate by check mark whether the registrant is a large accelerated filer, an accelerated filer, a non-accelerated filer, or a smaller reporting company. See the definitions of “large accelerated filer,” “accelerated filer” and “smaller reporting company” in Rule 12b-2 of the Exchange Act. (Check one):
Large accelerated filer ¨ Accelerated filer ¨ Non-accelerated filer ¨ Smaller reporting company x
Indicate by check mark whether the registrant is a shell company (as defined in Rule 12b-2 of the Act.). YES ¨ NO x
The aggregate market value of the voting stock held by non-affiliates of the Registrant was approximately $22,562,812 as of June 30, 2010, based upon the closing sale price on the Nasdaq Capital Market reported on June 30, 2010. The calculation excludes approximately 24,595,647 shares held by directors, officers and stockholders whose ownership exceeded five percent of the Registrant’s outstanding Common Stock as of June 30, 2010. Exclusion of these shares should not be construed to indicate that such person controls, is controlled by or is under common control with the Registrant. The determination of affiliate status for the purposes of this calculation is not necessarily a conclusive determination for other purposes.
There were 53,618,989 shares of Registrant’s Common Stock issued and outstanding as of February 22, 2011.
DOCUMENTS INCORPORATED BY REFERENCE
Items 10, 11, 12, 13 and 14 of Part III incorporate information by reference from the definitive proxy statement to be filed on or before April 30, 2011 with the Securities and Exchange Commission pursuant to Regulation 14A for the Registrant’s Annual Meeting of Stockholders. Except with respect to the information specifically incorporated by reference in this Form 10-K, the proxy statement is not deemed to be filed as part hereof.
Table of Contents
TELIK, INC.
2010 ANNUAL REPORT ON FORM 10-K
| Page | ||||||
| PART I | ||||||
| Item 1. |
4 | |||||
| Item 1A. |
13 | |||||
| Item 1B. |
24 | |||||
| Item 2. |
24 | |||||
| Item 3. |
24 | |||||
| PART II | ||||||
| Item 5. |
Market for Registrant’s Common Equity, Related Stockholder Matters and Issuer Purchases of Equity Securities | 25 | ||||
| Item 6. |
27 | |||||
| Item 7. |
Management’s Discussion and Analysis of Financial Condition and Results of Operations |
28 | ||||
| Item 7A. |
39 | |||||
| Item 8. |
40 | |||||
| Item 9. |
Changes in and Disagreements with Accountants on Accounting and Financial Disclosure |
40 | ||||
| Item 9A. |
40 | |||||
| Item 9B |
40 | |||||
| PART III | ||||||
| Item 10. |
41 | |||||
| Item 11. |
41 | |||||
| Item 12. |
Security Ownership of Certain Beneficial Owners and Management |
42 | ||||
| Item 13. |
Certain Relationships and Related Transactions, and Director Independence |
42 | ||||
| Item 14. |
42 | |||||
| PART IV | ||||||
| Item 15. |
43 | |||||
| SIGNATURES | 46 | |||||
| FINANCIAL STATEMENTS | ||||||
| 47 | ||||||
| 48 | ||||||
| 49 | ||||||
| 50 | ||||||
| 51 | ||||||
| 52 | ||||||
Table of Contents
Disclosure Regarding Forward-Looking Statements
This Annual Report on Form 10-K, including the documents that we incorporate by reference, contains statements indicating expectations about future performance and other forward-looking statements that involve risks and uncertainties. We usually use words such as “may,” “will,” “should,” “expect,” “plan,” “anticipate,” “believe,” “estimate,” “predict,” “future,” “intend,” “potential,” or “continue” or the negative of these terms or similar expressions to identify forward-looking statements. These statements appear throughout this Annual Report on Form 10-K and are statements regarding our current intent, belief, or expectation, primarily with respect to our operations and related industry developments. Examples of these statements include, but are not limited to, statements regarding the following: the implications of interim or final results of our Phase 2 clinical and Phase 3 registration trials, the progress and timing of our research programs, including clinical testing, our anticipated timing for filing additional Investigational New Drug, or IND, applications with the United States Food and Drug Administration for the initiation or completion of Phase 1, Phase 2 or Phase 3 testing for any of our product candidates, the extent to which our issued and pending patents may protect our products and technology, our ability to identify new product candidates using TRAP technology (our proprietary Target-Related Affinity Profiling technology, which is discussed below), the potential of such product candidates to lead to the development of safer or more effective therapies, our ability to develop the technology derived from our collaborations and to enter into additional collaborations, our future operating expenses, our future losses, our future expenditures for research and development, the sufficiency of our cash resources to fund current and future operations. You should not place undue reliance on these forward-looking statements, which apply only as of the date of this Annual Report. Our actual results could differ materially from those anticipated in these forward-looking statements for many reasons, including the risks faced by us and described in the section of Item 1A entitled “Risk Factors,” and elsewhere in this Annual Report. Any forward-looking statement speaks only as of the date on which it is made, and we undertake no obligation to update any forward-looking statement to reflect events or circumstances after the date on which the statement is made or to reflect the occurrence of unanticipated events.
TELIK, the Telik logo, TRAP, TELCYTA and TELINTRA are trademarks or registered trademarks of Telik, Inc. All other brand names or trademarks appearing in this Annual Report are the property of their respective holders.
3
Table of Contents
PART I
| Item 1. | Business. |
Overview
Our Business and Strategy
Telik, Inc. was incorporated in Delaware in 1988 and is a clinical-stage drug development company focused on discovering and developing small molecule drugs to treat cancer. We discover our product candidates using our proprietary drug discovery technology, Target-Related Affinity Profiling, or TRAP, which we believe enables the rapid and efficient discovery of small molecule product candidates. Our business strategy is to:
| • | Advance TELINTRA through Phase 2 clinical studies, and after obtaining clinical data, enter into a partnership with a pharmaceutical or biotechnology company to assist in further development and commercialization; |
| • | Seek a partnership for TELCYTA for further development and commercialization; |
| • | Utilize our proprietary TRAP drug discovery platform to provide a pipeline of future product development candidates to address unmet needs in cancer treatment; and |
| • | Establish collaborative agreements to advance the development of these candidates. |
Clinical Product Development
TELINTRA, our lead drug product candidate in clinical development, is a small molecule glutathione analog inhibitor of the enzyme glutathione S-transferase P1-1, or GST P1-1. We are developing TELINTRA for the treatment of blood disorders associated with low blood cell levels, such as neutropenia or anemia. In 2008, we initiated a Phase 2 clinical trial of TELINTRA tablets, for the treatment of patients with Myelodysplastic Syndrome, or MDS. The trial for MDS completed enrollment of 86 patients and we presented the results at the annual meeting of the American Society of Hematology, or ASH, in December 2010. In the second quarter of 2009, we initiated a Phase 2 randomized study in Severe Chronic Neutropenia, or SCN, to determine the effect of TELINTRA tablets on absolute neutrophil count in patients with this disease. The trial for SCN is intended to enroll a total of 20 patients. In the fourth quarter of 2009, we initiated a Phase 1 dose-ranging study of TELINTRA tablets in combination with Lenalidomide in patients with MDS. We expect to complete this 30-patient study by the end of 2011.
TELCYTA, our other product candidate, is a small molecule cancer drug product candidate designed to be activated in cancer cells. TELCYTA binds to GST P1-1, an enzyme that is elevated in many human cancers, such as ovarian, non-small cell lung, colorectal, and breast. GST P1-1 levels are often further elevated following treatment with many standard chemotherapy drugs and this elevation is associated with the development of resistance to these drugs. When TELCYTA binds to GST P1-1 inside a cancer cell, a chemical reaction occurs, releasing fragments of TELCYTA that cause programmed cancer cell death, or apoptosis.
TELCYTA has shown clinical antitumor activity alone and in combination with standard chemotherapeutic agents in multiple Phase 2 and Phase 3 clinical trials in refractory or resistant ovarian, non-small cell lung, breast and colorectal cancer. We completed a multicenter, randomized clinical study of 125 patients of TELCYTA in combination with liposomal doxorubicin versus liposomal doxorubicin as second line therapy in platinum refractory or resistant ovarian cancer and announced results at the annual meeting of the American Society of Clinical Oncology, or ASCO, in May 2009. In May 2010, we initiated an investigator led study at a single site of TELCYTA in patients with refractory or relapsed mantle cell lymphoma, diffuse large B cell lymphoma, and multiple myeloma. Enrollment for this study is expected to range between 18 to 48 patients based on the number of responses observed. We are currently seeking a partnership with a pharmaceutical or biotechnology company to further advance the development and commercialization of TELCYTA.
4
Table of Contents
Preclinical Drug Product Development
We currently have a small molecule compound, TLK60404, in preclinical development that inhibits both Aurora kinase and VEGFR kinase. Aurora kinase is a signaling enzyme whose function is required for cancer cell division, while vascular endothelial growth factor, or VEGF, plays a key role in tumor blood vessel formation, ensuring an adequate supply of nutrients to support tumor growth. The lead compounds of our first dual inhibitor program met a development milestone in August 2008 by demonstrating anticancer activity in preclinical models of human colon cancer and human leukemia. We are conducting the required preclinical safety studies that, if successful, may support the potential filing of an IND application with the FDA.
We have also discovered TLK60357, a novel, potent small molecule inhibitor of cell division. TLK60357 inhibits the formation of microtubules that are necessary for cancer cell growth leading to persistent cancer cell block and subsequent cell death at the G2/M phase of the cell cycle. This compound demonstrates potent broad-spectrum anticancer activity against a number of human cancer cells. This compound also displays oral efficacy in multiple, standard preclinical models of cancer. TLK60357 is currently being evaluated in preclinical safety studies.
In addition, we have identified TLK60596, a small-molecule dual inhibitor of VEGFR1 and VEGFR2 kinase. VEGFR1/2 kinases are known to mediate the formation of new blood vessels in human cancers allowing them to grow. In standard animal models of human colon cancer, oral administration of TLK60596 significantly reduced tumor growth. We are conducting further preclinical assessment of TLK60596.
Clinical Product Development Programs
Our two most advanced product candidates, TELINTRA and TELCYTA, are being developed to treat cancers for which there is significant demand for new therapies. Cancer is the second most common cause of death in the United States according to the American Cancer Society’s 2010 Cancer Facts and Figures. The five-year survival rates for patients with cancers that have spread from their original sites, although improved in recent years, are still poor. These poor survival rates reflect the limitations of current treatments and the development of resistance to available treatments. In addition, current treatments are often associated with severe toxic side effects.
TELINTRA
TELINTRA is our lead small molecule product candidate in clinical development for the treatment of blood disorders including cancer. It has a novel mechanism of action and acts by inhibiting GST P1-1, an enzyme that is involved in the control of cellular growth and differentiation. Inhibition of GST P1-1 results in the activation of the signaling molecule Jun kinase, a key regulator of the function of blood precursor cells. Preclinical tests show that TELINTRA is capable of causing the death or apoptosis of leukemic or malignant blood cells, while stimulating the growth and development of normal blood precursor cells. TELINTRA, therefore, may lead to a treatment for diseases that are characterized by the presence of abnormal blood cells and or the presence low levels of normal blood cells. The combination of abnormal cells and low normal blood cell levels is found in a number of hematologic diseases, including MDS.
In addition, decreased normal blood cell levels, especially of white cells, occur as a common side effect of cancer chemotherapy and render the already weakened cancer patient susceptible to life-threatening infections. Treatment is intended to accelerate the recovery of the white blood cells levels and decrease the risk for developing an infection. TELINTRA accelerated the recovery of white blood cells (neutrophils) in several preclinical models of chemotherapy induced neutropenia. Since currently approved treatments for this complication are given by injection, the oral formulation of TELINTRA, if effective, may prove to be a convenient alternative.
5
Table of Contents
TELINTRA has been studied in MDS using two formulations. A liposomal formulation was developed for intravenous administration of TELINTRA and was used in Phase 1 and Phase 2 studies in MDS patients. The results from the Phase 2 intravenous liposomal TELINTRA clinical trials demonstrated that TELINTRA treatment was associated with improvement in all three types of blood cell levels in patients with all types of MDS, including those in intermediate and high-risk groups. An oral dosage formulation (tablet) was subsequently developed and results from a Phase 1 study with TELINTRA tablets showed clinical activity and the formulation to be well tolerated. The tablet formulation of TELINTRA may offer advantages, including ease of manufacturing and oral administration and allow us to offer a product that is an alternative to the currently marketed parenterally administered drugs.
The activity and safety profile of tablet formulation allowed us to complete a Phase 2 trial of TELINTRA tablets in MDS. The results of this study were reported at the 52nd Annual Meeting American Society of Hematology in December 2010. The primary objective of the Phase 2 TELINTRA tablet study was to determine the efficacy of TELINTRA, defined by Hematologic Improvement, or HI, response rate according to the 2006 International Working Group criteria, as well as its safety. An additional goal of this study was to identify those patients whose MDS disease characteristics may allow us to prospectively target patients most likely to respond to TELINTRA treatment. A multivariate logistic regression analysis was conducted to identify significant MDS disease prognostic factors associated with erythroid improvement response rates, including prior MDS treatment, age, gender, the international prognostic scoring system, or IPSS, risk, Eastern Cooperative Group performance status, years from MDS diagnosis, MDS World Health Organization subtypes, anemia only versus anemia plus other cytopenias, dose schedule and starting dose. Results from this study show that:
| • | TELINTRA is the first GSTP1-1 enzyme inhibitor shown to cause clinically significant reductions in red blood cell transfusions, including transfusion independence in low to intermediate-1 risk MDS patients, as well as improvement in platelet count and white blood cell levels in certain patients. The multilineage responses and safety profile observed provides a unique clinical activity profile with attractive tolerability and safety. |
| • | TELINTRA, administered orally twice daily, appeared to be convenient and flexible for chronic treatment administration. |
| • | The HI rates were consistent with the Phase 1 results with TELINTRA and the duration of response was enhanced using the extended dose schedules. |
| • | Prior treatment with certain agents may influence the response to subsequent TELINTRA treatment. Revlimid is currently the only drug approved for treatment of low to intermediate-1 risk MDS red blood cell transfusion dependent patients with the 5q deletion cytogenetic karyotype. TELINTRA has shown clinically significant activity in Revlimid naïve or prior Revlimid resistant patients, and HI rate in erythroid responses in prior Revlimid treated patients with deletion 5q in relapse. |
| • | Prior history of Vidaza or Dacagen treatment appears to be an important predictor of decreased TELINTRA efficacy and tolerability. These findings may assist ongoing pharmacogenomic studies to characterize the genomic profile of responders and develop a test to identify those patients that are more likely to respond to TELINTRA treatment. |
We are also conducting a Phase 1 dose-ranging study of TELINTRA tablets in combination with Revlimid in patients with MDS to assess the potential for development of combination chemotherapy with TELINTRA and Revlimid for the treatment of MDS. We expect to complete the study by the end of 2011.
In addition to MDS, we are studying the use of TELINTRA tablets for the treatment of SCN, a blood disorder typified by very low neutrophil or white blood cell levels. White blood cells are important in defending the body against infections, and therefore, a patient with severely low white blood cell levels is more susceptible to life-threatening infections. We are currently conducting a Phase 1 trial investigating the use of TELINTRA tablets for the treatment of SCN.
6
Table of Contents
TELCYTA
TELCYTA is a small molecule drug product candidate that we are developing for the treatment of cancer. TELCYTA binds to GST, a protein known to play an important role in the development of resistance to commonly used chemotherapeutic drugs. GST P1-1 is a type of GST that is elevated in many cancers and is often further elevated following treatment with standard chemotherapeutic drugs. When TELCYTA binds to GST P1-1, it releases a fragment with a proven mechanism of killing cancer cells as well as other reactive agents. In contrast to the usual situation in which GST P1-1 is involved in the destruction of chemotherapeutic drugs, GST P1-1 activates TELCYTA when TELCYTA reaches its cellular target. In this way, TELCYTA kills cancer cells by inducing cell death through a process called apoptosis.
TELCYTA has been evaluated in multiple Phase 2 and Phase 3 clinical trials, including trials using TELCYTA as monotherapy and in combination regimens in ovarian, non-small cell lung, breast and colorectal cancer. Results from these clinical trials indicate that TELCYTA monotherapy was generally well-tolerated, with mostly mild to moderate side effects, particularly when compared to the side effects and toxicities of standard chemotherapeutic drugs. When TELCYTA was evaluated in combination with standard chemotherapeutic drugs, the tolerability of the combinations was similar to that expected of each drug alone. This tolerability profile may be an important clinical advantage for TELCYTA since combination drug regimens are commonly used in cancer treatment. Clinical activity including objective tumor responses and/or disease stabilization was reported in the TELCYTA Phase 2 trials; however, TELCYTA did not meet its primary endpoints in the Phase 3 studies. Positive results from a Phase 1-2a multicenter, dose-ranging study of TELCYTA in combination with carboplatin and paclitaxel as first-line therapy for patients with non-small cell lung cancer, or NSCLC, were published in a leading peer reviewed publication. Clinical data demonstrated positive results of TELCYTA in combination with carboplatin and paclitaxel in the treatment of first-line lung cancer followed by TELCYTA maintenance therapy.
Presently we have an on-going investigator-led study at a single site of TELCYTA in patients with refractory or relapsed mantle cell lymphoma, diffuse large B cell lymphoma, and multiple myeloma. Enrollment for this study is expected to range between 18 to 48 patients based on the number of responses observed. We are currently seeking a partnership with a pharmaceutical or biotechnology company to further advance the development and commercialization of TELCYTA.
Preclinical Drug Product Development
TLK60404—Aurora Kinase/VEGFR Inhibitors
We have a small molecule compound, TLK60404, in preclinical development that inhibits both Aurora kinase and VEGFR kinase. Aurora kinase is a signaling enzyme whose function is required for cancer cell division, while VEGF plays a key role in tumor blood vessel formation, ensuring an adequate supply of nutrients to support tumor growth. The lead compounds of our first dual inhibitor program met a development milestone in August 2008 by demonstrating anticancer activity in preclinical models of human colon cancer and human leukemia. These lead compounds prevented tumor growth in preclinical models of human colon cancer and human leukemia by inhibiting both Aurora kinase and VEGFR kinase. Our data support the concept that dual inhibition of Aurora kinase and VEGFR kinase represents a promising approach for anticancer therapy. A development drug product candidate, TLK60404, has been selected. We are conducting the required preclinical safety studies that if successful may support the potential filing of an IND application with the FDA.
TLK60357—Antimitotic Agent
Using our TRAP technology, we have discovered TLK60357, a novel, potent small molecule inhibitor of cell division. TLK60357 inhibits the formation of microtubules that are necessary for cancer cell growth leading to persistent G2/M cancer cell cycle block and subsequent cell death. This compound demonstrates potent broad-spectrum anticancer activity against a number of human cancer cells. This compound also displays oral efficacy in multiple, standard preclinical models of cancer. TLK60357 is currently being evaluated in preclinical safety studies.
7
Table of Contents
TLK60596—VEGFR Inhibitor
TLK60596, a potent VGFR kinase inhibitor, blocks the formation of new blood vessels in tumors. Oral administration of TLK60596 to animal models of human colon cancer significantly reduced tumor growth. TLK60596 is undergoing further preclinical assessment.
Research Discovery Programs
In addition to generating our current clinical product candidate portfolio, TRAP has allowed us to build our research pipeline with product candidates against targets in cancer. We have chosen to pursue those protein targets that have engendered a high level of interest in the drug discovery community, address important unmet clinical needs and whose modulation are expected to have a beneficial effect in treating a given disease. We are continually evaluating and prioritizing our early stage programs.
TRAP Technology
Our TRAP drug discovery technology is designed to rapidly and efficiently identify small molecule compounds that act on disease-related protein targets. TRAP technology offers solutions to the two major challenges facing drug discovery: the explosive growth in the number of new protein targets generated by the advances in genomics, and the intrinsic limitations of the Ultra High Throughput Screening, or UHTS, approach. TRAP offers several competitive advantages over UHTS, because it is able to accommodate thousands, rather than hundreds, of targets; is cost-effective to screen unproven targets for the purpose of validation; and allows the use of complex biologically relevant assays rather highly simplified assays.
The ability of TRAP to identify active compounds after screening only a few hundred samples overcomes many of the limitations of UHTS. TRAP does not require assays capable of screening millions of compounds, thereby decreasing the time and resources necessary for development of UHTS compatible assays. TRAP can be applied to tedious but biologically relevant assays. In addition, TRAP eliminates the need for large compound collections and sophisticated and expensive automation to support them, further lowering the financial barrier to screening and permitting its application to emerging biopharmaceutical companies. Finally, the overall efficiency and economy of TRAP allow multiple targets to be pursued simultaneously and permit the screening of higher risk, but potentially valuable, targets.
We have computationally enhanced TRAP by calculating affinity fingerprints, which greatly expands the number of compounds that can be surveyed. Our small-molecule database now has over 3.5 million computed affinity fingerprints. This approach has eliminated our need to maintain a large chemical inventory, resulting in a significant cost savings. Also, since fingerprints can be computed, TRAP can guide medicinal chemistry by evaluating potential compounds before they are made, thereby reducing the time and resources needed to develop a product candidate.
Collaborative Relationships
We are seeking to enter into collaborative arrangements with third parties for clinical trials, development, manufacturing, regulatory approvals or commercialization of some of our product candidates, particularly outside North America, or in disease areas requiring larger and longer clinical trials.
We have established a number of joint discovery programs with other pharmaceutical, biotechnology and genomics companies. These collaborations exploit our TRAP technology platform and have the potential to identify new product development and commercialization opportunities either independently or pursuant to expanded collaborations.
8
Table of Contents
These collaborations include the following:
Translational Genomics Research Institute
In January 2009, we extended our agreement, initially established in July 2007, with Translational Genomics Research Institute, or TGen, to include additional programs. TGen is focused on the development of therapies for cancer and other complex diseases. Telik and TGen are using TRAP technology for the identification of small molecule compounds against targets chosen by TGen.
Mount Sinai School of Medicine
In March 2008, we entered into a research and license agreement with the Mount Sinai School of Medicine, or Mount Sinai, to use our TRAP technology for the identification of small molecule compounds active against a target chosen by Mount Sinai. Mount Sinai has the right to select compounds arising from the collaboration for further development. The agreement provides for the payment of royalties to us based on product sales or licensing fees, and will expire at the end of the royalty period.
Hospital for Special Surgery
In September 2008, we entered into a TRAP screening agreement with the Hospital for Special Surgery, or HSS. The Research Division of HSS studies the mechanisms underlying musculoskeletal and autoimmune diseases to discover effective treatments for these disorders. We and HSS are using TRAP technology for the identification of small molecule compounds that inhibit a key enzyme in cell signaling and migration.
The above collaborative agreements do not have significant impact on our financial statements.
Patents and Proprietary Information
Patents and other proprietary rights are very important to our business. If we have enforceable patents of sufficient scope, it can be more difficult for our competitors to use our technology to create competitive products or to obtain patents that prevent us from using technology we create. As part of our business strategy, our policy is to actively file patent applications in the United States and internationally to cover new chemical compounds, pharmaceutical compositions, methods of preparation of the compounds and compositions and therapeutic uses of the compounds and compositions, methods related to our TRAP technology, and improvements in each of these. We also rely on trade secret information, technical know-how, innovation and agreements with third parties to continuously expand and protect our competitive position.
We have a number of patents and patent applications related to our compounds and other technology, but we cannot be certain that issued patents will be enforceable or provide adequate protection or that the pending patent applications will issue as patents. The following table shows the expiration dates in the United States and internationally for the primary patents that cover our TRAP technology and the compounds in our clinical and preclinical product candidates.
| US patent expirations |
Foreign patent expirations |
|||||||
| TRAP |
2014 | N/A | ||||||
| Product candidates |
||||||||
| TELCYTA |
2013 | 2014 | ||||||
| TELINTRA |
2014 | 2014 | ||||||
| TLK60404 |
2029 | * | 2029 | * | ||||
| TLK60357 |
2030 | * | 2030 | * | ||||
| TLK60596 |
2031 | * | 2031 | * | ||||
| * | Including pending and planned applications |
9
Table of Contents
We may obtain patents for our product candidates many years before we obtain marketing approval for them. We can generally expect to obtain patent term extensions of up to five years for patents covering our product candidates in many countries when and if marketing approvals are obtained. In foreign countries, these extensions are available only if approval is obtained before the patent expires, but in the United States, extensions are available even if approval is obtained after the patent would expire normally through a system of interim extensions until approval. In addition, we are actively pursuing multiple life cycle patent applications for TELINTRA and TELCYTA, including applications related to combination therapies, polymorphs, formulations and manufacturing processes.
In addition to patent coverage, we will generally be entitled to data exclusivities for our product candidates in many countries for several years after marketing approval (for example, 5 years in the United States and up to 10 years in the European Union) when and if marketing approvals are obtained.
We also rely on trade secret information, technical know-how, innovation and agreements with third parties to continuously expand and protect our proprietary position. We do not disclose our trade secrets (including significant aspects of our TRAP technology) outside Telik except where disclosure is essential to our business, and we require those individuals, companies and institutions doing business with us, including TRAP collaborators, to execute agreements to protect our trade secrets. We require our employees and consultants to execute non-disclosure and assignment of invention agreements on commencement of their employment or engagement.
Competition
Competition in the pharmaceutical and biotechnology industries is intense. The product candidates that we and our collaborative partners are developing will have to compete with existing therapies. In addition, a large number of companies are pursuing the development of pharmaceuticals that target the same diseases and conditions that we are targeting. Many pharmaceutical or biotechnology companies have products on the market and are actively engaged in the research and development of products that are competitive with our potential product candidates. Many of these companies and institutions, either alone or together with their collaborative partners, have substantially greater financial, manufacturing, sales, distribution and technical resources and more experience in research and development, clinical trials and regulatory matters, than we do. In addition, our competitors may succeed in developing technologies and drugs that are more effective, better tolerated or less costly than any which are being developed by us and our collaborative partners or which would render our technology or potential product candidates obsolete or noncompetitive.
Regulatory Considerations
The manufacturing and marketing of our product candidates and our on-going research and development activities are subject to extensive regulation by numerous governmental authorities in the United States and other countries. In the United States, pharmaceutical products are subject to rigorous review by the FDA under the Federal Food, Drug, and Cosmetic Act, the Public Health Service Act and other federal statutes and regulations. Non-compliance with applicable requirements can result in fines, recall or seizure of products, total or partial suspension of production, refusal of the government to approve marketing applications or allow us to enter into supply contracts and criminal prosecution. The FDA also has the authority to revoke previously granted marketing authorizations.
Securing FDA approval requires the submission of extensive preclinical and clinical data and supporting information to the FDA for each indication to establish a product candidate’s safety and efficacy. The approval process may take many years, requires the expenditure of substantial resources, may involve post-marketing surveillance and may involve on-going requirements for post-marketing studies. The FDA may also require post-marketing testing and surveillance to monitor the effects of approved products or place conditions on any approvals that could restrict the commercial applications of the products. Product approvals may be withdrawn if
10
Table of Contents
compliance with regulatory standards is not maintained or if problems occur following initial marketing. With respect to patented products or technologies, delays imposed by the governmental approval process may materially reduce the period during which we will have exclusive rights to exploit those products or technologies.
The cost of preparing and submitting a New Drug Application, or NDA, is substantial. Under federal law, the submission of most NDAs is additionally subject to a substantial application user fee and the manufacturer and/or sponsor under an approved new drug application are also subject to annual product and establishment user fees.
Preclinical studies involve laboratory evaluation and animal studies to assess the initial efficacy and safety of a product candidate. The FDA, under its Good Laboratory Practices regulations, regulates preclinical studies. Violations of these regulations can, in some cases, lead to invalidation of the studies, requiring these studies to be replicated. The results of the preclinical studies, together with manufacturing information and analytical data, are submitted to the FDA as part of an IND, which must be approved by the FDA before we can commence clinical trials in humans. Unless the FDA objects to an IND, the IND would become effective 30 days following its receipt by the FDA.
Clinical trials involve the administration of the investigational product candidate to humans under the supervision of a qualified principal investigator. Clinical trials in the United States must be conducted in accordance with Good Clinical Practice, or GCP, under protocols submitted to the FDA as part of the IND. In addition, each clinical trial must be approved and conducted under the auspices of an Investigational Review Board, or IRB, and with patient informed consent. The IRB will consider, among other things, ethical factors, the safety of human subjects and the possibility of liability of the institution conducting the trial.
The FDA may order the temporary or permanent discontinuation of a clinical trial at any time or impose other sanctions if it believes that the clinical trial is not being conducted in accordance with FDA requirements or presents an unacceptable risk to the clinical trial patients. An IRB may also require the clinical trial at the site to be halted, either temporarily or permanently, for failure to comply with the IRB’s requirements, or may impose other conditions.
Clinical trials in the United States are conducted in three sequential phases though the phases may overlap. Phase 1 clinical trials may be performed in healthy human subjects or, depending on the disease, in patients. The goal of Phase 1 clinical trials is to establish initial data about the safety and tolerance of the product candidate in humans. In Phase 2 clinical trials, in addition to safety, the efficacy of the product candidate is evaluated in a limited number of patients with the target disease. Phase 3 clinical trials typically involve additional testing for safety and clinical efficacy in expanded, large-scale, multicenter studies of patients with the target disease. We have engaged contract research organizations, or CROs, to facilitate the administration of some of our clinical trials.
We and all of our contract manufacturers are required to comply with the applicable FDA current Good Manufacturing Practice, or cGMP, regulations applicable to the manufacture of the clinical and commercial supplies of our product candidates. cGMP regulations include requirements relating to quality control and quality assurance as well as the corresponding maintenance of records and documentation. Manufacturing facilities are subject to inspection by the FDA. These facilities must be approved before we can use them in the commercial manufacture of our product candidates.
Outside the United States, our ability to market a product is contingent upon receiving marketing authorization from the appropriate regulatory authorities. The requirements governing the conduct of clinical trials, marketing authorization, pricing and reimbursement vary widely from country to country. At present, foreign marketing authorizations are generally applied for and obtained at a national level, although within the European Union registration procedures are available to companies wishing to market a product in more than one European Union member state. If the foreign regulatory authority is satisfied that adequate evidence of safety, quality and efficacy has been presented, a marketing authorization will be granted for the applicable country.
11
Table of Contents
Manufacturing
Isochem North America LLC (“Isochem”) has in the past manufactured and supplied a limited number of batches of the active ingredient to be used in the production of TELINTRA for use in clinical trials. As such, we have qualified Isochem as a potential source of supply for clinical quantities of this ingredient. In addition, Patheon Inc. (“Patheon”) has in the past performed formulation development and analytical services, and produced for us limited batches of clinical trial material, relating to the tablet formation of TELINTRA. As such, we have qualified Patheon as a potential manufacturer of TELINTRA tablets. However, we currently do not have in effect any manufacturing or supply agreements with either Isochem or Patheon. Although we have not qualified any other sources for the active ingredient in TELINTRA or the manufacture of TELINTRA tablets, we have evaluated, and may consider, potential alternative sources for this material in the future.
We are currently dependent on a single source, AMRI Rensselaer, Inc., or AMRI, previously known as Organichem Corporation, for the active ingredient in TELCYTA. We currently depend upon two sources for the manufacture of TELCYTA drug product.
We intend to continue to use third-party contract manufacturers or corporate collaborators for the production of material for use in preclinical studies, clinical trials, manufacture of future products and commercialization. The manufacture of our product candidates for preclinical studies and clinical trials and commercial purposes is subject to regulations promulgated by the FDA and to other applicable domestic and foreign regulations.
Research and Development
Our goal is to develop small molecule drugs for major disease areas and this goal has been supported by our substantial research and development investments. We spent approximately $11.0 million in 2010 and $12.7 million in 2009 on research and development. We conduct research internally and also through collaborations with third parties, including universities. In 2010, approximately 81% of our research and development was conducted internally and 19% was conducted through collaborations with third parties, including consultants.
Employees
As of February 15, 2011, our workforce consisted of 28 full-time and two part-time employees, nine of whom hold Ph.D. or M.D. degrees, or both, and one of whom hold other advanced degrees. Of our total workforce, 18 are engaged in research and development and 12 are engaged in business development, finance and administration. None of our employees are represented by a collective bargaining agreement, nor have we experienced any significant work stoppages. We believe that our relations with our employees are good.
Available Information
Our website address is www.telik.com; however, information found on, or that can be accessed through, our website is not incorporated by reference into this Annual Report on Form 10-K. We file or furnish electronically with the SEC our Annual Report on Form 10-K, quarterly reports on Form 10-Q, current reports on Form 8-K and amendments to those reports filed or furnished pursuant to Section 13(a) or 15(d) of the Securities Exchange Act of 1934. We make available free of charge on or through our website copies of these reports as soon as reasonably practicable after we electronically file such material with, or furnish it to, the SEC. The SEC maintains an internet site that contains reports, proxy and information statements and other information regarding our filings at www.sec.gov. You may also read and copy any of our materials filed with the SEC at the SEC’s Public Reference Room at 100 F Street, NE, Washington, DC 20549. Information regarding the operation of the Public Reference Room can be obtained by calling the SEC at 1-800-SEC-0330.
12
Table of Contents
| Item 1A. | Risk Factors. |
Our business faces significant risks, some of which are set forth below to enable readers to assess, and be appropriately apprised of, many of the risks and uncertainties applicable to the forward-looking statements made in this Annual Report. You should carefully consider these risk factors as each of these risks could adversely affect our business, operating results and financial condition. If any of the events or circumstances described in the following risks actually occurs, our business may suffer, the trading price of our common stock could decline and our financial condition or results of operations could be harmed. Given these risks and uncertainties, you are cautioned not to place undue reliance on forward-looking statements. These risks should be read in conjunction with the other information set forth in this Annual Report. There may be additional risks faced by our business, though we do believe that the risks set forth below reflect the more important ones.
If we are unable to raise adequate funds in the future, we will not be able to continue to fund our operations, research programs, preclinical testing and clinical trials to develop and manufacture our drug product candidates.
The process of carrying out the development of our own unpartnered product candidates to later stages of development and developing other research programs to the stage that they may be partnered to a pharmaceutical or biotechnology company will require significant additional expenditures, including the expenses associated with preclinical testing, clinical trials and obtaining regulatory approval. We believe that our existing cash and investment securities will be sufficient to support our current operating plan until the third quarter of 2012. However, unanticipated changes in our research and development plans or other changes affecting our operating expenses may affect actual consumption of existing cash resources. In any event, we will require substantial additional financing to fund our operations in the future. We do not know whether additional financing will be available when needed or that, if available, we will be able to obtain financing on terms favorable to our stockholders. In addition, the tight credit markets and concerns regarding the availability of credit, particularly in the United States, may also negatively impact our ability to raise additional capital to fund our business. As of December 31, 2010, our accumulated deficit was $528.3 million, and we expect to incur capital outlays and operating expenditures for the next several years as we continue our clinical, research and development activities. The extent of any actual increase in operating or capital spending will depend in part on the clinical success of our product candidates. If we fail to raise adequate funds on terms acceptable to us, if at all, we will not be able to continue to fund our operations, research programs, preclinical testing, clinical trials and manufacturing efforts.
We have a history of net losses, which we expect to continue for the next several years. We will never be profitable unless we develop, and obtain regulatory approval and market acceptance of, our product candidates.
To date, we have not obtained regulatory approval for the commercial sale of any products, and we have not received any revenue from the commercial sale of products. Due to the significant research and development expenditures required to develop our TRAP technology and identify new product candidates, and the lack of any products to generate revenue, we have not been profitable and have incurred operating losses since we were incorporated in 1988. As of December 31, 2010, we had an accumulated deficit of $528.3 million. We expect to incur losses for the next several years as we continue our research and development activities and incur significant clinical testing and drug supply manufacturing costs. We do not anticipate that we will generate product revenue for at least several years. Our losses, among other things, have caused and will cause our stockholders’ equity and working capital to decrease. We expect that this trend will continue until we develop, and obtain regulatory approval and market acceptance of, our product candidates, if at all. We may never generate product revenue sufficient to become profitable.
13
Table of Contents
Both of our most advanced drug product candidates, TELINTRA and TELCYTA, are in clinical development. If clinical trials of our product candidates are delayed or unsuccessful, or if we are unable to complete the preclinical development of our other preclinical product candidates, our business may suffer.
Preclinical testing and clinical trials are long, expensive and uncertain processes. It may take us or our collaborators several years to complete this testing, and failure can occur at any stage of the process. Success in preclinical testing and early clinical trials does not ensure that later clinical trials will be successful, and interim results of clinical trials do not necessarily predict final results. A number of companies in the pharmaceutical industry, including biotechnology companies, have suffered significant setbacks in advanced clinical trials, even after promising results in earlier clinical trials. To obtain regulatory approvals, we must, among other requirements, complete carefully controlled and well-designed clinical trials demonstrating that a particular drug is safe and effective for the applicable disease.
In 2007, we completed a Phase 1-2a clinical trial of a tablet formulation of TELINTRA in MDS, a form of pre-leukemia, to evaluate safety, pharmacokinetics, pharmacodynamics and efficacy. In May 2008, we initiated a Phase 2 clinical trial of TELINTRA tablets for the treatment of patients with MDS and announced final data at the ASH meeting in December 2010. In April 2009, we initiated a randomized Phase 2 clinical trial in SCN and in November 2009, we initiated a Phase 1 Dose-Ranging Study of TELINTRA tablets in combination with lenalidomide in patients with MDS. Our success depends in part on our ability to continue clinical development of TELINTRA.
TELCYTA has been evaluated in multiple Phase 1, 2 and 3 clinical trials. Our Phase 3 trials did not achieve their primary endpoints and consequently the FDA required that we conduct additional studies of TELCYTA to complete clinical development. In May 2010, we initiated an investigator led study at a single site of TELCYTA in patients with refractory or relapsed mantle cell lymphoma, diffuse large B cell lymphoma, and multiple myeloma.
Our success depends in large part on our ability to continue clinical development of TELINTRA and TELCYTA. If we do not have sufficient capital required to conduct additional studies or if the data on future clinical trials are not positive, we may not be able to continue clinical development on TELINTRA or TELCYTA and our business will suffer.
We rely on third-party clinical investigators to conduct our clinical trials and, as a result, we may face additional delays outside our control. We have in the past engaged contract research organizations, or CROs, to facilitate the administration of our Phase 3 clinical trials of TELCYTA. Dependence on a CRO subjects us to a number of risks. We may not be able to control the amount and timing of resources the CRO may devote to our clinical trials. Should the CRO fail to administer our Phase 3 clinical trials properly and on a timely basis, regulatory approval, development and commercialization of our product candidates will be delayed.
We do not know whether we will begin planned clinical trials on time or whether we will complete any of our on-going clinical trials on schedule, if at all. Clinical trials can be delayed for a variety of other reasons, including delays in clinical testing, obtaining regulatory approval to commence a study, delays in reaching agreement on acceptable clinical study agreement terms with prospective clinical sites, delays in obtaining institutional review board approval to conduct a study at a prospective clinical site and delays in recruiting subjects to participate in a study. Even if we are able to complete such clinical trials, we do not know whether any such trials will result in marketable products. Typically, there is a high rate of failure for product candidates in preclinical and clinical trials. We do not anticipate that any of our product candidates will reach the market for at least the next several years.
Delays in clinical testing can also materially impact our product candidates’ development costs. If we experience delays in clinical testing or approvals, our product candidates’ development costs will increase. For example, we may need to make additional payments to third-party investigators and organizations to retain their services or we may need to pay additional recruitment incentives. If the delays are significant, our financial results and the commercial prospects for our product candidates will be harmed, and our ability to become profitable will be significantly impaired or delayed.
14
Table of Contents
If we do not find collaborators for our product candidates, we may have to reduce or delay our rate of product development and/or increase our expenditures.
Our strategy to develop, manufacture and commercialize our products includes entering into relationships with pharmaceutical companies to advance certain programs and reduce our expenditures with respect to such programs. Our product candidates will target highly competitive therapeutic markets in which we have limited experience and expertise. If we are unable to develop this expertise ourselves, we will need to enter into agreements with one or more biotechnology or pharmaceutical companies to provide us with the necessary resources and experience for the development and commercialization of products in these markets. In particular, we are seeking a partnership with a pharmaceutical or biotechnology company to further advance the development and commercialization of TELINTRA and TELCYTA. There are a limited number of companies with the resources necessary to develop our future products commercially, and we may be unable to attract any of these firms. The current credit and financial market conditions could also impact our ability to find a collaborator for our development programs. A company that has entered into a collaboration agreement with one of our competitors may choose not to enter into a collaboration agreement with us. We may not be able to negotiate a collaboration agreement on acceptable terms or at all. If we are not able to establish collaborative arrangements, we may have to reduce or delay further development of some of our programs and/or increase our expenditures and undertake the development activities at our own expense. If we elect to increase our expenditures to fund our development programs, we will need to obtain additional capital, which may not be available on acceptable terms or at all.
In addition, there have been a significant number of recent business combinations among biotechnology and pharmaceutical companies that have reduced the number of potential future collaborators that would be willing to enter into a collaboration agreement with us. If business combinations involving potential collaborators continue to occur, our ability to find a collaborative partner could be diminished, which could result in the termination or delay in one or more of our product candidate development programs.
We will depend on collaborative arrangements to complete the development and commercialization of some of our product candidates. These collaborative arrangements may place the development of our product candidates outside of our control, may require us to relinquish important rights or may otherwise not be on terms favorable to us.
We expect to enter into collaborative arrangements with third parties for clinical trials, development, manufacturing, regulatory approvals or commercialization of some of our product candidates. Dependence on collaborative arrangements will subject us to a number of risks. We may not be able to control the amount and timing of resources our collaborative partners may devote to the product candidates. Our collaborative partners may experience financial difficulties. Should a collaborative partner fail to develop or commercialize a compound or product candidate to which it has rights from us, we may not receive any future milestone payments and will not receive any royalties for that compound or product candidate. Business combinations or significant changes in a collaborative partner’s business strategy may also adversely affect a partner’s willingness or ability to complete its obligations under an arrangement. If we fail to enter into additional collaborative agreements on favorable terms, our business, financial condition and results of operations could be materially adversely affected.
Some of our collaborations are for early stage programs and allow partners significant discretion in electing whether to pursue any of the planned activities. We do not anticipate significant revenues to result from these relationships until the collaborator has advanced product candidates into clinical trials, which will not occur for several years, if at all. These arrangements are subject to numerous risks, including the right of the collaboration partner to control the timing of the research and development efforts, the advancement of lead product candidates to clinical trials and the commercialization of product candidates. In addition, a collaborative partner could independently move forward with a competing lead candidate developed either independently or in collaboration with others, including our competitors.
15
Table of Contents
Our ability to publicly or privately sell equity securities and the liquidity of our common stock could be adversely affected if we are delisted from Nasdaq or if we are unable to transfer our listing to another stock market.
On September 19, 2008, we received a letter from the Nasdaq Listing Qualifications Department indicating that, for 30 consecutive business days, the bid price for our common stock had closed below the minimum $1.00 per share requirement for continued inclusion on the Nasdaq Global Market under Nasdaq Marketplace Rule 5550(a)(2). The letter also stated that in accordance with Nasdaq Marketplace Rule 5810(c)(3)(A), we were given 180 calendar days to regain compliance with this listing requirement, which may be accomplished if the bid price of our common stock closes at $1.00 per share or more for a minimum of 10 consecutive business days. Subsequently, Nasdaq implemented temporary suspensions of the minimum bid price requirement, allowing us until January 4, 2010 to regain compliance. Effective January 7, 2010, we transferred the listing of our common stock from the Nasdaq Global Market to the Nasdaq Capital Market. In accordance with Listing Rule 5810(c)(3)(A), we were provided an additional 180-day period, or until July 6, 2010, to regain compliance with the minimum bid price requirement. On April 22, 2010, we received notice from Nasdaq that we had regained compliance with the minimum bid price requirement. Since May 20, 2010, the bid price for our common stock had again fluctuated below the levels required by Nasdaq rules for continued listing. On July 21, 2010, we received notice from Nasdaq that the bid price for our common stock had closed below the minimum $1.00 per share requirement for continued inclusion on the Nasdaq Capital Market and that we had 180 calendar days, or until January 18, 2011, to regain compliance. The notice stated that if, following this 180-day period, Telik met certain listing standards for the Nasdaq Capital Market, with the exception of bid price, Telik might be eligible to receive an additional 180 day grace period. On January 19, 2011, we received a notice from Nasdaq indicating that, while we had not regained compliance with the $1.00 per share requirement, Nasdaq determined that Telik was eligible to receive an additional 180-day period, or until July 18, 2011, to regain compliance. The notice stated that Nasdaq’s determination was based on our currently meeting the continued listing requirements for market value of publicly held shares and all applicable initial listing criteria for the Nasdaq Capital Market, with the exception of bid price, and our stated intention to cure the deficiency during the additional compliance period by effecting a reverse stock split, if necessary. On February 10, 2011, we received a notice from Nasdaq indicating that for the preceding, ten consecutive business days, the closing bid price of our common stock was $1.00 per share or greater and we have regained compliance with the $1.00 per share minimum bid price requirement. We cannot assure you that we will be able to maintain the minimum bid price, or other Nasdaq listing requirements.
Delisting from Nasdaq could adversely affect our ability to raise additional financing through the public or private sale of equity securities, would significantly affect the ability of investors to trade our securities and would negatively affect the value and liquidity of our common stock. Delisting could also have other negative results, including the potential loss of confidence by employees, the loss of institutional investor interest and fewer business development opportunities.
Raising additional capital by issuing securities or through collaboration and licensing arrangements may cause dilution to existing stockholders or require us to relinquish rights to our technologies or product candidates.
We may seek to raise additional funds through equity or debt financings, collaborative arrangements with corporate partners or other sources. To the extent that we raise additional capital by issuing equity securities, our stockholders may experience dilution. To the extent that we raise additional capital through licensing arrangements or arrangements with collaborative partners, we may be required to relinquish, on terms that are not favorable to us, rights to some of our technologies or product candidates that we would otherwise seek to develop or commercialize ourselves.
It may be difficult for us to retain our current employees and identify, hire and retain future employees.
Our future success depends in part upon our ability to attract and retain highly skilled personnel. Several factors could make it difficult for us to achieve this. Competition among numerous companies, academic and
16
Table of Contents
other research institutions for skilled personnel and experienced scientists may be intense and turnover rates high. The cost of living in the San Francisco Bay Area is high compared to other parts of the country, which could adversely affect our ability to compete for qualified personnel and increase our costs. Because of this competitive environment, we have encountered and may continue to encounter increasing difficulty attracting qualified personnel, particularly if our operations expand and the demand for these professionals increases.
In addition, we may have difficulty attracting and retaining personnel as a result of having carried out four workforce reductions since 2007, the most recent of which was completed in November 2010. We cannot assure you that future reductions or adjustments of our workforce will not be made or that issues, such as voluntary departures by some employees, associated with such reductions will not recur. These circumstances could significantly impede the achievement of our business objectives.
If our competitors develop and market products that are more effective than our product candidates or any products that we may develop, or obtain marketing approval before we do, our commercial opportunity will be reduced or eliminated.
The biotechnology and pharmaceutical industries are intensely competitive and subject to rapid and significant technological change. Some of the drugs that we are attempting to develop will have to compete with existing therapies. In addition, a large number of companies are pursuing the development of pharmaceuticals that target the same diseases and conditions that we are targeting. We face competition from pharmaceutical and biotechnology companies in the United States and abroad. Our competitors may develop new screening technologies and may utilize discovery techniques or partner with collaborators in order to develop products more rapidly or successfully than we or our collaborators are able to do.
Many of our competitors, particularly large pharmaceutical companies, have substantially greater financial, technical and human resources than we do. These organizations also compete with us to attract qualified personnel and parties for acquisitions, joint ventures, licensing arrangements or other collaborations. In addition, academic institutions, government agencies and other public and private organizations conducting research may seek patent protection with respect to potentially competing products or technologies and may establish exclusive collaborative or licensing relationships with our competitors.
Our competitors may succeed in developing technologies and drugs that are more effective, better tolerated or less costly than any which are being developed by us or which would render our technology and potential drugs obsolete and noncompetitive. In addition, our competitors may succeed in obtaining FDA or other regulatory approvals for product candidates more rapidly than us or our collaborators. Any drugs resulting from our research and development efforts, or from our joint efforts with our existing or future collaborative partners, may not be able to compete successfully with our competitors’ existing products or product candidates under development or may not obtain regulatory approval in the United States or elsewhere.
If we do not obtain regulatory approval to market products in the United States and foreign countries, we or our collaborators will not be permitted to commercialize our product candidates.
Even if we are able to achieve success in our preclinical testing, we, or our collaborators, must provide the FDA and foreign regulatory authorities with clinical data that demonstrate the safety and efficacy of our product candidates in humans before they can be approved for commercial sale. Failure to obtain regulatory approval will prevent commercialization of our product candidates.
The pharmaceutical industry is subject to stringent regulation by a wide range of regulatory authorities. We cannot predict whether regulatory clearance will be obtained for any product candidate that we are developing or hope to develop. A pharmaceutical product cannot be marketed in the United States until it has completed rigorous preclinical testing and clinical trials and an extensive regulatory clearance process implemented by the FDA. Satisfaction of regulatory requirements typically takes many years and depends on the type, complexity
17
Table of Contents
and novelty of the product candidate and requires the expenditure of substantial resources. Of particular significance are the requirements covering research and development, testing, manufacturing, quality control, labeling and promotion of drugs for human use.
Before commencing clinical trials in humans, we, or our collaborators, must submit and receive approval from the FDA of an IND application. We must comply with FDA “Good Laboratory Practices” regulations in our preclinical studies. Clinical trials are subject to oversight by Institutional Review Boards, or IRBs, of participating clinical sites and the FDA and:
| • | must be conducted in conformance with the FDA regulations; |
| • | must meet requirements for IRB approval; |
| • | must meet requirements for informed consent; |
| • | must meet requirements for Good Clinical Practices; |
| • | may require large numbers of participants; and |
| • | may be suspended by us, our collaborators or the FDA at any time if it is believed that the subjects participating in these trials are being exposed to unacceptable health risks or if the FDA finds deficiencies in the IND application or the conduct of these trials. An IRB may also require the clinical trial at the site to be halted, either temporarily or permanently, for failure to comply with the IRB’s requirements, or may impose other conditions. |
Before receiving FDA clearance to market a product candidate, we, or our collaborators must demonstrate that the product candidate is safe and effective in the patient population that will be treated. Negative or inconclusive results or adverse medical events during a clinical trial could cause a clinical trial to be repeated, a program to be terminated and could delay approval. We typically rely on third-party clinical investigators to conduct our clinical trials and other third-party organizations to perform data collection and analysis. As a result, we may face additional delaying factors outside our control. In addition, we may encounter delays or rejections based upon additional government regulation from future legislation or administrative action or changes in FDA policy or interpretation during the period of product development, clinical trials and FDA regulatory review. Failure to comply with applicable FDA or other applicable regulatory requirements may result in criminal prosecution, civil penalties, recall or seizure of products, total or partial suspension of production or injunction, as well as other regulatory action. We have limited experience in conducting and managing the clinical trials necessary to obtain regulatory approval.
If regulatory clearance of a product candidate is granted, this clearance will be limited to those disease states and conditions for which the product candidate is demonstrated through clinical trials to be safe and efficacious, which could limit our market opportunity. Furthermore, product approvals, once granted, may be withdrawn if problems occur after initial marketing. We cannot ensure that any product candidate developed by us, alone or with others, will prove to be safe and efficacious in clinical trials and will meet all of the applicable regulatory requirements needed to receive marketing clearance. Regulatory clearance may also contain requirements for costly post-marketing testing and surveillance to monitor the safety and efficacy of the product candidate. If problems occur after initial marketing, such as the discovery of previously unknown problems with our product candidates, including unanticipated adverse events or adverse events of unanticipated severity or frequency, or manufacturer or manufacturing issues, marketing approval can be withdrawn.
Outside the United States, the ability to market a product depends on receiving a marketing authorization from the appropriate regulatory authorities. Most foreign regulatory approval processes include all of the risks associated with FDA clearance described above and some may include additional risks.
18
Table of Contents
As our product programs advance, we may need to hire additional scientific and management personnel. Our research and development efforts will be seriously jeopardized if we are unable to attract and retain key personnel.
Our success depends in part on the continued contributions of our principal management and scientific personnel and on our ability to develop and maintain important relationships with leading academic institutions, scientists and companies in the face of intense competition for such personnel. As we plan for additional advanced clinical trials, including Phase 2 and Phase 3, we may also need to expand our clinical development personnel. If we lose the services of Dr. Wick or any of our other key personnel, our research and development efforts could be seriously and adversely affected. We have generally entered into consulting or other agreements with our scientific and clinical collaborators and advisors. We do not carry key person insurance that covers Dr. Wick or any of our other key employees.
If we or our licensees cannot obtain and defend our respective intellectual property rights, or if our product candidates, technologies or any products that we may develop are found to infringe patents of third parties, we could become involved in lengthy and costly legal proceedings that could adversely affect our business.
Our success will depend in a large part on our own and our licensees’ ability to obtain and defend patents for each party’s respective technologies and the compounds and other products, if any, resulting from the application of these technologies. The patent positions of pharmaceutical and biotechnology companies can be highly uncertain and involve complex legal and factual questions. As a result, the degree of future protection for our proprietary rights is uncertain, and we cannot assure you that:
| • | we were the first to make the inventions covered by each of our pending patent applications; |
| • | we were the first to file patent applications for these inventions; |
| • | others will not independently develop similar or alternative technologies or duplicate any of our technologies; |
| • | any of our pending patent applications will result in issued patents; |
| • | any patents issued to us or our collaborators will provide a basis for commercially viable products, will provide us with any competitive advantages or will not be challenged by third parties; |
| • | any of our issued patents will be valid or enforceable; or |
| • | we will develop additional proprietary technologies that are patentable. |
Accordingly, we cannot predict the breadth of claims allowed in our or other companies’ patents.
For TELINTRA, we hold compound patents in the United States and internationally that will expire in 2014. For TELCYTA, we hold compound patents in the United States and internationally that will expire in 2013 and 2014. We can generally apply for patent term extensions on the patents for TELINTRA and TELCYTA when and if marketing approvals for these compounds are obtained in the relevant countries. In foreign countries, these extensions are available only if approval is obtained before the patent expires, but in the United States, extensions are available even if approval is obtained after the patent would expire normally through a system of interim extensions until approval.
Our success will also depend, in part, on our ability to operate without infringing the intellectual property rights of others. We cannot assure you that our activities will not infringe patents owned by others. To date, we have not received any communications with the owners of related patents alleging that our activities infringe their patents. However, if our product candidates, technologies or any products that we may develop are found to infringe patents issued to third parties, the manufacture, use and sale of any products that we may develop could be enjoined, and we could be required to pay substantial damages. In addition, we may be required to obtain
19
Table of Contents
licenses to patents or other proprietary rights of third parties. We cannot assure you that any licenses required under any such patents or proprietary rights would be made available on terms acceptable to us, if at all. Failure to obtain such licenses could negatively affect our business.
Others may have filed and in the future may file patent applications covering small molecules or therapeutic products that are similar to ours. We cannot assure you that our patent applications will have priority over patent applications filed by others. Any legal action against us or our collaborators claiming damages and seeking to enjoin commercial activities relating to the affected products and processes could, in addition to subjecting us to potential liability for damages, require us or our collaborators to obtain a license to continue to manufacture or market the affected products and processes. We cannot predict whether we, or our collaborators, would prevail in any of these actions or that any license required under any of these patents would be made available on commercially acceptable terms, if at all. We believe that there may be significant litigation in the industry regarding patent and other intellectual property rights. If we become involved in litigation, it could consume a substantial portion of our managerial and financial resources, and we may not be successful in any such litigation.
In addition, we could incur substantial costs and use of our key employees’ time and efforts in litigation if we are required to defend against patent suits brought by third parties or if we initiate these suits, and we cannot predict whether we would be able to prevail in any of these suits.
Furthermore, some of our patents and intellectual property rights are owned jointly by us and our collaborators. While there are legal and contractual restraints on the rights of these joint owners, they may use these patents and other intellectual property in ways that may harm our business. We may not be able to prevent this type of use.
We also rely on trade secrets to protect technology, including aspects of our TRAP technology, where we believe patent protection is not appropriate or obtainable. However, trade secrets are difficult to protect. While we require employees, academic collaborators and consultants to enter into confidentiality agreements, we may not be able to adequately protect our trade secrets or other proprietary information in the event of any unauthorized use or disclosure or the lawful development by others of such information. If the identity of specific proteins or other elements of our TRAP technology become known, our competitive advantage in drug discovery could be reduced.
Many of our collaborators and scientific advisors have publication and other rights to certain information and data gained from their collaborations and research with us. Any publication or other use could limit our ability to secure intellectual property rights or impair any competitive advantage that we may possess or realize by maintaining the confidentiality of that information or data.
If we are unable to enter into or maintain existing contracts with third parties to manufacture our product candidates or any products that we may develop in sufficient quantities and at an acceptable cost, clinical development of product candidates could be delayed and we may be unable to meet demand for any products that we may develop and lose potential revenue.
We do not currently operate manufacturing facilities for clinical or commercial production of our product candidates. We expect to continue to rely on third parties for the manufacture of our product candidates and any products that we may develop. We currently lack the resources and capability to manufacture any of our product candidates on a clinical scale or any products that we may develop on a commercial scale. As a result, we will be dependent on corporate partners, licensees or other third parties for the manufacturing of clinical and commercial scale quantities of our product candidates and any products that we may develop. Our product candidates and any products that we may develop may be in competition with other product candidates and products for access to these manufacturing facilities. For this and other reasons, our collaborators or third parties may not be able to manufacture our product candidates and products in a cost effective or timely manner. While we currently
20
Table of Contents
possess sufficient inventory of TELINTRA and TELCYTA that are stored in multiple locations and an additional, substantial quantity of the active ingredient in TELCYTA, if these inventories are lost or damaged, the clinical development of our product candidates or their submission for regulatory approval could be delayed, and our ability to deliver any products that we may develop on a timely basis could be impaired or precluded.
Isochem has in the past manufactured and supplied a limited number of batches of the active ingredient to be used in the production of TELINTRA for use in clinical trials. As such, we have qualified Isochem as a potential source of supply for clinical quantities of this ingredient. In addition, Patheon has in the past performed formulation development and analytical services, and produced for us limited batches of clinical trial material, relating to the tablet formation of TELINTRA. As such, we have qualified Patheon as a potential manufacturer of TELINTRA tablets. However, we currently do not have in effect any manufacturing or supply agreements with either Isochem or Patheon. Although we have not qualified any other sources for the active ingredient in TELINTRA or the manufacture of TELINTRA tablets, we have evaluated, and may consider, potential alternative sources for this material in the future.
We are currently dependent on a single source of supply of the active ingredient in TELCYTA, AMRI. We currently depend upon two sources for the drug product manufacture of TELCYTA.
If manufacturing is not performed in a timely manner, if our suppliers fail to perform or if our relationships with our suppliers or manufacturers should terminate, our clinical trials and commercialization of TELINTRA and TELCYTA could be delayed. We may not be able to enter into or maintain any necessary third-party manufacturing arrangements on acceptable terms, if at all. Our current dependence upon others for the manufacture of our product candidates and our anticipated dependence upon others for the manufacture of any products that we may develop may adversely affect our future profit margins and our ability to commercialize any products that we may develop on a timely and competitive basis.
Working capital constraints may force us to delay our efforts to develop certain product candidates in favor of developing others, which may prevent us from commercializing all product candidates as quickly as possible.
Because we have limited resources, and because research and development is an expensive process, we must regularly assess the most efficient allocation of our research and development budget. As a result, we may have to prioritize development candidates and may not be able to fully realize the value of some of our product candidates in a timely manner, as they will be delayed in reaching the market, if at all.
If product liability lawsuits are successfully brought against us, we may incur substantial liabilities and may be required to limit commercialization of our product candidates and any products that we may develop.
The testing and marketing of medical products entail an inherent risk of product liability. Although we are not aware of any historical or anticipated product liability claims or specific causes for concern, if we cannot successfully defend ourselves against product liability claims, we may incur substantial liabilities or be required to limit commercialization of our product candidates and any products that we may develop. In addition, product liability claims may also result in withdrawal of clinical trial volunteers, injury to our reputation and decreased demand for any products that we may commercialize. We currently carry product liability insurance that covers our clinical trials up to a $10 million annual aggregate limit. We will need to increase the amount of coverage if and when we have a product that is commercially available. If we are unable to obtain sufficient product liability insurance at an acceptable cost, potential product liability claims could prevent or inhibit the commercialization of any products that we may develop, alone or with corporate partners.
21
Table of Contents
We have implemented anti-takeover provisions which could discourage or prevent a takeover, even if an acquisition would be beneficial to our stockholders, and may prevent attempts by our stockholders to replace or remove our current management.
Provisions of our amended and restated certificate of incorporation and bylaws, as well as provisions of Delaware law, could make it more difficult for a third-party to acquire us, even if doing so would be beneficial to our stockholders. In addition, these provisions may frustrate or prevent any attempts by our stockholders to replace or remove our current management by making it more difficult for stockholders to replace members of our board of directors. Because our board of directors is responsible for appointing the members of our management team, these provisions could in turn affect any attempt by our stockholders to replace current members of our management team. These provisions include:
| • | establishing a classified board of directors requiring that members of the board be elected in different years, which lengthens the time needed to elect a new majority of the board; |
| • | authorizing the issuance of “blank check” preferred stock that could be issued by our board of directors to increase the number of outstanding shares or change the balance of voting control and thwart a takeover attempt; |
| • | prohibiting cumulative voting in the election of directors, which would otherwise allow for less than a majority of stockholders to elect director candidates; |
| • | limiting the ability of stockholders to call special meetings of the stockholders; |
| • | prohibiting stockholder action by written consent and requiring all stockholder actions to be taken at a meeting of our stockholders; and |
| • | establishing 90 to 120 day advance notice requirements for nominations for election to the board of directors and for proposing matters that can be acted upon by stockholders at stockholder meetings. |
We adopted a stockholder rights plan that may discourage, delay or prevent a merger or acquisition that is beneficial to our stockholders.
In November 2001, our board of directors adopted a stockholder rights plan that may have the effect of discouraging, delaying or preventing a merger or acquisition that is beneficial to our stockholders by diluting the ability of a potential acquiror to acquire us. Under the plan, except under certain circumstances, if a person or group acquires 20% or more of our outstanding common stock, or 10 business days after a person or group commences or announces a tender or exchange offer for 20% or more of our outstanding common stock, that person or group becomes an “Acquiring Person”, and the rights (except those rights held by the Acquiring Person) would generally become exercisable for shares of our common stock at a discount. In May 2006, we amended the stockholder rights plan to exclude Eastbourne Capital Management, L.L.C. and certain related persons and entities, collectively Eastbourne, from the definition of Acquiring Person so long as neither Eastbourne nor its affiliates or associates, either individually or in the aggregate, becomes the beneficial owner of 25% or more of the common stock then outstanding. On December 11, 2006, the plan was further amended to increase this threshold to 30% with respect to Eastbourne. Because the potential acquiror’s rights would not become exercisable for our shares of common stock at a discount, the potential acquiror would suffer substantial dilution and may lose its ability to acquire us. In addition, the existence of the plan itself may deter a potential acquiror from acquiring us. As a result, either by operation of the plan or by its potential deterrent effect, mergers and acquisitions of us that our stockholders may consider in their best interests may not occur.
Substantial future sales of our common stock by us or by our existing stockholders could cause our stock price to fall.
Additional equity financings or other share issuances by us, including shares issued in connection with strategic alliances and corporate partnering transactions, could adversely affect the market price of our common stock. Sales by existing stockholders of a large number of shares of our common stock in the public market or the
22
Table of Contents
perception that additional sales could occur could cause the market price of our common stock to drop. Substantially all of our outstanding shares of common stock were freely tradable and, in limited cases, subject to certain volume, notice and manner of sale restrictions under Rule 144 of the Securities Act of 1933.
If we do not progress in our programs as anticipated, our stock price could decrease.
For planning purposes, we estimate the timing of a variety of clinical, regulatory and other milestones, such as when a certain product candidate will enter clinical development, when a clinical trial will be completed or when an application for regulatory approval will be filed. Our estimates are based on present facts and a variety of assumptions. Many of the underlying assumptions are outside of our control. If milestones are not achieved when we estimated that they would be, investors could be disappointed, and our stock price may decrease.
Our stock price may be volatile, you may not be able to resell your shares at or above your purchase price.
Our stock prices and the market prices for securities of biotechnology companies in general have been highly volatile, with recent significant price and volume fluctuations, and may continue to be highly volatile in the future. For example, our stock price dropped by 71% on the day following the announcement in December 2006 that the preliminary top-line results of our first three Phase 3 trials did not meet primary end-points. During the twelve months ended December 31, 2010, our common stock traded between $0.64 and $1.49, and on December 31, 2010, our common stock closed at $0.76. You may not be able to sell your shares quickly or at the market price if we are delisted from Nasdaq Capital Market or if we are unable to transfer listing to another stock market, or if trading in our stock is not active or the volume is low. The following factors, in addition to other risk factors described in this section, may have a significant impact on the market price of our common stock, some of which are beyond our control:
| • | developments regarding, or the results of, our clinical trials; |
| • | announcements of technological innovations or new commercial products by our competitors or us; |
| • | developments concerning proprietary rights, including patents; |
| • | developments concerning our collaborations; |
| • | publicity regarding actual or potential medical results relating to products under development by our competitors or us; |
| • | regulatory developments in the United States and foreign countries; |
| • | litigation; |
| • | economic and other external factors or other disaster or crisis; or |
| • | period-to-period fluctuations in our financial results. |
We have been, and in the future may be, subject to securities class action lawsuits and shareholder derivative actions. These, and potential similar or related litigation, could result in substantial damages and may divert management’s time and attention from our business.
We have been, in particular between 2007 and 2008, and may in the future be, the target of securities class actions or shareholder derivative claims. Any such actions or claims could result in substantial damages and may divert management’s time and attention from our business.
23
Table of Contents
| Item 1B. | Unresolved Staff Comments. |
Not applicable.
| Item 2. | Properties. |
In November 2010, we entered into a 28 month lease agreement for 8,620 square feet of office space at 700 Hansen Way in Palo Alto, California and relocated our corporate offices to this facility. We also lease approximately 92,000 square feet of research and office space located at 3165 Porter Drive in Palo Alto, which we have subleased to a tenant effective November 2010 through May 2014 when our master lease expires. We believe the facility at Hansen Way is sufficient to meet our current needs.
| Item 3. | Legal Proceedings. |
None
24
Table of Contents
PART II
| Item 5. | Market for Registrant’s Common Equity, Related Stockholder Matters and Issuer Purchases of Equity Securities. |
Market for Our Common Stock
We transferred listing of our common stock from the Nasdaq Global Market to the Nasdaq Capital Market on January 7, 2010 and continues to trade under the symbol “TELK”. The following table sets forth the high and low sales prices for our common stock for each quarterly period within the two most recent fiscal years.
| High | Low | |||||||
| 2010 |
||||||||
| Quarter ended March 31, 2010 |
$ | 1.09 | $ | 0.72 | ||||
| Quarter ended June 30, 2010 |
$ | 1.49 | $ | 0.66 | ||||
| Quarter ended September 30, 2010 |
$ | 0.82 | $ | 0.64 | ||||
| Quarter ended December 31, 2010 |
$ | 0.95 | $ | 0.64 | ||||
| 2009 |
||||||||
| Quarter ended March 31, 2009 |
$ | 0.56 | $ | 0.27 | ||||
| Quarter ended June 30, 2009 |
$ | 1.40 | $ | 0.40 | ||||
| Quarter ended September 30, 2009 |
$ | 1.25 | $ | 0.65 | ||||
| Quarter ended December 31, 2009 |
$ | 1.02 | $ | 0.69 | ||||
Nasdaq Stock Listing Compliance
On September 19, 2008, we received notification from Nasdaq informing us that the bid price for our common stock had closed below the minimum $1.00 per share requirement for continued inclusion on the Nasdaq Global Market under Nasdaq Marketplace Rule 5550(a)(2). In December 2009, we transferred the listing of our common stock to the Nasdaq Capital Market effective at the opening of the market on January 7, 2010. On April 22, 2010, we received notice from Nasdaq that we had regained compliance with the minimum bid price requirement. Since May 20, 2010, the bid price for our common stock had again fluctuated below the levels required by Nasdaq rules for continued listing. On July 21, 2010, we received notice from Nasdaq that the bid price for our common stock had closed below the minimum $1.00 per share requirement for continued inclusion on the Nasdaq Capital Market. On February 10, 2011, we received a notice from Nasdaq indicating that we have regained compliance with the minimum bid price requirement. We cannot assure you that we will be able to maintain compliance with the minimum bid price, or any other Nasdaq listing requirement.
As of February 22, 2011, there were 80 stockholders of record of our common stock. We have never paid our stockholders cash dividends, and we do not anticipate paying any cash dividends in the foreseeable future as we intend to retain any earnings for use in our business. Any future determination to pay dividends will be at the discretion of our board of directors.
25
Table of Contents
Performance Graph
The following graph compares our cumulative total stockholder return for the past five years to two indices: the Nasdaq U.S. Index and the Nasdaq Pharmaceutical Stocks Index. This graph assumes the investment of $100 on December 30, 2005 in our common stock, the Nasdaq U.S. Index; and the Nasdaq Pharmaceutical Stocks Index. All values assume reinvestment of the full amount of all dividends and are calculated as of the last stock trading day of each year:
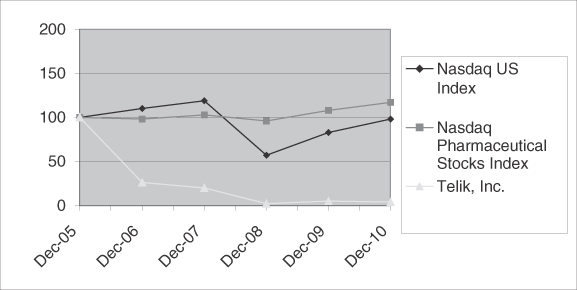
| December 30, 2005 |
December 29, 2006 |
December 31, 2007 |
December 31, 2008 |
December 31, 2009 |
December 31, 2010 |
|||||||||||||||||||
| Telik, Inc. |
$ | 100 | $ | 26 | $ | 20 | $ | 2 | $ | 5 | $ | 4 | ||||||||||||
| Nasdaq U.S. Index |
100 | 110 | 119 | 57 | 83 | 98 | ||||||||||||||||||
| Nasdaq Pharmaceutical Stocks Index |
100 | 98 | 103 | 96 | 108 | 117 | ||||||||||||||||||
Source: Nasdaq.Online. The information under “Performance Graph” is not deemed to be “soliciting material” or “filed” with the Securities and Exchange Commission or subject to Regulation 14A or 14C, or to the liabilities of Section 18 of the Exchange Act of 1934, as amended and is not to be incorporated by reference in any filing of Telik under the Securities Act of 1933, as amended, or the Securities Exchange Act of 1934, as amended, whether made before or after the date of this annual report on Form 10-K and irrespective of any general incorporation language in those filings.
26
Table of Contents
| Item 6. | Selected Financial Data. |
The following selected historical information has been derived from the audited financial statements of Telik and should be read in conjunction with “Item 7. Management’s Discussion and Analysis of Financial Condition and Results of Operations” and “Item 8. Financial Statements and Supplementary Data” included elsewhere in this Annual Report on Form 10-K. The historical results are not necessarily indicative of the results of operations to be expected in the future.
| Years Ended December 31, | ||||||||||||||||||||
| 2010 | 2009 | 2008 | 2007 | 2006 | ||||||||||||||||
| (In thousands, except per share amounts) | ||||||||||||||||||||
| Statement of Operations Data: |
||||||||||||||||||||
| Operating costs and expenses: |
||||||||||||||||||||
| Research and development |
11,040 | 12,723 | 23,952 | 43,032 | 71,522 | |||||||||||||||
| General and administrative |
9,230 | 10,810 | 10,560 | 15,941 | 16,288 | |||||||||||||||
| Facility exit costs |
5,360 | — | — | — | — | |||||||||||||||
| Restructuring costs |
425 | 951 | 196 | 1,356 | — | |||||||||||||||
| Total operating costs and expenses |
26,055 | 24,484 | 34,708 | 60,329 | 87,810 | |||||||||||||||
| Loss from operations |
(26,055 | ) | (24,484 | ) | (34,708 | ) | (60,329 | ) | (87,810 | ) | ||||||||||
| Interest income and other, net |
1,333 | 791 | 2,945 | 5,114 | 8,186 | |||||||||||||||
| Net loss |
$ | (24,722 | ) | $ | (23,693 | ) | $ | (31,763 | ) | $ | (55,215 | ) | $ | (79,624 | ) | |||||
| Basic and diluted net loss per share |
$ | (0.46 | ) | $ | (0.44 | ) | $ | (0.60 | ) | $ | (1.05 | ) | $ | (1.52 | ) | |||||
| Shares used to calculate basic and diluted net Loss per share |
53,539 | 53,371 | 53,177 | 52,542 | 52,271 | |||||||||||||||
| As of December 31, | ||||||||||||||||||||
| 2010 | 2009 | 2008 | 2007 | 2006 | ||||||||||||||||
| (In thousands) | ||||||||||||||||||||
| Balance Sheet Data: |
||||||||||||||||||||
| Cash, cash equivalents, investments and restricted Investments |
$ | 24,064 | $ | 40,400 | $ | 63,469 | $ | 93,233 | $ | 141,665 | ||||||||||
| Working capital |
20,736 | 39,221 | 48,778 | 69,410 | 120,845 | |||||||||||||||
| Total assets |
25,029 | 46,153 | 75,413 | 98,528 | 149,214 | |||||||||||||||
| Current portion of capital lease obligations and loans |
— | 3,101 | — | — | 440 | |||||||||||||||
| Non-current portion of obligations, loans, and long-term liabilities |
2,923 | — | 8,000 | — | — | |||||||||||||||
| Accumulated deficit |
(528,307 | ) | (503,585 | ) | (479,892 | ) | (448,129 | ) | (392,914 | ) | ||||||||||
| Total stockholders’ equity |
18,369 | 40,934 | 62,372 | 87,319 | 132,622 | |||||||||||||||
27
Table of Contents
| Item 7. | Management’s Discussion and Analysis of Financial Condition and Results of Operations. |
Overview
Telik is engaged in the discovery and development of small molecule drugs. Our business strategy is to advance our drug product candidates through Phase 2 clinical studies, and to enter into a partnership with a pharmaceutical or biotechnology company to assist in further development and commercialization, license product candidates outside our therapeutic focus, and identify and develop additional drug product candidates.
We have incurred net losses since inception and expect to incur losses for the next several years as we continue our research and development activities. During the year ended December 31, 2010, loss from operations was $26.1 million and net loss was $24.7 million. Net cash used in operations for the year ended December 31, 2010 was $16.7 million and net cash, cash equivalents, investments and restricted investments at December 31, 2010 were $24.1 million. As of December 31, 2010, we had an accumulated deficit of $528.3 million.
Our expenses have consisted primarily of those incurred for research and development and general and administrative costs associated with our operations. The process of carrying out the development of our product candidates to later stages of development and our research programs may require significant additional research and development expenditures, including for preclinical testing and clinical trials, as well as for manufacturing development efforts and obtaining regulatory approval. We outsource our clinical trials and our manufacturing development activities to third parties to maximize efficiency and minimize our internal overhead. To date, we have funded our operations primarily through the sale of equity securities, interest earned on investments, and non-equity payments from collaborative partners.
We are subject to risks common to biopharmaceutical companies, including risks inherent in our research, development and commercialization efforts, preclinical testing, clinical trials, uncertainty of regulatory and marketing approvals, enforcement of patent and proprietary rights, the need for future capital, potential competition and retention of key employees. In order for a product to be commercialized, it will be necessary for us to conduct preclinical tests and clinical trials, demonstrate efficacy and safety of our product candidates to the satisfaction of regulatory authorities, obtain marketing approval, enter into manufacturing, distribution and marketing arrangements, obtain market acceptance and, in many cases, obtain adequate reimbursement from government and private insurers. We cannot provide assurance that we will generate revenues or achieve and sustain profitability in the future.
In November 2010, we implemented a restructuring plan to further reduce our operating expenses and to streamline our infrastructure to focus on our most advanced preclinical and clinical development programs. As a result of the restructuring plan we reduced our workforce by 11 positions and recorded a charge of approximately $0.4 million for the year ended December 31, 2010, which primarily includes employee severance, payroll taxes and other personnel-related costs. As a result of our restructuring plan, we believe our existing cash resources will be sufficient to satisfy our current operating plan until the third quarter of 2012. Changes in our research and development plans or other changes affecting our operating expenses may affect actual future consumption of existing cash resources as well. In any event, we will require substantial additional financing to fund our operations in the future.
We expect that our quarterly and annual results of operations will fluctuate for the foreseeable future due to several factors, including the timing and extent of our research and development efforts and the outcome of our clinical trial activities. The successful development of our products is uncertain. As such, an accurate prediction of future operating results is difficult or impossible.
Clinical Product Development
TELINTRA, our lead drug product candidate in clinical development, is a small molecule glutathione analog inhibitor of the enzyme glutathione S-transferase P1-1. We are developing TELINTRA for the treatment
28
Table of Contents
of blood disorders associated with low blood cell levels, such as neutropenia or anemia. In May 2008, we initiated a Phase 2 clinical trial of TELINTRA tablets for the treatment of patients with MDS and completed enrollment of 86 patients in 2009. Our Phase 2 clinical trial of TELINTRA tablets for the treatment of Chemotherapy Induced Neutropenia, or CIN, that was also initiated in May 2008 was discontinued in 2009 to allow us to focus resources on the development of our MDS study. In June 2010, we announced positive results of our Phase 2 clinical trial of TELINTRA tablets for the treatment of patients with MDS and presented the data at the annual meeting of ASH in December 2010. In the second quarter of 2009, we initiated a Phase 2 randomized study in SCN to determine the effect of TELINTRA tablets on absolute neutrophil count in patients with this disease. The trial for SCN is intended to enroll a total of 20 patients. In the fourth quarter of 2009, we initiated a Phase 1 dose-ranging study of TELINTRA tablets in combination with Lenalidomide in patients with MDS. We expect to complete this 30-patient study by the end of 2011.
TELCYTA, our other product candidate, is a small molecule cancer drug product candidate designed to be activated in cancer cells. TELCYTA has shown clinical antitumor activity alone and in combination with standard chemotherapeutic agents in multiple Phase 2 and Phase 3 clinical trials in refractory or resistant ovarian, non-small cell lung, breast and colorectal cancer. We completed a multicenter, randomized clinical study of 125 patients of TELCYTA in combination with liposomal doxorubicin versus liposomal doxorubicin as second line therapy in platinum refractory or resistant ovarian cancer and announced results at the annual meeting of the American Society of Clinical Oncology, or ASCO, in May 2009. In May 2010, we initiated an investigator-led study at a single site of TELCYTA in patients with refractory or relapsed mantle cell lymphoma, diffuse large B cell lymphoma, and multiple myeloma. Enrollment for this study is expected to range between 18 to 48 patients based on the number of responses observed. We are currently seeking a partnership with a pharmaceutical or biotechnology company to further advance the development and commercialization of TELCYTA.
Preclinical Drug Product Development
TLK60404—Aurora Kinase/VEGFR Inhibitors
We have a small molecule compound inhibiting both Aurora kinase and VEGFR kinase. Aurora kinase is a signaling enzyme whose function is required for cancer cell division, while VEGF plays a key role in tumor blood vessel formation, ensuring an adequate supply of nutrients to support tumor growth. The lead compounds of our first dual inhibitor program met a development milestone in August 2008 by demonstrating anticancer activity in preclinical models of human colon cancer and human leukemia. These lead compounds prevented tumor growth in preclinical models of human colon cancer and human leukemia by inhibiting both Aurora kinase and VEGFR kinase. Our data support the concept that dual inhibition of Aurora kinase and VEGFR kinase represents a promising approach for anticancer therapy. A development drug product candidate, TLK60404, has been selected. We are conducting the required preclinical safety studies that if successful may support the potential filing of an IND application with the FDA.
TLK60357—Antimitotic Agent
Using our TRAP technology, we have discovered TLK60357, a novel, potent small molecule inhibitor of cell division. TLK60357 inhibits the formation of microtubules that are necessary for cancer cell growth leading to persistent cancer cell block and subsequent cell death at the G2/M cell cycle. This compound demonstrates potent broad-spectrum anticancer activity against a number of human cancer cells. This compound also displays oral efficacy in multiple, standard preclinical models of cancer. TLK60357 is currently being evaluated in preclinical safety studies.
TLK60596 – VEGFR Inhibitor
TLK60596 is a small-molecule dual inhibitor of VEGFR1 and VEGFR2 kinase. VEGFR1/2 kinases are known to mediate the formation of new blood vessels in human cancers allowing them to grow. In standard animal models of human colon cancer, oral administration of TLK60596 significantly reduced tumor growth. TLK60596 is undergoing further preclinical assessment.
29
Table of Contents
Other
We discovered all of our drug product candidates using our proprietary technology, TRAP, which we believe enables the rapid and efficient discovery of small molecule drug product candidates. We expect to enter into collaborative arrangements with third parties, such as contract research organizations for clinical trials, development, manufacturing, regulatory approvals or commercialization of some of our products, particularly outside North America, or in disease areas requiring larger and longer clinical trials than cancer.
Nasdaq Stock Listing Compliance
On September 19, 2008, we received notification from Nasdaq informing us that the bid price for our common stock had closed below the minimum $1.00 per share requirement for continued inclusion on the Nasdaq Global Market under Nasdaq Marketplace Rule 5550(a)(2). Effective January 7, 2010, we transferred the listing of our common stock from the Nasdaq Global Market to the Nasdaq Capital Market. On April 22, 2010, we received notification from Nasdaq that we had regained compliance with the minimum bid price requirement. Since May 20, 2010, the bid price for our common stock had again fluctuated below the levels required by Nasdaq rules for continued listing. On July 21, 2010, we received notice from Nasdaq that the bid price for our common stock had closed below the minimum $1.00 per share requirement for continued inclusion on the Nasdaq Capital Market. On February 10, 2011, we received a notice from Nasdaq indicating that we had regained compliance with the minimum bid price requirement.
UBS Purchase Rights and Loan
On November 10, 2008, we entered into a Rights Agreement with UBS AG and with its affiliates, or UBS, whereby we received rights, or the Right, to sell all our auction rate securities, or ARS, held in our UBS account at par value to UBS at any time during a two-year period beginning on June 30, 2010 and ending on July 2, 2012. UBS was also granted the right to purchase or sell our ARS at any time after acceptance of the Rights Agreement until July 2, 2012, so long as we received par value for the ARS.
In connection with our acceptance of the offer to enter into the agreement, UBS made available to us “no net cost” loans for up to 75% of the market value of our ARS, where interest payable on the loan did not exceed interest earned on our ARS. The loan was secured by our ARS. On December 31, 2008, we borrowed $8 million from UBS in accordance with such a secured, “no net cost” demand facility. On June 10, 2009 and February 12, 2010, UBS elected to repurchase a portion of our ARS under the Rights Agreement at par value of $4.9 million and $4.0 million, respectively. Proceeds from sales of our ARS were applied to the repayments of the credit line, which was paid in full in February 2010. For the year ended December 31, 2010, interest paid on the loan was approximately $6,000 which was offset entirely by interest earned on the pledged securities.
On July 1, 2010, we exercised the Right to sell all our remaining ARS to UBS under the Rights Agreement at par value of $9.8 million. Proceeds from the sale have been re-invested in US government agency securities and we no longer have any ARS investments in our portfolio. To date, we have not incurred any losses on our ARS investments, total par value of $18.7 million, as a result of the Rights Agreement with UBS.
Critical Accounting Policies and Significant Judgments and Estimates
Our management’s discussion and analysis of our financial condition and results of operations are based on our financial statements, which have been prepared in accordance with U.S. generally accepted accounting principles. The preparation of these financial statements requires us to make estimates and assumptions that affect the reported amounts of assets and liabilities and the disclosure of contingent assets and liabilities at the date of the financial statements as well as the reported revenues and expenses during the reporting periods. On an on-going basis, we evaluate our estimates and judgments related to revenue recognition and clinical development costs. We base our estimates on historical experience and on various other factors that we believe are reasonable
30
Table of Contents
under the circumstances, the results of which form the basis for making judgments about the carrying value of assets and liabilities that are not readily apparent from other sources. Actual results may differ significantly from these estimates under different assumptions or conditions.
While our significant accounting policies are more fully described in Note 1 to our financial statements appearing at the end of this Annual Report on Form 10-K, we believe the following accounting policies are critical to the process of making significant judgments and estimates in the preparation of our financial statements.
Fair Value Measurements
We invest our excess cash in money market funds, cash deposits, debt instruments of the U.S. government agency securities, auction rate securities, or ARS, and corporate notes. In the current market environment, the assessment of the fair value of the debt securities can be difficult and subjective. Accounting Standards Codification, or ASC, 820, “Fair Value Measurements and Disclosure”, establishes three levels of inputs that may be used to measure fair value The standard describes a fair value hierarchy based on three levels of inputs, of which the first two are considered observable and the last unobservable, that may be used to measure fair value which are the following:
| Level 1 | Quoted prices in active markets for identical assets or liabilities; |
| Level 2 | Inputs other than Level 1 that are observable, either directly or indirectly, such as quoted prices for similar assets or liabilities; quoted prices in markets that are not active; or other inputs that are observable or can be corroborated by observable market data for substantially the full term of the assets or liabilities; and |
| Level 3 | Unobservable inputs that are supported by little or no market activity and that are significant to the fair value of the assets or liabilities. The determination of fair value for Level 3 instruments requires the most management judgment and subjectivity. |
In the past, we used Level 3 assumptions to estimate our ARS investments. Since late 2007 the auctions for our ARS continued to fail and as a result these investments were not trading and therefore did not have a readily determinable market value. Accordingly, the estimated fair value of the ARS no longer approximated par value. Our ARS were held by UBS, one of our investment providers. On November 10, 2008, we accepted an offer, the “Right”, from UBS entitling us to sell our ARS originally purchased from UBS at par value at anytime during a two-year period from June 30, 2010 through July 2, 2012. We valued this put option using a discounted cash flow model based on Level 3 assumptions. The assumptions used in valuing the ARS and the put option included estimates of, based on data as of the reporting period then ended, interest rates, timing and amount of cash flows, credit and liquidity premiums, expected holding periods of the ARS, loan rates per the UBS Rights offering and bearer risk associated with UBS’s financial ability to repurchase the ARS beginning June 30, 2010. These assumptions were volatile and subject to change, and therefore could result in significant changes to the fair value of ARS. In July 2010, we exercised the Right from UBS to sell all our remaining ARS to UBS and we no longer held any ARS in our investment accounts. See Notes 2 and 4 in the Notes to Financial Statements for additional information.
Stock-based Compensation Expense
We used the fair value method under ASC 718, “Compensation—Stock Compensation” to account for share-based payment awards following the modified prospective method of adoption which provided for certain changes to the method for valuing stock-based compensation. Under ASC 718, employee stock-based compensation is estimated at the date of grant based on the employee stock award’s fair value using the Black-Scholes option-pricing model and is recognized as expense ratably over the requisite service period in a manner similar to other forms of compensation paid to employees. The Black-Scholes option-pricing model requires the
31
Table of Contents
use of certain subjective assumptions. The most significant of these assumptions are our estimates of the expected volatility of the market price of our stock and the expected term of the award. From January 1, 2008 to June 30, 2008, a blended rate of 50% historical volatility and 50% implied volatility was used to determine our expected stock-price volatility since we had sufficient market activity existed with respect to our traded options during such period. For the period from July 1, 2008 to December 31, 2009, the expected volatility was based solely on historical volatility as there was insufficient traded option activity resulting from our declining stock price. We did not use any expected volatility assumptions for 2010 as there were no options granted during the year. The expected term of options granted is based on the simplified method in accordance with the SEC Staff Accounting Bulletin, or SAB, Topic 14.D.2, as our historical share option exercise experience does not provide a reasonable basis for estimation. SAB Topic 14.D.2 was effective on January 1, 2008 and provided guidance to issuers on the method allowed in developing estimates of expected term of “plain vanilla” share options in accordance with ASC 718. SAB Topic 14.D.2 allows companies to continue to use the simplified method, under certain circumstances, beyond December 31, 2007. ASC 718 requires forfeitures to be estimated at the time of grant and revised, if necessary, in subsequent periods if actual forfeitures differ from those estimates. We evaluate our forfeiture rate to reflect actual historical and expected cancellations of unvested options periodically. Our forfeiture rate for 2010, 2009 and 2008 was at 15.7%. See also Note 9, “Stockholders’ Equity,” in the Notes to Financial Statements for further information.
If factors change and we develop different assumptions in the application of ASC 718 in future periods, the compensation expense that we will then record may differ significantly from what we have recorded in the current period.
Exit and Disposal Activities
We record costs and liabilities associated with exit and disposal activities, as defined in ASC 420, “Exit or Disposal Cost Obligations”, at fair value in the period the liability is incurred. ASC 420 requires that the estimated future cash flows to be used in the fair value calculation be discounted using a credit-adjusted risk-free interest rate and that such interest rate shall have a maturity date that approximates the expected timing of future cash flows. Future cash flows related to lease obligations shall include the effect of sublease rental income and other lease operating expenses. In addition, accretion of the liability due to the passage of time is recorded as a general and administrative expense. See Note 6 “Facility Exit Costs” in the Notes to Financial Statements for further information.
Research and Development Expenses
Our research and development expenses include salaries and benefits costs, fees for contractors, consultants and third-party contract research organizations, and an allocation of facility and administrative costs. Research and development expenses consist of costs incurred for drug and product development, manufacturing, clinical activities, discovery research, screening and identification of product candidates, and preclinical studies. All such costs are charged to research and development expenses as incurred.
Clinical development costs are a significant component of research and development expenses. We have a history of contracting with third parties that perform various clinical trial activities on our behalf in the on-going development of our product candidates. The financial terms of these contracts are subject to negotiation and may vary from contract to contract and may result in uneven payment flows. We accrue and expense costs for clinical trial activities performed by third parties based upon estimates of the percentage of work completed during a given period of time over the life of the individual study in accordance with agreements established with third-party contract research organizations and clinical trial sites. We determine our estimates through discussion with internal clinical personnel and third-party service providers of the progress or stage of completion of trials or services and the agreed upon fee to be paid for such services in each agreement. These estimates may or may not match the actual services performed by the third-party organizations as measured by patient enrollment levels
32
Table of Contents
and related activities. We monitor patient enrollment levels and related activities to the extent possible; however, if we underestimate activity levels associated with various studies at a given point in time, we could record significant research and development expenses in future periods. Conversely, over estimation of activity levels could result in accrued expenses being reversed in future periods.
Use of Estimates
In preparing our financial statements to conform with generally accepted accounting principles, we make estimates and assumptions that affect the amounts reported in our financial statements and accompanying notes. Actual results may differ from these estimates.
Results of Operations
Revenues
We had no collaborative research agreements in 2010, 2009 and 2008 and currently do not expect to record any revenue in the next twelve months. Future non-product revenues, if any, will depend upon the extent to which we enter into new collaborative research agreements and the amounts of payments relating to such agreements.
Research and Development Expenses
Research and development expenses for the years ended December 31, 2010, 2009 and 2008 were $11.0 million, $12.7 million and $24.0 million. Our research and development activities consist primarily of drug development, clinical supply manufacturing, clinical activities, discovery research, screening and identification of product candidates and preclinical studies. We group these activities into two major categories: “research and preclinical” and “clinical development.”
The costs associated with research and preclinical and clinical development activities approximate the following:
| Years Ended December 31, | Annual Percent Change |
|||||||||||||||||||
| 2010 | 2009 | 2008 | 2010/2009 | 2009/2008 | ||||||||||||||||
| (in thousands, except percentages) | ||||||||||||||||||||
| Research and preclinical |
$ | 3,000 | $ | 4,303 | $ | 14,012 | (30 | )% | (69 | )% | ||||||||||
| Clinical development |
8,040 | 8,420 | 9,940 | (5 | )% | (15 | )% | |||||||||||||
| Total research and development |
$ | 11,040 | $ | 12,723 | $ | 23,952 | (13 | )% | (47 | )% | ||||||||||
Total research and development expenses for the year ended December 31, 2010 decreased by 13%, or $1.7 million, compared to the same period in 2009 primarily due to the following:
| — | decreased costs of approximately $1.6 million in connection with headcount reduction as a result of our restructuring in 2009 and reduced research activities; |
| — | decreased expenses of approximately $977,000 for TLK58747-Cytotoxic Small Molecule pre-clinical development program due to the reprioritization of our focus on other compounds; |
| — | decreased clinical trial expenses of approximately $765,000 related to the completion our Phase 2 TELINTRA tablets for MDS and the discontinuation of our Phase 2 TELINTRA tablets for CIN; |
| — | offset by a $531,000 increase in clinical development expenses for our ongoing Phase 1 dose-ranging study of TELINTRA tablets in combination with Lenalidomide in patients with MDS, Phase 2 TELINTRA tablets randomized study in SCN and TELCYTA in patients with Refractory or Relapsed Mantle Cell lymphoma, Diffuse Large B Cell Lymphoma, and Multiple Myeloma clinical studies; |
33
Table of Contents
| — | increased stock-based compensation expense of approximately $432,000 primarily due to more stock options vested in 2010; and |
| — | in addition, the year ended December 31, 2009 included approximately $604,000 reduction in accrued clinical trials expenses as a result of final close-out of clinical sites for completed clinical studies while there were no such adjustments in 2010. |
Stock-based compensation expense included in research and development expenses for the years ended December 31, 2010 and 2009 were $851,000 and $420,000.
Total research and development expenses for the year ended December 31, 2009 decreased by 47%, or $11.2 million, compared to the same period in 2008 primarily due to the following:
| — | decreased costs of approximately $7.8 million in connection with headcount reduction as a result of our February 2009 restructuring and reduced research activities; |
| — | lower stock-based compensation expense of approximately $3.3 million primarily due to lower headcount associated with fewer outstanding options vested; |
| — | reduced expenses of approximately $1.1 million as Phase 3 clinical trial study activities in our ASSIST-1, ASSIST-2, ASSIST-3 and ASSIST-5 were completed; |
| — | decreased costs of approximately $413,000 as our TELCYTA Phase 2 combination trials in ovarian and lung cancer were completed and approximately $162,000 due to completion of Phase 1-2a TELINTRA oral formulation clinical trials for MDS. These reductions were offset by increased expenses of approximately $1.1 million for ongoing Phase 2 clinical trials of TELINTRA tablets; and |
| — | increased expenses of approximately $849,000 for TLK58747-Cytotoxic Small Molecule and TLK60404-Aurora Kinase preclinical development programs. |
Stock-based compensation expense included in research and development expenses for the years ended December 31, 2009 and 2008 were $420,000 and $3.7 million.
We expect total research and development expenditures to continue to decrease in the next twelve months as we focus our resources mainly on advancing the clinical development of TELINTRA in MDS.
The following table summarizes our principal drug product candidate development initiatives:
| Related R&D Expenses Years Ended December 31, |
||||||||||||
| Product |
2010 | 2009 | 2008 | |||||||||
| (in thousands) | ||||||||||||
| TELINTRA |
$ | 7,600 | $ | 6,832 | $ | 6,019 | ||||||
| TELCYTA |
2,107 | 923 | 4,494 | |||||||||
| TLK58747 |
128 | 3,269 | — | |||||||||
| TLK60404 |
495 | 742 | — | |||||||||
| Other (1) |
710 | 957 | 13,439 | |||||||||
| Total research and development expenses |
$ | 11,040 | $ | 12,723 | $ | 23,952 | ||||||
| (1) | “Other” constitutes research and development activities performed by our Chemistry, Biology, Preclinical and Quality Assurance departments as these costs cannot be allocated to any individual project. |
34
Table of Contents
The largest component of our total operating expenses is our on-going investment in our research and development activities and, in particular, the clinical development of our product candidate pipeline. The process of conducting the clinical research necessary to obtain FDA approval is costly and time consuming. Current FDA requirements for a new human drug to be marketed in the United States include:
| • | the successful conclusion of preclinical laboratory and animal tests, if appropriate, to gain preliminary information on the product’s safety; |
| • | filing with the FDA of an IND, to conduct initial human clinical trials for drug candidates; |
| • | the successful completion of adequate and well-controlled human clinical trials to establish the safety and efficacy of the product candidate; and |
| • | filing by the company and acceptance and approval by the FDA of a NDA for a product candidate to allow commercial distribution of the drug. |
In view of the factors mentioned above, we consider the active management and development of our clinical pipeline to be crucial to our long-term success. The actual probability of success for each product candidate and clinical program may be impacted by a variety of factors, including, among others, the quality of the candidate, the validity of the target and disease indication, early clinical data, investment in the program, competition, manufacturing capability and commercial viability. Due to these and other factors, it is difficult to give accurate guidance on the anticipated proportion of our research and development investments or the future cash inflows from these programs.
General and Administrative Expenses
| Years Ended December 31, | Annual Percent Change |
|||||||||||||||||||
| 2010 | 2009 | 2008 | 2010/2009 | 2009/2008 | ||||||||||||||||
| (in thousands, except percentages) | ||||||||||||||||||||
| General and administrative |
$ | 9,230 | $ | 10,810 | $ | 10,560 | (15 | )% | 2 | % | ||||||||||
The decrease in general and administrative expenses of 15%, or $1.6 million, in 2010, compared to the same period in 2009, was primarily due a decrease of $618,000 in headcount and corporate administrative expenses, decreased stock-based compensation expense of approximately $571,000 as a result of higher fair value stock options fully vested in 2009 and a decrease of $393,000 in legal and professional service expenses. Stock-based compensation expense included in general and administrative expenses for the years ended December 31, 2010 and 2009 were $1.2 million and $1.8 million.
The increase in general and administrative expenses of 2%, or $250,000, in 2009, compared to the same period in 2008, was primarily due to increased legal and professional service expenses of approximately $336,000 related to corporate matters and business development activities and increased allocation of facility related expenses of approximately $1.0 million. The increase was partially offset by lower stock-based compensation expense of approximately $786,000 as a result of lower fair values of options vested and a decrease of approximately $343,000 in expenses related primarily to lower insurance expenses. Stock-based compensation expense included in general and administrative expenses for the years ended December 31, 2009 and 2008 were $1.8 million and $2.6 million.
We expect future general and administrative expenses to be lower than the 2010 spending level as we undertake efforts to control expenses.
Facility Exit Costs
| Years Ended December 31, | ||||||||||||
| 2010 | 2009 | 2008 | ||||||||||
| (In thousands) | ||||||||||||
| Facility exit costs |
$ | 5,360 | $ | — | $ | — | ||||||
35
Table of Contents
In November 2010, we ceased the use of our facility at 3165 Porter Drive in Palo Alto, California and subleased the facility to a tenant for the remaining contractual term of our master lease, which is through May 2014. We recorded a facility exit charge of $5.4 million to the statement of operations, which included $4.7 million of estimated present value of future lease-related payments through May 2014, less estimated sublease income, and an impairment charge of $1.0 million in leasehold improvements for this facility as the facility would not have any future benefits to us and their estimated fair values were determined to be zero, offset by a reduction of $335,000 in the balance of deferred rent as of November 30, 2010.
Restructuring Costs
| Years Ended December 31, | ||||||||||||
| 2010 | 2009 | 2008 | ||||||||||
| (In thousands) | ||||||||||||
| Restructuring costs |
$ | 425 | $ | 951 | $ | 196 | ||||||
We have implemented workforce reductions over the past several years to reduce our operating expenses and to streamline our infrastructure based on our current preclinical and clinical trial projects. In November 2010, we recorded a restructuring charge of approximately $425,000 for severance costs, health benefits and other personnel related charges relating to a workforce reduction of eleven positions. In February 2009, we implemented a restructuring plan and reduced our workforce by 37 positions and recorded a charge of approximately $951,000. In September 2008, we recorded a restructuring charge of approximately $196,000 for severance costs and health benefits charges relating to a workforce reduction of seven positions.
Interest Income and Interest Expense
| Years Ended December 31, | Annual Percent Change |
|||||||||||||||||||
| 2010 | 2009 | 2008 | 2010/2009 | 2009/2008 | ||||||||||||||||
| (in thousands, except percentages) | ||||||||||||||||||||
| Interest and other income (expense), net |
$ | 1,339 | $ | 876 | $ | 2,945 | 53 | % | (70 | )% | ||||||||||
| Interest expense |
$ | 6 | $ | 85 | $ | — | (93 | )% | n/a | |||||||||||
Interest and other income (expense), net were $1.3 million, $876,000 and $2.9 million for the years ended December 31, 2010, 2009 and 2008. The increase of approximately $463,000 in 2010 compared to the same period in 2009 was due primarily to a $1.2 million Qualifying Therapeutic Discovery Project grant received from the Internal Revenue Service Department of Treasury and was partially offset by a decrease of $344,000 in investment income resulting from lower investment cash balances and a net decrease of $374,000 due to a loss of $31,000 on the disposal of computer and laboratory equipment in 2010 compared to a gain of $343,000 recorded in 2009.
The decrease of approximately $2.1 million in 2009 compared to the same period in 2008 was due primarily to a decrease of $1.7 million in investment income resulting from lower investment cash balances and lower interest rates. In addition, the year ended December 31, 2008 included a gain of $8.6 million from the ARS Right offered by UBS which largely offset the losses recorded on our ARS due to reclassification of these securities from available-for-sale to trading of approximately $7.9 million while there was no such adjustment in 2009. The decrease for 2009 was further offset by a $270,000 gain on the sale of computer and laboratory equipment.
Interest expenses for the periods reported were solely for interest payments on our UBS loan. The decrease of approximately $79,000 for the year ended December 31, 2010 compared to the same period in 2009 was due to the full payment of our UBS loan balance in February 2010. We had no interest expenses for the year ended December 31, 2008.
36
Table of Contents
Liquidity and Capital Resources
| 2010 | 2009 | 2008 | ||||||||||
| (In millions, except ratios) | ||||||||||||
| December 31: |
||||||||||||
| Cash, cash equivalents, investments and restricted cash |
$ | 24.1 | $ | 40.4 | $ | 63.5 | ||||||
| Working capital |
$ | 20.7 | $ | 39.2 | $ | 48.8 | ||||||
| Current ratio |
6.6 : 1 | 9.1 : 1 | 11.3 : 1 | |||||||||
| Year ended December 31: |
||||||||||||
| Cash provided by (used in): |
||||||||||||
| Operating activities |
$ | (16.7 | ) | $ | (24.1 | ) | $ | (30.3 | ) | |||
| Investing activities |
$ | 15.3 | $ | (14.2 | ) | $ | 30.7 | |||||
| Financing activities |
$ | (3.0 | ) | $ | — | $ | 9.0 | |||||
| Capital expenditures (included in investing activities above) |
$ | — | $ | — | $ | (0.1 | ) | |||||
Sources and Uses of Cash. Due to the significant research and development expenditures and the lack of any approved products to generate revenue, we have not been profitable and have generated operating losses since we incorporated in 1988. As such, we have funded our research and development operations through sales of equity, collaborative arrangements with corporate partners, interest earned on investments and equipment lease financings. At December 31, 2010 we had available cash, cash equivalents, investments and restricted investments of $24.1 million. Our cash and investment balances are held in a variety of interest-bearing instruments including obligations of U.S. government agencies and money market accounts. Cash in excess of immediate requirements is invested with regard to liquidity and capital preservation. Wherever possible, we seek to minimize the potential effects of concentration and degrees of risk.
Cash Flows from Operating Activities. Cash used in operations for 2010 was $16.7 million compared to $24.1 million for the same period in 2009 and $30.3 in 2008. Net loss of $24.7 million in 2010 included non-cash charges of $5.4 million of facility exit costs associated with the relocation of our principal executive offices, $2.1 million for stock based compensation and $343,000 for depreciation and amortization. The increase in accounts payable balance was offset by reductions in accrued expenses and did not have a significant impact on cash used in operations for 2010. Cash used in 2009 resulted from a net loss of $23.7 million which included non-cash charges of $2.2 million for stock-based compensation, $556,000 for depreciation and amortization and $1.3 million for the reduction in value of the put option associated with the UBS ARS Right and were partially offset by a $1.4 million increase in the fair value of marketable securities and a $342,000 gain on the disposal of property and equipment. Cash used in operations was further impacted by a $1.4 million decrease in accounts payable and a $1.3 million reduction in accrued clinical trials related primarily to final study payments as a result of the completion of our Phase 3 clinical trials. Cash used in 2008 resulted from a net loss of $31.8 million which included non-cash charges of $6.3 million for stock-based compensation, $1.0 for depreciation and amortization, $8.0 million for the write-down of marketable securities and were partially offset by a gain of $8.6 million recorded upon initial recognition of a put option associated with the ARS rights with UBS. Cash used in operations was further impacted by a $5.0 million reduction in accrued clinical trials related primarily to the completion of our ASSIST 1, 2, 3 and 5 clinical trials and a $1.0 million reduction in accrued legal and related expenses primarily for amounts paid in connection with the class action lawsuit, partially offset by a decrease of $563,000 in interest receivables as a result of lower interest rates and investment balances and a $825,000 increase in accounts payable.
Cash Flows from Investing Activities. Cash provided by investing activities for 2010 was $15.3 million compared to cash used in investing activities of $14.2 million for 2009 and cash provided by investing activities in 2008 of $30.7 million. Cash provided in 2010 was primarily from $35.7 million in investment maturities and $14.0 million in investment sales which included $13.8 million in sales of our ARS to UBS and was partially offset by the purchase of available-for-sale investments of $34.4 million. Cash used in 2009 was primarily for the
37
Table of Contents
purchase of available-for-sale investments of $42.1 million and was partially offset by $225,000 in investment sales, $27 million in investment maturities and $659,000 in proceeds from the sale of property. Cash provided for 2008 was primarily from $28.0 million in maturities of investments and $16.5 million from sales of investments offset by $13.7 million in purchases of available-for-sale investments.
Cash Flows from Financing Activities. Cash used in financing activities for 2010 was approximately $3.0 million compared to $47,000 provided by financing activities in 2009 and $8.6 million in 2008. Cash used in financing activities for 2010 was primarily due to $3.1 million payment of our remaining UBS loan balance on February 16, 2010, offset by $64,000 in proceeds from stock purchases under our employee stock purchase plan. Financing activities for 2009 comprised of $47,000 in proceeds from stock purchases under our employee stock purchase plan. Financing activities in 2008 comprised of $8.0 million in loan proceeds from UBS and $550,000 in proceeds from stock option exercises and stock purchases under our employee stock purchase plan.
Working Capital. Working capital decreased to $20.7 million at December 31, 2010 from $39.2 million at December 31, 2009. The decrease in working capital was primarily due to our use of cash for our clinical studies, pre-clinical programs and operating expenses.
As a result of our relocation to a smaller facility and restructuring plan implemented in November 2010, we believe our existing cash resources will be sufficient to satisfy our current operating plan until the third quarter of 2012. Changes in our research and development plans or other changes affecting our operating expenses may affect actual future consumption of existing cash resources as well. In any event, we will require substantial additional financing to fund our operations in the future. We may seek to raise any necessary additional funds through equity or debt financings, collaborative arrangements with corporate partners or other sources. To the extent that we raise additional capital by issuing equity securities, our stockholders may experience dilution. Debt financing may subject us to restrictive covenants that may adversely affect our operations. To the extent that we raise additional capital through licensing arrangements or arrangements with collaborative partners, we may be required to relinquish, on terms that are not favorable to us, rights to some of our technologies or product candidates that we would otherwise seek to develop or commercialize ourselves. Our future capital uses and requirements depend on numerous factors, including the following:
| • | the progress and success of preclinical studies and clinical trials of our product candidates; |
| • | the progress and number of research programs in development; |
| • | the costs associated with conducting Phase 2 clinical trials; |
| • | the costs and timing of obtaining regulatory approvals; |
| • | our ability to establish, and the scope of, any new collaborations; |
| • | our ability to meet the milestones identified in our collaborative agreements that trigger payments; |
| • | the costs and timing of obtaining, enforcing and defending our patent and intellectual property rights; and |
| • | competing technological and market developments. |
We currently have no commitments for any additional financings. If we need to raise additional money to fund our operations, funding may not be available to us on acceptable terms, or at all. If we are unable to raise additional funds when needed, we may not be able to market our products as planned or continue development of our products, or we could be required to delay, scale back or eliminate some or all of our research and development programs.
Our future contractual obligations at December 31, 2010 are as follows:
| Total | 2011 | 2012-2013 | 2014-2015 | After 2015 | ||||||||||||||||
| (In thousands) | ||||||||||||||||||||
| Operating leases |
$ | 5,413 | $ | 1,866 | $ | 3,086 | $ | 461 | $ | — | ||||||||||
38
Table of Contents
In November 2010, we entered into arrangements to sublease our facility located at 3165 Porter Drive in Palo Alto, California, which consists of approximately 92,000 square feet of research and office space. The sublease term commenced in November 2010 and will expire on May 31, 2014, the date on which the current term of our Master Lease expires. However, if the Master Lease is terminated for any reason prior to this date, the sublease will terminate concurrently.
On November 22, 2010, Telik entered into an arrangement to sublease a facility at 700 Hansen Way, Palo Alto, California in which to relocate our principal executive offices. The term of the Hansen Sublease commenced on November 29, 2010 and expires on March 31, 2013, the date on which the current term of the Hansen Master Lease expires. However, if the Hansen Master Lease is terminated for any reason prior to this date, the Hansen Sublease will terminate concurrently.
We have a contractual obligation under the terms of our manufacturing supply agreement with AMRI wherein we are obligated to purchase a majority of our United States requirements for the active ingredient in TELCYTA for a number of years. However, we currently do not have any requirements for the active ingredient. We have agreed on a pricing schedule for such supply, which will be subject to future renegotiation after a defined time period.
Off-Balance Sheet Arrangements
We have no material off-balance sheet arrangements as defined in Regulation S-K 303(a)(4)(ii).
Recent Accounting Pronouncements
See Note 1 of Notes to Financial Statements attached to this Annual Report for a description of recent accounting pronouncements.
| Item 7A. | Quantitative and Qualitative Disclosures About Market Risk. |
The following discussion about our market risk exposure involves forward-looking statements. We do not use or hold derivative financial instruments, however we are exposed to market risk related to changes interest rates and market conditions.
Our investment policy is to manage our marketable securities portfolio to preserve principal and liquidity while maximizing the return on the investment portfolio. To minimize the exposure due to adverse shifts in interest rates we maintain investments of shorter maturities. Our marketable securities portfolio is primarily invested in U.S. treasury and U.S. government agency securities with an average maturity of under one year and a minimum investment grade rating of A or A-1 or better to minimize credit risk. Although changes in interest rates may affect the fair value of the marketable securities portfolio and cause unrealized gains or losses, such gains or losses would not be realized unless the investments were sold prior to maturity. Through our money managers, we maintain risk management control systems to monitor interest rate risk. The risk management control systems use analytical techniques, including sensitivity analysis. We have operated primarily in the United States and all funding activities with our collaborators to date have been made in U.S. dollars. Accordingly, we do not have any exposure to foreign currency rate fluctuations.
The table below presents the principal amounts and weighted-average interest rates by year of stated maturity for our investment portfolio:
| 2011 | 2012 and Beyond |
Total | Fair Value at December 31, 2010 |
|||||||||||||
| (In thousands, except percentages) | ||||||||||||||||
| Available-for-sale securities |
$ | 20,735 | — | $ | 20,735 | $ | 20,734 | |||||||||
| Average interest rate |
0.24 | % | 0.00 | % | 0.24 | % | ||||||||||
39
Table of Contents
| Item 8. | Financial Statements and Supplementary Data. |
All information required by this item is included in Item 15 of Part IV of this Annual Report and is incorporated into this item by reference.
| Item 9. | Changes in and Disagreements with Accountants on Accounting and Financial Disclosure. |
None
| Item 9A. | Controls and Procedures. |
(I) Evaluation of Disclosure Controls and Procedures and Changes in Internal Control over Financial Reporting
Based on their evaluation as of December 31, 2010, our Chief Executive Officer and Vice President, Controller have concluded that our disclosure controls and procedures (as defined in Rules 13a-15(e) and 15d-15(e) under the Securities Exchange Act of 1934, as amended) were effective.
There were no changes in our internal control over financial reporting during the quarter ended December 31, 2010 that have materially affected, or are reasonably likely to materially affect, our internal control over financial reporting.
(II) Management’s Report on Internal Control over Financial Reporting
Our management is responsible for establishing and maintaining adequate internal control over financial reporting, as such term is defined in Exchange Act Rules 13a-15(f) and 15d-15(f). Our management, including our Chief Executive Officer and Vice President, Controller, does not expect that our procedures or our internal controls will prevent or detect all error and all fraud. An internal control system, no matter how well conceived and operated, can provide only reasonable, not absolute, assurance that the objectives of the control system are met. Because of the inherent limitations in all control systems, no evaluation of our controls can provide absolute assurance that all control issues and instances of fraud, if any, have been detected.
Under the supervision and with the participation of our management, including our Chief Executive Officer and Vice President, Controller, we conducted an evaluation of the effectiveness of our internal control over financial reporting as of December 31, 2010. In making this assessment, our management used the criteria set forth by the Committee of Sponsoring Organizations of the Treadway Commission (“COSO”) in Internal Control-Integrated Framework. Our management has concluded that, as of December 31, 2010, our internal control over financial reporting was effective based on these criteria.
This annual report does not include an attestation report of the company’s registered public accounting firm regarding internal control over financial reporting. Management’s report was not subject to attestation by the company’s registered public accounting firm pursuant to rules of the Securities and Exchange Commission that permit the company to provide only management’s report in this annual report.
| Item 9B. | Other Information. |
None
40
Table of Contents
PART III
| Item 10. | Directors, Executive Officers and Corporate Governance. |
Information regarding directors and executive officers is incorporated by reference to the information set forth under the caption “Information Regarding the Board of Directors and Corporate Governance” in our Proxy Statement pursuant to Section 14(a) of the Securities Exchange Act of 1934 for the Annual Meeting of Stockholders to be filed with the Commission on or before April 30, 2011.
We have adopted the Telik, Inc. Code of Conduct, a code of ethics with which every person who works for us is expected to comply, including without limitation our principal executive officer, principal financial officer, principal accounting officer or controller or persons performing similar functions. The Telik, Inc. Code of Conduct is filed as an exhibit to our Annual Report on Form 10-K for the period ended December 31, 2003 as filed on March 4, 2004, with the U.S. Securities and Exchange Commission, or SEC, and is incorporated herein by reference. If we make any substantive amendments to the Telik, Inc. Code of Conduct or grant to any of our directors or executive officers any waiver including any implicit waiver, from a provision of the Telik, Inc. Code of Conduct, we will disclose the nature of the waiver or amendment in a Current Report on Form 8-K.
| Item 11. | Executive Compensation. |
Information regarding executive compensation is incorporated by reference to the information set forth under the captions “Executive Compensation”, “Compensation Committee Interlocks and Insider Participation” and “Compensation Committee Report” in our Proxy Statement for the Annual Meeting of Stockholders to be filed with the Commission on or before April 30, 2011.
41
Table of Contents
| Item 12. | Security Ownership of Certain Beneficial Owners and Management and Related Stockholder Matters. |
Information regarding security ownership of certain beneficial owners and management is incorporated by reference to the information set forth under the caption “Security Ownership of Certain Beneficial Owners and Management” and “Equity Compensation Plan Information” in our Proxy Statement for the Annual Meeting of Stockholders to be filed with the Commission by on or before April 30, 2011.
Equity Compensation Plan Information
The following table provides certain information with respect to all of the Company’s equity compensation plans in effect as of December 31, 2010.
Equity Compensation Plan Information
| Plan Category |
(A) Number of Securities to be Issued Upon Exercise of Outstanding Options, Warrants and Rights |
(B) Weighted-average Exercise Price of Outstanding Options, Warrants and Rights |
(C) Number of Securities Remaining Available for Issuance Under Equity Compensation Plans (Excluding Securities Reflected in Column (A) (1)) |
|||||||||
| Equity compensation plans approved by security holders |
11,628,030 | $ | 7.28 | 673,460 | (2) | |||||||
| Equity compensation plans not approved by security holders |
— | N/A | — | |||||||||
| Total |
11,628,030 | $ | 7.28 | 673,460 | (2) | |||||||
| (1) | Each year on January 1, since January 1, 2001 and continuing through January 1, 2010, the aggregate number of shares of common stock that may be issued pursuant to stock awards under the 2000 Equity Incentive Plan is automatically increased by the lesser of 1,500,000 shares or 5% of the total number of shares of common stock outstanding on that date or such lesser amount as may be determined by our board of directors. In addition, the 2000 Employee Stock Purchase Plan provides for the automatic increase on that date in the number of shares equal to the lesser of 150,000 shares or 1% of the outstanding shares on that date or such lesser amount as may be determined by the Board. The 2000 Equity Incentive Plan terminated in March 2010 and there were no shares available for new stock awards issuance under this plan as of December 31, 2010. |
| (2) | Includes 673,460 shares issuable under the 2000 Employee Stock Purchase Plan. |
| Item 13. | Certain Relationships and Related Transactions, and Director Independence. |
Information regarding certain relationships and related transactions is incorporated by reference to the information set forth under the caption “Transactions with Related Persons” in our Proxy Statement for the Annual Meeting of Stockholders to be filed with the Commission on or before April 30, 2011.
| Item 14. | Principal Accounting Fees and Services. |
Information regarding principal accountant fees and services is incorporated by reference to the information set forth under the caption “Proposal 2 – Ratification of Selection of Independent Auditors” in our Proxy Statement for the Annual Meeting of Stockholders to be filed with the Commission by on or before April 30, 2011.
42
Table of Contents
PART IV
| Item 15. | Exhibits and Financial Statement Schedules. |
(a) The following documents are filed as part of this Annual Report:
| 1. | Financial Statements. Our financial statements and the Report of Independent Registered Public Accounting Firm, are included in Part IV of this Report on the pages indicated: |
| Page | ||||
| 47 | ||||
| 48 | ||||
| 49 | ||||
| 50 | ||||
| 51 | ||||
| 52 | ||||
| 2. | Financial Statement Schedules. All schedules are omitted because they are not applicable or the required information is shown in the financial statements or the notes thereto. |
| 3. | Exhibits: |
| Exhibit |
Description | |||
| 3.1 | Amended and Restated Certificate of Incorporation. (2) | |||
| 3.2 | Amended and Restated Bylaws. (13) | |||
| 4.1 | Specimen Common Stock Certificate. (1) | |||
| 4.2 | Rights Agreement dated November 2, 2001, by and between Telik and Wells Fargo Bank Minnesota, N.A., replaced by EquiServe Trust Company, N.A. as Rights Agent. (5) | |||
| 4.3 | Registrant’s Certificate of Designation of Series A Junior Participating Preferred Stock. (5) | |||
| 4.4 | Agreement, by and among Telik, Eastbourne Capital Management, L.L.C., Black Bear Offshore Master Fund, L.P., Black Bear Fund I, L.P., Black Bear Fund II, L.L.C., and Richard J. Barry, dated May 18, 2006. (9) | |||
| 4.5 | Amendment to Rights Agreement between Telik and Computershare Shareholder Services, Inc. and Computershare Trust Company, N.A., dated May 18, 2006. (11) | |||
| 4.6 | Second Amendment to Rights Agreement between Telik and Computershare Shareholder Services, Inc. and Computershare Trust Company, N.A., dated December 11, 2006. (10) | |||
| 4.7 | Amended and Restated Standstill Agreement between Telik and Eastbourne Capital Management, L.L.C. and certain related persons and entities, dated December 11, 2006. (10) | |||
| 10.1 | Form of Indemnity Agreement. (1) (3) | |||
| 10.2 | 2000 Equity Incentive Plan and related documents. (3) (4) | |||
| 10.3 | 2000 Employee Stock Purchase Plan and Offering. (3) (4) | |||
| 10.4 | 2000 Non-Employee Directors’ Stock Option Plan and Agreement. (3) (14) | |||
| 10.5 | 1996 Stock Option Plan and forms of grant thereunder. (3) (4) | |||
| 10.6 | 1988 Stock Option Plan and forms of grant thereunder. (3) (4) | |||
| 10.7 | Form of Non-Plan Stock Option Agreement. (3) (4) | |||
| 10.8 | Telik, Inc. Executive Officer Bonus Plan. (3) (12) | |||
43
Table of Contents
| Exhibit |
Description | |||
| 10.9 | Amended and Restated Employment Agreement between Michael M. Wick, M.D., Ph.D. and Telik, dated December 17, 2008, as amended. (3) (15) | |||
| 10.10 | Lease between Telik and The Board of Trustees of the Leland Stanford Junior University, dated July 25, 2002. (6) | |||
| 10.11 | * | Manufacturing Supply Agreement dated July 1, 2004, by and between Telik and Organichem Corporation. (7) | ||
| 10.12 | Telik, Inc. Change of Control Severance Benefit Plan, dated February 21, 2003, amended December 17, 2008. (3) (15) | |||
| 10.13 | Bonuses for Fiscal Year 2009 for Named Executive Officers. (3) (12) | |||
| 10.14 | Transition and Release Agreement between Telik, Inc. and Dr. Stefan Ryser, Ph.D., dated as of June 12, 2009. (3)(16) | |||
| 14.1 | Telik, Inc. Code of Conduct. (8) | |||
| 23.1 | Consent of Independent Registered Public Accounting Firm. | |||
| 24.1 | Power of Attorney (included on the signature pages hereto) | |||
| 31.1 | Certification required by Rule 13a-14(a) or Rule 15d-14(a). | |||
| 31.2 | Certification required by Rule 13a-14(a) or Rule 15d-14(a). | |||
| 32.1 | Certification required by Rule 13a-14(b) or Rule 15d-14(b) and Section 1350 of Chapter 63 of Title 18 of the United States Code (18 U.S.C. 1350). | |||
| * | Confidential treatment has been granted for portions of this document. The information omitted pursuant to such confidential treatment order has been filed separately with the Securities and Exchange Commission. |
| (1) | Incorporated by reference to exhibits to our Registration Statement on Form S-1, filed on April 3, 2000, as amended (File No. 333-33868). |
| (2) | Incorporated by reference to exhibits to our Annual Report on Form 10-K for the year ended December 31, 2001, as filed on March 27, 2002. |
| (3) | Management contract or compensatory arrangement. |
| (4) | Incorporated by reference to exhibits to our Registration Statement on Form S-8, as filed on August 30, 2000 (File No. 333-44826). |
| (5) | Incorporated by reference to exhibits to our Current Report on Form 8-K dated November 2, 2001, as filed on November 5, 2001. |
| (6) | Incorporated by reference to exhibits to our Quarterly Report on Form 10-Q for the quarterly period ended September 30, 2002, as filed on November 13, 2002. |
| (7) | Incorporated by reference to exhibits to our Quarterly Report on Form 10-Q for the quarterly period ended September 30, 2004, as filed on November 8, 2004. |
| (8) | Incorporated by reference to exhibits to our Annual Report on Form 10-K for the year ended December 31, 2003, as filed on March 5, 2004. |
| (9) | Incorporated by reference to exhibits to our Quarterly Report on Form 10-Q for the quarterly period ended June 30, 2006, as filed on August 3, 2006. |
| (10) | Incorporated by reference to exhibits to our Current Report on Form 8-K dated December 11, 2006, as filed on December 12, 2006. |
| (11) | Incorporated by reference to Exhibit A to Exhibit 10.2 to our Quarterly Report on Form 10-Q for the quarterly period ended June 30, 2006, as filed on August 3, 2006. |
44
Table of Contents
| (12) | Incorporated by reference to Exhibit 10.8 to our Annual Report on Form 10-K for the year ended December 31, 2006, as filed on February 28, 2007. |
| (13) | Incorporated by reference to Exhibit 3.2 to our Current Report on Form 8-K dated December 11, 2007, as filed on December 14, 2007. |
| (14) | Incorporated by reference to Exhibit 10.4 to our Annual Report on Form 10-K for the year ended December 31, 2007, as filed on March 3, 2008. |
| (15) | Incorporated by reference to exhibits to our Current Report on Form 8-K dated December 17, 2008, as filed on December 23, 2008. |
| (16) | Incorporated by reference to Exhibit 10.20 to our Quarterly Report on Form 10-Q for the quarterly period ended June 30, 2009, as filed on August 6, 2009. |
45
Table of Contents
Pursuant to the requirements of Section 13 or 15(d) of the Securities Exchange Act of 1934, the Registrant has duly caused this Report to be signed on its behalf by the undersigned, thereunto duly authorized.
| TELIK, INC. | ||
|
/S/ WENDY WEE | ||
| Wendy Wee Vice President, Controller (Principal Financial and Accounting Officer) | ||
Dated: March 1, 2011
POWER OF ATTORNEY
KNOW ALL PERSONS BY THESE PRESENTS, that each person whose signature appears below constitutes and appoints Michael M. Wick, M.D., Ph.D. and Wendy Wee, and each of them, as his true and lawful attorneys-in-fact and agents, with full power of substitution and resubstitution, for him and in his name, place, and stead, in any and all capacities, to sign any and all amendments to this Report, and to file the same, with all exhibits thereto, and other documents in connection therewith, with the Securities and Exchange Commission, granting unto said attorneys-in-fact and agents, and each of them, full power and authority to do and perform each and every act and thing requisite and necessary to be done in connection therewith, as fully to all intents and purposes as he might or could do in person, hereby ratifying and confirming that all said attorneys-in-fact and agents, or any of them or their or his substitute or substitutes, may lawfully do or cause to be done by virtue hereof.
Pursuant to the requirements of the Securities Exchange Act of 1934, this Report has been signed below by the following persons on behalf of the Registrant and in the capacities and on the dates indicated:
| Signature |
Title |
Date | ||
| /S/ MICHAEL M. WICK Michael M. Wick, M.D., Ph.D. |
Chief Executive Officer and Director (Principal Executive Officer) |
March 1, 2011 | ||
| /S/ WENDY WEE Wendy Wee |
Vice President, Controller (Principal Financial and Accounting Officer) |
March 1, 2011 | ||
| /S/ EDWARD W. CANTRALL Edward W. Cantrall, Ph.D. |
Director |
March 1, 2011 | ||
| /S/ STEVEN R. GOLDRING Steven R. Goldring, M.D. |
Director |
March 1, 2011 | ||
| /S/ RICHARD B. NEWMAN Richard B. Newman |
Director |
March 1, 2011 | ||
| /S/ HERWIG VON MORZE Herwig von Morze, Ph.D. |
Director |
March 1, 2011 | ||
46
Table of Contents
Report of Independent Registered Public Accounting Firm
The Board of Directors and Stockholders
Telik, Inc.
We have audited the accompanying balance sheets of Telik, Inc. as of December 31, 2010 and 2009, and the related statements of operations, stockholders’ equity, and cash flows for each of the three years in the period ended December 31, 2010. These financial statements are the responsibility of the Company’s management. Our responsibility is to express an opinion on these financial statements based on our audits.
We conducted our audits in accordance with the standards of the Public Company Accounting Oversight Board (United States). Those standards require that we plan and perform the audit to obtain reasonable assurance about whether the financial statements are free of material misstatement. We were not engaged to perform an audit of the Company’s internal control over financial reporting. Our audits included consideration of internal control over financial reporting as a basis for designing audit procedures that are appropriate in the circumstances, but not for the purpose of expressing an opinion on the effectiveness of the Company’s internal control over financial reporting. Accordingly, we express no such opinion. An audit also includes examining, on a test basis, evidence supporting the amounts and disclosures in the financial statements. An audit also includes assessing the accounting principles used and significant estimates made by management, as well as evaluating the overall financial statement presentation. We believe that our audits provide a reasonable basis for our opinion.
In our opinion, the financial statements referred to above present fairly, in all material respects, the financial position of Telik, Inc. at December 31, 2010 and 2009, and the results of its operations and its cash flows for each of the three years in the period ended December 31, 2010, in conformity with the U.S. generally accepted accounting principles.
/S/ ERNST & YOUNG LLP
Palo Alto, California
March 1, 2011
47
Table of Contents
BALANCE SHEETS
(In thousands, except share and per share data)
| December 31, | ||||||||
| 2010 | 2009 | |||||||
| Assets | ||||||||
| Current assets: |
||||||||
| Cash and cash equivalents |
$ | 7,768 | $ | 12,251 | ||||
| Short-term investments |
15,847 | 27,475 | ||||||
| Interest and other receivables |
214 | 216 | ||||||
| Prepaids and other current assets |
643 | 4,122 | ||||||
| Total current assets |
24,472 | 44,064 | ||||||
| Property and equipment, net |
11 | 1,415 | ||||||
| Restricted investments |
449 | 674 | ||||||
| Other assets |
97 | — | ||||||
| Total assets |
$ | 25,029 | $ | 46,153 | ||||
| Liabilities and Stockholders’ Equity | ||||||||
| Current liabilities: |
||||||||
| Accounts payable |
$ | 932 | $ | 190 | ||||
| Accrued clinical trial costs |
226 | 505 | ||||||
| Accrued compensation |
661 | 528 | ||||||
| Accrued liabilities |
478 | 519 | ||||||
| Notes payable |
— | 3,101 | ||||||
| Current portion of facility exit costs |
1,439 | — | ||||||
| Total current liabilities |
3,736 | 4,843 | ||||||
| Noncurrent portion of facility exit costs |
2,923 | — | ||||||
| Long-term deferred rent |
1 | 376 | ||||||
| Commitments and contingencies |
||||||||
| Stockholders’ equity: |
||||||||
| Preferred stock, $0.01 par value: 5,000,000 shares authorized; none issued or outstanding |
— | — | ||||||
| Common stock, $0.01 par value: 100,000,000 shares authorized; shares issued and outstanding 53,613,572 in 2010 and 53,430,083 in 2009 |
536 | 534 | ||||||
| Additional paid-in capital |
546,141 | 543,987 | ||||||
| Accumulated other comprehensive loss |
(1 | ) | (2 | ) | ||||
| Accumulated deficit |
(528,307 | ) | (503,585 | ) | ||||
| Total stockholders’ equity |
18,369 | 40,934 | ||||||
| Total liabilities and stockholders’ equity |
$ | 25,029 | $ | 46,153 | ||||
See accompanying Notes to Financial Statements.
48
Table of Contents
STATEMENTS OF OPERATIONS
(In thousands, except per share amounts)
| Years Ended December 31, | ||||||||||||
| 2010 | 2009 | 2008 | ||||||||||
| Operating costs and expenses: |
||||||||||||
| Research and development |
$ | 11,040 | $ | 12,723 | $ | 23,952 | ||||||
| General and administrative |
9,230 | 10,810 | 10,560 | |||||||||
| Facility exit costs |
5,360 | — | — | |||||||||
| Restructuring costs |
425 | 951 | 196 | |||||||||
| Total operating costs and expenses |
26,055 | 24,484 | 34,708 | |||||||||
| Loss from operations |
(26,055 | ) | (24,484 | ) | (34,708 | ) | ||||||
| Interest and other income, net |
1,339 | 876 | 2,945 | |||||||||
| Interest expense |
(6 | ) | (85 | ) | — | |||||||
| Net loss |
$ | (24,722 | ) | $ | (23,693 | ) | $ | (31,763 | ) | |||
| Basic and diluted net loss per share |
$ | (0.46 | ) | $ | (0.44 | ) | $ | (0.60 | ) | |||
| Shares used to calculate basic and diluted net loss per share |
53,539 | 53,371 | 53,177 | |||||||||
See accompanying Notes to Financial Statements.
49
Table of Contents
STATEMENTS OF STOCKHOLDERS’ EQUITY
(In thousands)
| Common Stock | Additional Paid-in Capital |
Accumulated Other Comprehensive Income (Loss) |
Accumulated Deficit |
Total Stockholders’ Equity |
||||||||||||||||||||
| Shares | Amount | |||||||||||||||||||||||
| Balances at December 31, 2007 |
52,929 | 529 | 534,881 | 38 | (448,129 | ) | 87,319 | |||||||||||||||||
| Comprehensive loss: |
||||||||||||||||||||||||
| Net loss |
— | — | — | — | (31,763 | ) | (31,763 | ) | ||||||||||||||||
| Change in unrealized gains (losses) on available-for-sale investments |
— | — | — | (17 | ) | — | (17 | ) | ||||||||||||||||
| Comprehensive loss |
(31,780 | ) | ||||||||||||||||||||||
| Share-based compensation expense |
— | — | 6,283 | — | — | 6,283 | ||||||||||||||||||
| Common stock issued under stock option and purchase plans |
361 | 4 | 546 | — | — | 550 | ||||||||||||||||||
| Balances at December 31, 2008 |
53,290 | 533 | 541,710 | 21 | (479,892 | ) | 62,372 | |||||||||||||||||
| Comprehensive loss: |
||||||||||||||||||||||||
| Net loss |
— | — | — | — | (23,693 | ) | (23,693 | ) | ||||||||||||||||
| Change in unrealized gains (losses) on available-for-sale investments |
— | — | — | (23 | ) | — | (23 | ) | ||||||||||||||||
| Comprehensive loss |
(23,716 | ) | ||||||||||||||||||||||
| Share-based compensation expense |
— | — | 2,231 | — | — | 2,231 | ||||||||||||||||||
| Common stock issued under stock option and purchase plans |
140 | 1 | 46 | — | — | 47 | ||||||||||||||||||
| Balance at December 31, 2009 |
53,430 | 534 | 543,987 | (2 | ) | (503,585 | ) | 40,934 | ||||||||||||||||
| Comprehensive loss: |
||||||||||||||||||||||||
| Net loss |
— | — | — | — | (24,722 | ) | (24,722 | ) | ||||||||||||||||
| Change in unrealized gains (losses) on available-for-sale investments |
— | — | — | 1 | — | 1 | ||||||||||||||||||
| Comprehensive loss |
(24,721 | ) | ||||||||||||||||||||||
| Share-based compensation expense |
— | — | 2,092 | — | — | 2,092 | ||||||||||||||||||
| Common stock issued under stock option and purchase plans |
184 | 2 | 62 | — | — | 64 | ||||||||||||||||||
| Balance at December 31, 2010 |
53,614 | $ | 536 | $ | 546,141 | $ | (1 | ) | $ | (528,307 | ) | $ | 18,369 | |||||||||||
See accompanying Notes to Financial Statements.
50
Table of Contents
STATEMENTS OF CASH FLOWS
(In thousands)
| Years Ended December 31, | ||||||||||||
| 2010 | 2009 | 2008 | ||||||||||
| Cash flows from operating activities: |
||||||||||||
| Net loss |
$ | (24,722 | ) | $ | (23,693 | ) | $ | (31,763 | ) | |||
| Adjustments to reconcile net loss to net cash used in operating activities: |
||||||||||||
| Depreciation and amortization |
343 | 556 | 1,021 | |||||||||
| (Gain) loss on the disposal of property and equipment |
31 | (342 | ) | — | ||||||||
| Share-based compensation expense |
2,092 | 2,231 | 6,283 | |||||||||
| Facility exit costs |
5,360 | — | — | |||||||||
| Change in value of marketable securities |
111 | (1,350 | ) | 7,957 | ||||||||
| Change in fair value of rights to sell ARS to UBS |
(111 | ) | 1,309 | (8,649 | ) | |||||||
| Changes in assets and liabilities: |
||||||||||||
| Other receivables |
2 | (178 | ) | 563 | ||||||||
| Prepaid expenses and other current assets |
59 | 267 | 468 | |||||||||
| Other assets |
(97 | ) | — | — | ||||||||
| Accounts payable |
742 | (1,391 | ) | 825 | ||||||||
| Accrued liabilities |
(227 | ) | (1,532 | ) | (6,993 | ) | ||||||
| Accrued facility exit costs |
(308 | ) | — | — | ||||||||
| Net cash used in operating activities |
(16,725 | ) | (24,123 | ) | (30,288 | ) | ||||||
| Cash flows from investing activities: |
||||||||||||
| Purchases of investments |
(34,411 | ) | (42,119 | ) | (13,745 | ) | ||||||
| Sales of investments |
14,024 | 225 | 16,451 | |||||||||
| Maturities of investments |
35,660 | 27,000 | 28,000 | |||||||||
| Purchases of property and equipment |
— | — | (52 | ) | ||||||||
| Proceeds from sale of property and equipment |
5 | 659 | — | |||||||||
| Net cash provided by (used in) investing activities |
15,278 | (14,235 | ) | 30,654 | ||||||||
| Cash flows from financing activities: |
||||||||||||
| (Payments on) proceeds from loan provided by UBS relating to ARS |
(3,100 | ) | — | 8,000 | ||||||||
| Net proceeds from issuance of common stock |
64 | 47 | 550 | |||||||||
| Net cash provided by (used in) financing activities |
(3,036 | ) | 47 | 8,550 | ||||||||
| Net change in cash and cash equivalents |
(4,483 | ) | (38,311 | ) | 8,916 | |||||||
| Cash and cash equivalents at beginning of period |
12,251 | 50,562 | 41,646 | |||||||||
| Cash and cash equivalents at end of period |
$ | 7,768 | $ | 12,251 | $ | 50,562 | ||||||
| Supplemental information: |
||||||||||||
| Interest paid |
$ | 6 | $ | 85 | $ | — | ||||||
| Proceeds from sale of ARS directly applied to UBS loan relating to ARS |
— | $ | 4,900 | — | ||||||||
| Repayment of UBS loan relating to ARS using proceeds from sale of ARS |
— | $ | (4,900 | ) | — | |||||||
See accompanying Notes to Financial Statements.
51
Table of Contents
NOTES TO FINANCIAL STATEMENTS
1. Summary of Significant Accounting Policies
Nature of Operations and Basis of Presentation
Telik, Inc. (“Telik,” “we” or, the “Company”) was incorporated in the state of Delaware in October 1988. We are engaged in the discovery and development of small molecule therapeutics. We operate in only one business segment.
Need for Additional Capital
We have incurred net losses since inception and we expect to incur substantial and increasing losses for at least the next several years as we continue our research and development activities. To date, we have funded operations primarily through the sale of equity securities, non-equity payments from collaborators and interest income. Future revenue, if any, for at least the next few years is expected to consist primarily of payments under corporate collaborations and interest income. The process of developing our products will require significant additional research and development, preclinical testing and clinical trials, as well as regulatory approval. We expect these activities, together with general and administrative expenses, to result in substantial operating losses for the foreseeable future. We will not receive product revenue unless we, or our collaborative partners, complete clinical trials, obtain regulatory approval and successfully commercialize one or more of our products.
We expect continuing losses over the next several years. We plan to obtain capital through public or private equity or debt financing, capital lease financing and collaborative arrangements with corporate partners. We may have to seek other sources of capital or re-evaluate our operating plans if we are unable to consummate some or all of the capital financing arrangements noted above. At December 31, 2010 we had available cash, cash equivalents, investments and restricted investments of $24.1 million. Our cash and investment balances are held in a variety of interest-bearing instruments including obligations of U.S. government agencies and money market accounts. Cash in excess of immediate requirements is invested with regard to liquidity and capital preservation. Wherever possible, we seek to minimize the potential effects of concentration and degrees of risk. We believe our existing cash resources will be sufficient to satisfy our current operating plan until the third quarter of 2012. Changes in our research and development plans or other changes effecting our operating expenses may affect actual future consumption of our existing cash resources as well.
Use of Estimates
In preparing our financial statements to conform with U.S. generally accepted accounting principles, we make estimates and assumptions that affect the amounts reported in our financial statements and accompanying notes. Actual results may differ from these estimates.
Cash and Cash Equivalents, Short-Term and Long-Term Investments
We currently invest our excess cash in money market funds, cash deposits, U.S. treasury and U.S. government agency securities. Prior to July 2010, we held taxable municipal notes, some of which had an auction reset feature (auction rate securities, or ARS), and corporate notes. All investments with stated maturities of three months or less from date of purchase are classified as cash equivalents. Debt securities with original maturities greater than three months and remaining maturities less than one year are classified as short-term investments. Debt securities with remaining maturities greater than one year and which we intend to hold until maturity are classified as long-term investments. We classify all cash equivalents and non-ARS investments as available-for-sale. Available-for-sale securities are carried at estimated fair value, with unrealized gains and losses reported as a component of accumulated other comprehensive income (loss).
52
Table of Contents
Realized gains or losses on the sale of investments are determined on a specific identification method, and such gains and losses are reflected as a component of interest and other income (expense), net.
Due to the unprecedented events in the ARS market and our November 2008 ARS Rights Agreement, or the Rights Agreement, with UBS AG and with its affiliates, or UBS, we elected a one-time transfer of our ARS investments from the classification of available-for-sale to trading securities under ASC 320, “Investments-Debt and Equity Securities,” during the fourth quarter of fiscal 2008. Trading securities are carried at estimated fair value, with gains and losses resulting from changes in fair value reported in earnings.
Marketable security investments are evaluated periodically for impairment. We take into account general market conditions, changes in economic environment as well as specific investment attributes, such as credit downgrade or illiquidity for each investment, the expected cash flows from the security, our intent to sell the security and whether or not we will be required to sell the security before the recovery of its amortized cost, to estimate the fair value of our investments and to determine whether impairment is other than temporary. If it is determined that a decline in fair value of any investment is other than temporary, then the unrealized loss related to credit risk would be included in interest and other income (expense), net for our available-for-sale securities.
Restricted Investments
Under certain operating lease agreements, we may be required from time to time to set aside cash as collateral. At December 31, 2010, we had approximately $449,000 of restricted investments and at December 31, 2009 we had approximately $674,000 related to the building lease agreement.
Fair Value of Financial Instruments
We used the provisions of ASC 820, “Fair Value Measurements and Disclosure,” to determine the fair values of our financial and nonfinancial assets and liabilities. ASC 820 defines fair value, establishes a framework for measuring fair value in generally accepted accounting principles and expands disclosure about fair value measurements. The objective of fair value measurement is to determine the price that would be received to sell the asset or paid to transfer the liability (an exit price) in an orderly transaction between market participants at the measurement date. The statement emphasizes that fair value is a market-based measurement, not an entity-specific measurement, and that market participant assumptions include assumptions about risk and effect of a restriction on the sale or use of an asset. To increase consistency and comparability in fair value measurement and related disclosures, this statement establishes a fair value hierarchy that prioritize the inputs to valuation techniques used to measure fair value into three broad levels: (1) Level 1 inputs are quoted prices (unadjusted) in active markets for identical assets or liabilities that the reporting entity has the ability to access at the measurement date; (2) Level 2 inputs are inputs other than quoted prices included in Level 1 that are observable for the asset or liability, either directly or indirectly through corroboration with observable market data; and (3) Level 3 inputs are unobservable inputs for asset or liability that reflect the reporting entity’s own assumptions about risk and the assumptions market participants would use in pricing the asset or liability developed based on the best information available in the circumstances.
We recorded the fair values of our treasury bills, treasury notes and government agency securities based on a monthly report provided by our investment provider. Since these government securities generally have market prices from multiple sources and it can be difficult to select the best individual price directly from the quoted prices in the active markets, our investment provider uses Level 2 inputs for the valuation of these securities. Using the Level 2 inputs, a “consensus price” or a weighted average price for each of these securities can be derived from a distribution-curve-based algorithm which includes market prices obtained from a variety of industrial standard data providers (e.g. Bloomberg), security master files from large financial institutions, and other third-party sources.
With the current financial market conditions, the assessment of fair values of certain financial instruments can be difficult and subjective. For our ARS and put option, we used Level 3 inputs to determine their fair values
53
Table of Contents
since they did not have a readily determinable market value. The assumptions used in valuing the ARS and the put option included, basing on data as of the reporting period then ended, interest rates, tax status, credit quality, expected holding periods of the ARS, insurance wraps, the portfolio composition of Federal Family Education Loan Program, or FFELP, and private loans, likelihood of redemption, loan rates per the UBS Rights offering and bearer risk associated with UBS’s financial ability to repurchase the ARS beginning June 30, 2010. These assumptions were volatile and subject to change, and therefore could result in significant changes to the fair values of these financial instruments. See Note 2 to Financial Statements for additional information.
The carrying amounts of other financial assets and liabilities, including cash, cash equivalents, prepaids and accrued liabilities, approximate fair value due to their short term nature.
Property and Equipment
Property and equipment are stated at cost. We calculate depreciation using the straight-line method over the estimated useful lives of the assets, which range from three to five years. We amortize furniture and equipment leased under capital leases and leasehold improvements using the straight-line method over the estimated useful lives of the respective assets or the lease term, whichever is shorter. Amortization of assets under capital leases is included in depreciation expense.
Exit and Disposal Activities
We record costs and liabilities associated with exit and disposal activities, as defined in ASC 420, “Exit or Disposal Cost Obligations”, at fair value in the period the liability is incurred. ASC 420 requires that the estimated future cash flows to be used in the fair value calculation be discounted using a credit-adjusted risk-free interest rate and that such interest rate shall have a maturity date that approximates the expected timing of future cash flows. Future cash flows related to lease obligations shall include the effect of sublease rental income and other lease operating expenses. In addition, accretion of the liability due to the passage of time is recorded as a general and administrative expense. See Note 6 to Financial Statements for further information.
Impairment of Long-lived Assets
We regularly evaluate our long-lived assets for indicators of possible impairment whenever events or changes in business circumstances indicate that the carrying amount of the assets may not be fully recoverable, in accordance with ASC 360 and related guidance. An impairment loss would be recognized when estimated undiscounted future cash flows expected to result from the use of the asset and its eventual disposition are less than its carrying amount. Impairment, if any, is assessed using discounted cash flows. For the year ended December 31, 2010, we recorded an impairment charge of $1.0 million against leasehold improvements and for the year ended December 31, 2009, we recorded an impairment charge of $40,000 against one of our laboratory equipment as we determined that the carrying value exceeded the fair value of these assets.
Research and Development
Our research and development expenses include salaries and benefits costs, fees for contractors, consultants and third party contract research organizations, and an allocation of facility and administrative costs. Research and development expenses consist of costs incurred for drug and product development, manufacturing, clinical activities, discovery research, screening and identification of product candidates, and preclinical studies. All such costs are charged to research and development expenses as incurred.
Clinical development costs are a significant component of research and development expenses. We have a history of contracting with third parties that perform various clinical trial activities on our behalf in the on-going development of our product candidates. The financial terms of these contracts are subject to negotiations and may vary from contract to contract and may result in uneven payment flows. We accrue and expense costs for
54
Table of Contents
clinical trial activities performed by third parties based upon estimates of the percentage of work completed over the life of the individual study in accordance to agreements established with contract research organizations and clinical trial sites. We determine our estimates through discussion with internal clinical personnel and outside service providers as to progress or stage of completion of trials or services and the agreed upon fee to be paid for such services. These estimates may or may not match the actual services performed by the organizations as determined by patient enrollment levels and related activities. We monitor patient enrollment levels and related activities to the extent possible.
Stock-based Compensation
Under the provisions of ASC 718, employee stock-based compensation is estimated using the Black-Scholes option-pricing model and is recognized as expense ratably over the requisite service period in a manner similar to other forms of compensation paid to employees. The Black-Scholes option-pricing model requires the use of certain subjective assumptions. The most significant of these assumptions are our estimates of the expected volatility of the market price of our stock and the expected term of the award. For the period from January 1, 2008 to June 30, 2008, expected volatility was based on a blended rate of 50% historical volatility and 50% implied volatility since we had sufficient market activity available with respect to our traded options during such period. For the period from July 1, 2008 to December 31, 2009, the expected volatility was based solely on historical volatility as there was insufficient traded option activity resulting from our declining stock price. We did not use any expected volatility assumptions for 2010 as there were no options granted during the year. The expected term of options granted is based on the simplified method in accordance with SAB Topic 14.D.2, as our historical share option exercise experience does not provide a reasonable basis for estimation. ASC 718 requires forfeitures to be estimated at the time of grant and revised, if necessary, in subsequent periods if actual forfeitures differ from those estimates. We adjust our forfeiture rate to reflect actual historical and expected cancellations of unvested options when applicable. Our forfeiture rate for 2010, 2009 and 2008 was at 15.7%. See Note 9 to Financial Statements for additional information.
We have adopted the simplified method to calculate the beginning balance of the additional paid-in-capital ,or APIC, pool of the excess tax benefit, and to determine the subsequent impact on the APIC pool and our Statements of Cash Flows of the tax effects of employee stock-based compensation awards that were outstanding upon our adoption of ASC 718.
Comprehensive Loss
Components of other comprehensive loss, including unrealized gains and losses on available-for-sale investments, are included as part of total comprehensive loss in our statements of stockholders’ equity.
Net Loss per Share
Basic and diluted net loss per share are computed by dividing net loss by the weighted average number of common shares outstanding during the year.
The following table reflects weighted average options outstanding before application of the treasury stock method that could potentially dilute basic earnings per share in the future, but were excluded from the computation of diluted net loss per share, as their effect would have been antidilutive for the periods presented herein.
| Year Ended December 31, | ||||||||||||
| 2010 | 2009 | 2008 | ||||||||||
| Outstanding options |
12,387,695 | 9,494,092 | 10,325,244 | |||||||||
55
Table of Contents
Income Taxes
We apply the provisions of ASC 740, “Accounting for Income Taxes”. Under ASC 740, deferred tax liabilities or assets arise from differences between the tax basis of liabilities or assets and their basis for financial reporting, and are subject to tests of recoverability in the case of deferred tax assets. Deferred tax assets and liabilities are measured using enacted tax rates expected to apply to taxable income in the years in which those temporary differences are expected to be recovered or settled. A valuation allowance is provided for deferred tax assets to the extent realization is not judged to be more likely than not.
In July 2006, the FASB issued Section 740-10-25 which provides detailed guidance for the financial statement recognition, measurement and disclosure of uncertain tax positions recognized in an enterprise’s financial statements in accordance with ASC 740. Income tax positions must meet a more-likely-than-not recognition threshold at the effective date to be recognized upon the adoption of Section 740-10-25 and in subsequent periods. Any potential accrued interest and penalties related to unrecognized tax benefits within operations would be recorded as income tax expense. To date, there have been no interest or penalties charged to us related to the underpayment of income taxes.
We adopted ASC 740-10-25 effective January 1, 2007 and the provisions of ASC 740-10-25 have been applied to all income tax positions commencing from that date. There was no impact on our financial statements upon adoption. Because of our historical significant net operating losses, we have not been subject to income tax since inception. Upon adoption of ASC 740-10-25 on January 1, 2007, we recognized a $14.2 million increase in our liability for unrecognized income tax benefits which was accounted for as a reduction to the deferred tax assets balance as of that date. At December 31, 2010, we have a liability for unrecognized tax benefits of $9.2 million, none of which, if recognized, would affect our effective tax rate. We maintain deferred tax assets that reflect the net tax effects of temporary differences between the carrying amounts of assets and liabilities for financial reporting purposes and the amounts used for income tax purposes. These deferred tax assets include net operating loss carryforwards, research credits and capitalized research and development. The net deferred tax asset has been fully offset by a valuation allowance because of our history of losses.
Recent Accounting Pronouncements
In January 2010, the FASB issued Accounting Standard Update No. 2010-06, Fair Value Measurements and Disclosures (Topic 820): Improving Disclosures about Fair Value Measurements, “ASU 2010-06”, to improve disclosures related to fair value measurements. This guidance requires new disclosures as well as clarifies certain existing disclosure requirements. Under ASU 2010-06, companies are required to provide separate information about significant transfers in and out of Level 1 and Level 2 of the fair value hierarchy as well as the reasons for such transfers, and a reconciliation of purchases, sales, issuances, and settlements activities valued using Level 3 inputs on a gross basis. ASU 2010-06 also clarifies the requirement to determine the level of disaggregation for fair value measurement disclosures and the requirement to disclose valuation techniques and inputs used for both recurring and nonrecurring fair value measurements in either Level 2 or Level 3. ASU 2010-06 is effective for interim and annual reporting periods beginning after December 15, 2009, except for the disclosure about purchases, sales, issuances, and settlements in the rollforward of activity for Level 3 fair value measurement which will be effective for fiscal years beginning after December 15, 2010, and for interim periods within those fiscal years. We adopted ASU 2010-06 for Level 1 and 2 disclosure requirements in the quarter ended March 31, 2010. The adoption of this guidance increases the level of disclosures in our financial statements related to fair value measurements.
On February 24, 2010, the FASB issued ASU No. 2010-09, Subsequent Events (Topic 855)—Amendments to Certain Recognition and Disclosure Requirements, “ASU 2010-09”. ASU 2010-09 removes the requirement that SEC filers disclose the date through which subsequent events have been evaluated. This amendment alleviates potential conflicts between Subtopic 855-10 and the SEC’s requirements. We have adopted this guidance since its issuance.
56
Table of Contents
2. Fair Value Measurements
We measure certain financial assets at fair value on a recurring basis, including cash equivalents, available-for-sale securities, trading securities and put options. The fair value of these financial assets was determined based on a three-tier fair value hierarchy as described in Note 1, which prioritizes the inputs used in measuring fair value.
The following table presents information about our financial assets that are measured at fair value on a recurring basis as of December 31, 2010 and indicates the fair value hierarchy of the valuation techniques utilized to determine such fair value:
| Fair Value Measurement at December 31, 2010 Using | ||||||||||||||||
| December 31, 2010 |
Quoted Prices in Active Markets for Identical Assets (Level 1) |
Significant Other Observable Inputs (Level 2) |
Significant Unobservable Inputs (Level 3) |
|||||||||||||
| (in thousands) | ||||||||||||||||
| Available-for-sale securities: |
||||||||||||||||
| Money market funds |
$ | 53 | $ | 53 | $ | — | $ | — | ||||||||
| US government agencies |
20,734 | — | 20,734 | — | ||||||||||||
| Total |
$ | 20,787 | $ | 53 | $ | 20,734 | $ | — | ||||||||
There were no transfers between Level 1 and Level 2 measurements in the year ended December 31, 2010.
The following table presents information about our financial assets that are measured at fair value on a recurring basis as of December 31, 2009 and indicates the fair value hierarchy of the valuation techniques utilized to determine such fair value:
| Fair Value Measurement at December 31, 2009 Using | ||||||||||||||||
| December 31, 2009 |
Quoted Prices in Active Markets for Identical Assets (Level 1) |
Significant Other Observable Inputs (Level 2) |
Significant Unobservable Inputs (Level 3) |
|||||||||||||
| (in thousands) | ||||||||||||||||
| Available-for-sale securities: |
||||||||||||||||
| Money market funds |
$ | 11,583 | $ | 11,583 | $ | — | $ | — | ||||||||
| US Treasury bills |
5,995 | — | 5,995 | — | ||||||||||||
| US Treasury notes |
11,100 | — | 11,100 | — | ||||||||||||
| Trading securities: |
||||||||||||||||
| Auction preferred stock |
1,600 | — | — | 1,600 | ||||||||||||
| Auction rate certificates |
8,780 | — | — | 8,780 | ||||||||||||
| Other current assets: |
||||||||||||||||
| Put option |
3,420 | — | — | 3,420 | ||||||||||||
| Total |
$ | 42,478 | $ | 11,583 | $ | 17,095 | $ | 13,800 | ||||||||
57
Table of Contents
The following is a reconciliation of our investments measured at fair value on a recurring basis using significant unobservable inputs (Level 3):
| Fair Value Measurements Using Significant Unobservable Inputs (Level 3) |
||||||||||||
| Put Option |
Auction Rate Securities |
Total | ||||||||||
| (in thousands) | ||||||||||||
| Balance at December 31, 2008 |
$ | 8,649 | $ | 10,010 | $ | 18,659 | ||||||
| Impairment gain (loss) included in net loss |
(1,309 | ) | 1,350 | 41 | ||||||||
| Sales or settlement |
(3,920 | ) | (980 | ) | (4,900 | ) | ||||||
| Balance at December 31, 2009 |
3,420 | 10,380 | 13,800 | |||||||||
| Impairment gain (loss) included in net loss |
111 | (111 | ) | — | ||||||||
| Sales or settlement |
(3,531 | ) | (10,269 | ) | (13,800 | ) | ||||||
| Balance at December 31, 2010 |
$ | — | $ | — | $ | — | ||||||
Our ARS investments, purchased through UBS at par value, have an auction reset feature. Historically, the fair value of ARS investments approximated par value due to the frequent resets through the auction process. Beginning in late 2007, our securities invested in ARS failed to settle in scheduled auctions due to liquidity crises. An auction failure means that the parties wishing to sell securities could not make the sale, but does not result in the securities going into default because the issuer continues to pay interest. The interest rates may be reset to predetermined “penalty” or “maximum” rates based on mathematical formulas in accordance with each security’s prospectus. While we continued earning interest on our ARS investments at the contractual rate, these investments were not trading and therefore did not have a readily determinable market value. Accordingly, the estimated fair value of the ARS did not approximate par value.
We estimated the fair value of our ARS after consideration of several factors, including input provided by UBS. Valuation techniques involved the use of a discounted cash flow approach. Although these securities would typically be measured using Level 2 inputs, the failure of auctions and the lack of market activity required that these securities be measured using Level 3 inputs. The assumptions used in preparing the discounted cash flow model to determine the fair value of our auction preferred stock took into account factors such as interest rates, credit quality, likelihood of redemption, duration and credit default swap data points for monoline insurers. The underlying assets of our auction rate certificates primarily comprised of student loans, and their fair values were measured by considering factors such as interest rates, tax status, credit quality, duration, insurance wraps, the portfolio composition of Federal Family Education Loan Program, or FFELP, and private loans and likelihood of redemption. These assumptions were highly subjective and involved significant judgment and were subject to change as the underlying sources of these assumptions and market conditions change.
On November 10, 2008, we entered into an agreement with UBS whereby we received rights, or the Right, to sell all our ARS held in our UBS account at par value ($18.7 million) to UBS at any time during a two-year period beginning on June 30, 2010 and ending on July 2, 2012. On February 12, 2010, UBS repurchased $4.0 million of our ARS from the original balance of $13.8 million. On July 1, 2010, we exercised the Right and sold all our remaining ARS to UBS under the Rights Agreement at par value of $9.8 million. For the year ended December 31, 2010, we recorded (i) a reduction of approximately $3.5 million and $10.3 million in fair values of our put option and ARS respectively, as a result of certain ARS repurchased by UBS in February 2010 and the exercise of the Rights Agreement on July 1, 2010 and (ii) no gain or loss to interest and income, net due to offsetting changes in fair values of our ARS and put option. As a result, we had no ARS investments and put option balance at December 31, 2010. For additional information, see Note 8 to Financial Statements.
We evaluate long-lived assets for impairment on a non-recurring basis whenever events or changes in circumstances indicate that the carrying value of long-lived assets may not be recoverable. We recognize such
58
Table of Contents
impairment in the event the net book value of such assets exceeds the future undiscounted cash flows attributable to such assets. An impairment charge of $40,000 against laboratory equipment was recorded for the year ended December 31, 2009. For the year ended December 31, 2010, we recorded an impairment charge of $1.0 million against the leasehold improvements of the Porter Drive facility as we determined the facility would not have any future benefits to us after we relocated to a new location. For additional information, see Note 5 to Financial Statements.
3. Cash and Cash Equivalents, Investments and Restricted Investments
The following is a summary of estimated fair value of cash and cash equivalents, investments and restricted investments:
| December 31 | ||||||||
| 2010 | 2009 | |||||||
| (in thousands) | ||||||||
| Certificate of deposits |
$ | 449 | $ | 674 | ||||
| Auction rate securities |
— | 10,380 | ||||||
| US treasuries |
— | 17,095 | ||||||
| US government agencies |
20,734 | — | ||||||
| Cash and money market funds |
2,881 | 12,251 | ||||||
| Total |
$ | 24,064 | $ | 40,400 | ||||
| Reported as: |
||||||||
| Cash and cash equivalents |
$ | 7,768 | $ | 12,251 | ||||
| Short-term investments |
15,847 | 27,475 | ||||||
| Restricted investments |
449 | 674 | ||||||
| Total |
$ | 24,064 | $ | 40,400 | ||||
ARS securities with an aggregate estimated fair value of $10.4 million as of December 31, 2009 were determined as securities held for trading. Accordingly, these securities were carried at estimated fair value, with unrealized gains and losses resulting from changes in fair value reported in earnings. We did not hold any ARS securities at December 31, 2010. All other marketable debt securities continue to be held as available-for-sale.
The following is a summary of amortized cost, unrealized gains and losses and estimated fair value of cash and cash equivalents and marketable debt securities held as available-for-sale.
| December 31, 2010 | ||||||||||||||||
| Amortized Cost |
Gross Unrealized Gains |
Gross Unrealized Losses |
Estimated Fair Value |
|||||||||||||
| (in thousands) | ||||||||||||||||
| Certificate of deposits |
$ | 449 | $ | — | $ | — | $ | 449 | ||||||||
| US government agencies |
20,735 | 2 | (3 | ) | 20,734 | |||||||||||
| Cash and money market funds |
2,881 | — | — | 2,881 | ||||||||||||
| Total |
$ | 24,065 | $ | 2 | $ | (3 | ) | $ | 24,064 | |||||||
| December 31, 2009 | ||||||||||||||||
| Amortized Cost |
Gross Unrealized Gains |
Gross Unrealized Losses |
Estimated Fair Value |
|||||||||||||
| (in thousands) | ||||||||||||||||
| Certificate of deposits |
$ | 674 | $ | — | $ | — | $ | 674 | ||||||||
| US treasuries |
17,097 | 1 | (3 | ) | 17,095 | |||||||||||
| Cash and money market funds |
12,251 | — | — | 12,251 | ||||||||||||
| Total |
$ | 30,022 | $ | 1 | $ | (3 | ) | $ | 30,020 | |||||||
59
Table of Contents
There were no realized gains on sales of available-for-sale investments for the years ended December 31, 2010 and 2009 and $21,000 for the year ended December 31, 2008. Realized gains and losses were calculated based on the specific identification method.
The following tables summarize the gross unrealized losses and fair values for investments in an unrealized loss position for which other-than-temporary impairments were not recognized.
| Less Than 12 Months | 12 Months or Greater | Total | ||||||||||||||||||||||
| December 31, 2010 |
Fair Value |
Unrealized Losses |
Fair Value |
Unrealized Losses |
Fair Value |
Unrealized Losses |
||||||||||||||||||
| (in thousands) | ||||||||||||||||||||||||
| US government agencies |
$ | 8,482 | $ | (3 | ) | $ | — | $ | — | $ | 8,482 | $ | (3 | ) | ||||||||||
| Total |
$ | 8,482 | $ | (3 | ) | $ | — | $ | — | $ | 8,482 | $ | (3 | ) | ||||||||||
| Less Than 12 Months | 12 Months or Greater | Total | ||||||||||||||||||||||
| December 31, 2009 |
Fair Value |
Unrealized Losses |
Fair Value |
Unrealized Losses |
Fair Value |
Unrealized Losses |
||||||||||||||||||
| (in thousands) | ||||||||||||||||||||||||
| US treasuries |
$ | 10,091 | $ | (3 | ) | $ | — | $ | — | $ | 10,091 | $ | (3 | ) | ||||||||||
| Total |
$ | 10,091 | $ | (3 | ) | $ | — | $ | — | $ | 10,091 | $ | (3 | ) | ||||||||||
The following is a summary of the cost and estimated fair value of marketable debt securities, held as available-for-sale at December 31, 2010 and 2009, classified by stated maturity date of the security:
| December 31, 2010 | December 31, 2009 | |||||||||||||||
| Amortized Cost |
Fair Value |
Amortized Cost |
Fair Value |
|||||||||||||
| (in thousands) | ||||||||||||||||
| Mature in less than one year |
$ | 20,735 | $ | 20,734 | $ | 17,097 | $ | 17,095 | ||||||||
| Total |
$ | 20,735 | $ | 20,734 | $ | 17,097 | $ | 17,095 | ||||||||
4. Prepaids and Other Current Assets
Prepaids and other current assets consist of the following:
| December 31, 2010 |
December 31, 2009 |
|||||||
| (in thousands) | ||||||||
| Prepaids |
$ | 643 | $ | 702 | ||||
| UBS Rights relating to ARS |
— | 3,420 | ||||||
| Total |
$ | 643 | $ | 4,122 | ||||
On November 10, 2008, we entered into an agreement with UBS whereby we received the Right, to sell all our ARS held in our UBS account at par value ($18.7 million) to UBS at any time during a two-year period beginning on June 30, 2010 and ending on July 2, 2012.
The enforceability of the Right resulted in a put option which was recognized as a separate freestanding asset and accounted for separately from the ARS investment. On June 10, 2009 and February 12, 2010, UBS elected to repurchase a portion of our ARS under the Rights Agreement at par value of $4.9 million and $4.0 million, respectively. On July 1, 2010, we exercised the Right to sell all our remaining ARS to UBS under the Rights Agreement at par value of $9.8 million. Proceeds from the sale were re-invested in US government agency securities and we did not have any ARS investments in our portfolio as of December 31, 2010.
60
Table of Contents
5. Property and Equipment
Property and equipment consist of the following:
| December 31, |
||||||||
| 2010 | 2009 | |||||||
| (in thousands) | ||||||||
| Computer and lab equipment |
$ | 1,113 | $ | 1,901 | ||||
| Capitalized software |
547 | 547 | ||||||
| Office furniture and equipment |
115 | 447 | ||||||
| Leasehold improvements |
— | 3,363 | ||||||
| 1,775 | 6,258 | |||||||
| Less accumulated depreciation and amortization |
(1,764 | ) | (4,843 | ) | ||||
| Property and equipment, net |
$ | 11 | $ | 1,415 | ||||
As a result of our restructuring plan implemented in February 2009, as described in Note 7 to the Financial Statements, we reclassified certain computers and laboratory equipment that were not in use to held-for-sale and ceased the depreciation of these assets. For the year ended December 31, 2009, we disposed of approximately $6.2 million (at cost) of computer and laboratory equipment with a net book value of $316,000 and recorded a net gain of $343,000 in interest and other income (expense), net. We also recorded an impairment charge of $40,000 against one of our laboratory equipment as we determined that the carrying value exceeded the fair value of this asset. This impairment charge was included in our total operating costs and expenses. We did not have any fixed assets classified as held-for-sale at December 31, 2009 and 2010.
We relocated our principal offices and ceased the use of our facility at 3165 Porter Drive, Palo Alto in November 2010. As a result, we recorded an impairment charge of $1.0 million against the leasehold improvements of the Porter Drive facility which had an original cost of $3.4 million to reflect the excess of carrying value of leasehold improvements over their estimated value which was determined to be zero as the facility would not have any future benefits to us. This impairment charge was included in our facility exit costs in the Statements of Operations. In addition, as a result of our principal offices relocation we disposed of approximately $1.1 million (at cost) of computer and laboratory equipment with a net book value of $36,000 and recorded a net loss in interest and other income (expense), net.
6. Facility Exit Costs
In November 2010, we ceased the use of our facility at 3165 Porter Drive in Palo Alto, California and subleased the facility to a tenant for the remaining contractual term of our master lease, which is through May 2014. As a result, we recorded a charge of $4.7 million which included the estimated fair value of future lease-related payments less estimated net income from sublease rental offset by a reduction of $335,000 in the balance of deferred rent related to the facility as of November 30, 2010. Future lease-related payments and rental income are scheduled to be made and received monthly until the lease and sublease expire in May 2014. All the aforementioned charges were included in the Statement of Operations as facility exit costs.
The following table summarizes the activities related to accrued facility exit costs for the year ended December 31, 2010 (in thousands):
| Balance as of November 30, 2010 |
$ | 4,671 | ||
| Amounts paid |
(309 | ) | ||
| Non-cash accretion |
— | |||
| Balance as of December 31, 2010 |
$ | 4,362 | ||
| Reported as current portion |
$ | 1,439 | ||
| Reported as noncurrent portion |
$ | 2,923 |
61
Table of Contents
7. Restructuring Plans
We implemented several restructuring plans in the past years to reduce our operating expenses and to streamline our infrastructure to focus on our most advanced preclinical and clinical development programs. For the restructuring plan implemented in September 2008, we reduced our workforce by seven positions and accrued a restructuring charge of $199,000, including employee severance costs and health benefits. All amounts were paid prior to December 31, 2008 except for $1,000 of accrued health benefits which was paid in the first quarter of 2009.
For the restructuring plan implemented in February 2009, we reduced our workforce by 37 positions and recorded a charge of approximately $951,000 for the year ended December 31, 2009. We paid $750,000 in the quarter ended March 31, 2009, $111,000 in the quarter ended June 30, 2009 and $90,000 in the quarter ended September 30, 2009, as severance, payroll taxes and other personnel related costs.
For the restructuring plan implemented in November 2010, we reduced our workforce by eleven positions and accrued a restructuring charge of $425,000, including employee severance costs, health benefits and personnel related costs. We paid $232,000 in December 2010 resulting in an accrued balance of approximately $193,000 as of December 31, 2010.
8. Notes Payable and Commitments
Notes Payable
In connection with our acceptance of the offer to enter into the agreement with UBS whereby we received the Right to sell all our ARS at par value to UBS at any time during a two-year period beginning on June 30, 2010 and ending on July 2, 2012, UBS made available to us “no net cost” loans up to 75% of the market value of our ARS. A “no net cost loan” as defined in the Rights Agreement means that the loan would bear interest at a rate equal to the average rate of interest paid or deemed paid to Telik on the pledged ARS such that the interest cost, net of interest received by us on the pledged ARS, would be zero. The “no net cost” loans had to be repaid upon commencement of the exercise of the Right. According to the Rights Agreement, the loan was payable on demand. If UBS exercised its discretionary right to demand repayment of any portion of the loan prior to the date we could exercise our repurchase rights, UBS and certain of its affiliates would arrange for alternative financing on terms and conditions substantially the same as those contained in the loan, and if alternative financing could not be established, then UBS or one of its affiliates would purchase our pledged ARS at par. UBS’ obligation to arrange such alternative financing did not apply under certain circumstances, including, but not limited to, if we sold the ARS pledged as collateral. Proceeds of sales of our ARS would first be applied to repayment of the credit line with the balance, if any, for our account.
On December 31, 2008, we entered into a loan agreement with UBS and drew down $8 million with our ARS pledged as collateral. On June 10, 2009 and February 12, 2010, UBS elected to repurchase a portion of our ARS under the Rights Agreement at par value of $4.9 million and $4.0 million, respectively. Proceeds from both sales of our ARS were applied to repayment of the credit line whereby $4.9 million was paid in June 2009 leaving a balance of $3.1 million which was paid in full in February 2010. For the year ended December 31, 2010, interest paid on the loan was approximately $6,000 which was offset entirely by interest earned on the pledged securities.
Operating Leases
In November 2010, we entered into a 28-month lease agreement for 8,620 square feet of office space at 700 Hansen Way in Palo Alto, California and relocated our corporate offices to this facility.
We also lease approximately 92,000 square feet located at 3165 Porter Drive in Palo Alto, California, which we have subleased to a tenant effective November 2010 through May 2014 when our master lease expires. Pursuant to the terms of the lease, we are required to maintain a security deposit, in the form of a letter of credit
62
Table of Contents
equal to approximately $449,000. This letter of credit must be secured by either a deposit account or a securities account and at December 31, 2010 the security deposit is in the form of securities that are classified in the balance sheet as restricted investments. This collateral account is managed in accordance with our investment policy, and is restricted as to withdrawal.
We also have an office equipment lease of approximately $73,000 with a remaining term of 31 months.
Future minimum rental payments under our non-cancelable operating leases as of December 31, 2010 are as follows:
| Operating Leases | ||||
| (in thousands) | ||||
| Years ending December 31, |
||||
| 2011 |
4,242 | |||
| 2012 |
4,370 | |||
| 2013 |
3,685 | |||
| 2014 |
1,537 | |||
| 2015 |
— | |||
| Total future minimum rental payments |
13,834 | |||
| Less aggregate future minimum rentals to be received from subleases |
(8,421 | ) | ||
| Total |
$ | 5,413 | ||
Rent expense under operating leases was approximately $3.4 million in 2010 and $3.7 million in 2009 and 2008.
9. Stockholders’ Equity
Stockholder Rights Plan
In October 2001, our Board of Directors approved the adoption of a Stockholder Rights Plan, which provided for the distribution of one preferred share purchase right (a “Right”) for each outstanding share of common stock of the Company. The dividend was paid on November 14, 2001 to the stockholders of record on that date. Each Right entitles the registered holder to purchase from the Company one one-hundredth of a share of Series A Junior Participating Preferred Stock, par value $0.01 per share (the “Preferred Shares”), at a price of $90.00 per one one-hundredth of a Preferred Share (the “Purchase Price”), subject to adjustment. The Rights will be exercisable the earlier of (i) the date of a public announcement that a person, entity or group of affiliated or associated persons have acquired beneficial ownership of 20% or more of the outstanding common shares (an “Acquiring Person”), or (ii) ten business days (or such later date as may be determined by action of the Board of Directors prior to such time as any person or entity becomes an Acquiring Person) following the commencement of, or announcement of an intention to commence, a tender offer or exchange offer the consummation of which would result in any person or entity becoming an Acquiring Person. In May 2006, we amended the stockholder rights plan to exclude Eastbourne Capital Management, L.L.C., or Eastbourne, and certain related persons and entities from the definition of Acquiring Person so long as neither Eastbourne nor its affiliates or associates, either individually or in the aggregate, becomes the beneficial owner of 25% or more of the common stock then outstanding. On December 11, 2006, the plan was further amended to increase this threshold to 30%.
In the event that any person, entity or group of affiliated or associated persons become an Acquiring Person, each holder of a Right will have the right to receive, upon exercise, the number of common shares having a market value of two times the exercise price of the Right. In the event that the Company is acquired in a merger or other business combination transaction or 50% or more of its consolidated assets or earning power are sold to an Acquiring Person, its associates or affiliates or certain other persons in which such persons have an interest, each holder of a Right will have the right to receive, upon the exercise at the then-current exercise price of the
63
Table of Contents
Right, that number of shares of common stock of the acquiring company which at the time of such transaction will have a market value of two times the exercise price of the Right. At any time after an Acquiring Person becomes an Acquiring Person and prior to the acquisition by such Acquiring Person of 50% or more of the outstanding common shares, the Board of Directors of the Company may exchange the Rights (other than Rights owned by such person or group which have become void), in whole or in part, at an exchange ratio of one common share, or one one-hundredth of a Preferred Share, per Right (or, at the election of the Company, the Company may issue cash, debt, stock or a combination thereof in exchange for the Rights), subject to adjustment. The Rights will expire on November 14, 2011, unless redeemed or exchanged by the Company.
2000 Equity Incentive Plan
In March 2000, we adopted the 2000 Equity Incentive Plan (the “2000 Plan”) and reserved 2,000,000 shares of Telik common stock for issuance under the 2000 Plan. In addition, the 2000 Plan provides for annual increases in the number of shares available for issuance under the 2000 Plan beginning January 1, 2001. The number of additional shares to be reserved automatically will be equal to the lesser of 1,500,000 shares, 5% of the outstanding shares on the date of the annual increase or such amount as may be determined by the Board of Directors. Options granted under the 2000 Plan may be either incentive stock options (“ISOs”) or nonstatutory stock options (“NSOs”). For ISOs and NSOs, the option price shall be at least 100% and 85%, respectively, of the closing price of our common stock on the date of the grant. If, at any time we grant an option, and the optionee directly or by attribution owns stock possessing more than 10% of the total combined voting power of all classes of stock of Telik, the option price shall be at least 110% of the fair value and shall not be exercisable more than five years after the date of grant. Options generally vest over a period of two or four years from the date of grant. We have also granted performance-based options which will only vest when our Board of Directors determines we have achieved the specific performance goals. As of December 31, 2010, there are 1.2 million shares of performance-based options to be recognized when or if it is probable the specific performance goals are achieved. Options granted under the 2000 Plan expire no later than 10 years from the date of grant. The 2000 Plan terminated in March 2010. There were 11.4 million stock option shares (including performance-based options) which had been granted prior to the plan’s expiration remaining outstanding as of December 31, 2010.
2000 Non-Employee Directors’ Stock Option Plan
In March 2000, we adopted the 2000 Non-Employee Directors’ Stock Option Plan (the “Directors’ Plan”) and reserved a total of 300,000 shares of common stock for issuance thereunder. In May 2006, our stockholders approved an increase in the number of shares of common stock authorized for issuance under the Directors’ Plan by an additional 300,000 shares. Each non-employee director at the initial public offering date was granted a NSO to purchase 20,000 shares of common stock, and each non-employee director who subsequently becomes a director of Telik will be automatically granted a NSO to purchase 20,000 shares of common stock on the date on which such person first becomes a director. On February 20, 2008, our board of directors amended the Directors’ Plan such that upon the day immediately following each annual stockholder meeting each non-employee director will automatically be granted a NSO to purchase 10,000 shares of common stock or an option to purchase an amount of shares prorated for the part of the year served as non-employee director. The exercise price of options under the Directors’ Plan will be equal to the fair market value of the common stock on the date of grant. The maximum term of the options granted under the Directors’ Plan is ten years. All grants under the Directors’ Plan will vest over a period of four years from date of grant, one fourth vesting one year after the date of the grant and thereafter the balance vesting monthly. The Directors’ Plan terminated in March 2010. There were 245,000 stock option shares which had been granted prior to the plan’s expiration remaining outstanding as of December 31, 2010.
2000 Employee Stock Purchase Plan
In March 2000, we adopted the 2000 Employee Stock Purchase Plan (the “Purchase Plan”). We reserved a total of 250,000 shares of our common stock for issuance under the Purchase Plan. In addition, the Purchase Plan
64
Table of Contents
provides for annual increases in the number of shares available for issuance under the Purchase Plan beginning January 1, 2001. The number of additional shares to be reserved automatically will be equal to the lesser of 150,000 shares, 1% of the outstanding shares on the date of the annual increase or such amount as may be determined by the Board of Directors. The Purchase Plan permits eligible employees to purchase common stock at a discount through payroll deductions during defined offering periods. The price at which the stock is purchased is equal to the lower of 85% of the fair market value of the common stock on the first day of the offering or 85% of the fair market value of our common stock on the purchase date. The weighted average per share fair value for stock purchase offerings under our Purchase Plan during 2009 and 2008 was $0.35, and $0.46. There were no new stock purchase offerings in 2010 under our Purchase Plan.
Reserved Shares
At December 31, 2010, shares of common stock reserved for future issuance is as follows:
| 2000 Equity incentive plan |
11,383,030 | |||
| 2000 Non-employee directors’ stock option plan |
245,000 | |||
| 2000 Employee stock purchase plan |
673,460 | |||
| 12,301,490 | ||||
Stock Option Plan Activity Summary
A summary of activity under our stock option plans is as follows:
| Shares Available for Grant |
Number of Options Outstanding |
Weighted average exercise price per share |
Weighted average remaining contractual term (in years) |
Aggregate intrinsic value (in thousands) |
||||||||||||||||
| Balance, December 31, 2007 |
3,547,626 | 9,059,216 | $ | 12.39 | ||||||||||||||||
| Authorized |
1,500,000 | — | — | |||||||||||||||||
| Granted |
(2,681,500 | ) | 2,681,500 | $ | 1.97 | |||||||||||||||
| Exercised |
— | (190,125 | ) | $ | 1.60 | |||||||||||||||
| 1996 Plan Shares Expired |
(139,546 | ) | — | $ | 1.60 | |||||||||||||||
| Forfeited or expired |
1,511,079 | (1,511,079 | ) | $ | 10.92 | |||||||||||||||
| Balance, December 31, 2008 |
3,737,659 | 10,039,512 | $ | 10.04 | ||||||||||||||||
| Authorized |
1,500,000 | — | — | |||||||||||||||||
| Granted |
(4,648,000 | ) | 4,648,000 | $ | 0.79 | |||||||||||||||
| 1996 Plan Shares Expired |
(178,097 | ) | — | $ | 1.61 | |||||||||||||||
| Forfeited or expired |
2,090,574 | (2,090,574 | ) | $ | 7.82 | |||||||||||||||
| Balance, December 31, 2009 |
2,502,136 | 12,596,938 | $ | 6.99 | ||||||||||||||||
| 1996 Plan Shares Expired |
(150,328 | ) | — | $ | 2.00 | |||||||||||||||
| 2000 Plan Shares Expired |
(4,514,257 | ) | — | (a | ) | |||||||||||||||
| 2000 Directors’ Plan Shares Expired |
(306,459 | ) | — | (b | ) | |||||||||||||||
| Authorized |
1,500,000 | — | — | |||||||||||||||||
| Forfeited or expired |
968,908 | (968,908 | ) | $ | 3.53 | |||||||||||||||
| Outstanding at December 31, 2010 |
— | 11,628,030 | $ | 7.28 | ||||||||||||||||
| Exercisable at December 31, 2010 |
8,520,796 | $ | 9.46 | 4.55 | $ | 11 | ||||||||||||||
| (a) | 2000 Plan terminated in March 2010. As of December 31, 2010, 4,514,257 shares expired of which 818,580 shares were from canceled stock options with a weighted average exercise price of $3.81. |
| (b) | 2000 Directors’ Plan terminated in March 2010. All shares available for grant under this plan expired. |
65
Table of Contents
The weighted average fair value of options granted during 2009 and 2008 was $0.62 and $1.36. There were no options granted in 2010. There were no options exercised during the year ended December 31, 2010 and 2009. The total intrinsic value of options exercised during the year ended December 31, 2008 was $131,000. The total fair value of shares vested during the years ended December 31, 2010, 2009 and 2008 was $1.9 million, $3.2 million and $12.3 million.
The following table summarizes information about the stock options outstanding at December 31, 2010 (in thousands, except years and per-share amounts):
| Options Outstanding | Options Exercisable | |||||||||||||||||||||||||||
| Range of Exercise Price |
Number of Shares |
Weighted Average Remaining Contractual Life (in years) |
Weighted Average Exercise Price per Share |
Aggregate Intrinsic Value |
Number of Shares |
Weighted Average Exercise Price per Share |
Aggregate Intrinsic Value |
|||||||||||||||||||||
| $ 0.24 – $ 0.79 |
4,275 | 8.44 | $ | 0.78 | $ | 23 | 1,893 | $ | 0.78 | $ | 11 | |||||||||||||||||
| $ 0.80 – $ 2.03 |
100 | 7.69 | $ | 1.40 | — | 63 | $ | 1.42 | — | |||||||||||||||||||
| $ 2.04 – $ 3.02 |
1,594 | 6.34 | $ | 2.20 | — | 1,015 | $ | 2.20 | — | |||||||||||||||||||
| $ 3.03 – $ 5.77 |
324 | 1.80 | $ | 3.92 | — | 316 | $ | 3.92 | — | |||||||||||||||||||
| $ 5.78 – $ 7.20 |
1,229 | 5.47 | $ | 5.92 | — | 1,153 | $ | 5.93 | — | |||||||||||||||||||
| $ 7.21 – $11.00 |
874 | 0.94 | $ | 10.56 | — | 874 | $ | 10.56 | — | |||||||||||||||||||
| $11.01 – $16.36 |
859 | 2.27 | $ | 12.55 | — | 834 | $ | 12.48 | — | |||||||||||||||||||
| $16.37 – $24.13 |
2,373 | 3.34 | $ | 20.69 | — | 2,373 | $ | 20.69 | — | |||||||||||||||||||
| $ 0.24 – $24.13 |
11,628 | 5.59 | $ | 7.28 | $ | 23 | 8,521 | $ | 9.46 | $ | 11 | |||||||||||||||||
Stock-Based Compensation under ASC 718
Employee stock-based compensation expenses recognized in the years ended December 31, 2010, 2009 and 2008 were calculated based on awards ultimately expected to vest and have been reduced for estimated forfeitures. ASC 718 requires forfeitures to be estimated at the time of grant and revised, if necessary, in subsequent periods if actual forfeitures differ from those estimates. Our forfeiture rate for years 2010, 2009 and 2008 was at 15.7%.
Total estimated stock-based compensation expense, related to all of our share-based payment awards, recognized under ASC 718 comprised of the following:
| Years Ended December 31, | ||||||||||||
| 2010 | 2009 | 2008 | ||||||||||
| (in thousands) | ||||||||||||
| Research and development |
$ | 852 | $ | 420 | $ | 3,686 | ||||||
| General and administrative |
1,240 | 1,811 | 2,597 | |||||||||
| Stock-based compensation expense before taxes |
2,092 | 2,231 | 6,283 | |||||||||
| Related income tax benefits |
— | — | — | |||||||||
| Effect on net loss |
$ | 2,092 | $ | 2,231 | $ | 6,283 | ||||||
Because we had a net operating loss carryforward as of December 31, 2010, no tax benefits for the tax deductions related to stock-based compensation expense were recognized in our Statements of Operations. Additionally, no incremental tax benefits were recognized from stock options exercised in the years ended December 31, 2010, 2009 and 2008, which would have resulted in a reclassification to reduce net cash provided by operating activities with an offsetting increase in net cash provided by financing activities. As of December 31, 2010, $1.2 million of total unrecognized compensation costs, net of forfeitures, related to non-vested awards was expected to be recognized over a weighted average period of 1.05 years.
66
Table of Contents
Valuation assumptions
Assumptions used in the Black-Scholes model were as follows:
| Stock Option Plans | Stock Purchase Plan | |||||||||||||||||||||||
| 2010 | 2009 | 2008 | 2010 | 2009 | 2008 | |||||||||||||||||||
| Weighted average expected stock price volatility |
N/A | 99.8 | % | 76.8 | % | N/A | 140.3 | % | 90.8 | % | ||||||||||||||
| Weighted average risk-free interest rate |
N/A | 2.65 | % | 3.00 | % | N/A | 0.67 | % | 2.14 | % | ||||||||||||||
| Weighted average expected life (in years) |
N/A | 5.65 | 6.08 | N/A | 1.25 | 1.25 | ||||||||||||||||||
| Weighted average expected dividend yield |
— | — | — | — | — | — | ||||||||||||||||||
10. Income Taxes
We have incurred net losses since inception and, consequently, have not recorded any U.S. federal and state income taxes.
The provision for income taxes differs from the expected tax expense computed by applying the statutory federal income tax rate to loss before taxes as follows:
| Years Ended December 31, | ||||||||||||
| 2010 | 2009 | 2008 | ||||||||||
| (in thousands) | ||||||||||||
| Tax at Federal statutory rate |
$ | (8,406 | ) | $ | (8,056 | ) | $ | (10,799 | ) | |||
| State tax, net of federal income tax benefit |
(1,424 | ) | (1,377 | ) | (1,848 | ) | ||||||
| Research and development credit |
(239 | ) | (601 | ) | (1,026 | ) | ||||||
| Un-benefitted losses |
10,324 | 9,909 | 13,025 | |||||||||
| Other individually immaterial items |
(255 | ) | 125 | 648 | ||||||||
| Provision for taxes |
$ | — | $ | — | $ | — | ||||||
Deferred income taxes reflect the net tax effects of net operating loss and tax credit carryovers and temporary differences between the carrying amounts of assets and liabilities for financial reporting purposes and the amounts used for income tax purposes. Significant components of our deferred tax assets are as follows:
| December 31, | ||||||||
| 2010 | 2009 | |||||||
| (in thousands) | ||||||||
| Deferred tax assets |
||||||||
| Net operating loss carryforwards (1) |
$ | 87,555 | $ | 80,535 | ||||
| Tax credits carryforwards (1) |
10,871 | 10,898 | ||||||
| Capitalized research expenses |
8,798 | 10,320 | ||||||
| Stock based compensation |
8,070 | 7,322 | ||||||
| Other |
2,198 | 1,342 | ||||||
| Total deferred tax assets (1) |
117,492 | 110,417 | ||||||
| Valuation allowance (1) |
(117,492 | ) | (110,417 | ) | ||||
| Net deferred tax assets |
$ | — | $ | — | ||||
| (1) | Amounts at December 31, 2009 have been revised to reflect that certain carryforwards that may not be available in future periods. See further discussion below. |
Realization of deferred tax assets is dependent upon the generation of future taxable income, the timing and amount of which are uncertain. Accordingly, the net deferred tax assets have been fully offset by a valuation allowance. The valuation allowance increased by $7.1 million, $10.7 million and $10.0 million at December 31, 2010, 2009 and 2008 respectively.
67
Table of Contents
As of December 31, 2010, we had U.S. federal and state net operating losses of approximately $237.5 million and $117.1 million. If not utilized, these carryforwards will begin to expire beginning in 2011 and 2012 for federal and state purposes, respectively. Approximately $10.5 million of the federal and $8.2 million of the state net operating loss carryforwards represents the stock option deduction arising from activity under our stock option plan, the benefit of which will increase additional paid in capital when realized.
We have research credit carryforwards of approximately $6.6 million and $6.5 million for federal and state income tax purposes. If not utilized, the federal credit will expire at various dates beginning in 2011 through 2030. California state research and development credits can be carried forward indefinitely.
Utilization of net operating loss carryforwards and tax credit carryforwards are subject to annual limitation due to the ownership change limitations provided by the Internal Revenue Code and similar state provisions. Such an annual limitation may result in the expiration of the net operating losses and credits before utilization. In 2010, an analysis was performed to assess if there was an ownership change within the meaning of the Internal Revenue Code and any limitation on the availability of tax attributes carryforwards. Based on this analysis, we concluded that due to ownership change limitations a portion of our carryforwards may not be available to offset future taxable income or tax. Accordingly, the net operating loss carryforwards and tax credit carryforwards at December 31, 2009 and 2010 were decreased by $212.4 million and $14.1 million, respectively for federal purposes and the net operating loss carryforwards at December 31, 2009 and 2010 decreased by $158.0 million for state purposes. Ownership change may have occurred during January 1, 2006 through December 31, 2010. Accordingly, amounts at December 31, 2009 have been changed. In the event we have additional changes in ownership, utilization of the carryforwards could be further significantly restricted and a substantial portion of our net operating losses and credits may never be available to offset taxable income or tax.
Effective January 1, 2007, we adopted ASC 740-10-25. This interpretation clarifies the criteria for recognizing income tax benefits under ASC 740, “Accounting for Income Taxes,” and requires additional disclosures about uncertain tax positions. Under ASC 740-10-25 the financial statement recognition of the benefit for a tax position is dependent upon the benefit being more likely than not to be sustainable upon audit by the applicable taxing authority. If this threshold is met, the tax benefit is then measured and recognized at the largest amount that is greater than 50 percent likely of being realized upon ultimate settlement. Upon adoption of ASC 740-10-25 on January 1, 2007, we recognized a $14.2 million increase in our liability for unrecognized income tax benefits, and did not recognize a decrease to Retained Earnings. A reconciliation of the beginning and ending amount of the consolidated liability for unrecognized income tax benefits during the twelve-month period ended December 31, 2010 is as follows:
| 2010 | 2009 | |||||||
| (in thousands) | ||||||||
| Balance at January 1 |
$ | 9,954 | $ | 11,022 | ||||
| Additions for tax positions of prior years |
(961 | ) | (4,065 | ) | ||||
| Additions for tax positions related to 2008 |
221 | 278 | ||||||
| Reductions for tax positions of prior years |
NIL | 2,719 | ||||||
| Settlements during the current year |
NIL | NIL | ||||||
| Balance at December 31 |
$ | 9,214 | $ | 9,954 | ||||
Interest and penalty costs related to unrecognized tax benefits are classified as a component of “Income Tax Expense” in the accompanying statement of operations and the corresponding liability in “Income Taxes Payable” or “Prepaid Income Taxes” in the accompanying balance sheet. We, however, did not recognize any interest expense related to unrecognized tax benefits for the year ended December 31, 2010.
We file income tax returns in the U.S. federal jurisdiction and various state jurisdictions. We are subject to U.S. federal income tax examination for calendar tax years ending 2007 through 2010. Additionally, we are subject to various state income tax examinations for the 2006 through 2010 calendar tax years. The federal and
68
Table of Contents
U.S. state taxing authorities may choose to audit tax returns for tax years beyond the statue of limitation period due to significant tax attribute carryforwards from prior years, making adjustments only to carryforward attributes. In April 2009 the Internal Revenue Service completed its audit on our U.S. federal income tax return for the 2005 calendar tax year which did not result in any significant adjustments.
11. Subsequent Event
On February 10, 2011, we received a notice from Nasdaq indicating that for the preceding, ten consecutive business days, the closing bid price of our common stock was $1.00 per share or greater and we have regained compliance with the $1.00 per share minimum bid price requirement.
12. Quarterly Financial Information (unaudited)
Selected quarterly financial information is summarized below (in thousands except per share amounts):
SELECTED QUARTERLY FINANCIAL INFORMATION
| 2010 | 2009 | |||||||||||||||||||||||||||||||
| Quarter ended |
Dec. 31 | Sep. 30 | Jun. 30 | Mar. 31 | Dec. 31 | Sep. 30 | Jun. 30 | Mar. 31 | ||||||||||||||||||||||||
| Total revenues |
$ | — | $ | — | $ | — | $ | — | $ | — | $ | — | $ | — | $ | — | ||||||||||||||||
| Operating costs and expenses: |
||||||||||||||||||||||||||||||||
| Research and development |
2,838 | 2,569 | 2,808 | 2,825 | 2,295 | 3,416 | 3,022 | 3,990 | ||||||||||||||||||||||||
| General and administrative |
2,374 | 2,101 | 2,197 | 2,558 | 1,965 | 2,759 | 3,199 | 2,887 | ||||||||||||||||||||||||
| Facility exit costs |
5,360 | — | — | — | — | — | — | — | ||||||||||||||||||||||||
| Restructuring costs (1) |
425 | — | — | — | — | — | 83 | 868 | ||||||||||||||||||||||||
| Total operating costs and expenses |
10,997 | 4,670 | 5,005 | 5,383 | 4,260 | 6,175 | 6,304 | 7,745 | ||||||||||||||||||||||||
| Loss from operations |
(10,997 | ) | (4,670 | ) | (5,005 | ) | (5,383 | ) | (4,260 | ) | (6,175 | ) | (6,304 | ) | (7,745 | ) | ||||||||||||||||
| Interest and other income (expense), net (2) |
1,201 | 17 | 59 | 56 | 60 | 68 | 623 | 40 | ||||||||||||||||||||||||
| Net loss |
$ | (9,796 | ) | $ | (4,653 | ) | $ | (4,946 | ) | $ | (5,327 | ) | $ | (4,200 | ) | $ | (6,107 | ) | $ | (5,681 | ) | $ | (7,705 | ) | ||||||||
| Net loss per share, basic and diluted (3) |
$ | (0.18 | ) | $ | (0.09 | ) | $ | (0.09 | ) | $ | (0.10 | ) | $ | (0.08 | ) | $ | (0.11 | ) | $ | (0.11 | ) | $ | (0.14 | ) | ||||||||
| Weighted average shares used in computing net loss per share, basic and diluted |
53,614 | 53,553 | 53,522 | 53,465 | 53,430 | 53,381 | 53,356 | 53,314 | ||||||||||||||||||||||||
| (1) | Restructuring charges in 2010 related to workforce reduction by 11 positions or 28% of our workforce. Restructuring charges in 2009 related to workforce reduction by 37 positions or 45% of our workforce. |
| (2) | Interest and other income (expense), net in 2010 includes US Government Qualifying Therapeutic Discovery Project grants of $1.2 million received in the fourth quarter of 2010. |
| (3) | Net loss per share for each quarter are calculated as a discrete period; the sum of four quarters may not equal the calculated full year amount. |
69
Table of Contents
Exhibit Index
| Exhibit |
Description | |||
| 3.1 | Amended and Restated Certificate of Incorporation. (2) | |||
| 3.2 | Amended and Restated Bylaws. (13) | |||
| 4.1 | Specimen Common Stock Certificate. (1) | |||
| 4.2 | Rights Agreement dated November 2, 2001, by and between Telik and Wells Fargo Bank Minnesota, N.A., replaced by EquiServe Trust Company, N.A. as Rights Agent. (5) | |||
| 4.3 | Registrant’s Certificate of Designation of Series A Junior Participating Preferred Stock. (5) | |||
| 4.4 | Agreement, by and among Telik, Eastbourne Capital Management, L.L.C., Black Bear Offshore Master Fund, L.P., Black Bear Fund I, L.P., Black Bear Fund II, L.L.C., and Richard J. Barry, dated May 18, 2006. (9) | |||
| 4.5 | Amendment to Rights Agreement between Telik and Computershare Shareholder Services, Inc. and Computershare Trust Company, N.A., dated May 18, 2006. (11) | |||
| 4.6 | Second Amendment to Rights Agreement between Telik and Computershare Shareholder Services, Inc. and Computershare Trust Company, N.A., dated December 11, 2006. (10) | |||
| 4.7 | Amended and Restated Standstill Agreement between Telik and Eastbourne Capital Management, L.L.C. and certain related persons and entities, dated December 11, 2006. (10) | |||
| 10.1 | Form of Indemnity Agreement. (1) (3) | |||
| 10.2 | 2000 Equity Incentive Plan and related documents. (3) (4) | |||
| 10.3 | 2000 Employee Stock Purchase Plan and Offering. (3) (4) | |||
| 10.4 | 2000 Non-Employee Directors’ Stock Option Plan and Agreement. (3) (14) | |||
| 10.5 | 1996 Stock Option Plan and forms of grant thereunder. (3) (4) | |||
| 10.6 | 1988 Stock Option Plan and forms of grant thereunder. (3) (4) | |||
| 10.7 | Form of Non-Plan Stock Option Agreement. (3) (4) | |||
| 10.8 | Telik, Inc. Executive Officer Bonus Plan. (3) (12) | |||
| 10.9 | Amended and Restated Employment Agreement between Michael M. Wick, M.D., Ph.D. and Telik, dated December 17, 2008, as amended. (3) (15) | |||
| 10.10 | Lease between Telik and The Board of Trustees of the Leland Stanford Junior University, dated July 25, 2002. (6) | |||
| 10.11 | * | Manufacturing Supply Agreement dated July 1, 2004, by and between Telik and Organichem Corporation. (7) | ||
| 10.12 | Telik, Inc. Change of Control Severance Benefit Plan, dated February 21, 2003, amended December 17, 2008. (3) (15) | |||
| 10.13 | Bonuses for Fiscal Year 2009 for Named Executive Officers. (3) (12) | |||
| 10.14 | Transition and Release Agreement between Telik, Inc. and Dr. Stefan Ryser, Ph.D., dated as of June 12, 2009. (3) (16) | |||
| 14.1 | Telik, Inc. Code of Conduct. (8) | |||
| 23.1 | Consent of Independent Registered Public Accounting Firm. | |||
| 24.1 | Power of Attorney (included on the signature pages hereto) | |||
| 31.1 | Certification required by Rule 13a-14(a) or Rule 15d-14(a). | |||
| 31.2 | Certification required by Rule 13a-14(a) or Rule 15d-14(a). | |||
| 32.1 | Certification required by Rule 13a-14(b) or Rule 15d-14(b) and Section 1350 of Chapter 63 of Title 18 of the United States Code (18 U.S.C. 1350). | |||
Table of Contents
| * | Confidential treatment has been granted for portions of this document. The information omitted pursuant to such confidential treatment order has been filed separately with the Securities and Exchange Commission. |
| (1) | Incorporated by reference to exhibits to our Registration Statement on Form S-1, filed on April 3, 2000, as amended (File No. 333-33868). |
| (2) | Incorporated by reference to exhibits to our Annual Report on Form 10-K for the year ended December 31, 2001, as filed on March 27, 2002. |
| (3) | Management contract or compensatory arrangement. |
| (4) | Incorporated by reference to exhibits to our Registration Statement on Form S-8, as filed on August 30, 2000 (File No. 333-44826). |
| (5) | Incorporated by reference to exhibits to our Current Report on Form 8-K dated November 2, 2001, as filed on November 5, 2001. |
| (6) | Incorporated by reference to exhibits to our Quarterly Report on Form 10-Q for the quarterly period ended September 30, 2002, as filed on November 13, 2002. |
| (7) | Incorporated by reference to exhibits to our Quarterly Report on Form 10-Q for the quarterly period ended September 30, 2004, as filed on November 8, 2004. |
| (8) | Incorporated by reference to exhibits to our Annual Report on Form 10-K for the year ended December 31, 2003, as filed on March 5, 2004. |
| (9) | Incorporated by reference to exhibits to our Quarterly Report on Form 10-Q for the quarterly period ended June 30, 2006, as filed on August 3, 2006. |
| (10) | Incorporated by reference to exhibits to our Current Report on Form 8-K dated December 11, 2006, as filed on December 12, 2006. |
| (11) | Incorporated by reference to Exhibit A to Exhibit 10.2 to our Quarterly Report on Form 10-Q for the quarterly period ended June 30, 2006, as filed on August 3, 2006. |
| (12) | Incorporated by reference to Exhibit 10.8 to our Annual Report on Form 10-K for the year ended December 31, 2006, as filed on February 28, 2007. |
| (13) | Incorporated by reference to Exhibit 3.2 to our Current Report on Form 8-K dated December 11, 2007, as filed on December 14, 2007. |
| (14) | Incorporated by reference to Exhibit 10.4 to our Annual Report on Form 10-K for the year ended December 31, 2007, as filed on March 3, 2008. |
| (15) | Incorporated by reference to exhibits to our Current Report on Form 8-K dated December 17, 2008, as filed on December 23, 2008. |
| (16) | Incorporated by reference to Exhibit 10.20 to our Quarterly Report on Form 10-Q for the quarterly period ended June 30, 2009, as filed on August 6, 2009. |