Attached files
| file | filename |
|---|---|
| EX-23.1 - STAAR SURGICAL CO | v213096_ex23-1.htm |
| EX-32.1 - STAAR SURGICAL CO | v213096_ex32-1.htm |
| EX-31.2 - STAAR SURGICAL CO | v213096_ex31-2.htm |
| EX-31.1 - STAAR SURGICAL CO | v213096_ex31-1.htm |
UNITED STATES SECURITIES AND EXCHANGE COMMISSION
Washington, D.C. 20549
Form 10-K
(Mark One)
|
þ
|
ANNUAL REPORT PURSUANT TO SECTION 13 OR 15(d) OF THE SECURITIES EXCHANGE ACT OF 1934
|
|
For the fiscal year ended December 31, 2010
|
|
|
or
|
|
|
o
|
TRANSITION REPORT PURSUANT TO SECTION 13 OR 15(d) OF THE SECURITIES EXCHANGE ACT OF 1934
|
|
For the Transition period from to
|
Commission file number: 0-11634
STAAR SURGICAL COMPANY
(Exact name of registrant as specified in its charter)
|
Delaware
|
95-3797439
|
|
(State or other jurisdiction of
incorporation or organization)
|
(I.R.S. Employer
Identification No.)
|
1911 Walker Avenue 91016
Monrovia, California
(Address of principal executive offices)
(626) 303-7902
(Registrant’s telephone number, including area code)
Securities registered pursuant to Section 12(b) of the Act:
|
(Title of each class)
|
(Name of each exchange on which registered)
|
|
Common Stock, $0.01 par value
|
Nasdaq Global Market
|
Securities registered pursuant to Section 12(g) of the Act: None
Indicate by check mark if the registrant is a well-known seasoned issuer, as defined in Rule 405 of the Securities Act. Yes o No þ
Indicate by check mark if the registrant is not required to file reports pursuant to Section 13 or Section 15(d) of the Act. Yes o No þ
Indicate by check mark whether the registrant (1) has filed all reports required to be filed by Section 13 or 15(d) of the Securities Exchange Act of 1934 during the preceding 12 months (or for such shorter period that the registrant was required to file such reports), and (2) has been subject to such filing requirements for the past 90 days. Yes þ No o
Indicate by check mark whether the registrant has submitted electronically and posted on its corporate Web site, if any, every Interactive Data File required to be submitted and posted pursuant to Rule 405 of Regulation S-T during the preceding 12 months (or for such shorter period that the registrant was required to submit and post such files). Yes o No o
Indicate by check mark if disclosure of delinquent filers pursuant to Item 405 of Regulation S-K is not contained herein, and will not be contained, to the best of registrant’s knowledge, in definitive proxy or information statements incorporated by reference in Part III of this Form 10-K or any amendment to this Form 10-K. o
Indicate by check mark whether the registrant is a large accelerated filer, an accelerated filer, a non-accelerated filer, or a smaller reporting company. See the definitions of “large accelerated filer,” “accelerated filer” and “smaller reporting company” in Rule 12b-2 of the Exchange Act. (Check one):
|
o Large accelerated filer
|
þ Accelerated filer
|
o Non-accelerated filer
|
o Smaller reporting company
|
|
(Do not check if a smaller reporting company)
|
Indicate by check mark whether the registrant is a shell company (as defined in Rule 12b-2 of the Act). Yes o No þ
The aggregate market value of the voting and non-voting common equity held by non-affiliates of the registrant as of July 2, 2010, the last business day of the registrant’s most recently completed second fiscal quarter, was approximately $162,232,000 based on the closing price per share of $5.76 of the registrant’s Common Stock on that date.
The number of shares outstanding of the registrant’s Common Stock as of March 1, 2011 was 35,270,846.
DOCUMENTS INCORPORATED BY REFERENCE
Portions of the registrant’s definitive proxy statement relating to its 2010 annual meeting of stockholders, which will be filed with the Securities and Exchange Commission pursuant to Regulation 14A within 120 days of the close of the registrant’s last fiscal year, are incorporated by reference into Part III of this report.
STAAR SURGICAL COMPANY
TABLE OF CONTENTS
PART 1
|
Page
|
|||
|
ITEM 1.
|
BUSINESS
|
2
|
|
|
ITEM 1A.
|
RISK FACTORS
|
18
|
|
|
ITEM 1B.
|
UNRESOLVED STAFF COMMENTS
|
25
|
|
|
ITEM 2.
|
PROPERTIES
|
25
|
|
|
ITEM 3.
|
LEGAL PROCEEDINGS
|
26
|
|
| PART II | |||
|
ITEM 5.
|
MARKET FOR REGISTRANT’S COMMON EQUITY, RELATED STOCKHOLDER MATTERS, AND ISSUER PURCHASES OF EQUITY SECURITIES
|
27
|
|
|
ITEM 6.
|
SELECTED FINANCIAL DATA
|
29
|
|
|
ITEM 7.
|
MANAGEMENT’S DISCUSSION AND ANALYSIS OF FINANCIAL CONDITION AND RESULTS OF OPERATIONS
|
30
|
|
|
ITEM 7A.
|
QUANTITATIVE AND QUALITATIVE DISCLOSURES ABOUT MARKET RISK
|
47
|
|
|
ITEM 8.
|
FINANCIAL STATEMENTS AND SUPPLEMENTARY DATA
|
47
|
|
|
ITEM 9.
|
CHANGES IN AND DISAGREEMENTS WITH ACCOUNTANTS ON ACCOUNTING AND FINANCIAL DISCLOSURE
|
47
|
|
|
ITEM 9A.
|
CONTROLS AND PROCEDURES
|
48
|
|
|
ITEM 9B.
|
OTHER INFORMATION
|
48
|
|
| PART III | |||
|
ITEM 10.
|
DIRECTORS AND EXECUTIVE OFFICERS AND CORPORATE GOVERNANCE
|
50
|
|
|
ITEM 11.
|
EXECUTIVE COMPENSATION
|
50
|
|
|
ITEM 12.
|
SECURITY OWNERSHIP OF CERTAIN BENEFICIAL OWNERS AND MANAGEMENT AND RELATED STOCKHOLDER MATTERS
|
50
|
|
|
ITEM 13.
|
CERTAIN RELATIONSHIPS AND RELATED TRANSACTIONS AND DIRECTOR INDEPENDENCE
|
50
|
|
|
ITEM 14.
|
PRINCIPAL ACCOUNTANT FEES AND SERVICES
|
50
|
|
| PART IV | |||
|
ITEM 15.
|
EXHIBITS AND FINANCIAL STATEMENT SCHEDULES
|
51
|
|
| SIGNATURES | 92 | ||
1
PART I
This Annual Report on Form 10-K contains statements that constitute “forward-looking statements” within the meaning of Section 27A of the Securities Act of 1933, as amended, and Section 21E of the Securities Exchange Act of 1934, as amended. These statements include comments regarding the intent, belief or current expectations of the Company and its management. Readers can recognize forward-looking statements by the use of words like “anticipate,” “estimate,” “expect,” “project,” “intend,” “plan,” “believe,” “will,” “target,” “forecast” and similar expressions in connection with any discussion of future operating or financial performance. STAAR Surgical Company
cautions investors and prospective investors that any such forward-looking statements are not guarantees of future performance and involve risks and uncertainties, and that actual results may differ materially from those projected in the forward-looking statements. See “Item 1A. Risk Factors.”
Item 1. Business
STAAR Surgical Company designs, develops, manufactures and sells implantable lenses for the eye. We make lenses both for use in surgery that treats cataracts, and for use in corrective or “refractive” surgery. All of the lenses we make are foldable, which permits the surgeon to insert them through a small incision during minimally invasive surgery. Cataract surgery is a common outpatient procedure where the surgeon removes the eye’s natural lens and replaces it with an artificial lens called an intraocular lens (IOL) to restore the patient’s vision. Refractive surgery corrects the types of visual disorders that glasses or contact lenses have traditionally treated. We refer to our lenses used in refractive surgery as “implantable
Collamer® lenses” or “ICLs.” The field of refractive surgery includes both lens-based procedures, using products like our ICL, and laser-based procedures like LASIK. Successful refractive surgery can correct common vision disorders such as myopia, hyperopia and astigmatism. Originally incorporated in California in 1982, STAAR Surgical Company reincorporated in Delaware in 1986. Unless the context indicates otherwise, “we,” “us,” the “Company,” and “STAAR” refer to STAAR Surgical Company and its consolidated subsidiaries.
STAAR®, Visian®, Collamer®, nanoFLEX™, nanoPOINT™, Epiphany™, and AquaFlow™ are trademarks or registered trademarks of STAAR in the U.S. and other countries. Collamer® is the brand name for STAAR’s proprietary collagen copolymer lens material.
A glossary explaining many of the technical terms used in this report begins on page 15. The reader may also find it helpful to refer to the discussion of the structure and function of the human eye that begins on page 3.
Operations
STAAR has significant operations both within and outside the U.S. Sales from activities outside the U.S. accounted for 73% of our total sales in fiscal year 2010. STAAR distributes its products in over 50 countries, with direct distribution in North America and Japan and independent distributors in the remainder of the world.
STAAR has manufacturing and administrative facilities in the United States, Switzerland and Japan:
|
|
·
|
United States. STAAR operates its global administrative headquarters and a manufacturing facility in Monrovia, California. The Monrovia manufacturing facility principally makes Collamer and silicone IOLs and injector systems for IOLs and ICLs. STAAR also manufactures the raw material for Collamer lenses (both IOLs and ICLs) and the AquaFlow Devices in a facility in Aliso Viejo, California.
|
|
|
·
|
Switzerland. STAAR operates an administrative, manufacturing and distribution facility in Nidau, Switzerland under its wholly owned subsidiary, STAAR Surgical AG. The Nidau manufacturing facility makes all of STAAR’s ICLs and TICLs and also manufactures the AquaFlow Device.
|
|
|
·
|
Japan. STAAR operates administrative, manufacturing and distribution facilities in Japan under its wholly owned subsidiary, STAAR Japan Inc. STAAR Japan’s administrative facility is located in Shin-Urayasu and its manufacturing and distribution facility is located in Ichikawa City. STAAR assembles all of its preloaded IOL injectors at the Ichikawa City facility. Following its approval by the Japanese Ministry of Health, Labor and Welfare on February 2, 2010, STAAR Japan began marketing and distributing the Visian ICL in Japan.
|
The global nature of STAAR’s business operations subjects it to risks, including the effect of changes in currency exchange rates, differences in laws, including laws protecting intellectual property and regulating medical devices, political risks and the challenge of managing foreign subsidiaries. See “Item 1A. Risk Factors — the global nature of our business may result in fluctuations and declines in our sales and profits” and “— the success of our international operations depend on our successfully managing our foreign subsidiaries.”
2
The Human Eye
The following discussion provides background information on the structure, function and some of the disorders of the human eye to enhance the reader’s understanding of our products described in this report. The human eye is a specialized sensory organ capable of receiving visual images and transmitting them to the visual center in the brain. Among the main parts of the eye are the cornea, the iris, the lens, the retina, and the trabecular meshwork. The cornea is the clear window in the front of the eye through which light first passes. The interior surface of the cornea is lined with a single layer of flat, tile-like endothelial cells, whose function is to maintain the transparency of the cornea. The iris is a muscular curtain located behind the cornea
which opens and closes to regulate the amount of light entering the eye through the pupil, an opening at the center of the iris. The lens is a clear structure located behind the iris that changes shape to focus light to the retina, located in the back of the eye. The medical term for the natural lens that is present in the eye from birth is “crystalline lens.” The retina is a layer of nerve tissue consisting of millions of light receptors called rods and cones, which receive the light image and transmit it to the brain via the optic nerve. The posterior chamber of the eye, located behind the iris, is filled with a watery fluid called the aqueous humor, while the portion of the eye behind the lens is filled with a jelly-like material called the vitreous humor. The anterior chamber is the space in the eye behind the cornea and in front of the iris. The trabecular meshwork, a drainage channel located between the
iris and the surrounding white portion of the eye, maintains a normal pressure in the anterior chamber of the eye by draining excess aqueous humor.
The eye can be affected by common visual disorders, disease or trauma. One of the most prevalent ocular disorders is cataracts. Cataract formation is generally an age-related disorder that involves the hardening and loss of transparency of the natural crystalline lens, impairing visual acuity.
Refractive disorders, which generally are not age-related, include myopia, hyperopia, astigmatism and presbyopia. A normal, well functioning eye receives images of objects at varying distances from the eye and focuses the images on the retina. Refractive errors occur when the eye’s natural optical system does not properly focus an image on the retina. Myopia, also known as nearsightedness, occurs when the eye’s lens focuses images in front of the retina. Hyperopia, or farsightedness, occurs when the eye’s lens focuses images behind the plane of the retina. Individuals with myopia or hyperopia may also have astigmatism. Astigmatism is blurred vision caused when an irregularly shaped cornea or, in some cases, a defect in the natural
lens, produces a distorted image on the retina. Presbyopia is the reduced ability to see in the near and middle distance range that occurs with age as the natural crystalline lens loses its elasticity, reducing the eye’s ability to accommodate or adjust its focus for varying distances.
History of STAAR
STAAR developed, patented, and licensed the first foldable intraocular lens, or IOL, for cataract surgery. Made of pliable material, the foldable IOL permitted surgeons for the first time to replace a cataract patient’s natural lens with minimally invasive surgery. The foldable IOL became the standard of care for cataract surgery throughout the world. STAAR introduced its first versions of the lens, made of silicone, in 1991.
In 1996 STAAR began selling the Visian ICL outside the U.S. Made of STAAR’s proprietary biocompatible Collamer lens material, the ICL is implanted behind the iris and in front of the patient’s natural lens to treat refractive errors such as myopia, hyperopia and astigmatism. Lenses of this type are generically called “phakic IOLs” or “phakic implants” because they work along with the patient’s natural lens, or phakos, rather than replacing it. The ICL received CE Marking in 1997, permitting sale in countries that require the European Union CE Mark, and it received FDA approval for the treatment of myopia in the U.S. in December 2005. STAAR now sells the ICL in more than 50 countries,
and it has been implanted in more than 200,000 eyes worldwide.
Other milestones in STAAR’s history include the following:
|
|
·
|
In 1998, STAAR introduced the Toric IOL, the first implantable lens approved for the treatment of preexisting astigmatism. Used in cataract surgery, the Toric IOL was STAAR’s first venture into the refractive surgery market in the United States.
|
|
|
·
|
In 2000, STAAR introduced an IOL made of the Collamer material, making its clarity, refractive qualities and biocompatibility available to cataract patients and their surgeons.
|
3
|
|
·
|
In 2001, STAAR commenced commercial sales of its Visian Toric ICL or TICL, which corrects both astigmatism and myopia, outside the U.S. In 2002, the TICL received CE Marking, allowing commercial sales in countries that require the European Union CE Mark. Other significant markets for the TICL include Korea, Spain, China, India and Middle East.
|
|
|
·
|
In late 2003, STAAR Japan introduced the first preloaded IOL lens injector system in international markets. The Preloaded Injector offers surgeons improved convenience and reliability. The Preloaded Injector is not yet available in the U.S.
|
|
|
·
|
On December 22, 2005, the FDA approved the Visian ICL for the treatment of myopia, making it the first, and to date only, small incision phakic IOL commercially available in the United States.
|
|
|
·
|
Beginning in 2007, STAAR introduced its first aspheric IOLs made of silicone and Collamer.
|
|
|
·
|
On December 29, 2007 (fiscal 2008), we acquired the 50% remaining interests in STAAR Japan, making this former joint venture a wholly owned subsidiary of STAAR.
|
|
|
·
|
On February 2, 2010, the Japanese Ministry of Health, Labor and Welfare approved the Visian ICL, making it the first phakic IOL available for sale in Japan.
|
|
|
·
|
In May 2010, the expanded range Visian ICL received CE Marking, allowing commercial sales in countries that require the European Union CE Mark. The expanded range allows for the treatment of virtually any myopic or hyperopic refractive error.
|
Financial Information about Segments and Geographic Areas
STAAR’s principal products are IOLs and ICLs used in ophthalmic surgery. Because STAAR generates 100% of its sales from the ophthalmic surgical product segment, the Company operates as one operating segment for financial reporting purposes. See Note 19 to the Consolidated Financial Statements for financial information about product lines and operations in geographic areas.
Principal Products
We design our products to:
|
|
·
|
Improve patient outcomes,
|
|
|
·
|
Minimize patient risk and discomfort, and
|
|
|
·
|
Simplify ophthalmic procedures or post-operative care for the surgeon and the patient.
|
Minimally Invasive Intraocular Lenses (IOLs). We produce and market a line of foldable IOLs for use in minimally invasive cataract surgical procedures. Because these lenses fold, surgeons can implant them into the eye through an incision less than 3mm in length, and for one model as small as 2.2 mm. Surgeons prefer foldable lenses and small incisions because clinical evidence has overwhelmingly shown that larger incisions can induce corneal astigmatism, extend healing times, and increase the possibility of infection. Once inserted, the IOL unfolds naturally to replace the cataractous lens.
In most countries a process of government reimbursement for cataract surgery and IOLs exists. In some countries, the ability for ophthalmic surgeons and surgical centers to collect an additional fee from the patient is evolving. STAAR’s strategic direction is to offer IOLs that fall within the categories that offer an opportunity to increase average selling prices. For example, the Center for Medicare and Medicaid Services (CMS) reimburses certain “premium” lenses at the standard rate of approximately $150, but allows the provider to receive an additional payment from the patient for the premium lens and associated services. STAAR’s Toric IOL falls in this category.
Currently, our foldable IOLs are manufactured from both our proprietary Collamer material and silicone. STAAR offers both materials in two differently configured styles: the single-piece design where both the optic and haptics are made of the same material and the three-piece design where PolyimideTM loop haptics are attached to the optic. The selection of one style over the other is primarily based on the preference of the ophthalmologist. We also market our silicone and independently sourced acrylic foldable IOLs packaged in a preloaded delivery system in various markets outside the U.S.
4
STAAR began introducing aspheric IOLs in 2007. Aspheric IOLs use advanced optical designs that produce a clearer image than traditional spherical lenses, especially in low light, which has led to significant market share gains for aspheric designs. STAAR introduced its first aspheric IOLs made of silicone and Collamer in 2007. During 2009, STAAR introduced the nanoFLEX IOL, which can be delivered through a 2.2 mm micro-incision using STAAR’s new nanoPOINT Injection System.
We have developed and currently market, principally in the U.S., the Toric IOL, a toric version of our single-piece silicone IOL, which is specifically designed for cataract patients who also have pre-existing astigmatism.
STAAR Japan introduced the first Preloaded Injector in international markets in late 2003. The Preloaded Injector is a silicone or acrylic IOL packaged and shipped in a pre-sterilized, disposable injector ready for use in cataract surgery. We believe the Preloaded Injector offers surgeons improved convenience and reliability. In 2006, STAAR Japan began selling in Japan an acrylic-lens-based Preloaded Injector employing a lens supplied by Nidek Inc., a Japanese ophthalmic company. STAAR now sells the acrylic Preloaded Injector in Europe and other Asian countries as well. Nidek also assembles and sells the acrylic Preloaded Injector under its own brand, using injector parts purchased from STAAR Japan. STAAR Japan’s agreement with Nidek provides
for the sale of the acrylic Preloaded Injector in additional territories by mutual agreement of the two companies.
Sales of IOLs accounted for approximately 50% of our total sales in fiscal 2010, 52% of our total sales in fiscal 2009, and 51% of our total sales in fiscal 2008.
Visian ICL (ICLs). ICLs correct refractive disorders such as myopia, hyperopia and astigmatism. The ICL can treat a wide range of refractive errors – the expanded offering of ICLs approved for sale in 2010 in the countries covered by the CE Mark offers a wider range of correction than any other refractive surgical procedure.
The ICL folds for minimally invasive implantation behind the iris and in front of the natural crystalline lens, using techniques similar to those used to implant an IOL during cataract surgery, except that the natural lens remains intact in the eye. The surgeon typically implants the ICL using topical anesthesia on an outpatient basis. The patient usually recovers vision within one to 24 hours.
The FDA approved the ICL for myopia for use in the United States on December 22, 2005. The ICL and TICL are approved in countries that require the European Union CE Mark, China, Canada, Korea and Singapore. The ICL for myopia was approved for sale in Japan on February 2, 2010, and an application for the TICL is pending in Japan. The Company submitted its application for U.S. approval of the TICL to the FDA in 2006 and it is currently under review (see “Regulatory Matters – Regulatory Requirements in the United States – Status of Toric ICL Submission”).
The Hyperopic ICL, which treats far-sightedness, is approved for use in countries that require the European Union CE Mark and Canada.
The ICL is available for myopia in the United States in four lengths and 27 powers for each length, and outside the U.S., the ICL is available for myopia in four lengths and 41 powers for each length and the HICL for hyperopia is available in four lengths, with 37 powers for each length, which equates to 420 inventoried parts. This requires the Company to carry a significant amount of inventory to meet the customer demand for rapid delivery. The Toric ICL is available for myopia in the same powers and lengths but carries additional parameters of cylinder and axis with 11 and 180 possibilities, respectively. Accordingly, we often make the Toric ICL to order. During 2010, approximately 75% of our Toric ICLs were delivered from stock.
Sales of ICLs (including TICLs) accounted for approximately 44 % of our total sales in fiscal 2010, 41% of our total sales in fiscal 2009, and 36% of our total sales in fiscal 2008.
Other Surgical Products
The Company also sells other related instruments, devices, surgical packs and equipment that we manufacture or that are manufactured by others, but has deemphasized these products in recent quarters due to their relatively lower overall gross profit margins. Sales of other surgical products accounted for approximately 6 % of our total sales in fiscal 2010, 7% of our total sales in fiscal 2009, and 13% of our total sales in fiscal 2008.
5
Sources and Availability of Raw Materials
STAAR uses a wide range of raw materials in the production of its products. STAAR purchases most of the raw materials and components from external suppliers. Some of our raw materials are single-sourced due to regulatory constraints, cost effectiveness, availability, quality, and vendor reliability issues. Many of our components are standard parts or materials and are available from a variety of sources although we do not typically pursue regulatory and quality certification of multiple sources of supply.
Our sources of supply for raw materials can be threatened by shortages and other market forces, by natural disasters, by the supplier’s failure to maintain adequate quality or a recall initiated by the supplier. Even when substitute suppliers are available, the need to certify regulatory compliance and quality standards of substitute suppliers could cause significant delays in production and a material reduction in our sales. We mitigate this risk by maintaining adequate inventory of raw materials when practical and identifying secondary suppliers, but we cannot entirely eliminate the risk. For example, the failure of one of our suppliers could be the result of an unforeseen industry-wide problem, or the failure of our supplier could create an industry-wide shortage affecting
secondary suppliers as well.
In particular, we obtain the proprietary collagen-based raw material used to manufacture our IOLs, ICLs and the AquaFlow Device internally from a sole source, one of our facilities in California. If the supply of these collagen-based raw materials is disrupted we know of no alternative supplier, and therefore, any such disruption could result in our inability to manufacture the products and would have a material adverse effect on the Company. In addition, the loss of our external supply source for silicone could cause us material harm. In some cases, we mitigate this risk by stockpiling materials, which requires us to devote financial resources to that purpose.
Patents, Trademarks and Licenses
We strive to protect our investment in the research, development, manufacturing and marketing of our products through the use of patents, licenses, trademarks, copyrights, and trade secrets. We own or have rights to a number of patents, licenses, trademarks, copyrights, trade secrets and other intellectual property directly related and important to our business. As of December 31, 2010, we owned approximately 124 United States and foreign patents and had approximately 8 patent applications pending.
We consider our patents to be significant when they protect the exclusivity of our material products in the marketplace or provide an opportunity to obtain material royalties or cross-licenses of intellectual property from other manufacturers. Because the Company has limited knowledge of the research and development efforts and strategic plans of its competitors, it can only estimate the value of its patents and the significance of any particular patent’s expiration. Competitors may be able to design products that avoid infringing on patents that the Company regards as valuable, or they may find patents that the Company regards as less significant to be obstacles to their development of competing products. The Company’s internal assessments of its patents include
confidential information, the disclosure of which would cause significant competitive harm to the Company.
The Company’s material patents generally fall within three areas of technology: (1) design of a posterior chamber phakic intraocular lens used to treat refractive errors of the eye (ICLs), (2) the Collamer® lens material, and (3) lens delivery systems for folding intraocular lenses (injectors and cartridges, both stand-alone and preloaded).
Posterior Chamber Phakic Intraocular Lens to treat Refractive Errors (“PIOL”)
The Company’s Visian ICL is the only posterior chamber PIOL approved for sale in the U.S., and the Company believes it is the world’s largest selling phakic IOL. The Company believes that its leadership in commercializing this technology results from a number of factors, including proprietary design features and the biocompatibility of the Collamer material. (The proprietary nature of Collamer is discussed in further detail below).
The Company has several patents covering design features that the Company believes are essential to the safety and effectiveness of its PIOLs, and that the Company believes would be necessary or desirable for any competing posterior chamber PIOL. These patents expire between 2014 and 2016.
Collamer Lens Material
The Company believes that the biocompatibility of the Collamer material used for the Visian ICL (and TICL) is a significant factor in the ability to place this lens safely in the posterior chamber of the eye. Compared to lenses placed in the anterior chamber, the Company believes that placement in the posterior chamber provides superior optical results and superior cosmetic appearance, and poses less risk of damage to the cornea. The Company believes that the physical and optical properties of Collamer also give it distinct advantages as a material for prosthetic IOLs used in cataract surgery.
6
Collamer belongs to a family of materials known as collagen copolymers. Collagen copolymers are compounds formed by joining molecules of collagen derived from biological sources with synthetic monomer molecules. The patents that underlie the specific Collamer formulation and manufacturing methods expire between 2014 and 2016.
Lens Delivery Systems
STAAR owns numerous patents covering the technology of foldable lens delivery systems, including injectors, cartridges and preloaded injectors and their specific design features. This group of patents includes relatively recent patents with up to 10 years of life remaining. However, a select group of these patents covering the more fundamental lens delivery technologies will expire between 2012 and 2014.
Trademarks
Worldwide, we sell all of our major products under trademarks we consider to be important to our business. The scope and duration of trademark protection varies widely throughout the world. In some countries, trademark protection continues only as long as the mark is used. Other countries require registration of trademarks and the payment of registration fees. Trademark registrations are generally for fixed but renewable terms.
Confidentiality Agreements
We protect our proprietary technology, in part, through confidentiality and nondisclosure agreements with employees, consultants and other parties. Our confidentiality agreements with employees and consultants generally contain standard provisions requiring those individuals to assign to STAAR, without additional consideration, inventions conceived or reduced to practice by them while employed or retained by STAAR, subject to customary exceptions.
Seasonality
Our sales are not materially impacted by seasonality, especially since the divestiture of Domilens.
The first quarter of each fiscal year tends to have the lowest cash flow of the year because of accounting fees related to the annual audit of our financial statements, professional fees for our consultant on internal controls pursuant to the Sarbanes-Oxley Act of 2002, bonus payments, and holiday closures of facilities during December that reduce the processing and payment of invoices by STAAR during the last weeks of the fourth quarter, resulting in a significant increase in cash payments by STAAR as it catches up during the first month of the first quarter.
Distribution and Customers
We market our products to a variety of health care providers, including surgical centers, hospitals, managed care providers, health maintenance organizations, group purchasing organizations and government facilities. The primary user of our products is the ophthalmologist.
We distribute products directly to the physician or facility in the United States, and rely primarily on local distributors in other countries. In Japan, we both sell directly and through a local distributor. Where we distribute products directly, we rely on local sales representatives to help generate sales by promoting and demonstrating our products with physicians. In Japan we generally employ our sales representatives directly. In the U.S., we rely on both directly employed representatives and independent sales representatives to sell our products under the supervision of directly employed sales managers.
For the years ended December 31, 2010 and January 1, 2010, respectively, $6,080,000 or 11.1% and $5,366,000 or 10.5%, of our consolidated net revenue was generated by one customer, Woo Jeon, our Korean distributor. For the year ended January 2, 2009, no single customer accounted for more than 10% of consolidated revenue.
Our U.S.-based internal marketing department develops the strategies used to sell our products in North America and guides the marketing efforts used in the Europe/Middle East and Pacific/Asia regions. The marketing department supports selling efforts by developing and providing promotional materials, educational courses, speakers’ programs, participation in trade shows and technical presentations.
7
Backlog
The dollar amount of the Company’s backlog orders is not significant in relation to total annual sales. The Company generally keeps sufficient inventory on hand to ship product when ordered.
Government Contracts
No material portion of our business is subject to renegotiation of profits or termination of contracts or subcontracts at the election of the U.S. Government.
Competition
Competition in the ophthalmic surgical product market is intense and characterized by extensive research and development and rapid technological change. Development by competitors of new or improved products, processes or technologies may make our products obsolete or less competitive. We must therefore devote continued efforts and significant financial resources to enhance our existing products and to develop new products for the ophthalmic industry.
Our ICL faces significant competition in the marketplace from other products and procedures that improve or correct refractive conditions, such as corrective eyeglasses, external contact lenses, and conventional and laser refractive surgical procedures. These products and procedures are long established in the marketplace and familiar to patients in need of refractive vision correction. In particular, eyeglasses and external contact lenses are much cheaper in the short term and more easily obtained, because the patient usually receives a prescription for the product immediately after a routine eye examination in a doctor’s office, without any need for treatment in a hospital or surgery center.
We believe that the following providers of equipment used in laser surgical procedures comprise our primary competition in the marketplace for patients seeking surgery to correct refractive conditions: Alcon Laboratories (“Alcon”); Abbott Medical Optics (“Abbott”), previously known as Advanced Medical Optics (“AMO”); and Bausch & Lomb. All of these companies market Excimer lasers for corneal refractive surgery. Approval of custom laser ablation, along with the addition of wavefront technology, has increased awareness of corneal refractive surgery by patients and practitioners. In the phakic implant market, there are only two approved phakic IOLs available in the U.S., our Visian ICL and the Ophtec Artisan®, which is also
distributed under the Verisyse™ name by Abbott. In international markets, our ICL’s main competition is the Verisyse/Artisan lens, although several other manufacturers market phakic IOLs in those markets.
We believe our primary competitors in the development and sale of foldable IOLs for use in cataract surgery include Alcon, Abbott and Bausch & Lomb. According to a 2010 report by Market Scope, LLC, a publisher of ophthalmic industry analysis, Alcon holds 53% of the global IOL market, followed by Abbott with 16% and Bausch & Lomb with 10%. Market Scope estimates STAAR’s global revenue market share at 2.3%. We hold approximately 8% to 9% market share in Japan and approximately 3% of the U.S. IOL market. Our competitors have been established for longer periods of time than we have and have significantly greater resources, including greater name recognition, larger sales operations, greater ability to finance research and development and initiatives to
achieve regulatory approval, and more developed regulatory compliance and quality control systems.
According to Market Scope, acrylic, which our competitors market as an advanced material, is the most preferred IOL material in the world, followed by silicone and PMMA. Acrylic IOLs currently account for a 81% share of the U.S. IOL market. We believe that we are positioned to compete effectively in the advanced material market segment with our Collamer IOL. As part of our effort to increase market uptake of our Collamer IOLs, we introduced an aspheric three-piece Collamer IOL in November 2007 and in 2009 introduced the nanoFLEX IOL which can be delivered using STAAR’s nanoPOINT™ injector, through a 2.2 mm incision.
Outside the U.S. STAAR markets the KS-X IOL line which combines STAAR’s proprietary preloaded delivery system with an independently sourced acrylic lens. The KS-X preloaded delivery system enables the surgeon to deliver the lens into the eye through a 2.8 millimeter incision. The lens material used is a hydrophobic acrylic, which is the material preferred by most surgeons.
The addition of aspheric optics to STAAR’s IOL designs has been a primary focus of STAAR’s development efforts. Aspheric IOLs use advanced optical designs intended to provide a clearer image than traditional spherical lenses, especially in low light, which has led to significant market share gains for aspheric designs. All of STAAR's aspheric lenses feature a proprietary optical design (patent pending) that is optimized for the naturally curved surface of the retina and certain other anatomical features of the human eye, and provides outstanding image quality even if decentered or tilted.
8
Although the market for silicone IOLs, which currently account for 17% of the U.S. IOL market, has declined in recent years, we believe they still provide an opportunity for us as we continue to introduce improvements to the silicone IOL technology. In particular, we believe that our aspheric silicone three-piece lens and the expected 2011 introduction of this lens in a preloaded configuration will enhance STAAR’s ability to maintain market share within the silicone market sector in the U.S.
“Presbyopic IOLs” sold by our major U.S. competitors are lenses that offer to make patients less dependent on reading glasses or contact lenses to provide both near and far vision after cataract surgery. FDA-approved and CE-marked lenses of this type include a lens produced by Bausch & Lomb that has been found to restore some of the eye’s natural ability to focus, and multifocal lenses produced by Alcon and AMO that create zones in the visual field for distance, far and near vision, similar to the near and far zones in bifocal glasses. In the U.S., CMS rules permit a cataract patient implanted with a presbyopic lens to receive reimbursement at the rate allowed for surgery with a standard IOL, and to pay out of pocket the balance of the lens cost and surgical fee for the
premium presbyopic IOL. Presbyopic lenses have gained a significant share of the overall IOL marketplace. At present, STAAR does not have a product approved by the FDA for the treatment of presbyopia in order to compete in this market sector.
In late 2009, a group of surgeons referred to by STAAR as the Collamer Accommodating Study Team (CAST) reported that the nanoFLEX IOL exhibited some near and intermediate vision improving properties. They reported average near visual acuity with the lens in the 20-50 range and average intermediate visual acuity in the 20-25 range. This level of intermediate vision would exceed that of any other lens for which published clinical data is available, including premium multifocal and accommodating IOLs.
It has also been reported that the nanoFLEX lens may be especially appropriate when used for monovision. Monovision is a treatment strategy for presbyopia that corrects one eye (the dominant eye) for distance vision, and corrects the other eye to provide near vision. It is reported that after surgery most patents undergo a neural adaptation that lets them fuse the near vision from one eye with the distance vision from the other. A survey conducted by Market Scope in the first quarter of 2009 found that, based on responses from 399 surgeons, an average of 14.5% of cataract procedures performed in the US market employed a monovision strategy. Some patients cannot tolerate monovision because they cannot adapt to the
significant disparity of 1.5 to 2.0 diopters of magnification between the two eyes. Attempts have been made to offer modified monovision or” mini monovision” treatments whereby the surgeon seeks to minimize the disparity between eyes. While patients may better tolerate this approach, it may leave the patient with less clarity of near vision and greater need for reading glasses.
In 2010, Dr. Ken Lipstock presented retrospective results from patients previously treated with STAAR’s nanoFLEX IOL using a “blended vision” strategy of monovision with a lesser disparity between eyes. In this study Dr. Lipstock reported that average near visual acuity could be improved to 20-25 with an average disparity of only 1.3 diopters, which 100% of the patients tolerated. This study suggests that surgeons may be able to provide good near, intermediate and distance vision using the nanoFLEX lens and a blended vision strategy.
STAAR believes that a growing number of surgeons are offering cataract patients treatments like monovision that can provide better refractive outcomes than standard monofocal IOL implantation. These treatments are provided with an understanding that the patient will bear the cost of additional testing and diagnostic tests related to the enhanced treatments, which generally are not be covered by Medicare.
Regulatory Matters
Nearly all countries where we sell our products have regulations requiring advance approval or certification of medical devices. Various federal, state, local and foreign laws also apply to our operations, including, among other things, working conditions, laboratory and manufacturing practices, and the use and disposal of hazardous or potentially hazardous substances.
The requirements for approval or clearance to market medical products vary widely by country. The requirements range from minimal requirements to requirements comparable to those established by the U.S. Food and Drug Administration (“FDA”). For example, many countries in South America have minimal regulatory requirements, while many others, such as Japan, have requirements at least as stringent as those of the FDA. The process of obtaining approval to distribute medical products is costly and time-consuming in virtually all of the major markets where we sell medical devices. We cannot assure that any new medical devices we develop will be approved in a timely or cost-effective manner or approved at all. The regulatory requirements in our most
important current markets, the U.S., Europe and Japan, are discussed below.
9
Regulatory Requirements in the United States.
Under the federal Food, Drug & Cosmetic Act, as amended (the “Act”), the FDA has the authority to adopt, and has adopted, regulations that do the following:
|
|
·
|
set standards for medical devices,
|
|
|
·
|
require proof of safety and effectiveness prior to marketing devices that the FDA believes require pre-market approval,
|
|
|
·
|
require approval prior to clinical evaluation of human use,
|
|
|
·
|
permit detailed inspections of device manufacturing facilities,
|
|
|
·
|
establish “good manufacturing practices” that must be followed in device manufacture,
|
|
|
·
|
require reporting of serious product defects, associated adverse events, and certain recalls or field actions to the FDA, and
|
|
|
·
|
prohibit the export of devices that do not comply with the Act unless they comply with specified requirements, including but not limited to requirements that exported devices comply with applicable foreign regulations, do not conflict with foreign laws, and that the export not be contrary to public health in the U.S. or the importing country.
|
Most of our products are medical devices intended for human use within the meaning of the Act and, therefore, are subject to FDA regulation.
The FDA establishes procedures for compliance based upon regulations that designate devices as Class I (general controls, such as establishment registration and device listing with FDA, labeling and record-keeping requirements), Class II (performance standards in addition to general controls) or Class III (pre-market approval (“PMA”) required before commercial marketing). Class III devices are the most extensively regulated because the FDA has determined they are life-supporting, are of substantial importance in preventing impairment of health, or present a potential unreasonable risk of illness or injury. The effect of assigning a device to Class III is to require each manufacturer to submit to the FDA a PMA that includes information on the safety and effectiveness of the
device. The FDA reviews device applications and notifications through its Office of Device Evaluation, or “ODE.”
510(k) Clearance. A medical device that is substantially equivalent to a directly related medical device previously in commerce may be eligible for the FDA’s pre-market notification “510(k) review” process. FDA clearance under Section 510 (k) of the ACT does not imply that the safety, reliability and effectiveness of the medical device has been approved or validated by the FDA, but merely means that the medical device is substantially equivalent to a previously cleared commercial medical device. The review period and FDA determination as to substantial equivalence generally is made within 90 days of submission of a 510(k) application, unless additional information or clarification or clinical studies are
requested or required by the FDA. As a practical matter, the review process and FDA determination may take longer than 90 days.
After a device receives 510(k) clearance, any modification that could significantly affect its safety or effectiveness, or that would constitute a major change in its intended use, will require a new 510(k) clearance or could require premarket approval. The FDA requires each manufacturer to make its own initial determination as to whether a change significantly affects safety or effectiveness. However, the FDA can review any such decision and can disagree with a manufacturer’s determination. If the FDA disagrees with a manufacturer’s determination, the FDA can require the manufacturer to cease marketing or recall the modified device until 510(k) clearance or premarket approval is obtained. If the FDA requires us to seek 510(k) clearance or premarket approval
for any modifications to a previously cleared product, we may be required to cease marketing or recall the modified device until we obtain this clearance or approval. Also, in these circumstances, we may be subject to significant regulatory fines or penalties.
10
In September 2009, the FDA requested that the Institute of Medicine perform a study on whether legislative, regulatory or administrative changes are needed to the FDA’s 510(k) process. The Institute of Medicine report is due in March 2011. The FDA also announced an internal working group to evaluate and improve the consistency of FDA decision making in the clearance process, and recently released an internal report in which FDA officials questioned the 510(k) process in general. Various committees of the U.S. Congress also have indicated that they may consider investigating the FDA’s 510(k) process. If these actions result in a limitation or elimination of the 510(k) approval path STAAR may find it much more costly and time consuming to develop and introduce
new products in the U.S.
Premarket Approval. When 510(k) clearance is not available, the more rigorous PMA process requires us to demonstrate independently that the new medical device is safe and effective. As an initial step the process of developing the product must be stringently managed and documented – along with any later changes in design – in a “design history file” that will be submitted with the PMA. The next step is pre-clinical testing, which includes chemical analysis, toxicity testing and other bench testing, and animal trials. The results of this early testing are submitted to the FDA along with a detailed research plan. Only after approval of this submission can a non-approved
device receive an “investigational device exemption” or IDE, which permits the device to be used to treat human subjects in a supervised study.
Clinical trials on human subjects are expensive and time consuming, often taking years from design to completion. The trial, once approved, is subject to extensive oversight. In addition to FDA oversight through the ODE and the FDA’s Division of Bioresearch Monitoring (“BIMO”), the company sponsoring the research must designate a private Independent Review Board (“IRB”) to approve and monitor the research and assure that it is ethical, scientifically sound and regulated. The company sponsoring the research must adopt and observe stringent procedures for overseeing research, collecting and analyzing data, and will be subject to BIMO audits to verify compliance.
If clinical research supports the safety and efficacy of the device, the sponsor prepares and submits the PMA, which consists of several volumes and includes not only research data and analysis, but also design history files. In addition to its own review, the FDA may organize an independent advisory panel of experts to review the PMA whenever a device is the first of its kind or the FDA otherwise determines panel review is warranted. The FDA holds panels on a regular basis, but the need to schedule panel review usually adds some weeks or months to the review process.
Following its review, the FDA will authorize commercial release if it determines there is reasonable assurance that the medical device is safe and effective. This FDA makes this decision based on a determination that the device’s benefit outweighs the risk to the population for which treatment with the device is intended.
If a manufacturer plans to modify an approved PMA device in a manner that affects safety or effectiveness, the manufacturer must submit an application called a “PMA Supplement” regarding the change. The FDA generally reviews PMA Supplements on a 180-day agency timetable, which may be extended if significant questions arise in review of the supplement. A manufacturer may implement a change that enhances safety prior to the FDA’s review of the PMA Supplement. The FDA designates some PMA Supplements as “panel track” supplements, which means that the agency believes review by an advisory panel may be warranted. Designation as a panel-track supplement does not necessarily mean that
panel review will actually occur.
Our IOLs, ICLs, and AquaFlow Devices are Class III devices, and our lens injectors are Class I devices. We have received PMA approval for our IOLs, the ICL for the treatment of myopia, and the AquaFlow Device. We have received 510(k) clearance for our lens injectors.
Oversight of compliance with quality, medical device reporting and other regulations. Both before and after we release a product commercially, we have ongoing responsibilities under FDA regulations. The FDA Office of Compliance reviews design and manufacturing practices, labeling and record keeping, and manufacturers’ required reports of adverse experiences and other information to identify potential problems with marketed medical devices. We are also subject to periodic inspection by the FDA for compliance with the FDA’s quality system regulations and requirements, such as restrictions on advertising and promotion. The Good Manufacturing Practice (“GMP”) regulations govern the methods
used in, and the facilities and controls used for, the design, manufacture, packaging and servicing of all finished medical devices intended for human use. If the FDA were to conclude that we are not in compliance with applicable laws or regulations, or that any of our medical devices are ineffective or pose an unreasonable health risk, the FDA could require us to notify health professionals and others that the devices present unreasonable risks of substantial harm to the public health, order a recall, repair, replacement, or refund of such devices, detain or seize adulterated or misbranded medical devices, or ban such medical devices. The FDA may also impose operating restrictions, enjoin and restrain certain violations of applicable law pertaining to medical devices, and assess civil or criminal penalties against our officers, employees, or us. The FDA may also recommend prosecution to the Department of Justice.
11
BIMO Review of Clinical Research Activities. Our activities as a sponsor of clinical research are subject to review by the FDA’s BIMO division. BIMO conducts facilities inspections as part of a program designed to ensure that data and information contained in requests for IDEs, PMA applications and 510(k) submissions are scientifically valid and accurate. Another objective of the program is to ensure that human subjects are protected from undue hazard or risk during the course of scientific investigations.
FDA Reviews of STAAR’s Quality Systems. The FDA’s most recent general quality inspections of STAAR’s facilities were regularly scheduled inspections of the Nidau, Switzerland facility between June 2 and June 5, 2009, the Monrovia, California facility, between February 23 and March 4, 2009 and a post-market inspection of the Aliso Viejo, California facility November 22, 2010. The inspection of the Nidau, Switzerland facility that concluded on June 5, 2009 resulted in the inspector issuing two observations of nonconformity on Form FDA-483. STAAR agreed with the observations and at the conclusion of the inspection both of the observations were annotated as corrected and one was additionally annotated
as verified. The inspection of the Monrovia, California facility that concluded on March 4, 2009 resulted in the issuance of three observations by the investigators of nonconformity on Form FDA-483. STAAR has agreed with the observations and has completed corrective actions to address each observation. We prepared and submitted a comprehensive response to the investigators’ observations that we believe appropriately addresses each of the issues raised on the Form FDA-483. The post-market inspection of Aliso Viejo, California resulted in no observations of noncompliance. Based in part on these inspections, STAAR believes that it is substantially in compliance with the FDA’s Quality System Regulations and Medical Device Reporting regulations.
STAAR’s ability to continue its U.S. business depends on the continuous improvement of its quality systems and its ability to demonstrate compliance with FDA regulations. Accordingly, for the foreseeable future STAAR’s management expects to continue to devote significant resources and attention to those efforts.
BIMO Review of STAAR’s Clinical Research Activities. Following an inspection related to STAAR’s TICL supplemental premarket application, on June 26, 2007, BIMO issued a Warning Letter in which it noted four areas of noncompliance in STAAR’s clinical research procedures and data reporting. The BIMO observations and Warning Letter resulted in the ODE placing STAAR’s TICL application on integrity hold on August 3, 2007. Following a number of corrective actions, including an independent audit of clinical data and clinical systems to ensure accuracy and completeness of data, the FDA removed the integrity hold on July 21, 2009 and resumed considering the TICL application.
While the past instances of noncompliance with procedures noted in the BIMO Warning Letter were serious in nature and required comprehensive corrective and preventative actions, STAAR does not believe that these nonconformities undermined the scientific validity and accuracy of its clinical data, or that human subjects were subjected to undue hazard or risk. STAAR believes that its corrective actions have substantially remedied BIMO’s concerns. However, in releasing the integrity hold, the FDA noted that for a period of two years it will require STAAR to obtain certification from an independent third party auditor for some of its filings. This requirement may increase the cost and time necessary for some FDA submissions.
Status of TICL Submission. STAAR submitted a PMA supplement for the TICL to the FDA on April 28, 2006. The FDA’s consideration of the application, which has been designated as a panel-track supplement, was interrupted by the agency’s integrity hold between August 3, 2007 and July 21, 2009. Following the release from integrity hold, the FDA and STAAR resolved a number of questions related to the TICL supplement in an interactive process during August and September 2009.
On February 3, 2010, STAAR received a letter of deficiency from the FDA outlining additional questions to be answered within 180 days. On August 2, 2010 the Company responded to the FDA’s deficiency letter. Since that response, STAAR has been in dialogue with the agency, working interactively to resolve a series of follow-up questions. STAAR cannot predict when, or if, the FDA may grant approval of the Visian Toric ICL.
Regulatory Requirements outside the United States.
CE Marking. The member countries of the European Union require that all medical products sold within their borders carry a Conformite Europeane Mark (“CE Mark”). The CE Mark on a medical device indicates that it has been found to comply with European Directives and associated guidelines concerning the design and manufacture of medical devices, including clinical trials, labeling, quality control, technical specifications, adverse event reporting, and biological, chemical and clinical safety. We have obtained the CE Mark for all of our principal products including our full range of ICL and TICL products, IOLs (excluding IOLs with aspheric optics), injectors and our AquaFlow Device.
12
A CE Marked device may be sold throughout the 27 countries in Europe. Other countries, such as Switzerland, have voluntarily adopted laws and regulations that mirror those of the European Union with respect to medical devices, and a number of countries outside of Europe permit importation of devices bearing the CE Mark. The method of assessing conformity varies depending on the class of the product, but normally involves a combination of self-assessment by the manufacturer and a third-party assessment by a “Notified Body.” Notified Bodies are a group of private quality-monitoring organizations that are accredited to approve medical devices and to monitor quality systems and adverse event reporting. The independent Notified Bodies perform, on a privatized basis, functions
similar to the FDA in the U.S. and the PMDA in Japan. Our facilities in the U.S., Japan and Switzerland are all subject to regular inspection by a designated Notified Body.
Medical Device Regulation in Japan. The Japanese Ministry of Health, Labor, and Welfare (MHLW) regulates the sale of medical devices under Japan’s Pharmaceutical Affairs Law (PAL). The Pharmaceutical and Medical Devices Agency (PMDA), a quasi-governmental organization, performs many of the medical device review functions for MHLW. Medical devices generally must undergo thorough safety examinations and demonstrate medical efficacy before the MHLW grants shonin (pre-market device approval) or ninsho (certification). Manufacturers and resellers (referred to as Marketing Authorization Holders or MAHs) must also
satisfy certain requirements before the MHLW grants a business license, or kyoka. Requirements for manufacturers and MAHs include compliance with Japanese regulations covering GQP (good quality control practice) and GVP (good vigilance practice), which include conformity to the ISO 13485 standard and are similar to good manufacturing practice and post-market surveillance requirements in the U.S., as well as the assignment of internal supervisors over marketing, quality assurance and safety control.
Approval for a new medical device that lacks a substantial equivalent in the Japanese market will generally require the submission of clinical trial data. Only a licensed MAH can apply for premarket device approval in Japan, and in most cases, the clinical trial data must include data gathered from Japanese subjects. For example, STAAR Japan conducted a separate clinical trial in Japan for the shonin application for the Visian ICL. Also, approval for a new medical device will require the manufacturer to undertake to reexamine the safety and efficacy of the device with a review of postmarket data gathered within a certain period - normally four years - after approval. The specific postmarket reexamination requirement
for a medical device is announced at the time of approval.
STAAR Japan currently holds shonin approval for the Visian ICL, preloaded injectors and their associated lenses, and kyoka licensing as a manufacturer and MAH of medical devices. The sponsor of a clinical trial submitted to the MHLW must strictly follow Good Clinical Practice (GCP) standards, and must follow the trial with standard Good Postmarket Study Practice (GPSP) reporting and a follow-up program. MHLW and PMDA also assess the quality management systems of manufacturers and the conformity of products to the requirements of PAL. STAAR is subject to inspection for compliance by these agencies. A company’s failure to comply with PAL can result in
severe penalties, including revocation or suspension of a company’s business license and possible criminal sanctions. STAAR is currently seeking shonin approval of the Toric ICL.
Research and Development
We are focused on furthering technological advancements in the ophthalmic products industry through the development of innovative premium ophthalmic products and materials and related surgical techniques. We maintain active internal research and development programs, both in the U.S. and Japan, which also includes clinical activities and regulatory affairs and is comprised of 45 employees. In order to achieve our business objectives, we will continue the investment in research and development.
STAAR Japan’s research and development department is a leader in injector technology, enabling STAAR to introduce the first Preloaded Injector to international markets in late 2003 and in 2009 to introduce the Epiphany injector system to the U.S. market. A realignment of activities between R&D in the U.S. and Japan has enabled the U.S. team to focus on advanced lens designs and new materials and the STAAR Japan team to focus on delivery systems.
During 2010, STAAR introduced the nanoPOINT™ 2.0 microincision injector for the ICL and launched an expanded range of Visian ICL products in countries that accept the CE Mark. During 2009 STAAR introduced the nanoFLEX™ Aspheric Collamer IOL, which can be delivered through the nanoPOINT injector, and the advanced Epiphany™ injector system for the Affinity Collamer IOL. Outside the U.S. in 2009 STAAR introduced the KS-X Preloaded Hydrophobic Acrylic Injector System in Europe and the KS-Ni Preloaded Silicone IOL Injector System in Japan.
Over the past several years surgeons implanting single piece Collamer IOLS (including the current nanoFLEX IOL) reported that their cataract patients experienced better than expected near and intermediate vision. In late 2008, STAAR organized the Collamer Accommodating Study Team or “CAST.” The CAST consists of several prominent physicians across the U.S. who implanted the nanoFLEX IOL and checked their patients for both near and intermediate vision approximately one month after surgery. Feedback from the group indicated that nanoFLEX provided near vision exceeding that provided by any conventional IOL where we have comparative data. The feedback also indicated that the intermediate vision provided by
nanoFLEX was better than that provided by any “presbyopia correcting” IOLs that have been studied, and the near vision provided by nanoFLEX approaches that of presbyopia correcting IOLs that are already on the market.
13
During 2011, our goal is to continue our focus on research and development in the following areas:
· Introduction of the silicone preloaded injector system in the U.S.
· Introduction of a hydrophobic acrylic single-piece preloaded injector system outside the U.S.
· Development of preloaded injector systems for Collamer IOLs and ICLs
· Continued development of a Collamer Toric IOL to complement our pioneering silicone Toric IOL
· Enhancements to the ICL that may simplify the procedure and further improve its already outstanding efficacy
· Development of accommodating or presbyopic IOLs
Research and development expenses were approximately $5.7 million, $5.9 million, and $7.9 million for our 2010, 2009 and 2008 fiscal years, respectively. STAAR expects to invest approximately 10% of sales for research and development in 2011.
Environmental Matters
The Company is subject to federal, state, local and foreign environmental laws and regulations. We believe that our operations comply in all material respects with applicable environmental laws and regulations in each country where we do business. We do not expect compliance with these laws to affect materially our capital expenditures, earnings or competitive position. We have no plans to invest in material capital expenditures for environmental control facilities for the remainder of our current fiscal year or for the next fiscal year. We are not aware of any pending actions, litigation or significant financial obligations arising from current or past environmental practices that are likely to have a material adverse impact on our financial position. However,
environmental problems relating to our properties could develop in the future, and such problems could require significant expenditures. In addition, we cannot predict changes in environmental legislation or regulations that may be adopted or enacted in the future and that may adversely affect us.
Significant Subsidiaries
As of March 2, 2011, the Company’s principal subsidiaries were STAAR Surgical AG and STAAR Japan Inc., which STAAR wholly owns. The activities of each are described above.
Employees
As of January 28, 2011, we employed approximately 279 persons.
Code of Ethics
STAAR has adopted a Code of Ethics that applies to all of its directors, officers, and employees. The Code of Ethics is posted on the Company’s website, www.staar.com — Investor Relations: Corporate Governance.
Additional Information
We make available free of charge through our website, www.staar.com, our Annual Report on Form 10-K, Quarterly Reports on Form 10-Q, Current Reports on Form 8-K and amendments to any reports filed or furnished pursuant to Section 13(a) of the Securities Exchange Act of 1934, as soon as reasonably practicable, after those reports are filed with or furnished to the Securities and Exchange Commission (“SEC”).
The public may read any of the items we file with the SEC at the SEC’s Public Reference Room at 100 F Street, NE, Washington, DC 20549. The public may obtain information about the operation of the Public Reference Room by calling the SEC at 1-800-SEC-0330. The SEC also maintains an Internet site that contains reports, proxy and information statements, and other information regarding the Company and other issuers that file electronically with the SEC at http://www.sec.gov.
14
Glossary
The following glossary is intended to help the reader understand some of the terms used in this Report.
accommodation – the eye’s ability to adjust its focus at all distances between near and far. This ability tends to decline with age.
accommodating IOL – a type of IOL designed to restore some degree of variable near-and-far focus after cataract surgery.
acrylic – a broadly used family of plastics. Acrylic materials used in IOLs have been both water repelling (hydrophobic) and water-absorbing (hydrophilic). The most popular IOLs in the U.S., Europe and Japan are made of a flexible, water-repellent acrylic material.
anterior chamber – the space in the eye between the cornea and the iris.
aspheric – aspheric lenses are lenses that are designed in a shape that creates a more clearly focused image than traditional spheric lenses. By reducing spherical aberrations, IOLs that feature aspheric optics generally deliver better night vision and contrast sensitivity than spheric IOLs.
astigmatism is a refractive disorder in which partially blurred vision results from an irregularly shaped cornea or, in some cases, a defect in the natural lens, produces a distorted image on the retina. The astigmatic eye is sometimes said to be slightly football-shaped rather than being a perfect sphere.
blended vision – a name used by some surgeons to refer to a modified monovision strategy for cataract patients. Using IOLs like nanoFLEX that provide a certain degree of intermediate vision, the surgeon corrects the two eyes for near and far vision with a difference between eyes that is less than conventional monovision, averaging 1.3 diopters. Surgeons using this method have reported that patients adapt to blended vision more readily than to conventional monovision, and report good binocular vision at all distances.
cataract – a common age-related eye disorder that involves the hardening and loss of transparency of the natural crystalline lens, impairing visual acuity.
CMS – an acronym for the Centers for Medicare and Medicaid Services, the federal agency that administers and establishes rules for the U.S. Medicare and Medicaid reimbursement systems.
collagen copolymer - collagen copolymers are compounds formed by joining molecules of collagen derived from biological sources with synthetic monomer molecules. STAAR’s Collamer® is a collagen copolymer engineered specifically for use in implantable lenses.
Collamer® - the brand name for STAAR’s proprietary collagen copolymer lens material. Collamer is composed of a poly-HEMA-based copolymer, collagen and a UV-absorbing chromophore. Collamer lenses have a high water content, are biocompatible and are designed to mimic the optical properties and flexibility of the natural lens in the human eye.
contrast sensitivity - the ability to visually distinguish an object from its background.
crystalline lens – the natural lens that is present in the eye at birth, which is a clear structure located behind the iris that changes shape to focus light onto the retina.
decentration – decentration of an IOL is a displacement of an IOL after implantation in the eye such that the IOL’s central axis is not perfectly aligned with the visual axis of the eye. STAAR developed its proprietary aspheric design to perform well even if decentered.
excimer laser – a specialized ultraviolet laser used in ophthalmology to cut or shape eye tissue. The excimer laser is used during LASIK and PRK surgery.
foldable IOL – an intraocular lens made of flexible material, which can be inserted with an injector system through a small incision in minimally invasive cataract surgery.
glaucoma – a progressive and degenerative condition, usually associated with elevated fluid pressure in the eye, in which the optic nerve may be damaged, resulting in irreversible loss of vision. Glaucoma is a leading cause of blindness worldwide.
15
haptic – the part of an IOL that contacts the structures of the eye and holds the IOL in place. IOLs in which the haptic is also a part of the optic material is called a single-piece IOL while IOLs in which the haptics are attached to the optic is called a three-piece IOL.
hyperopia – the refractive disorder commonly known as farsightedness, which occurs when the eye’s lens focuses images behind the plane of the retina. A person with hyperopia cannot see close objects without glasses or contact lenses. Because presbyopia often results in the need for reading glasses, it is sometimes confused with farsightedness.
HICL – an acronym for a Visian ICL product used to treat hyperopia (farsightedness).
ICL – an acronym for “implantable Collamer lens,” the Visian ICL is a folding lens implanted in the eye to correct refractive errors like myopia that have traditionally been corrected with eyeglasses or contact lenses. The ICL is within a product category referred to as phakic IOLS or phakic implants because they work with the patient’s natural lens, or phakos, rather than replacing it.
intraocular – within the eye.
iris – the muscular curtain located behind the cornea, which opens and closes to regulate the amount of light entering the eye through the pupil, which is an opening at the center of the iris. The iris carries the blue or brown pigment that gives the eye its color.
injector or injector system – a device, in the form of a syringe, that is used to deliver a foldable IOL into the eye through a slender nozzle in minimally invasive cataract surgery.
laser eye surgery – a generic term for LASIK and PRK.
LASIK – an acronym for laser-assisted in-situ keratomileusis, a surgical operation that reshapes the cornea to correct nearsightedness, farsightedness, or astigmatism. LASIK involves first the cutting of a hinged flap to separate the surface layer of the cornea, using a microkeratome (a special blade) or a laser. An excimer laser is then used to burn tissue away and reshape the inner cornea, after which the flap is returned to position.
monovision – a strategy for treating presbyopia where one eye – usually the dominant one – is corrected for distance vision and the other is corrected for near vision. This treatment method, which has been used with contact lenses and LASIK and with IOLs in cataract patients, depends on the patient’s neural visual system adapting to fuse the differing information into a continuous visual field from near to far. Because of the significant disparity between the correction of the two eyes – usually 1.5D to 2.OD – depth perception and contrast sensitivity
are somewhat compromised by monovision and some patients cannot tolerate it at all.
multifocal IOL – a type of IOL that creates zones in the visual field for distance, far and near vision, similar to the near and far zones in bifocal glasses.
myopia – the refractive disorder also known as nearsightedness, which occurs when the eye’s lens focuses images in front of the retina rather than on the retinal surface. A person with myopia cannot clearly see distant objects without glasses or contact lenses.
nanoFLEX – a single-piece Collamer aspheric IOL that can be implanted through a 2.2 mm incision with the complementary nanoPOINT injector system.
ophthalmologist – a surgeon who specializes in the diseases and disorders of the eye and the visual pathway related to it.
optometrist - a doctor who diagnoses disorders of the eye and prescribes eyeglasses and contact lenses for refractive disorders, but does not perform surgery.
ophthalmic – of or related to the eye.
optic – the central part of an IOL, the part that functions as a lens and focuses images on the retina.
phakic IOL or phakic implant – an artificial lens that is implanted to work along with the patient’s natural lens is called a phakic IOL or phakic implant, from the Greek word for lens, phakos. This is the product class to which the Visian line of products belongs. IOLs that treat cataracts are sometimes called aphakic IOLs because they are implanted in patients whose natural lenses have been removed.
16
phacoemulsification is a small-incision procedure used to remove a cataract patient’s cloudy lens before implantation of an IOL. Phacoemulsification uses ultrasound to break up the tissue of the crystalline lens, and then uses suction to draw it the tissue out through the small incision.
PMMA IOLs are IOLs made of polymethylmethacrylate, an inflexible material largely replaced by flexible materials such as acrylic and silicone.
posterior chamber is the space in eye behind the iris and in front of the natural crystalline lens.
Preloaded Injector - a silicone or acrylic IOL packaged and shipped in a pre-sterilized, disposable injector. The conventional method of packaging IOLs requires the surgeon or an assistant to manually load each lens into an injector before surgery.
presbyopia – an age-related condition in which the crystalline lens loses its ability to focus on both near and far objects. People who have had normal vision will typically begin to need glasses for reading or other close tasks at some point after age 40 due to presbyopia.
presbyopic IOLs are IOLs that are designed to restore some degree of near and far visual acuity after cataract surgery.
PRK – an acronym for photorefractive keratectomy, a surgical operation that reshapes the surface of the cornea to correct nearsightedness, farsightedness and astigmatism. PRK involves the use of an excimer laser to ablate, or burn, small amounts of tissue from the cornea. PRK differs from LASIK, which employs a flap to gain access to the corneal bed, then uses the excimer laser to shape the corneal bed rather than the surface of the cornea.
refractive disorders are visual disorders that affect the ability of the eye’s optical system to create a sharply focused image. Refractive disorders include myopia (nearsightedness), hyperopia (farsightedness), astigmatism and presbyopia. These are the visual disorders that have traditionally been treated with eyeglasses and contact lenses, and more recently with refractive surgery. Glaucoma, cataracts and macular degeneration are examples of visual impairment that are not refractive disorders.
refractive market – as used in this report “refractive market” means the overall market volume for refractive surgical procedures of all kinds, including LASIK, PRK, the Visian product family and other phakic IOLs. As used in this report, the term does not does not include sales of non-surgical products like eyeglasses and contact lenses.
refractive surgery – operative procedures intended to correct or reduce refractive disorders. In addition to the implantation of the Visian ICL, common refractive surgeries include LASIK and PRK.
retina - a layer of nerve tissue at the back of the eye consisting of millions of light receptors called rods and cones, which receive the light image and transmit it to the brain via the optic nerve.
silicone – a type of plastic often used in implantable devices that is inert, generally flexible and water-repelling.
single-piece IOL – in a single piece IOL the haptics and the optic are fashioned from a single piece of lens material.
spheric lenses – a spheric lens has surfaces that are shaped like sections of a sphere. The sphere is not an ideal shape for an optically accurate lens, but spherical surfaces have historically been the simplest lens shape to make. Spheric lenses have spherical aberrations – small errors in focus that become more pronounced at the edge of the lens When a spheric IOL is placed in the human eye, these aberrations can reduce night vision and contrast sensitivity.
three-piece IOL – a three-piece IOL has a central, disk-shaped optic and two spring-like haptics attached at either side. The haptics are positioned against structures of the eye to hold the IOL in place.
toric – refers to the shape of a lens designed to correct astigmatism, which has greater refractive power in some sections of the lens than others.
TICL – an acronym for “Toric implantable Collamer lens,” a variant of the ICL that corrects both myopia or hyperopia and astigmatism.
17
Visian – STAAR’s brand name for its family of phakic intraocular lenses, including the Visian ICL, Visian TICL and Visian HICL.
Item 1A. Risk Factors
Our short and long-term success is subject to many factors that are beyond our control. Investors and prospective investors should consider carefully the following risk factors, in addition to other information contained in this report. This Annual Report on Form 10-K contains forward-looking statements, which are subject to a variety of risks and uncertainties. We have identified our known, significant risk factors below.
Risks Related to Our Business
We have a history of losses which could continue in the future.
We have reported losses during the last several fiscal years and have an accumulated deficit of $132.0 million as of December 31, 2010. There can be no assurance that we will report net income in any future period.
We have only limited working capital and limited access to financing.
We began generating cash from operations in 2009 after six consecutive years when our cash requirements exceeded the level of cash generated by operations. We may not be able to sustain positive cash flow, and unexpected cash needs could exceed the amount of cash we generate. While we believe our capital resources and funds generated by operations are sufficient to operate our business and satisfy our obligations, if unexpected events increase our expenses or harm the performance of our business we may need to seek additional financing. We may also be presented with opportunities to expand our business that require additional financing. Should we need additional working capital, our ability to raise financing through sales of equity securities depends on general market
conditions and the demand for STAAR’s common stock. We may be unable to raise adequate capital through sales of equity securities, and if our stock has a low market price at the time of such sales our existing stockholders could experience substantial dilution. Because of our history of losses STAAR may also have difficulty obtaining debt financing on acceptable terms or renewing existing debt facilities. An inability to secure additional financing if it is needed in the future could require us to forego opportunities for expansion, reduce existing operations, or even jeopardize our ability to continue operations.
Our defined benefit pension plans are currently underfunded and we may be subject to significant increases in pension benefit obligations under those pension plans.
We sponsor two defined benefit pension plans through our wholly owned Swiss and Japanese subsidiaries. Both plans are underfunded and may require significant cash payments. We contributed $248,000 to our Swiss Plan and although we did not contribute to our Japan Plan, we made benefit payments of $79,000.
Beginning October 1, 2009, as part of the Amendment of the Japan Plan discussed in Note 13 to the consolidated financial statements included in this report, STAAR Japan will maintain and administer the Japan Plan, including paying the pension benefits as they are due solely from its continuing operations. STAAR Japan is not required to make any contributions to the Japan Plan in order to meet future pension benefit obligations, and does not expect to do so. As a result, STAAR Japan has no plan assets now and does not expect to have any in the future.
STAAR determines its pension benefit obligations and funding status using many assumptions, such as inflation, investment rates, mortality, turnover and interest rates, as applicable, any of which could prove to be different than projected. If the investment performance does not meet our expectations, or if other actuarial assumptions are modified, or not realized, we may be required to contribute more than we currently expect and increase our future pension benefit obligations to be funded from our operations.
Our pension plans in the aggregate are underfunded by approximately $2.6 million ($0.8 million for the Japan Plan and $1.8 million for the Swiss Plan) as of December 31, 2010.
If our cash flow from operations is insufficient to fund our worldwide pension obligations, we may be materially and adversely harmed and have to seek additional capital.
18
We may have limited ability to fully use our recorded tax loss carryforwards.
We have accumulated approximately $119.6 million of U.S. federal tax net operating loss carryforwards as of December 31, 2010 to be used in future quarters if we become profitable. If we were to experience a significant change in ownership, Internal Revenue Code Section 382 may restrict the future utilization of these tax loss carryforwards even if we become profitable and these tax loss carryforwards will begin to expire between 2020 and 2030.
FDA compliance issues have delayed approvals and we expect to devote significant resources to maintaining compliance in the future.
The Office of Compliance of the FDA’s Center for Devices and Radiological Health regularly inspects STAAR’s facilities to determine whether we are in compliance with the FDA Quality System Regulations relating to such things as manufacturing practices, validation, testing, quality control, product labeling and complaint handling, and in compliance with FDA Medical Device Reporting regulations and other FDA regulations. The FDA also regularly inspects for compliance with regulations governing clinical investigations.
Based on the results of regularly scheduled inspections of the Nidau, Switzerland facility between June 2 and June 5, 2009 and of the Monrovia, California facility, between February 23 and March 4, 2009, STAAR believes that it is substantially in compliance with the FDA’s Quality System Regulations and Medical Device Reporting regulations Maintaining compliance with FDA regulations requires constant vigilance, and past deficiencies observed at STAAR have led to FDA Warning Letters and delays in product approvals until we resolved agency concerns.
On June 26, 2007 STAAR received a Warning Letter from the FDA citing four areas of noncompliance noted by the FDA’s Bioresearch Monitoring branch during its inspection of STAAR’s clinical study procedures, practices, and documentation related to the TICL. The Office of Device Evaluation cited the same deficiencies in a letter placing an integrity hold on the TICL application. On July 21, 2009, the FDA indicated that it was satisfied with corrective actions taken by STAAR to resolve these deficiencies, and removed the integrity hold.
STAAR’s ability to continue its U.S. business depends on the continuous improvement of its quality systems and its compliance with FDA regulations. Accordingly, for the foreseeable future STAAR’s management expects to continue to devote significant resources and attention to those efforts. STAAR cannot ensure that its efforts will be successful. Any failure to demonstrate substantial compliance with FDA regulations can result in enforcement actions that terminate, suspend or severely restrict our ability to continue manufacturing and selling medical devices. Please see the related risks discussed under the headings “We are subject to extensive government regulation, which increases our costs and could prevent us from selling our products
” and “We are subject to federal and state regulatory investigations.”
FDA approval of the Toric ICL, which could have a significant U.S. market, has been considerably delayed.
Part of STAAR’s strategy to increase U.S. sales of refractive products has been a plan to introduce the Toric ICL, or TICL, a variant of the ICL that corrects both astigmatism and myopia in a single lens and that is currently marketed outside the U.S. STAAR believes the TICL also has a significant potential market in the U.S. and could accelerate growth of the overall refractive product line. STAAR submitted a supplemental PMA for the TICL in April 2006. In August 2007 the FDA placed an integrity hold on the PMA and suspended its consideration of the PMA until STAAR completed specified actions to satisfy FDA concerns regarding deficiencies in STAAR’s oversight of past clinical activities. The integrity hold was removed, and consideration of the application resumed on
July 21, 2009. On February 3, 2010, STAAR received a letter of deficiency from the FDA outlining additional questions and requesting labeling changes related to the TICL application. STAAR responded to the deficiency letter on August 2, 2010. STAAR cannot predict when or if the Toric ICL may be approved.
Continued effects of the global recession could reduce sales of our refractive products.
The global economy continues to suffer the effects of the severe recession that began in mid-2008. While the U.S. economy has resumed growth, employment, consumer spending and consumer confidence have not recovered to pre-recession levels in the U.S. Many regions of the world remain severely affected, including Spain, which has been a significant market for the ICL and TICL. Recovery may be slow or incomplete, and the global economy remains vulnerable to new setbacks from a variety of causes.
Refractive surgery is an elective procedure generally not covered by health insurance. Patients must pay for the procedure, frequently through installment financing arrangements. They can defer the choice to have refractive surgery if they lack the disposable income to pay for it or do not feel their income is secure in the current economic climate. Laser refractive surgery has experienced a significant decrease in demand globally. If the economic recovery does not become stronger, or if the global economy falls back into recession, Visian ICL sales could continue to grow slowly or decline. Because the Visian ICL is STAAR’s fastest growing and highest gross margin product, restricted growth or a decline in its sales could materially harm STAAR’s
business.
19
Negative publicity concerning complications of laser eye surgery could reduce the demand for our refractive products as well.
Negative publicity about laser eye surgery has appeared in the U.S. and some other refractive surgery markets. For example, on April 25, 2008, the FDA Ophthalmic Devices Panel held a public meeting to discuss reports of medical complications and customer satisfaction following refractive surgery. The resulting publicity broadened public awareness of the potential complications of refractive surgery and potential patient dissatisfaction, in particular as a result of LASIK and other corneal laser-based procedures. These concerns may have, in part, been a factor in the steep decline in demand for such procedures from 2008 through 2010. Concerns about complications of refractive laser eye surgery could encourage more patients and doctors to select the Visian ICL as
an alternative, but could also decrease patient interest in all refractive surgery, including Visian ICL. Depending on the nature and severity of future negative publicity about refractive surgery, the growth of ICL sales in the U.S. could be limited or sales could decline as a result. Because nearly all candidates for refractive surgery can achieve acceptable vision through the use of spectacles or contact lenses, for most patients the decision to have refractive surgery is a lifestyle choice that depends on high confidence in achieving a satisfactory outcome.
Strikes, slow-downs or other job actions by doctors can reduce sales of cataract-related products.
In many countries where STAAR sells its products, doctors, including ophthalmologists, are employees of the government, government-sponsored enterprises or large health maintenance organizations. In recent years employed doctors who object to salary limitations, working rules, reimbursement policies or other conditions have sought redress through strikes, slow-downs and other job actions. These actions often result in the deferral of non-essential procedures, such as cataract surgeries, which affects sales of our products. Depending on the importance of the affected region to STAAR’s business, the length of the action and its pervasiveness, job actions by doctors can materially reduce our sales and earnings.
We could experience losses due to product liability claims.
We have been subject to product liability claims in the past and may experience such claims in the future. Product liability claims against us may exceed the coverage limits of our insurance policies or cause us to record a loss in excess of our deductible. A product liability claim that exceeds our insurance coverage could materially harm our business, financial condition and results of operations. Even if a product liability loss is covered by an insurance policy, we must generally pay for losses until they reach the level of the policy’s stated deductible or retention amount after which the insurer begins paying. The payment of retentions or deductibles for a significant amount of claims could have a material adverse
effect on our business, financial condition, and results of operations.
Any product liability claim would divert managerial and financial resources and could harm our reputation with customers. We cannot assure you that we will not have product liability claims in the future or that such claims would not have a material adverse effect on our business.
We compete with much larger companies.
Our competitors, including Alcon, Abbott Medical Optics and Bausch & Lomb have much greater financial resources than we do and some of them have large international markets for a full suite of ophthalmic products. Their greater resources for research, development and marketing, and their greater capacity to offer comprehensive products and equipment to providers, make it difficult for us to compete. We have lost significant market share to some of our competitors.
The global nature of our business may result in fluctuations and declines in our sales and profits.
Our products are sold in in more than 50 countries. Sales from international operations make up a significant portion of our total sales. For the fiscal year ended December 31, 2010, sales from international operations were 73% of our total sales. The results of operations and the financial position of certain of our foreign operations are reported in the relevant local currencies and then translated into U.S. dollars at the applicable exchange rates for inclusion in our consolidated financial statements, exposing us to translation risk. In addition, we are exposed to transaction risk because some of our expenses are incurred in a different currency from the currency in which our sales are received. Our most significant currency exposures are to the Japanese Yen, Euro, and the Swiss Franc. The exchange rates
between these and other local currencies and the U.S. dollar may fluctuate substantially. We have not attempted to offset our exposure to these risks by investing in derivatives or engaging in other hedging transactions.
20
Economic, social and political conditions, laws, practices and local customs vary widely among the countries in which we sell our products. Our operations outside of the U.S. face a number of risks and potential costs, enjoy less stringent protection of intellectual property and face economic, political and social uncertainty in some countries, especially in emerging markets. Our continued success as a global company depends, in part, on our ability to develop and implement policies and strategies that are effective in anticipating and managing these and other risks in the countries where we do business. These and other risks may have a material adverse effect on our operations in any particular country and on our business as a whole. We price some of our products in U.S. dollars, and as a result changes in
exchange rates can make our products more expensive in some offshore markets and reduce our sales. Inflation in emerging markets also makes our products more expensive there and increases the credit risks to which we are exposed.
The success of our international operations depends on our successfully managing our foreign subsidiaries.
We conduct most of our international business through wholly owned subsidiaries. Managing distant subsidiaries and fully integrating them into STAAR’s business is challenging. While STAAR seeks to integrate its foreign subsidiaries fully into its operations, direct supervision of every aspect of their operations is impossible, and as a result STAAR relies on its local managers and staff. Cultural factors, language differences and the local legal climate can result in misunderstandings among internationally dispersed personnel, and increase the risk of failing to meet U.S. and foreign legal requirements, including with respect to the Sarbanes-Oxley Act of 2002 and the U.S. Foreign Corrupt Practices Act. These risks increased after we completed the acquisition of STAAR Japan Inc., and, notwithstanding the
March 2, 2010 sale of Domilens, our German distribution subsidiary, these risks remain significant. The risk that unauthorized conduct may go undetected will always be greater in foreign subsidiaries.
Our activities involve hazardous materials and emissions and may subject us to environmental liability.
Our manufacturing, research and development activities involve the use of hazardous materials. Federal, state and local laws and regulations govern the use, manufacturing, storage, handling and disposal of these materials and certain waste products in the places where we have operations. We cannot completely eliminate the risk of accidental contamination or injury from these materials. Remedial environmental actions could require us to incur substantial unexpected costs, which would materially and adversely affect our results of operations. If we were involved in an environmental accident or found to be in substantial non-compliance with applicable environmental laws, we could be held liable for damages or penalized with fines.
We depend on key employees.
We depend on the continued service of our senior management and other key employees. The loss of a key employee could hurt our business. We could be particularly hurt if any key employee or employees went to work for competitors. Our future success depends on our ability to identify, attract, train, motivate and retain other highly skilled personnel. Failure to do so may adversely affect our results. We do not maintain insurance policies to cover the cost of replacing the services of any of our key employees who unexpectedly die or become disabled.
Changes in accounting standards could affect our financial results.
The accounting rules applicable to public companies like STAAR are subject to frequent revision. Future changes in accounting standards could require us to change the way we calculate income, expense or balance sheet data, which could significantly change our reported results of operation or financial condition.
We are subject to international tax laws that could affect our financial results.
STAAR conducts international operations through its subsidiaries. Tax laws affecting international operations are highly complex and subject to change. STAAR’s payment of income tax in the different countries where it operates depends in part on internal settlement prices and administrative charges among STAAR and its subsidiaries. These arrangements require judgments by STAAR and are subject to risk that tax authorities will disagree with those judgments and impose additional taxes, penalties or interest on STAAR. In addition, transactions that STAAR has arranged in light of current tax rules could have unforeseeable negative consequences if tax rules change.
21
If we suffer loss to our facilities due to catastrophe, our operations could be seriously harmed.
We depend on the continuing operation of our manufacturing facilities in California, Japan and Switzerland, which have little redundancy or overlap among their activities. Our facilities could suffer catastrophic loss due to fire, flood, earthquake, terrorism or other natural or man-made disasters. Our California and Japanese facilities are in areas where earthquakes could cause catastrophic loss. If any of these facilities were to experience a catastrophic loss, it could disrupt our operations, delay production, shipments and revenue and result in large expenses to repair or replace the facility. Our insurance for property damage and business interruption may not be sufficient to cover any particular loss, and we do not carry insurance or reserve funds for interruptions or potential losses arising from
earthquakes or terrorism.
Most of our products have single-site manufacturing approvals, exposing us to risks of business interruption.
We manufacture all of our products at our facilities in California, Switzerland, and Japan. Most of our products are approved for manufacturing only at one of these sites. Before we can use a second manufacturing site for an implantable device we must obtain the approval of regulatory authorities. Because this process is expensive we have generally not sought approvals needed to manufacture at an additional site. If a natural disaster, fire, or other serious business interruption struck one of our manufacturing facilities, it could take a significant amount of time to validate a second site and replace lost product. We could lose customers to competitors, thereby reducing sales, profitability and market share.
If we are unable to protect our information systems against data corruption, cyber-based attacks or network security breaches, our operations could be disrupted.
We depend on information technology networks and systems, including the Internet, to process, transmit and store electronic information. In particular, our information technology infrastructure handles electronic communications among our locations around the world and between our personnel and our subsidiaries, customers, and suppliers. Security breaches of this infrastructure can create system disruptions, shutdowns or unauthorized disclosure of confidential information. If we are unable to prevent such security breaches, our operations could be disrupted or we may suffer financial damage or loss because of lost or misappropriated information.
Risks Related to the Ophthalmic Products Industry
If we recall a product, the cost and damage to our reputation could harm our business.
Medical devices must be manufactured to the highest standards and tolerances, and often incorporate newly developed technology. From time to time defects or technical flaws in medical devices may not come to light until after the products are sold or consigned. In those circumstances, like others in our industry, we have voluntarily recalled our products. Similar recalls could take place again. We may also be subject to recalls initiated by manufacturers of products we distribute. Courts or regulators can also impose mandatory recalls on us, even if we believe our products are safe and effective. STAAR believes that in recent years it has been less affected by recalls than most of its U.S. competitors, but cannot eliminate the risk of a material recall in the future. Recalls can
result in lost sales of the recalled products themselves, and can result in further lost sales while replacement products are manufactured, especially if the replacements must be redesigned. If recalled products have already been implanted, we may bear some or all of the cost of corrective surgery. Recalls may also damage our professional reputation and the reputation of our products. The inconvenience caused by recalls and related interruptions in supply, and the damage to our reputation, could cause professionals to discontinue using our products.
If we fail to keep pace with advances in our industry or fail to persuade physicians to adopt the new products we introduce, customers may not buy our products and our sales may decline.
Constant development of new technologies and techniques, frequent new product introductions and strong price competition characterize the ophthalmic industry. The first company to introduce a new product or technique to market usually gains a significant competitive advantage. Our future growth depends, in part, on our ability to develop products to treat diseases and disorders of the eye that are more effective, safer, or incorporate emerging technologies better than our competitors’ products. Sales of our existing products may decline rapidly if one of our competitors introduces a superior product, or if we announce a new product of our own. If we fail to make sufficient investments in research and development or if we focus on technologies that do not lead to better products, our current and planned
products could be surpassed by more effective or advanced products. In addition, we must manufacture these products economically and market them successfully by persuading a sufficient number of eye-care professionals to use them.
22
Resources devoted to research and development may not yield new products that achieve commercial success.
We spent about 10% of our sales on research and development during the fiscal year ended December 31, 2010, and we expect to spend similar amounts for this purpose in future periods. Development of new implantable technology, from discovery through testing and registration to initial product launch, is expensive and typically takes from three to seven years. Because of the complexities and uncertainties of ophthalmic research and development, products we are currently developing may not complete the development process or obtain the regulatory approvals required for us to market the products successfully. Any of the products currently under development may fail to become commercially successful.
Changes in reimbursement for our products by third-party payors could reduce sales of our products or make them less profitable.
Many of our products, in particular IOLs and products related to the treatment of glaucoma, are used in procedures that are typically covered by health insurance, HMO plans, Medicare, Medicaid, or other governmental sponsored programs both in and outside the U.S. Third party payors in both government and the private sector continue to seek to manage costs by restricting the types of procedures they reimburse to those viewed as most cost-effective and by capping or reducing reimbursement rates. Whether they limit reimbursement prices for our products or limit the surgical fees for a procedure that uses our products, these policies can reduce the sales volume of our reimbursed products, their selling prices or both. Future cost cutting initiatives could result in unexpected reductions in the reimbursement
rates for IOLs and related products. In some countries government insurers have sought to control costs by limiting the total number of procedures they will reimburse. The U.S. Congress is currently considering legislative proposals that would significantly change the system of public and private health care reimbursement, and will likely consider such changes again in the future. We are not able to predict whether new legislation or changes in regulations will take effect at the state or federal level, but if enacted these changes could significantly and adversely affect our business.
We are subject to extensive government regulation worldwide, which increases our costs and could prevent us from selling our products.
STAAR is regulated by regional, national, state and local agencies. In the U.S. our regulators include the Food and Drug Administration, the Department of Justice, the Federal Trade Commission, the Office of the Inspector General of the U.S. Department of Health and Human Services and other regulatory bodies, as well as governmental authorities in those foreign countries in which we manufacture or distribute products. The Federal Food, Drug, and Cosmetic Act, the Public Health Service Act and other federal and state statutes and regulations govern the research, development, manufacturing and commercial activities relating to medical devices, including their pre-clinical and clinical testing, approval, production, labeling, sale, distribution, import, export, post-market surveillance, advertising,
dissemination of information and promotion.
We are subject to similar regulatory regimes in other key regions of Europe and Asia, in particular Japan. Regulations worldwide are becoming more stringent. We have described in detail the regulations governing approval of medical devices and their manufacturing in the “Business – Regulatory Matters” section of this Report. We are also subject to government regulation over the prices we charge and any rebates we may offer to customers. Complying with government regulation substantially increases the cost of developing, manufacturing and selling our products.
Competing in the ophthalmic products industry requires us to introduce new or improved products and processes continuously, and to submit these to the FDA for approval. Obtaining FDA approval is a long and expensive process, and approval is never certain. In addition, our operations are subject to periodic inspection by the FDA and international regulators. An unfavorable outcome in an FDA inspection may result in the FDA ordering changes in our business practices or taking other enforcement action, which could be costly and severely harm our business.
Our new products could take a significantly longer time than we expect to gain regulatory approval and may never gain approval. If a regulatory authority delays approval of a potentially significant product, the potential sales of the product and its value to us can be substantially reduced. Even if the FDA or another regulatory agency approves a product, the approval may limit the indicated uses of the product, or may otherwise limit our ability to promote, sell and distribute the product, or may require post-marketing studies. If we cannot obtain timely regulatory approval of our new products, or if the approval is too narrow, we will not be able to market these products, which would eliminate or reduce our potential sales and earnings.
Investigations and allegations, whether or not they lead to enforcement action or litigation, can materially harm our business and our reputation.
Failure to comply with the requirements of the FDA or other regulators can result in civil and criminal fines, the recall of products, the total or partial suspension of manufacture or distribution, seizure of products, injunctions, whistleblower lawsuits, failure to obtain approval of pending product applications, withdrawal of existing product approvals, exclusion from participation in government healthcare programs and other sanctions. Any threatened or actual government enforcement action can also generate adverse publicity and require us to divert substantial resources from more productive uses in our business. Enforcement actions could affect our ability to distribute our products commercially and could materially harm our business.
23
From time to time STAAR is subject to formal and informal inquiries by regulatory agencies, which could lead to investigations or enforcement actions. Even when an inquiry results in no evidence of wrongdoing, is inconclusive or is otherwise not pursued, the agency generally is not required to notify STAAR of its findings and may not inform STAAR that the inquiry has been terminated.
STAAR maintains a hotline for employees to report any violation of laws, regulations or company policies anonymously, which is intended to permit STAAR to identify and remedy improper conduct. Nevertheless, present or former employees may elect to bring complaints to regulators and enforcement agencies. The relevant agency will generally be obligated to investigate such complaints to assess their validity and obtain evidence of any violation that may have occurred. In response to reports that its policies or applicable laws or regulations have been violated, STAAR may find it necessary to conduct its own intense investigations, which may be extensive. Even without a finding of misconduct, negative publicity about investigations or allegations of misconduct could harm our reputation with professionals and the market
for our common stock. Responding to investigations or conducting internal investigations can be costly, time-consuming and disruptive to our business.
We depend on proprietary technologies, but may not be able to protect our intellectual property rights adequately.
We rely on patents, trademarks, trade secrecy laws, contractual provisions and confidentiality procedures and copyright laws to protect the proprietary aspects of our technology. These legal measures afford limited protection and may not prevent our competitors from gaining access to our intellectual property and proprietary information. Any of our patents may be challenged, invalidated, circumvented or rendered unenforceable. Any of our pending patent applications may fail to result in an issued patent or fail to provide meaningful protection against competitors or competitive technologies. Litigation may be necessary to enforce our intellectual property rights, to protect our trade secrets and to determine the validity and scope of our proprietary rights. Any litigation could result in substantial expense, may
reduce our profits and may not adequately protect our intellectual property rights. In addition, we may be exposed to future litigation by third parties based on claims that our products infringe their intellectual property rights. This risk is exacerbated by the fact that the validity and breadth of claims covered by patents in our industry may involve complex legal issues that are open to dispute. Any litigation or claims against us, whether or not successful, could result in substantial costs and harm our reputation. Intellectual property litigation or claims could force us to do one or more of the following:
|
|
·
|
cease selling or using any of our products that incorporate the challenged intellectual property, which would adversely affect our sales;
|
|
|
·
|
negotiate a license from the holder of the intellectual property right alleged to have been infringed, which license may not be available on reasonable terms, if at all; or
|
|
|
·
|
redesign our products to avoid infringing the intellectual property rights of a third party, which may be costly and time-consuming or impossible to accomplish.
|
We may not successfully develop and launch replacements for our products that lose patent protection.
Most of our products are covered by patents that, if valid, give us a degree of market exclusivity during the term of the patent. We have also earned revenue in the past by licensing some of our patented technology to other ophthalmic companies. Generally, the legal life of a patent in the U.S. is 20 years from application. Patents covering our products will expire from this year through the next 20 years. Upon patent expiration, our competitors may introduce products using the same technology. Key patents covering the Collamer formulation and essential design features of the Visian ICL and TICL will expire between 2014 and 2016. As a result of this possible increase in competition, we may need to reduce our prices to maintain sales of our products, which would make them less profitable.
If we fail to develop and successfully launch new products prior to the expiration of patents for our existing products, our sales and profits with respect to those products could decline significantly. We may not be able to develop and successfully launch more advanced replacement products before these and other patents expire.
24
Risks Related to Ownership of Our Common Stock
Our charter documents could delay or prevent an acquisition or sale of our company.
Our Certificate of Incorporation empowers the Board of Directors to establish and issue a class of preferred stock, and to determine the rights, preferences and privileges of the preferred stock. These provisions give the Board of Directors the ability to deter, discourage or make more difficult a change in control of our company, even if such a change in control could be deemed in the interest of our stockholders or if such a change in control would provide our stockholders with a substantial premium for their shares over the then-prevailing market price for the common stock. Our bylaws contain other provisions that could have an anti-takeover effect, including the following:
|
|
·
|
stockholders have limited ability to remove directors;
|
|
|
·
|
stockholders cannot act by written consent;
|
|
|
·
|
stockholders cannot call a special meeting of stockholders; and
|
|
|
·
|
stockholders must give advance notice to nominate directors.
|
Anti-takeover provisions of Delaware law could delay or prevent an acquisition of our company.
We are subject to the anti-takeover provisions of Section 203 of the Delaware General Corporation Law, which regulates corporate acquisitions. These provisions could discourage potential acquisition proposals and could delay or prevent a change in control transaction. They could also have the effect of discouraging others from making tender offers for our common stock or prevent changes in our management.
Future sales of our common stock could reduce our stock price.
Our Board of Directors could issue additional shares of common or preferred stock to raise additional capital or for other corporate purposes without stockholder approval. In addition, the Board of Directors could designate and sell a class of preferred stock with preferential rights over the common stock with respect to dividends or other distributions. Sales of common or preferred stock could dilute the interest of existing stockholders and reduce the market price of our common stock. Even in the absence of such sales, the perception among investors that additional sales of equity securities may take place could reduce the market price of our common stock.
The market price of our common stock is likely to be volatile.
Our stock price has fluctuated widely, ranging from $3.00 to $6.74 per share during the year ended December 31, 2010 and was $5.75 on March 1, 2011. Our stock price could continue to experience significant fluctuations in response to factors such as market perceptions, quarterly variations in operating results, operating results that vary from the expectations of securities analysts and investors, changes in financial estimates, changes in market valuations of competitors, announcements by us or our competitors of a material nature, additions or departures of key personnel, future sales of Common Stock and stock volume fluctuations. Also, general political and economic conditions such as recession or interest rate fluctuations may adversely affect the market price of our stock.
Item 1B. Unresolved Staff Comments
None
Item 2. Properties
Our operations are conducted in leased facilities throughout the world. Our executive offices, manufacturing, warehouse and distribution, and primary research facilities are located in Monrovia, California. STAAR Surgical AG maintains office, manufacturing, and warehouse and distribution facilities in Nidau, Switzerland. The Company has one additional facility in Aliso Viejo, California for raw material production and research and development activities. STAAR Japan maintains executive offices and distribution facilities in Shin-Urayasu, Japan and a manufacturing and R&D facility in Ichikawa City, Japan. The Company leases an additional sales and distribution facility in Australia. We believe our manufacturing facilities in the U.S., Switzerland and Japan are suitable and adequate for our current and future
planned requirements. The Company could increase capacity by adding additional shifts at our existing facilities.
25
Item 3. Legal Proceedings
From time to time the Company is subject to various claims and legal proceedings arising out of the normal course of our business. These claims and legal proceedings relate to contractual rights and obligations, employment matters, and claims of product liability. STAAR maintains insurance coverage for product liability claims but may not be insured against other potentially material claims. While the Company does not believe that any of the claims known is likely to have a material adverse effect on its financial condition or results of operations, new claims or unexpected results of existing claims could lead to significant financial harm.
26
PART II
Item 5. Market for Registrant’s Common Equity, Related Stockholder Matters, and Issuer Purchases of Equity Securities
Market Information
Our common stock is traded on the Nasdaq Global Market (Nasdaq) under the symbol “STAA.” The following table sets forth the high and low per share sale prices of our common stock as reported by Nasdaq.
|
Period
|
High
|
Low
|
||||||
|
Year ended December 31, 2010
|
||||||||
|
Fourth Quarter
|
$ | 6.28 | $ | 4.89 | ||||
|
Third Quarter
|
6.74 | 4.20 | ||||||
|
Second Quarter
|
5.98 | 3.56 | ||||||
|
First Quarter
|
3.97 | 3.00 | ||||||
|
Year ended January 1, 2010
|
||||||||
|
Fourth Quarter
|
$ | 4.24 | $ | 2.47 | ||||
|
Third Quarter
|
4.26 | 1.90 | ||||||
|
Second Quarter
|
3.44 | .79 | ||||||
|
First Quarter
|
2.78 | .80 | ||||||
Holders
As of February 18, 2011, there were approximately 495 record holders of our Common Stock.
Dividends
We have not paid any cash dividends on our Common Stock since our inception. We currently expect to retain any earnings for use to further develop our business and not to declare cash dividends on our Common Stock in the foreseeable future. The declaration and payment of any such dividends in the future depends upon the Company’s earnings, financial condition, capital needs and other factors deemed relevant by the Board of Directors and may be restricted by future agreements with lenders.
Stock Performance Graph
This performance graph shall not be deemed “filed” for purposes of Section 18 of the Securities Exchange Act of 1934, as amended (the Exchange Act), or incorporated by reference into any filing of STAAR Surgical Company under the Securities Act of 1933, as amended, or the Exchange Act, except as shall be expressly set forth by specific reference in such filing.
The following graph shows a comparison from December 30, 2005 through December 31, 2010 of the cumulative total return for our common stock, the NASDAQ Stock Market (US and Foreign Companies, and NASDAQ Standard Industrial Classification (SIC) codes in the range of 3841-3851 (Surgical, Medical, and Dental Instruments and Supplies and Ophthalmic Goods). The Company’s SIC code is 3851. We have selected the range of SIC codes 3841-3851 as a group of peer companies based on the general similarity of businesses in these industries to STAAR’s business. In previous years we have compared our performance to companies in the range of 3840 to 3849 (Surgical, Medical, and Dental Instruments and Supplies). This year, we are adding code 3851 (Ophthalmic Devices) to
include previously omitted peer companies that are classified as operating primarily in the ophthalmic device business. STAAR believes that including these companies will make the peer group more closely comparable to STAAR’s business. During this year of transition, the performance graph shows performance of both the old and the new peer groups.
Returns in the graph below are based on historical results and are not intended to suggest future performance. The data assumes $100 was invested on December 30, 2005 in STAAR common stock and in each of the indices, and that dividends were reinvested. We have never paid dividends on our common stock and have no present plans to do so.
27
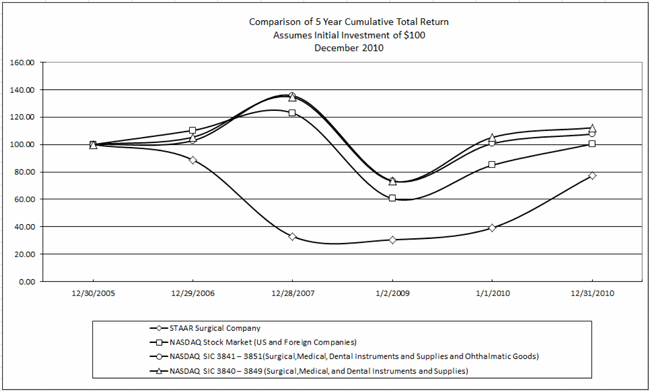
Prepared by Zacks Investment Research, Inc. Used with Permission. All rights reserved.
|
Total Returns Index for:
|
12/2005 | 12/2006 | 12/2007 | 1/2009 | 1/2010 | 12/2010 | ||||||||||||||||||
|
STAAR SURGICAL CO
|
100.0 | 88.73 | 32.91 | 30.51 | 39.24 | 77.22 | ||||||||||||||||||
|
NASDAQ Stock Market (US & Foreign)
|
100.0 | 110.30 | 122.95 | 60.50 | 84.93 | 100.37 | ||||||||||||||||||
|
NASDAQ SIC 3841-3851 (Surgical, Medical, and Dental Instruments and Supplies and Ophthalmic Goods)
|
100.0 | 102.84 | 135.61 | 73.52 | 100.71 | 107.63 | ||||||||||||||||||
|
NASDAQ SIC 3840 – 3849 (Surgical, Medical, and Dental Instruments and Supplies)
|
100.0 | 105.40 | 134.46 | 73.30 | 105.24 | 112.23 |
Notes:
A. The lines represent monthly index levels derived from compounded daily returns that include all dividends.
B. The indexes are reweighted daily, using the market capitalization on the previous trading day.
C. If the monthly interval, based on the fiscal year-end, is not a trading day, the preceding trading day is used.
D. The index level for all series was set to $100.0 on December 31, 2005.
28
Item 6. Selected Financial Data
The following table sets forth selected consolidated financial data with respect to the five most recent fiscal years ended December 31, 2010, January 1, 2010, January 2, 2009, December 28, 2007, and December 29, 2006. The selected consolidated statement of operations data set forth below for each of the three most recent fiscal years, and the selected consolidated balance sheet data set forth below at December 31, 2010 and January 1, 2010, derive from our consolidated financial statements, which have been audited by BDO USA, LLP, our independent registered public accounting firm, as indicated in their report included in this Annual Report. The selected consolidated statement of operations data set forth below for each of the two fiscal years in the periods ended December 28, 2007 and December 29, 2006, and the
consolidated balance sheet data set forth below at January 2, 2009, December 28, 2007, and December 29, 2006 derive from audited consolidated financial statements of the Company not included in this Annual Report. We have adjusted all prior periods presented to account for the Domilens divestiture on March 2, 2010 and present Domilens as a discontinued operation. The selected consolidated financial data should be read in conjunction with the consolidated financial statements of the Company, and the Notes thereto, included in this Annual Report, and “Management’s Discussion and Analysis of Financial Condition and Results of Operations” in Item 7.
|
Fiscal Year Ended
|
||||||||||||||||||||
|
December 31,
2010
|
January 1,
2010
|
January 2,
2009
|
December 28,
2007
|
December 29,
2006
|
||||||||||||||||
|
|
(In thousands except per share data)
|
|||||||||||||||||||
|
Statement of Operations
|
||||||||||||||||||||
|
Net sales
|
$
|
54,958
|
$
|
51,060
|
$
|
49,770
|
$
|
35,632
|
$
|
35,816
|
||||||||||
|
Cost of sales
|
19,882
|
19,737
|
20,688
|
16,176
|
18,961
|
|||||||||||||||
|
Gross profit
|
35,076
|
31,323
|
29,082
|
19,456
|
16,855
|
|||||||||||||||
|
General and administrative
|
14,078
|
15,247
|
15,730
|
12,309
|
10,891
|
|||||||||||||||
|
Marketing and selling
|
17,176
|
15,300
|
18,472
|
15,868
|
14,299
|
|||||||||||||||
|
Research and development
|
5,724
|
5,893
|
7,938
|
6,711
|
7,080
|
|||||||||||||||
|
Other general and administrative expenses (reversals), net
|
700
|
(238
|
)
|
9,773
|
—
|
(331
|
)
|
|||||||||||||
|
Operating loss
|
(2,602
|
)
|
(4,879
|
)
|
(22,831
|
)
|
(15,432
|
)
|
(15,084
|
)
|
||||||||||
|
Total other income (expense), net
|
(1,079
|
)
|
(869
|
)
|
(1,044
|
)
|
(917
|
)
|
39
|
|||||||||||
|
Loss before income taxes
|
(3,681
|
)
|
(5,748
|
)
|
(23,875
|
)
|
(16,349
|
)
|
(15,045
|
)
|
||||||||||
|
Income tax provision
|
432
|
1,154
|
975
|
883
|
273
|
|||||||||||||||
|
Loss from continuing operations
|
(4,113
|
)
|
(6,902
|
)
|
(24,850
|
)
|
(17,232
|
)
|
(15,318
|
)
|
||||||||||
|
Income from discontinued operations, net of income taxes
|
4,166
|
702
|
1,655
|
1,233
|
274
|
|||||||||||||||
|
Net income (loss)
|
$
|
53
|
$
|
(6,200
|
)
|
$
|
(23,195
|
)
|
$
|
(15,999
|
)
|
$
|
(15,044
|
)
|
||||||
|
Loss per share from continuing operations, basic and diluted
|
$
|
(.12
|
)
|
$
|
(.21
|
)
|
$
|
(.84
|
)
|
$
|
(0.61
|
)
|
$
|
(0.61
|
)
|
|||||
|
Income per share from discontinued operations, basic and diluted
|
$
|
.12
|
$
|
.02
|
$
|
.05
|
$
|
.04
|
$
|
.01
|
||||||||||
|
Net loss per share
|
$
|
(.00
|
)
|
$
|
(.19
|
)
|
$
|
(.79
|
)
|
$
|
(0.57
|
)
|
$
|
(0.60
|
)
|
|||||
|
Weighted average shares outstanding, basic and diluted
|
34,825
|
32,498
|
29,474
|
28,121
|
25,227
|
|||||||||||||||
|
Balance Sheet Data
|
||||||||||||||||||||
|
Working capital
|
$
|
16,539
|
$
|
13,466
|
$
|
10,807
|
$
|
21,006
|
$
|
14,363
|
||||||||||
|
Total assets
|
40,585
|
58,681
|
52,582
|
54,179
|
47,770
|
|||||||||||||||
|
Long-term notes payable, net of discount
|
—
|
—
|
*
|
4,414
|
4,166
|
1,802
|
||||||||||||||
|
Other long-term liabilities
|
4,711
|
3,887
|
3,910
|
2,500
|
1,079
|
|||||||||||||||
|
Stockholders’ equity
|
22,427
|
21,070
|
16,027
|
36,225
|
31,760
|
|||||||||||||||
* included in current liabilities
29
Item 7. Management’s Discussion and Analysis of Financial Condition and Results of Operations
The matters addressed in Management’s Discussion and Analysis of Financial Condition and Results of Operations that are not historical information constitute “forward-looking statements” within the meaning of Section 27A of the Securities Act of 1933, as amended, and Section 21E of the Securities Exchange Act of 1934, as amended. Readers can recognize forward-looking statements by the use of words like “anticipate,” “estimate,” “expect,” “project,” “intend,” “plan,” “believe,” “will,” “target,” “forecast” and similar expressions in connection with any discussion of future operating or financial performance. In particular, these include statements relating to
future actions, prospective products or product approvals, future performance or results of current and anticipated products, sales efforts, expenses, interest rates, foreign exchange rates, the outcome of contingencies, such as legal proceedings, and financial results.
Although the Company believes that the expectations reflected in these forward-looking statements are reasonable, such statements are inherently subject to risks and the Company can give no assurance that its expectations will prove to be correct. Actual results could differ from those described in this report because of numerous factors, many of which are beyond the control of the Company. These factors include, without limitation, those described in this Annual Report in “Item 1A — Risk Factors.” The Company undertakes no obligation to update these forward-looking statements after the date of this report to reflect future events or circumstances or to reflect actual outcomes.
You should read the following discussion should be read in conjunction with the audited consolidated financial statements of STAAR, including the related notes, provided in this report.
Overview
Strategy
STAAR’s strategy is to be valued as a leading global provider of innovative intraocular lens system technologies. STAAR employs a commercialization strategy that focuses on achieving sustainable profitable growth.
Performance Against 2010 Key Operational Metrics
Two overriding strategic goals guided STAAR’s key operational metrics in 2010: to generate a profit in 2010 and to lay the groundwork for sustainable profitability into the future. In pursuit of these goals, STAAR aligned its principal business initiatives during 2010 along the following five key operational metrics, which STAAR has also used to gauge its progress during the year:
|
|
·
|
Achievement of double-digit percentage growth in sales from core ICL and IOL products;
|
|
|
·
|
Improvement in gross profit margins to the mid-60% level;
|
|
|
·
|
Progress toward profitability throughout the year, with a goal of achieving net income for the full year;
|
|
|
·
|
Continued generation of cash flow from operations; and
|
|
|
·
|
Improvement in financial condition by retiring obligations and strengthening the balance sheet.
|
In the following discussion we generally measure STAAR’s 2010 performance based on results from “continuing operations.” In accordance with U.S. Generally Accepted Accounting Principals (GAAP), we account for our March 2, 2010 divestiture of Domilens GmbH as discontinued operations in the first quarter of 2010. As a result, the reader can compare current results of STAAR’s post-divestiture business with the corresponding elements of our business in historical periods. A more complete explanation of this reporting method may be found below under the heading “Effect of Domilens Divestiture on Financial Reporting.”
Double-digit growth in sales from core ICL and IOL products. Developing, making and selling implantable lenses has always been STAAR’s principal business, and STAAR believes that capitalizing on its expertise and reputation in the field presents its primary opportunity for growth. As a result, STAAR regards ICLs and IOLs as its “core products.”
30
STAAR achieved approximately 16% growth in worldwide ICL sales during 2010 over the prior year. During 2010 STAAR continued to focus its ICL marketing and sales efforts in the key territories where it has established significant market share. Following the February 2, 2010 approval of the ICL in Japan, STAAR added Japan to the list of targeted territories based on its potential market share. Japan has a higher rate of myopia than many other countries, which makes it a promising new market. STAAR’s post approval launch in Japan has proceeded slowly because of the time required to train and certify surgeons on the Visian ICL product. The key territories in which STAAR is currently seeking to enhance Visian sales are the U.S., Japan, Korea, China, India,
Italy, Spain, Germany, U.K. and France.
Since 2009, STAAR has experienced a breakthrough in market penetration in Korea, where it believes implants of Visian products have exceeded 12% of the total volume of refractive surgery procedures. Revenues from sales of Visian ICL products in Korea increased 13% during 2010 over 2009. Because of the rapid growth of Visian ICL sales and market share in Korea, STAAR is using Korea as a model of best practices for marketing that may serve to significantly increase market share in other key territories.
U.S. military forces currently represent the largest group of customers for Visian ICLs in the U.S. Compared to 2009 military sales increased slightly during 2010, while civilian sales decreased slightly. Surgeons affiliated with the U.S. Army have noted the benefits of the Visian ICL and have presented data based on military experience showing that ICL provides superior visual outcomes to LASIK, even in younger patients with relatively lower levels of myopia. STAAR believes that the military’s adoption of the Visian ICL will in the long term enhance demand for the lenses in the private sector. STAAR, however, does not believe that private sector purchases of Visian ICLs will resume growing significantly until consumer spending improves, which depends on continued
recovery in the U.S. economy. Overall, refractive procedures continue to be adversely affected by the economy; Market Scope reports that total refractive procedures dropped by approximately 8% in the U.S. during 2010. U.S. Visian ICL unit sales decreased by 5% in 2010. STAAR’s initiatives to increase its U.S. sales of ICLs are discussed in greater detail under the heading “Other Highlights - U.S. ICL Sales” below.
STAAR’s ability to maintain or accelerate the rate of growth in Visian ICL sales will partly depend on continued improvement in worldwide economic conditions and progress with regulatory agencies. ICL surgery is a relatively expensive elective procedure and is seldom reimbursed by insurers or government agencies. STAAR believes that the global recession reduced overall demand for refractive surgery, and it has been reported that consumer spending and consumer confidence has not returned to pre-recession levels.
STAAR’s global IOL sales have also continued to increase, with sales in 2010 approximately 5% higher than the prior year, due in part to the nanoFLEX, sales of which grew 21% during 2010. Sales of STAAR’s Preloaded IOLs, currently available only outside the U.S., increased by 10% during the year driven by the launch of the KS-X Hydrophobic Acrylic Preloaded IOL in new markets and continuing strong sales of Preloaded Silicone IOLs. Sales of preloaded IOLs represented 69% of our total IOL sales in fiscal 2010.
A 1% rise in U.S. IOL sales in the third quarter of 2010 marked the first time in four years that STAAR has increased its quarterly IOL sales in the U.S., and only the second time in the last seven years. While STAAR has been experiencing a general decline in U.S. IOL sales volume during the last several years, the rate of decline decreased following STAAR’s introduction of aspheric IOLs with NTIOL status in 2008 and 2009, which resulted in higher average selling prices for STAAR’s IOLs in the U.S. through February 26, 2011. STAAR introduced three new products in the U.S. in 2009 in pursuit of growth in its IOL market: the nanoFLEX IOL, the nanoPOINT injection system, and the advanced Epiphany injector for STAAR’s three-piece Collamer aspheric lens.
STAAR believes its recent product introductions have given the Company a more competitive IOL product line with unique features and benefits, and offer an opportunity to regain lost IOL market share both within and outside the U.S. STAAR is seeking to obtain U.S. Food and Drug Administration (“FDA”) approval to sell its silicone Preloaded Injectors in the U.S. STAAR believes this product will further enhance its U.S. IOL offering and will help STAAR maintain or increase its market share in the silicone IOL segment. STAAR’s initiatives to increase its U.S. sales of IOLs are discussed in greater detail under the heading “Other Highlights - U.S. IOL Sales” below.
Improvement in gross profit margins to the mid-60% level for the year. To achieve sustainable profitability, STAAR must not only increase its revenues but also increase the gross profit margin yielded by those revenues. STAAR’s gross profit margin was 64% for 2010 compared to 61% in 2009. This improvement primarily result from a decrease in royalty expense resulting from the 2009 expiration of a patent licensed to STAAR, increased sales of higher margin ICLs and IOLs, and decreased sales of other products. Those gains were partly offset by higher inventory provisions and by a one-time charge of $160,000 in the third quarter due to issues related to a key raw material for the Collamer material, which has been
resolved.
These results represent a substantial increase over profit margins previously reported on a consolidated basis when STAAR’s operations included its former German subsidiary, Domilens GmbH. The sale of Domilens in the first quarter of 2010 removed some of the lowest gross profit margin sales from STAAR’s product mix. Products sold by Domilens are presented in discontinued operations, including third party products, supplies and disposables like surgical drapes, and assembly of custom surgical kits. In contrast, STAAR’s own products previously distributed to Domilens will continue to be sold to Domilens as an unaffiliated distributor. Those sales are therefore treated as continuing operations of STAAR and are included in net sales in STAAR’s
consolidated financial statements after the disposition; however, the volume of these sales has not been significant in relation to STAAR’s consolidated net sales.
31
STAAR has further increased gross profit margin during 2010 through the following:
|
|
·
|
Increasing ICL sales as a percentage of STAAR’s overall product mix. Visian ICLs and TICLs generally yield gross profit margins in excess of 80%. The Visian product line is STAAR’s most profitable product family and the largest contributor to enhanced gross profit margins. Worldwide ICL sales grew throughout 2010, with fourth quarter sales in established markets further increased by our enhanced product offering in countries recognizing the CE Mark.
|
|
|
·
|
Increasing Sales of Higher Value IOLs in the U.S. In 2007 and 2008 STAAR began converting its U.S. IOL product offering from lower value legacy products to newer aspheric designs that yield higher average selling prices. With the introduction of the nanoFLEX IOL in 2009, STAAR has introduced aspheric versions for both of its IOL product platforms. As STAAR’s customers have switched to aspheric lenses, and new customers have begun purchasing the nanoFLEX IOL in greater numbers, U.S. IOL gross profit margins have increased.
|
Progress toward profitability throughout the year, with a goal of achieving income from continuing operations for the full year.
STAAR made progress toward profitability throughout 2010, reducing its losses from continuing operations by 40% to $4.1 million, compared to $6.9 million in 2009. Although STAAR did achieve net income for the full year as a result of the divestiture of Domilens, the Company did not achieve income from continuing operations. Among the reasons STAAR did not achieve its goal of income from continuing operations for 2010 was expenses related to expanded sales and marketing staff, promotional activities, and severance costs which offset significant reductions in general and administrative spending. STAAR believes that its 2010 investment in sales and marketing will begin to yield increases in sales in 2011 and help lead to sustainable profitability in future
periods.
Continued generation of cash flow from operations. STAAR generated positive cash flow from operating activities in the third quarter and fourth quarters of 2010. STAAR has succeeded in resuming positive cash flow despite the loss of cash previously generated by Domilens, which usually provided cash from operating activities on a stand-alone basis and accounted for $1.7 million of STAAR’s cash from operations in 2009. STAAR’s use of cash use in the first half of 2010 resulted primarily from a $4.0 million payment to globally settle outstanding litigation in the second quarter and other outlays, including $0.4 million of previously incurred transaction costs related to the disposition of Domilens, $0.2 million in
legal fees related to litigation, approximately $0.8 million in interest paid on the Senior Secured Promissory Note, including the early repayment interest of $0.3 million.
Based on 2010 results STAAR believes that, subject to the risk of future unexpected outlays, it is in position to continue generating cash from operations during 2011. STAAR cautions that its first quarter is typically the most challenging for cash because of accounting fees related to the annual audit of our financial statements, professional fees for our consultant on internal controls pursuant to the Sarbanes-Oxley Act of 2002, and holiday closures of facilities during December that reduce the processing and payment of invoices by STAAR during the last weeks of the fourth quarter.
Improve financial condition by retiring obligations and strengthening the balance sheet. At the beginning of 2010, STAAR had two significant financial obligations that were scheduled to mature in 2010: repayment of the $5 million principal balance on the Broadwood Note, originally due on December 14, 2010; and the right of the holders of 1,700,000 shares of our Series A Redeemable, Convertible Preferred Stock (the “Preferred Stock”) to redeem these shares at $4.00 per share, or $6.8 million in cash in aggregate. The redemption right, by its terms, would have matured on December 29, 2010.
After the sale of Domilens in the first quarter yielded approximately $11.8 million in cash and STAAR entered into a global settlement of its outstanding litigation, STAAR used its improved cash reserves to retire its major obligations during the second quarter. After delivering a Call Notice to the holders, STAAR repurchased all of the shares of Preferred Stock at the redemption price on May 24, 2010. On June 22, 2010, STAAR prepaid the $5 million Broadwood Note, plus the accrued interest as of that date, without any penalty. Since the Note was scheduled to mature in December 2010, STAAR also wrote off the remaining unamortized discount and issuance costs related to the Note and recognized a non-cash loss of $267,000.
Because the Preferred Stock was convertible into common stock on a one-for-one basis, the redemption of the preferred stock reduced our fully diluted capitalization by 1.7 million shares at a cost of $4 per share.
STAAR seeks to reserve any future capital raising efforts for initiatives to expand its business, rather than meeting existing obligations. Nevertheless, depending on STAAR’s future cash position, it may find it necessary to seek additional financing. See “Liquidity and Capital Resources” below.
32
Other Highlights
Divestiture of Domilens.
On March 2, 2010 we completed the divestiture of all of our interest in our former German distribution subsidiary, Domilens GmbH through a management buyout led by funds managed by Hamburg-based Small Cap Buyout Specialist BPE Unternehmensbeteiligungen GmbH (“BPE”). STAAR’s financial advisor in the transaction was Berenberg Bank, a German investment bank headquartered in Hamburg.
STAAR originally purchased Domilens in a series of stock purchases from the founder of the business between 1998 and 2003. STAAR originally intended to use Domilens as a channel for increased sales in the German market. However, by 2009 sales of STAAR product accounted for only approximately 7.6% of Domilens sales. The majority of Domilens sales were third party products, including IOLs of other manufacturers, disposables and other supplies such as surgical drapes, and the assembly of custom surgical kits containing a package of mostly third party products needed for a single procedure. While profitable, this business operates at gross profit margins that are significantly lower than STAAR’s overall average.
As part of the divestiture STAAR and Domilens entered into a distribution agreement under which Domilens will continue to purchase STAAR products at the unit sales volume previously projected for 2010 through 2012. Because of the nature of the Domilens business and the promise of continued distribution in Germany and Austria at projected levels, STAAR determined that the sale of Domilens would not impede its core business, and would permit management to focus on the higher value core business of developing, manufacturing and selling its own advanced ophthalmic products.
STAAR also determined that the gross purchase price received for Domilens, at approximately 6.9 times Domilens’ earnings before income taxes, represented a reasonable value for its investment in Domilens, and that these funds were of greater use to STAAR as working capital. The Stock Purchase Agreement provided for a purchase price of €10,512,100 (approximately $14.3 million). After adjusting for €800,000 in cash dividends received by STAAR from Domilens in December 2009 and January 2010, and the exclusion of expenses related to compliance with the Sarbanes-Oxley Act of 2002, at closing on March 2, 2010 Domilens Akquisitions paid a cash Net Purchase Price of €9,685,700 (approximately $13.2 million). €100,000 of the Net Purchase Price was paid into an
escrow account, to be held against payment of any unaccrued taxes assessed for periods prior to December 31, 2009. Funds remaining after the resolution of such potential liabilities, if any, will be distributed to STAAR from the escrow account, no later than December 31, 2011.
After expenses of €358,000 (~$485,000) related to investment banking fees, and excluding the escrowed funds and any earn-out payments, STAAR received net cash proceeds of approximately €9.2 million from the Transaction (approximately $12.5 million) and incurred legal and other costs of $.7 million for a net proceed of $11.8 million. The Company paid a $64,000 marketing allowance in 2010 for Domilens to market STAAR’s products after the divestiture. Taxes related to the disposition of Domilens were estimated to be insignificant.
Based on the performance of Domilens in fiscal years 2010, 2011 and 2012, STAAR may earn up to an additional €675,000 (approximately $895,000 at currently prevailing exchange rates). These additional “earn-out” payments will be earned only if Domilens significantly improves its performance over levels it has historically been able to achieve. If a target is missed in any year, but in the following year Domilens achieves the target and also makes up for the earlier shortfall, the payments for both years will be earned and paid. Domilens may not be able to achieve these improvements. Based on Domilens financial performance in
fiscal 2010, the Company is not entitled to the first earnout payment.
The benefits we expected to achieve from the Domilens divestiture include the following: approximately $11.8 million in net cash proceeds; greater focus on STAAR’s core business; significantly enhanced gross profit margins; and a contractual commitment to meet projected sales levels for STAAR products in Germany and Austria through 2012.
In accordance with U.S. generally accepted accounting principles, STAAR accounted for the divestiture of Domilens as discontinued operations during fiscal 2010.
As a result of this accounting treatment, in all historical periods presented, Domilens’ results of operations and cash flows, which formerly were consolidated with those of STAAR and its other subsidiaries, are now segregated into a separate line item as “discontinued operations,” and the consolidated results of operations and cash flows of STAAR and its other subsidiaries have been adjusted to exclude the results of Domilens. This presentation is intended to enable the reader more easily to compare current results from continuing operations of STAAR’s business ex-Domilens with the corresponding elements of the business in historical periods. The 2009 consolidated balance sheet has not been restated and includes the assets, liabilities and stockholders’ equity of
Domilens as reported.
33
U.S. ICL Sales.
We consider ICL sales growth in the U.S. market to be important because of the size of the U.S. refractive surgery market and the perceived worldwide leadership of the U.S. in adopting innovative medical technologies. The Visian ICL was approved by the FDA for treatment of myopia on December 22, 2005.
Visian ICL sales in the U.S. fell by 4.2% during 2010 compared to prior year, and grew 2.5% in 2009 when compared to 2008 levels. Most of the U.S. growth in ICL sales during the past two years has been in sales to the military, which have been offset by declines in the private sector. Market Scope has reported that overall refractive surgery market in the U.S. declined by approximately 8% during 2010. Because during the past two years STAAR’s rates of growth or decline in U.S. sales have remained better than the rate of decline in the overall U.S. refractive market, STAAR believes that it has continued to grow market share in this challenging environment.
In order to increase U.S. sales of the ICL, private sector sales must also resume growth. STAAR believes that the effects of global recession, especially the slow pace of recovery in employment, consumer spending and consumer confidence, represent the largest challenge to increased growth in U.S. private sector ICL sales. Refractive surgery is an elective procedure generally not covered by health insurance. Patients must pay for the procedure, frequently through installment financing arrangements. STAAR believes that the lack of growth in private sector ICL sales in the U.S. results from the significantly lower volume of patients seeking refractive surgery in the last three years, which has reduced the number of patients to whom the ICL is offered. Market Scope
estimates that the total number of refractive surgical procedures in the U.S. declined by 49% between 2007 and 2010. While ICL sales have been much more resistant to the recession than laser-based procedures, unless the economic recovery continues and consumer spending levels also recover, private sector ICL sales will not grow significantly and may decline. STAAR believes that its share of the U.S. refractive market has grown during the past three years, which will position the ICL for strong sales growth when conditions improve.
In addition to poor conditions in the general economy and in particular the refractive surgery market, other challenges to sustained growth in U.S. Visian ICL sales include the following:
|
|
·
|
the U.S. refractive surgery market has been dominated by corneal laser-based techniques, which continue to be better known than the Visian ICL among potential refractive patients;
|
|
·
|
other newly introduced surgical products will continue to compete with the Visian ICL for the attention of surgeons seeking to add new, high value surgical products, in particular multifocal and accommodating IOLs;
|
|
|
·
|
negative publicity about complications of LASIK could reduce interest in all refractive surgical procedures; and
|
|
|
·
|
FDA approval of the TICL, which STAAR sells in 45 international markets for treating patients affected by both myopia and astigmatism, has been delayed.
|
To help address these challenges, during the fourth quarter STAAR tested a direct-to-consumer advertising campaign on the internet and plans to test the campaign on television and radio in selected markets in the first quarter of 2011. This campaign seeks to increase potential refractive patient visits and to encourage patients to inquire specifically about the Visian ICL by distinguishing it from other refractive treatments. The initial materials for the campaign are a series of humorous one-minute videos contrasting the Visian ICL with LASIK, eyeglasses and contact lenses. The videos highlight certain benefits of the ICL over other treatments, including clarity of vision, absence of surgically induced dry eye, removability and ultraviolet protection. We cannot yet
assess the potential success of the campaign at this time.
On April 25, 2008, the FDA Ophthalmic Devices Panel held a public meeting to discuss issues of medical complications and customer satisfaction following refractive surgery. While the panel also discussed phakic IOLs such as the Visian ICL, most of its discussions centered on LASIK and testimony regarding customer dissatisfaction following LASIK surgery. The Panel recommended enhanced patient warnings of possible complications for LASIK and created a task force to study methods of better identifying those patients who are more likely to have an unsatisfactory outcome from laser vision correction. On October 15, 2009, the FDA announced a three-phase collaborative study on the potential impact of LASIK surgery on a patient’s quality of life, and also issued warning letters to
seventeen ambulatory surgery centers citing inadequate systems for reporting adverse events resulting from LASIK. These FDA activities have been widely reported in the U.S. In September 2010, a former FDA official received widespread publicity when he petitioned FDA to revoke its approval of LASIK. While it is difficult to assess precisely the impact of these events on patient attitudes or the recommendations of practicing surgeons, it is possible that reduced demand for laser eye surgery observed in 2008 and 2009 was caused in part by concerns regarding complications and potential patient dissatisfaction. Patient concerns about LASIK could increase interest in the Visian ICL as an alternative for patients who have a greater risk of complications from LASIK. The fact that the Visian ICL is removable if a patient is dissatisfied with the outcome may also be appealing to some patients with new concerns about risks of refractive
surgery. However, STAAR believes the negative publicity concerning LASIK has decreased patient interest in all refractive surgery, including Visian ICL. Because nearly all candidates for refractive surgery can achieve acceptable vision through the use of spectacles or contact lenses, for most patients the decision to have refractive surgery is a lifestyle choice that depends on high confidence in achieving a satisfactory outcome.
34
During 2010, STAAR has placed less emphasis on increasing its overall customer base and devoting more attention to identifying and supporting those practices that show potential for significant repeat business through a professional commitment to the ICL technology.
U.S. IOL Sales.
During 2010 STAAR saw indications that it may begin to reverse several years of decline in STAAR’s U.S. market share and sales of IOLs. During 2010 total U.S. sales of IOLs decreased 6% over prior year, compared to rates of decline of 8% and 16% in in 2009 and 2008.
The improving prospects for U.S. IOL sales largely result from growing market acceptance of the nanoFLEX single-piece Collamer aspheric lens, which in the U.S. experienced 20% growth in sales for the year and 16.7% growth in sales during the fourth quarter of 2010. The introduction of nanoFLEX lens and other advanced IOLs reflects STAAR’s effort to overcome the factors that contributed to the long-term decline in U.S. IOL sales, including the slow pace of product improvement and enhancement during a period when we devoted most of our research and development resources to introducing the ICL and to resolving the regulatory and compliance issues raised by the FDA.
STAAR’s strategy for returning to growth in its U.S. IOL business is to rationalize its product offering around its higher value products. This has included aspheric optics across all IOL platforms, improved delivery systems for Collamer IOLs to broaden their appeal and preloaded delivery systems for silicone lenses. Successful implementation of this strategy is subject to risks, including the risk of delays in developing new products or securing regulatory approval.
STAAR’s initiatives to enhance its IOL product line have resulted in the following developments:
|
|
·
|
the introduction of STAAR’s aspheric three-piece Collamer IOL in April 2007;
|
|
|
·
|
the introduction of STAAR’s aspheric three-piece silicone IOL November 2007;
|
|
|
·
|
the April 2008 introduction of the nanoPOINT injector, which delivers STAAR’s single-piece Collamer IOL, through a 2.2 mm incision;
|
|
|
·
|
the introduction of the nanoFLEX aspheric single-piece Collamer IOL in the second quarter of 2009, which brings advanced aspheric optics to the micro-incision nanoPOINT platform; and
|
|
|
·
|
the launch of the Epiphany injector for the Collamer three-piece lens in the third quarter of 2009 which brought smoother and more controlled delivery to one of STAAR’s most advanced lenses and paves the way for U.S. introduction of the silicone preloaded injector.
|
STAAR intends to continue to focus on the following development projects designed to make our IOL product offering more competitive:
|
|
·
|
Introduction of the silicone preloaded injector system in the U.S.
|
|
·
|
Development of preloaded injector systems for Collamer IOLs
|
|
|
·
|
Development of a Collamer Toric IOL to complement our pioneering silicone Toric IOL and better compete with the Alcon acrylic Toric IOL. The Collamer Toric IOL should provide a product with advanced optic materials and rotational stability to provide superior outcomes for cataract patients with astigmatism and would likely qualify as a premium IOL
|
|
|
·
|
Initiate a formal post-market clinical evaluation to support a possible submission to the FDA of claims that the nanoFLEX lens offers patients less spectacle dependence or superior mid-range vision
|
35
|
|
·
|
Development of accommodating or presbyopic IOLs
|
STAAR cautions that the successful development and introduction of new products is subject to risks and uncertainties, including the risk of unexpected delays and, in some cases, approval of regulatory authorities.
STAAR’s development efforts aim to realize the full market potential for Collamer IOLs by continuously improving lens delivery systems and differentiating STAAR’s silicone IOL offering through the Preloaded Injector. Approximately 43% of IOLs sold by STAAR in the U.S. are made of silicone, which was the original material used for foldable IOLs. Physician preferences in the U.S. have shifted toward acrylic IOLs and silicone IOLs now account for approximately 17% of the U.S. IOL market.
STAAR believes that its Collamer lenses have outstanding optical qualities and superior biocompatibility, and should be capable of competing with any of our competitor’s acrylic lens products in the advanced material sector. In addition, increasing use of the ICL, which relies on the outstanding optical properties of Collamer, has also introduced the advantages of the Collamer material to a growing number of surgeons. One factor that limited growth of the Collamer IOL market in the past was the difficulty of perfecting delivery systems for the soft Collamer material. STAAR believes that its Epiphany injector for the three-piece Collamer IOL and nanoPOINT injector for the nanoFLEX lens have substantially overcome this challenge to market acceptance.
Over the past several years surgeons implanting the nanoFLEX IOL have reported that their cataract patients have better than expected near vision. In late 2008, STAAR organized the Collamer Accommodating Study Team or “CAST.” The CAST consists of eight prominent physicians across the U.S. who are implanting the nanoFLEX IOL and are checking both near and intermediate vision approximately one month post operation. Feedback from the group indicates that the near vision achieved is better than that of any conventional IOL where we have comparative data. The feedback also indicates that the intermediate vision is better than “presbyopia correcting” IOLs that have been studied and near vision approaches that of presbyopia correcting IOLs
that are already on the market.
In the first quarter of 2010 STAAR initiated a program called the “nanoFLEX challenge” to facilitate an interested surgeon’s evaluation of the visual outcomes for patients receiving nanoFLEX IOLs compared to the outcomes from any other standard IOL currently used by the surgeon. STAAR believes that its marketing efforts, along with the features and benefits of the nanoFLEX lens and nanoPOINT injector system, are responsible for the product’s 20% sales growth in the U.S. during 2010, and that the product is capable of winning additional market share in the future.
While the market share of silicone IOLs has been slowly declining overall, a significant number of surgeons continue to select silicone lenses for their patients. Among U.S. IOL sales, STAAR believes that its recently introduced aspheric, three-piece silicone IOL offers outstanding optical performance and could enable STAAR to retain or possibly increase its market share within the silicone IOL sector, especially if STAAR’s efforts are successful in securing FDA approval to make it available in a Preloaded Injector.
STAAR’s efforts to increase U.S. IOL sales face a number of short and long-term challenges, including successfully meeting its objectives to develop new and enhanced products and marketing them with limited resources. The U.S. IOL market has recently become more fragmented with the entry of new competitors, including Hoya Surgical Optics and Lenstec, Inc., resulting in greater competition for market share. We cannot assure that our efforts will ultimately be successful.
Medical Device Regulatory Compliance, Clinical Oversight and TICL Approval.
As discussed above under the caption “Business — Regulatory Matters,” STAAR’s ability to develop, manufacture and distribute its products depends heavily on maintaining good standing with the FDA and other regulatory agencies. Based, in part, on the results of the FDA inspections of STAAR’s California facilities in 2009 and 2006 and STAAR’s Nidau, Switzerland facility in 2009, STAAR believes that it is substantially in compliance with the FDA’s Quality System Regulations and Medical Device Reporting regulations. STAAR has invested significant resources in maintaining regulatory compliance and expects to continue to do so in the future.
Financing Strategy
STAAR has reported losses on a consolidated basis over the last several years and has until recently experienced negative cash flow. During recent years STAAR has raised additional funds to support operations through sales of equity and debt securities. As cash flow improved in recent quarters, STAAR has sought to avoid further financings and to operate exclusively on self-generated cash.
36
Avoiding a short-term cash shortfall was a principal consideration for STAAR’s divestiture of Domilens on March 2, 2010. Among the expected demands on STAAR’s capital resources underlying this decision, the most pressing was the $6.5 million verdict rendered in a companion case to the 2009 case, and the potential need to post a $9.8 appeal bond on or before April 30, 2010. The Domilens divestiture yielded a total of approximately $11.8 million in net cash proceeds to STAAR. The March 30, 2010 global settlement of all pending litigation eliminated the potential need to post an appeal bond. STAAR contributed $4.0 million to the global settlement, paying this amount from the $7.4 million (including interest) on deposit with the Court in connection with the
2009 litigation. As a result, STAAR was able to apply the entire $11.8 million in net cash proceeds from the Domilens sale to working capital, along with approximately $3.4 million refunded to STAAR from the restricted deposit.
Following the divestiture of Domilens and the settlement of the lawsuits, on April 23, 2010, STAAR issued a call notice to the holders of its 1,700,000 outstanding shares of Preferred Stock, establishing May 24, 2010 as the redemption date for the Preferred Stock. On May 24, 2010, STAAR redeemed all outstanding shares of preferred stock in cash for $4.00 per share, or $6.8 million in aggregate. There are no Preferred Shares outstanding since the redemption.
Other financing activity include the December 14, 2007 borrowing by STAAR of $5 million from Broadwood Partners, L.P., at an interest rate of 7% per annum, primarily to fund the acquisition of STAAR’s remaining interest in the Canon Staar Joint Venture. The promissory note covering the loan was due on December 14, 2010. On June 22, 2010, STAAR prepaid the $5 million Broadwood Note, plus the accrued interest as of that date, without any penalty.
Following the redemption of the Preferred Shares and repayment of the Broadwood Note and release of the related lien, STAAR has no material indebtedness, other than the Japan line of credit, or encumbrances on its assets. These assets would therefore be available to secure a bank line of credit. STAAR does not believe such a line of credit would be available on attractive terms until it establishes a record of sustained profits, and it has no plans to seek such debt financing at this time.
STAAR’s need for working capital, renewal of existing credit facilities, and the terms on which financing may be available, will depend in part on its degree of success in achieving and maintaining positive cash flow and earnings through the strategies described above under the caption “Strategy.” STAAR cannot assure that such financing will be available on acceptable terms, if at all, if the need arises.
Results of Operations
The following table sets forth the percentage of total sales represented by certain items reflected in the Company’s consolidated statement of operations for the period indicated and the percentage increase or decrease in such items over the prior period.
|
Percentage of Net Sales
|
Percentage Change
|
|||||||||||||||||||
|
December 31,
2010
|
January 1,
2010
|
January 2,
2009
|
2010 vs.
2009
|
2009 vs.
2008
|
||||||||||||||||
|
Net sales
|
100.0 | % | 100.0 | % | 100.0 | % | 7.6 | % | 2.6 | % | ||||||||||
|
Cost of sales
|
36.2 | % | 38.7 | % | 41.6 | % | 0.7 | % | (4.6 | )% | ||||||||||
|
Gross profit
|
63.8 | % | 61.3 | % | 58.4 | % | 12.0 | % | 7.7 | % | ||||||||||
|
General and administrative
|
25.6 | % | 29.9 | % | 31.6 | % | (7.7 | )% | (3.1 | )% | ||||||||||
|
Marketing and selling
|
31.2 | % | 30.0 | % | 37.1 | % | 12.3 | % | (17.2 | )% | ||||||||||
|
Research and development
|
10.4 | % | 11.5 | % | 16.0 | % | (2.9 | )% | (25.8 | )% | ||||||||||
|
Other general and administrative expenses (recoveries), net
|
1.3 | % | (0.5 | )% | 19.6 | % | — | * | — | * | ||||||||||
|
Operating loss
|
(4.7 | )% | (9.6 | )% | (45.9 | )% | (46.7 | )% | (78.6 | )% | ||||||||||
|
Total other expense, net
|
(2.0 | )% | (1.7 | )% | (2.1 | )% | 24.2 | % | (16.8 | )% | ||||||||||
|
Loss before income taxes
|
(6.7 | )% | (11.3 | )% | (48.0 | )% | (36.0 | )% | (75.9 | )% | ||||||||||
|
Provision for income taxes
|
0.8 | % | 2.3 | % | 1.8 | % | (62.6 | )% | 18.4 | % | ||||||||||
|
Loss from continuing operations
|
(7.5 | )% | (13.6 | )% | (49.8 | )% | (40.4 | )% | (72.2 | )% | ||||||||||
|
Income from discontinued operations, net of income taxes
|
7.6 | % | 1.4 | % | 3.2 | % | — | * | (57.6 | )% | ||||||||||
|
Net Income (loss)
|
0.1 | % | (12.2 | )% | (46.6 | )% | — | * | 73.3 | % | ||||||||||
* Denotes change is greater than 100%
37
The following table presents our net sales, by product, for the fiscal years presented (dollars in thousands):
|
% of
Total
|
2010
|
% of
Total
|
2009
|
% of
Total
|
2008
|
|||||||||||||||||||
|
IOL
|
50.1 | % | $ | 27,550 | 51.5 | % | $ | 26,299 | 51.2 | % | $ | 25,479 | ||||||||||||
|
ICL
|
44.2 | % | 24,300 | 41.2 | % | 21,046 | 36.3 | % | 18,090 | |||||||||||||||
|
Core Product Sales
|
94.3 | % | 51,850 | 92.7 | % | 47,345 | 87.5 | % | 43,569 | |||||||||||||||
|
Other
|
5.7 | % | 3,108 | 7.3 | % | 3,715 | 12.5 | % | 6,201 | |||||||||||||||
|
Total Sales
|
100.0 | % | $ | 54,958 | 100.0 | % | $ | 51,060 | 100.0 | % | $ | 49,770 | ||||||||||||
Net sales for 2010 were $55.0 million, a 7.6% increase over the $51.1 million reported in fiscal 2009. The increase in net sales is due to the 10% increase in our core product sales (IOL and ICL). Core product sales represented 94.3% and 92.7% of the Company’s total sales in fiscal 2010 and 2009, respectively. Changes in foreign currency favorably impacted our net sales in 2010 by $1.2 million.
Net sales for 2009 were $51.1 million, a 2.6% increase over the $49.8 million reported in fiscal 2008. The increase in net sales was due to the 8.7% increase in our core product sales (IOL and ICL). Core product sales represented 92.7% and 87.5% of the Company’s total sales in fiscal 2009 and 2008, respectively. Changes in foreign currency favorably impacted our net sales in 2009 by $1.2 million.
Total IOL sales for 2010 were $27.6 million, a 4.8% increase over the $26.3 million reported in fiscal 2009. The increase in IOL sales is due to a 28.2% increase in preloaded acrylic IOL sales primarily as a result of the full rollout of the product in Europe and also due to a 19.6% increase in nanoFLEX IOL sales in the U.S. These increases were partially offset by decreased sales of lower margin silicone IOLs. IOL sales represented 50.1% and 51.5% of the Company’s total sales in fiscal 2010 and 2009, respectively. Preloaded IOL sales represented 69.3% of total IOL sales in fiscal 2010, compared with 66% in fiscal 2009.
Total IOL sales for 2009 were $26.3 million, a 3.2% increase over the $25.5 million reported in fiscal 2008. The increase in IOL sales is due to a 91.8% increase in preloaded acrylic IOL sales primarily as a result of the launch of the product in Europe and a 50% increase in sales in Japan. These increases were partially offset by decreased sales of all other IOLs. IOL sales represented 51.5% and 51.2% of the Company’s total sales in fiscal 2009 and 2008, respectively. Preloaded IOL sales represented 66% of total IOL sales in fiscal 2009, compared with 61.5% in fiscal 2008.
Total ICL sales for 2010 were $24.3 million, a 15.5% increase over the $21.0 million reported in fiscal 2009. The increase in ICL sales in 2010 is due to continued strong international sales as follows: India, up 57.2%, China, up 86.9%, Korea, up 13.4%, Lebanon, up 46.7%, Singapore, up 111.6%, France, up 24.3%, all other international markets, up 9.1%. U.S. ICL sales were down 4.2% due to a continued weak economy which has significantly impacted the overall demand for refractive procedures in the U.S. ICL sales represented 44.2% and 41.2% of the Company’s total sales in fiscal 2010 and 2009, respectively. Toric ICL sales represented 42.7% of total ICL sales, where approved, compared with 39.3% in fiscal 2009.
Total ICL sales for 2009 were $21.0 million, a 16.3% increase over the $18.1 million reported in fiscal 2008. The increase in ICL sales in 2009 is due to continued strong international sales as follows: India, up 73.4%, China, up 81.5%, Korea, up 55.6%, Lebanon, up 32.4%, Singapore, up 86.2%, France, up 63.5%, all other international markets, down 3.6%. U.S. ICL sales were up 2.5% despite a continued weak economy which has significantly impacted the overall demand for refractive procedures in the U.S. ICL sales represented 41.2% and 36.3% of the Company’s total sales in fiscal 2009 and 2008, respectively. Toric ICL sales represented 39.3% of total ICL sales, where approved, compared with 42.2% in fiscal 2008.
38
Other product sales, which continue to be deemphasized due to their low margins, were $3.1 million in fiscal 2010, a 16.3% decrease over the $3.7 million in sales reported in fiscal 2009. Other product sales represented 5.7% and 7.3% of the Company’s total sales in fiscal 2010 and 2009, respectively.
Other product sales, which have been deemphasized due to their low margins, were $3.7 million in fiscal 2009, a 40.1% decrease over the $6.2 million in sales reported in fiscal 2008. Other product sales represented 7.3% and 12.5% of the Company’s total sales in fiscal 2009 and 2008, respectively.
The following table presents our gross profit and gross profit margin for the fiscal years presented (dollars in thousands):
|
2010
|
2009
|
2008
|
||||||||||
|
Gross Profit
|
$ | 35,076 | $ | 31,323 | $ | 29,082 | ||||||
|
Gross Profit Margin
|
63.8 | % | 61.3 | % | 58.4 | % | ||||||
Gross profit in fiscal 2010 was $35.1 million compared with $31.3 million in fiscal 2009. Gross profit increased due to increased sales and decreased royalty expense which more than offset the increased cost of goods from higher sales. Gross profit margin increased from 61.3% in fiscal 2009 to 63.8% in fiscal 2010. The increase in gross profit margin is due to increased ICL sales and decreased other product sales and also due to decreased royalty expense. Royalty expense decreased by approximately $738,000 as a result of the 2009 expiration of a patent licensed to STAAR.
Gross profit in fiscal 2009 was $31.3 million compared with $29.1 million in fiscal 2008. Gross profit in fiscal 2008 was negatively impacted by the $1.5 million purchase accounting charge resulting from the acquisition of STAAR Japan. Notwithstanding the purchase accounting charge, gross profit increased due to increased ICL sales. Gross profit margin increased from 58.4% in fiscal 2008 to 61.3% in fiscal 2009 because of the purchase accounting charge in 2008 which negatively impacted margins.
The following table presents our general and administrative expense for the fiscal years presented (dollars in thousands):
|
2010
|
2009
|
2008
|
||||||||||
|
General and Administrative Expense
|
$ | 14,078 | $ | 15,247 | $ | 15,730 | ||||||
|
Percentage of Sales
|
25.6 | % | 29.9 | % | 31.6 | % | ||||||
General and administrative expense in fiscal 2010 was $14.1 million or 25.6% of sales, compared with $15.2 million or 29.9% of sales in fiscal 2009. The decrease in expense is primarily due to decreased legal expenses associated with litigation.
General and administrative expense in fiscal 2009 was $15.2 million or 29.9% of sales, compared with $15.7 million or 31.6% of sales in fiscal 2009. The decrease in expense is primarily due to decreased legal expenses associated with litigation as a result of our insurance carrier’s agreement to reimburse part of the cost.
The following table presents our marketing and selling expense for the fiscal years presented (dollars in thousands):
|
2010
|
2009
|
2008
|
||||||||||
|
Marketing and Selling Expense
|
$ | 17,176 | $ | 15,300 | $ | 18,472 | ||||||
|
Percentage of Sales
|
31.2 | % | 30.0 | % | 37.1 | % | ||||||
Marketing and selling expense in fiscal 2010 was $17.2 million or 31.2% of sales, compared with $15.3 million or 30% of sales in fiscal 2009. The increase in marketing and selling expense is due to the investment in additional direct sales representatives and increased promotional activities in the U.S. and also due to increased training and promotional activities as a result of the approval of the ICL in Japan. Despite the increase compared with 2009, marketing and selling expense in 2010 is 7% lower than 2008 on 10.4% higher sales.
39
Marketing and selling expense in fiscal 2009 was $15.3 million or 30% of sales, compared with $18.5 million or 37.1% of sales in fiscal 2008. The decrease compared with 2008 is due to decreased salaries, travel, consulting fees, promotional activities, and commissions in the U.S.
The following table presents our research and development expense for the fiscal years presented (dollars in thousands):
|
2010
|
2009
|
2008
|
||||||||||
|
Research and Development Expense
|
$ | 5,724 | $ | 5,893 | $ | 7,938 | ||||||
|
Percentage of Sales
|
10.4 | % | 11.5 | % | 16.0 | % | ||||||
Research and development expenses consist primarily of compensation and related costs for personnel responsible for the research and development of new and existing products and the regulatory and clinical activities required to acquire and maintain product approvals globally. These costs are expensed as incurred.
Research and development expense in fiscal 2010 was $5.7 million or 10.4% of sales, compared with $5.9 million or 11.5% of sales in fiscal 2009. The decrease compared with fiscal 2009 is primarily due to decreased depreciation expense and patent legal expenses.
Research and development expense in fiscal 2009 was $5.9 million or 11.5% of sales, compared with $7.9 million or 16% of sales in fiscal 2008. The decrease compared with fiscal 2008 is primarily due to decreased salaries, consulting fees, and general cost containment efforts in the U.S.
The following table presents other general and administrative expenses (recoveries) for the fiscal years presented (dollars in thousands):
|
2010
|
2009
|
2008
|
||||||||||
|
Other General and Administrative Expenses (Recoveries)
|
$ | 700 | $ | (238 | ) | $ | 9,773 | |||||
|
Percentage of Sales
|
1.3 | % | (0.5 | )% | 19.6 | % | ||||||
Other general and administrative expenses in fiscal 2010 of $700,000 relate to termination benefits resulting from the non-renewal of an executive employment agreement. Severance will be paid out over fifteen months beginning September 2010.
Other general and administrative expenses (recoveries) in fiscal 2009 of ($238,000) include the reversal of $0.8 million in accrued judgment costs resulting from the settlement of former sales representative litigation, largely offset by a $0.6 million charge associated with certain patents that were determined to have shorter useful lives than originally estimated.
Other general and administrative expenses in fiscal 2008 of $9.8 million consisted of the following: 1) $3.9 million loss on settlement of pre-existing distribution arrangement in connection with the acquisition of STAAR Japan; 2) $1.0 million in patent impairment charges; and 3) $4.9 million jury verdict awarded a former sales representative in litigation against the Company.
The following table presents our other expense, net for the fiscal years presented (dollars in thousands):
|
2010
|
2009
|
2008
|
||||||||||
|
Other Expense, net
|
$ | 1,079 | $ | 869 | $ | 1,044 | ||||||
|
Percentage of Sales
|
(2.0 | )% | (1.7 | )% | (2.1 | )% | ||||||
Other expense, net generally relates to interest expense on notes payable and lease obligations, gains or losses on foreign currency transactions, and fair value adjustments of outstanding warrants.
Other expense, net increased in fiscal 2010 to $1.1 million from $0.9 million in fiscal 2009. The increase in expense is due largely to $87,000 in foreign currency transaction losses recorded during the year compared with $124,000 in foreign currency transaction gains recorded during 2009 and also due to lower income in 2010 resulting from the fair value adjustment of warrants.
40
Other expense, net decreased in fiscal 2009 to $0.9 million from $1.0 million in fiscal 2008. Although interest expense increased to $1.3 million from $0.9 million in 2008 due to increased interest expense on the Broadwood note, the swing in foreign currency gains and losses from a loss of $410,000 in 2008 to a gain of $124,000 in 2009 more than offset the increased interest expense.
The following table presents our provision for income taxes for the fiscal years presented (in thousands):
|
2010
|
2009
|
2008
|
||||||||||
|
Provision for Income Taxes
|
$ | 432 | $ | 1,154 | $ | 975 | ||||||
Our provision for income taxes decreased from 2009 to 2010, primarily as a result of lower taxable income in jurisdictions where we pay tax.
Our provision for income taxes increased from 2008 to 2009, primarily as a result of an income tax benefit recorded by STAAR Japan in 2008 that reduced the overall tax provision.
See Critical Accounting Policies included later in this Item 7 for additional information about our provision for income taxes.
A reconciliation of the federal statutory income tax rate to our effective tax rate is set forth in Note 12 of Notes to the Consolidated Financial Statements included in Item 8 of this Annual Report on Form 10-K.
Liquidity and Capital Resources
While STAAR has made significant progress in reducing operating losses and improving cash flow, it has had a history of losses and negative cash flows on a consolidated basis over the last several years. During those years STAAR raised additional funds to support operations through sales of equity and debt securities.
The ability to avoid a subsequent short-term cash shortfall without selling additional equity securities was a principal consideration in STAAR’s divestiture of Domilens on March 2, 2010. The Domilens divestiture yielded a total of approximately $11.8 million in net cash proceeds to STAAR. On March 30, 2010, a global settlement of the Parallax and Moody cases was reached and in June 2010, STAAR’s $4.0 million contribution to the global settlement was paid from the $7.3 million release of the restricted deposit by the Court. The significant improvement in the Company’s cash position enabled STAAR to both redeem all the outstanding shares of its Series A preferred stock at an aggregate redemption value of $6.8 million and repay the $5.0 million Broadwood note, plus
interest, thereby significantly enhancing its balance sheet and financial position.
The Company’s liquidity requirements arise from the funding of its working capital needs, primarily inventory, work-in-process and accounts receivable. The Company’s primary sources for working capital and capital expenditures are cash flows from operating activities, proceeds from the Domilens divestiture, sale of STAAR common stock, and borrowings under the Company’s credit facilities. The Company’s liquidity also depends, in part, on customers paying within credit terms, and any extended delays in payments or changes in credit terms given to major customers may have an impact on the Company’s cash flow.
The Company believes its current cash balances coupled with cash flow from operating activities will be sufficient to meet its working capital requirements for the foreseeable future. STAAR’s need for working capital, and the terms on which financing may be available, will depend in part on its degree of success in maintaining positive cash flow through the strategies described above under the caption “Strategy.”
Overview of changes in cash and cash equivalents and other working capital accounts.
Net cash used in operating activities was $4.4 million in 2010, compared to net cash provided by operating activities of $1.4 million in 2009, and net cash used in operating activities of $8.2 million in fiscal 2008. In 2010, the use of cash from operations included the following significant items: payment of $4.0 million related to the global settlement of the legal judgments and $0.6 million used in the operating activities of discontinued operations of the disposed Domilens subsidiary, payment of $0.4 million of Domilens transaction related costs, and approximately $0.8 million interest paid for the Broadwood note. For fiscal 2009, the cash provided by operating activities was the result of a $17 million decrease in net loss in 2009 compared to
2008.
41
Net cash provided by investing activities was approximately $18.8 million in 2010, compared to net cash used in investing activities of $7.6 million in fiscal 2009, and net cash provided by investing activities of $1.1 million in 2008. Net cash provided by investing activities in 2010 was mainly due to the $11.8 million net cash proceeds from the sale of our German subsidiary in March 2010 and the release of the $7.4 million restricted deposit, including interest, by the Court. For 2009, net cash used in investing activities includes the $7.4 million posted as a deposit restricted deposit, including reinvested interest, with the Court for the litigation appeal and $0.6 million in acquisition of property, plant and equipment. In
fiscal year 2008, net cash provided by investing activities was primaily due to $2.2 million of cash acquired in the STAAR Japan acquisition, partially offset by $0.8 million of property and equipment purchases.
Net cash (used in) provided by financing activities was approximately ($11.5 million), $7.4 million, and $1.0 million for fiscal 2010, 2009, and 2008, respectively. Net cash used in financing activities in 2010 includes the $5 million principal payment on the Broadwood note, the $6.8 million cash redemption of the Series A preferred shares, and the $0.8 million repayment of principal on our capital lease obligations, partially offset by $1.1 million in cash proceeds from stock option exercises. Cash provided by financing activities in 2009 was primarily from the $8.5 million in proceeds from the sale of STAAR common stock in order to fund the Parallax bond, partially offset by $1.0 million repayment of principal on capital lease obligations. In 2008, cash provided by financing
activities resulted from net borrowings of $2 million under a line of credit in Japan, partially offset by $1 million in repayment of principan on capital lease obligations.
Accounts receivable was $8.2 million as of December 31, 2010 and $9.3 million as of January 1, 2010. Days’ Sales Outstanding (“DSO”) were 52 days in 2010 and 43 days in 2009. The Company expects to maintain DSO within a range of 50 to 55 days during the course of fiscal 2011.
Inventories at the end of fiscal 2010 and 2009 were $10.5 million and $14.8 million, respectively. Days’ inventory on hand (“DOH”) were 116 days in 2010 and 110 days in 2009 based on finished goods, including consignment inventory as of December 31, 2010 and January 1, 2010.
The increase in DSO and DOH from 2009 to 2010 is due to the divestiture of Domilens whose DSO and DOH was typically lower than the rest of the Company.
Credit Facilities, Contractual Obligations and Commitments
Accrued Termination Benefits for Executive
On May 24, 2010, STAAR accrued $700,000 in executive termination benefit costs in connection with the notice of non-renewal given under an executive employment agreement. This accrual represents STAAR’s best estimate of the contractual termination benefits due to the executive. The actual amount ultimately paid may be different. The costs are to be paid over fifteen months beginning August 27, 2010. The balance of the accrual at December 31, 2010 is approximately $570,000.
Credit Facilities
The Company has credit facilities with different lenders to support operations as detailed below.
Capital Lease Agreements
The Company has certain agreements with Farnam Street Financial, Inc. (“Farnam”) which provides lease financing to the Company for purchases of property, plant and equipment. These agreements are under various individual lease “Schedules” which commit the Company to lease a set contractual amount of assets per Schedule. Each Schedule has its own term, required commitment amount and lease rate factor (interest rate). In accordance with the requirements of ASC 840-10-25, all purchases under these Schedules are accounted for as capital leases. Title to all assets under the Farnam leases remains with Farnam. Under the agreement, the Company has the option to purchase any item of the leased property within its Schedule of assets at the end of
that Schedule’s lease term, at a mutually agreed-upon fair value. If the Company does not choose to purchase the asset under lease, it may rent the assets on a month-to-month basis or return them to Farnam. The Company must provide a 120-day notice prior to termination of its intent to purchase or return the assets. Amortization of the total capital lease obligation under any lease Schedule does not begin until the Company draws on the full amount of the commitment under that particular Schedule which is referred to as the Schedule “Commencement Date”. However, as individual asset leases are entered into pursuant to a particular Schedule but prior to the Commencement Date, the Company pays Farnam “interim rent” based on a predetermined lease factor applied to the actual principal amount of the purchases. (Note 10).
42
Line of Credit
The Company’s Japanese subsidiary, STAAR Japan, has an agreement, as amended on June 30, 2009, with Mizuho Bank which provides for borrowings of up to 300,000,000 Yen (approximately $3.7 million based on the rate of exchange on December 31, 2010), at an interest rate equal to the Tokyo short-term prime interest rate (approximately 1.475% as of December 31, 2010) plus 1.125% and may be renewed annually (the current line expires on April 2, 2011). The credit facility is not collateralized. The Company had 200,000,000 Yen outstanding on the line of credit as of December 31, 2010 and January 1, 2010, (approximately $2.5 million and $2.2 million based on the foreign exchange rates on December 31, 2010 and January 1, 2010) and approximates fair value due to the short-term maturity and market
interest rates of the line of credit. In case of default, the interest rate will be increased to 14% per annum. The Company believes the credit line will be renewed in fiscal 2011.
In August 2010, the Company’s wholly-owned Swiss subsidiary, STAAR Surgical AG, entered into a credit agreement with Credit Suisse (the “Bank”). The credit agreement provides for borrowings of up to 1,000,000 CHF (Swiss Francs) ($1,063,000 at the rate of exchange on December 31, 2010), to be used for working capital purposes. Accrued interest and 0.25% commissions on average outstanding borrowings is payable quarterly and the interest rate will be determined by the Bank based on the then prevailing market conditions at the time of borrowing. The credit agreement is automatically renewed on an annual basis based on the same terms assuming there is no default. The credit agreement may be terminated by either party at any time in accordance with its general terms
and conditions. The credit facility is not collateralized and contains certain conditions such as providing the Bank with audited financial statements annually and notice of significant events or conditions as defined in the credit agreement. The Bank may also declare all amounts outstanding to be immediately due and payable upon a change of control or a “material qualification” in STAAR Surgical AG’s independent auditors’ report. There were no borrowings outstanding as of December 31, 2010 and the full amount of the line was available for borrowing.
Covenant Compliance
The Company is in compliance with the covenants of its credit facilities and lines of credit as of the date of this report.
The following table represents the Company’s known contractual obligations as of December 31, 2010 (in thousands):
|
|
Payments Due by Period
|
|||||||||||||||||||
|
Contractual Obligations
|
Total
|
Less
Than
1 Year
|
1-3
Years
|
3-5
Years
|
More
Than
5 Years
|
|||||||||||||||
|
Line of credit
|
$
|
2,460
|
$
|
2,460
|
$
|
—
|
$
|
—
|
$
|
—
|
||||||||||
|
Capital lease obligations
|
2,432
|
938
|
1,390
|
104
|
—
|
|||||||||||||||
|
Operating lease obligations
|
9,364
|
2,246
|
3,906
|
3,212
|
—
|
|||||||||||||||
|
Pension obligations
|
2,072
|
118
|
303
|
366
|
1,285
|
|||||||||||||||
|
Severance
|
570
|
570
|
—
|
—
|
—
|
|||||||||||||||
|
Open purchase orders
|
387
|
387
|
—
|
—
|
—
|
|||||||||||||||
|
Total
|
$
|
17,285
|
$
|
6,719
|
$
|
5,599
|
$
|
3,682
|
$
|
1,285
|
||||||||||
Critical Accounting Policies
The preparation of financial statements in accordance with accounting principles generally accepted in the United States of America requires management to make estimates and assumptions that affect the reported amounts of assets and liabilities and disclosure of contingent assets and liabilities at the date of the financial statements and the reported amounts of sales and expenses during the reporting period. On an on-going basis, we evaluate our estimates, including those related to revenue recognition, allowances for doubtful accounts and sales return, inventory reserves and income taxes, among others. Our estimates are based on historical experiences, market trends and financial forecasts and projections, and on various other assumptions that management believes are reasonable under the circumstances
and at that certain point in time. Actual results may differ, significantly at times, from these if actual conditions differ from our assumptions.
43
We believe the following represent our critical accounting policies.
|
|
·
|
Revenue Recognition and Accounts Receivable. We recognize revenue when realized or realizable and earned, which is when the following criteria are met: persuasive evidence of an arrangement exists; delivery has occurred; the sale price is fixed and determinable; and collectability is reasonably assured. The Company records revenue from non-consignment product sales when title and risk of ownership has been transferred, which is typically at shipping point, except for our STAAR Japan subsidiary, which is typically recognized when the product is received by the customer. STAAR Japan does not have significant deferred revenues as delivery to the customer is generally made within the same or the next date of shipment. Our products are marketed
to ophthalmic surgeons, hospitals, ambulatory surgery centers or vision centers, and distributors. IOLs may be offered to surgeons and hospitals on a consignment basis. We maintain title and risk of loss on consigned inventory. We recognize revenue for consignment inventory when we are informed the IOL has been implanted and not upon shipment to the surgeon. We believe our revenue recognition policies are appropriate. We present sales tax we collect from our customers on a net basis (excluded from our revenues).
|
We ship ICLs only for use by surgeons who have already been certified, or for use in scheduled training surgeries.
For all sales, we are the Principal in the transaction as we, among other factors, bear general inventory risk, credit risk, have latitude in establishing the sales price and bear authorized sales returns inventory risk and therefore, sales are recognized gross with corresponding cost of sales in the statement of operations instead of a single, net amount. Cost of sales includes cost of production, freight and distribution, royalties, and inventory provisions, net of any purchase discounts.
We generally permit returns of product if the product is returned within the time allowed by our return policies, and in good condition. We provide allowances for sales returns based on an analysis of our historical patterns of returns matched against the sales from which they originated. While such allowances have historically been within our expectations, we cannot guarantee that we will continue to experience the same return rates that we have in the past. Measurement of such returns requires consideration of, among other factors, historical returns experience and trends, including the need to adjust for current conditions and product lines, the entry of a competitor, and judgments about the probable effects of relevant observable data. We consider all available information in our quarterly
assessments of the adequacy of the allowance for sales returns. Sales are reported net of estimated returns. If the actual sales returns are higher or lower than estimated by management, additional reduction or increase in sales may occur.
We maintain provisions for uncollectible accounts based on estimated losses resulting from the inability of our customers to remit payments. If the financial condition of customers were to deteriorate, thereby resulting in an inability to make payments, additional allowances could be required. We perform ongoing credit evaluations of our customers and adjust credit limits based upon customer payment history and current creditworthiness, as determined by our review of our customers’ current credit information. We continuously monitor collections and payments from our customers and maintain a provision for estimated credit losses based upon our historical experience and any specific customer collection issues that have been identified. Amounts determined to be uncollectible are written off against the allowance
for doubtful accounts. While such credit losses have historically been within our expectations and the provisions established, we cannot guarantee that we will continue to experience the same credit loss rates that we have in the past. Measurement of such losses requires consideration of historical loss experience, including the need to adjust for current conditions, and judgments about the probable effects of relevant observable data, including present economic conditions such as delinquency rates and financial health of specific customers. We consider all available information in our assessments of the adequacy of the reserves for uncollectible accounts.
|
|
·
|
Stock-Based Compensation. We account for the issuance of stock options to employees and directors by estimating the fair value of options and warrants issued using the Black-Scholes pricing model. This model’s calculations include the exercise price, the market price of shares on grant date, risk-free interest rates, expected term of the option or warrant, expected volatility of our stock and expected dividend yield. The amounts recorded in the financial statements for share-based expense could vary significantly if we were to use different assumptions.
|
44
|
|
·
|
Accounting for Warrants. We account for the issuance of Company derivative equity instruments such as the warrants, in accordance with ASC 815-40 (formerly Emerging Issues Task Force Issue No. 00-19, “Accounting for Derivative Financial Instruments Indexed to, and Potentially Settled in, a Company’s Own Stock” (“EITF 00-19”). We agreed to use our best efforts to register and maintain registration of the common shares underlying certain warrants (the “Warrant Shares”) that were issued by us with debt instruments, so that the warrant holder may freely sell the Warrant Shares if the warrant is exercised, and we agreed that in any event we would secure effective registration within a certain time period after issuance
(typically up to five months from issuance). In addition, while the relevant warrant agreement does not require cash settlement if we do not maintain continuous registration of certain Warrant Shares, the agreement does not specifically preclude cash settlement. As a result ASC 815-40 requires us to assume that in the absence of continuous effective registration we may be required to settle some of these warrants for cash when they are exercised. Accordingly, our agreement to register and maintain registration of certain Warrant Shares without express terms for settlement in the absence of continuous effective registration is presumed to create a liability to settle these warrants in cash, requiring liability classification. We have issued other warrants under another agreement that expressly provides that if we fail to satisfy registration requirements we will be obligated only to issue additional common stock as the holder’s sole remedy, with no possibility of settlement in
cash. In this circumstance, we account for those warrants as equity because additional shares are the only form of settlement available to the holder. We use the Black-Scholes option pricing model as the valuation model to estimate the fair value of all warrants. We evaluate the balance sheet classification of the warrants during each reporting period. Expected volatilities are based on historical volatility of our stock. The expected life of the warrant is determined by the amount of time remaining on the original six-year term of the relevant warrant agreement. The risk-free rate of return for periods within the contractual life of the warrant is based on the U.S. Treasury yield curve in effect at each reporting period. Any gains or losses resulting from the changes in fair value of the warrants classified as a liability from period to period are included as an increase or decrease of other income (expense). The warrants that are accounted for as equity are only valued on the
issuance date and not subsequently revalued.
|
|
|
·
|
Income Taxes. We account for income taxes under the asset and liability method, whereby deferred tax assets and liabilities are recognized for the future tax consequences attributable to differences between the financial statement carrying amounts of existing assets and liabilities and their respective tax bases. Deferred tax assets and liabilities are measured using enacted tax rates expected to apply in the years in which those temporary differences are expected to be recovered or settled. The effect on deferred tax assets and liabilities of a change in tax rates is recognized in income in the period that includes the enactment date. We evaluate the need to establish a valuation allowance for deferred tax assets based on the amount of existing temporary
differences, the period in which they are expected to be recovered and expected levels of taxable income. A valuation allowance to reduce deferred tax assets is established when it is “more likely than not” that some or all of the deferred tax assets will not be realized.
|
We expect to continue to maintain a full valuation allowance on future tax benefits until, and if, an appropriate level of profitability is sustained, or we are able to develop tax strategies that would enable us to conclude that it is more likely than not that a portion of our deferred tax assets would be realizable.
In the normal course of business, the Company is regularly audited by federal, state and foreign tax authorities, and is periodically challenged regarding the amount of taxes due. These challenges include questions regarding the timing and amount of deductions and the allocation of income among various tax jurisdictions. We believe that our tax positions comply with applicable tax law and intend to defend our positions. Our effective tax rate in a given financial statement period could be impacted if we prevailed in matters for which reserves have been established, or were required to pay amounts in excess of established reserves.
|
|
·
|
Inventories. We provide estimated inventory allowances for excess, slow moving, expiring and obsolete inventory as well as inventory whose carrying value is in excess of net realizable value. These reserves are based on current assessments about future demands, market conditions and related management initiatives. If market conditions and actual demands are less favorable than those projected by management, additional inventory write-downs may be required. We value our inventory at the lower of cost or net realizable market values. We regularly review inventory quantities on hand and record a provision for excess and obsolete inventory based primarily on the expiration of products with a shelf life of less than four months, estimated forecasts of product demand
and production requirements for the next twelve months. Several factors may influence the realizability of our inventories, including decisions to exit a product line, technological change and new product development. These factors could result in an increase in the amount of obsolete inventory quantities on hand. Additionally, estimates of future product demand may prove to be inaccurate, in which case the provision required for excess and obsolete inventory may be understated or overstated. If in the future, we determine that our inventory was overvalued, we would be required to recognize such costs in cost of sales at the time of such determination. Likewise, if we determine that our inventory was undervalued, cost of sales in previous periods could have been overstated and we would be required to recognize such additional operating income at the time of sale. While such inventory losses have historically been within our expectations and the provisions established, we cannot
guarantee that we will continue to experience the same loss rates that we have in the past. Therefore, although we make every effort to ensure the accuracy of forecasts of future product demand, including the impact of planned future product launches, any significant unanticipated changes in demand or technological developments could have a significant impact on the value of our inventory and our reported operating results.
|
45
|
|
·
|
Impairment of Long-Lived Assets. Intangible and other long lived-assets are reviewed for impairment whenever events such as product discontinuance, plant closures, product dispositions or other changes in circumstances indicate that the carrying amount may not be recoverable. Certain factors which may occur and indicate that an impairment exists include, but are not limited to the following: significant underperformance relative to expected historical or projected future operating results; significant changes in the manner of the Company’s use of the underlying assets; and significant adverse industry or market economic trends. In reviewing for impairment, we compare the carrying value of such assets to the estimated undiscounted future net cash flows
expected from the use of the assets and their eventual disposition. In the event that the carrying value of assets is determined to be unrecoverable, we would estimate the fair value of the assets and record an impairment charge for the excess of the carrying value over the fair value. The estimate of fair value requires management to make a number of assumptions and projections, which could include, but would not be limited to, future revenues, earnings and the probability of certain outcomes and scenarios. Our policy is consistent with current accounting guidance as prescribed by ASC 360-10-35 (formerly SFAS No. 144, Accounting for the Impairment or Disposal of Long-Lived Assets.)
|
|
|
·
|
Goodwill. Goodwill, which has an indefinite life, is not amortized, but instead is subject to periodic testing for impairment. Intangible assets determined to have definite lives are amortized over their remaining useful lives. Goodwill is tested for impairment on an annual basis or between annual tests if an event occurs or circumstances change that would reduce the fair value of a reporting unit below its carrying amount. Certain factors which may occur and indicate that an impairment exists include, but are not limited to the following: significant underperformance relative to expected historical or projected future operating results; significant changes in the manner of our use of the underlying assets; and significant adverse industry or market economic
trends. In the event that the carrying value of assets is determined to be unrecoverable, we would estimate the fair value of the reporting unit and record an impairment charge for the excess of the carrying value over the fair value. The estimate of fair value requires management to make a number of assumptions and projections, which could include, but would not be limited to, future revenues, earnings and the probability of certain outcomes and scenarios, including the use of experts.
|
|
|
·
|
Definite-Lived Intangible Assets. We also have other intangible assets mainly consisting of patents and licenses, developed technologies and customer relationships, with a gross book value of $13.5 million and accumulated amortization of $9.3 million as of December 31, 2010. We capitalize the cost of acquiring patents and licenses. We acquired certain customer relationships and developed technologies in the acquisition of our STAAR Japan subsidiary which was completed on December 29, 2007. Amortization is computed on the straight-line basis over the estimated useful lives of the assets, since the pattern in which the economic benefits realized cannot be reasonably determined, which are based on legal, contractual and other provisions, and range from 10
to 21 years for patents and licenses, 10 years for customer relationships and 3 to 10 years for developed technology. We review intangible assets for impairment in the assessment discussed above regarding Impairment of Long-Lived Assets.
|
|
|
·
|
Employee Defined Benefit Plans. We have maintained a passive pension plan (the “Swiss Plan”) covering employees of its Swiss subsidiary. The Company concluded that the features of the Swiss Plan conform to the features of a defined benefit plan. As a result, we adopted the recognition and disclosure requirements of ASC 715-20-65 Transition Guidance (formerly Statement of Financial Accounting Standards (“SFAS”) No. 158, “Employers’ Accounting for Defined Benefit Pension and Other Postretirement Plans,” an amendment of SFAS Nos. 87, 88, 106 and 132R (“SFAS 158”) on October 1, 2007).
|
In connection with our acquisition of the remaining interest in STAAR Japan, Inc., we assumed the net pension liability under STAAR Japan’s noncontributory defined benefit pension plan substantially covering all of the employees of STAAR Japan. STAAR Japan adopted the recognition and disclosure requirements of ASC 715-30 on December 29, 2007, the date of the acquisition.
46
ASC 715-30 requires recognition of the funded status, or difference between the fair value of plan assets and the projected benefit obligations of the pension plan on the statement of financial position with a corresponding adjustment to accumulated other comprehensive income. If the projected benefit obligation exceeds the fair value of plan assets, then that difference or unfunded status represents the pension liability. We record a net periodic pension cost in the consolidated statement of operations. The liabilities and annual income or expense of both plans are determined using methodologies that involve several actuarial assumptions, the most significant of which are the discount rate, and the expected long-term rate of asset return (based on the market-related value of assets). The fair values of
plan assets are determined based on prevailing market prices. The amounts recorded in the financial statements pertaining to our employee defined benefit plans could vary significantly if we were to use different assumptions.
Foreign Exchange
Management does not believe that the fluctuation in the value of the dollar in relation to the currencies of its suppliers or customers in the last three fiscal years had adversely affected our ability to purchase or sell products at agreed upon prices. No assurance can be given; however, that adverse currency exchange rate fluctuations will not occur in the future, which could significantly affect our operating results. We do not engage in hedging transactions to offset changes in currency or fluctuations in foreign currencies.
Inflation
Management believes inflation has not had a significant impact on our operations during the past three years.
Recent Accounting Pronouncements
See Item 8 of Part II, “Financial Statements and Supplementary Data – Note 1 – Significant Accounting Policies – Recent Accounting Pronouncements.”
Item 7A. Quantitative and Qualitative Disclosures About Market Risk
In the normal course of business, our operations are exposed to risks associated with fluctuations in interest rates and foreign currency exchange rates. The Company manages its risks based on management’s judgment of the appropriate trade-off between risk, opportunity, and costs and does not generally enter into interest rate or foreign exchange rate hedge instruments.
Interest rate risk. As of December 31, 2010, STAAR had $2.5 million of foreign debt. Our $2.5 million of foreign debt bears an interest rate that is equal to at an interest rate equal to the Tokyo short-term prime interest rate (approximately 1.475% as of December 31, 2010) plus 1.125% and thus, our interest expense would fluctuate with any change in the prime interest rate. If the Tokyo prime rate were to increase or decrease by 1% for the year, our annual interest expense would increase or decrease by approximately $25,000 based on the exchange rate in effect at December 31, 2010.
Foreign currency risk. Fluctuations in the rate of exchange between the U.S. dollar and foreign currencies in which we transact business could adversely affect our financial results. Cost of goods sold and selling, general, and administrative expenses that correspond with these sales are largely denominated in the same currency, thereby limiting our transaction risk exposure.
Our international subsidiaries operate in and are net recipients of currencies other than the U.S. dollar and, as a result, our sales benefit from a weaker dollar and are reduced by a stronger dollar relative to major currencies worldwide (primarily, the Euro, Japanese Yen, Swiss Franc and Australian dollar). Accordingly, changes in exchange rates, and particularly the strengthening of the U.S. Dollar, may negatively affect our consolidated sales and gross profit as expressed in U.S. dollars. Fluctuations during any given reporting period result in the re-measurement of our foreign currency denominated cash, receivables, and payables, generating currency transaction gains or losses and are reported in total other expenses in our consolidated statements of operations. In the
normal course of business, we also face risks that are either non-financial or non-quantifiable. Such risks include those set forth in “Item 1A. — Risk Factors.”
Item 8. Financial Statements and Supplementary Data
Financial Statements and the Reports of Independent Registered Public Accounting Firm are filed with this Annual Report on Form 10-K in a separate section following Part IV, as shown on the index under Item 15 of this Annual Report.
Item 9. Changes in and Disagreements with Accountants on Accounting and Financial Disclosure
None.
47
Item 9A. Controls and Procedures
Attached as exhibits to this Annual Report on Form 10-K are certifications of STAAR’s Chief Executive Officer (“CEO”) and Chief Financial Officer (“CFO”), which are required in accordance with Rule 13a-14 of the Securities Exchange Act of 1934, as amended (the “Exchange Act”). This “Controls and Procedures” section includes information concerning the controls and controls evaluation referred to in the certifications. Page F-3 of this Annual Report on Form 10-K sets forth the report of BDO USA, LLP, our independent registered public accounting firm, regarding its audit of STAAR’s internal control over financial reporting. This section should be read in conjunction with the certifications and the BDO USA, LLP report for a more complete understanding of the
topics presented.
Evaluation of Disclosure Controls and Procedures
As of the end of the period covered by this report, we carried out an evaluation, under the supervision and with the participation of our management, including our CEO and CFO, of the effectiveness of the design and operation of the disclosure controls and procedures of STAAR Surgical Company and its subsidiaries (the “Company”). Based on that evaluation, our CEO and CFO concluded, as of the end of the period covered by our Form 10-K for the fiscal year ended December 31, 2010, that our disclosure controls and procedures were effective. For purposes of this statement, the term “disclosure controls and procedures” means controls and other procedures of the Company that are designed to ensure that information required to be disclosed by the Company in the reports that it
files or submits under the Securities Exchange Act (15 U.S.C. 78a et seq) is recorded, processed, summarized and reported, within the time periods specified in the Commission's rules and forms. Disclosure controls and procedures include, without limitation, controls and procedures designed to ensure that information required to be disclosed by the issuer in the reports that it files or submits under the Act is accumulated and communicated to the issuer's management, including its principal executive and principal financial officers, or persons performing similar functions, as appropriate to allow timely decisions regarding required disclosure.
Management Annual Report on Internal Control over Financial Reporting
The Company’s management, including our Chief Executive Officer and Chief Financial Officer, is responsible for establishing and maintaining adequate internal control over financial reporting (as such term is defined in Exchange Act Rule 13a-15(f) and 15d-15(f)) for STAAR Surgical Company and its subsidiaries (the “Company”). The Company’s internal control system was designed to provide reasonable assurance to the Company’s management and Board of Directors regarding the preparation and fair presentation of published consolidated financial statements in accordance with accounting principles generally accepted in the United States of America.
Because of its inherent limitations, a system of internal control over financial reporting can provide only reasonable assurance and may not prevent or detect misstatements. Further, because of changing conditions, effectiveness of internal control over financial reporting may vary over time. The Company’s processes contain self-monitoring mechanisms, and actions are taken to correct deficiencies as they are identified.
Management has assessed the effectiveness of the Company’s internal control over financial reporting as of December 31, 2010, based on the criteria for effective internal control described in Internal Control — Integrated Framework issued by the Committee of Sponsoring Organizations of the Treadway Commission. Based on its assessment, management concluded that the Company’s internal control over financial reporting was effective as of December 31, 2010.
Changes in Internal Control over Financial Reporting
There was no change during the fiscal quarter ended December 31, 2010 that has materially affected, or is reasonably likely to materially affect, our internal control over financial reporting.
Item 9B. Other Information
Compensatory Arrangements of Certain Officers:
The following elements of compensation have been approved by the Board of Directors of STAAR Surgical Company, with the approval effective on the date STAAR files this Annual Report on Form 10-K for the fiscal year ended December 31, 2010, including the audited consolidated financial statements for that period. The restricted stock grants consist of shares of common stock that are subject to forfeiture based upon vesting conditions and will vest on the one year anniversary of the filing date of this Annual Report on Form 10-K.
48
For the Chief Executive Officer, Chief Financial Officer and named Executive Officer listed below the compensation was awarded as follows:
Bonuses for 2010 Performance
|
Name and Title
|
Bonus
|
|||
|
Barry Caldwell
|
||||
|
President and CEO
|
$ | 180,000 | ||
|
Deborah Andrews
|
||||
|
Vice President and Chief Financial Officer
|
$ | 67,500 | ||
|
Hans Blickensdoerfer
|
||||
|
President EMEA and Latin America
|
$ | 75,000 | ||
Long-Term Equity Compensation
|
Name and Title
|
Restricted Shares of
Common Stock (1)
|
|||
|
Barry Caldwell
|
||||
|
President and CEO
|
10,000 | |||
|
Deborah Andrews
|
||||
|
Vice President and Chief Financial Officer
|
4,000 | |||
|
Hans Blickensdoerfer
|
||||
|
President EMEA and Latin America
|
6,000 | |||
|
(1)
|
The restricted shares may not be sold or transferred until after the one year anniversary of the filing of this Annual Report on Form 10-K, and until that date are subject to forfeiture pursuant to customary vesting conditions.
|
In total, the Board of Directors approved aggregate awards of cash bonuses for 2010 performance to STAAR employees equaling $750,000 and restricted share awards totaling 48,000 shares to be distributed to approximately 30 employees, all of which awards are effective on the filing date of this Annual Report on Form 10-k. The Company accrued the total cash bonuses as an expense in the fiscal quarter that ended December 31, 2010, and that expense is reflected in the consolidated financial statements of the Company in this 10-K.
49
PART III
Item 10. Directors and Executive Officers and Corporate Governance
The information required by this item is incorporated herein by reference to the section entitled “Proposal One — Election of Directors” contained in the proxy statement (the “Proxy Statement”) for the 2011 annual meeting of stockholders to be filed with the Securities and Exchange Commission within 120 days of the close of the fiscal year ended December 31, 2010.
Item 11. Executive Compensation
The information required by this item is incorporated herein by reference to the section entitled “Proposal One — Election of Directors” contained in the Proxy Statement.
Item 12. Security Ownership of Certain Beneficial Owners and Management and Related Stockholder Matters
The information required by this item is incorporated herein by reference to the section entitled “General Information — Security Ownership of Certain Beneficial Owners and Management” and “Proposal One — Election of Directors” contained in the Proxy Statement.
Item 13. Certain Relationships and Related Transactions and Director Independence
The information required by this item is incorporated herein by reference to the section entitled “Proposal One — Election of Directors” contained in the Proxy Statement.
Item 14. Principal Accountant Fees and Services
The information required by this item is incorporated herein by reference to the section entitled “Proposal Two — Ratification of the Appointment of Independent Registered Public Accounting Firm” contained in the Proxy Statement.
50
PART IV
Item 15. Exhibits and Financial Statement Schedules
|
We have filed the following documents as part of this Annual Report on Form 10-K:
|
Page
|
||
|
(1)
|
Consolidated Financial Statements
|
||
|
Reports of Independent Registered Public Accounting Firm
|
F-2
|
||
|
Consolidated Balance Sheets
|
F-4
|
||
|
Consolidated Statements of Operations
|
F-5
|
||
|
Consolidated Statements of Changes in Stockholders’ Equity and Comprehensive Income
|
F-6
|
||
|
Consolidated Statements of Cash Flows
|
F-7
|
||
|
Notes to Consolidated Financial Statements
|
F-8
|
||
|
(2)
|
Schedules required by Regulation S-X are filed as an exhibit to this report:
|
||
|
I. Independent Registered Public Accounting Firm Report on Schedule
|
F-38 | ||
|
II. Schedule II — Valuation and Qualifying Accounts and Reserves
|
F-39 |
All other schedules have been omitted because they are not required, not applicable, or the required information is otherwise included.
| (3) |
Exhibits
|
|
2.1
|
Share Purchase Agreement between STAAR Surgical AG and Domilens Akquisitions GmbH, dated February 24, 2010.(1)
|
|
|
3.1
|
Certificate of Incorporation, as amended to date.(2)
|
|
|
3.2
|
By-laws, as amended to date.(3)
|
|
|
†4.3
|
1998 STAAR Surgical Company Stock Plan, adopted April 17, 1998.(4)
|
|
|
4.4
|
Form of Certificate for Common Stock, par value $0.01 per share.(5)
|
|
|
†4.5
|
Amended and Restated 2003 Omnibus Equity Incentive Plan and form of Option Grant and Stock Option Agreement.(6)
|
|
|
10.3
|
Indenture of Lease dated September 1, 1993, by and between the Company and FKT Associates and First through Third Additions Thereto.(11)
|
|
|
10.4
|
Second Amendment to Indenture of Lease dated September 21, 1998, between the Company and FKT Associates.(11)
|
|
|
10.5
|
Third Amendment to Indenture of Lease dated October 13, 2003, by and between the Company and FKT Associates.(7)
|
|
|
10.6
|
Fourth Amendment to Indenture of Lease dated September 30, 2006, by and between the Company and FKT Associates.(2)
|
|
|
10.7
|
Indenture of Lease dated October 20, 1983, between the Company and Dale E. Turner and Francis R. Turner and First through Fifth Additions Thereto.(8)
|
|
|
10.8
|
Sixth Lease Addition to Indenture of Lease dated October 13, 2003, by and between the Company and Turner Trust UTD Dale E. Turner March 28, 1984.(7)
|
|
|
10.9
|
Seventh Lease Addition to Indenture of Lease dated September 30, 2006, by and between the Company and Turner Trust UTD Dale E. Turner March 28, 1984.(2)
|
|
|
10.10
|
Amendment No. 1 to Standard Industrial/Commercial Multi-Tenant Lease dated January 3, 2003, by and between the Company and California Rosen LLC.(7)
|
|
|
10.11
|
Lease Agreement dated July 12, 1994, between STAAR Surgical AG and Calderari and Schwab AG/SA.(9)
|
|
|
10.12
|
Supplement #1 dated July 10, 1995, to the Lease Agreement of July 12, 1994, between STAAR Surgical AG and Calderari and Schwab AG/SA.(9)
|
|
|
10.13
|
Supplement #2 dated August 2, 1999, to the Lease Agreement of July 12, 1994, between STAAR Surgical AG and Calderari and Schwab AG/SA.(9)
|
|
|
10.15
|
Patent License Agreement, dated May 24, 1995, with Eye Microsurgery Intersectoral Research and Technology Complex.(10)
|
|
|
10.16
|
Patent License Agreement, dated January 1, 1996, with Eye Microsurgery Intersectoral Research and Technology Complex.(11)
|
|
|
†10.23
|
Stock Option Plan and Agreement for Chief Executive Officer dated November 13, 2001, between the Company and David Bailey.(12)
|
|
|
†10.24
|
Stock Option Certificate dated August 9, 2001, between the Company and David Bailey.(9)
|
51
|
†10.25
|
Stock Option Certificate dated January 2, 2002, between the Company and David Bailey(9)
|
|
|
†10.27
|
Amended and Restated Stock Option Certificate dated February 13, 2003, between the Company and David Bailey(9)
|
|
|
†10.42
|
Form of Indemnification Agreement between the Company and certain officers and directors(9)
|
|
|
10.59
|
Standard Industrial/Commercial Multi Tenant Lease — Gross dated October 6, 2005, entered into between the Company and Z & M LLC(13)
|
|
|
10.64
|
Warrant Agreement between STAAR Surgical Company and Broadwood Partners, L.P., dated March 21, 2007. (14)
|
|
|
†10.66
|
Executive Employment Agreement by and between the Company and Barry G. Caldwell, dated as of November 27, 2007. (15)
|
|
|
†10.67
|
Executive Employment Agreement by and between the Company and David Bailey, dated as of November 27, 2007.(15)
|
|
|
10.69
|
Warrant Agreement between STAAR Surgical Company and Broadwood Partners, L.P., dated December 14, 2007.(16)
|
|
|
†10.71
|
Amended and Restated Executive Employment Agreement by and between the Company and Barry G. Caldwell, dated December 31, 2008.(17)
|
|
|
†10.76
|
Employment Agreement effective November 22, 2002 by and between the Company and Deborah Andrews.(18)
|
|
|
†10.77
|
Letter of the Company dated April 11, 2007 to Deborah Andrews, Vice President and Chief Financial Officer, regarding compensation.(18)
|
|
|
†10.79
|
Employment Agreement, dated December 16, 2004, by and between the Company and Hans Blickensdoerfer.(18)
|
|
|
10.80
|
Credit Agreement between STAAR Japan Inc. and Mizuho Bank Inc., dated October 31, 2007.(18)
|
|
|
10.81
|
Amended Credit Agreement between STAAR Japan Inc. and Mizuho Bank Ltd., dated June 30, 2009.(18)
|
|
|
10.82
|
Basic Agreement on Unsterilized Intraocular Lens Sales Transactions between Canon Staar Co., Inc. and Nidek Co., Ltd., dated May 23, 2005.(19)
|
|
|
10.83
|
Basic Agreement on Injector Product Sales Transactions between Canon Staar Co., Inc. and Nidek Co., Ltd., dated May 23, 2005.(19)
|
|
|
10.84
|
Memorandum of Understanding Concerning Basic Agreements for Purchase and Sale between STAAR Japan Inc. and Nidek Co., Ltd., dated December 25, 2008.(19)
|
|
|
10.85
|
Acrylic Preset supply Warranty Agreement between STAAR Japan Inc. and Nidek Co., Ltd., dated December 25, 2008.(19)
|
|
|
10.86
|
Framework Agreement for Loans between Credit Suisse and STAAR Surgical AG, dated August 12, 2010. (20)
|
|
|
10.87
|
Amendment No. 1 to the Executive Employment Agreement between David Bailey and STAAR Surgical Company, dated November 10, 2010.(20)
|
|
|
14.1
|
Code of Ethics(9)
|
|
|
21.1
|
List of Significant Subsidiaries*
|
|
|
23.1
|
Consent of BDO USA, LLP*
|
|
|
31.1
|
Certification Pursuant to Rule 13a-14(a) of the Securities Exchange Act of 1934, Adopted Pursuant to Section 302 of the Sarbanes-Oxley Act of 2002*
|
|
|
31.2
|
Certification Pursuant to Rule 13a-14(a) of the Securities Exchange Act of 1934, Adopted Pursuant to Section 302 of the Sarbanes-Oxley Act of 2002*
|
|
|
32.1
|
Certification Pursuant to 18 U.S.C. Section 1350, Adopted Pursuant to Section 906 of the Sarbanes-Oxley Act of 2002*
|
|
*
|
Filed herewith
|
|
†
|
Management contract or compensatory plan or arrangement
|
|
#
|
All schedules and or exhibits have been omitted. Any omitted schedule or exhibit will be furnished supplementally to the Securities and Exchange Commission upon request.
|
|
(1)
|
Incorporated by reference to the Company’s Quarterly Report on Form 10-Q on Form 10-Q for the period ended April 2, 2010, as filed on May 12, 2010.
|
|
(2)
|
Incorporated by reference to the Company’s Annual Report on Form 10-K, for the year ended December 28, 2007, as filed on March 12, 2008.
|
|
(3)
|
Incorporated by reference from the Company’s Current Report on Form 8-K, as filed on May 23, 2006.
|
52
|
(4)
|
Incorporated by reference to the Company’s Proxy Statement for its Annual Meeting of Stockholders held on May 29, 1998, filed on May 1, 1998.
|
|
(5)
|
Incorporated by reference to Exhibit 4.1 to Amendment No. 1 to the Company’s Registration Statement on Form 8-A/A, as filed on April 18, 2003.
|
|
(6)
|
Incorporated by reference to the Company’s Proxy Statement for its Annual Meeting of Stockholders held on May 19, 2010, filed on April 9, 2010.
|
|
(7)
|
Incorporated by reference to the Company’s Annual Report on Form 10-K, for the year ended January 2, 2004, as filed on March 17, 2004.
|
|
(8)
|
Incorporated by reference from the Company’s Annual Report on Form 10-K, for the year ended January 2, 1998, as filed on April 1, 1998.
|
|
(9)
|
Incorporated by reference from the Company’s Annual Report on Form 10-K, for the year ended December 31, 2004, as filed on March 30, 2005.
|
|
(10)
|
Incorporated by reference to the Company’s Annual Report on form 10-K/A for the year ended December 29, 2000, as filed on May 9, 2001.
|
| (11) | Incorporated by reference to the Company’s Annual Report on form 10-K for the year ended December 29, 2000, as filed on March 29, 2001. |
| (12) | Incorporated by reference to the Company's Annual Report on Form 10-K for the year ended December 28, 2001, as filed on March 28, 2002. |
|
(13)
|
Incorporated by reference to the Company’s Quarterly Report on Form 10-Q for the period ended September 30, 2005, as filed on November 9, 2005.
|
|
(14)
|
Incorporated by reference to the Company’s Current Report on form 8-K filed on March 21, 2007.
|
|
(15)
|
Incorporated by reference to the Company’s Current Report on Form 8-K filed on December 4, 2007.
|
|
(16)
|
Incorporated by reference to the Company’s Current Report on form 8-K filed on December 17, 2007.
|
|
(17)
|
Incorporated by reference to the Company’s Current Report on Form 8-K filed on January 8, 2009.
|
|
(18)
|
Incorporated by reference to the Company’s Current Report on Form 8-K filed on October 1, 2009.
|
|
(19)
|
Incorporated by reference to the Company’s Annual Report on Form 10-K for the year ended January 1, 2010.
|
|
(20)
|
Incorporated by reference to the Company’s Quarterly Report on Form 10-Q for the period ended October 1, 2010, as filed on November 10, 2010.
|
53
SIGNATURES
Pursuant to the requirements of Section 13 or 15(d) of the Securities Exchange Act of 1934, the registrant has duly caused this report to be signed on its behalf by the undersigned, thereunto duly authorized.
|
STAAR SURGICAL COMPANY
|
|||
|
Date: March 2, 2011
|
By:
|
/s/ Barry G. Caldwell
|
|
|
Barry G. Caldwell
|
|||
|
President and Chief Executive Officer
|
|||
|
(principal executive officer)
|
|||
Pursuant to the requirements of the Securities Exchange Act of 1934, this report has been signed below by the following persons on behalf of the registrant and in the capacities and on the dates indicated.
|
Name
|
Title
|
Date
|
||
|
/s/ Barry G. Caldwell
|
President, Chief Executive Officer and Director
|
March 2, 2011
|
||
|
Barry G. Caldwell
|
(principal executive officer)
|
|||
|
/s/ Deborah Andrews
|
Vice President, Chief Financial Officer
|
March 2, 2011
|
||
|
Deborah Andrews
|
(principal accounting and financial officer)
|
|||
|
/s/ Don Bailey
|
Chairman of the Board, Director
|
March 2, 2011
|
||
|
Don Bailey
|
||||
|
/s/ Donald Duffy
|
Director
|
March 2, 2011
|
||
|
Donald Duffy
|
||||
|
/s/ John C. Moore
|
Director
|
March 2, 2011
|
||
|
John C. Moore
|
||||
|
/s/ David Morrison
|
Director
|
March 2, 2011
|
||
|
David Morrison
|
||||
|
/s/ Richard A. Meier
|
Director
|
March 2, 2011
|
||
|
Richard A. Meier
|
||||
|
/s/ Mark B. Logan
|
Director
|
March 2, 2011
|
||
|
Mark B. Logan
|
54
STAAR SURGICAL COMPANY AND SUBSIDIARIES
CONSOLIDATED FINANCIAL STATEMENTS
Years Ended December 31, 2010, January 1, 2010,
and January 2, 2009
TABLE OF CONTENTS
|
Report of Independent Registered Public Accounting Firm
|
F-2
|
||
|
Report of Independent Registered Public Accounting Firm
|
F-3
|
||
|
Consolidated Balance Sheets at December 31, 2010 and at January 1, 2010
|
F-4
|
||
|
Consolidated Statements of Operations for the years ended December 31, 2010, January 1, 2010, and January 2, 2009
|
F-5
|
||
|
Consolidated Statements of Stockholders’ Equity and Comprehensive Income (Loss) for the years ended December 31, 2010, January 1, 2010, and January 2, 2009
|
F-6
|
||
|
Consolidated Statements of Cash Flows for the years ended December 31, 2010, January 1, 2010, and January 2, 2009
|
F-7
|
||
|
Notes to Consolidated Financial Statements
|
F-8
|
||
|
Report on Schedule II – Valuation and Qualifying Accounts and Reserves
|
F-38 |
F-1
STAAR SURGICAL COMPANY AND SUBSIDIARIES
REPORT OF INDEPENDENT REGISTERED PUBLIC ACCOUNTING FIRM
Board of Directors and Stockholders
STAAR Surgical Company
Monrovia, CA
We have audited the accompanying consolidated balance sheets of STAAR Surgical Company and Subsidiaries (“the Company”) as of December 31, 2010 and January 1, 2010, and the related consolidated statements of operations, stockholders’ equity and comprehensive income (loss), and cash flows for each of the three years in the period ended December 31, 2010. These financial statements are the responsibility of the Company’s management. Our responsibility is to express an opinion on these financial statements based on our audits.
We conducted our audits in accordance with the standards of the Public Company Accounting Oversight Board (United States). Those standards require that we plan and perform the audit to obtain reasonable assurance about whether the financial statements are free of material misstatement. An audit includes examining, on a test basis, evidence supporting the amounts and disclosures in the financial statements, assessing the accounting principles used and significant estimates made by management, as well as evaluating the overall financial statement presentation. We believe that our audits provide a reasonable basis for our opinion.
In our opinion, the consolidated financial statements referred to above present fairly, in all material respects, the financial position of STAAR Surgical Company and Subsidiaries as of December 31, 2010 and January 1, 2010, and the consolidated results of their operations and their cash flows for each of the three years in the period ended December 31, 2010, in conformity with accounting principles generally accepted in the United States of America.
We also have audited, in accordance with the standards of the Public Company Accounting Oversight Board (United States), STAAR Surgical Company and Subsidiaries’ internal control over financial reporting as of December 31, 2010, based on criteria established in Internal Control – Integrated Framework issued by the Committee of Sponsoring Organizations of the Treadway Commission (COSO) and our report dated March 2, 2011 expressed an unqualified opinion thereon.
|
/s/ BDO USA, LLP
|
|
Los Angeles, California
|
|
March 2, 2011
|
F-2
STAAR SURGICAL COMPANY AND SUBSIDIARIES
REPORT OF INDEPENDENT REGISTERED PUBLIC ACCOUNTING FIRM
Board of Directors and Stockholders
STAAR Surgical Company
Monrovia, CA
We have audited STAAR Surgical Company and Subsidiaries’ internal control over financial reporting as of December 31, 2010, based on criteria established in Internal Control – Integrated Framework issued by the Committee of Sponsoring Organizations of the Treadway Commission (the COSO criteria). STAAR Surgical Company’s management is responsible for maintaining effective internal control over financial reporting and for its assessment of the effectiveness of internal control over financial reporting, included in the accompanying Item 9A, Management’s Report on Internal Control Over Financial Reporting. Our responsibility is to express an opinion on the company’s internal control over financial reporting based on our audit.
We conducted our audit in accordance with the standards of the Public Company Accounting Oversight Board (United States). Those standards require that we plan and perform the audit to obtain reasonable assurance about whether effective internal control over financial reporting was maintained in all material respects. Our audit included obtaining an understanding of internal control over financial reporting, assessing the risk that a material weakness exists, and testing and evaluating the design and operating effectiveness of internal control based on the assessed risk. Our audit also included performing such other procedures as we considered necessary in the circumstances. We believe that our audit provides a reasonable basis for our opinion.
A company’s internal control over financial reporting is a process designed to provide reasonable assurance regarding the reliability of financial reporting and the preparation of financial statements for external purposes in accordance with generally accepted accounting principles. A company’s internal control over financial reporting includes those policies and procedures that (1) pertain to the maintenance of records that, in reasonable detail, accurately and fairly reflect the transactions and dispositions of the assets of the company; (2) provide reasonable assurance that transactions are recorded as necessary to permit preparation of financial statements in accordance with generally accepted accounting principles, and that receipts and expenditures of the company are being made only in accordance
with authorizations of management and directors of the company; and (3) provide reasonable assurance regarding prevention or timely detection of unauthorized acquisition, use, or disposition of the company’s assets that could have a material effect on the financial statements.
Because of its inherent limitations, internal control over financial reporting may not prevent or detect misstatements. Also, projections of any evaluation of effectiveness to future periods are subject to the risk that controls may become inadequate because of changes in conditions, or that the degree of compliance with the policies or procedures may deteriorate.
In our opinion, STAAR Surgical Company and Subsidiaries maintained, in all material respects, effective internal control over financial reporting as of December 31, 2010, based on the COSO criteria.
We also have audited, in accordance with the standards of the Public Company Accounting Oversight Board (United States), the consolidated balance sheets of STAAR Surgical Company and subsidiaries as of December 31, 2010 and January 1, 2010, and the related consolidated statements of operations, stockholders’ equity and comprehensive income (loss), and cash flows for each of the three years in the period ended December 31, 2010 and our report dated March 2, 2011 expressed an unqualified opinion thereon.
|
/s/ BDO USA, LLP
|
|
Los Angeles, California
|
|
March 2, 2011
|
F-3
STAAR SURGICAL COMPANY AND SUBSIDIARIES
CONSOLIDATED BALANCE SHEETS
December 31, 2010 and January 1, 2010
|
|
2010
|
2009
|
||||||
|
|
(In thousands, except
|
|||||||
|
par value amounts)
|
||||||||
|
ASSETS
|
||||||||
|
Current assets:
|
||||||||
|
Cash and cash equivalents
|
$ | 9,376 | $ | 6,330 | ||||
|
Restricted cash
|
133 | 7,396 | ||||||
|
Accounts receivable trade, net
|
8,219 | 9,269 | ||||||
|
Inventories, net
|
10,543 | 14,820 | ||||||
|
Prepaids, deposits and other current assets
|
1,715 | 2,591 | ||||||
|
Total current assets
|
29,986 | 40,406 | ||||||
|
Property, plant and equipment, net
|
3,732 | 5,005 | ||||||
|
Intangible assets, net
|
3,672 | 4,148 | ||||||
|
Goodwill
|
1,786 | 7,879 | ||||||
|
Deferred income taxes
|
202 | 104 | ||||||
|
Other assets
|
1,207 | 1,139 | ||||||
|
Total assets
|
$ | 40,585 | $ | 58,681 | ||||
|
LIABILITIES, REDEEMABLE CONVERTIBLE PREFERRED STOCK
AND STOCKHOLDERS’ EQUITY
|
||||||||
|
Current liabilities:
|
||||||||
|
Line of credit
|
$ | 2,460 | $ | 2,160 | ||||
|
Accounts payable
|
3,717 | 7,416 | ||||||
|
Deferred income taxes
|
326 | 360 | ||||||
|
Obligations under capital leases
|
431 | 795 | ||||||
|
Accrued legal judgments
|
— | 4,000 | ||||||
|
Note payable, net of discount
|
— | 4,503 | ||||||
|
Other current liabilities
|
6,513 | 7,706 | ||||||
|
Total current liabilities
|
13,447 | 26,940 | ||||||
|
Obligations under capital leases
|
1,403 | 1,098 | ||||||
|
Deferred income taxes
|
488 | 653 | ||||||
|
Other long-term liabilities
|
2,820 | 2,136 | ||||||
|
Total liabilities
|
18,158 | 30,827 | ||||||
|
Commitments, contingencies and subsequent events (Note 15)
|
||||||||
|
Series A redeemable convertible preferred stock $0.01 par value; 10,000 shares authorized; 1,700 shares issued and outstanding at January 1, 2010. Liquidation value $6,800.
|
— | 6,784 | ||||||
|
Stockholders’ equity:
|
||||||||
|
Common stock, $0.01 par value; 60,000 shares authorized; 35,084 and 34,747 shares issued and outstanding at December 31, 2010 and January 1, 2010, respectively
|
351 | 348 | ||||||
|
Additional paid-in capital
|
152,014 | 149,559 | ||||||
|
Accumulated other comprehensive income
|
2,100 | 3,254 | ||||||
|
Accumulated deficit
|
(132,038 | ) | (132,091 | ) | ||||
|
Total stockholders’ equity
|
22,427 | 21,070 | ||||||
|
Total liabilities, redeemable convertible preferred stock and stockholders’ equity
|
$ | 40,585 | $ | 58,681 | ||||
See accompanying summary of accounting policies and notes to consolidated financial statements.
F-4
STAAR SURGICAL COMPANY AND SUBSIDIARIES
CONSOLIDATED STATEMENTS OF OPERATIONS
Years Ended December 31, 2010, January 1, 2010 and January 2, 2009
|
2010
|
2009
|
2008
|
||||||||||
|
(In thousands,
|
||||||||||||
|
except per share amounts)
|
||||||||||||
|
Net sales
|
$
|
54,958
|
$
|
51,060
|
$
|
49,770
|
||||||
|
Cost of sales
|
19,882
|
19,737
|
20,688
|
|||||||||
|
Gross profit
|
35,076
|
31,323
|
29,082
|
|||||||||
|
Selling, general and administrative expenses:
|
||||||||||||
|
General and administrative
|
14,078
|
15,247
|
15,730
|
|||||||||
|
Marketing and selling
|
17,176
|
15,300
|
18,472
|
|||||||||
|
Research and development
|
5,724
|
5,893
|
7,938
|
|||||||||
|
Other general and administrative expenses (recovery), net (Notes 1, 2, and 20)
|
700
|
(238
|
)
|
9,773
|
||||||||
|
Operating loss
|
(2,602
|
)
|
(4,879
|
)
|
(22,831
|
)
|
||||||
|
Other income (expense):
|
||||||||||||
|
Interest income
|
43
|
67
|
137
|
|||||||||
|
Interest expense
|
(896
|
)
|
(1,317
|
)
|
(897
|
)
|
||||||
|
Gain (loss) on foreign currency transactions
|
(87
|
)
|
124
|
(410
|
)
|
|||||||
|
Loss on early extinguishment of note payable
|
(267
|
)
|
—
|
—
|
||||||||
|
Other income, net
|
128
|
257
|
126
|
|||||||||
|
Other expense, net
|
(1,079
|
)
|
(869
|
)
|
(1,044
|
)
|
||||||
|
Loss before provision for income taxes
|
(3,681
|
)
|
(5,748
|
)
|
(23,875
|
)
|
||||||
|
Provision for income taxes
|
432
|
1,154
|
975
|
|||||||||
|
Loss from continuing operations
|
(4,113
|
)
|
(6,902
|
)
|
(24,850
|
)
|
||||||
|
Income from discontinued operations, net of income taxes
|
4,166
|
702
|
1,655
|
|||||||||
|
Net income (loss)
|
$
|
53
|
$
|
(6,200
|
)
|
$
|
(23,195
|
)
|
||||
|
Loss per share from continuing operations – basic and diluted
|
$
|
(.12
|
)
|
$
|
(.21
|
)
|
$
|
(.84
|
)
|
|||
|
Income per share from discontinued operations – basic and diluted
|
$
|
.12
|
$
|
.02
|
$
|
.05
|
||||||
|
Net loss per share
|
$
|
(.00
|
)
|
$
|
(.19
|
)
|
$
|
(.79
|
)
|
|||
|
Weighted average shares outstanding – basic and diluted
|
34,825
|
32,498
|
29,474
|
|||||||||
See accompanying summary of accounting policies and notes to consolidated financial
F-5
STAAR SURGICAL COMPANY AND SUBSIDIARIES
CONSOLIDATED STATEMENTS OF STOCKHOLDERS’ EQUITY
AND COMPREHENSIVE LOSS
Years Ended December 31 2010, January 1, 2010, and January 2, 2009
|
Common
Stock
Shares
|
Common
Stock Par
Value
|
Additional
Paid-In
Capital
|
Accumulated
Other
Comprehensive
Income (Loss)
|
Retained
Earnings
(Accumulated
Deficit)
|
Total
|
|||||||||||||||||||
|
Balance, at December 28, 2007
|
29,488
|
$
|
295
|
$
|
137,075
|
$
|
1,551
|
$
|
(102,696
|
)
|
$
|
36,225
|
||||||||||||
|
Net loss
|
—
|
—
|
—
|
—
|
(23,195
|
)
|
(23,195
|
)
|
||||||||||||||||
|
Foreign currency translation adjustment
|
—
|
—
|
—
|
1,303
|
—
|
1,303
|
||||||||||||||||||
|
Pension liability adjustment, net of tax
|
—
|
—
|
—
|
(42
|
)
|
—
|
(42
|
)
|
||||||||||||||||
|
Total comprehensive loss
|
(21,934
|
)
|
||||||||||||||||||||||
|
Common stock issued upon exercise of options
|
10
|
—
|
39
|
—
|
—
|
39
|
||||||||||||||||||
|
Stock-based compensation
|
—
|
—
|
1,712
|
—
|
—
|
1,712
|
||||||||||||||||||
|
Restricted stock cancelled
|
(2
|
)
|
—
|
—
|
—
|
—
|
—
|
|||||||||||||||||
|
Preferred stock accretion
|
—
|
—
|
(16
|
)
|
—
|
—
|
(16
|
)
|
||||||||||||||||
|
Unvested restricted stock
|
(17
|
)
|
—
|
—
|
—
|
—
|
—
|
|||||||||||||||||
|
Restricted stock grants
|
24
|
—
|
1
|
—
|
—
|
1
|
||||||||||||||||||
|
Balance, at January 2, 2009
|
29,503
|
295
|
138,811
|
2,812
|
(125,891
|
)
|
16,027
|
|||||||||||||||||
|
Net loss
|
—
|
—
|
—
|
—
|
(6,200
|
)
|
(6,200
|
)
|
||||||||||||||||
|
Foreign currency translation adjustment
|
—
|
—
|
—
|
578
|
—
|
578
|
||||||||||||||||||
|
Pension liability adjustment, net of tax
|
—
|
—
|
—
|
(136
|
)
|
—
|
(136
|
)
|
||||||||||||||||
|
Total comprehensive loss
|
(5,758
|
)
|
||||||||||||||||||||||
|
Common stock issued upon exercise of options
|
—
|
—
|
1
|
—
|
—
|
1
|
||||||||||||||||||
|
Net proceeds from public offering
|
4,555
|
46
|
8,456
|
—
|
—
|
8,502
|
||||||||||||||||||
|
Stock-based compensation
|
312
|
3
|
1,572
|
—
|
—
|
1,575
|
||||||||||||||||||
|
Stock issued in lieu of vacation
|
6
|
1
|
23
|
—
|
—
|
24
|
||||||||||||||||||
|
Preferred stock accretion
|
—
|
—
|
(16
|
)
|
—
|
—
|
(16
|
)
|
||||||||||||||||
|
Warrants issued to Broadwood
|
—
|
—
|
290
|
—
|
—
|
290
|
||||||||||||||||||
|
Common stock issued as payment for services
|
247
|
2
|
422
|
—
|
—
|
424
|
||||||||||||||||||
|
Vested restricted stock grants
|
124
|
1
|
—
|
—
|
—
|
1
|
||||||||||||||||||
|
Balance, at January 1, 2010
|
34,747
|
348
|
149,559
|
3,254
|
(132,091
|
)
|
21,070
|
|||||||||||||||||
|
Net income
|
—
|
—
|
—
|
—
|
53
|
53
|
||||||||||||||||||
|
Foreign currency translation adjustment
|
—
|
—
|
—
|
(1,154
|
)
|
—
|
(1,154
|
)
|
||||||||||||||||
|
Total comprehensive loss
|
(1,101
|
)
|
||||||||||||||||||||||
|
Common stock issued upon exercise of options
|
330
|
3
|
1,121
|
—
|
—
|
1,124
|
||||||||||||||||||
|
Stock-based compensation
|
—
|
—
|
1,333
|
—
|
—
|
1,333
|
||||||||||||||||||
|
Preferred stock accretion
|
—
|
—
|
1
|
—
|
—
|
1
|
||||||||||||||||||
|
Vested restricted stock grants
|
7
|
—
|
—
|
—
|
—
|
—
|
||||||||||||||||||
|
Balance, at December 31, 2010
|
35,084
|
$
|
351
|
$
|
152,014
|
$
|
2,100
|
$
|
(132,038
|
)
|
$
|
22,427
|
||||||||||||
See accompanying summary of accounting policies and notes to consolidated financial statements.
F-6
STAAR SURGICAL COMPANY AND SUBSIDIARIES
CONSOLIDATED STATEMENTS OF CASH FLOWS
Years Ended December 31, 2010, January 1, 2010, and January 2, 2009
|
2010
|
2009
|
2008
|
||||||||||
|
(In thousands)
|
||||||||||||
|
Cash flows from operating activities:
|
||||||||||||
|
Net income (loss)
|
$
|
53
|
$
|
(6,200
|
)
|
$
|
(23,195
|
)
|
||||
|
Adjustments to reconcile net income (loss) to net cash provided by (used in) operating activities:
|
||||||||||||
|
Income from discontinued operations
|
(4,166
|
)
|
(702
|
)
|
(1,655
|
)
|
||||||
|
Depreciation of property and equipment
|
1,590
|
1,973
|
2,390
|
|||||||||
|
Amortization of intangibles
|
816
|
1,402
|
843
|
|||||||||
|
Impairment loss on patents
|
—
|
—
|
1,023
|
|||||||||
|
Amortization of discount
|
236
|
379
|
248
|
|||||||||
|
Deferred income taxes
|
253
|
220
|
238
|
|||||||||
|
Loss on extinguishment of debt
|
267
|
—
|
—
|
|||||||||
|
Fair value adjustment of warrant
|
144
|
40
|
(7
|
)
|
||||||||
|
Change in net pension liability
|
318
|
232
|
72
|
|||||||||
|
Gain (loss) on disposal of property and equipment
|
(2
|
)
|
98
|
(35
|
)
|
|||||||
|
Stock-based compensation expense
|
1,248
|
1,428
|
1,468
|
|||||||||
|
Loss on settlement of pre-existing distribution arrangement
|
—
|
—
|
3,850
|
|||||||||
|
Other
|
93
|
148
|
249
|
|||||||||
|
Changes in working capital, net of business acquisition:
|
||||||||||||
|
Accounts receivable, net
|
(207
|
)
|
(604
|
)
|
(1,337
|
)
|
||||||
|
Inventories
|
1,521
|
1,425
|
1,728
|
|||||||||
|
Prepaids, deposits and other current assets
|
780
|
(116
|
)
|
1,178
|
||||||||
|
Accounts payable
|
(1,204
|
)
|
595
|
(2,738
|
)
|
|||||||
|
Other current liabilities
|
(5,522
|
)
|
(554
|
)
|
5,182
|
|||||||
|
Net cash provided by (used in) operating activities of discontinued operations
|
(635
|
)
|
1,663
|
2,270
|
||||||||
|
Net cash provided by (used in) operating activities
|
(4,417
|
)
|
1,427
|
(8,228
|
)
|
|||||||
|
Cash flows from investing activities:
|
||||||||||||
|
Proceeds from sale of subsidiary, net of transaction costs
|
11,824
|
|||||||||||
|
Acquisition of property and equipment
|
(320
|
)
|
(553
|
)
|
(769
|
)
|
||||||
|
Cash acquired in acquisition of Canon Staar, net of acquisition costs
|
—
|
—
|
2,215
|
|||||||||
|
Proceeds from the sale of property and equipment
|
29
|
23
|
43
|
|||||||||
|
Net change in other assets
|
24
|
(10
|
)
|
43
|
||||||||
|
Purchase of short-term investments
|
(219
|
)
|
(24
|
)
|
(212
|
)
|
||||||
|
Sale of short-term investments
|
87
|
198
|
—
|
|||||||||
|
Decrease (increase) in restricted cash, including reinvested interest
|
7,396
|
(7,396
|
)
|
—
|
||||||||
|
Net cash provided by (used in) investing activities of discontinued operations
|
(50
|
)
|
149
|
(199
|
)
|
|||||||
|
Net cash provided by (used in) investing activities
|
18,771
|
(7,613
|
)
|
1,121
|
||||||||
|
Cash flows from financing activities:
|
||||||||||||
|
Repayment of notes payable
|
(5,000
|
)
|
—
|
—
|
||||||||
|
Borrowings under lines of credit
|
—
|
642
|
3,880
|
|||||||||
|
Repayment of lines of credit
|
—
|
(642
|
)
|
(1,940
|
)
|
|||||||
|
Repayment of capital lease lines of credit
|
(796
|
)
|
(1,011
|
)
|
(897
|
)
|
||||||
|
Proceeds from the exercise of stock options
|
1,124
|
1
|
40
|
|||||||||
|
Redemption of Series A preferred stock
|
(6,800
|
)
|
—
|
—
|
||||||||
|
Net proceeds from public and private sale of equity securities
|
—
|
8,502
|
—
|
|||||||||
|
Net cash used in financing activities of discontinued operations
|
(50
|
)
|
(136
|
)
|
(86
|
)
|
||||||
|
Net cash provided by (used in) financing activities
|
(11,522
|
)
|
7,356
|
997
|
||||||||
|
Effect of exchange rate changes on cash and cash equivalents
|
214
|
168
|
207
|
|||||||||
|
Increase (decrease) in cash and cash equivalents
|
3,046
|
1,338
|
(5,903
|
)
|
||||||||
|
Cash and cash equivalents, at beginning of year
|
6,330
|
4,992
|
10,895
|
|||||||||
|
Cash and cash equivalents, at end of year
|
$
|
9,376
|
$
|
6,330
|
$
|
4,992
|
||||||
See accompanying summary of accounting policies and notes to consolidated financial statements.
F-7
STAAR SURGICAL COMPANY AND SUBSIDIARIES
NOTES TO CONSOLIDATED FINANCIAL STATEMENTS
Years Ended December 31, 2010 and January 1, 2010
Note 1 — Organization and Description of Business and Accounting Policies
Organization and Description of Business
STAAR Surgical Company and subsidiaries (the “Company”), a Delaware corporation, was incorporated in 1982 for the purpose of its developing, producing, and marketing intraocular lenses (“IOLs”) and other products for minimally invasive ophthalmic surgery. Principal products are IOLs and ICLs. IOLs are prosthetic intraocular lenses used to restore vision that has been adversely affected by cataracts, and include the Company’s lines of silicone and Collamer IOLs and the Preloaded Injector (a silicone or acrylic IOL preloaded into a single-use disposable injector). ICLs, consisting of the Company’s Visian ICL and TICL, are intraocular lenses used to correct refractive conditions such as myopia (near-sightedness), hyperopia (far-sightedness) and
astigmatism.
As of December 31, 2010, the Company’s significant subsidiaries consisted of STAAR Surgical AG, a wholly owned subsidiary formed in Switzerland to develop, manufacture and distribute certain of the Company’s products worldwide, including ICL. STAAR Japan, a wholly owned subsidiary that designs, manufactures and sells IOLs and injector systems which are sold as integrated preloaded injectors.
The Company operates as one operating segment, the ophthalmic surgical market, for financial reporting purposes (see Note 19).
Basis of Presentation
The accompanying consolidated financial statements include the accounts of the Company and its wholly owned subsidiaries. All significant intercompany balances and transactions have been eliminated in consolidation.
Fiscal Year and Interim Reporting Periods
The Company’s fiscal year ends on the Friday nearest December 31 and each of the Company’s quarterly reporting periods generally consists of 13 weeks. The fiscal 2010 and 2009 financial statements are based on a 52-week period, and fisical 2008 were based on 53-week period.
Foreign Currency
The functional currency of the Company and its Japanese subsidiary is the local currency. The functional currency of the Company’s Swiss subsidiary is the U.S. dollar. Assets and liabilities of foreign subsidiaries are translated at rates of exchange in effect at the close of the period. Sales and expenses are translated at the weighted average of exchange rates in effect during the period. The resulting translation gains and losses are deferred and are shown as a separate component of stockholders’ equity as accumulated other comprehensive income. During 2010, 2009, and 2008, the net foreign translation gains or (losses) were ($1,154,000), $578,000, and $1,303,000, respectively; and net foreign currency transaction gains or (losses), included in the consolidated statements of
operations under other (expense) income, were ($87,000), $124,000 and ($410,000), respectively.
Revenue Recognition
The Company recognizes revenue when realized or realizable and earned, which is when the following criteria are met: persuasive evidence of an arrangement exists; delivery has occurred; the sale price is fixed and determinable; and collectability is reasonably assured. The Company records revenue from non-consignment product sales when title and risk of ownership has been transferred, which is typically at shipping point, except for the STAAR Japan subsidiary, which is typically recognized when the product is received by the customer. STAAR Japan does not have significant deferred revenues as of December 31, 2010 as delivery to the customer is generally made within the same or the next date of shipment. The Company presents sales tax it collects from its customers on a net
basis (excluded from revenues).
F-8
STAAR SURGICAL COMPANY AND SUBSIDIARIES
NOTES TO CONSOLIDATED FINANCIAL STATEMENTS
Years Ended December 31, 2010 and January 1, 2010
The Company’s products are marketed to ophthalmic surgeons, hospitals, ambulatory surgery centers or vision centers, and distributors. IOLs may be offered to surgeons and hospitals on a consignment basis. The Company maintains title and risk of loss of consigned inventory and recognizes revenue for consignment inventory when the Company is notified that the IOL has been implanted.
ICLs are sold only to certified surgeons who have completed requisite training or for use in scheduled training surgeries. As a result, STAAR substantively reduces the risk that the revenue it recognizes on shipment of ICLs would need to be reversed because of a surgeon’s failure to qualify for its use.
For all sales, the Company is considered the Principal in the transaction as the Company, among other factors, bears general inventory risk, credit risk, has latitude in establishing the sales price, and bears authorized sales returns inventory risk and therefore, sales are recognized gross with a corresponding cost of sales in the statement of operations instead of a single, net amount. Cost of sales includes cost of production, freight and distribution, royalties, and inventory provisions, net of any purchase discounts.
The Company generally permit returns of product if the product is returned within the time allowed by our return policies and records an allowance for estimated returns at the time revenue is recognized. The Company’s allowance for estimated returns considers historical trends and experience, the impact of new product launches, the entry of a competitor, availability of timely and pertinent information and the various terms and arrangements offered, including sales with extended credit terms. Sales are reported net of estimated returns.
The Company performs ongoing credit evaluations of its customers and adjusts credit limits based on customer payment history and credit worthiness, as determined by the Company’s review of its customers’ current credit information. The Company continuously monitors collections and payments from customers and maintains a provision for estimated credit losses and uncollectible accounts based upon its historical experience and any specific customer collection issues that have been identified. Amounts determined to be uncollectible are written off against the allowance for doubtful accounts.
Use of Estimates
The consolidated financial statements have been prepared in conformity with accounting principles generally accepted in the United States of America and, as such, include amounts based on informed estimates and judgments of management with consideration given to materiality. For example, estimates are used in determining valuation allowances for uncollectible trade receivables, obsolete and excess inventory, deferred income taxes, and tax reserves. Estimates are also used in the evaluation of asset impairment, in determining the useful life of depreciable and definite-lived intangible assets, and in the variables used to calculate stock-based compensation. Actual results could differ materially from those estimates.
Cash and Cash Equivalents
The Company considers all highly liquid investments purchased with a maturity of three months or less to be cash equivalents. The Company maintains cash deposits with major banks which from time to time may exceed federally insured limits. The Company periodically assesses the financial condition of the institutions and believes that the risk of any loss is minimal.
Restricted Cash and Short-Term Investments
On March 2, 2010, as part of the disposition of the Domilens subsidiary, the Company deposited $133,000 into a restricted escrow account to be held against payment of any unaccrued taxes assessed for periods prior to December 31, 2009. Funds remaining after the resolution of such potential liabilities, if any, will be distributed to STAAR from the escrow account, no later than December 31, 2011. The Company has classified this restricted cash as a current asset commensurate with the related contingent tax liability included in other current liabilities as of the Closing Date.
F-9
STAAR SURGICAL COMPANY AND SUBSIDIARIES
NOTES TO CONSOLIDATED FINANCIAL STATEMENTS
Years Ended December 31, 2010 and January 1, 2010
On June 22, 2009, the Company posted a $7.3 million deposit with the Superior Court of California, County of Orange as required while the judgment rendered in the Parallax case was on appeal. On March 30, 2010, the Company settled both the Parallax and Scott C. Moody, Inc. v. STAAR Surgical Company lawsuits. In exchange for complete mutual releases, the settlement provided for payment by STAAR of $4.0 million from the restricted deposit as its contribution to the global settlement, which was paid in June 2010. The balance of the deposit, including accrued interest, was returned to STAAR.
Concentration of Credit Risk
Financial instruments that potentially subject the Company to credit risk principally consist of trade receivables. This risk is limited due to the large number of customers comprising the Company’s customer base, and their geographic dispersion. One foreign customer accounted for approximately 15% of the Company’s consolidated trade receivables balance as of December 31, 2010. The same customer accounts for approximately 11% of our consolidated net revenue as of December 31, 2010 and January 1, 2010. Ongoing credit evaluations of customers’ financial condition are performed and, generally, no collateral is required. The Company maintains reserves for potential credit losses and such losses, in the aggregate, have not exceeded management’s expectations.
Fair Value of Financial Instruments
Fair value is defined as the price that would be received to sell an asset or paid to transfer a liability in an orderly transaction between market participants at the measurement date. To increase the comparability of fair value measures, the following hierarchy prioritizes the inputs to valuation methodologies used to measure fair value:
|
·
|
Level 1 – Inputs to the valuation methodology are quoted prices (unadjusted) for identical assets or liabilities in active markets.
|
|
·
|
Level 2 – Inputs to the valuation methodology include quoted prices for similar assets and liabilities in active markets, and inputs that are observable for the assets or liability, either directly or indirectly, for substantially the full term of the financial instruments.
|
|
·
|
Level 3 – Inputs to the valuation methodology are unobservable; that reflect management’s own assumptions about the assumptions market participants would make and significant to the fair value.
|
The Broadwood Warrants issued on June 1, 2009 were valued using Level 2 inputs (see Note 10).
The carrying values reflected in the consolidated balance sheets for cash and cash equivalents, short-term investments, trade accounts receivable and accounts payable approximate their fair values because of the short maturity of these instruments.
Inventories, Net
Inventories, net are valued at the lower of cost, determined on a first-in, first-out basis, or market. Inventories include the costs of raw material, labor, and manufacturing overhead, work in process and finished goods. The Company provides estimated inventory allowances for excess, expiring, slow moving and obsolete inventory as well as inventory whose carrying value is in excess of net realizable value to properly reflect inventory at the lower of cost or market.
Property, Plant and Equipment
Property, plant and equipment are recorded at cost. Depreciation on property, plant, and equipment is computed using the straight-line method over the estimated useful lives of the assets as noted below. Leasehold improvements are amortized over the lesser of the estimated useful lives of the assets or the related lease term. Major improvements are capitalized and minor replacements, maintenance and repairs are charged to expense as incurred.
Depreciation is generally computed using the straight-line method over the estimated useful lives of the assets:
|
Machinery and equipment
|
5-10 years
|
|
|
Furniture and equipment
|
3-7 years
|
|
|
Computer and peripherals
|
2-5 years
|
|
|
Leasehold improvements
|
(a)
|
F-10
STAAR SURGICAL COMPANY AND SUBSIDIARIES
NOTES TO CONSOLIDATED FINANCIAL STATEMENTS
Years Ended December 31, 2010 and January 1, 2010
|
|
(a)
|
Leasehold improvements are depreciated over the shorter of the useful life of the asset or the term of the associated leases.
|
Goodwill
Goodwill, which has an indefinite life, is not amortized but instead is tested for impairment on an annual basis or between annual tests if an event occurs or circumstances change that would indicate the carrying amount may be impaired. Impairment testing for goodwill is done at the reporting unit level. Reporting units can be one level below the operating segment level, and can be combined when reporting units within the same operating segment have similar economic characteristics. The Company has determined that its reporting units have similar economic characteristics and, therefore, can be combined into one reporting unit for the purposes of goodwill impairment testing.
During the fourth quarter of fiscal 2010, 2009, and 2008, the Company performed its annual impairment test and determined that its goodwill was not impaired. As of December 31, 2010 and January 1, 2010, the carrying value of goodwill was $1.8 million and $7.9 million. The change in the carrying value of goodwill as of December 31, 2010 compared to the balance in the prior year is due to the effect of foreign currency translation and $6.3 million of goodwill sold as part of the Company’s sale of all of its interests in Domilens on March 2, 2010 (as more fully described in Note 3).
Long-Lived Assets
The Company reviews property and equipment and intangible assets, excluding goodwill, for impairment whenever events or changes in circumstances indicate the carrying amount of an asset may not be recoverable. We measure recoverability of these assets by comparing the carrying value of such assets to the estimated undiscounted future cash flows the assets are expected to generate. When the estimated undiscounted future cash flows are less than their carrying amount, an impairment loss is recognized equal to the difference between the assets’ fair value and their carrying value. A review of long lived assets was conducted as of December 31, 2010 and no impairment was identified.
In performing the fiscal 2009 review of intangible assets, the Company determined that certain patents had shorter legal useful lives than originally estimated. The remaining useful lives were adjusted as of January 1, 2010 and the cumulative impact to prior periods in the amount of $590,000 was recorded in other general and administrative expenses (recovery), net as part of total 2009 operating losses in the consolidated statements of operations.
In the fourth quarter of 2008, the Company determined that the value and utility of certain of its patents had become impaired due to the Company’s decision to discontinue marketing and selling certain products underlying these patents. As a result , the Company recorded a $1,023,000 impairment loss for the fourth quarter and fiscal year ended 2008, which was included in other general and administrative expenses (recovery), net as part of operating loss in the consolidated statements of operations. The fair value of these patents was determined by management using a discounted net cash flow method. The impairment adjustment also impacted the gross carrying value of the impaired patents and related accumulated amortization by $1,496,000 and $473,000, respectively.
Amortization is computed on the straight-line basis over the estimated useful lives of the assets which ranges from 3 to 21 years for patents and licenses, 10 years for customer relationships, and 3 to 10 years for developed technology.
Research and Development Costs
Expenditures for research activities relating to product development and improvement are charged to expense as incurred.
F-11
STAAR SURGICAL COMPANY AND SUBSIDIARIES
NOTES TO CONSOLIDATED FINANCIAL STATEMENTS
Years Ended December 31, 2010 and January 1, 2010
Income Taxes
The Company recognizes deferred tax assets and liabilities for temporary differences between the financial reporting basis and the tax basis of the Company’s assets and liabilities, net operating loss and credit carryforwards, and uncertainty in income taxes recognized in accordance with ASC 740-10 “Income Taxes”. Valuation allowances, or reductions to deferred tax assets, are recognized if, based on the weight of available evidence, it is more likely than not that some portion or all of the deferred tax asset may not be realized. The impact on deferred taxes of changes in tax rates and laws, if any, are applied to the years during which temporary differences are expected to be settled and reflected in the financial statements in the period of enactment.
We recognize the income tax benefit from an uncertain tax position when it is more likely than not that, based on technical merits, the position will be sustained upon examination, including resolutions of any related appeals or litigation processes. We recognize accrued interest related to uncertain tax positions as a component of income tax expense, and penalties, if incurred, are recognized as a component of operating income.
Basic and Diluted Loss Per Share
The consolidated financial statements include “basic” and “diluted” per share information. Basic per share information is calculated by dividing net loss by the weighted average number of shares outstanding. Diluted per share information is calculated by also considering the impact of potential common stock on both net income and the weighted number of shares outstanding. As the Company was in a net loss position, potential common shares of 5.3 million, 6.7 million and 6.0 million for the fiscal years ended December 31 2010, January 1, 2010, and January 2, 2009, respectively, were excluded from the computation as the shares would have had an anti-dilutive effect.
Employee Defined Benefit Plans
The Company maintains a passive pension plan (the “Swiss Plan”) covering employees of its Swiss subsidiary. The Swiss Plan conforms to the features of a defined benefit plan.
In connection with the Company’s acquisition of the remaining interest in STAAR Japan, Inc., STAAR assumed the net pension liability under STAAR Japan’s noncontributory defined benefit pension plan substantially covering all of the employees of STAAR Japan.
ASC 715-30 requires recognition of the funded status, or difference between the fair value of plan assets and the projected benefit obligations of the pension plan on the statement of financial position, with a corresponding adjustment to accumulated other comprehensive income. If the projected benefit obligation exceeds the fair value of plan assets, then that difference or unfunded status represents the pension liability. The Company records a net periodic pension cost in the consolidated statement of operations. The liabilities and annual income or expense of both plans are determined using methodologies that involve several actuarial assumptions, the most significant of which are the discount rate and the expected long-term rate of asset return (for Swiss Plan only) (based on the market-related value of
assets). The fair values of plan assets are determined based on prevailing market prices (see Note 13).
Stock Based Compensation
Stock-based compensation expense for all stock-based compensation awards granted is based on the grant-date fair value estimated. The Company recognizes these compensation costs on a straight-line basis over the requisite service period of the award, which is generally the option vesting term of three to four years (see Note 14).
The Company also issues Restricted Stock, which are unvested shares issued at fair market value on the date of grant. They typically vest over a service period ranging between one and four years and are subject to forfeiture until vested or the service period is achieved, and the restriction is lapsed or terminated. The stock compensation expense is generally recognized by the Company as the stock vests, based on the fair value of the stock on the vesting date and the vested number of shares less any amounts paid for the stock, which is typically the par value of the shares.
The Company accounts for options granted to persons other than employees and directors under ASC 718-10. As such, the fair value of such options is periodically remeasured using the Black-Scholes option-pricing model and income or expense is recognized over the vesting period.
F-12
STAAR SURGICAL COMPANY AND SUBSIDIARIES
NOTES TO CONSOLIDATED FINANCIAL STATEMENTS
Years Ended December 31, 2010 and January 1, 2010
Accounting for Warrants
The Company accounts for the issuance of Company derivative equity instruments in accordance with ASC 815-40 “Derivatives and Hedging”. The Company has agreed to use its best efforts to register and maintain registration of the common shares underlying certain warrants (the “Warrant Shares”) that were issued by the Company with debt instruments, so that the warrant holder may freely sell the Warrant Shares if the warrant is exercised, and the Company agreed that in any event it would secure and maintain effective registration within four months of issuance. In addition, while the relevant warrant agreement does not require cash settlement if the Company fails to register and maintain registration of the Warrant Shares, it does not specifically preclude cash settlement.
As a result ASC 815-40 requires the Company to assume that in the absence of continuous effective registration it may be required to settle the these warrants for cash when they are exercised. Accordingly, the Company’s agreement to register and maintain registration of the Warrant Shares without express terms for settlement in the absence of continuous effective registration is presumed to create a liability to settle these warrants in cash, requiring liability classification. Included in other long-term liabilities with a fair value of $244,000 and $101,000 as of December 31, 2010 and January 1, 2010, respectively, are 70,000 warrants issued in March 2007 to Broadwood in connection with a loan which has since been repaid. The Company has issued other warrants (1.4 million) under an agreement that expressly provides that if the Company fails to satisfy continuous registration requirements the Company will be obligated only to issue additional common stock
as the holder’s sole remedy, with no possibility of settlement in cash. The Company accounts for those warrants as equity because additional shares are the only form of settlement available to the holder. The Company uses the Black-Scholes option pricing model as the valuation model to estimate the fair value of all warrants. The Company evaluates the balance sheet classification of the warrants during each reporting period. Expected volatilities are based on historical volatility of the Company’s stock. The expected life of the warrant is determined by the amount of time remaining on the original six year term of the relevant warrant agreement. The risk-free rate of return for periods within the contractual life of the warrant is based on the U.S. Treasury yield curve in effect at each reporting period. Any gains or losses resulting from the changes in fair value of the warrants classified as a liability from period to period are included as an
increase or decrease of other income (expense). The warrants that are accounted for as equity are only valued on the issuance date and not subsequently revalued.
Comprehensive Loss
The Company presents comprehensive losses in its Consolidated Statement of Changes in Stockholders’ Equity in accordance with ASC 220-10 “Comprehensive Income”. Total comprehensive loss includes, in addition to net income (loss), changes in equity that are excluded from the consolidated statements of operations and are recorded directly into a separate section of stockholders’ equity on the consolidated balance sheets.
Recent Accounting Pronouncements
In January 2010, the FASB issued an update to ASC 820. This ASU 2010-06, Fair Value Measurements and Disclosures (Topic 820): Improving Disclosures about Fair Value Measurements requires entities to disclose separately the significant transfers in and out of Levels 1 and 2 fair value measurements and describe the reasons for the transfers. It also requires reconciliation of activity in Level 3 fair value measurements between beginning and ending balances, such as purchases, sales, issuances, and settlements on a gross basis instead of a net number. Finally, it clarifies existing disclosures for levels of disaggregation, that is to provide fair value measurement disclosures for each class of asset and liability and to
provide disclosures around the inputs used and valuation techniques to measure fair value for both recurring and non-recurring fair value measurements that fall within Levels 2 or 3, which also applies to defined benefit plans and related disclosures in plan assets. This ASU 2010-06 is effective for interim and annual reporting periods beginning after December 15, 2009 (fiscal year 2010), except for the disclosures about purchases, sales, issuances, and settlements in the roll forward of activity in Level 3 fair value measurements. Those disclosures are effective for fiscal years beginning after December 15, 2010 (fiscal year 2011), and for interim periods within those fiscal years. The Company believes the adoption of this ASU 2010-06 will not have a material impact to its consolidated financial statements.
In February 2010, the FASB issued an update to ASC 855. This update, ASU 2010-09, Subsequent Events, requires an entity that is a SEC filer to evaluate subsequent events through the date that the financial statements are issued however is not required to disclose that date. ASU 2010-09 is effective upon issuance and the Company has conformed its disclosure to this ASU 2010-09 in the accompanying financial statements.
F-13
STAAR SURGICAL COMPANY AND SUBSIDIARIES
NOTES TO CONSOLIDATED FINANCIAL STATEMENTS
Years Ended December 31, 2010 and January 1, 2010
Prior Year Reclassifications
Certain reclassifications have been made to the prior financial statement information to conform with current presentation.
Note 2 — Acquisition of STAAR Japan
On December 29, 2007 (the “Closing Date”), during STAAR’s 2008 fiscal year, STAAR acquired the remaining 50% of the shares of Canon Staar Co., Inc. (“Canon Staar”) that had been owned previously by Canon Inc. and Canon Marketing Japan Inc. (“Canon Marketing” and, collectively with Canon Inc., the “Canon companies”). In the transaction (the “Acquisition”), STAAR obtained 100% ownership of Canon Staar, which was renamed STAAR Japan, Inc. (“STAAR Japan”) as of the acquisition date.
In connection with the Acquisition, the material terms of the Joint Venture Agreement and other documents governing the joint venture were terminated. This included the termination of the pre-existing distribution arrangement of Canon Staar under which Canon Marketing had the exclusive right to distribute Canon Staar’s products in Japan prior to the Acquisition. As a result, STAAR Japan recorded an approximate $3.9 million loss at the close of the Acquisition, which is included in operating loss of STAAR’s consolidated statements of operations for the year ended January 2, 2009. This loss represents the portion of the consideration paid by STAAR for the Acquisition that was deemed to represent the settlement amount of the pre-existing relationship between Canon Staar and the
Canon companies, in particular for the termination of the distribution arrangement that, when compared to a comparable at-market arrangement as of the closing date, was deemed unfavorable to STAAR.
Note 3 – Disposal of Domilens Subsidiary
On March 2, 2010 (the “Closing Date”), STAAR Surgical Company completed the divestiture (the “Transaction”) of all if its interest in its German distribution subsidiary, Domilens GmbH (“Domilens”) through a management buyout led by funds managed by Hamburg-based Small Cap Buyout Specialist BPE Unternehmensbeteiligungen GmbH (“BPE”). To effectuate the Transactions “STAAR Surgical AG” (“STAAR AG”), STAAR’s Swiss subsidiary and holder of 100% of the shares of Domilens, signed a Stock Purchase agreement (the “Agreement”) with Domilens Akquisitions GmbH (“Domilens Akquisitions”) on February 24, 2010. Domilens Akqusitions become a newly formed entity 74% owned by BPE and 26% owned by management of Domilens.
After deducting expenses of the sale totaling approximately $1.2 million, including estimated taxes of $46,000, the net cash proceeds from the transaction were approximately $11.8 million.
Based on the performance of Domilens in fiscal years 2010, 2011 and 2012, STAAR may earn up to an additional €675,000 (approximately $895,000 at currently prevailing exchange rates). These additional “earn-out” payments will be paid on achievement of specified earnings before income tax (“EBIT”) as set forth below. If a target is missed in any year, but in the following year Domilens achieves the target and also makes up for the earlier shortfall, the payments for both years will be earned and paid. Based on Domilens financial performance in fiscal 2010, the Company is not entitled to the first earnout payment.
|
Fiscal Year
|
Domilens EBIT
|
Earn-Out Payment
|
||
|
2010
|
€2,500,000 (~ $3.3 million)
|
€200,000 (~$265,000)
|
||
|
2011
|
€2,900,000 (~ $3.8 million)
|
€225,000 (~$298,000)
|
||
|
2012
|
€3,500,000 (~ $4.6 million)
|
€250,000 (~$332,000)
|
In connection with the Stock Purchase Agreement, STAAR on February 24, 2010 also entered into a Distribution Agreement with Domilens providing for the continued sale of certain STAAR products following the transfer ownership. The Distribution Agreement has a term of five years. During the first three years of the term, Domilens will be the exclusive distributor of covered products in Germany and Austria, subject to Domilens’ achieving minimum purchase levels. After the initial three-year period, Domilens will have non-exclusive distribution rights for these STAAR products, unless the parties agree to an extension of the exclusivity. The following STAAR products are covered by the Distribution Agreement: preloaded
silicone and acrylic IOL injectors, the Visian ICL, Visian Toric ICL and Visian Hyperopic ICL.
F-14
STAAR SURGICAL COMPANY AND SUBSIDIARIES
NOTES TO CONSOLIDATED FINANCIAL STATEMENTS
Years Ended December 31, 2010 and January 1, 2010
The Transaction was accounted for as a divestiture as of the closing date, March 2, 2010, and Domilens was deconsolidated as of that date. The net gain on sale of Domilens was $4.1 million, calculated and recorded as of the closing date, as the difference between the fair value of consideration received of approximately $11.8 million in cash (net of taxes and direct transaction costs) and the $7.7 million carrying value of Domilens’ net assets (assets, excluding cash which was offset as part of net proceeds received, less liabilities) pursuant to ASC 810-10-40. Included in the net assets disposed of was goodwill of approximately $6.3 million resulting from the acquisition of Domilens by STAAR, which was completed in stages
during a five-year period between 1998 and 2003.
The Company has determined that the continuing cash flows from the Distribution Agreement are considered to be insignificant and STAAR will not have significant continuing involvement in the operations of the disposed subsidiary. Accordingly, the disposal was accounted for and reported as discontinued operations beginning in the first quarter of 2010 under the provisions of ASC 205-20-55, “Discontinued Operations.”
The Company’s results of operations for the divested Domilens subsidiary have been reported as discontinued operations for all periods presented and, accordingly, all prior periods reported in the consolidated statements of operations and of cash flows have been adjusted to conform to this presentation. All sales made by STAAR after the closing date to unaffiliated Domilens GmbH, pursuant to the Distribution Agreement, have been included in STAAR’s continuing operations.
The following table summarizes certain unaudited selected components of discontinued operations for the divested Domilens subsidiary for the period through the Transaction closing date, March 2, 2010 and years ended January 1, 2010 and January 2, 2009.
|
For the
Period From
January 2, -
March 2,
2010
|
Year Ended
January 1,
2010
|
Year Ended
Janaury 2,
2009
|
||||||||||
|
Net sales
|
$
|
3,584
|
$
|
24,286
|
$
|
25,124
|
||||||
|
Gross profit
|
1,544
|
10,570
|
11,025
|
|||||||||
|
Net gain on disposal, net of $46 of taxes
|
4,118
|
—
|
—
|
|||||||||
|
Income before provision for income taxes
|
64
|
1,040
|
2,204
|
|||||||||
|
Provision (benefit) for income taxes
|
(16
|
)
|
338
|
548
|
||||||||
|
Income from discontinued operations, net of income taxes
|
$
|
4,166
|
$
|
702
|
$
|
1,655
|
||||||
|
Income per share from discontinued operations – basic and diluted
|
$
|
0.12
|
$
|
0.02
|
$
|
0.05
|
||||||
The following presents the main classes of assets and liabilities of Domilens classified as discontinued operations as of January 1, 2010.
|
|
2009
|
|||
| FINANCIAL POSITION | ||||
|
Current assets:
|
||||
|
Cash and cash equivalents
|
$ | 1,597 | ||
|
Accounts receivable trade, net
|
1,685 | |||
|
Inventories, net
|
3,348 | |||
|
Prepaids, deposits and other current assets
|
596 | |||
|
Total current assets
|
7,226 | |||
|
Property, plant and equipment, net
|
1, 171 | |||
|
Goodwill
|
6,302 | |||
|
Total assets
|
$ | 14,699 | ||
|
Current liabilities:
|
||||
|
Line of credit
|
$ | 55 | ||
|
Accounts payable
|
2,725 | |||
|
Other current liabilities
|
658 | |||
|
Total current liabilities
|
3,438 | |||
|
Obligations under capital leases
|
267 | |||
|
Total liabilities
|
$ | 3,705 | ||
Note 4 — Accounts Receivable — Trade, Net
Accounts receivable – trade, net consisted of the following at December 31, 2010 and January 1, 2010 (in thousands):
|
|
2010
|
2009(1)
|
||||||
|
Domestic
|
$
|
1,405
|
$
|
1,680
|
||||
|
Foreign
|
8,237
|
8,921
|
||||||
|
9,642
|
10,601
|
|||||||
|
Less allowance for doubtful accounts and sales returns
|
1,423
|
1,332
|
||||||
|
$
|
8,219
|
$
|
9,269
|
|||||
(1)No adjustment has been made to fiscal 2009 consolidated balance sheet as a result of the Domilens divestiture completed on March 2, 2010
F-15
STAAR SURGICAL COMPANY AND SUBSIDIARIES
NOTES TO CONSOLIDATED FINANCIAL STATEMENTS
Years Ended December 31, 2010 and January 1, 2010
Note 5 — Inventories, Net
Inventories, net consisted of the following at December 31, 2010 and January 1, 2010 (in thousands):
|
|
2010
|
2009(1)
|
||||||
|
Raw materials and purchased parts
|
$
|
1,920
|
$
|
1,846
|
||||
|
Work in process
|
2,255
|
2,480
|
||||||
|
Finished goods
|
7,349
|
11,736
|
||||||
|
11,524
|
16,062
|
|||||||
|
Inventory reserves
|
(981
|
)
|
(1,242
|
)
|
||||
|
$
|
10,543
|
$
|
14,820
|
|||||
(1)No adjustment has been made to fiscal 2009 consolidated balance sheet as a result of the Domilens divestiture completed on March 2, 2010
Note 6 — Prepaids, Deposits, and Other Current Assets
Prepaids, deposits, and other current assets consisted of the following at December 31, 2010 and January 1, 2010 (in thousands):
|
|
2010
|
2009(1)
|
||||||
|
Prepaids and deposits
|
$
|
1,219
|
$
|
1,169
|
||||
|
Insurance receivable(2)
|
—
|
438
|
||||||
|
Other current assets
|
496
|
984
|
||||||
|
$
|
1,715
|
$
|
2,591
|
|||||
(1)No adjustment has been made to fiscal 2009 consolidated balance sheet as a result of the Domilens divestiture completed on March 2, 2010
(2)The insurance receivable is for partial reimbursement of legal fees and expenses that the Company’s general liability insurer has agreed to pay in connection with the defense of the Moody matter.
Note 7 — Property, Plant and Equipment
Property, plant and equipment consisted of the following at December 31, 2010 and January 1, 2010 (in thousands):
|
2010
|
2009(1)
|
|||||||
|
Machinery and equipment
|
$
|
13,069
|
$
|
15,515
|
||||
|
Furniture and fixtures
|
3,841
|
8,490
|
||||||
|
Leasehold improvements
|
4,245
|
5,525
|
||||||
|
21,155
|
29,530
|
|||||||
|
Less accumulated depreciation
|
17,423
|
24,525
|
||||||
|
$
|
3,732
|
$
|
5,005
|
|||||
(1)No adjustment has been made to fiscal 2009 consolidated balance sheet as a result of the Domilens divestiture completed on March 2, 2010
F-16
STAAR SURGICAL COMPANY AND SUBSIDIARIES
NOTES TO CONSOLIDATED FINANCIAL STATEMENTS
Years Ended December 31, 2010 and January 1, 2010
Depreciation expense from continuing operations for the years ended December 31, 2010, January 1, 2010 and January 2, 2009 was approximately $1.6 million, $2.0 million, and $2.4 million, respectively (adjusted for Domilens).
Note 8 – Intangible Assets, Net
Intangible assets, net, consisted of the following (in thousands):
|
December 31, 2010
|
January 1, 2010
|
|||||||||||||||||||||||
|
Gross
Carrying
Amount
|
Accumulated
Amortization
|
Net
|
Gross
Carrying
Amount
|
Accumulated
Amortization
|
Net
|
|||||||||||||||||||
|
Amortized intangible assets:
|
||||||||||||||||||||||||
|
Patents and licenses
|
$
|
10,827
|
$
|
(9,064
|
)
|
$
|
1,763
|
$
|
10,725
|
$
|
(8,619
|
)
|
$
|
2,106
|
||||||||||
|
Customer relationships
|
1,929
|
(579
|
)
|
1,350
|
1,694
|
(339
|
)
|
1,355
|
||||||||||||||||
|
Developed technology
|
1,226
|
(667
|
)
|
559
|
1,077
|
(390
|
)
|
687
|
||||||||||||||||
|
Total
|
$
|
13,982
|
$
|
(10,310
|
)
|
$
|
3,672
|
$
|
13,496
|
$
|
(9,348
|
)
|
$
|
4,148
|
||||||||||
Aggregate amortization expense for amortized intangible assets was $816,000, $1,402,000, and $843,000 for the years ended December 31, 2010, January 1, 2010, and January 2, 2009, respectively.
The following table shows estimated amortization expense for intangible assets for each of the next five succeeding years (in thousands):
|
Fiscal Year
|
Amount
|
|||
|
2011
|
$
|
791
|
||
|
2012
|
646
|
|||
|
2013
|
492
|
|||
|
2014
|
443
|
|||
|
2015
|
311
|
|||
|
Thereafter
|
989
|
|||
|
Total
|
$
|
3,672
|
||
Note 9 — Other Current Liabilities
Other current liabilities consisted of the following at December 31, 2010 and January 1, 2010 (in thousands):
|
2010
|
2009(1)
|
|||||||
|
Accrued salaries and wages
|
$ | 2,121 | $ | 2,122 | ||||
|
Accrued bonuses
|
751 | 530 | ||||||
|
Accrued severance
|
570 | — | ||||||
|
Customer credit balances
|
566 | 589 | ||||||
|
Accrued insurance
|
422 | 386 | ||||||
|
Accrued audit expenses
|
417 | 460 | ||||||
|
Accrued income taxes
|
147 | 905 | ||||||
|
Accrued interest on Broadwood Note
|
— | 499 | ||||||
|
Other(1)
|
1,519 | 2,215 | ||||||
| $ | 6,513 | $ | 7,706 | |||||
F-17
STAAR SURGICAL COMPANY AND SUBSIDIARIES
NOTES TO CONSOLIDATED FINANCIAL STATEMENTS
Years Ended December 31, 2010 and January 1, 2010
(1)No adjustment has been made to Fiscal 2009 consolidated balance sheet as a result of the Domilens divestiture completed on March 2, 2010
(2)No item in “Other” above exceeds 5% of total other current liabilities.
Note 10 — Notes Payable
Broadwood Promissory Note
The Company had a $5 million principal amount of indebtedness under an Amended and Restated Senior Secured Promissory Note (the “Note”) held by Broadwood Partners, L.P. (“Broadwood”), which was issued on April 13, 2009 and was scheduled to mature on December 14, 2010. STAAR’s obligations under the Note were secured by substantially all of STAAR’s assets pursuant to a Security Agreement with Broadwood, also dated April 13, 2009.
On June 22, 2010, the Company repaid the $5 million principal plus $322,000 in accrued interest. As a result of repaying the Note, the Company recorded a $267,000 loss on early extinguishment due to the write-off of the remaining unamortized debt discount and issuance costs on the date of the repayment; this loss is included in Other income (expense), net, in the accompanying consolidated statements of operations.
As additional consideration for the loan, on December 14, 2007, the Company also entered into a Warrant Agreement with Broadwood (the “December 2007 Warrant Agreement”) granting the right to purchase up to 700,000 shares of Common Stock at an exercise price of $4.00 per share, exercisable for a period of six years. The December 2007 Note also provided that if any indebtedness remained outstanding under the Note on June 1, 2009, the Company would issue additional warrants on the same terms as set forth in the December 2007 Warrant Agreement in a number equal to 700,000 times the percentage of the original $5 million principal that remains outstanding. On June 1, 2009, as the Note remained outstanding, the Company issued an additional 700,000 warrants to Broadwood, which were valued at
approximately $290,000 and included as additional paid–in capital in the consolidated balance sheet upon issuance. The December 2007 Warrant Agreement also provides that the Company will register the shares issuable upon exercise of the warrants with the Securities Exchange Commission. The Company filed and secured effectiveness of a registration statement covering resale of the shares. If the Company fails to keep the registration statement effective and the lapse exceeds permitted suspensions, as the holder’s sole remedy, the Company will be obligated to issue an additional 30,000 warrants for each month that the Company does not meet this effectiveness requirement through the term of the warrants (“Penalty Warrants”) (a maximum of approximately 1,590,000 warrants issuable as of December 31, 2010 under an assumed noncompliance as of that date). The Company does not consider the issuance of Penalty Warrants
likely. Additionally, in accordance with ASC 470-20-25, “Debt with Conversion and Other Options”, the total $5 million proceeds were allocated to the December 2007 Warrant and Note based on their relative fair values, approximating $842,000 and $4.2 million on the issuance date, respectively.
The fair value of the warrants was treated as an additional discount on the loan and was being amortized using the effective interest method over the life of the loan (which approximates an effective interest rate of 32% per annum, assuming the 20% cash interest rate is maintained throughout the life of the Note). During the years ended December 31, 2010 and January 1, 2010, approximately $236,000 and $379,000 of the discount was amortized and included in interest expense.
The fair value of the warrants was estimated on the December 14, 2007 and the June 1, 2009 issuance dates using a Black-Scholes option valuation model applying the assumptions noted in the following table:
|
As of
December
14, 2007
|
As of
June 1,
2009
|
|||||||
|
Common stock price per share
|
$
|
2.63
|
$
|
1.01
|
||||
|
Number of warrants
|
700,000
|
700,000
|
||||||
|
Expected dividends
|
0
|
%
|
0
|
%
|
||||
|
Expected volatility
|
67.3
|
%
|
74.4
|
%
|
||||
|
Risk-free rate
|
3.88
|
%
|
3.28
|
%
|
||||
|
Life (in years)
|
6.0
|
6.0
|
||||||
The fair value of the warrants that are classified as a liability as of January 1, 2010 and December 31, 2010 were based on the Black Scholes option valuation model applying the assumption noted on the following table below:
|
January 1, 2010
|
December 31, 2010
|
|||||||
|
Common stock price per share
|
$
|
3.10
|
$
|
6.10
|
||||
|
Number of warrants
|
70,000
|
70,000
|
||||||
|
Expected dividends
|
0
|
%
|
0
|
%
|
||||
|
Expected volatility
|
92.2
|
%
|
103.9
|
%
|
||||
|
Risk-free rate
|
1.70
|
%
|
1.02
|
%
|
||||
|
Remaining life (in years)
|
3.25
|
2.25
|
||||||
F-18
STAAR SURGICAL COMPANY AND SUBSIDIARIES
NOTES TO CONSOLIDATED FINANCIAL STATEMENTS
Years Ended December 31, 2010 and January 1, 2010
Capital Lease Agreements
The Company has certain agreements with Farnam Street Financial, Inc. (“Farnam”) which provides lease financing to the Company for purchases of property, plant and equipment. These agreements are under various individual lease “Schedules” which commit the Company to lease a set contractual amount of assets per Schedule. Each Schedule has its own term, required commitment amount and lease rate factor (interest rate). In accordance with the requirements of ASC 840-10-25, “Leases”, all purchases under this facility are accounted for as capital leases. Title to all assets under the Farnam leases remains with Farnam. Under the agreement, the Company has the option to purchase any items of the leased property within its Schedule of assets at the end of that Schedule’s lease term,
at a mutually agreed-upon fair value. If the Company does not choose to purchase the asset under lease, it may rent the assets on a month-to-month basis or return them to Farnam. The Company must provide a 120-day notice prior to termination of its intent to purchase or return the equipment. Amortization of the total capital lease obligation under any lease Schedule does not begin until the Company draws on the full amount of the commitment under that particular Schedule which is referred to as the Schedule “Commencement Date”. However, an individual asset leases are entered into pursuant to a particular Schedule but prior to the Commencement Date, the Company pays Farnam “interim rent” based on a predetermined lease factor applied to the actual principal amount of the purchase. Below is a table for all existing Schedules the Company has with Farnam as of December 31, 2010 (in thousands):
|
As of December 31, 2010
|
||||||||||||||||||
|
Schedule
Number
|
Commencement
Date
|
Term
|
Expiration
Date
|
Original
Required
Commitment
|
Obligation
Balance
|
Available
Credit
|
||||||||||||
|
001
|
April 1, 2007
|
36 Months
|
April 1, 2010
|
$
|
959
|
$
|
—
|
$
|
—
|
|||||||||
|
002
|
September 1, 2007
|
36 Months
|
September 1, 2010
|
527
|
—
|
—
|
||||||||||||
|
003
|
January 1, 2008
|
36 Months
|
January 1, 2011
|
387
|
126
|
—
|
||||||||||||
|
004
|
March 1, 2009
|
30 Months
|
September 1, 2011
|
150
|
45
|
—
|
||||||||||||
|
005
|
Pending
|
Pending
|
N/A
|
250
|
409
|
154
|
||||||||||||
|
006
|
Pending
|
Pending
|
N/A
|
150
|
172
|
150
|
||||||||||||
|
$
|
2,423
|
$
|
752
|
$
|
304
|
|||||||||||||
On April 1, 2010, Schedule 001 matured and on April 26, 2010, the Company entered into a new Schedule 005. Under the terms of Schedule 005, Farnam (a) renewed the capital lease related to the assets previously leased under Schedule 001 and, after making all the contractual payments, Farnam will transfer title to those assets to the Company at lease termination, and (b) provide the Company with $250,000 of additional availability for new equipment financing. The Schedule 005 term will not commence until the Company draws on the full $250,000 for new asset purchases and will terminate twenty-four months after the Commencement Date, assuming all payments are made timely. The monthly payments currently being made to Farnam under Schedule 005 are all considered “interim
rents” and include both the previous assets leased under Schedule 001 and the new assets financed under Schedule 005. The interim rents are considered to be a financing cost and are recorded as interest expense by the Company. On the Commencement Date, the Company will begin to amortize the capital lease obligation using the effective interest method over the twenty-four month lease term. Title to the new assets financed under Schedule 005, however, will remain with Farnam after lease termination and subject to a fair value purchase option at the end of the lease. Since the Company continues to utilize the assets previously leased under Schedule 001 and renewed under Schedule 005, the Company recorded $313,000 in assets and a corresponding capital lease obligation in connection with this renewal under the provisions of ASC 840-30-35. In addition, as of December 31, 2010, the Company has leased $96,000 of the $250,000 required
under Schedule 005 for lease term Commencement, thereby leaving $154,000 in available credit to the Company under Schedule 005.
F-19
STAAR SURGICAL COMPANY AND SUBSIDIARIES
NOTES TO CONSOLIDATED FINANCIAL STATEMENTS
Years Ended December 31, 2010 and January 1, 2010
On September 1, 2010, Schedule 002 matured and the Company entered into a new Schedule 006. Under the terms of Schedule 006, Farnam (a) renewed the capital lease related to the assets previously leased under Schedule 002 and, after making all the contractual payments, Farnam will transfer title to those assets to the Company at lease termination, and (b) provided the Company with $150,000 of additional availability for new equipment financing. The Schedule 006 term will not commence until the Company draws on the full $150,000 for new asset purchases and will terminate twenty-four months after the Commencement Date, assuming all payments are made timely. The monthly payments currently being made to Farnam under Schedule 006 are all
considered “interim rents” and include both the previous assets leased under Schedule 002 and any new assets financed under Schedule 006. The interim rents are considered to be a financing cost and are recorded as interest expense by the Company. On the Commencement Date, the Company will begin to amortize the capital lease obligation using the effective interest method over the twenty-four month lease term. Title to the new assets financed under Schedule 006, however, will remain with Farnam after lease termination and subject to a fair value purchase option at the end of the lease. Since the Company continues to utilize the assets previously leased under Schedule 002 and renewed under Schedule 006, the Company recorded $172,000 in assets and a corresponding capital lease obligation in connection with this renewal under the provisions of ASC 840-30-35. As of December 31, 2010, the Company has not leased any new assets under
Schedule 006, thereby leaving the entire $150,000 as an available commitment.
On December 31, 2010, Schedule 003 matured and the Company is in negotiation with Farnam to determine the fair market value for assets purchased under this schedule. Based on past negotiation related to Schedule 001 and Schedule 002, the Company recorded an estimated fair value of $126,000 for assets under Schedule 003.
The Company has various other capital leases internationally mainly for machinery and equipment used in operations. As of December 31, 2010, those capital lease obligations were $1.08 million.
Lines of Credit
The Company’s Japanese subsidiary, STAAR Japan, has an agreement, as amended on June 30, 2009, with Mizuho Bank which provides for borrowings of up to 300,000,000 Yen (approximately $3.7 million based on the rate of exchange on December 31, 2010), at an interest rate equal to the Tokyo short-term prime interest rate (approximately 1.475% as of December 31, 2010) plus 1.125% and may be renewed annually (the current line expires on April 2, 2011). The credit facility is not collateralized. The Company had 200,000,000 Yen outstanding on the line of credit as of December 31, 2010 and January 1, 2010, (approximately $2.5 million and $2.2 million based on the foreign exchange rates on December 31, 2010 and January 1, 2010, respectively) which approximates fair value due to the short-term
maturity and market interest rates of the line of credit. In case of default, the interest rate will be increased to 14% per annum. As of December 31, 2010, 100,000,000 Yen (approximately $1.2 million, based on the rate of exchange on December 31, 2010) was available for borrowing.
In August 2010, the Company’s wholly-owned Swiss subsidiary, STAAR Surgical AG, entered into a credit agreement with Credit Suisse (the “Bank”). The credit agreement provides for borrowing of up to 1,000,000 CHF (Swiss Francs) ($1,063,000 at the rate of exchange on December 31, 2010), to be used for working capital purposes. Accrued interest and 0.25% commissions on average outstanding borrowings is payable quarterly and the interest rate will be determined by the Bank based on the then prevailing market conditions at the time of borrowing. The credit agreement is automatically renewed on an annual basis based on the same terms assuming there is no default. The credit agreement may be terminated by either party at any time in accordance with its general terms and conditions. The credit facility is
not collateralized and contains certain conditions such as providing the Bank with audited financial statements annually and notice of significant events or conditions as defined in the credit agreement. The Bank may also declare all amounts outstanding to be immediately due and payable upon a change of control or a “material qualification” in STAAR Surgical AG’s independent auditors’ report. There were no borrowings outstanding as of December 31, 2010 and the full amount of the line was available for borrowing.
Covenant Compliance
The Company is in compliance with covenants of its credit facilities and lines of credit as of the date of this report.
F-20
STAAR SURGICAL COMPANY AND SUBSIDIARIES
NOTES TO CONSOLIDATED FINANCIAL STATEMENTS
Years Ended December 31, 2010 and January 1, 2010
Note 11 — Series A Redeemable, Convertible Preferred Stock
Under its Certificate of Incorporation, the Company has 10,000,000 shares of “blank check” preferred stock, which the Board of Directors is authorized to issue with such rights, preferences and privileges as the Board may determine. On October 22, 2007, the Board approved the designation of 1,700,000 shares of the preferred stock as Series A Redeemable Convertible Preferred Stock (“Preferred Stock”) to be issued in connection with the acquisition of the 50% interest in Canon Staar Co., Inc. which was consummated on December 29, 2007. On December 29, 2007, the Company issued the 1,700,000 shares of Preferred Stock to the Canon companies as partial consideration for their shares of Canon Staar Co., Inc. at an estimated fair value of $4.00 per share, or $6.8 million
in the aggregate.
The Preferred Stock was convertible into shares of the Company’s common stock at any time after the issuance date at a one-to-one conversion ratio that was adjustable only for stock splits, combinations, subdivisions, dividends or recapitalizations (“Conversion Ratio”). On the fifth anniversary of the issuance date, the Preferred Stock would expire and each share of Preferred Stock would automatically convert to common stock of the Company at the Conversion Ratio.
The Preferred Stock was redeemable by the Company at any time on or after the first anniversary of the issuance date at a price of $4.00 per share plus any accrued or declared but unpaid dividends (“Redemption Price”). The holders of the Preferred Stock had a right, exercisable at any time on or after the third anniversary (December 29, 2010) of the issuance date by a majority vote of the Preferred Stock holders with at least 30 days’ written notice, to require the Company to redeem the Preferred Stock at the Redemption Price.
The fair value of the Preferred Stock was determined on the issuance date by the Company with the assistance of a valuation specialist using the Binomial Tree option valuation model. This model considered the Preferred Stock to be a derivative asset of the Company’s common stock where the preferred stockholder had options to choose certain payoffs that maximized returns and therefore maximized the value of the preferred stock. The payoff available to the preferred stockholder was contingent on the future market value of the Company’s common stock. Therefore the model, based on certain significant management assumptions, analyzed various payoff patterns for different possible paths that might be followed by the common stock price over the life of the Preferred Stock until
the automatic conversion on the fifth anniversary of the issuance date.
The significant assumptions used in the valuation were as follows:
|
Average common stock price*
|
$
|
3.12
|
||
|
Expected volatility
|
67.4
|
%
|
||
|
Expected dividend yield
|
0
|
%
|
||
|
Risk-free interest rate
|
3.43
|
%
|
||
|
Issuer’s call price per share
|
$
|
4.00
|
||
|
Redemption price per share
|
$
|
4.00
|
* Average common stock price used in the valuation represents the average closing market price per share of the Company’s common stock a few days before and after the announcement date of the Canon Staar acquisition.
On April 23, 2010, STAAR issued a call notice to the holders of its 1,700,000 outstanding shares of Preferred Stock establishing May 24, 2010 as the redemption date for the Preferred Stock. On the redemption date each share of preferred stock could be redeemed for $4.00 per share unless it had previously been converted to the Company’s common stock. The holders of the preferred stock could convert their shares of Preferred Stock into common stock at the one-to-one ratio at any time until the close of business on May 17, 2010. On May 24, 2010, the Company redeemed all outstanding shares of preferred stock in cash for $4.00 per share, or $6.8 million in aggregate. There are no Preferred Shares outstanding since the redemption.
Since the Preferred Stock was redeemable only at the option of the holders after the third anniversary of issuance, the Company has presented the Preferred Stock in the mezzanine section of the consolidated balance sheet. The Preferred Stock fair value recorded on the issuance date approximated the redemption price, thus no further accretion was required by the Company to the redemption value and no subsequent revaluation was necessary so long as the Preferred Stock was considered a temporary equity instrument. However, issuance and registration costs of approximately $48,000 were incurred related to the Preferred Stock which were offset against its fair value on the issuance date and accreted to the redemption value with a corresponding charge to Additional Paid-In Capital over a three-year
period. The remaining costs were written-off when the Preferred Stock was redeemed on April 23, 2010.
F-21
STAAR SURGICAL COMPANY AND SUBSIDIARIES
NOTES TO CONSOLIDATED FINANCIAL STATEMENTS
Years Ended December 31, 2010 and January 1, 2010
Note 12 — Income Taxes
The provision for income taxes consists of the following (in thousands):
|
2010
|
2009(1)
|
2008(1)
|
||||||||||
|
Current tax provision:
|
||||||||||||
|
U.S. federal
|
$
|
—
|
$
|
—
|
$
|
—
|
||||||
|
State
|
13
|
15
|
8
|
|||||||||
|
Foreign
|
602
|
1,341
|
729
|
|||||||||
|
Total current provision
|
615
|
1,356
|
737
|
|||||||||
|
Deferred tax provision:
|
||||||||||||
|
U.S. federal and state
|
—
|
—
|
—
|
|||||||||
|
Foreign
|
(183
|
)
|
(202
|
)
|
238
|
|||||||
|
Total deferred provision
|
(183
|
)
|
(202
|
)
|
238
|
|||||||
|
Provision for income taxes
|
$
|
432
|
$
|
1,154
|
$
|
975
|
||||||
(1)Adjusted to reflect effects of discontinued operations.
As of December 31, 2010, the Company had $119.6 million of U.S. federal net operating loss carryforwards available to reduce future income taxes. The net operating loss carryforwards expire in varying amounts between 2020 and 2030.
The Company had accrued income taxes payable of $147,000 and $905,000 at December 31, 2010 and January 1, 2010, respectively, primarily due to taxes payable in foreign jurisdictions.
The provision for income before taxes differs from the amount computed by applying the statutory federal income tax rate to income before taxes as follows (amounts in thousands):
|
2010
|
2009(1)
|
2008(1)
|
||||||||||||||||||||||
|
Computed provision for taxes based on income at statutory rate
|
34.0
|
%
|
$
|
(1,252
|
)
|
34.0
|
%
|
$
|
(1,954
|
)
|
34.0
|
%
|
$
|
(8,117
|
)
|
|||||||||
|
Increase (decrease) in taxes resulting from:
|
||||||||||||||||||||||||
|
Permanent differences
|
(0.9
|
)
|
33
|
(0.5
|
)
|
23
|
(0.2
|
)
|
37
|
|||||||||||||||
|
State minimum taxes, net of federal income tax benefit
|
(0.2
|
)
|
9
|
(0.2
|
)
|
10
|
—
|
5
|
||||||||||||||||
|
State tax benefit
|
5.6
|
(207
|
)
|
13.7
|
(786
|
)
|
6.6
|
(1,583
|
)
|
|||||||||||||||
|
Tax rate difference due to foreign statutory rate
|
5.7
|
(208
|
)
|
2.9
|
(164
|
)
|
(7.7
|
)
|
1,846
|
|||||||||||||||
|
Foreign tax benefit
|
3.7
|
(137
|
)
|
4.7
|
(273
|
)
|
3.0
|
(717
|
)
|
|||||||||||||||
|
Previous write-down of investment in foreign subsidiary
|
—
|
—
|
—
|
—
|
(2.2
|
)
|
515
|
|||||||||||||||||
|
Foreign earnings not permanently reinvested
|
—
|
—
|
(17.4
|
)
|
1,001
|
(25.8
|
)
|
6,163
|
||||||||||||||||
|
Foreign dividend withholding
|
(12.0
|
)
|
440
|
(3.1
|
)
|
179
|
(2.4
|
)
|
591
|
|||||||||||||||
|
Return to provision adjustment
|
—
|
—
|
—
|
—
|
(0.6
|
)
|
143
|
|||||||||||||||||
|
FAS 123R
|
(23.7
|
)
|
873
|
—
|
—
|
—
|
—
|
|||||||||||||||||
|
Other
|
0.2
|
(7
|
)
|
(0.4
|
)
|
25
|
—
|
(2
|
)
|
|||||||||||||||
|
Valuation allowance
|
(24.1
|
)
|
888
|
(53.8
|
)
|
3,093
|
(8.8
|
)
|
2,094
|
|||||||||||||||
|
Effective tax provision rate
|
(11.7
|
)%
|
$
|
432
|
(20.1
|
)%
|
$
|
1,154
|
(4.1
|
)%
|
975
|
|||||||||||||
F-22
STAAR SURGICAL COMPANY AND SUBSIDIARIES
NOTES TO CONSOLIDATED FINANCIAL STATEMENTS
Years Ended December 31, 2010 and January 1, 2010
(1)Adjusted to reflect effects of discontinued operations.
Included in the state tax provision is an increase to the state deferred tax asset and corresponding increase to the valuation allowance of $204,000, $786,000 and $1,583,000 for 2010, 2009 and 2009, respectively. This results in a total state tax provision of $13,000, $15,000 and $8,000 for fiscal years ended 2010, 2009 and 2009, respectively.
During the year ended December 28, 2007, the Company adopted a plan to repatriate a portion of its earnings from certain foreign subsidiaries to commence during the 2008 fiscal year. These repatriated earnings were not expected to exceed $11.4 million at that time. As of January 2, 2009, all earnings from its subsidiaries were no longer considered to be permanently reinvested. Accordingly, the Company provides withholding and U.S. taxes on all unremitted foreign earnings. During 2010 and 2009, the Company paid $435,000 and $422,000 respectively in withholding taxes to the Swiss government due to the repatriation of approximately $8.7 million in 2010 and $8.4 million in 2009 of earnings from its Swiss subsidiary.
Deferred income taxes reflect the net tax effects of temporary differences between the carrying amounts of assets and liabilities for financial reporting purposes and the amounts used for income tax purposes. Significant components of the Company’s deferred tax assets (liabilities) as of December 31, 2010 and January 1, 2010 are as follows (in thousands):
|
2010
|
2009
|
|||||||
|
Current deferred tax assets (liabilities):
|
||||||||
|
Allowance for doubtful accounts and sales returns
|
$
|
245
|
$
|
212
|
||||
|
Inventories
|
421
|
427
|
||||||
|
Accrued vacation
|
434
|
277
|
||||||
|
Other
|
(123
|
)
|
(131
|
)
|
||||
|
State taxes
|
3
|
3
|
||||||
|
Accrued legal judgment and other accrued expenses
|
152
|
1,783
|
||||||
|
Valuation allowance
|
(1,458
|
)
|
(2,931
|
)
|
||||
|
Total current deferred tax liabilities
|
$
|
(326
|
)
|
$
|
(360
|
)
|
||
|
Non-current deferred tax assets (liabilities):
|
||||||||
|
Net operating loss carryforwards
|
51,077
|
50,922
|
||||||
|
Stock-based payments
|
1,128
|
1,918
|
||||||
|
Business, foreign and AMT credit carryforwards
|
723
|
906
|
||||||
|
Capitalized R&D
|
602
|
589
|
||||||
|
Contributions
|
190
|
179
|
||||||
|
Pensions
|
713
|
737
|
||||||
|
Depreciation and amortization
|
100
|
11
|
||||||
|
Foreign tax withholding
|
(869
|
)
|
(887
|
)
|
||||
|
Foreign earnings not permanently reinvested
|
(3,780
|
)
|
(7,116
|
)
|
||||
|
Other
|
61
|
62
|
||||||
|
Valuation allowance
|
(50,231
|
)
|
(47,870
|
)
|
||||
|
Total non-current deferred tax liabilities
|
$
|
(286
|
)
|
$
|
(549
|
)
|
||
ASC 740 requires that a valuation allowance be established when it is more likely than not that all or a portion of a deferred tax asset may not be realized. Cumulative losses weigh heavily in the assessment of the need for a valuation allowance. Due to the Company’s recent history of losses, the valuation allowance fully offsets the value of U.S. deferred tax assets on the Company’s balance sheet as of December 31, 2010. Further, under Federal Tax Law Internal Revenue Code Section 382, significant changes in ownership may restrict the future utilization of these tax loss carry forwards.
F-23
STAAR SURGICAL COMPANY AND SUBSIDIARIES
NOTES TO CONSOLIDATED FINANCIAL STATEMENTS
Years Ended December 31, 2010 and January 1, 2010
Included in deferred tax assets and liabilities are net non-current deferred tax assets of $202,000 and $104,000 for 2010 and 2009, respectively, for STAAR Surgical AG. Due to STAAR Surgical AG’s history of profits, the deferred tax assets are considered fully realizable.
The following tax years remain subject to examination:
|
Significant Jurisdictions
|
Open Years
|
||
|
U.S. Federal
|
2007 – 2009
|
||
|
California
|
2006 – 2009
|
||
|
Germany*
|
2007 – 2009
|
||
|
Switzerland
|
2009
|
||
|
Japan
|
2006 – 2009
|
*See Note 2 regarding the disposal of Domilens on March 2, 2010.
Income (loss) before provision for income taxes is as follows (in thousands):
|
2010
|
2009
|
2008
|
||||||||||
|
Domestic
|
$
|
(4,732
|
)
|
$
|
(9,052
|
)
|
$
|
(19,551
|
)
|
|||
|
Foreign
|
1,051
|
3,304
|
(4,324
|
)
|
||||||||
|
$
|
(3,681
|
)
|
$
|
(5,748
|
)
|
$
|
(23,875
|
)
|
||||
Note 13 – Employee Benefit Plans
The Company maintains a passive pension plan (the “Swiss Plan”) covering employees of its Swiss subsidiary, which is accounted for as a defined benefit plan under the provisions of ASC 715-30, “Defined Benefit Plans – Pension” (previously accounted for under Statement of Financial Accounting Standards (“SFAS”) No. 158, “Employers’ Accounting for Defined Benefit Pension and Other Postretirement Plans”).
Defined Benefit Plan-Switzerland
In Switzerland employers are required to provide a minimum pension plan for their staff. The Swiss Plan is financed by contributions of both the employees and employer. The amount of the contributions is defined by the plan regulations and cannot be decreased without amending the plan regulations. It is required that the employer contribute an amount equal to or greater than the employee contribution.
The funded status of the Swiss benefit plan at December 31, 2010 and January 1, 2010 is as follows:
|
2010
|
2009
|
|||||||
|
Change in Projected Benefit Obligation:
|
||||||||
|
Projected benefit obligation, beginning of period
|
$
|
3,836
|
$
|
3,021
|
||||
|
Service cost
|
328
|
307
|
||||||
|
Interest cost
|
120
|
108
|
||||||
|
Participant contributions
|
248
|
240
|
||||||
|
Benefits (paid) deposited
|
(489
|
)
|
89
|
|||||
|
Actuarial loss on obligation
|
825
|
71
|
||||||
|
Projected benefit obligation, end of period
|
$
|
4,868
|
$
|
3,836
|
||||
|
Changes in Plan Assets:
|
||||||||
|
Plan assets at fair value, beginning of period
|
$
|
2,722
|
$
|
2,325
|
||||
|
Actual return (loss) on plan assets (including foreign currency impact)
|
345
|
(171
|
)
|
|||||
|
Employer contributions
|
248
|
238
|
||||||
|
Participant contributions
|
248
|
240
|
||||||
|
Benefits (paid) deposited
|
(489
|
)
|
89
|
|||||
|
Plan assets at fair value, end of period
|
$
|
3,074
|
$
|
2,721
|
||||
|
Net Amount Recognized in Consolidated Balance Sheets:
|
||||||||
|
Underfunded, end of year
|
$
|
(1,794
|
)
|
$
|
(1,115
|
)
|
||
|
Other long term liabilities
|
$
|
(1,794
|
)
|
$
|
(1,115
|
)
|
||
|
Amount Recognized in Accumulated Other Comprehensive Loss, Net of Tax:
|
||||||||
|
Actuarial loss on plan assets
|
$
|
(589
|
)
|
$
|
(787
|
)
|
||
|
Actuarial (loss) gain on benefit obligation
|
(624
|
)
|
20
|
|||||
|
Actuarial gain recognized in current year
|
88
|
45
|
||||||
|
Accumulated other comprehensive loss
|
$
|
(1,125
|
)
|
$
|
(722
|
)
|
||
|
Accumulated benefit obligation at end of year
|
$
|
(4,271
|
)
|
$
|
(3,521
|
)
|
||
F-24
STAAR SURGICAL COMPANY AND SUBSIDIARIES
NOTES TO CONSOLIDATED FINANCIAL STATEMENTS
Years Ended December 31, 2010 and January 1, 2010
The underfunded balance of $1,794,000 and $1,115,000 was included in other long-term liabilities on the consolidated balance sheets as of December 31, 2010 and January 1, 2010, respectively.
Net periodic pension cost associated with the Swiss Plan in the years ended December 31, 2010, January 1, 2010 and January 2, 2009 include the following components (in thousands):
|
2010
|
2009
|
2008
|
||||||||||
|
Service Cost
|
$
|
328
|
$
|
307
|
$
|
265
|
||||||
|
Interest Cost
|
120
|
108
|
114
|
|||||||||
|
Expected return on plan assets
|
(91
|
)
|
(91
|
)
|
(111
|
)
|
||||||
|
Actuarial loss recognized in current year
|
55
|
33
|
24
|
|||||||||
|
Net periodic pension cost
|
$
|
412
|
$
|
357
|
$
|
292
|
||||||
Changes in other comprehensive loss (net of tax) associated with the Swiss Plan in the year ended December 31, 2010 and January 1, 2010 include the following components (in thousands):
|
2010
|
2009
|
|||||||
|
Actuarial loss of current year
|
$
|
(446
|
)
|
$
|
(260
|
)
|
||
|
Actuarial loss recorded in current year
|
43
|
26
|
||||||
|
Change in other comprehensive loss
|
$
|
(403
|
)
|
$
|
(234
|
)
|
||
The amount in accumulated other comprehensive loss as of December 31, 2010 that is expected to be recognized as a component of the net periodic pension costs in the subsequent year is $97,000.
Net periodic pension cost and projected and accumulated pension obligation for the Company’s Swiss Plan were calculated on December 31, 2010 and January 1, 2010 using the following assumptions:
|
2010
|
2009
|
|||||||
|
Discount rate
|
2.60
|
%
|
3.10
|
%
|
||||
|
Salary increases
|
3.00
|
%
|
2.00
|
%
|
||||
|
Expected return on plan assets
|
3.35
|
%
|
3.35
|
%
|
||||
|
Expected average remaining working lives in years
|
9.90
|
9.90
|
||||||
The discount rates of 2.60% and 3.10% for the period ending December 31, 2010 and January 1, 2010 respectively, are based on an assumed pension benefit maturity of 10 to 15 years. The rate was estimated using the rate of return for high quality Swiss corporate bonds that mature in eight years. This maturity was used as there are significant numbers of high quality Swiss bonds, but very few bonds issued with maturities with longer lives. As of December 31, 2010 and January 1, 2010, the average rate for high quality Swiss corporate bonds was 2.61% and 3.13% respectively. In order to determine an appropriate discount rate, the eight year rate of return was then extrapolated along the yield curve of Swiss government bonds.
F-25
STAAR SURGICAL COMPANY AND SUBSIDIARIES
NOTES TO CONSOLIDATED FINANCIAL STATEMENTS
Years Ended December 31, 2010 and January 1, 2010
The salary increase rate of 3% was based on the Company’s best estimate of future increases over time.
The expected long-term rate of return on plan assets is based on the expected asset allocation and assumptions concerning long-term interest rates, inflation rates, and risk premiums for equities above the risk-free rates of return. These assumptions take into consideration historical long-term rates of return for relevant asset categories.
Plan assets categories in the Swiss Plan are comprised of the following (in thousands):
|
2010
|
2009
|
|||||||
|
Bonds and loans
|
$
|
2,090
|
$
|
1,877
|
||||
|
Real estate (including real estate funds)
|
830
|
735
|
||||||
|
Equity securities
|
92
|
82
|
||||||
|
Liquid assets
|
62
|
27
|
||||||
|
$
|
3,074
|
$
|
2,721
|
|||||
In accordance with ASC 820-10-35 the assets above are measured at fair value and are categorized into three different class levels. Level 1 assets are those whose value is based on quoted prices in active markets. Level 2 assets are those whose values are based on direct or indirect observable markets for similar assets. Level 3 assets are those whose values are unobservable. As of December 31, 2010, Level 1 assets in the Swiss Plan include bonds (60%), equity (3%) and liquid assets (2%). Level 2 assets are comprised of mortgages (13%), real estate assets (14%) and loans (8%). As of January 1, 2010, Level 1 assets in the Swiss Plan include bonds (62%), equity (3%) and liquid assets (1%). Level 2 assets are comprised of real estate (12%),
mortgages (15%) and loans (7%).
The Company has contracted with the Allianz Suisse Life Insurance Company’s BVG Collective Foundation to manage the Swiss Plan. The investment strategy is determined by the Swiss insurance company and applies to all members of the collective foundation.
In fiscal 2011, the Company expects to make cash contributions totaling approximately $286,000 to the Swiss Plan.
The estimated future benefit payments for the Swiss Plan are as follows (in thousands):
|
Fiscal Year
|
||||
|
2011
|
$
|
47
|
||
|
2012
|
56
|
|||
|
2013
|
66
|
|||
|
2014
|
75
|
|||
|
2015
|
86
|
|||
|
2016 – 2020
|
614
|
|||
| Total | 944 | |||
Defined Benefit Plan-Japan
In connection with the Company’s acquisition of the remaining interest in STAAR Japan, Inc., STAAR assumed the net pension liability under STAAR Japan’s noncontributory defined benefit pension plan (“Japan Plan”) substantially covering all of the employees of STAAR Japan. STAAR Japan accounts for the Japan Plan under the requirements of ASC 715-30 (previously accounted for under SFAS No. 158). Benefits under the Japan plan are earned, vested and accumulated based on a point-system, primarily based on the combination of years of service, actual and expected future grades (management or non-management) and actual and future zone (performance) levels of the employees. Each point earned is worth a fixed monetary value, 1,000 Yen per point, regardless of the level, grade or
zone of the employee. Gross benefits are calculated based on the cumulative number of points earned over the service period multiplied by 1,000 Yen. The mandatory retirement age limit is 60 years old.
F-26
STAAR SURGICAL COMPANY AND SUBSIDIARIES
NOTES TO CONSOLIDATED FINANCIAL STATEMENTS
Years Ended December 31, 2010 and January 1, 2010
Effective September 30, 2009 (the “Distribution Date”), STAAR Japan management and the participants of the Japan Plan approved the distribution of the pension plan assets to its participants (the “Distribution”). All other terms and provisions of the Japan Plan remained unchanged except as described below. Prior to the Distribution Date, the plan assets were being held, invested and administered by Dai-ichi Mutual Life Insurance Company, the plan Custodian, and as of the Distribution Date, all the risks associated with the plan assets and its distribution to the participants of the plan were irrevocably accepted by and legally transferred to the Custodian. The Company accounted for this distribution as a partial settlement on the Distribution Date in
accordance with ASC 715-30-35, Defined Benefit Plans – Pension. On September 30, 2009, the fair value of the Japan Plan assets were approximately 58 million Yen (approximately $643,000 at the exchange rate in effect on that date), which were distributed to the participants based on their pro rata vested balances in October 2009. The Company recorded in earnings a $26,000 gain on partial settlement of the Japan Plan calculated on a pro rata portion of the amount equal to the percentage reduction in the projected benefit obligation by the distribution amount.
Beginning October 1, 2009, STAAR Japan maintains and administers the plan (the “Amended Plan”) and funds the obligations of the Amended Plan from STAAR Japan’s operations. STAAR Japan is not required, and does not intend to provide any future contributions to the Amended Plan to meet benefit obligations and will therefore not have any plan assets. Benefit payments are made to beneficiaries from operating cash flows as they become due. The Amended Plan will retain all other provisions of the Japan Plan that existed prior to the distribution, except for two amendments made to the Amended Plan. First, since the Distribution was a taxable event to the participants, STAAR Japan agreed to increase future pension benefits to the participants to reimburse them for any
additional taxes due from the Distribution when those benefits are paid. Second, the Amended Plan changed the benefit payment method to a lump-sum distribution only, whereas the Japan Plan prior to the amendment, provided a choice of distribution of benefits either in lump-sum or an annuity.
The funded status of the benefit plan at December 31, 2010 and January 1, 2010 is as follows:
|
2010
|
2009
|
|||||||
|
Change in Projected Benefit Obligation:
|
||||||||
|
Projected benefit obligation, beginning of period
|
$
|
920
|
$
|
1,500
|
||||
|
Service cost
|
234
|
238
|
||||||
|
Interest cost
|
12
|
27
|
||||||
|
Actuarial gain
|
(413
|
)
|
(111
|
)
|
||||
|
Benefits paid
|
(79
|
)
|
(59
|
)
|
||||
|
Distribution of plan assets
|
—
|
(643
|
)
|
|||||
|
Amendment 1
|
—
|
53
|
||||||
|
Amendment 2
|
—
|
(83
|
)
|
|||||
|
Foreign exchange adjustment
|
108
|
(2
|
)
|
|||||
|
Projected benefit obligation, end of period
|
$
|
782
|
$
|
920
|
||||
|
Changes in Plan Assets:
|
||||||||
|
Plan assets at fair value, beginning of period
|
$
|
—
|
$
|
578
|
||||
|
Actual return on plan assets
|
—
|
(13
|
)
|
|||||
|
Employer contributions
|
—
|
76
|
||||||
|
Benefits paid
|
—
|
(11
|
)
|
|||||
|
Distribution of plan assets
|
—
|
(643
|
)
|
|||||
|
Foreign exchange adjustment
|
—
|
13
|
||||||
|
Plan assets at fair value, end of period
|
$
|
—
|
$
|
—
|
||||
|
Net Amount Recognized in Consolidated Balance Sheets:
|
||||||||
|
Underfunded, end of period
|
$
|
(782
|
)
|
$
|
(920
|
)
|
||
|
Other long term liabilities
|
$
|
(782
|
)
|
$
|
(920
|
)
|
||
|
Amount Recognized in Accumulated Other Comprehensive Income:
|
||||||||
|
Transition obligation
|
$
|
85
|
$
|
70
|
||||
|
Actuarial gain
|
461
|
72
|
||||||
|
Prior Service Cost
|
30
|
31
|
||||||
|
Accumulated other comprehensive income
|
$
|
576
|
$
|
173
|
||||
|
Accumulated benefit obligation at end of year
|
$
|
(653
|
)
|
$
|
(578
|
)
|
||
F-27
STAAR SURGICAL COMPANY AND SUBSIDIARIES
NOTES TO CONSOLIDATED FINANCIAL STATEMENTS
Years Ended December 31, 2010 and January 1, 2010
The underfunded balance of $782,000 and $920,000 was included in other long-term liabilities on the consolidated balance sheets as of December 31, 2010 and January 1, 2010.
Net periodic pension cost associated with the Japan Plan for the years ended December 31, 2010 and January 1, 2010 include the following components (in thousands):
|
2010
|
2009
|
|||||||
|
Service cost
|
$
|
234
|
$
|
238
|
||||
|
Interest cost
|
13
|
27
|
||||||
|
Expected return on plan assets
|
—
|
(8
|
)
|
|||||
|
Gain on partial settlement
|
—
|
(26
|
)
|
|||||
|
Net amortization of transition obligation
|
15
|
6
|
||||||
|
Actuarial Loss
|
(24
|
)
|
—
|
|||||
|
Prior Service Cost
|
(1
|
)
|
—
|
|||||
|
$
|
237
|
$
|
237
|
|||||
Changes in other comprehensive income associated with the Japan Plan for the years ended December 31, 2010 and January 1, 2010 include the following components (in thousands):
|
2010
|
2009
|
|||||||
|
Amortization of transitional obligation
|
$
|
15
|
$
|
22
|
||||
|
Net actuarial gain of current year
|
413
|
88
|
||||||
|
Gain on partial settlement
|
—
|
(26
|
)
|
|||||
|
Actuarial gain recorded in current year
|
(24
|
)
|
(16
|
)
|
||||
|
Prior Service Cost
|
(1
|
)
|
30
|
|||||
|
Change in other comprehensive income
|
$
|
403
|
$
|
98
|
||||
The amount in accumulated other comprehensive income as of December 31, 2010 that is expected to be recognized as a component of the net periodic pension cost in fiscal 2011 is approximately $105,000.
Net periodic pension cost and projected and accumulated pension obligation for the Company’s Japan Plan were calculated on December 31, 2010 and January 1, 2010 using the following assumptions:
|
2010
|
2009
|
|||||||
|
Discount rate
|
.70
|
%
|
1.30
|
%
|
||||
|
Salary increases
|
2.00
|
%
|
2.00
|
%
|
||||
|
Expected return on plan assets
|
N/A
|
N/A
|
||||||
|
Expected average remaining working lives in years
|
6.49
|
20.00
|
||||||
The discount rate of 0.7% and 1.3% for the period ending December 31, 2010 and January 1, 2010 is based on the approximate Japanese government bond rate with a term of 10 to 20 years.
F-28
STAAR SURGICAL COMPANY AND SUBSIDIARIES
NOTES TO CONSOLIDATED FINANCIAL STATEMENTS
Years Ended December 31, 2010 and January 1, 2010
The salary increase average rate of 2% was based on the Company’s best estimate of future increases over time.
On September 30, 2009, all assets of the Japan Plan were liquidated as part of the Distribution. The estimated future benefit payments for the Japan Plan are as follows (in thousands):
|
Fiscal Year
|
||||
|
2011
|
$
|
71
|
||
|
2012
|
87
|
|||
|
2013
|
94
|
|||
|
2014
|
97
|
|||
|
2015
|
108
|
|||
|
2016 – 2020
|
671
|
|||
| Total | 1,128 | |||
Defined Contribution Plan
The Company maintains a 401(k) profit sharing plan (“401(k) Plan”) for the benefit of qualified employees in North America. During the fiscal year ended December 31, 2010, employees who participate may elect to make salary deferral contributions to the 401(k) Plan up to the $16,500 of the employees’ eligible payroll subject to annual Internal Revenue Code maximum limitations. The Company makes a contribution of 50% of the employee’s contribution up to the first 2% of the employee’s compensation, and 25% of the next 4% of compensation. In addition, STAAR may make a discretionary contribution to qualified employees, in accordance with the 401(k) Plan. During the years ended December 31, 2010, January 1, 2010, and January 2, 2009, the Company made contributions, net of
forfeitures, of $123,000, $94,000, and $125,000, respectively, to the 401(k) Plan.
Note 14 — Stockholders’ Equity
Common Stock
On June 17, 2009, the Company completed a Common Stock Offering (the “Offering”) by issuing 4,555,319 shares of Company stock to institutional investors at the previous day’s closing market price of $1.88 per share, raising $8.5 million in aggregate, net of approximately $62,000 issuance costs. No warrants or other financial instruments were issued in the Offering. The Offering resulted in an increase in the par value of Common Stock of $46,000, with the remainder of the proceeds being recorded as additional paid-in capital on the issuance date. The primary purpose of the Offering was to raise the funds necessary to post a deposit with the Superior Court of California, County of Orange, in connection with the Company’s Parallax judgment while the case was on appeal.
On February 20, 2009, the Company issued 246,764 shares of Company common stock to certain of its attorneys at the closing market price of $1.72 per share, or approximately $424,000, in lieu of cash for previously incurred legal services related to the Parallax case.
Restricted shares are issued at fair market value on the date of grant, vest over a period of one to four years, and are subject to forfeiture until vested or the service period is achieved and the restriction is lapsed or terminated. As the restriction lapses and the stock vests, the expense is included in stock-based compensation. During fiscal year 2010, the Company issued 113,000 shares of restricted stock to certain employees. As of December 31, 2010 none of these restricted shares had vested.
Share-Based Payments
The Company issues new shares upon option exercise once the optionee remits payment for the exercise price. The compensation cost that has been charged against income is set forth below (in thousands):
F-29
STAAR SURGICAL COMPANY AND SUBSIDIARIES
NOTES TO CONSOLIDATED FINANCIAL STATEMENTS
Years Ended December 31, 2010 and January 1, 2010
|
Fiscal Year Ended
|
||||||||||||
|
December 31,
2010
|
January 1,
2010
|
January 2,
2009
|
||||||||||
|
Stock based compensation expense
|
$
|
852
|
$
|
926
|
$
|
1,156
|
||||||
|
Restricted stock expense
|
285
|
194
|
253
|
|||||||||
|
Common stock issued to employees
|
—
|
286
|
—
|
|||||||||
|
Consultant compensation
|
111
|
22
|
59
|
|||||||||
|
Total
|
$
|
1,248
|
$
|
1,428
|
$
|
1,468
|
||||||
There was no net income tax benefit recognized in the consolidated statements of operations for share-based compensation arrangements as the Company fully offsets net deferred tax assets with a valuation allowance (see Note 11). In addition, the Company capitalized $85,000, $118,000 and $199,000 of stock based compensation to inventory for the fiscal years ended December 31, 2010, January 1, 2010 and January 2, 2009, respectively, and recognizes those amounts as expense in Cost of Sales as the inventory is sold.
Stock Option Plans
In fiscal year 2003, the Board of Directors approved the 2003 Omnibus Equity Incentive Plan (the “2003 Plan”) authorizing awards of equity compensation, including options to purchase common stock and restricted shares of common stock. The 2003 Plan amends, restates and replaces the 1991 Stock Option Plan, the 1995 Consultant Stock Plan, the 1996 Non-Qualified Stock Plan and the 1998 Stock Option Plan (the “Restated Plans”). Under provisions of the 2003 Plan, all of the unissued shares in the Restated Plans are reserved for issuance in the 2003 Plan. Each year the number of shares reserved for issuance under the 2003 Plan has been increased as necessary to provide that 2% of the total shares of common stock outstanding on the immediately preceding December 31 would be reserved for issuance,
up to a maximum of 1,586,371 additional shares, and a maximum total of 6,500,000 shares issuable under the 2003 Plan and all of the Restated Plans incorporated in it. The 6,500,000 maximum shares were reached on January 1, 2007. On May 19, 2010, the stockholders of STAAR approved the Restated 2003 Omnibus Plan, which increased the number of shares availale for grants under the Plan by 2,000,000 shares and extended the term of the plan to May 18, 2020.
Shares subject to grants under the 2003 Omnibus Plan and Restated Plans that lapse or terminate in accordance with their terms become available for new grants under the 2003 Omnibus Plan. As of December 31, 2010, approximately 2,451,362 shares were authorized and available for grants under the 2003 Omnibus Plan. The 2003 Plan provides for various forms of stock-based incentives. To date, of the available forms of awards under the 2003 Plan, the Company has granted only stock options and restricted stock. Options under the plan are granted at fair market value on the date of grant, become exercisable generally over a three- or four-year service period, or as determined by the Board of Directors, and expire over periods not exceeding 10 years from the date of grant. Certain option and share awards provide for
accelerated vesting if there is a change in control (as defined in the 2003 Plan). Restricted stock grants under the 2003 Plan generally vest over a period of one, three or four years. Pursuant to the plan, options for 3,168,974 shares were outstanding at December 31, 2010 with exercise prices ranging between $0.95 and $8.12 per share. There were 106,000 shares of restricted stock outstanding at December 31, 2010.
In fiscal year 1998, the Board of Directors approved the 1998 Stock Option Plan, authorizing the granting of options to purchase common stock or awards of common stock. Pursuant to the plan, options for 136,997 were outstanding at December 31, 2010 with exercise prices ranging between $3.60 and $3.81 per share. No further awards may be made under this plan.
In fiscal year 1995, the Company adopted the 1995 Consultant Stock Plan, authorizing the granting of options to purchase common stock or awards of common stock. Pursuant to this plan, options for 25,100 shares were outstanding at December 31, 2010 with an exercise price of $1.70 per share. No further awards may be made under this plan.
During the fiscal year ended December 31, 2010, officers, employees and others exercised 330,199 options from the 1995, 1998, and 2003 stock option plans at prices ranging from $0.95 to $6.25 resulting in net cash proceeds to the Company totaling $1,124,000.
During the fiscal year ended January 1, 2010, there was one inconsequential stock option exercise. During the fiscal year ended January 2, 2009, an outside consultant exercised 10,000 options from the 2003 Plan at an exercise price of $3.95 per option resulting in net cash proceeds to the Company totaling $39,500.
F-30
STAAR SURGICAL COMPANY AND SUBSIDIARIES
NOTES TO CONSOLIDATED FINANCIAL STATEMENTS
Years Ended December 31, 2010 and January 1, 2010
Assumptions
The fair value of each option award is estimated on the date of grant using a Black-Scholes option valuation model applying the assumptions noted in the following table. Expected volatilities are based on historical volatility of the Company’s stock. The Company uses historical data to estimate option exercise and employee termination behavior. The expected term of options granted is derived from the historical exercise activity over the past 15 years, and represents the period of time that options granted are expected to be outstanding. The Company has calculated a 10.24% estimated forfeiture rate used in the model for fiscal year 2010 option grants based on historical forfeiture experience. The risk-free rate for periods within the contractual life of the option is based on the U.S.
Treasury yield curve in effect at the time of grant.
|
Fiscal Year Ended
|
||||||||||||
|
December
31, 2010
|
January 1,
2010
|
January 2,
2009
|
||||||||||
|
Expected dividend yield
|
0
|
%
|
0
|
%
|
0
|
%
|
||||||
|
Expected volatility
|
80
|
%
|
74
|
%
|
62
|
%
|
||||||
|
Risk-free interest rate
|
2.13
|
%
|
1.92
|
%
|
2.87
|
%
|
||||||
|
Expected term (in years)
|
5.60
|
5.5
|
5.5
|
|||||||||
A summary of option activity under the Plans as of December 31, 2010 is presented below:
|
Options
|
Shares
(000’s)
|
Weighted-
Average
Exercise
Price
|
Weighted-
Average
Remaining
Contractual
Term
|
Aggregate
Intrinsic
Value
(000’s)
|
||||||||||||
|
Outstanding at January 1, 2010
|
3,743 | 5.36 | ||||||||||||||
|
Granted
|
745 | 4.63 | ||||||||||||||
|
Exercised
|
(330 | ) | 3.40 | |||||||||||||
|
Forfeited or expired
|
(827 | ) | 9.55 | |||||||||||||
|
Outstanding at December 31, 2010
|
3,331 | $ | 4.35 | 6.31 | $ | 6,432 | ||||||||||
|
Exercisable at December 31, 2010
|
2,446 | $ | 4.41 | 5.25 | 4,750 | |||||||||||
The weighted-average grant-date fair value of options granted during the fiscal years ended December 31, 2010, January 1, 2010, and January 2, 2009 was $3.13, $0.96 and $1.45 per option respectively. The total fair value of options vested during fiscal years ended December 31, 2010, January 1, 2010, and January 2, 2009 was $1,143,000, $1,194,000 and $1,716,000, respectively. The total intrinsic value of options exercised during the fiscal years ended December 31, 2010, January 1, 2010, and January 2, 2009 was $701,000, $1,000 and $13,000, respectively.
A summary of the Company’s non-vested options as of December 31, 2010 and changes during the period is presented below:
|
Nonvested Options
|
Options
(000’s)
|
Weighted-
Average
Grant Date
Fair Value
|
||||||
|
Nonvested at January 1, 2010
|
759 | $ | 1.84 | |||||
|
Granted
|
745 | 3.13 | ||||||
|
Vested
|
(562 | ) | 2.03 | |||||
|
Forfeited
|
(57 | ) | 2.12 | |||||
|
Nonvested at December 31, 2010
|
885 | $ | 2.89 | |||||
F-31
STAAR SURGICAL COMPANY AND SUBSIDIARIES
NOTES TO CONSOLIDATED FINANCIAL STATEMENTS
Years Ended December 31, 2010 and January 1, 2010
As of December 31, 2010, there was $1,881,000 of total unrecognized compensation cost related to non-vested share-based compensation arrangements granted under the Plans. That cost is expected to be recognized over a weighted-average period of 1.59 years.
The following table summarizes information about stock options outstanding and exercisable at December 31, 2010 (in thousands, except per share data):
|
Range of Exercise Prices
|
Number
Outstanding at
December 31,
2010
|
Options
Outstanding
Weighted-Average
Remaining
Contractual Life
|
Weighted-
Average
Exercise
Price
|
Number
Exercisable at
December 31,
2010
|
Weighted-
Average
Exercise
Price
|
||||||||||||
| $0.95 |
76
|
8.25 years
|
$
|
0.95
|
22
|
0.95
|
|||||||||||
| $1.56 to $2.30 |
512
|
7.05 years
|
$
|
2.15
|
445
|
$
|
2.14
|
||||||||||
| $2.45 to $3.60 |
441
|
7.79 years
|
$
|
3.15
|
207
|
$
|
2.78
|
||||||||||
| $3.75 to $5.29 |
1,289
|
5.52 years
|
$
|
4.20
|
987
|
$
|
4.07
|
||||||||||
| $5.39 to $7.32 |
816
|
6.64 years
|
$
|
6.07
|
588
|
$
|
6.23
|
||||||||||
| $7.50 to $8.12 |
197
|
4.01 years
|
$
|
7.93
|
197
|
$
|
7.93
|
||||||||||
|
3,331
|
6.31 years
|
$
|
4.35
|
2,446
|
$
|
4.41
|
|||||||||||
A summary of warrants to purchase Company stock issued to Broadwood as discussed under Note 9 as of December 31, 2010 is presented below:
|
Warrants
|
Shares
(000’s)
|
Weighted-
Average
Exercise
Price
|
Weighted-
Average
Remaining
Contractual
Term
|
Aggregate
Intrinsic
Value
(000’s)
|
||||||||||||
|
Outstanding at January 1, 2010
|
1,470
|
$
|
4.10
|
|||||||||||||
|
Granted
|
—
|
—
|
||||||||||||||
|
Exercised
|
—
|
—
|
||||||||||||||
|
Forfeited or expired
|
—
|
—
|
||||||||||||||
|
Outstanding at December 31, 2010
|
1,470
|
$
|
4.10
|
3.62
|
$
|
2,947
|
||||||||||
|
Exercisable at December 31, 2010
|
1,470
|
$
|
4.10
|
3.62
|
$
|
2,947
|
||||||||||
Note 15 — Commitments and Contingencies
Lease Obligations
The Company leases certain property, plant and equipment under capital and operating lease agreements. These leases vary in duration and many contain renewal options and/or escalation clauses. Current and long-term obligations under capital leases are included in total current liabilities and total long-term liabilities in the Company’s Consolidated Balance Sheets.
Estimated future minimum lease payments under leases having initial or remaining non-cancelable lease terms in excess of one year as of December 31, 2010 were approximately as follows (in thousands):
F-32
STAAR SURGICAL COMPANY AND SUBSIDIARIES
NOTES TO CONSOLIDATED FINANCIAL STATEMENTS
Years Ended December 31, 2010 and January 1, 2010
|
Fiscal Year
|
Operating
Leases
|
Capital
Leases
|
||||||
|
2011
|
$
|
2,246
|
$
|
938
|
||||
|
2012
|
2,081
|
763
|
||||||
|
2013
|
1,825
|
627
|
||||||
|
2014
|
1,824
|
68
|
||||||
|
2015
|
1,388
|
36
|
||||||
|
Thereafter
|
—
|
—
|
||||||
|
Total minimum lease payments
|
$
|
9,364
|
$
|
2,432
|
||||
|
Less amounts representing interest
|
—
|
(598
|
)
|
|||||
|
$
|
9,364
|
$
|
1,834
|
|||||
Rent expense was approximately $1.8 million, $2.2 million and $2.0 million for the years ended December 31, 2010, January 1, 2010 and January 2, 2009, respectively (adjusted for Domilens).
The Company had the following assets under capital lease at December 31, 2010 and January 1, 2010 (in thousands):
|
2010
|
2009(1)
|
|||||||
|
Machinery and equipment
|
$
|
3,385
|
$
|
2,342
|
||||
|
Furniture and fixtures
|
1,185
|
1,524
|
||||||
|
Leasehold improvements
|
133
|
103
|
||||||
|
4,703
|
3,969
|
|||||||
|
Less accumulated depreciation
|
3,033
|
2,367
|
||||||
|
$
|
1,670
|
$
|
1,602
|
|||||
(1)No adjustment has been made to fiscal 2009 consolidated balance sheet as a result of the Domilens divestiture completed on March 2, 2010
Depreciation expense for assets under capital lease for each of the years ended December 31, 2010, January 1, 2010, and January 2, 2009 was approximately $713,000, $1,020,000 and $848,000, respectively.
Indemnification Agreements
The Company has entered into indemnification agreements with its directors and officers that may require the Company: (a) to indemnify them against liabilities that may arise by reason of their status or service as directors or officers, except as prohibited by applicable law; (b) to advance their expenses incurred as a result of any proceeding against them as to which they could be indemnified; and (c) to make a good faith determination whether or not it is practicable for the Company to obtain directors’ and officers’ insurance. The Company currently has directors’ and officers’ liability insurance through a third party carrier.
Tax Filings
The Company’s tax filings are subject to audit by taxing authorities in jurisdictions where it conducts business. These audits may result in assessments of additional taxes that are subsequently resolved with the authorities or potentially through the courts. Management believes the Company has adequately provided for any ultimate amounts that are likely to result from these audits; however, final assessments, if any, could be significantly different than the amounts recorded in the consolidated financial statements.
F-33
STAAR SURGICAL COMPANY AND SUBSIDIARIES
NOTES TO CONSOLIDATED FINANCIAL STATEMENTS
Years Ended December 31, 2010 and January 1, 2010
Employment Agreements
The Company’s Chief Executive Officer and certain other officers have as provisions of their employment agreements certain rights, including continuance of cash compensation and benefits, upon a “change in control,” which may include an acquisition of substantially all of its assets, or termination “without cause or for good reason” as defined in the employment agreements.
Accrued Termination Benefits for Executive
On May 24, 2010, STAAR accrued $700,000 in executive termination benefit costs in connection with the notice of non-renewal given under an executive employment agreement. This accrual represents STAAR’s best estimate of the contractual termination benefits due to the executive. The actual amount ultimately paid may be different. The costs are to be paid over fifteen months beginning August 27, 2010. The balance of the accrual at December 31, 2010 is approximately $570,000.
Litigation and Claims
From time to time the Company is subject to various claims and legal proceedings arising out of the normal course of our business. These claims and legal proceedings relate to contractual rights and obligations, employment matters, and claims of product liability. STAAR maintains insurance coverage for product liability claims but may not be insured against other potentially material claims. While the Company does not believe that any of the claims known is likely to have a material adverse effect on its financial condition or results of operations, new claims or unexpected results of existing claims could lead to significant financial harm.
Note 16 — Related Party Transactions
The Company has related party transactions as discussed in Notes 9 and 13.
In addition to senior notes (see Note 9), the Company has made various advances to certain employees. Amounts due from employees included in prepaids, deposits, and other current assets at December 31, 2010 and January 1, 2010 were $93,000 and $15,000.
Note 17 — Supplemental Disclosure of Cash Flow Information
Interest paid was $981,000, $432,000 and $609,000 for the years ended December 31, 2010, January 1, 2010, and January 2, 2009, respectively. Income taxes paid amounted to approximately $1,362,000, $1,141,000 and $598,000 for the years ended December 31, 2010, January 1, 2010, and January 2, 2009, respectively.
The Company’s non-cash investing and financing activities were as follows (in thousands):
|
Non-cash investing activities and financing activities:
|
2010
|
2009
|
2008
|
|||||||||
|
Acquisition of Canon Staar
|
$
|
—
|
$
|
—
|
$
|
7,147
|
||||||
|
Applied 2007 advance payment on acquisition of Canon Staar
|
—
|
—
|
(4,000
|
)
|
||||||||
|
Applied 2007 deferred acquisition costs
|
—
|
—
|
(197
|
)
|
||||||||
|
Assets obtained by capital lease
|
940
|
690
|
1,014
|
|||||||||
|
Issuance of preferred stock
|
—
|
—
|
6800
|
|||||||||
|
Issuance and registration costs of preferred stock included in accounts payable and accrued liabilities
|
—
|
—
|
(17
|
)
|
||||||||
|
Common stock issued for services
|
—
|
424
|
—
|
|||||||||
|
Common stock issued in lieu of vacation
|
—
|
24
|
—
|
|||||||||
|
Warrants issued to Broadwood
|
—
|
290
|
—
|
F-34
STAAR SURGICAL COMPANY AND SUBSIDIARIES
NOTES TO CONSOLIDATED FINANCIAL STATEMENTS
Years Ended December 31, 2010 and January 1, 2010
Note 18 — Net Income (Loss) Per Share
The following is a reconciliation of the weighted average number of shares used to compute basic and diluted loss per share (in thousands):
|
2010
|
2009
|
2008
|
||||||||||
|
Basic weighted average shares outstanding
|
34,825
|
32,498
|
29,474
|
|||||||||
|
Diluted effect of stock options and warrants
|
—
|
—
|
—
|
|||||||||
|
Diluted weighted average shares outstanding
|
34,825
|
32,498
|
29,474
|
|||||||||
Potential common shares of 5.3 million (consisting of 3.8 million stock options, 1.5 million warrants), 6.7 million, and 6.0 million for the fiscal years ended December 31, 2010, January 1, 2010, and January 2, 2009, respectively, were excluded from the computation as the shares would have had an anti-dilutive effect.
Note 19 — Geographic and Product Data
The Company markets and sells its products in more than 50 countries and has manufacturing sites in the United States, Switzerland and Japan. Other than the United States, Japan, Korea, China, and Spain the Company does not conduct business in any country in which its sales in that country exceed 5% of consolidated sales. Sales are attributed to countries based on location of customers. The composition of the Company’s sales to unaffiliated customers is set forth below (in thousands):
|
2010
|
2009
|
2008
|
||||||||||
|
Net sales to unaffiliated customers
|
||||||||||||
|
United States
|
$
|
14,957
|
$
|
16,088
|
$
|
18,927
|
||||||
|
Japan
|
13,605
|
12,884
|
11,956
|
|||||||||
|
Korea
|
6,080
|
5,366
|
3,469
|
|||||||||
|
China
|
3,910
|
2,855
|
2,110
|
|||||||||
|
Spain
|
2,482
|
2,548
|
2,726
|
|||||||||
|
Others*
|
13,924
|
11,319
|
10,582
|
|||||||||
|
Total
|
$
|
54,958
|
$
|
51,060
|
$
|
49,770
|
||||||
*No other location individually exceeds 5% of total sales.
100% of the Company’s sales are generated from the ophthalmic surgical product segment and, therefore, the Company operates as one operating segment for financial reporting purposes. The Company’s principal products are IOLs used in cataract surgery and ICLs used in refractive surgery. The composition of the Company’s net sales by product line is as follows (in thousands):
Net Sales by Product Line
|
2010
|
2009
|
2008
|
||||||||||
|
IOLs
|
$
|
27,550
|
$
|
26,299
|
$
|
25,479
|
||||||
|
ICLs
|
24,300
|
21,046
|
18,090
|
|||||||||
|
Other Surgical Products
|
3,108
|
3,715
|
6,201
|
|||||||||
|
Total
|
$
|
54,958
|
$
|
51,060
|
$
|
47,770
|
||||||
F-35
STAAR SURGICAL COMPANY AND SUBSIDIARIES
NOTES TO CONSOLIDATED FINANCIAL STATEMENTS
Years Ended December 31, 2010 and January 1, 2010
The composition of the Company’s long-lived assets, consisting of property and equipment, between those in the United States, Germany (sold on March 2, 2010, see Note 2), Switzerland, Japan and Australia is set forth below (in thousands):
|
2010
|
2009
|
|||||||
|
Long-lived assets
|
||||||||
|
U.S.
|
$
|
1,318
|
$
|
1,507
|
||||
|
Germany(1)
|
—
|
1,171
|
||||||
|
Switzerland
|
967
|
806
|
||||||
|
Japan
|
1,429
|
1,435
|
||||||
|
Australia
|
18
|
86
|
||||||
|
Total
|
$
|
3,732
|
$
|
5,005
|
||||
(1)No adjustment has been made to fiscal 2009 consolidated balance sheet as a result of the Domilens divestiture completed on March 2, 2010
The Company sells its products internationally, which subjects the Company to several potential risks, including fluctuating exchange rates (to the extent the Company’s transactions are not in U.S. dollars), regulation of fund transfers by foreign governments, United States and foreign export and import duties and tariffs, and political instability.
Note 20 — Quarterly Financial Data (Unaudited)
Summary unaudited quarterly financial data from continuing operations for fiscal 2010 and 2009 is as follows (in thousands except per share data):
|
December 31, 2010
|
1st Qtr.
|
2nd Qtr.
|
3rd Qtr.
|
4th Qtr.
|
||||||||||||
|
Sales
|
$
|
13,778
|
$
|
13,639
|
$
|
13,152
|
$
|
14,389
|
||||||||
|
Gross profit
|
8,829
|
8,679
|
8,260
|
9,308
|
||||||||||||
|
Loss from continuing operations
|
(636
|
)
|
(1,628
|
)
|
(1,158
|
)
|
(691
|
)
|
||||||||
|
Income from discontinued operations, net of taxes
|
4,166
|
—
|
—
|
—
|
||||||||||||
|
Net income (loss)
|
3,530
|
(1,628
|
)
|
(1,158
|
)
|
(691
|
)
|
|||||||||
|
Loss per share from continuing operations, basic and diluted
|
(0.02
|
)
|
(0.05
|
)
|
(0.03
|
)
|
(0.02
|
)
|
||||||||
|
Income per share from discontinued operations, basic and diluted
|
0.12
|
—
|
—
|
—
|
||||||||||||
|
Net income (loss) per share
|
0.10
|
(0.05
|
)
|
(0.03
|
)
|
(0.02
|
)
|
|||||||||
|
January 1, 2010
|
1st Qtr.
|
2nd Qtr.
|
3rd Qtr.
|
4th Qtr.
|
||||||||||||
|
Sales
|
$
|
12,158
|
$
|
13,158
|
$
|
12,455
|
$
|
13,289
|
||||||||
|
Gross profit
|
7,655
|
7,971
|
7,512
|
8,185
|
||||||||||||
|
Loss from continuing operations
|
(2,229
|
)
|
(1,369
|
)
|
(1,834
|
)
|
(1,470
|
)
|
||||||||
|
Income (loss) from discontinued operations, net of taxes
|
567
|
281
|
(133
|
)
|
(13
|
)
|
||||||||||
|
Net loss
|
(1,662
|
)
|
(1,088
|
)
|
(1,967
|
)
|
(1,483
|
)
|
||||||||
|
Loss per share from continuing operations, basic and diluted
|
(0.08
|
)
|
(0.04
|
)
|
(0.05
|
)
|
(0.04
|
)
|
||||||||
|
Income (loss) per share from discontinued operations, basic and diluted
|
0.02
|
0.01
|
(0.01
|
)
|
0.00
|
|||||||||||
|
Net loss per share
|
(0.06
|
)
|
(0.04
|
)
|
(0.06
|
)
|
(0.04
|
)
|
||||||||
Quarterly and year-to-date computations of loss per share amounts are made independently. Therefore, the sum of the per share amounts for the quarters may not agree with the per share amounts for the year.
F-36
STAAR SURGICAL COMPANY AND SUBSIDIARIES
NOTES TO CONSOLIDATED FINANCIAL STATEMENTS
Years Ended December 31, 2010 and January 1, 2010
Significant Fourth Quarter Adjustments
During the fourth quarter of 2010, the Company did not record any significant adjustments.
During the fourth quarter of 2009, the Company recorded four significant adjustments. The first three adjustments were to reverse approximately $0.8 million in accrued legal judgments, included in other operating expenses (recovery), net $0.4 million in accrued legal fees, included in general and administrative expenses, and $0.5 million of accrued interest expense, included in interest expense, pursuant to the settlement of all outstanding litigation as more fully discussed in Notes 14 and 19. The fourth adjustment, which partially offset the first, was to record, in other operating expenses (recovery), net the cumulative impact to prior periods in the amount of $0.6 million related to certain patents which had shorter legal useful lives than originally estimated (see Note 1).
During the fourth quarter of 2008, the Company recorded two significant adjustments. First, the Company recorded an impairment loss of $1,023,000 related to certain patents that the Company determined were impaired pursuant to its review of long-lived assets (see Note 1). Second, the Company recorded expense of $4,900,000 related to the March 2, 2009 Parallax verdict as discussed in Note 14. Both fourth quarter adjustments are included in other general and administrative expenses as part of total operating loss on the consolidated statements of operations for the fiscal year ended 2008.
F-37
INDEPENDENT REGISTERED PUBLIC ACCOUNTING FIRM
REPORT ON SCHEDULE
To the Board of Directors
STAAR Surgical Company
Monrovia, CA
The audits referred to in our report dated March 2, 2011 relating to the consolidated financial statements of STAAR Surgical Company and Subsidiaries, which is contained in Item 8 of this Form 10-K, also included the audit of the financial statement schedule contained in Item 15. This financial statement schedule is the responsibility of the Company's management. Our responsibility is to express an opinion on the financial statement schedule based on our audits.
In our opinion such financial statement schedule, when considered in relation to the basic consolidated financial statements taken as a whole, presents fairly, in all material respects, the information set forth therein.
|
/s/ BDO USA, LLP
|
|
Los Angeles, California
|
|
March 2, 2011
|
F-38
STAAR SURGICAL COMPANY AND SUBSIDIARIES
SCHEDULE II — VALUATION AND QUALIFYING ACCOUNTS AND RESERVES
|
Column A
|
Column B
|
Column C
|
Column D
|
Column E
|
||||||||||||
|
Description
|
Balance at
Beginning
of Year
|
Additions
|
Deductions
|
Balance at
End of
Year
|
||||||||||||
|
(In thousands)
|
||||||||||||||||
|
2010
|
||||||||||||||||
|
Allowance for doubtful accounts and sales returns deducted from accounts receivable in balance sheet
|
$
|
1,332
|
$
|
410
|
$
|
319
|
$
|
1,423
|
||||||||
|
Deferred tax asset valuation allowance
|
50,801
|
888
|
—
|
51,689
|
||||||||||||
|
$
|
52,133
|
$
|
1,298
|
$
|
319
|
$
|
53,112
|
|||||||||
|
2009
|
||||||||||||||||
|
Allowance for doubtful accounts and sales returns deducted from accounts receivable in balance sheet
|
$
|
846
|
$
|
612
|
$
|
126
|
$
|
1,332
|
||||||||
|
Deferred tax asset valuation allowance
|
47,708
|
3,093
|
—
|
50,801
|
||||||||||||
|
$
|
48,554
|
$
|
3,705
|
$
|
126
|
$
|
52,133
|
|||||||||
|
2008
|
||||||||||||||||
|
Allowance for doubtful accounts and sales returns deducted from accounts receivable in balance sheet
|
$
|
684
|
$
|
335
|
$
|
173
|
$
|
846
|
||||||||
|
Deferred tax asset valuation allowance
|
45,419
|
2,289
|
—
|
47,708
|
||||||||||||
|
$
|
46,103
|
$
|
2,624
|
$
|
173
|
$
|
48,554
|
|||||||||
F-39