Attached files
| file | filename |
|---|---|
| EX-99.1 - CENTRAL VERMONT PUBLIC SERVICE CORP | ex99_1.pdf |
| 8-K - CENTRAL VERMONT PUBLIC SERVICE CORP | m311128k.htm |
Exhibit 99.1
CONFIDENTIAL TREATMENT REQUESTED:
INFORMATION FOR WHICH CONFIDENTIAL TREATMENT HAS BEEN REQUESTED IS OMITTED
AND MARKED WITH “*******” OR OTHERWISE CLEARLY INDICATED. AN UNREDACTED VERSION
AND MARKED WITH “*******” OR OTHERWISE CLEARLY INDICATED. AN UNREDACTED VERSION
OF THIS DOCUMENT HAS ALSO BEEN PROVIDED TO THE SECURITIES AND EXCHANGE COMMISSION.
2/25/11
CVPS-Omya-DPS MOU SETTLEMENT TERM SHEET
This term sheet (this “MOU”) describes terms and conditions for an MOU in Docket No. 7660 among CENTRAL VERMONT PUBLIC SERVICE CORPORATION (“CVPS”), OMYA, INC. (“Omya”), the VERMONT DEPARTMENT OF PUBLIC SERVICE (the “DPS”) and the TOWN OF PROCTOR (the “Town”), concerning the sale of assets of the Vermont Marble Power Division of Omya (“VMPD”) to CVPS.
|
1.
|
Purchase and Sale Agreement. The terms and provisions of this MOU are intended to supplement (and not supersede or replace, except to the extent otherwise expressly provided herein) the terms and provisions of that certain Purchase and Sale Agreement dated as of April 30, 2010 by and between CVPS and Omya (the “PSA”). All words and phrases defined in the PSA shall have the same meaning herein unless specifically defined herein. Promptly following the execution of this MOU by each of the parties hereto, Omya and CVPS shall endeavor to amend and restate the PSA to reflect, in a form satisfactory to each of Omya and CVPS (each in their sole and absolute discretion), the terms and provisions of this MOU, including additional terms in order to fully integrate the agreements herein (the “PSA Amendment”). It is understood and agreed that this MOU, as it relates to the sale of the VMPD Assets by Omya to CVPS, shall not be binding on Omya or CVPS unless and until, and only if and to the extent, such a mutually acceptable PSA Amendment reflecting such terms shall have been executed by each of Omya and CVPS; provided that paragraph 5 (second sentence) and paragraphs 12 through 19 shall be binding upon the signing of this MOU by each of CVPS, Omya and the DPS.
|
|
2.
|
Purchase Price for VMPD Assets. Section 2.2 of the PSA will be amended to provide that Omya will sell to CVPS, and CVPS will purchase from Omya, (a) the hydro assets of VMPD, as identified pursuant to the PSA (the “Hydro Assets”), for the sum of Twenty-Eight Million Two Hundred and Fifty Thousand Dollars ($28,250,000.00) (the “Purchase Price of the Hydro Assets”) and (b) all the remaining VMPD Assets identified pursuant to the PSA (including the transmission and distribution assets identified pursuant to the PSA (the “T&D Assets”)) at Net Book Value, Pro-forma Net Book Value, cost or for no additional price, as applicable and as set forth in the PSA (estimated to be approximately One Million Dollars or “$1,000,000”). The PSA will also be amended to provide that Omya will sell to CVPS, and CVPS will purchase from Omya, all of the vehicles and equipment, inventory and tools of VMPD reflected on a schedule previously furnished by Omya to CVPS (i.e., CVPS will not have an option to exclude any of these assets described on any such schedule from the transaction) and, subject to CVPS review of an updated statement that describes the plant to be purchased hereunder reflecting the book value of such plant as of December 31, 2010 to be tendered to CVPS as of the execution of this MOU, additional assets not reflected on such schedules.
|
1
|
3.
|
Omya Repayment Obligation for Rate Phase-In Plan. A new section will be added to the PSA pursuant to which Omya will agree to deposit in a separate CVPS interest-bearing account (the “Omya Repayment Obligation Account”), at the Closing, an aggregate amount equal to five percent (5%) of the difference between (i) the Net Book Value and Pro- forma Net Book Value of the Hydro Assets and (ii) the Purchase Price of the Hydro Assets (the “Aggregate Omya Repayment Amount”) (estimated to be approximately $1,125,000) to fund, subject to paragraph 4 below, a rate phase-in plan (the “Rate Phase-In Plan”) for the benefit of existing VMPD residential customers (“Existing VMPD Residential Customers”) as of the Closing Date and to fund a settlement fee of up to $11,000 to reimburse the Town for its reasonable attorney’s fees for its participation in Docket 7660. The Town and the DPS will be notified of the actual Aggregate Omya Repayment Amount upon Closing. Any interest that accrues and earnings in respect of amounts in the Omya Repayment Obligation Account will remain in the Omya Repayment Obligation Account.
|
|
4.
|
Rate Phase-In Plan. The Rate Phase-In Plan will include the following principal components:
|
|
|
§
|
CVPS will implement the Rate Phase-In Plan over approximately five years, in six steps (the “Rate Phase-In Period”).
|
|
|
§
|
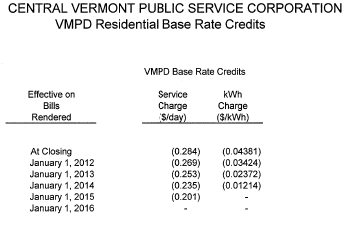
During the Rate Phase-In Period, CVPS will implement a series of base rate credits (the “Base Rate Credits”) as specified in the Exhibit entitled “Central Vermont Public Service Corporation – VMPD Residential Rate Credits/Central Vermont Public Service Corporation - Town of Proctor Residential Phase-In Plan” attached hereto and incorporated herein by this reference which will be applied to the CVPS Rate 1 service charge and the kWh charge applicable to Existing VMPD Residential Customers’ accounts. The Base Rate Credits will be based on the difference between the current VMPD Residential Rate 1 and CVPS’s Residential Rate 1 base rates as of January 1, 2011.
|
|
|
§
|
Taking into account these Base Rate Credits, the rates charged to Existing VMPD Residential Customers will result in no more than a 10% overall rate increase per year during the Rate Phase-In Period (based on January 1, 2011 rates) as shown in the “Central Vermont Public Service Corporation - Town of Proctor Residential Phase-In Plan” Exhibit. Existing VMPD Residential Customers’ accounts will, however, be subject to all future base rate increases or decreases and any PCAM/ESAM rate adjustments that take place subsequent to Closing.
|
|
|
§
|
The first step of the Rate Phase-In Plan will occur at Closing and will result in the elimination of the VMPD seasonal and block structure rate design. The first step will effectively maintain rates to Existing VMPD Residential Customers’ accounts at current levels by maintaining the VMPD service charge of $4.58 and converting the base rate kWh charge to $0.09567/kWh (the “Step 1 Adjustments”) after application of the first Base Rate Credits. The effective date of the rate changes after the Step 1 Adjustments shall occur annually on a bills rendered basis effective January 1st of each subsequent year (“Subsequent Adjustments”).
|
2
|
|
§
|
Promptly following the commencement of each calendar year during the Rate Phase-In Period, there shall be disbursed from the available Aggregate Omya Repayment Amount (if any) remaining in the Omya Repayment Obligation Account (the “Remaining Omya Funds”) an amount in cash equal to the aggregate amount of Base Rate Credits expected to be provided by CVPS to Existing VMPD Residential Customers’ accounts during such calendar year; provided that, for the avoidance of doubt, Omya’s sole responsibility in respect of the Rate Phase-In Plan shall be to fund the Omya Repayment Obligation Account at Closing with the Aggregate Omya Repayment Amount. CVPS will report to the Department, the Town and the Board on the status of the Remaining Omya Funds promptly at the start of each calendar year, and in no event any later than January 15th of each year.
|
|
|
§
|
Any Remaining Omya Funds in the Omya Repayment Obligation Account upon expiration of the Rate Phase-In Period shall be for the benefit of all customers. In no event shall Omya be responsible to pay more than the Aggregate Omya Repayment Amount or CVPS shareholders be responsible to fund the Base Rate Credits. In addition, if the Remaining Omya Funds are exhausted prior to full implementation of the Rate Phase-In, the Rate Phase-In shall end; in no event shall CVPS ratepayers fund the Rate Phase-In.
|
|
|
§
|
The Base Rate Credits shall apply only to Existing VMPD Customers’ accounts. Any new accounts established after the Closing Date (including any move by an Existing VMPD Residential Customer to a new account premises) shall be subject to CVPS’s normal tariff rates in effect from time to time.
|
|
|
§
|
Any revenue credited through the Base Rate Credits shall not be imputed to CVPS’s shareholders during base rate proceedings.
|
|
5.
|
CVPS Rate Base. CVPS agrees that its rate base for ratemaking purposes shall be Twenty-Seven Million Dollars ($27,000,000.00) in respect of the Hydro Assets plus the Net Book Value or Pro Forma Net Book Value, as applicable, in respect of the T&D Assets. DPS agrees to support the inclusion of said amounts in CVPS’s cost of service and rate base for ratemaking purposes which amounts will qualify for treatment under the capital expense adder included in the company’s Alternative Regulation Plan (“ARP”), currently codified at Section II.A.5.ii.2. CVPS and the DPS further agree that any additional capital investments that CVPS will make in connection with the consolidation of the VMPD service area and acquisition of the VMPD assets (e.g., new substation, hydro facility refurbishments, etc…) will qualify for capital expense adder treatment under the CVPS ARP.
|
3
|
6.
|
Rates Applicable to Omya Verpol Plant. Section 3.5 of the PSA will be amended to provide that, at the Closing, Omya’s Verpol Plants in Florence, Vermont (the “Verpol Plants”) will become a customer of CVPS, and Omya will agree to take service under CVPS’s Rate 5 tariff for a period of six (6) years after the Closing (the “Rate 5 Tariff Period”). During the Rate 5 Tariff Period, Omya will not seek a separate tariff arrangement for the Verpol Plants. Notwithstanding the foregoing, nothing herein shall prevent Omya from seeking to initiate or intervene in rate proceedings before the Board involving the Rate 5 Tariff consistent with applicable Board rules and precedent. However, during the Rate 5 Tariff Period, Omya may not seek a reduction specific to the Rate 5 Tariff to the extent premised on savings or economies of scale specific to serving the Omya loads realized as a result of the Transaction. Nothing herein shall prevent CVPS from changing generally applicable base rates, generally applicable adjustment charges (e.g., PCAM, ESAM), or any other generally applicable surcharges or efficiency utility charges. Such generally applicable changes shall apply to Omya.
|
|
7.
|
Value Sharing Arrangement. The PSA will be amended to include an excess value sharing mechanism (the “Value Sharing Arrangement”) in which the excess value received by CVPS on account of the power produced by the VMPD Facilities (the “Excess Value”) will be shared among (i) CVPS’s shareholders, (ii) Omya, and (iii) all of CVPS’s then existing customers, subject to the following terms and conditions:
|
|
|
i.
|
Determination of Value Sharing Pool. In each year throughout the term of the Value Sharing Arrangement, CVPS shall identify the actual value of the output of the VMPD hydro assets which shall include the value of energy and capacity. In addition, CVPS shall identify the value of any renewable energy credits, ISO-NE Generation Information System certificates, and other tradeable environmental attributes arising in connection with any incremental production from the VMPD hydro assets available on account of investments made by CVPS to said hydro assets. From the sum of these two values CVPS shall subtract the comparable values included in the CVPS analysis appended to this MOU1. This Excess Value difference, if a positive value, shall constitute the “Value Sharing Pool”. If said difference is a negative value, the Value Sharing Pool shall be set at $0 in that year.
|
|
|
ii.
|
CVPS Shareholder Value Sharing Methodology. In any year in which there is a positive value in the Value Sharing Pool, CVPS shareholders shall be entitled to receive an amount equal to one third (33.3 percent) of the Value Sharing Pool until CVPS shareholders have received $1,250,000 on a cumulative present value basis in 2011 dollars (as the same may be reduced pursuant to Section 8, the “CVPS Shareholder Value Sharing Cap”). Any amounts received by CVPS shareholders pursuant to this mechanism shall be excluded from any earnings sharing mechanism in effect for the company pursuant to an alternative regulation plan or otherwise.
|
1 This analysis reflects a $23.8 million present value.
4
|
|
iii.
|
Omya Value Sharing Methodology. In any year in which there is a positive value in the Value Sharing Pool, Omya shall be entitled to receive an amount equal to one third (33.3 percent) of the Value Sharing Pool until Omya has received $2,000,000 on a nominal basis in 2011 dollars (the “Omya Value Sharing Cap”). Payment to Omya will be reduced by five percent, and that amount will be placed in the Omya Repayment Obligation Account, if a payment to Omya occurs during the Rate Phase-In Period. Any amounts paid to the Omya Repayment Obligation Account shall be included when calculating the remaining amount of the OMYA Value Sharing Cap. Payments to Omya will also be adjusted based on the ratio of pre-upgrade projected output to post-upgrade projected output in accordance with the Value Sharing Arrangement spreadsheet attached to this MOU.
|
|
|
iv.
|
CVPS’s Then Existing Customer Value Sharing Methodology. In any year in which there is a positive value in the Sharing Pool, CVPS’s then existing customers will continue to realize the remainder amount after amounts due to CVPS shareholders and Omya have been removed. In no year in which the Sharing Pool has a positive value will the value realized by CVPS’s then existing customers be less than one third (33.3 percent) of the Sharing Pool.
|
|
|
v.
|
Effect of Reaching the Value Sharing Cap. To the extent that either CVPS or Omya shall receive amounts under the Value Sharing Arrangement that equal their respective Value Sharing Caps, amounts remaining in the Value Sharing Pool shall be shared equally between the remaining participants in the Value Sharing Arrangement subject to the methodologies described above (e.g., should CVPS reach its Value Sharing Cap, Omya would receive fifty percent (50%) of the Value Sharing Pool).
|
|
|
vi.
|
Reporting. CVPS, Omya and the DPS shall develop a mutually agreeable reporting mechanism to enable all parties to review and audit the implementation of the Value Sharing Arrangement.
|
|
|
vii.
|
Tender of Value Sharing Pool Amounts. Within thirty (30) days of the close of each year, CVPS shall tender any Value Sharing Pool amounts due to Omya.
|
|
|
viii.
|
Term. The term of the Value Sharing Arrangement is 15 years from the date of closing.
|
|
8.
|
CVPS Shareholders’ Value Sharing Cap Adjustment. Notwithstanding the foregoing paragraph 7, the CVPS Shareholder Value Sharing Cap under the VMPD Value Sharing Arrangement is predicated on the assumption that CVPS will be able to cost-effectively increase the nameplate capacity of the Proctor, Center Rutland, Huntington and Belden Stations, to a total of 21.5 MW. In the event that CVPS is unable to obtain a total of 21.5 MW of capacity for any reason, except for operating constraints requested or imposed by the State of Vermont or FERC, or the State of Vermont or FERC’s failure to act on a CVPS licensing request in a timely manner, then the CVPS Shareholder Value Sharing Cap will be reduced pro rata based on the actual amount of nameplate capacity it is able to obtain These pro rata reductions in CVPS’s allocation will begin in Year 3 and will continue through Year 15, as appropriate. The annual reductions, if any, will be based on the then-applicable capacity of the units.
|
5
|
9.
|
New Initiative Adder. CVPS and the DPS agree that the cost of service impacts of the acquisition of the VMPD assets by CVPS and consolidation of the VMPD service area with the CVPS service area qualifies for treatment as a New Initiative Adder under CVPS’s Alternative Regulation Plan. The objective of treating this acquisition and consolidation project under the new initiative adder is to permit CVPS to recover the agreed upon incremental operations and maintenance expenses. CVPS and the DPS will support the issuance of such approvals from the Public Service Board as are necessary to allow cost recovery under the CVPS ARP for the incremental operation and maintenance costs associated with the acquisition, including adjustments to the company’s 2012 base rates to account for the fact that said acquisition will occur sometime in 2011 if this MOU is approved.
|
|
10.
|
Amortization Schedule; Accounting Mechanisms. The DPS and CVPS agree to a term for amortization of the “acquisition adjustment” such that the ratemaking treatment for the acquisition of the VMPD assets and consolidation of the service areas occur in as close as reasonably possible to a rate neutral manner.3 CVPS and DPS shall inform the Board as to the specific amortization schedule developed to meet this standard, and shall develop appropriate accounting mechanisms for the acquisition adjustment and the implementation of the sharing mechanism established under paragraph 7 above.
|
|
11.
|
Changes to Closing Conditions Under PSA; “Burdensome Proposal”. Section 6.5 of the PSA will be amended so as not to include “approval of the recovery of the Purchase Price and cost recovery for the Transferred Employees and new employees, for an aggregate of three (3) persons, required to operate the four hydroelectric stations included in the VMPD Assets” but to include exemption from the hiring constraint agreed to in Docket 7496 for those employees. In addition, the defined term “Burdensome Proposal” in the PSA will be amended and restated in its entirety to read as follows: “‘Burdensome Proposal’ is (i) with respect to Buyer, a condition, requirement, settlement offer, memorandum of understanding, proposal for decision, Order, or any other formal proposal from a Governmental Body not anticipated by Buyer, which after the expiration of a fifteen (15) day period during which the parties engaged in good faith negotiation with the applicable Governmental Body, if accepted or imposed, is reasonably likely to cause a Material Adverse Effect on Buyer, including for purposes of this definition the rendering of the transactions contemplated herein materially uneconomic or materially detrimental from a managerial or long-term perspective to Buyer, and (ii) with respect to Seller, a condition, requirement, settlement offer, memorandum of understanding, proposal for decision, Order, or any other formal proposal from a Governmental Body that differs in any respect (without regard to materiality) from the terms set forth in this Agreement and that certain Memorandum of Understanding, dated as of February 25, 2011, among Buyer, Seller, the Vermont Department of Public Service and the Town of Proctor.”
|
2 For example, if after redevelopment of all the hydro facilities has been completed and after all operating conditions of the new FERC License have been implemented the new total nameplate capacity is 19.3 MW, CVPS’s sharing opportunity would be reduced by 1 – (19.3/21.5), or 10 %.
3 The term “acquisition adjustment” refers to CVPS’s recording to account 114 Electric Plant acquisition Adjustment the difference between the allowed purchase price of the VMPD assets allowed to be included in rate base and their net book value, the incremental maintenance costs incurred in bringing the acquired VMPD plant assets up to CVPS’s standards and the net book value of the acquired VMPD plant assets that are retired and reconstructed. Account 114 will be amortized to cost of service at the time of CVPS’s next retail rate proceeding. The amortization will be included in the cost of service and the unamortized balance in account 114 will be included in rate base in CVPS’s next retail rate proceeding.
6
|
12.
|
Service Area Alteration. The DPS agrees to support the issuance of an order by the Public Service Board approving the alteration of VMPD’s service territory by combining the same with the service territory of CVPS, and thereupon the abandonment by VMPD of its provision of public service.
|
|
13.
|
Staffing Level Adjustments. CVPS and the DPS agree to support the issuance of an order by the Public Service Board amending the final Order issued in the Docket No. 7496 Staffing Levels Investigation to allow CVPS to add three (3) full-time equivalent employees to the previously –approved employee level targets in that docket.
|
|
14.
|
VMPD Abandonment of Service. Omya and the DPS agree to support the issuance of an order by the Vermont Public Service Board authorizing VMPD to surrender its Certificate of Public Good pursuant to 30 V.S.A. §§ 102(c) and 231(a), and to cease the provision of service subject to regulation.
|
|
15.
|
C&I Customer Credit Program. Omya and the DPS agree to support the issuance of an order by the Vermont Public Service Board allowing Omya to enter the C&I Customer Credit Program available in all service territories as approved by the Board in Docket No. 5980 or is successor.
|
|
16.
|
Billing Inserts. CVPS agrees that it will collaborate with the DPS and the Town on language to be included in its Billing Inserts for existing VMPD customers to describe the Rate Phase in Plan.
|
|
17.
|
Agreement to Advocate for Approval. Each of CVPS, Omya, the DPS and the Town (the “Parties”) agree to advocate for approval of the Petition, including the transactions contemplated by the PSA, as modified by this MOU (collectively, the “Transaction”) and shall not offer into evidence at any hearing convened to consider this MOU prefiled testimony or other evidence contrary to the terms and conditions hereof. Omya and CVPS have disclosed all material information, and will continue to do so up until the time of the issuance of a Board Order on the MOU. Notwithstanding the foregoing commitment, the DPS shall support this MOU and issuance of the orders contemplated herein to the extent consistent with its obligations under Title 30, Vermont Statutes Annotated.
|
7
|
18.
|
Precedential Effect. The Parties agree that the Transaction and any Order approving the Transaction relate only to the Parties and the transaction contemplated by the PSA, as modified herein, and should not be construed by any party or tribunal as having precedential or any other impact on other proceedings. The Parties have made compromises on specific issues to reach this MOU. This MOU and any Order approving the Transaction shall not be construed by any party or tribunal as having precedential impact on any future proceedings involving the Parties except as necessary to ensure implementation of the PSA, as modified by this MOU, or to enforce an order of the Board resulting from the PSA, as modified by this MOU. The Parties reserve the right in future proceedings to advocate positions that differ from those set forth in the PSA, as modified by MOU, and, in any future proceeding, the PSA, as modified by this MOU, and any Order referring or relating thereto may not be used against any party except as necessary to enforce obligations under the PSA, as modified by this MOU, or to enforce an order of the Board resulting from the PSA, as modified by this MOU.
|
|
19.
|
Effect of Failure to Approve Transaction; Termination. The Parties agree that, should the Board fail to approve the Transaction in its entirety by May 16, 2011, the agreements set forth herein and in the PSA shall be terminable by notice from CVPS or Omya with a copy of said notice sent to DPS and the Town.
|
|
|
a.
|
For the avoidance of doubt, and notwithstanding the definition of “Burdensome Proposal” contained in the PSA and without limiting any of Omya’s or CVPS’s other rights, Omya and CVPS shall each have the right, exercisable in their sole and absolute discretion, to terminate the PSA and all of their obligations thereunder if the Board fails to approve the Transaction in its entirety by May 16, 2011 for any reason.
|
|
|
b.
|
In addition, each of Omya and CVPS shall have the right, exercisable in their sole and absolute discretion, to abandon the Transaction and terminate the PSA, as modified by this MOU, if either (i) the DPS and the Town have failed to execute this MOU by February 25, 2011, or (ii) a mutually acceptable PSA Amendment has not been executed by each of Omya and CVPS within seven (7) calendar days after the execution of this MOU by each of CVPS, Omya and the DPS. Section 9.1(b) of the PSA shall be amended to reflect the foregoing termination provisions, it being agreed that the concept of an “Extended Regulatory Period” shall not be included in the PSA Amendment.
|
|
|
c.
|
Further, to the extent necessary or desirable, the Parties shall have the right, but not the obligation, to submit pre-filed testimony on all issues addressed by the PSA, as modified by this MOU.
|
|
|
d.
|
The Parties agree that should the Board fail to approve this MOU without material change or condition, the Parties’ agreements set forth herein shall terminate and the Parties shall be placed in the position that each enjoyed in this proceeding before entering into the MOU. In such event, the Parties’ agreements in this MOU shall not be construed by any Party, tribunal, or other entity as having precedential impact on any testimony or positions which may be advanced in this proceeding, shall not constitute any part of the record in this proceeding and shall not be used for any other purpose. Subject to Section 18(a) above, in the event the Board conditionally approves this MOU and no Party objects, within ten (10) business days, to any conditions imposed by the Board, then this MOU as amended shall be deemed approved as if approved in its entirety by the Board.
|
8
|
20.
|
Section Headings. The headings of the various sections of this MOU are for convenience of reference only and shall not modify, define or limit any of the terms or provisions of this MOU.
|
|
21.
|
The Parties agree that this MOU shall have no precedential value nor shall it be used in any future proceeding, except a future proceeding to enforce the terms and conditions herein or in any Board Order approving this MOU.
|
|
22.
|
The Parties waive their rights under 3 V.S.A. § 811 to file written comments or present oral argument with respect to the Hearing Officer’s proposal for decision in this matter, provided such proposal for decision is consistent in all respects with this MOU and proposes that the Board approve this MOU in its entirety.
|
|
23.
|
Based on the foregoing agreements, the Parties request that the Board approve this MOU in its entirety without material change or condition, as the full and final resolution of the claims presented in this proceeding.
|
|
24.
|
Counterparts. This MOU may be executed by one or more parties on any number of separate counterparts, each of which when so executed and delivered shall be an original, but all such counterparts shall together constitute but one and the same document. All signatures need not be on the same counterpart. Facsimile or electronic signature and delivery of this MOU shall be considered an original and binding obligation upon the parties for all purposes.
|
|
|
[signature page follows]
|
9
The parties hereto have caused this MOU to be executed by their respective duly authorized officers, as of the 25th day of February, 2011.
|
Central Vermont Public Service
Corporation
|
|||
|
|
By:
|
/s/ Joseph M. Kraus | |
| Joseph M. Kraus | |||
|
Senior Vice President –
|
|||
|
Engineering and Operations
|
|||
|
Omya, Inc.
|
|||
|
|
By:
|
/s/ Anthony Colak | |
| Name: | Anthony Colak | ||
| Title: |
CEO
|
||
|
|
By:
|
/s/ M. Phillips | |
| Name: | M. Phillips | ||
| Title: |
CFO
|
||
|
Vermont Department of Public Service
|
|||
|
|
By:
|
/s/ Sarah Hoffman | |
| Name: | Sarah Hoffman | ||
| Title: |
Director for Public Advocacy
|
||
|
Town of Proctor
|
|||
|
|
By:
|
/s/ Alan B. George | |
| Name: | Alan B. George | ||
| Title: |
Counsel to the Town
|
||
10
Central Vermont Public Service Corporation - VMPD Residential Rate Credits/
Central Vermont Public Service Corporation - Town of Proctor Residential Phase-In Plan
11
12

13
Value Sharing Arrangement Attachment
14
|
Annual O&M and cap Adds for VMPD Hydro Facilities, Post Acquisition.
|
|||||||||||||||||||||||||
|
REGULATORY COMPLIANCE
|
2010
|
2011
|
2012
|
2013
|
2014
|
2015
|
2016
|
2017
|
2018
|
2019
|
2020
|
2021
|
2022
|
2023
|
2024
|
2025
|
2026
|
2027
|
2028
|
2029
|
2030
|
2031
|
|||
|
Capital Costs (000's)
|
|||||||||||||||||||||||||
|
FISHWAYS
|
0
|
0
|
0
|
0
|
0
|
0
|
0
|
0
|
0
|
0
|
0
|
0
|
0
|
0
|
0
|
0
|
0
|
0
|
0
|
0
|
0
|
0
|
|||
|
CULTURAL RESOURCE ISSUES
|
0
|
0
|
0
|
0
|
0
|
0
|
0
|
0
|
0
|
0
|
0
|
0
|
0
|
0
|
0
|
0
|
0
|
0
|
0
|
0
|
0
|
0
|
|||
|
LAND MANAGEMENT ISSUES
|
0
|
0
|
0
|
0
|
0
|
0
|
0
|
0
|
0
|
0
|
0
|
0
|
0
|
0
|
0
|
0
|
0
|
0
|
0
|
0
|
0
|
0
|
|||
|
RECREATIONAL FACILITIES
|
0
|
0
|
0
|
250
|
0
|
0
|
0
|
0
|
0
|
0
|
0
|
0
|
0
|
0
|
0
|
0
|
0
|
0
|
0
|
0
|
0
|
0
|
|||
|
CIVIL/STRUCTURAL
|
0
|
0
|
0
|
175
|
0
|
0
|
0
|
0
|
0
|
0
|
0
|
0
|
0
|
0
|
0
|
0
|
0
|
0
|
0
|
0
|
0
|
0
|
|||
|
WATER QUALITY
|
0
|
0
|
0
|
0
|
0
|
0
|
0
|
0
|
0
|
0
|
0
|
0
|
0
|
0
|
0
|
0
|
0
|
0
|
0
|
0
|
0
|
0
|
|||
|
FERC LICENSING CAPITAL
|
0
|
75
|
150
|
0
|
0
|
0
|
0
|
0
|
0
|
0
|
0
|
0
|
85
|
85
|
85
|
0
|
0
|
0
|
0
|
0
|
0
|
0
|
|||
|
OTHER
|
0
|
0
|
0
|
300
|
0
|
0
|
0
|
0
|
0
|
0
|
0
|
0
|
0
|
0
|
0
|
25
|
25
|
0
|
0
|
0
|
0
|
0
|
|||
|
OTHER
|
0
|
0
|
0
|
0
|
0
|
0
|
0
|
0
|
0
|
0
|
0
|
0
|
0
|
0
|
0
|
0
|
0
|
0
|
0
|
0
|
0
|
0
|
|||
|
Sub-Total Capital Costs (escalated, with RRF)
|
0
|
107
|
221
|
1,093
|
0
|
0
|
0
|
0
|
0
|
0
|
0
|
0
|
155
|
159
|
163
|
49
|
50
|
0
|
0
|
0
|
0
|
0
|
|||
|
Expenses (Annual Costs) (000's)
|
|||||||||||||||||||||||||
|
FISHWAYS
|
0
|
0
|
0
|
0
|
0
|
0
|
0
|
0
|
0
|
0
|
0
|
0
|
0
|
0
|
0
|
0
|
0
|
0
|
0
|
0
|
0
|
0
|
|||
|
CULTURAL RESOURCE ISSUES
|
0
|
0
|
0
|
60
|
40
|
15
|
15
|
15
|
15
|
15
|
15
|
15
|
15
|
15
|
15
|
15
|
15
|
15
|
15
|
15
|
15
|
15
|
|||
|
LAND MANAGEMENT ISSUES
|
0
|
0
|
0
|
0
|
0
|
0
|
0
|
0
|
0
|
0
|
0
|
0
|
0
|
0
|
0
|
0
|
0
|
0
|
0
|
0
|
0
|
0
|
|||
|
RECREATIONAL FACILITIES
|
0
|
0
|
0
|
0
|
0
|
0
|
0
|
0
|
0
|
0
|
0
|
0
|
0
|
0
|
0
|
0
|
0
|
0
|
0
|
0
|
0
|
0
|
|||
|
CIVIL/STRUCTURAL
|
0
|
0
|
0
|
0
|
0
|
0
|
0
|
0
|
0
|
0
|
0
|
0
|
0
|
0
|
0
|
0
|
0
|
0
|
0
|
0
|
0
|
0
|
|||
|
WATER QUALITY
|
0
|
0
|
0
|
0
|
0
|
0
|
0
|
0
|
0
|
0
|
0
|
0
|
0
|
0
|
0
|
0
|
0
|
0
|
0
|
0
|
0
|
0
|
|||
|
FIXED COMPLIANCE &ADMINISTRATION COSTS
|
0
|
0
|
0
|
150
|
75
|
30
|
15
|
15
|
15
|
15
|
15
|
15
|
15
|
15
|
15
|
15
|
15
|
15
|
15
|
15
|
15
|
15
|
|||
|
OTHER
|
5
|
5
|
5
|
5
|
5
|
5
|
5
|
5
|
5
|
5
|
5
|
5
|
5
|
5
|
5
|
5
|
5
|
5
|
5
|
5
|
5
|
5
|
|||
|
OTHER
|
0
|
0
|
0
|
0
|
0
|
0
|
0
|
0
|
0
|
0
|
0
|
0
|
0
|
0
|
0
|
0
|
0
|
0
|
0
|
0
|
0
|
0
|
|||
|
Sub-Total Expenses (escalated)
|
5
|
5
|
5
|
240
|
132
|
57
|
41
|
42
|
43
|
44
|
45
|
46
|
47
|
48
|
49
|
51
|
52
|
53
|
55
|
56
|
57
|
59
|
|||
|
PRODUCTION PLANT
|
2010
|
2011
|
2012
|
2013
|
2014
|
2015
|
2016
|
2017
|
2018
|
2019
|
2020
|
2021
|
2022
|
2023
|
2024
|
2025
|
2026
|
2027
|
2028
|
2029
|
2030
|
2031
|
|||
|
Capital Costs (000's)
|
|||||||||||||||||||||||||
|
ELECTRICAL-Generator
|
0
|
0
|
0
|
250
|
150
|
0
|
0
|
0
|
0
|
0
|
0
|
0
|
0
|
0
|
0
|
0
|
0
|
0
|
0
|
0
|
0
|
0
|
|||
|
ELECTRICAL-Transformer & Substation
|
0
|
0
|
750
|
500
|
200
|
0
|
0
|
0
|
0
|
0
|
0
|
0
|
0
|
0
|
0
|
0
|
0
|
0
|
0
|
0
|
0
|
0
|
|||
|
ELECTRICAL- Switches & Relays
|
0
|
150
|
2,000
|
1,500
|
0
|
0
|
0
|
0
|
0
|
0
|
0
|
0
|
0
|
0
|
0
|
0
|
0
|
0
|
0
|
0
|
0
|
0
|
|||
|
AUTOMATION
|
0
|
0
|
0
|
0
|
0
|
0
|
0
|
0
|
0
|
0
|
0
|
0
|
0
|
0
|
0
|
0
|
0
|
0
|
0
|
0
|
0
|
0
|
|||
|
MECHANICAL
|
0
|
0
|
2,500
|
1,250
|
750
|
0
|
0
|
0
|
0
|
0
|
0
|
0
|
0
|
0
|
0
|
0
|
0
|
0
|
0
|
0
|
0
|
0
|
|||
|
CIVIL/STRUCTURAL
|
0
|
0
|
500
|
100
|
0
|
0
|
0
|
0
|
0
|
0
|
0
|
0
|
0
|
0
|
0
|
0
|
0
|
0
|
0
|
0
|
0
|
0
|
|||
|
OTHER [WO 32 & Misc. Unforeseen]
|
0
|
0
|
1,100
|
350
|
0
|
0
|
250
|
250
|
0
|
0
|
0
|
250
|
250
|
250
|
0
|
0
|
250
|
250
|
250
|
0
|
0
|
0
|
|||
|
Sub-Total Capital Costs (escalated, with RRF)
|
0
|
213
|
10,099
|
5,955
|
1,639
|
0
|
391
|
401
|
0
|
0
|
0
|
443
|
454
|
465
|
0
|
0
|
501
|
514
|
526
|
0
|
0
|
0
|
|||
|
Expenses (Annual Costs) (000's)
|
|||||||||||||||||||||||||
|
BASE O&M (Fixed)
|
490
|
490
|
490
|
490
|
490
|
490
|
490
|
490
|
490
|
490
|
490
|
490
|
490
|
490
|
490
|
490
|
490
|
490
|
490
|
490
|
490
|
490
|
|||
|
PROPERTY TAXES
|
442
|
442
|
442
|
569
|
569
|
569
|
569
|
569
|
569
|
569
|
569
|
569
|
569
|
569
|
569
|
569
|
569
|
569
|
569
|
569
|
569
|
569
|
|||
|
INSURANCE
|
44
|
44
|
44
|
44
|
44
|
44
|
44
|
44
|
44
|
44
|
44
|
44
|
44
|
44
|
44
|
44
|
44
|
44
|
44
|
44
|
44
|
44
|
|||
|
ELECTRICAL
|
0
|
0
|
0
|
0
|
0
|
0
|
0
|
0
|
0
|
0
|
0
|
0
|
0
|
0
|
0
|
0
|
0
|
0
|
0
|
0
|
0
|
0
|
|||
|
MECHANICAL
|
0
|
100
|
0
|
0
|
0
|
0
|
0
|
0
|
0
|
0
|
0
|
0
|
0
|
0
|
0
|
0
|
0
|
0
|
0
|
0
|
0
|
0
|
|||
|
CIVIL/STRUCTURAL
|
0
|
150
|
0
|
0
|
0
|
0
|
0
|
0
|
0
|
0
|
0
|
0
|
0
|
0
|
0
|
0
|
0
|
0
|
0
|
0
|
0
|
0
|
|||
|
OTHER
|
0
|
200
|
100
|
0
|
0
|
0
|
250
|
250
|
250
|
0
|
0
|
250
|
250
|
250
|
0
|
0
|
250
|
250
|
250
|
0
|
0
|
0
|
|||
|
Sub-Total Expenses (escalated)
|
976
|
1,501
|
1,175
|
1,232
|
1,218
|
1,248
|
1,569
|
1,608
|
1,648
|
1,377
|
1,412
|
1,775
|
1,820
|
1,865
|
1,559
|
1,597
|
2,009
|
2,059
|
2,110
|
1,763
|
1,807
|
1,853
|
|||
|
Grand Total, Capital
|
0
|
320
|
10,320
|
7,048
|
1,639
|
0
|
391
|
401
|
0
|
0
|
0
|
443
|
609
|
624
|
163
|
49
|
551
|
514
|
526
|
0
|
0
|
0
|
|||
|
Grand Total, Expense
|
981
|
1,506
|
1,180
|
1,472
|
1,350
|
1,305
|
1,610
|
1,650
|
1,691
|
1,421
|
1,457
|
1,821
|
1,867
|
1,913
|
1,608
|
1,648
|
2,060
|
2,112
|
2,165
|
1,819
|
1,865
|
1,911
|
|||
|
Energy
|
2010
|
2011
|
2012
|
2013
|
2014
|
2015
|
2016
|
2017
|
2018
|
2019
|
2020
|
2021
|
2022
|
2023
|
2024
|
2025
|
2026
|
2027
|
2028
|
2029
|
2030
|
2031
|
|||
|
BASE ENERGY
|
58.6
|
59.7
|
59.7
|
65.3
|
65.3
|
65.3
|
65.3
|
65.3
|
65.3
|
65.3
|
65.3
|
65.3
|
65.3
|
65.3
|
65.3
|
65.3
|
65.3
|
65.3
|
65.3
|
65.3
|
65.3
|
65.3
|
|||
|
INSTALLED CAPACITY
|
14.3
|
14.3
|
13.2
|
13.2
|
13.2
|
13.2
|
13.2
|
13.2
|
13.2
|
13.2
|
13.2
|
13.2
|
13.2
|
13.2
|
13.2
|
13.2
|
13.2
|
13.2
|
13.2
|
13.2
|
13.2
|
13.2
|
|||
|
CAPABILITY
|
10.6
|
10.6
|
13.2
|
13.2
|
13.2
|
13.2
|
13.2
|
13.2
|
13.2
|
13.2
|
13.2
|
13.2
|
13.2
|
13.2
|
13.2
|
13.2
|
13.2
|
13.2
|
13.2
|
13.2
|
13.2
|
13.2
|
|||
|
ENERGY ADDS
|
0.0
|
0.0
|
0.0
|
0.0
|
0.0
|
0.0
|
0.0
|
0.0
|
0.0
|
0.0
|
0.0
|
0.0
|
0.0
|
0.0
|
0.0
|
0.0
|
0.0
|
0.0
|
0.0
|
0.0
|
0.0
|
0.0
|
|||
|
-Overhauls & Upgrades
|
0.0
|
0.0
|
0.0
|
0.0
|
0.0
|
0.0
|
0.0
|
0.0
|
0.0
|
0.0
|
0.0
|
0.0
|
0.0
|
0.0
|
0.0
|
0.0
|
0.0
|
0.0
|
0.0
|
0.0
|
0.0
|
0.0
|
|||
|
-Automation
|
0.0
|
0.0
|
0.0
|
0.0
|
0.0
|
0.0
|
0.0
|
0.0
|
0.0
|
0.0
|
0.0
|
0.0
|
0.0
|
0.0
|
0.0
|
0.0
|
0.0
|
0.0
|
0.0
|
0.0
|
0.0
|
0.0
|
|||
|
-Other
|
0.0
|
0.0
|
0.0
|
0.0
|
0.0
|
0.0
|
0.0
|
0.0
|
0.0
|
0.0
|
0.0
|
0.0
|
0.0
|
0.0
|
0.0
|
0.0
|
0.0
|
0.0
|
0.0
|
0.0
|
0.0
|
0.0
|
|||
|
ENERGY DEDUCTS
|
0.0
|
0.0
|
0.3
|
0.0
|
0.0
|
0.0
|
0.0
|
0.0
|
0.0
|
0.0
|
0.0
|
0.0
|
0.0
|
0.0
|
0.0
|
0.0
|
0.0
|
0.0
|
0.0
|
0.0
|
0.0
|
0.0
|
|||
|
- Minimum flows
|
0.0
|
0.0
|
0.0
|
0.0
|
0.0
|
0.0
|
0.0
|
0.0
|
0.0
|
0.0
|
0.0
|
0.0
|
0.0
|
0.0
|
0.0
|
0.0
|
0.0
|
0.0
|
0.0
|
0.0
|
0.0
|
0.0
|
|||
|
- Fish Passage Flows
|
0.0
|
0.0
|
0.0
|
0.0
|
0.0
|
0.0
|
0.0
|
0.0
|
0.0
|
0.0
|
0.0
|
0.0
|
0.0
|
0.0
|
0.0
|
0.0
|
0.0
|
0.0
|
0.0
|
0.0
|
0.0
|
0.0
|
|||
|
- Other (Please define)
|
0.0
|
0.0
|
0.0
|
0.0
|
0.0
|
0.0
|
0.0
|
0.0
|
0.0
|
0.0
|
0.0
|
0.0
|
0.0
|
0.0
|
0.0
|
0.0
|
0.0
|
0.0
|
0.0
|
0.0
|
0.0
|
0.0
|
|||
|
NET PROJECT GENERATION
|
58.6
|
59.7
|
59.7
|
65.3
|
65.3
|
65.3
|
65.3
|
65.3
|
65.3
|
65.3
|
65.3
|
65.3
|
65.3
|
65.3
|
65.3
|
65.3
|
65.3
|
65.3
|
65.3
|
65.3
|
65.3
|
65.3
|
|||
|
FORWARD PRICING
|
|||||||||||||||||||||||||
|
Energy
|
|||||||||||||||||||||||||
|
ICAP
|
|||||||||||||||||||||||||
|
Residual
|
|||||||||||||||||||||||||
|
Reserves
|
|||||||||||||||||||||||||
|
Other (List)
|
|||||||||||||||||||||||||
|
CASH FLOWS
|
|||||||||||||||||||||||||
|
Revenues
|
|||||||||||||||||||||||||
|
Energy
|
|||||||||||||||||||||||||
|
ICAP
|
|||||||||||||||||||||||||
|
Residual
|
|||||||||||||||||||||||||
|
Reserves
|
|||||||||||||||||||||||||
|
Other (List)
|
|||||||||||||||||||||||||
|
Subtotal, Revenues
|
|||||||||||||||||||||||||
|
Costs
|
|||||||||||||||||||||||||
|
Capital
|
0
|
320
|
10,320
|
7,048
|
1,639
|
0
|
391
|
401
|
0
|
0
|
0
|
443
|
609
|
624
|
163
|
49
|
551
|
514
|
526
|
0
|
0
|
0
|
|||
|
Expense
|
981
|
1,506
|
1,180
|
1,472
|
1,350
|
1,305
|
1,610
|
1,650
|
1,691
|
1,421
|
1,457
|
1,821
|
1,867
|
1,913
|
1,608
|
1,648
|
2,060
|
2,112
|
2,165
|
1,819
|
1,865
|
1,911
|
|||
|
Subtotal, Production Costs
|
981
|
1,826
|
11,500
|
8,520
|
2,989
|
1,305
|
2,001
|
2,051
|
1,691
|
1,421
|
1,457
|
2,264
|
2,476
|
2,538
|
1,771
|
1,697
|
2,612
|
2,626
|
2,691
|
1,819
|
1,865
|
1,911
|
|||
|
PV Cash Cost @ ATCC =
|
34,499
|
||||||||||||||||||||||||
|
PV MWH @ ATCC =
|
717
|
||||||||||||||||||||||||
|
Nominal Level Cash Cost, Used in Hydro DCF Model =
|
48.13
|
||||||||||||||||||||||||
15
|
REGULATORY COMPLIANCE
|
2011
|
2012
|
2013
|
2014
|
2015
|
2016
|
2017
|
2018
|
2019
|
2020
|
2021
|
2022
|
2023
|
2024
|
2025
|
2026
|
2027
|
2028
|
2029
|
2030
|
2031
|
2032
|
|
Capital Costs (000's)
|
||||||||||||||||||||||
|
FISHWAYS
|
0
|
0
|
0
|
0
|
0
|
0
|
0
|
0
|
0
|
0
|
0
|
0
|
0
|
0
|
0
|
0
|
0
|
0
|
0
|
0
|
0
|
0
|
|
CULTURAL RESOURCE ISSUES
|
0
|
0
|
0
|
0
|
0
|
0
|
0
|
0
|
0
|
0
|
0
|
0
|
0
|
0
|
0
|
0
|
0
|
0
|
0
|
0
|
0
|
0
|
|
LAND MANAGEMENT ISSUES
|
0
|
0
|
0
|
0
|
0
|
0
|
0
|
0
|
0
|
0
|
0
|
0
|
0
|
0
|
0
|
0
|
0
|
0
|
0
|
0
|
0
|
0
|
|
RECREATIONAL FACILITIES
|
0
|
0
|
250
|
0
|
0
|
0
|
0
|
0
|
0
|
0
|
0
|
0
|
0
|
0
|
0
|
0
|
0
|
0
|
0
|
0
|
0
|
0
|
|
CIVIL/STRUCTURAL
|
0
|
0
|
175
|
0
|
0
|
0
|
0
|
0
|
0
|
0
|
0
|
0
|
0
|
0
|
0
|
0
|
0
|
0
|
0
|
0
|
0
|
0
|
|
WATER QUALITY
|
0
|
0
|
0
|
0
|
0
|
0
|
0
|
0
|
0
|
0
|
0
|
0
|
0
|
0
|
0
|
0
|
0
|
0
|
0
|
0
|
0
|
0
|
|
FERC LICENSING CAPITAL
|
75
|
150
|
0
|
0
|
0
|
0
|
0
|
0
|
0
|
0
|
0
|
0
|
85
|
85
|
85
|
0
|
0
|
0
|
0
|
0
|
0
|
0
|
|
OTHER
|
0
|
0
|
300
|
0
|
0
|
0
|
0
|
0
|
0
|
0
|
0
|
0
|
0
|
0
|
0
|
25
|
25
|
0
|
0
|
0
|
0
|
0
|
|
OTHER
|
0
|
0
|
0
|
0
|
0
|
0
|
0
|
0
|
0
|
0
|
0
|
0
|
0
|
0
|
0
|
0
|
0
|
0
|
0
|
0
|
0
|
0
|
|
Sub-Total Capital Costs (escalated, with RRF)
|
101
|
213
|
1,069
|
0
|
0
|
0
|
0
|
0
|
0
|
0
|
0
|
0
|
155
|
159
|
163
|
49
|
50
|
0
|
0
|
0
|
0
|
0
|
|
Expenses (Annual Costs) (000's)
|
||||||||||||||||||||||
|
FISHWAYS
|
0
|
0
|
0
|
0
|
0
|
0
|
0
|
0
|
0
|
0
|
0
|
0
|
0
|
0
|
0
|
0
|
0
|
0
|
0
|
0
|
0
|
0
|
|
CULTURAL RESOURCE ISSUES
|
0
|
0
|
0
|
60
|
40
|
15
|
15
|
15
|
15
|
15
|
15
|
15
|
15
|
15
|
15
|
15
|
15
|
15
|
15
|
15
|
15
|
15
|
|
LAND MANAGEMENT ISSUES
|
0
|
0
|
0
|
0
|
0
|
0
|
0
|
0
|
0
|
0
|
0
|
0
|
0
|
0
|
0
|
0
|
0
|
0
|
0
|
0
|
0
|
0
|
|
RECREATIONAL FACILITIES
|
0
|
0
|
0
|
0
|
0
|
0
|
0
|
0
|
0
|
0
|
0
|
0
|
0
|
0
|
0
|
0
|
0
|
0
|
0
|
0
|
0
|
0
|
|
CIVIL/STRUCTURAL
|
0
|
0
|
0
|
0
|
0
|
0
|
0
|
0
|
0
|
0
|
0
|
0
|
0
|
0
|
0
|
0
|
0
|
0
|
0
|
0
|
0
|
0
|
|
WATER QUALITY
|
0
|
0
|
0
|
0
|
0
|
0
|
0
|
0
|
0
|
0
|
0
|
0
|
0
|
0
|
0
|
0
|
0
|
0
|
0
|
0
|
0
|
0
|
|
FIXED COMPLIANCE &ADMINISTRATION COSTS
|
0
|
0
|
0
|
150
|
75
|
30
|
15
|
15
|
15
|
15
|
15
|
15
|
15
|
15
|
15
|
15
|
15
|
15
|
15
|
15
|
15
|
15
|
|
OTHER
|
5
|
5
|
5
|
5
|
5
|
5
|
5
|
5
|
5
|
5
|
5
|
5
|
5
|
5
|
5
|
5
|
5
|
5
|
5
|
5
|
5
|
5
|
|
OTHER
|
0
|
0
|
0
|
0
|
0
|
0
|
0
|
0
|
0
|
0
|
0
|
0
|
0
|
0
|
0
|
0
|
0
|
0
|
0
|
0
|
0
|
0
|
|
Sub-Total Expenses (escalated)
|
5
|
5
|
5
|
240
|
132
|
57
|
41
|
42
|
43
|
44
|
45
|
46
|
47
|
48
|
49
|
51
|
52
|
53
|
55
|
56
|
57
|
59
|
|
PRODUCTION PLANT
|
2011
|
2012
|
2013
|
2014
|
2015
|
2016
|
2017
|
2018
|
2019
|
2020
|
2021
|
2022
|
2023
|
2024
|
2025
|
2026
|
2027
|
2028
|
2029
|
2030
|
2031
|
2032
|
|
Capital Costs (000's)
|
||||||||||||||||||||||
|
ELECTRICAL-Generator
|
0
|
0
|
250
|
0
|
0
|
150
|
0
|
0
|
0
|
0
|
0
|
0
|
0
|
0
|
0
|
0
|
0
|
0
|
0
|
0
|
0
|
0
|
|
ELECTRICAL-Transformer & Substation
|
0
|
500
|
500
|
0
|
0
|
200
|
0
|
0
|
0
|
0
|
0
|
0
|
0
|
0
|
0
|
0
|
0
|
0
|
0
|
0
|
0
|
0
|
|
ELECTRICAL- Switches & Relays
|
0
|
2,150
|
1,500
|
0
|
0
|
0
|
0
|
0
|
0
|
0
|
0
|
0
|
0
|
0
|
0
|
0
|
0
|
0
|
0
|
0
|
0
|
0
|
|
AUTOMATION
|
0
|
0
|
0
|
0
|
0
|
0
|
0
|
0
|
0
|
0
|
0
|
0
|
0
|
0
|
0
|
0
|
0
|
0
|
0
|
0
|
0
|
0
|
|
MECHANICAL
|
0
|
4,900
|
1,250
|
0
|
0
|
750
|
0
|
0
|
0
|
0
|
0
|
0
|
0
|
0
|
0
|
0
|
0
|
0
|
0
|
0
|
0
|
0
|
|
CIVIL/STRUCTURAL
|
0
|
1,500
|
100
|
0
|
0
|
0
|
0
|
0
|
0
|
0
|
0
|
0
|
0
|
0
|
0
|
0
|
0
|
0
|
0
|
0
|
0
|
0
|
|
OTHER [WO 32 & Misc. Unforeseen]
|
0
|
1,000
|
450
|
0
|
0
|
0
|
250
|
250
|
0
|
0
|
0
|
250
|
250
|
250
|
0
|
0
|
250
|
250
|
250
|
0
|
0
|
0
|
|
Sub-Total Capital Costs (escalated, with RRF)
|
0
|
14,280
|
5,971
|
0
|
0
|
1,680
|
391
|
401
|
0
|
0
|
0
|
443
|
454
|
465
|
0
|
0
|
501
|
514
|
526
|
0
|
0
|
0
|
|
Expenses (Annual Costs) (000's)
|
||||||||||||||||||||||
|
BASE O&M (Fixed)
|
490
|
490
|
490
|
490
|
490
|
490
|
490
|
490
|
490
|
490
|
490
|
490
|
490
|
490
|
490
|
490
|
490
|
490
|
490
|
490
|
490
|
490
|
|
PROPERTY TAXES
|
442
|
442
|
442
|
569
|
569
|
569
|
569
|
569
|
569
|
569
|
569
|
569
|
569
|
569
|
569
|
569
|
569
|
569
|
569
|
569
|
569
|
569
|
|
INSURANCE
|
44
|
44
|
44
|
44
|
44
|
44
|
44
|
44
|
44
|
44
|
44
|
44
|
44
|
44
|
44
|
44
|
44
|
44
|
44
|
44
|
44
|
44
|
|
ELECTRICAL
|
0
|
0
|
0
|
0
|
0
|
0
|
0
|
0
|
0
|
0
|
0
|
0
|
0
|
0
|
0
|
0
|
0
|
0
|
0
|
0
|
0
|
0
|
|
MECHANICAL
|
0
|
100
|
0
|
0
|
0
|
0
|
0
|
0
|
0
|
0
|
0
|
0
|
0
|
0
|
0
|
0
|
0
|
0
|
0
|
0
|
0
|
0
|
|
CIVIL/STRUCTURAL
|
0
|
150
|
0
|
0
|
0
|
0
|
0
|
0
|
0
|
0
|
0
|
0
|
0
|
0
|
0
|
0
|
0
|
0
|
0
|
0
|
0
|
0
|
|
OTHER
|
0
|
200
|
100
|
0
|
0
|
0
|
250
|
250
|
250
|
0
|
0
|
250
|
250
|
250
|
0
|
0
|
250
|
250
|
250
|
0
|
0
|
0
|
|
Sub-Total Expenses (escalated)
|
976
|
1,501
|
1,175
|
1,232
|
1,218
|
1,248
|
1,569
|
1,608
|
1,648
|
1,377
|
1,412
|
1,775
|
1,820
|
1,865
|
1,559
|
1,597
|
2,009
|
2,059
|
2,110
|
1,763
|
1,807
|
1,853
|
|
Grand Total, Capital
|
101
|
14,493
|
7,039
|
0
|
0
|
1,680
|
391
|
401
|
0
|
0
|
0
|
443
|
609
|
624
|
163
|
49
|
551
|
514
|
526
|
0
|
0
|
0
|
|
Grand Total, Expense
|
981
|
1,506
|
1,180
|
1,472
|
1,350
|
1,305
|
1,610
|
1,650
|
1,691
|
1,421
|
1,457
|
1,821
|
1,867
|
1,913
|
1,608
|
1,648
|
2,060
|
2,112
|
2,165
|
1,819
|
1,865
|
1,911
|
|
|
|
|
|
|
|
|
|
|
|
|
|
|
|
|
|
|
|
|
|
|
|
|
|
Energy
|
2011
|
2012
|
2013
|
2014
|
2015
|
2016
|
2017
|
2018
|
2019
|
2020
|
2021
|
2022
|
2023
|
2024
|
2025
|
2026
|
2027
|
2028
|
2029
|
2030
|
2031
|
2032
|
|
BASE ENERGY
|
58.6
|
56.7
|
65.4
|
69.8
|
69.8
|
68.1
|
71.1
|
71.1
|
71.1
|
71.1
|
71.1
|
71.1
|
71.1
|
71.1
|
71.1
|
71.1
|
71.1
|
71.1
|
71.1
|
71.1
|
71.1
|
71.1
|
|
INSTALLED CAPACITY
|
14.3
|
17.0
|
19.5
|
21.3
|
21.3
|
21.3
|
21.5
|
21.5
|
21.5
|
21.5
|
21.5
|
21.5
|
21.5
|
21.5
|
21.5
|
21.5
|
21.5
|
21.5
|
21.5
|
21.5
|
21.5
|
21.5
|
|
CAPABILITY
|
10.6
|
13.3
|
19.5
|
21.3
|
21.3
|
21.3
|
21.5
|
21.5
|
21.5
|
21.5
|
21.5
|
21.5
|
21.5
|
21.5
|
21.5
|
21.5
|
21.5
|
21.5
|
21.5
|
21.5
|
21.5
|
21.5
|
|
ENERGY ADDS
|
0.0
|
0.0
|
0.0
|
0.0
|
0.0
|
0.0
|
0.0
|
0.0
|
0.0
|
0.0
|
0.0
|
0.0
|
0.0
|
0.0
|
0.0
|
0.0
|
0.0
|
0.0
|
0.0
|
0.0
|
0.0
|
0.0
|
|
-Overhauls & Upgrades
|
0.0
|
0.0
|
0.0
|
0.0
|
0.0
|
0.0
|
0.0
|
0.0
|
0.0
|
0.0
|
0.0
|
0.0
|
0.0
|
0.0
|
0.0
|
0.0
|
0.0
|
0.0
|
0.0
|
0.0
|
0.0
|
0.0
|
|
-Automation
|
0.0
|
0.0
|
0.0
|
0.0
|
0.0
|
0.0
|
0.0
|
0.0
|
0.0
|
0.0
|
0.0
|
0.0
|
0.0
|
0.0
|
0.0
|
0.0
|
0.0
|
0.0
|
0.0
|
0.0
|
0.0
|
0.0
|
|
-Other
|
0.0
|
0.0
|
0.0
|
0.0
|
0.0
|
0.0
|
0.0
|
0.0
|
0.0
|
0.0
|
0.0
|
0.0
|
0.0
|
0.0
|
0.0
|
0.0
|
0.0
|
0.0
|
0.0
|
0.0
|
0.0
|
0.0
|
|
ENERGY DEDUCTS
|
0.0
|
0.0
|
0.0
|
0.0
|
0.0
|
0.0
|
0.0
|
0.0
|
0.0
|
0.0
|
0.0
|
0.0
|
0.0
|
0.0
|
0.0
|
0.0
|
0.0
|
0.0
|
0.0
|
0.0
|
0.0
|
0.0
|
|
- Minimum flows
|
0.0
|
0.0
|
0.0
|
0.0
|
0.0
|
0.0
|
0.0
|
0.0
|
0.0
|
0.0
|
0.0
|
0.0
|
0.0
|
0.0
|
0.0
|
0.0
|
0.0
|
0.0
|
0.0
|
0.0
|
0.0
|
0.0
|
|
- Fish Passage Flows
|
0.0
|
0.0
|
0.0
|
0.0
|
0.0
|
0.0
|
0.0
|
0.0
|
0.0
|
0.0
|
0.0
|
0.0
|
0.0
|
0.0
|
0.0
|
0.0
|
0.0
|
0.0
|
0.0
|
0.0
|
0.0
|
0.0
|
|
- Other (Please define)
|
0.0
|
0.0
|
0.0
|
0.0
|
0.0
|
0.0
|
0.0
|
0.0
|
0.0
|
0.0
|
0.0
|
0.0
|
0.0
|
0.0
|
0.0
|
0.0
|
0.0
|
0.0
|
0.0
|
0.0
|
0.0
|
0.0
|
|
NET PROJECT GENERATION
|
58.6
|
56.7
|
65.4
|
69.8
|
69.8
|
68.1
|
71.1
|
71.1
|
71.1
|
71.1
|
71.1
|
71.1
|
71.1
|
71.1
|
71.1
|
71.1
|
71.1
|
71.1
|
71.1
|
71.1
|
71.1
|
71.1
|
|
FORWARD PRICING
|
||||||||||||||||||||||
|
Energy
|
|
|
|
|
|
|
|
|
|
|
|
|
|
|
|
|
|
|
|
|
|
|
|
ICAP
|
|
|
|
|
|
|
|
|
|
|
|
|
|
|
|
|
|
|
|
|
|
|
|
Residual
|
||||||||||||||||||||||
|
Reserves
|
||||||||||||||||||||||
|
Other (List)
|
||||||||||||||||||||||
|
CASH FLOWS
|
||||||||||||||||||||||
|
Revenues
|
||||||||||||||||||||||
|
Energy
|
||||||||||||||||||||||
|
ICAP
|
||||||||||||||||||||||
|
Residual
|
||||||||||||||||||||||
|
Reserves
|
||||||||||||||||||||||
|
Other (List)
|
||||||||||||||||||||||
|
Subtotal, Revenues
|
||||||||||||||||||||||
|
Costs
|
||||||||||||||||||||||
|
Capital
|
101
|
14,493
|
7,039
|
0
|
0
|
1,680
|
391
|
401
|
0
|
0
|
0
|
443
|
609
|
624
|
163
|
49
|
551
|
514
|
526
|
0
|
0
|
0
|
|
Expense
|
981
|
1,506
|
1,180
|
1,472
|
1,350
|
1,305
|
1,610
|
1,650
|
1,691
|
1,421
|
1,457
|
1,821
|
1,867
|
1,913
|
1,608
|
1,648
|
2,060
|
2,112
|
2,165
|
1,819
|
1,865
|
1,911
|
|
Subtotal, Production Costs
|
1,082
|
15,999
|
8,220
|
1,472
|
1,350
|
2,985
|
2,001
|
2,051
|
1,691
|
1,421
|
1,457
|
2,264
|
2,476
|
2,538
|
1,771
|
1,697
|
2,612
|
2,626
|
2,691
|
1,819
|
1,865
|
1,911
|
|
PV Cash Cost @ ATCC =
|
38,863
|
|||||||||||||||||||||
|
PV MWH @ ATCC =
|
765
|
|||||||||||||||||||||
|
Nominal Level Cash Cost, Used in Hydro DCF Model =
|
50.82
|
16
|
Hydro DCF Model -- Base Case
|
||||||||||||||||||||||||
|
Federal Inc Tax Rate =
|
35.00%
|
|||||||||||||||||||||||
|
State Inc Tax Rate=
|
9.75%
|
|||||||||||||||||||||||
|
Composite Tax Rate =
|
41.34%
|
|||||||||||||||||||||||
|
Inflation Rate =
|
2.50%
|
|
||||||||||||||||||||||
|
Weighted
|
Weighted
|
Weighted
|
||||||||||||||||||||||
|
Share
|
Cost
|
Pre-Tax
|
ROR
|
After-Tax
|
||||||||||||||||||||
|
Common Equity
|
55.12%
|
9.59%
|
9.01%
|
5.29%
|
5.29%
|
|||||||||||||||||||
|
Preferred
|
1.77%
|
4.53%
|
0.14%
|
0.08%
|
0.08%
|
|||||||||||||||||||
|
Debt
|
43.11%
|
5.80%
|
2.50%
|
2.50%
|
1.47%
|
|||||||||||||||||||
|
11.65%
|
7.87%
|
6.83%
|
||||||||||||||||||||||
|
Rev Req Factor =
|
1.325
|
|
||||||||||||||||||||||
|
Plant MW =
|
NA
|
|
||||||||||||||||||||||
|
CF =
|
55.00%
|
|||||||||||||||||||||||
|
MWH =
|
NA
|
|||||||||||||||||||||||
|
UCAP Factor =
|
41.00%
|
|||||||||||||||||||||||
|
O&M/Adds (#/Mwh) =
|
48.20
|
|
||||||||||||||||||||||
|
Escalation =
|
0.00%
|
|||||||||||||||||||||||
|
Mkt Price Adjustment =
|
0.00%
|
|||||||||||||||||||||||
|
O&M Adjustment =
|
0.00%
|
|||||||||||||||||||||||
|
Scenario Purchase Price =
|
32,000,000
|
|||||||||||||||||||||||
|
|
|
|||||||||||||||||||||||
|
Initial DCF Value =
|
$0
|
1
|
2
|
3
|
4
|
5
|
6
|
7
|
8
|
9
|
10
|
11
|
12
|
13
|
14
|
15
|
16
|
17
|
18
|
19
|
20
|
21
|
||
|
Final Value (DCF adjusted for RR factor) =
|
$0
|
|
||||||||||||||||||||||
|
|
|
71.05
|
72.83
|
74.65
|
76.51
|
78.43
|
80.39
|
82.40
|
84.46
|
86.57
|
88.73
|
90.95
|
93.22
|
95.55
|
97.94
|
100.39
|
102.90
|
105.47
|
108.11
|
110.81
|
113.58
|
116.42
|
||
|
NPV
|
58,584
|
59,700
|
59,700
|
65,300
|
65,300
|
65,300
|
65,300
|
65,300
|
65,300
|
65,300
|
65,300
|
65,300
|
65,300
|
65,300
|
65,300
|
65,300
|
65,300
|
65,300
|
65,300
|
65,300
|
955,660
|
|||
|
Summary Results
|
*******
|
*******
|
*******
|
*******
|
*******
|
*******
|
*******
|
*******
|
*******
|
*******
|
*******
|
*******
|
*******
|
*******
|
*******
|
*******
|
*******
|
*******
|
*******
|
*******
|
*******
|
*******
|
||
|
NPV MWH @ Real AT =
|
1,253,890
|
|||||||||||||||||||||||
|
NPV MWH @ ATCC =
|
923,577
|
|||||||||||||||||||||||
|
NPV Incr Benefit @ ATCC
|
0
|
|||||||||||||||||||||||
|
NPV Incr Cost @ ATCC =
|
44,516,432
|
|||||||||||||||||||||||
|
Real Lev Total Cost ($/MWH) =
|
71.05
|
|||||||||||||||||||||||
|
2011
|
2012
|
2013
|
2014
|
2015
|
2016
|
2017
|
2018
|
2019
|
2020
|
2021
|
2022
|
2023
|
2024
|
2025
|
2026
|
2027
|
2028
|
2029
|
2030
|
Residual
|
||||
|
Mwh
|
58,584
|
59,700
|
59,700
|
65,300
|
65,300
|
65,300
|
65,300
|
65,300
|
65,300
|
65,300
|
65,300
|
65,300
|
65,300
|
65,300
|
65,300
|
65,300
|
65,300
|
65,300
|
65,300
|
65,300
|
955,660
|
|||
|
$/Mwh =
|
*******
|
*******
|
*******
|
*******
|
*******
|
*******
|
*******
|
*******
|
*******
|
*******
|
*******
|
*******
|
*******
|
*******
|
*******
|
*******
|
*******
|
*******
|
*******
|
*******
|
*******
|
|
|
|
|
Value $ =
|
*******
|
*******
|
*******
|
*******
|
*******
|
*******
|
*******
|
*******
|
*******
|
*******
|
*******
|
*******
|
*******
|
*******
|
*******
|
*******
|
*******
|
*******
|
*******
|
*******
|
*******
|
|||
|
|
|
|
||||||||||||||||||||||
|
O&M plus Cap Adds =
|
2,823,749
|
2,877,540
|
2,877,540
|
3,147,460
|
3,147,460
|
3,147,460
|
3,147,460
|
3,147,460
|
3,147,460
|
3,147,460
|
3,147,460
|
3,147,460
|
3,147,460
|
3,147,460
|
3,147,460
|
3,147,460
|
3,147,460
|
3,147,460
|
3,147,460
|
3,147,460
|
46,062,810
|
|||
|
Net Value =
|
*******
|
*******
|
*******
|
*******
|
*******
|
*******
|
*******
|
*******
|
*******
|
*******
|
*******
|
*******
|
*******
|
*******
|
*******
|
*******
|
*******
|
*******
|
*******
|
*******
|
*******
|
#DIV/0!
|
||
|
0
|
||||||||||||||||||||||||
17
|
Confidential
|
||||||||||||||||||||||||
|
Hydro DCF Model -- Base Case
|
||||||||||||||||||||||||
|
Federal Inc Tax Rate =
|
35.00%
|
|||||||||||||||||||||||
|
State Inc Tax Rate=
|
9.75%
|
|||||||||||||||||||||||
|
Composite Tax Rate =
|
41.34%
|
|||||||||||||||||||||||
|
Inflation Rate =
|
2.50%
|
|
||||||||||||||||||||||
|
Weighted
|
Weighted
|
Weighted
|
||||||||||||||||||||||
|
Share
|
Cost
|
Pre-Tax
|
ROR
|
After-Tax
|
||||||||||||||||||||
|
Common Equity
|
55.12%
|
9.59%
|
9.01%
|
5.29%
|
5.29%
|
|||||||||||||||||||
|
Preferred
|
1.77%
|
4.53%
|
0.14%
|
0.08%
|
0.08%
|
|||||||||||||||||||
|
Debt
|
43.11%
|
5.80%
|
2.50%
|
2.50%
|
1.47%
|
|||||||||||||||||||
|
11.65%
|
7.87%
|
6.83%
|
||||||||||||||||||||||
|
Rev Req Factor =
|
1.325
|
|
||||||||||||||||||||||
|
Plant MW =
|
NA
|
|
||||||||||||||||||||||
|
CF =
|
40.00%
|
|||||||||||||||||||||||
|
MWH =
|
NA
|
|||||||||||||||||||||||
|
UCAP Factor =
|
41.00%
|
|||||||||||||||||||||||
|
O&M/Adds (#/Mwh) =
|
50.82
|
|
||||||||||||||||||||||
|
Escalation =
|
0.00%
|
|||||||||||||||||||||||
|
Mkt Price Adjustment =
|
0.00%
|
|||||||||||||||||||||||
|
O&M Adjustment =
|
0.00%
|
|||||||||||||||||||||||
|
Scenario Purchase Price =
|
28,250,000
|
|||||||||||||||||||||||
|
|
|
|||||||||||||||||||||||
|
Initial DCF Value =
|
$0
|
1
|
2
|
3
|
4
|
5
|
6
|
7
|
8
|
9
|
10
|
11
|
12
|
13
|
14
|
15
|
16
|
17
|
18
|
19
|
20
|
21
|
||
|
Final Value (DCF adjusted for RR factor) =
|
$0
|
|
||||||||||||||||||||||
|
|
|
66.69
|
68.36
|
70.06
|
71.82
|
73.61
|
75.45
|
77.34
|
79.27
|
81.25
|
83.29
|
85.37
|
87.50
|
89.69
|
91.93
|
94.23
|
96.59
|
99.00
|
101.47
|
104.01
|
106.61
|
109.28
|
||
|
NPV
|
58,584
|
56,700
|
65,400
|
69,800
|
69,800
|
68,100
|
71,100
|
71,100
|
71,100
|
71,100
|
71,100
|
71,100
|
71,100
|
71,100
|
71,100
|
71,100
|
71,100
|
71,100
|
71,100
|
71,100
|
1,040,542
|
|||
|
Summary Results
|
*******
|
*******
|
*******
|
*******
|
*******
|
*******
|
*******
|
*******
|
*******
|
*******
|
*******
|
*******
|
*******
|
*******
|
*******
|
*******
|
*******
|
*******
|
*******
|
*******
|
*******
|
*******
|
||
|
NPV MWH @ Real AT =
|
1,348,479
|
|||||||||||||||||||||||
|
NPV MWH @ Real AT =
|
989,841
|
|||||||||||||||||||||||
|
NPV Incr Benefit @ ATCC
|
0
|
|||||||||||||||||||||||
|
NPV Incr Cost @ ATCC =
|
50,303,725
|
|||||||||||||||||||||||
|
Real Lev Total Cost ($/MWH) =
|
66.69
|
|||||||||||||||||||||||
|
|
|
|
|
|
|
|
|
|
|
|
|
|
|
|
|
|
|
|
|
|
||||
|
2011
|
2012
|
2013
|
2014
|
2015
|
2016
|
2017
|
2018
|
2019
|
2020
|
2021
|
2022
|
2023
|
2024
|
2025
|
2026
|
2027
|
2028
|
2029
|
2030
|
Residual
|
||||
|
Mwh
|
58,584
|
56,700
|
65,400
|
69,800
|
69,800
|
68,100
|
71,100
|
71,100
|
71,100
|
71,100
|
71,100
|
71,100
|
71,100
|
71,100
|
71,100
|
71,100
|
71,100
|
71,100
|
71,100
|
71,100
|
1,040,542
|
|
||
|
$/Mwh =
|
*******
|
*******
|
*******
|
*******
|
*******
|
*******
|
*******
|
*******
|
*******
|
*******
|
*******
|
*******
|
*******
|
*******
|
*******
|
*******
|
*******
|
*******
|
*******
|
*******
|
*******
|
|
|
|
|
Value $ =
|
*******
|
*******
|
*******
|
*******
|
*******
|
*******
|
*******
|
*******
|
*******
|
*******
|
*******
|
*******
|
*******
|
*******
|
*******
|
*******
|
*******
|
*******
|
*******
|
*******
|
*******
|
|||
|
|
|
|
||||||||||||||||||||||
|
O&M plus Cap Adds =
|
2,977,239
|
2,881,494
|
3,323,628
|
3,547,236
|
3,547,236
|
3,460,842
|
3,613,302
|
3,613,302
|
3,613,302
|
3,613,302
|
3,613,302
|
3,613,302
|
3,613,302
|
3,613,302
|
3,613,302
|
3,613,302
|
3,613,302
|
3,613,302
|
3,613,302
|
3,613,302
|
52,880,368
|
|||
|
Net Value =
|
*******
|
*******
|
*******
|
*******
|
*******
|
*******
|
*******
|
*******
|
*******
|
*******
|
*******
|
*******
|
*******
|
*******
|
*******
|
*******
|
*******
|
*******
|
*******
|
*******
|
*******
|
#DIV/0!
|
||
|
0
|
||||||||||||||||||||||||
18
|
Inflation =
|
*******
|
||||||||
|
Cap Factor =
|
*******
|
||||||||
|
Disc =
|
*******
|
||||||||
|
ISO Cap Adj =
|
*******
|
||||||||
|
Leveled Rates
|
|||||||||
|
Begin Year
|
2012
|
||||||||
|
End Year
|
2030
|
||||||||
|
Product =
|
Energy
|
Capacity
|
Total
|
|
|||||
|
$/Mwh
|
$/Kw year
|
$/Mwh
|
|||||||
|
Leveled Rate =
|
*******
|
*******
|
*******
|
||||||
|
|
|||||||||
|
NPV
|
|||||||||
|
FCM Adjusted
|
All-in @ CF
|
Unadjusted
|
NPV
|
NPV
|
All-in @ CF
|
||||
|
Energy
|
Capacity
|
*******
|
Capacity
|
Energy
|
Capacity
|
*******
|
|||
|
Year
|
$/Mwh
|
$/Kw year
|
$/Mwh
|
$/Kw year
|
$/Mwh
|
$/Kw year
|
$/Mwh
|
||
|
2007
|
|||||||||
|
2010
|
*******
|
*******
|
*******
|
*******
|
2010
|
*******
|
*******
|
*******
|
|
|
2011
|
*******
|
*******
|
*******
|
*******
|
2011
|
*******
|
*******
|
*******
|
|
|
2012
|
*******
|
*******
|
*******
|
*******
|
2012
|
*******
|
*******
|
*******
|
|
|
2013
|
*******
|
*******
|
*******
|
*******
|
2013
|
*******
|
*******
|
*******
|
|
|
2014
|
*******
|
*******
|
*******
|
*******
|
2014
|
*******
|
*******
|
*******
|
|
|
2015
|
*******
|
*******
|
*******
|
*******
|
2015
|
*******
|
*******
|
*******
|
|
|
2016
|
*******
|
*******
|
*******
|
*******
|
2016
|
*******
|
*******
|
*******
|
|
|
2017
|
*******
|
*******
|
*******
|
*******
|
2017
|
*******
|
*******
|
*******
|
|
|
2018
|
*******
|
*******
|
*******
|
*******
|
2018
|
*******
|
*******
|
*******
|
|
|
2019
|
*******
|
*******
|
*******
|
*******
|
2019
|
*******
|
*******
|
*******
|
|
|
2020
|
*******
|
*******
|
*******
|
*******
|
2020
|
*******
|
*******
|
*******
|
|
|
2021
|
*******
|
*******
|
*******
|
*******
|
2021
|
*******
|
*******
|
*******
|
|
|
2022
|
*******
|
*******
|
*******
|
*******
|
2022
|
*******
|
*******
|
*******
|
|
|
2023
|
*******
|
*******
|
*******
|
*******
|
2023
|
*******
|
*******
|
*******
|
|
|
2024
|
*******
|
*******
|
*******
|
*******
|
2024
|
*******
|
*******
|
*******
|
|
|
2025
|
*******
|
*******
|
*******
|
*******
|
2025
|
*******
|
*******
|
*******
|
|
|
2026
|
*******
|
*******
|
*******
|
*******
|
2026
|
*******
|
*******
|
*******
|
|
|
2027
|
*******
|
*******
|
*******
|
*******
|
2027
|
*******
|
*******
|
*******
|
|
|
2028
|
*******
|
*******
|
*******
|
*******
|
2028
|
*******
|
*******
|
*******
|
|
|
2029
|
*******
|
*******
|
*******
|
*******
|
2029
|
*******
|
*******
|
*******
|
|
|
2030
|
*******
|
*******
|
*******
|
*******
|
2030
|
*******
|
*******
|
*******
|
|
|
2031
|
*******
|
*******
|
*******
|
*******
|
2031
|
*******
|
*******
|
*******
|
|
|
2032
|
*******
|
*******
|
*******
|
*******
|
2032
|
*******
|
*******
|
*******
|
|
|
2033
|
*******
|
*******
|
*******
|
*******
|
2033
|
*******
|
*******
|
*******
|
|
|
2034
|
*******
|
*******
|
*******
|
*******
|
2034
|
*******
|
*******
|
*******
|
|
|
2035
|
*******
|
*******
|
*******
|
*******
|
2035
|
*******
|
*******
|
*******
|
|
19
|
Objectives:
|
||||||||||||||||||||||||||||||
|
1. Sharing fund is difference between actual revenue and projected base revenue.
|
||||||||||||||||||||||||||||||
|
i. Base projected revenue is equal to actual output (Column L) times base projected price (Column C)
|
||||||||||||||||||||||||||||||
|
ii. Actual revenue is equal to the actual revenues received for the entire output of the facility.
|
||||||||||||||||||||||||||||||
|
Energy revenues will be calculated on an hourly basis.
|
||||||||||||||||||||||||||||||
|
2. Scenario Output in Column L will be set to actual output annually.
|
||||||||||||||||||||||||||||||
|
3. CVPS maximum recovery is $1.25 million, cumulative PV at inflation
|
||||||||||||||||||||||||||||||
|
4. CV's share of fund is 1/3 of annual value up to cumulative maximum
|
||||||||||||||||||||||||||||||
|
5.OMYA maximum recovery is $2.0 million, nominal
|
||||||||||||||||||||||||||||||
|
6. OMYA share of fund is 1/3 of annual values, adjusted by 2 factors as follows:
|
||||||||||||||||||||||||||||||
|
i. Factor 1 -Ratio of pre upgrade projected output in each year to post upgrade projected output, assuming normal stream flows.
|
||||||||||||||||||||||||||||||
|
Annual ratios will be set as shown in column F below unless parties agree to change.
|
||||||||||||||||||||||||||||||
|
ii. Factor 2 - 5% of its annual fund share, after adjustment (i), for the 5 year rate phase-in period. These amounts are applied against its maximum.
|
||||||||||||||||||||||||||||||
|
7. Annual sharing fund will include actual REC revenues generated by the facilities in each year
|
||||||||||||||||||||||||||||||
|
8. If OMYA reaches its maximum entitlement from the sharing pool and CVPS has not, CVPS will be entitled to receive
|
||||||||||||||||||||||||||||||
|
50% of the ongoing sharing pool balances until it reaches its maximum.
|
||||||||||||||||||||||||||||||
|
9. If CVPS reaches its maximum entitlement from the sharing pool and OMYA has not, OMYA will be entitled to receive
|
||||||||||||||||||||||||||||||
|
50% (adjusted by the factors noted in item 5 above) of the ongoing sharing pool balances until it reaches its maximum.
|
||||||||||||||||||||||||||||||
|
Discount Rate =
|
2.50%
|
|||||||||||||||||||||||||||||
|
Rate Phase-in Years =
|
5
|
|||||||||||||||||||||||||||||
|
|
|
Customer Savings PV =
|
$0
|
|||||||||||||||||||||||||||
|
CV Max (PV) =
|
1,250,000
|
CV Recovery PV =
|
$0
|
|||||||||||||||||||||||||||
|
OMYA Max (Nominal) =
|
2,000,000
|
OYMA Recovery Nominal =
|
$0
|
Alternative
|
||||||||||||||||||||||||||
|
Scalars
|
||||||||||||||||||||||||||||||
|
|
|
Scenario
|
Scenario
|
REC Price
|
OMYA % to Repay Fund =
|
5.00%
|
|
33.33%
|
||||||||||||||||||||||
|
% Adjust
|
% Adjust
|
$/mWh
|
|
Cap Add Adjustment Factor =
|
Column F
|
50.00%
|
||||||||||||||||||||||||
|
Pre
|
|
0.00%
|
0.00%
|
$0.00
|
|
|
|
33.33%
|
OMYA
|
|
Cum PV
|
Cum Nominal
|
Cum Nominal
|
Cum PV
|
||||||||||||||||
|
Base
|
Base
|
Cap Add
|
Pre to Post
|
Base
|
Scenario
|
Scenario
|
Scenario
|
REC
|
Scenario
|
Scenario
|
CV
|
OMYA
|
Contribution to
|
OMYA
|
Customer
|
CV
|
OMYA
|
OMYA
|
Customer
|
|||||||||||
|
Price
|
Output
|
Output
|
Cap Add
|
Revenue
|
Price
|
Output
|
REC Price
|
Revenue
|
Revenue
|
Fund
|
Share
|
Gross Share
|
Repay Fund
|
Net Share
|
Share
|
Share
|
Gross Share
|
Net Share
|
Share
|
CV
|
OMYA
|
|||||||||
|
$/mWh
|
mWh
|
Mwh
|
Ratio
|
$$$
|
$/mWh
|
mWh
|
$/mWh
|
$$$
|
$$$
|
$$$
|
$$$
|
$$$
|
$$$
|
$$$
|
$$$
|
$$$
|
$$$
|
$$$
|
$$$
|
Scalar
|
Scalar
|
|||||||||
|
|
|
|
|
|
||||||||||||||||||||||||||
|
2011
|
50.68
|
*******
|
58,584
|
1.00
|
*******
|
*******
|
58,584
|
0.00
|
0
|
*******
|
0
|
0
|
0
|
0
|
0
|
0
|
0
|
0
|
0
|
0
|
0.33
|
0.33
|
||||||||
|
2012
|
52.97
|
*******
|
59,700
|
1.05
|
*******
|
*******
|
56,700
|
0.00
|
0
|
*******
|
0
|
0
|
0
|
0
|
0
|
0
|
0
|
0
|
0
|
0
|
0.33
|
0.33
|
||||||||
|
2013
|
56.23
|
*******
|
59,700
|
0.91
|
*******
|
*******
|
65,400
|
0.00
|
0
|
*******
|
0
|
0
|
0
|
0
|
0
|
0
|
0
|
0
|
0
|
0
|
0.33
|
0.33
|
||||||||
|
2014
|
57.22
|
*******
|
65,300
|
0.94
|
*******
|
*******
|
69,800
|
0.00
|
0
|
*******
|
0
|
0
|
0
|
0
|
0
|
0
|
0
|
0
|
0
|
0
|
0.33
|
0.33
|
||||||||
|
2015
|
59.58
|
*******
|
65,300
|
0.94
|
*******
|
*******
|
69,800
|
0.00
|
0
|
*******
|
0
|
0
|
0
|
0
|
0
|
0
|
0
|
0
|
0
|
0
|
0.33
|
0.33
|
||||||||
|
2016
|
61.92
|
*******
|
65,300
|
0.96
|
*******
|
*******
|
68,100
|
0.00
|
0
|
*******
|
0
|
0
|
0
|
0
|
0
|
0
|
0
|
0
|
0
|
0
|
0.33
|
0.33
|
||||||||
|
2017
|
63.62
|
*******
|
65,300
|
0.92
|
*******
|
*******
|
71,100
|
0.00
|
0
|
*******
|
0
|
0
|
0
|
0
|
0
|
0
|
0
|
0
|
0
|
0
|
0.33
|
0.33
|
||||||||
|
2018
|
65.05
|
*******
|
65,300
|
0.92
|
*******
|
*******
|
71,100
|
0.00
|
0
|
*******
|
0
|
0
|
0
|
0
|
0
|
0
|
0
|
0
|
0
|
0
|
0.33
|
0.33
|
||||||||
|
2019
|
68.81
|
*******
|
65,300
|
0.92
|
*******
|
*******
|
71,100
|
0.00
|
0
|
*******
|
0
|
0
|
0
|
0
|
0
|
0
|
0
|
0
|
0
|
0
|
0.33
|
0.33
|
||||||||
|
2020
|
72.41
|
*******
|
65,300
|
0.92
|
*******
|
*******
|
71,100
|
0.00
|
0
|
*******
|
0
|
0
|
0
|
0
|
0
|
0
|
0
|
0
|
0
|
0
|
0.33
|
0.33
|
||||||||
|
2021
|
76.30
|
*******
|
65,300
|
0.92
|
*******
|
*******
|
71,100
|
0.00
|
0
|
*******
|
0
|
0
|
0
|
0
|
0
|
0
|
0
|
0
|
0
|
0
|
0.33
|
0.33
|
||||||||
|
2022
|
77.96
|
*******
|
65,300
|
0.92
|
*******
|
*******
|
71,100
|
0.00
|
0
|
*******
|
0
|
0
|
0
|
0
|
0
|
0
|
0
|
0
|
0
|
0
|
0.33
|
0.33
|
||||||||
|
2023
|
80.93
|
*******
|
65,300
|
0.92
|
*******
|
*******
|
71,100
|
0.00
|
0
|
*******
|
0
|
0
|
0
|
0
|
0
|
0
|
0
|
0
|
0
|
0
|
0.33
|
0.33
|
||||||||
|
2024
|
84.24
|
*******
|
65,300
|
0.92
|
*******
|
*******
|
71,100
|
0.00
|
0
|
*******
|
0
|
0
|
0
|
0
|
0
|
0
|
0
|
0
|
0
|
0
|
0.33
|
0.33
|
||||||||
|
2025
|
87.57
|
*******
|
65,300
|
0.92
|
*******
|
*******
|
71,100
|
0.00
|
0
|
*******
|
0
|
0
|
0
|
0
|
0
|
0
|
0
|
0
|
0
|
0
|
0.33
|
0.33
|
||||||||
20