Attached files
Table of Contents
UNITED STATES SECURITIES AND EXCHANGE COMMISSION
WASHINGTON, D.C. 20549
Form 10-K
x ANNUAL REPORT PURSUANT TO SECTION 13 OR 15(d) OF THE SECURITIES EXCHANGE ACT OF 1934
For the Fiscal Year Ended December 31, 2010
OR
¨ TRANSITION REPORT PURSUANT TO SECTION 13 OR 15(d) OF THE SECURITIES EXCHANGE ACT OF 1934
For the transition period from to
Commission File Number: 1-7665

Lydall, Inc.
(Exact name of registrant as specified in its charter)
| Delaware |
06-0865505 | |
| (State or Other Jurisdiction of Incorporation or Organization) |
(I.R.S. Employer Identification No.) | |
| One Colonial Road, Manchester, Connecticut |
06042 | |
| (Address of principal executive offices) |
(Zip code) | |
Registrant’s telephone number, including area code: (860) 646-1233
Securities registered pursuant to Section 12(b) of the Act:
| Title of each class |
Name of each exchange on which registered | |
| Common Stock, $.10 par value |
New York Stock Exchange |
Securities registered pursuant to Section 12(g) of the Act: None
Indicate by check mark if the registrant is a well-known seasoned issuer, as defined in Rule 405 of the Securities Act. Yes ¨ No x
Indicate by check mark if the registrant is not required to file reports pursuant to Section 13 or Section 15(d) of the Exchange Act. Yes ¨ No x
Indicate by check mark whether the registrant (1) has filed all reports required to be filed by Section 13 or 15(d) of the Securities Exchange Act of 1934 during the preceding 12 months (or for such shorter period that the registrant was required to file such reports), and (2) has been subject to such filing requirements for the past 90 days. Yes x No ¨
Indicate by check mark whether the registrant has submitted electronically and posted on its corporate Web site, if any, every Interactive Data File required to be submitted and posted pursuant to Rule 405 of Regulation S-T (§232.405 of this chapter) during the preceding 12 months (or for such shorter period that the registrant was required to submit and post such files). Yes ¨ No ¨
Indicate by check mark if disclosure of delinquent filers pursuant to Item 405 of Regulation S-K (§229.405 of this chapter) is not contained herein, and will not be contained, to the best of the registrant’s knowledge, in definitive proxy or information statements incorporated by reference in Part III of this Form 10-K or any amendment to this Form 10-K. x
Indicate by check mark whether the registrant is a large accelerated filer, an accelerated filer, a non-accelerated filer, or a smaller reporting company. See definitions of “large accelerated filer”, “accelerated filer” and “smaller reporting company” in Rule 12b-2 of the Exchange Act.
|
Large accelerated filer ¨ |
Non-accelerated filer ¨ |
Accelerated filer x |
Smaller reporting company ¨ |
Indicate by check mark whether the registrant is a shell company (as defined in Rule 12b-2 of the Exchange Act). Yes ¨ No x
On June 30, 2010, the aggregate market value of the Registrant’s voting stock held by nonaffiliates was $126,451,703 based on the New York Stock Exchange closing price on that date. For purposes of this calculation, the Registrant has assumed that its directors and executive officers are affiliates.
On February 15, 2011, there were 17,133,751 shares of Common Stock outstanding, exclusive of treasury shares.
DOCUMENTS INCORPORATED BY REFERENCE
Part III incorporates information by reference to the definitive Proxy Statement to be distributed in connection with the Registrant’s Annual Meeting of Stockholders to be held on April 29, 2011.
The exhibit index is located on pages 38-40.
Table of Contents
INDEX TO ANNUAL REPORT ON FORM 10-K
Year Ended December 31, 2010
| Page Number |
||||||
| Item 1. |
1 | |||||
| Item 1A. |
4 | |||||
| Item 1B. |
8 | |||||
| Item 2. |
8 | |||||
| Item 3. |
9 | |||||
| Item 4. |
9 | |||||
| 10 | ||||||
| Item 5. |
11 | |||||
| Item 6. |
14 | |||||
| Item 7. |
Management’s Discussion and Analysis of Financial Condition and Results of Operations |
15 | ||||
| Item 7A. |
34 | |||||
| Item 8. |
34 | |||||
| Item 9. |
Changes in and Disagreements With Accountants on Accounting and Financial Disclosure |
35 | ||||
| Item 9A. |
35 | |||||
| Item 9B. |
36 | |||||
| Item 10. |
37 | |||||
| Item 11. |
37 | |||||
| Item 12. |
Security Ownership of Certain Beneficial Owners and Management and Related Stockholder Matters |
37 | ||||
| Item 13. |
Certain Relationships and Related Transactions, and Director Independence |
37 | ||||
| Item 14. |
37 | |||||
| Item 15. |
38 | |||||
| 41 | ||||||
The information called for by Items 10, 11, 12, 13 and 14, to the extent not included in this document, is incorporated herein by reference to such information included in the Company’s definitive Proxy Statement to be filed with the Securities and Exchange Commission and distributed in connection with Lydall, Inc.’s 2011 Annual Meeting of Stockholders to be held on April 29, 2011.
Table of Contents
Lydall, Inc. and its subsidiaries are hereafter collectively referred to as “Lydall,” the “Company” or the “Registrant.”
Lydall, Inc. has been incorporated in Delaware since 1987 after originally being incorporated in Connecticut in 1969. The principal executive offices are located in Manchester, Connecticut. The Company’s subsidiaries design and manufacture specialty engineered filtration media, industrial thermal insulating solutions, automotive thermal and acoustical barriers, temperature-control equipment, medical filtration media and devices and biopharmaceutical processing components for thermal/acoustical, filtration/separation and bio/medical applications.
Lydall serves a number of markets. The Company’s products are primarily sold directly to customers through an internal sales force and external sales representatives and distributed via common carrier. The majority of products are sold to original equipment manufacturers and tier-one suppliers. The Company competes through high-quality, specialty engineered innovative products and exceptional customer service. Lydall has a number of domestic and foreign competitors for its products, most of whom are either privately owned or divisions of larger companies, making it difficult to determine the Company’s share of the markets served.
Thermal/Acoustical segment sales to the automotive market represented 53.0% of Lydall’s net sales in 2010, 51.3% in 2009 and 53.5% in 2008. Sales to Ford Motor Company were $35.0 million and $24.1 million, or approximately 10% of Lydall’s 2010 and 2009 net sales, respectively. Sales to Volkswagen were approximately 10% of net sales in 2008. Sales to Chrysler were approximately 10% of net sales in 2008. No other single customer accounted for more than 10% of the Company’s net sales in 2010, 2009 or 2008.
Foreign and export sales were 49.9% of net sales in 2010, 50.3% in 2009 and 53.2% in 2008. Export sales primarily to Europe, Asia, Mexico and Canada were $46.2 million, $28.8 million and $44.0 million in 2010, 2009 and 2008, respectively. Foreign sales were $122.4 million, $96.3 million and $118.5 million for the years ended December 31, 2010, 2009 and 2008, respectively. The increase in export sales during 2010 was primarily related to higher export sales to Canada, China and Mexico in the Performance Materials and Thermal/Acoustical segments as a result of markets beginning to recover from the global economic recession. The increase in foreign net sales during 2010 was primarily from the Germany automotive facility, included in the Thermal/Acoustical segment.
Foreign operations generated operating income of $11.0 million, $1.6 million and $8.3 million for the years ended December 31, 2010, 2009 and 2008, respectively. Total foreign assets were $94.1 million at December 31, 2010 compared with $97.6 million at December 31, 2009.
The Company’s Annual Reports on Form 10-K, Quarterly Reports on Form 10-Q, Current Reports on Form 8-K and Proxy Statements are made available free of charge through the Investor Relations section of the Company’s Internet website at www.lydall.com after such material is electronically filed with, or furnished to, the Securities and Exchange Commission (the “Commission”) and are also available on the Commission’s website at www.sec.gov. Additionally, the public may read and copy any materials the Company files with the Commission at the Commission’s Public Reference room located at 100 F Street, N.E., Washington, D.C. 20549. The public may obtain information on the operation of the Public Reference Room by calling the Commission at 1-800-SEC-0330.
The Company’s Code of Ethics and Business Conduct for all employees and its Code of Ethics for the Chief Executive Officer, Senior Financial Officers and All Accounting and Financial Personnel can be obtained free of charge on the Company’s website under the Corporate Governance section or by contacting the Office of the General Counsel, P.O. Box 151, One Colonial Road, Manchester, CT 06045-0151.
SEGMENTS
The Company’s reportable segments are Performance Materials and Thermal/Acoustical. The Thermal/Acoustical segment reports the results of Lydall’s automotive businesses. The Performance Materials segment reports the results of the filtration and industrial thermal insulation businesses. All other businesses are aggregated in Other Products and Services (“OPS”).
1
Table of Contents
Performance Materials
The Performance Materials segment includes filtration media solutions for air, fluid power, industrial and life science applications and industrial thermal insulation solutions for building products, appliances, and energy and industrial markets.
Lydall air filtration products include LydAir®MG (Micro-Glass), LydAir®MB (Melt Blown), LydAir®SC (Synthetic Composite) and Arioso™ (Membrane Composite) media. These products constitute the critical media component of clean-air systems for applications in clean-space, commercial, industrial and residential HVAC, power generation, industrial processes and protection/respiratory devices. Lydall has leveraged its extensive technical expertise and applications knowledge into a suite of media products covering the vast liquid filtration landscape across the engine and industrial and life science fields. The LyPore® and activated carbon containing ActiPure® media series address a variety of application needs including hydraulic filters, air-water and air-oil coalescing, industrial fluid processes, diesel filtration, biopharmaceutical pre-filtration and clarification, diagnostic tests, and drinking water filtration. The Company also manufactures Lydall Solupor® specialty microporous membranes that are utilized in various markets and applications including batteries, fuel cells and supercapacitors, air and liquid filtration, and transdermal drug delivery. Solupor® membranes are based on ultra-high molecular weight polyethylene and incorporate an uncommon combination of mechanical strength, chemical inertness, and high porosity in a unique open structure.
The industrial thermal insulation business develops unique high performance nonwoven veils, papers, mats and specialty composites for the building products, appliance, and energy and industrial markets. The Manniglas® brand is diverse in its product application ranging from high temperature seals and gaskets in ovens and ranges to specialty veils for HVAC and cavity wall insulation. appLY™ Mat has been developed to expand Lydall’s high temperature technology portfolio for broad application into the appliance market and supplements the Lytherm™ product brand, traditionally utilized in the industrial market for kilns and furnaces used in metal processing. Lydall’s CryothermTM, CRS-WrapTM and CryoliteTM products are industry standards for state-of-the-art cryogenic insulation designs used by manufacturers of cryogenic equipment for liquid gas storage, piping and transportation.
Net sales from the Performance Materials segment represented 36.4% of Lydall’s net sales in 2010 compared with 39.4% in 2009 and 36.5% in 2008. Net sales generated by the international operations of the Performance Materials segment accounted for 29.8%, 29.8% and 27.6% of segment net sales in 2010, 2009 and 2008, respectively.
Thermal/Acoustical
The Thermal/Acoustical segment offers a full line of innovative engineered products to assist in noise and heat abatement within the transportation sector. Lydall products are found in the interior (Dash insulators), underbody (fuel tank, exhaust) and underhood (engine compartment) of cars, trucks, SUV’s, heavy duty trucks and recreational vehicles. Lydall’s patented products include ZeroClearance®, AMS®, Flexshield® and dBCore® comprising of organic and inorganic fiber composites as well as metal combinations.
Thermal/Acoustical segment net sales represented 53.0% of the Company’s net sales in 2010, 51.3% in 2009 and 53.5% in 2008. Net sales generated by international operations of the Thermal/Acoustical segment accounted for 46.2%, 51.4% and 52.4% of segment net sales in 2010, 2009 and 2008, respectively.
Other Products and Services
The components of OPS are Lydall’s Vital Fluids business and Affinity® temperature control equipment (“Affinity”) business.
The Vital Fluids business serves the life science industry offering specialty products for blood transfusion and cell therapy applications as well as Bio-Pak® single-use bioprocessing containers for containment of media, buffers and bulk intermediates used in biotech, pharmaceutical and diagnostic reagent manufacturing processes. Vital Fluids also offers Cell-Freeze®, a medical device used for cryogenic storage of peripheral blood stem cells. Its medical filter materials products are utilized in traditional blood filtration devices such as cardiotomy reservoirs and autotransfusion filters. Other products include specialty blood transfusion products, as well as medical filtration components used for surgical procedures.
The Affinity business designs and manufactures high precision, specialty engineered temperature-control equipment, including standard, configurable models, for demanding semiconductor, pharmaceutical, life sciences and industrial applications.
2
Table of Contents
OPS net sales were 11.1% of the Company’s net sales in 2010 compared with 9.6% in 2009 and 10.4% in 2008. Net sales generated by the international operations of OPS accounted for 7.9%, 6.2% and 6.1% of OPS net sales in 2010, 2009 and 2008, respectively.
OTHER INFORMATION
During 2011, the Company is implementing internal organizational changes in its Performance Materials and Vital Fluids businesses to better align the Company’s structure with its strategic direction. Lydall is integrating operational activities and realigning sales and marketing responsibilities within and across these two businesses. In 2011, the Company expects that the Vital Fluids business will be included in the operating results of the Performance Materials segment.
GENERAL BUSINESS INFORMATION
Lydall holds a number of patents, trademarks and licenses. While no single patent, trademark or license is critical to the success of Lydall, together these intangible assets are of considerable value to the Company.
The Company’s business is generally not seasonal; however, results of operations are impacted by shutdowns at its European operations and at its North American and European automotive customers that typically occur in the third and fourth quarters of each year. Lydall maintains levels of inventory and grants credit terms that are normal within the industries it serves. The Company uses a wide range of raw materials in the manufacturing of its products. The majority of raw materials used are generally available from a variety of suppliers.
The Company invested $8.7 million in 2010, $7.9 million in 2009 and $8.5 million in 2008, or approximately 3% of net sales for all years, in research and development to develop new products and to improve existing products. All amounts were expensed as incurred. Most of the investment in research and development is application specific. There were no significant customer-sponsored research and development activities during the past three years.
Backlog at January 31, 2011 was $55.7 million. Lydall’s backlog was $49.0 million at December 31, 2010, $26.3 million at December 31, 2009 and $18.0 million at December 31, 2008. Thermal/Acoustical segment backlog, comprising the global automotive business, included in Lydall’s backlog was $31.8 million, $12.2 million and $8.2 million at December 31, 2010, 2009 and 2008, respectively. Thermal/Acoustical backlog may be impacted by various assumptions, including future automotive production volume estimates, changes in program launch timing and changes in customer development plans. The Company believes that global automotive orders for a two month period represent a reasonable timeframe to be deemed as firm orders and included as Thermal/Acoustical segment backlog. The increase in Lydall’s backlog at December 31, 2010 compared with December 31, 2009 was due to a significant improvement in demand from customers beginning to recover from the global economic recession and market share gains in certain markets served by the Company. There are minimal seasonal aspects to Lydall’s backlog as of the end of the Company’s fiscal years.
No material portion of Lydall’s business is subject to renegotiation of profits or termination of contracts or subcontracts at the election of any governmental body.
Lydall believes that its plants and equipment are in substantial compliance with applicable federal, state and local provisions that have been enacted or adopted regulating the discharge of materials into the environment, or otherwise relating to the protection of the environment.
As of December 31, 2010, Lydall employed approximately 1,600 people. Four unions with contracts expiring on March 31, 2012 represent 67 employees in the United States. All employees at the facilities in France and the Netherlands are covered under a National Collective Bargaining Agreement. Certain salaried and all hourly employees in Germany are also covered under a National Collective Bargaining Agreement. Lydall considers its employee relationships to be satisfactory and did not have any actual or threatened work stoppages due to union-related activities in 2010.
There are no significant anticipated operating risks related to foreign investment law, expropriation, or availability of material, labor or energy. The foreign and domestic operations limit foreign currency exchange transaction risk by completing transactions in functional currencies whenever practical or through the use of foreign currency forward exchange contracts when deemed appropriate.
3
Table of Contents
The reader should carefully review and consider the risk factors discussed below. Any and all of these risk factors could materially affect the Company’s business, financial condition, future results of operations or cash flows and possibly lead to a decline in Lydall’s stock price. The risks, uncertainties and other factors described below constitute all material risk factors known to management as of the date of this report.
The Company’s Ability to Accurately Report its Financial Results may be Adversely Affected by the Lack of Effective Internal Controls and Procedures – At December 31, 2010, the Company had a material weakness in internal control over financial reporting. In connection with the preparation and filing of the third quarter 2010 Form 10-Q, the Company’s Chief Executive Officer and Chief Financial Officer concluded that the disclosure controls and procedures were not effective as of September 30, 2010 because of a material weakness in its internal control over financial reporting described in Item 4 of the Form 10-Q filed on November 5, 2010. As described in Item 9A of this Annual Report on Form 10-K, management believes that at December 31, 2010, enhancements have been made to strengthen the disclosure controls and procedures. Because the reliability of the internal control process requires repeatable execution, the successful remediation of this material weakness will require review and evidence of effectiveness prior to management concluding that the controls are now effective. Some of the enhancements that have been implemented by management in the fourth quarter of 2010 have not been in place for a sufficient period of time to demonstrate that their effectiveness is sustainable. Therefore, additional time is required to validate that the material weakness is fully remediated. Until management is able to ensure the effectiveness of the Company’s disclosure controls and procedures, the material weakness may materially adversely affect the Company’s ability to report accurately its financial information in a timely and reliable manner.
Worldwide Economic Cycles – Worldwide economic cycles affect the markets that the Company’s businesses serve and could affect demand for the Company’s products and impact profitability. Among other factors, disruptions in the global credit and financial markets, including diminished liquidity and credit availability, swings in consumer confidence and spending, unstable economic growth and fluctuations in unemployment rates could cause further economic instability and could have a negative impact on the Company’s results of operations, financial condition and liquidity and make it difficult to accurately forecast and plan future business activities. Demand for the Company’s products may be affected by continued uncertainty regarding the overall economic outlook for both U.S. and non-U.S. economies.
Quarterly Results – The Company’s quarterly results are subject to significant fluctuations. Operating results may fluctuate as a result of many factors, including size and timing of orders and shipments, loss of significant customers, product mix, technological change, operational efficiencies and inefficiencies, competition and general economic conditions. In addition, if revenues and asset utilization decrease, the absorption of the Company’s fixed costs will negatively impact gross margins.
Thermal/Acoustical Segment – Supplier to the Global Automotive Market – The Company’s Thermal/Acoustical segment, a vendor to the automotive market, accounted for approximately 53% of consolidated net sales in 2010. Approximately 54% of segment net sales were manufactured in North America and 46% were manufactured in Europe. Among other factors, the Company’s automotive business could be impacted by:
| • | Global economic uncertainties and swings in consumer spending; |
| • | A continuation of gross margin losses on fiber based products at its North American automotive facility. Fiber-based products were negatively impacted by higher manufacturing costs during 2010, including increases in raw material costs, abnormally high labor and overtime costs, material usage inefficiencies and excessive scrap on production lines, significant freight expediting and inspection costs; |
| • | The degree of success of actions aimed at improving the gross margins of fiber based products at the North American automotive facility as there is no assurance that depressed operating results for the Thermal/Acoustical segment will not continue in 2011; |
| • | An inability to satisfy the demand for the Company’s fiber-based products at the North American automotive facility, including on time delivery requirements, resulting in customer claims and contract penalties. Additionally, product quality could be impaired by the Company’s efforts to rapidly ramp up production necessary to satisfy a dramatic increase in demand; |
| • | Impairment of the Company’s relations with the automotive manufacturers and its status as an approved supplier to the automotive manufacturers as the result of the Company’s failure to satisfy current and expected demand and/or incur |
4
Table of Contents
| product quality issues. An impairment of the Company’s status as an approved supplier could result in the loss of future business; |
| • | The inability of the Company to realize the expected benefits from investments it has made in capital equipment to respond to the increased demand for the Company’s fiber-based automotive products; |
| • | Financial uncertainties faced by automakers and other automotive customers, as well as labor unrest and supply chain disruptions in the automotive industry; |
| • | The failure of an automaker to timely, or ever, pay the Company amounts owed, especially since receivables from automakers often comprise a material portion of overall account receivable; |
| • | The Company’s dependence on sales to large automotive manufacturers who have substantial bargaining power with respect to price, volume and other commercial terms. In the event customers obtain price decreases from Lydall, Lydall may not be able to offset such reduction by decreases in its costs of goods sold; |
| • | The sourcing by automotive OEM’s of parts from lower cost countries, in which Lydall does not operate. |
Restructurings and Cost Reduction Activities – During 2009, Lydall implemented certain measures to address slowdowns in the markets for most of its products, including a consolidation of facilities and headcount reductions. The Company cannot assure that, if production levels continue to increase, measures implemented in 2009 will not result in unforeseen costs, disruptions in operations or have other negative effects.
Manufacturing Efficiencies – The Company operates a number of manufacturing facilities. The equipment and systems necessary for such operations may break down, perform poorly or fail, causing fluctuations in manufacturing efficiencies. Such fluctuations could affect the Company’s ability to deliver products to customers on a timely basis, which could have a material adverse effect on the Company’s financial condition or results of operations.
Cyclical Business – Lydall’s Affinity business, which provides capital equipment for the semiconductor and other industries, experienced a significant increase in customer demand in 2010 and may not be able to satisfy this demand or otherwise deliver products on time. The Affinity business is subject to, and affected by, dramatic swings in demand in the historically cyclical semiconductor industry. As a result, it is possible that demand for Affinity products, which has recently increased, could significantly decrease in the future.
Liquidity and Capital Resources – The Company may not have adequate cash to fund its operating requirements. The principal source of liquidity is operating cash flows. In addition to operating cash flows, other significant factors that affect the overall management of liquidity include capital expenditures, investments in businesses, acquisitions, income tax payments, pension funding, outcomes of contingencies and availability of lines of credit and long-term financing. The Company’s liquidity can be impacted by the Company’s ability to:
| • | Manage working capital and the level of future profitability. The consolidated cash balance is impacted by capital equipment and inventory investments that may be made in response to changing market conditions; |
| • | Satisfy covenants and other obligations under its Domestic Credit Facility, which could limit or prohibit Lydall’s ability to borrow funds under the Domestic Credit Facility. Additionally, these debt covenants and other obligations could limit the Company’s ability to make acquisitions, incur additional debt, make investments, or consummate asset sales; |
| • | Obtain additional financing from other sources. |
Raw Material Pricing and Supply – Raw material pricing and supply issues could affect all of the Company’s businesses. The Thermal/Acoustical segment uses aluminum and other metals to manufacture most of its automotive heat shields. The Thermal/Acoustical and Performance Materials segments use various fibers in manufacturing its products. If the prices of these raw materials increase, the Company may not have the ability to pass incremental cost increases on to its customers, thus negatively impacting Lydall’s financial results. In addition, an interruption in the ability of the Company to source these materials could negatively impact operations and sales.
Energy Pricing – Increases in energy pricing can affect all of the Company’s businesses. Higher energy costs at the Company’s manufacturing plants or higher energy costs passed on from the Company’s vendors could impact each business’ profitability.
5
Table of Contents
International Operations – The Company believes that in order to be competitive and grow its businesses, it needs to maintain significant international operations. Foreign sales were $122.4 million, $96.3 million, and $118.5 million in 2010, 2009 and 2008, respectively. Operations outside the United States may be subject to inherent risks including political and economic conditions in various countries, unexpected changes in regulatory requirements, longer accounts receivable collection cycles and potentially adverse tax consequences.
Foreign Currency Exchange Rate Fluctuations – Transactions in non-functional currencies may be affected by exchange rate fluctuations. The Company’s primary currency exposure is to the Euro. The Company’s foreign and domestic operations limit foreign currency exchange transaction risk by completing transactions in functional currencies whenever practical or through the use of foreign currency forward exchange contracts when deemed appropriate. If the Company is not able to successfully hedge its currency exposure, changes in the rate of exchange between these foreign currencies and the U.S. dollar may negatively impact the Company. Additionally, translation of the results of operations and financial condition of its foreign operations into U.S. dollars may be affected by exchange rate fluctuations. The Company receives a material portion of its revenue from foreign operations. The Company’s reported results of operations and financial condition are subject to changes in the exchange relationship between the U.S. dollar and any applicable foreign currency. Such changes can affect the Company’s results of operations and assets and liabilities as reported in its financial statements.
Company Resources – The industries in which Lydall sells its products are highly competitive and many of the competitors are affiliated with entities that are substantially larger and that have greater financial, technical and marketing resources. The Company’s more limited resources and relatively diverse product mix may limit or impair its ability to capitalize on changes in technology, competition and pricing.
New Product Introductions – Improved performance and growth are partially dependent on new product introductions planned for the future. Delays in developing products and long customer qualification cycles may impact the success of new product programs. The degree of success of new product programs could materially impact the Company’s future results.
Product Performance – In the event that the Company’s products fail to perform as expected, the Company may be subject to warranty claims from its customers. If such failure results in, or is alleged to result in, bodily injury and/or property damage or other losses, the Company may be subject to product liability lawsuits, product recalls and other claims, any of which could have a material impact on results of operations and cash flows.
Strategic Initiatives – As part of Lydall’s business strategy, the Company continues to review various strategic and business opportunities to grow the business and evaluates the profitability and growth potential for each of its existing businesses. The Company cannot predict with certainty whether any recent or future strategic transactions will be beneficial to the Company. Future performance could be impacted by the Company’s ability to:
| • | Obtain adequate financing to fund strategic initiatives, which could be difficult to obtain; |
| • | Identify and effectively complete strategic transactions; |
| • | Successfully integrate and manage acquired businesses that involve numerous operational and financial risks, including difficulties in the assimilation of acquired operations, diversion of management’s attention from other business concerns, managing assets in multiple geographic regions and potential loss of key employees and key customers of acquired operations. |
Attracting and Retaining Key Employees – The Company’s success, in part, depends on key managerial, engineering, sales and marketing and technical personnel and its ability to continue to attract and retain additional personnel. The loss of certain key personnel could have a material, adverse effect upon the Company’s business and results of operations. There is no assurance that Lydall can retain its key employees or that it can attract competent and effective new or replacement personnel in the future.
Key Management Changes to Business Segments – In 2011, the Company is implementing internal organizational changes in its Performance Materials and Vital Fluids businesses. In order to better align the Performance Materials and Vital Fluids businesses with the Company’s strategic direction, Lydall is integrating operational activities and realigning sales and marketing responsibilities. The Company’s ability to effectively and efficiently implement these changes could impact these businesses’ operations and customer relations.
6
Table of Contents
Accounting Estimates – Estimates and assumptions may affect the reserves that the Company has established to cover uncollectible accounts receivable, excess or obsolete inventory, income tax valuation and fair market value write downs of certain assets and various liabilities. Actual results could differ from those estimates.
Lean Six Sigma Initiatives – The Company’s Lean Six Sigma program is intended to improve processes and work flow, improve customer service, reduce costs and leverage synergies across the Company to improve operating margins. There is no assurance that future Lean Six Sigma initiatives will result in improved operating margins.
Environmental Laws and Regulations – The Company is subject to federal, state, local, and foreign environmental, and health and safety laws and regulations that affect ongoing operations. In order to maintain compliance with such requirements, Lydall may incur increased capital costs and operating expenses. In addition, new laws and regulations, including legislation and regulation regarding climate change, discovery of previously unknown contamination, or the imposition of new clean-up requirements could require the Company to incur costs or become subject to new or increased liabilities that could have a material impact on results of operations and cash flows.
Intellectual Property – Lydall owns intellectual property, including patents and trademarks, which play an important role in helping the Company to maintain its competitive position in a number of markets. The Company is subject to risks with respect to (i) changes in the intellectual property landscape of markets in which it competes; (ii) the potential assertion of intellectual property-related claims against Lydall; (iii) the failure to maximize or successfully assert its intellectual property rights; and (iv) significant technological developments by others.
Legal Proceedings – The Company is involved in legal proceedings that, from time to time, are significant. These proceedings may include, without limitation, commercial or contractual disputes, intellectual property matters, personal injury claims and employment matters. No assurances can be given that such proceedings and claims will not have a material adverse impact on the Company’s results of operations and cash flows.
Tax Rate Changes – The Company is subject to risks with respect to changes in tax law and rates, changes in rules related to accounting for income taxes, or adverse outcomes from tax audits that may be in process in any of the jurisdictions in which the Company operates. In addition, certain jurisdictions have statutory rates greater than or less than the United States statutory rate. Changes in the mix and source of earnings between jurisdictions could have a significant impact on the overall effective tax rate in future periods.
Disruptions to the Company’s Operations Relating to Information Technology – The capacity, reliability and security of the Company’s information technology hardware and software infrastructure and the ability to expand and update this infrastructure in response to the Company’s changing needs are important to the operation of the businesses. Any failure of, or inadequacy in, the information technology infrastructure could harm Lydall’s businesses and negatively impact results of operations and cash flows.
The Company’s Ability to Effectively Upgrade Its Enterprise Resource Planning (“ERP”) System – In response to a review of its IT infrastructure, the Company has undertaken a project to upgrade its ERP system. The deployment, implementation and integration to a new version of its ERP system may not be managed in an efficient, timely and cost effective manner resulting in greater than anticipated costs and other operating difficulties.
Disruptions to the Company’s Operations – A major disruption caused by acts of war, global warming, terrorist attacks, the threat of domestic and international terrorist attacks, a natural disaster, a fire, or labor strikes and work stoppages at any of the Company’s facilities could result in a prolonged interruption of its business. Certain employees in the United States and Germany and all employees in France and the Netherlands are covered by one or more collective bargaining agreements. Widespread work stoppages or a major strike could have a direct negative impact on the Company’s ability to conduct business, continue production and on its operating results.
7
Table of Contents
Item 1B. UNRESOLVED STAFF COMMENTS
None
The principal properties of the Company as of December 31, 2010 are situated at the following locations and have the following characteristics:
| Location | Primary Business Segment/General Description | Type of Interest |
||||
| Hamptonville, North Carolina |
Thermal/Acoustical – Product Manufacturing |
Owned | ||||
| Yadkinville, North Carolina |
Thermal/Acoustical – Product Manufacturing |
Leased | ||||
| St. Johnsbury, Vermont |
Thermal/Acoustical – Formerly Product Manufacturing |
Leased | ||||
| Meinerzhagen, Germany |
Thermal/Acoustical – Product Manufacturing |
Owned | ||||
| Saint-Nazaire, France |
Thermal/Acoustical – Product Manufacturing |
Leased | ||||
| Green Island, New York |
Performance Materials – Specialty Media Manufacturing |
Owned | ||||
| Rochester, New Hampshire |
Performance Materials – Specialty Media Manufacturing |
Owned | ||||
| Saint-Rivalain, France |
Performance Materials – Specialty Media Manufacturing |
Owned | ||||
| Geleen, the Netherlands |
Performance Materials – Specialty Media Manufacturing |
Leased | ||||
| Heerlen, the Netherlands |
Performance Materials – Specialty Media Manufacturing |
Leased | ||||
| Winston-Salem, North Carolina |
Other Products and Services – Biomedical Products Manufacturing |
Leased | ||||
| Ossipee, New Hampshire |
Other Products and Services – Product Manufacturing |
Owned | ||||
| Manchester, Connecticut |
Corporate Office |
Owned | ||||
For information regarding lease obligations, see Note 17 to the Consolidated Financial Statements. Lydall considers its properties to be in good operating condition and suitable and adequate for its present needs. Except for the Company’s Vermont facility, all properties are being appropriately utilized consistent with experience and demand for the Company’s products. During 2009, the Company completed the consolidation of its Vermont manufacturing facility into its Hamptonville, North Carolina facility and ceased operations at the Vermont facility. Remaining lease payments for the Vermont facility will occur through the third quarter of 2011. In addition to the properties listed above, the Company has several leases for sales offices and warehouses in the United States, Europe and Asia.
8
Table of Contents
A suit was filed against a subsidiary of the Company on March 31, 2005, in the Vermont Superior Court by a safety equipment supplier, by and through its alleged assignee, a non-employee temporary worker, with respect to personal injuries allegedly suffered by the alleged assignee. The plaintiff alleges that the Company subsidiary removed safety equipment that would have prevented the injury. The Vermont Superior Court granted two motions for partial summary judgment filed by the Company. In December 2007, the plaintiff appealed to the Vermont Supreme Court. The Vermont Supreme Court issued an order on September 4, 2009, overturning the lower Court’s grant of summary judgment in the Company’s favor and remanding the case back to the Superior Court for further proceedings. On August 20, 2010, the Company filed a third party complaint against Stamp Tech asserting claims for breach of contract and negligence related to Stamp Tech’s installation of a safety device on the equipment that allegedly injured the plaintiff. The Company also claims that Stamp Tech is bound to defend and indemnify the Company for the plaintiff’s injuries. Stamp Tech filed an answer denying the Company’s claims on or about October 12, 2010 and a Motion to Dismiss the Company’s Third Party Complaint on January 12, 2011. A trial ready date has been set for March, 2011.
The Company believes that it has meritorious defenses to the above claim and intends to contest it vigorously. While it is not possible to predict or determine the outcome of the claim or to provide possible ranges of losses that may arise, the Company believes the losses associated with this action will not have a material adverse effect on the Company’s consolidated financial position or liquidity, but could possibly be material to its consolidated results of operations of any one period. As of December 31, 2010, there were no reserves recorded by the Company related to this claim because the Company believes a loss is not probable as the claim is without merit.
In addition to the above, from time-to-time the Company is subject to legal proceedings, claims and investigations that arise in the ordinary course of business such as, but not limited to, patent, employment, personal injury, commercial and environmental matters. Although there can be no assurance, the Company is not aware of any matters pending that are expected to be material with respect to the Company’s business, results of operations or cash flows.
9
Table of Contents
EXECUTIVE OFFICERS OF THE REGISTRANT
The executive officers of Lydall, Inc. or its subsidiaries, together with the offices presently held by them, their business experience since January 1, 2006, and their age as of March 1, 2011, the record date of the Company’s 2011 Annual Meeting, are as follows:
| Name | Age | Position and Date of Initial Employment | Other Business Experience Since 2006 | |||||
| Dale G. Barnhart |
58 | President, Chief Executive Officer (August 27, 2007) | Chief Executive Officer, Synventive Molding Solutions (March 2005 – August 2007), a provider of hot runner systems, machine nozzles, temperature controllers and sprue bushings for the injection molding industry. | |||||
| Erika G. Turner |
55 | Vice President, Chief Financial Officer and Treasurer (November 4, 2009) |
Chief Financial Officer, Superior Industries International (February 2008 – November 2009), a manufacturer of aluminum road wheels for sale to original equipment manufacturers; Chief Financial Officer and Vice President of Finance, Monogram Systems (July 2004 - February 2008), a supplier of cabin systems and equipment to the global aerospace industry. | |||||
| Mona G. Estey |
56 | Vice President, Human Resources (July 1, 2000); formerly Director, Human Resources (September 1, 1986) | Not applicable | |||||
| Paul G. Igoe |
48 | Vice President, General Counsel and Secretary (October 14, 2009) |
Associate General Counsel and Assistant Corporate Secretary, Teradyne, Inc. (June 2001 – September 2009), a supplier of automatic test equipment for the semiconductor industry. | |||||
| Peter M. Kurto |
45 | Vice President, Business Development and Sr. Vice President – Life Sciences (December 14, 2010); formerly Vice President – Business Development and Investor Relations (September 24, 2008) | Global Marketing Director, Imerys – Filtration Division (August 2006 – September 2008), a world leader in the supply of engineered minerals for liquid filtration applications; Intermediates Business Leader, General Electric Co. – Plastics Division (until August 2006), a major supplier of engineering thermoplastics to a diverse group of industries including automotive, electronics and appliances. | |||||
| James V. Laughlan |
38 | Chief Accounting Officer and Controller (March 29, 2010); formerly Principal Accounting Officer and Controller (December 4, 2007); formerly Controller (October 17, 2005) | Not applicable | |||||
10
Table of Contents
Item 5. MARKET FOR REGISTRANT’S COMMON EQUITY, RELATED STOCKHOLDER MATTERS AND ISSUER PURCHASES OF EQUITY SECURITIES
PRICE RANGE OF COMMON STOCK AND DIVIDEND HISTORY
The Company’s Common Stock is traded on the New York Stock Exchange (“NYSE”) under the symbol LDL. Shares totaling 21,425,695 and 22,062,283 were traded during 2010 and 2009, respectively. The table below shows the range of reported sale prices on the NYSE Composite Tape for the Company’s Common Stock for the periods indicated. As of December 31, 2010, 5,130 stockholders of record held 17,163,201 shares of Lydall’s Common Stock, $.10 par value.
| High | Low | Close | ||||||||||
| 2010 |
||||||||||||
| First Quarter |
$ | 8.56 | $ | 5.21 | $ | 7.85 | ||||||
| Second Quarter |
9.36 | 7.22 | 7.64 | |||||||||
| Third Quarter |
8.21 | 6.51 | 7.36 | |||||||||
| Fourth Quarter |
9.04 | 6.91 | 8.05 | |||||||||
| 2009 |
||||||||||||
| First Quarter |
$ | 6.07 | $ | 1.93 | $ | 2.97 | ||||||
| Second Quarter |
4.67 | 2.83 | 3.40 | |||||||||
| Third Quarter |
6.00 | 2.82 | 5.26 | |||||||||
| Fourth Quarter |
6.54 | 4.45 | 5.21 | |||||||||
The Company does not pay a cash dividend on its Common Stock and the Company’s domestic credit facility entered into on March 11, 2009 prohibits the payment of a cash dividend.
The following table provides information about the Company’s Common Stock that may be issued upon exercise of options and rights under all of the Company’s existing equity compensation plans at December 31, 2010. The number of securities remaining available for issuance at December 31, 2010 was 466,918 and includes 296,213 shares that may be issued as restricted stock, performance shares and other stock awards.
| Plan Category | Number of securities to be issued upon exercise of outstanding options, warrants and rights (a) |
Weighted average exercise price of outstanding options, warrants and rights (b) |
Number
of plans (excluding |
|||||||||
| Equity compensation plans approved by security holders |
906,751 | $ | 8.62 | 466,918 | ||||||||
11
Table of Contents
ISSUER PURCHASES OF EQUITY SECURITIES
In August 2003, the Company’s Board of Directors approved a Stock Repurchase Program (“Repurchase Program”) to mitigate the potentially dilutive effects of stock options and shares of restricted and unrestricted stock granted by the Company. Under the Repurchase Program, shares may be purchased by the Company up to the quantity of shares underlying options and other equity-based awards granted after January 1, 2003 under shareholder approved plans. The Company’s domestic credit facility generally prohibits the Company’s ability to repurchase common stock of the Company, subject to certain stated exceptions.
Should the Company have the ability to engage in repurchase activity in the future, the Company would take advantage of the safe harbor protections afforded by Rule 10b-18 promulgated under the Securities Exchange Act of 1934 (“Exchange Act”), to engage in future repurchase activity in accordance with the provisions of the Exchange Act. As of December 31, 2010, there were 2,278,389 shares remaining available for purchase under the Repurchase Program. There was no repurchase activity under the Repurchase Program during 2010. Shares acquired by the Company during the quarter ended December 31, 2010 represent shares withheld by the Company pursuant to provisions in agreements with recipients of restricted stock granted under the Company’s equity compensation plans requiring the Company to withhold the number of shares having fair value equal to each recipient’s tax withholding due. The following table details the activity for the fourth quarter ended December 31, 2010.
| Period | Total Number of Shares Purchased |
Average Price per Share |
Total Number of Shares |
Maximum Number of |
||||||||||||
| Activity October 1, 2010 - October 31, 2010 |
1,568 | $ | 7.75 | — | 1,969,230 | |||||||||||
| Activity November 1, 2010 - November 30, 2010 |
788 | $ | 8.08 | — | 1,969,230 | |||||||||||
| Activity December 1, 2010 - December 31, 2010 |
11,767 | $ | 7.56 | — | 2,278,389 | |||||||||||
| Total |
14,123 | $ | 7.61 | — | 2,278,389 | |||||||||||
Unregistered Sales of Equity Securities and Use of Proceeds
Lydall sponsored an Employee Stock Purchase Plan (“the Plan”) that provided a method by which participating employees used voluntary, systematic payroll deductions to purchase shares of Lydall Common stock in open-market purchase transactions effectuated by a broker. The Plan was suspended by the Company on February 25, 2010 and no shares have been purchased for participants since February 1, 2010. The Plan included a Company matching contribution feature, pursuant to which the Company contributed an amount equal to 33 and 1/3 cents for each dollar contributed by a participating employee, up to a maximum of $150 per month. The broker accumulated the contributions and purchased shares of Company stock for participants in open market transactions on a monthly basis. The Company received no proceeds from the transactions. Nevertheless, because the Plan included a matching contribution feature, the Company may have been required to register the transactions under the Securities Act of 1933, and for many years, the Company prepared and filed appropriate registration statements on Form S-8. In connection with the preparation and filing of the Company’s 2009 Annual Report on Form 10-K, the Company concluded that a new registration statement should have been filed with respect to the Plan a number of years ago. During 2010, 2009 and 2008, an aggregate of approximately 123,000 shares of Company stock were acquired by participating employees pursuant to the Plan without having been registered. Because the transactions were not registered, certain Plan participants may have a right to rescind their transactions. Based on Lydall’s current stock price, the Company does not believe that any liability for rescission would be material to the Company’s consolidated financial position, results of operations or cash flows.
12
Table of Contents
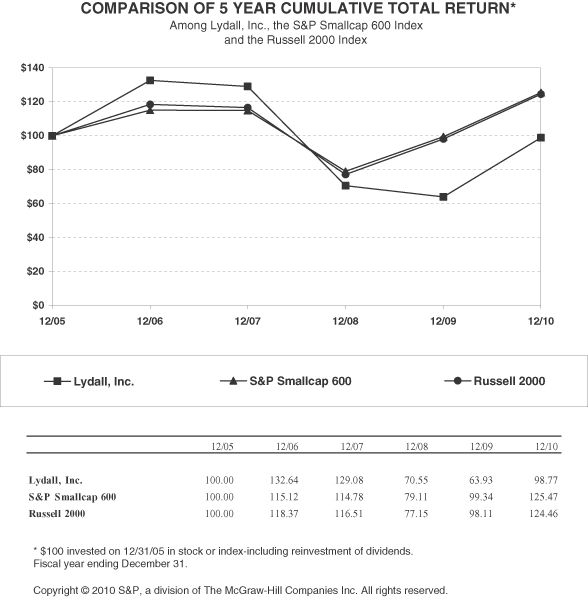
PERFORMANCE GRAPH
The following graph compares the cumulative total return on Lydall’s shares over the past five years with the cumulative total return on shares of companies comprising the Standard & Poor’s SmallCap 600 Index and the Russell 2000 Index. Cumulative total return is measured assuming an initial investment of $100 on December 31, 2005, including reinvestment of dividends. Due to the diversity of niche businesses that the Company participates in, it is difficult to identify a reasonable peer group or one industry or line-of-business index for comparison purposes. Thus, Lydall has chosen to compare its performance to the Standard & Poor’s SmallCap 600 Index and to the Russell 2000 Index.
13
Table of Contents
Item 6. SELECTED FINANCIAL DATA
FIVE-YEAR SUMMARY
| In thousands except per share amounts and ratio data | 2010 | Revised 2009 |
Revised 2008 |
Revised 2007 |
Revised 2006 |
|||||||||||||||
| Financial results from continuing operations |
||||||||||||||||||||
| Net sales |
$ | 338,007 | $ | 248,947 | $ | 305,716 | $ | 320,917 | $ | 306,121 | ||||||||||
| Income (loss) from continuing operations |
$ | 2,739 | $ | (14,572 | ) | $ | (6,031 | ) | $ | 8,196 | $ | 9,094 | ||||||||
| Common stock per share data |
||||||||||||||||||||
| Diluted income (loss) from continuing operations |
$ | .16 | $ | (.88 | ) | $ | (.37 | ) | $ | .50 | $ | .56 | ||||||||
| Diluted income from discontinued operations |
$ | — | $ | — | $ | .06 | $ | .03 | $ | .07 | ||||||||||
| Diluted net income (loss) |
$ | .16 | $ | (.88 | ) | $ | (.30 | ) | $ | .53 | $ | .63 | ||||||||
| Financial position |
||||||||||||||||||||
| Total assets |
$ | 231,888 | $ | 224,352 | $ | 235,452 | $ | 258,483 | $ | 241,173 | ||||||||||
| Working capital |
$ | 63,360 | $ | 60,599 | $ | 60,548 | $ | 63,506 | $ | 50,610 | ||||||||||
| Long-term debt, net of current maturities |
$ | 3,392 | $ | 5,220 | $ | 6,699 | $ | 8,377 | $ | 8,914 | ||||||||||
| Total stockholders’ equity |
$ | 155,455 | $ | 156,389 | $ | 166,140 | $ | 180,391 | $ | 161,516 | ||||||||||
| Property, plant and equipment |
||||||||||||||||||||
| Net property, plant and equipment |
$ | 88,236 | $ | 93,419 | $ | 101,592 | $ | 107,231 | $ | 103,469 | ||||||||||
| Capital expenditures |
$ | 12,001 | $ | 5,921 | $ | 12,037 | $ | 14,610 | $ | 11,182 | ||||||||||
| Depreciation |
$ | 13,650 | $ | 14,923 | $ | 15,867 | $ | 15,171 | $ | 15,130 | ||||||||||
| Performance and other ratios |
||||||||||||||||||||
| Gross margin |
17.1 | % | 13.3 | % | 20.5 | % | 22.5 | % | 22.3 | % | ||||||||||
| Operating margin |
1.4 | % | (7.1 | )% | (3.1 | )% | 4.7 | % | 4.4 | % | ||||||||||
| Current ratio |
2.2:1 | 2.5:1 | 2.7:1 | 2.4:1 | 2.2:1 | |||||||||||||||
| Total debt to total capitalization |
3.0 | % | 4.1 | % | 4.7 | % | 5.2 | % | 5.9 | % | ||||||||||
Please read Item 7 (Management’s Discussion and Analysis of Financial Condition and Results of Operations) and the Notes to the Consolidated Financial Statements for specific changes in the Company and the markets that provide context to the above data, including without limitation discussions concerning (i) how global economic uncertainties may affect the Company’s future results; (ii) business combinations and dispositions of business operations that affect the comparability of the data set forth above; and (iii) 2008 impairment charges recorded by the Company associated with goodwill and long-lived assets.
Please read Note 2 to the Consolidated Financial Statements which discloses the Company’s revision of previously reported financial results for 2009 and 2008. Financial results were primarily impacted by a revision to cost of sales and property, plant and equipment, net. Financial results for 2007 were also revised to reflect an adjustment primarily to income tax expense and deferred income taxes resulting in a reduction of income from continuing operations of approximately $0.4 million. The revision to 2006 financial results was to stockholders’ equity, as a revision impacted net income in a year prior to 2006.
14
Table of Contents
Item 7. MANAGEMENT’S DISCUSSION AND ANALYSIS OF FINANCIAL CONDITION AND RESULTS OF OPERATIONS
CAUTIONARY NOTE CONCERNING FACTORS THAT MAY AFFECT FUTURE RESULTS
This report contains “forward-looking statements” within the meaning of Section 21E of the Securities Exchange Act of 1934, as amended. In general, any statements contained in this report that are not statements of historical fact may be deemed to be forward-looking statements within the meaning of Section 21E. All such forward-looking statements are intended to provide management’s current expectations for the future operating and financial performance of the Company based on current expectations and assumptions relating to the Company’s business, the economy and other future conditions. Forward-looking statements generally can be identified through the use of the words “believes,” “anticipates,” “may,” “plans,” “projects,” “expects,” “estimates,” “forecasts,” “predicts,” “targets,” and other similar expressions in connection with the discussion of future operating or financial performance. Because forward-looking statements relate to the future, they are subject to inherent risks, uncertainties and changes in circumstances that are difficult to predict. Accordingly, the Company’s actual results may differ materially from those contemplated by the forward-looking statements. Investors, therefore, are cautioned against relying on any of these forward-looking statements. They are neither statements of historical fact nor guarantees or assurances of future performance. Forward-looking statements in this Annual Report on Form 10-K include, among others, statements relating to:
| • | Overall economic and business conditions and the effects on the Company’s markets |
| • | Business strategies, synergies, or operating efficiencies, such as manufacturing inefficiencies at the Company’s North American automotive facility |
| • | The ability of the Company to improve gross margins of fiber based products at its North American automotive facility |
| • | Significant changes in the North American or European automotive markets |
| • | Future earnings and other measurements of financial performance |
| • | Future cash flow and uses of cash |
| • | Competitive factors in the industries and geographic markets in which the Company competes or may compete |
| • | The cost and availability of raw materials and energy |
| • | Product development and new business opportunities |
| • | Benefits realized from savings and operating efficiency improvements as a result of Lean Six Sigma and operational excellence initiatives |
| • | Estimates of restructuring costs and future savings to the Company |
| • | Future amounts of stock-based compensation expense |
| • | Pension plan assumptions and future expense and funding requirements |
| • | Future levels of indebtedness and capital spending |
| • | The Company’s ability to meet cash operating requirements |
| • | The Company’s ability to meet financial covenants in its domestic credit facility |
| • | The Company’s ability to remediate identified control deficiencies over financial reporting |
| • | The Company’s ability to earn fees for services to be rendered under a process technology license agreement |
| • | Future effective income tax rates and realization of deferred tax assets |
| • | Estimates of fair values of reporting units and long-lived assets used in assessing goodwill and long-lived assets for possible impairment |
| • | The expected outcomes of contingencies |
| • | Future repurchases of the Company’s common stock |
| • | Benefits expected to be realized from recent acquisitions, including the Company’s ability to complete the commercialization of the Arioso™ product |
15
Table of Contents
| • | Benefits expected to be realized from capital equipment investments in businesses |
| • | Future strategic acquisitions, joint ventures, alliances and licensing agreements |
All forward-looking statements are inherently subject to a number of risks and uncertainties that could cause the actual results of the Company to differ materially from those reflected in forward-looking statements. See Item 1A. Risk Factors for a description of identified risks. The occurrence of one or more of these risks, or other unidentified risks, could cause Lydall’s actual results to vary materially from recent results or from the anticipated future results.
Lydall does not undertake to update any forward-looking statement made in this report or that may from time to time be made by or on behalf of the Company.
OVERVIEW AND OUTLOOK
Lydall, Inc. and its subsidiaries (collectively, the “Company” or “Lydall”) design and manufacture specialty engineered filtration media, industrial thermal insulating solutions, automotive thermal and acoustical barriers, temperature-control equipment, medical filtration media and devices and biopharmaceutical processing components for thermal/acoustical, filtration/separation and bio/medical applications. Lydall principally conducts its business through two reportable segments: Performance Materials and Thermal/Acoustical with the majority of sales to customers in North America and Europe.
The Performance Materials segment reports results of the filtration and industrial thermal insulation businesses. Lydall’s filtration media products provide solutions for air, fluid power, industrial and life science applications and its industrial thermal insulation products provide solutions for building products, appliances, and energy and industrial markets.
The Thermal/Acoustical segment reports the results of the Company’s automotive businesses. Thermal/Acoustical products provide solutions to abate noise and heat in various types of automobiles. Lydall products shield several areas in automobiles from heat (thermal) and sound (acoustical) sources including the underbody, under hood and interior areas.
All other businesses are aggregated in Other Products and Services. OPS includes the Vital Fluids business and the Affinity® temperature control equipment business.
Revision of Prior Period Amounts
During the third quarter of 2010, the Company revised prior period financial statements due to errors detected in the third quarter of 2010. None of the revisions were considered material to the periods impacted, as disclosed in Note 2 to Notes to the Consolidated Financial Statements. All figures in Item 7 of this filing are provided as revised.
Highlights
Below are financial highlights comparing Lydall’s 2010 results to its 2009 results:
| • | Consolidated net sales increased by $89.1 million, or 35.8%, to a record annual amount of $338.0 million; |
| • | Foreign currency translation negatively impacted net sales growth by 2.6%; |
| • | Segment net sales (net of foreign currency translation) increased as follows: |
| – | Performance Materials segment increased by $27.2 million, or 27.7%; |
| – | Thermal/Acoustical segment increased by $55.8 million, or 43.6%; |
| – | Other Products and Services increased by $13.6 million, or 57.3%; |
| • | Gross margin percentage increased to 17.1% compared to 13.3%; |
| • | Consolidated operating income was $4.6 million, compared to an operating loss of $(17.8) million: |
| – | Performance Materials segment reported operating income of $17.2 million, compared to operating income of $7.6 million; |
16
Table of Contents
| – | Thermal/Acoustical segment reported operating income of $0.4 million, compared to an operating loss of $(10.3) million; |
| – | OPS reported operating income of $1.0 million, compared to an operating loss of $(2.5) million; |
| – | Corporate office expenses were $(14.0) million, compared with $(12.5) million; |
| • | Pretax income for 2010 was $3.9 million, compared to pretax loss of $(18.4) million; |
| • | Net income for 2010 was $2.7 million, or $.16 per share, compared to a net loss of $(14.6) million, or $(.88) per share; |
| • | Cash provided from operations was $10.7 million compared to $14.1 million. |
Operational and Financial Overview
The Company reported net sales of $338.0 million, a record annual amount, reflecting an increase of nearly $90 million, or 36%, compared to 2009. The combination of a recovery in most of the markets that Lydall serves as well as improved market share resulted in the significant increase in net sales in 2010. The 2010 operating income of $4.6 million, or 1.4% of net sales, was significantly depressed by the operating results of the Thermal/Acoustical segment, serving the automotive industry. In particular, the gross margin in 2010 was negatively impacted by the fiber-based product line of the North American automotive facility (“NA Auto”) starting towards the end of the second quarter of 2010, as production was rapidly ramped up to meet a sharp increase in customer demand. Although manufacturing improvements have been made in the fourth quarter of 2010, the Company estimates that $30.0 million of fiber based product net sales generated a gross margin loss of approximately $(5.0) million from June 1, 2010 through December 31, 2010.
Performance Materials Segment
The Performance Materials segment reported record net sales of $123.1 million in 2010, which represented an increase of 25.6% from 2009, and operating income of $17.2 million, or 14.0% of net sales. Gross margin and operating income as a percentage of net sales both increased primarily as a result of the significant increase in net sales and improved absorption of fixed costs.
Demand for filtration products by customers in the air filtration, fluid power and automotive and life science markets in 2010 rebounded dramatically as customers began recovering from the global economic recession. Also, in 2010, the industrial thermal insulation business benefited from significant improvement in capital project investments by customers in the cryogenic and electrical markets, increasing demand for the Company’s energy and industrial products.
The filtration and industrial thermal insulation businesses are in markets that the Company believes present long-term growth opportunities through expansion of existing products and through strategic transactions. With a strong backlog of orders, the segment is actively managing growth by selectively investing in capabilities to enhance processes and capacity. The segment has realigned manufacturing capabilities among its production sites, which has enabled improved optimization of existing capacity and created additional capacity to grow the business organically. Further, products and activities are continually evaluated for strategic fit, as evidenced by the sale of the electrical papers product line in 2010.
Performance Materials remains focused on fully commercializing the Arioso™ membrane composite media, which was developed based on technologies obtained through the Solutech acquisition in late 2008. Arioso™ provides advanced filtration media for respirator, clean room and industrial dust collection applications. Although product development and customer qualification have taken longer than originally planned, the Arioso™ product represents an important growth area and is expected to expand the Company’s market participation in the industrial air and life science arena.
Thermal/Acoustical Segment
The Thermal/Acoustical segment reported net sales of $179.1 million in 2010, an increase of 40.1% from 2009. Segment net sales were approximately 53% of the Company’s consolidated net sales in 2010, compared to approximately 51% of net sales in 2009. According to a published automotive market forecasting service, production of cars and light trucks in North America and Europe in 2010 increased by approximately 22%, or 5.5 million vehicles, compared to 2009, indicating that the Thermal/Acoustical segment increased market share through the introduction of new products and growth of the automotive platforms served. The same service predicts that production of cars and light trucks in North America and Europe in 2011 will grow again in the range of 3% – 5%. While automobile production improved significantly in 2010 and is expected to increase again in 2011, volatile market conditions, including fluctuations in consumer demand for automobiles, persist in the automotive market.
17
Table of Contents
The segment reported operating income in 2010 of $0.4 million compared with an operating loss of $(10.3) million in 2009. Beginning late in the second quarter of 2010, the segment has been impacted by negative gross margin from the fiber-based product line of the NA Auto facility. During the second half of 2010, the Company responded to a rapid acceleration of orders with a plant expansion, addition of new equipment, hiring and training of a significant number of new employees and fabrication of tooling, all while simultaneously increasing output to meet customers’ demand. As a result, the Company incurred abnormally high labor costs, material usage inefficiencies and excessive scrap on production lines, and freight expediting and inspection costs. Also, due to capacity constraints, the facility outsourced a portion of the processing of certain fibers at a premium. While the Company has undertaken a comprehensive improvement plan to stabilize this operation, the full impact of actions underway has not yet been fully realized. The operating loss of $(10.3) million in 2009 included $5.8 million of restructuring related charges associated with the NA Auto consolidation.
Other Products and Services
The Vital Fluids business, which serves the life science industry, reported net sales of $15.6 million in 2010, an increase of 6.6% compared to 2009, and operating results were essentially breakeven in 2010 compared to operating income of $0.2 million in 2009. During 2009 and 2010, the Company made capital investments in clean room space capacity and acquired biodisposable bag manufacturing equipment to support a strategic initiative to increase market share in the growing bioprocessing market. During 2010, the business initiated the qualification of products with a number of new customers. However, due to the lengthy period of time required for qualification, incremental revenues did not materialize in 2010. During 2011, the Vital Fluids business expects certain customers to begin to complete the qualification process initiated in 2010 and start to order biodisposable bags from the Company.
Throughout 2010, the Affinity business benefited from the recovery of capital equipment spending in the semiconductor industry as evidenced by an increase in net sales of $12.7 million, to $21.9 million, in 2010. The business has begun to realize sales from the “S-Series,” a configurable industrial chiller launched in 2010, which is expected to open several new markets in the future, including medical, analytical, scientific, and industrial. Service revenues in the chiller markets have grown as well and the business has gained profitability both through absorption of costs from higher revenues and from employing Lean principles to systematically improve gross margins.
Liquidity
At December 31, 2010, the Company had cash balances of $25.0 million and no borrowings under any existing credit facility. Consistent with the fourth quarter of 2010, the Company expects to be subject to a $5.0 million borrowing limit under its domestic credit facility throughout the first quarter of 2011 and possibly future periods because it does not expect to meet the fixed charge coverage ratio. At December 31, 2010, the Company’s foreign subsidiaries had various credit arrangements with banks totaling €7.0 million (approximately $9.4 million) with €5.9 million (approximately $7.9 million) available for borrowings, primarily restricted to borrowings at the respective foreign subsidiary.
The Company expects to fund its operating cash requirements from existing cash balances, cash generated by operations and from available borrowings, as needed, under its existing domestic credit facility and foreign credit facilities.
During 2010, the Company increased working capital, primarily inventory, in order to meet anticipated customer demand. At December 30, 2010, inventory increased by $11.0 million compared to levels at December 31, 2009, primarily from increases in raw material inventory. Also contributing to the increase in working capital were significant cash investments in automotive tooling inventory and tooling accounts receivable during 2010 in preparation of launches of new automotive parts in 2011. Typically, the Company is not reimbursed for tooling inventory until completion and customer approval of the tooling.
Outlook
At December 31, 2010, the Company’s backlog was significantly higher than December 31, 2009. Going into 2011, the top priority for the Company is to improve its operating results, particularly those of the Thermal/Acoustical segment.
As part of Lydall’s business strategy, the Company will continue to review various strategic and business opportunities to grow its businesses and evaluate the profitability and growth potential for each of its existing businesses.
18
Table of Contents
In 2011, the Company is implementing internal organizational changes in its Performance Materials and Vital Fluids businesses to better align the Company’s structure with its strategic direction. Lydall is integrating operational activities and realigning sales and marketing responsibilities within and across these two businesses. In 2011, the Company expects that the Vital Fluids business will be included in the operating results of the Performance Materials segment.
Throughout the Company, management expects that its Lean Six Sigma and operational excellence initiatives will assist in reducing costs, improving performance and customer service, and leveraging synergies across the Company.
The Company is also focused on continuing to remediate its material weakness in internal control over financial reporting as discussed in Item 9A. Controls and Procedures.
19
Table of Contents
CONSOLIDATED RESULTS OF OPERATIONS
Net Sales
| (in thousands of dollars) | 2010 | Percent Change |
2009 | Percent Change |
2008 | |||||||||||||||
| Net sales |
$ | 338,007 | 35.8 | % | $ | 248,947 | (18.6 | )% | $ | 305,716 | ||||||||||
The increase in 2010 net sales of $89.1 million, or 35.8%, compared with 2009, was primarily attributable to higher sales volumes from the Thermal/Acoustical segment of $51.3 million, or 40.1%, and the Performance Materials segment of $25.1 million, or 25.6%. Net sales of OPS increased by $13.6 million, or 57.3%, including an increase of $12.7 million from the Affinity business and $0.9 million from the Vital Fluids business. Foreign currency translation decreased net sales by $6.6 million, or 2.6%, for the current year, compared with 2009, impacting the Thermal/Acoustical segment by $4.5 million and the Performance Materials segment by $2.1 million.
The decrease in 2009 net sales of $56.8 million, compared with 2008, was primarily the result of lower net sales from the Company’s Thermal/Acoustical segment of $35.9 million, or 21.9%. Performance Materials segment net sales in 2009 decreased by $13.6 million, or 12.2%, compared to 2008. Net sales of OPS in 2009 decreased by $7.9 million, or 25.0%, compared to 2008, as net sales from the Vital Fluids business decreased by $2.0 million and net sales from the Affinity business decreased by $5.9 million. Foreign currency translation decreased net sales by $4.7 million in 2009, compared with 2008, impacting the Thermal/Acoustical segment by $3.2 million and the Performance Materials segment by $1.5 million.
Gross Margin
| (in thousands of dollars) | 2010 | Revised 2009 |
Revised 2008 |
|||||||||
| Gross margin |
$ | 57,873 | $ | 33,004 | $ | 62,766 | ||||||
| Percentage of sales |
17.1 | % | 13.3 | % | 20.5 | % | ||||||
The increase in gross margin percentage in 2010 compared to 2009 was attributable to improved gross margin percentages from both the Performance Materials and Thermal/Acoustical segments, as well as from the Affinity business included in OPS. The Performance Materials segment and Affinity business reported improved gross margin percentages primarily as a result of significantly higher net sales and the resulting improved absorption of fixed costs. The 2009 gross margin percentage included restructuring related charges of $5.7 million, or 230 basis points, associated with the NA Auto consolidation, included in the Thermal/Acoustical segment. Excluding these restructuring charges in 2009, the Thermal/Acoustical segment gross margin percentage increased marginally in 2010 compared to 2009 due to improvements in gross margin percentage for worldwide non-fiber based products from higher sales partially offset by higher per unit costs for fiber-based products at its NA Auto facility.
The decrease in gross margin percentage in 2009 compared to 2008 was primarily caused by lower gross margin percentage from the Thermal/Acoustical segment and, to a lesser extent, from the Performance Materials segment and from OPS, which were all significantly impacted by global economic conditions. A reduction in net sales of $56.8 million, including a decrease in Thermal/Acoustical segment net sales of $35.9 million, resulted in higher per-unit manufacturing costs, as each unit absorbed a greater amount of fixed costs. Also, higher raw material costs in 2009, compared to 2008, contributed to lower gross margin percentage for the Thermal/Acoustical segment. The aforementioned restructuring related charges of $5.7 million negatively impacted gross margin percentage by approximately 230 basis points in 2009. Partially offsetting the above factors reducing gross margin percentage was savings realized from the Company’s Lean Six Sigma program.
Selling, Product Development and Administrative Expenses
| (in thousands of dollars) | 2010 | 2009 | 2008 | |||||||||
| Selling, product development and administrative expenses |
$ | 55,777 | $ | 50,783 | $ | 54,958 | ||||||
| Percentage of sales |
16.5 | % | 20.4 | % | 18.0 | % | ||||||
Selling, product development and administrative expenses increased in 2010 by $5.0 million, or 9.8%, compared to 2009. However, as a percentage of net sales, selling, product development and administrative expenses decreased by 390 basis points in
20
Table of Contents
2010 compared to 2009. The increase in 2010 expenses was primarily due to increases in incentive compensation expense of $1.8 million, sales commission expense of $1.1 million, legal expenses of $0.8 million, primarily associated with a matter with a former employee, salaries and wages expense of $0.5 million, severance-related expenses of $0.4 million and research and development trial expenses of $0.4 million. Because certain businesses met 2010 bonus plan targets, the Company recorded incentive compensation in 2010, while in 2009, the Company did not record any incentive compensation expense. A significant increase in net sales in 2010, compared to 2009, caused the increase in sales commission expense in 2010. Higher salaries and wages expense was primarily caused by higher headcount in 2010 compared to 2009 to support the increase in net sales in 2010 and strategic initiatives for the Company, and, to a lesser extent, the reinstatement of the matching contribution to its sponsored 401(k) plan in July 2010, for all non-union domestic employees. Foreign currency translation decreased selling, product development and administrative expenses by $0.6 million, or 1.2%, for the current year, compared with 2009.
Selling, product development and administrative expenses decreased in 2009 by $4.2 million compared to 2008. The inclusion of expenses from the Solutech business, included in the Performance Materials segment and acquired in December 2008, resulted in an additional $2.3 million of selling, product development and administrative expenses in 2009. Including the results of the Solutech business, the overall reduction in selling, product development and administrative expenses in 2009 was primarily due to decreases in salaries and wages expense of $1.1 million, incentive compensation expense of $0.7 million, sales commission expenses of $0.8 million, travel expenses of $0.7 million and bad debt expense of $0.3 million, as well as reductions in other discretionary spending. Partially offsetting these decreases was higher expense of $0.6 million related to the amortization of intangible assets of the Solutech business. Lower salaries and wages expense was due to reductions in workforce from the NA Auto consolidation completed in the first half of 2009, other workforce reduction initiatives, and the December 2008 realignment of management within the Company’s North American and European automotive operations, resulting in lower salaries and wages expense in 2009. Lower incentive compensation expense was due to not meeting targets for the Company’s 2009 bonus plan. Lower sales commission expenses were due to lower net sales in 2009 compared to 2008.
Divestiture
| (in thousands of dollars) | 2010 | 2009 | 2008 | |||||||||
| Gain on sale of product line, net |
$ | 2,542 | $ | — | $ | — | ||||||
On June 30, 2010, the Company divested its electrical papers product line business for total consideration of $5.8 million, of which $4.8 million was paid on June 30, 2010. As part of the sale transaction, the Company entered into a Manufacturing Agreement and a License Agreement with the buyer. Under the Manufacturing Agreement, the Company is obligated to manufacture and sell electrical paper products to the buyer for a two-year period. Pursuant to the License Agreement, the Company granted the buyer the right to use certain process technology and agreed to provide certain services to the buyer to facilitate the transfer of know-how for the manufacture of electrical paper products. Under the License Agreement, the buyer is obligated to pay the Company the additional $1.0 million on the earlier of June 30, 2012 or completion by Lydall of its obligations to provide services to the buyer.
For the year ended December 31, 2010, the Company recorded a $2.5 million gain related to this transaction. The Company recorded a gain on sale of $1.7 million in the second quarter of 2010, net of a write-off of $0.8 million of goodwill that was allocated to the electrical papers product line. During the six months ended December 31, 2010, the Company also recognized additional income of $0.8 million, as the Company provided services to the buyer in accordance with the terms of the License Agreement. The remainder of the gain is being recognized over the period that the Company satisfies its obligations under the License Agreement.
Impairment of Goodwill and Long-Lived Assets
| (in thousands of dollars) | 2010 | 2009 | 2008 | |||||||||
| Goodwill impairment |
$ | — | $ | — | $ | 16,380 | ||||||
| Impairment of long-lived assets |
— | — | 1,029 | |||||||||
| Total impairment |
$ | — | $ | — | $ | 17,409 | ||||||
The results of the Company’s annual goodwill impairment analysis in the fourth quarter of 2008 indicated that there was no remaining implied fair value attributable to the NA Auto goodwill, included in the Thermal/Acoustical segment, or Affinity goodwill,
21
Table of Contents
included in OPS. Accordingly, the Company wrote off all of the $12.2 million of NA Auto goodwill and all of the $4.2 million of Affinity goodwill during the fourth quarter of 2008. Also, the Company recorded an impairment of long-lived assets charge of $1.0 million in the fourth quarter of 2008 at the Affinity business. See Note 15 to Notes to Consolidated Financial Statements for additional information related to these impairments.
Interest Expense
| (in thousands of dollars) | 2010 | 2009 | 2008 | |||||||||
| Interest expense |
$ | 854 | $ | 814 | $ | 451 | ||||||
| Weighted average interest rate during the year |
5.3 | % | 5.0 | % | 5.2 | % | ||||||
Interest expense was higher in 2010 compared to 2009 due to increased amortization of debt financing costs associated with the Company entering into a domestic credit facility in March 2009 and increases in unused borrowing fees, partially offset by lower average principal balances on capital lease obligations.
The increase in interest expense for 2009 compared to 2008 was primarily due to increased amortization of debt financing costs associated with the Company entering into a domestic credit facility in March 2009 and increases in unused borrowing fees.
Other Income and Expense
| (in thousands of dollars) | 2010 | 2009 | 2008 | |||||||||
| Other income, net |
$ | 142 | $ | 232 | $ | 133 | ||||||
The amounts included in other income, net, in all years presented are primarily related to net gains and losses from derivative transactions, investment income and net foreign currency transaction gains and losses.
Income Taxes from Continuing Operations
| 2010 | Revised 2009 |
Revised 2008 |
||||||||||
| Effective income tax rate |
30.2 | % | 20.6 | % | 39.2 | % | ||||||
The Company’s effective tax rate from continuing operations for 2010 was 30.2% compared to 20.6% in 2009 and 39.2% in 2008. For 2010, the Company’s effective tax rate was significantly impacted by an IRC Section 987 tax benefit of $4.0 million associated with a change in assertion regarding unremitted foreign earnings related to its German branch. This was nearly offset by valuation allowances against certain foreign tax credits, U.S. federal and state net operating losses, and other U.S. net deferred tax assets, which generated tax expense of $3.8 million in 2010. The impact of those two items and a reduction in reserves for unrecognized tax benefits primarily contributed to the Company’s effective tax rate differing from the statutory federal income tax rate in 2010.
During the third quarter of 2010, the Company elected to change its assertion regarding unremitted foreign earnings related to its German branch. Under this election, the Company asserts that undistributed earnings of the branch are no longer indefinitely reinvested but are available for remittance to Lydall, Inc. Implementing this change required that the Company assume that the assertion was reversed at the beginning of the fiscal year and compute the effect of currency translations from branch inception through January 1, 2010 using exchange rates prevailing during the time that income was earned or remittances were made. The tax impact of the resulting currency translation adjustment is reflected in the Company’s effective tax rate and generated a tax benefit of $4.0 million in 2010. This benefit resulted from the German branch having incurred losses during periods of time when the U.S. Dollar exchange rates were less favorable compared to the Deutsch Mark and Euro and profits were earned during periods when the U.S. Dollar was strong against the Euro.
During 2010, the Company recorded additional valuation reserves against certain foreign tax credits, federal and state net operating losses, and other U.S. net deferred tax assets, which generated tax expense of $3.8 million. The reserves reflect the Company’s assessment that the future realization of such tax benefits is not reasonably assured. The Company determined it would carry-back its 2010 taxable loss to prior years. As a result, at December 31, 2010, an income tax receivable of $1.1 million was recorded in
22
Table of Contents
anticipation of a cash refund expected to be received in 2011. This carry-back allowed foreign tax credits previously utilized by the Company to become available for future use. An analysis was performed of the expected future realization of these foreign tax credits and credits generated in 2010 before their expiration, and as a result, the Company recorded an income tax charge of $2.0 million in 2010 to record a valuation allowance on the available foreign tax credits for which their future realization was not reasonably assured. In addition, the Company is in a cumulative three year loss in the U.S. and as a result, a valuation allowance of $1.8 million was recorded against federal and state net deferred tax assets as of December 31, 2010.
An income tax charge in 2009 to record valuation allowances on foreign tax credits primarily contributed to the effective tax rate differing from the statutory federal income tax rate in 2009. The Company determined it would carry-back its 2009 taxable loss to prior years. As a result, at December 31, 2009, an income tax receivable of $3.2 million was recorded in anticipation of a cash refund, which was subsequently received in 2010. This carry-back allowed foreign tax credits previously utilized by the Company to become available for future use. An analysis was performed of the expected future realization of these foreign tax credits before their expiration, and as a result, the Company recorded an income tax charge of $2.5 million in 2009 to record a valuation allowance on the available foreign tax credits for which their future realization was not reasonably assured.
The total amount of net unrecognized tax benefits that, if recognized, would affect the effective tax rate is $0.3 million as of December 31, 2010.
The Company’s effective tax rates in future periods could be affected by earnings being lower or higher than anticipated in countries where tax rates differ from the United States federal rate, the relative impact of permanent tax adjustments on higher or lower earnings from domestic operations, changes in net deferred tax asset valuation allowances, changes in tax rates or tax laws and the completion of tax audits.
Consolidation, Restructuring and Related Charges
In 2009, the Thermal/Acoustical segment completed the consolidation of the North American automotive parts production by transferring all production in Vermont to its North Carolina operation. The Vermont facility manufactured non-fiber based products. In the Thermal/Acoustical segment, the Company recorded pre-tax restructuring and restructuring related charges of $7.4 million over the period of consolidation, including pre-tax charges of $1.6 million in 2008 and $5.8 million in 2009, with over 95% recorded in cost of sales during both periods. These restructuring activity expenses primarily included severance related expenses, acceleration of depreciation expense on fixed assets that were not transferred to the North Carolina facility, and facility exit, moving and set-up expenses of equipment transferred from Vermont to North Carolina. No cash outflows were made in 2010 other than the remaining lease payments on the Vermont facility of approximately $0.4 million, which will continue to be made ratably through the third quarter of 2011. Total cash outflows for the restructuring program was $5.4 million in 2009 and $0.3 million in 2008. This consolidation reduced operating costs for non-fiber based products due to lower fixed overhead and labor costs as a result of closing the Vermont facility. However, these savings were more than offset by the impact of manufacturing inefficiencies for fiber based products at the North Carolina facility, which resulted in higher manufacturing costs in 2010.
23
Table of Contents
SEGMENT RESULTS
| Consolidated Net Sales | For the Years Ended December 31, |
|||||||||||
| in thousands | 2010 | 2009 | 2008 | |||||||||
| Performance Materials: |
||||||||||||
| Filtration |
$ | 84,551 | $ | 66,363 | $ | 70,549 | ||||||
| Industrial Thermal Insulation |
38,584 | 31,652 | 41,036 | |||||||||
| Performance Materials Segment net sales |
$ | 123,135 | $ | 98,015 | $ | 111,585 | ||||||
| Thermal/Acoustical: |
||||||||||||
| Automotive parts |
$ | 158,414 | $ | 106,735 | $ | 143,177 | ||||||
| Automotive tooling |
20,637 | 21,058 | 20,523 | |||||||||
| Thermal/Acoustical Segment net sales |
$ | 179,051 | $ | 127,793 | $ | 163,700 | ||||||
| Other Products and Services: |
||||||||||||
| Vital Fluids |
$ | 15,562 | $ | 14,600 | $ | 16,649 | ||||||
| Affinity |
21,894 | 9,215 | 15,104 | |||||||||
| Other Products and Services net sales |
$ | 37,456 | $ | 23,815 | $ | 31,753 | ||||||
| Eliminations and Other |
(1,635 | ) | (676 | ) | (1,322 | ) | ||||||
| Consolidated Net Sales |
$ | 338,007 | $ | 248,947 | $ | 305,716 | ||||||
| Operating Income (Loss) from Continuing Operations | For the Years Ended December 31, |
|||||||||||
| in thousands | 2010 | Revised 2009 |
Revised 2008 |
|||||||||
| Performance Materials Segment |
$ | 17,247 | $ | 7,593 | $ | 15,625 | ||||||
| Thermal/Acoustical Segment |
446 | (10,337 | ) | (6,101 | ) | |||||||
| Other Products and Services: |
||||||||||||
| Vital Fluids |
(131 | ) | 211 | 1,069 | ||||||||
| Affinity |
1,123 | (2,708 | ) | (7,457 | ) | |||||||
| Corporate Office Expenses |
(14,047 | ) | (12,538 | ) | (12,737 | ) | ||||||
| Operating Income (Loss) from Continuing Operations |
$ | 4,638 | $ | (17,779 | ) | $ | (9,601 | ) | ||||
Performance Materials
Excluding the impact of foreign currency translation, segment net sales increased by $27.2 million, or 27.7%, in 2010 compared to 2009. Net sales of filtration products increased by $20.3 million, net of foreign currency translation, compared to 2009, primarily from higher volumes of air filtration, fluid power and automotive, and life sciences product net sales. Net sales of industrial thermal insulation products increased by $6.9 million in 2010 compared to the same period of 2009, primarily from improvement in capital project investments by customers in the cryogenic and electrical markets, resulting in increased demand for the Company’s energy and industrial products. Although the Company continues to be impacted by a weak market for construction of new homes and commercial buildings in the U.S., it realized a marginal improvement in sales of industrial thermal insulation products to the construction market in 2010 compared to 2009.
The Performance Materials segment reported operating income of $17.2 million in 2010, or 14.0% of net sales, compared to operating income of $7.6 million, or 7.7% of net sales in 2009. Higher net sales and an increase in gross margin due to improved absorption of fixed costs resulted in higher operating income in 2010 compared to 2009. Operating income in 2010 also includes a net gain on the sale of the Company’s electrical papers product line of $2.5 million, or 2.0% of net sales. Partially offsetting the improved gross margin were higher selling, product development and administrative expenses of $1.8 million in 2010 compared to 2009. This increase was primarily due to higher incentive compensation expense of $0.9 million, new product development trial costs of $0.4 million, and severance related charges of $0.4 million. Because the segment and Company met certain 2010 bonus plan targets, it recorded incentive compensation expense in 2010, while in 2009, no bonus plan targets were met.
24
Table of Contents
Excluding the impact of foreign currency translation, segment net sales decreased by $12.0 million, or 10.8%, in 2009 compared to 2008. Net sales of filtration products decreased by $2.7 million as many of the air filtration media customers lowered production schedules due to reduced demand for their products as a result of the global economic recession. Net sales of industrial thermal insulation products decreased by $9.3 million in 2009 compared to 2008. This decrease was due to reductions in net sales of both energy and industrial products and, to a lesser extent, building and appliance insulation products. Throughout most of 2008, there was strong demand for the Company’s energy and industrial products. However, in 2009, net sales of energy and industrial products decreased by $5.1 million due to lower capital project investments by customers in the electrical and cryogenic markets. Net sales of building and appliance insulation products decreased by $4.2 million in 2009, compared to 2008, as the Company was impacted by lower construction of new homes and commercial buildings in the U.S. in 2009.
The Performance Materials segment reported operating income of $7.6 million in 2009, a decrease of $8.0 million, or 51.4%, compared with 2008. Lower net sales, as well as a higher per-unit manufacturing costs, which caused a lower gross margin percentage, contributed to lower operating income in 2009 compared to 2008. Higher per-unit manufacturing costs were caused by lower sales as each unit absorbed a greater amount of fixed costs. Also, the results at the Solutech operation, acquired in December 2008, contributed to the reduction in operating income in 2009 compared to 2008. Selling, product development and administrative expenses were essentially flat in 2009 compared to 2008. Solutech expenses increased by $2.3 million in 2009 compared to 2008 due to the acquisition occurring in December 2008. Offsetting the increase at Solutech was a reduction in expenses at all other Performance Materials segment locations. These reductions included incentive compensation expense of $0.7 million, travel related costs of $0.3 million, sales commissions and advertising costs aggregating to $0.3 million, as well as reductions in other discretionary spending.
Thermal/Acoustical
Excluding the impact of foreign currency translation, segment net sales for 2010 increased by $55.8 million, or 43.6%, compared to 2009. Automotive parts net sales increased by $55.6 million, or 52.1%, compared to 2009. Tooling net sales in 2010 were essentially flat with 2009. NA Auto parts net sales were higher by $32.2 million, or 58.5%, and European parts net sales increased by $23.4 million, or 45.3%, net of foreign currency translation, in 2010 compared to 2009. This increase in automotive parts net sales was driven by higher demand of automobiles on Lydall’s existing platforms, as well as from sales of parts on new platforms awarded to the Company. For most of 2009, this segment was negatively impacted by the global economic recession causing lower consumer demand for automobiles and resulting in lower production levels on most platforms, early termination of various platforms and delays in launches of new platforms by automakers, as well as bankruptcy filings of Chrysler and General Motors.
For the year ended December 31, 2010, operating income for the segment was $0.4 million, compared with an operating loss of $(10.3) million in 2009. Operating results in 2010 included approximately $0.8 million of income recorded in the fourth quarter of 2010 primarily related to a negotiated price settlement with a customer and the completion of a tax audit, which resulted in the reversal of a property tax accrual recorded in a prior year. Operating loss in 2009 included $5.8 million of restructuring related charges associated with the NA Auto consolidation. The positive impact of higher net sales on the segment’s operating results in 2010 was depressed by negative gross margin by the fiber-based product line of the NA Auto facility, starting towards the end of the second quarter of 2010. Selling, product development and administrative expenses in 2010 were higher by $1.2 million compared to 2009. This increase was primarily caused by higher sales commission expense of $0.9 million and an accrued payroll tax item of $0.4 million.
Thermal/Acoustical segment net sales decreased to $127.8 million in 2009, compared to $163.7 million for 2008. Excluding the impact of foreign currency translation, net sales decreased by $32.7 million, or 20.0%, when compared to 2008. Automotive parts net sales decreased by $33.8 million, partially offset by increased tooling net sales $1.1 million in 2009, compared to 2008. Automotive parts net sales in North America were lower by $17.2 million, or 23.9%, in 2009, while parts net sales in Europe decreased by $16.6 million, or 23.4%, net of foreign currency translation, compared to 2008. In North America and Europe, the Company’s automotive businesses were impacted by global economic conditions resulting in less consumer demand for automobiles. Automotive parts net sales were adversely impacted by lower production on existing platforms, early termination of existing platforms and delays in launches of new platforms. The Company’s NA Auto business was also negatively impacted by the bankruptcy filings of Chrysler and General Motors. In connection with its bankruptcy filing, Chrysler temporarily idled production at most manufacturing plants in the U.S. during a significant portion of the second quarter of 2009 while the company reorganized. Also, General Motors had extended shut-down periods during the second quarter of 2009. The increase in tooling net sales in 2009, compared to 2008, was in North America due to the completion of tooling for future automobile platforms.
25
Table of Contents
Operating loss for the segment was $(10.3) million in 2009 compared with an operating loss of $(6.1) million in 2008. Approximately $5.8 million, or 56%, of the 2009 operating loss was the result of restructuring related charges associated with the NA Auto consolidation. The increase in operating loss in 2009 was comprised of the following: (i) lower gross margin of $20.1 million in 2009, including higher restructuring related charges of $4.2 million in 2009, (ii) the absence of goodwill impairment charges of $12.2 million recorded in 2008 as it was determined that there was no remaining implied fair value of goodwill attributable to the Company’s NA Auto business, and (iii) reductions of $3.7 million in selling, product development and administrative expenses. Lower gross margin in 2009 compared to 2008 was due to significantly lower net sales in 2009 than 2008. Also, gross margin percentage in 2009 was lower by approximately 770 basis points than 2008, when excluding the impact of restructuring charges in both periods. Lower net sales resulted in higher per-unit manufacturing costs, as each unit absorbed a greater amount of fixed costs. Contributing to the reduction in selling, product development and administrative expenses of $3.7 million in 2009 compared to 2008 were reductions in: salaries and wages expense of $1.4 million, severance related charges of $0.7 million, sales commission expenses of $0.6 million, bad debt expense of $0.3 million, as well as other reductions in discretionary spending. Reductions in workforce in 2009, due to the NA Auto consolidation and lower production requirements at other automotive businesses, contributed to lower salaries and wages expense. Realignment of management in the global automotive business, in December 2008, contributed to higher severance related charges in 2008 and lower salaries and wages expense in 2009. In addition, lower sales commission expenses were recorded due to lower sales in 2009 compared to 2008.
Other Products and Services
In 2010, compared to 2009, OPS net sales increased by $13.6 million, or 57.3%, primarily as the result of increased volumes of net sales from the Affinity business of $12.7 million, or 137.6%. Vital Fluids net sales increased by $0.9 million, or 6.6%, in 2010 compared to 2009. The increase in Affinity net sales was attributable to a significant increase in capital equipment spending in the semiconductor industry. The increase in the Vital Fluids business was caused by higher volumes of bioprocessing and blood filtration product net sales.
OPS reported operating income of $1.0 million in 2010, compared to an operating loss of $(2.5) million in 2009. The Affinity business reported operating income of $1.1 million in 2010 compared to an operating loss of $(2.7) million in 2009, as a result of higher sales and an improvement in the absorption of fixed costs, partially offset by higher expenses related to sales commissions and incentive compensation aggregating to $0.4 million. The Vital Fluids business reported an operating loss of $(0.1) million in 2010, compared to operating income of $0.2 million in 2009. This reduction in Vital Fluids’ operating results was due to product mix as well as a product scrap issue of $0.2 million in 2010.
The decrease in OPS net sales of $7.9 million in 2009 compared to 2008 was due to decreased volumes of net sales from the Affinity business of $5.9 million and the Vital Fluids business of $2.0 million. The decrease in Affinity net sales during 2009 was attributable to the depressed capital equipment spending in the semiconductor industry that the Company serves. The decrease in net sales of Vital Fluids’ products was primarily attributable to decreased volumes of blood filtration product net sales and, to a lesser extent, bioprocessing net sales, partially offset by higher net sales of blood transfusion products.
OPS operating loss was $(2.5) million in 2009 compared to an operating loss of $(6.4) million in 2008. The Affinity business reported an operating loss of $(2.7) million in 2009 compared to an operating loss of $(7.5) million in 2008. Excluding the fourth quarter of 2008 charges related to goodwill impairment of $4.2 million and long-lived asset impairment of $1.0 million, the operating loss at Affinity increased by $0.4 million in 2009 compared to 2008. While net sales decreased by $5.9 million, or 39%, in 2009, compared to 2008, cost reduction activities partially offset the impact of lower net sales on Affinity’s operating results. Also, selling expenses decreased by $0.3 million in 2009, compared to 2008, primarily due to lower net sales. Operating income of $0.2 million reported by the Vital Fluids business in 2009 was lower by $0.9 million compared to 2008. Lower net sales of $2.0 million, and to a lesser extent, changes in product mix, resulted in the decrease in operating income.
Corporate Office Expenses
The increase in corporate office expenses of $1.5 million in 2010 compared to 2009 was principally due to higher legal and settlement costs of $0.8 million, primarily related to defending and settling lawsuits filed by a former employee and higher incentive compensation expense of $0.7 million. Because the Company met certain 2010 bonus plan targets, it recorded incentive compensation expense whereas there was no incentive compensation expense in 2009.
Corporate office expenses in 2009 were essentially flat with 2008 due to increases in pension expense associated with the Company’s sponsored defined benefit plans of $0.8 million and severance related charges of $0.3 million offset by reductions in salaries and wages expense, 401(k) company match expense, travel expense, as well as other reductions in discretionary spending.
26
Table of Contents
Higher pension expense was primarily impacted by a lower expected rate of return on assets in 2009 compared to 2008, applied to a lower base of assets, and increases in amortization of actuarial losses. Offsetting this were reductions in personnel, which contributed to lower salaries expense in 2009 as compared to 2008. The Company’s suspension of its matching contribution to its sponsored 401(k) plan, beginning with the first payroll of May 2009, for all non-union domestic employees caused the lower 401(k) company match expense in 2009 compared to 2008.
LIQUIDITY AND CAPITAL RESOURCES
| For the Year
Ended December 31, |
||||||||||||
| (in thousands except ratio data) | 2010 | Revised 2009 |
Revised 2008 |
|||||||||
| Cash and cash equivalents |
$ | 24,988 | $ | 22,721 | $ | 13,660 | ||||||
| Cash provided by operating activities |
$ | 10,718 | $ | 14,067 | $ | 20,098 | ||||||
| Cash used for investing activities |
$ | (6,229 | ) | $ | (3,649 | ) | $ | (21,234 | ) | |||
| Cash used for financing activities |
$ | (1,404 | ) | $ | (1,669 | ) | $ | (262 | ) | |||
| Depreciation and amortization |
$ | 14,407 | $ | 15,890 | $ | 16,131 | ||||||
| Capital expenditures |
$ | 12,001 | $ | 5,921 | $ | 12,037 | ||||||
| Total debt |
$ | 4,888 | $ | 6,751 | $ | 8,154 | ||||||
| Total capitalization (debt plus equity) |
$ | 160,343 | $ | 163,140 | $ | 174,294 | ||||||
| Total debt to total capitalization |
3 | % | 4 | % | 5 | % | ||||||
The Company assesses its liquidity in terms of its ability to generate cash to fund operating, investing and financing activities. The principal source of liquidity is operating cash flows. In addition to operating cash flows, other significant factors that affect the overall management of liquidity include capital expenditures, investments in businesses, acquisitions, income tax payments, pension funding and availability of lines of credit and long-term financing. The Company manages worldwide cash requirements considering available funds among domestic and foreign subsidiaries.
Operating Cash Flows
Net cash provided by operating activities in 2010 was $10.7 million compared with $14.1 million in 2009. In 2010, compared to 2009, operating income improved $22.4 million, which was offset by working capital investments by the Company. At December 31, 2010, inventory increased $11.8 million compared to levels at December 31, 2009. This increase is the result of greater production activity in reaction to improving market conditions and demand for the Company’s products. Contributing to the increase in inventories was higher raw material inventory of $5.9 million and an increase in automotive tooling inventory, net, which was $2.3 million greater at December 31, 2010 compared to December 31, 2009. Overall, the Company made significant cash investments in tooling inventory during 2010 in preparation of launches of new automotive platforms in the latter part of 2010 and in 2011. Typically, the Company is not reimbursed for tooling inventory until completion of the tooling. Accounts receivable increased by $9.1 million at December 31, 2010, compared to December 31, 2009, primarily due to higher sales in the fourth quarter of 2010 compared to the fourth quarter of 2009, partially offset by lower accounts receivable days outstanding. Partially offsetting the above uses of cash were increases in accounts payable by $8.5 million, primarily due to increased levels of inventory purchases, and accrued payroll and other compensation liabilities by $3.5 million due to the timing of payroll and accrued incentive compensation under the Company’s 2010 bonus program. Also, during the second quarter of 2010, the Company filed its U.S. 2009 Federal Income Tax Return and subsequently received a cash refund of $3.5 million in the third quarter of 2010.
Investing Cash Flows
Net cash used for investing activities was $6.2 million in 2010 compared with $3.6 million in 2009. In 2010, capital expenditures returned to a more normalized level of $12.0 million compared with $5.9 million in 2009. On June 30, 2010, the Company sold its electrical papers product line, included in the Performance Materials segment, and realized proceeds of $4.8 million. In 2010, the Company received $0.7 million from a leasing company as a result of a sale-leaseback transaction for equipment. Cash of $0.3 million was received in 2010 from DSM Solutech B.V. for the final resolution of the purchase price detailed in the Sales and Purchase Agreement. This amount was recorded in accounts receivable at December 31, 2009.
27
Table of Contents
Financing Cash Flows
In 2010, net cash used for financing activities was $1.4 million compared with net cash used for financing activities of $1.7 million in 2009. Net debt payments and capital lease payments aggregated to $1.4 million in 2010 compared to $1.6 million in 2009. The Company had no borrowings on its domestic credit facility at December 31, 2010 and 2009. Proceeds from common stock issuances in 2010 were $0.1 million, which were offset by common stock repurchased.
Financing Arrangements
On March 11, 2009, the Company entered into a $35 million senior secured domestic credit facility (“Domestic Credit Facility”) with a financial institution. The Borrowing Base under the Domestic Credit Facility is determined based on certain percentages of eligible domestic accounts receivable, eligible domestic inventories and eligible domestic fixed assets, reduced by applicable reserves. The Company had no borrowings outstanding under the Domestic Credit Facility at December 31, 2010 or December 31, 2009. The Domestic Credit Facility has a term of three years.
Interest is charged on borrowings at the Company’s option of either: (i) the Prime Rate plus an Applicable Margin or (ii) the Eurodollar Rate plus an Applicable Margin. The Prime Rate is a fluctuating rate equal to the higher of the financial institution’s prime rate or the federal funds rate plus .50%. The Eurodollar Rate is a fluctuating LIBOR rate offered for deposits in U.S. dollars. The Applicable Margin added to the Prime Rate ranges from 1.25% to 1.75% and the Applicable Margin added to the Eurodollar Rate ranges from 4.25% to 4.75% depending on the type of collateral that supports the outstanding borrowings. The Company also pays .50% per annum on the average daily unused portion of the Domestic Credit Facility and 4.25% per annum on the daily outstanding balance of letters of credit.
The loan agreement governing the Domestic Credit Facility contains a number of affirmative and negative covenants, including financial covenants. Among others, at all times the Company and its domestic subsidiaries must maintain Excess Availability, as defined in the loan agreement, of not less than $5.0 million. If the borrowings under the Domestic Credit Facility exceed $5.0 million, or Excess Availability under the Domestic Credit Facility is less than $12.5 million, the Company is required to meet a minimum fixed charge coverage ratio. The fixed charge coverage ratio requires that, at the end of any month, the ratio of consolidated EBITDA, as defined in the loan agreement, to fixed charges may not be less than 1 to 1 for the immediately preceding 12 month period. At no time during the twelve months ended December 31, 2010 did borrowings under the Domestic Credit Facility exceed $5.0 million or was Excess Availability less than $12.5 million, therefore, the Company was not subject to the fixed charge coverage ratio. Consistent with the fourth quarter of 2010, the Company expects to be subject to a $5.0 million borrowing limit under its Domestic Credit Facility throughout the first quarter of 2011 and possibly future periods because it does not expect to meet the fixed charge coverage ratio.
At December 31, 2010, the Company’s foreign subsidiaries had various credit arrangements with banks totaling €7.0 million (approximately $9.4 million) with €5.9 million (approximately $7.9 million) available for borrowings, primarily restricted to borrowings at the respective foreign subsidiary. Other than letters of credit outstanding, the Company’s foreign subsidiaries had no borrowings outstanding on any of its credit arrangements at December 31, 2010 or December 31, 2009.
The Company has a capital lease agreement for a high speed manufacturing line at its German operation, included in the Thermal/Acoustical segment. The lease has monthly principal and interest payments until the first quarter of 2012. The lease also contains a purchase option, which provides the Company with the option to purchase the equipment anytime after the fourth year of the lease term for a stated percentage of the original purchase price. In addition, the Company has a capital lease agreement for the land and building at the St. Nazaire, France operating facility, included in the Thermal/Acoustical segment, requiring monthly principal and interest payments until 2016. The capital lease provides an option for the Company to purchase the land and building at the end of the lease for a nominal amount.
In 2010, the Company entered into operating leases for manufacturing equipment at its North American automotive facility included in the Thermal/Acoustical segment. The estimated future minimum payments for this equipment are $1.8 million through 2017.
Other than operating leases, the Company does not have any off-balance sheet financing arrangements.
Future Cash Requirements
At December 31, 2010, total indebtedness was $4.9 million, or 3.0% of the Company’s total capital structure. Cash requirements for 2011 are expected to include the funding of ongoing operations, including purchase of raw material, capital expenditures, payments due on capital and operating leases, pension plan contributions, income tax payments and debt service.
28
Table of Contents
Capital spending for 2011 is expected to be approximately $12.0 million to $14.0 million. The funded status of the Company’s defined benefit pension plans is dependent upon many factors, including returns on invested assets, levels of market interest rates and levels of contributions to the plans. The Company expects to contribute approximately $2.5 million to its defined benefit pension plans during 2011. The Company continually explores its core markets for suitable acquisitions, joint ventures, alliances and licensing agreements. If completed, such activities would be financed with cash generated from operations, under the credit facilities described under “Financing Arrangements” above or other forms of financing, as required.
The Company manages worldwide cash requirements considering available funds among domestic and foreign subsidiaries. During 2010, the Company elected to change its assertion regarding indefinite reinvestment of earnings in its German branch, thus providing more flexibility in remitting foreign funds to Lydall, Inc. The Company expects to fund its operating cash requirements from existing cash balances, cash generated by operations, and through borrowings, as needed, under its existing domestic and foreign credit facilities.
Contractual Obligations
The following table summarizes the Company’s significant obligations as of December 31, 2010 and the effect such obligations are expected to have on the Company’s liquidity and cash flows in future periods:
| Payments Due by Period |
||||||||||||||||||||||||||||
| In thousands | 2011 | 2012 | 2013 | 2014 | 2015 | After 5 years | Total | |||||||||||||||||||||
| Contractual obligations: |
||||||||||||||||||||||||||||
| Pension plan contributions |
$ | 2,472 | $ | — | $ | — | $ | — | $ | — | $ | — | $ | 2,472 | ||||||||||||||
| Operating leases |
2,832 | 2,281 | 1,117 | 778 | 468 | 1,147 | 8,623 | |||||||||||||||||||||
| Capital leases* |
1,430 | 940 | 776 | 683 | 683 | 341 | 4,853 | |||||||||||||||||||||
| Long-term debt* |
245 | 260 | 64 | — | — | — | 569 | |||||||||||||||||||||
| Purchase obligations |
6,248 | — | — | — | — | — | 6,248 | |||||||||||||||||||||
| Total contractual obligations |
$ | 13,227 | $ | 3,481 | $ | 1,957 | $ | 1,461 | $ | 1,151 | $ | 1,488 | $ | 22,765 | ||||||||||||||
| * | includes estimated interest payments |
The above table does not reflect net unrecognized tax benefits of $0.3 million, the timing of which is uncertain. Refer to Note 14 to the Consolidated Financial Statements for additional discussion on unrecognized tax benefits. Purchase obligations in the table above are primarily related to contracts to purchase aluminum at various automotive operations ($5.4 million in 2011) in which the quantity and price is contractually fixed at December 31, 2010. Not included in the table above, because the price is not fixed, is an additional purchase obligation of 450 metric tons of aluminum at the European automotive operation, beginning in January 2011 through May 2011, which will be based on the London Metal Exchange (“LME”) average rate. Based on LME rates during 2010, the Company estimated this additional aluminum commitment to be approximately $1.0 million to $1.2 million. Also, the Company’s North American automotive operation has an additional purchase obligation of 5.1 million pounds of aluminum, which is priced based on the U.S. Midwest previous month’s average rate. Based on an estimated price and expected 2011 production requirements, the Company estimated this additional aluminum commitment to be approximately $5.4 million to $6.5 million for 2011. Purchase orders or contracts for normal purchases of raw materials and other goods and services are not included in the table above. The Company is not able to determine the aggregate amount of such purchase orders that represent contractual obligations, as purchase orders may represent authorizations to purchase rather than binding agreements. For purposes of this table, contractual obligations for purchase of goods or services are defined as agreements that are enforceable and legally binding on the Company and that specify all significant terms, including: fixed or minimum quantities to be purchased; fixed, minimum or variable price provisions; and the approximate timing of the transactions. The Company does not have significant agreements for the purchase of raw materials or other goods specifying minimum quantities or set prices that exceed expected requirements.
The Company’s long-term debt payments and interest rates for all of the Company’s outstanding debt were fixed as of December 31, 2010. Actual payments may vary significantly from those included in the table above depending on future debt levels, timing of debt repayments and sources of funding utilized.
The Company’s future pension plan contributions relate to the remaining contributions required for the 2010 plan year and the minimum contributions for the 2011 plan year based on the Company’s pension plan valuations at December 31, 2010. See Note 11 to the Consolidated Financial Statements for additional information regarding the Company’s pension plans.
29
Table of Contents
In addition to the above contractual obligations, the Company utilizes letters of credit in the ordinary course of business for security deposit requirements. Outstanding letters of credit were $4.3 million and $2.5 million at December 31, 2010 and 2009, respectively.
CRITICAL ACCOUNTING ESTIMATES
The preparation of the Company’s consolidated financial statements in accordance with accounting principles generally accepted in the United States of America requires management to make estimates and assumptions that affect the reported amounts of assets and liabilities and disclosure of contingent assets and liabilities as of the date of the financial statements and the reported amounts of revenues and expenses during the reporting periods. Note 1 in Notes to Consolidated Financial Statements describes the significant accounting policies used in the preparation of the consolidated financial statements. The Company’s management is required to make judgments about and estimates of the effect of matters that are inherently uncertain. Actual results could differ from management’s estimates. The most significant areas involving management judgments and estimates are described below.
Intangible Assets and Goodwill
Intangible assets consist primarily of goodwill and acquisition-related intangibles. The Company had goodwill of $18.2 million at December 31, 2010 and $19.3 million at December 31, 2009.
Goodwill and other intangible assets determined to have indefinite lives are not amortized, but rather are subject to annual impairment tests or when an event occurs or circumstances change that would more likely than not reduce the fair value of a reporting unit below its carrying value. The identification and measurement of goodwill impairment involves the estimation of the fair value of reporting units, including related goodwill. The Company’s reporting units are operating segments or components of operating segments for which discrete financial information is available and management regularly reviews the operating results of that operating segment or component. Goodwill is tested for impairment using a two-step process. In the first step, the fair value of the reporting unit is compared to its carrying value. If the fair value of the reporting unit exceeds the carrying value of its net assets, goodwill is considered not impaired and no further testing is required. If the carrying value of the net assets exceeds the fair value of the reporting unit, a second step of the impairment test is performed in order to determine the implied fair value of a reporting unit’s goodwill. Determining the implied fair value of goodwill requires a valuation of the reporting unit’s tangible and intangible assets and liabilities in a manner similar to the allocation of purchase price in a business combination. If the carrying value of the reporting unit’s goodwill exceeds the implied fair value of its goodwill, goodwill is deemed impaired and is written down to the extent of the difference.
The estimates of fair value of reporting units are based on the best information available as of the date of the assessment, which incorporate management assumptions about expected future cash flows, as well as other factors such as market capitalization. Future cash flows can be affected by numerous factors including changes in economic, industry or market conditions, changes in the underlying business or products of the reporting unit, changes in competition and changes in technology. Any changes in key assumptions about the business and its prospects, changes in any of the factors discussed above or other factors could affect the fair value of one or more of the reporting units resulting in an impairment charge, which did occur during the fourth quarter of 2008.
During the fourth quarter of 2010, the Company performed its annual impairment analysis of the $13.5 million of goodwill in the Performance Materials reporting unit and $4.7 million of goodwill in the Vital Fluids reporting unit, included in OPS. The Company’s goodwill impairment testing analysis (“analysis”) included projecting cash flows for the years 2011– 2015 and discounting those amounts based on appropriate market risks and other market factors. Based on those projections and other assumptions used in the analysis, the Company concluded that the fair value of these reporting units exceeded their carrying value of net assets. As a result, there was no impairment of goodwill.
The projected cash flows of the Vital Fluids reporting unit include assumptions for growth in future years resulting from a strategic initiative to increase market share in the bioprocessing market. In 2010, the Vital Fluids business initiated the qualification of products with a number of new customers, however, there is a lengthy period of time required for customer qualification and the expected improved operating results to be realized by the business. If future operating performance does not meet expectations or other key assumptions change or are not met, there can be no assurance that the fair value of the reporting unit will continue to exceed its carrying value which could potentially result in a non-cash impairment charge to income from operations.
30
Table of Contents
Impairment of Long-Lived Assets
Long-lived assets are reviewed for impairment whenever events or changes in circumstances indicate that the carrying amount of such assets may not be recoverable. Determination of recoverability is based on the Company’s judgment and estimates of undiscounted future cash flows resulting from the use of the assets and their eventual disposition. Measurement of an impairment loss for long-lived assets and certain identifiable intangible assets that management expects to hold and use is based on the fair value of the asset.
The carrying values of the assets determined to be impaired are reduced to their estimated fair values. The fair values of the impaired assets are determined based on market conditions, including independent appraisals when appropriate, the income approach, which utilizes cash flow projections, and other factors.
The Company determined that long-lived assets at the Affinity business were impaired at December 31, 2008. This was based on reviewing estimated undiscounted cash flows and independent appraisals for its asset group, which indicated that the fair value was less than their carrying value. The Company recorded an impairment charge of $1.0 million during the fourth quarter of 2008, which represented the difference between the estimated fair value of the asset group compared to the carrying value of the asset group (See Note 15 to the Consolidated Financial Statements).
Pensions
Pension cost and the related obligations recognized in the consolidated financial statements are determined on an actuarial basis. The determination of such amounts is made in consultation with the Company’s outside actuary based on information and assumptions provided by the Company. A substantial portion of the Company’s pension amounts relate to its defined benefit plans in the United States. Pension plans outside the U.S. are not significant at December 31, 2010.
A significant element in determining the Company’s pension cost is the expected return on plan assets. Based on a review of market trends, actual returns on plan assets and other factors, the Company’s expected long-term rate of return on plan assets of 8.0% will be utilized for determining 2011 pension cost, which is consistent with what was used for calculating 2010 pension costs. In determining the expected return on plan assets, the Company considers the relative weighting of plan assets, the historical performance of marketable debt and equity securities and economic and other indicators of future performance. Investment management objectives include maintaining an adequate level of diversification to balance market risk and to provide sufficient liquidity for near-term payments of benefits accrued under the plan and to pay the expenses of administration. The investment plan assets are stated at fair value, which is based on quoted market prices in an active market. The expected long-term rate of return on assets is applied to the value of plan assets at the beginning of the year and this produces the expected return on plan assets that is included in the determination of pension cost for that year. The difference between this expected return and the actual return on plan assets is deferred, within certain parameters, as discussed below. The Company continually evaluates its expected long-term rate of return and will adjust such rate as deemed appropriate.
At the end of each year, the Company determines the discount rate to be used to calculate the present value of plan liabilities, as well as the following year’s pension cost. The discount rate is an estimate of the current interest rate at which the pension liabilities could be effectively settled at the end of the year. The Company based its discount rate assumption on an analysis which included the selection of a bond portfolio comprised of high quality fixed income investments whose cash flows would provide for the projected benefit payments of the plan. The discount rate is then developed as the single rate that equates the market value of the bond portfolio to the discounted value of the plan’s benefit payments. At December 31, 2010, the Company determined this rate to be 5.74%. Increases or decreases in the discount rate result in decreases and increases, respectively, in the projected benefit obligation. The net effect on pension liabilities from changes in the discount rate is deferred within certain parameters, as discussed below.
Pension accounting guidance requires that gains or losses be deferred unless the unrecognized net gain or loss at the end of a year exceeds a “corridor” (as defined in the pension accounting guidance). If the deferred gain or loss exceeds the corridor at the end of the year, then the amount in excess of the corridor is amortized over a period equal to the average remaining service period of active employees expected to receive benefits. Since benefit accruals were frozen on certain domestic defined benefit plans on June 30, 2006, these plan participants are considered inactive participants. Therefore, the gain/loss amortization for these plans is amortized over the average remaining life expectancy of all plan participants. As of December 31, 2010 and 2009, the net deferred loss exceeded the corridor. Consequently, pension cost for 2011 will include amortization of a portion of the deferred loss in
31
Table of Contents
excess of the corridor. The amount of amortization in future years will be dependent on changes in the components of the deferred loss amount, particularly actual return on plan assets in relation to the estimated return on plan assets, as well as future increases or decreases in the discount rate.
For the year ended December 31, 2010, the Company recognized pension expense related to its defined benefit plans in the U.S. of $0.8 million as a result of the expected return on assets being lower than the aggregate of interest cost and the amortization of actuarial loss. As discussed above, the Company’s discount rate was 5.74% at December 31, 2010 and was used for purposes of determining 2011 pension cost. Pension expense for 2011 is expected to be in the range of $0.5 million to $0.6 million.
The Company contributed $1.7 million to its U.S. defined benefit pension plans during 2010 and expects to contribute approximately $2.5 million in 2011.
Income Taxes
The Company accounts for income taxes recognizing deferred tax assets and liabilities using enacted tax rates for the effect of temporary differences between book and tax bases of recorded assets and liabilities. Deferred tax assets are reduced by a valuation allowance if it is more likely than not that some or all of a deferred tax asset will not be realized.
In assessing the need for a valuation allowance, the Company analyzes historical financial results by jurisdiction and estimates future taxable income, considering the feasibility of ongoing tax planning strategies and the realizability of tax loss carryforwards. Valuation allowances related to deferred tax assets can be impacted by changes in tax law, changes in statutory tax rates and future levels of taxable income. In the event the Company was to determine that it would not be able to realize all or a portion of its deferred tax assets in the future, the Company would reduce such amounts through a charge to income in the period that such determination was made. Conversely, if the Company was to determine that it would be able to realize its deferred tax assets in the future in excess of the net carrying amounts, the Company would decrease the recorded valuation allowance and record an increase to income in the period that such determination was made. See Note 14 to the Consolidated Financial Statements.
The Company and its subsidiaries file a consolidated federal income tax return, as well as returns required by various state and foreign jurisdictions. In the normal course of business, the Company is subject to examination by taxing authorities, including such major jurisdictions as the United States, France, Germany and the Netherlands. With few exceptions, the Company is no longer subject to U.S. federal examinations for years before 2006, state and local examinations for years before 2006, and non-U.S. income tax examinations for years before 2007.
In assessing the need for reserves for uncertainties in income taxes recognized, a significant number of estimates and judgments must be made by the Company. The total amount of net unrecognized tax benefits that, if recognized, would affect the effective tax rate was $0.3 million as of December 31, 2010.
Unremitted earnings of foreign subsidiaries have been included in the consolidated financial statements without giving effect to the United States taxes that may be payable on the distribution to the United States because it is not anticipated such earnings will be remitted to the United States. If remitted, the additional United States tax liability is not expected to be material.
The Company’s effective tax rates in future periods could be affected by earnings being lower or higher than anticipated in countries where tax rates differ from the United States federal rate, the relative impact of permanent tax adjustments on higher or lower earnings from domestic operations, changes in net deferred tax asset valuation allowances, changes in tax rates or tax laws and the completion of tax audits.
Equity Compensation Plans
The Company accounts for awards of equity instruments under the fair value method of accounting and recognizes such amounts in the statements of operations. The Company recognizes expense on a straight-line basis over the vesting period of the entire award. Stock-based compensation expense includes the estimated effects of forfeitures and such estimates of forfeitures are adjusted over the requisite service period to the extent actual forfeitures differ, or are expected to differ, from such estimates. The effect of changes in estimated forfeitures is recognized in the period of change and will also impact the amount of expense to be recognized in future periods. The Company estimates the fair value of option grants based on the Black Scholes option-pricing model. Expected volatility and expected term are based on historical information. The Company believes that future volatility and expected term are not likely to materially differ from the Company’s historical stock price volatility and historical exercise data, respectively.
32
Table of Contents
The fair value of each option granted is estimated on the date of grant using the Black-Scholes option-pricing model with the following weighted-average assumptions for the years ended December 31:
| 2010 | 2009 | 2008 | ||||||||||
| Risk-free interest rate |
2.2 | % | 2.6 | % | 2.9 | % | ||||||
| Expected life |
5.3 years | 5.5 years | 5.6 years | |||||||||
| Expected volatility |
65 | % | 61 | % | 50 | % | ||||||
| Expected dividend yield |
0 | % | 0 | % | 0 | % | ||||||
Recently Issued Accounting Standards
In October 2009, the FASB issued guidance on revenue recognition. Under this guidance, if vendor-specific objective evidence or third party evidence of fair value for each deliverable in an arrangement with multiple elements is not available then the proportion of the selling price attributable to each deliverable may be estimated. This guidance is effective for annual reporting periods beginning after June 15, 2010. The Company early-adopted these standards on April 1, 2010 and retroactively applied these standards as of the beginning of 2010 for new and materially modified arrangements originating after December 31, 2009 (see Note 9 in Notes to Consolidated Financial Statements). Operating income for 2010 was approximately $1.9 million higher than operating income would have been under the previous accounting rules.
In January 2010, the FASB issued guidance on improving disclosures about fair value measurements. This guidance requires reporting entities to make new disclosures about recurring or nonrecurring fair-value measurements including significant transfers into and out of Level 1 and Level 2 fair value measurements and information on purchases, sales, issuances, and settlements on a gross basis in the reconciliation of Level 3 fair value measurements. This guidance is effective for annual reporting periods beginning after December 15, 2009, except for Level 3 reconciliation disclosures which are effective for annual periods beginning after December 15, 2010. The adoption of this guidance has not had and is not expected to have a material effect on the Company’s consolidated financial position, results of operations, or cash flows.
OTHER KEY FINANCIAL ITEMS
Cash and cash equivalents – Cash and cash equivalents increased to $25.0 million as of December 31, 2010 compared with $22.7 million as of December 31, 2009. This increase of $2.3 million was primarily due to cash generated from operating activities of $10.7 million, including tax refunds of $3.5 million, which was partially offset by cash used in investing activities of $6.2 million and cash used for financing activities of $1.4 million. Investing activities included $12.0 million used for capital expenditures offset by $4.8 million of proceeds from a sale of a product line. Changes in foreign currency exchange rates resulted in cash decreasing by $0.8 million in 2010 compared to 2009.
Accounts receivable – Accounts receivable, net of the allowance for doubtful receivables, were $47.1 million at the end of 2010 compared with $39.8 million at the end of 2009. This increase was primarily related to higher net sales in the fourth quarter of 2010 as compared to the same period in 2009.
Inventories – Inventories were $37.4 million as of December 31, 2010 compared with $26.4 million as of December 31, 2009. Primarily contributing to this increase was higher raw materials and work-in-process inventories (net of progress billing on tooling inventories) of $5.9 million and $3.4 million, respectively. These increases were the result of greater production activity in reaction to improving market conditions and demand for the Company’s products. Contributing to the increase in work-in-process inventories was an increase in automotive tooling inventory, net, which was $2.3 million greater at December 31, 2010 compared to December 31, 2009. The Company made significant cash investments in tooling inventory during 2010 in preparation of launches of new automotive platforms in the latter part of 2010 and in 2011.
Current liabilities – Current liabilities increased to $52.7 million at December 31, 2010 compared to $39.4 million at December 31, 2010. The largest components of the increase were related to higher accounts payable of $7.9 million and accrued payroll and other compensation of $3.2 million. The increase in accounts payable was primary driven by the timing of inventory purchases. As a result of greater customer demand for products, the Company’s level of inventory purchases in the fourth quarter of 2010 was significantly higher than the comparable quarter of 2009. Higher accrued payroll and other compensation was due to the timing of payroll as well as higher headcount and greater production labor hours in the last weeks of December 2010 compared to December 2009. Also, as a result of meeting certain financial targets in the Company’s 2010 bonus plan, accrued incentive compensation was recorded at December 31, 2010, compared to 2009 when no incentive compensation was accrued at December 31, 2009.
33
Table of Contents
Working capital and current ratio – Working capital at December 31, 2010 was $63.4 million, compared to $60.6 million at December 31, 2009. The ratio of current assets to current liabilities was 2.2:1 and 2.5:1 at December 31, 2010 and 2009, respectively.
Capital expenditures – Capital expenditures were $12.0 million in 2010, $5.9 million in 2009, and $12.0 million in 2008. Capital spending for 2011 is expected to be approximately $12.0 million to $14.0 million.
Total debt to total capitalization – Total debt to total capitalization decreased to 3.0% in 2010 compared with 4.1% in 2009. The decrease was primarily due to lower debt levels in 2010 compared to 2009.
Stockholders’ equity – Stockholders’ equity decreased to $155.5 million at December 31, 2010 from $156.4 million at December 31, 2009. This decrease was primarily due to foreign currency translation adjustments of $5.3 million, partially offset by net income of $2.7 million and $1.4 million of stock based compensation expense. On a per share basis, stockholders’ equity decreased to $9.06 at December 31, 2010 from $9.15 at December 31, 2009.
Dividend policy – The Company does not pay a cash dividend on its common stock and the Company’s domestic credit facility entered into on March 11, 2009 prohibits the Company from paying such cash dividend.
Off Balance Sheet Arrangements – Other than operating leases, the Company does not have any other material off-balance sheet financing arrangements.
Item 7A. QUANTITATIVE AND QUALITATIVE DISCLOSURES ABOUT MARKET RISK
Lydall’s limited market risk exposures relate to changes in foreign currency exchange rates and interest rates.
FOREIGN CURRENCY RISK
Lydall has sales and manufacturing activities in foreign countries. As a result, financial results could be affected by factors such as changes in foreign currency exchange rates or economic conditions in the foreign markets where the Company distributes its products. The Company’s primary currency exposure is to the Euro and, to a lesser degree, the Japanese Yen and the British Pound Sterling.
Lydall’s foreign and domestic operations limit foreign currency exchange transaction risk by completing transactions in local functional currencies whenever practicable. In addition, Lydall periodically enters into foreign currency forward exchange contracts to mitigate exposure to foreign currency volatility. Lydall utilizes bank loans and other debt instruments throughout its operations. To mitigate foreign currency risk, such debt is denominated primarily in the functional currency of the operation maintaining the debt.
INTEREST RATE RISK
The Company’s interest rate exposure is most sensitive to fluctuations in interest rates in the United States and Europe, which impact interest paid on its debt. At December 31, 2010, the Company had no loans or borrowings on lines of credit outstanding with variable interest rates, therefore, a 10% change in the weighted average interest rate on the Company’s variable rate debt would not have any impact to the Company’s consolidated financial position, results of operations, or cash flows. The weighted average interest rate paid on variable debt was 4.5% in 2010 and 2.4% in 2009. At no time during 2008 did the Company have any borrowings with variable interest rates.
The weighted average interest rate on long-term debt was 5.3%, 5.0%, and 5.2% for the years ended December 31, 2010, 2009 and 2008, respectively.
Item 8. FINANCIAL STATEMENTS AND SUPPLEMENTARY DATA
The response to this Item is contained under Item 15 “Exhibits, Financial Statement Schedules.”
34
Table of Contents
Item 9. CHANGES IN AND DISAGREEMENTS WITH ACCOUNTANTS ON ACCOUNTING AND FINANCIAL DISCLOSURE
None
Item 9A. CONTROLS AND PROCEDURES
Evaluation of Disclosure Controls and Procedures
The Company’s management, including the Company’s President and Chief Executive Officer (“CEO”) and Vice President, Chief Financial Officer and Treasurer (“CFO”), conducted an evaluation as of December 31, 2010 of the effectiveness of the design and operation of the Company’s disclosure controls and procedures (as defined in Rule 13a-15(e) and Rule 15d-15(e) of the Securities Exchange Act of 1934 as amended (“Exchange Act”)). The Company’s disclosure controls and procedures are designed to provide reasonable assurance that information required to be disclosed by the Company in the reports that it files or submits under the Exchange Act is recorded, processed, summarized and reported within the time periods specified in the rules and forms of the SEC, and that such information is accumulated and communicated to management of the Company, including its CEO and CFO, as appropriate to allow timely decisions regarding required disclosure. In designing and evaluating disclosure controls and procedures, management recognizes that any controls and procedures, no matter how well designed and operated, can provide only reasonable assurance of achieving the desired control objectives.
Based on this evaluation, the CEO and CFO concluded that, as of December 31, 2010, the Company’s disclosure controls and procedures were not effective at the reasonable assurance level as a result of a material weakness in the Company’s internal control over financial reporting. This material weakness is discussed in “Management’s Report on Internal Control Over Financial Reporting” below.
In light of this material weakness, the Company performed additional analyses and other post-closing procedures to ensure that the Company’s consolidated financial statements were prepared in accordance with generally accepted accounting principles and accurately reflect the results for the year ended December 31, 2010. As a result, notwithstanding the material weakness discussed below, management concluded that the consolidated financial statements included in this Form 10-K fairly present in all material respects the Company’s financial position, results of operations and cash flows for the year ended December 31, 2010.
Management’s Report on Internal Control Over Financial Reporting
The Company’s management is responsible for establishing and maintaining adequate internal control over financial reporting, as such term is defined in Exchange Act Rule 13a-15(f). Internal control over financial reporting is a process designed by, or under the supervision of, the CEO and CFO, or persons performing similar functions, and effected by the Company’s board of directors, management and other personnel to provide reasonable assurance regarding the reliability of financial reporting and the preparation of financial statements for external purposes in accordance with generally accepted accounting principles.
Because of its inherent limitations, internal control over financial reporting may not prevent or detect misstatements. Also, projections of any evaluation of effectiveness to future periods are subject to the risk that controls may become inadequate because of changes in conditions, or that the degree of compliance with policies or procedures may deteriorate.
Management of the Company has assessed the effectiveness of the Company’s internal control over financial reporting as of December 31, 2010. In making its assessment of internal control over financial reporting, management utilized the criteria and framework established by the Committee of Sponsoring Organizations (“COSO”) of the Treadway Commission in Internal Control – Integrated Framework.
A material weakness is a deficiency, or a combination of deficiencies, in internal control over financial reporting such that there is a reasonable possibility that a material misstatement of the Company’s annual or interim financial statements will not be prevented or detected on a timely basis.
The Company did not maintain effective internal controls over the preparation and review of journal entries at one of its facilities and such control failure was also not detected by the monitoring controls related to the review of the facility’s reported operating results. Specifically, the controls did not operate effectively to ensure the complete, accurate, and timely recording of journal entries at this division. These control deficiencies resulted in the misstatement of expedited freight costs and unvouchered receipts,
35
Table of Contents
causing an understatement of cost of sales and current liabilities, which contributed to the revision of previously reported quarterly results for the second quarter of 2010 and the fourth quarter of 2009 included in the quarterly report on Form 10-Q for the period ended September 30, 2010 and this Annual Report on Form 10-K. These control deficiencies could result in a material misstatement of the accounts at this facility that would result in a material misstatement of the Company’s consolidated financial statements that would not be prevented or detected. Accordingly, management has concluded that these deficiencies represent a material weakness in internal control over financial reporting as of December 31, 2010.
Because of this material weakness, management concluded that the Company did not maintain effective internal control over financial reporting as of December 31, 2010, based on criteria in Internal Control – Integrated Framework issued by the COSO.
The effectiveness of the Company’s internal control over financial reporting as of December 31, 2010 has been audited by PricewaterhouseCoopers LLP, an independent registered public accounting firm, as stated in their report which appears on page F-1 of this Annual Report on Form 10-K.
Changes in Internal Control Over Financial Reporting
There have been changes in internal control over financial reporting during the quarter ended December 31, 2010 that have materially affected, or are reasonably likely to materially affect, the Company’s internal control over financial reporting.
Beginning in the fourth quarter of 2010, management designed and implemented remediation measures to address the material weakness described above and enhance the Company’s internal control over financial reporting, including the following:
| • | The Company reinforced existing company-wide financial reporting policies and procedures, and developed enhanced procedures and processes at the facility involving journal entries and corresponding supporting documentation, and the Company reinforced existing controls and expectations regarding roles and responsibilities; |
| • | The Company designed and implemented additional training programs to enhance the expertise of the finance function at the facility; |
| • | Management has taken steps to improve communication at the facility between finance personnel responsible for accounting for transactions and other operational functions within the facility to allow for improved monitoring practices concerning the review of monthly journal entries and reported financial results at the facility; and |
| • | The facility finance team changed its monitoring practices concerning the review of monthly journal entries and reported financial results. |
Remediation Plan
Management believes that the remediation measures described above will strengthen the Company’s internal control over financial reporting and will remediate the identified material weakness. As management continues to evaluate and work to enhance internal control over financial reporting, management may determine that additional measures must be taken to address these control deficiencies or may determine that it needs to modify or otherwise adjust the remediation measures described above.
Because the reliability of the internal control process requires repeatable execution, the successful remediation of this material weakness will require review and evidence of effectiveness prior to management concluding that the controls are now effective. Some of the enhancements that have been implemented by management in the fourth quarter of 2010 have not been in place for a sufficient period of time to demonstrate that their effectiveness is sustainable. Therefore, additional time is required to validate that the material weakness is fully remediated.
None
36
Table of Contents
Item 10. DIRECTORS, EXECUTIVE OFFICERS AND CORPORATE GOVERNANCE
Information required by this Item is incorporated by reference from the sections entitled “Nominees for Election as Directors” and “Corporate Governance” of the definitive Proxy Statement of Lydall to be filed with the Securities and Exchange Commission (“Commission”) in connection with the Annual Meeting of Stockholders to be held on April 29, 2011. Information regarding the Executive Officers of the Company is contained in this Annual Report on Form 10-K.
Item 11. EXECUTIVE COMPENSATION
Information required by this Item is incorporated by reference from the sections entitled “Fiscal Year 2010 Director Compensation,” “Compensation Discussion and Analysis,” “Compensation Committee Report on Executive Compensation,” “Fiscal Year 2010 Summary Compensation Table,” “Grants of Plan-Based Awards For 2010,” “Outstanding Equity Awards at Fiscal Year-End 2010,” “Option Exercises and Stock Vested for 2010,” “Potential Payment upon Termination or Change-in-Control” and “Pension Benefits in 2010” of the definitive Proxy Statement of Lydall to be filed with the Commission in connection with its Annual Meeting of Stockholders to be held on April 29, 2011.
Item 12. SECURITY OWNERSHIP OF CERTAIN BENEFICIAL OWNERS AND MANAGEMENT AND RELATED STOCKHOLDER MATTERS
Information required by this Item is incorporated by reference from the section entitled “Securities Ownership of Directors, Certain Officers and 5 Percent Beneficial Owners” of the definitive Proxy Statement of Lydall to be filed with the Commission in connection with its Annual Meeting of Stockholders to be held on April 29, 2011.
Item 13. CERTAIN RELATIONSHIPS AND RELATED TRANSACTIONS, AND DIRECTOR INDEPENDENCE
Information required by this Item is incorporated by reference from the sections entitled “Independence Determination,” “Related Party Transactions,” and “Compensation Committee Interlocks and Insider Participation” of the definitive Proxy Statement of Lydall to be filed with the Commission in connection with its Annual Meeting of Stockholders to be held on April 29, 2011.
Item 14. PRINCIPAL ACCOUNTING FEES AND SERVICES
Information required by this Item is incorporated by reference from the sections entitled “Ratification of Appointment of Independent Auditors,” and “Principal Fees and Services” of the definitive Proxy Statement of Lydall to be filed with the Commission in connection with its Annual Meeting of Stockholders to be held on April 29, 2011.
37
Table of Contents
Item 15. EXHIBITS, FINANCIAL STATEMENT SCHEDULES
| Page | ||||
| a) 1. Financial Statements: |
||||
| F-1 | ||||
| Consolidated Statements of Operations for the years ended December 31, 2010, 2009 and 2008 |
F-2 | |||
| F-3 | ||||
| Consolidated Statements of Cash Flows for the years ended December 31, 2010, 2009 and 2008 |
F-4 | |||
| F-5 | ||||
| F-6 | ||||
| a) 2. Financial Statement Schedule: |
||||
| Schedule II – Valuation and Qualifying Accounts for the years ended December 31, 2010, 2009 and 2008 |
S-1 | |||
Other schedules for which provision is made in the applicable accounting regulations of the Securities and Exchange Commission are not required under the related instructions, are inapplicable or are presented in “Notes to Consolidated Financial Statements” and therefore have been omitted.
38
Table of Contents
a) 3. Exhibits Included Herein or Incorporated by Reference:
| 3.1 | Certificate of Incorporation of the Registrant, as amended through the date of filing of this report, filed as Exhibit 3.1 to the Registrant’s Annual Report on Form 10-K dated March 12, 2004 and incorporated herein by this reference. | |
| 3.2 | Bylaws of the Registrant, as amended and restated as of December 11, 2003, filed as Exhibit 3.2 to the Registrant’s Annual Report on Form 10-K dated March 12, 2004 and incorporated herein by this reference. | |
| 4.1 | Certain long-term debt instruments, each representing indebtedness in an amount equal to less than 10 percent of the Registrant’s total consolidated assets, have not been filed as exhibits to this Annual Report on Form 10-K. The Registrant will file these instruments with the Commission upon request. | |
| 10.1 | Stock Purchase and Sale Agreement between Lydall, Inc., Lydall Transport, Ltd. and LTL Acquisition LLC dated September 1, 2008, filed as Exhibit 10.1 to the Registrant’s Form 8-K dated September 5, 2008 and incorporated herein by this reference. | |
| 10.2 | Capital lease agreement between Lydall Thermique Acoustique S.A.S., CMCIC Lease and Natiocredimurs Societe en Nom Collectif, filed as Exhibit 10.5 to the Registrant’s Quarterly Report on Form 10-Q dated November 9, 2004 and incorporated herein by reference. | |
| 10.3 | Loan and Security Agreement with Wachovia Capital Finance Corporation (New England), filed as Exhibit 99.1 to the Registrant’s From 8-K dated March 17, 2009 and incorporated herein by this reference. | |
| 10.4 | Contract for a Consortium Credit in the Amount of €6,000,000, filed as Exhibit 10.2 to the Registrant’s Quarterly Report on Form 10-Q dated November 7, 2003 and incorporated herein by this reference. | |
| 10.5 | Supplement to the Contract for a Consortium Credit in the Amount of €6,000,000, filed as Exhibit 10.2 to the Registrant’s Quarterly Report on Form 10-Q dated November 7, 2007 and incorporated herein by this reference. | |
| 10.6* | Employment Agreement with Dale Barnhart dated July 31, 2007, filed as Exhibit 10.1 to the Registrant’s Form 8-K dated August 3, 2007 and incorporated herein by this reference. | |
| 10.7* | Employment Agreement with Erika G. Turner dated November 2, 2009, filed as Exhibit 10.1 to the Registrant’s Form 8-K dated November 4, 2009 and incorporated herein by this reference. | |
| 10.8* | Employment Agreement with Mona G. Estey dated January 10, 2007, filed as Exhibit 10.14 to the Registrant’s Annual Report on Form 10-K dated March 13, 2007 and incorporated herein by this reference. | |
| 10.9* | Letter of Agreement, dated October 14, 2009, between Lydall, Inc. and Mary A. Tremblay, filed as Exhibit 10.1 to the Registrant’s From 8-K dated October 14, 2009 and incorporated herein by this reference. | |
| 10.10* | Employment Agreement with Peter Kurto dated September 23, 2008, filed as Exhibit 10.1 to the Registrant’s Quarterly Report on Form 10-Q dated November 3, 2008 and incorporated herein by this reference. | |
| 10.11* | Indemnification Agreement with Dale Barnhart dated July 31, 2007, filed as Exhibit 10.2 to the Registrant’s Form 8-K dated August 3, 2007 and incorporated herein by this reference. | |
| 10.12* | Lydall, Inc. Annual Incentive Performance Bonus Program, filed as Exhibit 10.1 to the Registrant’s Form 8-K dated January 15, 2009 and incorporated herein by this reference. | |
| 10.13 | Form of Indemnification Agreement between Lydall, Inc. and non-employee directors, filed as Exhibit 10.1 to the Registrant’s Form 8-K dated June 19, 2009 and incorporated herein by this reference. | |
| 10.14* | Amended and restated, 1992 Stock Incentive Compensation Plan, dated May 14, 1992, amended through March 10, 1999, filed as Exhibit 10.9 to the Registrant’s Annual Report on Form 10-K dated March 21, 2001 and incorporated herein by this reference. | |
| 10.15* | Amended and Restatement of the Lydall 2003 Stock Incentive Compensation Plan, filed as Appendix A to the Company’s Definitive Proxy Statement on March 19, 2009 and incorporated herein by this reference. | |
| 10.16* | Form of Nonqualified Stock Option Agreement (Under the Lydall 2003 Stock Incentive Plan), filed as Exhibit 10.4 to the Registrant’s Form 8-K dated November 4, 2009 and incorporated herein by this reference. | |
| 10.17* | Form of Agreement Covering Annual Nonqualified Stock Option Awards to Outside Directors (Under the Lydall 2003 Stock Incentive Plan), filed as Exhibit 10.6 to the Registrant’s Form 8-K dated November 4, 2009 and incorporated herein by this reference. | |
| 10.18* | Form of Agreement Covering Nonqualified Stock Option Awards to Outside Directors in Lieu of Cash-Based Retirement Benefits (Under the Lydall 2003 Stock Incentive Plan), filed as Exhibit 10.7 to the Registrant’s Quarterly Report on Form 8-K dated November 4, 2009 and incorporated herein by this reference. |
39
Table of Contents
| 10.19* | Form of Incentive Stock Option Agreement (Under the Lydall 2003 Stock Incentive Plan), filed as Exhibit 10.3 to the Registrant’s Form 8-K dated November 4, 2009 and incorporated herein by this reference. | |
| 10.20* | Form of Restricted Stock Award Agreement (Under the Lydall 2003 Stock Incentive Plan), filed as Exhibit 10.5 to the Registrant’s Form 8-K dated November 4, 2009 and incorporated herein by this reference. | |
| 10.21* | Form of Lydall, Inc. Performance Share Award Agreement, filed as Exhibit 10.2 to the Registrant’s Form 8-K dated January 15, 2009 and incorporated herein by this reference. | |
| 10.22* | Form of Lydall, Inc. Performance Share Award Agreement (One-Year Period), filed as Exhibit 10.30 to the Registrant’s Annual Report on Form 10-K dated February 26, 2010 and incorporated herein by this reference. | |
| 14.1 | Code of Ethics for the Chief Executive Officer, Senior Financial Officers and All Accounting and Financial Personnel, filed as Exhibit 14.1 to the Registrant’s Annual Report on Form 10-K dated March 12, 2004 and incorporated herein by this reference. This document can also be accessed on Lydall’s website at www.lydall.com under the Corporate Governance section. | |
| 21.1 | List of subsidiaries of the Registrant, filed herewith. | |
| 23.1 | Consent of PricewaterhouseCoopers LLP, filed herewith. | |
| 24.1 | Power of Attorney, dated February 25, 2011, authorizing Dale G. Barnhart and/or Erika G. Turner to sign this report on behalf of each member of the Board of Directors indicated therein, filed herewith. | |
| 31.1 | Certification Pursuant to Rule 13a-14(a) and Rule 15d-14(a) under the Securities Exchange Act of 1934, filed herewith. | |
| 31.2 | Certification Pursuant to Rule 13a-14(a) and Rule 15d-14(a) under the Securities Exchange Act of 1934, filed herewith. | |
| 32.1 | Certifications Pursuant to 18 U.S.C. Section 1350, as Adopted Pursuant to Section 906 of the Sarbanes-Oxley Act of 2002, furnished herewith. | |
| * | Management contract or compensatory plan. |
40
Table of Contents
Pursuant to the requirements of Section 13 or 15(d) of the Securities Exchange Act of 1934, Lydall, Inc. has duly caused this report to be signed on its behalf by the undersigned, thereunto duly authorized.
| LYDALL, INC. | ||||||
| March 1, 2011 |
By: | /s/ JAMES V. LAUGHLAN | ||||
| James V. Laughlan Chief Accounting Officer and Controller | ||||||
Pursuant to the requirements of the Securities Exchange Act of 1934, this report has been signed below by the following persons on behalf of Lydall, Inc. in the capacities and on the dates indicated.
| Signature | Title | Date | ||
| /s/ DALE G. BARNHART Dale G. Barnhart |
President, Chief Executive Officer and Director (Principal Executive Officer) |
March 1, 2011 | ||
| /s/ ERIKA G. TURNER Erika G. Turner |
Vice President, Chief Financial Officer and Treasurer (Principal Financial Officer) |
March 1, 2011 | ||
| /s/ JAMES V. LAUGHLAN James V. Laughlan |
Chief Accounting Officer and Controller |
March 1, 2011 | ||
| /s/ ERIKA G. TURNER Erika G. Turner Attorney-in-fact for: |
March 1, 2011 | |||
| Kathleen Burdett |
Director |
|||
| W. Leslie Duffy |
Chairman of the Board of Directors |
|||
| Matthew T. Farrell |
Director |
|||
| Marc T. Giles |
Director |
|||
| William D. Gurley |
Director |
|||
| Suzanne Hammett |
Director |
|||
| S. Carl Soderstrom, Jr. |
Director |
|||
41
Table of Contents
Report of Independent Registered Public Accounting Firm
To the Board of Directors and
Stockholders of Lydall, Inc.
In our opinion, the consolidated financial statements listed in the index appearing under Item 15(a)(1) present fairly, in all material respects, the financial position of Lydall, Inc. and its subsidiaries at December 31, 2010 and 2009, and the results of their operations and their cash flows for each of the three years in the period ended December 31, 2010 in conformity with accounting principles generally accepted in the United States of America. In addition, in our opinion, the financial statement schedule listed in the index appearing under Item 15(a)(2) presents fairly, in all material respects, the information set forth therein when read in conjunction with the related consolidated financial statements. Also in our opinion, the Company did not maintain, in all material respects, effective internal control over financial reporting as of December 31, 2010, based on criteria established in Internal Control—Integrated Framework issued by the Committee of Sponsoring Organizations of the Treadway Commission (COSO) because a material weakness in internal control over financial reporting related to a facility that did not maintain effective internal controls over the preparation and review of journal entries, and that such control failure was also not detected by the monitoring controls related to the review of the facility’s reported operating results, existed as of that date. A material weakness is a deficiency, or a combination of deficiencies, in internal control over financial reporting, such that there is a reasonable possibility that a material misstatement of the annual or interim financial statements will not be prevented or detected on a timely basis. The material weakness referred to above is described in Management’s Report on Internal Control Over Financial Reporting under Item 9A. We considered this material weakness in determining the nature, timing, and extent of audit tests applied in our audit of the December 31, 2010 consolidated financial statements and our opinion regarding the effectiveness of the Company’s internal control over financial reporting does not affect our opinion on those consolidated financial statements. The Company’s management is responsible for these financial statements and financial statement schedule, for maintaining effective internal control over financial reporting and for its assessment of the effectiveness of internal control over financial reporting included in management’s report referred to above. Our responsibility is to express opinions on these financial statements, on the financial statement schedule, and on the Company’s internal control over financial reporting based on our integrated audits. We conducted our audits in accordance with the standards of the Public Company Accounting Oversight Board (United States). Those standards require that we plan and perform the audits to obtain reasonable assurance about whether the financial statements are free of material misstatement and whether effective internal control over financial reporting was maintained in all material respects. Our audits of the financial statements included examining, on a test basis, evidence supporting the amounts and disclosures in the financial statements, assessing the accounting principles used and significant estimates made by management, and evaluating the overall financial statement presentation. Our audit of internal control over financial reporting included obtaining an understanding of internal control over financial reporting, assessing the risk that a material weakness exists, and testing and evaluating the design and operating effectiveness of internal control based on the assessed risk. Our audits also included performing such other procedures as we considered necessary in the circumstances. We believe that our audits provide a reasonable basis for our opinions.
A company’s internal control over financial reporting is a process designed to provide reasonable assurance regarding the reliability of financial reporting and the preparation of financial statements for external purposes in accordance with generally accepted accounting principles. A company’s internal control over financial reporting includes those policies and procedures that (i) pertain to the maintenance of records that, in reasonable detail, accurately and fairly reflect the transactions and dispositions of the assets of the company; (ii) provide reasonable assurance that transactions are recorded as necessary to permit preparation of financial statements in accordance with generally accepted accounting principles, and that receipts and expenditures of the company are being made only in accordance with authorizations of management and directors of the company; and (iii) provide reasonable assurance regarding prevention or timely detection of unauthorized acquisition, use, or disposition of the company’s assets that could have a material effect on the financial statements.
Because of its inherent limitations, internal control over financial reporting may not prevent or detect misstatements. Also, projections of any evaluation of effectiveness to future periods are subject to the risk that controls may become inadequate because of changes in conditions, or that the degree of compliance with the policies or procedures may deteriorate.
| /s/ PricewaterhouseCoopers LLP |
| PricewaterhouseCoopers LLP Hartford, Connecticut March 1, 2011 |
F-1
Table of Contents
CONSOLIDATED STATEMENTS OF OPERATIONS
| |
For the years ended December 31, |
| ||||||||||
| In thousands except per share data | 2010 |
|
Revised 2009 |
|
|
Revised 2008 |
| |||||
| Net sales |
$ | 338,007 | $ | 248,947 | $ | 305,716 | ||||||
| Cost of sales |
280,134 | 215,943 | 242,950 | |||||||||
| Gross margin |
57,873 | 33,004 | 62,766 | |||||||||
| Selling, product development and administrative expenses |
55,777 | 50,783 | 54,958 | |||||||||
| Gain on sale of product line, net |
2,542 | — | — | |||||||||
| Impairment of goodwill and long-lived assets |
— | — | 17,409 | |||||||||
| Operating income (loss) from continuing operations |
4,638 | (17,779 | ) | (9,601 | ) | |||||||
| Interest expense |
854 | 814 | 451 | |||||||||
| Other income, net |
(142 | ) | (232 | ) | (133 | ) | ||||||
| Income (loss) from continuing operations before income taxes |
3,926 | (18,361 | ) | (9,919 | ) | |||||||
| Income tax expense (benefit) from continuing operations |
1,187 | (3,789 | ) | (3,888 | ) | |||||||
| Income (loss) from continuing operations |
2,739 | (14,572 | ) | (6,031 | ) | |||||||
| Income from discontinued operations, net |
— | — | 1,052 | |||||||||
| Net income (loss) |
$ | 2,739 | $ | (14,572 | ) | $ | (4,979 | ) | ||||
| Basic earnings (loss) per common share: |
||||||||||||
| Income (loss) from continuing operations |
$ | .16 | $ | (.88 | ) | $ | (.37 | ) | ||||
| Income from discontinued operations |
$ | — | $ | — | $ | .06 | ||||||
| Net income (loss) |
$ | .16 | $ | (.88 | ) | $ | (.30 | ) | ||||
| Weighted average common shares outstanding |
16,672 | 16,567 | 16,458 | |||||||||
| Diluted earnings (loss) per common share: |
||||||||||||
| Income (loss) from continuing operations |
$ | .16 | $ | (.88 | ) | $ | (.37 | ) | ||||
| Income from discontinued operations |
$ | — | $ | — | $ | .06 | ||||||
| Net income (loss) |
$ | .16 | $ | (.88 | ) | $ | (.30 | ) | ||||
| Weighted average common shares and equivalents outstanding |
16,788 | 16,567 | 16,458 | |||||||||
The accompanying notes are an integral part of these consolidated financial statements.
F-2
Table of Contents
CONSOLIDATED BALANCE SHEETS
| December 31, |
||||||||
| In thousands of dollars and shares | 2010 | Revised 2009 |
||||||
| Assets |
||||||||
| Current assets: |
||||||||
| Cash and cash equivalents |
$ | 24,988 | $ | 22,721 | ||||
| Accounts receivable (net of allowance for doubtful receivables of $945 and $1,333, respectively) |
47,080 | 39,766 | ||||||
| Inventories, net |
37,444 | 26,436 | ||||||
| Taxes receivable |
1,867 | 4,651 | ||||||
| Prepaid expenses and other current assets, net |
4,652 | 6,413 | ||||||
| Total current assets |
116,031 | 99,987 | ||||||
| Property, plant and equipment, net |
88,236 | 93,419 | ||||||
| Goodwill and other intangible assets |
24,094 | 26,403 | ||||||
| Deferred tax assets |
1,453 | 2,771 | ||||||
| Other assets, net |
2,074 | 1,772 | ||||||
| Total assets |
$ | 231,888 | $ | 224,352 | ||||
| Liabilities and Stockholders’ Equity |
||||||||
| Current liabilities: |
||||||||
| Current portion of long-term debt |
$ | 1,496 | $ | 1,531 | ||||
| Accounts payable |
33,963 | 26,035 | ||||||
| Accrued payroll and other compensation |
9,022 | 5,794 | ||||||
| Accrued taxes |
3,113 | 1,072 | ||||||
| Other accrued liabilities |
5,077 | 4,956 | ||||||
| Total current liabilities |
52,671 | 39,388 | ||||||
| Long-term debt |
3,392 | 5,220 | ||||||
| Deferred tax liabilities |
5,360 | 6,357 | ||||||
| Pension and other long-term liabilities |
15,010 | 16,998 | ||||||
| Commitments and contingencies (Note 17) |
||||||||
| Stockholders’ equity: |
||||||||
| Preferred stock (par value $1.00 per share; authorized 500,000 shares; none issued or outstanding) |
— | — | ||||||
| Common stock (par value $.10 per share; authorized 30,000 shares; issued 23,639 and 23,560 shares, respectively) |
2,364 | 2,356 | ||||||
| Capital in excess of par value |
54,799 | 53,394 | ||||||
| Retained earnings |
171,822 | 169,083 | ||||||
| Accumulated other comprehensive loss |
(8,330 | ) | (3,355 | ) | ||||
| Treasury stock, 6,475 and 6,461 shares of common stock, respectively, at cost |
(65,200 | ) | (65,089 | ) | ||||
| Total stockholders’ equity |
155,455 | 156,389 | ||||||
| Total liabilities and stockholders’ equity |
$ | 231,888 | $ | 224,352 | ||||
The accompanying notes are an integral part of these consolidated financial statements.
F-3
Table of Contents
CONSOLIDATED STATEMENTS OF CASH FLOWS
| For the years ended December 31, |
||||||||||||
| In thousands | 2010 | Revised 2009 |
Revised 2008 |
|||||||||
| Cash flows from operating activities: | ||||||||||||
| Net income (loss) |
$ | 2,739 | $ | (14,572 | ) | $ | (4,979 | ) | ||||
| Adjustments to reconcile net income (loss) to net cash provided by operating activities: |
||||||||||||
| Gain from discontinued operations, net of tax |
— | — | (860 | ) | ||||||||
| Gain from sale of product line |
(2,542 | ) | — | — | ||||||||
| Depreciation and amortization |
14,407 | 15,890 | 16,131 | |||||||||
| Amortization of debt issuance costs |
403 | 335 | 15 | |||||||||
| Deferred income taxes |
433 | (1,119 | ) | (5,568 | ) | |||||||
| Stock based compensation |
1,354 | 1,425 | 903 | |||||||||
| Loss on disposition of property, plant and equipment, net |
175 | 103 | 489 | |||||||||
| Impairment of goodwill and long-lived assets |
— | — | 17,409 | |||||||||
| Changes in operating assets and liabilities (exclusive of impact of acquisitions): |
||||||||||||
| Accounts receivable |
(9,148 | ) | (4,666 | ) | 12,088 | |||||||
| Taxes receivable |
2,635 | (2,710 | ) | (70 | ) | |||||||
| Inventories |
(11,820 | ) | 14,812 | (3,486 | ) | |||||||
| Prepaid expenses and other assets |
552 | (915 | ) | (1,292 | ) | |||||||
| Accounts payable |
8,508 | 5,264 | (6,658 | ) | ||||||||
| Accrued taxes |
2,124 | 483 | (1,669 | ) | ||||||||
| Accrued payroll and other compensation |
3,472 | (2,022 | ) | (56 | ) | |||||||
| Proceeds from surrender of life insurance policies |
— | 3,830 | — | |||||||||
| Supplemental executive retirement settlement payments |
— | (1,433 | ) | — | ||||||||
| Other liabilities, net |
(2,574 | ) | (638 | ) | (2,299 | ) | ||||||
| Net cash provided by operating activities |
10,718 | 14,067 | 20,098 | |||||||||
| Cash flows from investing activities: |
||||||||||||
| Proceeds from sale of product line or operation, net |
4,797 | — | 3,351 | |||||||||
| Acquisitions, net |
276 | (128 | ) | (10,148 | ) | |||||||
| Capital expenditures |
(12,001 | ) | (5,921 | ) | (12,037 | ) | ||||||
| Reimbursement of cash from leasing company |
699 | — | — | |||||||||
| Release of (increase in) restricted cash |
— | 2,400 | (2,400 | ) | ||||||||
| Net cash used for investing activities |
(6,229 | ) | (3,649 | ) | (21,234 | ) | ||||||
| Cash flows from financing activities: |
||||||||||||
| Debt proceeds |
4,900 | 8,816 | — | |||||||||
| Debt repayments |
(5,129 | ) | (9,092 | ) | (250 | ) | ||||||
| Capital lease payments |
(1,177 | ) | (1,287 | ) | (1,064 | ) | ||||||
| Common stock repurchased |
(111 | ) | (106 | ) | (82 | ) | ||||||
| Common stock issued |
113 | — | 1,134 | |||||||||
| Net cash used for financing activities |
(1,404 | ) | (1,669 | ) | (262 | ) | ||||||
| Effect of exchange rate changes on cash |
(818 | ) | 312 | (658 | ) | |||||||
| Increase (decrease) in cash and cash equivalents |
2,267 | 9,061 | (2,056 | ) | ||||||||
| Cash and cash equivalents at beginning of year |
22,721 | 13,660 | 15,716 | |||||||||
| Cash and cash equivalents at end of year |
$ | 24,988 | $ | 22,721 | $ | 13,660 | ||||||
| Supplemental Schedule of Cash Flow Information |
||||||||||||
| Cash paid (received) during the year for: |
||||||||||||
| Interest |
$ | 441 | $ | 460 | $ | 423 | ||||||
| Income taxes (received) paid |
$ | (3,012 | ) | $ | 634 | $ | 2,448 | |||||
The accompanying notes are an integral part of these consolidated financial statements.
F-4
Table of Contents
CONSOLIDATED STATEMENTS OF CHANGES IN STOCKHOLDERS’ EQUITY
| In thousands | Common Shares |
Common Stock Amount |
Capital in Excess of Par Value |
Retained Earnings |
Accumulated Other Compre- hensive Income (Loss) |
Treasury Stock |
Total Stock- holders’ Equity |
|||||||||||||||||||||
| Balance at December 31, 2007 |
23,004 | $ | 2,301 | $ | 50,105 | $ | 188,634¹ | $ | 4,252 | $ | (64,901 | ) | $ | 180,391¹ | ||||||||||||||
| Net loss revised¹ |
(4,979 | ) | (4,979 | ) | ||||||||||||||||||||||||
| Other comprehensive income: |
||||||||||||||||||||||||||||
| Foreign currency translation adjustments |
(2,174 | ) | (2,174 | ) | ||||||||||||||||||||||||
| Change in pension plans, net of income tax benefit of $5,575 |
(9,096 | ) | (9,096 | ) | ||||||||||||||||||||||||
| Change in fair value of derivative instrument, net of income taxes of $60 |
98 | 98 | ||||||||||||||||||||||||||
| Comprehensive loss revised |
(16,151 | ) | ||||||||||||||||||||||||||
| Stock repurchased |
(82 | ) | (82 | ) | ||||||||||||||||||||||||
| Stock issued under employee plans |
136 | 13 | 745 | 758 | ||||||||||||||||||||||||
| Stock based compensation expense |
972 | 972 | ||||||||||||||||||||||||||
| Stock issued to Directors |
32 | 3 | 249 | 252 | ||||||||||||||||||||||||
| Balance at December 31, 2008 |
23,172 | 2,317 | 52,071 | 183,655¹ | (6,920 | ) | (64,983 | ) | 166,140¹ | |||||||||||||||||||
| Net loss revised¹ |
(14,572 | ) | (14,572 | ) | ||||||||||||||||||||||||
| Other comprehensive income: |
||||||||||||||||||||||||||||
| Foreign currency translation adjustments |
1,859 | 1,859 | ||||||||||||||||||||||||||
| Change in pension plans, net of income taxes of $1,052 |
1,716 | 1,716 | ||||||||||||||||||||||||||
| Change in fair value of derivative instrument, net of income tax benefit of $6 |
(10 | ) | (10 | ) | ||||||||||||||||||||||||
| Comprehensive loss revised |
(11,007 | ) | ||||||||||||||||||||||||||
| Stock repurchased |
(106 | ) | (106 | ) | ||||||||||||||||||||||||
| Stock issued under employee plans |
326 | 33 | (96 | ) | (63 | ) | ||||||||||||||||||||||
| Stock based compensation expense |
1,173 | 1,173 | ||||||||||||||||||||||||||
| Stock issued to Directors |
62 | 6 | 246 | 252 | ||||||||||||||||||||||||
| Balance at December 31, 2009 |
23,560 | 2,356 | 53,394 | 169,083¹ | (3,355 | ) | (65,089 | ) | 156,389¹ | |||||||||||||||||||
| Net Income |
2,739 | 2,739 | ||||||||||||||||||||||||||
| Other comprehensive income: |
||||||||||||||||||||||||||||
| Foreign currency translation adjustments |
(5,279 | ) | (5,279 | ) | ||||||||||||||||||||||||
| Change in pension plans, net of income taxes of $199 |
325 | 325 | ||||||||||||||||||||||||||
| Change in fair value of derivative instrument, net of income tax benefit of $13 |
(21 | ) | (21 | ) | ||||||||||||||||||||||||
| Comprehensive loss |
(2,236 | ) | ||||||||||||||||||||||||||
| Stock repurchased |
(111 | ) | (111 | ) | ||||||||||||||||||||||||
| Stock issued under employee plans |
48 | 5 | 54 | 59 | ||||||||||||||||||||||||
| Stock based compensation expense |
1,102 | 1,102 | ||||||||||||||||||||||||||
| Stock issued to Directors |
31 | 3 | 249 | 252 | ||||||||||||||||||||||||
| Balance at December 31, 2010 |
23,639 | $ | 2,364 | $ | 54,799 | $ | 171,822 | $ | (8,330 | ) | $ | (65,200 | ) | $ | 155,455 | |||||||||||||
¹ See Note 2 for discussion of revision of prior year amounts.
The accompanying notes are an integral part of these consolidated financial statements.
F-5
Table of Contents
NOTES TO CONSOLIDATED FINANCIAL STATEMENTS
1. Significant Accounting Policies
Business – Lydall, Inc. and its subsidiaries (the “Company” or “Lydall”) design and manufacture specialty engineered filtration media, industrial thermal insulating solutions, automotive thermal and acoustical barriers, temperature-control equipment, medical filtration media and devices and biopharmaceutical processing components for thermal/acoustical, filtration/separation and bio/medical applications.
Principles of consolidation – The consolidated financial statements include the accounts of Lydall, Inc. and its subsidiaries. All significant intercompany accounts and transactions have been eliminated.
Estimates and assumptions – The preparation of the Company’s consolidated financial statements in conformity with accounting principles generally accepted in the United States of America requires management to make estimates and assumptions that affect the reported amounts of assets and liabilities and the disclosure of contingent assets and liabilities at the financial statement dates and the reported amounts of revenues and expenses during the reporting periods. Actual results could differ from those estimates.
Risks and uncertainties – Worldwide economic cycles affect the markets that the Company’s businesses serve and affect demand for Lydall’s products and impact profitability. Among other factors, disruptions in the global credit and financial markets, including diminished liquidity and credit availability, swings in consumer confidence and spending, unstable economic growth and fluctuations in unemployment rates have caused economic instability and could have a negative impact on the Company’s results of operations and liquidity.
Cash and cash equivalents – Cash and cash equivalents include cash on hand and highly liquid investments with original maturities of three months or less at the date of purchase.
Concentrations of credit risk – Financial instruments that potentially subject the Company to concentrations of credit risk consist principally of cash and cash equivalents and trade accounts receivable. The Company places its cash and cash equivalents in high-quality financial institutions and instruments with a minimum investment grade rating of BBB or better. Concentrations of credit risk with respect to trade accounts receivable are limited by the large number of customers comprising the Company’s customer base and their dispersion across many different industries and geographies. Foreign and export sales were 50% of the Company’s net sales in 2010, 50% in 2009 and 53% in 2008. Export sales primarily to Europe, Asia, Mexico and Canada were $46.2 million, $28.8 million and $44.0 million in 2010, 2009 and 2008, respectively. The Company performs ongoing credit evaluations of its customers’ financial condition and generally does not require collateral. Sales to the automotive market, included in the Thermal/Acoustical segment, were approximately 53% of the Company’s net sales in 2010, 51% in 2009 and 54% in 2008. Sales to Ford Motor Company (“Ford”) were approximately 10% of Lydall’s 2010 and 2009 net sales. Sales to Volkswagen and Chrysler were each approximately 10% of net sales in 2008. No other customer accounted for more than 10% of total net sales in 2010, 2009 or 2008. At December 31, 2010, Ford represented approximately 11% of total accounts receivable. At December 31, 2009, Ford and Chrysler represented approximately 12% and 10%, respectively, of total accounts receivable. No other customers accounted for more than 10% of total accounts receivable at December 31, 2010 or 2009.
Inventories – Inventories are valued at lower of cost or market, cost being determined using the first-in, first-out (FIFO) cost method. Inventories in excess of requirements for current or anticipated orders have been written down to net realizable value.
Pre-production design and development costs – The Company enters into contractual agreements with certain customers to design and develop molds, dies and tools (collectively, “tooling”). All such tooling contracts relate to products that the Company will supply to customers under long-term supply agreements. Tooling costs are accumulated in work-in process inventory and are charged to operations as the related revenue from the tooling is recognized. Revenue is recognized as tooling is delivered and accepted by the customer. The Company also may progress bill on certain tooling being constructed. These billings are recorded as progress billings (a reduction of the associated work-in-process inventory) until the appropriate revenue recognition criteria have been met.
Periodically, the Company enters into contractually guaranteed reimbursement arrangements as a mechanism to collect amounts due from customers from tooling sales. Under these arrangements, amounts due from tooling sales are collected as parts are
F-6
Table of Contents
delivered over the part supply arrangement, in accordance with the specific terms of the arrangement. The amounts due from the customer in such transactions are recorded in “Prepaid expenses and other current assets, net” or “Other assets, net” based upon the expected term of the reimbursement arrangement.
The following tooling related assets were included in the Consolidated Balance Sheets as of December 31, 2010 and 2009:
| |
December 31, |
| ||||||
| In thousands | 2010 | |
Revised 2009 |
| ||||
| Inventories, net of progress billings and reserves |
$ | 6,444 | $ | 4,191 | ||||
| Prepaid expenses and other current assets, net |
593 | 1,224 | ||||||
| Other assets, net |
370 | 35 | ||||||
| Total tooling related assets |
$ | 7,407 | $ | 5,450 | ||||
Amounts included in “Prepaid expenses and other current assets, net” include the short-term portion of receivables due under contractually guaranteed reimbursement arrangements and amounts included in “Other assets, net” represent the long-term portion of those receivables. Included in the inventory balance was an offset for progress billings of $0.7 million and $1.3 million at December 31, 2010 and 2009, respectively. Company owned tooling is recorded in “Property, plant and equipment, net” and was not material at December 31, 2010 or December 31, 2009.
Property, plant and equipment – Property, plant, and equipment are stated at cost. Assets held under capital leases are recorded at the lower of the net present value of the minimum lease payments or the fair value of the leased asset at the inception of the lease. Property, plant and equipment, including property, plant and equipment under capital leases, are depreciated over their estimated useful lives using the straight-line method. Leasehold improvements are depreciated on a straight-line basis over the term of the lease or the life of the asset, whichever is shorter. The cost and accumulated depreciation amounts applicable to assets sold or otherwise disposed of are removed from the asset and accumulated depreciation accounts and any net gain or loss is included in the Consolidated Statements of Operations. Expenses for maintenance and repairs are charged to expense as incurred.
Goodwill and other intangible assets – Goodwill represents costs in excess of fair values assigned to the underlying net assets of acquired companies, net of accumulated amortization. Goodwill and other intangible assets with indefinite lives are not amortized but are subject to annual impairment tests. All other intangible assets are amortized over their estimated useful lives, which range from 4 to 20 years. In performing impairment tests, the Company considers current market capitalization, discounted cash flows and other factors as best evidence of fair value. There are inherent uncertainties and management judgment required in these analyses. Refer to Note 15 for discussion of impairment charges recorded in the fourth quarter of 2008.
Valuation of long-lived assets – The Company evaluates the recoverability of long-lived assets, or asset groups, whenever events or changes in circumstances indicate that carrying amounts may not be recoverable. Should such evaluations indicate that the related future undiscounted cash flows are not sufficient to recover the carrying values of the assets, such carrying values would be reduced to fair value and this adjusted carrying value would become the assets’ new cost basis. Fair value is determined primarily using future anticipated cash flows that are directly associated with, and that are expected to arise as a direct result of the use and eventual disposition of the asset, or asset group, discounted using an interest rate commensurate with the risk involved, as well as market conditions and other factors. Refer to Note 15 for discussion of impairment charges recorded in the fourth quarter of 2008.
Derivative instruments – Derivative instruments are measured at fair value and recognized as either assets or liabilities on the balance sheet in either current or non-current other assets or other accrued liabilities or other long-term liabilities depending upon maturity and commitment. For derivative instruments that are designated and qualify as a fair value hedge, the gain or loss on the derivative as well as the offsetting loss or gain on the hedged item attributable to the hedged risk are recognized in the statement of operations. For derivative instruments that are designated and qualify as a cash flow hedge, the effective portion of the gain or loss on the derivative is reported as a component of other comprehensive income and reclassified into earnings in the same period or periods in which the hedge transaction affects earnings. In general, the types of risks being hedged by the Company are related to the variability of future cash flows caused by changes in foreign currency exchange rates and hedging the impact of variability of foreign exchange rates on recorded intercompany assets or liabilities. Lydall’s objective for entering into derivative instruments has always been for risk management purposes. The Company does not engage in derivative instruments for speculative purposes. Lydall has historically not been a party to a significant number of derivative instruments.
F-7
Table of Contents
Employer sponsored benefit plans – The Company recognizes the funded status of its defined benefit plans as well as provides required disclosures. Net benefit obligations are calculated based on actuarial valuations using key assumptions related to discount rates and expected return on plan assets.
Asset retirement obligations – The Company records asset retirement obligation liabilities at fair value in the period in which it occurred if a reasonable estimate of fair value can be made. The Company has conditional legal obligations for certain of the Company’s owned and leased facilities related primarily to building materials and leasehold improvements.
Accrued liabilities for conditional asset retirement obligations as of December 31, 2010 were as follows:
| In thousands | Total | |||
| Balance as of December 31, 2009 |
$ | 690 | ||
| Accretion |
40 | |||
| Payments |
(182 | ) | ||
| Foreign currency translation |
(19 | ) | ||
| Change in estimates |
(125 | ) | ||
| Balance as of December 31, 2010 |
$ | 404 | ||
Revenue recognition – The Company recognizes revenue (1) once evidence of an arrangement exists; (2) product delivery has occurred; (3) pricing is fixed or determinable; and (4) collection is reasonably assured. The four criteria required to recognize revenue are considered to be met, and the passage of title to the customer occurs, at the respective FOB point and, therefore, revenue is recognized at that time. The Company’s standard sales and shipping terms are FOB shipping point, therefore, substantially all revenue is recognized upon shipment. However, in limited circumstances, the Company conducts business with certain customers on FOB destination terms and in these instances revenue is recognized upon receipt by the customer. The Company generally does not provide specific customer inspection or acceptance provisions in its sales terms, with the exception of tooling sales discussed in “Pre-production design and development costs” above.
Sales returns and allowances are recorded as identified or communicated by the customer and internally approved. The Company does not provide customers with general rights of return for products sold; however, in limited circumstances, the Company will allow sales returns and allowances from customers if the products sold do not conform to specifications.
Shipping and handling costs consist primarily of costs incurred to deliver products to customers and internal costs related to preparing products for shipment and are recorded in cost of sales. Amounts billed to customers as shipping and handling are classified as revenue.
Research and development – Research and development costs are charged to expense as incurred and amounted to $8.7 million in 2010, $7.9 million in 2009 and $8.5 million in 2008. Research and development costs were primarily comprised of development personnel salaries, prototype material costs and testing and trials of new products.
Earnings per share – Basic earnings per common share are equal to net income divided by the weighted average number of common shares outstanding during the period. Diluted earnings per common share are equal to net income divided by the weighted average number of common shares outstanding during the period, including the effect of stock options and stock awards, if such effect is dilutive.
Income taxes – The provision for income taxes is based upon income reported in the accompanying consolidated financial statements. Deferred income taxes reflect the impact of temporary differences between the amounts of income and expense recognized for financial reporting purposes and such amounts recognized for tax purposes. In the event the Company was to determine that it would not be able to realize all or a portion of its deferred tax assets in the future, the Company would record a valuation allowance through a charge to income in the period that such determination was made. Conversely, if the Company was to determine that it would be able to realize its deferred tax assets in the future in excess of the net carrying amounts, the Company would decrease the recorded valuation allowance and record an increase to income in the period that such determination was made.
F-8
Table of Contents
Translation of foreign currencies – Assets and liabilities of foreign subsidiaries are translated at exchange rates prevailing on the balance sheet date. Revenues and expenses are translated at average exchange rates prevailing during the period. Any resulting translation gains or losses are reported in other comprehensive income.
Stock options and share grants – The Company accounts for awards of equity instruments under the fair value method of accounting and recognizes such amounts in the statements of operations. The Company recognizes expense on a straight-line basis over the vesting period of the entire award. Stock-based compensation expense includes the estimated effects of forfeitures, and such estimates of forfeitures are adjusted over the requisite service period to the extent actual forfeitures differ, or are expected to differ, from such estimates. The effect of changes in estimated forfeitures is recognized in the period of change and also impacts the amount of expense to be recognized in future periods. The Company estimates the fair value of option grants based on the Black Scholes option-pricing model. Expected volatility and expected term are based on historical information. The Company believes that its future volatility and expected term are not likely to materially differ from the Company’s historical stock price volatility and historical exercise data, respectively. Compensation expense for all restricted stock awards is recorded based on the market value of the stock on the grant date and recognized as expense over the vesting period of the award. Compensation expense for performance-based restricted stock is also impacted by the probability of achieving the performance targets.
Reclassification of Financial Information – Certain prior year components of the consolidated financial statements have been reclassified to be consistent with current year presentation. Refer to Note 2 for discussion of revision of prior period amounts.
2. Revision of Prior Period Amounts
In preparing Lydall’s financial statements for the quarter ended September 30, 2010, the Company discovered and corrected certain errors related to accounting for freight expense, unvouchered inventory receipts and depreciation expense. The freight and unvouchered inventory receipts errors of $456,000 and $143,000, respectively, resulted in the understatement of cost of sales and current liabilities in the second quarter of 2010. The depreciation expense error was the result of understating depreciation expense commencing in the quarter ended September 30, 2007 and all subsequent quarters through June 30, 2010 in the aggregate amount of $537,000. In accordance with SEC Staff Accounting Bulletin Nos. 99 and 108 (“SAB 99 and SAB 108”), the Company evaluated these errors and, based on an analysis of quantitative and qualitative factors, determined that they were immaterial to each of the reporting periods affected and, therefore, amendment of previously filed reports with the Securities and Exchange Commission was not required. However, if the adjustments to correct the cumulative effect of the aforementioned errors had been recorded in the quarter ended September 30, 2010, the Company believes the impact would have been significant to the third quarter of 2010 and would have impacted comparisons to prior periods. Therefore, as permitted by SAB 108, Lydall revised in the current filing previously reported results for the years ended December 31, 2009 and December 31, 2008. In addition to recording these adjustments, the Company recorded other adjustments to prior period amounts to correct other immaterial out of period adjustments, which primarily impacted inventory and income taxes.
The Consolidated Balance Sheets and Consolidated Statements of Changes in Stockholders’ Equity were also revised to reflect the cumulative effect of the errors described above and other immaterial errors. These revisions resulted in decreases to retained earnings of $419,000 as of December 31, 2009, $5,000 as of December 31, 2008 and $62,000 as of December 31, 2007.
The adjustments to the Consolidated Statement of Cash Flows for the years ended December 31, 2009 and December 31, 2008 did not result in any changes to the amounts previously reported for net cash from operating activities, investing activities or financing activities in those periods. All adjustments had an immaterial effect on the components of cash flows from operating activities and had no net impact on net cash from operating activities in any period.
F-9
Table of Contents
The revisions of prior period reported amounts are as follows:
Consolidated Balance Sheet – December 31, 2009
| In thousands |
As Previously Reported December 31, 2009 |
Adjustments | Revised December 31, 2009 |
|||||||||
| Inventories, net |
$ | 26,571 | $ | (135 | ) | $ | 26,436 | |||||
| Total current assets |
$ | 100,122 | $ | (135 | ) | $ | 99,987 | |||||
| Property, plant and equipment, net |
$ | 93,884 | $ | (465 | ) | $ | 93,419 | |||||
| Total assets |
$ | 224,952 | $ | (600 | ) | $ | 224,352 | |||||
| Total current liabilities |
$ | 39,312 | $ | 76 | $ | 39,388 | ||||||
| Deferred tax liabilities |
$ | 6,614 | $ | (257 | ) | $ | 6,357 | |||||
| Retained earnings |
$ | 169,502 | $ | (419 | ) | $ | 169,083 | |||||
| Total stockholders’ equity |
$ | 156,808 | $ | (419 | ) | $ | 156,389 | |||||
Consolidated Statement of Operations – Year Ended December 31, 2009
| In thousands, except per share data | As Previously Reported Year |
Adjustments (a) | Revised Year Ended December 31, 2009 |
|||||||||
| Net sales |
$ | 248,947 | $ | — | $ | 248,947 | ||||||
| Cost of sales |
215,482 | 461 | 215,943 | |||||||||
| Gross margin |
33,465 | (461 | ) | 33,004 | ||||||||
| Selling, product development and administrative expenses |
50,783 | — | 50,783 | |||||||||
| Operating loss |
(17,318 | ) | (461 | ) | (17,779 | ) | ||||||
| Interest expense |
814 | — | 814 | |||||||||
| Other income, net |
(232 | ) | — | (232 | ) | |||||||
| Loss before income taxes |
(17,900 | ) | (461 | ) | (18,361 | ) | ||||||
| Income tax benefit |
(3,742 | ) | (47 | ) | (3,789 | ) | ||||||
| Net loss |
$ | (14,158 | ) | $ | (414 | ) | $ | (14,572 | ) | |||
| Earnings (loss) per share: |
||||||||||||
| Basic |
$ | (.85 | ) | $ | (.88 | ) | ||||||
| Diluted |
$ | (.85 | ) | $ | (.88 | ) | ||||||
| Weighted average number of common shares outstanding: |
||||||||||||
| Basic and Diluted |
16,567 | 16,567 | ||||||||||
| (a) | Adjustment relates primarily to the understatement of depreciation expense during the year ended December 31, 2009. |
F-10
Table of Contents
Consolidated Statement of Operations – Year Ended December 31, 2008
| In thousands, except per share data |
As Previously December 31, 2008 |
Adjustments (b) | Revised Year Ended December 31, 2008 |
|||||||||
| Net sales |
$ | 305,716 | $ | — | $ | 305,716 | ||||||
| Cost of sales |
242,836 | 114 | 242,950 | |||||||||
| Gross margin |
62,880 | (114 | ) | 62,766 | ||||||||
| Selling, product development and administrative expenses |
54,958 | — | 54,958 | |||||||||
| Impairment of goodwill and long-lived assets |
17,409 | — | 17,409 | |||||||||
| Operating loss from continuing operations |
(9,487 | ) | (114 | ) | (9,601 | ) | ||||||
| Interest expense |
451 | — | 451 | |||||||||
| Other income, net |
(133 | ) | — | (133 | ) | |||||||
| Loss before income taxes |
(9,805 | ) | (114 | ) | (9,919 | ) | ||||||
| Income tax benefit |
(3,717 | ) | (171 | ) | (3,888 | ) | ||||||
| Loss from continuing operations |
(6,088 | ) | 57 | (6,031 | ) | |||||||
| Income from discontinued operations, net |
1,052 | — | 1,052 | |||||||||
| Net loss |
$ | (5,036 | ) | $ | 57 | $ | (4,979 | ) | ||||
| Basic and diluted earnings (loss) per share: |
||||||||||||
| Loss from continuing operations |
$ | (.37 | ) | $ | (.37 | ) | ||||||
| Income from discontinued operations |
$ | .06 | $ | .06 | ||||||||
| Net loss |
$ | (.31 | ) | $ | (.30 | ) | ||||||
| Weighted average number of common shares outstanding: |
||||||||||||
| Basic and Diluted |
16,458 | 16,458 | ||||||||||
| (b) | Adjustment relates primarily to an overstatement of income tax expense, partially offset by an understatement of depreciation expense, during the year ended December 31, 2008. |
3. Inventories
Inventories as of December 31, 2010 and 2009 were as follows:
| |
December 31, |
| ||||||
| In thousands | 2010 |
|
Revised 2009 |
| ||||
| Raw materials |
$ | 15,587 | $ | 9,692 | ||||
| Work in process |
11,759 | 8,985 | ||||||
| Finished goods |
10,758 | 9,051 | ||||||
| 38,104 | 27,728 | |||||||
| Less: Progress billings on tooling inventory |
(660 | ) | (1,292 | ) | ||||
| Total inventories |
$ | 37,444 | $ | 26,436 | ||||
Included in work in process is gross tooling inventory of $7.1 million and $5.5 million at December 31, 2010 and December 31, 2009, respectively. Tooling inventory, net of progress billings, was $6.4 million and $4.2 million at December 31, 2010 and 2009, respectively.
F-11
Table of Contents
4. Property, Plant and Equipment
Property, plant and equipment as of December 31, 2010 and 2009 were as follows:
|
|
Estimated |
|
|
December 31, |
| |||||||
| In thousands | 2010 |
|
Revised 2009 |
| ||||||||
| Land |
— | $ | 2,380 | $ | 2,467 | |||||||
| Buildings and improvements |
10-35 years | 46,084 | 47,170 | |||||||||
| Machinery and equipment |
5-25 years | 147,985 | 147,225 | |||||||||
| Office equipment |
2-8 years | 33,314 | 34,360 | |||||||||
| Vehicles |
3-6 years | 642 | 650 | |||||||||
| Assets under capital leases: |
||||||||||||
| Land |
— | 673 | 720 | |||||||||
| Buildings and improvements |
10-35 years | 5,889 | 6,291 | |||||||||
| Machinery and Equipment |
5-25 years | 4,004 | 4,288 | |||||||||
| 240,971 | 243,171 | |||||||||||
| Accumulated depreciation |
(154,250 | ) | (148,764 | ) | ||||||||
| Accumulated amortization on capital leases |
(3,974 | ) | (3,562 | ) | ||||||||
| 82,747 | 90,845 | |||||||||||
| Construction in progress |
5,489 | 2,574 | ||||||||||
| Total property, plant and equipment |
$ | 88,236 | $ | 93,419 | ||||||||
Depreciation expense was $13.7 million in 2010, $14.9 million in 2009 and $15.9 million in 2008.
5. Goodwill and Intangible Assets
Goodwill was $18.2 million as of December 31, 2010 compared to $19.3 million as of December 31, 2009. As of December 31, 2010, $13.5 million of goodwill was allocated to the Performance Materials segment and $4.7 million was allocated to Other Products and Services (“OPS”).
During the fourth quarter of 2010, the Company performed its annual impairment analysis of the $13.5 million of goodwill in the Performance Materials reporting unit and $4.7 million of goodwill in the Vital Fluids reporting unit, included in OPS. The Company’s goodwill impairment testing analysis (“analysis”) included projecting cash flows for the years 2011 – 2015 and discounting those amounts based on appropriate market risks. Based on those projections and other assumptions used in the analysis, the Company concluded that the fair value of these reporting units exceeded their carrying value of net assets. As a result, there was no impairment of goodwill.
Gross and net carrying amounts of goodwill at December 31, 2009 and 2010 are as follows:
| In thousands | Performance Materials |
Thermal/ Acoustical |
Other Products and Services |
Totals | ||||||||||||
| Goodwill |
$ | 14,598 | $ | 12,160 | $ | 8,879 | $ | 35,637 | ||||||||
| Accumulated impairment losses |
— | (12,160 | ) | (4,219 | ) | (16,379 | ) | |||||||||
| Balance at December 31, 2009 |
$ | 14,598 | $ | — | $ | 4,660 | $ | 19,258 | ||||||||
| Goodwill |
$ | 13,522 | $ | 12,160 | $ | 8,879 | $ | 34,561 | ||||||||
| Accumulated impairment losses |
(12,160 | ) | (4,219 | ) | (16,379 | ) | ||||||||||
| Balance at December 31, 2010 |
$ | 13,522 | $ | — | $ | 4,660 | $ | 18,182 | ||||||||
F-12
Table of Contents
The changes in the carrying amounts of goodwill in 2009 and 2010 are as follows:
| In thousands | Performance Materials |
Other Products and Services |
Totals | |||||||||
| Balance at January 1, 2009 |
$ | 14,746 | $ | 4,660 | $ | 19,406 | ||||||
| Goodwill adjustment |
(243 | ) | — | (243 | ) | |||||||
| Currency translation adjustments |
95 | — | 95 | |||||||||
| Balance at December 31, 2009 |
$ | 14,598 | $ | 4,660 | $ | 19,258 | ||||||
| Goodwill write-off |
(826 | ) | — | (826 | ) | |||||||
| Goodwill adjustment |
69 | — | 69 | |||||||||
| Currency translation adjustments |
(319 | ) | — | (319 | ) | |||||||
| Balance at December 31, 2010 |
$ | 13,522 | $ | 4,660 | $ | 18,182 | ||||||
On June 30, 2010, Lydall sold an electrical papers product line for a total consideration of $5.8 million (see Note 9). Lydall concluded that the sale of this product line constituted a sale of a business in accordance with ASC 805. The electrical papers business was included in the Company’s Performance Materials segment. The Company wrote off $0.8 million of goodwill that was allocated to this business based on the relative fair value of the business sold to the total fair value of the related reporting unit.
The goodwill adjustment of approximately $0.1 million in 2010 was related to the acquisition of DSM Solutech B.V. (“Solutech”) in December 2008. Lydall is obligated to pay to the Seller payments based on the net revenues of Solutech for a period of five years beginning on December 1, 2008 (“Contingent Consideration”). This Contingent Consideration will equal 4% of Solutech’s net revenues, as defined, during each of the periods. The value of the Contingent Consideration when paid will be added to the original cost of the acquisition and will increase the amount of goodwill previously recorded, as the acquisition occurred prior to the revised guidance issued by the Financial Accounting Standards Board (ASC 805) for business combinations.
The goodwill adjustment in 2009 of $0.2 million was related to the acquisition of Solutech in December 2008. This acquisition was accounted for using the purchase method set forth in the guidance for Business Combinations, whereby the purchase consideration was allocated to the estimated fair values of the assets acquired and liabilities assumed at the effective date of the purchase. The Company made a preliminary allocation of the purchase price of € 8.6 million (or $10.8 million) in the fourth quarter of 2008. This preliminary allocation was subsequently revised during 2009 upon final resolution of certain adjustments to the purchase price detailed in the Sale and Purchase Agreement between the Company and seller, resulting in a reduction of goodwill by approximately $0.2 million.
The table below presents the gross carrying amount and, as applicable, the accumulated amortization of the Company’s acquired intangible assets other than goodwill included in “Goodwill and other intangible assets” in the Consolidated Balance Sheets as of December 31, 2010 and 2009:
| |
December 31, 2010 |
|
|
December 31, 2009 |
| |||||||||||
| In thousands | |
Gross Carrying Amount |
|
|
Accumulated Amortization |
|
|
Gross Carrying Amount |
|
|
Accumulated Amortization |
| ||||
| Amortized intangible assets: |
||||||||||||||||
| License agreements |
$ | 866 | $ | (590 | ) | $ | 902 | $ | (442 | ) | ||||||
| Patents |
6,628 | (1,592 | ) | 7,240 | (1,203 | ) | ||||||||||
| Other |
289 | (139 | ) | 307 | (109 | ) | ||||||||||
| Total amortized intangible assets |
$ | 7,783 | $ | (2,321 | ) | $ | 8,449 | $ | (1,754 | ) | ||||||
| Unamortized intangible assets: |
||||||||||||||||
| Trademarks |
$ | 450 | $ | 450 | ||||||||||||
Amortization of intangible assets for the years ended December 31, 2010 and 2009 was $0.8 million and $0.9 million, respectively. Estimated amortization expense for intangible assets is expected to be $0.8 million for the years ending December 31, 2011 and 2012, $0.7 million for the years ending December 31, 2013 and 2014, and $0.6 million for the year ending December 31, 2015. As of December 31, 2010, the weighted average useful life of intangible assets was approximately 8 years.
F-13
Table of Contents
6. Long-term Debt and Financing Arrangements
On March 11, 2009, the Company entered into a $35 million senior secured domestic credit facility (“Domestic Credit Facility”) with a financial institution. The Borrowing Base under the Domestic Credit Facility is determined based on certain percentages of eligible domestic accounts receivable, eligible domestic inventories and eligible domestic fixed assets, reduced by applicable reserves. The Company had no borrowings outstanding under the Domestic Credit Facility at December 31, 2010 or December 31, 2009. The Domestic Credit Facility has a term of three years.
Interest is charged on borrowings at the Company’s option of either: (i) the Prime Rate plus an Applicable Margin or (ii) the Eurodollar Rate plus an Applicable Margin. The Prime Rate is a fluctuating rate equal to the higher of the financial institution’s prime rate or the federal funds rate plus .50%. The Eurodollar Rate is a fluctuating LIBOR rate offered for deposits in U.S. dollars. The Applicable Margin added to the Prime Rate ranges from 1.25% to 1.75% and the Applicable Margin added to the Eurodollar Rate ranges from 4.25% to 4.75% depending on the type of collateral that supports the outstanding borrowings. The Company also pays .50% per annum on the average daily unused portion of the Domestic Credit Facility and 4.25% per annum on the daily outstanding balance of letters of credit.
The loan agreement governing the Domestic Credit Facility contains a number of affirmative and negative covenants, including financial covenants. Among others, at all times the Company and its domestic subsidiaries must maintain Excess Availability, as defined in the loan agreement, of not less than $5.0 million. If the borrowings under the Domestic Credit Facility exceed $5.0 million, or Excess Availability under the Domestic Credit Facility is less than $12.5 million, the Company is required to meet a minimum fixed charge coverage ratio. The fixed charge coverage ratio requires that, at the end of any month, the ratio of consolidated EBITDA, as defined in the loan agreement, to fixed charges may not be less than 1 to 1 for the immediately preceding 12 month period. At no time during the twelve months ended December 31, 2010 did borrowings under the Domestic Credit Facility exceed $5.0 million or was Excess Availability less than $12.5 million, therefore, the Company was not subject to the fixed charge coverage ratio.
At December 31, 2010, the Company’s foreign subsidiaries had various credit arrangements with banks totaling €7.0 million (approximately $9.4 million) with €5.9 million (approximately $7.9 million) available for borrowings, primarily restricted to borrowings at the respective foreign subsidiary. Other than letters of credit outstanding, the Company’s foreign subsidiaries had no borrowings outstanding on any of its credit arrangements at December 31, 2010 or December 31, 2009.
The Company has a capital lease agreement for a high speed manufacturing line at its German operation, included in the Thermal/Acoustical segment. The lease has monthly principal and interest payments until the first quarter of 2012. The lease also contains a purchase option, which provides the Company with the option to purchase the equipment anytime after the fourth year of the lease term for a stated percentage of the original purchase price. In addition, the Company has a capital lease agreement for the land and building at the St. Nazaire, France operating facility, included in the Thermal/Acoustical segment, requiring monthly principal and interest payments until 2016. The capital lease provides an option for the Company to purchase the land and building at the end of the lease for a nominal amount.
Total outstanding debt consists of:
|
Effective |
December 31, |
|||||||||||||||
| In thousands | Maturity | 2010 | 2009 | |||||||||||||
| Volksbank Meinerzhagen eG, collateralized by certain real estate |
5.95 | % | 2013 | $ | 568 | $ | 855 | |||||||||
| Capital Lease, manufacturing equipment, Meinerzhagen, Germany |
4.25 | % | 2012 | 798 | 1,509 | |||||||||||
| Capital Lease, land and building, St. Nazaire, France |
5.44 | % | 2016 | 3,522 | 4,387 | |||||||||||
| 4,888 | 6,751 | |||||||||||||||
| Less portion due within one year |
(1,496 | ) | (1,531 | ) | ||||||||||||
| Total long-term debt |
$ | 3,392 | $ | 5,220 | ||||||||||||
As of December 31, 2010, total debt maturing in 2011, 2012, 2013, 2014 and 2015 was $1.5 million, $1.1 million, $0.7 million, $0.6 million and $0.6 million, respectively. There was $0.4 million of debt outstanding that matures after 2015.
The weighted average interest rate on long-term debt was 5.3% for the year ended December 31, 2010, compared with 5.0% for 2009 and 5.2% for 2008.
F-14
Table of Contents
7. Financial Instruments and Fair Value Measurements
The Company did not hold any material investments in financial instruments at December 31, 2010 or 2009. No material gains or losses on investments were realized in 2010, 2009 or 2008. For the purpose of computing realized gains and losses, cost is determined on the specific identification basis.
The Company utilizes letters of credit in the ordinary course of business to satisfy security deposit requirements. Outstanding letters of credit were $4.3 million as of December 31, 2010 and $2.5 million as of December 31, 2009.
The Company periodically enters into foreign currency forward exchange contracts to mitigate exposure to foreign currency risk. The Company did not hold any foreign exchange contracts as of December 31, 2010 and the fair value of foreign exchange contracts as of December 31, 2009 was not considered material to the Company’s consolidated financial position. The Company reassesses the effectiveness of its derivative instruments on an ongoing basis. If it is determined that a derivative instrument has ceased to be highly effective as a hedge, the Company will discontinue hedge accounting prospectively and changes in the fair value of the derivative instrument will then be reported in the current period results of operations. By nature, all financial instruments involve market and credit risks. The Company enters into derivative and other financial instruments with major investment grade financial institutions and has policies to monitor the credit risk of those counterparties. The Company does not anticipate non-performance by any of its counterparties.
Fair value, as defined in accounting guidance, is the price that would be received when selling an asset or transferring a liability in an orderly transaction between market participants at the measurement date. The transaction of selling an asset or transfering a liability is a hypothetical transaction at the measurement date, considered from the perspective of a market participant that holds the asset or owes the liability. Therefore, the objective of a fair value measurement is to determine the price that would be received when selling the asset or paid transferring the liability (an exit price) at the measurement date.
The Company did not hold any non-recurring non-financial assets or liabilities as of December 31, 2010 or 2009 or any recurring non-financial assets as of December 31, 2010.
The following table provides the non-financial assets carried at fair value measured on a recurring basis as of December 31, 2009:
|
|
Total Carrying December 31, |
|
|
Fair Value measurements at December 31, 2009
using |
| |||||||||||
| In thousands |
|
Quoted Prices in active markets (Level 1) |
|
|
Significant other observable inputs (Level 2) |
|
|
Significant unobservable inputs (Level 3) |
| |||||||
| Forward exchange contracts |
$ | 662 | $ | — | $ | 662 | $ | — | ||||||||
Derivative valuations are based on observable inputs to a valuation model including interest rates and foreign currency exchange rates and are classified within Level 2 of the valuation hierarchy.
The carrying amounts and fair values of financial instruments as of December 31, 2010 and 2009 were as follows:
| |
2010 |
|
|
2009 |
| |||||||||||
| In thousands | |
Carrying Amount |
|
|
Fair Value |
|
|
Carrying Amount |
|
|
Fair Value |
| ||||
| Financial liabilities: |
||||||||||||||||
| Current portion of long-term debt |
$ | 1,496 | $ | 1,507 | $ | 1,531 | $ | 1,548 | ||||||||
| Long-term debt |
$ | 3,392 | $ | 3,410 | $ | 5,220 | $ | 5,303 | ||||||||
The above fair values were computed based on quoted market rates and discounted future cash flows. The carrying amounts of cash and cash equivalents, accounts receivable and accounts payable approximate fair value as of December 31, 2010 and 2009.
F-15
Table of Contents
8. Derivative Instruments and Hedging Activities
In general, the Company utilizes derivative instruments to reduce its exposure to the effects of the variability of foreign currencies on its financial performance when it believes such action is warranted. The Company does not engage in derivative instruments for speculative purposes. Lydall has historically not been a party to a significant number of derivative instruments.
In December 2008, the Company entered into a foreign currency forward contract with a notional amount of €4.5 million that matured in December 2010. This derivative instrument was accounted for as an economic hedge of an intercompany loan denominated in a foreign currency. At each balance sheet date throughout the term of this derivative instrument, the Company remeasured it at fair value and recognized the change in fair value in the statement of operations. The Company entered into this derivative contract to minimize the offsetting impact in the Company’s statement of operations of changes in foreign currency rates impacting the amount of an intercompany loan that was settled in December 2010. The table below discloses the fair value and location of this derivative instrument at December 31, 2009, and amount of gain or loss recognized in the Company’s statement of operations for the years ended December 31, 2010 and 2009 related to this derivative instrument. The Company had no derivative instruments at December 31, 2010. The fair value of derivative instruments at December 31, 2009 is summarized in the following table:
| Asset Derivatives |
Liability Derivatives |
|||||||||||||||
| In thousands | Balance Sheet Location |
Fair Value |
Balance Sheet Location |
Fair Value |
||||||||||||
| Derivatives designated as cash flow hedging instruments: |
||||||||||||||||
| Foreign exchange contracts |
Other current assets | $ | 32 | Other liabilities | $ | — | ||||||||||
| Derivatives not designated as hedging instruments (economic hedge): |
||||||||||||||||
| Foreign exchange contracts |
Other current assets | $ | 630 | Other liabilities | $ | — | ||||||||||
| Total Derivatives |
$ | 662 | $ | — | ||||||||||||
The effect of derivative instruments not designated as hedging instruments on the consolidated statement of operations in the years ended December 31, 2010 and December 31, 2009:
| In thousands | Location of (Loss) Gain Recognized in Earnings |
(Loss) Gain Recognized in Earnings |
||||||||||
| 2010 |
2009 |
|||||||||||
| Foreign exchange contracts |
Other income, net | $ | (630 | ) | $ | 225 | ||||||
The Company includes the gain or loss on the derivative in the same line item as the offsetting gain or loss on the related hedged item. The amounts noted in the tables above for other income, net do not include any adjustments for the impact of deferred income taxes.
The effect of derivative instruments on the consolidated statement of operations designated as cash flow or fair value hedging instruments was immaterial for 2010 and 2009.
9. Acquisitions and Divestures
2010 Transaction
On June 30, 2010, the Company divested its electrical papers product line business, included in the Performance Materials segment, for total consideration of $5.8 million, of which $4.8 million was paid on June 30, 2010. As part of the sale transaction, the Company transferred its electrical paper products customer list to the buyer, agreed not to compete (the “Non-Compete Agreement”) with the buyer with respect to the manufacture and sale of electrical insulating products for use in the transformer industry for a period of ten years, entered into a contract manufacturing agreement (the “Manufacturing Agreement”) with the buyer pursuant to which the Company is obligated to manufacture and sell electrical paper products to the buyer for a two-year period, and entered into a process technology license agreement (“License Agreement”). Pursuant to the License Agreement, the Company granted the buyer the right to use certain process technology and agreed to provide certain services to the buyer to facilitate the transfer of know-how for the manufacture of electrical paper products. Under the License Agreement, the buyer is obligated to pay the Company an additional $1.0 million on the earlier of June 30, 2012 or completion by Lydall of its obligations to provide services to the buyer.
F-16
Table of Contents
Gain Recognition
For the year ended December 31, 2010, the Company recorded a $2.5 million gain related to this transaction. The Company recorded a gain on sale of $1.7 million in the second quarter of 2010, net of a write-off of $0.8 million of goodwill that was allocated to the electrical papers product line. During the six months ended December 31, 2010, the Company also recognized additional income of $0.8 million, as the Company provided services to the buyer in accordance with the terms of the License Agreement. The remainder of the gain is being recognized over the period that the Company satisfies its obligations under the License Agreement.
This transaction contained multiple deliverables, some of which were delivered on June 30, 2010, while others will be delivered in subsequent periods. The Company concluded that on June 30, 2010 it had delivered a customer list and the Non-Compete Agreement, and that future services under the License Agreement remained undelivered. The Company adopted Accounting Standards Update (“ASU”) No. 2009-13, “Multiple-Deliverable Revenue Arrangements” (“ASU 2009-13”) effective January 1, 2010, which changed the requirements for establishing separate units of accounting in a multiple element arrangement and required the allocation of the arrangement consideration to each deliverable to be based on the estimated selling price, if neither vendor-specific objective evidence nor third-party evidence is available. The Company retroactively applied these standards to the beginning of 2010 for new and materially modified arrangements originating after December 31, 2009. The Company concluded that the customer list and the Non-Compete Agreement together represented one unit of accounting with stand-alone value to the buyer and that the License Agreement represented a separate unit of accounting.
The significant factors and estimates used to determine the estimated selling price of the separate units of accounting included existing and projected cash flows received by the Company from sale of the electrical paper products prior to the transaction. On June 30, 2010, the Company concluded that the estimated selling price of the customer list and the Non-Compete Agreement unit of accounting to be approximately $2.6 million and the License Agreement unit of accounting to be approximately $3.2 million. As a result, the Company recorded a gross gain of $2.6 million related to the delivered elements during the quarter ended June 30, 2010 and deferred $3.2 million, with the deferred amount recognized in income as services under the License Agreement are delivered in subsequent periods, including $0.8 million recognized over the second half of 2010. Based upon the terms of the License Agreement, the Company has determined it will record income on a straight-line basis from July 1, 2010 through June 30, 2012 as there is no better discernible pattern of when services will be provided to the buyer.
Under the Manufacturing Agreement the buyer is obligated to purchase its requirements of the electrical paper products from the Company with the exception that the buyer may itself manufacture the products at its own facilities. The Manufacturing Agreement is a separate unit of accounting with stand-alone value and the Company will recognize revenue in future periods as the Company delivers the products to the buyer.
Impact of Adoption
By adopting the new accounting guidance, operating income for 2010 was approximately $1.9 million higher than operating income would have been under the previous accounting rules. This increase in operating income was due to recognition of the gain on sale of the product line sold on June 30, 2010 that contained an undelivered element (License Agreement) for which the Company would be unable to demonstrate fair value pursuant to the previous accounting standards. Previous accounting standards required that if the Company did not have vendor-specific objective evidence or third-party evidence of the selling price for the License Agreement (the undelivered element in this arrangement), then the gain associated with both the delivered and undelivered elements would be combined into one unit of accounting. This would have resulted in the entire transaction amount of $5.8 million being deferred at June 30, 2010 and subsequently recognized as the License Agreement services were delivered by the Company to the buyer. The Company believes that the previous accounting standard described above did not reflect the underlying economics of the transaction. As a result, the Company early-adopted the new revenue accounting guidance discussed above.
2008 Transactions
Acquisitions
On December 1, 2008, the Company, through its wholly owned subsidiary Lydall Netherlands B.V., acquired for cash all the outstanding shares in DSM Solutech B.V. (“Solutech”) from Royal DSM N.V. (the “Seller”). Solutech, based in Heerlen, the Netherlands, manufactures micro-porous films – trade name Solupor® – using its proprietary technology. This acquisition supported the Company’s strategy to invest in technologically innovative solutions and provided a new platform for growth into specialty segments currently underserved by the Company’s filtration business and other suppliers. The Solutech operation is included in the Performance Materials segment.
F-17
Table of Contents
This acquisition was accounted for using the purchase method set forth in the guidance for Business Combinations, whereby the purchase consideration was allocated to the estimated fair values of the assets acquired and liabilities assumed at the effective date of the purchase. Upon final resolution of certain adjustments to the purchase price in 2009, detailed in the Sale and Purchase Agreement between the Company and Seller, the Company paid approximately $10.4 million for Solutech with the majority of the purchase price allocated to goodwill and other intangible assets.
Lydall is obligated to pay to the Seller earn-out payments based on the net revenues of Solutech for a period of five years beginning on December 1, 2008 (“Contingent Consideration”). This Contingent Consideration will equal 4% of Solutech’s net revenues, as defined, during each of the periods. The value of the Contingent Consideration when paid will be added to the original cost of the acquisition and will increase the amount of goodwill previously recorded. During 2010 and 2009, Contingent Consideration payments were approximately $0.1 million in both periods. An estimate of Contingent Consideration to be paid over the remaining five year period cannot be made as it depends on the amount of Solutech net revenues. The maximum amount is unlimited.
Divestitures
On September 19, 2008, the Company sold its wholly-owned subsidiary, Lydall Transport, Ltd. (“Transport”), for $4.2 million in cash. Transport had operated the Company’s transport, distribution and warehousing businesses that specialized in time-sensitive shipments and warehouse management services primarily serving the paper and printing industries. The Company recorded a gain on disposal, net of income taxes, of $0.9 million related to this transaction. The Consolidated Financial Statements have been adjusted to reclassify Transport as a discontinued operation for all periods presented.
As part of the sale agreement, the Company entered into a Services Agreement with Transport. Transport will perform substantially the same freight hauling services for the Company that it performed prior to the sale, for a period of three years from the date of closing. The Company guaranteed that minimum payments under the Services Agreement would be $1.2 million for each year of the three year term. Freight hauling services under this agreement were $1.2 million for the first year term from September 2008 to September 2009 and $1.9 million for the second year term from October 2009 to September 2010. Freight hauling services were $0.6 million for the period October 2010 through December 2010. Freight hauling expenses recorded with this discontinued operation that were previously eliminated as intercompany expenses in consolidation were $1.2 million from January 1, 2008 to the date of sale. In accordance with accounting guidance, the Company reviewed the transaction and concluded that the results of Transport should be reported as a discontinued operation.
The following table is a summary of the results of the discontinued operation:
| In thousands | 2008 | |||
| Net sales |
$ | 13,621 | ||
| Income before income taxes |
$ | 307 | ||
| Income tax expense |
115 | |||
| Income from discontinued operations |
$ | 192 | ||
| Gain on sale of discontinued operations, net of tax of $0.5 million |
860 | |||
| Total discontinued operations, net of tax |
$ | 1,052 | ||
10. Capital Stock
Preferred stock – The Company has authorized Serial Preferred Stock with a par value of $1.00. None of the 500,000 authorized shares have been issued.
Common stock – As of December 31, 2010, 5,130 Lydall stockholders of record held 17,163,201 shares of Common Stock.
Dividend policy – The Company does not pay a cash dividend on its common stock, and the Company’s domestic credit facility entered into on March 11, 2009 prohibits the payment of a cash dividend.
F-18
Table of Contents
11. Employer Sponsored Benefit Plan
On July 29, 2010, Lydall’s Board of Directors voted to approve the merger of the three pension plans into one plan to achieve administrative efficiencies and reduce plan maintenance costs. The effective date of the merger was December 31, 2010.
The defined benefit pension plan, which covers the majority of domestic Lydall employees, is noncontributory and benefits are based on either years of service or eligible compensation paid while a participant is in a plan. The plan is closed to new employees and benefits under the pension plan are no longer accruing.
The Company’s funding policy for its pension plan is to fund not less than the ERISA minimum funding standard and not more than the maximum amount that can be deducted for federal income tax purposes.
Plan assets and benefit obligations of the domestic defined benefit pension plan are as follows:
| |
December 31, |
| ||||||
| In thousands | 2010 | 2009 | ||||||
| Change in benefit obligation: |
||||||||
| Net benefit obligation at beginning of year |
$ | 43,886 | $ | 43,299 | ||||
| Service cost |
— | 47 | ||||||
| Interest cost |
2,553 | 2,571 | ||||||
| Actuarial loss |
1,250 | 1,281 | ||||||
| Gross benefits paid |
(1,739 | ) | (2,035 | ) | ||||
| Settlements |
— | (1,277 | ) | |||||
| Net benefit obligation at end of year |
$ | 45,950 | $ | 43,886 | ||||
| Change in plan assets: |
||||||||
| Fair value of plan assets at beginning of year |
$ | 29,285 | $ | 25,897 | ||||
| Actual return on plan assets |
3,595 | 5,084 | ||||||
| Contributions |
1,656 | 339 | ||||||
| Gross benefits paid |
(1,739 | ) | (2,035 | ) | ||||
| Fair value of plan assets at end of year |
$ | 32,797 | $ | 29,285 | ||||
| Net benefit obligation in excess of plan assets |
$ | (13,153 | ) | $ | (14,601 | ) | ||
| Balance sheet amounts: |
||||||||
| Noncurrent liabilities |
$ | (13,153 | ) | $ | (14,601 | ) | ||
| Total liabilities |
$ | (13,153 | ) | $ | (14,601 | ) | ||
| Amounts recognized in accumulated other comprehensive income, net of tax consist of: |
||||||||
| Net actuarial loss |
$ | 12,459 | $ | 12,835 | ||||
| Net amount recognized |
$ | 12,459 | $ | 12,835 | ||||
At December 31, 2010, in addition to the accrued benefit liability of $13.2 million recognized for the Company’s domestic defined benefit pension plan, the Company also had an accrued benefit liability of $0.8 million and an insignificant accumulated other comprehensive loss, net of tax, related to foreign regulatory labor agreements.
The pension liability (net of tax) included in other comprehensive income decreased by $0.4 million for the year ended December 31, 2010 and decreased $1.7 million for the year ended December 31, 2009.
Aggregated information for the domestic defined benefit pension plan with an accumulated benefit obligation in excess of plan assets is provided in the table below:
| |
December 31, |
| ||||||
| In thousands | 2010 | 2009 | ||||||
| Projected benefit obligation |
$ | 45,950 | $ | 43,886 | ||||
| Accumulated benefit obligation |
$ | 45,950 | $ | 43,886 | ||||
| Fair value of plan assets |
$ | 32,797 | $ | 29,285 | ||||
F-19
Table of Contents
Components of net periodic benefit cost for the domestic pension plan:
| |
For the years ended December 31, |
| ||||||||||
| In thousands | 2010 | 2009 | 2008 | |||||||||
| Service cost |
$ | — | $ | 47 | $ | 85 | ||||||
| Interest cost |
2,553 | 2,571 | 2,555 | |||||||||
| Expected return on plan assets |
(2,329 | ) | (2,033 | ) | (3,143 | ) | ||||||
| Curtailment loss |
— | 213 | — | |||||||||
| Settlement gain |
— | (59 | ) | — | ||||||||
| Amortization of: |
||||||||||||
| Prior service cost |
— | 7 | 19 | |||||||||
| Unrecognized actuarial loss |
590 | 695 | 170 | |||||||||
| Total net periodic benefit cost (income) |
$ | 814 | $ | 1,441 | $ | (314 | ) | |||||
The estimated amounts that will be amortized from accumulated other comprehensive loss into net periodic benefit costs for the domestic pension plan in 2011 are as follows:
| In thousands | Pension Benefits |
|||
| Actuarial loss |
$ | 560 | ||
| Prior service cost |
— | |||
| Total |
$ | 560 | ||
The major assumptions used in determining the year-end benefit obligation and annual net cost for the domestic pension plan are presented in the following table:
| Benefit Obligation |
Net Cost | |||||||||
| For the years ended December 31, | 2010 | 2009 | 2010 | 2009 | 2008 | |||||
| Discount rate |
5.74% | 5.96% | 5.96% | 6.12% | 6.29% | |||||
| Salary scale |
— | — | — | — | — | |||||
| Expected return on plan assets |
8.00% | 8.00% | 8.00% | 8.00% | 8.50% | |||||
Plan Assets
The domestic defined benefit pension plan is administered by an Administrative Committee and an Investment Committee, which are appointed by the Board of Directors of Lydall, Inc. The Investment Committee’s responsibilities are to establish a funding policy for the Lydall Pooled Pension Investment Trust (“the Trust”) and to appoint and oversee the investment advisor(s) responsible for the Trust’s investments. The Investment Committee is a named fiduciary under the plan with respect to management of the Trust’s investments. The assets of the domestic pension plan are invested in a Trust for the purpose of investment diversification. In determining the expected return on plan assets, the Investment Committee considers the relative weighting of plan assets, the historical performance of marketable debt and equity securities and economic and other indicators of future performance.
Investment management objectives include maintaining an adequate level of diversification to balance market risk and to provide sufficient liquidity for near-term payments of benefits accrued under the domestic pension plan and to pay the expenses of administration. The long-term investment objective of the Trust is to achieve a total return equal to or greater than the Trust’s actuarially assumed rate of return, currently 8.0%. Though it is the intent of the Investment Committee to achieve income and growth, that intent does not include taking extraordinary risks or engaging in investment activities not commonly considered prudent under the standards imposed by ERISA. The Investment Committee defines risk as the probability of not meeting the Trust’s objectives and the probability of not meeting the Trust’s liability requirements. The allowable investments include: treasury bills, money market funds, STIF funds, commercial paper, banker’s acceptances, repurchase agreements, certificates of deposit, US government securities, corporate notes and bonds, mortgage backed bonds, preferred stock, fixed income securities of foreign governments and corporations, collateralized mortgage obligations, common stocks, convertible notes and bonds, convertible preferred stocks, American Depository Receipts of Non-US companies, stocks of Non-US companies, real estate investment trusts, mutual funds, GIC’s and hedge fund of funds. Prohibited investments include: commodities and futures contracts, private
F-20
Table of Contents
placements, options, limited partnerships, venture-capital investments, real estate properties, CMO derivatives, single strategy hedge funds and Lydall, Inc. securities.
The Investment Committee’s target asset allocation seeks to control risk through portfolio diversification and takes into account, among other factors, objectives discussed above, current funding levels, cash flow conditions and economic and industry trends. The target allocations for plan assets are 70% equity securities and 30% fixed income securities. Equity securities include investments in large-cap and small-cap companies primarily located in the United States. Fixed income securities include fixed income mutual bond funds and common and collective funds.
The following table presents the target allocation of pension plan assets for 2011 and the actual allocation of plan assets as of December 31, 2010 and 2009 by major asset category:
| |
Target Allocation |
|
|
Actual Allocation of Plan Assets December 31, |
| |||||||
| Asset Category | 2011 | 2010 | 2009 | |||||||||
| Equity securities – US Large Cap |
35% - 50% | 40% | 39% | |||||||||
| Equity securities – US Small Cap |
10% - 20% | 14% | 13% | |||||||||
| Equity securities – Non-US |
10% - 20% | 18% | 17% | |||||||||
| Fixed income securities |
20% - 40% | 25% | 27% | |||||||||
| Cash and cash equivalents and other |
0% - 5% | 3% | 4% | |||||||||
The investments of the Trust are stated at fair value. Fair value is the price that would be received to sell an asset or paid to transfer a liability in an orderly transaction between market participants at the measurement date. The asset’s fair value measurement level within the fair value hierarchy is based on the lowest level of any input that is significant to the fair value measurement. Valuation techniques used need to maximize the use of observable inputs and minimize the use of unobservable inputs. The framework for measuring fair value provides a fair value hierarchy that prioritizes the inputs to valuation techniques used to measure fair value. The hierarchy gives the highest priority to unadjusted quoted prices in active markets for identical assets or liabilities (level 1 measurements) and the lowest priority to unobservable inputs (level 3 measurements).
Equity securities, which consist primarily of common stocks, are valued at the closing price reported in the active market in which individuals securities are traded. Short-term cash funds and mutual funds are valued at the net asset value of shares held by the plan at year end as reported in the active market in which the funds are traded. Common and collective trusts are stated at their net unit values as reported by the investment manager of the fund based on their fair value of the underlying assets and liabilities, which are primarily marketable securities with quoted market prices.
The Trust’s purchases and sales of securities are recorded on a trade date basis. Interest income is recorded on the accrual basis. Dividends are recorded on the ex-dividend date.
The following table sets forth by level, within the fair value hierarchy, the Trust’s assets at fair value as of December 31, 2010 and December 31, 2009
| December 31, 2010 In thousands |
||||||||||||||||
| Level 1 | Level 2 | Level 3 | Total | |||||||||||||
| Equity securities: |
||||||||||||||||
| Equity securities –US large cap |
$ | 13,106 | $ | — | $ | — | $ | 13,106 | ||||||||
| Equity securities –US small cap |
4,719 | — | — | 4,719 | ||||||||||||
| Equity securities – Non-US |
5,845 | — | — | 5,845 | ||||||||||||
| Fixed Income securities: |
||||||||||||||||
| Common and collective trusts |
— | 1,640 | — | 1,640 | ||||||||||||
| Mutual funds -bonds |
6,571 | — | — | 6,571 | ||||||||||||
| Cash and cash equivalents |
916 | — | — | 916 | ||||||||||||
| Total Assets at Fair Value |
$ | 31,157 | $ | 1,640 | $ | — | $ | 32,797 | ||||||||
F-21
Table of Contents
| December 31, 2009 In thousands |
||||||||||||||||
| Level 1 | Level 2 | Level 3 | Total | |||||||||||||
| Equity securities: |
||||||||||||||||
| Equity securities –US large cap |
$ | 11,266 | $ | — | $ | — | $ | 11,266 | ||||||||
| Equity securities –US small cap |
3,786 | — | — | 3,786 | ||||||||||||
| Equity securities – Non-US |
4,948 | — | — | 4,948 | ||||||||||||
| Fixed Income securities: |
||||||||||||||||
| Common and collective trusts |
— | 4,017 | — | 4,017 | ||||||||||||
| Mutual funds -bonds |
4,029 | — | — | 4,029 | ||||||||||||
| Cash and cash equivalents |
1,239 | — | — | 1,239 | ||||||||||||
| Total Assets at Fair Value |
$ | 25,268 | $ | 4,017 | $ | — | $ | 29,285 | ||||||||
Estimated Future Contributions and Benefit Payments
The Company expects to contribute approximately $2.5 million in cash to its domestic defined benefit pension plan in 2011.
Estimated future benefit payments for the next 10 years are as follows:
| In thousands | 2011 | 2012 | 2013 | 2014 | 2015 | 2016-2020 | ||||||||||||||||||
| Benefit payments |
$ | 1,824 | $ | 1,931 | $ | 2,049 | $ | 2,191 | $ | 2,286 | $ | 13,368 | ||||||||||||
Employee Savings Plan
The Company also sponsors a 401(k) Plan. Employer contributions to this plan amounted to $0.9 million in 2010, $0.6 million in 2009 and $2.1 million in 2008. In response to the global economic decline, Lydall suspended its matching contribution to its sponsored 401(k) plan beginning with the first payroll of May 2009, for all non-union domestic employees. The 401(k) plan matching contribution resumed, beginning with the first payroll of July 2010. Matching contributions by the Company are made on employee pretax contributions up to five percent of compensation, with the first three percent matched at 100% and the next two percent matched at 50%. Prior to the suspension in 2009, the Company’s matching contribution was 100% of employee pretax contributions up to 6% of compensation.
12. Equity Compensation Plans
As of December 31, 2010, the Company had two stock option plans – the 1992 Stock Incentive Compensation Plan (“1992 Plan”) and the 2003 Stock Incentive Compensation Plan (“2003 Plan”), collectively, the “Plans” – under which incentive and non-qualified stock options and time and performance based restricted shares may have been granted to employees and outside directors from authorized but unissued shares of common stock or treasury shares. The 1992 Plan expired in May 2002; however, the 1992 Plan shall continue to govern all outstanding awards under that plan until the awards themselves are exercised or terminate in accordance with their terms. The 2003 Plan authorized 2.5 million share options and restricted shares for employees and outside directors.
The Company recognizes expense on a straight-line basis over the vesting period of the entire award. Options issued by the Company under its stock option plans have a term of ten years and generally vest ratably over a period of three to four years. Time based restricted stock grants are expensed over the vesting period of the award, which is typically four years. The number of performance based restricted shares that vest or forfeit depend upon achievement of certain targets during the performance period. Stock-based compensation expense includes the estimated effects of forfeitures. Stock options issued under the current plan must have an exercise price that may not be less than the fair market value of the Company’s common stock on the date of grant. The Plans provide for automatic acceleration of vesting in the event of a change in control of the Company.
The Company incurred compensation expense of $1.4 million, $1.4 million and $0.9 million for the years ended December 31, 2010, 2009 and 2008, respectively, for all stock-based compensation plans, including restricted stock awards. No compensation costs were capitalized as part of inventory. The associated tax benefit realized was $0.1 million, $0.1 million and $0.2 million for the years ended December 31, 2010, 2009 and 2008, respectively.
F-22
Table of Contents
Stock Options
The fair value of each option granted was estimated on the date of grant using the Black-Scholes option-pricing model with the following weighted-average assumptions for the years ended December 31:
| 2010 | 2009 | 2008 | ||||||||||
| Risk-free interest rate |
2.2 | % | 2.6 | % | 2.9 | % | ||||||
| Expected life |
5.3 years | 5.5 years | 5.6 years | |||||||||
| Expected volatility |
65 | % | 61 | % | 50 | % | ||||||
| Expected dividend yield |
0 | % | 0 | % | 0 | % | ||||||
The following is a summary of the option activity as of December 31, 2010 and changes during the year then ended:
| In thousands except per share and term amounts | ||||||||||||||||
| Fixed options | Shares | Weighted- Average Exercise Price |
Weighted- Average Remaining Contractual Term (years) |
Aggregate Intrinsic Value |
||||||||||||
| Outstanding at December 31, 2009 |
860 | $ | 8.77 | |||||||||||||
| Granted |
201 | $ | 7.90 | |||||||||||||
| Exercised |
(16 | ) | $ | 7.24 | ||||||||||||
| Forfeited/Cancelled |
(138 | ) | $ | 8.61 | ||||||||||||
| Outstanding at December 31, 2010 |
907 | $ | 8.62 | 6.7 | $ | 694 | ||||||||||
| Options exercisable at December 31, 2010 |
526 | $ | 9.64 | 4.9 | $ | 241 | ||||||||||
The Company granted 200,775, 173,000 and 114,000 stock options during 2010, 2009 and 2008, respectively. The weighted-average grant-date fair value of options granted during the years 2010, 2009 and 2008 was $4.48, $2.95 and $3.52, respectively. There were 15,700 options exercised in the year ended December 31, 2010, no options exercised in 2009 and 17,550 options exercised in 2008. The total intrinsic value and associated tax benefit realized for options exercised in 2010 were minimal. For the year ended December 31, 2010, the amount of cash received from the exercise of stock options was $0.1 million. The total intrinsic value for options exercised during the year ended December 31, 2008 was $0.3 million and the associated tax benefit realized from stock options exercised was $0.1 million. For the year ended December 31, 2008, the amount of cash received from the exercise of stock options was $0.8 million. At December 31, 2010, the total unrecognized compensation cost related to non-vested stock option awards was approximately $1.0 million, with a weighted average expected amortization period of 3.1 years.
Restricted Stock
Compensation for restricted stock is recorded based on the market value of the stock on the grant date and amortized to expense over the vesting period of the award. The Company granted 116,000, 333,000, and 84,000 shares of restricted stock during 2010, 2009 and 2008, respectively. The weighted average fair value per share of restricted stock granted was $7.80, $5.48 and $5.12 during 2010, 2009, and 2008, respectively. During 2010, 2009 and 2008, respectively, there were 83,000 shares, 13,050 shares and 25,140 shares of restricted stock forfeited. The fair value of awards for which restrictions lapsed during the years ended December 31, 2010, 2009, and 2008 was $0.4 million, $0.4 million and $0.3 million, respectively. At December 31, 2010, the total unrecognized compensation cost related to non-vested restricted stock awards was approximately $2.1 million, with a weighted average expected amortization period of 2.8 years.
F-23
Table of Contents
The following is a summary of the Company’s nonvested restricted shares as of December 31, 2010 and changes during the year ended December 31, 2010:
| In thousands except per share amounts | ||||||||
| Nonvested Restricted Shares | Shares | Weighted-Average Grant-Date |
||||||
| Nonvested at December 31, 2009 |
447 | $ | 6.06 | |||||
| Granted |
116 | $ | 7.80 | |||||
| Vested |
(50 | ) | $ | 8.35 | ||||
| Forfeited |
(83 | ) | $ | 6.05 | ||||
| Nonvested at December 31, 2010 |
430 | $ | 6.27 | |||||
Stock Repurchase Program
In August 2003, the Company’s Board of Directors approved a Stock Repurchase Program (the “Repurchase Program”) to mitigate the potentially dilutive effects of stock options and shares of restricted and unrestricted stock granted by the Company. Under the Repurchase Program, shares may be purchased by the Company up to the quantity of shares underlying options and other equity-based awards granted after January 1, 2003 under shareholder approved plans. The terms and conditions of the Company’s Domestic Credit Facility at December 31, 2010 prohibit the Company’s ability to repurchase common stock, subject to certain exceptions. Should Lydall have the ability to engage in repurchase activity in the future, the Company intends to take advantage of the safe harbor protections afforded by Rule 10b-18 promulgated under the Exchange Act, to engage in future repurchase activity in accordance with the provisions of the Exchange Act. As of December 31, 2010, there were 2,278,389 shares remaining available for purchase under the Repurchase Program. There was no repurchase activity under the Repurchase Program during 2010. The 14,529 shares acquired by the Company during the year ended December 31, 2010 represent shares withheld by the Company pursuant to provisions in agreements with recipients of restricted stock granted under the Company’s equity compensation plans requiring the Company to withhold the number of shares having fair value equal to each recipient’s tax withholding due.
13. Segment Information
The Company’s reportable segments are Performance Materials and Thermal/Acoustical. The Performance Materials segment reports results of the filtration businesses and the industrial thermal insulation business. The Thermal/Acoustical segment reports the results of the Company’s automotive businesses. All other businesses are aggregated in OPS. OPS comprises the Vital Fluids business and Affinity® temperature control equipment business (“Affinity”).
In September 2008, the Company sold its wholly-owned subsidiary, Transport (See Note 9). This operation had been included within OPS. As a result of the sale, the Consolidated Financial Statements have been adjusted to reclassify Transport as a discontinued operation and the following segment information excludes Transport’s net sales and operating income in 2008.
Performance Materials Segment
The Performance Materials segment includes filtration media solutions for air, fluid power, industrial and life science applications and industrial thermal insulation solutions for building products, appliances, and energy and industrial markets.
Lydall air filtration products include LydAir®MG (Micro-Glass) Air Filtration Media, LydAir®MB (Melt Blown) Air Filtration Media, LydAir®SC (Synthetic Composite) Air Filtration Media, and Arioso™ (Membrane Composite) Composite Media. These products constitute the critical media component of clean-air systems for applications in clean-space, commercial, industrial and residential HVAC, power generation, industrial processes and protection/respiratory devices. Lydall has leveraged its extensive technical expertise and applications knowledge into a suite of media products covering the vast liquid filtration landscape across the engine and industrial and life science fields. The LyPore® Liquid Filtration Media and activated carbon containing ActiPure® Filtration Media series address a variety of application needs including hydraulic filters, air-water and air-oil coalescing, industrial fluid processes, diesel filtration, biopharmaceutical pre-filtration and clarification, diagnostic tests, and drinking water filtration. The Company also manufactures Solupor® Membrane specialty microporous membranes that are utilized in various markets and applications including batteries, fuel cells and supercapacitors, air and liquid filtration, and transdermal drug delivery. Solupor®
F-24
Table of Contents
Membrane membranes are based on ultra-high molecular weight polyethylene and incorporate an uncommon combination of mechanical strength, chemical inertness, and high porosity in a unique open structure.
The industrial thermal insulation business develops high performance nonwoven veils, papers, mats and specialty composites for the building products, appliance, and energy and industrial markets. The Manniglas® Thermal Insulation brand is diverse in its product application ranging from high temperature seals and gaskets in ovens and ranges to specialty veils for HVAC and cavity wall insulation. appLY® (Mat) Needled Glass Mats have been developed to expand Lydall’s high temperature technology portfolio for broad application into the appliance market and supplements the Lytherm® Insulation Media product brand, traditionally utilized in the industrial market for kilns and furnaces used in metal processing. Lydall’s Cryotherm® Super-Insulating Media, CRS-Wrap® Super-Insulating Media and Cryo-LiteTM Cryogenic Insulation products are industry standards for state-of-the-art cryogenic insulation designs used by manufacturers of cryogenic equipment for liquid gas storage, piping, and transportation.
Thermal/Acoustical Segment
The Thermal/Acoustical segment offers a full line of innovative engineered products to assist in noise and heat abatement within the transportation sector. Lydall products are found in the interior (Dash insulators), underbody (fuel tank, exhaust) and underhood (engine compartment) of cars, trucks, SUV’s, heavy duty trucks, and recreational vehicles. Lydall’s patented products include ZeroClearance®, AMS®, Flexshield® and dBCore® comprising of organic and inorganic fiber composites as well as metal combinations.
Other Products and Services
The components of OPS are Lydall’s Vital Fluids business and Affinity business.
The Vital Fluids business serves the life science industry offering specialty products for blood transfusion and cell therapy applications as well as Bio-Pak® Single-Use Disposable Bio-Containers for containment of media, buffers and bulk intermediates used in biotech, pharmaceutical and diagnostic reagent manufacturing processes. Vital Fluids also offers Cell-Freeze® Bio-Containers, a medical device used for cryogenic storage of peripheral blood stem cells. Its medical filter materials products are utilized in traditional blood filtration devices such as cardiotomy reservoirs and autotransfusion filters. Other products include specialty blood transfusion products, as well as medical filtration components used for surgical procedures.
Lydall’s Affinity business designs and manufactures high precision, specialty engineered temperature-control equipment for semiconductor, pharmaceutical, life sciences and industrial applications.
Net sales by segment and for OPS, as well as reconciling items, to equal to consolidated net sales for the years ended December 31, 2010, 2009, and 2008 were as follows:
| Consolidated Net Sales |
|
For the Years Ended December 31, |
| |||||||||
| In thousands | 2010 | 2009 | 2008 | |||||||||
| Performance Materials: |
||||||||||||
| Filtration |
$ | 84,551 | $ | 66,363 | $ | 70,549 | ||||||
| Industrial Thermal Insulation |
38,584 | 31,652 | 41,036 | |||||||||
| Performance Materials Segment net sales |
$ | 123,135 | $ | 98,015 | $ | 111,585 | ||||||
| Thermal/Acoustical: |
||||||||||||
| Automotive parts |
$ | 158,414 | $ | 106,735 | $ | 143,177 | ||||||
| Automotive tooling |
20,637 | 21,058 | 20,523 | |||||||||
| Thermal/Acoustical Segment net sales |
$ | 179,051 | $ | 127,793 | $ | 163,700 | ||||||
| Other Products and Services: |
||||||||||||
| Vital Fluids |
$ | 15,562 | $ | 14,600 | $ | 16,649 | ||||||
| Affinity |
21,894 | 9,215 | 15,104 | |||||||||
| Other Products and Services net sales |
$ | 37,456 | $ | 23,815 | $ | 31,753 | ||||||
| Eliminations and Other |
(1,635 | ) | (676 | ) | (1,322 | ) | ||||||
| Consolidated Net Sales |
$ | 338,007 | $ | 248,947 | $ | 305,716 | ||||||
F-25
Table of Contents
Operating income (loss) from continuing operations by segment and for OPS and Corporate Office Expenses for the years ended December 31, 2010, 2009, and 2008 were as follows:
| Operating Income (Loss) from Continuing Operations |
|
For the Years Ended December 31, |
| |||||||||
| In thousands | 2010 |
|
Revised 2009 |
|
|
Revised 2008 |
| |||||
| Performance Materials Segment |
$ | 17,247 | $ | 7,593 | $ | 15,625 | ||||||
| Thermal/Acoustical Segment |
446 | (10,337 | ) | (6,101 | ) | |||||||
| Other Products and Services |
||||||||||||
| Vital Fluids |
(131 | ) | 211 | 1,069 | ||||||||
| Affinity |
1,123 | (2,708 | ) | (7,457 | ) | |||||||
| Corporate Office Expenses |
(14,047 | ) | (12,538 | ) | (12,737 | ) | ||||||
| Operating Income (Loss) from Continuing Operations |
$ | 4,638 | $ | (17,779 | ) | $ | (9,601 | ) | ||||
Operating results in 2010 were impacted by a net gain on sale of a product line of $2.5 million in the Performance Materials segment. Operating results in 2009 for the Thermal/Acoustical segment were impacted by restructuring related charges of $5.8 million. Operating results in 2008 for the Thermal/Acoustical segment were impacted by a goodwill impairment charge of $12.2 million and restructuring related charges of $1.6 million. Operating results for Affinity in 2008 were impacted by impairment charges of $5.2 million.
Total assets by segment and for OPS and the Corporate Office were as follows at December 31, 2010 and 2009:
| Total Assets | |
December 31, |
| |||||
| In thousands | 2010 | |
Revised 2009 |
| ||||
| Performance Materials Segment |
$ | 74,895 | $ | 75,192 | ||||
| Thermal/Acoustical Segment |
122,572 | 113,733 | ||||||
| Other Products and Services |
20,690 | 18,914 | ||||||
| Corporate Office |
13,731 | 16,513 | ||||||
| Total Assets |
$ | 231,888 | $ | 224,352 | ||||
Total capital expenditures and depreciation and amortization by segment and for OPS and the Corporate Office for the years ended December 31, 2010, 2009 and 2008 were as follows:
| |
Capital Expenditures |
|
|
Depreciation & Amortization |
| |||||||||||||||||||
| In thousands | 2010 | 2009 | 2008 | 2010 |
|
Revised 2009 |
|
|
Revised 2008 |
| ||||||||||||||
| Performance Materials Segment |
$ | 3,825 | $ | 2,542 | $ | 5,022 | $ | 5,340 | $ | 5,572 | $ | 4,462 | ||||||||||||
| Thermal/Acoustical Segment |
6,988 | 1,430 | 5,542 | 7,708 | 8,487 | 9,277 | ||||||||||||||||||
| Other Products and Services |
724 | 1,935 | 1,383 | 868 | 713 | 905 | ||||||||||||||||||
| Corporate Office |
464 | 14 | 90 | 491 | 1,118 | 1,487 | ||||||||||||||||||
| Total |
$ | 12,001 | $ | 5,921 | $ | 12,037 | $ | 14,407 | $ | 15,890 | $ | 16,131 | ||||||||||||
Net sales by geographic area for the years ended December 31, 2010, 2009 and 2008 and long-lived asset information by geographic area as of December 31, 2010 and 2009 were as follows:
| |
Net Sales |
|
|
Long-Lived Assets |
| |||||||||||||||
| In thousands | 2010 | 2009 | 2008 | 2010 |
|
Revised 2009 |
| |||||||||||||
| United States |
$ | 215,572 | $ | 152,652 | $ | 187,186 | $ | 69,493 | $ | 70,314 | ||||||||||
| France |
51,079 | 37,779 | 45,608 | 16,158 | 22,779 | |||||||||||||||
| Germany |
65,055 | 53,879 | 71,011 | 18,757 | 18,349 | |||||||||||||||
| Other |
6,301 | 4,637 | 1,911 | 11,449 | 12,923 | |||||||||||||||
| Total |
$ | 338,007 | $ | 248,947 | $ | 305,716 | $ | 115,857 | $ | 124,365 | ||||||||||
F-26
Table of Contents
Foreign sales are based on the country in which the sales originated (i.e., where the legal entity is domiciled).
Sales to Ford Motor Company in 2010 and 2009 were $35.0 million and $24.1 million, respectively. Sales to Chrysler and Volkswagen in 2008 were $32.4 million and $30.3 million, respectively. These sales were reported in the Thermal/Acoustical segment. No other customers accounted for more than 10% of total net sales in 2010, 2009, or 2008.
14. Income Taxes
The provision for income taxes from continuing operations consists of the following:
|
|
For the years ended December 31, |
| ||||||||||
| In thousands | 2010 | |
Revised 2009 |
|
|
Revised 2008 |
| |||||
| Current: |
||||||||||||
| Federal |
$ | (1,353 | ) | $ | (3,440 | ) | $ | 537 | ||||
| State |
(24 | ) | 209 | 225 | ||||||||
| Foreign |
2,131 | 561 | 918 | |||||||||
| Total current |
754 | (2,670 | ) | 1,680 | ||||||||
| Deferred: |
||||||||||||
| Federal |
(1,242 | ) | (333 | ) | (5,333 | ) | ||||||
| State |
735 | (479 | ) | (377 | ) | |||||||
| Foreign |
940 | (307 | ) | 142 | ||||||||
| Total deferred |
433 | (1,119 | ) | (5,568 | ) | |||||||
| Provision for income taxes |
$ | 1,187 | $ | (3,789 | ) | $ | (3,888 | ) | ||||
The following is a reconciliation of the difference between the actual provision for income taxes from continuing operations and the provision computed by applying the federal statutory tax rate on earnings:
|
|
For the years ended December 31, |
| ||||||||||
| In thousands | 2010 | |
Revised 2009 |
|
|
Revised 2008 |
| |||||
| Statutory federal income tax rate |
34.0 | % | 34.0 | % | 34.0 | % | ||||||
| State income taxes, including valuation allowances |
15.8 | 1.0 | 3.2 | |||||||||
| Impact of recognition of foreign deferred tax assets |
(1.8 | ) | 0.3 | 3.7 | ||||||||
| Valuation allowances for deferred tax assets |
77.5 | (13.8 | ) | — | ||||||||
| Reserve for tax contingencies |
(5.3 | ) | 1.7 | (0.3 | ) | |||||||
| Adjustments from tax provision to final returns |
0.7 | 0.9 | 0.5 | |||||||||
| IRC Section 987 loss |
(101.3 | ) | — | — | ||||||||
| France tax law change |
4.2 | — | — | |||||||||
| Other |
6.4 | (3.5 | ) | (1.9 | ) | |||||||
| Effective income tax rate |
30.2 | % | 20.6 | % | 39.2 | % | ||||||
The other line item above includes mainly non-deductible expenditures such as meals and entertainment and stock based compensation expense for incentive stock options and other non-taxable income and expense items.
The Company’s effective tax rate from continuing operations for 2010 was 30.2% compared to 20.6% in 2009 and 39.2% in 2008. For 2010, the Company’s effective tax rate was significantly impacted by a tax benefit of $4.0 million associated with a change in assertion regarding unremitted foreign earnings related to its German branch. This was nearly offset by valuation allowances against certain foreign tax credits, U.S. federal and state net operating losses, and other U.S. net deferred tax assets, which generated tax expense of $3.8 million in 2010. The impact of those two items and a reduction in reserves for unrecognized tax benefits primarily contributed to the Company’s effective tax rate differing from the statutory federal income tax rate in 2010.
F-27
Table of Contents
During the third quarter of 2010, the Company elected to change its assertion regarding unremitted foreign earnings related to its German branch. Under this election, the Company asserts that undistributed earnings of the branch are no longer indefinitely reinvested, but are available for remittance to Lydall, Inc. Implementing this change required that the Company assume that the assertion was reversed at the beginning of the fiscal year and compute the effect of currency translations from branch inception through January 1, 2010 using exchange rates prevailing during the time that income was earned or remittances were made. The tax impact of the resulting currency translation adjustment is reflected in the Company’s effective tax rate and generated an IRC Section 987 tax benefit of $4.0 million in 2010. This benefit resulted from the German branch having incurred losses during periods of time when the U.S. Dollar exchange rates were less favorable compared to the Deutsch Mark and Euro and profits were earned during periods when the U.S. Dollar was strong against the Euro.
During 2010, the Company recorded additional valuation reserves against certain foreign tax credits, federal and state net operating losses, and other U.S. net deferred tax assets, which generated tax expense of $3.8 million. The reserves reflect the Company’s assessment that the future realization of such tax benefits is not reasonably assured. The Company determined it would carry-back its 2010 taxable loss to prior years. As a result, at December 31, 2010, an income tax receivable of $1.1 million was recorded in anticipation of a cash refund expected to be received in 2011. This carry-back allowed foreign tax credits previously utilized by the Company to become available for future use. An analysis was performed of the expected future realization of these foreign tax credits and credits generated in 2010 before their expiration and, as a result, the Company recorded an income tax charge of $2.0 million in 2010 to record a valuation allowance on the available foreign tax credits for which their future realization was not reasonably assured. In addition, the Company is in a cumulative three year loss in the U.S. and, as a result, a valuation allowance of $1.8 million was recorded against the federal and state net deferred tax assets as of December 31, 2010.
An income tax charge in 2009 to record valuation allowances on foreign tax credits primarily contributed to the effective tax rate differing from the statutory federal income tax rate in 2009. The Company determined it would carry-back its 2009 taxable loss to prior years. As a result, at December 31, 2009, an income tax receivable of $3.2 million was recorded in anticipation of a cash refund, which was subsequently received in 2010. This carry-back allowed foreign tax credits previously utilized by the Company to become available for future use. An analysis was performed of the expected future realization of these foreign tax credits before their expiration and, as a result, the Company recorded an income tax charge of $2.5 million in 2009 to record a valuation allowance on the available foreign tax credits for which their future realization was not reasonably assured.
The following schedule presents net current and net long-term deferred tax assets and liabilities by tax jurisdiction as of December 31, 2010 and 2009:
| |
2010 |
|
|
2009 |
| |||||||||||
| |
Deferred Tax Assets |
|
|
Deferred Tax Assets |
| |||||||||||
| In thousands | Current | Long-term | Current | Long-term | ||||||||||||
| Federal |
$ | 1,116 | $ | — | $ | 726 | $ | — | ||||||||
| State |
42 | — | 158 | 13 | ||||||||||||
| Foreign |
164 | 1,453 | 735 | 2,758 | ||||||||||||
| Totals |
$ | 1,322 | $ | 1,453 | $ | 1,619 | $ | 2,771 | ||||||||
| |
2010 |
|
|
Revised 2009 |
| |||||||||||
| |
Deferred Tax Liabilities |
|
|
Deferred Tax Liabilities |
| |||||||||||
| In thousands | Current | Long-term | Current | Long-term | ||||||||||||
| Federal |
$ | — | $ | 4,381 | $ | — | $ | 5,238 | ||||||||
| State |
— | 612 | — | — | ||||||||||||
| Foreign |
34 | 367 | — | 1,119 | ||||||||||||
| Totals |
$ | 34 | $ | 5,360 | $ | — | $ | 6,357 | ||||||||
F-28
Table of Contents
The net deferred tax liabilities consist of the following as of December 31, 2010 and 2009:
| |
December 31, |
| ||||||
| In thousands | 2010 | |
Revised 2009 |
| ||||
| Deferred tax assets: |
||||||||
| Accounts receivable |
$ | 146 | $ | 180 | ||||
| Inventories |
805 | 796 | ||||||
| Net operating loss carryforwards |
6,199 | 6,865 | ||||||
| Other accrued liabilities |
1,552 | 1,332 | ||||||
| Pension |
4,933 | 5,784 | ||||||
| Tax credits |
7,814 | 4,397 | ||||||
| Total deferred tax assets |
$ | 21,449 | $ | 19,354 | ||||
| Deferred tax liabilities: |
||||||||
| Domestic liability of foreign assets |
$ | 987 | $ | 2,042 | ||||
| Intangible assets |
4,169 | 3,894 | ||||||
| Property, plant and equipment |
9,835 | 9,678 | ||||||
| Other accrued liabilities |
— | 830 | ||||||
| Total deferred tax liabilities |
$ | 14,991 | $ | 16,444 | ||||
| Valuation allowance |
$ | 9,077 | $ | 4,877 | ||||
| Net deferred tax liabilities |
$ | 2,619 | $ | 1,967 | ||||
For the years ended December 31, 2010, 2009 and 2008, income (loss) from continuing operations before income taxes was derived from the following sources:
| |
For the years ended December 31, |
| ||||||||||
| In thousands | 2010 | |
Revised 2009 |
|
|
Revised 2008 |
| |||||
| United States |
$ | (3,751 | ) | $ | (18,246 | ) | $ | (14,021 | ) | |||
| Foreign |
7,677 | (115 | ) | 4,102 | ||||||||
| Total income (loss) from continuing operations before income taxes |
$ | 3,926 | $ | (18,361 | ) | $ | (9,919 | ) | ||||
At December 31, 2010, the Company had approximately $14.0 million of foreign net operating loss carryforwards. The majority of the foreign net operating loss carryforwards have no expiration. The Company had concluded it is more likely than not that the foreign net operating loss carryforwards will be fully realized and no valuation allowance is necessary as of December 31, 2010. The Company will continue to monitor the realization criteria based on future operating results.
At December 31, 2010, the Company had approximately $0.9 million of federal net operating loss carryforwards and approximately $27.6 million of state net operating loss carryforwards. The federal net operating loss carryforwards expire in 2030, while the state net operating loss carryforwards expire between 2011 and 2030. In addition, at December 31, 2010, the Company had $6.2 million of federal tax credit carryforwards that expire between 2015 and 2020 and $1.6 million of state tax credit carryforwards that expire between 2011 and 2025. As of December 31, 2010, the Company had provided a valuation reserve against its federal and state net operating loss carryforwards and tax credit carryforwards, as well as other U.S. net deferred tax assets. The valuation allowance related to all of these deferred tax assets was required as the Company determined that future realization was not reasonably assured. The Company evaluates and weighs the positive and negative evidence present at each period. In arriving at a conclusion, the Company has given significant weight to future projected earnings and historical earnings.
United States income taxes have not been provided on undistributed earnings of international subsidiaries. It is not practicable to estimate the amount of tax that might be payable. The Company’s intention is to reinvest these earnings permanently or to repatriate the earnings only when it is tax effective to do so. Accordingly, the Company believes that any U.S. tax on repatriated earnings would be substantially offset by U.S. foreign tax credits.
The Company and its subsidiaries file a consolidated federal income tax return, as well as returns required by various state and foreign jurisdictions. In the normal course of business the Company is subject to examination by taxing authorities, including such
F-29
Table of Contents
major jurisdictions as the United States, France, Germany and the Netherlands. With few exceptions, the Company is no longer subject to U.S. federal examinations for years before 2006, state and local examinations for years before 2006, and non-U.S. income tax examinations for years before 2007.
A reconciliation of the beginning and ending amount of gross unrecognized tax benefits is as follows:
| In thousands | 2010 | 2009 | ||||||
| Unrecognized tax benefits at beginning of year |
$ | 884 | $ | 1,722 | ||||
| Decreases relating to positions taken in prior periods |
(78 | ) | (454 | ) | ||||
| Increases relating to current period |
101 | 91 | ||||||
| Tax settlements paid |
— | (353 | ) | |||||
| Decreases due to lapse of statute of limitations |
(85 | ) | (122 | ) | ||||
| Unrecognized tax benefits at end of year |
$ | 822 | $ | 884 | ||||
The Company recognizes the interest accrued and the penalties related to unrecognized tax benefits as a component of tax expense. The total amount of accrued interest and penalties as of December 31, 2010 was $0.1 million.
| 15. | Impairments of Goodwill and Long-Lived Assets |
During the fourth quarter of 2010 and 2009, the Company performed its an annual impairment analysis of goodwill in the Performance Materials reporting unit and Vital Fluids reporting unit, included in OPS. The Company concluded that the fair value of these reporting units exceeded their carrying value of net assets. As a result, there was no impairment of goodwill in 2010.
During the fourth quarter of 2008, the Company performed its annual impairment test of its goodwill. In addition, the Company performed an impairment test on certain of its long-lived assets (principally machinery and equipment, and buildings and improvements) due to events and changes in circumstances during the fourth quarter of 2008 that indicated an impairment might have occurred. As a result of this impairment testing, the Company recorded the following impairment charges during the fourth quarter of 2008:
| In thousands | Thermal Acoustical Segment |
Other Products and Services |
Total | |||||||||
| Impairment of goodwill |
$ | 12,160 | $ | 4,219 | $ | 16,379 | ||||||
| Impairment of long-lived assets |
— | 1,030 | 1,030 | |||||||||
| Total impairments |
$ | 12,160 | $ | 5,249 | $ | 17,409 | ||||||
Goodwill
The results of the Company’s goodwill impairment analysis in the fourth quarter of 2008 indicated that there was no remaining implied fair value attributable to the North American automotive (“NA Auto”) goodwill, included in the Thermal/Acoustical segment, or Affinity goodwill, included in OPS. Accordingly, the Company wrote off all of the $12.2 million of NA Auto goodwill and all of the $4.2 million of Affinity goodwill during the fourth quarter of 2008. Both businesses were significantly impacted by reduced demand for their products. The NA Auto business was dramatically impacted by lower consumer demand for automobiles, as well as domestic automakers reporting financial losses, announcing facility closures and other restructuring actions, and concerns about their near-term cash liquidity. The Affinity business continued to be significantly impacted by a slow-down in capital equipment spending in the semiconductor industry. In addition, during the fourth quarter of 2008 there was a sustained decline in Lydall’s stock price. As a result of this decline, the Company’s market capitalization fell significantly below the recorded value of its consolidated net assets. The results of the Company’s goodwill impairment analysis indicated that there was no remaining implied fair value attributable to NA Auto or Affinity goodwill.
Long-Lived Assets
In connection with the triggering events discussed above for the Affinity business, as well as other events, the Company determined that long-lived assets at the Affinity business were impaired by $1.0 million as of December 31, 2008, which represented the difference between the estimated fair value of the asset group compared to the carrying value of the asset group. The fair values of
F-30
Table of Contents
the impaired assets were determined based on market conditions including independent appraisals, the income approach which utilizes cash flow projections, and other factors.
16. Restructuring and Related Costs
In 2009, the Thermal/Acoustical segment completed the consolidation of the NA Auto parts production by transferring all production in Vermont to its North Carolina operation. The Vermont facility manufactured non-fiber based products. All restructuring related charges were incurred in 2008 and 2009 in the Thermal/Acoustical segment, with over 95% recorded in cost of sales. These restructuring expenses primarily included severance related expenses, acceleration of depreciation expense on fixed assets that were not transferred to the North Carolina facility, and facility exit, moving and set-up expenses of equipment transferred from Vermont to North Carolina.
Pre-tax expenses incurred for the restructuring program by type during the years ended December 31, 2009 and December 31, 2008 were as follows:
| In thousands | Severance and Related Expenses |
Accelerated Depreciation |
Facility Exit, Set-up |
Total | ||||||||||||
| December 31, 2009 |
$ | 1,256 | $ | 461 | $ | 4,074 | $ | 5,791 | ||||||||
| December 31, 2008 |
708 | 515 | 344 | 1,567 | ||||||||||||
| Total pre-tax expense |
$ | 1,964 | $ | 976 | $ | 4,418 | $ | 7,358 | ||||||||
No cash outflows were made in 2010 other than the remaining lease payments on the Vermont facility of approximately $0.4 million, which will continue to be made ratably through the third quarter of 2011. Total cash outflows for the restructuring program were $5.4 million in 2009 and $0.3 million in 2008.
17. Commitments and Contingencies
Leases
The Company has operating leases that resulted in expense of $3.6 million in 2010, $4.2 million in 2009 and $3.0 million in 2008. These contracts include building, office equipment, vehicle and machinery leases that require payment of property taxes, insurance, repairs and other operating costs.
In 2010, the Company entered into operating leases for manufacturing equipment at its North American automotive facility included in the Thermal/Acoustical segment. The estimated future minimum payments for this equipment included in the table below are $1.8 million through 2017.
The Company has a capital lease agreement for a high speed manufacturing line at its German operation. The lease has monthly principal and interest payments until 2012. In addition, the Company has a capital lease agreement for the land and building at the St. Nazaire, France operating facility requiring monthly principal and interest payments until 2016 (See Note 6).
Approximate future minimum lease payments under noncancelable leases are:
| |
Payments due by Period |
| ||||||||||
| In thousands | |
Operating Lease Payments |
|
|
Capital Lease Payments |
|
Total | |||||
| 2011 |
$ | 2,832 | $ | 1,430 | $ | 4,262 | ||||||
| 2012 |
2,281 | 940 | 3,221 | |||||||||
| 2013 |
1,117 | 776 | 1,893 | |||||||||
| 2014 |
778 | 683 | 1,461 | |||||||||
| 2015 |
468 | 683 | 1,151 | |||||||||
| Thereafter |
1,147 | 341 | 1,488 | |||||||||
| Total |
8,623 | 4,853 | 13,476 | |||||||||
| Interest on capital leases |
— | (533 | ) | (533 | ) | |||||||
| Total | $ | 8,623 | $ | 4,320 | $ | 12,943 | ||||||
F-31
Table of Contents
Commitments and Contingencies
The Company is, from time to time, subject to governmental audits, proceedings and various litigation relating to matters incidental to its business, including product liability and environmental claims. While the outcome of current matters cannot be predicted with certainty, management, after reviewing such matters and consulting with the Company’s internal and external counsel and considering any applicable insurance or indemnification, does not expect any liability that may ultimately be incurred will materially affect the consolidated financial position, results of operations or cash flows of the Company.
A suit was filed against a subsidiary of the Company on March 31, 2005, in the Vermont Superior Court by a safety equipment supplier, by and through its alleged assignee, a non-employee temporary worker, for personal injuries allegedly suffered by the alleged assignee. The plaintiff alleges that the Company subsidiary removed safety equipment that would have prevented the injury. The Vermont Superior Court granted two motions for partial summary judgment filed by the Company. In December 2007, the plaintiff appealed to the Vermont Supreme Court. The Vermont Supreme Court issued an order on September 4, 2009, overturning the lower Court’s grant of summary judgment in the Company’s favor and remanding the case back to the Superior Court for further proceedings. On August 20, 2010, the Company filed a third party complaint against Stamp Tech asserting claims for breach of contract and negligence related to Stamp Tech’s installation of a safety device on the equipment that allegedly injured the plaintiff. The Company also claims that Stamp Tech is bound to defend and indemnify the Company for the plaintiff’s injuries. Stamp Tech filed an answer denying the Company’s claims on or about October 12, 2010 and a Motion to Dismiss the Company’s Third Party Complaint on January 12, 2011. A trial ready date has been set for March, 2011.
The Company believes that it has meritorious defenses to the above claim and intends to contest it vigorously. While it is not possible to predict or determine the outcome of the claim or to provide possible ranges of losses that may arise, the Company believes the losses associated with this action will not have a material adverse effect on the Company’s consolidated financial position or liquidity, but could possibly be material to its consolidated results of operations of any one period. As of December 31, 2010, there were no reserves recorded by the Company related to this claim because the Company believes a loss is not probable as the claim is without merit.
In addition to the above, from time-to-time the Company is subject to legal proceedings, claims and investigations that arise in the ordinary course of business such as, but not limited to, patent, employment, personal injury, commercial and environmental matters. Although there can be no assurance, the Company is not aware of any matters pending that are expected to be material with respect to the Company’s business, results of operations or cash flows.
By letter dated September 14, 2010, the Company provided notice to the Pension Benefit Guaranty Corporation (the “PBGC”) pursuant to Section 4063(a) of ERISA of the occurrence of a Section 4062(e) event with respect to a Lydall pension plan and requested that the PBGC determine its liability, if any, as a result of the Section 4062(e) event. The Section 4062(e) event relates to the substantial cessation by the Company in the second quarter of 2009 of its operations at its St. Johnsbury, Vermont facility and the resulting separation from employment of greater than 20% of the active participants in a Lydall pension plan. Under Section 4062(e), the PBGC has the authority to require additional contributions to the Plan by the Company or to require the Company to post a bond or fund an escrow in order to secure obligations under the Plan attributable to the separation from employment of the affected employees. The PBGC could also elect not to require any further action by the Company. The Company is currently exchanging information with the PBGC and, at this time, is unable to estimate the impact, if any, on the Company’s cash position. The Company does not expect the resolution of this matter to have a significant impact on its results of operations.
As of December 31, 2010, the Company’s European automotive operation had unconditional purchase obligations of approximately $2.5 million and an additional estimated aluminum commitment of approximately $1.0 million to $1.2 million. This estimated obligation is the portion of the cost for the committed volume of 450 metric tons of aluminum beginning in January 2011 through May 2011, which will be based on the London Metal Exchange (“LME”) average rate. The Company’s NA Auto operation has a purchase obligation of 5.1 million pounds of aluminum which is expected to be used for 2011 production requirements. The portion of the cost that is fixed for this volume commitment is $2.9 million and there is an additional cost estimated of $5.4 million to $6.5 million for 2011, which is priced based on the U.S. Midwest previous month’s average rate.
F-32
Table of Contents
18. Earnings Per Share
The following table provides a reconciliation of weighted-average shares used to determine basic and diluted earnings per share.
| |
For the years ended December 31, |
| ||||||||||
| In thousands | 2010 | 2009 | 2008 | |||||||||
| Basic average common shares outstanding |
16,672 | 16,567 | 16,458 | |||||||||
| Effect of dilutive options and restricted stock awards | 116 | — | — | |||||||||
| Diluted average common shares outstanding | 16,788 | 16,567 | 16,458 | |||||||||
For the years ended December 31, 2010, 2009 and 2008, stock options and restricted stock awards for 1.1 million, 1.0 million and 0.5 million shares of common stock, respectively, were not considered in computing diluted earnings per common share because they were anti-dilutive.
19. Comprehensive Income (Loss)
The following table discloses the balance by classification within accumulated other comprehensive income (loss):
| In thousands | Foreign Currency Translation Adjustment |
Unrealized Gain (Loss) on Derivative Instruments |
Pension Liability Adjustment |
Total Accumulated Other Comprehensive (Loss) Income |
||||||||||||
| Balance at January 1, 2008 |
$ | 9,762 | $ | (67 | ) | $ | (5,443 | ) | $ | 4,252 | ||||||
| Change year-to-date |
(2,174 | ) | 98 | (9,096 | ) | (11,172 | ) | |||||||||
| Balance at December 31, 2008 |
7,588 | 31 | (14,539 | ) | (6,920 | ) | ||||||||||
| Change year-to-date |
1,859 | (10 | ) | 1,716 | 3,565 | |||||||||||
| Balance at December 31, 2009 |
9,447 | 21 | (12,823 | ) | (3,355 | ) | ||||||||||
| Change year-to-date |
(5,279 | ) | (21 | ) | 325 | (4,975 | ) | |||||||||
| Balance at December 31, 2010 |
$ | 4,168 | $ | — | $ | (12,498 | ) | $ | (8,330 | ) | ||||||
20. Quarterly Financial Information (Unaudited)
The following table summarizes quarterly financial results for 2010 and 2009. In management’s opinion, all material adjustments necessary to present fairly the information for such quarters have been reflected.
| 1st Quarter |
2nd Quarter |
3rd Quarter |
4th Quarter |
|||||||||||||||||||||||||||||
| In thousands except per share data | 2010 | 2009 | Revised 2010 |
Revised 2009 |
2010 | Revised 2009 |
2010 | Revised 2009 |
||||||||||||||||||||||||
| Net sales |
$ | 75,579 | $ | 54,333 | $ | 82,880 | $ | 55,981 | $ | 83,752 | $ | 66,090 | $ | 95,796 | $ | 72,543 | ||||||||||||||||
| Gross margin |
$ | 14,006 | $ | 5,993 | $ | 15,797 | $ | 4,040 | $ | 12,448 | $ | 11,261 | $ | 15,622 | $ | 11,710 | ||||||||||||||||
| Net (loss) income |
$ | (471 | ) | $ | (4,520 | ) | $ | 2,083 | $ | (6,019 | ) | $ | 1,516 | $ | (479 | ) | $ | (389 | ) | $ | (3,554 | ) | ||||||||||
| Basic (loss)earnings per share: |
||||||||||||||||||||||||||||||||
| Net (loss) income |
$ | (0.03 | ) | $ | (0.27 | ) | $ | 0.13 | $ | (0.36 | ) | $ | 0.09 | $ | (0.03 | ) | $ | (0.02 | ) | $ | (0.21 | ) | ||||||||||
| Diluted (loss)earnings per share: |
||||||||||||||||||||||||||||||||
| Net (loss) income |
$ | (0.03 | ) | $ | (0.27 | ) | $ | 0.12 | $ | (0.36 | ) | $ | 0.09 | $ | (0.03 | ) | $ | (0.02 | ) | $ | (0.21 | ) | ||||||||||
The Company divested its electrical papers product line business, included in the Performance Materials segment, and recognized a pre-tax gain on sale of $1.7 million in the second quarter of 2010 (See Note 9). The Company reported a tax benefit of $1.8 million in the third quarter of 2010, which included the recognition of a $4.1 million discrete tax benefit as the result of the Company’s election in the third quarter to change its prior assertion regarding unremitted foreign earnings of a foreign branch, which was partially offset by tax expense that included the effective tax rate impact of valuation reserves on certain deferred tax assets. The Company reported tax expense of $2.3 million in the fourth quarter of 2010, which included the impact of additional valuation allowances on certain deferred tax assets of $1.9 million.
F-33
Table of Contents
Restructuring related charges associated with the NA Auto consolidation were $2.1 million in the first quarter of 2009, $3.0 million in the second quarter of 2009 and $0.7 million in the fourth quarter of 2009 (See Note 16).
21. Recently Issued Accounting Standards
In October 2009, the FASB issued guidance on revenue recognition. Under this guidance, if vendor-specific objective evidence or third party evidence of fair value for each deliverable in an arrangement with multiple elements is not available, then the proportion of the selling price attributable to each deliverable may be estimated. This guidance is effective for annual reporting periods beginning after June 15, 2010. The Company early-adopted these standards on April 1, 2010 and retroactively applied these standards as of the beginning of 2010 for new and materially modified arrangements originating after December 31, 2009 (see Footnote 9). Operating income for 2010 was approximately $1.9 million higher than operating income would have been under the previous accounting rules.
In January 2010, the FASB issued guidance on improving disclosures about fair value measurements. This guidance requires reporting entities to make new disclosures about recurring or nonrecurring fair-value measurements including significant transfers into and out of Level 1 and Level 2 fair value measurements and information on purchases, sales, issuances, and settlements on a gross basis in the reconciliation of Level 3 fair value measurements. This guidance is effective for annual reporting periods beginning after December 15, 2009, except for Level 3 reconciliation disclosures which are effective for annual periods beginning after December 15, 2010. The adoption of this guidance has not had and is not expected to have a material effect on the Company’s consolidated financial position, results of operations, or cash flows.
F-34
Table of Contents
LYDALL, INC.
VALUATION AND QUALIFYING ACCOUNTS
FOR THE YEARS ENDED DECEMBER 31, 2010, 2009 AND 2008
| In thousands | Balance at January 1, |
Charges to Costs and Expenses |
Charges (Deductions) |
Deductions | Balance at December 31, |
|||||||||||||||
| 2010 |
||||||||||||||||||||
| Allowance for doubtful receivables |
$ | 1,333 | $ | 258 | $ | (15 | )2 | $ | (631 | )1 | $ | 945 | ||||||||
| Allowance for note receivable |
480 | — | — | — | 480 | 4 | ||||||||||||||
| Tax valuation allowances |
4,877 | 4,335 | — | (135 | )3 | 9,077 | ||||||||||||||
| 2009 |
||||||||||||||||||||
| Allowance for doubtful receivables |
$ | 1,275 | $ | 178 | $ | 6 | 2 | $ | (126 | )1 | $ | 1,333 | ||||||||
| Allowance for note receivable |
480 | — | — | — | 480 | 4 | ||||||||||||||
| Tax valuation allowances |
1,537 | 3,369 | — | (29 | )3 | 4,877 | ||||||||||||||
| 2008 |
||||||||||||||||||||
| Allowance for doubtful receivables |
$ | 1,052 | $ | 471 | $ | (21 | )2 | $ | (227 | )1 | $ | 1,275 | ||||||||
| Allowance for note receivable |
480 | — | — | — | 480 | 4 | ||||||||||||||
| Tax valuation allowances |
1,748 | 148 | — | (359 | )3 | 1,537 | ||||||||||||||
| 1 | Uncollected receivables written off and recoveries. |
| 2 | Foreign currency translation and other adjustments. |
| 3 | Reduction to income tax expense. |
| 4 | A reserve for $0.5 million was recorded during 2004 for the remaining balance of the note receivable associated with the sale of certain assets of the fiberboard operation in 2001, which was included within “Prepaid expenses and other current assets, net” on the Consolidated Balance Sheets as of December 31, 2010 and 2009. |
S-1