Attached files
| file | filename |
|---|---|
| EX-4.8 - EX-4.8 - INTERLINE BRANDS, INC./DE | a2202291zex-4_8.htm |
| EX-31.2 - EX-31.2 - INTERLINE BRANDS, INC./DE | a2202291zex-31_2.htm |
| EX-32.2 - EX-32.2 - INTERLINE BRANDS, INC./DE | a2202291zex-32_2.htm |
| EX-23.1 - EX-23.1 - INTERLINE BRANDS, INC./DE | a2202291zex-23_1.htm |
| EX-31.1 - EX-31.1 - INTERLINE BRANDS, INC./DE | a2202291zex-31_1.htm |
| EX-12.1 - EX-12.1 - INTERLINE BRANDS, INC./DE | a2202291zex-12_1.htm |
| EX-21.1 - EX-21.1 - INTERLINE BRANDS, INC./DE | a2202291zex-21_1.htm |
| EX-32.1 - EX-32.1 - INTERLINE BRANDS, INC./DE | a2202291zex-32_1.htm |
| EX-10.45 - EX-10.45 - INTERLINE BRANDS, INC./DE | a2202291zex-10_45.htm |
| EX-10.12 - EX-10.12 - INTERLINE BRANDS, INC./DE | a2202291zex-10_12.htm |
Use these links to rapidly review the document
TABLE OF CONTENTS
PART IV
UNITED STATES
SECURITIES AND EXCHANGE COMMISSION
WASHINGTON, D.C. 20549
FORM 10-K
| (Mark One) | ||
ý |
ANNUAL REPORT PURSUANT TO SECTION 13 OR 15(d) OF THE SECURITIES EXCHANGE ACT OF 1934 |
|
For the fiscal year ended December 31, 2010 |
||
or |
||
o |
TRANSITION REPORT PURSUANT TO SECTION 13 OR 15(d) OF THE SECURITIES EXCHANGE ACT OF 1934 |
|
For the transition period from to |
||
Commission file number: 001-32380
INTERLINE BRANDS, INC.
(Exact name of registrant as specified in its charter)
| Delaware (State or other jurisdiction of incorporation or organization) |
03-0542659 (I.R.S. Employer Identification No.) |
|
| 701 San Marco Boulevard, Jacksonville, Florida (Address of principal executive offices) |
32207 (Zip Code) |
(904) 421-1400
(Registrant's telephone number, including area code)
Securities registered pursuant to Section 12(b) of the Act:
| Title of Class | Name of each exchange on which registered | |
|---|---|---|
| Common Stock, $.01 par value per share | New York Stock Exchange |
Securities registered pursuant to Section 12(g) of the Act: None
Indicate by check mark if the registrant is a well-known seasoned issuer, as defined in Rule 405 of the Securities Act. Yes o No ý
Indicate by check mark if the registrant is not required to file reports pursuant to Section 13 or Section 15(d) of the Exchange Act. Yes o No ý
Indicate by check mark whether the registrant (1) has filed all reports required to be filed by Section 13 or 15(d) of the Securities Exchange Act of 1934 during the preceding 12 months (or for such shorter period that the registrant was required to file such reports), and (2) has been subject to such filing requirements for the past 90 days. Yes ý No o
Indicate by check mark whether the registrant has submitted electronically and posted on its corporate Web site, if any, every Interactive Data File required to be submitted and posted pursuant to Rule 405 of Regulation S-T during the preceding 12 months (or for such shorter period that the registrant was required to submit and post such files). Yes o No o
Indicate by check mark if disclosure of delinquent filers pursuant to Item 405 of Regulation S-K is not contained herein, and will not be contained, to the best of registrant's knowledge, in definitive proxy or information statements incorporated by reference in Part III of this Form 10-K or any amendment to this Form 10-K. ý
Indicate by check mark whether the registrant is a large accelerated filer, an accelerated filer, a non-accelerated filer or a smaller reporting company. See definitions of "large accelerated filer," "accelerated filer" and "smaller reporting company" in Rule 12b-2 of the Exchange Act.
| Large accelerated filer o | Accelerated filer ý | Non-accelerated filer o (Do not check if smaller reporting company) |
Smaller reporting company o |
Indicate by check mark whether the registrant is a shell company (as defined in Rule 12b-2 of the Exchange Act). Yes o No ý
As of June 25, 2010, the aggregate market value of the registrant's common stock held by non-affiliates of the registrant was $602.7 million based on the closing sale price as reported on the New York Stock Exchange.
As of February 25, 2011, there were 33,319,799 shares of the registrant's common stock outstanding (excluding 168,622 shares held in treasury), par value $0.01.
DOCUMENTS INCORPORATED BY REFERENCE
The registrant's definitive Proxy Statement for its Annual Meeting of Stockholders to be held May 10, 2011 is incorporated by reference in Part III of this Form 10-K.
iii
Forward-Looking Statements
This report contains forward-looking statements within the meaning of Section 27A of the Securities Act of 1933, as amended (the "Securities Act"), and Section 21E of the Securities Exchange Act of 1934, as amended (the "Exchange Act"), that are subject to risks and uncertainties. You should not place undue reliance on those statements because they are subject to numerous uncertainties and factors relating to our operations and business environment, all of which are difficult to predict and many of which are beyond our control. Forward-looking statements include information concerning our possible or assumed future results of operations, including descriptions of our business strategy. These statements often include words such as "may," "believe," "expect," "anticipate," "intend," "plan," "estimate" or similar expressions. These statements are based on assumptions that we have made in light of our experience in the industry as well as our perceptions of historical trends, current conditions, expected future developments and other factors we believe are appropriate under the circumstances. As you read and consider this report, you should understand that these statements are not guarantees of performance or results. They involve risks, uncertainties and assumptions. Although we believe that these forward-looking statements are based on reasonable assumptions, you should be aware that many factors could affect our actual financial results or results of operations and could cause actual results to differ materially from those in the forward-looking statements. These factors include:
- •
- economic slowdowns,
- •
- general market conditions,
- •
- credit market contractions,
- •
- currency exchange rates,
- •
- changes to tariffs between the countries in which we operate,
- •
- labor and benefit costs,
- •
- weather conditions,
- •
- the loss of significant customers,
- •
- failure to realize expected benefits from acquisitions,
- •
- consumer spending and debt levels,
- •
- apartment vacancy rates and effective rents,
- •
- adverse changes in trends in the home improvement and remodeling and home building markets,
- •
- product cost and price fluctuations due to market conditions,
- •
- the highly competitive nature of the maintenance, repair and operations distribution industry,
- •
- material facilities and systems disruptions and shutdowns,
- •
- governmental and educational budget constraints,
- •
- fluctuations in the cost of commodity-based products, raw materials and fuel prices,
- •
- our ability to purchase products from suppliers on favorable terms,
- •
- failure to identify, acquire and successfully integrate acquisition candidates,
- •
- the length of our supply chains,
- •
- work stoppages or other business interruptions at transportation centers or shipping ports,
1
- •
- our ability to accurately predict market trends,
- •
- dependence on key employees,
- •
- healthcare costs,
- •
- our inability to protect trademarks,
- •
- adverse publicity and litigation,
- •
- our level of debt,
- •
- interest rate fluctuations,
- •
- our customers' ability to pay us,
- •
- future cash flows,
- •
- changes in consumer preferences, and
- •
- the other factors described under "Part I. Item 1A—Risk Factors" in this Annual Report on Form 10-K.
You should keep in mind that any forward-looking statement made by us in this report, or elsewhere, speaks only as of the date on which we make it. New risks and uncertainties arise from time to time, and it is impossible for us to predict these events or how they may affect us. In light of these risks and uncertainties, you should keep in mind that any forward-looking statement made in this report or elsewhere might not occur. Notwithstanding the foregoing, all information contained in this report is materially accurate as of the date of this report.
Our Company
We are a leading distributor and direct marketer of maintenance, repair and operations ("MRO") products. We have one operating segment, the distribution of MRO products. We stock approximately 100,000 MRO products in the following categories: janitorial and sanitation ("JanSan"); plumbing; heating, ventilation and air conditioning ("HVAC"); hardware, tools and fixtures; electrical and lighting; appliances and parts; security and safety; and other miscellaneous products. Our products are primarily used for the repair, maintenance, remodeling, refurbishment and construction of properties and non-industrial facilities.
Our highly diverse customer base includes facilities maintenance customers, which consist of multi-family housing facilities, educational institutions, lodging and healthcare facilities, government properties and building services contractors; professional contractors who are primarily involved in the repair, remodeling and construction of residential and non-industrial facilities; and specialty distributors, including plumbing and hardware retailers. Our customers range in size from individual contractors and independent hardware stores to apartment management companies and national purchasing groups.
We market and sell our products primarily through thirteen distinct and targeted brands, each of which is recognized in the markets they serve for providing quality products at competitive prices with reliable same-day or next-day delivery. The Wilmar®, AmSan®, CleanSource®, Sexauer®, Maintenance USA® and Trayco® brands generally serve our facilities maintenance customers; the Barnett®, Copperfield®, U.S. Lock®, and SunStar® brands generally serve our professional contractor customers; and the Hardware Express®, LeranSM and AF LightingSM brands generally serve our specialty distributors customers. Our multi-brand operating model, which we believe is unique in the industry, utilizes a single distribution platform to deliver tailored products and services to meet the individual
2
needs of each respective customer group served. We reach our markets using a variety of sales channels, including a sales force of approximately 650 field sales representatives, approximately 350 telesales and customer service representatives, a direct marketing program consisting of catalogs and promotional flyers, brand-specific websites and a national accounts sales program.
We deliver our products through our network of 57 distribution centers, 25 professional contractor showrooms located throughout the United States, Canada and Puerto Rico, 38 vendor-managed inventory locations at large professional contractor customer locations and a dedicated fleet of trucks. Our broad distribution network enables us to provide reliable, next-day delivery service to approximately 98% of the U.S. population and same-day delivery service to most major metropolitan markets in the U.S.
Our information technology and logistics platforms support our major business functions, allowing us to market and sell our products at varying price points depending on the customer's service requirements. While we market our products under a variety of brands, generally our brands draw from the same inventory within common distribution centers and share associated employee and transportation costs. In addition, we have centralized marketing, purchasing, catalog production operations, and certain other services that support our brands. We believe that our information technology and logistics platform also benefits our customers by allowing us to offer a broad product selection at highly competitive prices while maintaining the unique customer appeal of each of our targeted brands. Overall, our common operating platform has enabled us to improve customer service, maintain lower operating costs, efficiently manage working capital and support our growth initiatives.
In this document, unless otherwise indicated, "we," "us," "our" and the "Company" refer to Interline Brands, Inc., a Delaware corporation incorporated in 2004, and its consolidated subsidiaries; and "Interline New Jersey" refers to Interline Brands, Inc., a New Jersey corporation incorporated in 1978, through which we conduct our business.
Acquisitions
On October 29, 2010, Interline New Jersey acquired substantially all of the assets and a portion of the liabilities of CleanSource, Inc. ("CleanSource") for $54.6 million in cash and an earn-out of up to $5.5 million in cash over two years. CleanSource, which is headquartered in San Jose, California, is a large regional distributor of JanSan supplies. CleanSource offers over 4,000 products and primarily serves institutional facilities in the healthcare and education markets, as well as building services contractors. This acquisition represents a geographical expansion of the Company's offering of JanSan products to the West Coast of the United States.
On January 28, 2011, Interline New Jersey acquired substantially all of the assets and a portion of the liabilities of Northern Colorado Paper, Inc. ("NCP") for $9.5 million in cash and an earn-out of up to $0.3 million in cash over two years. The Company has not completed the allocation of the purchase price. NCP, which is headquartered in Greeley, Colorado, is a regional distributor of JanSan supplies, primarily serving institutional facilities in the healthcare, education and food service industries.
Refinancing Transactions
On November 16, 2010, Interline New Jersey completed a series of refinancing transactions: (1) an offering of $300.0 million of 7.00% senior subordinated notes due 2018 (the "7.00% Notes") and (2) entering into a $225.0 million asset-based revolving credit facility (the "ABL Facility"). The proceeds from the 7.00% Notes were used to redeem the 81/8% senior subordinated notes due 2014 (the "81/8% Notes") and to repay the indebtedness under the prior credit facility.
For more information about these refinancing transactions, see "Management's Discussion and Analysis of Financial Condition and Results of Operations—Overview—Refinancing Transactions,"
3
"Management's Discussion and Analysis of Financial Condition and Results of Operations—Liquidity and Capital Resources" and Note 10. Debt to our audited consolidated financial statements included in this report.
Strategy
Our objective is to become the leading supplier of MRO products to our three principal end-markets: facilities maintenance, professional contractors and specialty distributors. In pursuing this objective, we plan to increase our net sales, earnings and return on invested capital by capitalizing on our information technology and logistics platforms to successfully execute our organic growth, geographic expansion, operating efficiency and strategic acquisition initiatives.
- •
- Organic Growth Initiatives. We seek to further penetrate
the markets we serve, and to expand into new product areas, by utilizing and increasing our already successful new product and marketing strategies, including: growing web-based sales
capabilities; targeted new customer acquisition; expanding our national accounts program; increasing customer use of our supply chain management services; continuing to develop proprietary products
under our exclusive brands; and selectively adding new products and new categories to our various brand offerings.
- •
- Geographic Expansion Opportunities. We believe we can
further penetrate the markets we serve and expand into new markets by increasing the number of our field sales and telesales territories to serve additional sales regions and other initiatives.
- •
- Operating Efficiencies. We will continue to focus on
enhancing our operating efficiency, which will increase profitability, improve our cash conversion cycle and increase our return on capital.
- •
- Acquisitions. We will continue to maintain a disciplined acquisition strategy of adding new customers and/or product offerings in currently served markets and pursuing acquisitions of established brands in new or existing markets in an effort to further leverage our operating infrastructure.
Industry and Market Overview
The MRO distribution industry in the U.S. and Canada is over $550 billion in size according to MRO market analyses by Modern Distribution Management ("MDM"), a trade company specializing in wholesale distribution, and Industrial Marketing Information, Inc. ("IMI"), a market research company specializing in quantification of the industrial business-to-business markets. The MRO distribution industry encompasses the supply of a wide range of products, including plumbing and electrical supplies, hand-tools, janitorial supplies, safety equipment and many other categories. Customers served by the MRO distribution industry include heavy industrial manufacturers that use MRO supplies for the repair and overhaul of production equipment and machinery; owners and managers of facilities such as apartment complexes, office buildings, schools, hotels and hospitals that use MRO supplies largely for maintenance, repair and refurbishment; and professional contractors.
Within the MRO distribution industry, we focus on serving customers in three principal end-markets: facilities maintenance, professional contractors and specialty distributors. Our customers are primarily engaged in the repair, maintenance, remodeling, refurbishment and construction of properties and non-industrial facilities, as opposed to the maintenance of heavy industrial facilities and machinery. Our facilities maintenance customers are individuals and entities responsible for the maintenance and repair of various commercial properties, including apartment buildings, schools, hotels and healthcare facilities, among others. Our professional contractor customers buy our products to provide plumbing, electrical, HVAC and mechanical services to their residential and commercial customers. Our specialty distributor customers consist primarily of hardware stores and small plumbing and electrical distributors that purchase our products for resale. According to the MDM/IMI MRO
4
market analyses, the size of our addressable end-markets, which generally exclude new commercial and residential construction and heavy industrial manufacturing, is approximately $80 billion.
Our Brands
We market and sell products to our customers primarily through thirteen distinct and targeted brands: Wilmar, AmSan, Barnett, CleanSource, Sexauer, Hardware Express, Copperfield, Maintenance USA, U.S. Lock, SunStar, Leran, Trayco and AF Lighting. Each of our brands is focused on serving a particular customer group. The Wilmar, AmSan, CleanSource, Sexauer, Maintenance USA and Trayco brands generally serve facilities maintenance customers; the Barnett, Copperfield, U.S. Lock and SunStar brands generally serve our professional contractor customers; and the Hardware Express, Leran and AF Lighting brands generally serve our specialty distributor customers. Our brands are distinguished not only by the type of products offered, but also by the levels of service provided to customers. We have brands that market a wide range of product categories, such as Wilmar, as well as brands that specialize in a particular group of products, such as U.S. Lock, which focuses on security hardware, SunStar, which focuses on specialty lighting, and Copperfield, which focuses on chimney repair and maintenance products. We have brands that market complementary services to our customers, including inventory management and technical assistance, and brands that offer products without support services. We believe that our brand-based business model effectively allows us to offer a deep product offering to very targeted customer end-markets. We have core competencies in the sales channels available to a distributor, including national accounts sales professionals, field sales representatives, outbound and inbound telesales and customer service representatives, direct marketing via catalog and flyers, professional contractor showrooms, vendor-managed inventory locations, and internet-based sales and service capabilities. This allows us to effectively compete for a broad range of customers across our industry by offering our customers the service and delivery platform they prefer and often require.
Facilities Maintenance Brands
We serve our facilities maintenance customers primarily through our Wilmar, AmSan, CleanSource, Sexauer, Maintenance USA and Trayco brands. Facilities maintenance customers buy our products for maintenance, repair and remodeling, and often need to obtain products with minimal delay. In many cases, our facilities maintenance customers also look to us for support services such as inventory management, technical advice and assistance, drop ship products and equipment servicing and training.
Wilmar. Our Wilmar brand markets and sells maintenance products to the multi-family housing market. Through its master catalog, Wilmar is able to act as a one-stop shopping resource for multi-family housing maintenance managers by offering one of the industry's most extensive selections of standard and specialty plumbing, hardware, electrical, janitorial and related products. Wilmar provides same-day or next-day delivery in local markets on our own trucks served by our distribution centers, and ships by parcel delivery services or other carriers to other areas. The Wilmar brand sells primarily through field sales representatives, as well as through its website, direct marketing and telesales. We also have a successful national accounts program at Wilmar where national accounts managers market to senior officers at real estate investment trusts and other property management companies. Through this program, we assist large multi-location customers in reducing total supply chain costs.
AmSan. Our AmSan brand markets and sells a comprehensive range of JanSan products to institutional facilities, such as schools and universities, healthcare sites, lodging and government properties and building services contractors. We sell JanSan products primarily through field sales representatives supported by a full line catalog and website, which include national brand product offerings as well as AmSan's exclusive brand product line Renown™. In addition, AmSan provides customers with reliable technical support, equipment repair services, and customized training programs,
5
all of which make AmSan an important supplier to our customers. AmSan provides same-day or next-day delivery in local markets served by our distribution centers and ships by parcel delivery services or other carriers to other areas.
CleanSource. Our CleanSource brand markets and sells a comprehensive range of JanSan products to institutional facilities, such as schools, healthcare sites, lodging and government properties and building services contractors. We sell JanSan products primarily through field sales representatives supported by a catalog and website, which include national brand product offerings and certain exclusive brands. CleanSource field sales representatives are trained and experienced in developing customer-focused solutions based on a careful analysis of each customer's unique facility, providing better results and total value.
Sexauer. Our Sexauer brand markets and sells specialty plumbing and facility maintenance products to institutional customers, including education, lodging, healthcare and other facilities maintenance customers. We believe that the catalog of Sexauer products is well known in the industry as a comprehensive source of specialty plumbing and facility maintenance products. In addition to a broad product portfolio, Sexauer offers customers an extensive selection of service and procurement solutions, through its catalog and website, drawing upon our product and supply management expertise.
Maintenance USA. Our Maintenance USA brand markets and sells a broad portfolio of MRO products to facilities, including multi-family housing, lodging and institutional customers. Maintenance USA sells our products primarily through telesales and direct marketing supplemented by its website, representing a low-cost supply alternative to property managers and customers requiring a reduced level of support services.
Trayco. Our Trayco brand markets and sells an extensive inventory of specialty plumbing items as well as a wide array of other facilities maintenance products. Trayco specializes in hard-to-find items and provides access to hundreds of manufacturers. Trayco sells its products through the use of a catalog and field sales personnel.
Professional Contractor and Specialty Distributor Brands
We serve our professional contractor customers primarily through our Barnett, Copperfield, U.S. Lock and SunStar brands and our specialty distributor customers primarily through our Hardware Express, Leran and AF Lighting brands. Professional contractors generally purchase our products for specific job assignments and/or to resell the product to end-customers.
Barnett. Our Barnett brand markets and sells a broad range of MRO products to professional contractors, including plumbing, electrical, building and HVAC contractors, typically for repair, remodeling and construction applications. The Barnett brand also sells its products to specialty distributors, which are generally smaller and carry fewer products than Barnett. The brand sells its products through a catalog, supplemented by its website, direct marketing, telesales and field sales representatives in select markets throughout the United States. Customers can also receive technical support and assistance in selecting products by calling our customer service centers. In addition to next-day delivery, Barnett also offers customers the convenience of a network of local professional contractor showrooms, or Pro Centers, as well as on-site, vendor-managed, inventory capabilities.
Hardware Express. Our Hardware Express brand markets and sells our full range of products primarily to retail hardware stores. While Hardware Express customers may order our products for general inventory purposes, we also specialize in working with independent stores to sell our exclusive brand products through custom designed retail display sets. We believe that our retail hardware store customers prefer our exclusive brand products because they are priced more competitively than non-exclusive brand products. In addition, our retail display program enables our hardware suppliers to
6
present an entire line of products in a professional and organized manner. Hardware Express sells its products through a catalog, supplemented by its website, direct marketing, telesales and a specialty display sales program of exclusive brand products which is coordinated by field sales representatives.
Copperfield. Our Copperfield brand markets and sells specialty ventilation and chimney maintenance products to chimney professionals and hearth retailers, through its website, direct marketing, outbound telesales and field sales representatives. Copperfield offers more than 5,000 brand name and exclusive brand repair and replacement items including chimney replacement and relining products, specialty ventilation components, hearth products, gas and electrical appliances and an assortment of gas and solid fuel burning appliances.
U.S. Lock. Our U.S. Lock brand markets and sells security hardware products to professional locksmiths. Our primary marketing vehicle for U.S. Lock products is our U.S. Lock dealer program, in which professional locksmiths receive incentives such as rebates based on annual purchase volumes and favored pricing on proprietary items in return for paying an annual membership fee, displaying our U.S. Lock logo in their stores and assisting in other promotional activities. Sales are made primarily through telesales and direct marketing, supplemented by its website.
Leran. Our Leran brand markets and sells an extensive line of propane, plumbing, HVAC, electrical and hardware products including copper tubing and brass fittings as well as appliances and water heaters to professional contractors. Leran sells its products through the use of a catalog supplemented by telesales personnel and its website.
SunStar/AF Lighting. Our SunStar and AF Lighting brands market and sell residential lighting and electrical products to electrical contractors, electrical distributors, lighting showrooms and mass merchants through direct marketing, outbound telesales and a network of manufacturer's representatives, supplemented by its website.
Our Products
We stock approximately 100,000 standard and specialty MRO products in a number of categories, including: JanSan; plumbing; HVAC; hardware, tools and fixtures; electrical and lighting; appliances and parts; security and safety; and other miscellaneous products. We offer a broad range of brand name and exclusive brand products.
Product Categories
The approximate percentages of our net sales for the fiscal year ended December 31, 2010 by principal product category were as follows:
Product Category
|
Percent of Net Sales |
||||
|---|---|---|---|---|---|
Janitorial and sanitation |
28 | % | |||
Plumbing |
24 | ||||
Heating, ventilation and air conditioning |
12 | ||||
Hardware, tools and fixtures |
11 | ||||
Electrical and lighting |
6 | ||||
Appliances and parts |
6 | ||||
Security and safety |
6 | ||||
Other |
7 | ||||
Total |
100 | % | |||
7
The following is a discussion of our principal product categories:
Janitorial and Sanitation. Our comprehensive selection of JanSan products includes brooms, mops, trash can liners, cleaning chemicals, paper towels, bath tissue and other products. We offer a number of products from leading JanSan manufacturers, such as Kimberly-Clark and Georgia-Pacific. We also offer exclusive brand JanSan products under our Renown brand.
Plumbing. We sell a broad range of plumbing products, from individual faucet parts to complete bathroom renovation kits. In addition, we sell both brand name and exclusive brand products. For example, we sell brand name products from manufacturers including Kohler, Moen and Delta. We also sell exclusive brand plumbing products under various proprietary trademarks, including Premier faucets and water heaters, DuraPro tubular products and ProPlus retail plumbing accessories.
Heating, Ventilation and Air Conditioning. We offer a variety of HVAC products, including condensing units, thermostats, fans and motors under both name brand and exclusive brand names. Manufacturers include Goodman, Nordyne and Honeywell. We also offer specialty ventilation and chimney maintenance products through our Copperfield brand.
Hardware, Tools and Fixtures. We sell a variety of hardware products, tools and fixtures, including hinges, power tools and mini blinds, and a limited selection of cabinetry, doors and windows. Our brand name products include DeWalt, Channellock, Milwaukee Tool and Sunco. Our exclusive brand hardware products include Yukon, Legend and Anvil Mark.
Electrical and Lighting. Our comprehensive selection of electrical and lighting products ranges from electrical wire and breakers to light fixtures and light bulbs. We offer brand name products from leading electrical supply manufacturers, including Eaton, Sylvania and Leviton, as well as a number of exclusive brand electrical products, such as Preferred Industries.
Appliances and Parts. Our comprehensive range of appliances and parts includes stoves, washer/dryer components, garbage disposers, refrigerators and range hoods. We sell a number of brand name products of leading appliance manufacturers, including General Electric. We also sell a number of high-quality replacement parts from a number of different suppliers.
Security and Safety. We sell a broad range of security hardware products, from individual lock-sets to computerized master-key systems. We sell a number of brand name products of leading security hardware manufacturers, including Kwikset and Schlage. We also sell a number of exclusive brand security hardware products, such as U.S. Lock hardware, Legend locks and Rx master keyways. We sell a variety of safety products, ranging from safety detection devices, such as smoke detectors, to personal protection items, including gloves and masks.
Exclusive Brand Products
Our size and reputation have enabled us to develop and market various lines of exclusive brand products, which we believe offer our customers high-quality, low-cost alternatives to the brand name products we sell. Third-party manufacturers, primarily in Asia and the United States, using our proprietary branding and packaging design, manufacture our exclusive brand products to our specifications. Our sales force, catalogs, brand-specific websites and promotional flyers emphasize the comparative value of our exclusive brand products. Since our exclusive brand products are typically less expensive for us to purchase from suppliers, we are able to improve our profit margin with the sale of these products while offering lower prices to our customers. In addition, we have found that we develop strong relationships with our exclusive brand customers and generate increased repeat business, as exclusive brand customers generally return to us for future service and replacement parts on previously purchased products.
8
New Product Offerings
We constantly monitor and evaluate our product offerings both to assess the sales performance of our existing products and to discontinue products that fail to meet specified sales criteria. We also create new product offerings in response to customer requirements by adjusting our product portfolio within existing product lines as well as by establishing new product line categories. These categories can either be new to Interline or new to a brand. For example, as we enhance our brand-specific websites, we are able to make available products not yet offered in our catalogs. Through these efforts, we are able to sell more products to existing customers as well as address our customers' changing product needs and thereby retain and attract customers. Further, by introducing new product lines, we provide our customers with additional opportunities for cost savings and a one-stop shopping outlet with broad product offerings. We believe that introducing new products in existing product lines and creating new product lines are both strategies which enable us to increase penetration of existing customer accounts, as well as attract new customers to our brands.
Sales and Marketing
We market our products through a variety of channels. The majority of our sales to facilities maintenance customers are made through field sales representatives, and the majority of our sales to professional contractors and specialty distributors are made through telesales supported by catalogs and promotional mailings, and field sales in major metropolitan markets. We also serve our customers with brand-specific websites.
As MRO customers grow in size, their supply chains often become increasingly complex and difficult to manage. In many cases, customers have no view into or control over their product spend, inventory shrinkage, and indirect MRO personnel costs. To meet these needs, we offer a range of sophisticated supply chain management solutions designed to solve the unique problems of each of our customers. By offering customers services beyond fulfillment such as product standardization, vendor consolidation, inventory management, product training, and electronic invoicing, we provide a suite of services that can be utilized either individually or as a group based upon the customer's size and supply chain complexity. Our customers rely upon us as a supply chain partner rather than a vendor and in turn realize significant benefits by reducing overall product spend, improving inventory management, and lowering their indirect MRO spend. As supply chain partners, we seek to become our customers' single source for MRO supplies and knowledge.
Our marketing strategy involves targeting our marketing channels and efforts to specific customer groups. As a result of our long-standing relationships with customers, we have been able to assemble a database of customer purchasing information, such as end-market purchasing trends, product and pricing preferences and support service requirements. In addition, we are able to track information such as customer retention and reactivation as well as new account acquisitions. We are also able to track the success of a particular marketing effort once it is implemented by analyzing the purchases of the customers targeted by that effort. Our information technology allows us to use this data to develop more effective sales and marketing programs. For example, our understanding of the preferences of our large, multi-family housing customers led to our development of a national accounts program through which field sales representatives focus on developing contacts with national accounts. We will continue to leverage our customer knowledge and shared brand information technology to develop successful print and website-based sales and marketing strategies.
Field Sales Representatives
Our direct sales force markets and sells to all levels of the customer's organization, including senior property management executives, local and regional property managers, on-site maintenance managers, and owners and managers of professional plumbing, electrical and HVAC contractors. Our
9
direct sales force marketing efforts are designed to establish and solidify customer relationships through frequent contact, while emphasizing our broad product selection, e-commerce capabilities, reliable delivery of our products, high level of customer service and competitive pricing.
We maintain one of the largest direct sales forces in our industry, with approximately 650 field sales representatives covering markets throughout the United States, Canada and Central America. We have found that we obtain a greater percentage of our customers' overall spending on MRO products in markets serviced by local sales representatives, particularly in regions where these representatives are supported by a nearby distribution center that enables same-day or next-day delivery of our products.
Our field sales representatives are expected not only to generate orders, but also to act as problem-solving customer service representatives. Our field sales representatives are trained and qualified to assist customers in shop organization, special orders, part identification and complaint resolution. We compensate the majority of our field sales representatives based on a commission program or on a combination of salary and bonus program. We will continue to seek additional opportunities where we can leverage the strength of our field sales force to generate additional sales from our customers.
Telesales
Our telesales operation has been designed to make ordering our products as convenient and efficient as possible. We divide our telesales staff into outbound and inbound groups. Our outbound telesales representatives are responsible for maintaining relationships with existing customers and prospecting for new customers. These representatives are assigned individual accounts in specified territories and have frequent contact with existing and prospective customers in order to make telesales presentations, notify customers of current promotions and encourage additional purchases. Our inbound telesales representatives are trained to process orders quickly from existing customers, provide technical support and expedite and process new customer applications, as well as handle all other customer service requests. We offer our customers nationwide toll-free telephone numbers and brand-specific telesales representatives who are familiar with a particular brand's markets, products and customers. Our call centers are staffed by approximately 350 telesales, customer service and technical support personnel, who utilize our proprietary, on-line order processing system. This sophisticated software provides the telesales staff with detailed customer profiles and information about products, pricing, promotions and competition.
Catalogs and Direct Marketing
Our catalogs and direct marketing promotional flyers are key marketing tools that allow us to communicate our product offerings to both existing and potential customers. We create catalogs for most of our brands and mail or deliver them on an annual or semi-annual basis to our existing customers. We often supplement these catalog mailings by sending our customers promotional flyers. Most of our branded catalogs have been distributed for over three decades and we believe that these catalog titles have achieved a high degree of recognition among our customers.
In targeting potential direct marketing customers, we sometimes make our initial contact through promotional flyers, rather than by sending a complete catalog. We obtain mailing lists of prospective customers from outside marketing information services and other sources. We are able to gauge the effectiveness of our promotional flyer mailings through the use of proprietary database analysis methods, as well as through our telesales operations. Once customers begin to place orders with us, we typically send an initial catalog and include the customer on our periodic mailing list for updated catalogs and promotional materials. We believe that this approach is a cost-effective way for us to contact large numbers of potential customers and to determine which customers should be targeted for continuous marketing.
10
We produce the design and layout for our catalogs and promotional mailings using a sophisticated catalog content database and software system. Our catalogs are indexed and illustrated to provide simplified pricing information and to highlight new product offerings. Our promotional mailings introduce new product offerings, sale-promotion items and other periodic offerings. Illustrations, photographs and copy are shared among brand catalogs and mailings or customized for a specific brand, allowing for fast and efficient production of multi-branded media. In addition, we frequently build custom catalogs designed specifically for the needs of our larger customers.
Operations and Logistics
Distribution Network
We have a network strategically located to serve the largest metropolitan areas throughout the United States and Canada comprised of 57 distribution centers and 25 professional contractor showrooms. We also maintain a dedicated fleet of trucks to assist in local delivery of products. The geographic scope of our distribution network and the efficiency of our information technology enable us to provide reliable, next-day delivery service to approximately 98% of the U.S. population and same-day delivery service to most major metropolitan markets.
Our distribution centers are central to our operations and range in size from approximately 6,000 square feet to approximately 317,000 square feet. Our distribution centers are typically maintained under operating leases in commercial or industrial centers, and primarily consist of warehouse and shipping facilities. We have professional contractor showrooms in certain existing distribution centers and in freestanding locations, which allow customers to obtain products from a fixed location without ordering in advance.
Inbound Logistics
Our Regional Replenishment Centers ("RRCs") in Jacksonville, Florida; Philadelphia, Pennsylvania; Nashville, Tennessee; and Salt Lake City, Utah are distribution centers that receive the majority of our supplier shipments, efficiently re-distribute products to our other distribution centers and also deliver directly to customers in their local regions. Some over-sized or seasonal products are directly shipped to distribution centers other than the RRCs by our suppliers. Our use of RRCs has significantly reduced distribution center replenishment lead times while simultaneously improving our customer fill rates.
Outbound Logistics
Once an order is entered into our computer system, the order is usually picked and processed in the distribution center nearest to the customer. For customers located within the local delivery radius of a distribution center, our own trucks or third-party carriers will deliver the products directly to the customer the next business day (or same day for emergencies). For customers located outside the local delivery radius of a distribution center, we deliver products via parcel delivery companies, such as UPS. Large orders, or orders that cannot be delivered via parcel delivery, are delivered by common carriers. We generally arrange for pick-up of returns at no charge to the customer in the local delivery radius. For customers outside the local delivery radius, we provide parcel service pick-up of the returns at no charge and also provide a full refund if the return is the result of our error. In addition, portions of our sales are delivered direct from the supplier.
Suppliers and Purchasing
Our suppliers play an important role in our success. We work closely with our supplier base to ensure product merchandising and costs are managed effectively. Wherever possible, we seek to develop long-standing relationships with our suppliers. We also manage sourcing risk by developing
11
multiple sources of competitive product supply for many key products. Due to our high volume of purchases, we are able to obtain purchase terms we believe to be more favorable than those available to most local suppliers of MRO products.
We buy our products from over 3,100 suppliers located in the United States and throughout the world. A majority of our purchases are primarily from domestic supplier partners with the remainder from foreign-based suppliers located primarily throughout Asia and South America. No individual supplier represented more than 6% of our total purchases during the year ended December 31, 2010.
With regard to inventory, our customer-centric strategy balances the need for high fill rates with the aggressive management of inventory levels. Our goals are to continue to increase our inventory efficiency over the long term as we grow, further optimize our distribution network, manage stock keeping unit complexity and leverage our common information technology and logistics platforms. We also balance inventory efficiency with global sourcing opportunities, which have longer supply lead times than domestic relationships.
In addition to our inventory management team, our purchasing process is managed through an inventory management system which forecasts demand based on customer ordering patterns. This system monitors our inventory and alerts our purchasing managers of items approaching low levels of stock. We balance ordering and carrying costs in an effort to minimize total inventory costs. Demand forecasting is automated and is primarily based on historical sales, taking into account seasonally adjusted demand and supply lead times, which in turn are key inputs into setting safety stock levels.
Information Technology
We operate a customer service and inventory management system that allows us to manage customer relationships and to administer and distribute thousands of products. Our systems encompass all major business functions for each of our brands and enable us to receive and process orders, manage inventory, verify credit and payment history, generate customer invoices, receive payments and manage our proprietary customer information. We have consistently invested in our information technology, as we believe that the efficiency and flexibility of our information technology are critical to the success of our business.
Our information technology has been instrumental in our efforts to streamline our inventory management processes. For example, we are able to track each item of our inventory and its location within our distribution network. By monitoring inventory levels, we are able to quickly re-order products or shift inventory through our distribution network in order to ensure product availability. Our systems also allow us to monitor sales of products, enabling us to eliminate products that do not perform to our sales targets. Our information technology has also allowed us to create a more efficient order fulfillment process. Through our information technology, our distribution centers are networked together, which provides us with real-time access to inventory availability, order tracking and customer creditworthiness.
We constantly seek new ways to generate additional efficiencies, such as by utilizing e-commerce. For our larger brands, our customers can browse brand-specific product offerings online and use the internet to send electronic purchase orders to our order entry system. Additionally, we integrate with industry-leading business-to-business portals that allow customers to receive real-time inventory visibility and order product. Our customers can integrate these systems into their own purchase order systems, thereby making the supply chain operate more seamlessly. In addition, we offer our customers the option of receiving invoices electronically. For customers that place frequent orders and have the ability to receive electronic invoices, this program can dramatically reduce ordering costs by eliminating invoice handling, and by automating the matching and payment process. We believe that by offering services like electronic purchasing and invoicing, which remove transaction costs from the supply chain, we help our customers realize significant cost savings.
12
Competition
The MRO product distribution industry is highly competitive. Competition in our industry is primarily based upon product line breadth, product availability, technology, service capabilities and price. We face significant competition from national and regional distributors, such as HD Supply, Ferguson and Grainger. These competitors market their products through the use of direct sales forces as well as direct marketing, websites and catalogs. In addition, we face competition from traditional channels of distribution such as retail outlets, small wholesalers and large warehouse stores, including Home Depot and Lowe's. We also compete with buying groups formed by smaller distributors, internet-based procurement service companies, auction businesses and trade exchanges.
We expect that competition in our industry will continue to be strong in the future. The MRO product distribution industry continues to consolidate, as traditional MRO product distributors attempt to achieve economies of scale and increase efficiency. Furthermore, MRO product customers are continuing to seek low cost alternatives to replace traditional methods of purchasing and sources of supply. We believe that the current trend is for customers to reduce the number of suppliers and rely on lower cost alternatives such as direct marketing and/or integrated supply arrangements, which will contribute to competition in our industry.
Environmental and Health and Safety Matters
Some of the products we handle and sell, such as cleaning chemicals, are considered hazardous materials. Accordingly, we are subject to certain federal, state and local environmental laws and regulations, including those governing the transportation, management and disposal of, and exposure to, hazardous materials and the cleanup of contaminated sites. While we could incur costs as a result of liabilities under, or violations of, such environmental laws and regulations or arising out of the presence of hazardous materials in the environment, including the discovery of any such materials resulting from historical operations at our sites, we do not believe that we are subject to any such costs that are material. We are also subject to various health and safety requirements, including the Occupational, Safety and Health Act. We believe we are in compliance in all material respects with all environmental laws and regulations and health and safety requirements applicable to our facilities and operations.
Trademarks and Other Intellectual Property
We have registered and nonregistered trade names, trademarks and service marks covering the principal brand names and product lines under which our products are marketed, including AF LightingSM, AmSan®, Barnett®, CleanSource®, Copperfield®, Hardware Express®, LeranSM, Maintenance USA®, Premier®, ProPlus®, Renown®, Renovations Plus®, Sexauer®, SunStar Lighting®, Trayco®, U.S. Lock®, and Wilmar®. We also own several patents for certain products manufactured and marketed under our Copperfield® brand. We believe that our trademarks and other intellectual property rights are important to our success and our competitive position. Accordingly, our policy is to pursue and maintain registration of our trade names, trademarks and other intellectual property whenever appropriate and to oppose vigorously any infringement or dilution of our trade names, trademarks or other intellectual property.
Employees
As of December 31, 2010, we had 3,485 employees. Currently, we have no labor agreements in place. The labor agreements for our Mt. Laurel, New Jersey and Elkridge, Maryland distribution centers were terminated in May 2010 and August 2010, respectively, upon the closings of those facilities. We have not experienced any work stoppages resulting from management or union disagreements and believe that our employee relations are satisfactory.
13
Available Information
Our internet address is www.interlinebrands.com. We make available, free of charge, through our internet site, via a hyperlink to the 10KWizard.com web site, our annual reports on Form 10-K; quarterly reports on Form 10-Q; current reports on Form 8-K; and any amendments to those reports filed or furnished pursuant to the Exchange Act, as soon as reasonably practicable after such material is electronically filed with, or furnished to, the Securities and Exchange Commission ("SEC").
Recent Events
Special Time-Based Restricted Share Units Award and Amendment to Change in Control Severance Agreement
Effective March 1, 2011, the Compensation Committee of the Board approved a special award of time-based restricted share units to John A. Ebner, Chief Financial Officer, both in recognition of his exceptional performance during 2010 and as compensation for a modification to Mr. Ebner's existing Change in Control Agreement, which was entered into on January 8, 2010 (the "2010 CIC Agreement"). Mr. Ebner has agreed to modify his 2010 CIC Agreement by removing all tax gross-up rights provided therein. This change was made in consultation with the Company's independent compensation consultant, Frederic W. Cook & Company, Inc., who supported this modification and the consideration provided to Mr. Ebner in connection therewith. All other existing terms under Mr. Ebner's 2010 CIC Agreement remain unchanged.
The following risk factors should be read carefully in connection with evaluating us and this Annual Report on Form 10-K. Certain statements in "Risk Factors" are forward-looking statements. See "Forward-Looking Statements" above.
Risks Relating to Our Business
Adverse changes in global economic conditions may negatively affect our industry, business and results of operations.
Financial markets in the United States, Europe and Asia experienced substantial disruption from the second half of 2008 through early 2010, including, among other things, extreme volatility in security prices, severely diminished liquidity and credit availability, rating downgrades of certain investments and declining valuations of others. During this time period, governments took unprecedented actions intended to address these market conditions and the effectiveness of these actions is not yet fully known. Although macroeconomic conditions generally improved in 2010, the overall health of the economy remains fragile. High unemployment rates and continuing challenges in the housing sector, among other factors, continue to weigh on the economy.
The MRO product distribution industry is affected by changes in economic conditions outside our control, which can result in increased vacancies and lower effective rents in the residential rental housing market and a general decrease in product demand from our customers. In addition, a significant number of our facilities maintenance customers are educational institutions and healthcare facilities, which depend on public funding. Tax revenue for federal, state and local governments has decreased substantially during the economic recession and in response to the reduced revenue, governments have cut public funding and may continue to cut funding to our existing and potential customers.
Such economic developments may affect our business in a number of ways. Reduced demand may drive us and our competitors to offer products at promotional prices, which would have a negative impact on our profitability. In addition, credit availability may adversely affect the ability of our
14
customers and suppliers to obtain financing for significant purchases and operations and could result in a decrease in, or cancellation of, orders for our products. If demand for our products continues to slow down or decrease, we will not be able to improve our revenues and we may run the risk of failing to satisfy the financial and other restrictive covenants to which we are subject under our existing indebtedness. Reduced revenues as a result of decreased demand may also reduce our working capital for planned growth and otherwise hinder our ability to improve our performance in connection with our long-term strategy.
The trading price of our common stock may be volatile.
The market price of our common stock could be subject to wide fluctuations in response to, among other things, the risk factors described in this and other periodic reports, and other factors beyond our control, such as fluctuations in the valuation of companies perceived by investors to be comparable to us. Furthermore, the stock markets have experienced price and volume fluctuations that have affected and continue to affect the market prices of equity securities of many companies. These fluctuations often have been unrelated or disproportionate to the operating performance of those companies. These broad market and industry fluctuations, as well as general economic, political, and market conditions, such as recessions, interest rate changes or international currency fluctuations, may negatively affect the market price of our common stock. In the past, many companies that have experienced volatility in the market price of their stock have been subject to securities class action litigation. We may be the target of this type of litigation in the future. Securities litigation against us could result in substantial costs and divert our management's attention from other business concerns, which could seriously harm our business.
An impairment in the carrying value of our goodwill or other intangible assets could adversely affect our financial condition and results of operations.
Goodwill represents the difference between the purchase price of acquired companies and the related fair values of net assets acquired. We test goodwill for impairment annually and whenever events or changes in circumstances indicate that impairment may have occurred. We compare the carrying value of a reporting unit, including goodwill, to the fair value of the unit. Carrying value is based on the assets and liabilities associated with the operations of that reporting unit. If the carrying value is less than the fair value, no impairment exists. If the carrying value is higher than the fair value, there is an indication of impairment. A significant amount of judgment is involved in determining if an indication of impairment exists. Factors may include, among others: a significant decline in our expected future cash flows; a sustained, significant decline in our stock price and market capitalization; a significant adverse change in legal factors or in the business climate; unanticipated competition; the testing for recoverability of a significant asset group within a reporting unit; and slower growth rates. Any adverse change in these factors would have a significant impact on the recoverability of these assets and negatively affect our financial condition and consolidated results of operations. We compute the amount of impairment by comparing the implied fair value of reporting unit goodwill with the carrying amount of that goodwill. We are required to record a non-cash impairment charge if the testing performed indicates that goodwill has been impaired.
As with goodwill, we test our indefinite-lived intangible assets (primarily trade names) for impairment annually and whenever events or changes in circumstances indicate that their carrying value may not be recoverable. We estimate the fair value of the trademarks based on an income valuation model using the relief from royalty method, which requires assumptions related to projected revenues from our annual long-range plan, assumed royalty rates that could be payable if we did not own the trademarks and a discount rate.
15
We cannot accurately predict the amount and timing of any impairment of assets. Should the value of goodwill or other intangible assets become impaired, there could be an adverse effect on our financial condition and consolidated results of operations.
Our allowance for doubtful accounts may prove inadequate or we may be negatively affected by credit risk exposures.
Our business depends on the creditworthiness of our customers. We periodically review our allowance for doubtful accounts for adequacy considering economic conditions and trends, collateral values and credit quality indicators, including past charge-off experience and levels of past due accounts. We cannot be certain that our allowance for doubtful accounts will be adequate over time to cover losses in our accounts receivable because of adverse changes in the economy or events adversely affecting specific customers, industries or markets. The current economic environment is dynamic and the credit worthiness of our customers and the value of collateral underlying our accounts receivable can change significantly over very short periods of time. Our allowance may not keep pace with changes in the creditworthiness of our customers or collateral values. If the credit quality of our customer base materially decreases, if the risk of a market, industry, or group of customers changes significantly, or if our allowance for doubtful accounts is not adequate, our business, financial condition and results of operations could suffer.
One of the key markets in which we operate is impacted by trends in home improvement, home remodeling and home building. Adverse changes in economic factors specific to these industries may negatively impact the rate of growth of our net sales.
The professional contractor market is impacted by trends in home improvement, home remodeling and new home construction. Trends in these areas are in turn dependent upon a number of factors, including demographic trends, interest rates, tax policy, employment levels, consumer confidence and the economy generally. Unfavorable changes in demographics or a weakening of the national economy or of any regional or local economy in which we operate could adversely affect consumer spending, result in decreased demand for repair, improvement, remodeling or construction products and adversely affect our business. For example, during 2010, our average organic daily sales rate in the professional contractor market decreased 0.2%.
We operate in a highly competitive industry, and if we are unable to compete successfully we could lose customers, and our sales may decline.
The MRO product distribution industry is highly competitive. We face significant competition from national and regional distributors which market their products through the use of direct sales forces as well as direct marketing, websites and catalogs. In addition, we face competition from traditional channels of distribution such as retail outlets, small dealerships and large warehouse stores and from buying groups formed by smaller distributors, internet-based procurement service companies, auction businesses and trade exchanges. We expect that new competitors may develop over time as internet-based enterprises become more established and reliable and refine their service capabilities.
In addition, the MRO product distribution industry is undergoing changes driven by industry consolidation and increased customer demands. Traditional MRO product distributors are consolidating operations and acquiring or merging with other MRO product distributors to achieve economies of scale and increase efficiency. This consolidation trend could cause the industry to become more competitive and make it more difficult for us to maintain our operating margins.
Competition in our industry is primarily based upon product line breadth, product availability, service capabilities and price. To the extent that existing or future competitors seek to gain or retain
16
market share by reducing price or by increasing support service offerings, we may be required to lower our prices or to make additional expenditures for support services, thereby reducing our profitability.
Fluctuations in the cost of raw materials, fuel prices or in currency exchange rates could significantly reduce our revenues and profitability.
As a distributor of manufactured products, our profitability is related to the prices we pay to the manufacturers from which we purchase our products and to the cost of transporting the products to us and our customers. The price that our suppliers charge us for our products is dependent in part upon the availability and cost of the raw materials used to produce those products. Such raw materials are often subject to price fluctuations, frequently due to factors beyond our control, including changes in supply and demand, general U.S. and international economic conditions, labor costs, competition and government regulations. Increases in the cost of raw materials, such as copper, oil, stainless steel, aluminum, zinc, plastic and PVC and other commodities and raw materials, have occurred in the past and adversely impacted our operating results. Transportation prices are significantly dependent on fuel prices, which generally change due to factors beyond our control, such as changes in worldwide demand, disruptions in supply, changes in the political climate in the Middle East and other regions and changes in government regulations, including existing and pending legislation and regulations relating to climate change. For example, efforts to combat climate change through reduction of greenhouse gases may result in higher fuel costs through taxation or other means. Fluctuations in raw materials and fuel prices may increase our costs and significantly reduce our revenues and profitability. The nature and extent of such an impact is difficult to predict, quantify and measure. To the extent the costs of products increase or decrease, the prices we charge for our products may correspondingly increase or decrease, adversely affecting our revenues and profitability.
In addition, many of our suppliers price their products in currencies other than the U.S. dollar or incur costs of production in non-U.S. currencies. Accordingly, depreciation of the U.S. dollar against foreign currencies could increase the price we pay for these products. For example, a substantial portion of our products are sourced from suppliers in China and the value of the Chinese Yuan has increased relative to the U.S. dollar since July 2005, when it was allowed to fluctuate against a basket of foreign currencies. Most experts believe that the value of the Yuan will continue to increase relative to the U.S. dollar over the next few years. Such a move would most likely result in an increase in the cost of products that are sourced from suppliers in China.
Loss of supplier agreements, lack of product availability or loss of delivery sources could decrease our revenues and profitability.
Our ability to offer a wide variety of products to our customers is dependent upon our ability to obtain adequate product supply from manufacturers or other suppliers. While in many instances we have agreements, including supply chain agreements, with our suppliers, these agreements are generally terminable by either party on limited notice. Even though we can replace each of our suppliers and no individual supplier represents more than 6% of our total purchases, the loss of several supplier agreements, or a substantial decrease in the availability of products from our suppliers, could have a short-term material impact on our business.
In addition, supply interruptions could arise from shortages of raw materials, labor disputes or weather conditions affecting products or shipments, transportation disruptions or other factors beyond our control. Loss of a key foreign supplier could disrupt our supply chain for approximately 60 to 90 days, or longer, and loss of key suppliers from an individual country could result in disruptions of approximately 120 to 150 days, or longer. Short- and long-term disruptions in our supply chain would result in higher inventory levels as we replace similar product domestically, a higher cost of product and ultimately a decrease in our revenues and profitability. Although we are not substantially
17
dependent on any individual supplier, a disruption in the timely availability of our product by our key suppliers could result in a decrease in our revenues and profitability.
We could face potential product quality and product liability claims relating to the products we distribute, which could result in a decline in revenues and profitability and negatively impact customer confidence.
We rely on manufacturers and other suppliers to provide us with the products we sell and distribute. As we do not have direct control over the quality of the products manufactured or supplied by such third party suppliers, we are exposed to risks relating to the quality of the products we distribute. It is possible that inventory from a manufacturer or supplier could be sold to our customers and later be alleged to have quality problems or to have caused personal injury, subjecting us to potential claims from customers or third parties. The risk of claims may be greater with respect to our exclusive brand products, as these products are customarily manufactured by third party suppliers outside the United States, particularly in China. We have been subject to claims in the past, which have been resolved without material financial impact. Product liability claims can be expensive to defend and can divert the attention of management and other personnel for significant time periods, regardless of the ultimate outcome. An unsuccessful product liability defense could be very costly and accordingly result in a decline in revenues and profitability. In addition, uncertainties with respect to the Chinese legal system may adversely affect us in resolving claims arising from our exclusive brand products manufactured in China. Because many laws and regulations are relatively new and the Chinese legal system is still evolving, the interpretations of many laws, regulations and rules are not always uniform. Finally, even if we are successful in defending any claim relating to the products we distribute, claims of this nature could negatively impact customer confidence in our products and our company.
If the government of China were to reduce or withdraw the tax benefits they provide our Chinese suppliers, the cost of some of our products could increase and therefore our profitability may be significantly reduced.
China's turnover tax system consists of value-added tax ("VAT"), consumption tax and business tax. Export sales are exempted under VAT rules and an exporter who incurs input VAT on the manufacture of goods can claim a tax rebate from Chinese tax authorities. Currently, our Chinese suppliers benefit from the tax rebates that China provides them to export their products. If these tax rebates are reduced or eliminated, some of our Chinese-sourced products could become more expensive for us, thereby reducing our profitability.
In some cases, we are dependent on long supply chains, which may subject us to interruptions in the supply of many of the products that we distribute.
A significant portion of the products that we distribute is imported from foreign countries, including China. We are thus dependent on long supply chains for the successful delivery of many of our products. The length and complexity of these supply chains make them vulnerable to numerous risks, many of which are beyond our control, which could cause significant interruptions or delays in delivery of our products. Factors such as labor disputes, currency fluctuations, changes in tariff or import policies, severe weather or terrorist attacks or armed hostilities may disrupt these supply chains. In addition to these factors, loading container cargo in Chinese ports can be disrupted or delayed by congestion in port terminal facilities, inadequate equipment to load, dock and offload container vessels or energy-related tie-ups. In any such case, our product shipments will be delayed. We expect more of our name brand and exclusive brand products will be imported in the future, which will further increase these risks. A significant interruption in our supply chains caused by any of the above factors could result in increased costs or delivery delays and result in a decrease in our revenues and profitability.
18
Our ability to both maintain our existing customer base and to attract new customers is dependent in many cases upon our ability to deliver products and fulfill orders in a timely and cost-effective manner.
To ensure timely delivery of our products to our customers, we frequently rely on third parties, including couriers such as UPS and other national shippers as well as various local and regional trucking contractors and logistics consulting and management companies. Outsourcing this activity generates a number of risks, including decreased control over the delivery process and service timeliness and quality. Any sustained inability of these third parties to deliver our products to our customers could result in the loss of customers or require us to seek alternative delivery sources, if they are available, which may result in significantly increased costs and delivery delays. Furthermore, the need to identify and qualify substitute service providers or increase our internal capacity could result in unforeseen operations problems and additional costs. Moreover, if demand for our products increases, we may be unable to secure sufficient additional capacity from our current service providers, or others, on commercially reasonable terms, if at all.
The loss of any of our significant customers could significantly reduce our revenues and profitability.
Our 10 largest customers generated approximately $52.8 million, or approximately 5%, of our sales in the year ended December 31, 2010, and our largest customer accounted for less than 1% of our sales in the year ended December 31, 2010. The loss of one or more of our significant customers or deterioration in our relations with any of them could significantly reduce our revenues and profitability.
We may not be able to protect our trademarks, which could diminish the strength of our trademarks or limit our ability to use our trademarks and, accordingly, undermine our competitive position.
We believe that our trademarks are important to our success and our competitive position. For instance, we market and sell products primarily through thirteen distinct and targeted brands: Wilmar®, AmSan®, Barnett®, CleanSource®, Sexauer®, Hardware Express®, Copperfield®, Maintenance USA®, U.S. Lock®, SunStar®, LeranSM, Trayco®, and AF LightingSM. We believe many of our customers have developed strong consumer loyalty to these targeted brands. Accordingly, we devote resources to the establishment and protection of our trademarks, including with respect to our brand names and our exclusive brand products. However, the actions we have taken may be inadequate to prevent imitation of our brands and concepts by others or to prevent others from claiming violations of their trademarks and proprietary rights by us. In addition, others may assert rights in our trademarks. Our exclusive rights to our trademarks are subject to the common law rights of any other person who began using the trademark (or a confusingly similar mark) prior to the date of federal registration. Future actions by third parties may diminish the strength of our trademarks or limit our ability to use our trademarks and, accordingly, undermine our competitive position.
We may not be able to facilitate our growth strategy by identifying or completing transactions with attractive acquisition candidates, which could impede our revenues and profitability.
Our acquisitions have contributed significantly to our growth. An important element of our growth strategy is to continue to seek additional businesses to acquire in order to add new customers within our existing markets and to acquire brands in new markets. We cannot assure you that we will be able to identify attractive acquisition candidates or complete the acquisition of any identified candidates at favorable prices and upon advantageous terms and conditions. Furthermore, we believe that our industry is currently in a process of consolidation, and competition for attractive acquisition candidates is therefore likely to escalate, thereby limiting the number of acquisition candidates or increasing the overall costs of making acquisitions. In addition, we may not be able to obtain financing necessary to complete acquisitions on attractive terms or at all. Difficulties we may face in identifying or completing acquisitions could impede our revenue growth and profitability.
19
We cannot assure you that we will be able to successfully complete the integration of our recent acquisitions of CleanSource and NCP or any future acquisitions or manage other consequences of our acquisitions, which could impede our ability to remain competitive and, ultimately, our revenues and profitability.
Acquisitions involve significant risks and uncertainties, including difficulties integrating acquired personnel and other corporate cultures into our business, difficulties associated with information technology conversions, the potential loss of key employees, customers or suppliers, the assumption of liabilities and exposure to unforeseen liabilities of acquired companies, the difficulties in achieving target synergies and the diversion of management attention and resources from existing operations. We may not be able to fully integrate the operations of CleanSource and NCP or any future acquired businesses with our own in an efficient and cost-effective manner or without significant disruption to our existing or acquired operations. We may also be required to incur additional debt in order to consummate acquisitions in the future. Such debt may be substantial and may limit our flexibility in using our cash flow from operations. Our failure to integrate future acquired businesses effectively or to manage other consequences of our acquisitions, including increased indebtedness, could impede our ability to remain competitive and, ultimately, our revenues and profitability.
Disruption in our information technology could significantly lower our revenues and profitability.
Our operations are dependent upon our information technology that encompasses all of our major business functions. We rely upon our information technology to manage and replenish inventory, to fill and ship customer orders on a timely basis and to coordinate our sales and marketing activities across all of our brands. We believe that our information technology plays a key role in our ability to achieve operating and financial efficiencies. Any substantial disruption of our information technology for any prolonged time period could result in delays in receiving inventory and supplies or filling customer orders and, accordingly, could significantly lower our revenues and profitability.
Disruption in our distribution centers could significantly lower our revenues and profitability.
Our distribution centers are essential to the efficient operation of our national distribution network. Any serious disruption to these distribution centers due to fire, earthquake, act of terrorism or any other cause could damage a significant portion of our inventory. In addition, we could incur significantly higher costs and longer lead times associated with distributing our products to our customers during the time that it takes for us to reopen or replace these centers. As a result, any such disruption could significantly lower our revenues and profitability.
We may be unable to retain senior executives and attract and retain other qualified employees which might hinder our growth and could impede our ability to run our business and potentially reduce our revenues and profitability.
Our success depends in part on our ability to attract, hire, train and retain qualified managerial, sales, operational and marketing personnel. We face significant competition for these types of personnel in our industry. We may be unsuccessful in attracting and retaining the personnel we require to conduct and expand our operations successfully and, in such an event, our revenues and profitability could decline. In addition, key personnel may leave us and compete against us. Our success also depends, to a significant extent, on the continued service of our senior management team. The loss of any member of our senior management team or other qualified employees could impair our ability to execute our business plan and growth strategy, cause us to lose customers and reduce our net sales, or lead to employee morale problems and/or the loss of key employees.
20
If we fail to maintain an effective system of internal controls, we may not be able to accurately report our financial results or prevent fraud. As a result, current and potential stockholders could lose confidence in our financial reporting, which would harm the trading price of our stock.
Effective internal controls are necessary for us to provide reliable financial reports and prevent fraud. Any failure to implement required new or improved controls, or difficulties encountered in their implementation, could harm our operating results or cause us to fail to meet our reporting obligations. Inadequate internal controls could also cause investors to lose confidence in our reported financial information, which could have a negative effect on the trading price of our stock.
Risks Relating to Our Indebtedness
The volatility and disruption of the capital and credit markets may impair our access to sufficient capital.
Over the past few years, the United States credit markets have experienced unprecedented contraction. As the future of the credit markets remains uncertain and potentially volatile, we may not be able to obtain additional financing on favorable terms, or at all. In addition, if the current pressures on credit continue or worsen, we may not be able to refinance our outstanding debt when due, which could have a material adverse effect on our business. Decreased access to the credit markets and other financing sources could also restrict our ability to make acquisitions and grow our business.
Furthermore, if our operating results, cash flow or capital resources prove inadequate, or if interest rates increase significantly, we could face substantial liquidity problems and might be required to dispose of material assets or operations to meet our debt and other obligations. If we are unable to service our debt, we could be forced to reduce or delay planned capital expenditures, sell assets, restructure or refinance our debt or seek additional equity capital, and we may be unable to take any of the actions on satisfactory terms or in a timely manner. Further, any of these actions may not be sufficient to allow us to service our debt obligations or may have an adverse impact on our business. The terms of the ABL Facility and the indenture governing the 7.00% Notes will limit our ability to take certain of these actions. Our failure to generate sufficient operating cash flow to pay our debts, to refinance our indebtedness or to successfully undertake any of these other actions could have a material adverse effect on us.
Our substantial indebtedness could adversely affect our financial health and prevent us from fulfilling our obligations.
As of December 31, 2010, our total indebtedness was $322.8 million, of which $7.9 million was outstanding in the form of letters of credit and $1.5 million relates to capital lease obligations. As of December 31, 2010, we had $313.4 million of senior indebtedness outstanding and $169.8 million in availability under the ABL Facility. Also as of December 31, 2010, we had $87.1 million of total cash on hand and permitted investments. Our substantial indebtedness could have important consequences to our financial health. For example it could:
- •
- make it more difficult for us to satisfy our obligations with respect to the 7.00% Notes and our other indebtedness,
- •
- increase our vulnerability to the general adverse economic and industry conditions or a downturn in our business,
- •
- require us to dedicate a substantial portion of our cash flow from operations to debt service thereby reducing the
availability of our cash flow to fund working capital, capital expenditures and other general corporate purposes,
- •
- limit our flexibility in planning for, or reacting to, changes in our business and the industry in which we operate,
21
- •
- place us at a competitive disadvantage compared to our competitors that are not as highly leveraged,
- •
- limit, along with the financial and other restrictive covenants in our indebtedness, among other things, our ability to
borrow additional funds,
- •
- result in an event of default if we fail to satisfy our obligations under the 7.00% Notes or our other indebtedness or
fail to comply with the financial and other restrictive covenants contained in the indenture or our other debt; such event of default could result in all of our debt becoming immediately due and
payable and could permit certain of our lenders to foreclose on our assets securing such indebtedness, and
- •
- the amount of our debt relative to our market cap or annual revenues may discourage investors from purchasing our shares, which could result in lower investor demand for our shares and a decrease in our share price.
We cannot be certain that our earnings will be sufficient to allow us to pay principal and interest on our debt and meet our other obligations. If we do not have sufficient earnings, we may be required to refinance all or part of our existing debt, sell assets, borrow more money or sell more securities, none of which we can guarantee we will be able to do. Our ability to incur additional debt will be limited by the terms and conditions of our credit facility. Any of the above listed factors could have a material adverse effect on our business, financial condition and results of operations.
Despite current indebtedness levels, we may still be able to incur substantial additional indebtedness.
We may be able to incur substantial additional indebtedness in the future to finance acquisitions, investments or for other purposes, subject to the restrictions contained in the documents governing our indebtedness. We are able to incur up to a maximum of $169.8 million in total indebtedness under the ABL Facility, based on year-end inventory and trade accounts receivable balances. The agreement governing the ABL Facility also allows us to incur additional other indebtedness. The indenture governing the 7.00% Notes contains some limitations on our ability to incur indebtedness; however, it may not prohibit the incurrence of additional indebtedness. If new indebtedness is added to our current indebtedness levels, the substantial leverage risks described above that we now face would intensify.
The indenture governing the 7.00% Notes and the agreement governing the ABL Facility include restrictive and financial covenants that may limit our operating and financial flexibility.
The indenture governing the 7.00% Notes and the agreement governing the ABL Facility each contain covenants that, among other things, restrict our ability to take specific actions, even if we believe them to be in our best interest. These include restrictions on our ability to:
- •
- incur additional indebtedness,
- •
- pay dividends or distributions on, or redeem or repurchase, capital stock,
- •
- prepay, redeem or repurchase specified indebtedness,
- •
- merge, consolidate or sell assets or enter into other business combination transactions,
- •
- make acquisitions, capital expenditure investments or other investments,
- •
- enter into transactions with affiliates,
- •
- incur certain liens,
- •
- enter into sale-leaseback transactions,
- •
- use proceeds from sale of assets, and
22
- •
- change our business.
In addition, the agreement governing the ABL Facility contains a single fixed charge coverage requirement which only becomes applicable when borrowing availability is less than the greater of 12.5% of the commitment thereunder or $28.1 million. There are no credit ratings related triggers in the ABL Facility that would impact the cost of borrowing, annual amortization of principal or related indebtedness maturity.
ITEM 1B. Unresolved Staff Comments
None.
We operate from 133 locations throughout the United States, Canada and Puerto Rico consisting of 57 distribution centers, 25 professional contractor showrooms, 38 vendor-managed inventory locations, nine administrative and support facilities and four cross-dock facilities.
We lease 92 properties. The majority of these leases are for varying term lengths up to seven years. We own a call center located in Jacksonville, Florida and distribution centers in Long Island, New York and Louisville, Kentucky, both of which have attached administrative and support facilities. None of the owned properties are subject to any mortgages; however, our call center in Jacksonville, Florida is subject to a development agreement with the City of Jacksonville. Our 38 vendor-managed inventory locations are customer-specific locations whereby we assist those customers with their MRO inventory management process.
We believe that our properties are in good operating condition and adequately serve our current business operations.
The ranges in size of the locations we operate are as follows (not including vendor-managed inventory locations and cross-dock facilities):
| |
Size (in square feet) |
|||
|---|---|---|---|---|
Distribution centers |
6,000 – 317,100 | |||
Professional contractor showrooms |
900 – 26,700 | |||
Administrative and support facilities |
1,500 – 72,900 | |||
23
The following table sets forth the states, territories and provinces where we (not including vendor-managed inventory locations and cross-dock facilities):
Location
|
Distribution Centers |
Professional Contractor Showrooms |
Administrative and Support Locations |
||||||||
|---|---|---|---|---|---|---|---|---|---|---|---|
U.S. State |
|||||||||||
Alabama |
1 | ||||||||||
Arizona |
1 | ||||||||||
California |
5 | 3 | |||||||||
Colorado |
1 | 1 | |||||||||
Florida |
2 | 6 | 2 | ||||||||
Georgia |
1 | ||||||||||
Illinois |
3 | ||||||||||
Indiana |
1 | ||||||||||
Iowa |
2 | 1 | |||||||||
Kansas |
1 | 1 | |||||||||
Kentucky |
2 | ||||||||||
Louisiana |
1 | ||||||||||
Massachusetts |
1 | 1 | |||||||||
Michigan |
1 | ||||||||||
Minnesota |
1 | 1 | |||||||||
Missouri |
2 | ||||||||||
Montana |
2 | ||||||||||
Nebraska |
1 | 1 | |||||||||
Nevada |
1 | 1 | |||||||||
New Jersey |
2 | 1 | |||||||||
New York |
1 | 1 | |||||||||
North Carolina |
2 | ||||||||||
Ohio |
3 | 1 | |||||||||
Oklahoma |
2 | 1 | |||||||||
Oregon |
1 | 2 | 2 | ||||||||
Pennsylvania |
2 | 1 | |||||||||
South Carolina |
1 | ||||||||||
Tennessee |
2 | 1 | |||||||||
Texas |
6 | 1 | |||||||||
Utah |
1 | ||||||||||
Virginia |
1 | ||||||||||
Washington |
5 | ||||||||||
Subtotal |
54 | 25 | 9 | ||||||||
U.S. Territory |
|||||||||||
Puerto Rico |
1 | ||||||||||
Subtotal |
1 | 0 | 0 | ||||||||
Canadian Province |
|||||||||||
Alberta |
1 | ||||||||||
Ontario |
1 | ||||||||||
Subtotal |
2 | 0 | 0 | ||||||||
Total |
57 | 25 | 9 | ||||||||
24
We are involved in various legal proceedings in the normal course of our business. In the opinion of management, none of the proceedings is material in relation to our consolidated financial statements.
25
ITEM 5. Market for Registrant's Common Equity, Related Stockholder Matters and Issuer Purchases of Equity Securities
Market Information
Since December 16, 2004, our common stock has been publicly traded on the New York Stock Exchange ("NYSE") under the symbol "IBI".
Holders
As of February 25, 2011, there were approximately 75 holders of record of our outstanding common stock.
Stock Price Performance
The following Performance Graph and related information shall not be deemed "soliciting material" or to be "filed" with the Securities and Exchange Commission, nor shall such information be incorporated by reference into any future filing under the Securities Act or the Exchange Act, except to the extent that the Company specifically incorporates it by reference into such filing.
The following performance graph compares the performance of our common stock with the performance of the NYSE Composite and the Standard & Poor's ("S&P") Small Cap 600 Index, during the period from December 30, 2005 through December 31, 2010. The Company has chosen the S&P Small Cap 600 Index for comparison because the S&P Small Cap 600 Index includes companies of similar capitalization to the Company. The graph plots the changes in value of an initial $100 investment over the indicated time period, assuming all dividends are reinvested.
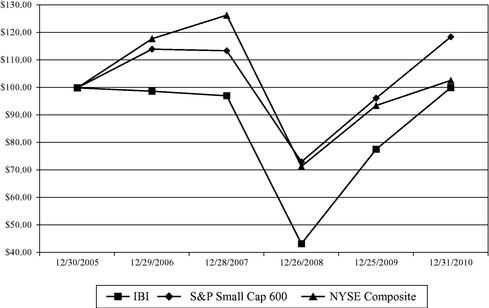
| |
December 30, 2005 |
December 29, 2006 |
December 28, 2007 |
December 26, 2008 |
December 25, 2009 |
December 31, 2010 |
|||||||||||||
|---|---|---|---|---|---|---|---|---|---|---|---|---|---|---|---|---|---|---|---|
IBI |
$ | 100.00 | $ | 98.77 | $ | 97.10 | $ | 43.30 | $ | 77.63 | $ | 100.09 | |||||||
Standard and Poor's Small Cap 600 |
$ | 100.00 | $ | 114.07 | $ | 113.50 | $ | 73.09 | $ | 96.22 | $ | 118.55 | |||||||
New York Stock Exchange Composite |
$ | 100.00 | $ | 117.86 | $ | 126.44 | $ | 71.42 | $ | 93.57 | $ | 102.71 | |||||||
26
The following table sets forth the high and low sale price per share of our common stock during the periods indicated:
| |
High | Low | ||||||
|---|---|---|---|---|---|---|---|---|
Fiscal Year 2010 |
||||||||
First quarter ended March 26, 2010 |
$ | 20.00 | $ | 16.35 | ||||
Second quarter ended June 25, 2010 |
$ | 22.20 | $ | 17.85 | ||||
Third quarter ended September 24, 2010 |
$ | 19.25 | $ | 15.43 | ||||
Fourth quarter ended December 31, 2010 |
$ | 23.14 | $ | 17.34 | ||||
Fiscal Year 2009 |
||||||||
First quarter ended March 27, 2009 |
$ | 10.71 | $ | 6.34 | ||||
Second quarter ended June 26, 2009 |
$ | 16.00 | $ | 8.01 | ||||
Third quarter ended September 25, 2009 |
$ | 18.63 | $ | 12.29 | ||||
Fourth quarter ended December 25, 2009 |
$ | 18.00 | $ | 14.05 | ||||
Dividends
We have never declared dividends on our common stock. Our ability to declare and pay dividends on our common stock is subject to the requirements of Delaware law. In addition, we are a parent company with no business operations of our own. Accordingly, our sources of cash are dividends and distributions with respect to our ownership interest in Interline New Jersey that are derived from the earnings and cash flow generated by our businesses. The ability of Interline New Jersey to pay dividends to us is restricted under certain of its debt and other agreements.
Securities Authorized for Issuance Under Equity Compensation Plans
The following table sets forth information as of December 31, 2010 regarding compensation plans under which our equity securities are authorized for issuance.
| |
|
|
(c) |
|||||||
|---|---|---|---|---|---|---|---|---|---|---|
| |
|
|
Number of securities remaining available for future issuance under equity compensation plans (excluding securities reflected in column (a)) |
|||||||
| |
(a) |
(b) |
||||||||
Plan Category
|
Number of securities to be issued upon exercise of outstanding options |
Weighted-average exercise price of outstanding options ($) |
||||||||
Equity compensation plans approved by security holders |
3,699,901 | (1) | $ | 17.60 | (2) | 2,062,489 | ||||
Equity compensation plans not approved by security holders |
— | — | — | |||||||
Total |
3,699,901 | (1) | $ | 17.60 | (2) | 2,062,489 | ||||
- (1)
- Includes
659,576 restricted share units and 93,134 deferred stock units granted to management and non-employee directors, respectively, pursuant
to the 2004 Equity Incentive Plan.
- (2)
- The weighted-average exercise price excludes restricted share units and deferred stock units.
Further, as of December 31, 2010, there were 2,947,191 stock options outstanding with a weighted-average exercise price of $17.60 and a weighted-average remaining term of 4.4 years and 760,760 full value shares outstanding under our equity compensation plans. As of December 31, 2010, there were 2,062,489 shares remaining to be awarded under our equity compensation plans (2,057,359 under the 2004 Equity Incentive Plan and 5,130 under the 2000 Stock Award Plan).
Purchases of Equity Securities by the Issuer
None during the three months ended December 31, 2010.
27
ITEM 6. Selected Financial Data
The table below presents our selected historical consolidated financial data for 2010, 2009, 2008, 2007 and 2006. The information presented below should be read in conjunction with "Management's Discussion and Analysis of Financial Conditions and Results of Operations" and the consolidated financial statements included elsewhere in this report.
| |
Fiscal Year Ended | |||||||||||||||||
|---|---|---|---|---|---|---|---|---|---|---|---|---|---|---|---|---|---|---|
| |
December 31, 2010(1)(2) |
December 25, 2009 |
December 26, 2008(1) |
December 28, 2007 |
December 29, 2006(1) |
|||||||||||||
| |
(in thousands, except per share data) |
|||||||||||||||||
Income Statement Data: |
||||||||||||||||||
Net sales |
$ | 1,086,989 | $ | 1,059,278 | $ | 1,195,663 | $ | 1,239,027 | $ | 1,067,570 | ||||||||
Cost of sales |
672,745 | 665,327 | 746,037 | 765,137 | 658,698 | |||||||||||||
Gross profit |
414,244 | 393,951 | 449,626 | 473,890 | 408,872 | |||||||||||||
Operating expenses |
339,060 | 334,717 | 360,659 | 359,796 | 307,179 | |||||||||||||
Operating income |
75,184 | 59,234 | 88,967 | 114,094 | 101,693 | |||||||||||||
Interest and other expense, net |
(16,948 | ) | (17,330 | ) | (26,284 | ) | (30,672 | ) | (30,170 | ) | ||||||||
(Loss) gain on extinguishment of debt, net |
(11,486 | ) | 1,257 | 2,775 | — | (20,843 | ) | |||||||||||
Income before income taxes |
46,750 | 43,161 | 65,458 | 83,422 | 50,680 | |||||||||||||
Provision for income taxes |
18,829 | 17,073 | 24,625 | 32,460 | 19,495 | |||||||||||||
Net income |
27,921 | 26,088 | 40,833 | 50,962 | 31,185 | |||||||||||||
Preferred stock dividends |
— | — | — | — | — | |||||||||||||
Net income applicable to common stockholders |
$ | 27,921 | $ | 26,088 | $ | 40,833 | $ | 50,962 | $ | 31,185 | ||||||||
Earnings per share: |
||||||||||||||||||
Basic |
$ | 0.85 | $ | 0.80 | $ | 1.26 | $ | 1.58 | $ | 0.97 | ||||||||
Diluted |
$ | 0.83 | $ | 0.79 | $ | 1.25 | $ | 1.56 | $ | 0.95 | ||||||||
Cash dividends declared per share |
$ | — | $ | — | $ | — | $ | — | $ | — | ||||||||
Cash Flow Data: |
||||||||||||||||||
Net cash provided by (used in): |
||||||||||||||||||
Operating activities |
$ | 60,760 | $ | 144,282 | $ | 56,192 | $ | 57,730 | $ | 29,946 | ||||||||
Investing activities |
(71,131 | ) | (14,515 | ) | 17,715 | (64,211 | ) | (139,298 | ) | |||||||||
Financing activities |
(2,016 | ) | (93,560 | ) | (15,844 | ) | 4,441 | 113,226 | ||||||||||
Capital expenditures |
17,729 | 11,157 | 20,582 | 14,906 | 7,813 | |||||||||||||
Balance Sheet Data (as of end of period): |
||||||||||||||||||
Cash and cash equivalents |
$ | 86,981 | $ | 99,223 | $ | 62,724 | $ | 4,975 | $ | 6,852 | ||||||||
Total assets |
1,007,609 | 928,838 | 962,848 | 936,834 | 890,569 | |||||||||||||
Total debt(3) |
313,358 | 305,678 | 403,390 | 418,590 | 421,066 | |||||||||||||
Stockholders' equity |
496,232 | 451,735 | 420,073 | 377,414 | 320,679 | |||||||||||||
Other Data: |
||||||||||||||||||
Depreciation and amortization |
$ | 20,612 | $ | 19,174 | $ | 17,414 | $ | 15,114 | $ | 14,427 | ||||||||
Adjusted EBITDA(4) |
97,420 | 79,907 | 107,474 | 130,452 | 116,726 | |||||||||||||
- (1)
- We acquired AmSan LLC ("AmSan") in July 2006, Eagle Maintenance Supply, Inc. ("Eagle") in August 2008 and CleanSource in October 2010. Their results have been included in the financial statements since their respective acquisition date.
28
- (2)
- Fiscal
year ended December 31, 2010 was a 53-week year. All other years presented were 52-week years.
- (3)
- Total
debt represents the amount of our short-term debt and long-term debt.
- (4)
- We define Adjusted EBITDA as net income plus interest expense (income), net, loss (gain) on extinguishment of debt, net, provision for income taxes and depreciation and amortization. Adjusted EBITDA differs from EBITDA and may not be comparable to EBITDA or Adjusted EBITDA as reported by other companies. Adjusted EBITDA differs from Consolidated EBITDA per our credit facility agreement for purposes of determining our net leverage ratio.
- •
- Loss (gain) on extinguishment of debt—We have recorded losses and gains associated with the early extinguishment of debt. In 2006, we refinanced our 111/2% senior subordinated notes due 2011 and credit facility with the 81/8% Notes and a new credit facility. In 2008, we repurchased $12.9 million of our 81/8% Notes at 773/8% of par, or $10.0 million. In 2009, we repurchased $36.4 million of our 81/8% Notes at 93.79% of par, or $34.2 million, and repaid $60.2 million of our term loan ahead of schedule. In 2010, in connection with the redemption of the 81/8% Notes and the repayment of the prior credit facility, we recorded a loss on early extinguishment of debt of $11.5 million. The loss was comprised of $6.9 million in tender premiums and transaction costs associated with the redemption of the 81/8% Notes and a non-cash charge of $4.6 million in deferred financing costs and original issue discount written-off associated with the redemption of the 81/8% Notes and the repayment of the prior credit facility. Since these transactions relate to the financing of the Company, we believe the gains and losses associated with these specific significant financing transactions are not indicative of our core operating results.
We present Adjusted EBITDA herein because we believe it to be relevant and useful information to our investors since it is consistently used by our management to evaluate the operating performance of our business and to compare our operating performance with that of our competitors. Management also uses Adjusted EBITDA for planning purposes, including the preparation of annual operating budgets, and to determine appropriate levels of operating and capital investments. We therefore utilize Adjusted EBITDA as a useful alternative to net income as an indicator of our operating performance compared to the Company's plan. However, Adjusted EBITDA is not a measure of financial performance under accounting principles generally accepted in the United States of America ("US GAAP"). Accordingly, Adjusted EBITDA should not be used in isolation or as a substitute for other measures of financial performance reported in accordance with US GAAP, such as gross margin, operating income, net income, cash flows from operating, investing and financing activities or other income or cash flow statement data prepared in accordance with US GAAP.
Our definition of Adjusted EBITDA specifically excludes certain items, including loss (gain) on extinguishment of debt, which we believe are not indicative of our core operating results as follows:
These items impacted net income over the periods presented which make direct comparisons between years less meaningful and more difficult without adjusting for them. While we believe that some of the items excluded in the calculation of Adjusted EBITDA are not indicative of our core operating results, these items do impact our income statement, and management therefore utilizes Adjusted EBITDA as an operating performance measure in conjunction with US GAAP measures such as net income.
In addition, we believe the remaining adjustments in arriving at Adjusted EBITDA, comprised of interest expense (income), net, provision for income taxes and depreciation and amortization, are appropriate because these adjustments allow management and investors to evaluate our operating performance without regard to these items which can vary from company to company depending
29
upon the acquisition history, capital intensity, financing options and the method by which its assets were acquired. We continuously manage and monitor our capital structure, tax position and capital spending to ensure that they are appropriate. While the exclusion of these items limits the usefulness of this non-US GAAP measure as a performance measure because it does not reflect all the related expenses we incurred, adjusting for these items and monitoring our performance with and without them helps management and investors more meaningfully evaluate and compare the results of our operations from period to period and to those of other companies.
The computation of Adjusted EBITDA is as follows (in thousands):
| |
Fiscal Year Ended | |||||||||||||||
|---|---|---|---|---|---|---|---|---|---|---|---|---|---|---|---|---|
| |
December 31, 2010 |
December 25, 2009 |
December 26, 2008 |
December 28, 2007 |
December 29, 2006 |
|||||||||||
Net income |
$ | 27,921 | $ | 26,088 | $ | 40,833 | $ | 50,962 | $ | 31,185 | ||||||
Interest expense, net |
18,572 | 18,829 | 27,377 | 31,916 | 30,776 | |||||||||||
Loss (gain) on extinguishment of debt, net |
11,486 | (1,257 | ) | (2,775 | ) | — | 20,843 | |||||||||
Provision for income taxes |
18,829 | 17,073 | 24,625 | 32,460 | 19,495 | |||||||||||
Depreciation and amortization |
20,612 | 19,174 | 17,414 | 15,114 | 14,427 | |||||||||||
|
$ | 97,420 | $ | 79,907 | $ | 107,474 | $ | 130,452 | $ | 116,726 | ||||||
Reconciliation of Average Organic Daily Sales to Net Sales
Average organic daily sales are defined as sales for a period of time divided by the number of shipping days in that period of time excluding any sales from acquisitions made subsequent to the beginning of the prior year period. The computation of average organic daily sales is as follows (dollar amounts in thousands):
| |
Fiscal Year Ended | Fiscal Year Ended | ||||||||||||||||||
|---|---|---|---|---|---|---|---|---|---|---|---|---|---|---|---|---|---|---|---|---|
| |
December 31, 2010 |
December 25, 2009 |
% Variance |
December 25, 2009 |
December 26, 2008 |
% Variance |
||||||||||||||
Net sales |
$ | 1,086,989 | $ | 1,059,278 | 2.6 | % | $ | 1,059,278 | $ | 1,195,663 | (11.4 | )% | ||||||||
Less acquisitions |
(18,645 | ) | — | (13,058 | ) | — | ||||||||||||||
Organic sales |
$ | 1,068,344 | $ | 1,059,278 | 0.9 | % | $ | 1,046,220 | $ | 1,195,663 | (12.5 | )% | ||||||||
Daily sales: |
||||||||||||||||||||
Ship days |
257 | 252 | 252 | 252 | ||||||||||||||||
Average daily sales(1) |
$ | 4,230 | $ | 4,203 | 0.6 | % | $ | 4,203 | $ | 4,745 | (11.4 | )% | ||||||||
Average organic daily sales(2) |
$ | 4,157 | $ | 4,203 | (1.1 | )% | $ | 4,152 | $ | 4,745 | (12.5 | )% | ||||||||
- (1)
- Average
daily sales are defined as sales for a period of time divided by the number of shipping days in that period of time.
- (2)
- Average organic daily sales are defined as sales for a period of time divided by the number of shipping days in that period of time excluding any sales from acquisitions made subsequent to the beginning of the prior year period.
30
Average organic daily sales is presented herein because we believe it to be relevant and useful information to our investors since it is used by our management to evaluate the operating performance of our business, as adjusted to exclude the impact of acquisitions, and compare our organic operating performance with that of our competitors. However, average organic daily sales is not a measure of financial performance under US GAAP and it should be considered in addition to, but not as a substitute for, other measures of financial performance reported in accordance with US GAAP, such as net sales. Management utilizes average organic daily sales as an operating performance measure in conjunction with US GAAP measures such as net sales.
ITEM 7. Management's Discussion and Analysis of Financial Condition and Results of Operations
You should read the following discussion in conjunction with "Selected Financial Data" and our consolidated financial statements included elsewhere in this report. Some of the statements in the following discussion are forward-looking statements. See "Forward-Looking Statements" above.
Overview
We are a leading distributor and direct marketer of MRO products. We have one operating segment, the distribution of MRO products. We stock approximately 100,000 MRO products in the following categories: janitorial and sanitation ("JanSan"); plumbing; heating, ventilation and air conditioning ("HVAC"); hardware, tools and fixtures; electrical and lighting; appliances and parts; security and safety; and other miscellaneous products. Our products are primarily used for the repair, maintenance, remodeling, refurbishment and construction of properties and non-industrial facilities.
Our highly diverse customer base includes facilities maintenance customers, which consist of multi-family housing facilities, educational institutions, lodging and healthcare facilities, government properties and building service contractors; professional contractors who are primarily involved in the repair, remodeling and construction of residential and non-industrial facilities; and specialty distributors, including plumbing and hardware retailers. Our customers range in size from individual contractors and independent hardware stores to apartment management companies and national purchasing groups.
We market and sell our products primarily through thirteen distinct and targeted brands, each of which is recognized in the markets they serve for providing quality products at competitive prices with reliable same-day or next-day delivery. The Wilmar®, AmSan®, CleanSource®, Sexauer®, Maintenance USA® and Trayco® brands generally serve our facilities maintenance customers; the Barnett®, Copperfield®, U.S. Lock® and SunStar® brands generally serve our professional contractor customers; and the Hardware Express®, LeranSM and AF LightingSM brands generally serve our specialty distributors customers. Our multi-brand operating model, which we believe is unique in the industry, allows us to use a single platform to deliver tailored products and services to meet the individual needs of each respective customer group served. We reach our markets using a variety of sales channels, including a sales force of approximately 650 field sales representatives, approximately 350 inside sales and customer service representatives, a direct marketing program consisting of catalogs and promotional flyers, brand-specific websites and a national accounts sales program.
We deliver our products through our network of 57 distribution centers, 25 professional contractor showrooms located throughout the United States, Canada and Puerto Rico, 38 vendor-managed inventory locations at large professional contractor customer locations and a dedicated fleet of trucks. Our broad distribution network enables us to provide reliable, next-day delivery service to approximately 98% of the U.S. population and same-day delivery service to most major metropolitan markets in the U.S.
31
Our information technology and logistics platform supports our major business functions, allowing us to market and sell our products at varying price points depending on the customer's service requirements. While we market our products under a variety of brands, generally our brands draw from the same inventory within common distribution centers and share associated employee and transportation costs. In addition, we have centralized marketing, purchasing and catalog production operations to support our brands. We believe that our information technology and logistics platform also benefits our customers by allowing us to offer a broad product selection at highly competitive prices while maintaining the unique customer appeal of each of our targeted brands. Overall, our common operating platform has enabled us to improve customer service, maintain lower operating costs, efficiently manage working capital and support our growth initiatives.
Acquisition
On October 29, 2010, Interline New Jersey acquired substantially all of the assets and a portion of the liabilities of CleanSource for $54.6 million in cash and an earn-out of up to $5.5 million in cash over two years. CleanSource, which is headquartered in San Jose, California, is a large regional distributor of JanSan supplies. CleanSource offers over 4,000 products and primarily serves institutional facilities in the healthcare and education markets, as well as building services contractors. For the twelve-month period ended September 30, 2010, CleanSource generated approximately $115 million of sales. This acquisition represents a geographical expansion of the Company's offering of JanSan products to the West Coast of the United States.
Refinancing Transactions
On November 16, 2010, Interline New Jersey completed a series of refinancing transactions: (1) an offering of $300.0 million of 7.00% Notes and (2) entering into a $225.0 million ABL Facility. The proceeds from the 7.00% Notes were used to redeem the 81/8% Notes and to repay the indebtedness under the prior credit facility. The 81/8% Notes were redeemed at an average price equal to 104.256%. In connection with the redemption of the 81/8% Notes and the repayment of the prior credit facility, we recorded a loss on early extinguishment of debt of $11.5 million. The loss was comprised of $6.9 million in tender premiums and transaction costs associated with the redemption of the 81/8% Notes and a non-cash charge of $4.6 million in deferred financing costs and original issue discount written-off associated with the redemption of the 81/8% Notes and the repayment of the prior credit facility.
As a result of the acquisition and refinancing transactions described above, our historical financial results or results of operations may not be indicative of our financial results or results of operations in the future.
32
Results of Operations
The following table presents information derived from the consolidated statements of earnings expressed as a percentage of net sales for the periods indicated:
| |
% of Net Sales | |
% of Net Sales | |
|||||||||||||||||
|---|---|---|---|---|---|---|---|---|---|---|---|---|---|---|---|---|---|---|---|---|---|
| |
Fiscal Year Ended | |
Fiscal Year Ended | |
|||||||||||||||||
| |
% Increase (Decrease) 2010 vs. 2009(1) |
% Increase (Decrease) 2009 vs. 2008(1) |
|||||||||||||||||||
| |
December 31, 2010 |
December 25, 2009 |
December 25, 2009 |
December 26, 2008 |
|||||||||||||||||
Net sales |
100.0 | % | 100.0 | % | 2.6 | % | 100.0 | % | 100.0 | % | (11.4 | )% | |||||||||
Cost of sales |
61.9 | 62.8 | 1.1 | 62.8 | 62.4 | (10.8 | ) | ||||||||||||||
Gross profit |
38.1 | 37.2 | 5.2 | 37.2 | 37.6 | (12.4 | ) | ||||||||||||||
Operating Expenses: |
|||||||||||||||||||||
Selling, general and administrative expenses |
29.3 | 29.8 | 0.8 | 29.8 | 28.8 | (8.0 | ) | ||||||||||||||
Depreciation and amortization |
1.9 | 1.8 | 8.9 | 1.8 | 1.4 | 10.2 | |||||||||||||||
Total operating expense |
31.2 | 31.6 | 1.3 | 31.6 | 30.2 | (7.2 | ) | ||||||||||||||
Operating income |
6.9 | 5.6 | 26.9 | 5.6 | 7.4 | (33.4 | ) | ||||||||||||||
(Loss) gain on extinguishment of debt, net |
(1.1 | ) | 0.1 | N/M | 0.1 | 0.2 | (54.7 | ) | |||||||||||||
Interest expense |
(1.7 | ) | (1.8 | ) | (1.8 | ) | (1.8 | ) | (2.4 | ) | (33.1 | ) | |||||||||
Interest and other income |
0.2 | 0.2 | 2.8 | 0.2 | 0.2 | (22.0 | ) | ||||||||||||||
Income before income taxes |
4.3 | 4.1 | 8.3 | 4.1 | 5.5 | (34.1 | ) | ||||||||||||||
Income tax provision |
(1.7 | ) | (1.6 | ) | 10.3 | (1.6 | ) | (2.1 | ) | (30.7 | ) | ||||||||||
Net income |
2.6 | % | 2.5 | % | 7.0 | % | 2.5 | % | 3.4 | % | (36.1 | )% | |||||||||
N/M—Not Meaningful. |
|||||||||||||||||||||
- (1)
- Percent increase (decrease) represents the actual change as a percentage of the prior year's result.
The following discussion refers to the term average daily sales and average organic daily sales. Average daily sales are defined as sales for a period of time divided by the number of shipping days in that period of time. Average organic daily sales are defined as sales for a period of time divided by the number of shipping days in that period of time excluding any sales from acquisitions made subsequent to the beginning of the prior year period. For a reconciliation of average organic daily sales growth to US GAAP-based financial measures, see "Selected Financial Data—Reconciliation of Average Organic Daily Sales to Net Sales."
Fiscal Year Ended December 31, 2010 Compared to Fiscal Year Ended December 25, 2009
Overview. During 2010, our sales increased 2.6%, organic sales increased 0.9%, and average organic daily sales decreased 1.1%. Sales to customers in our facilities maintenance end-market, which makes up 73% of our total sales, increased 2.6%, including our CleanSource acquisition; excluding our CleanSource acquisition, organic sales increased 0.2% and our average organic daily sales decreased 1.7%. Sales to our professional contractor customers, which represent 15% of our total sales, increased 1.8% in total and decreased 0.2% on an average organic daily sales basis. Sales to our specialty distributor customers, which represent 12% of our total sales, increased 3.3% in total and increased 1.3% on an average organic daily sales basis.
We believe our average organic daily sales decrease is associated with the well-publicized general economic downturn over the last few years. Although we are starting to see signs of stabilization, demand from certain customers continues to be negatively impacted by lower levels of residential new
33
construction and renovations activity as well as governmental and educational budget constraints. We expect continued variability within our end-markets; however, we believe the impact on sales related to the market weakness during 2011 will be less severe than we experienced during 2010. We expect sales to our customers to increase modestly during 2011 as limited and uneven economic improvements occur across our end-markets.
Operating income as a percentage of net sales was 6.9% in 2010 compared to 5.6% in 2009. The increase in operating income as a percentage of sales is primarily a result of higher gross profit margins and lower salary and wages expense, lower bad debt expense and lower occupancy related expenses, offset in part by higher fringe benefits and variable compensation expenses as well as higher depreciation and amortization expense.
Net income as a percentage of net sales was 2.6% in 2010 compared to 2.5% in 2009 as a result of the increase in operating income offset by the loss on extinguishment of debt associated with the refinancing transactions mentioned above.
Effective December 26, 2009, the first day of our 2010 fiscal year, we reinstituted merit-based salary increases and the matching of employee contributions to our qualified profit sharing plan at a rate of 25% of the first 5% of the employee's base salary up to the statutory maximum of $5,500 per employee. In light of the current economic conditions, we continue to evaluate the cost and benefits associated with these cost control measures.
We are continuing to focus on keeping operating costs as a percentage of sales low while also investing in our operating platform for the long term. Accordingly, our plans include continued investments in the consolidation of our distribution network and in information technology solutions.
Net Sales. Net sales increased by $27.7 million during 2010 to $1,087.0 million from $1,059.3 million in 2009, an increase of 2.6%, primarily attributable to the CleanSource acquisition. Organic sales were $1,068.3 million in 2010 and $1,059.3 million in 2009, a 0.9% increase primarily due to five additional shipping days during the fiscal year ended December 31, 2010 compared to the fiscal year ended December 25, 2009. Average organic daily sales decreased 1.1% resulting from a 1.7% decrease in sales to our facilities maintenance customers and a 0.2% decrease in sales to our professional contractor customers partially offset by a 1.3% increase in sales to our specialty distributor customers. We believe our average organic daily sales decrease is associated with the well-publicized general economic downturn over the last few years.
Gross Profit. Gross profit increased by $20.3 million, or 5.2%, to $414.2 million in 2010 from $394.0 million in 2009. This increase in gross profit was attributable to our continued focus on increasing our gross profit margins as well as our acquisition of CleanSource. Our gross profit margins increased 90 basis points to 38.1% in 2010 from 37.2% in 2009. This increase in gross margin is primarily due to continued improvement in selling margins from the optimization of product pricing as well as higher supplier rebates, offset in part from lower gross margins related to our CleanSource acquisition.
Selling, General and Administrative Expenses. SG&A expenses increased by $2.7 million, or 0.8%, to $318.8 million in 2010 from $316.1 million in 2009. As a percentage of net sales, SG&A decreased 50 basis points to 29.3% for 2010 compared to 29.8% for 2009. The decrease in SG&A expenses as a percentage of sales is primarily due to lower salary and wages expense, lower bad debt expense, lower occupancy related expenses and the SG&A expense impact from our CleanSource acquisition, offset in part by higher fringe benefit and variable compensation expenses.
Depreciation and Amortization. Depreciation and amortization expense increased by $1.7 million, or 8.9%, to $20.2 million in 2010 from $18.6 million in 2009. As a percentage of net sales, depreciation and amortization was 1.9%, 10 basis points higher than the 1.8% rate in 2009. These increases were due to higher depreciation resulting from our higher capital spending over the last three years
34
associated with our information technology infrastructure and distribution center consolidation and integration efforts as well as from our CleanSource acquisition.
Operating Income. As a result of the foregoing, operating income increased $16.0 million, or 26.9%, to $75.2 million in 2010 from $59.2 million in 2009. As a percentage of net sales, operating income increased to 6.9% in 2010 compared to 5.6% in 2009.
(Loss) Gain on Extinguishment of Debt. Loss on extinguishment of debt was $11.5 million in 2010 compared to a gain on extinguishment of debt of $1.3 million in 2009. During 2010, we repurchased $137.3 million of the 81/8% Notes and repaid the indebtedness under our prior credit facility. The remaining $13.4 million of the 81/8% Notes were redeemed on January 3, 2011. The 81/8% Notes were redeemed at an average price of 104.256% of par. In connection with the redemption of the 81/8% Notes and the repayment of the prior credit facility, we recorded a loss on early extinguishment of debt of $11.5 million. The loss was comprised of $6.9 million in tender premiums and transaction costs associated with the redemption of the 81/8% Notes and a non-cash charge of $4.6 million in deferred financing costs and original issue discount written-off associated with the redemption of the 81/8% Notes and the repayment of the prior credit facility. During 2009, we repurchased $36.4 million of the 81/8% Notes at an average of 93.8% of par, or $34.2 million, including fees. In addition, we repaid $60.2 million of our term loan ahead of schedule. In connection with the repurchase of the 81/8% Notes and the term loan payments, we recorded a gain on extinguishment of debt of $1.3 million net of $0.1 million and $0.9 million in original issue discount and deferred financing costs written-off, respectively.
Interest Expense. Interest expense decreased by $0.3 million to $18.7 million in 2010 from $19.0 million in 2009. This decrease was primarily due to average lower debt balances outstanding compared to last year, associated with the repayments of our term debt and the repurchase of the 81/8% Notes, and lower interest rates.
Interest and Other Income. Interest and other income increased by less than $0.1 million to $1.8 million in 2010 from $1.7 million in 2009. This increase was primarily attributable to a lesser impact from foreign exchange rates in 2010 compared to 2009 offset in part by lower interest income earned from our short-term investments.
Provision for Income Taxes. The effective tax rate was 40.3% in 2010 compared to 39.6% in 2009. The increase in the effective tax rate was primarily due to the impact from our refinancing transaction, the write-off of deferred tax assets associated with share-based compensation arising from stock options that were forfeited due to employee terminations, lower tax exempt interest income, and the impact from our CleanSource acquisition.
Fiscal Year Ended December 25, 2009 Compared to Fiscal Year Ended December 26, 2008
Overview. During 2009, our sales declined 11.4% and organic sales declined 12.5%. We believe this decline was in part associated with the widely reported general economic downturn and credit crisis. Sales to customers in our facilities maintenance end-market, which made up 73% of our total sales, declined 6.2% during 2009 compared to 2008. Sales to our professional contractor and specialty distributor customers, which represented 16% and 11% of our total sales, respectively, declined 25.3% and 18.5%, respectively. Sales to these customers continued to be impacted by the prolonged declines in residential new construction and renovations activity.
Net income as a percentage of net sales was 2.5% in 2009 compared to 3.4% in 2008. The decline in net income was a result of lower sales and gross margins, and the costs associated with our operational initiatives, such as employee separation benefits, closing of underperforming professional contractor showrooms, consolidation of certain distribution centers, and higher bad debt expense. These
35
higher costs were offset in part by decreases in compensation and fringe benefits, lower delivery costs and lower interest expense associated with lower debt balances outstanding and lower interest rates.
Net Sales. Net sales decreased by $136.4 million, or 11.4%, to $1,059.3 million in 2009 from $1,195.7 million in 2008. Average organic daily sales were $4.2 million in 2009 and $4.7 million in 2008, a 12.5% decrease. The decline in sales resulted from the net impact of a 6.2% decrease in sales to our facilities maintenance customers and a continued decline in sales to our professional contractor and specialty distributor customers of 25.3% and 18.5%, respectively.
Gross Profit. Gross profit decreased by $55.7 million, or 12.4%, to $394.0 million in 2009 from $449.6 million in 2008 as a direct result of the decrease in sales as well as the decline of gross profit margin during the year. Gross profit margins decreased 40 basis points to 37.2% in 2009 from 37.6% in 2008. This decrease in our gross profit margins was primarily related to a decline in our direct selling gross margins arising from heightened price competition associated with the decrease in sales and higher operating costs as a percentage of sales at our distribution centers driven from the decline in sales.
Selling, General and Administrative Expenses. SG&A expenses decreased by $27.7 million, or 8.0%, to $316.1 million in 2009 from $343.8 million in 2008. As a percentage of net sales, SG&A increased 100 basis points to 29.8% for 2009 compared to 28.8% for 2008. The increase in SG&A expenses as a percentage of sales was primarily due to $3.8 million in increased bad debt expense primarily associated with a customer seeking Chapter 11 bankruptcy protection, $2.3 million in additional severance and distribution center closing costs associated with our distribution and operational initiatives (such as headcount reductions, consolidation of certain distribution centers and closing of underperforming professional contractor centers), the write-off of $0.7 million in deferred acquisition costs due to the adoption of a new accounting standard on business combinations and higher occupancy costs on a lower sales base. We have also increased our accounts receivable reserve to adjust for higher levels of risk in our portfolio stemming from an unprecedented market and credit environment. These costs were partially offset by the cost savings derived from the reduction in workforce in the fourth quarter of 2008 and the first quarter of 2009, the closing of underperforming professional contractor centers and consolidation of certain distribution centers during the last six months of 2008 and the first nine months of 2009, and various other efforts aimed at reducing costs.
Depreciation and Amortization. Depreciation and amortization expense increased by $1.7 million, or 10.2%, to $18.6 million in 2009 from $16.9 million in 2008. As a percentage of net sales, depreciation and amortization was 1.8% or 40 basis points higher than the 1.4% rate in 2008. These increases were due to higher depreciation resulting from our higher capital spending over the last three years associated with our information technology infrastructure and distribution center consolidation and integration efforts. In 2009, we had $12.6 million of depreciation and $6.0 million of amortization compared to $11.1 million and $5.8 million in 2008, respectively.
Operating Income. As a result of the foregoing, operating income decreased by $29.7 million, or 33.4%, to $59.2 million in 2009 from $89.0 million in 2008.
Gain on Extinguishment of Debt. Gain on extinguishment of debt was $1.3 million in 2009 compared to $2.8 million in 2008. During 2009, we repurchased $36.4 million of the 81/8% Notes at an average of 93.8% of par, or $34.2 million, including fees. In addition, we repaid $60.2 million of our term loan ahead of schedule. In connection with the repurchase of the 81/8% Notes and the term loan payments, we recorded a gain on extinguishment of debt of $1.3 million net of $0.1 million and $0.9 million in original issue discount and deferred financing costs written-off, respectively. In December 2008, we repurchased $12.9 million of the 81/8% Notes at 773/8% of par, or $10.0 million. In connection with the repurchase of the 81/8% Notes, we recorded a gain on extinguishment of debt of $2.8 million net of $0.1 million in deferred financing costs written-off.
36
Interest Expense. Interest expense decreased by $9.4 million to $19.0 million in 2009 from $28.5 million in 2008. This decrease was primarily due to $97.7 million in lower debt balances outstanding compared to 2008 associated with the repayments of our term loan and the repurchase of the 81/8% Notes as well as lower interest rates.
Interest and Other Income. Interest and other income decreased by $0.5 million to $1.7 million in 2009 from $2.2 million in 2008. This decrease was primarily attributable to lower interest income associated with lower interest rates earned on cash and cash equivalents balances.
Provision for Income Taxes. The provision for income taxes was $17.1 million in 2009 compared to a provision of $24.6 million in 2008. The effective tax rate for 2009 increased by 200 basis points to 39.6% compared to 37.6% for 2008. The increase in the effective tax rate was due to the decrease in the benefit recognized associated with previously unrecognized tax benefits and the write-off of deferred tax assets associated with share-based compensation arising from stock options that were forfeited due to employee terminations as well as the decrease in tax exempt interest recorded. During 2009, we resolved an uncertain tax position with regards to one state tax jurisdiction, and we made an adjustment of $0.1 million, which favorably impacted our effective tax rate for the year. This compares to the $0.8 million we derecognized related to uncertain tax positions during 2008.
Seasonality
We experience some seasonal fluctuations as sales of our products typically increase in the second and third fiscal quarters of the year due to increased apartment turnover and related maintenance and repairs in the multi-family residential housing sector during these periods. Typically, November, December and January sales are lower across most of our brands because customers may defer purchases at year-end as their budget limits are met and because of the winter holiday season between Thanksgiving Day and New Year's Day. Our Copperfield brand experiences approximately two-thirds of its sales between July and December. As such, our first quarter sales and earnings typically tend to be lower than the remaining three quarters of the year.
Liquidity and Capital Resources
Overview
We are a holding company whose only asset is the stock of our subsidiaries. We conduct virtually all of our business operations through Interline New Jersey. Accordingly, our only material sources of cash are dividends and distributions with respect to our ownership interests in Interline New Jersey that are derived from the earnings and cash flow generated by Interline New Jersey.
On November 16, 2010, Interline New Jersey completed a series of refinancing transactions: (1) an offering of $300.0 million of the 7.00% Notes and (2) entering into a $225.0 million ABL Facility. The proceeds from the 7.00% Notes were used to redeem $137.3 million of the 81/8% Notes and to repay the indebtedness under the prior credit facility of Interline New Jersey. The remaining $13.4 million of the 81/8% Notes were redeemed on January 3, 2011. The 81/8% Notes were redeemed at an average price of 104.256% of par. As a result of these refinancing transactions, Interline New Jersey extended the maturities of its debt and interest expense will increase compared to 2010.
The 7.00% Notes were priced at 100% of their principal amount of $300.0 million. The 7.00% Notes mature on November 15, 2018 and interest is payable on May 15 and November 15 of each year, beginning on May 15, 2011. Debt issuance costs capitalized in connection with the 7.00% Notes were $6.9 million.
The 7.00% Notes are generally unsecured, senior subordinated obligations of Interline New Jersey that rank equal to all of Interline New Jersey's existing and future senior subordinated indebtedness, junior to all of Interline New Jersey's existing and future senior indebtedness, including indebtedness
37
under the ABL Facility, and senior to any of Interline New Jersey's existing and future obligations that are, by their terms, expressly subordinated in right of payment to the 7.00% Notes. The 7.00% Notes are unconditionally guaranteed, jointly and severally, on an unsecured senior subordinated basis by the Company and Interline New Jersey's existing and future domestic subsidiaries that guarantee the ABL Facility (collectively the "Guarantors"). The Guarantors have issued guarantees (each a "Guarantee" and collectively, the "Guarantees") of Interline New Jersey's obligations under the 7.00% Notes and the Indenture on an unsecured senior subordinated basis. Each Guarantee ranks equal in right of payment with all of the Guarantors' existing and future senior subordinated indebtedness, junior to all of the Guarantors' existing and future senior indebtedness, including guarantees of the ABL Facility, and senior to all of the Guarantors' existing and future obligations that are, by their terms, expressly subordinated in right of payment to the Guarantees. The 7.00% Notes are not guaranteed by any of Interline New Jersey's foreign subsidiaries. For a description of certain terms of the 7.00% Notes, see Note 10. Debt to our audited consolidated financial statements included in this report.
The debt instruments of Interline New Jersey, primarily the ABL Facility and the indenture governing the terms of the 7.00% Notes, contain significant restrictions on the payment of dividends and distributions to the Company by Interline New Jersey. The ABL facility allows Interline New Jersey to pay dividends, make distributions to the Company or repurchase its shares from the Company in an aggregate amount not to exceed $25.0 million during any 12-month period, so long as there is no default and Interline New Jersey meets certain availability requirements. Only if these conditions are met and, in addition, Interline New Jersey's fixed charge coverage ratio is at least 1.20 to 1.00, is there no cap on Interline New Jersey's ability to pay dividends and repurchase its shares. In addition, ordinary course distributions for overhead (up to $3.0 million annually) and taxes are permitted, as are annual payments of up to $7.5 million in respect of our stock option or other benefit plans for management or employees. The indenture for the 7.00% Notes generally restricts the ability of Interline New Jersey to pay distributions to the Company and to make advances to, or investments in, the Company to an amount equal to 50% of the net income of Interline New Jersey, plus an amount equal to the net proceeds from certain equity issuances, subject to compliance with a leverage ratio and no default having occurred and continuing. The indenture also contains certain permitted exceptions including (1) allowing the Company to pay our franchise taxes and other fees required to maintain our corporate existence, to pay for general corporate and overhead expenses and to pay expenses incurred in connection with certain financing, acquisition or disposition transactions, in an aggregate amount not to exceed $15.0 million per year; (2) allowing certain tax payments; and (3) allowing other distributions in an aggregate amount not to exceed the greater of $85.0 million and 8.5% of the total assets of Interline New Jersey and its restricted subsidiaries, provided there is no default. For a further description of the ABL Facility, see "Credit Facility" below.
As of December 31, 2010, we had $300.0 million of the 7.00% Notes and $13.4 million of the 81/8% Notes outstanding and $169.8 million of availability under our ABL Facility, net of $7.9 million in letters of credit.
Financial Condition
Working capital increased by $4.3 million to $301.6 million as of December 31, 2010 from $297.3 million as of December 25, 2009.
Cash Flow
Operating Activities. Net cash provided by operating activities was $60.8 million during the year ended December 31, 2010 compared to net cash provided by operating activities of $144.3 million and $56.2 million during the years ended December 25, 2009 and December 26, 2008, respectively.
Net cash provided by operating activities of $60.8 million during the year ended December 31, 2010 primarily consisted of net income of $27.9 million, adjustments for non-cash items of $45.2 million
38
and cash used by working capital items of $16.6 million. Adjustments for non-cash items primarily consisted of $20.6 million in depreciation and amortization of property, equipment and intangible assets, including $0.4 million of depreciation recorded within cost of sales, $11.5 million loss on the early extinguishment of our 81/8% Notes, $5.7 million in provisions for doubtful accounts, $3.5 million in share-based compensation, net of excess tax benefits, $2.5 million in deferred income taxes and $1.1 million in amortization of debt issuance costs. The cash provided by working capital items primarily consisted of $7.5 million from increased trade payables balances as a result of the timing of purchases and related payments, $5.2 million generated from trade receivables resulting from increased collections and $1.7 million increased accrued expenses arising from the issuance of the 7.00% Notes. The sources of cash were partially offset by $22.7 million in increased inventory primarily as a result of increased demand, opportunistic year-end purchases and the stocking of our distribution centers in Chicago, Illinois; Jacksonville, Florida; and Philadelphia, Pennsylvania, $8.9 million in increased prepaid expenses and other current assets primarily from higher rebates receivable and $1.5 million from the increase in income taxes.
Net cash provided by operating activities of $144.3 million during the year ended December 25, 2009 primarily consisted of net income of $26.1 million, adjustments for non-cash items of $40.0 million and cash provided by working capital items of $78.0 million. Adjustments for non-cash items primarily consisted of $19.2 million in depreciation and amortization of property, equipment and intangible assets, including $0.6 million of depreciation recorded within cost of sales, $10.5 million in provisions for doubtful accounts, $5.7 million in deferred income taxes, $3.8 million in share-based compensation, $1.1 million in amortization of debt issuance costs and the write-off of $0.7 million in deferred acquisition costs due to the adoption of a new accounting standard on business combinations offset by $1.3 million in net gain from the repurchase of $36.4 million of our 81/8% Notes and the repayment of $60.2 million of our term debt. The cash provided by working capital items primarily consisted of $38.1 million from decreased inventory levels as a result of decreased purchases associated with lower demand, $17.7 million from increased trade payables balances as a result of the timing of purchases and related payments, $9.2 million generated from trade receivables resulting from increased collections and the decline in sales, $5.9 million from accrued expenses arising from the timing of the payment of certain expenses primarily from severance and distribution center closing costs associated with our previously discussed operational initiatives, such as headcount reductions, consolidation of certain distribution centers and closing of underperforming professional contractor centers as well as higher accrued compensation and related benefits at period-end, $4.3 million from decreased prepaid expenses and other current assets primarily from lower rebates from vendors on lower purchases and $2.8 million from the increase in income taxes.
Net cash provided by operating activities during the year ended December 26, 2008 of $56.2 million primarily consisted of net income of $40.8 million and adjustments for non-cash items of $25.8 million offset by cash used in working capital of $9.6 million. Adjustments for non-cash items primarily consisted of $17.4 million in depreciation and amortization of property, equipment and intangible assets, including $0.5 million of depreciation recorded within cost of sales, $3.8 million in share-based compensation, $6.7 million in provisions for doubtful accounts and $1.1 million in amortization of debt issuance costs offset by $2.8 million in net gain from the repurchase of $12.9 million of our 81/8% Notes. The cash used in working capital consisted of increased inventory levels of $19.1 million as a result of lower sales in the latter part of the year as well as increased inventory to stock our distribution center in Salt Lake City, Utah, and new MRO product offerings for our institutional facilities maintenance customers, increased accrued expenses primarily from lower accrued compensation and related benefits of $6.8 million and overpayment of estimated income taxes of $2.6 million due to lower net income than expected. These uses in cash were partially offset by $10.3 million generated from trade receivables resulting from increased collections and the decline in sales and increased trade payables balances of $6.9 million as a result of the increased inventory levels and the timing of related payments for this inventory.
39
Investing Activities. Net cash used in investing activities was $71.1 million during the year ended December 31, 2010 compared to net cash used in investing activities of $14.5 million during the year ended December 25, 2009 and net cash provided by investing activities of $17.7 million during the year ended December 26, 2008.
Net cash used in investing activities during the year ended December 31, 2010 was attributable to $54.8 million in costs related to purchases of businesses, $17.7 million in capital expenditures made in the ordinary course of business and $1.4 million in net sales and maturities of short-term investments comprised of pre-refunded municipal bonds secured by U.S. Treasury securities.
Net cash used in investing activities during the year ended December 25, 2009 was attributable to $11.2 million in capital expenditures made in the ordinary course of business, $1.9 million in costs related to purchases of businesses primarily associated with earn-out provisions related to the 2008 acquisition of Eagle Maintenance Supply, Inc. ("Eagle") and $1.5 million in net purchases of short-term investments comprised of pre-refunded municipal bonds secured by U.S. Treasury securities.
Net cash provided by investing activities during the year ended December 26, 2008 was attributable to $48.5 million in net sales of short-term investments comprised of tax exempt auction rate securities and variable rate demand notes offset by $20.6 million in capital expenditures made in the ordinary course of business and $10.2 million in costs related to purchases of businesses, net of cash acquired, including $9.6 million for Eagle.
Financing Activities. Net cash used in financing activities totaled $2.0 million during the year ended December 31, 2010 compared to net cash used in financing activities of $93.6 million during the year ended December 25, 2009 and net cash used in financing activities of $15.8 million during the year ended December 26, 2008.
Net cash used in financing activities during the year ended December 31, 2010 was primarily attributable to our repayment of $156.2 million of term debt and capital lease obligations, our repurchase of $143.7 million of our 81/8% Notes, including payment of tender premiums and expenses, payment of $10.4 million of debt issuance costs on our 7.00% Notes, and net decrease in purchase card payable of $3.5 million offset by proceeds from the issuance of our 7.00% Notes of $300.0 million and $11.7 million of proceeds from stock options exercised and excess tax benefits from share-based compensation, net of treasury stock acquired to satisfy minimum statutory tax withholding requirements resulting from the vesting or exercising of equity awards.
Net cash used in financing activities during the year ended December 25, 2009 was primarily attributable to our repayment of $61.8 million of term debt and capital lease obligations and our repurchase of $36.4 million of our 81/8% Notes at an average of 93.8% of par, or $34.2 million offset by the net increase in purchase card payable of $1.4 million and $1.0 million of proceeds from stock options exercised and excess tax benefits from share-based compensation, net of treasury stock acquired to satisfy minimum statutory tax withholding requirements resulting from the vesting or exercising of equity awards.
Net cash used in financing activities during the year ended December 26, 2008 was primarily attributable to our repurchase of $12.9 million of our 81/8% Notes at 773/8% of par, or $10.0 million, the net decrease in purchase card payable of $2.9 million, our repayment of $2.7 million of term debt and capital lease obligations and $1.1 million for the acquisition of treasury stock to satisfy minimum statutory tax withholding requirements resulting from the vesting or exercising of equity awards offset by $0.8 million of proceeds from stock options exercised and excess tax benefits from share-based compensation.
40
Capital Expenditures
Capital expenditures were $17.7 million in 2010, $11.2 million in 2009 and $20.6 million in 2008. Capital expenditures as a percentage of net sales were 1.6%, 1.1% and 1.7% in 2010, 2009 and 2008, respectively.
Capital expenditures during 2010 were driven primarily by the continued consolidation of our distribution center network including the investments in larger more efficient distribution centers and enhancements to our information technology systems. In addition, during 2010, we acquired $2.5 million of property in the form of leasehold improvements through lease incentives primarily associated with our Chicago, Illinois; Jacksonville, Florida; and Philadelphia, Pennsylvania distribution centers.
Capital expenditures during 2009 were driven primarily by the continued consolidation of our distribution center network including the investments in larger more efficient distribution centers. In addition, during 2009, we acquired $3.0 million of property in the form of leasehold improvements through lease incentives associated with our corporate headquarters in Jacksonville, Florida and our San Bernardino, California distribution center.
Capital expenditures during 2008 were primarily made for the upgrade of our telecommunications network, the consolidation of our distribution center network, the purchase of warehouse equipment and overall investments in our information technology solutions.
Credit Facility
The ABL Facility provides for revolving credit financing of up to $225.0 million subject to borrowing base availability, with a maturity of five years, including sub-facilities for letters of credit, not exceeding $40.0 million, and swingline loans. In addition, the ABL Facility provides that the revolving commitments may be increased to $325.0 million, subject to certain terms and conditions. The ABL Facility has a 5-year term and any borrowings outstanding will be due and payable in full on November 15, 2015. Debt issuance costs capitalized in connection with the ABL Facility were $3.5 million.
The borrowing base at any time equals the sum (subject to certain eligibility requirements, reserves and other adjustments) of:
- •
- 85% of eligible trade receivables; and
- •
- the lesser of (x) 65% of eligible inventory, valued at the lower of cost or market, and (y) 85% of the net orderly liquidation value of eligible inventory.
The ABL Facility includes borrowing capacity for letters of credit and for borrowings on same-day notice, referred to as swingline loans. All borrowings under the ABL Facility will be subject to the satisfaction of customary conditions, including absence of a default and accuracy of representations and warranties.
Borrowings under the ABL Facility bear interest at a rate per annum equal to, at Interline New Jersey's option, either adjusted LIBOR or at an alternate base rate, in each case plus an applicable margin. The applicable margin will initially be equal to 2.50% per annum for loans bearing interest by reference to the adjusted LIBOR and 1.50% per annum for loans bearing interest by reference to the alternate base rate and, after the delivery of certain financial reports following the first full fiscal quarter ending after the closing date, will be adjusted quarterly by reference to a grid based on average availability under the ABL Facility.
In addition, Interline New Jersey will be required to pay each lender a commitment fee at a rate equal to 0.50% per annum, in respect of any unused commitments if the average utilization under the
41
ABL Facility during the preceding calendar quarter is 50% or higher, and equal to 0.625% if the average utilization under the ABL Facility during the preceding calendar quarter is less than 50%.
During any period after the occurrence and continuance of an event of default (and continuing for a certain period of time thereafter), or after availability under the ABL Facility is less than the greater of (i) $35.0 million and (ii) 17.5% of the total revolving commitments at such time (and continuing for a certain period of time thereafter), the ABL Facility will, subject to exceptions, require mandatory prepayments, but not permanent reductions of commitments, and subject to a right of reinvestment, in amounts equal to 100% of the net cash proceeds from permitted non-ordinary-course asset sales and casualty and condemnation events, as well as from any equity issuance or incurrence of debt not otherwise permitted under the ABL Facility. In addition, Interline New Jersey is required to pay down loans under the ABL Facility if the total amount of outstanding obligations thereunder exceeds the lesser of the aggregate amount of the revolving commitments thereunder and the applicable borrowing base. Interline New Jersey may prepay loans and permanently reduce commitments under the ABL Facility at any time in certain minimum principal amounts, without premium or penalty (except LIBOR breakage costs, if applicable).
Borrowings under the ABL Facility are guaranteed by the Company and Interline New Jersey's existing and future domestic subsidiaries (collectively the "Guarantors") and are secured by first priority liens on substantially all of the assets of Interline New Jersey and the Guarantors.
The ABL Facility requires that if excess availability is less than the greater of (a) 12.5% of the commitments and (b) $28.1 million, Interline New Jersey must comply with a minimum fixed charge coverage ratio test of 1.00:1.00 and certain other covenants. In addition, the ABL Facility includes negative covenants that, subject to significant exceptions, limit Interline New Jersey's ability and the ability of the Guarantors to, among other things, incur debt, incur liens and engage in sale leaseback transactions, make investments and loans, pay dividends, engage in mergers, acquisitions and asset sales, prepay certain indebtedness, amend the terms of certain material agreements, enter into agreements limiting subsidiary distributions, engage in certain transactions with affiliates and alter the business that Interline New Jersey conducts.
The ABL Facility contains customary events of default, including, but not limited to, payment defaults, breaches of representations and warranties, covenant defaults, cross-defaults to certain indebtedness, certain events of bankruptcy, certain events under ERISA, material judgments, actual or asserted failure of any guaranty or security document supporting the ABL Facility to be in full force and effect and changes of control. If such an event of default occurs, the lenders under the ABL Facility would be entitled to take various actions, including the acceleration of amounts due under the ABL Facility and all actions permitted to be taken by a secured creditor.
We are currently in compliance with all covenants contained within the ABL Facility.
Liquidity
Historically, our capital requirements have been for debt service obligations, working capital requirements, including inventory, accounts receivable and accounts payable, acquisitions, the expansion and maintenance of our distribution network and upgrades of our information technology. We expect this to continue in the foreseeable future. Historically, we have funded these requirements through cash flow generated from operating activities and funds borrowed under our credit facilities. We expect our cash on hand as well as cash flow from operations and availability under our ABL Facility to be our primary source of funds in the future. Letters of credit, which are issued under our ABL Facility, are used to support payment obligations incurred for our general corporate purposes.
42
As of December 31, 2010, we had $169.8 million of availability under our ABL Facility, net of $7.9 million in letters of credit. We believe that cash and cash equivalents on hand, cash flow from operations and available borrowing capacity under our ABL Facility will be adequate to finance our ongoing operational cash flow needs and debt service obligations in the foreseeable future.
Contractual Obligations and Off-Balance Sheet Arrangements
The following table sets forth our contractual obligations as of December 31, 2010 (in thousands):
| |
Total | Less than 1 year |
2-3 years |
4-5 years |
After 5 years |
|||||||||||
|---|---|---|---|---|---|---|---|---|---|---|---|---|---|---|---|---|
81/8% Notes(1) |
$ | 13,955 | $ | 13,955 | $ | — | $ | — | $ | — | ||||||
7.00% Notes |
300,000 | — | — | — | 300,000 | |||||||||||
ABL Facility(2) |
— | — | — | — | — | |||||||||||
Interest |
168,000 | 21,000 | 42,000 | 42,000 | 63,000 | |||||||||||
Operating leases |
103,112 | 23,473 | 34,088 | 24,099 | 21,452 | |||||||||||
Capital leases |
1,703 | 695 | 919 | 89 | — | |||||||||||
Employment agreements |
6,377 | 5,372 | 1,005 | — | — | |||||||||||
Other(3) |
4,740 | 2,393 | 1,972 | 211 | 164 | |||||||||||
Total contractual cash obligations(4)(5) |
$ | 597,887 | $ | 66,888 | $ | 79,984 | $ | 66,399 | $ | 384,616 | ||||||
- (1)
- The
remaining $13.4 million of the 81/8% Notes was redeemed on January 3, 2011. The $14.0 million paid included a
$0.5 million call premium and a $0.1 million interest payment.
- (2)
- Our
ABL Facility calls for an unused commitment fee of 0.625% which is excluded from the table. As of December 31, 2010, we had $7.9 million
in letters of credit issued under the ABL Facility. See Liquidity and Capital Resources above for more information.
- (3)
- Other
includes deferred compensation and retirement plans totaling $0.7 million payable in equal increments over seven years, and the fair market
value of the earn-out related to the CleanSource acquisition of $4.0 million payable over two years if targets are reached.
- (4)
- Trade
accounts payable of $96.9 million are excluded from the table but generally payable within 30 to 60 days. See Item 8. Financial
Statements and Supplementary Data and the accompanying audited consolidated financial statements.
- (5)
- As more fully disclosed in Note 17. Income Taxes to our audited consolidated financial statements included in this report, as of December 31, 2010, we are unable to make a reasonably reliable estimate of the timing of payments in individual years beyond 12 months due to uncertainties in the timing of tax audit outcomes. As a result, this amount is not included in the table above.
As of December 31, 2010, except for operating leases and letters of credit, we had no material off-balance sheet arrangements.
Critical Accounting Policies
In preparing the consolidated financial statements in conformity with US GAAP, we are required to make certain estimates, judgments and assumptions. These estimates, judgments and assumptions affect the reported amounts of assets and liabilities, including the disclosure of contingent assets and liabilities, at the date of the financial statements and the reported amounts of revenues and expenses during the periods presented. On an ongoing basis, we evaluate these estimates and assumptions. We base our estimates and assumptions on historical experience and on various other factors that we believe are reasonable at the time we make the estimates and assumptions. Actual results may differ from these estimates and assumptions under different circumstances or conditions. The significant
43
accounting policies that we believe are the most critical in order to fully understand and evaluate our financial position and results of operations include the following policies.
Revenue Recognition
While our recognition of revenue is predominantly derived from routine transactions and does not involve significant judgment, revenue recognition represents an important accounting policy for us. We recognize a sale when the product has been shipped and risk of loss has passed to the customer, collection of the resulting receivable is probable, persuasive evidence of an arrangement exists and the price is fixed or determinable. Sales are recorded net of estimated discounts, rebates and returns. A portion of our sales is delivered directly from the supplier to our customers. These direct-shipment sales are recorded on a gross basis with the corresponding cost of goods sold. We provide limited product return and protection rights to certain customers. We accrue product return reserves. The provision is made for estimated product returns based on sales volumes and our experience. Actual returns have not varied materially from amounts provided historically.
Vendor Rebates
Many of our arrangements with our vendors provide for us to receive a rebate of a specified amount, payable to us when we achieve any of a number of measures generally related to the volume of purchases from our vendors. We account for these rebates as a reduction of the prices of the related vendors' products, which reduces the inventory cost until the period in which we sell the product, at which time these rebates reduce cost of sales in our income statement. Throughout the year, we estimate the amount of rebates receivable based upon the expected level of purchases. We continually revise these estimates to reflect actual rebates earned based on actual purchase levels. Historically, our actual rebates have been within our expectations used for our estimates. If we fail to achieve a measure which is required to obtain a vendor rebate, we will record a charge in the period that we determine the criteria or measure for the vendor rebate will not be met to the extent the vendor rebate was estimated and included as a reduction to cost of sales. If market conditions were to change, vendors may change the terms of some or all of these programs. Although these changes would not affect the amounts which we have recorded related to products already purchased, it may impact our gross margin on products we sell or revenues earned in future periods.
Allowance for Doubtful Accounts
We maintain an allowance for doubtful accounts for estimated losses resulting from the inability to collect outstanding amounts from customers. The allowance includes specific amounts for those accounts that are likely to be uncollectible, such as accounts of customers in bankruptcy and general allowances for those accounts that management currently believes to be collectible but may later become uncollectible. Estimates are used to determine the allowance for bad debts and are based on historical collection experience, current economic trends, credit worthiness of customers and changes in customer payment terms. Adjustments to credit limits are made based upon payment history and our customers' current credit worthiness. If the financial condition of our customers were to deteriorate, additions to the allowance may be needed that will increase selling, general and administrative expenses and decrease accounts receivable.
Valuation of Excess and Obsolete Inventory
Inventories are valued at the lower of cost or market. We determine inventory cost using the average cost method. We adjust inventory for excess and obsolete inventory and for the difference by which the cost of the inventory exceeds the estimated market value. In order to determine the adjustments, management reviews inventory quantities on hand, slow movement reports and sales history reports. Management estimates the required adjustment based on estimated demand for products and market conditions. To the extent historical results are not indicative of future results and
44
if events occur that affect our relationships with suppliers or the salability of our products, additional write-offs may be needed that will increase our cost of sales and decrease inventory.
Goodwill, Intangibles and Other Long-Lived Assets
Management assesses the recoverability of our goodwill and indefinite-lived identifiable intangibles on an annual basis. Management also assesses the recoverability of goodwill, identifiable intangibles and other long-lived assets whenever events or changes in circumstances indicate that the carrying value may not be recoverable. The following factors, if present, may trigger an impairment review: (1) significant underperformance relative to expected historical or projected future operating results; (2) significant negative industry or economic trends; (3) a significant increase in competition; and (4) a significant increase in interest rates on debt. If the recoverability of these assets is unlikely because of the existence of one or more of the above-mentioned factors, an impairment analysis is performed using a projected discounted cash flow method. Management must make assumptions regarding estimated future cash flows and other factors to determine the fair value of these respective assets. If these estimates or related assumptions change in the future, we may be required to record an impairment charge. Impairment charges would be included in our statements of operations, and would result in reduced carrying amounts of the related assets in our balance sheets.
Share-Based Compensation
Under the fair value recognition provisions of US GAAP, share-based compensation cost is measured at the grant date based on the fair value of the award and is recognized as expense on a straight-line basis over the requisite service period, which is generally the vesting period. We currently use the Black-Scholes option pricing model to determine the fair value of stock options. The fair value of restricted stock awards, restricted share units (depending on the grant) and deferred stock units is based on the fair market values of the underlying stock on the dates of grant. The determination of the fair value of stock-based awards on the date of grant using an option pricing model is affected by our stock price as well as assumptions regarding a number of complex and subjective variables. These variables include our expected stock price volatility over the expected term of the awards, actual and projected employee stock option exercise behaviors, risk-free interest rate, estimated forfeitures and expected dividends.
We estimate the expected term of options granted by calculating the average term from our historical stock option exercise experience. We estimate the volatility of our common stock based on the historical performance of our common stock. We base the risk-free interest rate on zero-coupon yields implied from U.S. Treasury issues with remaining terms similar to the expected term on the options. We do not anticipate paying any cash dividends in the foreseeable future and therefore use an expected dividend yield of zero in the option pricing model. We are required to estimate forfeitures at the time of grant and revise those estimates in subsequent periods if actual forfeitures differ from those estimates. We use historical data to estimate pre-vesting option forfeitures and record stock-based compensation expense only for those awards that are expected to vest. See Note 13. Share-Based Compensation to our audited consolidated financial statements included in this report.
If we use different assumptions for estimating stock-based compensation expense in future periods or if actual forfeitures differ materially from our estimated forfeitures, the change in our stock-based compensation expense could materially affect our operating income, net income and net income per share.
Income Taxes
Significant judgment is required in determining our provision for income taxes, current tax assets and liabilities, deferred tax assets and liabilities and our future taxable income for purposes of assessing our ability to realize future benefit from our deferred tax assets. A valuation allowance is established to reduce our deferred tax assets to the amount that is considered more likely than not to be realized
45
through the generation of future taxable income and other tax planning opportunities. To the extent that a determination is made to establish or adjust a valuation allowance, the expense or benefit is recorded in the period in which the determination is made.
Our accounting for income taxes requires us to exercise judgment for known issues under discussion with tax authorities and transactions yet to be settled. The final outcome of these tax uncertainties is dependent upon various matters including tax examinations, legal proceedings, changes in regulatory tax laws, or interpretation of those tax laws, or expiration of statutes of limitation. However, based on the number of jurisdictions, the uncertainties associated with litigation and the status of examinations, including the protocols of finalizing audits by the relevant tax authorities, which could include formal legal proceedings, there is a high degree of uncertainty regarding the future cash outflows associated with these tax uncertainties. See Note 17. Income Taxes to our audited consolidated financial statements included in this report.
Future rulings by tax authorities and future changes in tax laws and their interpretation, changes in projected levels of taxable income and future tax planning strategies could impact our actual effective tax rate and our recorded tax balances. If actual results differ from estimates we have used, or if we adjust these estimates in future periods, our operating results and financial position could be materially affected.
Legal Contingencies
From time to time, in the course of our business, we become involved in legal proceedings. In accordance with US GAAP, if it is probable that, as a result of a pending legal claim, an asset had been impaired or a liability had been incurred at the date of the financial statements and the amount of the loss is estimable, an accrual for the costs to resolve the claim is recorded in accrued expenses in our balance sheets. Professional fees related to legal claims are included in selling, general and administrative expenses in our statements of operations. Management, with the assistance of outside counsel, determines whether it is probable that a liability from a legal claim has been incurred and estimates the amount of loss. The analysis is based upon potential results, assuming a combination of litigation and settlement strategies. As discussed in Note 15. Commitments and Contingencies to our audited consolidated financial statements included in this report, management does not believe that currently pending proceedings will have a material adverse effect on our consolidated financial position. It is possible, however, that future results of operations for any particular period could be materially affected by changes in our assumptions related to these proceedings.
Certifications
Our Chief Executive Officer has certified to the NYSE that he is not aware of any violations by the Company of NYSE corporate governance listing standards. We have included as exhibits to this Annual Report on Form 10-K certificates of our Chief Executive Officer and Chief Financial Officer certifying the quality of our public disclosure.
ITEM 7A. Quantitative and Qualitative Disclosures About Market Risk
Commodity Price Risk
We are aware of the potentially unfavorable effects inflationary pressures may create through higher product and material costs, higher asset replacement costs and related depreciation and higher interest rates. In addition, our operating performance is affected by price fluctuations in copper, oil, stainless steel, aluminum, zinc, plastic and PVC and other commodities and raw materials. We seek to minimize the effects of inflation and changing prices through economies of purchasing and inventory management resulting in cost reductions and productivity improvements as well as price increases to maintain reasonable profit margins. However, such commodity price fluctuations have from time to time created cyclicality in our financial performance, and could continue to do so in the future. In
46
addition, our use of priced catalogs may not allow us to offset such cost increases quickly, resulting in a decrease in gross margins and profit.
Interest Rate Risk
Our variable rate term debt is sensitive to changes in the general level of interest rates. As of December 31, 2010, we had no outstanding variable rate debt.
The fair market value of our 7.00% Notes is subject to interest rate risk. As of December 31, 2010, the estimated fair market value of our 7.00% Notes was $304.5 million or 101.5% of par.
Foreign Currency Exchange Risk
The majority of our purchases from foreign-based suppliers are from China and other countries in Asia and are transacted in U.S. dollars. Accordingly, our risk to foreign currency exchange rates was not material as of December 31, 2010.
Many of our suppliers price their products in currencies other than the U.S. dollar or incur costs of production in non-U.S. currencies. Accordingly, depreciation of the U.S. dollar against foreign currencies could increase the price we pay for these products. A substantial portion of our products is sourced from suppliers in China and the value of the Chinese Yuan has increased relative to the U.S. dollar since July 2005, when it was allowed to fluctuate against a basket of foreign currencies. Most experts believe that the value of the Yuan will continue to increase relative to the U.S. dollar over the next few years. Such a move would most likely result in an increase in the cost of products that are sourced from suppliers in China.
Derivative Financial Instruments
As of December 31, 2010, we did not have any interest rate swap exchange agreements, or swaps. Historically, we have entered into derivative financial instruments from time to time, including interest rate exchange agreements, to manage our exposure to fluctuations in interest rates on our debt. Under our former swap agreements, we paid a fixed rate on the notional amount to our banks and the banks paid us a variable rate on the notional amount equal to a base LIBOR rate.
We periodically evaluate the costs and benefits of any changes in our interest rate risk. Based on such evaluation, we may enter into new interest rate swaps to manage our interest rate exposure. Our derivative activities, all of which are for purposes other than trading, are initiated within the guidelines of corporate risk-management policies.
ITEM 8. Financial Statements and Supplementary Data
Our consolidated financial statements are provided in part IV, Item 15 of this filing.
ITEM 9. Changes in and Disagreements with Accountants on Accounting and Financial Disclosure
None.
ITEM 9A. Controls and Procedures
Evaluation of Disclosure Controls and Procedures
Our management, with the participation of our Chief Executive Officer and Chief Financial Officer (our principal executive officer and principal financial officer), evaluated the effectiveness of our disclosure controls and procedures (as defined in Rules 13a-15(e) and 15d-15(e) under the Exchange Act) as of December 31, 2010. Based on this evaluation, our Chief Executive Officer and Chief Financial Officer concluded that, as of December 31, 2010, our disclosure controls and procedures were effective to (1) ensure that material information disclosed by us in the reports that we file or submit under the Exchange Act is accumulated and communicated to our management, including our Chief Executive Officer and Chief Financial Officer, to allow timely decisions regarding
47
required disclosure and (2) ensure that information required to be disclosed by us in the reports that we file or submit under the Exchange Act is recorded, processed, summarized and reported, within the time periods specified in the SEC's rules and forms.
Internal Control over Financial Reporting
Our management is responsible for establishing and maintaining adequate internal control over financial reporting, as such term is defined in Exchange Act Rules 13a-15(f) and 15d-15(f). Under the supervision and with the participation of our management, including our Chief Executive Officer and Chief Financial Officer, we conducted an evaluation of the effectiveness of our internal control over financial reporting based on the framework in Internal Control—Integrated Framework issued by the Committee of Sponsoring Organizations of the Treadway Commission. Based on our evaluation, under the Internal Control—Integrated Framework, our management concluded that our internal control over financial reporting was effective as of December 31, 2010.
The report of our independent registered public accounting firm related to the effectiveness of internal control over financial reporting is included on page F-1 of this Annual Report on Form 10-K.
Changes in Internal Control over Financial Reporting
No change in our internal control over financial reporting occurred during the quarter ended December 31, 2010 that has materially affected, or is reasonably likely to materially affect, our internal control over financial reporting.
Limitations on the Effectiveness of Controls
Our management, including our Chief Executive Officer and Chief Financial Officer, does not expect that our disclosure controls and procedures or our internal control over financial reporting will prevent all error and all fraud. A control system, no matter how well conceived and operated, can provide only reasonable assurance that the objectives of a control system are met. Further, any control system reflects limitations on resources, and the benefits of a control system must be considered relative to its costs. Because of the inherent limitations in all control systems, no evaluation of controls can provide absolute assurance that all control issues and instances of fraud, if any, have been detected. The design of a control system is also based upon certain assumptions about the likelihood of future events, and there can be no assurance that any design will succeed in achieving its stated goals under all potential future conditions. Over time, controls may become inadequate because of changes in conditions or deterioration in the degree of compliance with policies or procedures. Because of the inherent limitations in a cost-effective control system, misstatements due to error or fraud may occur and may not be detected. Our disclosure controls are designed to provide reasonable assurance of achieving their objectives. Based on our evaluation of the effectiveness of our internal control over financial reporting, our management, including our Chief Executive Officer and Chief Financial Officer, concluded that, as of December 31, 2010, our disclosure controls and procedures were effective at the reasonable assurance level.
None.
48
ITEM 10. Directors, Executive Officers and Corporate Governance
The information required by this item is incorporated by reference from our definitive proxy statement to be filed not later than 120 days after the end of the fiscal year covered by this Annual Report on Form 10-K pursuant to Regulation 14A.
ITEM 11. Executive Compensation
The information required by this item is incorporated by reference from our definitive proxy statement to be filed not later than 120 days after the end of the fiscal year covered by this Annual Report on Form 10-K pursuant to Regulation 14A.
ITEM 12. Security Ownership of Certain Beneficial Owners and Management and Related Stockholder Matters
The information required by this item is incorporated by reference from our definitive proxy statement to be filed not later than 120 days after the end of the fiscal year covered by this Annual Report on Form 10-K pursuant to Regulation 14A.
ITEM 13. Certain Relationships and Related Transactions, and Director Independence
The information required by this item is incorporated by reference from our definitive proxy statement to be filed not later than 120 days after the end of the fiscal year covered by this Annual Report on Form 10-K pursuant to Regulation 14A.
ITEM 14. Principal Accounting Fees and Services
The information required by this item is incorporated by reference from our definitive proxy statement to be filed not later than 120 days after the end of the fiscal year covered by this Annual Report on Form 10-K pursuant to Regulation 14A.
49
ITEM 15. Exhibits, Financial Statement Schedules
- (2)
- Exhibits
See Exhibit Index beginning on page 53
50
Pursuant to the requirements of Section 13 or 15(d) of the Securities Exchange Act of 1934, the registrant has duly caused this report to be signed on its behalf by the undersigned, thereunto duly authorized.
| INTERLINE BRANDS, INC. | ||
/s/ MICHAEL J. GREBE Michael J. Grebe Chief Executive Officer |
||
Date: March 1, 2011 |
Pursuant to the requirements of the Securities Exchange Act of 1934, this report has been signed by the following persons on behalf of the Registrant and in the capacities indicated and on the dates indicated.
Signature
|
Title
|
Date
|
||
|---|---|---|---|---|
| /s/ MICHAEL J. GREBE Michael J. Grebe |
Chairman of the Board and Chief Executive Officer (Principal Executive Officer) | March 1, 2011 | ||
/s/ JOHN A. EBNER John A. Ebner |
Chief Financial Officer (Principal Financial Officer) |
March 1, 2011 |
||
/s/ DAVID C. SERRANO David C. Serrano |
Chief Accounting Officer and Corporate Controller (Principal Accounting Officer) |
March 1, 2011 |
||
/s/ GIDEON ARGOV Gideon Argov |
Director |
March 1, 2011 |
||
/s/ MICHAEL E. DEDOMENICO Michael E. DeDomenico |
Director |
March 1, 2011 |
||
/s/ JOHN J. GAVIN John J. Gavin |
Director |
March 1, 2011 |
||
/s/ BARRY J. GOLDSTEIN Barry J. Goldstein |
Director |
March 1, 2011 |
||
/s/ ERNEST K. JACQUET Ernest K. Jacquet |
Director |
March 1, 2011 |
||
51
Signature
|
Title
|
Date
|
||
|---|---|---|---|---|
| /s/ RANDOLPH W. MELVILLE Randolph W. Melville |
Director | March 1, 2011 | ||
/s/ CHARLES W. SANTORO Charles W. Santoro |
Director |
March 1, 2011 |
||
/s/ DREW T. SAWYER Drew T. Sawyer |
Director |
March 1, 2011 |
52
| 3.1 | Amended and Restated Certificate of Incorporation of the Company (incorporated by reference to Exhibit 3.1 to the Company's Registration Statement on Form S-3 filed on May 24, 2006 (No. 333-134415)). | ||
3.2 |
Second Amended and Restated By-Laws of the Company (incorporated by reference to Exhibit 3.2 to the Company's Current Report on Form 8-K filed March 23, 2009). |
||
4.1 |
Form of Specimen Certificate of Common Stock of the Company (incorporated by reference to Exhibit 4.2 to the Company's Amendment No. 4 to Registration Statement on Form S-1 filed on December 3, 2004 (No. 333-116482)). |
||
4.2 |
Credit Agreement, dated as of June 23, 2006, among the Company, Interline New Jersey, as borrower, the lenders party therein, JPMorgan Chase Bank, N.A., as administrative agent, Lehman Commercial Paper Inc., as syndication agent, Credit Suisse, Bank of America, N.A., Wachovia Bank, National Association and SunTrust Bank, each as a co-documentation agent and J.P. Morgan Securities Inc. and Lehman Brothers Inc. as joint bookrunners and joint-lead arrangers (incorporated by reference to Exhibit 4.2 to the Company's Annual Report on Form 10-K for the fiscal year ended December 25, 2009). |
||
4.3 |
Guarantee and Collateral Agreement, dated as of June 23, 2006, among the Company, Interline New Jersey, certain subsidiaries of Interline New Jersey and JPMorgan Chase Bank, N.A., as collateral agent (incorporated by reference to Exhibit 4.3 to the Company's Annual Report on Form 10-K for the fiscal year ended December 25, 2009). |
||
4.4 |
Subordinated Debt Indenture, dated as of June 23, 2006, among Interline New Jersey, the Company, as guarantor, certain subsidiaries of the Company and The Bank of New York Trust Company, N.A., as trustee (incorporated by reference to Exhibit 4.3 to the Company's Current Report on Form 8-K filed on June 27, 2006). |
||
4.5 |
First Supplemental Indenture, dated as of June 23, 2006, among Interline New Jersey, the Company, as guarantor, certain subsidiaries of the Company and The Bank of New York Trust Company, N.A., as trustee (incorporated by reference to Exhibit 4.4 to the Company's Current Report on Form 8-K filed on June 27, 2006). |
||
4.6 |
Second Supplemental Indenture, dated as of July 3, 2006, by and among Interline New Jersey, the Company, AmSan, LLC, as a subsidiary guarantor, certain other subsidiaries of the Company and The Bank of New York Trust Company, N.A., as trustee (incorporated by reference to Exhibit 4.1 to the Company's Current Report on Form 8-K filed on July 10, 2006). |
||
4.7 |
Third Supplemental Indenture, dated as of September 29, 2009, by and among Interline New Jersey, the Company, Eagle Maintenance Supply, Inc. as a subsidiary guarantor, certain other subsidiaries of the Company and The Bank of New York Mellon Trust Company, N.A., as trustee (incorporated by reference to Exhibit 4.7 to the Company's Annual Report on Form 10-K for the fiscal year ended December 25, 2009). |
||
4.8 |
Fourth Supplemental Indenture, dated as of November 15, 2010, by and among Interline New Jersey, the Company, certain subsidiaries of the Company and The Bank of New York Mellon Trust Company, N.A., as trustee (furnished herewith). |
||
4.9 |
Supplement No.1, dated as of July 3, 2006, to the Guarantee and Collateral Agreement, dated June 23, 2006, between AmSan, LLC and JPMorgan Chase Bank, N.A., as collateral agent (incorporated by reference to Exhibit 4.2 to the Company's Current Report on Form 8-K filed on July 10, 2006). |
53
| 4.10 | Supplement No. 2, dated as of September 25, 2009, to the Guarantee and Collateral Agreement, dated June 23, 2006, between the Company, Eagle Maintenance Supply, Inc. and JPMorgan Chase Bank, N.A., as collateral agent (incorporated by reference to Exhibit 4.9 to the Company's Annual Report on Form 10-K for the fiscal year ended December 25, 2009). | ||
4.11 |
Indenture, dated as of November 16, 2010, among Interline New Jersey, as issuer, the Company, as guarantor, subsidiary guarantors named therein and Wells Fargo Bank, National Association, as trustee (incorporated by reference to Exhibit 4.1 to the Company's Registration Statement on Form S-4 filed on December 16, 2010 (No. 333-171215)). |
||
4.12 |
Registration Rights Agreement, dated as of November 16, 2010, by and among Interline New Jersey, the guarantors named therein, Barclays Capital Inc., J.P. Morgan Securities LLC, BB&T Capital Markets, a division of Scott Stringfellow, LLC, Goldman, Sachs & Co., Lazard Capital Markets LLC, SunTrust Robinson Humphrey, Inc. and U.S. Bancorp Investments, Inc. (incorporated by reference to Exhibit 4.3 to the Company's Registration Statement on Form S-4 filed on December 16, 2010 (No. 333-171215)). |
||
4.13 |
Credit Agreement, dated as of November 16, 2010, among Interline New Jersey, as borrower, the Company, as guarantor, subsidiary guarantors named therein, the lenders party thereto, JPMorgan Chase Bank, N.A., as administrative agent, Bank of America, N.A., as syndication agent, and Barclays Capital, Wells Fargo Capital Finance, LLC and Branch Banking and Trust Company, as co-documentation agents (incorporated by reference to Exhibit 4.4 to the Company's Registration Statement on Form S-4 filed on December 16, 2010 (No. 333-171215)). |
||
4.14 |
Rights Agreement, dated as of March 22, 2009, by and between the Company and Mellon Investor Services LLC, as Rights Agent (incorporated by reference to Exhibit 4.1 to the Company's Current Report on Form 8-K filed on March 23, 2009). |
||
4.15 |
Amendment No. 1 to Rights Agreement, dated as of March 16, 2010, by and between the Company and Mellon Investor Services LLC, as Rights Agent (incorporated by reference to Exhibit 4.1 to the Company's Current Report on Form 8-K filed on March 18, 2010). |
||
4.16 |
Certificate of Designation, Preferences and Rights of Series A Junior Participating Preferred Stock, as filed with the Secretary of State of Delaware on March 23, 2009 (incorporated by reference to Exhibit 3.1 to the Company's Current Report on Form 8-K filed on March 23, 2009). |
||
10.1 |
Amended and Restated Shareholders' Agreement, dated as of September 29, 2000, among Interline New Jersey and certain of its shareholders (incorporated by reference to Exhibit 9.1 to Interline New Jersey's Registration Statement on Form S-4 filed on July 3, 2003 (No. 333-106801)). |
||
10.2 |
Amendment No. 1 to Amended and Restated Shareholders' Agreement, dated as of March 15, 2004, among Interline New Jersey and certain of its shareholders (incorporated by reference to Exhibit 9.2 to the Company's Amendment No. 5 to Registration Statement on Form S-1 filed on December 14, 2004 (No. 333-116482)). |
||
10.3 |
Amendment No. 2 to Amended and Restated Shareholders' Agreement, dated as of December 21, 2004, among Interline New Jersey and certain of its shareholders (incorporated by reference to Exhibit 10.3 to the Company's Annual Report on Form 10-K for the fiscal year ended December 31, 2004). |
||
10.4 |
2000 Stock Award Plan, as amended and restated July, 2000 (incorporated by reference to Exhibit 10.23 to Interline New Jersey's Registration Statement on Form S-4 filed on July 3, 2003 (No. 333-106801)). |
54
| 10.5 | Amended and Restated 2004 Equity Incentive Plan (incorporated by reference to Appendix A to the Company's definitive proxy statement for its annual meeting of stockholders held on May 8, 2008 (No. 001-32380)). | ||
10.6 |
Form of Stock Option Agreement (executive) (incorporated by reference to Exhibit 10.6 to the Company's Annual Report on Form 10-K for the fiscal year ended December 26, 2008). |
||
10.7 |
Form of Stock Option Agreement (non-executive) (incorporated by reference to Exhibit 10.7 to the Company's Annual Report on Form 10-K for the fiscal year ended December 26, 2008). |
||
10.8 |
Form of Non-Employee Directors Option Agreement (incorporated by reference to Exhibit 10.45 to the Company's Amendment No. 5 to Registration Statement on Form S-1 filed on December 14, 2004 (No. 333-116482)). |
||
10.9 |
Form of Restricted Share Unit Agreement (incorporated by reference to Exhibit 10.3 to the Company's Current Report filed on Form 8-K on March 17, 2006). |
||
10.10 |
Amendment to Restricted Share Unit Award Agreements (incorporated by reference to Exhibit 10.10 to the Company's Annual Report on Form 10-K for the fiscal year ended December 26, 2008). |
||
10.11 |
Form of Restricted Share Unit Agreement (time-based), used through 2010 (incorporated by reference to Exhibit 10.11 to the Company's Annual Report on Form 10-K for the fiscal year ended December 26, 2008). |
||
10.12 |
Form of Restricted Share Unit Agreement (time-based), used commencing in 2011 (furnished herewith). |
||
10.13 |
Form of Deferred Stock Unit Award Agreement and Notice of Election for Non-employee Directors (incorporated by reference to Exhibit 10.36 to the Company's Annual Report on Form 10-K for the fiscal year ended December 30, 2005). |
||
10.14 |
Amendment to Deferred Stock Unit Award Agreements for Non-employee Directors (incorporated by reference to Exhibit 10.13 to the Company's Annual Report on Form 10-K for the fiscal year ended December 26, 2008). |
||
10.15 |
Form of Management Restricted Stock Award Agreement (incorporated by reference to Exhibit 10.44 to the Company's Amendment No. 5 to Registration Statement on Form S-1 filed on December 14, 2004 (No. 333-116482)). |
||
10.16 |
Form of Non-Employee Directors Restricted Stock Award Agreement (incorporated by reference to Exhibit 10.46 to the Company's Amendment No. 5 to Registration Statement on Form S-1 filed on December 14, 2004 (No. 333-116482)). |
||
10.17 |
Executive Cash Incentive Plan (incorporated by reference to Appendix B to the Company's definitive proxy statement for its annual meeting of stockholders held on May 11, 2006 (No. 001-32380)). |
||
10.18 |
Form of Change in Control Severance Agreement (incorporated by reference to Exhibit 10.42 to the Company's Annual Report on Form 10-K for the fiscal year ended December 29, 2006). |
||
10.19 |
Form of Amendment to Change in Control Severance Agreement (incorporated by reference to Exhibit 10.45 to the Company's Annual Report on Form 10-K for the fiscal year ended December 26, 2008). |
55
| 10.20 | Employment Agreement, dated as of August 13, 2004, by and between Interline New Jersey and Michael J. Grebe (incorporated by reference to Exhibit 10.32 to the Company's Amendment No. 2 to Registration Statement on Form S-1 filed on September 27, 2004 (No. 333-116482)). | ||
10.21 |
Amendment One to Employment Agreement, dated as of December 2, 2004, by and between Interline New Jersey and Michael J. Grebe (incorporated by reference to Exhibit 10.37 to the Company's Amendment No. 4 to Registration Statement on Form S-1 filed on December 3, 2004 (No. 333-116482)). |
||
10.22 |
Amendment to Employment Agreement, dated as of December 31, 2008, by and between Interline New Jersey and Michael J. Grebe (incorporated by reference to Exhibit 10.19 to the Company's Annual Report on Form 10-K for the fiscal year ended December 26, 2008). |
||
10.23 |
Incentive Stock Option Agreement of Michael J. Grebe, dated as of May 16, 2000 (incorporated by reference to Exhibit 10.11 to the Company's Amendment No. 5 to Form S-1 Registration Statement filed on December 14, 2004 (No. 333-116482)). |
||
10.24 |
Employment Agreement, dated as of July 25, 2005, by and between Interline New Jersey and Thomas J. Tossavainen (incorporated by reference to Exhibit 10.55 of the Company's Amendment No. 2 to Registration Statement on Form S-1 filed on August 1, 2005 (No. 333-126515)). |
||
10.25 |
Amendment to Employment Agreement, dated as of December 31, 2008, by and between Interline New Jersey and Thomas J. Tossavainen (incorporated by reference to Exhibit 10.26 to the Company's Annual Report on Form 10-K for the fiscal year ended December 26, 2008). |
||
10.26 |
Employment Agreement, dated April 30, 2007, by and between Interline New Jersey and Kenneth D. Sweder (incorporated by reference to Exhibit 10.27 to the Company's Annual Report on Form 10-K for the fiscal year ended December 26, 2008). |
||
10.27 |
First Amendment to Employment Agreement, dated October 20, 2008, by and between Interline New Jersey and Kenneth D. Sweder (incorporated by reference to Exhibit 10.28 to the Company's Annual Report on Form 10-K for the fiscal year ended December 26, 2008). |
||
10.28 |
Amendment to Employment Agreement, dated as of December 31, 2008, by and between Interline New Jersey and Kenneth D. Sweder (incorporated by reference to Exhibit 10.29 to the Company's Annual Report on Form 10-K for the fiscal year ended December 26, 2008). |
||
10.29 |
Change in Control Severance Agreement, dated April 30, 2007, by and between the Company and Kenneth D. Sweder (incorporated by reference to Exhibit 10.30 to the Company's Annual Report on Form 10-K for the fiscal year ended December 26, 2008). |
||
10.30 |
First Amendment to Change in Control Severance Agreement, dated October 20, 2008, by and between the Company and Kenneth D. Sweder (incorporated by reference to Exhibit 10.31 to the Company's Annual Report on Form 10-K for the fiscal year ended December 26, 2008). |
||
10.31 |
Restricted Share Unit Award Agreement under the 2004 Equity Incentive Plan, dated as of October 20, 2008, by and between Kenneth D. Sweder and Interline New Jersey (incorporated by reference to Exhibit 10.32 to the Company's Annual Report on Form 10-K for the fiscal year ended December 26, 2008). |
||
10.32 |
Employment Agreement, dated as of January 7, 2004, by and between Interline New Jersey and Fred Bravo (incorporated by reference to Exhibit 10.25 to the Company's Amendment No. 5 to Registration Statement on Form S-1 filed on December 14, 2004 (No. 333-116482)). |
56
| 10.33 | Amendment to Employment Agreement, dated September 27, 2004, by and between Interline New Jersey and Fred Bravo (incorporated by reference to Exhibit 10.34 to the Company's Amendment No. 5 to Registration Statement on Form S-1 filed on December 14, 2004 (No. 333-116482)). | ||
10.34 |
Amendment to Employment Agreement, dated as of December 2, 2004, by and between Interline New Jersey and Fred Bravo (incorporated by reference to Exhibit 10.40 to the Company's Amendment No. 4 to Form S-1 Registration Statement filed on December 3, 2004 (No. 333-116482)). |
||
10.35 |
Amendment to Employment Agreement, dated as of December 31, 2008, by and between Interline New Jersey and Fred Bravo (incorporated by reference to Exhibit 10.36 to the Company's Annual Report on Form 10-K for the fiscal year ended December 26, 2008). |
||
10.36 |
Employment Agreement, dated as of January 14, 2004, by and between Interline New Jersey and James A. Spahn (incorporated by reference to Exhibit 10.41 to the Company's Annual Report on Form 10-K for the fiscal year ended December 26, 2008). |
||
10.37 |
Amendment to Employment Agreement, dated as of October 28, 2004, by and between Interline New Jersey and James A. Spahn (incorporated by reference to Exhibit 10.42 to the Company's Annual Report on Form 10-K for the fiscal year ended December 26, 2008). |
||
10.38 |
Amendment to Employment Agreement, dated as of December 31, 2008, by and between Interline New Jersey and James A. Spahn (incorporated by reference to Exhibit 10.43 to the Company's Annual Report on Form 10-K for the fiscal year ended December 26, 2008). |
||
10.39 |
Employment Agreement, dated as of October 30, 2006, by and between Interline New Jersey and Lucretia D. Doblado (incorporated by reference to Exhibit 10.44 to the Company's Annual Report on Form 10-K for the fiscal year ended December 25, 2009). |
||
10.40 |
Amendment to Employment Agreement, dated as of March 23, 2007, by and between Interline New Jersey and Lucretia D. Doblado (incorporated by reference to Exhibit 10.45 to the Company's Annual Report on Form 10-K for the fiscal year ended December 25, 2009). |
||
10.41 |
Amendment to Employment Agreement dated as of December 31, 2008, by and between Interline New Jersey and Lucretia D. Doblado (incorporated by reference to Exhibit 10.46 to the Company's Annual Report on Form 10-K for the fiscal year ended December 25, 2009). |
||
10.42 |
Employment Agreement, dated as of January 8, 2010, by and between Interline New Jersey and John A. Ebner (incorporated by reference to Exhibit 10.1 to the Company's Current Report on Form 8-K filed on January 14, 2010). |
||
10.43 |
Change in Control Severance Agreement, dated as of January 8, 2010, by and between the Company and John A. Ebner (incorporated by reference Exhibit 10.2 to the Company's Current Report on Form 8-K filed January 14, 2010). |
||
10.44 |
Purchase Agreement, dated November 4, 2010, among Interline New Jersey, the Company, as guarantor, subsidiary guarantors named therein and Barclays Capital Inc. as the representative of several initial purchasers named therein (incorporated by reference to Exhibit 10.35 to the Company's Registration Statement on Form S-4 filed on December 16, 2010 (No. 333-171215)). |
||
10.45 |
First Amendment to Change in Control Severance Agreement, dated March 1, 2011, by and between the Company and John A. Ebner (furnished herewith). |
||
11.1 |
Computation of earnings per share information (contained in Note 2 to the Consolidated Financial Statements contained in this Annual Report on Form 10-K for the fiscal year ended December 31, 2010) (furnished herewith). |
57
| 12.1 | Statements regarding computation of ratios of earnings to fixed charges and earnings to combined fixed charges and preferred dividends of the Company (furnished herewith). | ||
21.1 |
List of Subsidiaries of the Company (furnished herewith). |
||
23.1 |
Consent of Deloitte & Touche LLP (furnished herewith). |
||
31.1 |
Certification of the Chief Executive Officer pursuant to Rule 13a-14 of the Exchange Act, as adopted pursuant to Section 302 of the Sarbanes-Oxley Act of 2002 (furnished herewith). |
||
31.2 |
Certification of the Chief Financial Officer pursuant to Rule 13a-14 of the Exchange Act, as adopted pursuant to Section 302 of the Sarbanes-Oxley Act of 2002 (furnished herewith). |
||
32.1 |
Certification of the Chief Executive Officer pursuant to Rule 13a-14(b) of the Exchange Act and 18 U.S.C. Section 1350, as adopted pursuant to Section 906 of the Sarbanes-Oxley Act of 2002 (furnished herewith). |
||
32.2 |
Certification of the Chief Financial Officer pursuant to Rule 13a-14(b) of the Exchange Act and 18 U.S.C. Section 1350, as adopted pursuant to Section 906 of the Sarbanes-Oxley Act of 2002 (furnished herewith). |
58
REPORT OF INDEPENDENT REGISTERED PUBLIC ACCOUNTING FIRM
To
the Board of Directors and Stockholders of
Interline Brands, Inc.
Jacksonville, Florida
We have audited the accompanying consolidated balance sheets of Interline Brands, Inc. and subsidiaries (the "Company") as of December 31, 2010 and December 25, 2009, and the related consolidated statements of earnings, stockholders' equity, and cash flows for each of the three years in the period ended December 31, 2010. We also have audited the Company's internal control over financial reporting as of December 31, 2010, based on criteria established in Internal Control—Integrated Framework issued by the Committee of Sponsoring Organizations of the Treadway Commission. The Company's management is responsible for these financial statements, for maintaining effective internal control over financial reporting, and for its assessment of the effectiveness of internal control over financial reporting, included in the accompanying Item 9A. Controls and Procedures. Our responsibility is to express an opinion on these financial statements and an opinion on the Company's internal control over financial reporting based on our audits.
We conducted our audits in accordance with the standards of the Public Company Accounting Oversight Board (United States). Those standards require that we plan and perform the audit to obtain reasonable assurance about whether the financial statements are free of material misstatement and whether effective internal control over financial reporting was maintained in all material respects. Our audits of the financial statements included examining, on a test basis, evidence supporting the amounts and disclosures in the financial statements, assessing the accounting principles used and significant estimates made by management, and evaluating the overall financial statement presentation. Our audit of internal control over financial reporting included obtaining an understanding of internal control over financial reporting, assessing the risk that a material weakness exists, and testing and evaluating the design and operating effectiveness of internal control based on the assessed risk. Our audits also included performing such other procedures as we considered necessary in the circumstances. We believe that our audits provide a reasonable basis for our opinions.
A company's internal control over financial reporting is a process designed by, or under the supervision of, the company's principal executive and principal financial officers, or persons performing similar functions, and effected by the company's board of directors, management, and other personnel to provide reasonable assurance regarding the reliability of financial reporting and the preparation of financial statements for external purposes in accordance with generally accepted accounting principles. A company's internal control over financial reporting includes those policies and procedures that (1) pertain to the maintenance of records that, in reasonable detail, accurately and fairly reflect the transactions and dispositions of the assets of the company; (2) provide reasonable assurance that transactions are recorded as necessary to permit preparation of financial statements in accordance with generally accepted accounting principles, and that receipts and expenditures of the company are being made only in accordance with authorizations of management and directors of the company; and (3) provide reasonable assurance regarding prevention or timely detection of unauthorized acquisition, use, or disposition of the company's assets that could have a material effect on the financial statements.
Because of the inherent limitations of internal control over financial reporting, including the possibility of collusion or improper management override of controls, material misstatements due to error or fraud may not be prevented or detected on a timely basis. Also, projections of any evaluation of the effectiveness of the internal control over financial reporting to future periods are subject to the risk that the controls may become inadequate because of changes in conditions, or that the degree of compliance with the policies or procedures may deteriorate.
F-1
In our opinion, the consolidated financial statements referred to above present fairly, in all material respects, the financial position of Interline Brands, Inc. and subsidiaries as of December 31, 2010 and December 25, 2009, and the results of their operations and their cash flows for each of the three years in the period ended December 31, 2010, in conformity with accounting principles generally accepted in the United States of America. Also, in our opinion, the Company maintained, in all material respects, effective internal control over financial reporting as of December 31, 2010, based on the criteria established in Internal Control—Integrated Framework issued by the Committee of Sponsoring Organizations of the Treadway Commission.
/s/
Deloitte & Touche LLP
Certified Public Accountants
Jacksonville,
Florida
March 1, 2011
F-2
INTERLINE BRANDS, INC. AND SUBSIDIARIES
CONSOLIDATED BALANCE SHEETS
AS OF DECEMBER 31, 2010 AND DECEMBER 25, 2009
(in thousands,
except share and per share data)
| |
December 31, 2010 |
December 25, 2009 |
|||||||
|---|---|---|---|---|---|---|---|---|---|
ASSETS |
|||||||||
Current Assets: |
|||||||||
Cash and cash equivalents |
$ | 86,981 | $ | 99,223 | |||||
Short-term investments |
100 | 1,479 | |||||||
Accounts receivable—trade (net of allowance for doubtful accounts of $9,088 and $12,975) |
122,619 | 120,004 | |||||||
Inventory |
203,269 | 173,422 | |||||||
Prepaid expenses and other current assets |
28,816 | 18,552 | |||||||
Income taxes receivable |
2,086 | — | |||||||
Deferred income taxes |
17,381 | 16,459 | |||||||
Total current assets |
461,252 | 429,139 | |||||||
Property and equipment, net |
54,546 | 46,804 | |||||||
Goodwill |
341,168 | 319,006 | |||||||
Other intangible assets, net |
141,562 | 124,835 | |||||||
Other assets |
9,081 | 9,054 | |||||||
Total assets |
$ | 1,007,609 | $ | 928,838 | |||||
LIABILITIES AND STOCKHOLDERS' EQUITY |
|||||||||
Current Liabilities: |
|||||||||
Accounts payable |
$ | 96,878 | $ | 85,982 | |||||
Accrued expenses and other current liabilities |
45,181 | 41,715 | |||||||
Accrued interest |
2,852 | 1,050 | |||||||
Income taxes payable |
819 | 1,285 | |||||||
Current portion of long-term debt |
13,358 | 1,590 | |||||||
Capital lease—current |
607 | 222 | |||||||
Total current liabilities |
159,695 | 131,844 | |||||||
Long-Term Liabilities: |
|||||||||
Deferred income taxes |
44,045 | 40,369 | |||||||
Long-term debt, net of current portion |
300,000 | 304,088 | |||||||
Capital lease—long-term |
906 | 4 | |||||||
Other liabilities |
6,731 | 798 | |||||||
Total liabilities |
511,377 | 477,103 | |||||||
Commitments and contingencies (see Note 15) Senior preferred stock; $0.01 par value, 20,000,000 authorized; none outstanding as of December 31, 2010 and December 25, 2009 |
— | — | |||||||
Stockholders' Equity: |
|||||||||
Common stock; $0.01 par value, 100,000,000 authorized; 33,336,373 issued and 33,214,073 outstanding as of December 31, 2010 and 32,640,957 issued and 32,524,251 outstanding as of December 25, 2009 |
333 | 326 | |||||||
Additional paid-in capital |
593,031 | 576,747 | |||||||
Accumulated deficit |
(96,824 | ) | (124,745 | ) | |||||
Accumulated other comprehensive income |
1,865 | 1,483 | |||||||
Treasury stock, at cost, 122,300 shares as of December 31, 2010 and 116,706 as of December 25, 2009 |
(2,173 | ) | (2,076 | ) | |||||
Total stockholders' equity |
496,232 | 451,735 | |||||||
Total liabilities and stockholders' equity |
$ | 1,007,609 | $ | 928,838 | |||||
See accompanying notes to consolidated financial statements.
F-3
INTERLINE BRANDS, INC. AND SUBSIDIARIES
CONSOLIDATED STATEMENTS OF EARNINGS
YEARS ENDED DECEMBER 31, 2010, DECEMBER 25, 2009 AND DECEMBER 26, 2008
(in thousands, except share and per share data)
| |
2010 | 2009 | 2008 | |||||||||
|---|---|---|---|---|---|---|---|---|---|---|---|---|
Net sales |
$ | 1,086,989 | $ | 1,059,278 | $ | 1,195,663 | ||||||
Cost of sales |
672,745 | 665,327 | 746,037 | |||||||||
Gross profit |
414,244 | 393,951 | 449,626 | |||||||||
Operating Expenses: |
||||||||||||
Selling, general and administrative expenses |
318,820 | 316,137 | 343,793 | |||||||||
Depreciation and amortization |
20,240 | 18,580 | 16,866 | |||||||||
Total operating expense |
339,060 | 334,717 | 360,659 | |||||||||
Operating income |
75,184 | 59,234 | 88,967 | |||||||||
(Loss) gain on extinguishment of debt, net |
(11,486 | ) | 1,257 | 2,775 | ||||||||
Interest expense |
(18,710 | ) | (19,044 | ) | (28,482 | ) | ||||||
Interest and other income |
1,762 | 1,714 | 2,198 | |||||||||
Income before income taxes |
46,750 | 43,161 | 65,458 | |||||||||
Provision for income taxes |
18,829 | 17,073 | 24,625 | |||||||||
Net income |
$ | 27,921 | $ | 26,088 | $ | 40,833 | ||||||
Earnings Per Share: |
||||||||||||
Basic |
$ | 0.85 | $ | 0.80 | $ | 1.26 | ||||||
Diluted |
$ | 0.83 | $ | 0.79 | $ | 1.25 | ||||||
Weighted-Average Shares Outstanding: |
||||||||||||
Basic |
32,998,352 | 32,503,306 | 32,396,764 | |||||||||
Diluted |
33,785,885 | 32,908,510 | 32,573,552 | |||||||||
See accompanying notes to consolidated financial statements.
F-4
INTERLINE BRANDS, INC. AND SUBSIDIARIES
CONSOLIDATED STATEMENTS OF STOCKHOLDERS' EQUITY
YEARS ENDED DECEMBER 31, 2010, DECEMBER 25, 2009 AND
DECEMBER 26, 2008
(in thousands, except share data)
| |
Common Stock | |
|
Accumulated Other Comprehensive Income |
|
|
||||||||||||||||||||
|---|---|---|---|---|---|---|---|---|---|---|---|---|---|---|---|---|---|---|---|---|---|---|---|---|---|---|
| |
Additional Paid-In Capital |
Accumulated Deficit |
Treasury Stock |
Total Stockholders' Equity |
||||||||||||||||||||||
| |
Shares | Amount | ||||||||||||||||||||||||
Balance at December 28, 2007 |
32,350,188 | $ | 324 | $ | 567,860 | $ | (191,666 | ) | $ | 1,751 | $ | (855 | ) | $ | 377,414 | |||||||||||
Share-based compensation |
3,782 | 3,782 | ||||||||||||||||||||||||
Issuance of common stock from exercise of stock options |
38,595 | — | 656 | 656 | ||||||||||||||||||||||
Issuance of common stock from vesting of restricted share units |
172,577 | 2 | (2 | ) | — | |||||||||||||||||||||
Excess tax benefits on stock options exercised and other vested share-based payments |
(428 | ) | (428 | ) | ||||||||||||||||||||||
Repurchase of common stock |
(1,128 | ) | (1,128 | ) | ||||||||||||||||||||||
Comprehensive income: |
||||||||||||||||||||||||||
Net income |
40,833 | |||||||||||||||||||||||||
Amortization of unrecognized gain on employee benefits |
11 | |||||||||||||||||||||||||
Foreign currency translation |
(1,067 | ) | ||||||||||||||||||||||||
Total comprehensive income |
39,777 | |||||||||||||||||||||||||
Balance at December 26, 2008 |
32,561,360 | 326 | 571,868 | (150,833 | ) | 695 | (1,983 | ) | 420,073 | |||||||||||||||||
Share-based compensation |
3,794 | 3,794 | ||||||||||||||||||||||||
Issuance of common stock in lieu of director's fees |
3,019 | — | — | |||||||||||||||||||||||
Issuance of common stock from exercise of stock options |
67,078 | — | 1,005 | 1,005 | ||||||||||||||||||||||
Issuance of common stock from vesting of restricted share units |
9,500 | — | — | — | ||||||||||||||||||||||
Excess tax benefits on stock options exercised and other vested share-based payments |
45 | 45 | ||||||||||||||||||||||||
Repurchase of common stock |
35 | (93 | ) | (58 | ) | |||||||||||||||||||||
Comprehensive income: |
||||||||||||||||||||||||||
Net income |
26,088 | |||||||||||||||||||||||||
Amortization of unrecognized gain on employee benefits |
11 | |||||||||||||||||||||||||
Unrealized gain on short-term investments |
1 | |||||||||||||||||||||||||
Foreign currency translation |
776 | |||||||||||||||||||||||||
Total comprehensive income |
26,876 | |||||||||||||||||||||||||
Balance at December 25, 2009 |
32,640,957 | 326 | 576,747 | (124,745 | ) | 1,483 | (2,076 | ) | 451,735 | |||||||||||||||||
Share-based compensation |
4,533 | 4,533 | ||||||||||||||||||||||||
Issuance of common stock in lieu of director's fees |
2,051 | — | — | |||||||||||||||||||||||
Issuance of common stock from exercise of stock options |
673,817 | 7 | 10,757 | 10,764 | ||||||||||||||||||||||
Issuance of common stock from vesting of restricted share units |
19,548 | — | — | — | ||||||||||||||||||||||
Excess tax benefits on stock options exercised and other vested share-based payments |
994 | 994 | ||||||||||||||||||||||||
Repurchase of common stock |
(97 | ) | (97 | ) | ||||||||||||||||||||||
Comprehensive income: |
||||||||||||||||||||||||||
Net income |
27,921 | |||||||||||||||||||||||||
Amortization of unrecognized gain on employee benefits |
16 | |||||||||||||||||||||||||
Unrealized loss on short-term investments |
(1 | ) | ||||||||||||||||||||||||
Foreign currency translation |
367 | |||||||||||||||||||||||||
Total comprehensive income |
28,303 | |||||||||||||||||||||||||
Balance at December 31, 2010 |
33,336,373 | $ | 333 | $ | 593,031 | $ | (96,824 | ) | $ | 1,865 | $ | (2,173 | ) | $ | 496,232 | |||||||||||
See accompanying notes to consolidated financial statements.
F-5
INTERLINE BRANDS, INC. AND SUBSIDIARIES
CONSOLIDATED STATEMENTS OF CASH FLOWS
YEARS ENDED DECEMBER 31, 2010, DECEMBER 25, 2009 AND DECEMBER 26, 2008
(in thousands)
| |
2010 | 2009 | 2008 | |||||||||||
|---|---|---|---|---|---|---|---|---|---|---|---|---|---|---|
Cash Flows from Operating Activities: |
||||||||||||||
Net income |
$ | 27,921 | $ | 26,088 | $ | 40,833 | ||||||||
Adjustments to reconcile net income to net cash provided by operating activities: |
||||||||||||||
Depreciation and amortization |
20,612 | 19,174 | 17,414 | |||||||||||
Amortization of debt issuance costs |
1,056 | 1,084 | 1,143 | |||||||||||
Amortization of discount on 81/8% senior subordinated notes |
128 | 145 | 148 | |||||||||||
Loss (gain) on extiguishment of debt, net |
11,486 | (1,257 | ) | (2,775 | ) | |||||||||
Write-off of deferred acquisition costs |
— | 672 | — | |||||||||||
Share-based compensation |
4,533 | 3,794 | 3,782 | |||||||||||
Excess tax benefits from share-based compensation |
(994 | ) | (45 | ) | (147 | ) | ||||||||
Deferred income taxes |
2,504 | 5,684 | (680 | ) | ||||||||||
Provision for doubtful accounts |
5,699 | 10,522 | 6,711 | |||||||||||
Loss on disposal of property and equipment |
146 | 217 | 191 | |||||||||||
Changes in assets and liabilities which provided (used) cash, net of business acquired: |
||||||||||||||
Accounts receivable—trade |
5,224 | 9,216 | 10,303 | |||||||||||
Inventory |
(22,660 | ) | 38,098 | (19,148 | ) | |||||||||
Prepaid expenses and other current assets |
(8,854 | ) | 4,343 | 1,461 | ||||||||||
Other assets |
92 | 394 | 661 | |||||||||||
Accounts payable |
7,509 | 17,671 | 6,871 | |||||||||||
Accrued expenses and other current liabilities |
1,881 | 5,880 | (6,800 | ) | ||||||||||
Accrued interest |
1,744 | (22 | ) | 234 | ||||||||||
Income taxes |
(1,456 | ) | 2,804 | (2,558 | ) | |||||||||
Other liabilities |
4,189 | (180 | ) | (1,452 | ) | |||||||||
Net cash provided by operating activities |
60,760 | 144,282 | 56,192 | |||||||||||
Cash Flows from Investing Activities: |
||||||||||||||
Purchase of property and equipment, net |
(17,729 | ) | (11,157 | ) | (20,582 | ) | ||||||||
Purchase of short-term investments |
(2,955 | ) | (3,034 | ) | (35,531 | ) | ||||||||
Proceeds from sales and maturities of short-term investments |
4,334 | 1,557 | 84,071 | |||||||||||
Purchase of businesses, net of cash acquired |
(54,781 | ) | (1,881 | ) | (10,243 | ) | ||||||||
Net cash (used in) provided by investing activities |
(71,131 | ) | (14,515 | ) | 17,715 | |||||||||
Cash Flows from Financing Activities: |
||||||||||||||
(Decrease) increase in purchase card payable, net |
(3,471 | ) | 1,379 | (2,909 | ) | |||||||||
Repayment of term debt |
(155,815 | ) | (61,535 | ) | (2,486 | ) | ||||||||
Repayment of 81/8% senior subordinated notes |
(137,323 | ) | (34,157 | ) | (9,984 | ) | ||||||||
Proceeds from issuance of 7.00% senior subordinated notes |
300,000 | — | — | |||||||||||
Payment of tender premiums and expenses on 81/8% senior subordinated notes |
(6,338 | ) | — | — | ||||||||||
Payments on capital lease obligations |
(352 | ) | (239 | ) | (218 | ) | ||||||||
Payment of debt issuance costs |
(10,378 | ) | — | — | ||||||||||
Proceeds from stock options exercised |
10,764 | 1,005 | 656 | |||||||||||
Excess tax benefits from share-based compensation |
994 | 45 | 147 | |||||||||||
Treasury stock acquired to satisfy minimum tax withholding requirements |
(97 | ) | (58 | ) | (1,050 | ) | ||||||||
Net cash used in financing activities |
(2,016 | ) | (93,560 | ) | (15,844 | ) | ||||||||
Effect of exchange rate changes on cash and cash equivalents |
145 | 292 | (314 | ) | ||||||||||
Net (decrease) increase in cash and cash equivalents |
(12,242 | ) | 36,499 | 57,749 | ||||||||||
Cash and cash equivalents at beginning of period |
99,223 | 62,724 | 4,975 | |||||||||||
Cash and cash equivalents at end of period |
$ | 86,981 | $ | 99,223 | $ | 62,724 | ||||||||
Supplemental Disclosure of Cash Flow Information: |
||||||||||||||
Cash paid during the period for : |
||||||||||||||
Interest |
$ | 15,332 | $ | 17,697 | $ | 26,864 | ||||||||
Income taxes, net of refunds |
$ | 17,758 | $ | 8,958 | $ | 28,905 | ||||||||
Schedule of Non-Cash Investing and Financing Activities: |
||||||||||||||
Property acquired through lease incentives |
$ | 2,493 | $ | 3,009 | $ | — | ||||||||
Adjustments to liabilities assumed and goodwill on businesses acquired |
$ | 233 | $ | 8 | $ | 1,027 | ||||||||
Contingent consideration associated with purchase of business |
$ | 4,048 | $ | — | $ | — | ||||||||
See accompanying notes to consolidated financial statements.
F-6
INTERLINE BRANDS, INC. AND SUBSIDIARIES
NOTES TO CONSOLIDATED FINANCIAL STATEMENTS
YEARS ENDED DECEMBER 31, 2010, DECEMBER 25, 2009 AND DECEMBER 26,
2008
1. DESCRIPTION OF THE BUSINESS AND BACKGROUND
Description of Business
Interline Brands, Inc., a Delaware corporation, and its subsidiaries ("Interline" or the "Company") is a direct marketer and specialty distributor of maintenance, repair and operations ("MRO") products. The Company sells plumbing, electrical, hardware, security, heating, ventilation and air conditioning ("HVAC"), janitorial and sanitation ("JanSan") supplies and other MRO products. Interline's highly diverse customer base consists of multi-family housing, educational, lodging, government and healthcare facilities, professional contractors and specialty distributors.
The Company markets and sells its products primarily through thirteen distinct and targeted brands. The Company utilizes a variety of sales channels, including a direct sales force, telesales representatives, a direct marketing program, brand-specific websites and a national accounts sales program. The Company delivers its products through its network of distribution centers and professional contractor showrooms located throughout the United States, Canada and Puerto Rico, vendor managed inventory locations at large professional contractor customer locations and its dedicated fleet of trucks. Through its broad distribution network, the Company is able to provide next-day delivery service to at least 98% of the U.S. population and same-day delivery service to most major metropolitan markets.
The Company is the holding company of the Interline group of businesses, including its principal operating subsidiary, Interline Brands, Inc., a New Jersey corporation ("Interline New Jersey").
2. SUMMARY OF SIGNIFICANT ACCOUNTING POLICIES
Principles of Consolidation
The consolidated financial statements include the accounts of Interline Brands, Inc. and all of its wholly-owned subsidiaries. These statements have been prepared in accordance with accounting principles generally accepted in the United States of America ("US GAAP"). All intercompany balances and transactions have been eliminated in consolidation.
Fiscal Year
The Company operates on a 52-53 week fiscal year, which ends on the last Friday in December. The fiscal year ended December 31, 2010 was a fifty-three week year. The fiscal years ended December 25, 2009 and December 26, 2008 were fifty-two week years. References herein to 2010, 2009 and 2008 are for the fiscal years ended December 31, 2010, December 25, 2009 and December 26, 2008, respectively.
Estimates
The preparation of financial statements in conformity with US GAAP requires management to make estimates and assumptions that affect the reported amounts of assets and liabilities and disclosures of contingent liabilities at the date of the financial statements and the reported amounts of revenues and expenses during the reporting period. Actual results may differ from those estimates and assumptions.
Subsequent Events
The Company evaluated events and transactions that occurred during the period from December 31, 2010, the date of the consolidated balance sheet, through the date the consolidated
F-7
INTERLINE BRANDS, INC. AND SUBSIDIARIES
NOTES TO CONSOLIDATED FINANCIAL STATEMENTS (Continued)
YEARS ENDED DECEMBER 31, 2010, DECEMBER 25, 2009 AND DECEMBER 26, 2008
2. SUMMARY OF SIGNIFICANT ACCOUNTING POLICIES (Continued)
financial statements were issued, for potential recognition or disclosure in the consolidated financial statements. See Note 20. Subsequent Event.
Fair Value of Financial Instruments
The Company defines fair value as the price that would be received to sell an asset or paid to transfer a liability in an orderly transaction between market participants at the measurement date. US GAAP requires disclosure about how fair value is determined for assets and liabilities and establishes a hierarchy for which these assets and liabilities must be grouped, based on significant levels of inputs as follows:
Level 1 |
quoted prices in active markets for identical assets or liabilities; | |
Level 2 |
quoted prices in active markets for similar assets and liabilities and inputs that are observable for the asset or liability; or |
|
Level 3 |
unobservable inputs, such as discounted cash flow models or valuations. |
The determination of where assets and liabilities fall within this hierarchy is based upon the lowest level of input that is significant to the fair value measurement.
The fair value of cash and cash equivalents, accounts receivable, accounts payable and note payable approximate the carrying amount because of the short maturities of these items.
The Company's short-term investments are comprised of pre-refunded municipal bonds. The fair value of the pre-refunded municipal bonds is determined by quoted market prices as they are publicly traded. The following table shows the carrying amount and the fair value of the Company's short-term investments as of December 31, 2010 and December 25, 2009 (in thousands):
| |
December 31, 2010 | December 25, 2009 | |||||||||||
|---|---|---|---|---|---|---|---|---|---|---|---|---|---|
| |
Carrying Amount |
Fair Value |
Carrying Amount |
Fair Value |
|||||||||
Pre-refunded municipal bonds |
$ | 100 | $ | 100 | $ | 1,478 | $ | 1,479 | |||||
|
$ | 100 | $ | 100 | $ | 1,478 | $ | 1,479 | |||||
- (1)
- Fair value estimated using Level 1 inputs. The fair value of the pre-refunded municipal bonds is determined by quoted market prices as they are publicly traded.
The fair value of term loans was estimated using Level 2 inputs, consisting of a discounted cash flow analysis based on borrowing rates available to companies with similar credit ratings for loans with similar terms and maturity. There were no term loans outstanding as of December 31, 2010. The carrying amount and fair value of the term loans at December 25, 2009 was $154.2 million and $145.8 million, respectively.
The fair value of the Company's senior subordinated notes is determined by quoted market prices, which are Level 1 inputs. The carrying amount and fair value of the non-current portion of the Company's senior subordinated notes at December 31, 2010 was $300.0 million and $304.5 million, respectively. The carrying amount and fair value of the Company's senior subordinated notes at December 25, 2009 was $149.9 million and $151.4 million, respectively.
F-8
INTERLINE BRANDS, INC. AND SUBSIDIARIES
NOTES TO CONSOLIDATED FINANCIAL STATEMENTS (Continued)
YEARS ENDED DECEMBER 31, 2010, DECEMBER 25, 2009 AND DECEMBER 26, 2008
2. SUMMARY OF SIGNIFICANT ACCOUNTING POLICIES (Continued)
Foreign Currency Translation
Assets and liabilities of the Company's foreign subsidiaries, where the functional currency is the local currency, are translated into United States dollars at the year-end exchange rate. Revenues and expenses are translated using average exchange rates prevailing during the year. As of December 31, 2010 and December 25, 2009, cumulative translation adjustments of $1.9 million and $1.5 million, respectively, were included as a component of accumulated other comprehensive income.
Cash and Cash Equivalents
Cash and cash equivalents consist of cash and highly liquid investments that can be readily converted into cash or that have an original maturity of three months or less.
Short-Term Investments
The Company's short-term investments, which are classified as available-for-sale, consist of pre-refunded municipal bonds. Pre-refunded municipal bonds are bonds that are refinanced by the issuer and remain outstanding in the marketplace until a specific call date or maturity date is reached. Pre-refunded municipal bonds are secured by U.S. Treasury securities placed in an irrevocable escrow account. As of December 31, 2010, all of the Company's pre-refunded municipal bonds have contractual maturities of less than one year. Accordingly, they have been classified as current assets. Short-term investments are recorded at fair value as determined by quoted market prices. Changes in the fair value, if any, are included in accumulated other comprehensive income, net of applicable taxes, except credit related losses, which would be recorded before applicable taxes within the statement of earnings. As of December 31, 2010 and December 25, 2009, there were essentially no unrealized gains and losses associated with these investments. During 2010, 2009 and 2008, all income generated from short-term investments was recorded as interest income.
Concentrations of Credit Risk
Financial instruments, which potentially subject the Company to concentration of credit risk, consist principally of accounts receivable. The Company's accounts receivable are principally from facilities maintenance, professional contractor and specialty distributor customers in the United States and Canada. Concentration of credit risk with respect to accounts receivable, however, is limited due to the large number of customers comprising the Company's customer base. The Company performs credit evaluations of its customers; however, the Company's policy is not to require collateral. As of December 31, 2010 and December 25, 2009, the Company had no significant concentrations of credit risk.
Allowance for Doubtful Accounts
The Company maintains an allowance for doubtful accounts for estimated losses resulting from the inability of its customers to make payments. The allowance for doubtful accounts is estimated using factors such as past collection history and general risk profile. Receivables are charged against the allowance for doubtful accounts when it is probable that the receivable will not be recovered.
Inventories
Inventories, consisting substantially of finished goods, are valued at the lower of cost or market. Inventory cost is determined using the weighted-average cost method. The Company adjusts inventory
F-9
INTERLINE BRANDS, INC. AND SUBSIDIARIES
NOTES TO CONSOLIDATED FINANCIAL STATEMENTS (Continued)
YEARS ENDED DECEMBER 31, 2010, DECEMBER 25, 2009 AND DECEMBER 26, 2008
2. SUMMARY OF SIGNIFICANT ACCOUNTING POLICIES (Continued)
for excess and obsolete inventory and for the difference by which the cost of the inventory exceeds the estimated market value. In order to determine the adjustments, management reviews inventory quantities on hand, slow movement reports and sales history reports. Management estimates the required adjustment based on estimated demand for products and market conditions. To the extent historical results are not indicative of future results and if events occur that affect the Company's relationships with suppliers or the salability of their products, additional write-offs may be needed that will increase cost of sales and decrease inventory.
Vendor Rebates
Many of the Company's arrangements with its vendors provide for the Company to receive a rebate of a specified amount of consideration, payable to the Company when the Company achieves any of a number of measures, generally related to the volume level of purchases from its vendors. The Company accounts for such rebates as a reduction of the prices of the vendor's products and therefore as a reduction of inventory until it sells the product, at which time such rebates reduce cost of sales in the Company's statement of earnings. Throughout the year, the Company estimates the amount of rebates earned based on estimated purchases to date relative to the purchase levels that mark the Company's progress toward earning the rebates. The Company continually revises these estimates to reflect actual rebates earned based on actual purchase levels.
Property and Equipment
Property and equipment purchased in the normal course of business is stated at cost, net of accumulated depreciation and amortization. Expenditures for additions, renewals and betterments are capitalized. Expenditures for maintenance and repairs are charged to expense as incurred. Property and equipment acquired in connection with acquisitions are recorded at amounts which approximate fair market value as of the date of the acquisition. Upon the retirement or disposal of assets, the cost and accumulated depreciation or amortization is eliminated from the accounts and the resulting gain or loss is credited or charged to operations.
Leasehold improvements and assets under capital leases are amortized, using the straight-line method, over the lesser of the estimated useful lives or the term of the lease. Lease incentive obligations accrued as a result of leasehold improvements are amortized as a decrease in rent expense over the life of the related leasehold improvements.
Depreciation and amortization, including assets under capital leases, is computed using the straight-line method based upon estimated useful lives of the assets as follows:
Buildings |
39 - 40 years | |
Machinery and equipment |
3 - 7 years | |
Office furniture and equipment |
3 - 7 years | |
Vehicles |
5 years | |
Leasehold improvements |
1 - 10 years |
Costs of Computer Software Developed or Obtained for Internal Use
The Company capitalizes costs related to internally developed software and amortizes those costs over five years. Only costs incurred during the development stage, including design, coding, installation and testing are capitalized. These capitalized costs primarily represent internal labor costs for
F-10
INTERLINE BRANDS, INC. AND SUBSIDIARIES
NOTES TO CONSOLIDATED FINANCIAL STATEMENTS (Continued)
YEARS ENDED DECEMBER 31, 2010, DECEMBER 25, 2009 AND DECEMBER 26, 2008
2. SUMMARY OF SIGNIFICANT ACCOUNTING POLICIES (Continued)
employees directly associated with the software development. Upgrades or modifications that result in additional functionality are capitalized. Capitalized costs were $3.1 million, $1.3 million and $1.7 million for 2010, 2009 and 2008, respectively. As of December 31, 2010 and December 25, 2009, there was $5.4 million and $4.1 million, respectively, of unamortized capitalized software costs. During 2010, 2009 and 2008, amortization expense associated with capitalized software costs was $1.9 million, $1.6 million and $1.6 million, respectively.
Goodwill
Goodwill represents the excess of the costs of acquired companies over the fair value of their net assets. The Company performs a goodwill impairment analysis, using the two-step method, on an annual basis and whenever events or changes in circumstances indicate that the carrying value may not be recoverable. The Company has elected to perform its annual goodwill impairment test as of the last day of each year. The recoverability of goodwill is measured at the reporting unit level, which the Company has determined to be consistent with its operating segment, by comparing the reporting unit's carrying amount, including goodwill, to the fair market value of the reporting unit. The Company determines the fair market value of its reporting unit based on a weighting of both the present value of future projected cash flows (the "income approach") and the use of comparative market multiples (the "market approach"). The market approach compares the Company's reporting unit to other comparable companies based on valuation multiples to arrive at fair value. The income approach is based on assumptions that are consistent with the Company's estimates of future cash flows. The determination of whether goodwill has become impaired involves a significant level of judgment in the assumptions underlying the approach used to determine the value of the Company's reporting unit including assumptions related to future growth rates, discount factors and tax rates, among other considerations. Changes in the Company's strategy or assumptions, environmental or other regulations, and/or operating, economic or market conditions could significantly impact these judgments. The Company monitors these conditions and other factors to determine if interim impairment tests are necessary in future periods. Changes in conditions that occur after the annual impairment analysis and that impact these assumptions may result in a future goodwill impairment charge, which could be material. The Company has not identified any impairment losses with respect to goodwill for any year presented.
Other Intangible Assets
Other intangible assets include amounts assigned to trademarks, customer lists and relationships, non-compete agreements and deferred debt issuance costs. Other intangibles are amortized over their useful lives, 13 to 22 years for customer lists and relationships and 1 to 10 years for non-compete agreements. Customer lists and relationships are amortized on either a straight-line or accelerated basis, depending on the characteristics of the asset at the beginning of its life. Deferred debt issuance costs are amortized as a component of interest expense over the term of the related debt using the effective interest method or a method that approximates the effective interest method. The Company has determined that its trademarks have indefinite lives and has elected to perform its annual impairment test on indefinite-lived assets as of the last day of each year. The Company has not identified any impairment losses with respect to trademarks for any year presented.
F-11
INTERLINE BRANDS, INC. AND SUBSIDIARIES
NOTES TO CONSOLIDATED FINANCIAL STATEMENTS (Continued)
YEARS ENDED DECEMBER 31, 2010, DECEMBER 25, 2009 AND DECEMBER 26, 2008
2. SUMMARY OF SIGNIFICANT ACCOUNTING POLICIES (Continued)
Impairment of Long-Lived Assets
The Company evaluates its long-lived assets for impairment on an annual basis or when an event occurs or circumstances change that would indicate that the fair value of the long-lived asset has fallen below its carrying amount. Such evaluations include an assessment of customer retention, cash flow projections and other factors the Company believes are relevant. The discounted future expected net cash flows of each identifiable asset are used to measure impairment losses. The determination of whether long-lived assets have become impaired involves a significant level of judgment in the assumptions underlying the approach used to determine the value of the long-lived asset. Changes in the Company's strategy or assumptions, environmental or other regulations, and/or market conditions could significantly impact these judgments. The Company monitors market conditions and other factors to determine if interim impairment tests are necessary. The Company has not identified any impairment losses with respect to long-lived assets for any year presented.
Risk Insurance
The Company has a $0.3 million self-insured retention per occurrence in connection with its workers' compensation and auto insurance policies (collectively "Risk Insurance"). The Company accrues its estimated cost in connection with its portion of its Risk Insurance losses using an actuarial methodology based on claims filed, historical development factors and an estimate of claims incurred but not yet reported. The Company does not discount its workers compensation reserve. Claims paid are charged against the reserve.
Taxes Collected and Remitted
The Company records non-income taxes collected from customers and remitted to governmental agencies on a net basis.
Revenue Recognition
The Company requires that the following four basic criteria must be met before revenue is recognized:
- •
- persuasive evidence of an arrangement exists;
- •
- delivery has occurred or services have been rendered;
- •
- the seller's price to the buyer is fixed or determinable; and
- •
- collectability is reasonably assured.
The Company recognizes a sale when the risk of loss has passed to the customer. For goods shipped by third party carriers, the Company recognizes revenue upon shipment since the terms are generally FOB shipping point. For goods delivered on the Company's dedicated fleet of trucks, the Company recognizes revenue upon delivery to the customer. Sales are recorded net of estimated discounts, rebates and returns. A portion of the Company's sales are delivered direct from the suppliers. These direct-shipment sales are recorded on a gross basis, with the corresponding cost of goods sold. The Company bills some shipping and handling costs to its customers and has included this amount in revenue. The Company provides product return and protection rights to certain customers. A provision is made for estimated product returns based on sales volumes and our experience. Actual returns have not varied materially from amounts provided historically.
F-12
INTERLINE BRANDS, INC. AND SUBSIDIARIES
NOTES TO CONSOLIDATED FINANCIAL STATEMENTS (Continued)
YEARS ENDED DECEMBER 31, 2010, DECEMBER 25, 2009 AND DECEMBER 26, 2008
2. SUMMARY OF SIGNIFICANT ACCOUNTING POLICIES (Continued)
Cost of Sales
Cost of sales includes merchandise costs less vendor rebates, freight-in and a portion of operating costs related to the replenishment activities of some of our large distribution centers.
Shipping and Handling Costs
Shipping and handling costs to customers have been included in selling, general and administrative expenses on the consolidated statements of earnings. Shipping and handling costs were $48.4 million, $47.4 million, and $57.3 million in 2010, 2009 and 2008, respectively.
Advertising Costs
Costs of producing and distributing sales catalogs and promotional flyers are capitalized and charged to expense over the life of the related catalog and promotional flyers. Advertising expenses, net of co-op advertising, were $1.2 million, $2.5 million, and $2.3 million in 2010, 2009 and 2008, respectively. Co-op advertising was $2.7 million, $2.1 million and $2.3 million in 2010, 2009 and 2008, respectively.
Share-Based Compensation
The Company recognizes compensation cost ratably using the straight-line attribution method over the expected vesting period or to the retirement eligibility date, if less than the vesting period when vesting is not contingent upon any future performance. In addition, the Company estimates the amount of expected forfeitures when calculating the compensation costs.
During 2008, the Company entered in to a separation agreement with an executive. Under the separation agreement and in exchange for non-competition and non-solicitation restrictions relating to activities after leaving the Company, the Company amended certain stock options granted to the executive in connection with the Company's initial public offering in December 2004. The amendments allowed the executive the right to exercise those stock options until December 31, 2010. As a result of the modification to those stock options, the Company recorded $0.7 million in share-based compensation expense. Total share-based compensation expense, which is included in the consolidated statement of earnings, was $4.5 million, $3.8 million and $3.8 million for 2010, 2009 and 2008, respectively. The tax benefit related to share-based compensation was $1.8 million, $1.5 million and $1.5 million for 2010, 2009 and 2008, respectively. See Note 13. Share-Based Compensation for more information.
Income Taxes
Taxes on income are provided using an asset and liability approach to financial accounting and reporting for income taxes. Deferred income tax assets and liabilities are computed for differences between the financial statement carrying values and the tax bases of assets and liabilities that will result in taxable or deductible amounts in the future. Such deferred income tax asset and liability computations are based on enacted tax laws and rates applicable to periods in which the differences are expected to affect taxable income. Valuation allowances are established when necessary to reduce deferred tax assets to the amounts expected to be realized.
Accounting for income taxes requires the Company to exercise judgment in evaluating uncertain tax positions taken by the Company. The Company accounts for uncertainty in income taxes in
F-13
INTERLINE BRANDS, INC. AND SUBSIDIARIES
NOTES TO CONSOLIDATED FINANCIAL STATEMENTS (Continued)
YEARS ENDED DECEMBER 31, 2010, DECEMBER 25, 2009 AND DECEMBER 26, 2008
2. SUMMARY OF SIGNIFICANT ACCOUNTING POLICIES (Continued)
accordance with US GAAP. The final outcome of these tax uncertainties is dependent upon various matters including tax examinations, legal proceedings, changes in regulatory tax laws, or interpretation of those tax laws, or expiration of statutes of limitation. The Company recognizes potential penalties and interest related to unrecognized tax benefits within its statements of earnings as selling, general and administrative expenses and interest expense, respectively. To the extent penalties and interest are not assessed with respect to uncertain tax positions, amounts accrued will be reduced and reflected as a reduction of selling, general and administrative expenses and interest expense, respectively. See Note 17. Income Taxes for more information.
Earnings per Share
Basic earnings per share is computed by dividing net income by the weighted-average number of common shares outstanding during the year including the dilutive effect of deferred stock units. Diluted earnings per share is computed by dividing net income by the weighted-average number of shares outstanding during the year as adjusted for the potential dilutive effect of stock options and non-vested shares of restricted stock and restricted share units using the treasury stock method.
The following summarizes the shares of common stock used to calculate diluted earnings per share including the impact of stock options, restricted stock and restricted share units:
| |
Year Ended | ||||||||||
|---|---|---|---|---|---|---|---|---|---|---|---|
| |
December 31, 2010 |
December 25, 2009 |
December 26, 2008 |
||||||||
Weighted average shares outstanding—basic |
32,998,352 | 32,503,306 | 32,396,764 | ||||||||
Dilutive shares resulting from: |
|||||||||||
Stock options |
380,056 | 163,463 | 102,383 | ||||||||
Restricted stock |
— | 311 | 2,088 | ||||||||
Restricted share units |
407,477 | 241,430 | 72,317 | ||||||||
Weighted average shares outstanding—diluted |
33,785,885 | 32,908,510 | 32,573,552 | ||||||||
During 2010, 2009 and 2008, options to purchase 1,649,470 shares, 2,693,002 shares, and 2,197,830 shares of common stock, respectively, were excluded from the computations of diluted weighted-average shares outstanding because the exercise prices of those options are greater than the average market value of common stock and the effect would be anti-dilutive.
F-14
INTERLINE BRANDS, INC. AND SUBSIDIARIES
NOTES TO CONSOLIDATED FINANCIAL STATEMENTS (Continued)
YEARS ENDED DECEMBER 31, 2010, DECEMBER 25, 2009 AND DECEMBER 26, 2008
2. SUMMARY OF SIGNIFICANT ACCOUNTING POLICIES (Continued)
Segment Information
The Company has one operating segment and, therefore, one reportable segment, the distribution of MRO products. The Company's revenues and assets outside the United States are not significant. The Company's net sales by product category were as follows (in thousands):
| |
Year Ended | ||||||||||
|---|---|---|---|---|---|---|---|---|---|---|---|
Product Category(1)
|
December 31, 2010 |
December 25, 2009 |
December 26, 2008 |
||||||||
Janitorial and sanitation |
$ | 308,958 | $ | 292,308 | $ | 280,332 | |||||
Plumbing |
266,252 | 269,660 | 320,016 | ||||||||
Heating, ventilation and air conditioning |
127,194 | 110,283 | 123,645 | ||||||||
Hardware, tools and fixtures |
120,771 | 122,376 | 134,475 | ||||||||
Electrical and lighting |
69,983 | 73,507 | 91,795 | ||||||||
Appliances and parts |
62,372 | 60,602 | 61,212 | ||||||||
Security and safety |
60,549 | 61,045 | 70,789 | ||||||||
Other |
70,910 | 69,497 | 113,399 | ||||||||
Total |
$ | 1,086,989 | $ | 1,059,278 | $ | 1,195,663 | |||||
- (1)
- During 2010, the Company implemented a new product information management system. In conjunction with this implementation, the Company went through a robust product identification process and, as a result, realigned stock keeping units within product categories. Therefore, prior periods in this table have been recast to be consistent with current year presentation.
3. ACQUISITION
On October 29, 2010, Interline New Jersey acquired substantially all of the assets and a portion of the liabilities of CleanSource, Inc. ("CleanSource") for $54.6 million in cash and an earn-out of up to $5.5 million in cash over two years. As of December 31, 2010, the fair value of the earn-out, per the valuation performed in accordance with ASC 805-10, Business Combinations, was $4.0 million. CleanSource, which is headquartered in San Jose, California, is a large regional distributor of JanSan supplies. CleanSource offers over 4,000 products and primarily serves institutional facilities in the healthcare and education markets, as well as building services contractors. This acquisition represents a geographical expansion of the Company's JanSan offering to the West Coast of the United States.
F-15
INTERLINE BRANDS, INC. AND SUBSIDIARIES
NOTES TO CONSOLIDATED FINANCIAL STATEMENTS (Continued)
YEARS ENDED DECEMBER 31, 2010, DECEMBER 25, 2009 AND DECEMBER 26, 2008
3. ACQUISITION (Continued)
The following table summarizes the preliminary allocation of the purchase price to the CleanSource assets acquired and liabilities assumed at estimated fair values (in thousands):
Accounts receivable |
$ | 13,451 | |||
Inventory |
7,026 | ||||
Other current assets |
1,410 | ||||
Property and equipment |
2,357 | ||||
Goodwill |
22,251 | ||||
Intangible assets |
17,100 | ||||
Other assets |
120 | ||||
Total assets acquired |
63,715 | ||||
Current liabilities |
6,320 | ||||
Other liabilities |
2,855 | ||||
Total liabilities assumed |
9,175 | ||||
Net assets acquired |
$ | 54,540 | |||
This acquisition was treated as a purchase and sale of assets for Federal income tax purposes. Accordingly, the $22.3 million of goodwill is expected to be deductible for tax purposes. Recorded goodwill is the result of discounted expected future cash flows not related to identifiable assets.
Of the $17.1 million of acquired intangible assets, $4.1 million was assigned to registered trademarks that are not subject to amortization as the Company believes these intangible assets have indefinite lives. The remaining $13.0 million of acquired intangible assets consists of customer relationships and have a weighted-average useful life of approximately 22 years.
Net sales and net income for the year ended December 31, 2010 of $18.6 million and $0.1 million are included in the Statement of Earnings relating to CleanSource for the period October 29, 2010 through December 31, 2010. If the acquisition of CleanSource had occurred on December 27, 2008, revenue would have been $1,183.4 million and $1,176.0 million for the years ended December 31, 2010 and December 25, 2009, respectively, and net income would have been $29.9 million and $27.1 million for the years ended December 31, 2010 and December 25, 2009, respectively.
4. RESTRUCTURING AND ACQUISITION ACCRUALS
Restructuring Accruals
During the three months ended September 26, 2008, the Company began undertaking significant changes in its cost structure. These operational initiatives focus on reducing the Company's overall operating cost structure. The Company took the following specific actions during 2009 and 2008:
- •
- reduced its workforce; and
- •
- closed and consolidated certain facilities.
There were no restructuring charges related to these various initiatives in 2010 and no additional charges are expected. There were restructuring charges related to these initiatives of $4.6 and $2.3 million during 2009 and 2008, respectively, which are included as part of selling, general and
F-16
INTERLINE BRANDS, INC. AND SUBSIDIARIES
NOTES TO CONSOLIDATED FINANCIAL STATEMENTS (Continued)
YEARS ENDED DECEMBER 31, 2010, DECEMBER 25, 2009 AND DECEMBER 26, 2008
4. RESTRUCTURING AND ACQUISITION ACCRUALS (Continued)
administrative expenses in the Company's statement of earnings. The following table summarizes the changes to accruals recorded in connection with the Company's restructuring, which are included in accrued expenses and other current liabilities (in thousands):
| |
Employee Separation Costs |
Facility Closing and Other Costs |
Total | ||||||||
|---|---|---|---|---|---|---|---|---|---|---|---|
Balance at December 26, 2008 |
$ | 330 | $ | 844 | $ | 1,174 | |||||
Provisions |
1,472 | 3,140 | 4,612 | ||||||||
Payments |
(1,625 | ) | (2,660 | ) | (4,285 | ) | |||||
Balance at December 25, 2009 |
177 | 1,324 | 1,501 | ||||||||
Payments |
(73 | ) | (781 | ) | (854 | ) | |||||
Adjustments(1) |
(104 | ) | (68 | ) | (172 | ) | |||||
Balance at December 31, 2010 |
$ | — | $ | 475 | $ | 475 | |||||
- (1)
- Adjustments reflect a change in estimate of remaining liabilities for employee separation and facility closing and other costs.
Acquisition Accruals
The following table summarizes the changes to reserves recorded in connection with the Company's business combinations (in thousands):
| |
Employee Severance and Relocation |
Facility Closing and Other Costs |
Total | ||||||||
|---|---|---|---|---|---|---|---|---|---|---|---|
Balance at December 26, 2008 |
$ | 95 | $ | 1,982 | $ | 2,077 | |||||
Payments |
— | (670 | ) | (670 | ) | ||||||
Write-offs |
(40 | ) | (1,148 | ) | (1,188 | ) | |||||
Additions to reserve |
— | 1,176 | 1,176 | ||||||||
Balance at December 25, 2009 |
55 | 1,340 | 1,395 | ||||||||
Payments |
(11 | ) | (39 | ) | (50 | ) | |||||
Write-offs |
— | (384 | ) | (384 | ) | ||||||
Balance at December 31, 2010 |
$ | 44 | $ | 917 | $ | 961 | |||||
5. ACCOUNTS RECEIVABLE
The Company's trade receivables are exposed to credit risk. The majority of the market served by the Company is comprised of numerous individual accounts, none of which is individually significant. The Company monitors the creditworthiness of its customers on an ongoing basis and provides a reserve for estimated bad debt losses. If the financial condition of the Company's customers were to deteriorate, increases in its allowance for doubtful accounts may be needed.
F-17
INTERLINE BRANDS, INC. AND SUBSIDIARIES
NOTES TO CONSOLIDATED FINANCIAL STATEMENTS (Continued)
YEARS ENDED DECEMBER 31, 2010, DECEMBER 25, 2009 AND DECEMBER 26, 2008
5. ACCOUNTS RECEIVABLE (Continued)
The activity in the allowance for doubtful accounts consisted of the following (in thousands):
Year Ended
|
Balance at Beginning of Year |
Charged to Expense(1) |
Deductions(2) | Balance at End of Year |
|||||||||
|---|---|---|---|---|---|---|---|---|---|---|---|---|---|
December 26, 2008 |
$ | 7,268 | $ | 6,711 | $ | (1,839 | ) | $ | 12,140 | ||||
December 25, 2009(3) |
$ | 12,140 | $ | 10,522 | $ | (9,687 | ) | $ | 12,975 | ||||
December 31, 2010(3) |
$ | 12,975 | $ | 5,699 | $ | (9,586 | ) | $ | 9,088 | ||||
- (1)
- Expense
for 2009 includes a $3.0 million charge associated with a customer seeking Chapter 11 bankruptcy protection.
- (2)
- Accounts
receivable written-off as uncollectible, net of recoveries.
- (3)
- During 2009 and 2010, the Company performed detailed reviews of its accounts receivable deemed uncollectible. Based on those reviews, the Company increased the number of accounts written-off. The majority of the accounts receivable deemed uncollectible had been fully reserved for in prior years.
6. PREPAID EXPENSES AND OTHER CURRENT ASSETS
Prepaid expenses and other current assets consisted of the following as of December 31, 2010 and December 25, 2009 (in thousands):
| |
December 31, 2010 |
December 25, 2009 |
|||||
|---|---|---|---|---|---|---|---|
Vendor rebates receivable |
$ | 14,968 | $ | 10,792 | |||
Prepaid insurance |
2,426 | 2,217 | |||||
Prepaid rent |
2,020 | 1,882 | |||||
Other |
9,402 | 3,661 | |||||
|
$ | 28,816 | $ | 18,552 | |||
F-18
INTERLINE BRANDS, INC. AND SUBSIDIARIES
NOTES TO CONSOLIDATED FINANCIAL STATEMENTS (Continued)
YEARS ENDED DECEMBER 31, 2010, DECEMBER 25, 2009 AND DECEMBER 26, 2008
7. PROPERTY AND EQUIPMENT
Major classifications of property and equipment as of December 31, 2010 and December 25, 2009 were as follows (in thousands):
| |
December 31, 2010 |
December 25, 2009 |
|||||
|---|---|---|---|---|---|---|---|
Land |
$ | 400 | $ | 400 | |||
Building |
9,262 | 9,262 | |||||
Machinery and equipment |
98,508 | 95,100 | |||||
Office furniture and equipment |
13,110 | 7,863 | |||||
Vehicles |
4,078 | 2,534 | |||||
Leasehold improvements |
17,313 | 14,927 | |||||
|
142,671 | 130,086 | |||||
Less: Accumulated depreciation and amortization |
(88,125 | ) | (83,282 | ) | |||
|
$ | 54,546 | $ | 46,804 | |||
Depreciation and amortization expense, including amounts for assets under capital leases, was $14.7 million, $13.2 million, and $11.6 million for 2010, 2009 and 2008, respectively.
8. GOODWILL AND OTHER INTANGIBLE ASSETS
Changes to goodwill during 2010 and 2009 were as follows (in thousands):
Balance at December 26, 2008 |
$ | 317,117 | |||
Acquired goodwill |
1,881 | ||||
Purchase price adjustments |
8 | ||||
Balance at December 25, 2009 |
319,006 | ||||
Acquired goodwill |
22,395 | ||||
Purchase price adjustments |
(233 | ) | |||
Balance at December 31, 2010 |
$ | 341,168 | |||
The acquired goodwill in 2010 primarily relates to the Company's acquisition of CleanSource, Inc. in October 2010. The acquired goodwill during 2009 primarily relates to purchase price adjustments from the acquisition of Eagle Maintenance Supply, Inc. ("Eagle") in August 2008.
Purchase price adjustments in 2010 relate to the revision of the liability for exit activities associated with the Eagle acquisition, net of related adjustments to deferred taxes. Purchase price adjustments during 2009 relate primarily to the write-off of unused acquisition accruals created for the estimated loss on property and equipment and operating leases associated with the Barnett, Inc. ("Barnett") and AmSan LLC ("AmSan") acquisitions, net of related adjustments to deferred taxes for these write-offs.
F-19
INTERLINE BRANDS, INC. AND SUBSIDIARIES
NOTES TO CONSOLIDATED FINANCIAL STATEMENTS (Continued)
YEARS ENDED DECEMBER 31, 2010, DECEMBER 25, 2009 AND DECEMBER 26, 2008
8. GOODWILL AND OTHER INTANGIBLE ASSETS (Continued)
The gross carrying amount and accumulated amortization of the Company's intangible assets other than goodwill as of December 31, 2010 and December 25, 2009 were as follows (in thousands):
December 31, 2010
|
Gross Carrying Amount |
Accumulated Amortization |
Net Book Value |
||||||||
|---|---|---|---|---|---|---|---|---|---|---|---|
Trademarks |
$ | 65,221 | $ | 5,568 | $ | 59,653 | |||||
Customer relationships |
110,562 | 38,885 | 71,677 | ||||||||
Non-compete agreements |
2,832 | 2,785 | 47 | ||||||||
Deferred debt issuance costs |
10,378 | 193 | 10,185 | ||||||||
Total |
$ | 188,993 | $ | 47,431 | $ | 141,562 | |||||
December 25, 2009 |
|||||||||||
Trademarks |
$ | 61,121 | $ | 5,568 | $ | 55,553 | |||||
Customer relationships |
97,562 | 33,013 | 64,549 | ||||||||
Non-compete agreements |
2,762 | 2,748 | 14 | ||||||||
Deferred debt issuance costs |
8,591 | 3,872 | 4,719 | ||||||||
Total |
$ | 170,036 | $ | 45,201 | $ | 124,835 | |||||
The amortization of deferred debt issuance costs, recorded as a component of interest expense, was $1.1 million in each of 2010, 2009 and 2008. The write-off of deferred debt issuance costs totaled $3.9 million, $0.9 million and $0.1 million in 2010, 2009 and 2008, respectively, related to the extinguishment of debt.
Amortization expense on other intangible assets was $5.9 million, $6.0 million, and $5.8 million for 2010, 2009 and 2008, respectively. Expected amortization expense on other intangible assets (excluding deferred debt issuance costs which will vary depending upon debt payments) for each of the five succeeding fiscal years is expected to be as follows (in thousands):
Fiscal Year
|
Future Estimated Amortization |
|||
|---|---|---|---|---|
2011 |
$ | 6,402 | ||
2012 |
$ | 6,280 | ||
2013 |
$ | 6,246 | ||
2014 |
$ | 6,231 | ||
2015 |
$ | 6,210 | ||
F-20
INTERLINE BRANDS, INC. AND SUBSIDIARIES
NOTES TO CONSOLIDATED FINANCIAL STATEMENTS (Continued)
YEARS ENDED DECEMBER 31, 2010, DECEMBER 25, 2009 AND DECEMBER 26, 2008
9. ACCRUED EXPENSES AND OTHER CURRENT LIABILITIES
Accrued expenses and other current liabilities consisted of the following as of December 31, 2010 and December 25, 2009 (in thousands):
| |
December 31, 2010 |
December 25, 2009 |
|||||
|---|---|---|---|---|---|---|---|
Accrued compensation and benefits |
$ | 17,168 | $ | 12,671 | |||
Accrued sales tax |
4,573 | 3,184 | |||||
Purchase card payable(1) |
2,222 | 5,693 | |||||
Other |
21,218 | 20,167 | |||||
|
$ | 45,181 | $ | 41,715 | |||
- (1)
- Purchase card payable is comprised of trade vendor invoices that were paid pursuant to a purchase card agreement with a third-party intermediary. The Company has a purchase card agreement with a third-party intermediary whereby the third-party intermediary pays the trade vendor invoices in accordance with the terms agreed to by the vendor and the Company. The third-party intermediary bills the Company for amounts disbursed on a monthly basis. As a result, there could be an outstanding payable due to the third-party intermediary at any period end. The net activity in purchase card payable is shown as cash flows from financing activities. In addition, the Company received a rebate from the third-party intermediary based on the volume of transactions administered by the third-party intermediary totaling $0.5 million, $0.5 million, and $0.6 million during 2010, 2009 and 2008, respectively.
10. DEBT
Long-term debt consisted of the following as of December 31, 2010 and December 25, 2009 (in thousands):
| |
December 31, 2010 |
December 25, 2009 |
|||||
|---|---|---|---|---|---|---|---|
Note payable |
$ | — | $ | 1,590 | |||
Term loans |
— | 154,225 | |||||
7.00% Notes |
300,000 | — | |||||
81/8% Notes, net of unamortized discount of $0 as of December 31, 2010 and $818 as of December 25, 2009 |
13,358 | 149,863 | |||||
|
313,358 | 305,678 | |||||
Less: Current portion |
(13,358 | ) | (1,590 | ) | |||
|
$ | 300,000 | $ | 304,088 | |||
In April 2003, Interline New Jersey issued a non-recourse note payable in the principal amount of $3.3 million for the purchase of an investment. During 2009 and 2008, in accordance with the terms of the note, the Company used part of the capital distributed by the investment to pay down $0.7 million and $1.0 million of the note, respectively. This note, which was secured only by the investment and bore interest at a rate of 4.0% per annum, was paid in full upon its maturity in June 2010.
F-21
INTERLINE BRANDS, INC. AND SUBSIDIARIES
NOTES TO CONSOLIDATED FINANCIAL STATEMENTS (Continued)
YEARS ENDED DECEMBER 31, 2010, DECEMBER 25, 2009 AND DECEMBER 26, 2008
10. DEBT (Continued)
In June 2006, Interline New Jersey completed a series of refinancing transactions: (1) an offering of $200.0 million of 81/8% senior subordinated notes due 2014 (the "81/8% Notes") and (2) entering into a $330.0 million bank credit facility. The bank credit facility consisted of a $100.0 million 7-year term loan, a $130.0 million 7-year delayed draw term loan and a $100.0 million 6-year revolving credit facility of which a portion not exceeding $40.0 million was available in the form of letters of credit.
The 81/8% Notes were priced at 99.3% of their principal amount, or $198.6 million, representing a yield to maturity of 81/4%. The discount of $1.4 million was being amortized over the term of the 81/8% Notes. The amortization of the discount, recorded as a component of interest expense, was $0.1 million in 2010, 2009 and 2008. Debt issuance costs capitalized in connection with the 81/8% Notes were $5.8 million. In 2009 and 2008, the Company repurchased $36.4 million and $12.9 million, respectively, of the 81/8% Notes. The 2009 repurchase was made at an average of 93.8% of par, or $34.2 million and the 2008 repurchase was made at 773/8% of par, or $10.0 million. In connection with the repurchases of the 81/8% Notes, the Company recorded a gain on the extinguishment of debt of $1.8 million during 2009, net of $0.5 million in deferred financing costs written-off, and $2.8 million during 2008, net of $0.1 million in deferred financing costs written-off. As of December 31, 2010, there was $13.4 million in outstanding 81/8% Notes. In November 2010, as part of the refinancing transactions described below, the Company redeemed $137.3 million of the 81/8% Notes. The remaining $13.4 million of the 81/8% Notes were redeemed on January 3, 2011. The 81/8% Notes were redeemed at an average price of 104.256% of par. As of December 25, 2009, there was $150.7 million in outstanding 81/8% Notes with an estimated fair market value of $151.4 million, or 100.5% of par.
Borrowings under the term loan, the delayed draw facility and the revolving credit facility bore interest, at Interline New Jersey's option, at either LIBOR plus 1.75% or at the alternate base rate, which was the greater of the Prime Rate or the Federal Funds Effective Rate plus 0.50%, plus 0.75%. As of December 25, 2009, the interest rate in effect with respect to the term loan and the delayed draw facility was 2.02% for the LIBOR option and 4.00% for the alternate base rate option. Outstanding letters of credit under the revolving credit facility were subject to a per annum fee equal to the applicable margin under the revolving credit facility. The interest rate margin was subject to pricing adjustments at the end of each fiscal quarter based on the ratio of net total indebtedness to adjusted consolidated earnings before interest, taxes, depreciation and amortization ("EBITDA"), as defined by the credit facility. Debt issuance costs capitalized in connection with the term loan, the delayed draw facility and the revolving credit facility were $3.9 million. In November 2010, Interline New Jersey paid off the term loan facility as part of the refinancing transactions described below. As of December 25, 2009, the fair value of term loans was estimated using a discounted cash flow analysis based on borrowing rates available to companies with similar credit ratings for loans with similar terms and maturity. The carrying amount and fair value of the term loans as of December 25, 2009 was $154.2 million and $145.8 million, respectively.
In November 2010, Interline New Jersey completed a series of refinancing transactions: (1) an offering of $300.0 million of 7.00% senior subordinated notes due 2018 (the "7.00% Notes") and (2) entering into a $225.0 million asset-based revolving credit facility (the "ABL Facility"). The proceeds from the 7.00% Notes were used to redeem $137.3 million of the 81/8% Notes and to repay the indebtedness under the prior credit facility. In connection with the redemption of the 81/8% Notes and the repayment of the prior credit facility, Interline New Jersey recorded a loss on early extinguishment of debt of $11.5 million. The loss was comprised of $6.9 million in tender premiums
F-22
INTERLINE BRANDS, INC. AND SUBSIDIARIES
NOTES TO CONSOLIDATED FINANCIAL STATEMENTS (Continued)
YEARS ENDED DECEMBER 31, 2010, DECEMBER 25, 2009 AND DECEMBER 26, 2008
10. DEBT (Continued)
and transaction costs associated with the redemption of the 81/8% Notes and a non-cash charge of $4.6 million in deferred financing costs and original issue discount written-off associated with the redemption of the 81/8% Notes and the repayment of the prior credit facility.
The 7.00% Notes were priced at 100% of their principal amount. As of December 31, 2010, the estimated fair value of the 7.00% Notes was $304.5 million, or 101.5% of par. The 7.00% Notes mature on November 15, 2018 and interest is payable on May 15 and November 15 of each year, beginning on May 15, 2011. Debt issuance costs capitalized in connection with the 7.00% Notes were $6.9 million.
The 7.00% Notes are generally unsecured, senior subordinated obligations of Interline New Jersey that rank equal to all of Interline New Jersey's existing and future senior subordinated indebtedness, junior to all of Interline New Jersey's existing and future senior indebtedness, including indebtedness under the ABL Facility, and senior to any of Interline New Jersey's existing and future obligations that are, by their terms, expressly subordinated in right of payment to the 7.00% Notes. The 7.00% Notes are unconditionally guaranteed, jointly and severally, on an unsecured senior subordinated basis by the Company and Interline New Jersey's existing and future domestic subsidiaries that guarantee the ABL Facility (collectively the "Guarantors"). The Guarantors have issued guarantees (each a "Guarantee" and collectively, the "Guarantees") of Interline New Jersey's obligations under the 7.00% Notes and the Indenture on an unsecured senior subordinated basis. Each Guarantee ranks equal in right of payment with all of the Guarantors' existing and future senior subordinated indebtedness, junior to all of the Guarantors' existing and future senior indebtedness, including guarantees of the ABL Facility, and senior to all of the Guarantors' existing and future obligations that are, by their terms, expressly subordinated in right of payment to the Guarantees. The 7.00% Notes are not guaranteed by any of Interline New Jersey's foreign subsidiaries.
Interline New Jersey has the option to redeem the 7.00% Notes prior to November 15, 2013 at a redemption price equal to 100% of the principal amount plus a make-whole premium and accrued and unpaid interest to the date of redemption. At any time on or after November 15, 2013, Interline New Jersey may redeem some or all of the 7.00% Notes at certain fixed redemption prices expressed as percentages of the principal amount, plus accrued and unpaid interest. At any time prior to November 15, 2013, Interline New Jersey may, from time to time, redeem up to 35% of the aggregate principal amount of the Notes with the net cash proceeds received by Interline New Jersey from certain equity offerings at a price equal to 107.000% of the principal amount of the 7.00% Notes redeemed, plus accrued and unpaid interest and additional interest, if any, to the redemption date, provided that the redemption occurs within 90 days of the closing date of such equity offering, and at least 65% of the aggregate principal amount of the 7.00% Notes remain outstanding immediately thereafter.
The Indenture governing the 7.00% Notes contains covenants limiting, among other things, the ability of Interline New Jersey and its restricted subsidiaries to incur additional indebtedness; pay dividends on their capital stock or redeem, repurchase or retire their capital stock; make certain investments; create restrictions on the payment of dividends or other amounts from Interline New Jersey's restricted subsidiaries to Interline New Jersey; and consolidate, merge or transfer assets. These covenants are subject to a number of important exceptions and qualifications.
The ABL Facility provides for revolving credit financing of up to $225.0 million subject to borrowing base availability, with a maturity of five years, including sub-facilities for letters of credit, not exceeding $40.0 million, and swingline loans. In addition, the ABL Facility provides that the revolving
F-23
INTERLINE BRANDS, INC. AND SUBSIDIARIES
NOTES TO CONSOLIDATED FINANCIAL STATEMENTS (Continued)
YEARS ENDED DECEMBER 31, 2010, DECEMBER 25, 2009 AND DECEMBER 26, 2008
10. DEBT (Continued)
commitments may be increased to $325.0 million, subject to certain terms and conditions. The ABL Facility has a 5-year term and any borrowings outstanding will be due and payable in full on November 15, 2015. Debt issuance costs capitalized in connection with the ABL Facility were $3.5 million.
The borrowing base at any time equals the sum (subject to certain eligibility requirements, reserves and other adjustments) of:
- •
- 85% of eligible trade receivables, and
- •
- the lesser of (x) 65% of eligible inventory, valued at the lower of cost or market, and (y) 85% of the net orderly liquidation value of eligible inventory.
The ABL Facility includes borrowing capacity for letters of credit and for borrowings on same-day notice, referred to as swingline loans. All borrowings under the ABL Facility will be subject to the satisfaction of customary conditions, including absence of a default and accuracy of representations and warranties.
Borrowings under the ABL Facility bear interest, at Interline New Jersey's option, at adjusted LIBOR or an alternate base rate, in each case plus an applicable margin. The applicable margin will initially be equal to 2.50% per annum for loans bearing interest by reference to adjusted LIBOR and 1.50% per annum for loans bearing interest by reference to the alternate base rate and, after the delivery of certain financial reports following the first full fiscal quarter ending after the closing date, will be adjusted quarterly by reference to a grid based on average availability under the ABL Facility.
In addition, Interline New Jersey will be required to pay each lender a commitment fee at a rate equal to 0.50% per annum, in respect of any unused commitments if the average utilization under the ABL Facility during the preceding calendar quarter is 50% or higher, and equal to 0.625% if the average utilization under the ABL Facility during the preceding calendar quarter is less than 50%.
During any period after the occurrence and continuance of an event of default (and continuing for a certain period of time thereafter), or after availability under the ABL Facility is less than the greater of (i) $35.0 million and (ii) 17.5% of the total revolving commitments at such time (and continuing for a certain period of time thereafter), the ABL Facility will, subject to exceptions, require mandatory prepayments, but not permanent reductions of commitments, and subject to a right of reinvestment, in amounts equal to 100% of the net cash proceeds from permitted non-ordinary-course asset sales and casualty and condemnation events, as well as from any equity issuance or incurrence of debt not otherwise permitted under the ABL Facility. In addition, Interline New Jersey is required to pay down loans under the ABL Facility if the total amount of outstanding obligations thereunder exceeds the lesser of the aggregate amount of the revolving commitments thereunder and the applicable borrowing base. Interline New Jersey may prepay loans and permanently reduce commitments under the ABL Facility at any time in certain minimum principal amounts, without premium or penalty (except LIBOR breakage costs, if applicable).
Borrowings under the ABL Facility are guaranteed by the Guarantors and are secured by first-priority liens on substantially all of the assets of Interline New Jersey and the Guarantors.
The ABL Facility requires that if excess availability is less than the greater of (a) 12.5% of the commitments and (b) $28.1 million, Interline New Jersey must comply with a minimum fixed charge
F-24
INTERLINE BRANDS, INC. AND SUBSIDIARIES
NOTES TO CONSOLIDATED FINANCIAL STATEMENTS (Continued)
YEARS ENDED DECEMBER 31, 2010, DECEMBER 25, 2009 AND DECEMBER 26, 2008
10. DEBT (Continued)
coverage ratio test of 1.00:1.00 and certain other covenants. In addition, the ABL Facility includes negative covenants that, subject to significant exceptions, limit Interline New Jersey's ability and the ability of the Guarantors to, among other things, incur debt, incur liens and engage in sale leaseback transactions, make investments and loans, pay dividends, engage in mergers, acquisitions and asset sales, prepay certain indebtedness, amend the terms of certain material agreements, enter into agreements limiting subsidiary distributions, engage in certain transactions with affiliates and alter the business that Interline New Jersey conducts.
The ABL Facility contains customary events of default, including, but not limited to, payment defaults, breaches of representations and warranties, covenant defaults, cross-defaults to certain indebtedness, certain events of bankruptcy, certain events under ERISA, material judgments, actual or asserted failure of any guaranty or security document supporting the ABL Facility to be in full force and effect and changes of control. If such an event of default occurs, the lenders under the ABL Facility would be entitled to take various actions, including the acceleration of amounts due under the ABL Facility and all actions permitted to be taken by a secured creditor.
The debt instruments of Interline New Jersey, primarily the ABL Facility and the indenture governing the terms of the 7.00% Notes, contain significant restrictions on the payment of dividends and distributions to the Company by Interline New Jersey. The ABL facility allows Interline New Jersey to pay dividends, make distributions to the Company or repurchase its shares from the Company in an aggregate amount not to exceed $25.0 million during any 12-month period, so long as there is no default and Interline New Jersey meets certain availability requirements. Only if these conditions are met and, in addition, Interline New Jersey's fixed charge coverage ratio is at least 1.20 to 1.00, is there no cap on Interline New Jersey's ability to pay dividends and repurchase its shares. In addition, ordinary course distributions for overhead (up to $3.0 million annually) and taxes are permitted, as are annual payments of up to $7.5 million in respect of the Company's stock option or other benefit plans for management or employees. The indenture for the 7.00% Notes generally restricts the ability of Interline New Jersey to pay distributions to the Company and to make advances to, or investments in, the Company to an amount equal to 50% of the net income of Interline New Jersey since July 2006, plus an amount equal to the net proceeds from certain equity issuances, subject to compliance with a leverage ratio and no default having occurred and continuing. The indenture also contains certain permitted exceptions including (1) allowing the Company to pay its franchise taxes and other fees required to maintain its corporate existence, to pay for general corporate and overhead expenses and to pay expenses incurred in connection with certain financing, acquisition or disposition transactions, in an aggregate amount not to exceed $15.0 million per year; (2) allowing certain tax payments; and (3) allowing other distributions in an aggregate amount not to exceed the greater of $85.0 million or 8.5% of total assets of Interline Brands New Jersey and its restricted subsidiaries, provided there is no default.
Interline New Jersey and the Company were in compliance with all covenants as of December 31, 2010 and December 25, 2009.
As of December 31, 2010 and December 25, 2009, Interline New Jersey had $169.8 million and $24.3 million available under its respective revolving credit facilities. There were no borrowings under the respective revolving credit facilities as of December 31, 2010 and December 25, 2009. Total letters of credit issued under the respective revolving credit facilities as of December 31, 2010 and December 25, 2009 were $7.9 million and $9.5 million, respectively.
F-25
INTERLINE BRANDS, INC. AND SUBSIDIARIES
NOTES TO CONSOLIDATED FINANCIAL STATEMENTS (Continued)
YEARS ENDED DECEMBER 31, 2010, DECEMBER 25, 2009 AND DECEMBER 26, 2008
10. DEBT (Continued)
The maturities of long-term debt subsequent to December 31, 2010 are as follows (in thousands):
Fiscal Year
|
|
|||
|---|---|---|---|---|
2011 |
$ | 13,358 | ||
2012 |
— | |||
2013 |
— | |||
2014 |
— | |||
2015 |
— | |||
Thereafter |
300,000 | |||
|
$ | 313,358 | ||
11. PREFERRED STOCK
The Company has the authority to issue 20,000,000 shares of preferred stock, par value $.01 per share. As of December 31, 2010 and December 25, 2009 there were no preferred shares issued or outstanding.
12. COMMON STOCK
On March 22, 2009, the Board of Directors of Interline adopted a shareholder rights plan and authorized and declared a dividend distribution of one preferred stock purchase right (a "Right") for each outstanding share of the Company's common stock. The Rights are not exercisable unless an entity becomes, or launches a tender offer to become, the beneficial owner of 15% or more of the Company's outstanding common stock (including derivative positions), subject to certain exceptions. The distribution was paid on April 2, 2009 to shareholders of record as of the close of business on April 2, 2009. Each Right, if and when it becomes exercisable, entitles the holder to buy 1/1000 of a share of our preferred stock, designated as Series A Junior Preferred Stock, par value $0.01 per share, at a price of $30.00 per 1/1000 of a share subject to adjustment (the "Exercise Price"). If any person or group becomes the beneficial owner of 15% or more of the Company's common stock at any time after the date of the plan (with certain limited exceptions), then each Right not owned by such person or group will entitle its holder to purchase, at the Exercise Price, shares of the Company's common stock or, in certain circumstances, common stock of the acquiring person, having a market value of twice the Exercise Price. The Rights will expire at the close of business on March 22, 2012, unless earlier redeemed or exchanged by the Company. The description and terms of the Rights are set forth in a rights agreement between the Company and Mellon Investor Services LLC, as the Rights Agent.
On March 16, 2010, the Company and the Rights Agent entered into an amendment (the "Amendment") to the Rights Agreement. Pursuant to the Amendment, the Final Expiration Date of the Rights (each as defined in the Rights Agreement) was advanced from the close of business on March 22, 2012 to the close of business on March 17, 2010. As a result of the Amendment, as of the close of business on March 17, 2010, the Rights were no longer outstanding or exercisable and the Rights Agreement was effectively terminated and of no further force and effect.
F-26
INTERLINE BRANDS, INC. AND SUBSIDIARIES
NOTES TO CONSOLIDATED FINANCIAL STATEMENTS (Continued)
YEARS ENDED DECEMBER 31, 2010, DECEMBER 25, 2009 AND DECEMBER 26, 2008
13. SHARE-BASED COMPENSATION
Stock Incentive Plans
During 2000, Interline New Jersey established a Stock Award Plan (the "2000 Plan"), under which Interline New Jersey may award a total of 6,395 shares of common stock in the form of incentive stock options (which may be awarded to key employees only), nonqualified stock options, stock appreciation rights ("SARs") and restricted stock awards, all of which may be awarded to directors, officers, key employees and consultants. The Company's compensation committee will determine in its sole discretion whether a SAR is settled in cash, shares or a combination of cash and shares. In connection with the Company's initial public offering in December 2004, options to purchase shares of the common stock of Interline New Jersey were converted into options to purchase shares of the Company's common stock.
During 2004, the Company adopted the 2004 Equity Incentive Plan, (the "2004 Plan"), under which the Company may award 1,175,000 shares in the form of incentive stock options, nonqualified stock options, stock appreciation rights, or SARs, restricted stock, restricted share units ("RSUs"), deferred stock units ("DSUs") and stock bonus awards, all of which may be awarded to any employee, director, officer or consultant of the Company. In May 2006, the stockholders of the Company approved an amendment to the 2004 Plan whereby the number of shares of the Company's common stock reserved for issuance under the 2004 Plan was increased by 2,000,000 shares and to further restrict the repricing of awards granted under the 2004 Plan without first obtaining approval by the Company's stockholders. In May 2008, the stockholders of the Company approved amendments to the 2004 Plan, including to increase the number of shares of common stock reserved for issuance and available for grants thereunder to 3,800,000 as of January 1, 2008 and to change the method by which shares subject to full value awards granted thereunder are counted against the 2004 Plan's share limit. Effective January 1, 2008, shares subject to grants of full value awards, or awards other than options or SARs, count against the applicable share limits under the 2004 Plan as 1.8 shares for every 1 share granted, while shares subject to stock options or SARs count against the applicable share limits as 1 share for every 1 share granted.
These plans allow the Company to fulfill its incentive stock option, nonqualified stock option, SAR, restricted stock, RSU, DSU and stock bonus award obligations using unissued or treasury shares.
Stock Options
Under the terms of the 2000 Plan, the exercise price per share for an incentive stock option may not be less than 100% of the fair market value of a share of common stock on the grant date. The exercise price per share for an incentive stock option granted to a person owning stock possessing more than 10% of the total combined voting power of all classes of stock may not be less than 110% of the fair market value of a share of common stock on the grant date. These incentive stock options vest in 25% increments over four years and may not be exercisable after the expiration of ten years from the date of grant.
Under the terms of the 2004 Plan, the exercise price of the options will not be less than the fair market value of the common stock at the date of grant, generally vest in 25% increments over four years and may not be exercisable after the expiration of seven or ten years from the date of grant.
F-27
INTERLINE BRANDS, INC. AND SUBSIDIARIES
NOTES TO CONSOLIDATED FINANCIAL STATEMENTS (Continued)
YEARS ENDED DECEMBER 31, 2010, DECEMBER 25, 2009 AND DECEMBER 26, 2008
13. SHARE-BASED COMPENSATION (Continued)
The fair values of stock options were estimated using the Black-Scholes option-pricing model. Expected volatility is based on historical performance of the Company's stock. The Company also uses historical data to estimate the timing and amount of stock option exercises and forfeitures. The expected life represents the period of time that stock options are expected to remain outstanding and is based on the contractual term of the stock options and expected exercise behavior. The risk-free interest rate is based on U.S. Treasury zero-coupon issues with a remaining term equal to the expected option life assumed at the date of grant. The Black-Scholes weighted-average assumptions were as follows:
| |
Year Ended | |||||||||
|---|---|---|---|---|---|---|---|---|---|---|
| |
December 31, 2010 |
December 25, 2009 |
December 26, 2008 |
|||||||
Expected volatility |
41.5 | % | 43.0 | % | 33.6 | % | ||||
Expected dividends |
0.0 | % | 0.0 | % | 0.0 | % | ||||
Risk-free interest rate |
2.4 | % | 2.1 | % | 2.9 | % | ||||
Expected life (in years) |
5.0 | 5.0 | 5.0 | |||||||
The weighted average fair value per option of stock options granted during 2010, 2009 and 2008 was $7.21, $3.49 and $6.64, respectively.
A summary of stock option activity for the year ended December 31, 2010 is presented below:
Options
|
Shares | Weighted- Average Exercise Price |
Weighted- Average Remaining Contractual Term |
Aggregate Intrinsic Value(1) |
||||||||||
|---|---|---|---|---|---|---|---|---|---|---|---|---|---|---|
| |
|
|
(in years) |
(in thousands) |
||||||||||
Outstanding at December 25, 2009 |
3,593,360 | $ | 17.53 | |||||||||||
Granted |
292,473 | 18.28 | ||||||||||||
Exercised |
(673,817 | ) | 15.97 | |||||||||||
Forfeited or expired |
(264,825 | ) | 21.55 | |||||||||||
Outstanding at December 31, 2010 |
2,947,191 | $ | 17.60 | 4.4 | $ | 16,660 | ||||||||
Vested or expected to vest at December 31, 2010 |
2,931,758 | $ | 17.62 | 4.4 | $ | 16,527 | ||||||||
Exercisable at December 31, 2010 |
2,113,153 | $ | 18.62 | 4.1 | $ | 10,200 | ||||||||
- (1)
- The aggregate intrinsic value represents the amount by which the fair value of the underlying stock at period end exceeds the stock option exercise price.
The total intrinsic value, the difference between the exercise price and the market price on the date of exercise, of all stock options exercised during 2010, 2009 and 2008 was $2.6 million, $0.2 million and $0.1 million, respectively. Proceeds from stock options exercised during 2010, 2009 and 2008 were $10.8 million, $1.0 million and $0.7 million, respectively. As of December 31, 2010, there was $3.0 million of total unrecognized compensation cost related to unvested stock options. The cost is expected to be recognized over a weighted-average period of 2.1 years.
F-28
INTERLINE BRANDS, INC. AND SUBSIDIARIES
NOTES TO CONSOLIDATED FINANCIAL STATEMENTS (Continued)
YEARS ENDED DECEMBER 31, 2010, DECEMBER 25, 2009 AND DECEMBER 26, 2008
13. SHARE-BASED COMPENSATION (Continued)
Restricted Stock, Restricted Share Units and Deferred Stock Units
Shares of restricted stock granted under the 2004 Plan to executives, employees and non-employee directors do not have an exercise price. The share-based compensation expense associated with the restricted stock is based on the quoted market price of the Company's shares of common stock on the date of grant. The restricted stock awards for executives vest either on an accelerated basis in one-third installments over three years provided that certain pre-established annual percentage increases in the Company's earnings per share are attained or on the seventh anniversary of the date of grant. One half of the restricted stock awards granted to employees vest evenly over three years and one half vest evenly over five years. The restricted stock awards for non-employee directors vest evenly over two years or at the end of three years, depending on the grant.
RSUs granted under the 2004 Plan to management do not have an exercise price. The share-based compensation expense associated with the RSUs is based on the quoted market price of the Company's shares of common stock on the date of grant. Depending on the grant, (1) one-half of the RSUs vest on the second grant date anniversary provided that certain pre-established annual percentage increases in specific Company-wide metrics, such as EBITDA, are attained and one-half vest evenly over three years; or (2) one-half of the RSUs vest evenly over two years and one-half vest evenly over three years; or (3) one-third of the RSUs vest evenly over each of the first three years following the date of grant; or (4) one-half of the RSUs vest evenly over three years and one-half vest evenly over five years; or (5) on the earlier of A) the fourth grant date anniversary, provided that the average daily closing price of a share of the Company's common stock during any 20-consecutive-trading-day period ("Average Closing Price") commencing on or after the grant date equals or exceeds a specified amount prior to the fourth grant date anniversary; or (B) the date that is the later of (1) the date on which the Average Closing Price equals or exceeds a higher specified amount and (2) the fifth grant date anniversary of the Transaction Date, provided that it occurs not later than the seventh grant date anniversary. Under all vesting schedules, the RSUs will only vest provided the grantee's service to the Company has not terminated prior to the vesting date.
DSUs granted under the 2004 Plan to non-employee directors do not have an exercise price. The share-based compensation expense associated with the DSUs is based on the quoted market price of the Company's shares of common stock on the date of grant. DSUs vest on the grant date or evenly over the non-employee directors' current service term; depending on the grant. All DSUs are to be settled in shares of the Company's common stock upon termination of the non-employee directors' service or one year after termination of the non-employee directors' service; depending on the grant.
F-29
INTERLINE BRANDS, INC. AND SUBSIDIARIES
NOTES TO CONSOLIDATED FINANCIAL STATEMENTS (Continued)
YEARS ENDED DECEMBER 31, 2010, DECEMBER 25, 2009 AND DECEMBER 26, 2008
13. SHARE-BASED COMPENSATION (Continued)
A summary of restricted stock, RSUs and DSUs for the year ended December 31, 2010 is presented below:
| |
Restricted Stock | Restricted Share Units | Deferred Stock Units | |||||||||||||||||
|---|---|---|---|---|---|---|---|---|---|---|---|---|---|---|---|---|---|---|---|---|
| |
Shares | Weighted- Average Grant Date Fair Value |
Shares | Weighted- Average Grant Date Fair Value |
Shares | Weighted- Average Grant Date Fair Value |
||||||||||||||
Outstanding at December 25, 2009 |
10,350 | $ | 23.49 | 452,376 | $ | 8.69 | 68,310 | $ | 18.66 | |||||||||||
Granted |
— | — | 244,521 | 18.61 | 24,824 | 20.95 | ||||||||||||||
Vested |
(2,300 | ) | 22.27 | (19,548 | ) | 21.92 | — | — | ||||||||||||
Forfeited |
— | — | (17,773 | ) | 7.89 | — | — | |||||||||||||
Outstanding at December 31, 2010 |
8,050 | $ | 23.84 | 659,576 | $ | 12.06 | 93,134 | $ | 19.27 | |||||||||||
The total fair value of restricted stock vested during 2010, 2009 and 2008 was less than $0.1 million, $0.1 million and $1.1 million, respectively. The total fair value of RSUs vested during 2010, 2009 and 2008 was $0.3 million, $0.1 million and $2.4 million, respectively. As of December 31, 2010, there was $5.2 million of total unrecognized compensation cost related to unvested restricted stock, RSUs and DSUs. The cost is expected to be recognized over a weighted-average period of 1.1 years.
14. EMPLOYEE BENEFIT PLANS
401(k) Plan
The Company has qualified profit sharing plans under Section 401(k) of the Internal Revenue Code. Pursuant to the 401(k) plan, the Company historically matched employee contributions at a rate of 50% of the first 5% up to the statutory maximum of $5,500 per employee. During 2009, the Company halted matching contributions to the 401(k) plan except for contributions made by employees acquired through the acquisition of Eagle Maintenance Supply, Inc. The 401(k) employer match was resumed at the beginning of 2010 at a revised match rate of 25% of the first 5% contributed. Company contributions to the 401(k) plans were $1.0 million, $0.2 million, and $2.1 million for 2010, 2009 and 2008, respectively.
Supplemental Executive Retirement Plan
As a result of the AmSan acquisition, the Company has a supplemental executive retirement plan ("AmSan SERP"). The AmSan SERP is a nonqualified plan that covers three retired AmSan employees. Service cost, interest expense and cash benefits paid for the AmSan SERP for 2010, 2009 and 2008 were immaterial. The projected and accumulated benefit obligation for the AmSan SERP as of December 31, 2010 and December 25, 2009 was $0.4 million and $0.5 million, respectively, and is included in other liabilities on the Company's consolidated balance sheet. The Company does not fund this liability and no assets are held by the AmSan SERP. Benefit payments expected to be paid under the AmSan SERP are less than $0.1 million in years 2011 through 2015 and $0.1 million thereafter for a total of $0.5 million.
F-30
INTERLINE BRANDS, INC. AND SUBSIDIARIES
NOTES TO CONSOLIDATED FINANCIAL STATEMENTS (Continued)
YEARS ENDED DECEMBER 31, 2010, DECEMBER 25, 2009 AND DECEMBER 26, 2008
14. EMPLOYEE BENEFIT PLANS (Continued)
The Company has one whole-life insurance policy for each AmSan employee covered by the AmSan SERP. The cash surrender value of these policies as of December 31, 2010 and December 25, 2009 was $0.6 million and $0.5 million, respectively, and is included in other assets on the Company's consolidated balance sheet.
Deferred Compensation Plan
As a result of the AmSan acquisition, the Company has a nonqualified deferred compensation plan ("AmSan DCP"). Contributions and interest expense for the AmSan DCP for 2010, 2009 and 2008 were immaterial. Payments under the AmSan DCP were immaterial during 2010, 2009 and 2008. The liability for the AmSan DCP as of December 31, 2010 and December 25, 2009 was $0.1 million and $0.2 million, respectively, and is included in other liabilities on the Company's consolidated balance sheet. The Company does not fund this liability and no assets are held by the AmSan DCP. Benefit payments, including interest, expected to be paid under the AmSan DCP total $0.2 million over seven years.
15. COMMITMENTS AND CONTINGENCIES
Lease Commitments
The Company leases its facilities under operating and capital leases expiring at various dates through 2019. Minimum future rental payments under these operating and capital leases as of December 31, 2010 are as follows (in thousands):
Fiscal Year
|
Operating | Capital | ||||||
|---|---|---|---|---|---|---|---|---|
2011 |
$ | 23,473 | $ | 695 | ||||
2012 |
19,185 | 552 | ||||||
2013 |
14,903 | 367 | ||||||
2014 |
12,474 | 79 | ||||||
2015 |
11,625 | 10 | ||||||
Thereafter |
21,452 | — | ||||||
Total payments |
$ | 103,112 | 1,703 | |||||
Less: Amount representing interest |
(190 | ) | ||||||
Present value of minimum lease payments |
1,513 | |||||||
Less: Current portion |
(607 | ) | ||||||
Long term portion |
$ | 906 | ||||||
In connection with the July 2005 acquisition of CCS Enterprises, Inc. ("Copperfield"), the Company leases an office building from an entity in which an employee and his family hold an ownership interest. This lease was amended in November 2005 and extended on November 30, 2010, for an additional 64-month term. Minimum annual rent payable under this lease is $0.1 million, plus all real estate taxes and assessments, and all operating costs related to the building. The Company believes that the terms of the lease are no less favorable than could be obtained from an unaffiliated party. The total rent expense for this lease was $0.2 million for 2010, 2009 and 2008.
F-31
INTERLINE BRANDS, INC. AND SUBSIDIARIES
NOTES TO CONSOLIDATED FINANCIAL STATEMENTS (Continued)
YEARS ENDED DECEMBER 31, 2010, DECEMBER 25, 2009 AND DECEMBER 26, 2008
15. COMMITMENTS AND CONTINGENCIES (Continued)
In connection with the AmSan acquisition, the Company leases two properties from entities in which employees and their families hold an ownership interest. These leases expire on January 31, 2013 and December 31, 2013, respectively. Minimum annual rent payable under these leases is $0.5 million, including all real estate taxes and assessments, plus all operating costs related to the properties. The Company believes that the terms of these leases are no less favorable than could be obtained from unaffiliated parties. The total rent expense for leases with affiliated parties resulting from the AmSan acquisition was $0.5 million for 2010, $0.6 million for 2009 and $1.3 million for 2008.
Rent expense under all operating leases was $33.2 million, $33.8 million, and $34.9 million, for 2010, 2009 and 2008, respectively. Certain of the leases provide that the Company pays taxes, insurance and other operating expenses applicable to the leased premises.
Employment Agreements
The Company has employment agreements with various expiration dates through 2012 with certain officers and employees, unless terminated earlier by the Company, at combined salaries of $6.4 million, plus bonuses and subject to adjustments.
Contingent Liabilities
As of December 31, 2010 and December 25, 2009, the Company was contingently liable for unused letters of credit aggregating $7.9 million and $9.5 million, respectively.
Legal Proceedings
The Company is involved in various legal proceedings in the ordinary course of its business that are not anticipated to have a material adverse effect on the Company's results of operations or financial position.
16. INTEREST AND OTHER INCOME
Interest and other income consisted of the following during 2010, 2009 and 2008 (in thousands):
| |
Year Ended | |||||||||
|---|---|---|---|---|---|---|---|---|---|---|
| |
December 31, 2010 |
December 25, 2009 |
December 26, 2008 |
|||||||
Interest income |
$ | 138 | $ | 215 | $ | 1,105 | ||||
Other income |
1,624 | 1,499 | 1,093 | |||||||
|
$ | 1,762 | $ | 1,714 | $ | 2,198 | ||||
17. INCOME TAXES
The Company files numerous consolidated and separate income tax returns in the U.S. federal jurisdiction and in many state and foreign jurisdictions. With few exceptions, the Company is no longer subject to U.S. federal income tax examinations for years before 2008 and is no longer subject to state and local, or foreign income tax examinations by tax authorities for years before 2005.
F-32
INTERLINE BRANDS, INC. AND SUBSIDIARIES
NOTES TO CONSOLIDATED FINANCIAL STATEMENTS (Continued)
YEARS ENDED DECEMBER 31, 2010, DECEMBER 25, 2009 AND DECEMBER 26, 2008
17. INCOME TAXES (Continued)
The provision (benefit) for income taxes for 2010, 2009 and 2008, is as follows (in thousands):
| |
Year Ended | ||||||||||
|---|---|---|---|---|---|---|---|---|---|---|---|
| |
December 31, 2010 |
December 25, 2009 |
December 26, 2008 |
||||||||
Current: |
|||||||||||
Federal |
$ | 12,979 | $ | 9,332 | $ | 21,475 | |||||
State |
3,083 | 1,843 | 3,361 | ||||||||
Foreign |
263 | 214 | 469 | ||||||||
|
16,325 | 11,389 | 25,305 | ||||||||
Deferred: |
|||||||||||
Federal |
2,640 | 5,181 | (449 | ) | |||||||
State |
141 | 538 | (228 | ) | |||||||
Foreign |
(277 | ) | (35 | ) | (3 | ) | |||||
|
2,504 | 5,684 | (680 | ) | |||||||
|
$ | 18,829 | $ | 17,073 | $ | 24,625 | |||||
As of December 31, 2010, the approximate amount of earnings of foreign subsidiaries that the Company considers permanently reinvested and for which deferred taxes have not been provided was $13.2 million. Because of the availability of U.S. foreign tax credits, it is not practicable to determine the U.S. federal income tax impact if such earnings were not permanently reinvested.
The Company has foreign tax credits in the amount of $2.1 million which may be used to offset future foreign source income taxable in the U.S. If not used, the foreign tax credits will expire at the end of 2013.
The components of income before income taxes for 2010, 2009 and 2008 were as follows (in thousands):
| |
Year Ended | ||||||||||
|---|---|---|---|---|---|---|---|---|---|---|---|
| |
December 31, 2010 |
December 25, 2009 |
December 26, 2008 |
||||||||
United States |
$ | 46,711 | $ | 42,446 | $ | 64,140 | |||||
Foreign |
39 | 715 | 1,318 | ||||||||
Total |
$ | 46,750 | $ | 43,161 | $ | 65,458 | |||||
F-33
INTERLINE BRANDS, INC. AND SUBSIDIARIES
NOTES TO CONSOLIDATED FINANCIAL STATEMENTS (Continued)
YEARS ENDED DECEMBER 31, 2010, DECEMBER 25, 2009 AND DECEMBER 26, 2008
17. INCOME TAXES (Continued)