Attached files
Table of Contents
UNITED STATES SECURITIES AND EXCHANGE COMMISSION
Washington, D.C. 20549
FORM 10-K
(Mark One)
| x | ANNUAL REPORT PURSUANT TO SECTION 13 OR 15(d) OF THE SECURITIES EXCHANGE ACT OF 1934 |
For the fiscal year ended: December 31, 2010
or
| ¨ | TRANSITION REPORT PURSUANT TO SECTION 13 OR 15(d) OF THE SECURITIES EXCHANGE ACT OF 1934 |
For the transition period from to
Commission file number: 001-32678
DCP MIDSTREAM PARTNERS, LP
(Exact name of registrant as specified in its charter)
| Delaware | 03-0567133 | |
| (State or other jurisdiction of incorporation or organization) |
(I.R.S. Employer Identification No.) | |
| 370 17th Street, Suite 2775 Denver, Colorado |
80202 | |
| (Address of principal executive offices) | (Zip Code) | |
Registrant’s telephone number, including area code: 303-633-2900
Securities registered pursuant to Section 12(b) of the Act:
| Title of Each Class: |
Name of Each Exchange on Which Registered: | |
| Common Units Representing Limited Partner Interests |
New York Stock Exchange |
Securities registered pursuant to Section 12(g) of the Act:
NONE
Indicate by check mark if the registrant is a well-known seasoned issuer, as defined in Rule 405 of the Securities Exchange Act of 1934, or the Act. Yes x No ¨
Indicate by check mark if the registrant is not required to file reports pursuant to Section 13 or Section 15(d) of the Act. Yes ¨ No x
Indicate by check mark whether the registrant (1) has filed all reports required to be filed by Section 13 or 15(d) of the Act during the preceding 12 months (or for such shorter period that the registrant was required to file such reports), and (2) has been subject to such filing requirements for the past 90 days. Yes x No ¨
Indicate by check mark whether the registrant has submitted electronically and posted on its corporate Web site, if any, every Interactive Data File required to be submitted and posted pursuant to Rule 405 of regulation S-T (§232.405 of this chapter) during the preceding 12 months (or for such shorter period that the registrant was required to submit and post such files). Yes ¨ No ¨
Indicate by check mark if disclosure of delinquent filers pursuant to Item 405 of Regulation S-K is not contained herein, and will not be contained, to the best of registrant’s knowledge, in definitive proxy or information statements incorporated by reference in Part III of this Form 10-K or any amendment to this Form 10-K. x
Indicate by check mark whether the registrant is a large accelerated filer, an accelerated filer, a non-accelerated filer or a smaller reporting company. See definition of “large accelerated filer,” “accelerated filer” and “smaller reporting company” in Rule 12b-2 of the Act. (Check one):
| Large accelerated filer x | Accelerated filer ¨ | Non-accelerated filer ¨ | Smaller reporting company ¨ |
Indicate by check mark whether the registrant is a shell company (as defined in Rule 12b-2 of the Act). Yes ¨ No x
The aggregate market value of common units held by non-affiliates of the registrant on June 30, 2010, was approximately $724,943,000. The aggregate market value was computed by reference to the last sale price of the registrant’s common units on the New York Stock Exchange on June 30, 2010.
As of February 25, 2011, there were outstanding 40,486,782 common units.
DOCUMENTS INCORPORATED BY REFERENCE:
None.
Table of Contents
FORM 10-K FOR THE YEAR ENDED DECEMBER 31, 2010
TABLE OF CONTENTS
| Item |
Page | |||||
| PART I. | ||||||
| 1. | 3 | |||||
| 1A. | 27 | |||||
| 1B. | 51 | |||||
| 2. | 51 | |||||
| 3. | 51 | |||||
| 4. | 52 | |||||
| PART II. | ||||||
| 5. | Market for Registrant’s Common Equity, Related Unitholder Matters and Issuer Purchases of Units |
53 | ||||
| 6. | 54 | |||||
| 7. | Management’s Discussion and Analysis of Financial Condition and Results of Operations |
57 | ||||
| 7A. | 91 | |||||
| 8. | 98 | |||||
| 9. | Changes in and Disagreements with Accountants on Accounting and Financial Disclosure |
162 | ||||
| 9A. | 162 | |||||
| 9B. | 164 | |||||
| PART III. | ||||||
| 10. | 164 | |||||
| 11. | 170 | |||||
| 12. | Security Ownership of Certain Beneficial Owners and Management and Related Unitholder Matters |
184 | ||||
| 13. | Certain Relationships and Related Transactions, and Director Independence |
185 | ||||
| 14. | 190 | |||||
| PART IV. | ||||||
| 15. | 191 | |||||
| 208 | ||||||
| 210 | ||||||
i
Table of Contents
GLOSSARY OF TERMS
The following is a list of certain industry terms used throughout this report:
| Bbl |
barrel | |
| Bbls/d |
barrels per day | |
| BBtu/d |
one billion Btus per day | |
| Bcf |
one billion cubic feet | |
| Bcf/d |
one billion cubic feet per day | |
| Btu |
British thermal unit, a measurement of energy | |
| Fractionation |
the process by which natural gas liquids are separated into individual components | |
| Frac spread |
price differences, measured in energy units, between equivalent amounts of natural gas and NGLs | |
| MBbls |
one thousand barrels | |
| MMBbls |
one million barrels | |
| MBbls/d |
one thousand barrels per day | |
| MMBtu |
one million Btus | |
| MMBtu/d |
one million Btus per day | |
| MMcf |
one million cubic feet | |
| MMcf/d |
one million cubic feet per day | |
| MMscf |
one million standard cubic feet | |
| NGLs |
natural gas liquids | |
| Tcf |
one trillion cubic feet | |
| Throughput |
the volume of product transported or passing through a pipeline or other facility | |
ii
Table of Contents
CAUTIONARY STATEMENT ABOUT FORWARD-LOOKING STATEMENTS
Our reports, filings and other public announcements may from time to time contain statements that do not directly or exclusively relate to historical facts. Such statements are “forward-looking statements” within the meaning of the Private Securities Litigation Reform Act of 1995. You can typically identify forward-looking statements by the use of forward-looking words, such as “may,” “could,” “project,” “believe,” “anticipate,” “expect,” “estimate,” “potential,” “plan,” “forecast” and other similar words.
All statements that are not statements of historical facts, including statements regarding our future financial position, business strategy, budgets, projected costs and plans and objectives of management for future operations, are forward-looking statements.
These forward-looking statements reflect our intentions, plans, expectations, assumptions and beliefs about future events and are subject to risks, uncertainties and other factors, many of which are outside our control. Important factors that could cause actual results to differ materially from the expectations expressed or implied in the forward-looking statements include known and unknown risks. Known risks and uncertainties include, but are not limited to, the risks set forth in “Item 1A. Risk Factors” as well as the following risks and uncertainties:
| • | the extent of changes in commodity prices, our ability to effectively limit a portion of the adverse impact of potential changes in prices through derivative financial instruments, and the potential impact of price and producers’ access to capital on natural gas drilling, demand for our services, and the volume of NGLs and condensate extracted; |
| • | general economic, market and business conditions; |
| • | the level and success of natural gas drilling around our assets, the level and quality of gas production volumes around our assets and our ability to connect supplies to our gathering and processing systems in light of competition; |
| • | our ability to grow through acquisitions, contributions from affiliates, or organic growth projects, and the successful integration and future performance of such assets; |
| • | our ability to access the debt and equity markets and the resulting cost of capital, which will depend on general market conditions, our financial and operating results, inflation rates, interest rates and our ability to effectively limit a portion of the adverse effects of potential changes in interest rates by entering into derivative financial instruments, our ability to comply with the covenants to our credit agreement and our debt securities, as well as our ability to maintain our credit ratings; |
| • | our ability to purchase propane from our principal suppliers and make associated profitable sales transactions for our wholesale propane logistics business; |
| • | our ability to construct facilities in a timely fashion, which is partially dependent on obtaining required construction, environmental and other permits issued by federal, state and municipal governments, or agencies thereof, the availability of specialized contractors and laborers, and the price of and demand for supplies; |
| • | the creditworthiness of counterparties to our transactions; |
| • | weather and other natural phenomena, including their potential impact on demand for the commodities we sell and the operation of company-owned and third-party-owned infrastructure; |
| • | new, additions to and changes in laws and regulations, particularly with regard to taxes, safety and protection of the environment, including climate change legislation, or the increased regulation of our industry; |
| • | our ability to obtain insurance on commercially reasonable terms, if at all, as well as the adequacy of the insurance to cover our losses; |
| • | industry changes, including the impact of consolidations, increased delivery of liquefied natural gas to the United States, alternative energy sources, technological advances and changes in competition; and |
1
Table of Contents
| • | the amount of collateral we may be required to post from time to time in our transactions, including changes resulting from the Dodd-Frank Wall Street Reform and Consumer Protection Act. |
In light of these risks, uncertainties and assumptions, the events described in the forward-looking statements might not occur or might occur to a different extent or at a different time than we have described. We undertake no obligation to publicly update or revise any forward-looking statements, whether as a result of new information, future events or otherwise.
2
Table of Contents
| Item 1. | Business |
OUR PARTNERSHIP
DCP Midstream Partners, LP along with its consolidated subsidiaries, or we, us, our, or the partnership, is a Delaware limited partnership formed in August 2005 by DCP Midstream, LLC to own, operate, acquire and develop a diversified portfolio of complementary midstream energy assets. We completed our initial public offering on December 7, 2005. We are currently engaged in the business of gathering, compressing, treating, processing, transporting, storing and selling natural gas; transporting, storing and selling propane in wholesale markets; and producing, fractionating, transporting, storing and selling NGLs and condensate. Supported by our relationship with DCP Midstream, LLC and its parents, Spectra Energy Corp, or Spectra Energy, and ConocoPhillips, we have a management team dedicated to executing our growth strategy by acquiring and constructing additional assets.
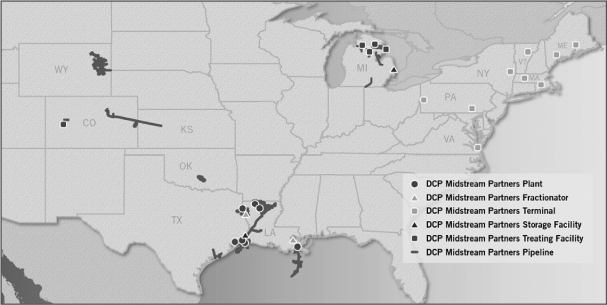
Our operations are organized into three business segments, Natural Gas Services, Wholesale Propane Logistics and NGL Logistics. A map representing the geographic location and type of our assets for all segments is set forth below. Additional maps detailing the individual assets can be found on our website at www.dcppartners.com. Our website and the information contained on that site, or connected to that site, are not incorporated by reference into this report. For more information on our segments, see the “Our Operating Segments” discussion below.

OVERVIEW AND STRATEGIES
Our Business Strategies
Our primary business objectives are to have sustained company profitability, a strong balance sheet and profitable growth thereby increasing our cash distribution per unit over time. We intend to accomplish these objectives by executing the following business strategies:
Acquire: pursue strategic and accretive acquisitions. We pursue strategic and accretive acquisition opportunities within the midstream energy industry, both in new and existing lines of business, and geographic areas of operation. We believe there will continue to be acquisition opportunities as energy companies continue to divest their midstream assets. We intend to pursue acquisition opportunities both independently and jointly with DCP Midstream, LLC and its parents, Spectra Energy and ConocoPhillips, and we may also acquire assets directly from them, which we believe will provide us with a broader array of growth opportunities than those available to many of our competitors. We plan to execute and fund our growth partially through co-investing with DCP Midstream, LLC, including the pursuit of acquisitions
3
Table of Contents
with or from DCP Midstream, LLC and through formation of additional joint ventures with it. In partnering with DCP Midstream, LLC in this manner, we aim to accomplish our individual growth initiatives while expanding the reach of both entities.
Build: capitalize on organic expansion opportunities. We continually evaluate economically attractive organic expansion opportunities to construct midstream systems in new or existing operating areas. For example, we believe there are opportunities to expand several of our gas gathering systems to attach increased volumes of natural gas produced in the areas of our operations. We believe there are opportunities to expand our NGL Logistics business via the expansion of NGL pipelines and storage. We also believe that we can continue to expand our wholesale propane logistics business via the construction of new propane terminals.
Optimize: maximize the profitability of existing assets. We intend to optimize the profitability of our existing assets by maintaining existing volumes and adding new volumes to enhance utilization, improve operating efficiencies and capture marketing opportunities when available. Our facilities, terminals and pipelines have excess capacity, which allows us to connect or contract for new supplies of natural gas and NGLs at minimal incremental cost. Our wholesale propane logistics business has diversified supply options that allow us to capture lower cost supply to lock in our margin, while providing reliable supplies to our customers.
Our Competitive Strengths
We believe that we are well positioned to execute our business strategies and achieve one of our primary business objectives of increasing our cash distribution per unit because of the following competitive strengths:
Affiliation with DCP Midstream, LLC and its parents. Our relationship with DCP Midstream, LLC and its parents, Spectra Energy and ConocoPhillips, should continue to provide us with significant business opportunities. DCP Midstream, LLC is one of the largest gatherers of natural gas (based on wellhead volume), and one of the largest producers and marketers of NGLs in North America. This relationship also provides us with access to a significant pool of management talent. We believe our strong relationships throughout the energy industry, including with major producers of natural gas and NGLs in the United States, will help facilitate the implementation of our strategies. Additionally, we believe DCP Midstream, LLC, which operates most of our assets on our behalf, has established a reputation in the midstream business as a reliable and cost-effective supplier of services to our customers, and has a track record of safe, efficient and environmentally responsible operation of our facilities.
We believe we are an important growth vehicle and a key source of funding for DCP Midstream, LLC to pursue the acquisition, expansion, and organic construction of midstream natural gas, wholesale propane, NGL and other complementary energy businesses and assets. DCP Midstream, LLC has also provided us with growth opportunities through acquisitions directly from it or joint ventures with it. We believe we will have future opportunities to make additional acquisitions with or directly from DCP Midstream, LLC as well as form joint ventures with it; however, we cannot say with any certainty which, if any, of these opportunities may be made available to us, or if we will choose to pursue any such opportunity. In addition, through our relationship with DCP Midstream, LLC and its parents, we believe we have strong commercial relationships throughout the energy industry and access to DCP Midstream, LLC’s broad operational, commercial, technical, risk management and administrative infrastructure.
DCP Midstream, LLC has a significant interest in us through its approximately 1% general partner interest in us, its ownership of our incentive distribution rights and an approximately 29% limited partner interest in us. We have entered into an omnibus agreement, or the Omnibus Agreement, with DCP Midstream, LLC and some of its affiliates that governs our relationship with them regarding the operation of most of our assets, as well as certain reimbursement and other matters.
Strategically located assets. Each of our business segments has assets that are strategically located in areas with the potential for increasing each of our business segments’ volume throughput and cash flow generation. Our Natural Gas Services segment has a strategic presence in several active natural gas producing areas including Colorado, Louisiana, Michigan, Oklahoma, Texas, Wyoming and the Gulf of
4
Table of Contents
Mexico. These natural gas gathering systems provide a variety of services to our customers including natural gas gathering, compression, treating, processing, fractionation, storage and transportation services. The strategic location of our assets, coupled with their geographic diversity, presents us continuing opportunities to provide competitive natural gas services to our customers and opportunities to attract new natural gas production. Our NGL Logistics segment has strategically located NGL transportation pipelines in Colorado, Kansas, Louisiana and Texas, which are major NGL producing regions, and an NGL storage facility in Michigan. Our NGL pipelines connect to various natural gas processing plants and transport the NGLs to large fractionation facilities, a petrochemical plant or an underground NGL storage facility along the Gulf Coast. Our NGL storage facility is strategically adjacent to the Sarnia refinery and petrochemical corridor. Our Wholesale Propane Logistics Segment has terminals in the mid-atlantic, northeastern and upper midwestern states that are strategically located to receive and deliver propane to some of the largest demand areas for propane in the United States.
Stable cash flows. Our operations consist of a favorable mix of fee-based and commodity-based services, which together with our derivative activities, generate relatively stable cash flows. While certain of our gathering and processing contracts subject us to commodity price risk, we have mitigated a portion of our currently anticipated natural gas, NGL and condensate commodity price risk associated with the equity volumes from our gathering and processing operations through 2015 with fixed price commodity swaps and collar arrangements.
Integrated package of midstream services. We provide an integrated package of services to natural gas producers, including gathering, compressing, treating, processing, transporting, storing and selling natural gas, as well as producing, fractionating, transporting, storing and selling NGLs and condensate. We believe our ability to provide all of these services gives us an advantage in competing for new supplies of natural gas because we can provide substantially all services that producers, marketers and others require to move natural gas and NGLs from wellhead to market on a cost-effective basis.
Comprehensive propane logistics systems. We have multiple propane supply sources and terminal locations for wholesale propane delivery. We believe our diversity of supply source and logistics capabilities along with our propane storage assets and services allow us to provide our customers with reliable supplies of propane during periods of tight supply. These capabilities also allow us to moderate the effects of commodity price volatility and reduce significant fluctuations in our sales volumes.
Experienced management team. Our senior management team and board of directors include some of the most senior officers of DCP Midstream, LLC and former senior officers from other energy companies who have extensive experience in the midstream industry. We believe our management team has a proven track record of enhancing value through the acquisition, optimization and integration of midstream assets.
Midstream Natural Gas Industry Overview
General
The midstream natural gas industry is the link between exploration and production of natural gas and the delivery of its components to end-use markets, and consists of the gathering, compression, treating, processing, transporting, storing and selling of natural gas, and the production, fractionating, transporting, storing and selling of NGLs.
5
Table of Contents
Once natural gas is produced from wells, producers then seek to deliver the natural gas and its components to end-use markets. The following diagram illustrates the natural gas gathering, processing, fractionation, storage and transportation process, which ultimately results in natural gas and its components being delivered to end-users.
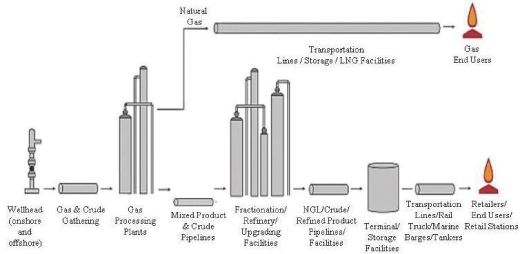
Natural Gas Gathering
The natural gas gathering process begins with the drilling of wells into gas-bearing rock formations. Once the well is completed, the well is connected to a gathering system. Onshore gathering systems generally consist of a network of small diameter pipelines that collect natural gas from points near producing wells and transport it to larger pipelines for further transmission.
Natural Gas Compression
Gathering systems are generally operated at design pressures that will maximize the total throughput from all connected wells. Since wells produce at progressively lower field pressures as they deplete, it becomes increasingly difficult to deliver the remaining lower pressure production from the well against the prevailing gathering system pressures. Natural gas compression is a mechanical process in which a volume of wellhead gas is compressed to a desired higher pressure, allowing gas to flow into a higher pressure downstream pipeline to be brought to market. Field compression is typically used to lower the pressure of a gathering system to operate at a lower pressure or provide sufficient pressure to deliver gas into a higher pressure downstream pipeline. If field compression is not installed, then the remaining natural gas in the ground will not be produced because it cannot overcome the higher gathering system pressure. In contrast, if field compression is installed, then a well can continue delivering production that otherwise would not be produced.
Natural Gas Processing
The principal component of natural gas is methane, but most natural gas produced at the wellhead also contains varying amounts of NGLs including ethane, propane, normal butane, isobutane and natural gasoline. NGLs have economic value and are utilized as a feedstock in the petrochemical and oil refining industries or directly as heating, engine or industrial fuels. Long-haul natural gas pipelines have residue natural gas specifications as to the maximum NGL content of the gas to be shipped. In order to meet quality standards for long-haul pipeline transportation, natural gas collected at the wellhead through a gathering system may need to be processed to separate hydrocarbon liquids from the natural gas that can have higher values as NGLs. NGLs are typically recovered by cooling the natural gas until the NGLs become separated through condensation. Cryogenic recovery methods are processes where this is accomplished at temperatures lower than minus 150°F. These methods provide higher NGL recovery yields.
6
Table of Contents
In addition to NGLs, natural gas collected at the wellhead through a gathering system may also contain impurities, such as water, sulfur compounds, nitrogen or helium, which must also be removed to meet the quality standards for long-haul pipeline transportation. As a result, gathering systems and natural gas processing plants will typically provide ancillary services prior to processing such as dehydration, treating to remove impurities and condensate separation. Dehydration removes water from the natural gas stream, which can form ice when combined with natural gas and cause corrosion when combined with carbon dioxide or hydrogen sulfide. Natural gas with a carbon dioxide or hydrogen sulfide content higher than permitted by pipeline quality standards requires treatment with chemicals called amines at a separate treatment plant prior to processing. Condensate separation involves the removal of liquefied hydrocarbons from the natural gas stream. Once the condensate has been removed, it may be stabilized for transportation away from the processing plant via truck, rail or pipeline.
Natural Gas and NGL Transportation and Storage
After gas collected through a gathering system is processed to meet quality standards required for transportation and NGLs have been extracted from natural gas, the residue natural gas is shipped on long-haul pipelines. The NGLs are typically transported via NGL pipelines or trucks to a fractionator for separation of the NGLs into their individual component parts. Natural gas and NGLs can also be held in storage facilities to meet future seasonal and customer demands. Storage facilities can include marine, pipeline and rail terminals, and underground facilities consisting of salt caverns and aquifers, used for storage of natural gas and various liquefied petroleum gas products including propane, mixed butane, and normal butane. Rail, truck and pipeline connections provide varying ways of transporting natural gas and NGLs to and from storage facilities.
Wholesale Propane Logistics Overview
General
Wholesale propane logistics covers the receipt of propane from processing plants, fractionation facilities and crude oil refineries, the transportation of that propane by pipeline, rail or ship to terminals and storage facilities, the storage of propane and the delivery of propane to retail distributors.
Production of Propane
Propane is extracted from the natural gas stream at processing plants, separated from NGLs at fractionation facilities or separated from crude oil during the refining process. Most of the propane that is consumed in the United States is produced at processing plants, fractionation facilities and refineries located in the United States or in foreign locations, particularly Canada, the North Sea, East Africa and the Middle East. There are limited processing plants, fractionation facilities and propane production in the northeastern United States.
Propane Demand
Propane demand is typically highest in suburban and rural areas where natural gas is not readily available, such as the northeastern United States. Propane is supplied by wholesalers to retailers to be sold to residential and commercial consumers primarily for heating and industrial applications. Propane demand is typically highest in the winter heating season months of October through April.
Transportation and Storage
Due to the region’s limited propane production and relatively high demand, the mid-atlantic and northeastern United States are importers of propane. These areas rely almost exclusively on pipeline, marine and rail sources for incoming supplies from both domestic and foreign locations. Independent terminal operators and wholesale distributors, own, lease or have access to propane storage facilities that receive supplies via pipeline, ship or rail. Generally, inventories in the propane storage facilities increase during the spring and summer months for delivery to customers during the fall and winter heating season when demand is typically at its peak.
7
Table of Contents
Delivery
Often, upon receipt of propane at marine, rail and pipeline terminals, product is delivered to customer trucks or is stored in tanks located at the terminals or in off-site bulk storage facilities for future delivery to customers. Most terminals and storage facilities have a tanker truck loading facility commonly referred to as a “rack.” Typically independent retailers will rely on independent trucking companies to pick up propane at the propane wholesalers’ rack and transport it to the retailer at its location.
OUR OPERATING SEGMENTS
Natural Gas Services Segment
General
Our Natural Gas Services segment consists of a geographically diverse complement of assets and ownership interests that provide a varying array of wellhead to market services for our producer customers. These services include gathering, compressing, treating, processing, fractionating, transporting and storing natural gas; however, we do not offer all services at every location. These assets are positioned in areas with active drilling programs and opportunities for both organic growth and readily integrated acquisitions. Our Natural Gas Services Segment operates in seven states in the continental United States: Arkansas, Colorado, Louisiana, Michigan, Oklahoma, Texas and Wyoming. The assets in these states include our Northern Louisiana system (including the Minden, Ada and Pelico systems), our Southern Oklahoma system (Lindsay system), our 40% equity interest in the Discovery system located off and onshore in Southern Louisiana, our 50.1% operating interest in the East Texas system, our 75% operating interest in our Colorado system (Collbran system), our Wyoming system (Douglas system), our Michigan system, and from January 2011, our 33.33% equity interest in the Southeast Texas system. The East Texas and Southeast Texas systems provide operating synergies and opportunities for growth in conjunction with DCP Midstream, LLC. This geographic diversity helps to mitigate our natural gas supply risk in that we are not tied to one natural gas resource type or producing area. We believe our current geographic mix of assets will be an important factor for maintaining overall volumes and cash flow for this segment.
Our Natural Gas Services segment consists of approximately 5,300 miles of pipe, seven processing plants, five treating plants, two natural gas storage facilities and two NGL fractionation facilities. The seven processing plants that service our natural gas gathering systems include six cryogenic facilities with approximately 873 MMcf/d of processing capacity and one refrigeration facility with approximately 45 MMcf/d of processing
8
Table of Contents
capacity. Further, our Minden and Discovery processing facilities both have ethane rejection capabilities that serve to optimize the value of the gas stream. The natural gas storage facilities include 850 MMcf of leased storage on our Pelico system, and our 33.33% interest in the Southeast Texas system’s 9 Bcf salt dome storage facility.
During 2010, the volume throughput on our assets was in excess of 1.1 Bcf/d, originating from a diversified mix of natural gas producing companies. Our systems each have significant customer acreage dedications that will continue to provide opportunities for growth as those customers execute their drilling plans over time. Our gathering systems also attract new natural gas volumes through numerous smaller acreage dedications and also by contracting with undedicated producers who are operating in or around our gathering footprint. During 2010, the combined NGL production from our processing facilities was in excess of 33,500 Bbls/d and was delivered and sold into various NGL takeaway pipelines or transported by truck.
Our natural gas gathering systems have the ability to deliver gas into numerous downstream transportation pipelines and markets. Many of our outlets transport gas to premium markets in the eastern United States, further enhancing the competitiveness of our commercial efforts in and around our natural gas gathering systems.
Gathering and Transmission Systems, Plants, Fractionators and Storage Facilities
Following is operating data for our systems:
| System |
Approximate Gas Gathering and Transmission Systems (Miles) |
Plants | Fractionators | Approximate Net Plant Capacity (MMcf/d)(a) |
Approximate Natural Gas Storage Capacity(Bcf) |
2010 Operating data | ||||||||||||||||||||||
| Natural Gas Throughput (MMcf/d)(a) |
NGL Production (Bbls/d)(a) |
|||||||||||||||||||||||||||
| Minden |
725 | 1 | (c) | — | 115 | — | 62 | 4,081 | ||||||||||||||||||||
| Ada |
130 | 1 | (c) | — | 45 | — | 41 | 184 | ||||||||||||||||||||
| Pelico |
600 | — | — | — | — | 146 | — | |||||||||||||||||||||
| Southern Oklahoma |
225 | — | — | — | — | 17 | 1,995 | |||||||||||||||||||||
| Colorado |
40 | 1 | (d) | — | 84 | — | 63 | 2,961 | ||||||||||||||||||||
| Wyoming |
1,300 | — | — | — | — | 21 | 2,002 | |||||||||||||||||||||
| Michigan |
440 | 4 | (d) | — | 455 | — | 358 | — | ||||||||||||||||||||
| Discovery |
300 | 1 | (c)(e) | 1 | (e) | 240 | — | 200 | 9,018 | |||||||||||||||||||
| East Texas |
900 | 1 | (c) | 1 | 391 | — | 260 | 13,280 | ||||||||||||||||||||
| Southeast Texas |
675 | 3 | (c) | — | 127 | 3 | (b) | (f | ) | (f | ) | |||||||||||||||||
| Total |
5,335 | 12 | 2 | 1,457 | 3 | 1,168 | 33,521 | |||||||||||||||||||||
| (a) | Represents total capacity or total volumes allocated to our proportionate ownership share for 2010 divided by 365 days. |
| (b) | Represents total storage capacity allocated to our proportionate ownership share. |
| (c) | Represents NGL extraction plants. |
| (d) | Represents treating plants. |
| (e) | Represents a location operated by a third party. |
| (f) | We acquired our interest in the Southeast Texas system on January 1, 2011. |
Our Northern Louisiana system includes our Minden and Ada systems, which gather natural gas from producers and deliver it for processing to the processing plants. It also includes our Pelico system, which stores natural gas and transports it to markets. Through our Northern Louisiana system, we offer producers and customers wellhead-to-market services. Our Northern Louisiana system has numerous market outlets for the natural gas we gather, including several intrastate and interstate pipelines, major industrial end-users and major power plants. The system is strategically located to facilitate the transportation of natural gas from Texas and northern Louisiana to pipeline connections linking to markets in the eastern areas of the United States.
9
Table of Contents
Our Minden processing plant is a cryogenic natural gas processing and treating plant located in Webster Parish, Louisiana. This processing plant has amine treating and ethane recovery and rejection capabilities such that we can recover approximately 80% of the ethane contained in the natural gas stream. In addition the processing plant is able to reject the majority of the ethane when justified by market economics. This processing flexibility enables us to maximize the value of ethane for our customers. NGLs produced at the Minden processing plant are delivered to our Black Lake pipeline.
Our Ada gathering system is located in Bienville and Webster Parish in Louisiana and the Ada processing plant is a refrigeration natural gas processing plant located in Bienville Parish, Louisiana. This low pressure gathering system compresses and processes natural gas for our producing customers and delivers residue gas into our Pelico intrastate system. The NGLs produced at the Ada processing plant are transported by truck from the plant tailgate.
Our Pelico system is an intrastate natural gas gathering and transportation pipeline that gathers and transports natural gas that does not require processing from producers in the area. Additionally, the Pelico system transports processed gas from the Minden and Ada processing plants and natural gas supplied from third party interstate and intrastate natural gas pipelines. The Pelico system also receives natural gas produced in Texas through its interconnect with other pipelines that transport natural gas from Texas into western Louisiana. The Pelico system leases 850 MMcf of storage capacity from a third party.
Our Southern Oklahoma system is located in the Golden Trend area of McClain, Garvin and Grady counties in southern Oklahoma. The system is adjacent to assets owned by DCP Midstream, LLC. Natural gas gathered by the system is delivered to DCP Midstream, LLC processing plants.
Our Colorado system is comprised of a 75% operating interest in Collbran Valley Gas Gathering, LLC, or Collbran, and consists of assets in the southern Piceance Basin that gather natural gas at high pressure from over 20,000 dedicated and producing acres in western Colorado. The remaining 25% interest in the joint venture is held by Occidental Petroleum Corporation who, along with Delta Petroleum Corporation, are the producers on the system. The Collbran system underwent expansion, completed in the third quarter of 2009, which consisted of an additional 24-inch pipeline loop and installation of compression at the Anderson Gulch site. The expansion increased the pipeline capacity to over 200 MMcf/d and enables gas deliveries to the third-party Meeker Plant through a downstream connection with Enterprise Products Partners LP. As a result of our arrangement with Enterprise Products Partners LP, we have decommissioned the processing services at our natural gas processing plant at the Anderson Gulch site. However, this plant will continue to provide treating and compression services as needed.
Our Wyoming system consists of over 1,300 miles of natural gas gathering pipelines that cover more than 4,000 square miles in the Powder River Basin in Wyoming. The system gathers primarily rich casing-head gas from oil wells at low pressure and delivers the gas to a third party for processing under a fee agreement.
Our Michigan system consists of four natural gas treating plants and an approximately 330-mile gas gathering pipeline system with throughput capacity of 455 MMcf/d; an approximately 55-mile residue gas pipeline, or Bay Area pipeline; a 75% interest in Jackson Pipeline Company, a partnership owning an approximately 25-mile residue pipeline; and a 44% interest in the 30-mile Litchfield pipeline.
We have a 40% equity interest in Discovery, with the remaining 60% owned by Williams Partners, L.P. The Discovery system includes a natural gas gathering and transportation pipeline system located primarily off the coast of Louisiana in the Gulf of Mexico, with six delivery points connected to major interstate and intrastate pipeline systems; a cryogenic natural gas processing plant in Larose, Louisiana; a fractionator in Paradis, Louisiana; and an NGL pipeline connecting the gas processing plant to the fractionator. The Discovery system, operated by the Williams Companies, offers a full range of wellhead-to-market services to both onshore and offshore natural gas producers. The assets are primarily located in the eastern Gulf of Mexico and Lafourche Parish, Louisiana. The Discovery system is able to reject the majority of the ethane when justified by market economics.
Discovery is managed by a two-member management committee, consisting of one representative from each owner. The members of the management committee have voting power corresponding to their respective ownership interests in Discovery. All actions and decisions relating to Discovery require the unanimous
10
Table of Contents
approval of the owners except for a few limited situations. Discovery must make quarterly distributions of available cash (generally, cash from operations less required and discretionary reserves) to its owners. The management committee, by majority approval based on the ownership percentage represented, will determine the amount of the distributions. In addition, the owners are required to offer to Discovery all opportunities to construct pipeline laterals within an “area of interest.”
We have a 50.1% consolidating interest in East Texas. In July 2007 and April 2009, we acquired 25% and 25.1%, respectively, of limited liability company interests in East Texas from DCP Midstream, LLC. Our East Texas system gathers, transports, treats, compresses and processes natural gas and NGLs. Our East Texas facility may also fractionate NGL production, which can be marketed at nearby petrochemical facilities. Our East Texas system, located near Carthage, Texas, includes a natural gas processing complex that is connected to its gathering system, as well as third party gathering systems. The complex includes the Carthage Hub, which delivers residue gas to interstate and intrastate pipelines and acts as a key exchange point for the purchase and sale of residue gas in the eastern Texas region. The East Texas system consists of approximately 900 miles of pipe, processing capacity of 780 MMcf/d and fractionation capacity of 11 MBbls/d.
East Texas is managed by a four-member management committee, consisting of two representatives from each owner. The members of the management committee have voting power corresponding to their respective ownership interests in East Texas. East Texas must make quarterly distributions of available cash (generally, cash from operations less required and discretionary reserves) to its owners. The management committee, by majority approval, will determine the amount of the distributions.
We have a 33.33% interest in Southeast Texas, which we acquired from DCP Midstream, LLC in January 2011. Two wholly-owned subsidiaries of DCP Midstream, LLC own the remaining 66.67% interest. The Southeast Texas system is a fully integrated midstream business which includes 675 miles of natural gas pipelines, three natural gas processing plants in Liberty and Jefferson Counties with recently increased processing capacity totaling 380 MMcf/d, and natural gas storage assets in Beaumont with 9 Bcf of existing storage capacity.
Southeast Texas is managed by a three-member management committee, consisting of one representative appointed by us and two representatives from DCP Midstream, LLC. The members of the management committee have voting power corresponding to their respective ownership interests in Southeast Texas. Southeast Texas must make quarterly distributions of available cash (generally, cash from operations less required and discretionary reserves) to its owners. The terms of the joint venture agreement provide that distributions to us for the first seven years related to natural gas storage and transportation gross margin will be pursuant to a fee-based arrangement, based on storage capacity and tailgate volumes. Distributions related to the gathering and processing business, along with reductions for all expenditures, will be pursuant to our and DCP Midstream, LLC’s respective ownership interests in Southeast Texas. In the event Southeast Texas has insufficient available cash for a quarterly distribution (including pursuant to our fee-based arrangement), DCP Midstream, LLC will assign its distribution rights, or contribute any distribution deficiency to Southeast Texas, the sole use of which shall be to pay the distribution deficiency owing to us related to our fee-based arrangement on natural gas storage and transportation gross margin, based on storage capacity and tailgate volumes. The allocation of earnings to each owner is made on the same basis as the above cash distributions. The management committee, by majority approval, will determine the amount of the distributions.
Natural Gas and NGL Markets
The Northern Louisiana system has numerous market outlets for the natural gas that we gather on the system. Our natural gas pipelines connect to the Perryville Market Hub, a natural gas marketing hub that provides connection to four intrastate or interstate pipelines, including pipelines owned by Southern Natural Gas Company, Texas Gas Transmission, LLC, CenterPoint Energy Mississippi River Transmission Corporation and CenterPoint Energy Gas Transmission Company. In addition, our natural gas pipelines in northern Louisiana also have access to gas that flows through pipelines owned by Texas Eastern Transmission, LP, Crosstex LIG, LLC, Gulf South Pipeline Company, Tennessee Natural Gas Company and Regency Intrastate Gas, LLC. The Northern Louisiana system is also connected to eight major industrial end-users and makes deliveries to three power plants. The NGLs extracted from the natural gas at the Minden processing plant are
11
Table of Contents
delivered to our Black Lake pipeline through our Minden NGL pipeline. The Black Lake pipeline delivers NGLs to Mt. Belvieu. The NGLs extracted from natural gas at the Ada processing plant are sold at market index prices to affiliates and are delivered to third parties’ trucks at the tailgate of the plant.
The Southern Oklahoma system has access to a mix of mid-continent pipelines including OGT, Southern Star, and NGPL, and markets through DCP Midstream, LLC owned processing plants.
The Colorado system gathers, compresses and redelivers unprocessed gas to the third party Meeker plant.
The Wyoming system delivers to the Kinder Morgan Interstate Gas Transmission interstate pipeline. The NGLs on the Wyoming system are transported on the ConocoPhillips owned, Powder River Pipeline.
The Michigan system delivers Antrim Shale gas to our four treating plants: the South Chester Treating Complex and the Warner, Turtle Lake and East Caledonia plants. Antrim Shale natural gas requires treating in order to meet downstream gas pipeline quality specifications. The treated gas is transported away from the tailgate of the plant. The Bay Area pipeline delivers fuel gas to a third party power plant owned by Consumers Energy. The Jackson Pipeline is operated by Consumers Energy and connects several intrastate pipelines with the Eaton Rapids gas storage facility. The Litchfield pipeline is operated by ANR Pipeline Company and facilitates receipts or deliveries between ANR Pipeline Company and the Eaton Rapids storage facility.
The Discovery assets have access to downstream pipelines and markets including Texas Eastern Transmission Company, Bridgeline, Gulf South Pipeline Company, Transcontinental Gas Pipeline Company, Columbia Gulf Transmission and Tennessee Gas Pipeline Company, among others. The NGLs are fractionated at the Paradis fractionation facilities and delivered downstream to third-party purchasers. The third party purchasers of the fractionated NGLs consist of a mix of local petrochemical facilities and wholesale distribution companies for the ethane and propane components, while the butanes and natural gasoline are delivered and sold to pipelines that transport product to the storage and distribution center near Napoleonville, Louisiana or other similar product hub.
The East Texas system delivers gas primarily through its Carthage Hub which delivers residue gas to ten different interstate and intrastate pipelines including CenterPoint Energy Gas Transmission, Texas Gas Transmission, Tennessee Gas Pipeline Company, Natural Gas Pipeline Company of America, Gulf South Pipeline Company, Enterprise, Energy Transfer and others. Certain of the lighter NGLs, consisting of ethane and propane, are fractionated at the East Texas facility and sold to regional petrochemical purchasers. The remaining NGLs, including butanes and natural gasoline, are purchased by DCP Midstream, LLC and shipped on the Panola NGL pipeline to Mt. Belvieu for fractionation and sale.
The Southeast Texas system has numerous natural gas market outlets and delivers residue gas into various interstate and intrastate pipelines, including the TETCO and Sabine pipelines. The Southeast Texas system makes NGL market deliveries directly to Exxon Mobil and to Mt. Belvieu via our Black Lake NGL pipeline.
Customers and Contracts
The primary suppliers of natural gas to our Natural Gas Services segment are a broad cross-section of the natural gas producing community. We actively seek new producing customers of natural gas on all of our systems to increase throughput volume and to offset natural declines in the production from connected wells. We obtain new natural gas supplies in our operating areas by contracting for production from new wells, by connecting new wells drilled on dedicated acreage and by obtaining natural gas that has been directly received or released from other gathering systems.
Our contracts with our producing customers in our Natural Gas Services segment are primarily a mix of commodity sensitive percent-of-proceeds and percent-of-liquids contracts and non-commodity sensitive fee-based contracts. Our gross margin generated from percent-of-proceeds contracts is directly related to the price of natural gas, NGLs and condensate and our gross margin generated from percent-of-liquids contracts is directly related to the price of NGLs and condensate. Additionally, these contracts may include fee-based components. Generally, the initial term of these purchase agreements is for three to five years or, in some cases, the life of the lease. The largest percentage of volume at Minden and Wyoming are processed under percent-of-proceeds contracts. Discovery has percent-of-liquids contracts and fee-based contracts, as well as
12
Table of Contents
some keep-whole contracts. The producer contracts at our Southern Oklahoma, East Texas and Southeast Texas systems are primarily percent-of-liquids. The majority of the margin associated with contracts for our Pelico and Ada assets, as well as our Colorado and Michigan system, are fee-based.
DCP Midstream, LLC operates our Southeast Texas system storage facility. It commits on an annual basis a portion of such facility’s capacity to third parties pursuant to fee-based arrangements and manages the rest for its own account. We receive distributions related to this storage business pursuant to the joint venture agreement.
Discovery’s wholly owned subsidiary, Discovery Gas Transmission, owns the mainline and the Federal Energy Regulatory Commission, or FERC, regulated laterals, which generate revenues through a tariff on file with FERC for several types of service: traditional firm transportation service with reservation fees; firm transportation service on a commodity basis with reserve dedication; and interruptible transportation service. In addition, for any of these general services, Discovery Gas Transmission has the authority to negotiate a specific rate arrangement with an individual shipper and has several of these arrangements currently in effect.
The midstream natural gas industry is cyclical, with the operating results of companies in the industry significantly affected by the prevailing price of NGLs, which in turn has been generally related to the price of crude oil, with some notable exceptions in late 2008 to early 2009, when NGL pricing was at a greater discount to crude oil pricing. Although the prevailing price of residue natural gas has less short-term significance to our operating results than the price of NGLs, in the long term the growth and sustainability of our business depends on natural gas prices being at levels sufficient to provide incentives and capital for producers to increase natural gas exploration and production. The prices of NGLs, crude oil and natural gas can be extremely volatile for periods of time, and may not always have a close relationship. Changes in the relationship of the price of NGLs and crude oil will cause our commodity price sensitivities to vary. To minimize potential future commodity-based pricing and cash flow volatility, we have entered into a series of derivative financial instruments. As a result of these transactions, we have mitigated a portion of our expected natural gas, NGL and condensate commodity price risk relating to the equity volumes associated with our gathering and processing operations through 2015.
Competition
The natural gas services business is highly competitive in our markets and includes major integrated oil and gas companies, interstate and intrastate pipelines, and companies that gather, compress, treat, process, store, transport and/or market natural gas. Competition is often the greatest in geographic areas experiencing robust drilling by producers and during periods of high commodity prices for crude oil, natural gas and/or NGLs. Competition is also increased in those geographic areas where our commercial contracts with our customers are shorter in length of term and therefore must be renegotiated on a more frequent basis.
13
Table of Contents
Wholesale Propane Logistics Segment
General
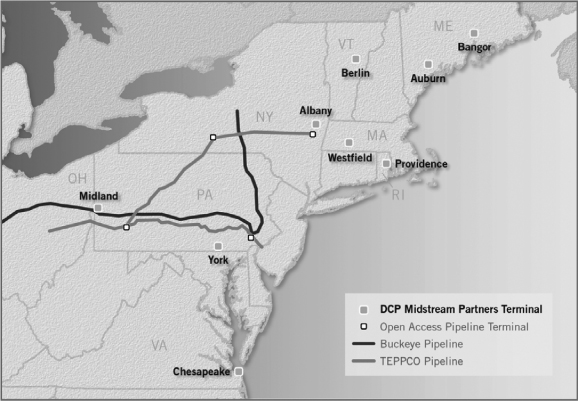
We operate a wholesale propane logistics business in the states of Connecticut, Maine, Massachusetts, New Hampshire, New York, Ohio, Pennsylvania, Rhode Island, Vermont and Virginia. As a result of our acquisition of Atlantic Energy in July 2010, we now serve a portion of the large propane market in the mid-atlantic states. The acquisition expands our wholesale marketing operations to not only the acquired Chesapeake, Virginia terminal, but also to open access terminals along the Dixie pipeline.
Due to our multiple propane supply sources, annual and long-term propane supply purchase arrangements, storage capabilities, and multiple terminal locations for wholesale propane delivery, we are generally able to provide our retail propane distribution customers with reliable, low cost deliveries and greater volumes of propane during periods of tight supply such as the winter months. We believe these factors generally result in our maintaining favorable relationships with our customers and allowing us to remain a supplier to many of the large retail distributors in the northeastern and mid-atlantic United States. As a result, we serve as the baseload provider of propane supply to many of our retail propane distribution customers.
Pipeline deliveries to the northeastern and mid-atlantic markets in the winter season are generally at capacity and competing pipeline-dependent terminals can have supply constraints or outages during peak market conditions. Our system of terminals has excess capacity, which provides us with opportunities to increase our volumes with minimal additional cost. Additionally, we are actively seeking new terminals through acquisition or construction to expand our distribution capabilities.
Our Terminals
Our operations include one owned propane marine import terminal with storage capacity of 476 MBbls, one leased propane marine terminal with storage capacity of 424 MBbls, one propane pipeline terminal with storage capacity of 56 MBbls, six owned propane rail terminals with aggregate storage capacity of 21 MBbls,
14
Table of Contents
and access to several open access pipeline terminals. We own our rail terminals and lease the land on which the terminals are situated under long-term leases, except for the York terminal where we own the land. Our leased marine terminal is on a long-term lease agreement. Each of our rail terminals consist of two to three propane tanks with capacity of between 120,000 and 270,000 gallons for storage, and two high volume racks for loading propane into trucks. Our aggregate truck-loading capacity is approximately 400 trucks per day. We could expand each of our terminals’ loading capacity by adding a third rack to handle future growth. High volume submersible pumps are utilized to enable trucks to fully load within 15 minutes. Each facility also has the ability to unload multiple railcars simultaneously. We have numerous railcar leases that allow us to increase our storage and throughput capacity as propane demand increases. Each terminal relies on leased rail trackage for the storage of the majority of its propane inventory in these leased railcars. These railcars mitigate the need for larger numbers of fixed storage tanks and reduce initial capital needs when constructing a terminal. Each railcar holds approximately 30,000 gallons of propane.
Propane Supply
Our wholesale propane business has a strategic network of supply arrangements under annual and multi-year agreements under index-based pricing. The remaining supply is purchased on annual or month-to-month terms to match our anticipated sale requirements. Our primary suppliers of propane include a subsidiary of DCP Midstream, LLC, Aux Sable Liquid Products LP, Spectra Energy and BP Canada. We may also obtain supply from our recently acquired NGL storage facility in Marysville, Michigan.
For our rail terminals, we contract for propane at various major supply points in the United States and Canada, and transport the product to our terminals under long-term rail commitments, which provide fixed transportation costs that are subject to prevailing fuel surcharges. We also purchase propane supply from natural gas fractionation plants and crude oil refineries located in the Texas and Louisiana Gulf Coast. Through this process, we take custody of the propane and either sell it in the wholesale market or store it at our facilities. We have supply contracts with Spectra Energy for both marine terminals.
Based on the carrying value of our inventory, timing of inventory transactions and the volatility of the market value of propane, we have historically and may periodically recognize non-cash lower of cost or market inventory adjustments.
Customers and Contracts
We typically sell propane to retail propane distributors under annual sales agreements, negotiated each spring, that specify floating price terms that provide us a margin in excess of our floating index-based supply costs under our supply purchase arrangements. In the event that a retail propane distributor desires to purchase propane from us on a fixed price basis, we sometimes enter into fixed price sales agreements with terms of generally up to one year. We manage this commodity price risk by purchasing and storing propane, by entering into physical purchase agreements or by entering into offsetting financial derivative instruments, with DCP Midstream, LLC or third parties, that generally match the quantities of propane subject to these fixed price sales agreements. Our ability to help our clients manage their commodity price exposure by offering propane at a fixed price may lead to improved margins and a larger customer base. Historically, approximately 75% of the gross margin generated by our wholesale propane business is earned in the heating season months of October through April, which corresponds to the general market demand for propane.
We had one third-party customer in our Wholesale Propane Logistics segment that accounted for greater than 10% of our segment revenues.
Competition
The wholesale propane business is highly competitive in the mid-atlantic, upper midwestern and northeastern regions of the United States. Our wholesale propane business’ competitors include integrated oil and gas and energy companies, and interstate and intrastate pipelines.
15
Table of Contents
NGL Logistics Segment
General
We operate our NGL Logistics business in the states of Louisiana, Texas, Colorado, Kansas and Michigan.
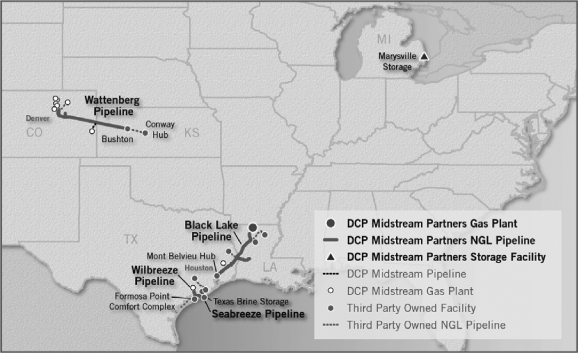
Our NGL pipelines transport NGLs from natural gas processing plants to fractionation facilities, a petrochemical plant and a third party underground NGL storage facility. In aggregate, our NGL transportation business has 95 MBbls/d of capacity and in 2010, had average throughput of approximately 38 MBbls/d. Our pipelines provide transportation services to customers on a fee basis. Therefore, the results of operations for this business are generally dependent upon the volume of product transported and the level of fees charged to customers. The volumes of NGLs transported on our pipelines are dependent on the level of production of NGLs from processing plants connected to our NGL pipelines. When natural gas prices are high relative to NGL prices, it is less profitable to recover NGLs from natural gas because of the higher value of natural gas compared to the value of NGLs. As a result, we have experienced periods in the past, and will likely experience periods in the future, when higher relative natural gas prices reduce the volume of NGLs produced at plants connected to our NGL pipelines.
With the December 2010 acquisition of our facility in Marysville, Michigan, we have entered the NGL storage business in the upper midwestern United States. This facility, with strategic access to Canadian NGLs, has approximately 7 MMBbls of propane and butane storage and was operating near capacity in 2010. Our facility serves regional refining and petrochemical demand, and helps to balance the seasonality of propane distribution in the midwestern and northeastern United States and in Sarnia, Canada. We provide services to customers primarily on a fee basis. Therefore, the results of operations for this business are generally dependent upon the volume of product injected, stored and withdrawn, and the level of fees charged to customers.
NGL Pipelines
Seabreeze and Wilbreeze Pipelines. The Seabreeze intrastate NGL pipeline is approximately 68 miles long, has capacity of 33 MBbls/d and, in 2010, had average throughput of approximately 16 MBbls/d. The Seabreeze pipeline, located in Texas, delivers NGLs to a large third-party processing plant with capacity of approximately 340 MMcf/d located in Matagorda County and an NGL pipeline. The Seabreeze pipeline is the
16
Table of Contents
sole NGL pipeline for one processing plant and is the only delivery point for two NGL pipelines. One third party NGL pipeline transports NGLs from five natural gas processing plants located in southeastern Texas that have aggregate processing capacity of approximately 1.6 Bcf/d. Three of these processing plants are owned by DCP Midstream, LLC. In total, seven processing plants produce NGLs, which flow into the Seabreeze pipeline from processed natural gas produced in southern Texas and offshore in the Gulf of Mexico. The Seabreeze pipeline delivers the NGLs it receives from these sources to a third party fractionator and a third party storage facility. The Wilbreeze intrastate pipeline, located in Texas, is approximately 39 miles long, has a current capacity of 11 MBbls/d and, in 2010, had average throughput of 6 MBbls/d.
Wattenberg Pipeline. The Wattenberg interstate NGL pipeline is approximately 350 miles long and has capacity of 22 MBbls/d. It originates in the Denver-Julesburg, or DJ, Basin in Colorado and terminates near the Conway hub in Bushton, Kansas. The pipeline is currently connected to two DCP Midstream, LLC plants and two third party plants. To address the growing needs of the DJ Basin, the pipeline is currently undergoing an expansion project which we expect to complete in early 2011 to connect to two additional DCP Midstream, LLC processing plants.
Black Lake Pipeline. The Black Lake interstate NGL pipeline is approximately 317 miles long, has capacity of 40 MBbls/d and, in 2010, had average throughput of approximately 12 MBbls/d. The Black Lake pipeline delivers NGLs from processing plants in northern Louisiana and southeastern Texas to fractionation plants at Mt. Belvieu on the Texas Gulf Coast. The Black Lake pipeline receives NGLs from two natural gas processing plants in northern Louisiana, including our Minden plant and Regency Intrastate Gas, LLC’s Dubach processing plant. The Black Lake pipeline is the sole NGL pipeline for these natural gas processing plants in northern Louisiana, as well as one of our Southeast Texas system processing plants, and also receives NGLs from XTO Energy Inc.’s Cotton Valley processing plant and Eagle Rock’s Brookland processing plant.
Black Lake is owned by us and has been operated by DCP Midstream, LLC since November 2010. Prior to July 27, 2010, we owned a 45% interest in Black Lake, while DCP Midstream, LLC owned a 5% interest. The remaining 50% was owned by an affiliate of BP PLC, who also operated the pipeline prior to November 2010. On July 27, 2010 we acquired DCP Midstream, LLC’s 5% interest in Black Lake in a transaction among entities under common control, and on July 30, 2010, we acquired the remaining 50% interest in Black Lake from an affiliate of BP PLC, bringing our ownership interest in Black Lake to 100%. Prior to our acquisition of the remaining 50% interest in Black Lake, we accounted for Black Lake under the equity method of accounting. Subsequent to this transaction we account for Black Lake as a consolidated subsidiary.
NGL Storage Facility
Our NGL storage facility is housed on 320 acres of land in Marysville, Michigan and includes nine underground salt caverns with approximately 7 MMBbls of storage capacity and rail, truck and pipeline connections providing an important supply point for refiners, petrochemical plants and wholesale propane distributors in the Sarnia, midwestern and northeastern markets, including our Wholesale Propane business. We own an additional 300 undeveloped acres in neighboring St. Clair Township, Michigan, which provides the opportunity for future expansion to increase capacity or expand service offerings.
Customers and Contracts
The Wilbreeze pipeline is supported by an NGL product dedication agreement with DCP Midstream, LLC.
DCP Midstream, LLC is the sole shipper on the Seabreeze pipeline under a long-term transportation agreement. The Seabreeze pipeline collects fee-based transportation revenue under this agreement. DCP Midstream, LLC receives its supply of NGLs that it then transports on the Seabreeze pipeline under an NGL purchase agreement with Williams Field Services – Gulf Coast Company, LP. Under this agreement, Williams has dedicated all of their respective NGL production from this processing plant to DCP Midstream, LLC. DCP Midstream, LLC has a sales agreement with Formosa Hydrocarbons Company, Inc. Additionally, DCP Midstream, LLC has a transportation agreement with TEPPCO Partners, L.P. that covers all of the NGL volumes transported on TEPPCO Partners, L.P.’s South Dean NGL pipeline for delivery to the Seabreeze pipeline.
17
Table of Contents
The Wattenberg pipeline is an open access pipeline with access to numerous gas processing facilities in the DJ Basin. Effective January 1, 2011, we entered into a 10-year dedication and transportation agreement with a subsidiary of DCP Midstream, LLC whereby certain NGL volumes produced at several of DCP Midstream, LLC’s processing facilities are dedicated for transportation on the Wattenberg pipeline. We collect fee-based transportation revenue under our tariff.
There are currently six active shippers on the Black Lake pipeline. DCP Midstream, LLC has historically been the largest, accounting for approximately 43% of total throughput in 2010. The Black Lake pipeline generates revenues through a FERC-regulated tariff.
Our Marysville NGL storage facility serves retail and wholesale propane customers, as well as refining and petrochemical customers, under one to three year term storage agreements. Our margins for the storage are primarily fee-based.
Other
For additional information on our segments, please see Item 7. “Management’s Discussion and Analysis of Financial Condition and Results of Operations,” and Note 18 of the Notes to Consolidated Financial Statements in Item 8. “Financial Statements and Supplementary Data.”
We have no revenue or segment profit or loss attributable to international activities.
REGULATORY AND ENVIRONMENTAL MATTERS
Safety and Maintenance Regulation
We are subject to regulation by the United States Department of Transportation, or DOT, under the Hazardous Liquids Pipeline Safety Act of 1979, as amended, referred to as the Hazardous Liquid Pipeline Safety Act, and comparable state statutes with respect to design, installation, testing, construction, operation, replacement and management of pipeline facilities. The Hazardous Liquid Pipeline Safety Act covers petroleum and petroleum products, including NGLs and condensate, and requires any entity that owns or operates pipeline facilities to comply with such regulations, to permit access to and copying of records and to file certain reports and provide information as required by the United States Secretary of Transportation. These regulations include potential fines and penalties for violations. We believe that we are in compliance in all material respects with these Hazardous Liquid Pipeline Safety Act regulations.
We are also subject to the Natural Gas Pipeline Safety Act of 1968, as amended, or NGPSA, and the Pipeline Safety Improvement Act of 2002. The NGPSA regulates safety requirements in the design, construction, operation and maintenance of gas pipeline facilities while the Pipeline Safety Improvement Act establishes mandatory inspections for all United States oil and natural gas transportation pipelines in high-consequence areas within 10 years. The DOT has developed regulations implementing the Pipeline Safety Improvement Act that requires pipeline operators to implement integrity management programs, including more frequent inspections and other safety protections in areas where the consequences of potential pipeline accidents pose the greatest risk to people and their property. We currently estimate we will incur costs of up to $4.1 million between 2010 and 2015 to implement integrity management program testing along certain segments of our natural gas transmission and NGL pipelines, including our Wattenberg NGL pipeline acquired in January 2010. We believe that we are in compliance in all material respects with the NGPSA and the Pipeline Safety Improvement Act of 2002.
States are largely preempted by federal law from regulating pipeline safety but may assume responsibility for enforcing intrastate pipeline regulations at least as stringent as the federal standards. In practice, states vary considerably in their authority and capacity to address pipeline safety. We do not anticipate any significant problems in complying with applicable state laws and regulations in those states in which we or the entities in which we own an interest operate. Our natural gas transmission and regulated gathering pipelines have ongoing inspection and compliance programs designed to keep the facilities in compliance with pipeline safety and pollution control requirements.
In addition, we are subject to the requirements of the federal Occupational Safety and Health Act, or OSHA, and comparable state statutes, whose purpose is to protect the health and safety of workers, both
18
Table of Contents
generally and within the pipeline industry. In addition, the OSHA hazard communication standard, the Environmental Protection Agency, or EPA, community right-to-know regulations under Title III of the federal Superfund Amendment and Reauthorization Act and comparable state statutes require that information be maintained concerning hazardous materials used or produced in our operations and that this information be provided to employees, state and local government authorities and citizens. We and the entities in which we own an interest are also subject to OSHA Process Safety Management regulations, which are designed to prevent or minimize the consequences of catastrophic releases of toxic, reactive, flammable or explosive chemicals. These regulations apply to any process which involves a chemical at or above the specified thresholds, or any process which involves flammable liquid or gas, pressurized tanks, caverns and wells in excess of 10,000 pounds at various locations. Flammable liquids stored in atmospheric tanks below their normal boiling point without the benefit of chilling or refrigeration are exempt. We have an internal program of inspection designed to monitor and enforce compliance with worker safety requirements. We believe that we are in compliance in all material respects with all applicable laws and regulations relating to worker health and safety.
Propane Regulation
National Fire Protection Association Pamphlets No. 54 and No. 58, which establish rules and procedures governing the safe handling of propane, or comparable regulations, have been adopted as the industry standard in all of the states in which we operate. In some states these laws are administered by state agencies, and in others they are administered on a municipal level. With respect to the transportation of propane by truck, we are subject to regulations promulgated under the Federal Motor Carrier Safety Act. These regulations cover the transportation of hazardous materials and are administered by the DOT. We conduct ongoing training programs to help ensure that our operations are in compliance with applicable regulations. We maintain various permits that are necessary to operate our facilities, some of which may be material to our propane operations. We believe that the procedures currently in effect at all of our facilities for the handling, storage and distribution of propane are consistent with industry standards and are in compliance in all material respects with applicable laws and regulations.
FERC Regulation of Operations
FERC regulation of pipeline gathering and transportation services, natural gas sales and transportation of NGLs may affect certain aspects of our business and the market for our products and services.
Interstate Natural Gas Pipeline Regulation
The Discovery 105-mile mainline, approximately 60 miles of laterals and its market expansion project are subject to regulation by FERC, under the Natural Gas Act of 1938, or NGA. Natural gas companies may not charge rates that have been determined to be unjust or unreasonable. In addition, FERC authority over natural gas companies that provide natural gas pipeline transportation services in interstate commerce includes:
| • | certification and construction of new facilities; |
| • | extension or abandonment of services and facilities; |
| • | maintenance of accounts and records; |
| • | acquisition and disposition of facilities; |
| • | initiation and discontinuation of services; |
| • | terms and conditions of services and service contracts with customers; |
| • | depreciation and amortization policies; |
| • | conduct and relationship with certain affiliates; and |
| • | various other matters. |
Generally, the maximum filed recourse rates for interstate pipelines are based on the cost of service including recovery of and a return on the pipeline’s actual prudent investment cost. Key determinants in the ratemaking process are costs of providing service, allowed rate of return and volume throughput and contractual
19
Table of Contents
capacity commitment assumptions. The maximum applicable recourse rates and terms and conditions for service are set forth in each pipeline’s FERC-approved gas tariff. Rate design and the allocation of costs also can impact a pipeline’s profitability. FERC-regulated natural gas pipelines are permitted to discount their firm and interruptible rates without further FERC authorization down to the minimum rate or variable cost of performing service, provided they do not “unduly discriminate.”
Tariff changes can only be implemented upon approval by FERC. Two primary methods are available for changing the rates, terms and conditions of service of an interstate natural gas pipeline. Under the first method, the pipeline voluntarily seeks a tariff change by making a tariff filing with FERC justifying the proposed tariff change and providing notice, generally 30 days, to the appropriate parties. If FERC determines, as required by the NGA, that a proposed change is just and reasonable, FERC will accept the proposed change and the pipeline will implement such change in its tariff. However, if FERC determines that a proposed change may not be just and reasonable as required by NGA, then FERC may suspend such change for up to five months beyond the date on which the change would otherwise go into effect and set the matter for an administrative hearing. Subsequent to any suspension period ordered by FERC, the proposed change may be placed into effect by the company, pending final FERC approval. In most cases, a proposed rate increase is placed into effect before a final FERC determination on such rate increase, and the proposed increase is collected subject to refund (plus interest). Under the second method, FERC may, on its own motion or based on a complaint, initiate a proceeding seeking to compel the company to change its rates, terms and/or conditions of service. If FERC determines that the existing rates, terms and/or conditions of service are unjust, unreasonable, unduly discriminatory or preferential, then any rate reduction or change that it orders generally will be effective prospectively from the date of FERC order requiring this change.
Additional proposals and proceedings that might affect the natural gas industry are pending before Congress, FERC and the courts. The natural gas industry historically has been heavily regulated; therefore, there is no assurance that a more stringent regulatory approach will not be pursued by FERC and Congress, especially in light of potential market power abuse by marketing affiliates of certain pipeline companies engaged in interstate commerce. In response to this issue, Congress, in the Energy Policy Act of 2005, or EPACT 2005, and FERC have implemented requirements to ensure that energy prices are not impacted by the exercise of market power or manipulative conduct. EPACT 2005 prohibits the use of any “manipulative or deceptive device or contrivance” in connection with the purchase or sale of natural gas, electric energy or transportation subject to FERC jurisdiction. In addition, EPACT 2005 gave FERC increased penalty authority for these violations. FERC may now issue civil penalties of up to $1.0 million per day per violation, and possible criminal penalties of up to $1.0 million per violation and five years in prison. FERC may also order disgorgement of profits obtained in violation of FERC rules. FERC adopted the Market Manipulation Rules and the Market Behavior Rules to implement the authority granted under EPACT 2005. These rules, which prohibit fraud and manipulation in wholesale energy markets, are subject to broad interpretation. In the past two years, FERC has relied on its EPACT 2005 enforcement authority in issuing a number of natural gas enforcement actions giving rise to the imposition of aggregate penalties of approximately $40.0 million and aggregate disgorgements of approximately $30.0 million. These orders reflect FERC’s view that it has broad latitude in determining whether specific behavior violates the rules. Given FERC’s broad mandate granted in EPACT 2005, if energy prices are high, or exhibit what FERC deems to be “unusual” trading patterns, FERC will investigate energy markets to determine if behavior unduly impacted or “manipulated” energy prices.
Intrastate Natural Gas Pipeline Regulation
Intrastate natural gas pipeline operations are not generally subject to rate regulation by FERC, but they are subject to regulation by various agencies in the respective states where they are located. While the regulatory regime varies from state to state, state agencies typically require intrastate gas pipelines to file their rates with the agencies and permit shippers to challenge existing rates or proposed rate increases. However, to the extent that an intrastate pipeline system transports natural gas in interstate commerce, the rates, terms and conditions of such transportation service are subject to FERC jurisdiction under Section 311 of the Natural Gas Policy Act, or NGPA. Under Section 311, intrastate pipelines providing interstate service may avoid jurisdiction that would otherwise apply under the NGA. Section 311 regulates, among other things, the provision of transportation services by an intrastate natural gas pipeline on behalf of a local distribution company or an interstate natural
20
Table of Contents
gas pipeline. Under Section 311, rates charged for transportation must be fair and equitable, and amounts collected in excess of fair and equitable rates are subject to refund with interest. Rates for service pursuant to Section 311 of the NGPA are generally subject to review and approval by FERC at least once every three years. The rate review may, but does not necessarily, involve an administrative-type hearing before FERC staff panel and an administrative appellate review. Additionally, the terms and conditions of service set forth in the intrastate pipeline’s Statement of Operating Conditions are subject to FERC approval. Failure to observe the service limitations applicable to transportation services provided under Section 311, failure to comply with the rates approved by FERC for Section 311 service, and failure to comply with the terms and conditions of service established in the pipeline’s FERC-approved Statement of Operating Conditions could result in the assertion of federal NGA jurisdiction by FERC and/or the imposition of administrative, civil and criminal penalties. Among other matters, EPACT 2005 amends the NGPA to give FERC authority to impose civil penalties for violations of the NGPA up to $1.0 million per day per violation and possible criminal penalties of up to $1.0 million per violation and five years in prison for violations occurring after August 8, 2005. For violations occurring before August 8, 2005, FERC had the authority to impose civil penalties for violations of the NGPA up to $5,000 per violation per day. The Pelico and EasTrans systems are subject to FERC jurisdiction under Section 311 of the NGPA.
On May 20, 2010, FERC issued Order No. 735, a final rule revising the contract reporting requirements for intrastate pipelines providing interstate transportation service pursuant to Section 311 of the NGPA and Hinshaw pipelines providing interstate service subject to the FERC’s NGA section 1(c) jurisdiction pursuant to blanket certificates. The final rule revised the reporting requirements to be filed quarterly instead of annually and to include additional data. On December 16, 2010, FERC issued Order No. 735-A that affirmed Order No. 735 and clarified several items. The rule is effective April 1, 2011 and the first report will be due June 1, 2011 and cover first quarter 2011 activity. Pelico, EasTrans and Jackson pipeline systems are required to comply with this rule.
On October 21, 2010, FERC issued a Notice of Inquiry seeking comment on whether and how holders of firm capacity on intrastate natural gas pipelines providing interstate transportation and storage services should be permitted to allow others to make use of their firm interstate capacity. If FERC imposes new requirements on intrastate pipelines providing interstate firm transportation service, Pelico and EasTrans could be required to comply with such requirements.
On March 31, 2009, EasTrans, LLC filed a Section 311 rate case with the Railroad Commission of Texas, or TRRC, justifying the current maximum rate applicable to transportation pursuant to Section 311 of the NGPA of $0.1773 per MMBtu. The filed rates were affirmed by order of the TRRC on March 23, 2010. On October 30, 2009, Pelico filed a Section 311 rate case with FERC proposing a maximum rate for transportation pursuant to Section 311 of NGPA of $0.3291 per MMBtu. On March 12, 2010, Pelico filed a settlement agreement under which it would implement a Section 311 transportation rate of $0.2700 per MMBtu. On March 23, 2010, FERC approved the Pelico settlement agreement.
Gathering Pipeline Regulation
Section 1(b) of the NGA exempts natural gas gathering facilities from the jurisdiction of FERC under the NGA. We believe that our natural gas gathering facilities meet the traditional tests FERC has used to establish a pipeline’s status as a gatherer not subject to FERC jurisdiction. However, the distinction between FERC-regulated transmission services and federally unregulated gathering services is the subject of material, on-going litigation, so the classification and regulation of our gathering facilities are subject to change based on future determinations by FERC and the courts. State regulation of gathering facilities generally includes various safety, environmental and, in some circumstances, nondiscriminatory take requirements, and in some instances complaint-based rate regulation.
Our purchasing, gathering and intrastate transportation operations are subject to ratable take and common purchaser statutes in the states in which they operate. The ratable take statutes generally require gatherers to take, without undue discrimination, natural gas production that may be tendered to the gatherer for handling. Similarly, common purchaser statutes generally require gatherers to purchase without undue discrimination as to source of supply or producer. These statutes are designed to prohibit discrimination in favor of one producer
21
Table of Contents
over another producer or one source of supply over another source of supply. These statutes have the effect of restricting our right as an owner of gathering facilities to decide with whom we contract to purchase or transport natural gas.
Natural gas gathering may receive greater regulatory scrutiny at both the state and federal levels where FERC has recognized a jurisdictional exemption for the gathering activities of interstate pipeline transmission companies and a number of such companies have transferred gathering facilities to unregulated affiliates. Many of the producing states have adopted some form of complaint-based regulation that generally allows natural gas producers and shippers to file complaints with state regulators in an effort to resolve grievances relating to natural gas gathering access and rate discrimination. Our gathering operations could be adversely affected should they be subject in the future to the application of state or federal regulation of rates and services. Additional rules and legislation pertaining to these matters are considered or adopted from time to time. We cannot predict what effect, if any, such changes might have on our operations, but the industry could be required to incur additional capital expenditures and increased costs depending on future legislative and regulatory changes.
Sales of Natural Gas
The price at which we buy and sell natural gas currently is not subject to federal regulation and, for the most part, is not subject to state regulation. However, with regard to our physical purchases and sales of these energy commodities, and any related derivative activities that we undertake, we are required to observe anti-market manipulation laws and related regulations enforced by FERC and/or the Commodity Futures Trading Commission, or CFTC. Should we violate the anti-market manipulation laws and regulations, we could also be subject to related third party damage claims by, among others, market participants, sellers, royalty owners and taxing authorities.
Our sales of natural gas are affected by the availability, terms and cost of pipeline transportation. As noted above, the price and terms of access to pipeline transportation are subject to extensive federal and state regulation. FERC is continually proposing and implementing new rules and regulations affecting those segments of the natural gas industry, most notably interstate natural gas transmission companies that remain subject to FERC jurisdiction. These initiatives also may affect the intrastate transportation of natural gas under certain circumstances. The stated purpose of many of these regulatory changes is to promote competition among the various sectors of the natural gas industry. We cannot predict the ultimate impact of these regulatory changes to our natural gas marketing operations, and we note that some of FERC’s more recent proposals may adversely affect the availability and reliability of interruptible transportation service on interstate pipelines. We do not believe that we will be affected by any such FERC action materially differently than other natural gas marketers with whom we compete.
Interstate NGL Pipeline Regulation
The Black Lake and Wattenberg pipelines are interstate NGL pipelines subject to FERC regulation. FERC regulates interstate NGL pipelines under its Oil Pipeline Regulations, the Interstate Commerce Act, or ICA, and the Elkins Act. FERC requires that interstate NGL pipelines file tariffs containing all the rates, charges and other terms for services performed. The ICA requires that tariffs apply to the interstate movement of NGLs, as is the case with the Black Lake and Wattenberg pipelines. Pursuant to the ICA, rates can be challenged at FERC either by protest when they are initially filed or increased or by complaint at any time they remain on file with FERC.
In October 1992, Congress passed the Energy Policy Act of 1992, or EPACT, which among other things, required FERC to issue rules establishing a simplified and generally applicable ratemaking methodology for pipelines regulated by FERC pursuant to the ICA. FERC responded to this mandate by issuing several orders, including Order No. 561. Beginning January 1, 1995, Order No. 561 enables petroleum pipelines to change their rates within prescribed ceiling levels that are tied to an inflation index. Specifically, the indexing methodology allows a pipeline to increase its rates annually by a percentage equal to the change in the producer price index for finished goods, PPI-FG, plus 1.3% to the new ceiling level. Rate increases made pursuant to the indexing methodology are subject to protest, but such protests must show that the portion of the rate increase resulting from application of the index is substantially in excess of the pipeline’s increase in costs. If the
22
Table of Contents
PPI-FG falls and the indexing methodology results in a reduced ceiling level that is lower than a pipeline’s filed rate, Order No. 561 requires the pipeline to reduce its rate to comply with the lower ceiling unless doing so would reduce a rate “grandfathered” by EPACT (see below) below the grandfathered level. A pipeline must, as a general rule, utilize the indexing methodology to change its rates. FERC, however, retained cost-of-service ratemaking, market-based rates, and settlement as alternatives to the indexing approach, which alternatives may be used in certain specified circumstances. FERC’s indexing methodology is subject to review every five years; the current methodology remains in place through June 30, 2011. Effective July 1, 2011, the FERC index methodology changes to PPI-FG plus 2.65% until June 30, 2016 for oil pipeline companies.
EPACT deemed petroleum pipeline rates in effect for the 365-day period ending on the date of enactment of EPACT that had not been subject to complaint, protest or investigation during that 365-day period to be just and reasonable under the ICA. Generally, complaints against such “grandfathered” rates may only be pursued if the complainant can show that a substantial change has occurred since the enactment of EPACT in either the economic circumstances of the petroleum pipeline, or in the nature of the services provided, that were a basis for the rate. EPACT places no such limit on challenges to a provision of a petroleum pipeline tariff as unduly discriminatory or preferential.
Intrastate NGL Pipeline Regulation
Intrastate NGL and other petroleum pipelines are not generally subject to rate regulation by FERC, but they are subject to regulation by various agencies in the respective states where they are located. While the regulatory regime varies from state to state, state agencies typically require intrastate petroleum pipelines to file their rates with the agencies and permit shippers to challenge existing rates or proposed rate increases.
Environmental Matters
General
Our operation of pipelines, plants and other facilities for gathering, transporting, processing or storing natural gas, propane, NGLs and other products is subject to stringent and complex federal, state and local laws and regulations governing the discharge of materials into the environment or otherwise relating to the protection of the environment.
As an owner or operator of these facilities, we must comply with these laws and regulations at the federal, state and local levels. These laws and regulations can restrict or impact our business activities in many ways, such as:
| • | requiring the acquisition of permits to conduct regulated activities; |
| • | restricting the way we can handle or dispose of our wastes; |
| • | limiting or prohibiting construction activities in sensitive areas such as wetlands, coastal regions or areas inhabited by endangered species; |
| • | requiring remedial action to mitigate pollution conditions caused by our operations or attributable to former operations; |
| • | enjoining the operations of facilities deemed in non-compliance with permits issued pursuant to such environmental laws and regulations; and |
| • | regulating changes to the operations of facilities deemed in non-compliance with permits issued pursuant to such environmental laws and regulations. |
Failure to comply with these laws and regulations may trigger a variety of administrative, civil and criminal enforcement measures, including the assessment of monetary penalties, the imposition of remedial requirements and the issuance of orders enjoining future operations. Certain environmental statutes impose strict joint and several liability for costs required to clean up and restore sites where hazardous substances have been disposed or otherwise released. Moreover, it is not uncommon for neighboring landowners and other third parties to file claims for personal injury and property damage allegedly caused by the release of substances or other waste products into the environment.
23
Table of Contents
The trend in environmental regulation is to place more restrictions and limitations on activities that may affect the environment. Thus, there can be no assurance as to the amount or timing of future expenditures for environmental compliance or remediation, and actual future expenditures may be different from the amounts we currently anticipate. We try to anticipate future regulatory requirements that might be imposed and plan accordingly to remain in compliance with changing environmental laws and regulations and to minimize the costs of such compliance. For instance, we or the entities in which we own an interest inspect the pipelines regularly using equipment rented from third party suppliers. Third parties also assist us in interpreting the results of the inspections. We also actively participate in industry groups that help formulate recommendations for addressing existing or future regulations.
We do not believe that compliance with federal, state or local environmental laws and regulations will have a material adverse effect on our business, financial position or results of operations. Below is a discussion of the more significant environmental laws and regulations that relate to our business and with which compliance may have a material adverse effect on our capital expenditures, earnings or competitive position.
Air Emissions, Global Warming and Climate Change
Our operations are subject to the federal Clean Air Act, as amended and comparable state laws and regulations. These laws and regulations regulate emissions of air pollutants from various industrial sources, including our processing plants and compressor stations, and also impose various monitoring and reporting requirements. Such laws and regulations may require that we obtain pre-approval for the construction or modification of certain projects or facilities expected to produce or significantly increase air emissions, obtain and strictly comply with air permits containing various emissions and operational limitations, and utilize specific emission control technologies to limit emissions. In response to studies suggesting that emissions of carbon dioxide and certain other gases often referred to as “greenhouse gases,” or GHGs, may be contributing to warming of the Earth’s atmosphere, the U.S. Congress continues to consider climate change-related legislation to regulate GHG emissions. In addition, at least one-third of the states have already taken legal measures to reduce emissions of GHGs, primarily through the planned development of GHG emission inventories and/or regional GHG cap and trade programs. Depending on the particular program or jurisdiction, we could be required to purchase and surrender allowances, either for GHG emissions resulting from our operations (e.g., compressor units) or from combustion of fuels (e.g., oil or natural gas) we process. Also, after the U.S. Supreme Court’s decision on April 2, 2007 in Massachusetts, et al. v. EPA, the EPA has declared that GHGs “endanger” public health and welfare, and has taken steps to regulate GHG emissions from mobile sources such as cars and trucks and to require reporting of GHG emissions from stationary sources, even if Congress does not adopt new legislation specifically addressing emissions of GHGs. In May 2010, the EPA issued a final rule to address carbon dioxide and other GHG emissions from vehicles and automobile fuels. According to the EPA, this final action on the GHG vehicle emission rule also triggers regulation of carbon dioxide and other GHG emissions from stationary sources under various Clean Air Act programs at both the federal and state levels such as the Prevention of Significant Deterioration, or PSD, program and Title V permitting, and the EPA has declared that these new requirements for stationary sources are effective starting January 2, 2011. In part, these programs could require our facilities to meet “best available control technology” standards for greenhouse gases, which may be established by state authorities or the EPA on a case-by-case basis. In November 2010, the EPA issued guidance materials on defining best available control technology for greenhouse gases. Litigation challenging the EPA’s endangerment finding and its related regulatory enactments is pending before the DC Circuit, although no decision is expected until late 2011. These EPA regulations as well as other possible new federal or state laws or regulations imposing more stringent air quality standards for hazardous air pollutants or ambient air quality standards or requiring adoption of stringent GHG reporting and control programs or imposing restrictions on emissions of carbon dioxide in areas of the United States in which we conduct business could adversely affect our cost of doing business and demand for the oil and gas we transport. Our failure to comply with these requirements could subject us to monetary penalties, injunctions, conditions or restrictions on operations, and potentially criminal enforcement actions. We may be required to incur certain capital expenditures in the future for air pollution control equipment in connection with obtaining and maintaining operating permits and approvals for air emissions.
24
Table of Contents
In addition to the effects of regulation, the meteorological effects of global climate change could pose additional risks to our operations, including physical damage risks associated with more frequent, more intense storms and flooding, and could adversely affect the demand for our products.
Hazardous Substances and Waste
Our operations are subject to environmental laws and regulations relating to the management and release of hazardous substances or solid wastes, including petroleum hydrocarbons. These laws generally regulate the generation, storage, treatment, transportation and disposal of solid and hazardous waste, and may impose strict, joint and several liability for the investigation and remediation of areas at a facility where hazardous substances may have been released or disposed. For instance, the Comprehensive Environmental Response, Compensation, and Liability Act, as amended, or CERCLA, also known as the Superfund law, and comparable state laws impose liability, without regard to fault or the legality of the original conduct, on certain classes of persons that contributed to the release of a hazardous substance into the environment. These persons include current and prior owners or operators of the site where the release occurred and companies that disposed or arranged for the disposal of the hazardous substances found at the site. Under CERCLA, these persons may be subject to joint and several strict liability for the costs of cleaning up the hazardous substances that have been released into the environment, for damages to natural resources and for the costs of certain health studies. CERCLA also authorizes the EPA and, in some instances, third parties to act in response to threats to the public health or the environment and to seek to recover from the responsible classes of persons the costs they incur. Despite the “petroleum exclusion” of CERCLA Section 101(14) that currently encompasses natural gas, we may nonetheless handle hazardous substances within the meaning of CERCLA, or similar state statutes, in the course of our ordinary operations and, as a result, may be jointly and severally liable under CERCLA for all or part of the costs required to clean up sites at which these hazardous substances have been released into the environment.
We also generate solid wastes, including hazardous wastes that are subject to the requirements of the Resource Conservation and Recovery Act, as amended, or RCRA, and comparable state statutes. While RCRA regulates both solid and hazardous wastes, it imposes strict requirements on the generation, storage, treatment, transportation and disposal of hazardous wastes. Certain petroleum production wastes are excluded from RCRA’s hazardous waste regulations. However, it is possible that these wastes, which could include wastes currently generated during our operations, will in the future be designated as hazardous wastes and therefore be subject to more rigorous and costly disposal requirements. Any such changes in the laws and regulations could have a material adverse effect on our maintenance capital expenditures and operating expenses.
We currently own or lease properties where petroleum hydrocarbons are being or have been handled for many years. Although we have utilized operating and disposal practices that were standard in the industry at the time, petroleum hydrocarbons or other wastes may have been disposed of or released on or under the properties owned or leased by us or on or under the other locations where these petroleum hydrocarbons and wastes have been taken for treatment or disposal. In addition, certain of these properties have been operated by third parties whose treatment and disposal or release of petroleum hydrocarbons or other wastes was not under our control. These properties and wastes disposed thereon may be subject to CERCLA, RCRA and analogous state laws. Under these laws, we could be required to remove or remediate previously disposed wastes (including wastes disposed of or released by prior owners or operators), to clean up contaminated property (including contaminated groundwater) or to perform remedial operations to prevent future contamination. We are not currently aware of any facts, events or conditions relating to the application of such requirements that could reasonably have a material impact on our operations or financial condition.
Water
The Federal Water Pollution Control Act of 1972, as amended, also referred to as the Clean Water Act, or CWA, and analogous state laws impose restrictions and strict controls regarding the discharge of pollutants into navigable waters. Pursuant to the CWA and analogous state laws, permits must be obtained to discharge pollutants into state and federal waters. The CWA also requires implementation of spill prevention, control and countermeasure plans, also referred to as “SPCC plans,” in connection with on-site storage of threshold quantities of oil. The CWA imposes substantial potential civil and criminal penalties for non-compliance. State
25
Table of Contents
laws for the control of water pollution also provide varying civil and criminal penalties and liabilities. In addition, some states maintain groundwater protection programs that require permits for discharges or operations that may impact groundwater conditions. The EPA has promulgated regulations that require us to have permits in order to discharge certain storm water. The EPA has entered into agreements with certain states in which we operate whereby the permits are issued and administered by the respective states. These permits may require us to monitor and sample the storm water discharges. We believe that compliance with existing permits and compliance with foreseeable new permit requirements will not have a material adverse effect on our financial condition or results of operations.
The Oil Pollution Act of 1990 (“OPA”) addresses prevention, containment and cleanup, and liability associated with oil pollution. OPA applies to vessels, offshore platforms, and onshore facilities, including terminals, pipelines, and transfer facilities. OPA subjects owners of such facilities to strict liability for containment and removal costs, natural resource damages, and certain other consequences of oil spills into jurisdictional waters. Any unpermitted release of petroleum or other pollutants from our operations could result in government penalties and civil liability.
Anti-Terrorism Measures
The federal Department of Homeland Security regulates the security of chemical and industrial facilities pursuant to regulations known as the Chemical Facility Anti-Terrorism Standards. These regulations apply to oil and gas facilities, among others, that are deemed to present “high levels of security risk.” Pursuant to these regulations, certain of our facilities are required to comply with certain regulatory requirements, including those regarding inspections, audits, recordkeeping, and protection of chemical-terrorism vulnerability information.
Employees
Our operations and activities are managed by our general partner, DCP Midstream GP, LP, which in turn is managed by its general partner, DCP Midstream GP, LLC, or the General Partner, which is wholly-owned by DCP Midstream, LLC. As of December 31, 2010, the General Partner or its affiliates employed 7 people directly and approximately 297 people who provided direct support for our operations through DCP Midstream, LLC.
General
We make certain filings with the Securities and Exchange Commission, or SEC, including our annual report on Form 10-K, quarterly reports on Form 10-Q, current reports on Form 8-K, and all amendments and exhibits to those reports, which are available free of charge through our website, www.dcppartners.com, as soon as reasonably practicable after they are filed with the SEC. The filings are also available through the SEC at the SEC’s Public Reference Room at 100 F Street, N.E., Washington, D.C. 20549 or by calling 1-800-SEC-0330. Also, these filings are available on the internet at www.sec.gov. Our annual reports to unitholders, press releases and recent analyst presentations are also available on our website.
26
Table of Contents
| Item 1A. | Risk Factors |
Limited partner interests are inherently different from capital stock of a corporation, although many of the business risks to which we are subject are similar to those that would be faced by a corporation engaged in similar businesses. You should consider carefully the following risk factors together with all of the other information included in this annual report in evaluating an investment in our common units.
If any of the following risks were actually to occur, our business, financial condition or results of operations could be materially affected. In that case, we might not be able to pay the minimum quarterly distribution on our common units, the trading price of our common units could decline and you could lose all or part of your investment.
Risks Related to Our Business
We may not have sufficient cash from operations following the establishment of cash reserves and payment of fees and expenses, including cost reimbursements to our general partner, to enable us to continue to make cash distributions to holders of our common units at our current distribution rate.
The amount of cash we can distribute on our units principally depends upon the amount of cash we generate from our operations, which will fluctuate from quarter to quarter based on, among other things:
| • | the fees we charge and the margins we realize for our services; |
| • | the prices of, level of production of, and demand for, natural gas, propane, condensate and NGLs; |
| • | the success of our commodity derivative and interest rate hedging programs in mitigating fluctuations in commodity prices and interest rates; |
| • | the volume and quality of natural gas we gather, treat, compress, process, transport and sell, the volume of propane and NGLs we transport and sell, and the volumes of propane we store; |
| • | the relationship between natural gas, NGL and crude oil prices; |
| • | the level of competition from other energy companies; |
| • | the impact of weather conditions on the demand for natural gas and propane; |
| • | the level of our operating and maintenance and general and administrative costs; and |
| • | prevailing economic conditions. |
In addition, the actual amount of cash we will have available for distribution will depend on other factors, some of which are beyond our control, including:
| • | the level of capital expenditures we make; |
| • | the cost and form of payment for acquisitions; |
| • | our debt service requirements and other liabilities; |
| • | fluctuations in our working capital needs; |
| • | our ability to borrow funds and access capital markets at reasonable rates; |
| • | restrictions contained in our debt agreements; |
| • | the amount of cash distributions we receive from our equity interests; |
| • | the amount of cash reserves established by our general partner; and |
| • | new, additions to and changes in laws and regulations. |
27
Table of Contents
We have partial ownership interests in certain joint venture legal entities, including Discovery, East Texas and Southeast Texas, which could adversely affect our ability to operate and control these entities. In addition, we may be unable to control the amount of cash we will receive from the operation of these entities and we could be required to contribute significant cash to fund our share of their operations, which could adversely affect our ability to distribute cash to our unitholders.
Our inability, or limited ability, to control the operations and management of joint venture legal entities that we have a partial ownership interest in may mean that we will not receive the amount of cash we expect to be distributed to us. In addition, for entities where we have a minority ownership interest, we will be unable to control ongoing operational decisions, including the incurrence of capital expenditures that we may be required to fund. Specifically,
| • | we have limited ability to influence decisions with respect to the operations of these entities and their subsidiaries, including decisions with respect to incurrence of expenses and distributions to us; |
| • | these entities may establish reserves for working capital, capital projects, environmental matters and legal proceedings which would otherwise reduce cash available for distribution to us; |
| • | these entities may incur additional indebtedness, and principal and interest made on such indebtedness may reduce cash otherwise available for distribution to us; and |
| • | these entities may require us to make additional capital contributions to fund working capital and capital expenditures, our funding of which could reduce the amount of cash otherwise available for distribution. |
All of these items could significantly and adversely impact our ability to distribute cash to our unitholders.
The amount of cash we have available for distribution to holders of our common units depends primarily on our cash flow and not solely on profitability.
Profitability may be significantly affected by non-cash items. As a result, we may make cash distributions during periods when we record losses for financial accounting purposes and may not make cash distributions during periods when we record net earnings for financial accounting purposes.
Because of the natural decline in production from existing wells, our success depends on our ability to obtain new sources of supplies of natural gas and NGLs.
Our gathering and transportation pipeline systems are connected to or dependent on the level of production from natural gas wells, from which production will naturally decline over time. As a result, our cash flows associated with these wells will also decline over time. In order to maintain or increase throughput levels on our gathering and transportation pipeline systems and NGL pipelines and the asset utilization rates at our natural gas processing plants, we must continually obtain new supplies. The primary factors affecting our ability to obtain new supplies of natural gas and NGLs, and to attract new customers to our assets include the level of successful drilling activity near these assets, the demand for natural gas and crude oil, producers’ desire and ability to obtain necessary permits in an efficient manner, natural gas field characteristics and production performance, surface access and infrastructure issues, and our ability to compete for volumes from successful new wells. If we are not able to obtain new supplies of natural gas to replace the natural decline in volumes from existing wells or because of competition, throughput on our pipelines and the utilization rates of our treating and processing facilities would decline, which could have a material adverse effect on our business, results of operations, financial position and cash flows, and our ability to make cash distributions.
Current economic conditions may adversely affect natural gas and NGL producers’ drilling activity and transportation spending levels, which may in turn negatively impact our volumes and results of operations and our ability to make distributions to our unitholders.
The level of drilling activity is dependent on economic and business factors beyond our control. Among the factors that impact drilling decisions are commodity prices, the liquids content of the natural gas production, drilling requirements for producers to hold leases, the cost of finding and producing natural gas and the general condition of the credit and financial markets. Natural gas prices are lower in recent periods when compared to historical periods. For example, the twelve-month average New York Mercantile Exchange, or NYMEX, price
28
Table of Contents
of natural gas futures contracts per MMBtu was $4.55, $5.87 and $6.21 as of December 31, 2010, 2009 and 2008 respectively. The twelve-month average price per gallon for NGLs was $1.10, $0.80 and $1.36 as of December 31, 2010, 2009 and 2008, respectively and the price of crude oil per barrel was $79.53, $61.81 and $99.67 as of December 31, 2010, 2009 and 2008, respectively. These relatively higher prices for crude oil and NGLs in 2010 compared to 2009, and compared to natural gas prices, have resulted in increased drilling in liquids rich areas during the recent period of lower natural gas prices, and conversely a decrease in drilling activity in regions with low liquid content.
Furthermore a sustained decline in commodity prices could result in a decrease in exploration and development activities in the fields served by our gathering and pipeline transportation systems and our natural gas treating and processing plants, and our NGL and natural gas storage assets, which could lead to reduced utilization of these assets. During periods of natural gas price decline or if the price of NGLs and crude oil declines the level of drilling activity could decrease. When combined with a reduction of cash flow resulting from lower commodity prices, a reduction in our producers’ borrowing base under reserve-based credit facilities and lack of availability of debt or equity financing for our producers may result in a significant reduction in our producers’ spending for natural gas drilling activity, which could result in lower volumes being transported on our pipeline systems. Other factors that impact production decisions include the ability of producers to obtain necessary drilling and other governmental permits and regulatory changes. Because of these factors, even if new natural gas reserves are discovered in areas served by our assets, producers may choose not to develop those reserves. If we are not able to obtain new supplies of natural gas to replace the declines resulting from reductions in drilling activity, throughput on our pipelines and the utilization rates of our treating and processing facilities would decline, which could have a material adverse effect on our business, results of operations, financial position and cash flows and our ability to make cash distributions.
The cash flow from our Natural Gas Services segment is affected by natural gas, NGL and condensate prices.
Our Natural Gas Services segment is affected by the level of natural gas, NGL and condensate prices. NGL and condensate prices generally fluctuate on a basis that relates to fluctuations in crude oil prices. In the past, the prices of natural gas and crude oil have been volatile, and we expect this volatility to continue. The markets and prices for natural gas, NGLs, condensate and crude oil depend upon factors beyond our control and may not always have a close relationship. These factors include supply of and demand for these commodities, which fluctuate with changes in market and economic conditions and other factors, including:
| • | the impact of weather, including abnormally mild winter or summer weather that cause lower energy usage for heating or cooling purposes, respectively, or extreme weather that may disrupt our operations or related downstream operations; |
| • | the level of domestic and offshore production; |
| • | a general downturn in economic conditions, including demand for NGLs; |
| • | the availability of imported natural gas, NGLs and crude oil and the demand in the U.S. and globally for these commodities; |
| • | actions taken by foreign oil and gas producing nations; |
| • | the availability of local, intrastate and interstate transportation systems; |
| • | the availability and marketing of competitive fuels; |
| • | the extent of governmental regulation and taxation. |
Our primary natural gas gathering and processing arrangements that expose us to commodity price risk are our percent-of-proceeds arrangements. Under percent-of-proceeds arrangements, we generally purchase natural gas from producers for an agreed percentage of the proceeds from the sale of residue gas and NGLs resulting from our processing activities, and then sell the resulting residue gas and NGLs at market prices. Under these types of arrangements, our revenues and our cash flows increase or decrease, whichever is applicable, as the price of natural gas and NGLs fluctuate. We have mitigated a portion of our share of anticipated natural gas, NGL and condensate commodity price risk associated with the equity volumes from our gathering and processing operations through 2015 with derivative instruments.
29
Table of Contents
Our derivative activities and the application of fair value measurements may have a material adverse effect on our earnings, profitability, cash flows, liquidity and financial condition.
We are exposed to risks associated with fluctuations in commodity prices. The extent of our commodity price risk is related largely to the effectiveness and scope of our derivative activities. For example, the derivative instruments we utilize are based on posted market prices, which may differ significantly from the actual natural gas, NGL and condensate prices that we realize in our operations. To mitigate a portion of our cash flow exposure to fluctuations in the price of NGLs, we have primarily entered into derivative financial instruments relating to the future price of crude oil. If the price relationship between NGLs and crude oil declines, our commodity price risk will increase. Furthermore, we have entered into derivative transactions related to only a portion of the volume of our expected natural gas supply and production of NGLs and condensate from our processing plants; as a result, we will continue to have direct commodity price risk to the open portion. Our actual future production may be significantly higher or lower than we estimate at the time we entered into the derivative transactions for that period. If the actual amount is higher than we estimate, we will have greater commodity price risk than we intended. If the actual amount is lower than the amount that is subject to our derivative financial instruments, we might be forced to satisfy all or a portion of our derivative transactions without the benefit of the cash flow from our sale of the underlying physical commodity, reducing our liquidity.
We have mitigated a portion of our expected natural gas, NGL and condensate commodity price risk relating to the equity volumes from our gathering and processing operations through 2015 by entering into fixed price derivative financial instruments. Additionally, we have entered into interest rate swap agreements to convert a portion of the variable rate revolving debt under our 5-year credit agreement that matures in June 2012, or the Credit Agreement, to a fixed rate obligation, thereby reducing the exposure to market rate fluctuations. The intent of these arrangements is to reduce the volatility in our cash flows resulting from fluctuations in commodity prices and interest rates.
We record all of our derivative financial instruments at fair value on our balance sheets primarily using information readily observable within the marketplace. In situations where market observable information is not available, we may use a variety of data points that are market observable, or in certain instances, develop our own expectation of fair value. We will continue to use market observable information as the basis for our fair value calculations, however, there is no assurance that such information will continue to be available in the future. In such instances we may be required to exercise a higher level of judgment in developing our own expectation of fair value, which may be significantly different from the historical fair values, and may increase the volatility of our earnings.
We will continue to evaluate whether to enter into any new derivative arrangements, but there can be no assurance that we will enter into any new derivative arrangement or that our future derivative arrangements will be on terms similar to our existing derivative arrangements. Although we enter into derivative instruments to mitigate a portion of our commodity price and interest rate risk, we also forego the benefits we would otherwise experience if commodity prices or interest rates were to change in our favor.
The counterparties to our derivative instruments may require us to post collateral in the event that our potential payment exposure exceeds a predetermined collateral threshold. Depending on the movement in commodity prices, the amount of collateral posted may increase, reducing our liquidity.
As a result of these factors, our derivative activities may not be as effective as we intend in reducing the volatility of our cash flows, and in certain circumstances may actually increase the volatility of our earnings and cash flows. In addition, even though our management monitors our derivative activities, these activities can result in material losses. Such losses could occur under various circumstances, including if a counterparty does not or is unable to perform its obligations under the applicable derivative arrangement, the derivative arrangement is imperfect or ineffective, or our risk management policies and procedures are not properly followed or do not work as planned.
30
Table of Contents
Volumes of natural gas dedicated to our systems in the future may be less than we anticipate.
As a result of the unwillingness of producers to provide reserve information as well as the cost of such evaluation, we do not have independent estimates of total reserves dedicated to our systems or the anticipated life of such reserves. If the reserves connected to our gathering systems are less than we anticipate and we are unable to secure additional sources of natural gas, then the volumes of natural gas on our systems in the future could be less than we anticipate.
We depend on certain natural gas producer customers for a significant portion of our supply of natural gas and NGLs.
We identify as primary natural gas suppliers those suppliers individually representing 10% or more of our total natural gas supply. Our one primary supplier of natural gas represented approximately 14% of the natural gas supplied in our Natural Gas Services segment during the year ended December 31, 2010. In our NGL Logistics segment, our largest NGL supplier is DCP Midstream, LLC, who obtains NGLs from various third party producer customers. While some of these customers are subject to long-term contracts, we may be unable to negotiate extensions or replacements of these contracts on favorable terms, if at all. The loss of all or even a portion of the natural gas and NGL volumes supplied by these customers, as a result of competition or otherwise, could have a material adverse effect on our business.
If we are not able to purchase propane from our principal suppliers, or we are unable to secure transportation under our transportation arrangements, our results of operations in our wholesale propane logistics business would be adversely affected.
Most of our propane purchases are made under supply contracts that have a term of between one to five years and provide various pricing formulas. We identify primary suppliers as those individually representing 10% or more of our total propane supply. Our four primary suppliers of propane, two of which are affiliated entities, represented approximately 91% of our propane supplied during the year ended December 31, 2010. A portion of our suppliers’ propane is sourced by them internationally. If current unrest in North Africa should expand further into countries where our propane supply originates, it could result in supply disruptions. In the event that we are unable to purchase propane from our significant suppliers due to their failure to perform under contractual obligations or otherwise, replace terminated or expired supply contracts, or if there are domestic or international supply disruptions, our failure to obtain alternate sources of supply at competitive prices and on a timely basis would affect our ability to satisfy customer demand, reduce our revenues and adversely affect our results of operations. In addition, if we are unable to transport propane supply to our terminals under our rail commitments, our ability to satisfy customer demand and our revenue and results of operations would be adversely affected.
The recent adoption of financial reform legislation by the United States Congress could have an adverse effect on our ability to use derivative instruments to hedge risks associated with our business.
We hedge both our commodity risk and our interest rate risk. The United States Congress recently adopted comprehensive financial reform legislation that establishes federal oversight and regulation of the over-the-counter derivatives market and entities, including businesses like ours, that participate in that market. The new legislation, known as the Dodd-Frank Wall Street Reform and Consumer Protection Act, or Act, was signed into law by the President on July 21, 2010, and requires the CFTC and the SEC to promulgate rules and regulations implementing the new legislation within 360 days from the date of enactment. In its rulemaking under the Act, the CFTC has proposed regulations to set position limits for certain futures and option contracts in the major energy markets and for swaps that are their economic equivalents. Although certain bona fide hedging transactions or positions would be exempt from these position limits, it is not possible at this time to predict what impact these regulations will have on our hedging program or when the CFTC will finalize these regulations. The Act may also require us to comply with margin requirements and with certain clearing and trade-execution requirements in connection with our derivatives activities, although the application of those provisions to us is uncertain at this time. The Act may also require the counterparties to our derivative instruments to spin off some of their derivatives activities to a separate entity, which may not be as creditworthy as the current counterparty. The new legislation and any new regulations could significantly
31
Table of Contents
increase the cost of derivatives contracts (including through requirements to post collateral which could adversely affect our available liquidity), materially alter the terms of derivatives contracts, reduce the availability of derivatives to protect against risks we encounter, reduce our ability to monetize or restructure our existing derivatives contracts, and increase our exposure to less creditworthy counterparties. If we reduce our use of derivatives as a result of the legislation and regulations, our results of operations may become more volatile and our cash flows may be less predictable, which could adversely affect our ability to plan for and fund capital expenditures and fund unitholder distributions. Finally, the legislation was intended, in part, to reduce the volatility of oil and natural gas prices, which some legislators attributed to speculative trading in derivatives and commodity instruments related to oil and natural gas. Our revenues could therefore be adversely affected if a consequence of the legislation and regulations is to lower commodity prices. Any of these consequences could have a material adverse effect on our business, our financial condition, and our results of operations.
We may not be able to grow or effectively manage our growth.
A principal focus of our strategy is to continue to grow the per unit distribution on our units by expanding our business. Our future growth will depend upon a number of factors, some of which we can control and some of which we cannot. These factors include our ability to:
| • | identify businesses engaged in managing, operating or owning pipelines, processing and storage assets or other midstream assets for acquisitions, joint ventures and construction projects; |
| • | consummate accretive acquisitions or joint ventures and complete construction projects; |
| • | appropriately identify liabilities associated with acquired businesses or assets; |
| • | integrate acquired or constructed businesses or assets successfully with our existing operations and into our operating and financial systems and controls; |
| • | hire, train and retain qualified personnel to manage and operate our growing business; and |
| • | obtain required financing for our existing and new operations at reasonable rates. |
A deficiency in any of these factors could adversely affect our ability to achieve growth in the level of our cash flows or realize benefits from acquisitions, joint ventures or construction projects. In addition, competition from other buyers could reduce our acquisition opportunities. DCP Midstream, LLC and its affiliates are not restricted from competing with us. DCP Midstream, LLC and its affiliates may acquire, construct or dispose of midstream or other assets in the future without any obligation to offer us the opportunity to purchase or construct those assets.
Furthermore, we have recently grown significantly through a number of acquisitions. If we fail to properly integrate these acquired assets successfully with our existing operations, if the future performance of these acquired assets does not meet our expectations, or we did not identify significant liabilities associated with the acquired assets, the anticipated benefits from these acquisitions may not be fully realized.
We may not successfully balance our purchases and sales of natural gas and propane.
We purchase from producers and other customers a substantial amount of the natural gas that flows through our natural gas gathering, processing and transportation systems for resale to third parties, including natural gas marketers and end-users. In addition, in our wholesale propane logistics business, we purchase propane from a variety of sources and resell the propane to retail distributors. We may not be successful in balancing our purchases and sales. A producer or supplier could fail to deliver contracted volumes or deliver in excess of contracted volumes, or a purchaser could purchase less than contracted volumes. Any of these actions could cause our purchases and sales to be unbalanced. While we attempt to balance our purchases and sales, if our purchases and sales are unbalanced, we will face increased exposure to commodity price risks and could have increased volatility in our operating income and cash flows.
32
Table of Contents
Our NGL pipelines could be adversely affected by any decrease in NGL prices relative to the price of natural gas.
The profitability of our NGL pipelines is dependent on the level of production of NGLs from processing plants. When natural gas prices are high relative to NGL prices, it is less profitable to process natural gas because of the higher value of natural gas compared to the value of NGLs and because of the increased cost (principally that of natural gas as a feedstock and fuel) of separating the NGLs from the natural gas. As a result, we may experience periods in which higher natural gas prices relative to NGL prices reduce the volume of natural gas processed at plants connected to our NGL pipelines, as well as reducing the amount of NGL extraction, which would reduce the volumes and gross margins attributable to our NGL pipelines.
Third party pipelines and other facilities interconnected to our natural gas and NGL pipelines and facilities may become unavailable to transport or produce natural gas and NGLs.
We depend upon third party pipelines and other facilities that provide delivery options to and from our pipelines and facilities for the benefit of our customers. Since we do not own or operate any of these third-party pipelines or other facilities, their continuing operation is not within our control.
Service at our propane terminals may be interrupted.
Historically, a substantial portion of the propane we purchase to support our wholesale propane logistics business is delivered at our rail terminals or by ship at our leased marine terminal in Providence, Rhode Island and at our owned marine terminal in Chesapeake, Virginia. We also rely on shipments of propane via the Buckeye Pipeline for our Midland Terminal and via TEPPCO Partners, LP’s pipeline to open access terminals. Any significant interruption in the service at these terminals would adversely affect our ability to obtain propane, which could reduce the amount of propane that we distribute and impact our revenues or cash available for distribution.
We operate in a highly competitive business environment.
We compete with similar enterprises in our respective areas of operation. Some of our competitors are large oil, natural gas and petrochemical companies that have greater financial resources and access to supplies of natural gas, propane and NGLs than we do. Some of these competitors may expand or construct gathering, processing and transportation systems that would create additional competition for the services we provide to our customers. Likewise, our customers who produce NGLs may develop their own systems to transport NGLs. Additionally, our wholesale propane distribution customers may develop their own sources of propane supply. Our ability to renew or replace existing contracts with our customers at rates sufficient to maintain current revenues and cash flows could be adversely affected by the activities of our competitors and our customers.
Our assets and operations can be affected by weather and other weather related conditions.
Our assets and operations can be adversely affected by hurricanes, floods, tornadoes, wind, lightning, cold weather and other natural phenomena, which could impact our results of operations and make it more difficult for us to realize historic rates of return. Although we carry insurance on the vast majority of our assets, insurance may be inadequate to cover our loss and in some instances, we have been unable to obtain insurance on commercially reasonable terms, if at all. If we incur a significant disruption in our operations or a significant liability for which we were not fully insured, our financial condition, results of operations and ability to make distributions to our unitholders could be materially adversely affected.
Weather conditions could also have an impact on the demand for wholesale propane because the end-users of propane depend on propane principally for heating purposes. As a result, warm weather conditions could adversely impact the demand for and prices of propane. Since our wholesale propane logistics business is located almost solely in the northeast, warmer than normal temperatures in the northeast can decrease the total volume of propane we sell. Such conditions may also cause downward pressure on the price of propane, which could result in a lower of cost or market adjustment to the value of our inventory.
33
Table of Contents
Competition from alternative energy sources, conservation efforts and energy efficiency and technological advances may reduce the demand for propane.
Competition from alternative energy sources, including natural gas and electricity, has been increasing as a result of reduced regulation of many utilities. In addition, propane competes with heating oil primarily in residential applications. Propane is generally not competitive with natural gas in areas where natural gas pipelines already exist because natural gas is a less expensive source of energy than propane. The gradual expansion of natural gas distribution systems and availability of natural gas in the northeast, which has historically depended upon propane, could reduce the demand for propane, which could adversely affect the volumes of propane that we distribute. In addition, stricter conservation measures in the future or technological advances in heating, energy generation or other devices could reduce the demand for propane.
A change in the jurisdictional characterization of some of our assets by federal, state or local regulatory agencies or a change in policy by those agencies may result in increased regulation of our assets.
The majority of our natural gas gathering and intrastate transportation operations are exempt from FERC regulation under the NGA but FERC regulation still affects these businesses and the markets for products derived from these businesses. FERC’s policies and practices across the range of its oil and natural gas regulatory activities, including, for example, its policies on open access transportation, ratemaking, capacity release and market center promotion, indirectly affect intrastate markets. In recent years, FERC has pursued pro-competitive policies in its regulation of interstate oil and natural gas pipelines. However, we cannot assure that FERC will continue this approach as it considers matters such as pipeline rates and rules and policies that may affect rights of access to oil and natural gas transportation capacity. In addition, the distinction between FERC-regulated transmission services and federally unregulated gathering services has been the subject of regular litigation, so the classification and regulation of some of our gathering facilities and intrastate transportation pipelines may be subject to change based on any reassessment by us of the jurisdictional status of our facilities or on future determinations by FERC and the courts.
In addition, the rates, terms and conditions of some of the transportation services we provide on our Pelico pipeline system and the EasTrans Limited Partnership or EasTrans pipeline system owned by East Texas, are subject to FERC regulation under Section 311 of the NGPA. Under Section 311, rates charged for transportation must be fair and equitable, and amounts collected in excess of fair and equitable rates are subject to refund with interest. The Pelico system is currently charging rates for its Section 311 transportation services that were deemed fair and equitable under a rate settlement approved by FERC. The EasTrans system is currently charging rates for its Section 311 transportation services that were deemed fair and equitable under an order approved by the Railroad Commission of Texas. The Black Lake pipeline system is an interstate transporter of NGLs and is subject to FERC jurisdiction under the Interstate Commerce Act and the Elkins Act.
Should we fail to comply with all applicable FERC-administered statutes, rules, regulations and orders, we could be subject to substantial penalties and fines. Under EPACT 2005, FERC has civil penalty authority under the NGA and the NGPA to impose penalties for current violations of up to $1.0 million per day for each violation and possible criminal penalties of up to $1.0 million per violation and five years in prison.
Other state and local regulations also affect our business. Our non-proprietary gathering lines are subject to ratable take and common purchaser statutes in Louisiana. Ratable take statutes generally require gatherers to take, without undue discrimination, oil or natural gas production that may be tendered to the gatherer for handling. Similarly, common purchaser statutes generally require gatherers to purchase without undue discrimination as to source of supply or producer. These statutes restrict our right as an owner of gathering facilities to decide with whom we contract to purchase or transport oil or natural gas. Federal law leaves any economic regulation of natural gas gathering to the states. The states in which we operate have adopted complaint-based regulation of oil and natural gas gathering activities, which allows oil and natural gas producers and shippers to file complaints with state regulators in an effort to resolve grievances relating to oil and natural gas gathering access and rate discrimination. Other state regulations may not directly regulate our business, but may nonetheless affect the availability of natural gas for purchase, processing and sale, including state regulation of production rates and maximum daily production allowable from gas wells. While our proprietary gathering lines are currently subject to limited state regulation, there is a risk that state laws will be changed, which may give producers a stronger basis to challenge proprietary status of a line, or the rates, terms and conditions of a gathering line providing transportation service.
34
Table of Contents
Discovery’s interstate tariff rates are subject to review and possible adjustment by federal regulators. Moreover, because Discovery is a non-corporate entity, it may be disadvantaged in calculating its cost-of-service for rate-making purposes.
FERC, pursuant to the NGA, regulates many aspects of Discovery’s interstate pipeline transportation service, including the rates that Discovery is permitted to charge for such service. Under the NGA, interstate transportation rates must be just and reasonable and not unduly discriminatory. If FERC fails to permit tariff rate increases requested by Discovery, or if FERC lowers the tariff rates Discovery is permitted to charge its customers, on its own initiative, or as a result of challenges raised by Discovery’s customers or third parties, Discovery’s tariff rates may be insufficient to recover the full cost of providing interstate transportation service. In certain circumstances, FERC also has the power to order refunds.
The Discovery interstate natural gas pipeline system filed with FERC on November 16, 2007 a rate case settlement with a January 1, 2008 effective date, reflecting an increase in its rates. Also, modifications were made to the imbalance resolution and fuel reimbursement sections of Discovery’s tariff. FERC approved the settlement on February 5, 2008 for all parties except ExxonMobil who contested the settlement. ExxonMobil will continue to pay Discovery’s previously approved rates.
Under current policy, FERC permits pipelines to include, in the cost-of-service used as the basis for calculating the pipeline’s regulated rates, a tax allowance reflecting the actual or potential income tax liability on public utility income attributable to all partnership or limited liability company interests, if the ultimate owner of the interest has an actual or potential income tax liability on such income. Whether a pipeline’s owners have such actual or potential income tax liability will be reviewed by FERC on a case-by-case basis. In a future rate case, Discovery may be required to demonstrate the extent to which inclusion of an income tax allowance in Discovery’s cost-of-service is permitted under the current income tax allowance policy.
Should we fail to comply with all applicable FERC-administered statutes, rules, regulations and orders, we could be subject to substantial penalties and fines. Under EPACT 2005 FERC has civil penalty authority under the NGA to impose penalties for current violations of up to $1.0 million per day for each violation and possible criminal penalties of up to $1.0 million per violation and five years in prison.
Recent spills and their aftermath could lead to additional governmental regulation of the offshore exploration and production industry, which may result in substantial cost increases or delays in our offshore natural gas gathering activities.
In April 2010, a deepwater exploration well located in the Gulf of Mexico, owned and operated by companies unrelated to us, sustained a blowout and subsequent explosion leading to the leaking of hydrocarbons. In response to this event, certain federal agencies and governmental officials ordered additional inspections of deepwater operations in the Gulf of Mexico. On May 28, 2010, a six-month federal moratorium was implemented on all offshore deepwater drilling projects. On October 12, 2010, the Department of the Interior announced it was lifting the deepwater drilling moratorium. Despite the fact that the drilling moratorium was lifted, this spill and its aftermath has led to additional governmental regulation of the offshore exploration and production industry and delays in the issuance of drilling permits, which may result in volume impacts, cost increases or delays in our offshore natural gas gathering activities, which could materially impact our business, financial condition and results of operations. We cannot predict with any certainty what form any additional regulation or limitations would take.
We may incur significant costs and liabilities in the future resulting from a failure to comply with new or existing environmental regulations or an accidental release of hazardous substances or hydrocarbons into the environment.
Our operations are subject to stringent and complex federal, state and local environmental laws and regulations. These include, for example, (1) the federal Clean Air Act and comparable state laws and regulations that impose obligations related to air emissions; (2) the federal Resource Conservation and Recovery Act, or RCRA, and comparable state laws that impose requirements for the discharge of waste from our facilities; and (3) the Comprehensive Environmental Response Compensation and Liability Act of 1980, or CERCLA, also known as “Superfund,” and comparable state laws that regulate the cleanup of hazardous
35
Table of Contents
substances that may have been released at properties currently or previously owned or operated by us or locations to which we have sent waste for disposal. Failure to comply with these laws and regulations or newly adopted laws or regulations may trigger a variety of administrative, civil and criminal enforcement measures, including the assessment of monetary penalties, the imposition of remedial requirements, and the issuance of orders enjoining future operations. Certain environmental regulations, including CERCLA and analogous state laws and regulations, impose strict, joint and several liability for costs required to clean up and restore sites where hazardous substances or hydrocarbons have been disposed or otherwise released. Moreover, it is not uncommon for neighboring landowners and other third parties to file claims for personal injury and property damage allegedly caused by the release of hazardous substances, hydrocarbons or other waste products into the environment.
There is inherent risk of the incurrence of environmental costs and liabilities in our business due to our handling of natural gas, NGLs and other petroleum products, air emissions related to our operations, and historical industry operations and waste disposal practices. For example, an accidental release from one of our facilities could subject us to substantial liabilities arising from environmental cleanup and restoration costs, claims made by neighboring landowners and other third parties for personal injury and property damage and governmental claims for natural resource damages or fines or penalties for related violations of environmental laws or regulations. In addition, it is possible that stricter laws, regulations or enforcement policies could significantly increase our compliance costs and the cost of any remediation that may become necessary. We may not be able to recover some or any of these costs from insurance or from indemnification from DCP Midstream, LLC.
We may incur significant costs in the future associated with proposed climate change legislation.
The United States Congress and some states where we have operations are currently considering legislation related to greenhouse gas emissions. In addition, there have recently been international conventions and efforts to establish standards for the reduction of greenhouse gases globally. The United States Congress will most likely consider a number of bills that would compel greenhouse gas emission reductions. Some of these proposals may include limitations, or caps, on the amount of greenhouse gas that can be emitted, as well as a system of emissions allowances. Legislation passed by the US House of Representatives in 2010 placed the entire burden of obtaining allowances for the carbon content of natural gas liquids, or NGLs, on the owners of NGLs at the point of fractionation. To the extent legislation is enacted that regulates greenhouse gas emissions, it could significantly increase our costs to (i) acquire allowances; (ii) operate and maintain our facilities; (iii) install new emission controls; and (iv) manage a greenhouse gas emissions program. If such legislation becomes law in the United States or any states in which we have operations and we are unable to pass these costs through as part of our services, it could have an adverse affect on our business and cash available for distributions.
We may incur significant costs and liabilities resulting from implementing and administering pipeline integrity programs and related repairs.
Pursuant to the Pipeline Safety Improvement Act of 2002, the DOT has adopted regulations requiring pipeline operators to develop integrity management programs for transportation pipelines located where a leak or rupture could do the most harm in “high consequence areas.” The regulations require operators to:
| • | perform ongoing assessments of pipeline integrity; |
| • | identify and characterize applicable threats to pipeline segments that could impact a high consequence area; |
| • | improve data collection, integration and analysis; |
| • | repair and remediate the pipeline as necessary; and |
| • | implement preventive and mitigating actions. |
Although many of our natural gas facilities fall within a class that is not subject to these requirements, we may incur significant costs and liabilities associated with repair, remediation, preventative or mitigation measures associated with non-exempt pipeline. Such costs and liabilities might relate to repair, remediation,
36
Table of Contents
preventative or mitigating actions that may be determined to be necessary as a result of the testing program, as well as lost cash flows resulting from shutting down our pipelines during the pendency of such repairs. Additionally, we may be affected by the testing, maintenance and repair of pipeline facilities downstream from our own facilities. Our NGL pipelines are also subject to integrity management and other safety regulations imposed by the Texas Railroad Commission, or TRRC.
We currently estimate that we will incur costs of up to $4.1 million between 2011 and 2015 to implement pipeline integrity management program testing along certain segments of our natural gas and NGL pipelines. This does not include the costs, if any, of any repair, remediation, preventative or mitigating actions that may be determined to be necessary as a result of the testing program, which costs could be substantial.
We currently transport NGLs produced at our processing plants on our owned and third party NGL pipelines. Accordingly, in the event that an owned or third party NGL pipeline becomes inoperable due to any necessary repairs resulting from integrity testing program or for any other reason for any significant period of time, we would need to transport NGLs by other means. There can be no assurance that we will be able to enter into alternative transportation arrangements under comparable terms.
Any regulatory expansion of the existing pipeline safety requirements or the adoption of new pipeline safety requirements could also increase our cost of operation and impair our ability to provide service during the period in which assessments and repairs take place, adversely affecting our business.
Construction of new assets is subject to regulatory, environmental, political, legal, economic and other risks that may adversely affect financial results.
The construction of additions or modifications to our existing midstream asset systems or propane terminals involves numerous regulatory, environmental, political and legal and economic uncertainties beyond our control and may require the expenditure of significant amounts of capital. These projects may not be completed on schedule or within budgeted cost, or at all. We may construct facilities to capture anticipated future growth in production in a region in which such growth does not materialize. Since we are not engaged in the exploration for and development of natural gas and oil reserves, we often do not have access to third party estimates of potential reserves in an area prior to constructing facilities in such area. To the extent we rely on estimates of future production in our decision to construct additions to our systems, such estimates may prove to be inaccurate because there are numerous uncertainties inherent in estimating quantities of future production. As a result, new facilities may not be able to attract enough throughput to achieve our expected investment return, which could adversely affect our results of operations and financial condition. The construction of additions to our existing gathering, transportation and propane terminal assets may require us to obtain new rights-of-way prior to constructing new facilities. We may be unable to obtain such rights-of-way to connect new natural gas supplies to our existing gathering lines, expand our network of propane terminals, or capitalize on other attractive expansion opportunities. The construction of additions to our existing gathering, transportation and propane terminal assets may require us to rely on third parties downstream of our facilities to have available capacity for our delivered natural gas, natural gas liquids, or propane. If such third party facilities are not constructed or operational at the time that the addition to our facilities is completed, we may experience adverse effects on our results of operations and financial condition. The construction of additional propane terminals may require greater capital investment if the commodity prices of certain supplies such as steel increase. Construction also subjects us to risks related to the ability to construct projects within anticipated costs, including the risk of cost overruns resulting from inflation or increased costs of equipment, materials, labor, or other factors beyond our control that could adversely affect results of operations, financial position or cash flows.
If we do not make acquisitions on economically acceptable terms, our future growth could be limited.
Our acquisition strategy is based, in part, on our expectation of ongoing divestitures of energy assets by industry participants. Our ability to make acquisitions that are accretive to our cash generated from operations per unit is based upon our ability to identify attractive acquisition candidates or negotiate acceptable purchase contracts with them and obtain financing for these acquisitions on economically acceptable terms. Furthermore, even if we do make acquisitions that we believe will be accretive, these acquisitions may nevertheless result in a decrease in the cash generated from operations per unit. Additionally, net assets contributed by DCP
37
Table of Contents
Midstream, LLC represent a transfer of net assets between entities under common control, and are recognized at DCP Midstream, LLC’s basis in the net assets transferred. The amount of the purchase price in excess of DCP Midstream, LLC’s basis in the net assets, if any, is recognized as a reduction to partners’ equity. The amount of the purchase price in deficit of DCP Midstream’s basis in the net assets, if any, is recognized as an increase to partners’ equity.
Any acquisition involves potential risks, including, among other things:
| • | mistaken assumptions about volumes, future contract terms with customers, revenues and costs, including synergies; |
| • | an inability to successfully integrate the businesses we acquire; |
| • | the assumption of unknown liabilities; |
| • | limitations on rights to indemnity from the seller; |
| • | mistaken assumptions about the overall costs of equity or debt; |
| • | the diversion of management’s and employees’ attention from other business concerns; |
| • | change in competitive landscape; |
| • | unforeseen difficulties operating in new product areas or new geographic areas; and |
| • | customer or key employee losses at the acquired businesses. |
If we consummate any future acquisitions, our capitalization and results of operations may change significantly, and unitholders will not have the opportunity to evaluate the economic, financial and other relevant information that we will consider in determining the application of these funds and other resources.
In addition, any limitations on our access to substantial new capital to finance strategic acquisitions will impair our ability to execute this component of our growth strategy. If the cost of such capital becomes too expensive, our ability to develop or acquire accretive assets will be limited. We may not be able to raise the necessary funds on satisfactory terms, if at all. The primary factors that influence our cost of capital include market conditions and offering or borrowing costs such as interest rates or underwriting discounts.
We do not own all of the land on which our pipelines, facilities and rail terminals are located, which may subject us to increased costs.
Upon contract lease renewal, we may be subject to more onerous terms and/or increased costs to retain necessary land use if we do not have valid rights of way or if such rights of way lapse or terminate. We obtain the rights to construct and operate our pipelines, surface sites and rail terminals on land owned by third parties and governmental agencies for a specific period of time.
Our business involves many hazards and operational risks, some of which may not be fully covered by insurance.
Our operations, and the operations of third parties are subject to many hazards inherent in the gathering, compressing, treating, processing, storage and transporting of natural gas, propane and NGLs, including:
| • | damage to pipelines, plants, terminals, storage facilities and related equipment and surrounding properties caused by hurricanes, tornadoes, floods, fires and other natural disasters and acts of terrorism; |
| • | inadvertent damage from construction, farm and utility equipment; |
| • | leaks of natural gas, propane, NGLs and other hydrocarbons from our pipelines, plants, terminals, or storage facilities, or losses of natural gas, propane or NGLs as a result of the malfunction of equipment or facilities; |
| • | contaminants in the pipeline system; |
| • | fires and explosions; and |
| • | other hazards that could also result in personal injury and loss of life, pollution and suspension of operations. |
38
Table of Contents
These risks could result in substantial losses due to personal injury and/or loss of life, severe damage to and destruction of property and equipment and pollution or other environmental damage and may result in curtailment or suspension of our related operations. We are not fully insured against all risks inherent to our business, including offshore wind. In accordance with typical industry practice, we do not have any property insurance on any of our underground pipeline systems that would cover damage to the pipelines. We are not insured against all environmental accidents that might occur, which may include toxic tort claims, other than those considered to be sudden and accidental. In some instances, certain insurance could become unavailable or available only for reduced amounts of coverage, or may become prohibitively expensive, and we may elect not to carry policy.
Volatility in the capital markets may adversely impact our liquidity.
The capital markets may experience volatility, which may lead to financial uncertainty. Our access to funds under the Credit Agreement is dependent on the ability of the lenders that are party to the Credit Agreement to meet their funding obligations. Those lenders may not be able to meet their funding commitments if they experience shortages of capital and liquidity. If lenders under the Credit Agreement were to fail to fund their share of the Credit Agreement, our available borrowings could be further reduced. In addition, our borrowing capacity may be further limited by the Credit Agreement’s financial covenant requirements.
A significant downturn in the economy could adversely affect our results of operations, financial position or cash flows. In the event that our results were negatively impacted, we could require additional borrowings. A deterioration of the capital markets could adversely affect our ability to access funds on reasonable terms in a timely manner.
Our debt levels may limit our flexibility in obtaining additional financing and in pursuing other business opportunities.
Our Credit Agreement consists of a revolving credit facility with capacity of $850.0 million, which matures on June 21, 2012. As of December 31, 2010, the outstanding balance on the revolving credit facility was $398.0 million resulting in unused revolver capacity of $419.9 million, of which approximately $265.0 million was available for general working capital purposes.
We continue to have the ability to incur additional debt, subject to limitations within our credit facility. Our level of debt could have important consequences to us, including the following:
| • | our ability to obtain additional financing, if necessary, for working capital, capital expenditures, acquisitions or other purposes may be impaired or such financing may not be available on favorable terms; |
| • | an increased amount of cash flow will be required to make interest payments on our debt; |
| • | our debt level will make us more vulnerable to competitive pressures or a downturn in our business or the economy generally; and |
| • | our debt level may limit our flexibility in responding to changing business and economic conditions. |
Our ability to obtain new debt funding or service our existing debt will depend upon, among other things, our future financial and operating performance, which will be affected by prevailing economic conditions and financial, business, regulatory and other factors. In addition, our ability to service debt under our revolving credit facility will depend on market interest rates. If our operating results are not sufficient to service our current or future indebtedness, we may take actions such as reducing distributions, reducing or delaying our business activities, acquisitions, investments or capital expenditures, selling assets, restructuring or refinancing our debt, or seeking additional equity capital. We may not be able to effect any of these actions on satisfactory terms, or at all.
39
Table of Contents
Restrictions in our credit facility may limit our ability to make distributions to unitholders and may limit our ability to capitalize on acquisitions and other business opportunities.
Our credit facility contains covenants limiting our ability to make distributions, incur indebtedness, grant liens, make acquisitions, investments or dispositions and engage in transactions with affiliates. Furthermore, our credit facility contains covenants requiring us to maintain a certain leverage ratio and certain other tests. Any subsequent replacement of our credit facility or any new indebtedness could have similar or greater restrictions. If our covenants are not met, whether as a result of reduced production levels of natural gas and NGLs as described above or otherwise, our financial condition, results of operations and ability to make distributions to our unitholders could be materially adversely affected.
Changes in interest rates may adversely impact our ability to issue additional equity or incur debt, as well as the ability of exploration and production companies to finance new drilling programs around our systems.
Interest rates on future credit facilities and debt offerings could be higher than current levels, causing our financing costs to increase. As with other yield-oriented securities, our unit price is impacted by the level of our cash distributions and implied distribution yield. The distribution yield is often used by investors to compare and rank related yield-oriented securities for investment decision-making purposes. Therefore, changes in interest rates, either positive or negative, may affect the yield requirements of investors who invest in our units, and a rising interest rate environment could impair our ability to issue additional equity to make acquisitions, or incur debt or for other purposes. Increased interest costs could also inhibit the financing of new capital drilling programs by exploration and production companies served by our systems.
We have a holding company structure in which our subsidiaries conduct our operations and own our operating assets.
The partnership is a holding company, and our subsidiaries conduct all of our operations and own all of our operating assets. We do not have significant assets other than equity in our subsidiaries and equity investees. As a result, our ability to make required payments on our notes depends on the performance of our subsidiaries and their ability to distribute funds to us. The ability of our subsidiaries to make distributions to us may be restricted by, among other things, credit instruments, applicable state business organization laws and other laws and regulations. If our subsidiaries are prevented from distributing funds to us, we may be unable to pay all the principal and interest on the notes when due.
Our outstanding notes are senior unsecured obligations of our operating subsidiary, DCP Midstream Operating, LP, or DCP Operating, and are not guaranteed by any of our subsidiaries. As a result, our notes are effectively junior to DCP Operating’s existing and future secured debt and to all debt and other liabilities of its subsidiaries.
Our 3.25% Senior Notes Due 2015, or our notes, are senior unsecured obligations of our indirect wholly-owned subsidiary, DCP Operating, and rank equally in right of payment with all of its other existing and future senior unsecured debt. All of our operating assets are owned by our subsidiaries, and none of these subsidiaries guarantee DCP Operating’s obligations with respect to the notes. Creditors of DCP Operating’s subsidiaries may have claims with respect to the assets of those subsidiaries that rank effectively senior to the notes. In the event of any distribution or payment of assets of such subsidiaries in any dissolution, winding up, liquidation, reorganization or bankruptcy proceeding, the claims of those creditors would be satisfied prior to making any such distribution or payment to DCP Operating in respect of its direct or indirect equity interests in such subsidiaries. Consequently, after satisfaction of the claims of such creditors, there may be little or no amounts left available to make payments in respect of our notes. As of December 31, 2010, DCP Operating’s subsidiaries had no debt for borrowed money owing to any unaffiliated third parties. However, such subsidiaries are not prohibited under the indenture governing the notes from incurring indebtedness in the future.
In addition, because our notes and our guarantee of our notes are unsecured, holders of any secured indebtedness of us would have claims with respect to the assets constituting collateral for such indebtedness that are senior to the claims of the holders of our notes. Currently, we do not have any secured indebtedness.
40
Table of Contents
Although the indenture governing our notes places some limitations on our ability to create liens securing debt, there are significant exceptions to these limitations that will allow us to secure significant amounts of indebtedness without equally and ratably securing the notes. If we incur secured indebtedness and such indebtedness is either accelerated or becomes subject to a bankruptcy, liquidation or reorganization, our assets would be used to satisfy obligations with respect to the indebtedness secured thereby before any payment could be made on our notes. Consequently, any such secured indebtedness would effectively be senior to our notes and our guarantee of our notes, to the extent of the value of the collateral securing the secured indebtedness. In that event, noteholders may not be able to recover all the principal or interest due under our notes.
Our significant indebtedness and the restrictions in our debt agreements may adversely affect our future financial and operating flexibility.
As of December 31, 2010, our consolidated indebtedness was $647.8 million. Our significant indebtedness and the additional debt we may incur in the future for potential acquisitions may adversely affect our liquidity and therefore our ability to make interest payments on our notes.
Among other things, our significant indebtedness may be viewed negatively by credit rating agencies, which could result in increased costs for us to access the capital markets. Any future downgrade of the debt issued by us or our subsidiaries could significantly increase our capital costs or adversely affect our ability to raise capital in the future.
Debt service obligations and restrictive covenants in our credit facility and the indenture governing our notes may adversely affect our ability to finance future operations, pursue acquisitions and fund other capital needs as well as our ability to make cash distributions unitholders. In addition, this leverage may make our results of operations more susceptible to adverse economic or operating conditions by limiting our flexibility in planning for, or reacting to, changes in our business and the industry in which we operate and may place us at a competitive disadvantage as compared to our competitors that have less debt.
If we incur any additional indebtedness, including trade payables, that ranks equally with our notes, the holders of that debt will be entitled to share ratably with the holders of our notes in any proceeds distributed in connection with any insolvency, liquidation, reorganization, dissolution or other winding up of us or DCP Operating. This may have the effect of reducing the amount of proceeds paid to noteholders. If new debt is added to our current debt levels, the related risks that we now face could intensify.
Due to our lack of industry diversification, adverse developments in our midstream operations or operating areas would reduce our ability to make distributions to our unitholders.
We rely on the cash flow generated from our midstream energy businesses, and as a result, our financial condition depends upon prices of, and continued demand for, natural gas, propane, condensate and NGLs. Due to our lack of diversification in industry type, an adverse development in one of these businesses may have a significant impact on our company.
We are exposed to the credit risks of our key producer customers and propane purchasers, and any material nonpayment or nonperformance by our key producer customers or our propane purchasers could reduce our ability to make distributions to our unitholders.
We are subject to risks of loss resulting from nonpayment or nonperformance by our producer customers and propane purchasers. Any material nonpayment or nonperformance by our key producer customers or our propane purchasers could reduce our ability to make distributions to our unitholders. Furthermore, some of our producer customers or our propane purchasers may be highly leveraged and subject to their own operating and regulatory risks, which could increase the risk that they may default on their obligations to us.
Terrorist attacks, the threat of terrorist attacks, and sustained military campaigns may adversely impact our results of operations.
The long-term impact of terrorist attacks, such as the attacks that occurred on September 11, 2001 or the attacks in London, and the threat of future terrorist attacks on our industry in general, and on us in particular, is not known at this time. Increased security measures taken by us as a precaution against possible terrorist attacks
41
Table of Contents
have resulted in increased costs to our business. Uncertainty surrounding continued hostilities in the Middle East or other sustained military campaigns may affect our operations in unpredictable ways, including disruptions of crude oil supplies, propane shipments or storage facilities, and markets for refined products, and the possibility that infrastructure facilities could be direct targets of, or indirect casualties of, an act of terror.
Recent acquisitions may not be beneficial to us.
Acquisitions involve numerous risks, including:
| • | the failure to realize expected profitability, growth or accretion; |
| • | an increase in indebtedness and borrowing costs; |
| • | potential environmental or regulatory compliance matters or liabilities; |
| • | potential title issues; |
| • | the incurrence of unanticipated liabilities and costs; and |
| • | the temporary diversion of management’s attention from managing the remainder of our assets to the process of integrating the acquired businesses. |
The assets recently acquired will also be subject to many of the same risks as our existing assets. If any of these risks or unanticipated liabilities or costs were to materialize, any desired benefits of these acquisitions may not be fully realized, if at all, and our future financial performance and results of operations could be negatively impacted.
Risks Inherent in an Investment in Our Common Units
Conflicts of interest may exist between individual unitholders and DCP Midstream, LLC, our general partner, which has sole responsibility for conducting our business and managing our operations.
DCP Midstream, LLC owns and controls our general partner. Some of our general partner’s directors, and some of its executive officers, are directors or officers of DCP Midstream, LLC or its parents. Therefore, conflicts of interest may arise between DCP Midstream, LLC and its affiliates and our unitholders. In resolving these conflicts of interest, our general partner may favor its own interests and the interests of its affiliates over the interests of our unitholders. These conflicts include, among others, the following situations:
| • | neither our partnership agreement nor any other agreement requires DCP Midstream, LLC to pursue a business strategy that favors us. DCP Midstream, LLC’s directors and officers have a fiduciary duty to make these decisions in the best interests of the owners of DCP Midstream, LLC, which may be contrary to our interests; |
| • | our general partner is allowed to take into account the interests of parties other than us, such as DCP Midstream, LLC and its affiliates, in resolving conflicts of interest; |
| • | DCP Midstream, LLC and its affiliates, including Spectra Energy and ConocoPhillips, are not limited in their ability to compete with us. Please read “DCP Midstream, LLC and its affiliates are not limited in their ability to compete with us” below; |
| • | once certain requirements are met, our general partner may make a determination to receive a quantity of our Class B units in exchange for resetting the target distribution levels related to its incentive distribution rights without the approval of the special committee of our general partner or our unitholders; |
| • | some officers of DCP Midstream, LLC who provide services to us also will devote significant time to the business of DCP Midstream, LLC, and will be compensated by DCP Midstream, LLC for the services rendered to it; |
| • | our general partner has limited its liability and reduced its fiduciary duties, and has also restricted the remedies available to our unitholders for actions that, without the limitations, might constitute breaches of fiduciary duty; |
42
Table of Contents
| • | our general partner determines the amount and timing of asset purchases and sales, borrowings, issuance of additional partnership securities and reserves, each of which can affect the amount of cash that is distributed to unitholders; |
| • | our general partner determines the amount and timing of any capital expenditures and whether a capital expenditure is a maintenance capital expenditure, which reduces operating surplus, or an expansion capital expenditure, which does not reduce operating surplus. This determination can affect the amount of cash that is distributed to our unitholders; |
| • | our general partner determines which costs incurred by it and its affiliates are reimbursable by us; |
| • | our partnership agreement does not restrict our general partner from causing us to pay it or its affiliates for any services rendered to us or entering into additional contractual arrangements with any of these entities on our behalf; |
| • | our general partner intends to limit its liability regarding our contractual and other obligations and, in some circumstances, is entitled to be indemnified by us; |
| • | our general partner may exercise its limited right to call and purchase common units if it and its affiliates own more than 80% of the common units; |
| • | our general partner controls the enforcement of obligations owed to us by our general partner and its affiliates; and |
| • | our general partner decides whether to retain separate counsel, accountants or others to perform services for us. |
DCP Midstream, LLC and its affiliates are not limited in their ability to compete with us, which could cause conflicts of interest and limit our ability to acquire additional assets or businesses, which in turn could adversely affect our results of operations and cash available for distribution to our unitholders.
Neither our partnership agreement nor the Omnibus Agreement, as amended, between us, DCP Midstream, LLC and others will prohibit DCP Midstream, LLC and its affiliates, including ConocoPhillips, Spectra Energy and Spectra Energy Partners, LP, from owning assets or engaging in businesses that compete directly or indirectly with us. In addition, DCP Midstream, LLC and its affiliates, including Spectra Energy and ConocoPhillips, may acquire, construct or dispose of additional midstream or other assets in the future, without any obligation to offer us the opportunity to purchase or construct any of those assets. Each of these entities is a large, established participant in the midstream energy business, and each has significantly greater resources and experience than we have, which factors may make it more difficult for us to compete with these entities with respect to commercial activities as well as for acquisition candidates. As a result, competition from these entities could adversely impact our results of operations and cash available for distribution.
Cost reimbursements due to our general partner and its affiliates for services provided, which will be determined by our general partner, will be material.
Pursuant to the Omnibus Agreement, as amended, we entered into with DCP Midstream, LLC, our general partner and others, DCP Midstream, LLC will receive reimbursement for the payment of operating expenses related to our operations and for the provision of various general and administrative services for our benefit. Payments for these services will be material. In addition, under Delaware partnership law, our general partner has unlimited liability for our obligations, such as our debts and environmental liabilities, except for our contractual obligations that are expressly made without recourse to our general partner. To the extent our general partner incurs obligations on our behalf, we are obligated to reimburse or indemnify it. If we are unable or unwilling to reimburse or indemnify our general partner, our general partner may take actions to cause us to make payments of these obligations and liabilities. These factors may reduce the amount of cash otherwise available for distribution to our unitholders.
43
Table of Contents
Our partnership agreement limits our general partner’s fiduciary duties to holders of our common units.
Although our general partner has a fiduciary duty to manage us in a manner beneficial to us and our unitholders, the directors and officers of our general partner have a fiduciary duty to manage our general partner in a manner beneficial to its owner, DCP Midstream, LLC. Our partnership agreement contains provisions that reduce the standards to which our general partner would otherwise be held by state fiduciary duty laws. For example, our partnership agreement permits our general partner to make a number of decisions either in its individual capacity, as opposed to in its capacity as our general partner or otherwise free of fiduciary duties to us and our unitholders. This entitles our general partner to consider only the interests and factors that it desires, and it has no duty or obligation to give any consideration to any interest of, or factors affecting, us, our affiliates or any limited partner. Examples include:
| • | the exercise of its right to reset the target distribution levels of its incentive distribution rights at higher levels and receive, in connection with this reset, a number of Class B units that are convertible at any time following the first anniversary of the issuance of these Class B units into common units; |
| • | its limited call right; |
| • | its voting rights with respect to the units it owns; |
| • | its registration rights; and |
| • | its determination whether or not to consent to any merger or consolidation of the partnership or amendment to the partnership agreement. |
By purchasing a common unit, a common unitholder will agree to become bound by the provisions in the partnership agreement, including the provisions discussed above.
Our partnership agreement restricts the remedies available to holders of our common units for actions taken by our general partner that might otherwise constitute breaches of fiduciary duty.
Our partnership agreement contains provisions that restrict the remedies available to unitholders for actions taken by our general partner that might otherwise constitute breaches of fiduciary duty. For example, our partnership agreement:
| • | provides that our general partner will not have any liability to us or our unitholders for decisions made in its capacity as a general partner so long as it acted in good faith, meaning it believed the decision was in the best interests of our partnership; |
| • | generally provides that affiliated transactions and resolutions of conflicts of interest not approved by the special committee of the board of directors of our general partner and not involving a vote of unitholders must be on terms no less favorable to us than those generally being provided to or available from unrelated third parties or must be “fair and reasonable” to us, as determined by our general partner in good faith and that, in determining whether a transaction or resolution is “fair and reasonable,” our general partner may consider the totality of the relationships between the parties involved, including other transactions that may be particularly advantageous or beneficial to us; and provides that our general partner and its officers and directors will not be liable for monetary damages to us, our limited partners or assignees for any acts or omissions unless there has been a final and non-appealable judgment entered by a court of competent jurisdiction determining that the general partner or those other persons acted in bad faith or engaged in fraud or willful misconduct or, in the case of a criminal matter, acted with knowledge that the conduct was criminal. |
Our general partner may elect to cause us to issue Class B units to it in connection with a resetting of the target distribution levels related to our general partner’s incentive distribution rights without the approval of the special committee of our general partner or holders of our common units. This may result in lower distributions to holders of our common units in certain situations.
Our general partner currently has the right to reset the initial cash target distribution levels at higher levels based on the distribution at the time of the exercise of the reset election. Following a reset election by our general partner, the minimum quarterly distribution amount will be reset to an amount equal to the average cash
44
Table of Contents
distribution amount per common unit for the two fiscal quarters immediately preceding the reset election (such amount is referred to as the “reset minimum quarterly distribution”) and the target distribution levels will be reset to correspondingly higher levels based on percentage increases above the reset minimum quarterly distribution amount. Currently, our distribution to our general partner related to its incentive distribution rights is at the highest level.
In connection with resetting these target distribution levels, our general partner will be entitled to receive a number of Class B units. The Class B units will be entitled to the same cash distributions per unit as our common units and will be convertible into an equal number of common units. The number of Class B units to be issued will be equal to that number of common units whose aggregate quarterly cash distributions equaled the average of the distributions to our general partner on the incentive distribution rights in the prior two quarters. We anticipate that our general partner would exercise this reset right in order to facilitate acquisitions or internal growth projects that would not be sufficiently accretive to cash distributions per common unit without such conversion; however, it is possible that our general partner could exercise this reset election at a time when it is experiencing, or may be expected to experience, declines in the cash distributions it receives related to its incentive distribution rights and may therefore desire to be issued our Class B units, which are entitled to receive cash distributions from us on the same priority as our common units, rather than retain the right to receive incentive distributions based on the initial target distribution levels. As a result, in certain situations, a reset election may cause our common unitholders to experience dilution in the amount of cash distributions that they would have otherwise received had we not issued new Class B units to our general partner in connection with resetting the target distribution levels related to our general partner incentive distribution rights.
Holders of our common units have limited voting rights and are not entitled to elect our general partner or its directors.
Unlike the holders of common stock in a corporation, unitholders have only limited voting rights on matters affecting our business and, therefore, limited ability to influence management’s decisions regarding our business. Unitholders will not elect our general partner or its board of directors, and will have no right to elect our general partner or its board of directors on an annual or other continuing basis. The board of directors of our general partner will be chosen by the members of our general partner. As a result of these limitations, the price at which the common units will trade could be diminished because of the absence or reduction of a takeover premium in the trading price.
Even if holders of our common units are dissatisfied, they may be unable to remove our general partner without its consent.
The unitholders may be unable to remove our general partner without its consent because our general partner and its affiliates own sufficient units to be able to prevent its removal. The vote of the holders of at least 66 2/3% of all outstanding units voting together as a single class is required to remove the general partner. As of December 31, 2010, our general partner and its affiliates owned approximately 30% of our aggregate outstanding units.
Our partnership agreement restricts the voting rights of unitholders owning 20% or more of our common units.
Unitholders’ voting rights are further restricted by the partnership agreement provision providing that any units held by a person that owns 20% or more of any class of units then outstanding, other than our general partner, its affiliates, their transferees and persons who acquired such units with the prior approval of the board of directors of our general partner, cannot vote on any matter. Our partnership agreement also contains provisions limiting the ability of unitholders to call meetings or to acquire information about our operations, as well as other provisions limiting the unitholders’ ability to influence the manner or direction of management.
45
Table of Contents
If we are deemed an “investment company” under the Investment Company Act of 1940, it would adversely affect the price of our common units and could have a material adverse effect on our business.
Our current assets include a 40% interest in the Discovery system and from January 2011, a 33.33% interest in the Southeast Texas system which may be deemed to be “investment securities” within the meaning of the Investment Company Act of 1940. If a sufficient amount of our assets are deemed to be “investment securities” within the meaning of the Investment Company Act, we would either have to register as an investment company under the Investment Company Act, obtain exemptive relief from the SEC or modify our organizational structure or our contract rights to fall outside the definition of an investment company. Registering as an investment company could, among other things, materially limit our ability to engage in transactions with affiliates, including the purchase and sale of certain securities or other property to or from our affiliates, restrict our ability to borrow funds or engage in other transactions involving leverage and require us to add additional directors who are independent of us or our affiliates. The occurrence of some or all of these events may have a material adverse effect on our business.
Moreover, treatment of us as an investment company would prevent our qualification as a partnership for federal income tax purposes in which case we would be treated as a corporation for federal income tax purposes, and be subject to federal income tax at the corporate tax rate, significantly reducing the cash available for distributions. Additionally, distributions to the unitholders would be taxed again as corporate distributions and none of our income, gains, losses or deductions would flow through to the unitholders.
Additionally, as a result of our desire to avoid having to register as an investment company under the Investment Company Act, we may have to forego potential future acquisitions of interests in companies that may be deemed to be investment securities within the meaning of the Investment Company Act or dispose of our current interests in Discovery or Southeast Texas.
Control of our general partner may be transferred to a third party without unitholder consent.
Our general partner may transfer its general partner interest to a third party in a merger or in a sale of all or substantially all of its assets without the consent of the unitholders. Furthermore, our partnership agreement does not restrict the ability of the owners of our general partner from transferring all or a portion of their respective ownership interest in our general partner to a third party. The new owners of our general partner would then be in a position to replace the board of directors and officers of the general partner with its own choices and thereby influence the decisions taken by the board of directors and officers.
We may issue additional units without your approval, which would dilute your existing ownership interests.
Our partnership agreement does not limit the number of additional limited partner interests that we may issue at any time without the approval of our unitholders. The issuance by us of additional common units or other equity securities of equal or senior rank will have the following effects:
| • | your proportionate ownership interest in us will decrease; |
| • | the amount of cash available for distribution on each unit may decrease; |
| • | the ratio of taxable income to distributions may increase; |
| • | the relative voting strength of each previously outstanding unit may be diminished; and |
| • | the market price of the common units may decline. |
Our general partner including its affiliates may sell units in the public or private markets, which could reduce the market price of our outstanding common units.
If our general partner or its affiliates holding unregistered units were to dispose of a substantial portion of these units in the public market, whether in a single transaction or series of transactions, it could reduce the market price of our outstanding common units. In addition, these sales, or the possibility that these sales may occur, could make it more difficult for us to sell our common units in the future.
46
Table of Contents
Our general partner has a limited call right that may require the unitholders to sell their units at an undesirable time or price.
If at any time our general partner and its affiliates own more than 80% of the common units, our general partner will have the right, but not the obligation, which it may assign to any of its affiliates or to us, to acquire all, but not less than all, of the common units held by unaffiliated persons at a price not less than their then-current market price. As a result, the unitholders may be required to sell their common units at an undesirable time or price and may not receive any return on their investment. Unitholders may also incur a tax liability upon a sale of their units.
The liability of holders of limited partner interests may not be limited if a court finds that unitholder action constitutes control of our business.
A general partner of a partnership generally has unlimited liability for the obligations of the partnership, except for those contractual obligations of the partnership that are expressly made without recourse to the general partner. Our partnership is organized under Delaware law and we conduct business in a number of other states. The limitations on the liability of holders of limited partner interests for the obligations of a limited partnership have not been clearly established in some of the other states in which we do business. Holders of limited partner interests could be liable for any and all of our obligations as if such holder were a general partner if:
| • | a court or government agency determined that we were conducting business in a state but had not complied with that particular state’s partnership statute; or |
| • | the right of holders of limited partner interests to act with other unitholders to remove or replace the general partner, to approve some amendments to our partnership agreement or to take other actions under our partnership agreement constitute “control” of our business. |
Unitholders may have liability to repay distributions that were wrongfully distributed to them.
Under certain circumstances, unitholders may have to repay amounts wrongfully returned or distributed to them. Under Section 17-607 of the Delaware Revised Uniform Limited Partnership Act, we may not make a distribution to the unitholders if the distribution would cause our liabilities to exceed the fair value of our assets. Delaware law provides that for a period of three years from the date of the impermissible distribution, limited partners who received the distribution and who knew at the time of the distribution that it violated Delaware law will be liable to the limited partnership for the distribution amount. Substituted limited partners are liable for the obligations of the assignor to make contributions to the partnership that are known to the substituted limited partner at the time it became a limited partner and for unknown obligations if the liabilities could be determined from the partnership agreement. Liabilities to partners on account of their partnership interest and liabilities that are non-recourse to the partnership are not counted for purposes of determining whether a distribution is permitted.
Tax Risks to Common Unitholders
Our tax treatment depends on our status as a partnership for federal income tax purposes, as well as our being subject to minimal entity-level taxation by individual states. If the Internal Revenue Service, or IRS, were to treat us as a corporation or we become subject to a material amount of entity-level taxation for state tax purposes, it would substantially reduce the amount of cash available for distribution to our unitholders.
The anticipated after-tax economic benefit of an investment in the common units depends largely on our being treated as a partnership for federal income tax purposes. We have not requested, and do not plan to request, a ruling from the IRS regarding our status as a partnership.
Despite the fact that we are a limited partnership under Delaware law, it is possible in certain circumstances for a partnership such as ours to be treated as a corporation for federal income tax purposes. Although we do not believe based upon our current operations that we will be treated as a corporation, a change in our business (or a change in current law) could cause us to be treated as a corporation for federal income tax purposes or otherwise subject us to taxation as an entity.
47
Table of Contents
If we were treated as a corporation for federal income tax purposes, we would pay federal income tax on our taxable income at the corporate tax rate, which is currently a maximum of 35% and would likely pay state income tax at varying rates. Distributions to a unitholder would generally be taxed again as corporate distributions, and no income, gains, losses or deductions would flow through to them. Because a tax would be imposed upon us as a corporation, our cash available for distribution to a unitholder would be substantially reduced. Therefore, treatment of us as a corporation would result in a material reduction in the anticipated cash flow and after-tax return to a unitholder, likely causing a substantial reduction in the value of our common units.
Current law may change, which would cause us to be treated as a corporation for federal income tax purposes or otherwise subject us to entity-level taxation. At the federal level, members of Congress recently considered legislation that would have eliminated partnership tax treatment for certain publicly traded partnerships. Although the recently considered legislation would not have affected our tax treatment as a partnership, we are unable to predict whether any similar changes or other proposals will ultimately be enacted. Moreover, any such modifications to federal income tax laws and interpretations thereof may or may not be applied retroactively. Any such legislative changes could negatively impact the value of an investment in our common units. In addition, because of widespread state budget deficits and other reasons, several states are evaluating ways to subject partnerships to entity-level taxation through the imposition of state income, franchise and other forms of taxation. For example, we are required to pay Texas franchise tax at a maximum effective rate of 0.7% of our gross income apportioned to Texas in the prior year and a Michigan business tax of 0.8% on gross receipts, and 4.95% of Michigan taxable income. Imposition of such a tax on us by any other state will reduce the cash available for distribution to a unitholder. The partnership agreement provides that if a law is enacted or existing law is modified or interpreted in a manner that subjects us to taxation as a corporation or otherwise subjects us to entity-level taxation for federal, state or local income tax purposes, the minimum quarterly distribution amount and the target distribution levels will be adjusted to reflect the impact of that law on us.
If the IRS contests the federal income tax positions we take, the market for our common units may be adversely impacted, and the cost of any IRS contest will reduce our cash available for distribution to our unitholders.
We have not requested a ruling from the IRS with respect to our treatment as a partnership for federal income tax purposes or any other matter affecting us. The IRS may adopt positions that differ from the conclusions of our counsel expressed in this document or from the positions we take. It may be necessary to resort to administrative or court proceedings to sustain some or all of our counsel’s conclusions or the positions we take. A court may not agree with some or all of our counsel’s conclusions or positions we take. Any contest with the IRS may materially and adversely impact the market for our common units and the price at which they trade. In addition, our costs of any contest with the IRS will be borne indirectly by our unitholders and our general partner because such costs will reduce our cash available for distribution.
Unitholders may be required to pay taxes on income from us even if the unitholders do not receive any cash distributions from us.
Because our unitholders will be treated as partners to whom we will allocate taxable income, which could be different in amount than the cash we distribute, unitholders will be required to pay any federal income taxes and, in some cases, state and local income taxes on their share of our taxable income even if they receive no cash distributions from us. Unitholders may not receive cash distributions from us equal to their share of our taxable income or even equal to the tax liability that results from that income.
Tax gain or loss on disposition of common units could be more or less than expected.
If unitholders sell their common units, they will recognize a gain or loss equal to the difference between the amount realized and their tax basis in those common units. Because distributions to unitholders in excess of the total net taxable income allocated to them for a common unit decreases their tax basis in that common unit, the amount, if any, of such prior excess distributions will, in effect, become taxable income to them if the common unit is sold at a price greater than their tax basis in that common unit, even if the price is less than their original cost. Furthermore, a substantial portion of the amount realized, whether or not representing gain, may
48
Table of Contents
be taxed as ordinary income due to potential recapture items, including depreciation recapture. In addition, because the amount realized includes a unitholder’s share of our nonrecourse liabilities, if a unitholder sells its units, the unitholder may incur a tax liability in excess of the amount of cash it receives from the sale.
Tax-exempt entities and non-U.S. persons face unique tax issues from owning common units that may result in adverse tax consequences to them.
Investment in common units by tax-exempt entities, such as individual retirement accounts, or IRAs, other retirement plans and non-U.S. persons raises issues unique to them. For example, virtually all of our income allocated to organizations that are exempt from federal income tax, including IRAs and other retirement plans, will be unrelated business taxable income, which may be taxable to them. Distributions to non-U.S. persons will be reduced by federal withholding taxes at the highest applicable effective tax rate, and non-U.S. persons will be required to file United States federal tax returns and pay tax on their share of our taxable income. If a unitholder is a tax-exempt entity or a non-U.S. person, the unitholder should consult its tax advisor before investing in our common units.
We will treat each purchaser of our common units as having the same tax benefits without regard to the actual common units purchased. The IRS may challenge this treatment, which could adversely affect the value of the common units.
Because we cannot match transferors and transferees of common units and because of other reasons, we will adopt depreciation and amortization positions that may not conform to all aspects of existing Treasury Regulations. A successful IRS challenge to those positions could adversely affect the amount of tax benefits available to the unitholders. It also could affect the timing of these tax benefits or the amount of gain from the sale of common units and could have a negative impact on the value of our common units or result in audit adjustments to the unitholders’ tax returns.
We prorate our items of income, gain, loss and deduction between transferors and transferees of our units each month based upon the ownership of our units on the first day of each month, instead of on the basis of the date a particular unit is transferred. The IRS may challenge this treatment, which could change the allocation of items of income, gain, loss and deduction among our unitholders.
We prorate our items of income, gain, loss and deduction between transferors and transferees of our units each month based upon the ownership of our units on the first day of each month, instead of on the basis of the date a particular unit is transferred. The use of this proration method may not be permitted under existing Treasury Regulations. Recently, however, the U.S. Treasury Department issued proposed Treasury Regulations that provide a safe harbor pursuant to which publicly traded partnerships may use a similar monthly simplifying convention to allocate tax items among transferor and transferee unitholders. Nonetheless, the proposed regulations do not specifically authorize the use of the proration method we have adopted. If the IRS were to challenge our proration method or new Treasury regulations were issued, we may be required to change the allocation of items of income, gain, loss and deduction among our unitholders.
A unitholder whose units are loaned to a “short seller” to cover a short sale of units may be considered as having disposed of those units. If so, he would no longer be treated for tax purposes as a partner with respect to those units during the period of the loan and may recognize gain or loss from the disposition.
Because a unitholder whose units are loaned to a “short seller” to cover a short sale of units may be considered as having disposed of the loaned units, he may no longer be treated for tax purposes as a partner with respect to those units during the period of the loan to the short seller and such unitholder may recognize gain or loss from such disposition. Moreover, during the period of the loan to the short seller, any of our income, gain, loss or deduction with respect to those units may not be reportable by the unitholder and any cash distributions received by the unitholder as to those units could be fully taxable as ordinary income. Unitholders desiring to assure their status as partners and avoid the risk of gain recognition from a loan to a short seller are urged to modify any applicable brokerage account agreements to prohibit their brokers from borrowing their units.
49
Table of Contents
We have adopted certain valuation methodologies that may result in a shift of income, gain, loss and deduction between the general partner and the unitholders. The IRS may challenge this treatment, which could adversely affect the value of the common units.
When we issue additional units or engage in certain other transactions, we determine the fair market value of our assets and allocate any unrealized gain or loss attributable to our assets to the capital accounts of our unitholders and our general partner. Our methodology may be viewed as understating the value of our assets. In that case, there may be a shift of income, gain, loss and deduction between certain unitholders and the general partner, which may be unfavorable to such unitholders. Moreover, subsequent purchasers of common units may have a greater portion of their Internal Revenue Code Section 743(b) adjustment allocated to our tangible assets and a lesser portion allocated to our intangible assets. The IRS may challenge our valuation methods, or our allocation of the Section 743(b) adjustment attributable to our tangible and intangible assets, and allocations of income, gain, loss and deduction between the general partner and certain of our unitholders.
A successful IRS challenge to these methods or allocations could adversely affect the amount of taxable income or loss being allocated to our unitholders. It also could affect the amount of gain from our unitholders’ sale of common units and could have a negative impact on the value of the common units or result in audit adjustments to our unitholders’ tax returns without the benefit of additional deductions.
The sale or exchange of 50% or more of our capital and profits interests during any twelve-month period will result in the termination of our partnership for federal income tax purposes.
We will be considered to have terminated for federal income tax purposes if there is a sale or exchange of 50% or more of the total interests in our capital and profits within a twelve-month period. Our termination, among other things, would result in the closing of our taxable year for all unitholders, which would result in us filing two tax returns (and our unitholders could receive two Schedule K-1’s) for one calendar year. Our termination could also result in a significant deferral of depreciation deductions allowable in computing our taxable income. In the case of a unitholder reporting on a taxable year other than a calendar year, the closing of our taxable year may result in more than twelve months of our taxable income or loss being includable in his taxable income for the year of termination. Our termination currently would not affect our classification as a partnership for federal income tax purposes, but instead, we would be treated as a new partnership for tax purposes. If treated as a new partnership, we must make new tax elections and could be subject to penalties if we are unable to determine that a termination occurred. The IRS has recently announced a relief procedure whereby the IRS may allow a publicly traded partnership that has terminated to provide only a single Schedule K-1 to each unitholder for the two tax years in the fiscal year in which the termination occurs.
Unitholders may be subject to state and local taxes and return filing requirements in states where they do not reside as a result of investing in our units.
In addition to federal income taxes, unitholders may be subject to other taxes, including foreign, state and local taxes, unincorporated business taxes and estate, inheritance or intangible taxes that are imposed by the various jurisdictions in which we conduct business or own property, even if the unitholders do not live in any of those jurisdictions. Unitholders may be required to file foreign, state and local income tax returns and pay state and local income taxes in some or all of these jurisdictions. Further, the unitholder may be subject to penalties for failure to comply with those requirements. We own assets and conduct business in the states of Arkansas, Colorado, Connecticut, Indiana, Kentucky, Louisiana, Maine, Maryland, Massachusetts, Michigan, New Hampshire, New York, Ohio, Oklahoma, Pennsylvania, Rhode Island, Tennessee, Texas, Vermont, Virginia, West Virginia and Wyoming. Each of these states, other than Texas and Wyoming, currently imposes a personal income tax on individuals. A majority of these states impose an income tax on corporations and other entities. As we make acquisitions or expand our business, we may own assets or do business in additional states that impose a personal income tax. It is each unitholder’s responsibility to file all United States federal, foreign, state and local tax returns.
50
Table of Contents
| Item 1B. | Unresolved Staff Comments |
None.
| Item 2. | Properties |
As of February 25, 2011, we own and operate processing plants and gathering systems located in Arkansas, Colorado, Louisiana, Michigan, Oklahoma, Texas and Wyoming, all within our Natural Gas Services segment, six owned propane rail terminals, five of which we operate, located in Maine, Massachusetts, New York, Pennsylvania and Vermont, one owned and operated marine import terminal located in Virginia, and one owned and operated propane pipeline terminal located in Pennsylvania within our Wholesale Propane Logistics Segment, two owned and operated pipelines located in Texas, one owned and operated pipeline located in Texas and Louisiana, one owned and operated pipeline located in Colorado and Kansas, and one owned and operated underground storage facility located in Michigan within our NGL Logistics segment. In addition within our Natural Gas Services segment, we own a 40% interest in Discovery Producer Services, LLC, which owns an offshore gathering pipeline, a natural gas processing plant and an NGL fractionator plant in Louisiana, operated by a third party; a 50.1% interest in DCP East Texas Holdings, LLC, which own a natural gas processing complex, connected gathering system and pipeline hub in Texas, operated by DCP Midstream, LLC; and a 33.33% interest in DCP Southeast Texas Holdings, GP, which owns processing plants, gathering systems and natural gas storage in Texas, operated by DCP Midstream, LLC. For additional details on these plants, storage facilities, propane terminals and pipeline systems, please read “Business—Natural Gas Services Segment,” “Business — Wholesale Propane Logistics Segment” and “Business — NGL Logistics Segment.” We believe that our properties are generally in good condition, well maintained and are suitable and adequate to carry on our business at capacity for the foreseeable future.
Our real property falls into two categories: (1) parcels that we own in fee; and (2) parcels in which our interest derives from leases, easements, rights-of-way, permits or licenses from landowners or governmental authorities permitting the use of such land for our operations. Portions of the land on which our plants and other major facilities are located are owned by us in fee title, and we believe that we have satisfactory title to these lands. The remainder of the land on which our plant sites and major facilities are located are held by us pursuant to ground leases between us, as lessee, and the fee owner of the lands, as lessors. We, or our predecessors, have leased these lands for many years without any material challenge known to us relating to the title to the land upon which the assets are located, and we believe that we have satisfactory leasehold estates to such lands. We have no knowledge of any challenge to the underlying fee title of any material lease, easement, right-of-way, permit or license held by us or to our title to any material lease, easement, right-of-way, permit or lease, and we believe that we have satisfactory title to all of our material leases, easements, rights-of-way, permits and licenses.
Our principal executive offices are located at 370 17th Street, Suite 2775, Denver, Colorado 80202, our telephone number is 303-633-2900 and our website address is www.dcppartners.com.
| Item 3. | Legal Proceedings |
We are not a party to any significant legal proceedings, other than those listed below, but are a party to various administrative and regulatory proceedings that have arisen in the ordinary course of our business. Management currently believes that the ultimate resolution of these matters, taken as a whole, and after consideration of amounts accrued, insurance coverage or other indemnification arrangements, will not have a material adverse effect upon our consolidated results of operations, financial position or cash flows. Please read “Business — Regulation of Operations” and “Business — Environmental Matters.”
Westfield — In July 2010, there was an explosion at a condominium complex in Norfolk, Massachusetts in which a worker at the condominium was killed. An investigation of the accident by the Massachusetts State Fire Marshall has indicated that the propane that exploded may have been unodorized. The investigation further indicated that the propane that exploded may have been supplied by our Westfield propane rail terminal to one of our customers who filled the tank that exploded. We are not responsible for odorization of the propane we supply to our customers out of our Westfield terminal. Rather, we receive the propane by rail which has been odorized by our suppliers. An attorney representing the estate of the deceased has brought a legal action against
51
Table of Contents
our customer who filled the tank that exploded; however, we have not been named in that lawsuit. It is not possible to predict whether we will incur any liability or to estimate the damages, if any, we might incur in connection with this matter. Management does not believe the ultimate resolution of this issue will have a material adverse effect on our consolidated results of operations, financial position or cash flows.
El Paso — On February 27, 2009, a jury in the District Court, Harris County, Texas rendered a verdict in favor of El Paso E&P Company, L.P., or El Paso, and against one of our subsidiaries and DCP Midstream, LLC. As previously disclosed, the lawsuit, filed in December 2006, stems from an ongoing commercial dispute involving our Minden processing plant that dates back to August 2000. During the second quarter of 2009 we filed an appeal in the 14th Court of Appeals, Texas. El Paso filed an additional lawsuit in the District Court of Webster Parish, Louisiana, claiming damages for the same claims as the Texas matter, but for periods prior to our ownership of the Minden processing plant. The Louisiana court determined in August 2009 that El Paso’s Louisiana claims were barred by the doctrine of res judicata and dismissed the case with prejudice in Louisiana. In January 2010, we and DCP Midstream, LLC entered into a settlement agreement with El Paso to resolve all claims brought by El Paso regarding this matter in Texas and Louisiana. Under the terms of the settlement agreement, we paid El Paso approximately $2.2 million for our portion of the settlement, which is within the amount of our previously disclosed contingent liability. This amount was included in the consolidated balance sheets within other current liabilities as of December 31, 2009. The cases have been dismissed in both Texas and Louisiana.
| Item 4. |
Reserved.
52
Table of Contents
PART II
| Item 5. | Market for Registrant’s Common Equity, Related Unitholder Matters and Issuer Purchases of Units |
Market Information
Our common units have been listed on the New York Stock Exchange, or the NYSE, under the symbol “DPM” since December 2, 2005. The following table sets forth intra-day high and low sales prices of the common units, as reported by the NYSE, as well as the amount of cash distributions declared per quarter for 2010 and 2009.
| Quarter Ended |
High | Low | Distribution Per Common Unit |
|||||||||
| December 31, 2010 |
$ | 37.85 | $ | 33.35 | $ | 0.6175 | ||||||
| September 30, 2010 |
$ | 36.66 | $ | 30.82 | $ | 0.6100 | ||||||
| June 30, 2010 |
$ | 34.56 | $ | 27.02 | $ | 0.6100 | ||||||
| March 31, 2010 |
$ | 33.87 | $ | 26.76 | $ | 0.6000 | ||||||
| December 31, 2009 |
$ | 29.70 | $ | 23.99 | $ | 0.6000 | ||||||
| September 30, 2009 |
$ | 26.20 | $ | 20.33 | $ | 0.6000 | ||||||
| June 30, 2009 |
$ | 21.80 | $ | 13.58 | $ | 0.6000 | ||||||
| March 31, 2009 |
$ | 15.06 | $ | 8.59 | $ | 0.6000 | ||||||
As of February 25, 2011, there were approximately 43 unitholders of record of our common units. This number does not include unitholders whose units are held in trust by other entities. The actual number of unitholders is greater than the number of holders of record.
Distributions of Available Cash
General — Our partnership agreement requires that, within 45 days after the end of each quarter, we distribute all of our Available Cash (defined below) to unitholders of record on the applicable record date, as determined by our general partner.
Definition of Available Cash — Available Cash, for any quarter, consists of all cash and cash equivalents on hand at the end of that quarter:
| • | less the amount of cash reserves established by our general partner to: |
| • | provide for the proper conduct of our business; |
| • | comply with applicable law, any of our debt instruments or other agreements; or |
| • | provide funds for distributions to our unitholders and to our general partner for any one or more of the next four quarters; |
| • | plus, if our general partner so determines, all or a portion of cash and cash equivalents on hand on the date of determination of Available Cash for the quarter. |
Minimum Quarterly Distribution — The Minimum Quarterly Distribution, as set forth in the partnership agreement, is $0.35 per unit per quarter, or $1.40 per unit per year. Our current quarterly distribution is $0.6175 per unit, or $2.47 per unit annualized. There is no guarantee that we will maintain our current distribution or pay the Minimum Quarterly Distribution on the units in any quarter. Even if our cash distribution policy is not modified or revoked, the amount of distributions paid under our policy and the decision to make any distribution is determined by our general partner, taking into consideration the terms of our partnership agreement. Please read “Management’s Discussion and Analysis of Financial Condition and Results of Operations — Capital Requirements — Description of Credit Agreement” for a discussion of the restrictions included in our credit agreement that may restrict our ability to make distributions.
General Partner Interest and Incentive Distribution Rights — As of December 31, 2010 the general partner is entitled to a percentage of all quarterly distributions equal to its general partner interest of
53
Table of Contents
approximately 1% and limited partner interest of 1%. The general partner has the right, but not the obligation, to contribute a proportionate amount of capital to us to maintain its current general partner interest. The general partner’s interest may be reduced if we issue additional units in the future and our general partner does not contribute a proportionate amount of capital to us to maintain its current general partner interest.
The incentive distribution rights held by our general partner entitle it to receive an increasing share of Available Cash as pre-defined distribution targets have been achieved. Currently, our distribution to our general partner related to its incentive distribution rights is at the highest level. Our general partner’s incentive distribution rights were not reduced as a result of our recent common unit offerings, and will not be reduced if we issue additional units in the future and the general partner does not contribute a proportionate amount of capital to us to maintain its current general partner interest. Please read the Distributions of Available Cash after the Subordination Period sections in Note 13 of the Notes to Consolidated Financial Statements in Item 8. “Financial Statements and Supplementary Data” for more details about the distribution targets and their impact on the general partner’s incentive distribution rights.
On January 27, 2011, the board of directors of DCP Midstream GP, LLC declared a quarterly distribution of $0.6175 per unit, which was paid on February 14, 2011, to unitholders of record on February 7, 2011.
Equity Compensation Plans
The information relating to our equity compensation plans required by Item 5 is incorporated by reference to such information as set forth in “Item 12. Security Ownership of Certain Beneficial Owners and Management and Related Unitholder Matters” contained herein.
| Item 6. | Selected Financial Data |
The following table shows our selected financial data for the periods and as of the dates indicated, which is derived from the consolidated financial statements. These consolidated financial statements include our accounts, which have been combined with the historical assets, liabilities and operations of our wholesale propane logistics business which we acquired from DCP Midstream, LLC in November 2006, our initial 25% limited liability company interest in DCP East Texas Holdings, LLC, or East Texas, our 40% limited liability company interest in Discovery Producer Services, LLC, or Discovery, and a non-trading derivative instrument, or the Swap, which DCP Midstream, LLC entered into in March 2007, which we acquired from DCP Midstream, LLC in July 2007 and our additional 25.1% limited liability interest in East Texas, which we acquired from DCP Midstream, LLC in April 2009. Prior to our acquisition of an additional 25.1% limited liability company interest in East Texas we owned a 25.0% limited liability company interest in East Texas, which was accounted for under the equity method of accounting. Subsequent to our acquisition of an additional 25.1% limited liability company interest in April 2009, we own a 50.1% limited liability company interest in East Texas and account for East Texas as a consolidated subsidiary. This transaction was among entities under common control; accordingly, our financial information includes the historical results of entities and interests contributed to us by DCP Midstream, LLC for all periods presented. The information contained herein should be read together with, and is qualified in its entirety by reference to, the consolidated financial statements and the accompanying notes included elsewhere in this Form 10-K.
Our operating results incorporate a number of significant estimates and uncertainties. Such matters could cause the data included herein to not be indicative of our future financial conditions or results of operations. A discussion on our critical accounting estimates is included in “Management’s Discussion and Analysis of Financial Condition and Results of Operations.”
54
Table of Contents
The table should also be read together with “Management’s Discussion and Analysis of Financial Condition and Results of Operations.”
| Year Ended December 31, | ||||||||||||||||||||
| 2010(a) | 2009(a) | 2008(a) | 2007(a) | 2006 | ||||||||||||||||
| (Millions, except per unit amounts) | ||||||||||||||||||||
| Statements of Operations Data: |
||||||||||||||||||||
| Sales of natural gas, propane, NGLs and condensate |
$ | 1,162.7 | $ | 913.0 | $ | 1,672.7 | $ | 1,376.5 | $ | 1,232.2 | ||||||||||
| Transportation, processing and other |
115.3 | 95.2 | 86.1 | 57.4 | 50.0 | |||||||||||||||
| (Losses) gains from commodity derivative activity, net(b) |
(8.5 | ) | (65.8 | ) | 71.7 | (87.7 | ) | (1.0 | ) | |||||||||||
| Total operating revenues(c) |
1,269.5 | 942.4 | 1,830.5 | 1,346.2 | 1,281.2 | |||||||||||||||
| Operating costs and expenses: |
||||||||||||||||||||
| Purchases of natural gas, propane and NGLs |
1,032.6 | 776.2 | 1,481.0 | 1,185.6 | 1,085.7 | |||||||||||||||
| Operating and maintenance expense |
79.8 | 69.7 | 77.4 | 59.3 | 48.1 | |||||||||||||||
| Depreciation and amortization expense |
73.7 | 64.9 | 53.2 | 40.2 | 27.4 | |||||||||||||||
| General and administrative expense |
33.7 | 32.3 | 33.3 | 36.2 | 32.5 | |||||||||||||||
| Step acquisition — equity interest re-measurement gain |
(9.1 | ) | — | — | — | — | ||||||||||||||
| Other income |
(1.0 | ) | — | (1.5 | ) | — | — | |||||||||||||
| Other income — affiliates |
(3.0 | ) | — | — | — | — | ||||||||||||||
| Total operating costs and expenses |
1,206.7 | 943.1 | 1,643.4 | 1,321.3 | 1,193.7 | |||||||||||||||
| Operating income (loss) |
62.8 | (0.7 | ) | 187.1 | 24.9 | 87.5 | ||||||||||||||
| Interest income |
— | 0.3 | 6.1 | 5.6 | 6.3 | |||||||||||||||
| Interest expense |
(29.1 | ) | (28.3 | ) | (32.8 | ) | (25.7 | ) | (11.5 | ) | ||||||||||
| Earnings from unconsolidated affiliates(d) |
23.8 | 18.5 | 18.2 | 24.7 | 17.2 | |||||||||||||||
| Income (loss) before income taxes |
57.5 | (10.2 | ) | 178.6 | 29.5 | 99.5 | ||||||||||||||
| Income tax expense |
(0.3 | ) | (0.6 | ) | (0.6 | ) | (0.8 | ) | (1.8 | ) | ||||||||||
| Net income (loss) |
57.2 | (10.8 | ) | 178.0 | 28.7 | 97.7 | ||||||||||||||
| Net income attributable to noncontrolling interests |
(9.2 | ) | (8.3 | ) | (36.1 | ) | (29.8 | ) | (23.9 | ) | ||||||||||
| Net income (loss) attributable to partners |
$ | 48.0 | $ | (19.1 | ) | $ | 141.9 | $ | (1.1 | ) | $ | 73.8 | ||||||||
| Less: |
||||||||||||||||||||
| Net loss (income) attributable to predecessor |
— | 1.0 | (16.2 | ) | (18.3 | ) | (38.5 | ) | ||||||||||||
| General partner interest in net income or net loss |
(16.9 | ) | (12.7 | ) | (13.0 | ) | (3.9 | ) | (0.6 | ) | ||||||||||
| Net income (loss) allocable to limited partners |
$ | 31.1 | $ | (30.8 | ) | $ | 112.7 | $ | (23.3 | ) | $ | 34.7 | ||||||||
| Net income (loss) per limited partner unit-basic and diluted |
$ | 0.86 | $ | (0.99 | ) | $ | 4.11 | $ | (1.14 | ) | $ | 1.98 | ||||||||
| Balance Sheet Data (at period end): |
||||||||||||||||||||
| Property, plant and equipment, net |
$ | 1,169.1 | $ | 1,000.1 | $ | 882.7 | $ | 737.2 | $ | 423.0 | ||||||||||
| Total assets |
$ | 1,700.6 | $ | 1,481.5 | $ | 1,419.7 | $ | 1,380.8 | $ | 874.4 | ||||||||||
| Accounts payable |
$ | 136.7 | $ | 128.6 | $ | 107.6 | $ | 223.8 | $ | 164.9 | ||||||||||
| Long-term debt |
$ | 647.8 | $ | 613.0 | $ | 656.5 | $ | 630.0 | $ | 268.0 | ||||||||||
| Partners’ equity |
$ | 518.1 | $ | 377.7 | $ | 395.1 | $ | 232.4 | $ | 318.8 | ||||||||||
| Noncontrolling interests |
$ | 220.1 | $ | 227.7 | $ | 167.7 | $ | 155.1 | $ | 101.7 | ||||||||||
| Total equity |
$ | 738.2 | $ | 605.4 | $ | 562.8 | $ | 387.5 | $ | 420.5 | ||||||||||
| Other Information: |
||||||||||||||||||||
| Cash distributions declared per unit |
$ | 2.438 | $ | 2.400 | $ | 2.390 | $ | 2.115 | $ | 1.565 | ||||||||||
| Cash distributions paid per unit |
$ | 2.420 | $ | 2.400 | $ | 2.360 | $ | 1.975 | $ | 1.230 | ||||||||||
55
Table of Contents
| (a) | Includes the effect of the following acquisitions prospectively from their respective dates of acquisition; (1) our Southern Oklahoma system acquired in May 2007; (2) certain subsidiaries of Momentum Energy Group, Inc. acquired in August 2007; (3) Michigan Pipeline & Processing, LLC acquired in October 2008; (4) certain companies acquired from MichCon Pipeline Company in November 2009; (5) the Wattenberg pipeline acquired from Buckeye Partners, L.P. in January 2010; (6) an additional 5% interest in Collbran Valley Gas Gathering LLC, acquired from Delta Petroleum Company in February 2010; (7) an additional 50% interest in Black Lake Pipeline Company, or Black Lake, acquired from an affiliate of BP PLC in July 2010; and (8) the acquisition of Atlantic Energy from UGI Corporation in July 2010. |
| Prior | to our acquisition of an additional 50% interest in Black Lake, in July 2010, we accounted for Black Lake under the equity method of accounting. Subsequent to this transaction we account for Black Lake as a consolidated subsidiary. |
| (b) | Includes the effect of the NGL Hedge acquired from DCP Midstream, LLC in April 2009 and the Swap entered into by DCP Midstream, LLC in March 2007 and contributed to us in July 2007. The NGL Hedge is a fixed price natural gas liquids derivative by NGL component which commenced in April 2009 and expired in March 2010. The Swap was for a total of 1.9 million barrels at $66.72 per barrel. |
| (c) | We hedge the proportionate ownership of East Texas. Results shown include the unhedged portion of East Texas owned by DCP Midstream, LLC. Our consolidated results depict 75% of East Texas unhedged in all periods prior to the second quarter of 2009 and 49.9% of East Texas unhedged for all periods subsequent to the first quarter of 2009. |
| (d) | Includes the effect of the acquisition of a 40% limited liability company interest in Discovery from DCP Midstream, LLC for all periods presented, as well as our proportionate share of the earnings of Black Lake through July 2010. Earnings for Discovery and Black Lake include the amortization of the net difference between the carrying amount of the investments and the underlying equity of the investments. |
| (e) | Includes the net income (loss) attributable to our wholesale propane logistics business prior to the date of our acquisition from DCP Midstream, LLC in November 2006, the net income attributable to the acquisition of an initial 25% limited liability company interest in East Texas, a 40% limited liability company interest in Discovery, and the Swap prior to the date of our acquisition from DCP Midstream, LLC in July 2007, and the net income attributable to the acquisition of an additional 25.1% limited liability company interest in East Texas prior to the date of our acquisition from DCP Midstream, LLC in April 2009. |
56
Table of Contents
| Item 7. | Management’s Discussion and Analysis of Financial Condition and Results of Operations |
The following discussion analyzes our financial condition and results of operations. You should read the following discussion of our financial condition and results of operations in conjunction with our consolidated financial statements and notes included elsewhere in this annual report.
Overview
We are a Delaware limited partnership formed by DCP Midstream, LLC to own, operate, acquire and develop a diversified portfolio of complementary midstream energy assets. Our operations are organized into three business segments; Natural Gas Services, Wholesale Propane Logistics and NGL Logistics.
The financial information contained herein includes, for each period presented, our accounts, and the assets, liabilities and operations of our additional 25.1% limited liability company interest in East Texas acquired from DCP Midstream, LLC in April 2009, a transaction among entities under common control, which we refer to as our “predecessor.” Transfers of net assets between entities under common control are accounted for as if the transfer occurred at the beginning of the period, and prior years are retroactively adjusted to furnish comparative information similar to the pooling method. Prior to our acquisition of an additional 25.1% limited liability company interest in East Texas from DCP Midstream, LLC in April 2009, we owned a 25% limited liability company interest in East Texas, which we accounted for under the equity method of accounting. Subsequent to this transaction we own a 50.1% limited liability interest in East Texas, and account for East Texas as a consolidated subsidiary. Accordingly, our financial information includes the historical results of our predecessor for all periods presented.
Crude oil and NGL prices have generally remained at favorable levels, although natural gas prices continue to decline and remain lower than prices in 2008 and 2009. With the exception of certain higher liquids content and emerging gas shale regions where drilling activity remains high, the lower natural gas prices are resulting in significantly reduced drilling activity in areas where the gas has a relatively lower liquid content. Gas production in regions with low liquid content receive less price uplift from the relatively higher crude and NGL prices.
During January and February, we experienced near record cold weather, causing operating challenges at our East Texas and Northern Louisiana plants, creating periods of low NGL recoveries and volume curtailments due to plant shut downs and producer wellhead freeze offs.
From May to November, we had an extended planned outage related to an inspection at our Providence wholesale propane terminal, with lower unit margins resulting from the associated logistics of shifting inventory and sales volumes to our other terminals. Earlier in the year, warmer weather and an early spring tempered propane sales volumes. This was partially offset by the cash payment we received in conjunction with an amendment to an existing propane supply contract.
Improvements in several aspects of the business environment along with opportunities in the market enabled us to continue to execute on our growth objectives in 2010 through a series of acquisitions and capital projects around our existing footprint. In January, we completed an acquisition of our Wattenberg fee-based NGL pipeline and announced a related expansion capital project. In July, we acquired an additional 55% interest in our Black Lake fee-based NGL pipeline bringing our ownership interest in Black Lake to 100%. In July, we also closed on an acquisition which expanded our existing northeastern U.S. wholesale propane logistics business into the mid-Atlantic region through the addition of a marine import terminal and storage facility in the Port of Chesapeake, Virginia. Prior to year-end, we further expanded our NGL logistics business in the Midwest, Sarnia and Northeast supply markets through the acquisition of an NGL storage facility in Marysville, Michigan.
On November 4, 2010, we entered into agreements with DCP Midstream, LLC, to acquire a 33.33% interest in Southeast Texas, for $150.0 million. The Southeast Texas system is a fully integrated midstream business which includes 675 miles of natural gas pipelines, three natural gas processing plants with recently increased processing capacity totaling 380 MMcf/d and natural gas storage assets with 9 Bcf of existing storage capacity. The terms of the joint venture agreement provide that distributions to us for the first seven years related to storage and transportation gross margin will be pursuant to a fee-based arrangement, based on storage
57
Table of Contents
capacity and tailgate volumes. Distributions related to the gathering and processing business, along with reductions for all expenditures, will be pursuant to our and DCP Midstream, LLC’s respective ownership interests in Southeast Texas. The transaction closed on January 1, 2011.
Through the growth opportunities executed, we increased our business diversity, geographic and resource exposure, and our fee-based margins. Our integration efforts related to the acquisitions are progressing according to plan. The Wattenberg capital expansion project, which we expect to complete in early 2011, is also progressing on plan.
We believe our financial positioning is a key element of our growth strategy and that our accomplishments related to our financial objectives position us well in terms of both liquidity and cost of capital to support our growth plans. In September, we successfully executed our inaugural public debt offering through the issuance of $250.0 million of senior notes due 2015. We raised $189.3 million in capital through the successful execution of two public equity offerings in August and November.
Financial results for the year were in line with our previously provided 2010 forecast. Resuming distribution growth was an important 2010 objective, with the past year serving as a transition year to consistent distribution growth. We raised our distribution in the second and fourth quarters, resulting in a 3% increase in our quarterly distribution rate over the rate paid in the fourth quarter of 2009. The distributions reflect our business results as well as our recent execution on growth opportunities.
General Trends and Outlook
In 2011, our strategic objectives will continue to focus on maintaining stable distributable cash flows from our existing assets and executing on growth opportunities to increase our distributable cash flows. We believe the key elements to stable distributable cash flows are the diversity of our asset portfolio, our significant fee-based business representing approximately 60% of our estimated margins, and our highly hedged commodity position, the objective of which is to protect against downside risk in our distributable cash flows.
We incur capital expenditures for our consolidated entities and our unconsolidated affiliates. We anticipate maintenance capital expenditures of between $10.0 and $15.0 million, and expenditures for expansion capital of between $35.0 and $50.0 million in 2011 including $10.0 million for the expansion to storage capacity at our Southeast Texas system. The board of directors may approve additional growth capital during the year at their discretion. This capital does not include any acquisitions or additional investment opportunities that may be identified throughout the course of the year and approved by our management and our board of directors.
In 2011, we expect to continue to pursue a multi-faceted growth strategy, which may include executing on organic opportunities around our footprint, third party acquisitions, and periodic dropdowns from our sponsors in order to grow our distributable cash flows. We also plan to continue to integrate our recent acquisitions and execute on the Wattenberg pipeline expansion project.
We anticipate our business to continue to be affected by the following key trends. Our expectations are based on assumptions made by us and information currently available to us. To the extent our underlying assumptions about or interpretations of available information prove to be incorrect, our actual results may vary materially from our expected results.
Natural Gas Gathering and Processing Margins — Except for our fee-based contracts, which may be impacted by throughput volumes, our natural gas gathering and processing profitability is dependent upon commodity prices, natural gas supply, and demand for natural gas, NGLs and condensate. Commodity prices, which are impacted by the balance between supply and demand, have historically been volatile. Throughput volumes could decline should natural gas prices and drilling levels continue to experience weakness. Our long-term view is that as economic conditions improve, natural gas prices should return to a level that would support continued natural gas production in the United States. During 2010, petrochemical demand remained strong for NGLs as NGLs were a lower cost feedstock when compared to crude oil derived feedstocks. We anticipate this continuing in 2011.
Wholesale Propane Supply and Demand — Due to our multiple propane supply sources, propane supply contractual arrangements, significant storage capabilities, and multiple terminal locations for wholesale propane
58
Table of Contents
delivery, we are generally able to provide our retail propane distribution customers with reliable supplies of propane during peak demand periods of tight supply, usually in the winter months when their retail customers consume the most propane for home heating.
Factors That May Significantly Affect Our Results
Natural Gas Services Segment
Our results of operations for our Natural Gas Services segment are impacted by (1) increases and decreases in the volume and quality of natural gas that we gather and transport through our systems, which we refer to as throughput, (2) the associated Btu content of our system throughput and our related processing volumes, (3) the prices of and relationship between commodities such as NGLs, crude oil and natural gas, (4) the operating efficiency of our processing facilities, (5) potential limitations on throughput volumes arising from downstream and infrastructure capacity constraints, and (6) the terms of our processing contract arrangements with producers.
Throughput and operating efficiency generally are driven by wellhead production, plant recoveries, operating availability of our facilities, physical integrity and our competitive position on a regional basis, and more broadly by demand for natural gas, NGLs and condensate. Historical and current trends in the price changes of commodities may not be indicative of future trends. Throughput and prices are also driven by demand and take-away capacity for residue natural gas and NGLs.
Our processing contract arrangements can have a significant impact on our profitability and cash flow. Our actual contract terms are based upon a variety of factors, including natural gas quality, geographic location, the commodity pricing environment at the time the contract is executed, customer requirements and competition from other midstream service providers. Our gathering and processing contract mix and, accordingly, our exposure to natural gas, NGL and condensate prices, may change as a result of producer preferences, impacting our expansion in regions where certain types of contracts are more common as well as other market factors.
The capacity on certain downstream NGL and natural gas infrastructure has tightened in recent periods and can be further constrained seasonally or when there is severe weather. Constrained market outlets may restrict us from operating our facilities optimally.
Our Natural Gas Services segment operating results are impacted by market conditions causing variability in natural gas, crude oil and NGL prices. The midstream natural gas industry is cyclical, with the operating results of companies in the industry significantly affected by the prevailing price of NGLs. Although the prevailing price of residue natural gas has less short-term significance to our operating results than the price of NGLs, in the long term, the growth and sustainability of our business depends on natural gas prices being at levels sufficient to provide incentives and capital for producers to explore and produce natural gas.
The prices of NGLs, crude oil and natural gas can be extremely volatile for periods of time, and may not always have a close relationship. Due to our hedging program, changes in the relationship of the price of NGLs and crude oil may cause our commodity price exposure to vary, which we have attempted to capture in our commodity price sensitivities in “— Quantitative and Qualitative Disclosures about Market Risk.” Our results may also be impacted as a result of non-cash lower of cost or market inventory or imbalance adjustments, which occur when the market value of commodities decline below our carrying value.
The natural gas services business is highly competitive in our markets and includes major integrated oil and gas companies, interstate and intrastate pipelines, and companies that gather, compress, treat, process, transport and/or market natural gas. Competition is often the greatest in geographic areas experiencing robust drilling by producers and during periods of high commodity prices for crude oil, natural gas and/or natural gas liquids. Competition is also increased in those geographic areas where our commercial contracts with our customers are shorter in length of term and therefore must be renegotiated on a more frequent basis.
Wholesale Propane Logistics Segment
Our Wholesale Propane Logistics segment operating results are impacted by our ability to provide our retail propane distribution customers with reliable supplies of propane. We use physical inventory, physical purchase agreements and financial derivative instruments, with DCP Midstream, LLC or third parties, which
59
Table of Contents
typically match the quantities of propane subject to fixed price sales agreements to mitigate our commodity price risk. Our results may also be impacted as a result of non-cash lower of cost or market inventory adjustments, which occur when the market value of propane declines below our inventory value. We generally recover lower of cost or market inventory adjustments in subsequent periods through the sale of inventory. There may be positive or negative impacts on sales volumes and gross margin from supply disruptions and weather conditions in the mid-atlantic, upper midwestern and northeastern areas of the United States. Our annual sales volumes of propane may decline when these areas experience periods of milder weather in the winter months. Volumes may also be impacted by conservation and reduced demand in a recessionary environment.
The wholesale propane business is highly competitive in our market areas which include the mid-atlantic, upper midwest and northeastern regions of the United States. Our competitors include major integrated oil and gas and energy companies, and interstate and intrastate pipelines.
NGL Logistics Segment
Our NGL Logistics segment operating results are impacted by the throughput volumes of the NGLs we transport on our NGL pipelines and the volumes of NGLs we store in our storage facility. We transport and store NGLs primarily on a fee basis. Throughput may be negatively impacted as a result of our customers operating their processing plants in ethane rejection mode, often as a result of low commodity prices for ethane. Factors that impact the supply and demand of NGLs, as described above in our Natural Gas Services segment, may also impact the throughput and volume for our NGL Logistics segment. Our results may also be impacted as a result of non-cash lower of cost or market inventory adjustments, which occur when the market value of NGLs decline below our carrying value.
Weather
The economic impact of severe weather may negatively affect the nation’s short-term energy supply and demand, and may result in commodity price volatility. Additionally, severe weather may restrict or prevent us from fully utilizing our assets, by damaging our assets, interrupting utilities, and through possible NGL and natural gas curtailments downstream of our facilities, which restricts our production. These impacts may linger past the time of the actual weather event. Severe weather may also impact the supply availability and propane demand in our Wholesale Propane Logistics segment. Although we carry insurance on the vast majority of our assets, insurance may be inadequate to cover our loss in some instances, and in certain circumstances we have been unable to obtain insurance on commercially reasonable terms, if at all.
Capital Markets
Volatility in the capital markets may impact our business in multiple ways, including limiting our producers’ ability to finance their drilling programs and limiting our ability to fund our operations through acquisitions or organic growth projects. These events may impact our counterparties’ ability to perform under their credit or commercial obligations. Where possible, we have obtained additional collateral agreements, letters of credit from highly rated banks, or have managed credit lines, to mitigate a portion of these risks.
Impact of Inflation
Inflation has been relatively low in the United States in recent years. However, the inflation rates impacting our business fluctuate throughout the broad economic and energy business cycles. Consequently, our costs for chemicals, utilities, materials and supplies, labor and major equipment purchases may increase during periods of general business inflation or periods of relatively high energy commodity prices.
Other
The above factors, including sustained deterioration in commodity prices, volumes or other market declines, including a decline in our unit price, may negatively impact our results of operations, and may increase the likelihood of a non-cash impairment charge or non-cash lower of cost or market inventory adjustments.
60
Table of Contents
Recent Events
In January 2011, we announced that we are no longer pursuing a joint venture or alternative transaction structures with EQT Corporation.
On January 27, 2011, the board of directors of the general partner declared a quarterly distribution of $0.6175 per unit, payable on February 14, 2011 to unitholders of record on February 7, 2011.
On December 30, 2010, we acquired all of the interests in Marysville Hydrocarbons Holdings, LLC, or Marysville. The acquisition involved three separate transactions with a number of parties. The Partnership acquired a 90% interest in Marysville from Dart Energy Corporation, a 5% interest in Marysville from Prospect Street Energy, LLC and 100% of EE Group, LLC, which owns the remaining 5% interest in Marysville. We paid a purchase price of $94.8 million and $6.0 million for net working capital and other adjustments, for an aggregate purchase price of $100.8 million subject to customary purchase price adjustments, for our 100% interest. The purchase was financed at closing with borrowings under the Partnership’s revolving credit facility. $21.2 million of the purchase price has been deposited in an indemnity escrow to satisfy certain tax liabilities and provide for breaches of representations and warranties of the sellers.
On November 4, 2010, we entered into agreements with DCP Midstream, LLC to acquire a 33.33% interest in Southeast Texas for $150.0 million. The Southeast Texas system is a fully integrated midstream business which includes 675 miles of natural gas pipelines, three natural gas processing plants with recently increased processing capacity totaling 380 MMcf/d and natural gas storage assets with 9 Bcf of existing storage capacity. The terms of the joint venture agreement provide that distributions to us for the first seven years related to storage and transportation gross margin will be pursuant to a fee-based arrangement, based on storage capacity and tailgate volumes. Distributions related to the gathering and processing business, along with reductions for all expenditures, will be pursuant to our and DCP Midstream, LLC’s respective ownership interests in Southeast Texas. This acquisition closed on January 1, 2011.
In November 2010, we issued 2,875,000 common units at $34.96 per unit. We received proceeds of $96.2 million, net of offering costs.
Our Operations
We manage our business and analyze and report our results of operations on a segment basis. Our operations are divided into our Natural Gas Services segment, our Wholesale Propane Logistics segment and our NGL Logistics segment.
Natural Gas Services Segment
Results of operations from our Natural Gas Services segment are determined primarily by the volumes of natural gas gathered, compressed, treated, processed, transported, stored and sold through our gathering, processing and pipeline systems; the volumes of NGLs and condensate sold; and the level of our realized natural gas, NGL and condensate prices. We generate our revenues and our gross margin for our Natural Gas Services segment principally from contracts that contain a combination of the following arrangements:
| • | Fee-based arrangements — Under fee-based arrangements, we receive a fee or fees for one or more of the following services: gathering, compressing, treating, processing, transporting or storing natural gas. Our fee-based arrangements include natural gas purchase arrangements pursuant to which we purchase natural gas at the wellhead or other receipt points, at an index related price at the delivery point less a specified amount, generally the same as the transportation fees we would otherwise charge for transportation of natural gas from the wellhead location to the delivery point. The revenues we earn are directly related to the volume of natural gas or NGLs that flows through our systems and are not directly dependent on commodity prices. However, to the extent a sustained decline in commodity prices results in a decline in volumes, our revenues from these arrangements would be reduced. |
| • | Percent-of-proceeds/liquids arrangements — Under percent-of-proceeds arrangements, we generally purchase natural gas from producers at the wellhead, or other receipt points, gather the wellhead natural gas through our gathering system, treat and process the natural gas, and then sell the resulting residue natural gas, NGLs and condensate based on index prices from published index market prices. We remit |
61
Table of Contents
| to the producers either an agreed-upon percentage of the actual proceeds that we receive from our sales of the residue natural gas, NGLs and condensate, or an agreed-upon percentage of the proceeds based on index related prices for the natural gas, NGLs and condensate, regardless of the actual amount of the sales proceeds we receive. We keep the difference between the proceeds received and the amount remitted back to the producer. Under percent-of-liquids arrangements, we do not keep any amounts related to residue natural gas proceeds and only keep amounts related to the difference between the proceeds received and the amount remitted back to the producer related to NGLs and condensate. Certain of these arrangements may also result in our returning all or a portion of the residue natural gas and/or the NGLs to the producer, in lieu of returning sales proceeds. Additionally, these arrangements may include fee-based components. Our revenues under percent-of-proceeds arrangements relate directly with the price of natural gas, NGLs and condensate. Our revenues under percent-of-liquids arrangements relate directly with the price of NGLs and condensate. |
In addition to the above contract types, we have keep-whole arrangements, which are estimated to generate less than 6% of our gross margin. Our equity method investment in Discovery, also has keep-whole arrangements. Under the terms of a keep-whole processing contract, natural gas is gathered from the producer for processing, the NGLs and condensate are sold and the residue natural gas is returned to the producer with a Btu content equivalent to the Btu content of the natural gas gathered. This arrangement keeps the producer whole to the thermal value of the natural gas received. Under this type of contract, we are exposed to the frac spread. The frac spread is the difference between the value of the NGLs and condensate extracted from processing and the value of the Btu equivalent of the residue natural gas. We benefit in periods when NGL and condensate prices are higher relative to natural gas prices when that frac spread exceeds the operating costs. Fluctuations in commodity prices are expected to continue to impact the operating costs of these entities.
The natural gas supply for our gathering pipelines and processing plants is derived primarily from natural gas wells located in Colorado, Louisiana, Michigan, Oklahoma, Texas, Wyoming and the Gulf of Mexico. The Pelico system also receives natural gas produced in Texas through its interconnect with other pipelines that transport natural gas from Texas into western Louisiana. These areas have historically experienced significant levels of drilling activity, providing us with opportunities to access newly developed natural gas supplies. We identify primary suppliers as those individually representing 10% or more of our total natural gas supply. Our one primary supplier of natural gas in our Natural Gas Services segment represented approximately 14% of the natural gas supplied to this system in 2010. We actively seek new supplies of natural gas, both to offset natural declines in the production from connected wells and to increase throughput volume. We obtain new natural gas supplies in our operating areas by contracting for production from new wells, connecting new wells drilled on dedicated acreage, or by obtaining natural gas that has been directly received or released from other gathering systems. In 2010, due to the decline in producer drilling in various areas in which we operate, new well connections have been at reduced levels.
We sell natural gas to marketing affiliates of natural gas pipelines, marketing affiliates of integrated oil companies, marketing affiliates of DCP Midstream, LLC, national wholesale marketers, industrial end-users and gas-fired power plants. We typically sell natural gas under market index related pricing terms. The NGLs extracted from the natural gas at our processing plants are sold at market index prices to DCP Midstream, LLC or its affiliates, or to third parties. In addition, under our merchant arrangements, we use a subsidiary of DCP Midstream, LLC as our agent to purchase natural gas from third parties at pipeline interconnect points, as well as residue gas from our Minden and Ada processing plants, and then resell the aggregated natural gas to third parties.
We manage the commodity price risk of our supply portfolio and sales portfolio with both physical and financial transactions. As a service to our customers, we may enter into physical fixed price natural gas purchases and sales, utilizing financial derivatives to swap this fixed price risk back to market index. We may enter into financial derivatives to lock in time spreads and price differentials across the Pelico system to maximize the value of pipeline and storage capacity. We also gather, process and transport natural gas under fee-based transportation contracts. Our Southeast Texas system also manages the value of pipeline and storage capacity in a similar manner, although our 33.33% distributions for the first seven years are fee-based such that we are not exposed to that activity.
62
Table of Contents
Wholesale Propane Logistics Segment
We operate a wholesale propane logistics business in the mid-atlantic, upper midwest and northeastern United States. We purchase large volumes of propane supply from natural gas processing plants and fractionation facilities, and crude oil refineries, primarily located in the Texas and Louisiana Gulf Coast area, Canada and other international sources, and transport these volumes of propane supply by pipeline, rail or ship to our terminals and storage facilities in the mid-atlantic, midwest and the northeastern areas of the United States. We identify primary suppliers as those individually representing 10% or more of our total propane supply. Our four primary suppliers of propane, two of which are affiliated entities, represented approximately 91% of our propane supplied in 2010. We sell propane on a wholesale basis to retail propane distributors who in turn resell propane to their retail customers.
Due to our multiple propane supply sources, annual and long-term propane supply purchase arrangements, significant storage capabilities, and multiple terminal locations for wholesale propane delivery, we are generally able to provide our retail propane distribution customers with reliable supplies of propane during periods of tight supply, such as the winter months when their retail customers generally consume the most propane for home heating. In particular, we generally offer our customers the ability to obtain propane supply volumes from us in the winter months that are generally significantly greater than their purchase of propane from us in the summer. We believe these factors generally allow us to maintain our generally favorable relationships with our customers.
We manage our wholesale propane margins by selling propane to retail propane distributors under annual sales agreements negotiated each spring which specify floating price terms that provide us a margin in excess of our floating index-based supply costs under our supply purchase arrangements. Our portfolio of multiple supply sources and storage capabilities allows us to actively manage our propane supply purchases and to lower the aggregate cost of supplies. Based on the carrying value of our inventory, timing of inventory transactions and the volatility of the market value of propane, we have historically and may continue to periodically recognize non-cash lower of cost or market inventory adjustments. In addition, we may use financial derivatives to manage the value of our propane inventories.
NGL Logistics Segment
Our pipelines and storage facility provide transportation and storage services for customers, primarily on a fee basis. We have entered into contractual arrangements with DCP Midstream, LLC and others that generally require customers to pay us to transport or store NGLs pursuant to a fee-based rate that is applied to volumes. Therefore, the results of operations for this business segment are generally dependent upon the volume of product transported or stored and the level of fees charged to customers. We do not take title to the products transported on our NGL pipelines or stored in our storage facility; rather, the customer retains title and the associated commodity price risk. DCP Midstream, LLC provides 100% of volumes transported on the Seabreeze and Wilbreeze pipelines. For the Black Lake pipeline, any line loss or gain in NGLs is allocated to the shipper. The volumes of NGLs transported on our pipelines are dependent on the level of production of NGLs from processing plants connected to our NGL pipelines. When natural gas prices are high relative to NGL prices, it is less profitable to process natural gas because of the higher value of natural gas compared to the value of NGLs and because of the increased cost of separating the NGLs from the natural gas. As a result, we have experienced periods in the past, in which higher natural gas prices reduce the volume of NGLs extracted at plants connected to our NGL pipelines and, in turn, lower the NGL throughput on our assets. In the transportation markets we serve, our pipelines are the sole pipeline facility transporting NGLs from the supply source. Our storage facility in Marysville, Michigan provides storage and related services primarily to depositories operating in the liquid hydrocarbons industry.
How We Evaluate Our Operations
Our management uses a variety of financial and operational measurements to analyze our performance. These measurements include the following: (1) volumes; (2) gross margin, segment gross margin and adjusted segment gross margin; (3) operating and maintenance expense, and general and administrative expense; (4) adjusted EBITDA; and (5) distributable cash flow. Gross margin, segment gross margin, adjusted segment
63
Table of Contents
gross margin, adjusted EBITDA and distributable cash flow are not measures under accounting principles generally accepted in the United States of America, or GAAP. To the extent permitted, we present certain non-GAAP measures and reconciliations of those measures to their most directly comparable financial measures as calculated and presented in accordance with GAAP. These non-GAAP measures may not be comparable to a similarly titled measure of another company because other entities may not calculate these non-GAAP measures in the same manner.
Volumes — We view throughput volumes for our Natural Gas Services segment and our NGL Logistics segment, and sales volumes for our Wholesale Propane Logistics segment as important factors affecting our profitability. We gather and transport some of the natural gas and NGLs under fee-based transportation contracts. Revenue from these contracts is derived by applying the rates stipulated to the volumes transported. Pipeline throughput volumes from existing wells connected to our pipelines will naturally decline over time as wells deplete. Accordingly, to maintain or to increase throughput levels on these pipelines and the utilization rate of our natural gas processing plants, we must continually obtain new supplies of natural gas and NGLs. Our ability to maintain existing supplies of natural gas and NGLs and obtain new supplies are impacted by: (1) the level of workovers or recompletions of existing connected wells and successful drilling activity in areas currently dedicated to our pipelines; and (2) our ability to compete for volumes from successful new wells in other areas. The throughput volumes of NGLs on our pipelines are substantially dependent upon the quantities of NGLs produced at our processing plants, as well as NGLs produced at other processing plants that have pipeline connections with our NGL pipelines. We regularly monitor producer activity in the areas we serve and in which our pipelines are located, and pursue opportunities to connect new supply to these pipelines.
Gross Margin, Segment Gross Margin and Adjusted Segment Gross Margin — We view our gross margin as an important performance measure of the core profitability of our operations. We review our gross margin monthly for consistency and trend analysis.
We define gross margin as total operating revenues, including commodity derivative activity, less purchases of natural gas, propane and NGLs, and we define segment gross margin for each segment as total operating revenues for that segment less commodity purchases for that segment. Our gross margin equals the sum of our segment gross margins. We define adjusted segment gross margin as segment gross margin plus non-cash commodity derivative losses, less non-cash commodity derivative gains for that segment. Gross margin, segment gross margin and adjusted segment gross margin are primary performance measures used by management, as these measures represent the results of product sales and purchases, a key component of our operations. As an indicator of our operating performance, gross margin, segment gross margin and adjusted segment gross margin should not be considered an alternative to, or more meaningful than, net income or loss, net income or loss attributable to partners, operating income, cash flows from operating activities or any other measure of financial performance presented in accordance with GAAP.
64
Table of Contents
Our gross margin, segment gross margin and adjusted segment gross margin may not be comparable to a similarly titled measure of another company because other entities may not calculate these measures in the same manner. The following table sets forth our reconciliation of certain non-GAAP measures:
Reconciliation of Non-GAAP Measures
| Year Ended December 31, | ||||||||||||
| 2010 | 2009 | 2008 | ||||||||||
| (Millions) | ||||||||||||
| Reconciliation of net income (loss) attributable to partners to gross margin: |
| |||||||||||
| Net income(loss) attributable to partners |
$ | 48.0 | $ | (19.1 | ) | $ | 141.9 | |||||
| Interest expense |
29.1 | 28.3 | 32.8 | |||||||||
| Income tax expense |
0.3 | 0.6 | 0.6 | |||||||||
| Operating and maintenance expense |
79.8 | 69.7 | 77.4 | |||||||||
| Depreciation and amortization expense |
73.7 | 64.9 | 53.2 | |||||||||
| General and administrative expense |
33.7 | 32.3 | 33.3 | |||||||||
| Other income |
(1.0 | ) | — | (1.5 | ) | |||||||
| Other income — affiliate |
(3.0 | ) | — | — | ||||||||
| Step acquisition — equity interest re-measurement gain |
(9.1 | ) | — | — | ||||||||
| Interest income |
— | (0.3 | ) | (6.1 | ) | |||||||
| Earnings from unconsolidated affiliates |
(23.8 | ) | (18.5 | ) | (18.2 | ) | ||||||
| Net income attributable to noncontrolling interests |
9.2 | 8.3 | 36.1 | |||||||||
| Gross margin |
$ | 236.9 | $ | 166.2 | $ | 349.5 | ||||||
| Non-cash commodity derivative mark-to-market(a) |
$ | (5.4 | ) | $ | (83.4 | ) | $ | 101.6 | ||||
| Reconciliation of segment net income(loss) attributable to partners to segment gross margin: |
||||||||||||
| Natural Gas Services segment: |
||||||||||||
| Segment net income(loss) attributable to partners |
$ | 77.3 | $ | (2.1 | ) | $ | 195.7 | |||||
| Operating and maintenance expense |
63.5 | 58.2 | 66.5 | |||||||||
| Depreciation and amortization expense |
69.1 | 61.9 | 50.5 | |||||||||
| Other income |
(1.0 | ) | — | — | ||||||||
| Earnings from unconsolidated affiliates |
(23.0 | ) | (16.6 | ) | (17.4 | ) | ||||||
| Net income attributable to noncontrolling interests |
9.2 | 8.3 | 36.1 | |||||||||
| Segment gross margin |
$ | 195.1 | $ | 109.7 | $ | 331.4 | ||||||
| Non-cash commodity derivative mark-to-market(a) |
$ | (4.4 | ) | $ | (84.2 | ) | $ | 99.2 | ||||
| Wholesale Propane Logistics segment: |
||||||||||||
| Segment net income attributable to partners |
$ | 17.4 | $ | 37.2 | $ | 1.3 | ||||||
| Operating and maintenance expense |
12.6 | 10.3 | 9.9 | |||||||||
| Depreciation and amortization expense |
1.9 | 1.4 | 1.3 | |||||||||
| Other income |
— | — | (1.5 | ) | ||||||||
| Other income — affiliate |
(3.0 | ) | — | — | ||||||||
| Segment gross margin |
$ | 28.9 | $ | 48.9 | $ | 11.0 | ||||||
| Non-cash commodity derivative mark-to-market(a) |
$ | (1.0 | ) | $ | 0.8 | $ | 2.4 | |||||
| NGL Logistics segment: |
||||||||||||
| Segment net income attributable to partners |
$ | 16.5 | $ | 6.9 | $ | 5.5 | ||||||
| Operating and maintenance expense |
3.7 | 1.2 | 1.0 | |||||||||
| Depreciation and amortization expense |
2.6 | 1.4 | 1.4 | |||||||||
| Step acquisition – equity interest re-measurement gain |
(9.1 | ) | — | — | ||||||||
| Earnings from unconsolidated affiliates |
(0.8 | ) | (1.9 | ) | (0.8 | ) | ||||||
| Segment gross margin |
$ | 12.9 | $ | 7.6 | $ | 7.1 | ||||||
| (a) | Non-cash commodity derivative mark-to-market is included in segment gross margin, along with cash settlements for our derivative contracts. |
65
Table of Contents
Operating and Maintenance and General and Administrative Expense — Operating and maintenance expenses are costs associated with the operation of a specific asset and are primarily comprised of direct labor, ad valorem taxes, repairs and maintenance, lease expenses, utilities and contract services. These expenses fluctuate depending on the activities performed during a specific period. General and administrative expenses are as follows:
| Year Ended December 31, | ||||||||||||
| 2010 | 2009 | 2008 | ||||||||||
| Affiliate: |
||||||||||||
| Omnibus Agreement |
$ | 9.9 | $ | 9.7 | $ | 9.8 | ||||||
| Other — DCP Midstream, LLC |
9.3 | 10.4 | 10.4 | |||||||||
| Other — affiliate |
0.2 | 0.3 | — | |||||||||
| Total affiliate |
19.4 | 20.4 | 20.2 | |||||||||
| Third Party |
14.3 | 11.9 | 13.1 | |||||||||
| Total |
$ | 33.7 | $ | 32.3 | $ | 33.3 | ||||||
We have entered into an omnibus agreement, as amended, or the Omnibus Agreement, with DCP Midstream, LLC. Under the Omnibus Agreement, we are required to reimburse DCP Midstream, LLC for salaries of operating personnel and employee benefits, as well as capital expenditures, maintenance and repair costs, taxes and other direct costs incurred by DCP Midstream, LLC on our behalf. We also pay DCP Midstream, LLC an annual fee under the Omnibus Agreement for centralized corporate functions performed by DCP Midstream, LLC on our behalf, including legal, accounting, cash management, insurance administration and claims processing, risk management, health, safety and environmental, information technology, human resources, credit, payroll, taxes and engineering.
On January 1, 2011, we extended the omnibus agreement through December 31, 2011 for $10.2 million. The Omnibus Agreement also addresses the following matters:
| • | DCP Midstream, LLC’s obligation to indemnify us for certain liabilities and our obligation to indemnify DCP Midstream, LLC for certain liabilities; |
| • | DCP Midstream, LLC’s obligation to continue to maintain its credit support for our obligations related to commercial contracts with respect to its business or operations that were in effect at December 7, 2005 until the expiration of such contracts; and |
| • | Our general partner will have the right to agree to further increases in connection with expansions of our operations through the acquisition or construction of new assets or businesses, with the concurrence of the special committee of DCP Midstream GP, LLC’s board of directors. |
East Texas incurs general and administrative expenses directly from DCP Midstream, LLC. During the years ended December 31, 2010, 2009 and 2008, East Texas incurred $7.8 million, $8.5 million and $8.6 million, respectively, for general and administrative expenses from DCP Midstream, LLC, which includes expenses for our predecessor operations.
Outside of the Omnibus Agreement and amounts incurred by East Texas, we incurred other fees with DCP Midstream, LLC, which includes expenses for our predecessor operations, of $1.5 million, $1.9 million and $1.8 million, respectively, for the years ended December 31, 2010, 2009 and 2008, respectively. These amounts include allocated expenses, including professional services, insurance and internal audit.
We also incurred third party general and administrative expenses, which were primarily related to compensation and benefit expenses of the personnel who provide direct support to our operations. Also included are expenses associated with annual and quarterly reports to unitholders, tax return and Schedule K-1 preparation and distribution, independent auditor fees, due diligence and acquisition costs, costs associated with the Sarbanes-Oxley Act of 2002, investor relations activities, registrar and transfer agent fees, incremental director and officer liability insurance costs, and director compensation.
Adjusted EBITDA and Distributable Cash Flow — We define adjusted EBITDA as net income or loss attributable to partners less interest income, noncontrolling interest in depreciation and income tax expense and non-cash commodity derivative gains, plus interest expense, income tax expense, depreciation and amortization
66
Table of Contents
expense and non-cash commodity derivative losses. Adjusted EBITDA is used as a supplemental liquidity and performance measure by our management and by external users of our financial statements, such as investors, commercial banks, research analysts and others, to assess:
| • | the ability of our assets to generate cash sufficient to pay interest costs, support our indebtedness, make cash distributions to our unitholders and general partner, and finance maintenance capital expenditures; |
| • | financial performance of our assets without regard to financing methods, capital structure or historical cost basis; |
| • | our operating performance and return on capital as compared to those of other companies in the midstream energy industry, without regard to financing methods or capital structure; and |
| • | the viability of acquisitions and capital expenditure projects and the overall rates of return on alternative investment opportunities. |
Our adjusted EBITDA may not be comparable to a similarly titled measure of another company because other entities may not calculate this measure in the same manner.
Adjusted EBITDA should not be considered an alternative to, or more meaningful than, net income or loss, net income or loss attributable to partners, operating income, cash flows from operating activities or any other measure of financial performance presented in accordance with GAAP as measures of operating performance, liquidity or ability to service debt obligations.
We define Distributable Cash Flow as net cash provided by or used in operating activities, less maintenance capital expenditures, net of reimbursable projects, plus or minus adjustments for non-cash mark-to-market of derivative instruments, proceeds from divestiture of assets, net income attributable to noncontrolling interest net of depreciation and income tax, net changes in operating assets and liabilities, and other adjustments to reconcile net cash provided by or used in operating activities (see “— Liquidity and Capital Resources” for further definition of maintenance capital expenditures). Maintenance capital expenditures are capital expenditures made where we add on to or improve capital assets owned, or acquire or construct new capital assets, if such expenditures are made to maintain, including over the long term, our operating capacity or revenues. Non-cash mark-to-market of derivative instruments is considered to be non-cash for the purpose of computing Distributable Cash Flow because settlement will not occur until future periods, and will be impacted by future changes in commodity prices. Distributable Cash Flow is used as a supplemental liquidity and performance measure by our management and by external users of our financial statements, such as investors, commercial banks, research analysts and others, to assess our ability to make cash distributions to our unitholders and our general partner. Our Distributable Cash Flow may not be comparable to a similarly titled measure of another company because other entities may not calculate Distributable Cash Flow in the same manner.
67
Table of Contents
Results of Operations
Consolidated Overview
The following table and discussion is a summary of our consolidated results of operations for the three years ended December 31, 2010, 2009 and 2008. The results of operations by segment are discussed in further detail following this consolidated overview discussion.
| Variance 2010 vs. 2009 |
Variance 2009 vs. 2008 |
|||||||||||||||||||||||||||
| Year Ended December 31, | Increase (Decrease) |
Percent | Increase (Decrease) |
Percent | ||||||||||||||||||||||||
| 2010(a)(b) | 2009(a)(b) | 2008(a)(b) | ||||||||||||||||||||||||||
| (Millions, except as indicated) | ||||||||||||||||||||||||||||
| Operating revenues: |
||||||||||||||||||||||||||||
| Natural Gas Services(c) |
$ | 778.7 | $ | 583.7 | $ | 1,336.2 | $ | 195.0 | 33 | % | $ | (752.5 | ) | (56 | )% | |||||||||||||
| Wholesale Propane Logistics |
473.2 | 348.2 | 483.0 | 125.0 | 36 | % | (134.8 | ) | (28 | )% | ||||||||||||||||||
| NGL Logistics |
17.6 | 10.5 | 11.3 | 7.1 | 68 | % | (0.8 | ) | (7 | )% | ||||||||||||||||||
| Total operating revenues |
1,269.5 | 942.4 | 1,830.5 | 327.1 | 35 | % | (888.1 | ) | (49 | )% | ||||||||||||||||||
| Gross margin(d): |
||||||||||||||||||||||||||||
| Natural Gas Services |
195.1 | 109.7 | 331.4 | 85.4 | 78 | % | (221.7 | ) | (67 | )% | ||||||||||||||||||
| Wholesale Propane Logistics |
28.9 | 48.9 | 11.0 | (20.0 | ) | (41 | )% | 37.9 | 345 | % | ||||||||||||||||||
| NGL Logistics |
12.9 | 7.6 | 7.1 | 5.3 | 70 | % | 0.5 | 7 | % | |||||||||||||||||||
| Total gross margin |
236.9 | 166.2 | 349.5 | 70.7 | 43 | % | (183.3 | ) | (52 | )% | ||||||||||||||||||
| Operating and maintenance expense |
(79.8 | ) | (69.7 | ) | (77.4 | ) | 10.1 | 14 | % | (7.7 | ) | (10 | )% | |||||||||||||||
| Depreciation and amortization expense |
(73.7 | ) | (64.9 | ) | (53.2 | ) | 8.8 | 14 | % | 11.7 | 22 | % | ||||||||||||||||
| General and administrative expense |
(33.7 | ) | (32.3 | ) | (33.3 | ) | 1.4 | 4 | % | (1.0 | ) | (3 | )% | |||||||||||||||
| Step acquisition — equity interest re-measurement gain |
9.1 | — | — | 9.1 | 100 | % | — | — | % | |||||||||||||||||||
| Other income |
1.0 | — | 1.5 | 1.0 | 100 | % | (1.5 | ) | (100 | )% | ||||||||||||||||||
| Other income — affiliates |
3.0 | — | — | 3.0 | 100 | % | — | — | % | |||||||||||||||||||
| Earnings from unconsolidated affiliates(e) |
23.8 | 18.5 | 18.2 | 5.3 | 29 | % | 0.3 | 2 | % | |||||||||||||||||||
| Interest income |
— | 0.3 | 6.1 | (0.3 | ) | (100 | )% | (5.8 | ) | (95 | )% | |||||||||||||||||
| Interest expense |
(29.1 | ) | (28.3 | ) | (32.8 | ) | 0.8 | 3 | % | (4.5 | ) | (14 | )% | |||||||||||||||
| Income tax expense |
(0.3 | ) | (0.6 | ) | (0.6 | ) | (0.3 | ) | (50 | )% | — | — | % | |||||||||||||||
| Net income attributable to noncontrolling interests |
(9.2 | ) | (8.3 | ) | (36.1 | ) | 0.9 | 11 | % | (27.8 | ) | (77 | )% | |||||||||||||||
| Net income (loss) attributable to partners |
$ | 48.0 | $ | (19.1 | ) | $ | 141.9 | $ | 67.1 | * | $ | (161.0 | ) | * | ||||||||||||||
| Other data: |
||||||||||||||||||||||||||||
| Non-cash commodity derivative mark-to-market |
$ | (5.4 | ) | $ | (83.4 | ) | $ | 101.6 | $ | 78.0 | 94 | % | $ | (185.0 | ) | * | ||||||||||||
| Natural gas throughput (MMcf/d)(e) |
1,168 | 1,072 | 961 | 96 | 9 | % | 111 | 12 | % | |||||||||||||||||||
| NGL gross production (Bbls/d)(e) |
33,521 | 28,831 | 28,000 | 4,690 | 16 | % | 831 | 3 | % | |||||||||||||||||||
| Propane sales volume (Bbls/d) |
22,350 | 22,278 | 21,053 | 72 | — | % | 1,225 | 6 | % | |||||||||||||||||||
| NGL pipelines throughput (Bbls/d)(e) |
38,282 | 30,160 | 31,407 | 8,122 | 27 | % | (1,247 | ) | (4 | )% | ||||||||||||||||||
| * | Percentage change is not meaningful. |
| (a) | Includes the results of certain companies that held natural gas gathering and treating assets purchased from MichCon Pipeline Company since November 24, 2009, the date of acquisition, and the results of Michigan Pipeline & Processing, LLC, or MPP, since October 1, 2008, the date of acquisition, in our Natural Gas Services Segment. |
Includes the results of Atlantic Energy, since July 30, 2010, the date of acquisition, in our Wholesale Propane Logistics segment.
68
Table of Contents
Includes the results of our Wattenberg pipeline acquired from Buckeye Partners, L.P, since January 28, 2010, the date of acquisition, and an additional 50% interest in Black Lake acquired from an affiliate of BP PLC, since July 30, 2010, the date of acquisition, in our NGL Logistics segment. The acquisition of an additional 50% interest in Black Lake brought our ownership interest in Black Lake to 100%. Prior to our acquisition of an additional 50% interest in Black Lake, we accounted for Black Lake under the equity method of accounting. Subsequent to this transaction we account for Black Lake as a consolidated subsidiary.
The impact to our results related to Marysville, acquired on December 30, 2010, is not significant.
| (b) | We utilize commodity derivative instruments to provide stability to distributable cash flows for our proportionate ownership in East Texas as well as all other natural gas services assets. We do not utilize commodity derivative instruments for the proportionate interest in East Texas that is owned by DCP Midstream, LLC. As such, the portion of East Texas owned by DCP Midstream, LLC is unhedged. Our consolidated results depict 75% of East Texas unhedged in all periods prior to the second quarter of 2009 and 49.9% of East Texas unhedged for all periods subsequent to the first quarter of 2009 corresponding with DCP Midstream, LLC’s ownership interest in East Texas in each period. |
| (c) | Includes the effect of the acquisition of the NGL Hedge, contributed by DCP Midstream, LLC, in April 2009. The NGL Hedge was a fixed price natural gas liquids derivative by NGL component, which commenced in April 2009 and expired in March 2010. The NGL Hedge was for a total of 1.9 million barrels at $66.72 per barrel. |
| (d) | Gross margin consists of total operating revenues, including commodity derivative activity, less purchases of natural gas, propane and NGLs, and segment gross margin for each segment consists of total operating revenues for that segment, less commodity purchases for that segment. Please read “How We Evaluate Our Operations” above. |
| (e) | Includes our proportionate share of the throughput volumes and NGL production of Collbran, Jackson Pipeline Company, or Jackson, East Texas, and Discovery and our proportionate earnings of Discovery. Earnings for Discovery include the accretion of the net difference between the carrying amount of the investment and the underlying equity of the investment. |
| For periods prior to July 30, 2010, includes our 50% share of the throughput volumes and earnings for Black Lake. Black Lake’s earnings included the accretion of the net difference between the carrying amount of the investment and the underlying equity of the investment. |
Year Ended December 31, 2010 vs. Year Ended December 31, 2009
Total Operating Revenues — Total operating revenues increased in 2010 compared to 2009, primarily as a result of the following:
| • | $126.6 million increase primarily attributable to higher propane prices and our acquisition of Atlantic Energy in July 2010, which impact both sales and purchases, partially offset by a planned outage related to our Providence terminal inspection and reduced demand as a result of an early spring and warmer weather; |
| • | $122.7 million increase primarily attributable to higher commodity prices, which impact both sales and purchases, and an increase in NGL production, partially offset by changes in contract mix, increased fuel consumption, differences in gas quality, the impact of volume curtailments due to plant shutdowns and producer wellhead freeze offs as a result of near record cold weather at East Texas and North Louisiana in the first quarter, as well as a decrease in natural gas sales volumes across certain assets. 2009 results include the first quarter impact of a third party owned pipeline rupture, resulting in a fire at East Texas and our Wyoming pipeline integrity and system enhancement project; |
| • | $57.3 million increase related to commodity derivative activity. This increase includes a decrease in unrealized losses of $77.5 million due to movements in forward prices of commodities, partially offset by a decrease in realized cash settlement gains of $20.2 million due to generally higher average prices of commodities in 2010; and |
69
Table of Contents
| • | $20.1 million increase in transportation, processing and other revenue, which represents our fee-based revenues, primarily as a result of increased throughput volumes due to our Michigan and Wattenberg acquisitions, our acquisition of an additional 50% interest in Black Lake, our organic growth project in the Piceance Basin, as well as the renegotiation of commodity sensitive contracts to fee-based contracts. |
Gross Margin — Gross margin increased in 2010 compared to 2009, primarily as a result of the following:
| • | $85.4 million increase for our Natural Gas Services segment, primarily related to commodity derivative activity as explained in the operating revenue section above, higher commodity prices, increased fee-based throughput volumes resulting from the Michigan acquisition, our organic growth project in the Piceance Basin and the renegotiation of commodity sensitive contracts to fee-based contracts, partially offset by reduced natural gas basis spreads, increased fuel consumption, decreased natural gas volumes and differences in gas quality across certain of our assets, as well as the impact of volume curtailments due to plant shutdowns and producer wellhead freeze offs as a result of near record cold weather at East Texas and North Louisiana in the first quarter. 2009 results include the first quarter impact of a third party owned pipeline rupture, resulting in a fire at East Texas and operational downtime; and |
| • | $5.3 million increase for our NGL Logistics segment as a result of higher volumes from our Wattenberg pipeline acquisition and our acquisition of an additional 50% interest in Black Lake. |
These increases were partially offset by:
| • | $20.0 million decrease for our Wholesale Propane Logistics segment. 2010 results reflect a planned outage related to our Providence terminal inspection and reduced demand as a result of an early spring and warmer weather. 2009 results reflect increased spot sales volumes and significantly higher per unit margins, approximately $6.0 million of which was attributable to the sale of inventory that was written down at the end of the fourth quarter of 2008. |
Operating and Maintenance Expense — Operating and maintenance expense increased in 2010 compared to 2009 primarily as a result of our Michigan acquisition and integration costs, turnaround activities at certain assets, our Wattenberg pipeline acquisition and our acquisition of an additional 50% interest in Black Lake.
Depreciation and Amortization Expense — Depreciation and amortization expense increased in 2010 compared to 2009, primarily as a result of our capital projects completed in 2009, our Michigan acquisition, our Atlantic Energy acquisition, our Wattenberg pipeline acquisition and our acquisition of an additional 50% interest in Black Lake.
Step acquisition — equity interest re-measurement gain — Step acquisition — equity interest re-measurement gain results from our acquisition of an additional 50% interest in Black Lake, bringing our ownership interest in Black Lake to 100% in our NGL Logistics segment. Prior to our acquisition of an additional 50% interest in Black Lake, we accounted for Black Lake under the equity method of accounting. Subsequent to this transaction we account for Black Lake as a consolidated subsidiary. As a result of acquiring an additional 50% interest in Black Lake, we remeasured our initial 50% equity interest in Black Lake to its fair value, and recognized a gain of $9.1 million.
Other income — affiliates — Other income — affiliates increased due to a $3.0 million payment received in the second quarter of 2010 from Spectra Energy, a supplier for our Wholesale Propane Logistics segment, related to an amendment of a supply agreement to shorten the term of the agreement by two years.
Earnings from Unconsolidated Affiliates — Earnings from unconsolidated affiliates increased in 2010 compared to 2009, primarily as a result of increased earnings from Discovery. Settlements related to our commodity derivatives on our unconsolidated affiliates are included in segment gross margin.
Net income attributable to noncontrolling interests — Net income attributable to noncontrolling interests includes the impact of organic growth from our Piceance Basin expansion project, offset by volume curtailments due to plant shutdowns and producer wellhead freeze offs as a result of near record cold weather in the first quarter, increased fuel consumption and differences in gas quality at East Texas in 2010. 2009 results include the first quarter impact of a third party owned pipeline rupture, resulting in a fire at East Texas.
70
Table of Contents
Year Ended December 31, 2009 vs. Year Ended December 31, 2008
Total Operating Revenues — Total operating revenues decreased in 2009 compared to 2008, primarily due to the following:
| • | $622.2 million decrease primarily attributable to decreased commodity prices, which impact both sales and purchases, and a decrease in natural gas sales volumes across certain assets. 2009 results include the impact of a third party owned pipeline rupture, resulting in a fire at East Texas. Results in both years were impacted by hurricanes and operational downtime for our Natural Gas Services segment; |
| • | $137.5 million decrease related to commodity derivative activity. This increase in losses includes an increase in unrealized losses of $184.8 million due to forward prices of commodities increasing in 2009 compared to 2008, partially offset by an increase in realized cash settlement gains of $47.3 million due to generally lower average prices of commodities in 2009; |
| • | $134.9 million decrease primarily attributable to lower propane prices, which impact both sales and purchases, partially offset by increased sales volumes, for our Wholesale Propane Logistics segment; and |
| • | $2.4 million decrease due primarily to lower NGL throughput volumes partially offset by increased per unit margins, for our NGL Logistics segment. |
These decreases were partially offset by:
| • | $9.1 million increase in transportation processing and other revenue, which represents our fee-based revenue, primarily attributable to increased throughput volumes due to our Michigan acquisitions, partially offset by decreases in throughput volumes across other assets. |
Gross Margin — Gross margin decreased in 2009 compared to 2008, primarily due to the following:
| • | $221.7 million decrease for our Natural Gas Services segment primarily due to decreases related to commodity derivative activity, lower commodity prices and lower natural gas volumes across certain assets. These decreases include the impact of a third party owned pipeline rupture, resulting in a fire at East Texas in the first quarter of 2009. The decreases were partially offset by increased fee-based throughput volumes due to our Michigan acquisitions. Results in both years were impacted by hurricanes and operational downtime. |
These decreases were partially offset by:
| • | $37.9 million increase for our Wholesale Propane Logistics segment as a result of increased volumes and margins, a portion of which was attributable to the sale of inventory that was written down at the end of the fourth quarter of 2008. |
| • | $0.5 million increase for our NGL Logistics segment, primarily due to higher per-unit margins. |
Operating and Maintenance Expense — Operating and maintenance expense decreased in 2009 compared to 2008, primarily as a result of our cost reduction initiatives, partially offset by increased expenses as a result of the Michigan acquisitions.
Depreciation and Amortization Expense — Depreciation and amortization expense increased in 2009 compared to 2008, primarily as a result of our Michigan acquisitions and our East Texas, Wyoming and Piceance Basin capital projects.
General and Administrative Expense — General and administrative expense decreased in 2009 compared to 2008, primarily as a result of our cost reduction initiatives, partially offset by our Michigan acquisitions.
Earnings from Unconsolidated Affiliates — Earnings from unconsolidated affiliates increased in 2009 compared to 2008, primarily due to increased earnings from Black Lake, partially offset by decreased earnings from Discovery. Settlements related to our commodity derivatives on our unconsolidated affiliates are included in segment gross margin.
71
Table of Contents
Net income attributable to noncontrolling interests — Net income attributable to noncontrolling interests decreased in 2009 primarily due to lower earnings at East Texas, for which the portion owned by DCP Midstream, LLC is unhedged. 2009 results include the impact of a third party owned pipeline rupture, resulting in a fire at East Texas.
Results of Operations — Natural Gas Services Segment
This segment consists of our Northern Louisiana system, the Southern Oklahoma system, a 40% limited liability company interest in Discovery, our Colorado and Wyoming systems, our East Texas systems, and our Michigan system.
| Variance 2010 vs. 2009 |
Variance 2009 vs. 2008 |
|||||||||||||||||||||||||||
| Year Ended December 31, | Increase (Decrease) |
Percent | Increae (Decrease) |
Percent | ||||||||||||||||||||||||
| 2010(a)(b) | 2009(a)(b) | 2008(a)(b) | ||||||||||||||||||||||||||
| (Millions, except as indicated) | ||||||||||||||||||||||||||||
| Operating revenues: |
||||||||||||||||||||||||||||
| Sales of natural gas, NGLs and condensate |
$ | 684.2 | $ | 562.8 | $ | 1,185.2 | $ | 121.4 | 22 | % | $ | (622.4 | ) | (53 | )% | |||||||||||||
| Transportation, processing and other |
102.1 | 87.3 | 79.1 | 14.8 | 17 | % | 8.2 | 10 | % | |||||||||||||||||||
| (Losses) gains from commodity derivative activity(c) |
(7.6 | ) | (66.4 | ) | 71.9 | 58.8 | 89 | % | (138.3 | ) | * | |||||||||||||||||
| Total operating revenues |
778.7 | 583.7 | 1,336.2 | 195.0 | 33 | % | (752.5 | ) | (56 | )% | ||||||||||||||||||
| Purchases of natural gas and NGLs |
583.6 | 474.0 | 1,004.8 | 109.6 | 23 | % | (530.8 | ) | (53 | )% | ||||||||||||||||||
| Segment gross margin(d) |
195.1 | 109.7 | 331.4 | 85.4 | 78 | % | (221.7 | ) | (67 | )% | ||||||||||||||||||
| Operating and maintenance expense |
(63.5 | ) | (58.2 | ) | (66.5 | ) | 5.3 | 9 | % | (8.3 | ) | (12 | )% | |||||||||||||||
| Depreciation and amortization expense |
(69.1 | ) | (61.9 | ) | (50.5 | ) | 7.2 | 12 | % | 11.4 | 23 | % | ||||||||||||||||
| Other income |
1.0 | — | — | 1.0 | 100 | % | — | — | % | |||||||||||||||||||
| Earnings from unconsolidated affiliates(e) |
23.0 | 16.6 | 17.4 | 6.4 | 39 | % | (0.8 | ) | (5 | )% | ||||||||||||||||||
| Segment net income |
86.5 | 6.2 | 231.8 | 80.3 | 1,295 | % | (225.6 | ) | (97 | )% | ||||||||||||||||||
| Segment net income attributable to noncontrolling interests |
(9.2 | ) | (8.3 | ) | (36.1 | ) | 0.9 | 11 | % | (27.8 | ) | (77 | )% | |||||||||||||||
| Segment net income (loss) attributable to partners |
$ | 77.3 | $ | (2.1 | ) | $ | 195.7 | $ | 79.4 | * | $ | (197.8 | ) | * | ||||||||||||||
| Other data: |
||||||||||||||||||||||||||||
| Natural gas throughput (MMcf/d)(e) |
1,168 | 1,072 | 961 | 96 | 9 | % | 111 | 12 | % | |||||||||||||||||||
| NGL gross production (Bbls/d)(e) |
33,521 | 28,831 | 28,000 | 4,690 | 16 | % | 831 | 3 | % | |||||||||||||||||||
| * | Percentage change is not meaningful. |
| (a) | Includes the results of certain companies that held natural gas gathering and treating assets purchased from MichCon Pipeline Company since November 24, 2009, the date of acquisition, and the results of MPP since October 1, 2008, the date of acquisition. |
| (b) | We utilize commodity derivative instruments to provide stability to distributable cash flows for our ownership in East Texas as well as all other natural gas services assets, the portion of East Texas owned by DCP Midstream, LLC is unhedged. As such, our consolidated results depict 75% of East Texas unhedged in all periods prior to the second quarter of 2009 and 49.9% of East Texas unhedged for all periods subsequent to the first quarter of 2009. |
72
Table of Contents
| (c) | Includes the effect of the acquisition of the NGL Hedge, contributed by DCP Midstream, LLC in April 2009. The NGL Hedge is a fixed price natural gas liquids derivative by NGL component, which commenced in April 2009 and expired in March 2010. |
| (d) | Segment gross margin consists of total operating revenues, including commodity derivative activity, less purchases of natural gas and NGLs. Please read “How We Evaluate Our Operations” above. |
| (e) | Includes our proportionate share of the throughput volumes and NGL production of Collbran, Jackson, East Texas and Discovery and our proportionate share of the earnings of Discovery for each period presented. Earnings for Discovery include the accretion of the net difference between the carrying amount of the investment and the underlying equity of the investment. |
Year Ended December 31, 2010 vs. Year Ended December 31, 2009
Total Operating Revenues — Total operating revenues increased in 2010 compared to 2009, primarily as a result of the following:
| • | $144.5 million increase attributable to increased commodity prices, which impact both sales and purchases; |
| • | $58.8 million increase related to commodity derivative activity. This increase includes a decrease in unrealized losses of $79.4 million due to movements in forward prices of commodities, partially offset by a decrease in realized cash settlement gains of $20.6 million due to generally higher average prices of commodities in 2010; |
| • | $30.0 million increase as a result of increased NGL production and a change to a contract with an affiliate in the Piceance Basin, such that certain revenues changed from a net presentation in transportation, processing and other to a gross presentation in sales of natural gas, NGLs and condensate; and |
| • | $14.8 million increase primarily as a result of increased fee-based throughput volumes resulting from the Michigan acquisition, our organic growth project in the Piceance Basin, as well as the renegotiation of commodity sensitive contracts to fee-based contracts partially offset by decreases across certain assets. |
These increases were partially offset by:
| • | $53.5 million decrease due primarily to the impact of changes in contract mix, increased fuel consumption, differences in gas quality, a decrease in natural gas sales volume across certain of assets, as well as volume curtailments due to plant shutdowns and producer wellhead freeze offs as a result of near record cold weather at East Texas and North Louisiana in the first quarter. 2009 results include the first quarter impact of a third party owned pipeline rupture, resulting in a fire at East Texas, and our Wyoming pipeline integrity and system enhancement project. |
Purchases of Natural Gas and NGLs — Purchases of natural gas and NGLs increased in 2010 compared to 2009, primarily as a result of increased commodity prices, which impact both sales and purchases, as well as a change to a contract with an affiliate in the Piceance Basin, such that certain purchases changed from a net presentation in transportation, processing and other to a gross presentation in purchases of natural gas and NGLs.
Segment Gross Margin — Segment gross margin increased in 2010 compared to 2009, primarily as a result of the following:
| • | $58.8 million increase related to commodity derivative activities as discussed in the Operating Revenues section above; |
| • | $31.2 million increase as a result of higher commodity prices; and |
| • | $14.8 million increase as a result of increased fee-based throughput volumes resulting from the Michigan acquisition, our organic growth project in the Piceance Basin, as well as the renegotiation of commodity sensitive contracts to fee-based contracts partially offset by decreases across certain assets. |
73
Table of Contents
These increases were partially offset by:
| • | $19.4 million decrease attributable to reduced natural gas basis spreads, increased fuel consumption, the impact of changes in contract mix, differences in gas quality, the impact of volume curtailment due to plant shutdowns and producer wellhead freeze offs as a result of near record cold weather at East Texas and North Louisiana in the first quarter and other natural gas volume reductions across certain of our assets. 2009 results include the first quarter impact of a third party owned pipeline rupture, resulting in a fire at East Texas and our Wyoming pipeline integrity and system enhancement project. |
Operating and Maintenance Expense — Operating and maintenance expense increased in 2010 compared to 2009 primarily as a result of our Michigan acquisition and integration costs, turnaround activities at certain assets, repairs as a result of near record cold weather and efficiency projects.
Depreciation and Amortization Expense — Depreciation and amortization expense increased in 2010 compared to 2009 primarily as a result of our capital projects completed in 2009 and the Michigan acquisition.
Other income — Other income relates to our reassessment of the fair value of contingent consideration for our acquisition of an additional 5% interest in Collbran from Delta Petroleum Company, or Delta, in February 2010.
Earnings from Unconsolidated Affiliates — Earnings from unconsolidated affiliates, representing our 40% ownership of Discovery, increased in 2010 compared to 2009, primarily due to higher prices and increased NGL production, partially offset by differences in gas quality, higher costs and downtime related to turnarounds. Settlements related to our commodity derivatives on our unconsolidated affiliates are included in segment gross margin.
Segment net income attributable to noncontrolling interests — Segment net income attributable to noncontrolling interests includes the impact of organic growth from our Piceance Basin expansion project, offset by volume curtailments due to plant shutdowns and producer wellhead freeze offs as a result of near record cold weather in the first quarter, increased fuel consumption, differences in gas quality and turnarounds at East Texas in 2010. 2009 results include the first quarter impact of a third party owned pipeline rupture, resulting in a fire at East Texas.
Natural Gas Throughput — Natural gas transported, processed and/or treated increased in 2010 compared to 2009, as a result of increased fee-based throughput volumes from our Michigan acquisition, and increased volumes at Discovery, partially offset by decreased volumes across certain assets. 2010 results include the impact of volume curtailment due to plant shutdowns and producer wellhead freeze offs as a result of near record cold weather at East Texas and North Louisiana in the first quarter. 2009 results include the first quarter impact of operational downtime following the hurricanes, a third party owned pipeline rupture resulting in a fire at East Texas and our Wyoming pipeline integrity and system enhancement project.
NGL Gross Production — NGL production increased in 2010 compared to 2009, due primarily to increased volumes from our Piceance Basin expansion project and increased NGL production at Discovery. 2010 results include the impact of volume curtailment due to plant shutdowns and producer wellhead freeze offs as a result of near record cold weather at East Texas and North Louisiana in the first quarter. 2009 results include the first quarter impact of operational downtime following the hurricanes, a third party owned pipeline rupture resulting in a fire at East Texas and our Wyoming pipeline integrity and system enhancement project.
Year Ended December 31, 2009 vs. Year Ended December 31, 2008
Total Operating Revenues — Total operating revenues decreased in 2009 compared to 2008, primarily due to the following:
| • | $560.1 million decrease attributable to decreased commodity prices, which impact both sales and purchases, and includes the results of East Texas for which the portion owned by DCP Midstream, LLC is unhedged; |
| • | $138.3 million decrease related to commodity derivative activity. This increase in losses includes an increase in unrealized losses of $183.2 million due to forward prices of commodities increasing in 2009 compared to 2008, partially offset by an increase in realized cash settlement gains of $44.9 million due to generally lower average prices of commodities in 2009; and |
74
Table of Contents
| • | $62.1 million decrease due primarily to a decrease in natural gas sales volumes across certain assets, partially offset by increased revenues due to contractual amendments such that certain revenues changed from a net presentation to a gross presentation. These results include the impact of a third party owned pipeline rupture, resulting in a fire at East Texas in the first quarter of 2009. Results in both years include the impact of hurricanes and our Wyoming pipeline integrity and system enhancement project. |
These decreases were partially offset by:
| • | $8.2 million increase in transportation, processing and other revenue, which represents our fee-based revenues, primarily as a result of increased throughput volumes due to the Michigan acquisitions, partially offset by decreased throughput volumes across other assets. |
Purchases of Natural Gas and NGLs — Purchases of natural gas and NGLs decreased in 2009 compared to 2008, primarily due to decreased commodity prices, which impact both sales and purchases, partially offset by contractual amendments which resulted in a prospective change in certain purchases from a net presentation to a gross presentation.
Segment Gross Margin — Segment gross margin decreased in 2009 compared to 2008, primarily as a result of the following:
| • | $138.3 million decrease related to commodity derivative activity, as discussed in the Operating Revenues section above; |
| • | $78.8 million decrease due to lower commodity prices, which includes the results of East Texas for which the portion owned by DCP Midstream, LLC is unhedged; and |
| • | $21.1 million decrease, primarily due to lower natural gas volumes across certain assets. These decreases include the impact of a third party owned pipeline rupture, resulting in a fire at East Texas in the first quarter of 2009. Results in both years include the impact of hurricanes and our Wyoming pipeline integrity and system enhancement project. |
These decreases were partially offset by:
| • | $16.7 million increase primarily as a result of increased fee-based throughput volumes due to the Michigan acquisitions. |
Operating and Maintenance Expense — Operating and maintenance expense decreased in 2009 compared to 2008, primarily as a result of our cost reduction initiatives, partially offset by increased expenses as a result of our Michigan acquisitions.
Depreciation and Amortization Expense — Depreciation and amortization expense increased in 2009 compared to 2008, primarily as a result of the Michigan acquisitions, and our East Texas, Wyoming and Piceance Basin capital projects.
Earnings from Unconsolidated Affiliates — Earnings from unconsolidated affiliates, representing our 40% ownership of Discovery, decreased in 2009 compared to 2008. This decrease was as a result of a reduction in the recognition of Discovery’s deficit purchase price in 2009 compared to 2008. The reduction of deficit purchase price recognition was partially offset by increased earnings from Discovery. The increase in Discovery’s earnings are primarily as a result of the following variances in earnings drivers, representing 100% of Discovery’s results of operations: Net income increased $2.5 million, or 7%, due primarily to $12.4 million higher gathering and transportation revenue, $13.2 million lower operating and maintenance expense and $2.6 million lower depreciation and accretion expense. These increases were largely offset by $18.5 million lower NGL sales margins resulting from sharply lower average per-unit margins on higher volumes of NGL equity sales and a $5.4 million unfavorable change in other income or expense, net. Settlements related to our commodity derivatives on our unconsolidated affiliates are included in segment gross margin.
Segment net income attributable to noncontrolling interests — Segment net income attributable to noncontrolling interests decreased in 2009 compared to 2008 primarily as a result of decreased net income at East Texas, for which the portion owned by DCP Midstream, LLC is unhedged. 2009 results include the impact of a third party owned pipeline rupture resulting in a fire at East Texas.
75
Table of Contents
Natural Gas Throughput — Natural gas transported, processed and/or treated increased in 2009 compared to 2008, due to increased fee-based throughput volumes from our Michigan acquisitions and increased volumes from the Tahiti project at Discovery, partially offset by decreased volumes across certain assets. Results in both years include the impact of hurricanes and operational downtime following the hurricanes. 2009 results include the impact of a third party owned pipeline rupture resulting in a fire at East Texas during the first quarter.
NGL Gross Production — NGL production increased in 2009 compared to 2008, due primarily to increased NGL production from Discovery. Results in both periods include the impact of hurricanes and operational downtime and our Wyoming system pipeline integrity and enhancement project. 2009 results also include the impact of a third party owned pipeline rupture, resulting in a fire at East Texas during the first quarter.
Results of Operations — Wholesale Propane Logistics Segment
This segment includes our propane transportation facilities, which includes one owned underground storage facility, six owned rail terminals, one owned marine import terminal, one leased marine terminal, one pipeline terminal and access to several open-access propane pipeline terminals.
| Year Ended December 31, | Variance 2010 vs. 2009 |
Variance 2009 vs. 2008 |
||||||||||||||||||||||||||
| 2010(a) | 2009 | 2008 | Increase (Decrease) |
Percent | Increase (Decrease) |
Percent | ||||||||||||||||||||||
| (Millions, except operating data) | ||||||||||||||||||||||||||||
| Operating revenues: |
||||||||||||||||||||||||||||
| Sales of propane |
$ | 473.8 | $ | 347.2 | $ | 482.1 | $ | 126.6 | 36 | % | $ | (134.9 | ) | (28 | )% | |||||||||||||
| Transportation, processing and other |
0.3 | 0.4 | 1.1 | (0.1 | ) | (25 | )% | (0.7 | ) | (64 | )% | |||||||||||||||||
| (Losses) gains from commodity derivative activity |
(0.9 | ) | 0.6 | (0.2 | ) | (1.5 | ) | * | 0.8 | * | ||||||||||||||||||
| Total operating revenues |
473.2 | 348.2 | 483.0 | 125.0 | 36 | % | (134.8 | ) | (28 | )% | ||||||||||||||||||
| Purchases of propane |
444.3 | 299.3 | 472.0 | 145.0 | 48 | % | (172.7 | ) | (37 | )% | ||||||||||||||||||
| Segment gross margin(b) |
28.9 | 48.9 | 11.0 | (20.0 | ) | (41 | )% | 37.9 | 345 | % | ||||||||||||||||||
| Operating and maintenance expense |
(12.6 | ) | (10.3 | ) | (9.9 | ) | 2.3 | 22 | % | 0.4 | 4 | % | ||||||||||||||||
| Depreciation and amortization expense |
(1.9 | ) | (1.4 | ) | (1.3 | ) | 0.5 | 36 | % | 0.1 | 8 | % | ||||||||||||||||
| Other income — affiliates |
3.0 | — | 1.5 | 3.0 | 100 | % | (1.5 | ) | (100 | )% | ||||||||||||||||||
| Segment net income attributable to partners |
$ | 17.4 | $ | 37.2 | $ | 1.3 | $ | (19.8 | ) | (53 | )% | $ | 35.9 | 2,762 | % | |||||||||||||
| Operating Data: |
||||||||||||||||||||||||||||
| Propane sales volume (Bbls/d) |
22,350 | 22,278 | 21,053 | 72 | — | % | 1,225 | 6 | % | |||||||||||||||||||
| * | Percentage change is not meaningful. |
| (a) | Includes the results of Atlantic Energy, since July 30, 2010, the date of acquisition. |
| (b) | Segment gross margin consists of total operating revenues, including commodity derivative activity, less purchases of propane. Please read “How We Evaluate Our Operations” above. |
Year Ended December 31, 2010 vs. Year Ended December 31, 2009
Total Operating Revenues — Total operating revenues increased in 2010 compared to 2009, primarily as a result of the following:
| • | $111.7 million increase attributable to higher propane prices, which impact both sales and purchases; and |
| • | $35.4 million increase attributable to our acquisition of Atlantic Energy in July 2010. |
76
Table of Contents
This increase was partially offset by:
| • | $20.5 million decrease attributable to a planned outage related to our Providence terminal inspection and reduced demand as a result of an early spring and warmer weather; |
| • | $1.5 million decrease due to commodity derivative activity. |
Purchases of Propane — Purchases of propane increased in 2010 compared to 2009 as a result of higher propane prices, which impact both sales and purchases, and our acquisition of Atlantic Energy in July 2010, partially offset by decreased propane sales volumes.
Segment Gross Margin — Segment gross margin decreased in 2010 compared to 2009. 2010 results reflect a planned outage related to our Providence terminal inspection and reduced demand as a result of an early spring and warmer weather, partially offset by our acquisition of Atlantic Energy in July 2010. 2009 results reflect a late winter, increased spot sales volumes and significantly higher per unit margins, approximately $6.0 million of which was attributable to the sale of inventory that was written down at the end of the fourth quarter of 2008.
Operating and Maintenance Expense — Operating and maintenance expense increased in 2010 compared to 2009, primarily as a result of our acquisition of Atlantic Energy.
Depreciation and Amortization Expense — Depreciation and amortization expense increased in 2010 compared to 2009, primarily as a result of our acquisition of Atlantic Energy.
Other income — affiliates — Other income — affiliates increased due to a $3.0 million payment received in the second quarter of 2010 from Spectra Energy, related to an amendment of a supply agreement to shorten the term of the agreement by two years.
Propane Sales Volume — Propane sales volumes were stable in 2010 compared to 2009. 2010 results reflect increased volumes due to our acquisition of Atlantic Energy, offset by a planned outage related to our Providence terminal inspection and reduced demand as a result of an early spring and warmer weather. 2009 results reflect a late winter and increased spot sales volume.
Year Ended December 31, 2009 vs. Year Ended December 31, 2008
Total Operating Revenues — Total operating revenues decreased in 2009 compared to 2008, primarily due to the following:
| • | $163.8 million decrease attributable to lower propane prices, which impact both sales and purchases. |
This decrease was partially offset by:
| • | $28.9 million increase attributable to increased propane sales volumes; and |
| • | $0.8 million increase related to commodity derivative activity. |
Purchases of Propane — Purchases of propane decreased in 2009 compared to 2008, due to lower propane prices, which impact both sales and purchases, partially offset by increased volumes.
Segment Gross Margin — Segment gross margin increased in 2009 compared to 2008, primarily as a result of increased volumes and per unit margins, approximately $6.0 million of which was attributable to the sale of inventory that was written down at the end of the fourth quarter of 2008.
Operating and Maintenance Expense — Operating and maintenance expense increased in 2009 compared to 2008 due to property taxes, partially offset by our cost reduction initiatives.
Other — Other operating income in 2008 related to payment received from a supplier regarding the early termination of its supply agreement.
Propane Sales Volume — Propane sales volumes increased 6% in 2009 compared to 2008.
77
Table of Contents
Results of Operations — NGL Logistics Segment
This segment includes our Seabreeze, Wilbreeze and Wattenberg NGL and Black Lake transportation pipelines:
| Year Ended December 31, | Variance 2010 vs. 2009 |
Variance 2009 vs. 2008 |
||||||||||||||||||||||||||
| 2010(a) | 2009 | 2008 | Increase (Decrease) |
Percent | Increase (Decrease) |
Percent | ||||||||||||||||||||||
| (Millions, except operating data) | ||||||||||||||||||||||||||||
| Operating revenues: |
||||||||||||||||||||||||||||
| Sales of NGLs |
$ | 4.7 | $ | 3.0 | $ | 5.4 | $ | 1.7 | 57 | % | $ | (2.4 | ) | (44 | )% | |||||||||||||
| Transportation, processing and other |
12.9 | 7.5 | 5.9 | 5.4 | 72 | % | 1.6 | 27 | % | |||||||||||||||||||
| Total operating revenues |
17.6 | 10.5 | 11.3 | 7.1 | 68 | % | (0.8 | ) | (7 | )% | ||||||||||||||||||
| Purchases of NGLs |
4.7 | 2.9 | 4.2 | 1.8 | 62 | % | (1.3 | ) | (31 | )% | ||||||||||||||||||
| Segment gross margin(b) |
12.9 | 7.6 | 7.1 | 5.3 | 70 | % | 0.5 | 7 | % | |||||||||||||||||||
| Operating and maintenance expense |
(3.7 | ) | (1.2 | ) | (1.0 | ) | 2.5 | 208 | % | 0.2 | 20 | % | ||||||||||||||||
| Depreciation and amortization expense |
(2.6 | ) | (1.4 | ) | (1.4 | ) | 1.2 | 86 | % | — | — | % | ||||||||||||||||
| Step acquisition — equity interest re-measurement gain |
9.1 | — | — | 9.1 | 100 | % | — | — | % | |||||||||||||||||||
| Earnings from unconsolidated affiliates(c) |
0.8 | 1.9 | 0.8 | (1.1 | ) | (58 | )% | 1.1 | 138 | % | ||||||||||||||||||
| Segment net income attributable to partners |
$ | 16.5 | $ | 6.9 | $ | 5.5 | $ | 9.6 | 139 | % | $ | 1.4 | 25 | % | ||||||||||||||
| Operating data: |
||||||||||||||||||||||||||||
| NGL pipelines throughput (Bbls/d)(c) |
38,282 | 30,160 | 31,407 | 8,122 | 27 | % | (1,247 | ) | (4 | )% | ||||||||||||||||||
| (a) | Includes the results of our Wattenberg pipeline acquired from Buckeye Partners, L.P, since January 28, 2010, the date of acquisition, and an additional 50% interest in Black Lake acquired from an affiliate of BP PLC, since July 30, 2010 the date of acquisition. |
| The acquisition of an additional 50% interest in Black Lake brought our ownership interest in Black Lake to 100%. Prior to our acquisition of an additional 50% interest in Black Lake, we accounted for Black Lake under the equity method of accounting. Subsequent to this transaction we account for Black Lake as a consolidated subsidiary. |
| The impact to our results related to Marysville, acquired on December 30, 2010, is not significant. |
| (b) | Segment gross margin consists of total operating revenues less purchases of NGLs. Please read “How We Evaluate Our Operations” above. |
| (c) | For periods prior to July 30, 2010, includes our 50% share of the throughput volumes and earnings for Black Lake. Black Lake’s earnings included the accretion of the net difference between the carrying amount of the investment and the underlying equity of the investment. |
Year Ended December 31, 2010 vs. Year Ended December 31, 2009
Total Operating Revenues — Total operating revenues increased in 2010 compared to 2009, primarily as a result of the Wattenberg pipeline acquisition, our acquisition of an additional 50% interest in Black Lake. 2009 results include the first quarter impact of decreased throughput volumes resulting from ethane rejection and lower volumes at certain connected processing plants.
Segment Gross Margin — Segment gross margin increased in 2010 compared to 2009, as a result of higher volumes from the Wattenberg pipeline acquisition and our acquisition of an additional 50% interest in Black Lake, as well as higher per unit margins.
78
Table of Contents
Operating and Maintenance Expense — Operating and maintenance expense increased in 2010 compared to 2009, primarily as a result of the Wattenberg pipeline acquisition and our acquisition of an additional 50% interest in Black Lake.
Depreciation and Amortization Expense — Depreciation and amortization expense increased in 2010 compared to 2009, primarily as a result of the Wattenberg pipeline acquisition and our acquisition of an additional 50% interest in Black Lake.
Step acquisition — equity interest re-measurement gain — Step acquisition — equity interest re-measurement gain results from our acquisition of an additional 50% interest in Black Lake bringing our ownership interest in Black Lake to 100%. Prior to our acquisition of an additional 50% interest in Black Lake, we accounted for Black Lake under the equity method of accounting. Subsequent to this transaction we account for Black Lake as a consolidated subsidiary. As a result of acquiring an additional 50% interest in Black Lake, we remeasured our initial 50% equity interest in Black Lake to its fair value, and recognized a gain of $9.1 million.
NGL Pipelines Throughput — NGL pipelines throughput increased in 2010 compared to 2009, as a result of increased volumes from the Wattenberg pipeline acquisition and our acquisition of an additional 50% interest in Black Lake. 2009 results include the first quarter impact of ethane rejection and lower volumes at certain connected processing plants.
Year Ended December 31, 2009 vs. Year Ended December 31, 2008
Total Operating Revenues — Total operating revenues decreased in 2009 compared to 2008, primarily due to lower throughput volumes, partially offset by higher per unit margins.
Segment Gross Margin — Segment gross margin increased in 2009 compared to 2008, primarily due to higher per unit margins.
Earnings from Unconsolidated Affiliates — Earnings from unconsolidated affiliates increased in 2009 compared to 2008, primarily due to decreased operating expenses.
NGL Pipelines Throughput — NGL pipeline throughput decreased in 2009 compared to 2008, due to declines at certain connected processing plants, partially offset by volumes from new interconnects.
Liquidity and Capital Resources
We expect our sources of liquidity to include:
| • | cash generated from operations; |
| • | cash distributions from our unconsolidated affiliates; |
| • | borrowings under our revolving credit facility; |
| • | issuance of additional partnership units; |
| • | debt offerings; |
| • | guarantees issued by DCP Midstream, LLC, which reduce the amount of collateral we may be required to post with certain counterparties to our commodity derivative instruments; and |
| • | letters of credit. |
We anticipate our more significant uses of resources to include:
| • | capital expenditures; |
| • | quarterly distributions to our unitholders; |
| • | contributions to our unconsolidated affiliates to finance our share of their capital expenditures; |
| • | business and asset acquisitions; and |
79
Table of Contents
| • | collateral with counterparties to our swap contracts to secure potential exposure under these contracts, which may, at times, be significant depending on commodity price movements, and which is required to the extent we exceed certain guarantees issued by DCP Midstream, LLC and letters of credit we have posted. |
We believe that cash generated from these sources will be sufficient to meet our short-term working capital requirements, long-term capital expenditure and acquisition requirements, and quarterly cash distributions for the next twelve months. In the event these sources are not sufficient, we would reduce our discretionary spending.
We routinely evaluate opportunities for strategic investments or acquisitions. Future material investments or acquisitions may require that we obtain additional capital, assume third party debt or incur other long-term obligations. We have the option to utilize both equity and debt instruments as vehicles for the long-term financing of our investment activities and acquisitions.
In 2010, we executed two public equity offerings which generated net proceeds $189.3 million. The proceeds from the equity issuances were used primarily to fund our growth strategy, including acquisitions and organic expansion. The 2010 acquisitions included our purchase of the Wattenberg NGL pipeline, the Chesapeake marine terminal, an additional interest in our Black Lake NGL pipeline and the Marysville NGL storage facility for total cash consideration, net of cash acquired of $203.3 million. Our portion of expansion capital expenditures for 2010 was $30.3 million. Additionally, we used the proceeds to fund our January 2011 $150.0 million acquisition of a 33.3% interest in Southeast Texas from DCP Midstream, LLC. The balance of the capital requirements were funded through borrowing on our revolving credit facility.
Based on current and anticipated levels of operations, we believe we have adequate committed financial resources to conduct our business, although deterioration in our operating environment could limit our borrowing capacity, raise our financing costs, as well as impact our compliance with our financial covenant requirements under our Credit Agreement. Our sources of funding could include additional borrowings under our Credit Agreement, the placement of public and private debt, and the issuance of our common units.
Changes in natural gas, NGL and condensate prices and the terms of our processing arrangements have a direct impact on our generation and use of cash from operations due to their impact on net income, along with the resulting changes in working capital. We have mitigated a portion of our anticipated commodity price risk associated with the equity volumes from our gathering and processing activities through 2015 with fixed price commodity swaps and collar arrangements. For additional information regarding our derivative activities, please read “— Quantitative and Qualitative Disclosures about Market Risk — Commodity Price Risk — Commodity Cash Flow Protection Activities.”
Our banking group is comprised of various financial institutions, of which certain institutions have recently merged. We do not expect the aggregate contractual financial commitment of these institutions to us to change during the remaining life of our existing credit agreement as a result of these mergers.
Our Credit Agreement consists of a revolving credit facility with capacity of $850.0 million, which matures on June 21, 2012. As of December 31, 2010, the outstanding balance on the revolving credit facility was $398.0 million resulting in unused revolver capacity of $419.9 million, of which approximately $265.0 million was available for general working capital purposes. Effective June 28, 2010, we transferred both the funded and the unfunded portions of the former Lehman Brothers Commercial Bank’s commitment to Morgan Stanley. The transfer reinstated $25.4 million of available capacity to our revolving credit facility.
Our borrowing capacity is currently limited by the Credit Agreement’s financial covenant requirements. Except in the case of a default, which would make the borrowings under the Credit Agreement fully callable, amounts borrowed under the Credit Agreement will not mature prior to the June 21, 2012 maturity date. As of February 25, 2011, we had approximately $324.5 million of unused capacity under the Credit Agreement.
On May 26, 2010, we filed a universal shelf registration statement on Form S-3 with the SEC with a maximum aggregate offering price of $1.5 billion, to replace an existing shelf registration statement. The universal shelf registration statement will allow us to register and issue additional common units and debt securities.
80
Table of Contents
In August 2010, we issued 2,990,000 common units at $32.57 per unit. We received proceeds of $93.1 million, net of offering costs, which we used to repay funds borrowed under the revolver portion of our Credit Facility.
In September 2010, we issued $250.0 million of 3.25% Senior Notes due October 1, 2015. We received net proceeds, after deducting underwriting discounts and offering expenses, of $247.7 million, which we used to repay funds borrowed under the revolver portion of our Credit Facility.
In November 2010, we issued 2,875,000 common units at $34.96 per unit. We received proceeds of $96.2 million, net of offering costs which we used to fund the Southeast Texas acquisition.
The counterparties to each of our commodity swap contracts are investment-grade rated financial institutions. Under these contracts, we may be required to provide collateral to the counterparties in the event that our potential payment exposure exceeds a predetermined collateral threshold. Collateral thresholds are set by us and each counterparty, as applicable, in the master contract that governs our financial transactions based on our and the counterparty’s assessment of creditworthiness. The assessment of our position with respect to the collateral thresholds are determined on a counterparty by counterparty basis, and are impacted by the representative forward price curves and notional quantities under our swap contracts. Due to the interrelation between the representative crude oil and natural gas forward price curves, it is not practical to determine a single pricing point at which our swap contracts will meet the collateral thresholds as we may transact multiple commodities with the same counterparty. As of February 25, 2011, DCP Midstream, LLC had issued and outstanding parental guarantees totaling $75.0 million in favor of certain counterparties to our commodity derivative instruments to mitigate a portion of our collateral requirements with these counterparties. We pay DCP Midstream, LLC a fee of 0.50% per annum on $75.0 million of these guarantees. As of February 25, 2011, we had a contingent issuance letter of credit facility for up to $10.0 million, on which we pay a fee of 0.50% per annum. As of February 25, 2011, we had no letters of credit issued on this facility; we will pay a net fee of 1.75% per annum on letters of credit issued on this facility. These parental guarantees and contingent issuance letter of credit facility reduce the amount of cash we may be required to post as collateral. This contingent issuance letter of credit facility was issued directly by a financial institution and does not reduce the available capacity under our credit facility. As of February 25, 2011, we had no cash collateral posted with counterparties. Depending on daily commodity prices, the amount of collateral posted can go up or down on a daily basis. Predetermined collateral thresholds for certain commodity derivative instruments guaranteed by us or DCP Midstream, LLC are generally dependent on our or DCP Midstream, LLC’s credit ratings and the thresholds could be reduced to $0 in the event that our individual credit ratings were to fall below investment grade.
Discovery is owned 40% by us and 60% by Williams Partners, LP. Discovery is managed by a two-member management committee, consisting of one representative from each owner. The members of the management committee have voting power corresponding to their respective ownership interests in Discovery. All actions and decisions relating to Discovery require the unanimous approval of the owners except for a few limited situations. Discovery must make quarterly distributions of available cash (generally, cash from operations less required and discretionary reserves) to its owners. The management committee, by majority approval, will determine the amount of the distributions. In addition, the owners are required to offer to Discovery all opportunities to construct pipeline laterals within an “area of interest.” Calls for capital contributions are determined by a vote of the management committee and require unanimous approval of both owners in most instances.
East Texas is owned 50.1% by us and 49.9% by DCP Midstream, LLC. East Texas is managed by a four-member management committee, consisting of two representatives from each owner. The members of the management committee have voting power corresponding to their respective ownership interests in East Texas. East Texas must make quarterly distributions of available cash (generally, cash from operations less required and discretionary reserves) to its owners. The management committee, by majority approval, will determine the amount of the distributions. Calls for capital contributions are determined by a vote of the management committee and require unanimous approval of both owners except in certain situations, such as the breach or default of a material agreement or payment obligation, that are reasonably likely to have a material adverse effect on the business, operations or financial condition of East Texas.
81
Table of Contents
Southeast Texas is owned 33.33% by us and 66.67% by two wholly-owned subsidiaries of DCP Midstream, LLC. Southeast Texas is managed by a three-member management committee, consisting of one representative appointed by us and two representatives from DCP Midstream, LLC. The members of the management committee have voting power corresponding to their respective ownership interests in Southeast Texas. Southeast Texas must make quarterly distributions of available cash (generally, cash from operations less required and discretionary reserves) to its owners. In the event Southeast Texas has insufficient available cash for a quarterly distribution (including pursuant to our fee-based arrangement), DCP Midstream, LLC will assign its distribution rights, or contribute any distribution deficiency to Southeast Texas, the sole use of which shall be to pay the distribution deficiency owing to us related to our fee-based arrangement on storage and transportation gross margin, based on storage capacity and tailgate volumes. The management committee, by majority approval, will determine the amount of the distributions. Calls for capital contributions are determined by a vote of the management committee and require unanimous approval of the owners except in certain situations, such as the breach or default of a material agreement or payment obligation, that are reasonably likely to have a material adverse effect on the business, operations or financial condition of Southeast Texas.
Working Capital — Working capital is the amount by which current assets exceed current liabilities. Current assets are reduced by our quarterly distributions, which are required under the terms of our partnership agreement based on Available Cash, as defined in the partnership agreement. In general, our working capital is impacted by changes in the prices of commodities that we buy and sell, inventory levels and other business factors that affect our net income and cash flows. Our working capital is also impacted by the timing of operating cash receipts and disbursements, borrowings of and payments on debt, capital expenditures, and increases or decreases in restricted investments and other long-term assets.
We had working capital of $21.9 million as of December 31, 2010 and $6.6 million as of December 31, 2009. Included in these working capital amounts are net derivative working capital liabilities of $41.1 million and $34.2 million as of December 31, 2010 and December 31, 2009, respectively. The change in working capital is primarily attributable to the factors described above. We expect that our future working capital requirements will be impacted by these same factors.
As of December 31, 2010, we had $6.7 million in cash and cash equivalents. Of this balance, as of December 31, 2010, $0.8 million was held by subsidiaries we do not wholly own, which we consolidate in our financial results. Other than the cash held by these subsidiaries, this cash balance was available for general corporate purposes. Congress recently passed the Dodd-Frank Wall Street Reform and Consumer Protection Act, which has the potential to impact our cash collateral requirements for our derivative positions depending on the final regulations adopted by the United States Commodity Futures Trading Commission and the SEC.
Cash Flow — Operating, investing and financing activities was as follows:
| Year Ended December 31, | ||||||||||||
| 2010 | 2009 | 2008 | ||||||||||
| (Millions) | ||||||||||||
| Net cash provided by operating activities |
$ | 140.8 | $ | 107.9 | $ | 177.6 | ||||||
| Net cash used in investing activities |
$ | (241.6 | ) | $ | (163.8 | ) | $ | (192.2 | ) | |||
| Net cash provided by (used in) financing activities |
$ | 105.4 | $ | (3.9 | ) | $ | 47.2 | |||||
Our predecessor’s sources of liquidity, prior to its acquisition by us, included cash generated from operations and funding from DCP Midstream, LLC. Our predecessor’s cash receipts were deposited in DCP Midstream, LLC’s bank accounts and all cash disbursements were made from these accounts. Cash transactions for our predecessor were handled by DCP Midstream, LLC and were reflected in partners’ equity as net changes in parent advances to predecessors from DCP Midstream, LLC.
Net Cash Provided by Operating Activities — The changes in net cash provided by operating activities are attributable to our net income adjusted for non-cash charges as presented in the consolidated statements of cash flows and changes in working capital as discussed above.
We paid net cash for settlement of our commodity derivative instruments of $3.6 million for the year ended December 31, 2010, net of cash receipts of $6.2 million of which was associated with rebalancing our portfolio, and received cash for settlement of our commodity derivative instruments for the year ended
82
Table of Contents
December 31, 2009 of $16.6 million, approximately $4.8 million of which was associated with rebalancing our portfolio. In addition, we received $3.6 million from DCP Midstream, LLC, related to the sale of surplus equipment as of December 31, 2010, which has been treated as an operating cash flow, because the title to the equipment was not transferred to DCP Midstream, LLC as of the balance sheet date.
We and our predecessors received cash distributions from unconsolidated affiliates of $30.0 million, $20.2 million and $38.4 million during the years ended December 31, 2010, 2009 and 2008, respectively. Distributions exceeded earnings by $6.2 million, $1.7 million and $20.2 million for the years ended December 31, 2010, 2009 and 2008, respectively.
Net Cash Used in Investing Activities — Net cash used in investing activities during 2010 was comprised of: (1) acquisition expenditures of $203.3 million related to our acquisition of Atlantic Energy, the Wattenberg NGL pipeline, Marysville and an additional 55% interest in Black Lake; (2) capital expenditures of $50.7 million (our portion of which was $35.9 million and the noncontrolling interest holders’ portion was $14.8 million); and (3) investments in Discovery of $2.3 million; partially offset by (4) net proceeds from sale of available-for-sale securities of $10.1 million; (5) proceeds from sale of assets of $3.4 million; and (6) a return of investment from Discovery of $1.2 million.
Net cash used in investing activities during 2009 was primarily used for: (1) capital expenditures of $164.8 million (our portion of which was $79.7 million and the noncontrolling interest holders’ portion was $85.1 million), which primarily consisted of expenditures for installation of compression and expansion of our East Texas system, expansion of our Colorado system, and the completion of pipeline integrity system upgrades to our Wyoming system; (2) acquisition expenditure of $44.5 million, primarily related to the acquisition of certain companies that held natural gas gathering and treating assets from MichCon Pipeline Company of $45.1 million; and (3) investments in Discovery of $7.0 million, partially offset by (4) net proceeds from sale of available-for-sale securities of $50.0 million; (5) a return of investment from Discovery of $2.2 million; and (6) proceeds from sale of assets of $0.3 million.
Net cash used in investing activities during 2008 was primarily used for: (1) acquisition of MPP of $146.4 million; acquisition of the MEG subsidiaries of $10.9 million; (2) capital expenditures of $72.7 million (our portion of which was $42.8 million and the noncontrolling interest holders’ portion was $29.9 million), which generally consisted of expenditures for construction and expansion of our infrastructure in addition to well connections and other upgrades to our existing facilities, including the pipeline integrity costs and system upgrades at our Wyoming system; and (3) investments in unconsolidated affiliates of $7.4 million, which were partially offset by (4) net proceeds from available-for-sale securities of $42.3 million; and (5) $2.9 million proceeds from the sale of assets.
Net Cash Provided By (Used in) Financing Activities — Net cash provided by financing activities during 2010 was comprised of: (1) borrowings of $868.2 million; (2) proceeds from the issuance of common units net of offering costs of $189.3 million; and (3) contributions from noncontrolling interests of $13.8 million; partially offset by (4) repayments of debt of $833.4 million; (5) distributions to our unitholders and general partner of $101.9 million; (6) distributions to noncontrolling interests of $25.6 million; (7) purchase of additional interest in a subsidiary of $3.5 million; (8) payment of deferred financing costs of $2.1 million; and (9) contributions from DCP Midstream, LLC of $0.6 million.
During 2010, total outstanding indebtedness under our $850.0 million Credit Agreement, which includes borrowings under our revolving credit facility, our term loan facility and letters of credit issued under the Credit Agreement, was not less than $300.5 million and did not exceed $722.4 million. The weighted-average indebtedness outstanding under the revolving credit facility was $622.5 million, $625.9 million, $634.7 million and $347.9 million for the first, second, third and fourth quarters of 2010, respectively.
We had unused revolver capacity, which is available commitments under the Credit Agreement of $209.3 million, $234.6 million, $486.5 million and $419.9 million at the end of the first, second, third and fourth quarters of 2010, respectively.
During 2010, we had the following net movements on our revolving credit facility:
| • | $247.7 million repayment financed by the issue of $250.0 million of 3.25% Senior Notes due October 1, 2015; |
83
Table of Contents
| • | $93.1 million repayment financed by the issue of 2,990,000 common units in August 2010; and |
| • | $96.2 million repayment financed by the issue of 2,875,000 common units in November 2010; partially offset by |
| • | $66.3 million borrowing to fund the acquisition of Atlantic Energy, which includes $17.3 million for propane inventory and working capital; |
| • | $16.3 million net borrowings for general corporate purposes; |
| • | $22.0 million borrowing to fund the acquisition of the Wattenberg pipeline; |
| • | $16.6 million borrowing to fund the acquisition of an additional 55% interest in Black Lake; |
| • | $100.8 million borrowing to fund the acquisition of Marysville, which includes $6.0 million for inventory and working capital; and |
| • | $10.0 million borrowing to fund repayment of our term loan facility. |
During 2010, we had a repayment of $10.0 million on our term loan facility and released $10.0 million of restricted investments which were required as collateral for the facility.
Net cash used in financing activities during 2009 was comprised of: (1) repayments of debt of $280.5 million; (2) distributions to our unitholders and general partner of $85.3 million; and (3) distributions to noncontrolling interests of $27.0 million, partially offset by (4) borrowings of $237.0 million; (5) contributions from non controlling interests of $78.7 million; (6) the issuance of common units for $69.5 million, net of offering costs; (7) net changes in advances to predecessor from DCP Midstream, LLC of $3.0 million; and (8) contributions from DCP Midstream, LLC of $0.7 million.
During 2009, total outstanding indebtedness under our $850.0 million Credit Agreement, which includes borrowings under our revolving credit facility, our term loan facility and letters of credit issued under the credit agreement, was not less than $608.3 million and did not exceed $656.8 million. The weighted average indebtedness outstanding was $656.7 million, $644.4 million, $638.3 million and $620.4 million for the first, second, third and fourth quarters of 2009, respectively.
We had liquidity, which is available commitments under the Credit Agreement of $239.3 million, $221.3 million, $221.3 million and $221.3 million at the end of the first, second, third and fourth quarters of 2009, respectively.
During 2009, we had the following net movements on our Credit Agreement:
| • | $50.0 million borrowing under our revolving credit facility to fund a partial repayment of our term loan facility; partially offset by |
| • | $43.5 million repayment under our revolving credit facility. |
Net cash provided by financing activities during 2008 was comprised of: (1) proceeds from debt of $660.4 million; (2) the issuance of common units for $132.1 million, net of offering costs; (3) contributions from noncontrolling interests of $21.3 million; (4) contributions from DCP Midstream, LLC of $4.1 million, partially offset by (5) repayment of debt of $633.9 million; (6) distributions to our unitholders and general partner of $76.2 million; (7) distributions to noncontrolling interests of $46.4 million; and (8) net changes in advances from DCP Midstream, LLC relating to our predecessor of $14.2 million.
During 2008, total outstanding indebtedness under our $850.0 million Credit Agreement, which includes borrowings under our revolving credit facility, our term loan facility and letters of credit issued under the credit agreement, was not less than $630.2 million and did not exceed $735.3 million. The weighted average indebtedness outstanding was $643.1 million, $690.0 million, $655.4 million and $666.6 million for the first, second, third and fourth quarters of 2008, respectively.
We had liquidity, which is available commitments under the Credit Agreement, of $364.7 million, $385.4 million, $390.4 million and $228.0 million at the end of the first, second, third and fourth quarters of 2008, respectively.
84
Table of Contents
During 2008, we had the following net movements on our Credit Agreement:
| • | $146.4 million borrowing under our revolving credit facility which was used for the Michigan acquisition; partially offset by |
| • | $79.9 million repayment under our revolving credit facility. |
During 2008, we repaid $40.0 million under our term loan facility
We expect to continue to use cash in financing activities for the payment of distributions to our unitholders and general partner. See Note 13 of the Notes to Consolidated Financial Statements in Item 8. “Financial Statements and Supplementary Data.”
Capital Requirements — The midstream energy business can be capital intensive, requiring significant investment to maintain and upgrade existing operations. Our capital requirements have consisted primarily of, and we anticipate will continue to consist of the following:
| • | maintenance capital expenditures, which are cash expenditures where we add on to or improve capital assets owned, including certain system integrity and safety improvements, or acquire or construct new capital assets if such expenditures are made to maintain, including over the long term, our operating capacity or revenues; and |
| • | expansion capital expenditures, which are cash expenditures for acquisitions or capital improvements (where we add on to or improve the capital assets owned, or acquire or construct new gathering lines, treating facilities, processing plants, fractionation facilities, pipelines, terminals, docks, truck racks, tankage and other storage, distribution or transportation facilities and related or similar midstream assets) in each case if such addition, improvement, acquisition or construction is made to increase our operating capacity or revenues. |
We incur capital expenditures for our consolidated entities and our unconsolidated affiliates. We anticipate maintenance capital expenditures of between $10.0 million and $15.0 million, and expenditures for expansion capital of between $35.0 million and $50.0 million, for the year ending December 31, 2011 including $10.0 million for the expansion to storage capacity at our Southeast Texas system. The board of directors may approve additional growth capital during the year, at their discretion.
The following table summarizes our maintenance and expansion capital expenditures for our consolidated entities.
| Year Ended December 31, 2010 | Year Ended December 31, 2009 | |||||||||||||||||||||||
| Maintenance Capital Expenditures |
Expansion Capital Expenditures |
Total Consolidated Capital Expenditures |
Maintenance Capital Expenditures |
Expansion Capital Expenditures |
Total Consolidated Capital Expenditures |
|||||||||||||||||||
| (Millions) | (Millions) | |||||||||||||||||||||||
| Our portion |
$ | 5.6 | $ | 30.3 | $ | 35.9 | $ | 12.6 | $ | 67.1 | $ | 79.7 | ||||||||||||
| Noncontrolling interest portion |
6.4 | 8.4 | 14.8 | 21.3 | 63.8 | 85.1 | ||||||||||||||||||
| Total |
$ | 12.0 | $ | 38.7 | $ | 50.7 | $ | 33.9 | $ | 130.9 | $ | 164.8 | ||||||||||||
| Year Ended December 31, 2008 | ||||||||||||
| Maintenance Capital Expenditures |
Expansion Capital Expenditures |
Total Consolidated Capital Expenditures |
||||||||||
| (Millions) | ||||||||||||
| Our portion |
$ | 13.6 | $ | 29.2 | $ | 42.8 | ||||||
| Noncontrolling interest portion |
11.5 | 18.4 | 29.9 | |||||||||
| Total |
$ | 25.1 | $ | 47.6 | $ | 72.7 | ||||||
85
Table of Contents
In addition, we invested cash in unconsolidated affiliates of $2.3 million, $7.0 million and $7.4 million during the years ended December 31, 2010, 2009 and 2008, respectively, of which $2.3 million, $2.8 million and $5.8 million, respectively, was to fund our share of capital expansion projects, and $4.2 million in 2009, was to fund repairs to Discovery following damage caused by hurricane Ike in 2008 (of which $1.2 and $2.2 million was returned to us by Discovery during 2010 and 2009, respectively).
Capital expenditures decreased in 2010 compared to 2009 as a result of the substantial completion during 2009 of our expansion projects in our Colorado and East Texas systems.
We intend to make cash distributions to our unitholders and our general partner. Due to our cash distribution policy, we expect that we will distribute to our unitholders most of the cash generated by our operations. As a result, we expect that we will rely upon external financing sources, which could include debt and common unit issuances, to fund our acquisition and expansion capital expenditures.
We expect to fund future capital expenditures with funds generated from our operations, borrowings under our credit facility, issuance of long-term debt and the issuance of additional partnership units. If these sources are not sufficient, we will reduce our discretionary spending.
Cash Distributions to Unitholders — Our partnership agreement requires that, within 45 days after the end of each quarter, we distribute all Available Cash, as defined in the partnership agreement. We made cash distributions to our unitholders and general partner, including payment to our general partner related to our incentive distribution rights, of $101.9 million, $85.3 million and $76.2 million during 2010, 2009 and 2008, respectively. We intend to continue making quarterly distribution payments to our unitholders and general partner to the extent we have sufficient cash from operations after the establishment of reserves.
Description of the Credit Agreement — The Credit Agreement consists of an $850.0 million revolving credit at December 31, 2010. The Credit Agreement matures on June 21, 2012. As of December 31, 2010, the outstanding balance on the revolving credit facility was $398.0 million resulting in unused revolver capacity of $419.9 million, of which approximately $265.0 million was available for general working capital purposes. The term loan was repaid during the first quarter of 2010.
Our obligations under the revolving credit facility are unsecured. The term loan facility, which was repaid during the first quarter of 2010, was secured at all times by high-grade securities, which we classified as restricted investments in the accompanying consolidated balance sheets, in an amount equal to or greater than the outstanding principal amount of the term loan. Any portion of the term loan balance may be repaid at any time, and we would then have access to a corresponding amount of the collateral securities. Upon any prepayment of term loan borrowings, the amount of our revolving credit facility will automatically increase to the extent that the repayment of our term loan facility is made in connection with an acquisition or construction of assets in the midstream energy business. The unused portion of the revolving credit facility may be used for letters of credit. At December 31, 2010 and 2009, we had outstanding letters of credit issued under the Credit Agreement of $32.1 million and $0.3 million, respectively.
We may prepay all loans at any time without penalty, subject to the reimbursement of lender breakage costs in the case of prepayment of London Interbank Offered Rate, or LIBOR, borrowings. Indebtedness under the revolving credit facility bears interest at either: (1) the higher of Wells Fargo Bank’s prime rate or the Federal Funds rate plus 0.50%; or (2) LIBOR plus an applicable margin, which ranges from 0.23% to 0.575% dependent upon our credit rating. As of December 31, 2010, the weighted-average interest rate on our revolving credit facility was 1.14% per annum. The revolving credit facility incurs an annual facility fee of 0.07% to 0.175% depending on our credit rating. This fee is paid on drawn and undrawn portions of the revolving credit facility. The term loan facility bears interest at a rate equal to either: (1) LIBOR plus 0.10%; or (2) the higher of Wells Fargo Bank’s prime rate or the Federal Funds rate plus 0.50%.
The Credit Agreement requires us to maintain a leverage ratio (the ratio of our consolidated indebtedness to our consolidated EBITDA, in each case as is defined by the Credit Agreement) of not more than 5.0 to 1.0, and on a temporary basis for not more than three consecutive quarters (including the quarter in which such acquisition is consummated) following the consummation of asset acquisitions in the midstream energy business of not more than 5.5 to 1.0.
86
Table of Contents
Description of Debt Securities
On September 30, 2010, we issued $250.0 million of 3.25% Senior Notes due October 1, 2015. We received net proceeds of $247.7 million, net of underwriters’ fees, related expense and unamortized discounts of $1.5 million, $0.6 million and $0.2 million, respectively which we used to repay funds borrowed under the revolver portion of our Credit Facility. Interest on the notes will be paid semi-annually on April 1 and October 1 of each year, commencing April 1, 2011. The notes will mature on October 1, 2015 unless redeemed prior to maturity.
We incurred $2.1 million of underwriters’ fees and related expense with the issue of the notes, which we deferred in other long term assets in our consolidated balance sheets. We will amortize these costs over the term of the notes.
The notes are senior unsecured obligations, ranking equally in right of payment with our existing unsecured indebtedness, including indebtedness under our Credit Facility. We are not required to make mandatory redemption or sinking fund payments with respect to these notes. The securities are redeemable at a premium at our option.
Total Contractual Cash Obligations and Off-Balance Sheet Obligations
A summary of our total contractual cash obligations as of December 31, 2010, is as follows:
| Payments Due by Period | ||||||||||||||||||||
| Total | 2011 | 2012-2013 | 2014-2015 | 2016 and Thereafter |
||||||||||||||||
| (Millions) | ||||||||||||||||||||
| Long-term debt(a) |
$ | 735.1 | $ | 33.2 | $ | 432.8 | $ | 269.1 | $ | — | ||||||||||
| Operating lease obligations(b) |
43.8 | 15.8 | 22.1 | 4.7 | 1.2 | |||||||||||||||
| Purchase obligations(c) |
614.0 | 324.0 | 176.0 | 65.4 | 48.6 | |||||||||||||||
| Other long-term liabilities(d) |
12.1 | — | 0.5 | 0.3 | 11.3 | |||||||||||||||
| Total |
$ | 1,405.0 | $ | 373.0 | $ | 631.4 | $ | 339.5 | $ | 61.1 | ||||||||||
| (a) | Includes interest payments on long-term debt that has been hedged and on debt securities that have been issued. These interest payments are $33.2 million, $34.8 million and $19.1 million for 2011, 2012-2013 and 2014-2015, respectively. Interest payments on long-term debt that has not been hedged are not included as these payments are based on floating interest rates and we cannot determine with accuracy the periodic repayment dates or the amounts of the interest payments. |
| (b) | Our operating lease obligations are contractual obligations, and primarily consist of our leased marine propane terminal and railcar leases, both of which provide supply and storage infrastructure for our Wholesale Propane Logistics business. Operating lease obligations also include firm transportation arrangements and natural gas storage for our Pelico system. The firm transportation arrangements supply off-system natural gas to Pelico and the natural gas storage arrangement enables us to maximize the value between the current price of natural gas and the futures market price of natural gas. |
| (c) | Our purchase obligations are contractual obligations and include $3.8 million of purchase orders for capital expenditures and $610.2 million of various non-cancelable commitments to purchase physical quantities of propane supply for our Wholesale Propane Logistics business. For contracts where the price paid is based on an index, the amount is based on the forward market prices at December 31, 2010. Purchase obligations exclude accounts payable, accrued interest payable and other current liabilities recognized in the consolidated balance sheets. Purchase obligations also exclude current and long-term unrealized losses on derivative instruments included in the consolidated balance sheet, which represent the current fair value of various derivative contracts and do not represent future cash purchase obligations. These contracts may be settled financially at the difference between the future market price and the contractual price and may result in cash payments or cash receipts in the future, but generally do not require delivery of physical quantities of the underlying commodity. In addition, many of our gas purchase contracts include short and long term commitments to purchase produced gas at market prices. These contracts, which have no minimum quantities, are excluded from the table. |
| (d) | Other long-term liabilities include $10.8 million of asset retirement obligations and $1.3 million of environmental reserves recognized in the consolidated balance sheet at December 31, 2010. |
We have no items that are classified as off balance sheet obligations.
87
Table of Contents
Critical Accounting Policies and Estimates
Our financial statements reflect the selection and application of accounting policies that require management to make estimates and assumptions. We believe that the following are the more critical judgment areas in the application of our accounting policies that currently affect our financial condition and results of operations. These accounting policies are described further in Note 2 of the Notes to Consolidated Financial Statements in Item 8. “Financial Statements and Supplementary Data.”
| Description |
Judgments and Uncertainties |
Effect if Actual Results Differ | ||
| Inventories | ||||
| Inventories, which consist of NGLs and natural gas, are recorded at the lower of weighted-average cost or market value. | Judgment is required in determining the market value of inventory, as the geographic location impacts market prices, and quoted market prices may not be available for the particular location of our inventory. | If the market value of our inventory is lower than the cost, we may be exposed to losses that could be material. If commodity prices were to decrease by 10% below our December 31, 2010 weighted-average cost, our net income would be affected by approximately $6.5 million. | ||
| Impairment of Goodwill |
||||
| We evaluate goodwill for impairment annually in the third quarter, and whenever events or changes in circumstances indicate it is more likely than not that the fair value of a reporting unit is less than its carrying amount. | We determine fair value using widely accepted valuation techniques, namely discounted cash flow and market multiple analyses. These techniques are also used when allocating the purchase price to acquired assets and liabilities. These types of analyses require us to make assumptions and estimates regarding industry and economic factors and the profitability of future business strategies. It is our policy to conduct impairment testing based on our current business strategy in light of present industry and economic conditions, as well as future expectations. | We completed our impairment testing of goodwill using the methodology described herein, and determined there was no impairment. Key assumptions in the analysis include the use of an appropriate discount rate and estimated future cash flows. In estimating cash flows, we incorporate current market information, as well as historical and other factors, into our forecasted commodity prices and throughput volumes. If actual results are not consistent with our assumptions and estimates, or our assumptions and estimates change due to new information, we may be exposed to goodwill impairment charges, which would be recognized in the period in which the carrying value exceeds fair value. We have not recorded any impairment charges on goodwill during the year ended December 31, 2010. The carrying value of goodwill as of December 31, 2010 by reporting unit was $52.8 million for our Colorado system, $36.9 million for our Wholesale Propane Logistics business and $10.0 million for our Michigan system, totaling $99.7 million. | ||
88
Table of Contents
| Description |
Judgments and Uncertainties |
Effect if Actual Results Differ | ||
| Impairment of Long-Lived Assets | ||||
| We periodically evaluate whether the carrying value of long-lived assets has been impaired when circumstances indicate the carrying value of those assets may not be recoverable. This evaluation is based on undiscounted cash flow projections expected to be realized over the remaining useful life of the primary asset. The carrying amount is not recoverable if it exceeds the sum of undiscounted cash flows expected to result from the use and eventual disposition of the asset. If the carrying value is not recoverable, the impairment loss is measured as the excess of the asset’s carrying value over its fair value. | Our impairment analyses may require management to apply judgment in estimating future cash flows as well as asset fair values, including forecasting useful lives of the assets, assessing the probability of different outcomes, and selecting the discount rate that reflects the risk inherent in future cash flows. We assess the fair value of long-lived assets using commonly accepted techniques, and may use more than one method, including, but not limited to, recent third party comparable sales and discounted cash flow models. These techniques are also used when allocating the purchase price to acquired assets and liabilities. | Using the impairment review methodology described herein, we have not recorded any impairment charges on long-lived assets during the year ended December 31, 2010. If actual results are not consistent with our assumptions and estimates or our assumptions and estimates change due to new information, we may be exposed to an impairment charge. The carrying value of our long-lived assets as of December 31, 2010 was $1,256.1 million. | ||
| Impairment of Investments in Unconsolidated Affiliates | ||||
| We evaluate our investments in unconsolidated affiliates for impairment whenever events or changes in circumstances indicate, in management’s judgment, that the carrying value of such investment may have experienced a decline in value. When evidence of loss in value has occurred, we compare the estimated fair value of the investment to the carrying value of the investment to determine whether an impairment has occurred. | Our impairment loss calculations require management to apply judgment in estimating future cash flows and asset fair values, including forecasting useful lives of the assets, assessing the probability of differing estimated outcomes, and selecting the discount rate that reflects the risk inherent in future cash flows. We assess the fair value of our unconsolidated affiliates using commonly accepted techniques, and may use more than one method, including, but not limited to, recent third party comparable sales and discounted cash flow models. | Using the impairment review methodology described herein, we have not recorded any impairment charges on investments in unconsolidated affiliates during the year ended December 31, 2010. If the estimated fair value of our unconsolidated affiliates is less than the carrying value, we would recognize an impairment loss for the excess of the carrying value over the estimated fair value. The carrying value of our unconsolidated affiliates as of December 31, 2010 was $104.3 million. | ||
89
Table of Contents
| Description |
Judgments and Uncertainties |
Effect if Actual Results Differ | ||
| Accounting for Risk Management Activities and Financial Instruments | ||||
| Each derivative not qualifying for the normal purchases and normal sales exception is recorded on a gross basis in the consolidated balance sheets at its fair value as unrealized gains or unrealized losses on derivative instruments. Derivative assets and liabilities remain classified in our consolidated balance sheets as unrealized gains or unrealized losses on derivative instruments at fair value until the contractual settlement period impacts earnings. Values are adjusted to reflect the credit risk inherent in the transaction as well as the potential impact of liquidating open positions in an orderly manner over a reasonable time period under current conditions. | When available, quoted market prices or prices obtained through external sources are used to determine a contract’s fair value. For contracts with a delivery location or duration for which quoted market prices are not available, fair value is determined based on pricing models developed primarily from historical and the expected relationship with quoted market prices. | If our estimates of fair value are inaccurate, we may be exposed to losses or gains that could be material. A 10% difference in our estimated fair value of derivatives at December 31, 2010 would have affected net income by approximately $7.2 million for the year ended December 31, 2010. | ||
| Accounting for Equity-Based Compensation | ||||
| Our long-term incentive plan permits for the grant of restricted units, phantom units, unit options and substitute awards. Equity-based compensation expense is recognized over the vesting period or service period of the related awards. We estimate the fair value of each award, and the number of awards that will ultimately vest, at the end of each period. | Estimating the fair value of each award, the number of awards that will ultimately vest, and the forfeiture rate requires management to apply judgment to estimate the tenure of our employees and the achievement of certain performance targets over the performance period. | If actual results are not consistent with our assumptions and judgments or our assumptions and estimates change due to new information, we may experience material changes in compensation expense. | ||
| Accounting for Asset Retirement Obligations | ||||
| Asset retirement obligations associated with tangible long-lived assets are recorded at fair value in the period in which they are incurred, if a reasonable estimate of fair value can be made, and added to the carrying amount of the associated asset. This additional carrying amount is then depreciated over the life of the asset. The liability is determined using a credit adjusted risk free interest rate, and increases due to the passage of time based on the time value of money until the obligation is settled. | Estimating the fair value of asset retirement obligations requires management to apply judgment to evaluate the necessary retirement activities, estimate the costs to perform those activities, including the timing and duration of potential future retirement activities, and estimate the risk free interest rate. When making these assumptions, we consider a number of factors, including historical retirement costs, the location and complexity of the asset and general economic conditions. | If actual results are not consistent with our assumptions and judgments or our assumptions and estimates change due to new information, we may experience material changes in our asset retirement obligations. Establishing an asset retirement obligation has no initial impact on net income. A 10% change in depreciation and accretion expense associated with our asset retirement obligations during the year ended December 31, 2010 would impact our net income by approximately $0.1 million. | ||
90
Table of Contents
Recent Accounting Pronouncements
Financial Accounting Standards Board, or FASB, Accounting Standards Update, or ASU, 2010-29 “Business Combinations (Topic 805): Disclosure of Supplementary Pro Forma Information for Business Combinations”, or ASU 2010-29 — In December 2010, the FASB issued ASU 2010-29 which amended Accounting Standards Codification, or ASC, Topic 805 “Business Combinations” to specify that if a public entity presents comparative financial statements, the entity should disclose revenue and earnings of the combined entity as though the business combination that occurred during the year had occurred as of the beginning of the comparable prior annual reporting period only. The ASU also expands the supplemental pro forma disclosures under Topic 805 to include a description of the nature and the amount of material, nonrecurring pro forma adjustments directly attributable to the business combination included in the reported pro forma revenue and earnings. ASU 2010-29 is effective for business combinations for which the acquisition date is on or after January 1, 2011 and we will disclose information in accordance with the ASU within all financial statements issued after the effective date.
ASU 2010-28 “Intangibles — Goodwill and Other (Topic 350): When to Perform Step 2 of the Goodwill Impairment Test for Reporting Units with Zero or Negative Carrying Amounts”, or ASU 2010-28 — In December 2010, the FASB issued ASU 2010-28 which amended ASC Topic 350 “Goodwill and Other”. ASU 2010-28 requires an entity with reporting units that have carrying amounts that are zero or negative to assess whether it is more likely than not that the reporting units’ goodwill is impaired. If the entity determines that it is more likely than not that the goodwill of one or more of its reporting units is impaired, the entity is required to perform Step 2 of the goodwill impairment test for those reporting unit(s) and record any resulting impairment as a cumulative-effect adjustment to beginning retained earnings. The provisions of ASU 2010-28 became effective for us on January 1, 2011, and we will disclose information in accordance with the ASU within all financial statements issued after the effective date.
ASU 2010-06 “Fair Value Measurements and Disclosures (Topic 820): Improving Disclosures about Fair Value Measurements”, or ASU 2010-06 — In January 2010, the FASB issued ASU 2010-06 which amended ASC Topic 820-10 “Fair Value Measurement and Disclosures—Overall.” ASU 2010-06 requires new disclosures regarding transfers in and out of assets and liabilities measured at fair value classified within the valuation hierarchy as either Level 1 or Level 2 and information about sales, issuances and settlements on a gross basis for assets and liabilities classified as Level 3. ASU 2010-06 clarifies existing disclosures on the level of disaggregation required and inputs and valuation techniques. The provisions of ASU 2010-06 became effective for us on January 1, 2010, except for disclosure of information about sales, issuances and settlements on a gross basis for assets and liabilities classified as Level 3, which is effective for us on January 1, 2011. The provisions of ASU 2010-06 impact only disclosures and we have disclosed information in accordance with the revised provisions of ASU 2010-06 within this filing.
ASU 2009-17 “Consolidation (Topic 810): Improvements to Financial Reporting by Enterprises Involved with Variable Interest Entities”, or ASU 2009-17 — In December 2009, the FASB issued ASU 2009-17 which amended ASC Topic 810 “Consolidation.” ASU 2009-17 requires entities to perform additional analysis of their variable interest entities and consolidation methods. This ASU became effective for us on January 1, 2010 and upon adoption we did not change our conclusions on which entities we consolidate in our consolidated financial statements.
ASU 2009-13 “Revenue Recognition (Topic 605) Multiple-Deliverable Revenue Arrangements”, or ASU 2009-13 — In October 2009, the FASB issued ASU 2009-13 which amended ASC Topic 605 “Revenue Recognition.” The ASU addresses the accounting for multiple-deliverable arrangements, to enable vendors to account for products or services separately rather than as a combined unit. ASU 2009-13 became effective for us on January 1, 2011 and there was no impact on our consolidated results of operations, cash flows and financial position as a result of adoption.
| Item 7A. | Quantitative and Qualitative Disclosures about Market Risk |
Market risk is the risk of loss arising from adverse change in market prices and rates. We are exposed to market risks, including changes in commodity prices and interest rates. We may use financial instruments such as forward contracts, swaps and futures to mitigate a portion of the effects of identified risks. In general, we
91
Table of Contents
attempt to mitigate a portion of the risks related to the variability of future earnings and cash flows resulting from changes in applicable commodity prices or interest rates so that we can maintain cash flows sufficient to meet debt service, required capital expenditures, distribution objectives and similar requirements.
Risk Management Policy
We have established a comprehensive risk management policy, or Risk Management Policy, and a risk management committee, or the Risk Management Committee, to monitor and manage market risks associated with commodity prices and counterparty credit. Our Risk Management Committee is composed of senior executives who receive regular briefings on positions and exposures, credit exposures and overall risk management in the context of market activities. The Risk Management Committee is responsible for the overall management of credit risk and commodity price risk, including monitoring exposure limits.
See Note 12, Risk Management and Hedging Activities, of the Notes to Consolidated Financial Statements in Item 8. “Financial Statements and Supplementary Data” for further discussion of the accounting for derivative contracts.
Credit Risk
Our principal customers in the Natural Gas Services segment are large, natural gas marketing servicers and industrial end-users. Our principal customers in the Wholesale Propane Logistics segment are primarily retail propane distributors. In the NGL Logistics Segment, our principal customers include an affiliate of DCP Midstream, LLC, producers and marketing companies. Substantially all of our natural gas, propane and NGL sales are made at market-based prices. This concentration of credit risk may affect our overall credit risk, as these customers may be similarly affected by changes in economic, regulatory or other factors. Where exposed to credit risk, we analyze the counterparties’ financial condition prior to entering into an agreement, establish credit limits, and monitor the appropriateness of these limits on an ongoing basis. We operate under DCP Midstream, LLC’s corporate credit policy. DCP Midstream, LLC’s corporate credit policy, as well as the standard terms and conditions of our agreements, prescribe the use of financial responsibility and reasonable grounds for adequate assurances. These provisions allow our credit department to request that a counterparty remedy credit limit violations by posting cash or letters of credit for exposure in excess of an established credit line. The credit line represents an open credit limit, determined in accordance with DCP Midstream, LLC’s credit policy. Our standard agreements also provide that the inability of a counterparty to post collateral is sufficient cause to terminate a contract and liquidate all positions. The adequate assurance provisions also allow us to suspend deliveries, cancel agreements or continue deliveries to the buyer after the buyer provides security for payment to us in a satisfactory form.
Interest Rate Risk
Interest rates on future credit facility draws and debt offerings could be higher than current levels, causing our financing costs to increase accordingly. Although this could limit our ability to raise funds in the debt capital markets, we expect to remain competitive with respect to acquisitions and capital projects, as our competitors would face similar circumstances.
We mitigate a portion of our interest rate risk with interest rate swaps, which reduce our exposure to market rate fluctuations by converting variable interest rates to fixed interest rates. These interest rate swap agreements convert the interest rate associated with the indebtedness outstanding under our revolving credit facility to a fixed rate obligation, thereby reducing the exposure to market rate fluctuations.
At December 31, 2010, we had interest rate swap agreements totaling $450.0 million, of which we have designated $275.0 million as cash flow hedges and account for the remaining $175.0 million under the mark-to-market method of accounting. As we expect to have variable rate debt levels equal to or exceeding our swap positions during their term, the entire $450.0 million of these agreements mitigate our interest rate risk through June 2012, with $150.0 million extending from June 2012 through June 2014. Based on our current operations we believe our interest rate swap agreements adequately mitigate our interest rate risk associated with our variable rate debt. As of February 25, 2011, we had interest rate swap agreements totaling $450.0 million, of which we have designated $425.0 million as cash flow hedges and account for the remaining $25.0 million under the mark-to-market method of accounting.
92
Table of Contents
At December 31, 2009, we had interest rate swap agreements totaling $575.0 million, all of which we had designated as cash flow hedges. In conjunction with the issuance of $250.0 million of 3.25% Senior Notes, we paid down our revolving credit facility, discontinued hedge accounting on $225.0 million of our existing swap agreements, terminated certain swap agreements for $1.3 million, and modified certain swap agreements to reduce the total outstanding amount by $125.0 million. Additionally, the term on $150.0 million of the swap agreements was extended through June 2014. This resulted in $450.0 million of these swap agreements mitigating our interest rate risk through June 2012, with $150.0 million extending from June 2012 through June 2014.
At December 31, 2010, the effective weighted-average interest rate on our outstanding debt was 4.42%, taking into account our interest rate swap agreements totaling $450.0 million.
Based on the annualized unhedged borrowings under our credit facility of $123.0 million as of December 31, 2010, a 0.5% movement in the base rate or LIBOR rate would result in an approximately $0.6 million annualized increase or decrease in interest expense.
Commodity Price Risk
We are exposed to the impact of market fluctuations in the prices of natural gas, NGLs and condensate as a result of our gathering, processing, sales and storage activities. For gathering services, we receive fees or commodities from producers to bring the natural gas from the wellhead to the processing plant. For processing services, we either receive fees or commodities as payment for these services, depending on the types of contracts. We employ established policies and procedures to manage our risks associated with these market fluctuations using various commodity derivatives, including forward contracts, swaps and futures.
Commodity Cash Flow Protection Activities — We closely monitor the risks associated with commodity price changes on our future operations and, where appropriate, use various fixed price swaps and collar arrangements to mitigate a portion of the effect pricing fluctuations may have on the value of our assets and operations. Depending on our risk management objectives, we may periodically settle a portion of these instruments prior to their maturity.
We enter into derivative financial instruments to mitigate a portion of the cash flow risk of decreased natural gas, NGL and condensate prices associated with our percent-of-proceeds arrangements and gathering operations. We also may enter into natural gas derivatives to lock in margin around our transportation or leased storage assets. Historically, there has been a strong relationship between NGL prices and crude oil prices, with some recent exceptions and lack of liquidity in the NGL financial market; therefore we have historically used crude oil swaps and costless collars to mitigate a portion of NGL price risk. When the relationship of NGL prices to crude oil prices is at a discount to historical ranges, we experience additional exposure as a result of the relationship. As a result of these transactions, we have mitigated a portion of our expected natural gas, NGL and condensate commodity price risk through 2015.
The derivative financial instruments we have entered into are typically referred to as “swap” contracts and “collar” arrangements. These swap contracts entitle us to receive payment at settlement from the counterparty to the contract to the extent that the reference price is below the swap price stated in the contract, and we are required to make payment at settlement to the counterparty to the extent that the reference price is higher than the swap price stated in the contract.
We are using the mark-to-market method of accounting for all commodity derivative instruments, which has significantly increased the volatility of our results of operations as we recognize, in current earnings, all non-cash gains and losses from the mark-to-market on derivative activity.
We also use commodity collar arrangements which include the combination of a sold call and a purchased put. The sold call establishes the maximum prices that we will receive for contracted commodity volumes, and the purchased put establishes the minimum price that we will receive.
93
Table of Contents
The following tables set forth additional information about our fixed price commodity swaps and collar arrangements used to mitigate a portion of our natural gas and NGL price risk associated with our percent-of-proceeds arrangements and our condensate price risk associated with our gathering operations, as of February 25, 2011:
Commodity Swaps
| Period |
Commodity | Notional Volume |
Reference Price |
Price Range | ||||
| January 2011 — December 2014 |
Natural Gas | 500 MMBtu/d | IFERC Monthly Index Price for Colorado Interstate Gas Pipeline(a) |
$5.06/MMBtu | ||||
| January 2011 — December 2014 |
Natural Gas | 500 MMBtu/d | Texas Gas Transmission Price(b) | $4.87/MMBtu | ||||
| March 2011 — December 2011 |
Natural Gas | 400MMBtu/d | IFERC Monthly Index Price for Houston Ship Channel(d) | $4.21/MMBtu | ||||
| January 2011 — December 2011 |
Crude Oil | 2,600 Bbls/d | Asian-pricing of NYMEX crude oil futures(c) |
$56.75 - $83.80/Bbl | ||||
| January 2012 — December 2012 |
Crude Oil | 2,325 Bbls/d | Asian-pricing of NYMEX crude oil futures(c) |
$66.72 - $99.85/Bbl | ||||
| January 2013 — December 2013 |
Crude Oil | 2,250 Bbls/d | Asian-pricing of NYMEX crude oil futures(c) |
$67.60 - $99.85/Bbl | ||||
| January 2014 — December 2014 |
Crude Oil | 1,500 Bbls/d | Asian-pricing of NYMEX crude oil futures(c) |
$74.90 - $96.08/Bbl | ||||
| January 2015 — December 2015 |
Crude Oil | 1,000 Bbls/d | Asian-pricing of NYMEX crude oil futures(c) |
$92.00 - $100.04/Bbl | ||||
| April 2011 — December 2011 |
NGLS | 405 Bbls/d | Mt. Belvieu Non-TET(e) | $0.55 - $2.38/Gal | ||||
| (a) | The Inside FERC index price for natural gas delivered into the Colorado Interstate Gas (CIG) pipeline. |
| (b) | The Inside FERC index price for natural gas delivered into the Texas Gas Transmission pipeline in the North Louisiana area. |
| (c) | Monthly average of the daily close prices for the prompt month NYMEX light, sweet crude oil futures contract (CL). |
| (d) | The Inside FERC monthly published index price for natural gas delivered into the Houston Ship Channel area. |
| (e) | The average monthly OPIS price for Mt. Belvieu Non-TET. |
Commodity Collar Arrangements
| Period |
Commodity | Notional Volume |
Reference Price |
Collar Price Range | ||||
| January 2011 — December 2012 |
Crude Oil | 200 Bbls/d(a) | Asian-pricing of NYMEX crude oil futures(b) | $80.00 - $97.40/Bbl |
| (a) | Reflects separate purchased put and sold call contracts, resulting in a collar arrangement. |
| (b) | Monthly average of the daily close prices for the prompt month NYMEX light, sweet crude oil futures contract (CL). |
At December 31, 2010, the aggregate fair value of the fixed price commodity swaps and collar arrangements described above was a net loss of $62.6 million.
Our annual sensitivities for 2011 as shown in the table below, exclude the impact from non-cash mark-to-market on our commodity derivatives. We utilize derivatives to mitigate a portion of our commodity price exposure for NGLs, and show our sensitivity to changes in the relationship between the pricing of NGLs and crude oil. For fixed price natural gas and crude oil, the sensitivities are associated with our unhedged volumes. For our NGL to crude oil price relationship, the sensitivity is associated with both hedged and unhedged equity volumes.
94
Table of Contents
Commodity Sensitivities Excluding Non-Cash Mark-To-Market
| Per Unit Decrease | Unit of Measurement |
Estimated Decrease in Annual Net Income Attributable to Partners |
||||||||
| (Millions) | ||||||||||
| Natural gas prices |
$ | 1.00 | MMBtu | $ | 0.4 | |||||
| Crude oil prices(a) |
$ | 5.00 | Barrel | $ | 2.5 | |||||
| NGL to crude oil price relationship(b) |
|
5 percentage point change |
|
Barrel | $ | 7.7 | ||||
| (a) | Assuming 60% NGL to crude oil price relationship. |
| (b) | Assuming 60% NGL to crude oil price relationship and $80.00/Bbl crude oil price. Generally, this sensitivity changes by $1.9 million for each $20.00/Bbl change in the price of crude oil. As crude oil prices increase from $80.00/Bbl, we become slightly more sensitive to the change in the relationship of NGL prices to crude oil prices. As crude oil prices decrease from $80.00/Bbl, we become less sensitive to the change in the relationship of NGL prices to crude oil prices. |
In addition to the linear relationships in our commodity sensitivities above, additional factors cause us to be less sensitive to commodity price declines. A portion of our net income is derived from fee-based contracts and a certain percentage of liquids processing arrangements that contain minimum fee clauses in which our processing margins convert to fee-based arrangements as NGL prices decline.
The above sensitivities exclude the impact from arrangements where producers on a monthly basis may elect to not process their natural gas in which case we retain a portion of the customers’ natural gas in lieu of NGLs as a fee. The above sensitivities also exclude certain related processing arrangements where we control the processing or by-pass of the production based upon individual economic processing conditions. Under each of these types of arrangements, our processing of the natural gas would yield favorable processing margins. Less than 10% of our gas throughput is associated with these arrangements.
We estimate the following non-cash sensitivities in 2011 related to the mark-to-market on our commodity derivatives associated with our commodity cash flow protection activities:
Non-Cash Mark-To-Market Commodity Sensitivities
| Per Unit Increase | Unit of Measurement |
Estimated Mark-to-Market Impact (Decrease in Net Income Attributable to Partners) |
||||||||
| (Millions) | ||||||||||
| Natural gas prices |
$ | 1.00 | MMBtu | $ | 1.4 | |||||
| Crude oil prices |
$ | 5.00 | Barrel | $ | 16.6 | |||||
| NGL prices |
$ | 0.10 | Gallon | $ | 0.5 | |||||
While the above commodity price sensitivities are indicative of the impact that changes in commodity prices may have on our annualized net income, changes during certain periods of extreme price volatility and market conditions or changes in the relationship of the price of NGLs and crude oil may cause our commodity price sensitivities to vary significantly from these estimates.
The above Commodity Sensitivities Excluding Non-Cash Mark-to-Market Activity and Non-Cash Mark-to-Market Sensitivities tables exclude our collar arrangements. These collar arrangements represent approximately 5% of our commodity derivative instruments.
The midstream natural gas industry is cyclical, with the operating results of companies in the industry significantly affected by the prevailing price of NGLs, which in turn has been generally related to the price of crude oil, with some notable exceptions in late 2008 and early 2009, when NGL pricing was at a greater discount to crude oil pricing. Although the prevailing price of residue natural gas has less short-term significance to our operating results than the price of NGLs, in the long term the growth and sustainability of
95
Table of Contents
our business depends on natural gas prices being at levels sufficient to provide incentives and capital, for producers to increase natural gas exploration and production. To minimize potential future commodity-based pricing and cash flow volatility, we have entered into a series of derivative financial instruments. As a result of these transactions, we have mitigated a portion of our expected natural gas, NGL and condensate commodity price risk relating to the equity volumes associated with our gathering and processing activities through 2015. Given the historical relationship between NGL prices and crude oil prices and the lack of liquidity in the NGL financial market, we have generally used crude oil derivative instruments to mitigate a portion of NGL price risk. When the relationship of NGL prices to crude oil prices is at a discount to historical ranges, we experience additional exposure as a result of the relationship.
Based on historical trends, we generally expect NGL prices to directionally follow changes in crude oil prices over the long term. However, the pricing relationship between NGLs and crude oil may vary, as we believe crude oil prices will in large part be determined by the level of production from major crude oil exporting countries and the demand generated by growth in the world economy, whereas NGL prices are more correlated to supply and U.S. petrochemical demand. We believe that future natural gas prices will be influenced by North American supply deliverability, the severity of winter and summer weather, the level of North American production and drilling activity of exploration and production companies and imports of liquid natural gas, or LNG, from foreign locations. Drilling activity can be adversely affected as natural gas prices decrease. Energy market uncertainty could also further reduce North American drilling activity. Limited access to capital could also decrease drilling. Lower drilling levels over a sustained period would reduce natural gas volumes gathered and processed, but could increase commodity prices, if supply were to fall below demand levels.
Other Asset-Based Activities — Our operations of gathering, processing, and transporting natural gas, and the accompanying operations of transporting, producing and marketing of NGLs create commodity price risk due to market fluctuations in commodity prices, primarily with respect to the prices of NGLs, natural gas and condensate. To the extent possible, we match the pricing of our supply portfolio to our sales portfolio in order to lock in value and reduce our overall commodity price risk. We manage the commodity price risk of our supply portfolio and sales portfolio with both physical and financial transactions. We occasionally will enter into financial derivatives to lock in time spreads and price differentials across the Pelico system to maximize the value of pipeline capacity.
Our wholesale propane logistics business is generally designed to establish stable margins by entering into supply arrangements that specify prices based on established floating price indices and by entering into sales agreements that provide for floating prices that are tied to our variable supply costs plus a margin. Occasionally, we may enter into fixed price sales agreements in the event that a retail propane distributor desires to purchase propane from us on a fixed price basis. We manage this risk with both physical and financial transactions, sometimes using non-trading derivative instruments, which generally allow us to swap our fixed price risk to market index prices that are matched to our market index supply costs. In addition, we may on occasion use financial derivatives to manage the value of our propane inventories.
We manage our commodity derivative activities in accordance with our Risk Management Policy which limits exposure to market risk and requires regular reporting to management of potential financial exposure.
Valuation — Valuation of a contract’s fair value is validated by an internal group independent of the marketing group. While common industry practices are used to develop valuation techniques, changes in pricing methodologies or the underlying assumptions could result in significantly different fair values and income recognition. When available, quoted market prices or prices obtained through external sources are used to determine a contract’s fair value. For contracts with a delivery location or duration for which quoted market prices are not available, fair value is determined based on pricing models developed primarily from historical and expected relationship with quoted market prices.
Values are adjusted to reflect the credit risk inherent in the transaction as well as the potential impact of liquidating open positions in an orderly manner over a reasonable time period under current conditions. Changes in market prices and management estimates directly affect the estimated fair value of these contracts. Accordingly, it is reasonably possible that such estimates may change in the near term.
96
Table of Contents
The fair value of our interest rate swaps and commodity non-trading derivatives is expected to be realized in future periods, as detailed in the following table. The amount of cash ultimately realized for these contracts will differ from the amounts shown in the following table due to factors such as market volatility, counterparty default and other unforeseen events that could impact the amount and/or realization of these values.
| Fair Value of Contracts as of December 31, 2010 | ||||||||||||||||||||
| Sources of Fair Value |
Total | Maturity in 2011 |
Maturity in 2012-2013 |
Maturity in 2014-2015 |
Maturity in 2016 and Thereafter |
|||||||||||||||
| (Millions) | ||||||||||||||||||||
| Prices supported by quoted market prices and other external sources |
$ | (90.0 | ) | $ | (41.3 | ) | $ | (43.7 | ) | $ | (5.0 | ) | $ | — | ||||||
| Prices based on models or other valuation techniques |
$ | — | $ | 0.2 | $ | — | $ | (0.2 | ) | $ | — | |||||||||
| Total |
$ | (90.0 | ) | $ | (41.1 | ) | $ | (43.7 | ) | $ | (5.2 | ) | $ | — | ||||||
The “prices supported by quoted market prices and other external sources” category includes our interest rate swaps, our New York Mercantile Exchange, or NYMEX, positions in natural gas, NGLs and crude oil. In addition, this category includes our forward positions in natural gas for which our forward price curves are obtained from SunGard Kiodex and then validated through an internal process which includes the use of independent broker quotes. This category also includes our forward positions in NGLs at points for which over-the-counter, or OTC, broker quotes for similar assets or liabilities are available for the full term of the instrument. This category also includes “strip” transactions whose pricing inputs are directly or indirectly observable from external sources and then modeled to daily or monthly prices as appropriate.
The “prices based on models and other valuation methods” category includes the value of transactions for which inputs to the fair value of the instrument are unobservable in the marketplace and are considered significant to the overall fair value of the instrument. The fair value of these instruments may be based upon an internally developed price curve, which was constructed as a result of the long dated nature of the transaction or the illiquidity of the market point.
97
Table of Contents
| Item 8. | Financial Statements and Supplementary Data |
| DCP MIDSTREAM PARTNERS, LP CONSOLIDATED FINANCIAL STATEMENTS: |
||||
| 99 | ||||
| Consolidated Balance Sheets as of December 31, 2010 and 2009 |
100 | |||
| Consolidated Statements of Operations for the years ended December 31, 2010, 2009 and 2008 |
101 | |||
| 102 | ||||
| Consolidated Statements of Changes in Equity for the years ended December 31, 2010, 2009 and 2008 |
103 | |||
| Consolidated Statements of Cash Flows for the years ended December 31, 2010, 2009 and 2008 |
105 | |||
| 106 | ||||
98
Table of Contents
REPORT OF INDEPENDENT REGISTERED PUBLIC ACCOUNTING FIRM
To the Board of Directors of
DCP Midstream GP, LLC
Denver, Colorado
We have audited the accompanying consolidated balance sheets of DCP Midstream Partners, LP and subsidiaries (the “Company”) as of December 31, 2010 and 2009, and the related consolidated statements of operations, comprehensive income (loss), changes in equity, and cash flows for each of the three years in the period ended December 31, 2010. These financial statements are the responsibility of the Company’s management. Our responsibility is to express an opinion on these financial statements based on our audits. We did not audit the financial statements of Discovery Producer Services, LLC (“Discovery”), an investment of the Company which is accounted for by the use of the equity method. The Company’s equity in Discovery’s net assets of $139,233,000 and $145,727,000 at December 31, 2010 and 2009, respectively, and in Discovery’s net income of $20,570,000, $14,204,000 and $13,759,000 for the years ended December 31, 2010, 2009, and 2008, respectively, are included in the accompanying consolidated financial statements. Discovery’s financial statements were audited by other auditors whose report has been furnished to us, and our opinion, insofar as it relates to the amounts included for Discovery, is based solely on the report of the other auditors.
We conducted our audits in accordance with the standards of the Public Company Accounting Oversight Board (United States). Those standards require that we plan and perform the audit to obtain reasonable assurance about whether the financial statements are free of material misstatement. An audit includes examining, on a test basis, evidence supporting the amounts and disclosures in the financial statements. An audit also includes assessing the accounting principles used and significant estimates made by management, as well as evaluating the overall financial statement presentation. We believe that our audits and the report of the other auditors provide a reasonable basis for our opinion.
In our opinion, based on our audits and the report of the other auditors, such consolidated statements present fairly, in all material respects, the financial position of the Company as of December 31, 2010 and 2009, and the results of their operations and their cash flows for each of the three years in the period ended December 31, 2010, in conformity with accounting principles generally accepted in the United States of America.
The consolidated financial statements give retroactive effect to the April 1, 2009 acquisition by the Company of an additional 25.1% of DCP East Texas Holdings, LLC from DCP Midstream, LLC, as a combination of entities under common control, and have been accounted for in a manner similar to a pooling of interests as described in Note 1 to the consolidated financial statements.
We have also audited, in accordance with the standards of the Public Company Accounting Oversight Board (United States), the Company’s internal control over financial reporting as of December 31, 2010, based on the criteria established in the Internal Control — Integrated Framework issued by the Committee of Sponsoring Organizations of the Treadway Commission and our report dated March 1, 2011 expressed an unqualified opinion on the Company’s internal control over financial reporting.
/s/ Deloitte & Touche LLP
Denver, Colorado
March 1, 2011
99
Table of Contents
CONSOLIDATED BALANCE SHEETS
| December 31, | ||||||||
| 2010 | 2009 | |||||||
| (Millions) | ||||||||
| ASSETS | ||||||||
| Current assets: |
||||||||
| Cash and cash equivalents |
$ | 6.7 | $ | 2.1 | ||||
| Accounts receivable: |
||||||||
| Trade, net of allowance for doubtful accounts of $0.5 million and $0.5 million, respectively |
89.3 | 78.7 | ||||||
| Affiliates |
61.7 | 73.8 | ||||||
| Inventories |
65.2 | 34.2 | ||||||
| Unrealized gains on derivative instruments |
1.9 | 7.3 | ||||||
| Assets held for sale |
6.2 | — | ||||||
| Other |
2.1 | 1.6 | ||||||
| Total current assets |
233.1 | 197.7 | ||||||
| Restricted investments |
— | 10.0 | ||||||
| Property, plant and equipment, net |
1,169.1 | 1,000.1 | ||||||
| Goodwill |
99.7 | 92.1 | ||||||
| Intangible assets, net |
87.0 | 60.5 | ||||||
| Investments in unconsolidated affiliates |
104.3 | 114.6 | ||||||
| Unrealized gains on derivative instruments |
1.4 | 2.0 | ||||||
| Other long-term assets |
6.0 | 4.5 | ||||||
| Total assets |
$ | 1,700.6 | $ | 1,481.5 | ||||
| LIABILITIES AND EQUITY | ||||||||
| Current liabilities: |
||||||||
| Accounts payable: |
||||||||
| Trade |
$ | 99.1 | $ | 85.5 | ||||
| Affiliates |
37.6 | 43.1 | ||||||
| Unrealized losses on derivative instruments |
43.0 | 41.5 | ||||||
| Other |
31.5 | 21.0 | ||||||
| Total current liabilities |
211.2 | 191.1 | ||||||
| Long-term debt |
647.8 | 613.0 | ||||||
| Unrealized losses on derivative instruments |
50.3 | 58.0 | ||||||
| Other long-term liabilities |
53.1 | 14.0 | ||||||
| Total liabilities |
962.4 | 876.1 | ||||||
| Commitments and contingent liabilities: |
||||||||
| Equity: |
||||||||
| Common unitholders (40,478,383 and 34,608,183 units issued and outstanding, respectively) |
552.2 | 415.5 | ||||||
| General partner |
(6.4 | ) | (5.9 | ) | ||||
| Accumulated other comprehensive loss |
(27.7 | ) | (31.9 | ) | ||||
| Total partners’ equity |
518.1 | 377.7 | ||||||
| Noncontrolling interests |
220.1 | 227.7 | ||||||
| Total equity |
738.2 | 605.4 | ||||||
| Total liabilities and equity |
$ | 1,700.6 | $ | 1,481.5 | ||||
See accompanying notes to consolidated financial statements.
100
Table of Contents
CONSOLIDATED STATEMENTS OF OPERATIONS
| Year Ended December 31, | ||||||||||||
| 2010 | 2009 | 2008 | ||||||||||
| (Millions, except per unit amounts) | ||||||||||||
| Operating revenues: |
||||||||||||
| Sales of natural gas, propane, NGLs and condensate |
$ | 634.3 | $ | 456.3 | $ | 881.2 | ||||||
| Sales of natural gas, propane, NGLs and condensate to affiliates |
528.4 | 456.7 | 791.5 | |||||||||
| Transportation, processing and other |
94.9 | 79.2 | 59.9 | |||||||||
| Transportation, processing and other to affiliates |
20.4 | 16.0 | 26.2 | |||||||||
| (Losses) gains from commodity derivative activity, net |
(7.3 | ) | (62.3 | ) | 75.4 | |||||||
| Losses from commodity derivative activity, net — affiliates |
(1.2 | ) | (3.5 | ) | (3.7 | ) | ||||||
| Total operating revenues |
1,269.5 | 942.4 | 1,830.5 | |||||||||
| Operating costs and expenses: |
||||||||||||
| Purchases of natural gas, propane and NGLs |
755.2 | 529.5 | 1,218.0 | |||||||||
| Purchases of natural gas, propane and NGLs from affiliates |
277.4 | 246.7 | 263.0 | |||||||||
| Operating and maintenance expense |
79.8 | 69.7 | 77.4 | |||||||||
| Depreciation and amortization expense |
73.7 | 64.9 | 53.2 | |||||||||
| General and administrative expense |
14.3 | 11.9 | 13.1 | |||||||||
| General and administrative expense — affiliates |
19.4 | 20.4 | 20.2 | |||||||||
| Step acquisition — equity interest re-measurement gain |
(9.1 | ) | — | — | ||||||||
| Other income |
(1.0 | ) | — | (1.5 | ) | |||||||
| Other income — affiliates |
(3.0 | ) | — | — | ||||||||
| Total operating costs and expenses |
1,206.7 | 943.1 | 1,643.4 | |||||||||
| Operating income (loss) |
62.8 | (0.7 | ) | 187.1 | ||||||||
| Interest income |
— | 0.3 | 6.1 | |||||||||
| Interest expense |
(29.1 | ) | (28.3 | ) | (32.8 | ) | ||||||
| Earnings from unconsolidated affiliates |
23.8 | 18.5 | 18.2 | |||||||||
| Income (loss) before income taxes |
57.5 | (10.2 | ) | 178.6 | ||||||||
| Income tax expense |
(0.3 | ) | (0.6 | ) | (0.6 | ) | ||||||
| Net income (loss) |
57.2 | (10.8 | ) | 178.0 | ||||||||
| Net income attributable to noncontrolling interests |
(9.2 | ) | (8.3 | ) | (36.1 | ) | ||||||
| Net income (loss) attributable to partners |
48.0 | (19.1 | ) | 141.9 | ||||||||
| Net loss (income) attributable to predecessor operations |
— | 1.0 | (16.2 | ) | ||||||||
| General partner’s interest in net income or net loss |
(16.9 | ) | (12.7 | ) | (13.0 | ) | ||||||
| Net income (loss) allocable to limited partners |
$ | 31.1 | $ | (30.8 | ) | $ | 112.7 | |||||
| Net income (loss) per limited partner unit — basic |
$ | 0.86 | $ | (0.99 | ) | $ | 4.11 | |||||
| Net income (loss) per limited partner unit — diluted |
$ | 0.86 | $ | (0.99 | ) | $ | 4.11 | |||||
| Weighted-average limited partner units outstanding — basic |
36.1 | 31.2 | 27.4 | |||||||||
| Weighted-average limited partner units outstanding — diluted |
36.1 | 31.2 | 27.4 | |||||||||
See accompanying notes to consolidated financial statements.
101
Table of Contents
CONSOLIDATED STATEMENTS OF COMPREHENSIVE INCOME (LOSS)
| Year Ended December 31, | ||||||||||||
| 2010 | 2009 | 2008 | ||||||||||
| (Millions) | ||||||||||||
| Net income (loss) |
$ | 57.2 | $ | (10.8 | ) | $ | 178.0 | |||||
| Other comprehensive income (loss): |
||||||||||||
| Reclassification of cash flow hedge losses into earnings |
22.9 | 20.6 | 7.5 | |||||||||
| Net unrealized losses on cash flow hedges |
(18.7 | ) | (12.0 | ) | (33.1 | ) | ||||||
| Total other comprehensive income (loss) |
4.2 | 8.6 | (25.6 | ) | ||||||||
| Total comprehensive income (loss) |
61.4 | (2.2 | ) | 152.4 | ||||||||
| Total comprehensive income attributable to noncontrolling interests |
(9.2 | ) | (8.3 | ) | (36.1 | ) | ||||||
| Total comprehensive income (loss) attributable to partners |
$ | 52.2 | $ | (10.5 | ) | $ | 116.3 | |||||
See accompanying notes to consolidated financial statements.
102
Table of Contents
CONSOLIDATED STATEMENTS OF CHANGES IN EQUITY
| Partners’ Equity | ||||||||||||||||||||||||||||||||
| Predecessor Equity |
Common Unitholders |
Class D Unitholders |
Subordinated Unitholders |
General Partner |
Accumulated Other Comprehensive Income (Loss) |
Noncontrolling Interests |
Total Equity |
|||||||||||||||||||||||||
| (Millions) | ||||||||||||||||||||||||||||||||
| Balance, January 1, 2010 |
$ | — | $ | 415.5 | $ | — | $ | — | $ | (5.9 | ) | $ | (31.9 | ) | $ | 227.7 | $ | 605.4 | ||||||||||||||
| Purchase of additional interest in a subsidiary |
— | 1.0 | — | — | — | — | (5.5 | ) | (4.5 | ) | ||||||||||||||||||||||
| Issuance of 5,870,200 common units |
— | 189.1 | — | — | — | — | — | 189.1 | ||||||||||||||||||||||||
| Equity based compensation |
— | 0.2 | — | — | — | — | — | 0.2 | ||||||||||||||||||||||||
| Distributions to unitholders and general partner |
— | (85.6 | ) | — | — | (16.3 | ) | — | — | (101.9 | ) | |||||||||||||||||||||
| Distributions to noncontrolling interests |
— | — | — | — | — | (25.6 | ) | (25.6 | ) | |||||||||||||||||||||||
| Contributions from DCP Midstream, LLC |
— | 0.6 | — | — | — | — | — | 0.6 | ||||||||||||||||||||||||
| Contributions from noncontrolling interests |
— | — | — | — | — | — | 14.3 | 14.3 | ||||||||||||||||||||||||
| Excess purchase price over carrying value of acquired assets |
— | (0.8 | ) | — | — | — | — | — | (0.8 | ) | ||||||||||||||||||||||
| Comprehensive income: |
||||||||||||||||||||||||||||||||
| Net income |
— | 32.2 | — | — | 15.8 | — | 9.2 | 57.2 | ||||||||||||||||||||||||
| Reclassification of cash flow hedges into earnings |
— | — | — | — | — | 22.9 | — | 22.9 | ||||||||||||||||||||||||
| Net unrealized losses on cash flow hedges |
— | — | — | — | — | (18.7 | ) | — | (18.7 | ) | ||||||||||||||||||||||
| Total comprehensive income (loss) |
— | 32.2 | — | — | 15.8 | 4.2 | 9.2 | 61.4 | ||||||||||||||||||||||||
| Balance, December 31, 2010 |
$ | $ | 552.2 | $ | — | $ | — | $ | (6.4 | ) | $ | (27.7 | ) | $ | 220.1 | $ | 738.2 | |||||||||||||||
See accompanying notes to consolidated financial statements.
103
Table of Contents
DCP MIDSTREAM PARTNERS, LP
CONSOLIDATED STATEMENTS OF CHANGES IN EQUITY — (Continued)
| Partners’ Equity | ||||||||||||||||||||||||||||||||
| Predecessor Equity |
Common Unitholders |
Class D Unitholders |
Subordinated Unitholders |
General Partner |
Accumulated Other Comprehensive Income (Loss) |
Noncontrolling Interests |
Total Equity |
|||||||||||||||||||||||||
| (Millions) | ||||||||||||||||||||||||||||||||
| Balance, January 1, 2008 |
$ | 64.0 | $ | 308.8 | $ | — | $ | (120.1 | ) | $ | (5.4 | ) | $ | (14.9 | ) | $ | 155.1 | $ | 387.5 | |||||||||||||
| Net change in parent advances |
(14.2 | ) | — | — | — | — | — | — | (14.2 | ) | ||||||||||||||||||||||
| Issuance of 4,250,000 common units |
— | 132.1 | — | — | — | — | — | 132.1 | ||||||||||||||||||||||||
| Conversion of subordinated units to common units |
— | (66.4 | ) | — | 66.4 | — | — | — | — | |||||||||||||||||||||||
| Contributions |
— | 4.0 | — | — | — | — | — | 4.0 | ||||||||||||||||||||||||
| Contributions from noncontrolling interests |
— | — | — | — | — | — | 21.3 | 21.3 | ||||||||||||||||||||||||
| Distributions |
— | (53.9 | ) | — | (10.5 | ) | (11.3 | ) | — | — | (75.7 | ) | ||||||||||||||||||||
| Distributions to noncontrolling interests |
— | — | — | — | — | — | (46.4 | ) | (46.4 | ) | ||||||||||||||||||||||
| Equity-based compensation |
— | 0.2 | — | — | — | — | — | 0.2 | ||||||||||||||||||||||||
| Acquisition of subsidiaries |
— | — | — | — | — | — | 1.6 | 1.6 | ||||||||||||||||||||||||
| Comprehensive income: |
||||||||||||||||||||||||||||||||
| Net income attributable to predecessor operations |
16.2 | — | — | — | — | — | — | 16.2 | ||||||||||||||||||||||||
| Net income |
— | 104.2 | — | 9.6 | 11.9 | — | 36.1 | 161.8 | ||||||||||||||||||||||||
| Reclassification of cash flow hedges into earnings |
— | — | — | — | — | 7.5 | — | 7.5 | ||||||||||||||||||||||||
| Net unrealized losses on cash flow hedges |
— | — | — | — | — | (33.1 | ) | — | (33.1 | ) | ||||||||||||||||||||||
| Total comprehensive income (loss) |
16.2 | 104.2 | — | 9.6 | 11.9 | (25.6 | ) | 36.1 | 152.4 | |||||||||||||||||||||||
| Balance, December 31, 2008 |
$ | 66.0 | $ | 429.0 | $ | — | $ | (54.6 | ) | $ | (4.8 | ) | $ | (40.5 | ) | $ | 167.7 | $ | 562.8 | |||||||||||||
| Net change in parent advances |
3.0 | — | — | — | — | — | — | 3.0 | ||||||||||||||||||||||||
| Conversion of subordinated units to common units |
— | (52.1 | ) | — | 52.1 | — | — | — | — | |||||||||||||||||||||||
| Distributions |
— | (67.7 | ) | (2.1 | ) | (2.1 | ) | (13.4 | ) | — | — | (85.3 | ) | |||||||||||||||||||
| Distributions to noncontrolling interests |
— | — | — | — | — | — | (27.0 | ) | (27.0 | ) | ||||||||||||||||||||||
| Contributions from DCP Midstream, LLC |
— | 0.7 | — | — | — | — | — | 0.7 | ||||||||||||||||||||||||
| Contributions from noncontrolling interests |
— | — | — | — | — | — | 78.7 | 78.7 | ||||||||||||||||||||||||
| Other |
— | (0.1 | ) | — | — | — | — | — | (0.1 | ) | ||||||||||||||||||||||
| Issuance of 2,875,000 common units |
— | 69.5 | — | — | — | — | — | 69.5 | ||||||||||||||||||||||||
| Issuance of 3,500,000 Class D units |
— | — | 49.7 | — | — | — | — | 49.7 | ||||||||||||||||||||||||
| Acquisition of additional 25.1% interest in East Texas and the NGL Hedge |
(68.0 | ) | — | 4.6 | — | — | — | — | (63.4 | ) | ||||||||||||||||||||||
| Deficit purchase price over carrying value of acquired assets |
— | — | 19.0 | — | — | — | — | 19.0 | ||||||||||||||||||||||||
| Conversion of Class D units into common units |
— | 66.8 | (66.8 | ) | — | — | — | — | — | |||||||||||||||||||||||
| Comprehensive income: |
||||||||||||||||||||||||||||||||
| Net loss attributable to predecessor operations |
(1.0 | ) | — | — | — | — | — | — | (1.0 | ) | ||||||||||||||||||||||
| Net (loss) income |
— | (30.6 | ) | (4.4 | ) | 4.6 | 12.3 | — | 8.3 | (9.8 | ) | |||||||||||||||||||||
| Reclassification of cash flow hedges into earnings |
— | — | — | — | — | 20.6 | — | 20.6 | ||||||||||||||||||||||||
| Net unrealized losses on cash flow hedges |
— | — | — | — | — | (12.0 | ) | — | (12.0 | ) | ||||||||||||||||||||||
| Total comprehensive (loss) income |
(1.0 | ) | (30.6 | ) | (4.4 | ) | 4.6 | 12.3 | 8.6 | 8.3 | (2.2 | ) | ||||||||||||||||||||
| Balance, December 31, 2009 |
$ | — | $ | 415.5 | $ | — | $ | — | $ | (5.9 | ) | $ | (31.9 | ) | $ | 227.7 | $ | 605.4 | ||||||||||||||
See accompanying notes to consolidated financial statements.
104
Table of Contents
DCP MIDSTREAM PARTNERS, LP
CONSOLIDATED STATEMENTS OF CASH FLOWS
| Year Ended December 31, | ||||||||||||
| 2010 | 2009 | 2008 | ||||||||||
| (Millions) | ||||||||||||
| OPERATING ACTIVITIES: |
||||||||||||
| Net income (loss) |
$ | 57.2 | $ | (10.8 | ) | $ | 178.0 | |||||
| Adjustments to reconcile net income to net cash provided by operating activities: |
||||||||||||
| Depreciation and amortization expense |
73.7 | 64.9 | 53.2 | |||||||||
| Earnings from unconsolidated affiliates |
(23.8 | ) | (18.5 | ) | (18.2 | ) | ||||||
| Distributions from unconsolidated affiliates |
30.0 | 20.2 | 38.4 | |||||||||
| Step acquisition — equity interest re-measurement gain |
(9.1 | ) | — | — | ||||||||
| Other, net |
— | (0.4 | ) | (0.7 | ) | |||||||
| Change in operating assets and liabilities which provided (used) cash, net of effects of acquisitions: |
||||||||||||
| Accounts receivable |
5.8 | (36.6 | ) | 101.4 | ||||||||
| Inventories |
(8.7 | ) | (13.3 | ) | 16.4 | |||||||
| Net unrealized losses (gains) on derivative instruments |
4.0 | 83.8 | (101.0 | ) | ||||||||
| Accounts payable |
5.7 | 21.5 | (108.2 | ) | ||||||||
| Accrued interest |
1.8 | (0.6 | ) | (0.3 | ) | |||||||
| Other current assets and liabilities |
2.6 | (3.2 | ) | 19.0 | ||||||||
| Other long-term assets and liabilities |
1.6 | 0.9 | (0.4 | ) | ||||||||
| Net cash provided by operating activities |
140.8 | 107.9 | 177.6 | |||||||||
| INVESTING ACTIVITIES: |
||||||||||||
| Capital expenditures |
(50.7 | ) | (164.8 | ) | (72.7 | ) | ||||||
| Acquisitions, net of cash acquired |
(203.3 | ) | (44.5 | ) | (157.3 | ) | ||||||
| Investments in unconsolidated affiliates |
(2.3 | ) | (7.0 | ) | (7.4 | ) | ||||||
| Return of investment from unconsolidated affiliate |
1.2 | 2.2 | — | |||||||||
| Proceeds from sales of assets |
3.4 | 0.3 | 2.9 | |||||||||
| Purchases of available-for-sale securities |
— | (1.1 | ) | (608.2 | ) | |||||||
| Proceeds from sales of available-for-sale securities |
10.1 | 51.1 | 650.5 | |||||||||
| Net cash used in investing activities |
(241.6 | ) | (163.8 | ) | (192.2 | ) | ||||||
| FINANCING ACTIVITIES: |
||||||||||||
| Proceeds from debt |
868.2 | 237.0 | 660.4 | |||||||||
| Payments of debt |
(833.4 | ) | (280.5 | ) | (633.9 | ) | ||||||
| Payment of deferred financing costs |
(2.1 | ) | — | — | ||||||||
| Proceeds from issuance of common units, net of offering costs |
189.3 | 69.5 | 132.1 | |||||||||
| Net change in advances to predecessor from DCP Midstream, LLC |
— | 3.0 | (14.2 | ) | ||||||||
| Distributions to unitholders and general partner |
(101.9 | ) | (85.3 | ) | (76.2 | ) | ||||||
| Distributions to noncontrolling interests |
(25.6 | ) | (27.0 | ) | (46.4 | ) | ||||||
| Contributions from noncontrolling interests |
13.8 | 78.7 | 21.3 | |||||||||
| Contributions from DCP Midstream, LLC |
0.6 | 0.7 | 4.1 | |||||||||
| Purchase of additional interest in a subsidiary |
(3.5 | ) | — | — | ||||||||
| Net cash provided by (used in) financing activities |
105.4 | (3.9 | ) | 47.2 | ||||||||
| Net change in cash and cash equivalents |
4.6 | (59.8 | ) | 32.6 | ||||||||
| Cash and cash equivalents, beginning of period |
2.1 | 61.9 | 29.3 | |||||||||
| Cash and cash equivalents, end of period |
$ | 6.7 | $ | 2.1 | $ | 61.9 | ||||||
See accompanying notes to consolidated financial statements.
105
Table of Contents
NOTES TO CONSOLIDATED FINANCIAL STATEMENTS
Years Ended December 31, 2010, 2009 and 2008
| 1. | Description of Business and Basis of Presentation |
DCP Midstream Partners, LP, with its consolidated subsidiaries, or us, we or our, is engaged in the business of gathering, compressing, treating, processing, transporting, storing and selling natural gas; producing, transporting, storing and selling NGLs and condensate.
We are a Delaware limited partnership that was formed in August 2005. We completed our initial public offering on December 7, 2005. Our partnership includes: our Northern Louisiana system; our Southern Oklahoma system; our 40% limited liability company interest in Discovery Producer Services LLC, or Discovery; our Wyoming system; a 75% interest in our Colorado system (of which 5% was acquired in February 2010); our 50.1% interest in our East Texas system (of which 25.1% was acquired in April 2009); our Michigan system (acquired in October 2008 and November 2009); our wholesale propane logistics business (which includes Atlantic Energy acquired in July 2010); and our NGL logistics business (including Marysville Hydrocarbons Holdings, Inc, or Marysville, acquired in December 2010, the Wattenberg pipeline acquired in January 2010 and our 100% interest in the Black Lake Pipeline Company, or Black Lake, 55% of which was acquired in July 2010, comprised of a 5% interest acquired from DCP Midstream, LLC, in a transaction among entities under common control, and an additional 50% interest acquired from an affiliate of BP PLC).
Our operations and activities are managed by our general partner, DCP Midstream GP, LP, which in turn is managed by its general partner, DCP Midstream GP, LLC, which we refer to as the General Partner, and is wholly-owned by DCP Midstream, LLC. DCP Midstream, LLC and its subsidiaries and affiliates, collectively referred to as DCP Midstream, LLC, is owned 50% by Spectra Energy Corp, or Spectra Energy, and 50% by ConocoPhillips. DCP Midstream, LLC directs our business operations through its ownership and control of the General Partner. DCP Midstream, LLC and its affiliates’ employees provide administrative support to us and operate most of our assets. DCP Midstream, LLC owns approximately 30% of us.
The consolidated financial statements include the accounts of the Partnership and all majority-owned subsidiaries where we have the ability to exercise control and undivided interests in jointly owned assets. Investments in greater than 20% owned affiliates that are not variable interest entities and where we do not have the ability to exercise control, and investments in less than 20% owned affiliates where we have the ability to exercise significant influence, are accounted for using the equity method. Intercompany balances and transactions have been eliminated.
The consolidated financial statements include our accounts, which have been combined with the historical assets, liabilities and operations of our predecessor operations. We refer to the assets, liabilities and operations of DCP East Texas Holdings, LLC, or East Texas, prior to our acquisition of an additional 25.1% limited liability company interest from DCP Midstream, LLC in April 2009 as our “predecessor.” Prior to our acquisition of an additional 25.1% limited liability company interest in East Texas, we owned a 25.0% limited liability company interest in East Texas which we accounted for under the equity method of accounting. Subsequent to this transaction we own a 50.1% limited liability company interest in East Texas, and account for East Texas as a consolidated subsidiary. Because the additional interest in East Texas was acquired from DCP Midstream, LLC, this transaction was considered to be among entities under common control. We recognize transfers of net assets between entities under common control at DCP Midstream, LLC’s basis in the net assets contributed. In addition, transfers of net assets between entities under common control are accounted for as if the transfer occurred at the beginning of the period, and prior years are retroactively adjusted to furnish comparative information similar to the pooling method; accordingly our financial information includes the historical results of our additional 25.1% interest in East Texas for all periods presented. The amount of the purchase price in excess, or in deficit of DCP Midstream, LLC’s basis in the net assets, if any, is recognized as a reduction to, or an increase to partners’ equity, respectively. The consolidated financial statements of our predecessor have been prepared from the separate records maintained by DCP Midstream, LLC and may not necessarily be indicative of the conditions that would have existed or the results of operations if our predecessor
106
Table of Contents
DCP MIDSTREAM PARTNERS, LP
NOTES TO CONSOLIDATED FINANCIAL STATEMENTS
Years Ended December 31, 2010, 2009 and 2008 — (Continued)
had been operated as an unaffiliated entity. In addition, the results of operations of acquisitions accounted for as business combinations have been included in the consolidated financial statements since their respective acquisition dates.
The consolidated financial statements have been prepared in accordance with accounting principles generally accepted in the United States of America, or GAAP. All intercompany balances and transactions have been eliminated. Transactions between us and other DCP Midstream, LLC operations have been identified in the consolidated financial statements as transactions between affiliates.
| 2. | Summary of Significant Accounting Policies |
Use of Estimates — Conformity with GAAP requires management to make estimates and assumptions that affect the amounts reported in the consolidated financial statements and notes. Although these estimates are based on management’s best available knowledge of current and expected future events, actual results could differ from those estimates.
Cash and Cash Equivalents — We consider investments in highly liquid financial instruments purchased with an original stated maturity of 90 days or less to be cash equivalents.
Short-Term and Restricted Investments — We may invest available cash balances in various financial instruments, such as commercial paper and money market instruments. These instruments provide for a high degree of liquidity through features which allow for the redemption of the investment at its face amount plus earned income. As we generally intend to sell these instruments within one year or less from the balance sheet date, and as they are available for use in current operations, they are classified as current assets, unless otherwise restricted.
Restricted investments are used as collateral to secure the term loan portion of our credit facility and to finance gathering and compression asset acquisitions. We classify all short-term and restricted investments as available-for-sale as we do not intend to hold them to maturity, nor are they bought or sold with the objective of generating profit on short-term differences in prices. These investments are recorded at fair value, with changes in fair value recorded as unrealized gains and losses in accumulated other comprehensive income (loss), or AOCI. The cost, including accrued interest on investments, approximates fair value, due to the short-term, highly liquid nature of the securities held by us; interest rates are re-set on a daily, weekly or monthly basis.
Inventories — Inventories, which consist primarily of NGLs and natural gas, are recorded at the lower of weighted-average cost or market value. Transportation costs are included in inventory.
Property, Plant and Equipment — Property, plant and equipment are recorded at historical cost. The cost of maintenance and repairs, which are not significant improvements, are expensed when incurred. Depreciation is computed using the straight-line method over the estimated useful lives of the assets.
Asset retirement obligations associated with tangible long-lived assets are recorded at fair value in the period in which they are incurred, if a reasonable estimate of fair value can be made, and added to the carrying amount of the associated asset. This additional carrying amount is then depreciated over the life of the asset. The liability is determined using a risk free interest rate, and increases due to the passage of time based on the time value of money until the obligation is settled.
Goodwill and Intangible Assets — Goodwill is the cost of an acquisition less the fair value of the net assets of the acquired business. We perform an annual impairment test of goodwill in the third quarter, and update the test during interim periods when we believe events or changes in circumstances indicate that we may not be able to recover the carrying value of a reporting unit. Impairment testing consists of a two-step process. The first step involves comparing the fair value of the reporting unit, to which goodwill has been allocated, with its carrying amount. If the carrying amount of the reporting unit exceeds its fair value, the second step of the
107
Table of Contents
DCP MIDSTREAM PARTNERS, LP
NOTES TO CONSOLIDATED FINANCIAL STATEMENTS
Years Ended December 31, 2010, 2009 and 2008 — (Continued)
process involves comparing the fair value and carrying value of the goodwill of that reporting unit. If the carrying value of the goodwill of a reporting unit exceeds the fair value of that goodwill, the excess of the carrying value over the fair value is recognized as an impairment loss. We use a discounted cash flow analysis supported by market valuation multiples to perform the assessment. Key assumptions in the analysis include the use of an appropriate discount rate and estimated future cash flows. In estimating cash flows, we incorporate current market information, as well as historical and other factors, into our forecasted commodity prices.
Intangible assets consist primarily of customer contracts, including commodity purchase, transportation and processing contracts and related relationships. These intangible assets are amortized on a straight-line basis over the period of expected future benefit. Intangible assets are removed from the gross carrying amount and the total of accumulated amortization in the period in which they become fully amortized.
Long-Lived Assets — We periodically evaluate whether the carrying value of long-lived assets has been impaired when circumstances indicate the carrying value of those assets may not be recoverable. This evaluation is based on undiscounted cash flow projections. The carrying amount is not recoverable if it exceeds the sum of the undiscounted cash flows expected to result from the use and eventual disposition of the asset. We consider various factors when determining if these assets should be evaluated for impairment, including but not limited to:
| • | significant adverse change in legal factors or business climate; |
| • | a current-period operating or cash flow loss combined with a history of operating or cash flow losses, or a projection or forecast that demonstrates continuing losses associated with the use of a long-lived asset; |
| • | an accumulation of costs significantly in excess of the amount originally expected for the acquisition or construction of a long-lived asset; |
| • | significant adverse changes in the extent or manner in which an asset is used, or in its physical condition; |
| • | a significant adverse change in the market value of an asset; or |
| • | a current expectation that, more likely than not, an asset will be sold or otherwise disposed of before the end of its estimated useful life. |
If the carrying value is not recoverable, the impairment loss is measured as the excess of the asset’s carrying value over its fair value. We assess the fair value of long-lived assets using commonly accepted techniques, and may use more than one method, including, but not limited to, recent third party comparable sales and discounted cash flow models. Significant changes in market conditions resulting from events such as the condition of an asset or a change in management’s intent to utilize the asset would generally require management to reassess the cash flows related to the long-lived assets.
Asset Retirement Obligations — Our asset retirement obligations relate primarily to the retirement of various gathering pipelines and processing facilities, obligations related to right-of-way easement agreements, and contractual leases for land use. We adjust our asset retirement obligation each quarter for any liabilities incurred or settled during the period, accretion expense and any revisions made to the estimated cash flows.
Investments in Unconsolidated Affiliates — We use the equity method to account for investments in greater than 20% owned affiliates that are not variable interest entities and where we do not have the ability to exercise control, and investments in less than 20% owned affiliates where we have the ability to exercise significant influence.
We evaluate our investments in unconsolidated affiliates for impairment whenever events or changes in circumstances indicate that the carrying value of such investments may have experienced a decline in value. When evidence of loss in value has occurred, we compare the estimated fair value of the investment to the carrying value of the investment to determine whether impairment has occurred. We assess the fair value of our
108
Table of Contents
DCP MIDSTREAM PARTNERS, LP
NOTES TO CONSOLIDATED FINANCIAL STATEMENTS
Years Ended December 31, 2010, 2009 and 2008 — (Continued)
investments in unconsolidated affiliates using commonly accepted techniques, and may use more than one method, including, but not limited to, recent third party comparable sales and discounted cash flow models. If the estimated fair value is considered to be permanently less than the carrying value, the excess of the carrying value over the estimated fair value is recognized as an impairment loss.
Unamortized Debt Expense — Expenses incurred with the issuance of long-term debt are amortized over the term of the debt using the effective interest method. These expenses are recorded on the consolidated balance sheet as other long-term assets.
Noncontrolling Interest — Noncontrolling interest represents any third party or affiliate interest in non-wholly-owned entities that we consolidate. For financial reporting purposes, the assets and liabilities of these entities are consolidated with those of our own, with any third party or affiliate interest in our consolidated balance sheet amounts shown as noncontrolling interest in equity. Distributions to and contributions from noncontrolling interests represent cash payments to and cash contributions from, respectively, such third party and affiliate investors.
Accounting for Risk Management Activities and Financial Instruments — Non-trading energy commodity derivatives are designated as either a hedge of a forecasted transaction or future cash flow (cash flow hedge), a hedge of a recognized asset, liability or firm commitment (fair value hedge), or normal purchases or normal sales. The remaining non-trading derivatives, which are related to asset-based activities for which the normal purchases or normal sale exception are not elected, are recorded at fair value in the consolidated balance sheets as unrealized gains or unrealized losses in derivative instruments, with changes in the fair value recognized in the consolidated statements of operations. For each derivative, the accounting method and presentation of gains and losses or revenue and expense in the consolidated statements of operations are as follows:
| Classification of Contract |
Accounting Method |
Presentation of Gains & Losses or Revenue & Expense | ||
| Non-Trading Derivative Activity |
Mark-to-market method (a) | Net basis in gains and losses from commodity derivative activity | ||
| Cash Flow Hedge |
Hedge method (b) | Gross basis in the same consolidated statements of operations category as the related hedged item | ||
| Fair Value Hedge |
Hedge method (b) | Gross basis in the same consolidated statements of operations category as the related hedged item | ||
| Normal Purchases or Normal Sales |
Accrual method (c) | Gross basis upon settlement in the corresponding consolidated statements of operations category based on purchase or sale | ||
| (a) | Mark-to-market method — An accounting method whereby the change in the fair value of the asset or liability is recognized in the consolidated statements of operations in gains and losses from commodity derivative activity during the current period. |
| (b) | Hedge method — An accounting method whereby the change in the fair value of the asset or liability is recorded in the consolidated balance sheets as unrealized gains or unrealized losses on derivative instruments. For cash flow hedges, there is no recognition in the consolidated statements of operations for the effective portion until the service is provided or the associated delivery period impacts earnings. For fair value hedges, the change in the fair value of the asset or liability, as well as the offsetting changes in value of the hedged item, are recognized in the consolidated statements of operations in the same category as the related hedged item. |
| (c) | Accrual method — An accounting method whereby there is no recognition in the consolidated balance sheets or consolidated statements of operations for changes in fair value of a contract until the service is provided or the associated delivery period impacts earnings. |
109
Table of Contents
DCP MIDSTREAM PARTNERS, LP
NOTES TO CONSOLIDATED FINANCIAL STATEMENTS
Years Ended December 31, 2010, 2009 and 2008 — (Continued)
Cash Flow and Fair Value Hedges — For derivatives designated as a cash flow hedge or a fair value hedge, we maintain formal documentation of the hedge. In addition, we formally assess both at the inception of the hedging relationship and on an ongoing basis, whether the hedge contract is highly effective in offsetting changes in cash flows or fair values of hedged items. All components of each derivative gain or loss are included in the assessment of hedge effectiveness, unless otherwise noted.
The fair value of a derivative designated as a cash flow hedge is recorded in the consolidated balance sheets as unrealized gains or unrealized losses on derivative instruments. The effective portion of the change in fair value of a derivative designated as a cash flow hedge is recorded in partners’ equity as AOCI, and the ineffective portion is recorded in the consolidated statements of operations. During the period in which the hedged transaction impacts earnings, amounts in AOCI associated with the hedged transaction are reclassified to the consolidated statements of operations in the same accounts as the item being hedged. Hedge accounting is discontinued prospectively when it is determined that the derivative no longer qualifies as an effective hedge, or when it is probable that the hedged transaction will not occur. When hedge accounting is discontinued because the derivative no longer qualifies as an effective hedge, the derivative is subject to the mark-to-market accounting method prospectively. The derivative continues to be carried on the consolidated balance sheets at its fair value; however, subsequent changes in its fair value are recognized in current period earnings. Gains and losses related to discontinued hedges that were previously accumulated in AOCI will remain in AOCI until the hedged transaction impacts earnings, unless it is probable that the hedged transaction will not occur, in which case, the gains and losses that were previously deferred in AOCI will be immediately recognized in current period earnings.
The fair value of a derivative designated as a fair value hedge is recorded for balance sheet purposes as unrealized gains or unrealized losses on derivative instruments. We recognize the gain or loss on the derivative instrument, as well as the offsetting loss or gain on the hedged item in earnings in the current period. All derivatives designated and accounted for as fair value hedges are classified in the same category as the item being hedged in the results of operations.
Valuation — When available, quoted market prices or prices obtained through external sources are used to determine a contract’s fair value. For contracts with a delivery location or duration for which quoted market prices are not available, fair value is determined based on pricing models developed primarily from historical relationships with quoted market prices and the expected relationship with quoted market prices.
Values are adjusted to reflect the credit risk inherent in the transaction as well as the potential impact of liquidating open positions in an orderly manner over a reasonable time period under current conditions. Changes in market prices and management estimates directly affect the estimated fair value of these contracts. Accordingly, it is reasonably possible that such estimates may change in the near term.
Revenue Recognition — We generate the majority of our revenues from gathering, processing, compressing, transporting, storing and fractionating natural gas and NGLs, and from trading and marketing of natural gas and NGLs. We realize revenues either by selling the residue natural gas and NGLs, or by receiving fees.
We obtain access to commodities and provide our midstream services principally under contracts that contain a combination of one or more of the following arrangements:
| • | Fee-based arrangements — Under fee-based arrangements, we receive a fee or fees for one or more of the following services: gathering, compressing, treating, processing, storing or transporting natural gas; and storing and transporting NGLs. Our fee-based arrangements include natural gas purchase arrangements pursuant to which we purchase natural gas at the wellhead or other receipt points, at an index related price at the delivery point less a specified amount, generally the same as the transportation fees we would otherwise charge for transportation of natural gas from the wellhead location to the delivery point. The revenues we earn are directly related to the volume of natural gas or NGLs that |
110
Table of Contents
DCP MIDSTREAM PARTNERS, LP
NOTES TO CONSOLIDATED FINANCIAL STATEMENTS
Years Ended December 31, 2010, 2009 and 2008 — (Continued)
| flows through our systems and are not directly dependent on commodity prices. However, to the extent a sustained decline in commodity prices results in a decline in volumes, our revenues from these arrangements would be reduced. |
| • | Percent-of-proceeds/liquids arrangements — Under percent-of-proceeds arrangements, we generally purchase natural gas from producers at the wellhead, or other receipt points, gather the wellhead natural gas through our gathering system, treat and process the natural gas, and then sell the resulting residue natural gas, NGLs and condensate based on index prices from published index market prices. We remit to the producers either an agreed-upon percentage of the actual proceeds that we receive from our sales of the residue natural gas, NGLs and condensate, or an agreed-upon percentage of the proceeds based on index related prices for the natural gas, NGLs and condensate, regardless of the actual amount of the sales proceeds we receive. We keep the difference between the proceeds received and the amount remitted back to the producer. Under percent-of-liquids arrangements, we do not keep any amounts related to residue natural gas proceeds and only keep amounts related to the difference between the proceeds received and the amount remitted back to the producer related to NGLs and condensate. Certain of these arrangements may also result in our returning all or a portion of the residue natural gas and/or the NGLs to the producer, in lieu of returning sales proceeds. Additionally, these arrangements may include fee-based components. Our revenues under percent-of-proceeds arrangements relate directly with the price of natural gas, NGLs and condensate. Our revenues under percent-of-liquids arrangements relate directly with the price of NGLs and condensate. |
| • | Propane sales arrangements — Under propane sales arrangements, we generally purchase propane from natural gas processing plants and fractionation facilities, and crude oil refineries. We sell propane on a wholesale basis to retail propane distributors, who in turn resell to their retail customers. Our sales of propane are not contingent upon the resale of propane by propane distributors to their retail customers. |
Our marketing of natural gas and NGLs consists of physical purchases and sales, as well as positions in derivative instruments.
We recognize revenues for sales and services under the four revenue recognition criteria, as follows:
| • | Persuasive evidence of an arrangement exists — Our customary practice is to enter into a written contract. |
| • | Delivery — Delivery is deemed to have occurred at the time custody is transferred, or in the case of fee-based arrangements, when the services are rendered. To the extent we retain product as inventory, delivery occurs when the inventory is subsequently sold and custody is transferred to the third party purchaser. |
| • | The fee is fixed or determinable — We negotiate the fee for our services at the outset of our fee-based arrangements. In these arrangements, the fees are nonrefundable. For other arrangements, the amount of revenue, based on contractual terms, is determinable when the sale of the applicable product has been completed upon delivery and transfer of custody. |
| • | Collectability is reasonably assured — Collectability is evaluated on a customer-by-customer basis. New and existing customers are subject to a credit review process, which evaluates the customers’ financial position (for example, credit metrics, liquidity and credit rating) and their ability to pay. If collectability is not considered probable at the outset of an arrangement in accordance with our credit review process, revenue is not recognized until the cash is collected. |
We generally report revenues gross in the consolidated statements of operations, as we typically act as the principal in these transactions, take custody to the product, and incur the risks and rewards of ownership. We recognize revenues for non-trading commodity derivative activity net in the consolidated statements of operations as gains and losses from commodity derivative activity. These activities include mark-to-market gains and losses on energy trading contracts and the settlement of financial or physical energy trading contracts.
111
Table of Contents
DCP MIDSTREAM PARTNERS, LP
NOTES TO CONSOLIDATED FINANCIAL STATEMENTS
Years Ended December 31, 2010, 2009 and 2008 — (Continued)
Quantities of natural gas or NGLs over-delivered or under-delivered related to imbalance agreements with customers, producers or pipelines are recorded monthly as accounts receivable or accounts payable using current market prices or the weighted-average prices of natural gas or NGLs at the plant or system. These balances are settled with deliveries of natural gas or NGLs, or with cash.
Significant Customers — There were no third party customers that accounted for more than 10% of total operating revenues for the years ended December 31, 2010, 2009 and 2008. There was one third party customer that accounted for approximately 17%, 12% and 11% of total operating revenues of the Wholesale Propane Logistics segment for the years ended December 31, 2010, 2009 and 2008, respectively. We also had significant transactions with affiliates.
Environmental Expenditures — Environmental expenditures are expensed or capitalized as appropriate, depending upon the future economic benefit. Expenditures that relate to an existing condition caused by past operations and that do not generate current or future revenue are expensed. Liabilities for these expenditures are recorded on an undiscounted basis when environmental assessments and/or clean-ups are probable and the costs can be reasonably estimated. Environmental liabilities as of December 31, 2010 and 2009, included in the consolidated balance sheets as other current liabilities amounted to $0.6 million and $0.5 million, respectively, and as other long-term liabilities amounted to $1.3 million and $0.6 million, respectively.
Equity-Based Compensation — Equity classified stock-based compensation cost is measured at fair value, based on the closing common unit price at grant date, and is recognized as expense over the vesting period. Liability classified stock-based compensation cost is remeasured at each reporting date at fair value, based on the closing common unit price, and is recognized as expense over the requisite service period. Compensation expense for awards with graded vesting provisions is recognized on a straight-line basis over the requisite service period of each separately vesting portion of the award. Awards granted to non-employees for acquiring, or in conjunction with selling, goods and services are measured at the estimated fair value of the goods or services, or the fair value of the award, whichever is more reliably measured.
Allowance for Doubtful Accounts — Management estimates the amount of required allowances for the potential non-collectability of accounts receivable generally based upon the number of days past due, past collection experience and consideration of other relevant factors. However, past experience may not be indicative of future collections and therefore additional charges could be incurred in the future to reflect differences between estimated and actual collections.
Income Taxes — We are structured as a master limited partnership which is a pass-through entity for federal income tax purposes. Our income tax expense includes certain jurisdictions, including state, local, franchise and margin taxes of the master limited partnership and subsidiaries. We follow the asset and liability method of accounting for income taxes. Under this method, deferred income taxes are recognized for the tax consequences of temporary differences between the financial statement carrying amounts and the tax basis of the assets and liabilities. Our taxable income or loss, which may vary substantially from the net income or loss reported in the consolidated statements of operations, is proportionately included in the federal returns of each partner.
Net Income or Loss per Limited Partner Unit — Basic and diluted net income or loss per limited partner unit is calculated by dividing limited partners’ interest in net income or loss by the weighted-average number of outstanding limited partner units during the period.
| 3. | Recent Accounting Pronouncements |
Financial Accounting Standards Board, or FASB, Accounting Standards Update, or ASU, 2010-29 “Business Combinations (Topic 805): Disclosure of Supplementary Pro Forma Information for Business Combinations”, or ASU 2010-29 — In December 2010, the FASB issued ASU 2010-29 which amended Accounting Standards Codification, or ASC, Topic 805 “Business Combinations” to specify that if a public
112
Table of Contents
DCP MIDSTREAM PARTNERS, LP
NOTES TO CONSOLIDATED FINANCIAL STATEMENTS
Years Ended December 31, 2010, 2009 and 2008 — (Continued)
entity presents comparative financial statements, the entity should disclose revenue and earnings of the combined entity as though the business combination that occurred during the year had occurred as of the beginning of the comparable prior annual reporting period only. The ASU also expands the supplemental pro forma disclosures under Topic 805 to include a description of the nature and the amount of material, nonrecurring pro forma adjustments directly attributable to the business combination included in the reported pro forma revenue and earnings. ASU 2010-29 is effective for business combinations for which the acquisition date is on or after January 1, 2011 and we will disclose information in accordance with the ASU within all financial statements issued after the effective date.
ASU 2010-28 “Intangibles—Goodwill and Other (Topic 350): When to Perform Step 2 of the Goodwill Impairment Test for Reporting Units with Zero or Negative Carrying Amounts”, or ASU 2010-28 — In December 2010, the FASB issued ASU 2010-28 which amended ASC Topic 350 “Goodwill and Other”. ASU 2010-28 requires an entity with reporting units that have carrying amounts that are zero or negative to assess whether it is more likely than not that the reporting units’ goodwill is impaired. If the entity determines that it is more likely than not that the goodwill of one or more of its reporting units is impaired, the entity is required to perform Step 2 of the goodwill impairment test for those reporting unit(s) and record any resulting impairment as a cumulative-effect adjustment to beginning retained earnings. The provisions of ASU 2010-28 became effective for us on January 1, 2011, and we will disclose information in accordance with the ASU within all financial statements issued after the effective date.
ASU 2010-06 “Fair Value Measurements and Disclosures (Topic 820): Improving Disclosures about Fair Value Measurements”, or ASU 2010-06 — In January 2010, the FASB issued ASU 2010-06 which amended ASC Topic 820-10 “Fair Value Measurement and Disclosures — Overall.” ASU 2010-06 requires new disclosures regarding transfers in and out of assets and liabilities measured at fair value classified within the valuation hierarchy as either Level 1 or Level 2 and information about sales, issuances and settlements on a gross basis for assets and liabilities classified as Level 3. ASU 2010-06 clarifies existing disclosures on the level of disaggregation required and inputs and valuation techniques. The provisions of ASU 2010-06 became effective for us on January 1, 2010, except for disclosure of information about sales, issuances and settlements on a gross basis for assets and liabilities classified as Level 3, which became effective for us on January 1, 2011. The provisions of ASU 2010-06 impact only disclosures and we have disclosed information in accordance with the revised provisions of ASU 2010-06 within this filing.
ASU 2009-17 “Consolidation (Topic 810): Improvements to Financial Reporting by Enterprises Involved with Variable Interest Entities”, or ASU 2009-17 — In December 2009, the FASB issued ASU 2009-17 which amended ASC Topic 810 “Consolidation.” ASU 2009-17 requires entities to perform additional analysis of their variable interest entities and consolidation methods. This ASU became effective for us on January 1, 2010 and upon adoption, we did not change our conclusions on which entities we consolidate in our consolidated financial statements.
ASU 2009-13 “Revenue Recognition (Topic 605) Multiple-Deliverable Revenue Arrangements”, or ASU 2009-13 — In October 2009, the FASB issued ASU 2009-13 which amended ASC Topic 605 “Revenue Recognition.” The ASU addresses the accounting for multiple-deliverable arrangements, to enable vendors to account for products or services separately rather than as a combined unit. ASU 2009-13 became effective for us on January 1, 2011 and there was no impact on our consolidated results of operations, cash flows and financial position as a result of adoption.
| 4. | Acquisitions |
On December 30, 2010, we acquired all of the interests in Marysville Hydrocarbons Holdings, LLC, or Marysville. The acquisition involved three separate transactions with a number of parties. The Partnership acquired a 90% interest in Marysville from Dart Energy Corporation, a 5% interest in Marysville from Prospect Street Energy, LLC and 100% of EE Group, LLC, which owns the remaining 5% interest in Marysville. We
113
Table of Contents
DCP MIDSTREAM PARTNERS, LP
NOTES TO CONSOLIDATED FINANCIAL STATEMENTS
Years Ended December 31, 2010, 2009 and 2008 — (Continued)
paid a purchase price of $94.8 million and $6.0 million for net working capital and other adjustments for an aggregate purchase price of $100.8 million subject to customary purchase price adjustments, for our 100% interest. The cash purchase was financed at closing with borrowings under the Partnership’s revolving credit facility. $21.2 million of the purchase price has been deposited in an indemnity escrow to satisfy certain tax liabilities and provide for breaches of representations and warranties of the sellers.
On January 4, 2011, we merged two wholly-owned subsidiaries of Marysville and converted the combined entity’s organizational structure from a corporation to a limited liability company. This conversion to a limited liability company triggers tax liabilities, resulting from built-in tax gains recognized in the transaction, to become currently payable. Accordingly, $35.0 million of estimated deferred tax liabilities associated with this transaction and recorded at December 31, 2010, became currently payable as of January 4, 2011. These tax liabilities are unrelated to the tax liabilities of Marysville for which the indemnity escrow has been established. These tax liabilities may be greater or less than the $35.0 million currently recorded in our balance sheet as of December 31, 2010 depending on the final accounting for the Marysville business combination.
Given the recent timing of this acquisition, we have not completed the accounting for the Marysville business combination and have not made certain disclosures. These disclosures include the final fair value of assets acquired and liabilities assumed and pro-forma information. The final accounting and related disclosures for business combinations will be made in subsequent financial statements. The purchase price allocation is preliminary and is based on estimates of fair values at the date of the acquisition. Currently, all amounts included in property, plant and equipment are classified as processing, storage and terminal facilities. This allocation may change in subsequent financial statements. We are currently evaluating the preliminary purchase price allocation, which will be adjusted as additional information relative to the fair value of assets and liabilities becomes available. The preliminary purchase price allocation is as follows:
| (Millions) | ||||
| Aggregate consideration |
$ | 100.8 | ||
| Cash |
3.1 | |||
| Accounts receivable |
1.1 | |||
| Inventory |
5.7 | |||
| Other current assets |
0.7 | |||
| Property, plant and equipment |
129.9 | |||
| Accounts payable |
(0.7 | ) | ||
| Other current liabilities |
(4.0 | ) | ||
| Long-term liabilities |
(35.0 | ) | ||
| Total preliminary purchase price allocation |
$ | 100.8 | ||
On July 30, 2010, we acquired Atlantic Energy, a wholly-owned subsidiary of UGI Corporation, for $49.0 million plus propane inventory and other working capital of $17.3 million. We have incurred additional post-closing purchase price adjustments for net working capital of $1.9 million for an aggregate purchase price of $68.2 million. Atlantic Energy has a contractual agreement with Spectra Energy, the supplier of the acquired propane inventory, in which the final price of the acquired inventory will be determined based upon index rates at established future dates. Atlantic Energy’s sales agreements specify floating pricing terms in excess of the floating pricing terms established in the contractual agreement with Spectra. The cash purchase was financed at closing with borrowings under our revolving credit facility. Atlantic Energy owns and operates a marine import terminal with 20 million gallons of above ground storage in the Port of Chesapeake, Virginia. The assets serve as a supply point for propane customers in the mid-atlantic region, and will extend our existing northeastern U.S. wholesale propane business into the mid-atlantic. The results of the Atlantic Energy acquisition are included prospectively from the date of acquisition in our Wholesale Propane Logistics segment.
114
Table of Contents
DCP MIDSTREAM PARTNERS, LP
NOTES TO CONSOLIDATED FINANCIAL STATEMENTS
Years Ended December 31, 2010, 2009 and 2008 — (Continued)
The purchase price allocation is preliminary and is based on initial estimates of fair values at the date of the acquisition. We will continue to evaluate the initial purchase price allocation, which may be adjusted as additional information relative to the fair value of assets and liabilities becomes available. The preliminary purchase price allocation is as follows:
| (Millions) | ||||
| Aggregate consideration |
$ | 68.2 | ||
| Cash |
$ | 0.4 | ||
| Accounts receivable |
2.1 | |||
| Inventory |
16.6 | |||
| Property, plant and equipment |
15.2 | |||
| Intangible assets |
27.2 | |||
| Goodwill |
7.6 | |||
| Other liabilities |
(0.9 | ) | ||
| Total preliminary purchase price allocation |
$ | 68.2 | ||
On July 27, 2010, we acquired an additional 5% interest in Black Lake from DCP Midstream, LLC, in a transaction among entities under common control, for $1.5 million in cash, financed at closing with borrowings under our revolving credit facility. This transaction brought our ownership interest in Black Lake to 50%. The historical carrying value of DCP Midstream, LLC’s 5% interest in Black Lake was $0.7 million; accordingly we have recorded the $0.8 million excess purchase price over acquired assets as a decrease in common unitholders equity.
On July 30, 2010, we acquired an additional 50% interest in Black Lake from an affiliate of BP PLC, for $15.1 million in cash, financed at closing with borrowings under our revolving credit facility, bringing our ownership interest in Black Lake to 100%. Prior to our acquisition of an additional 50% interest in Black Lake, we accounted for Black Lake under the equity method of accounting. Subsequent to this transaction we account for Black Lake as a consolidated subsidiary. As a result of acquiring an additional 50% interest in Black Lake, we have remeasured our initial 50% interest in Black Lake to its fair value. Accordingly we recognized a gain of $9.1 million in step acquisition — equity interest re-measurement gain in our consolidated statement of operations for the year ended December 31, 2010, which reflects the increase from the net assets historical carrying value, to the net assets fair value for our initial 50% interest. We have evaluated certain pre-acquisition contingencies arising from potential environmental issues that existed as of the acquisition date. We have determined that certain of these pre-acquisition contingencies are probable in nature and estimable as of the acquisition date and, accordingly, have recorded $0.9 million for these contingencies as a part of the purchase price allocation for Black Lake.
The results of our additional 50% interest in Black Lake are included prospectively from the date of acquisition in our NGL Logistics segment. Our calculation of the step acquisition — equity interest re-measurement gain is as follows:
| (Millions) | ||||
| Fair value of 50% equity interest in Black Lake |
$ | 15.1 | ||
| Less: Carrying value of 50% equity interest in Black Lake |
6.0 | |||
| Step acquisition — equity interest re-measurement gain |
$ | 9.1 | ||
115
Table of Contents
DCP MIDSTREAM PARTNERS, LP
NOTES TO CONSOLIDATED FINANCIAL STATEMENTS
Years Ended December 31, 2010, 2009 and 2008 — (Continued)
The purchase price is preliminary and is based on initial estimates of fair values at the date of the acquisition. We will continue to evaluate the initial purchase price allocation, which may be adjusted as additional information relative to the fair value of assets and liabilities becomes available. The preliminary purchase price allocation is as follows:
| (Millions) | ||||
| Cash consideration |
$ | 15.1 | ||
| Cash |
$ | 0.8 | ||
| Accounts receivable |
0.6 | |||
| Property, plant and equipment |
27.4 | |||
| Intangible assets |
2.7 | |||
| Other asset |
0.3 | |||
| Other liabilities |
(1.6 | ) | ||
| Fair value of 100% interest in Black Lake |
30.2 | |||
| Less: |
||||
| Carrying value of initial 50% equity interest in Black Lake |
(6.0 | ) | ||
| Step acquisition — equity interest re-measurement gain |
(9.1 | ) | ||
| Total preliminary purchase price allocation |
$ | 15.1 | ||
On February 3, 2010, we acquired an additional 5% interest in Collbran Valley Gas Gathering LLC, or Collbran, from Delta Petroleum Company, or Delta, for $3.5 million in cash, bringing our total ownership in Collbran to 75%. In addition, as part of this transaction we paid Delta’s unpaid capital calls to Collbran of $2.4 million. We may pay an additional $2.0 million of contingent consideration to Delta if Delta meets certain throughput volume thresholds by June 30, 2011, pursuant to a gathering agreement. We recognized the fair value of this contingent consideration of approximately $1.0 million, which we recorded to other current liabilities in our consolidated balance sheet. Accordingly, we recognized a $5.5 million reduction in noncontrolling interest in equity, which represents the carrying value of Delta’s 5% interest in Collbran, and an increase of $1.0 million to common unitholders in equity, which represented the difference between the fair value of the consideration and the carrying value of Delta’s 5% interest. As of September 30, 2010, we reassessed the fair value of the contingent consideration and adjusted the fair value of the liability to $0, and there has been no change to our assessment of the fair value as of December 31, 2010. Accordingly, we recognized $1.0 million in other income in our consolidated results of operations during the year ended December 31, 2010.
On January 28, 2010, we acquired an interstate natural gas liquids pipeline, or the Wattenberg pipeline, from Buckeye Partners, L.P., or Buckeye, for $22.0 million in cash, funded at closing with borrowings under our revolving credit facility. This transaction was accounted for as a business combination. The 350-mile pipeline originates in the Denver-Julesburg, or DJ Basin, in Colorado and terminates near the Conway hub in Bushton, Kansas. The pipeline is currently utilized by DCP Midstream, LLC as a market outlet for NGL production from certain of their plants in the DJ Basin. The results of the asset are included in our NGL Logistics segment prospectively, from the date of acquisition. The purchase price was allocated to property, plant and equipment.
116
Table of Contents
DCP MIDSTREAM PARTNERS, LP
NOTES TO CONSOLIDATED FINANCIAL STATEMENTS
Years Ended December 31, 2010, 2009 and 2008 — (Continued)
Combined Financial Information
The following tables present the total operating revenues and net income attributable to partners, associated with the acquisition of the Wattenberg pipeline, Atlantic Energy, and an additional 50% interest in Black Lake, or the acquired assets, from their respective dates of acquisition through December 31, 2010. These amounts have been included in the consolidated statement of operations.
| Year Ended December 31, 2010 | ||||||||||||||||
| Wattenberg Pipeline |
Atlantic Energy |
Additional 50% interest in Black Lake |
Total | |||||||||||||
| (Millions) | ||||||||||||||||
| Total operating revenues |
$ | 3.3 | $ | 35.5 | $ | 2.9 | $ | 41.7 | ||||||||
| Net income attributable to partners |
$ | 1.1 | $ | 1.3 | $ | 1.0 | $ | 3.4 | ||||||||
The following tables present unaudited pro forma information for the consolidated statements of operations for the years ended December 31, 2010 and 2009, as if the acquisitions had occurred at the beginning of each period presented. The 2010 results presented for Wattenberg, Atlantic Energy and Black Lake below represent results of operations from the beginning of the period to the respective date of acquisition. The results of operations for these acquired assets subsequent to the date of acquisition are included in the DCP Midstream Partners, LP results.
| Year Ended December 31, 2010 | ||||||||||||||||||||
| DCP Midstream Partners, LP |
Acquisition of the Wattenberg Pipeline |
Acquisition of Atlantic Energy |
Acquisition of an additional 50% interest in Black Lake |
DCP Midstream Partners, LP Pro Forma |
||||||||||||||||
| (Millions, except per unit amounts) | ||||||||||||||||||||
| Total operating revenues |
$ | 1,269.5 | $ | 0.2 | $ | 64.5 | $ | 4.1 | $ | 1,338.3 | ||||||||||
| Net income attributable to partners |
$ | 48.0 | $ | 0.1 | $ | 1.1 | $ | 0.6 | $ | 49.8 | ||||||||||
| Less: |
||||||||||||||||||||
| General partner’s interest in net income or net loss |
(16.9 | ) | — | — | — | (16.9 | ) | |||||||||||||
| Net income allocable to limited partners |
$ | 31.1 | $ | 0.1 | $ | 1.1 | $ | 0.6 | $ | 32.9 | ||||||||||
| Net income per limited partner unit – basic and diluted |
$ | 0.86 | $ | — | $ | 0.03 | $ | 0.02 | $ | 0.91 | ||||||||||
| Year Ended December 31, 2009 | ||||||||||||||||||||
| DCP Midstream Partners, LP |
Acquisition of the Wattenberg Pipeline(a) |
Acquisition of Atlantic Energy |
Acquisition of an additional 50% interest in Black Lake |
DCP Midstream Partners, LP Pro Forma |
||||||||||||||||
| (Millions, except per unit amounts) | ||||||||||||||||||||
| Total operating revenues |
$ | 942.4 | $ | 9.2 | $ | 67.5 | $ | 7.0 | $ | 1,026.1 | ||||||||||
| Net (loss) income attributable to partners |
$ | (19.1 | ) | $ | (67.0 | ) | $ | 0.7 | $ | 1.7 | $ | (83.7 | ) | |||||||
| Less: |
||||||||||||||||||||
| Net loss attributable to predecessor operations |
1.0 | — | — | — | 1.0 | |||||||||||||||
| General partner’s interest in net income or net loss |
(12.7 | ) | (0.7 | ) | — | — | (13.4 | ) | ||||||||||||
| Net (loss) income allocable to limited partners |
$ | (30.8 | ) | $ | (67.7 | ) | $ | 0.7 | $ | 1.7 | $ | (96.1 | ) | |||||||
| Net (loss) income per limited partner unit – basic and diluted |
$ | (0.99 | ) | $ | (2.16 | ) | $ | 0.02 | $ | 0.05 | $ | (3.08 | ) | |||||||
| (a) | During the second quarter of 2009, prior to our ownership, Buckeye received notification that several of its shippers on the Wattenberg pipeline intended to migrate to a competing pipeline that had recently been put |
117
Table of Contents
DCP MIDSTREAM PARTNERS, LP
NOTES TO CONSOLIDATED FINANCIAL STATEMENTS
Years Ended December 31, 2010, 2009 and 2008 — (Continued)
| into service. The notification by the shippers was accompanied by a significant decline in shipment volumes as compared to historical averages. As a result Buckeye recognized an impairment charge of $72.5 million in relation to the Wattenberg pipeline. |
The pro forma information is not intended to reflect actual results that would have occurred if the assets had been combined during the periods presented, nor is it intended to be indicative of the results of operations that may be achieved by us in the future.
| 5. | Agreements and Transactions with Affiliates |
DCP Midstream, LLC
Omnibus Agreement and Other General and Administrative Charges
We have entered into an omnibus agreement, as amended, or the Omnibus Agreement, with DCP Midstream, LLC.
Following is a summary of the fees we incurred under the Omnibus Agreement as well as other fees paid to DCP Midstream, LLC:
| Year Ended December 31, | ||||||||||||
| 2010 | 2009 | 2008 | ||||||||||
| (Millions) | ||||||||||||
| Omnibus Agreement |
$ | 9.9 | $ | 9.7 | $ | 9.8 | ||||||
| Other fees — DCP Midstream, LLC |
9.3 | 10.4 | 10.4 | |||||||||
| Total — DCP Midstream, LLC |
$ | 19.2 | $ | 20.1 | $ | 20.2 | ||||||
Under the Omnibus Agreement, we are required to reimburse DCP Midstream, LLC for salaries of operating personnel and employee benefits as well as capital expenditures, maintenance and repair costs, taxes and other direct costs incurred by DCP Midstream, LLC on our behalf. We also pay DCP Midstream, LLC an annual fee for centralized corporate functions performed by DCP Midstream, LLC on our behalf, including legal, accounting, cash management, insurance administration and claims processing, risk management, health, safety and environmental, information technology, human resources, credit, payroll, taxes and engineering.
In January 2011, we extended the omnibus agreement through December 31, 2011 for $10.2 million. The Omnibus Agreement also addresses the following matters:
| • | DCP Midstream, LLC’s obligation to indemnify us for certain liabilities and our obligation to indemnify DCP Midstream, LLC for certain liabilities; and |
| • | DCP Midstream, LLC’s obligation to continue to maintain its credit support, including without limitation guarantees and letters of credit, for our obligations related to commercial contracts with respect to its business or operations that were in effect at the closing of our initial public offering until the expiration of such contracts. |
Any or all of the provisions of the Omnibus Agreement, other than the indemnification provisions, will be terminable by DCP Midstream, LLC at its option if the general partner is removed without cause and units held by the general partner and its affiliates are not voted in favor of that removal. The Omnibus Agreement will also terminate in the event of a change of control of us, the general partner (DCP Midstream GP, LP) or the General Partner (DCP Midstream GP, LLC).
East Texas incurs general and administrative expenses directly from DCP Midstream, LLC. During the years ended December 31, 2010, 2009 and 2008, East Texas incurred $7.8 million, $8.5 million and $8.6 million, respectively, for general and administrative expenses from DCP Midstream, LLC, which includes expenses for our predecessor operations.
118
Table of Contents
DCP MIDSTREAM PARTNERS, LP
NOTES TO CONSOLIDATED FINANCIAL STATEMENTS
Years Ended December 31, 2010, 2009 and 2008 — (Continued)
In addition to the Omnibus Agreement and amounts incurred by East Texas, we incurred other fees with DCP Midstream, LLC, which includes expenses for our predecessor operations, of $1.5 million, $1.9 million and $1.8 million, respectively, for the years ended December 31, 2010, 2009 and 2008, respectively. These amounts include allocated expenses, including professional services, insurance and internal audit.
Competition
None of DCP Midstream, LLC, or any of its affiliates, including Spectra Energy and ConocoPhillips, is restricted, under either the partnership agreement or the Omnibus Agreement, from competing with us. DCP Midstream, LLC and any of its affiliates, including Spectra Energy and ConocoPhillips, may acquire, construct or dispose of additional midstream energy or other assets in the future without any obligation to offer us the opportunity to purchase or construct those assets.
Indemnification
In connection with our acquisition of our wholesale propane logistics business, DCP Midstream, LLC agreed to indemnify us until October 31, 2010 if certain contractual matters result in a claim, and agreed to indemnify us indefinitely for breaches of the agreement. The indemnity obligation for breach of the representations and warranties is not effective until claims exceed in the aggregate $680,000 and is subject to a maximum liability of $6.8 million. This indemnity obligation for all other claims other than a breach of the representations and warranties does not become effective until an individual claim or series of related claims exceed $50,000. We have not pursued indemnification under this agreement.
Other Agreements and Transactions with DCP Midstream, LLC
On November 4, 2010, we entered into agreements with DCP Midstream, LLC, to acquire a 33.33% interest in Southeast Texas, for $150.0 million. The Southeast Texas system is a fully integrated midstream business which includes 675 miles of natural gas pipelines, three natural gas processing plants with recently increased processing capacity totaling 380 MMcf/d, and natural gas storage assets with 9 Bcf of existing storage capacity. The terms of the joint venture agreement provide that distributions to us for the first seven years related to storage and transportation gross margin will be pursuant to a fee-based arrangement, based on storage capacity and tailgate volumes. Distributions related to the gathering and processing business, along with reductions for all expenditures, will be pursuant to our and DCP Midstream, LLC’s respective ownership interests in Southeast Texas. This transaction closed on January 1, 2011.
On September 16, 2010, we entered into an agreement with DCP Midstream, LLC to sell certain surplus equipment with a net book value of $6.2 million, for net proceeds of $3.6 million. The surplus equipment is the result of a consolidation of operations at our Anderson Gulch plant in the Piceance Basin. The net proceeds of $3.6 million have been distributed 75% to us and 25% to the noncontrolling interest in Collbran, based upon proportionate ownership. The title to the surplus equipment will pass to DCP Midstream, LLC upon removal of the equipment from our premises. As of December 31, 2010, the surplus equipment has been reclassified from property, plant and equipment, to current assets and classified as assets held for sale in our consolidated balance sheets. In addition, we have recorded a deferred credit of $3.6 million in other current liabilities in our consolidated balance sheets.
On June 30, 2010, we entered into an agreement with DCP Midstream, LLC to sell certain surplus equipment with a net book value of $1.6 million, for net proceeds of $2.2 million. The surplus equipment is the result of our integration efforts and synergies realized following our acquisition of certain companies that held natural gas gathering and treating assets from MichCon Pipeline Company in November 2009. We have recognized a contribution of $0.6 million for the year ended December 31, 2010, from DCP Midstream, LLC in our consolidated statements of changes in equity representing the difference between the net book value and the proceeds received for the surplus equipment.
119
Table of Contents
DCP MIDSTREAM PARTNERS, LP
NOTES TO CONSOLIDATED FINANCIAL STATEMENTS
Years Ended December 31, 2010, 2009 and 2008 — (Continued)
In conjunction with our acquisition of a 50.1% limited liability company interest in East Texas from DCP Midstream, LLC, we entered into agreements with DCP Midstream, LLC whereby DCP Midstream, LLC will reimburse East Texas for certain expenditures on East Texas capital projects as defined in the Contribution Agreements. These reimbursements are for certain capital projects which have commenced within three years from the respective acquisition dates. DCP Midstream, LLC made capital contributions to East Texas for capital projects of $13.8 million and $67.5 million for the years ended December 31, 2010 and 2009, respectively.
On February 11, 2009, our East Texas natural gas processing complex and natural gas delivery system known as the Carthage Hub, was temporarily shut in following a fire that was caused by a third party underground pipeline outside of our property line that ruptured. We are actively pursuing full reimbursement of our costs and lost margin associated with the incident from the responsible third party. East Texas filed a lawsuit in December 2009, to recover damages from the responsible third party. In the event we are unable to recover our costs and lost margin from the responsible third party, we have insurance covering property damage, net of applicable deductibles. Following this incident, DCP Midstream, LLC has agreed to reimburse to us 25% of any claims received as reimbursement of costs and lost margin, from the responsible third party or from insurance. DCP Midstream, LLC will pay 75% of costs related to the incident as a result of this agreement.
On February 25, 2009, we entered into a Contribution Agreement with DCP Midstream, LLC, whereby DCP Midstream, LLC contributed an additional 25.1% interest in East Texas and the NGL Hedge to us in exchange for 3,500,000 Class D units, providing us with a 50.1% interest in East Texas. This transaction closed in April 2009. Subsequent to this transaction we consolidate our 50.1% interest in East Texas and consequently no longer account for East Texas as an unconsolidated affiliate. The Class D Units converted into the Partnership’s Common Units on a one-for-one basis on August 17, 2009.
We sell a portion of our residue gas, NGLs and condensate to, purchase natural gas and other petroleum products from, and provide gathering and transportation services for, DCP Midstream, LLC. We anticipate continuing to purchase from and sell commodities to DCP Midstream, LLC in the ordinary course of business. In addition, DCP Midstream, LLC conducts derivative activities on our behalf.
DCP Midstream, LLC owns certain assets and is party to certain contractual relationships around our Pelico system, included in our Northern Louisiana system, which is part of our Natural Gas Services segment, that are periodically used for the benefit of Pelico. DCP Midstream, LLC is able to source natural gas upstream of Pelico and deliver it to us and is able to take natural gas from the outlet of the Pelico system and market it downstream of Pelico. We purchase natural gas from DCP Midstream, LLC upstream of Pelico and transport it to Pelico under a firm transportation agreement with an affiliate. Our purchases from DCP Midstream, LLC are at DCP Midstream LLC’s actual acquisition cost plus any transportation service charges. Volumes that exceed our on-system demand are sold to DCP Midstream, LLC at an index-based price, less contractually agreed to marketing fees. Revenues associated with these activities are reported gross in our consolidated statements of operations as sales of natural gas, propane, NGLs and condensate to affiliates.
In addition, in our Natural Gas Services segment, we sell NGLs processed at certain of our plants, and sell condensate removed from the gas gathering systems that deliver to certain of our systems under contracts to a subsidiary of DCP Midstream, LLC equal to that subsidiary’s net weighted-average sales price, adjusted for transportation, processing and other charges from the tailgate of the respective asset.
In April 2009, we entered into a thirteen year contractual arrangement with DCP Midstream, LLC in which we pay DCP Midstream, LLC a fee for processing services associated with the gas we gather on our Southern Oklahoma system, which is part of our Natural Gas Services segment. In addition, in February 2010, a contract was signed with DCP Midstream, LLC providing for adjustments to those fees based upon plant efficiencies related to our portion of volumes from the Southern Oklahoma system being processed at DCP Midstream, LLC’s plant through March 2022. We generally report fees associated with these activities in the consolidated statements of operations as purchases of natural gas, propane, NGLs and condensate from affiliates. In addition,
120
Table of Contents
DCP MIDSTREAM PARTNERS, LP
NOTES TO CONSOLIDATED FINANCIAL STATEMENTS
Years Ended December 31, 2010, 2009 and 2008 — (Continued)
as part of this arrangement, DCP Midstream, LLC pays us a fee for certain gathering services. We generally report revenues associated with these activities in the consolidated statements of operations as transportation, processing and other to affiliates.
In our NGL Logistics segment, we also have a contractual arrangement with a subsidiary of DCP Midstream, LLC that provides that DCP Midstream, LLC will pay us to transport NGLs over our Seabreeze and Wilbreeze pipelines, pursuant to fee-based rates that will be applied to the volumes transported. DCP Midstream, LLC is the sole shipper on these pipelines under the transportation agreements. We generally report revenues associated with these activities in the consolidated statements of operations as transportation, processing and other to affiliates.
In conjunction with our acquisition of the Wattenberg pipeline, which is part of our NGL Logistics segment, we signed a transportation agreement with DCP Midstream, LLC pursuant to fee-based rates that will be applied to the volumes transported. The agreement was effective through December 31, 2010. Effective January 1, 2011, we entered into a 10-year dedication and transportation agreement with a subsidiary of DCP Midstream, LLC whereby certain NGL volumes produced at several of DCP Midstream, LLC’s processing facilities are dedicated for transportation on the Wattenberg pipeline. We collect fee-based transportation revenues under our tariff. We generally report revenues associated with these activities in the consolidated statements of operations as transportation, processing and other to affiliates.
DCP Midstream, LLC has issued parental guarantees totaling $65.0 million as of December 31, 2010, in favor of certain counterparties to our commodity derivative instruments to mitigate a portion of our collateral requirements with those counterparties. We pay DCP Midstream, LLC interest of 0.5% per annum on these outstanding guarantees.
In conjunction with our acquisition of a 40% limited liability company interest in Discovery from DCP Midstream, LLC in July 2007, we entered into a letter agreement with DCP Midstream, LLC whereby DCP Midstream, LLC will make capital contributions to us as reimbursement for certain Discovery capital projects, which were forecasted to be completed prior to our acquisition of a 40% limited liability company interest in Discovery. Pursuant to the letter agreement, DCP Midstream, LLC made capital contributions to us of $0.7 million and $3.8 million during the years ended December 31, 2009 and 2008, respectively to reimburse us for these capital projects, which were substantially completed during 2008. There were no reimbursements to us in 2010.
DCP Midstream, LLC has issued parental guarantees for its 49.9% limited liability company interest in East Texas, totaling $6.0 million as of December 31, 2010, in favor of certain counterparties to processing and transportation agreements at East Texas. Concurrently, we have issued similar guarantees for our 50.1% interest.
DCP Midstream, LLC was a significant customer during the years ended December 31, 2010, 2009 and 2008.
Spectra Energy
We have a propane supply agreement with Spectra Energy, effective from May 1, 2008 through April 30, 2012, which provides us propane supply at our Providence marine terminal, which is included in our Wholesale Propane Logistics segment, for up to approximately 120 million gallons of propane annually. On June 15, 2010, we entered into an amendment to the supply agreement to shorten the term of the agreement by two years to April 30, 2012, which previously terminated on April 30, 2014. In consideration for shortening the term, Spectra Energy provided us with a cash payment of $3.0 million, which we recognized in other income — affiliates, in our Wholesale Propane Logistics segment in the consolidated statements of operations.
In conjunction with our acquisition of Atlantic Energy on July 30, 2010, we acquired a propane supply agreement with Spectra Energy, effective from May 1, 2010 to April 30, 2012, which provides us propane supply for our Chesapeake marine terminal, which is included in our Wholesale Propane Logistics segment, for up to approximately 65 million gallons of propane annually.
121
Table of Contents
DCP MIDSTREAM PARTNERS, LP
NOTES TO CONSOLIDATED FINANCIAL STATEMENTS
Years Ended December 31, 2010, 2009 and 2008 — (Continued)
In December 2010, Spectra Energy’s international propane supplier breached its contract with Spectra Energy by failing to make certain scheduled propane deliveries that were to be delivered to us under our propane supply contracts with Spectra Energy. We were able to secure spot shipments on the open market at a price higher than our contract price to cover these missing deliveries. In December 2010 Spectra Energy made a $17.0 million payment to us to reimburse us for the damages we incurred for our open market purchases.
ConocoPhillips
We have multiple agreements with ConocoPhillips and its affiliates. The agreements include fee-based and percent-of-proceeds gathering and processing arrangements, and gas purchase and gas sales agreements. We anticipate continuing to purchase from and sell these commodities to ConocoPhillips and its affiliates in the ordinary course of business. In addition, we may be reimbursed by ConocoPhillips for certain capital projects where the work is performed by us. We received $0.2 million, $0.6 million and $1.9 million of capital reimbursements during the years ended December 31, 2010, 2009 and 2008, respectively.
Summary of Transactions with Affiliates
The following table summarizes the transactions with affiliates:
| Year Ended December 31, | ||||||||||||
| 2010 | 2009 | 2008 | ||||||||||
| (Millions) | ||||||||||||
| DCP Midstream, LLC: |
||||||||||||
| Sales of natural gas, propane, NGLs and condensate |
$ | 522.7 | $ | 451.4 | $ | 760.1 | ||||||
| Transportation, processing and other |
$ | 12.1 | $ | 7.5 | $ | 15.4 | ||||||
| Purchases of natural gas, propane and NGLs |
$ | 183.1 | $ | 138.4 | $ | 175.4 | ||||||
| Losses from commodity derivative activity, net |
$ | (1.2 | ) | $ | (3.5 | ) | $ | (3.7 | ) | |||
| General and administrative expense |
$ | 19.2 | $ | 20.1 | $ | 20.2 | ||||||
| Interest expense |
$ | 0.2 | $ | 0.2 | $ | 0.4 | ||||||
| Spectra Energy: |
||||||||||||
| Sales of natural gas, propane, NGLs and condensate |
$ | — | $ | — | $ | 0.3 | ||||||
| Transportation, processing and other |
$ | 0.2 | $ | 0.3 | $ | 0.2 | ||||||
| Purchases of natural gas, propane and NGLs (a) |
$ | 82.1 | $ | 95.2 | $ | 50.9 | ||||||
| Other income |
$ | 3.0 | $ | — | $ | — | ||||||
| ConocoPhillips: |
||||||||||||
| Sales of natural gas, propane, NGLs and condensate |
$ | 5.7 | $ | 5.3 | $ | 31.1 | ||||||
| Transportation, processing and other |
$ | 8.1 | $ | 8.2 | $ | 10.6 | ||||||
| Purchases of natural gas, propane and NGLs |
$ | 7.4 | $ | 12.7 | $ | 36.7 | ||||||
| General and administrative expense |
$ | 0.2 | $ | 0.3 | $ | — | ||||||
| Unconsolidated affiliates: |
||||||||||||
| Purchases of natural gas, propane and NGLs |
$ | 4.8 | $ | 0.4 | $ | — | ||||||
| (a) | Includes a $17.0 million payment received in December 2010 for reimbursement of damages we incurred when an international propane supplier breached its contract with Spectra Energy. |
122
Table of Contents
DCP MIDSTREAM PARTNERS, LP
NOTES TO CONSOLIDATED FINANCIAL STATEMENTS
Years Ended December 31, 2010, 2009 and 2008 — (Continued)
We had balances with affiliates as follows:
| December 31, | ||||||||
| 2010 | 2009 | |||||||
| (Millions) | ||||||||
| DCP Midstream, LLC: |
||||||||
| Accounts receivable |
$ | 60.1 | $ | 71.5 | ||||
| Accounts payable |
$ | 27.0 | $ | 24.4 | ||||
| Unrealized gains on derivative instruments—current |
$ | 1.3 | $ | 5.5 | ||||
| Unrealized losses on derivative instruments—current |
$ | (1.8 | ) | $ | (5.4 | ) | ||
| Spectra Energy: |
||||||||
| Accounts receivable |
$ | — | $ | 0.1 | ||||
| Accounts payable |
$ | 8.7 | $ | 16.6 | ||||
| ConocoPhillips: |
||||||||
| Accounts receivable |
$ | 1.6 | $ | 2.2 | ||||
| Accounts payable |
$ | 1.0 | $ | 2.1 | ||||
| Unconsolidated affiliates: |
||||||||
| Accounts payable |
$ | 0.9 | $ | — | ||||
| 6. | Property, Plant and Equipment |
A summary of property, plant and equipment by classification is as follows:
| Depreciable Life |
December 31, | |||||||||||
| 2010 | 2009 | |||||||||||
| (Millions) | ||||||||||||
| Gathering and transmission systems |
15 —30 Years | $ | 992.0 | $ | 900.2 | |||||||
| Processing, storage and terminal facilities |
20 —50 Years | 585.2 | 456.4 | |||||||||
| Other |
3 — 30 Years | 12.6 | 15.2 | |||||||||
| Construction work in progress |
42.1 | 21.8 | ||||||||||
| Property, plant and equipment |
1,631.9 | 1,393.6 | ||||||||||
| Accumulated depreciation |
(462.8 | ) | (393.5 | ) | ||||||||
| Property, plant and equipment, net |
$ | 1,169.1 | $ | 1,000.1 | ||||||||
During the year ended December 31, 2010, we re-assessed our major classes of property, plant and equipment and changed our presentation.
Interest capitalized on construction projects in 2010, 2009 and 2008, was $0.2 million, $1.3 million and $0.3 million, respectively.
Depreciation expense was $70.0 million, $62.3 million and $51.1 million for the years ended December 31, 2010, 2009 and 2008, respectively.
Asset Retirement Obligations — As of December 31, 2010, we had asset retirement obligations of $10.8 million included in other long-term liabilities in the consolidated balance sheets. As of December 31, 2009 we had asset retirement obligations of $8.5 million included in other long-term liabilities in the consolidated balance sheets. Accretion expense for the years ended December 31, 2010, 2009 and 2008 was $0.6 million, $0.3 million and $0.4 million, respectively.
We identified various assets as having an indeterminate life, for which there is no requirement to establish a fair value for future retirement obligations associated with such assets. These assets include certain pipelines, gathering systems and processing facilities. A liability for these asset retirement obligations will be recorded only if and when a future retirement obligation with a determinable life is identified. These assets have an indeterminate life because they are owned and will operate for an indeterminate future period when properly
123
Table of Contents
DCP MIDSTREAM PARTNERS, LP
NOTES TO CONSOLIDATED FINANCIAL STATEMENTS
Years Ended December 31, 2010, 2009 and 2008 — (Continued)
maintained. Additionally, if the portion of an owned plant containing asbestos were to be modified or dismantled, we would be legally required to remove the asbestos. We currently have no plans to take actions that would require the removal of the asbestos in these assets. Accordingly, the fair value of the asset retirement obligation related to this asbestos cannot be estimated and no obligation has been recorded.
| 7. | Goodwill and Intangible Assets |
The change in the carrying amount of goodwill is as follows:
| December 31, | ||||||||
| 2010 | 2009 | |||||||
| (Millions) | ||||||||
| Beginning of period |
$ | 92.1 | $ | 88.8 | ||||
| Acquisitions |
7.6 | 3.3 | ||||||
| End of period |
$ | 99.7 | $ | 92.1 | ||||
Goodwill increased in 2010 by $7.6 million as a result of our acquisition of Atlantic Energy.
Our annual goodwill impairment tests indicated that our reporting unit’s fair value exceeded its carrying or book value; therefore, we did not record any impairment charges during the years ended December 31, 2010, 2009 and 2008.
The carrying value of goodwill as of December 31, 2010 and 2009 was $36.9 million and $29.3 million, respectively, for our Wholesale Propane Logistics segment and was $62.8 million as of both periods for our Natural Gas Services segment.
If actual results are not consistent with our assumptions and estimates, or our assumptions and estimates change due to new information, we may be exposed to goodwill impairment charges, which would be recognized in the period in which the carrying value exceeds fair value.
Intangible assets consist of customer contracts, including commodity purchase, transportation and processing contracts, and related relationships. The gross carrying amount and accumulated amortization of these intangible assets are included in the accompanying consolidated balance sheets as intangible assets, net, and are as follows:
| December 31, | ||||||||
| 2010 | 2009 | |||||||
| (Millions) | ||||||||
| Gross carrying amount |
$ | 96.4 | $ | 66.2 | ||||
| Accumulated amortization |
(9.4 | ) | (5.7 | ) | ||||
| Intangible assets, net |
$ | 87.0 | $ | 60.5 | ||||
Intangible assets increased in 2010 by $27.2 million as a result of our acquisition of Atlantic Energy and by $2.7 million as a result of our acquisition of an additional 50% interest in Black Lake.
For the years ended December 31, 2010, 2009 and 2008, we recorded amortization expense of $3.7 million, $2.6 million and $2.1 million, respectively. As of December 31, 2010, the remaining amortization periods ranged from approximately 11 years to 25 years, with a weighted-average remaining period of approximately 21 years.
The weighted-average remaining amortization for the $27.2 million of intangible assets acquired with our acquisition of Atlantic Energy on July 30, 2010 is 25 years, and for the $2.7 million of intangible assets acquired with our acquisition of an additional 50% interest in Black Lake on July 30, 2010 is 20 years.
124
Table of Contents
DCP MIDSTREAM PARTNERS, LP
NOTES TO CONSOLIDATED FINANCIAL STATEMENTS
Years Ended December 31, 2010, 2009 and 2008 — (Continued)
Estimated future amortization for these intangible assets is as follows:
| Estimated Future Amortization |
||||
| (Millions) | ||||
| 2011 |
$ | 4.4 | ||
| 2012 |
4.4 | |||
| 2013 |
4.4 | |||
| 2014 |
4.4 | |||
| 2015 |
4.4 | |||
| Thereafter |
65.0 | |||
| Total |
$ | 87.0 | ||
| 8. | Investments in Unconsolidated Affiliates |
The following table summarizes our investments in unconsolidated affiliates:
| Percentage
of Ownership as of December 31, 2010 and 2009 |
Carrying Value as
of December 31, |
|||||||||||
| 2010 | 2009 | |||||||||||
| (Millions) | ||||||||||||
| Discovery Producer Services, LLC |
40% | $ | 104.1 | $ | 108.2 | |||||||
| Black Lake Pipe Line Company(a) |
100% and 45% | — | 6.2 | |||||||||
| Other |
50% | 0.2 | 0.2 | |||||||||
| Total investments in unconsolidated affiliates |
$ | 104.3 | $ | 114.6 | ||||||||
| (a) | On July 27, 2010, we acquired an additional 5% interest in Black Lake from DCP Midstream, LLC in a transaction among entities under common control, and on July 30, 2010, we acquired an additional 50% interest in Black Lake from an affiliate of BP PLC, bringing our ownership interest in Black Lake to 100%. Prior to our acquisition of an additional 50% interest in Black Lake, we accounted for Black Lake under the equity method of accounting. Subsequent to this transaction we account for Black Lake as a consolidated subsidiary. |
There was a deficit between the carrying amount of the investment and the underlying equity of Discovery of $35.1 million and $37.6 million at December 31, 2010 and 2009, respectively, which is associated with, and is being accreted over, the life of the underlying long-lived assets of Discovery.
There was a deficit between the carrying amount of the investment and the underlying equity of Black Lake of $5.7 million at December 31, 2009, which was associated with, and was being accreted over, the life of the underlying long-lived assets of Black Lake.
Earnings from investments in unconsolidated affiliates were as follows:
| Year Ended December 31, | ||||||||||||
| 2010 | 2009 | 2008 | ||||||||||
| (Millions) | ||||||||||||
| Discovery Producer Services LLC |
$ | 23.0 | $ | 16.6 | $ | 17.4 | ||||||
| Black Lake Pipe Line Company and other(a) |
0.8 | 1.9 | 0.8 | |||||||||
| Total earnings from unconsolidated affiliates |
$ | 23.8 | $ | 18.5 | $ | 18.2 | ||||||
| (a) | On July 27, 2010, we acquired an additional 5% interest in Black Lake from DCP Midstream, LLC in a transaction among entities under common control, and on July 30, 2010, we acquired an additional 50% interest in Black Lake from an affiliate of BP PLC, bringing our ownership interest in Black Lake to |
125
Table of Contents
DCP MIDSTREAM PARTNERS, LP
NOTES TO CONSOLIDATED FINANCIAL STATEMENTS
Years Ended December 31, 2010, 2009 and 2008 — (Continued)
| 100%. Prior to our acquisition of an additional 50% interest in Black Lake, we accounted for Black Lake under the equity method of accounting. Subsequent to this transaction we account for Black Lake as a consolidated subsidiary. |
The following summarizes combined financial information of our investments in unconsolidated affiliates:
| Year Ended December 31, | ||||||||||||
| 2010(a) | 2009 | 2008 | ||||||||||
| (Millions) | ||||||||||||
| Statements of operations: |
||||||||||||
| Operating revenue |
$ | 211.6 | $ | 168.1 | $ | 247.9 | ||||||
| Operating expenses |
$ | 158.9 | $ | 127.2 | $ | 216.7 | ||||||
| Net income |
$ | 52.8 | $ | 40.4 | $ | 35.3 | ||||||
| (a) | Excludes the results of Black Lake from July 30, 2010 to December 31, 2010. |
| December 31, | ||||||||
| 2010(a) | 2009 | |||||||
| (Millions) | ||||||||
| Balance sheet: |
||||||||
| Current assets |
$ | 34.6 | $ | 41.8 | ||||
| Long-term assets |
356.7 | 383.8 | ||||||
| Current liabilities |
(17.2 | ) | (17.4 | ) | ||||
| Long-term liabilities |
(25.6 | ) | (23.6 | ) | ||||
| Net assets |
$ | 348.5 | $ | 384.6 | ||||
| (a) | On July 27, 2010, we acquired an additional 5% interest in Black Lake from DCP Midstream, LLC in a transaction among entities under common control, and on July 30, 2010, we acquired an additional 50% interest in Black Lake from an affiliate of BP PLC, bringing our ownership interest in Black Lake to 100%. Prior to our acquisition of an additional 50% interest in Black Lake, we accounted for Black Lake under the equity method of accounting. Subsequent to this transaction we account for Black Lake as a consolidated subsidiary. |
| 9. | Fair Value Measurement |
Determination of Fair Value
Below is a general description of our valuation methodologies for derivative financial assets and liabilities, as well as short-term and restricted investments, which are measured at fair value. Fair values are generally based upon quoted market prices, where available. If listed market prices or quotes are not available, we determine fair value based upon a market quote, adjusted by other market-based or independently sourced market data such as historical commodity volatilities, crude oil future yield curves, and/or counterparty specific considerations. These adjustments result in a fair value for each asset or liability under an “exit price” methodology, in line with how we believe a marketplace participant would value that asset or liability. These adjustments may include amounts to reflect counterparty credit quality, the effect of our own creditworthiness, the time value of money and/or the liquidity of the market.
| • | Counterparty credit valuation adjustments are necessary when the market price of an instrument is not indicative of the fair value as a result of the credit quality of the counterparty. Generally, market quotes assume that all counterparties have near zero, or low, default rates and have equal credit quality. Therefore, an adjustment may be necessary to reflect the credit quality of a specific counterparty to determine the fair value of the instrument. We record counterparty credit valuation adjustments on all |
126
Table of Contents
DCP MIDSTREAM PARTNERS, LP
NOTES TO CONSOLIDATED FINANCIAL STATEMENTS
Years Ended December 31, 2010, 2009 and 2008 — (Continued)
| derivatives that are in a net asset position as of the measurement date in accordance with our established counterparty credit policy, which takes into account any collateral margin that a counterparty may have posted with us as well as any letters of credit that they have provided. |
| • | Entity valuation adjustments are necessary to reflect the effect of our own credit quality on the fair value of our net liability position with each counterparty. This adjustment takes into account any credit enhancements, such as collateral margin we may have posted with a counterparty, as well as any letters of credit that we have provided. The methodology to determine this adjustment is consistent with how we evaluate counterparty credit risk, taking into account our own credit rating, current credit spreads, as well as any change in such spreads since the last measurement date. |
| • | Liquidity valuation adjustments are necessary when we are not able to observe a recent market price for financial instruments that trade in less active markets for the fair value to reflect the cost of exiting the position. Exchange traded contracts are valued at market value without making any additional valuation adjustments and, therefore, no liquidity reserve is applied. For contracts other than exchange traded instruments, we mark our positions to the midpoint of the bid/ask spread, and record a liquidity reserve based upon our total net position. We believe that such practice results in the most reliable fair value measurement as viewed by a market participant. |
We manage our derivative instruments on a portfolio basis and the valuation adjustments described above are calculated on this basis. We believe that the portfolio level approach represents the highest and best use for these assets as there are benefits inherent in naturally offsetting positions within the portfolio at any given time, and this approach is consistent with how a market participant would view and value the assets and liabilities. Although we take a portfolio approach to managing these assets/liabilities, in order to reflect the fair value of any one individual contract within the portfolio, we allocate all valuation adjustments down to the contract level, to the extent deemed necessary, based upon either the notional contract volume, or the contract value, whichever is more applicable.
The methods described above may produce a fair value calculation that may not be indicative of net realizable value or reflective of future fair values. While we believe that our valuation methods are appropriate and consistent with other market participants, we recognize that the use of different methodologies or assumptions to determine the fair value of certain financial instruments could result in a different estimate of fair value at the reporting date. We review our fair value policies on a regular basis taking into consideration changes in the marketplace and, if necessary, will adjust our policies accordingly. See Note 12 Risk Management and Hedging Activities.
Valuation Hierarchy
Our fair value measurements are grouped into a three-level valuation hierarchy. The valuation hierarchy is based upon the transparency of inputs to the valuation of an asset or liability as of the measurement date. The three levels are defined as follows:
| • | Level 1 — inputs are unadjusted quoted prices for identical assets or liabilities in active markets. |
| • | Level 2 — inputs include quoted prices for similar assets and liabilities in active markets, and inputs that are observable for the asset or liability, either directly or indirectly, for substantially the full term of the financial instrument. |
| • | Level 3 — inputs are unobservable and considered significant to the fair value measurement. |
A financial instrument’s categorization within the hierarchy is based upon the input that requires the highest degree of judgment in the determination of the instrument’s fair value. Following is a description of the valuation methodologies used as well as the general classification of such instruments pursuant to the hierarchy.
127
Table of Contents
DCP MIDSTREAM PARTNERS, LP
NOTES TO CONSOLIDATED FINANCIAL STATEMENTS
Years Ended December 31, 2010, 2009 and 2008 — (Continued)
Commodity Derivative Assets and Liabilities
We enter into a variety of derivative financial instruments, which may include over-the-counter, or OTC, instruments, such as natural gas, crude oil or NGL contracts.
Within our Natural Gas Services segment we typically use OTC derivative contracts in order to mitigate a portion of our exposure to natural gas, NGL and condensate price changes. We also may enter into natural gas derivatives to lock in margin around our storage and transportation assets. These instruments are generally classified as Level 2. Depending upon market conditions and our strategy, we may enter into OTC derivative positions with a significant time horizon to maturity, and market prices for these OTC derivatives may only be readily observable for a portion of the duration of the instrument. In order to calculate the fair value of these instruments, readily observable market information is utilized to the extent that it is available; however, in the event that readily observable market data is not available, we may interpolate or extrapolate based upon observable data. In instances where we utilize an interpolated or extrapolated value, and it is considered significant to the valuation of the contract as a whole, we would classify the instrument within Level 3.
Within our Wholesale Propane Logistics segment, we may enter into a variety of financial instruments to either secure sales or purchase prices, or capture a variety of market opportunities. Since financial instruments for NGLs tend to be counterparty and location specific, we primarily use the OTC derivative instrument markets, which are not as active and liquid as exchange traded instruments. Market quotes for such contracts may only be available for short dated positions (up to six months), and an active market itself may not exist beyond such time horizon. Contracts entered into with a relatively short time horizon for which prices are readily observable in the OTC market are generally classified within Level 2. Contracts with a longer time horizon, for which we internally generate a forward curve to value such instruments, are generally classified within Level 3. The internally generated curve may utilize a variety of assumptions including, but not limited to, historical and future expected relationship of NGL prices to crude oil prices, the knowledge of expected supply sources coming on line, expected weather trends within certain regions of the United States, and the future expected demand for NGLs.
Each instrument is assigned to a level within the hierarchy at the end of each financial quarter depending upon the extent to which the valuation inputs are observable. Generally, an instrument will move toward a level within the hierarchy that requires a lower degree of judgment as the time to maturity approaches, and as the markets in which the asset trades will likely become more liquid and prices more readily available in the market, thus reducing the need to rely upon our internally developed assumptions. However, the level of a given instrument may change, in either direction, depending upon market conditions and the availability of market observable data.
Interest Rate Derivative Assets and Liabilities
We use interest rate swap agreements as part of our overall capital strategy. These instruments effectively exchange a portion of our floating rate debt for fixed rate debt. The swaps are generally priced based upon a London Interbank Offered Rate, or LIBOR, instrument with similar duration, adjusted by the credit spread between our company and the LIBOR instrument. Given that a portion of the swap value is derived from the credit spread, which may be observed by comparing similar assets in the market, these instruments are classified within Level 2. Default risk on either side of the swap transaction is also considered in the valuation. We record counterparty credit and entity valuation adjustments in the valuation of our interest rate swaps; however, these reserves are not considered to be a significant input to the overall valuation.
Short-Term and Restricted Investments
We were required to post collateral to secure the term loan portion of our credit facility, and could elect to invest a portion of our available cash and restricted investment balances in various financial instruments such as
128
Table of Contents
DCP MIDSTREAM PARTNERS, LP
NOTES TO CONSOLIDATED FINANCIAL STATEMENTS
Years Ended December 31, 2010, 2009 and 2008 — (Continued)
commercial paper and money market instruments. The money market instruments are generally priced at acquisition cost, plus accreted interest at the stated rate, which approximates fair value, without any additional adjustments. Given that there is no observable exchange traded market for identical money market securities, we have classified these instruments within Level 2. Investments in commercial paper are priced using a yield curve for similarly rated instruments, and are classified within Level 2. Restricted investments have been used as collateral to secure the term loan portion of our credit facility. As of December 31, 2010, we held no short-term or restricted investments as a result of the term loan facility being fully repaid during the first quarter of 2010.
Nonfinancial Assets and Liabilities
We utilize fair value on a non-recurring basis to perform impairment tests as required on our property, plant and equipment, goodwill and intangible assets. Assets and liabilities acquired in business combinations are recorded at their fair value on the date of acquisition. The inputs used to determine such fair value are primarily based upon internally developed cash flow models and would generally be classified within Level 3, in the event that we were required to measure and record such assets at fair value within our consolidated financial statements. Additionally, we use fair value to determine the inception value of our asset retirement obligations. The inputs used to determine such fair value are primarily based upon costs incurred historically for similar work, as well as estimates from independent third parties for costs that would be incurred to restore leased property to the contractually stipulated condition, and would generally be classified within Level 3.
We utilize fair value on a recurring basis to measure our contingent consideration that is a result of certain acquisitions. The inputs used to determine such fair value are primarily based upon internally developed cash flow models and are classified within Level 3.
The following table presents the financial instruments carried at fair value as of December 31, 2010 and 2009, by consolidated balance sheet caption and by valuation hierarchy, as described above:
| December 31, 2010 | December 31, 2009 | |||||||||||||||||||||||||||||||
| Level 1 | Level 2 | Level 3 | Total Carrying Value |
Level 1 | Level 2 | Level 3 | Total Carrying Value |
|||||||||||||||||||||||||
| (Millions) | ||||||||||||||||||||||||||||||||
| Current assets: |
||||||||||||||||||||||||||||||||
| Short term investments(a) |
$ | — | $ | — | $ | — | $ | — | $ | — | $ | 0.1 | $ | — | $ | 0.1 | ||||||||||||||||
| Commodity derivatives(b) |
$ | — | $ | 1.6 | $ | 0.3 | $ | 1.9 | $ | — | $ | 6.9 | $ | 0.4 | $ | 7.3 | ||||||||||||||||
| Long-term assets: |
||||||||||||||||||||||||||||||||
| Restricted investments |
$ | — | $ | — | $ | — | $ | — | $ | — | $ | 10.0 | $ | — | $ | 10.0 | ||||||||||||||||
| Commodity derivatives(c) |
$ | — | $ | 1.1 | $ | 0.3 | $ | 1.4 | $ | — | $ | 1.8 | $ | 0.2 | $ | 2.0 | ||||||||||||||||
| Current liabilities(d): |
||||||||||||||||||||||||||||||||
| Commodity derivatives |
$ | — | $ | (25.9 | ) | $ | (0.1 | ) | $ | (26.0 | ) | $ | — | $ | (20.3 | ) | $ | (0.8 | ) | $ | (21.1 | ) | ||||||||||
| Interest rate derivatives |
$ | — | $ | (17.0 | ) | $ | — | $ | (17.0 | ) | $ | — | $ | (20.4 | ) | $ | — | $ | (20.4 | ) | ||||||||||||
| Long-term liabilities(e): |
||||||||||||||||||||||||||||||||
| Commodity derivatives |
$ | — | $ | (39.9 | ) | $ | (0.5 | ) | $ | (40.4 | ) | $ | — | $ | (46.0 | ) | $ | (0.4 | ) | $ | (46.4 | ) | ||||||||||
| Interest rate derivatives |
$ | — | $ | (9.9 | ) | $ | — | $ | (9.9 | ) | $ | — | $ | (11.6 | ) | $ | — | $ | (11.6 | ) | ||||||||||||
| (a) | Included in other current assets in our consolidated balance sheets. |
| (b) | Included in current unrealized gains on derivative instruments in our consolidated balance sheets. |
| (c) | Included in long-term unrealized gains on derivative instruments in our consolidated balance sheets. |
| (d) | Included in current unrealized losses on derivative instruments in our consolidated balance sheets. |
| (e) | Included in long-term unrealized losses on derivative instruments in our consolidated balance sheets. |
129
Table of Contents
DCP MIDSTREAM PARTNERS, LP
NOTES TO CONSOLIDATED FINANCIAL STATEMENTS
Years Ended December 31, 2010, 2009 and 2008 — (Continued)
Changes in Level 3 Fair Value Measurements
The tables below illustrate a rollforward of the amounts included in our consolidated balance sheets for derivative financial instruments that we have classified within Level 3. The determination to classify a financial instrument within Level 3 is based upon the significance of the unobservable factors used in determining the overall fair value of the instrument. Since financial instruments classified as Level 3 typically include a combination of observable components (that is, components that are actively quoted and can be validated to external sources) and unobservable components, the gains and losses in the table below may include changes in fair value due in part to observable market factors, or changes to our assumptions on the unobservable components. Depending upon the information readily observable in the market, and/or the use of unobservable inputs, which are significant to the overall valuation, the classification of any individual financial instrument may differ from one measurement date to the next. In the event that there is a movement to/from the classification of an instrument as Level 3, we have reflected such items in the table below within the “Transfers In/Out of Level 3” caption.
We manage our overall risk at the portfolio level, and in the execution of our strategy, we may use a combination of financial instruments, which may be classified within any level. Since Level 1 and Level 2 risk management instruments are not included in the rollforward below, the gains or losses in the table do not reflect the effect of our total risk management activities.
| Commodity Derivative Instruments | ||||||||||||||||
| Current Assets |
Long-Term Assets |
Current Liabilities |
Long-Term Liabilities |
|||||||||||||
| (Millions) | ||||||||||||||||
| Year ended December 31, 2010: |
| |||||||||||||||
| Beginning balance |
$ | 0.4 | $ | 0.2 | $ | (0.8 | ) | $ | (0.4 | ) | ||||||
| Net realized and unrealized gains (losses) included in earnings |
2.0 | 1.3 | (0.3 | ) | (0.1 | ) | ||||||||||
| Transfers into Level 3(a) |
— | — | — | — | ||||||||||||
| Transfers out of Level 3(a) |
— | — | — | — | ||||||||||||
| Purchases, Issuances and Settlements net |
(2.1 | ) | (1.2 | ) | 1.0 | — | ||||||||||
| Ending balance |
$ | 0.3 | $ | 0.3 | $ | (0.1 | ) | $ | (0.5 | ) | ||||||
| Net unrealized gains (losses) still held included in earnings(b) |
$ | 0.3 | $ | 0.1 | $ | (0.1 | ) | $ | (0.1 | ) | ||||||
| Year ended December 31, 2009: |
||||||||||||||||
| Beginning balance |
$ | 0.3 | $ | 1.7 | $ | — | $ | — | ||||||||
| Net realized and unrealized gains (losses) included in earnings |
0.2 | (1.5 | ) | (3.9 | ) | (0.4 | ) | |||||||||
| Net transfers (out) of Level 3(c) |
(0.1 | ) | — | — | — | |||||||||||
| Purchases, Issuances and Settlements net |
— | — | 3.1 | — | ||||||||||||
| Ending balance |
$ | 0.4 | $ | 0.2 | $ | (0.8 | ) | $ | (0.4 | ) | ||||||
| Net unrealized gains (losses) still held included in earnings(b) |
$ | 0.4 | $ | (0.1 | ) | $ | (1.8 | ) | $ | (0.4 | ) | |||||
| (a) | Amounts transferred in and amounts transferred out are reflected at fair value as of the end of the period. |
| (b) | Represents the amount of total gains or losses for the period, included in gains or losses from commodity derivative activity, net, attributable to change in unrealized gains or losses relating to assets and liabilities classified as Level 3 that are still held as of December 31, 2010 and 2009. |
| (c) | Amounts transferred in are reflected at the fair value as of the beginning of the period and amounts transferred out are reflected at fair value at the end of the period. |
During the first quarter of 2010, we recognized the fair value of our contingent consideration, which is classified as Level 3, in relation to our acquisition of an additional 5% interest in Collbran, from Delta, of
130
Table of Contents
DCP MIDSTREAM PARTNERS, LP
NOTES TO CONSOLIDATED FINANCIAL STATEMENTS
Years Ended December 31, 2010, 2009 and 2008 — (Continued)
approximately $1.0 million, which we recorded to other current liabilities in our consolidated balance sheets. As of September 30, 2010, we reassessed the fair value of the contingent consideration and adjusted the fair value of the liability to $0, and there has been no change to our assessment of the fair value as of December 31, 2010. Accordingly we recognized $1.0 million in other income in our consolidated results of operations during the year ended December 31, 2010.
During year ended December 31, 2010, we had no significant transfers into and out of Levels 1, 2 and 3. To qualify as a transfer, the asset or liability must have existed in the previous reporting period and moved into a different level during the current period.
| 10. | Estimated Fair Value of Financial Instruments |
We have determined fair value amounts using available market information and appropriate valuation methodologies. However, considerable judgment is required in interpreting market data to develop the estimates of fair value. Accordingly, the estimates presented herein are not necessarily indicative of the amounts that we could realize in a current market exchange. The use of different market assumptions and/or estimation methods may have a material effect on the estimated fair value amounts.
The fair value of restricted investments, accounts receivable and accounts payable are not materially different from their carrying amounts because of the short term nature of these instruments or the stated rates approximating market rates. Unrealized gains and unrealized losses on derivative instruments are carried at fair value. The carrying and fair values of outstanding balances under our Credit Agreement are $398.0 million and $388.9 million as of December 31, 2010 and $613.0 million and $590.0 million, respectively as of December 31, 2009. The carrying and fair values of 3.25% Senior Notes are $250.0 million and $247.0 million as of December 31, 2010. We determine the fair value of our credit facility borrowings based upon the discounted present value of expected future cash flows, taking into account the difference between the contractual borrowing spread and the spread for similar credit facilities available in the marketplace. Additionally, we have executed interest rate swap agreements on a portion of our interest rate exposure which swaps variable for fixed interest rates.
| 11. | Debt |
Long-term debt was as follows:
| December 31, 2010 |
December 31, 2009 |
|||||||
| (Millions) | ||||||||
| Credit Agreement |
||||||||
| Revolving credit facility, weighted-average variable interest rate of 1.14% and 0.69%, respectively, and net effective interest rate of 4.28% and 4.41%, respectively, due June 21, 2012(a) |
$ | 398.0 | $ | 603.0 | ||||
| Term loan facility, variable interest rate of 0.34%, due June 21, 2012(b) |
— | 10.0 | ||||||
| Total amounts outstanding under the Credit Agreement |
398.0 | 613.0 | ||||||
| Debt Securities |
||||||||
| Issued September 30, 2010, interest at 3.25% payable semi-annually, due October 1, 2015 |
250.0 | — | ||||||
| Unamortized discount |
(0.2 | ) | — | |||||
| Total long-term debt |
$ | 647.8 | $ | 613.0 | ||||
| (a) | $275.0 million of debt has been swapped to a fixed rate obligation with effective fixed rates ranging from 3.97% to 5.19%, for a net effective rate of 4.28% on the $398.0 million of outstanding debt under our revolving credit facility as of December 31, 2010. |
131
Table of Contents
DCP MIDSTREAM PARTNERS, LP
NOTES TO CONSOLIDATED FINANCIAL STATEMENTS
Years Ended December 31, 2010, 2009 and 2008 — (Continued)
| (b) | The term loan facility is fully secured by restricted investments as of December 31, 2009. The term loan was repaid during the first quarter of 2010. |
Credit Agreement
We have an $850.0 million revolving credit facility that matures June 21, 2012, or the Credit Agreement. Effective June 28, 2010, we transferred both the funded and the unfunded portions of the former Lehman Brothers Commercial Bank commitment to Morgan Stanley. The transfer reinstated the $25.4 million of available capacity to our revolving credit facility.
At December 31, 2010 and 2009, we had $32.1 million and $0.3 million, respectively, of letters of credit issued and outstanding under the Credit Agreement. As of December 31, 2009, we had outstanding term loan balances under the Credit Agreement, which were fully collateralized by investments in high-grade securities classified as restricted investments in the accompanying consolidated balance sheet. As of December 31, 2010, the unused capacity under the revolving credit facility was $419.9 million, of which approximately $265.0 million was available for general working capital purposes. We incurred $0.6 million of debt issuance costs associated with the Credit Agreement. These expenses are deferred as other long-term assets in the consolidated balance sheet and will be amortized over the term of the Credit Agreement.
Our borrowing capacity is limited at December 31, 2010 by the Credit Agreement’s financial covenant requirements. Except in the case of a default, amounts borrowed under our credit facility will not mature prior to the June 21, 2012 maturity date.
Under the Credit Agreement, indebtedness under the revolving credit facility bears interest at either: (1) the higher of Wells Fargo Bank’s prime rate or the Federal Funds rate plus 0.50%; or (2) LIBOR plus an applicable margin, which ranges from 0.23% to 0.575% dependent upon our credit rating. The revolving credit facility incurs an annual facility fee of 0.07% to 0.175% depending on our credit rating. This fee is paid on drawn and undrawn portions of the revolving credit facility. The term loan facility bears interest at a rate equal to either: (1) LIBOR plus 0.10%; or (2) the higher of Wells Fargo Bank’s prime rate or the Federal Funds rate plus 0.50%.
The Credit Agreement requires us to maintain a leverage ratio (the ratio of our consolidated indebtedness to our consolidated EBITDA, in each case as is defined by the Credit Agreement) of not more than 5.0 to 1.0, and on a temporary basis for not more than three consecutive quarters (including the quarter in which such acquisition is consummated) following the consummation of asset acquisitions in the midstream energy business of not more than 5.5 to 1.0.
Debt Securities
On September 30, 2010, we issued $250.0 million of 3.25% Senior Notes due October 1, 2015. We received proceeds of $247.7 million, which are net of underwriters’ fees, related expense and unamortized discounts of $1.5 million, $0.6 million and $0.2 million, respectively, which we used to repay funds borrowed under the revolver portion of our Credit Facility. Interest on the notes will be paid semi-annually on April 1 and October 1 of each year, commencing April 1, 2011. The notes will mature on October 1, 2015 unless redeemed prior to maturity.
We have incurred $2.1 million of underwriters’ fees and related expense with the issue of the notes, which we deferred in other long term assets in our consolidated balance sheets. We will amortize these costs over the term of the notes.
The notes are senior unsecured obligations, ranking equally in right of payment with our existing unsecured indebtedness, including indebtedness under our Credit Facility. We are not required to make mandatory redemption or sinking fund payments with respect to these notes. The securities are redeemable at a premium at our option.
132
Table of Contents
DCP MIDSTREAM PARTNERS, LP
NOTES TO CONSOLIDATED FINANCIAL STATEMENTS
Years Ended December 31, 2010, 2009 and 2008 — (Continued)
The future maturities of long-term debt in the year indicated are as follows:
| Debt Maturities |
||||
| (Millions) | ||||
| 2011 |
$ | — | ||
| 2012 |
398.0 | |||
| 2013 |
— | |||
| 2014 |
— | |||
| 2015 |
250.0 | |||
| Thereafter |
— | |||
| Unamortized discount |
(0.2 | ) | ||
| Total |
$ | 647.8 | ||
Other Agreements
As of December 31, 2010, we had a contingent letter of credit for up to $10.0 million, on which we pay a fee of 0.50% per annum. This facility reduces the amount of cash we may be required to post as collateral. As of December 31, 2010, we have no letters of credit issued on this facility; any letters of credit issued on this facility will incur a fee of 1.75% per annum and will not reduce the available capacity under our credit facility.
| 12. | Risk Management and Hedging Activities |
Our day to day operations expose us to a variety of risks including but not limited to changes in the prices of commodities that we buy or sell, changes in interest rates, and the creditworthiness of each of our counterparties. We manage certain of these exposures with both physical and financial transactions. We have established a comprehensive risk management policy, or Risk Management Policy, and a risk management committee, or the Risk Management Committee, to monitor and manage market risks associated with commodity prices and counterparty credit. The Risk Management Committee is responsible for the overall management of credit risk and commodity price risk, including monitoring exposure limits. The following briefly describes each of the risks that we manage.
Commodity Price Risk
We are exposed to the impact of market fluctuations in the prices of natural gas, NGLs and condensate as a result of our gathering, processing, sales and storage activities. For gathering and processing services, we may receive fees or commodities as payment for these services, depending on the contract type. We enter into derivative financial instruments to mitigate a portion of the risk of weakening natural gas, NGL and condensate prices associated with our gathering, processing and sales activities, thereby stabilizing our cash flows. We have mitigated a portion of our expected commodity price risk associated with our gathering, processing and sales activities through 2015 with commodity derivative instruments. Additionally, given the limited depth of the NGL derivatives market, we primarily utilize crude oil swaps to mitigate a portion of our commodity price exposure for propane and heavier NGLs. Historically, prices of NGLs have been generally related to the price of crude oil, with some exceptions, notably in late 2008 to early 2009, when NGL pricing was at a greater discount to crude oil pricing. Given the relationship and the lack of liquidity in the NGL financial market, we have historically used crude oil swaps to mitigate a portion of NGL price risks. When the relationship of NGL prices to crude oil prices is at a discount to historical ranges, we experience additional exposure as a result of the relationship. These transactions are primarily accomplished through the use of forward contracts that effectively exchange our floating price risk for a fixed price. However, the type of instrument that we use to mitigate a portion of our risk may vary depending upon our risk management objective. These transactions are not designated as hedging instruments for accounting purposes and the change in fair value is reflected within our consolidated statements of operations as a gain or a loss on commodity derivative activity.
133
Table of Contents
DCP MIDSTREAM PARTNERS, LP
NOTES TO CONSOLIDATED FINANCIAL STATEMENTS
Years Ended December 31, 2010, 2009 and 2008 — (Continued)
With respect to our Pelico system, we may enter into financial derivatives to lock in transportation margins across the system, or to lock in margins around our leased storage facility to maximize value. This objective may be achieved through the use of physical purchases or sales of gas that are accounted for under accrual accounting. While the physical purchase or sale of gas transactions are accounted for under accrual accounting and any inventory is stated at lower of cost or market, the swaps are not designated as hedging instruments for accounting purposes and any change in fair value of these instruments is reflected within our consolidated statements of operations.
Our Wholesale Propane Logistics segment is generally designed to establish stable margins by entering into supply arrangements that specify prices based on established floating price indices and by entering into sales agreements that provide for floating prices that are tied to our variable supply costs plus a margin. To the extent possible, we match the pricing of our supply portfolio to our sales portfolio in order to lock in value and reduce our overall commodity price risk. However, to the extent that we carry propane inventories or our sales and supply arrangements are not aligned, we are exposed to market variables and commodity price risk. We manage the commodity price risk of our supply portfolio and sales portfolio with both physical and financial transactions. While the majority of our sales and purchases in this segment are index-based, occasionally, we may enter into fixed price sales agreements in the event that a retail propane distributor desires to purchase propane from us on a fixed price basis. In such cases, we may manage this risk with derivatives that allow us to swap our fixed price risk to market index prices that are matched to our market index supply costs. In addition, we may on occasion use financial derivatives to manage the value of our propane inventories. These transactions are not designated as hedging instruments for accounting purposes and the change in value is reflected in the current period within our consolidated statements of operations as a gain or loss on commodity derivative activity.
Our portfolio of commodity derivative activity is primarily accounted for using the mark-to-market method of accounting, whereby changes in fair value are recorded directly to the consolidated statements of operations; however, depending upon our risk profile and objectives, in certain limited cases, we may execute transactions that qualify for the hedge method of accounting.
Commodity Cash Flow Hedges — Effective July 1, 2007, we elected to discontinue using the hedge method of accounting for derivatives that manage our commodity price risk. Prior to July 1, 2007, we used commodity swaps to mitigate a portion of the risk of market fluctuations in the price of NGLs, natural gas and condensate. Given our election to discontinue using the hedge method of accounting, the remaining net losses deferred in AOCI relative to cash flow hedges are reclassified to sales of natural gas, propane, NGLs and condensate, through December 2011, as the underlying transactions impact earnings.
Interest Rate Risk
We mitigate a portion of our interest rate risk with interest rate swaps, which reduce our exposure to market rate fluctuations by converting variable interest rates to fixed interest rates. These interest rate swap agreements convert the interest rate associated with the indebtedness outstanding under our revolving credit facility to a fixed rate obligation, thereby reducing the exposure to market rate fluctuations.
At December 31, 2010 we had interest rate swap agreements totaling $450.0 million, of which we have designated $275.0 million as cash flow hedges and account for the remaining $175.0 million under the mark-to-market method of accounting. The entire $450.0 million of these swap agreements mitigate our interest rate risk through June 2012, with $150.0 million extending from June 2012 through June 2014.
We have designated $275.0 million of our interest rate swap agreements as cash flow hedges, and effectiveness is determined by matching the principal balance and terms with that of the specified obligation. The effective portions of changes in fair value are recognized in AOCI in the consolidated balance sheets and are reclassified into earnings as the hedged transactions impact earnings. The effect that these swaps have on
134
Table of Contents
DCP MIDSTREAM PARTNERS, LP
NOTES TO CONSOLIDATED FINANCIAL STATEMENTS
Years Ended December 31, 2010, 2009 and 2008 — (Continued)
our consolidated financial statements, as well as the effect that is expected over the upcoming 12 months is summarized in the charts below. However, due to the volatility of the interest rate markets, the corresponding value in AOCI is subject to change prior to its reclassification into earnings. Ineffective portions of changes in fair value are recognized in earnings.
As of December 31, 2010, $300.0 million of the agreements reprice prospectively approximately every 90 days and the remaining $150.0 million of the agreements reprice prospectively approximately every 30 days. Under the terms of the interest rate swap agreements, we pay fixed rates ranging from 2.94% to 5.19%, and receive interest payments based on the three-month and one-month LIBOR. The differences to be paid or received under the interest rate swap agreements are recognized as an adjustment to interest expense.
At December 31, 2009 we had interest rate swap agreements totaling $575.0 million, all of which we had designated as cash flow hedges. In conjunction with the issuance of $250.0 million of 3.25% Senior Notes, we paid down our revolving credit facility, discontinued hedge accounting on $225.0 million of our existing swap agreements, terminated certain swap agreements for $1.3 million, and modified certain swap agreements to reduce the total outstanding amount by $125.0 million. Additionally, the term on $150.0 million of the swap agreements was extended through June 2014. This resulted in $450.0 million of these swap agreements mitigating our interest rate risk through June 2012, with $150.0 million extending from June 2012 through June 2014.
Contingent Credit Features
Each of the above risks is managed through the execution of individual contracts with a variety of counterparties. Certain of our derivative contracts may contain credit-risk related contingent provisions that may require us to take certain actions in certain circumstances.
We have International Swap Dealers Association, or ISDA, contracts which are standardized master legal arrangements that establish key terms and conditions which govern certain derivative transactions. These ISDA contracts contain standard credit-risk related contingent provisions. Some of the provisions we are subject to are outlined below.
| • | If we were to have an effective event of default under our Credit Agreement that occurs and is continuing, our ISDA counterparties may have the right to request early termination and net settlement of any outstanding derivative liability positions. |
| • | In the event that we or DCP Midstream, LLC were to be downgraded below investment grade by at least one of the major credit rating agencies, certain of our ISDA counterparties have the right to reduce our collateral threshold to zero, potentially requiring us to fully collateralize any commodity contracts in a net liability position. |
| • | Additionally, in some cases, our ISDA contracts contain cross-default provisions that could constitute a credit-risk related contingent feature. These provisions apply if we default in making timely payments under those agreements and the amount of the default is above certain predefined thresholds, which are significantly high and are generally consistent with the terms of our Credit Agreement. As of December 31, 2010, we are not a party to any agreements that would be subject to these provisions other than our credit agreement. |
Our commodity derivative contracts that are not governed by ISDA contracts do not have any credit-risk related contingent features.
Depending upon the movement of commodity prices and interest rates, each of our individual contracts with counterparties to our commodity derivative instruments or to our interest rate swap instruments are in either a net asset or net liability position. As of December 31, 2010, we had $64.4 million of individual commodity derivative contracts that contain credit-risk related contingent features that were in a net liability
135
Table of Contents
DCP MIDSTREAM PARTNERS, LP
NOTES TO CONSOLIDATED FINANCIAL STATEMENTS
Years Ended December 31, 2010, 2009 and 2008 — (Continued)
position, and have not posted any cash collateral relative to such positions. If a credit-risk related event were to occur and we were required to net settle our position with an individual counterparty, our ISDA contracts permit us to net all outstanding contracts with that counterparty, whether in a net asset or net liability position, as well as any cash collateral already posted. As of December 31, 2010 if a credit-risk related event were to occur we may be required to post additional collateral. Additionally, although our commodity derivative contracts that contain credit-risk related contingent features were in a net liability position as of December 31, 2010, if a credit-risk related event were to occur, the net liability position would be partially offset by contracts in a net asset position reducing our net liability to $62.6 million.
As of December 31, 2010 our interest rate swaps were in a net liability position of approximately $26.9 million, of which, the entire amount is subject to credit-risk related contingent features. If we were to have a default of any of our covenants to our Credit Agreement, that occurs and is continuing, the counterparties to our swap instruments have the right to request that we net settle the instrument in the form of cash.
Collateral
As of December 31, 2010, we had a contingent letter of credit facility for up to $10.0 million, on which we have no letters of credit issued. DCP Midstream, LLC had issued and outstanding parental guarantees totaling $65.0 million in favor of certain counterparties to our commodity derivative instruments. This contingent letter of credit facility and parental guarantees reduce the amount of cash we may be required to post as collateral. As of December 31, 2010, we had no cash collateral posted with counterparties to our commodity derivative instruments.
Summarized Derivative Information
The following summarizes the balance within AOCI relative to our commodity and interest rate cash flow hedges:
| December 31, 2010 |
December 31, 2009 |
|||||||
| (Millions) | ||||||||
| Commodity cash flow hedges: |
||||||||
| Net deferred losses in AOCI |
$ | (0.3 | ) | $ | (0.8 | ) | ||
| Interest rate cash flow hedges: |
||||||||
| Net deferred losses in AOCI |
(27.4 | ) | (31.1 | ) | ||||
| Total AOCI |
$ | (27.7 | ) | $ | (31.9 | ) | ||
136
Table of Contents
DCP MIDSTREAM PARTNERS, LP
NOTES TO CONSOLIDATED FINANCIAL STATEMENTS
Years Ended December 31, 2010, 2009 and 2008 — (Continued)
The fair value of our derivative instruments that are designated as hedging instruments, those that are marked to market each period, as well as the location of each within our consolidated balance sheets, by major category, is summarized as follows:
| Balance Sheet Line Item |
December 31, 2010 |
December 31, 2009 |
Balance Sheet Line Item |
December 31, 2010 |
December 31, 2009 |
|||||||||||||
| (Millions) | (Millions) | |||||||||||||||||
| Derivative Assets Designated as Hedging Instruments: |
|
Derivative Liabilities Designated as Hedging Instruments: |
| |||||||||||||||
| Interest rate derivatives: |
Interest rate derivatives: |
| ||||||||||||||||
| Unrealized gains on derivative instruments — current |
$ | — | $ | — | Unrealized losses on derivative instruments — current |
$ | (12.2 | ) | $ | (20.4 | ) | |||||||
| Unrealized gains on derivative instruments — long-term |
— | — | Unrealized losses on derivative instruments — long-term |
(5.4 | ) | (11.6 | ) | |||||||||||
| $ | — | $ | — | $ | (17.6 | ) | $ | (32.0 | ) | |||||||||
| Derivative Assets Not Designated as Hedging Instruments: |
|
Derivative Liabilities Not Designated as Hedging Instruments: |
| |||||||||||||||
| Commodity derivatives: |
Commodity derivatives: |
|||||||||||||||||
| Unrealized gains on derivative instruments — current |
$ | 1.9 | $ | 7.3 | Unrealized losses on derivative instruments — current |
$ | (26.0 | ) | $ | (21.1 | ) | |||||||
| Unrealized gains on derivative instruments — long-term |
1.4 | 2.0 | Unrealized losses on derivative instruments — long-term |
(40.4 | ) | (46.4 | ) | |||||||||||
| $ | 3.3 | $ | 9.3 | $ | (66.4 | ) | $ | (67.5 | ) | |||||||||
| Interest rate derivatives: |
Interest rate derivatives: |
|||||||||||||||||
| Unrealized gains on derivative instruments — current |
$ | — | $ | — | Unrealized losses on derivative instruments — current |
$ | (4.8 | ) | $ | — | ||||||||
| Unrealized gains on derivative instruments — long-term |
— | — | Unrealized losses on derivative instruments — long-term |
(4.5 | ) | — | ||||||||||||
| $ | — | $ | — | $ | (9.3 | ) | $ | — | ||||||||||
The following table summarizes the impact on our consolidated balance sheet and consolidated statements of operations of our derivative instruments that are accounted for using the cash flow hedge method of accounting.
| Gain (Loss) Recognized in AOCI on Derivatives — Effective Portion |
Gain (Loss) Reclassified From AOCI to Earnings — Effective Portion |
Gain (Loss) Recognized in Income on Derivatives — Ineffective Portion and Amount Excluded From Effectiveness Testing |
Deferred Losses in AOCI Expected to be Reclassified into Earnings Over the Next 12 Months |
|||||||||||||||||||||||||||||
| 2010 | 2009 | 2010 | 2009 | 2010 | 2009 | |||||||||||||||||||||||||||
| (Millions) | (Millions) | (Millions) | (Millions) | |||||||||||||||||||||||||||||
| Interest rate derivatives |
$ | (18.7 | ) | $ | (12.0 | ) | $ | (22.4 | ) | $ | (19.7 | ) | (a) | $ | — | $ | — | (a)(c) | $ | (19.1 | ) | |||||||||||
| Commodity derivatives |
$ | — | $ | — | $ | (0.5 | ) | $ | (0.9 | ) | (b) | $ | — | $ | — | (b)(c) | $ | (0.3 | ) | |||||||||||||
| (a) | Included in interest expense in our consolidated statements of operations. |
| (b) | Included in sales of natural gas, propane, NGLs and condensate in our consolidated statements of operations. |
| (c) | For the year ended December 31, 2010 and 2009, no derivative gains or losses were reclassified from AOCI to current period earnings as a result of the discontinuance of cash flow hedges related to certain forecasted transactions that are not probable of occurring. |
137
Table of Contents
DCP MIDSTREAM PARTNERS, LP
NOTES TO CONSOLIDATED FINANCIAL STATEMENTS
Years Ended December 31, 2010, 2009 and 2008 — (Continued)
Changes in value of derivative instruments, for which the hedge method of accounting has not been elected from one period to the next, are recorded in the consolidated statements of operations. The following summarizes these amounts and the location within the consolidated statements of operations that such amounts are reflected:
| Year Ended December 31, | ||||||||||||
| Commodity Derivatives: Statements of Operations Line Item |
2010 | 2009 | 2008 | |||||||||
| (Millions) | ||||||||||||
| Third party: |
||||||||||||
| Realized |
$ | (2.9 | ) | $ | 16.8 | $ | (25.5 | ) | ||||
| Unrealized |
(4.4 | ) | (79.1 | ) | 100.9 | |||||||
| (Losses) gains from commodity derivative activity, net |
$ | (7.3 | ) | $ | (62.3 | ) | $ | 75.4 | ||||
| Affiliates: |
||||||||||||
| Realized |
$ | (0.7 | ) | $ | (0.2 | ) | $ | (5.2 | ) | |||
| Unrealized |
(0.5 | ) | (3.3 | ) | 1.5 | |||||||
| Losses from commodity derivative activity, net — affiliates |
$ | (1.2 | ) | $ | (3.5 | ) | $ | (3.7 | ) | |||
| Year Ended December 31, | ||||||||||||
| Interest Rate Derivatives: Statements of Operations Line Item |
2010 | 2009 | 2008 | |||||||||
| (Millions) | ||||||||||||
| Third party: |
||||||||||||
| Realized |
$ | (1.5 | ) | $ | — | $ | — | |||||
| Unrealized |
3.1 | — | — | |||||||||
| Interest expense |
$ | 1.6 | $ | — | $ | — | ||||||
We do not have any derivative financial instruments that qualify as a hedge of a net investment.
The following tables represent, by commodity type, our net long or short positions that are expected to partially or entirely settle in each respective year. To the extent that we have long dated derivative positions that span multiple calendar years, the contract will appear in more than one line item in the tables below.
| December 31, 2010 | ||||||||||||
| Crude Oil | Natural Gas | Natural Gas Liquids |
||||||||||
| Year of Expiration |
Net Long (Short) Position (Bbls) |
Net Long (Short) Position (MMBtu) |
Net Long (Short) Position (Bbls) |
|||||||||
| 2011 |
(998,554 | ) | (687,500 | ) | (73,190 | ) | ||||||
| 2012 |
(839,358 | ) | (366,000 | ) | — | |||||||
| 2013 |
(748,250 | ) | (365,000 | ) | — | |||||||
| 2014 |
(547,500 | ) | (365,000 | ) | — | |||||||
| 2015 |
(182,500 | ) | — | — | ||||||||
| December 31, 2009 | ||||||||||||
| Crude Oil | Natural Gas | Natural Gas Liquids |
||||||||||
| Year of Expiration |
Net Long (Short) Position (Bbls) |
Net Long (Short) position (MMbtu) |
Net Long (Short) Position (Bbls) |
|||||||||
| 2010 |
(950,225 | ) | (1,883,500 | ) | (74,001 | ) | ||||||
| 2011 |
(949,000 | ) | (1,496,500 | ) | — | |||||||
| 2012 |
(777,750 | ) | (1,500,600 | ) | — | |||||||
| 2013 |
(748,250 | ) | (730,000 | ) | — | |||||||
| 2014 |
(365,000 | ) | — | — | ||||||||
138
Table of Contents
DCP MIDSTREAM PARTNERS, LP
NOTES TO CONSOLIDATED FINANCIAL STATEMENTS
Years Ended December 31, 2010, 2009 and 2008 — (Continued)
We periodically enter into interest rate swap agreements to mitigate a portion of our floating rate interest exposure. As of December 31, 2010 we have swaps with a notional value between $50.0 million and $80.0 million, which, in aggregate, exchange $450.0 million of our floating rate obligation to a fixed rate obligation through June 2012, with $150.0 million extending from June 2012 through June 2014.
| 13. | Partnership Equity and Distributions |
General — Our partnership agreement requires that, within 45 days after the end of each quarter, we distribute all of our Available Cash, as defined below, to unitholders of record on the applicable record date, as determined by our general partner.
In November 2010, we issued 2,875,000 common limited partner units at $34.96 per unit. We received proceeds of $96.2 million, net of offering costs.
In September 2010, we issued 5,200 common limited partner units, from our Long Term Incentive plan, to non-employee directors as compensation for their service during 2010.
In August 2010, we issued 2,990,000 common limited partner units at $32.57 per unit. We received proceeds of $93.1 million, net of offering costs.
On May 26, 2010, we filed a universal shelf registration statement on Form S-3 with the SEC with a maximum aggregate offering price of $1.5 billion, to replace an existing shelf registration statement. The universal shelf registration statement will allow us to offer and issue additional partnership units and debt securities.
In November 2009, we issued 2,500,000 common limited partner units at $25.40 per unit, and in December 2009 we issued an additional 375,000 common limited partner units to the underwriters upon exercise of their overallotment option. We received proceeds of $69.5 million, net of offering costs.
In April 2009, we issued 3,500,000 Class D units valued at $49.7 million. The Class D units were issued to DCP Midstream, LLC in consideration for an additional 25.1% interest in East Texas and a fixed price natural gas liquids derivative by NGL component for the period April 2009 to March 2010. The Class D units converted into our common units on a one-for-one basis on August 17, 2009.
In March 2008, we issued 4,250,000 common limited partner units at $32.44 per unit, and received proceeds of $132.1 million, net of offering costs.
In January 2008, our registration statement on Form S-3 to register the 3,005,780 common limited partner units represented in the June 2007 private placement agreement and the 2,380,952 common limited partner units represented in the August 2007 private placement agreement was declared effective by the SEC.
Definition of Available Cash — Available Cash, for any quarter, consists of all cash and cash equivalents on hand at the end of that quarter:
| • | less the amount of cash reserves established by the general partner to: |
| • | provide for the proper conduct of our business; |
| • | comply with applicable law, any of our debt instruments or other agreements; and |
| • | provide funds for distributions to the unitholders and to our general partner for any one or more of the next four quarters; |
| • | plus, if our general partner so determines, all or a portion of cash and cash equivalents on hand on the date of determination of Available Cash for the quarter. |
139
Table of Contents
DCP MIDSTREAM PARTNERS, LP
NOTES TO CONSOLIDATED FINANCIAL STATEMENTS
Years Ended December 31, 2010, 2009 and 2008 — (Continued)
General Partner Interest and Incentive Distribution Rights — The general partner is entitled to a percentage of all quarterly distributions equal to its general partner interest of approximately 1% and limited partner interest of 1% as of December 31, 2010. The general partner has the right, but not the obligation, to contribute a proportionate amount of capital to us to maintain its current general partner interest.
The incentive distribution rights held by the general partner entitle it to receive an increasing share of Available Cash when pre-defined distribution targets are achieved. Currently, our distribution to our general partner related to its incentive distribution rights is at the highest level. The general partner’s incentive distribution rights were not reduced as a result of our common limited partner unit issuances, and will not be reduced if we issue additional units in the future and the general partner does not contribute a proportionate amount of capital to us to maintain its current general partner interest. Please read the Distributions of Available Cash after the Subordination Period sections below for more details about the distribution targets and their impact on the general partner’s incentive distribution rights.
Class D Units — All of the Class D units were held by DCP Midstream, LLC and converted into our common units on a one for one basis on August 17, 2009. The holders of the Class D units received the second quarter distribution paid on August 14, 2009.
Subordinated Units — All of our subordinated units were held by DCP Midstream, LLC and were converted to common limited partner units by February 2009. The subordination period had an early termination provision that permitted 50% of the subordinated units, or 3,571,428 units, to convert into common units on a one-to-one basis in February 2008 and permitted the other 50% of the subordinated units, or 3,571,429 units, to convert into common units on a one-to-one basis in February 2009, following the satisfactory completion of the tests for ending the subordination period contained in our partnership agreement. The board of directors of the General Partner certified that all conditions for early conversion were satisfied.
Our partnership agreement provides that, during the subordination period, the common units had the right to receive distributions of Available Cash each quarter in an amount equal to $0.35 per common unit, or the Minimum Quarterly Distribution, plus any arrearages in the payment of the Minimum Quarterly Distribution on the common units from prior quarters, before any distributions of Available Cash may be made on the subordinated units. These units are deemed “subordinated” because for a period of time, referred to as the subordination period, the subordinated units were not entitled to receive any distributions until the common units received the Minimum Quarterly Distribution plus any arrearages from prior quarters. Furthermore, no arrearages could be paid on the subordinated units. The practical effect of the subordinated units is to increase the likelihood that during the subordination period there will be Available Cash to be distributed on the common units.
Distributions of Available Cash after the Subordination Period — Our partnership agreement, after adjustment for the general partner’s relative ownership level, requires that we make distributions of Available Cash from operating surplus for any quarter after the subordination period, which ended in February 2009, in the following manner:
| • | first, to all unitholders and the general partner, in accordance with their pro rata interest, until each unitholder receives a total of $0.4025 per unit for that quarter; |
| • | second, 13% to the general partner, plus the general partner’s pro rata interest, and the remainder to all unitholders pro rata until each unitholder receives a total of $0.4375 per unit for that quarter; |
| • | third, 23% to the general partner, plus the general partner’s pro rata interest, and the remainder to all unitholders pro rata until each unitholder receives a total of $0.525 per unit for that quarter; and |
| • | thereafter, 48% to the general partner, plus the general partner’s pro rata interest, and the remainder to all unitholders. |
140
Table of Contents
DCP MIDSTREAM PARTNERS, LP
NOTES TO CONSOLIDATED FINANCIAL STATEMENTS
Years Ended December 31, 2010, 2009 and 2008 — (Continued)
The following table presents our cash distributions paid in 2010, 2009 and 2008:
| Payment Date |
Per Unit Distribution |
Total Cash Distribution |
||||||
| (Millions) | ||||||||
| November 12, 2010 |
$ | 0.610 | $ | 27.4 | ||||
| August 13, 2010 |
0.610 | 25.3 | ||||||
| May 14, 2010 |
0.600 | 24.6 | ||||||
| February 12, 2010 |
0.600 | 24.6 | ||||||
| November 13, 2009 |
0.600 | 22.6 | ||||||
| August 14, 2009 |
0.600 | 22.6 | ||||||
| May 15, 2009 |
0.600 | 20.1 | ||||||
| February 13, 2009 |
0.600 | 20.1 | ||||||
| November 14, 2008 |
0.600 | 20.1 | ||||||
| August 14, 2008 |
0.600 | 20.1 | ||||||
| May 15, 2008 |
0.590 | 19.6 | ||||||
| February 14, 2008 |
0.570 | 15.7 | ||||||
| 14. | Equity-Based Compensation |
Total compensation cost (credit) for equity-based arrangements was as follows:
| Year Ended December 31, | ||||||||||||
| 2010 | 2009 | 2008 | ||||||||||
| (Millions) | ||||||||||||
| Performance Units |
$ | 1.2 | $ | 1.2 | $ | (0.7 | ) | |||||
| Phantom Units |
0.2 | 0.4 | (0.4 | ) | ||||||||
| Restricted Phantom Units |
1.4 | 0.6 | 0.1 | |||||||||
| Total compensation cost (credit) |
$ | 2.8 | $ | 2.2 | $ | (1.0 | ) | |||||
On November 28, 2005, the board of directors of our General Partner adopted a long-term incentive plan, or LTIP, for employees, consultants and directors of our General Partner and its affiliates who perform services for us. The LTIP provides for the grant of limited partner units, or LPUs, phantom units, unit options and substitute awards, and, with respect to unit options and phantom units, the grant of dividend equivalent rights, or DERs. Subject to adjustment for certain events, an aggregate of 850,000 LPUs may be delivered pursuant to awards under the LTIP. Awards that are canceled or forfeited, or are withheld to satisfy the General Partner’s tax withholding obligations, are available for delivery pursuant to other awards. The LTIP is administered by the compensation committee of the General Partner’s board of directors. All awards are subject to cliff vesting, with the exception of the Phantom Units issued to directors in conjunction with our initial public offering, which are subject to graded vesting provisions.
Substantially all awards are accounted for as liability awards.
Performance Units — We have awarded phantom LPUs, or Performance Units, pursuant to the LTIP to certain employees. Performance Units generally vest in their entirety at the end of a three year performance period. The number of Performance Units that will ultimately vest range, in value from 0% to 200% of the outstanding Performance Units, depending on the achievement of specified performance targets over three year performance periods. The final performance payout is determined by the compensation committee of the board of directors of our General Partner. The DERs are paid in cash at the end of the performance period. Of the remaining Performance Units outstanding at December 31, 2010, 51,794 units are expected to vest on December 31, 2011 and 11,641 units are expected to vest on December 31, 2012.
141
Table of Contents
DCP MIDSTREAM PARTNERS, LP
NOTES TO CONSOLIDATED FINANCIAL STATEMENTS
Years Ended December 31, 2010, 2009 and 2008 — (Continued)
At December 31, 2010, there was approximately $1.0 million of unrecognized compensation expense related to the Performance Units that is expected to be recognized over a weighted-average period of 1.2 years. The following table presents information related to the Performance Units:
| Units | Grant Date Weighted- Average Price per Unit |
Measurement Date Price per Unit |
||||||||||
| Outstanding at January 1, 2008 |
46,960 | $ | 34.09 | |||||||||
| Granted |
17,085 | $ | 33.85 | |||||||||
| Forfeited |
(12,025 | ) | $ | 33.14 | ||||||||
| Outstanding at December 31, 2008 |
52,020 | $ | 34.23 | |||||||||
| Granted |
52,450 | $ | 10.05 | |||||||||
| Vested |
(37,330 | ) | $ | 34.51 | ||||||||
| Outstanding at December 31, 2009 |
67,140 | $ | 15.18 | |||||||||
| Granted |
16,630 | $ | 31.80 | |||||||||
| Vested(a) |
(14,215 | ) | $ | 33.44 | ||||||||
| Forfeited |
(2,205 | ) | $ | 15.61 | ||||||||
| Outstanding at December 31, 2010 |
67,350 | $ | 15.42 | $ | 37.40 | |||||||
| Expected to vest(b) |
63,435 | $ | 14.04 | $ | 37.40 | |||||||
| (a) | The units vested at 0%. |
| (b) | Based on our December 31, 2010 estimated achievement of specified performance targets, the performance estimate for units granted in 2010 is 100%, and for units granted in 2009 is 125%. The estimated forfeiture rate for units granted in 2010 is 30% and for units granted in 2009 is 21%. |
The estimate of Performance Units that are expected to vest is based on highly subjective assumptions that could potentially change over time, including the expected forfeiture rate and achievement of performance targets. Therefore, the amount of unrecognized compensation expense noted above does not necessarily represent the value that will ultimately be realized in our consolidated statements of operations.
The following table presents the fair value of units vested and the unit-based liabilities paid for unit based awards related to Performance Units, including the related DERs:
| Units Vested | Fair Value of Units Vested |
Unit-Based Liabilities Paid |
||||||||||
| (Millions) | ||||||||||||
| 2010 |
14,215 | $ | — | $ | 0.8 | (a) | ||||||
| 2009 |
37,330 | (a) | $ | 1.1 | $ | 0.3 | ||||||
| (a) | 22,860, or $0.8 million, of the units and the related DERs that vested in 2009 were paid in 2010. |
Phantom Units — In conjunction with our initial public offering, in January 2006 our General Partner’s board of directors awarded phantom LPUs, or Phantom Units, to key employees, and to directors who are not officers or employees of affiliates of the General Partner.
In 2010, we granted 5,200 Phantom Units, pursuant to the LTIP, to directors who are not officers or employees of affiliates of the General Partner as part of their annual director fees for 2010. All of these units vested in 2010 and were settled in units.
In 2009, we granted 16,000 Phantom Units, pursuant to the LTIP, to directors who are not officers or employees of affiliates of the General Partner as part of their annual director fees for 2009. All of these units vested during 2009 and were settled in cash.
142
Table of Contents
DCP MIDSTREAM PARTNERS, LP
NOTES TO CONSOLIDATED FINANCIAL STATEMENTS
Years Ended December 31, 2010, 2009 and 2008 — (Continued)
In 2008, we granted 4,000 Phantom Units, pursuant to the LTIP, to directors who are not officers or employees of affiliates of the General Partner as part of their annual director fees for 2008. All of these units vested during 2008 and were settled in cash.
The DERs are paid in cash quarterly in arrears.
The following table presents information related to the Phantom Units:
| Units | Grant Date Weighted- Average Price per Unit |
Measurement Date Price per Unit |
||||||||||
| Outstanding at January 1, 2008 |
20,199 | $ | 24.56 | |||||||||
| Granted |
4,000 | $ | 35.88 | |||||||||
| Forfeited |
(4,000 | ) | $ | 24.05 | ||||||||
| Vested |
(6,501 | ) | $ | 32.91 | ||||||||
| Outstanding at December 31, 2008 |
13,698 | $ | 24.05 | |||||||||
| Granted |
16,000 | $ | 10.05 | |||||||||
| Vested |
(29,698 | ) | $ | 16.51 | ||||||||
| Outstanding at December 31, 2009 |
— | $ | — | |||||||||
| Granted |
5,200 | $ | 24.05 | |||||||||
| Vested |
(5,200 | ) | $ | 31.80 | ||||||||
| Outstanding at December 31, 2010 |
— | $ | — | $ | — | |||||||
The following table presents the fair value of units vested and the unit-based liabilities paid for unit based awards related to Phantom Units:
| Units Vested | Fair Value of Units Vested |
Unit-Based Liabilities Paid |
||||||||||
| (Millions) | ||||||||||||
| 2010(a) |
5,200 | $ | 0.2 | $ | — | |||||||
| 2009 |
29,698 | $ | 0.5 | $ | 0.5 | |||||||
| 2008 |
6,501 | $ | 0.2 | $ | 0.2 | |||||||
| (a) | We issued 5,200 units in September 2010 related to these Phantom Units. |
Restricted Phantom Units — Our General Partner’s board of directors awarded restricted phantom LPUs, or RPUs, to key employees under the LTIP. Of the remaining RPUs outstanding at December 31, 2010, 41,436 units are expected to vest on December 31, 2011 and 11,641 units are expected to vest on December 31, 2012. The DERs are paid in cash quarterly in arrears.
143
Table of Contents
DCP MIDSTREAM PARTNERS, LP
NOTES TO CONSOLIDATED FINANCIAL STATEMENTS
Years Ended December 31, 2010, 2009 and 2008 — (Continued)
At December 31, 2010, there was approximately $0.9 million of unrecognized compensation expense related to the RPUs that is expected to be recognized over a weighted-average period of 1.0 year. The following table presents information related to the RPUs:
| Units | Grant Date Weighted- Average Price per Unit |
Measurement Date Price per Unit |
||||||||||
| Outstanding at January 1, 2008 |
— | $ | — | |||||||||
| Granted |
17,085 | $ | 33.85 | |||||||||
| Forfeited |
(2,395 | ) | $ | 35.88 | ||||||||
| Outstanding at December 31, 2008 |
14,690 | $ | 33.52 | |||||||||
| Granted |
52,450 | $ | 10.05 | |||||||||
| Outstanding at December 31, 2009 |
67,140 | $ | 15.18 | |||||||||
| Granted |
16,630 | $ | 31.80 | |||||||||
| Vested |
(14,215 | ) | $ | 33.44 | ||||||||
| Forfeited |
(2,205 | ) | $ | 15.61 | ||||||||
| Outstanding at December 31, 2010 |
67,350 | $ | 15.42 | $ | 37.40 | |||||||
| Expected to vest |
66,403 | $ | 18.64 | $ | 37.40 | |||||||
The following table presents the fair value of units vested and the unit-based liabilities paid for unit based awards related to Restricted Phantom Units:
| Units Vested | Fair Value of Units Vested |
Unit-Based Liabilities Paid |
||||||||||
| (Millions) | ||||||||||||
| 2010(a) |
14,215 | $ | 0.5 | $ | — | |||||||
| (a) | 14,215 of the units and the related DERs that vested in 2010 were paid in 2011. |
The estimate of RPUs that are expected to vest is based on highly subjective assumptions that could potentially change over time, including the expected forfeiture rate, which was estimated at 30% for units granted in 2010, 21% for units granted in 2009 and 22% for units granted in 2008. Therefore, the amount of unrecognized compensation expense noted above does not necessarily represent the value that will ultimately be realized in our consolidated statements of operations.
We intend to settle certain awards issued under the LTIP in cash upon vesting. Compensation expense on these awards is recognized ratably over each vesting period, and will be re-measured each reporting period for all awards outstanding until the units are vested. The fair value of all awards is determined based on the closing price of our common units at each measurement date.
| 15. | Income Taxes |
We are structured as a master limited partnership, which is a pass-through entity for federal income tax purposes. Accordingly, we had no federal deferred tax balances as of December 31, 2009 and 2008, and no federal income tax expense for the years ended December 31, 2010, 2009 and 2008. On December 30, 2010, we acquired all of the interests in Marysville Hydrocarbons Holdings, LLC, an entity that owns a taxable C-Corporation consolidated return group. We have estimated $35.0 million of federal deferred tax liabilities resulting from built-in tax gains recognized in the transaction and have recorded this in our preliminary purchase price allocation as of December 31, 2010.
On January 4, 2011, we merged two wholly-owned subsidiaries of Marysville Hydrocarbons Holding, LLC and converted the combined entity’s organizational structure from a corporation to a limited liability company. This conversion to a limited liability company triggers the deferred tax liabilities resulting from
144
Table of Contents
DCP MIDSTREAM PARTNERS, LP
NOTES TO CONSOLIDATED FINANCIAL STATEMENTS
Years Ended December 31, 2010, 2009 and 2008 — (Continued)
built-in tax gains to become currently payable. Accordingly, the estimated $35.0 million of deferred tax liabilities at December 31, 2010 will be reflected as current income tax payable on financial statements with reporting periods beginning on or after January 1, 2011.
The State of Texas imposes a margin tax that is assessed at 1% of taxable margin apportioned to Texas. During 2008 and 2009 we acquired properties in Michigan. Michigan imposes a business tax of 0.8% on gross receipts, and 4.95% of Michigan taxable income. The sum of the gross receipts and income tax is subject to a tax surcharge of 21.99%. Michigan provides tax credits that may reduce our final tax liability.
Income tax benefit (expense) consists of the following:
| Year Ended December 31, | ||||||||||||
| 2010 | 2009 | 2008 | ||||||||||
| (millions) | ||||||||||||
| Current: |
||||||||||||
| State |
$ | (0.4 | ) | $ | (0.5 | ) | $ | (0.7 | ) | |||
| Deferred: |
||||||||||||
| State |
0.1 | (0.1 | ) | 0.1 | ||||||||
| Total income tax expense |
$ | (0.3 | ) | $ | (0.6 | ) | $ | (0.6 | ) | |||
We had additional net long-term deferred tax liabilities of $1.6 million and $1.7 million as of December 31, 2010 and 2009, respectively, included in other long term liabilities on the consolidated balance sheets. These state deferred tax liabilities relate to our East Texas operations, and are primarily associated with depreciation related to property plant and equipment.
Our effective tax rate differs from statutory rates, primarily due to being structured as a limited partnership, which is a pass-through entity for United States income tax purposes, while being treated as a taxable entity in certain states.
| 16. | Net Income or Loss per Limited Partner Unit |
Our net income or loss is allocated to the general partner and the limited partners, including the holders of the subordinated units, through the date of subordinated conversion, in accordance with their respective ownership percentages, after allocating Available Cash generated during the period in accordance with our partnership agreement.
Securities that meet the definition of a participating security are required to be considered for inclusion in the computation of basic earnings per unit using the two-class method. Under the two-class method, earnings per unit is calculated as if all of the earnings for the period were distributed under the terms of the partnership agreement, regardless of whether the general partner has discretion over the amount of distributions to be made in any particular period, whether those earnings would actually be distributed during a particular period from an economic or practical perspective, or whether the general partner has other legal or contractual limitations on its ability to pay distributions that would prevent it from distributing all of the earnings for a particular period.
These required disclosures do not impact our overall net income or loss or other financial results; however, in periods in which aggregate net income exceeds our Available Cash it will have the impact of reducing net income per LPU.
Basic and diluted net income or loss per LPU is calculated by dividing limited partners’ interest in net income or loss, by the weighted-average number of outstanding LPUs during the period.
145
Table of Contents
DCP MIDSTREAM PARTNERS, LP
NOTES TO CONSOLIDATED FINANCIAL STATEMENTS
Years Ended December 31, 2010, 2009 and 2008 — (Continued)
| 17. | Commitments and Contingent Liabilities |
Litigation
Westfield — In July 2010 there was an explosion at a condominium complex in Norfolk, Massachusetts in which a worker at the condominium was killed. An investigation of the accident by the Massachusetts State Fire Marshall has indicated that the propane that exploded may have been unodorized. The investigation further indicated that the propane that exploded may have been supplied by our Westfield propane rail terminal to one of our customers who filled the tank that exploded. We are not responsible for odorization of the propane we supply to our customers out of our Westfield terminal. Rather, we receive the propane by rail which has been odorized by our suppliers. An attorney representing the estate of the deceased has brought a legal action against our customer who filled the tank that exploded; however, we have not been named in that lawsuit. It is not possible to predict whether we will incur any liability or to estimate the damages, if any, we might incur in connection with this matter. Management does not believe the ultimate resolution of this issue will have a material adverse effect on our consolidated results of operations, financial position or cash flows.
El Paso — On February 27, 2009, a jury in the District Court, Harris County, Texas rendered a verdict in favor of El Paso E&P Company, L.P., or El Paso, and against one of our subsidiaries and DCP Midstream, LLC. As previously disclosed, the lawsuit, filed in December 2006, stems from an ongoing commercial dispute involving our Minden processing plant that dates back to August 2000. During the second quarter of 2009 we filed an appeal in the 14th Court of Appeals, Texas. El Paso filed an additional lawsuit in the District Court of Webster Parish, Louisiana, claiming damages for the same claims as the Texas matter, but for periods prior to our ownership of the Minden processing plant. The Louisiana court determined in August 2009 that El Paso’s Louisiana claims were barred by the doctrine of res judicata and dismissed the case with prejudice in Louisiana. In January 2010, we and DCP Midstream, LLC entered into a settlement agreement with El Paso to resolve all claims brought by El Paso regarding this matter in Texas and Louisiana. Under the terms of the settlement agreement, we paid El Paso approximately $2.2 million for our portion of the settlement, which is within the amount of our previously disclosed contingent liability. The cases have been dismissed in both Texas and Louisiana.
Other — We are not a party to any other significant legal proceedings, but are a party to various administrative and regulatory proceedings and commercial disputes that have arisen in the ordinary course of our business. Management currently believes that the ultimate resolution of the foregoing matters, taken as a whole, and after consideration of amounts accrued, insurance coverage or other indemnification arrangements, will not have a material adverse effect on our consolidated results of operations, financial position, or cash flows.
Insurance — We renewed our insurance policies in May, June and July 2010 for the 2010-2011 insurance year. We contract with third-party and affiliate insurers for: (1) automobile liability insurance for all owned, non-owned and hired vehicles; (2) general liability insurance; (3) excess liability insurance above the established primary limits for general liability and automobile liability insurance; and (4) property insurance, which covers replacement value of real and personal property and includes business interruption/extra expense. These renewals have not resulted in any material change to the premiums we are contracted to pay in the 2010-2011 insurance year compared with the 2009-2010 insurance year. We are jointly insured with DCP Midstream, LLC for directors and officers insurance covering our directors and officers for acts related to our business activities. All coverage is subject to certain limits and deductibles, the terms and conditions of which are common for companies that are of similar size to us and with similar types of operations.
Our insurance on Discovery for the 2010-2011 insurance year covers onshore named windstorm property and business interruption insurance and onshore and offshore non-windstorm property and business interruption insurance. The availability of offshore named windstorm property and business interruption insurance has been significantly reduced over the past two years as a result of higher industry-wide damage claims. Additionally, the named windstorm property and business interruption insurance that is available comes at uneconomic
146
Table of Contents
DCP MIDSTREAM PARTNERS, LP
NOTES TO CONSOLIDATED FINANCIAL STATEMENTS
Years Ended December 31, 2010, 2009 and 2008 — (Continued)
premium levels, higher deductibles and lower coverage limits. Consequently, as with the 2009-2010 insurance year, Discovery elected to not purchase offshore named windstorm property and business interruption insurance coverage for the 2010-2011 insurance year.
Environmental — The operation of pipelines, plants and other facilities for gathering, transporting, processing, treating, or storing natural gas, NGLs and other products is subject to stringent and complex laws and regulations pertaining to health, safety and the environment. As an owner or operator of these facilities, we must comply with United States laws and regulations at the federal, state and local levels that relate to air and water quality, hazardous and solid waste management and disposal, and other environmental matters. The cost of planning, designing, constructing and operating pipelines, plants, and other facilities must incorporate compliance with environmental laws and regulations and safety standards. Failure to comply with these laws and regulations may trigger a variety of administrative, civil and potentially criminal enforcement measures, including citizen suits, which can include the assessment of monetary penalties, the imposition of remedial requirements, and the issuance of injunctions or restrictions on operation. Management believes that, based on currently known information, compliance with these laws and regulations will not have a material adverse effect on our consolidated results of operations, financial position or cash flows.
Indemnification — DCP Midstream, LLC has indemnified us for certain potential environmental claims, losses and expenses associated with the operation of the assets of certain of our predecessors. See the “Indemnification” section of Note 5 for additional details.
Other Commitments and Contingencies — We utilize assets under operating leases in several areas of operation. Consolidated rental expense, including leases with no continuing commitment, totaled $12.8 million, $12.1 million and $12.9 million for the years ended December 31, 2010, 2009 and 2008, respectively. Rental expense for leases with escalation clauses is recognized on a straight line basis over the initial lease term.
Minimum rental payments under our various operating leases in the year indicated are as follows at December 31, 2010:
| (Millions) | ||||
| 2011 |
$ | 15.8 | ||
| 2012 |
12.5 | |||
| 2013 |
9.6 | |||
| 2014 |
4.1 | |||
| 2015 |
0.6 | |||
| Thereafter |
1.2 | |||
| Total minimum rental payments |
$ | 43.8 | ||
| 18. | Business Segments |
Our operations are located in the United States and are organized into three reporting segments: (1) Natural Gas Services; (2) Wholesale Propane Logistics; and (3) NGL Logistics.
Natural Gas Services — The Natural Gas Services segment consists of our Northern Louisiana system, our Southern Oklahoma system, our 40% limited liability company interest in Discovery, our 75% interest in our Colorado system, our Wyoming system, our 50.1% interest in our East Texas system, and our Michigan system.
Wholesale Propane Logistics — The Wholesale Propane Logistics segment consists of six owned rail terminals, one owned marine import terminal, one leased marine terminal, one pipeline terminal and access to several open-access pipeline terminals.
NGL Logistics — The NGL Logistics segment consists of the Seabreeze and Wilbreeze NGL transportation pipelines, the Wattenberg NGL transportation pipeline, the Black Lake interstate NGL pipeline and the NGL storage facility in Marysville, Michigan.
147
Table of Contents
DCP MIDSTREAM PARTNERS, LP
NOTES TO CONSOLIDATED FINANCIAL STATEMENTS
Years Ended December 31, 2010, 2009 and 2008 — (Continued)
These segments are monitored separately by management for performance against our internal forecast and are consistent with internal financial reporting. These segments have been identified based on the differing products and services, regulatory environment and the expertise required for these operations. Gross margin is a performance measure utilized by management to monitor the business of each segment.
The following tables set forth our segment information:
Year Ended December 31, 2010:
| Natural
Gas Services |
Wholesale Propane Logistics |
NGL Logistics |
Other | Total | ||||||||||||||||
| (Millions) | ||||||||||||||||||||
| Total operating revenue |
$ | 778.7 | $ | 473.2 | $ | 17.6 | $ | — | $ | 1,269.5 | ||||||||||
| Gross margin(a) |
$ | 195.1 | $ | 28.9 | $ | 12.9 | $ | — | $ | 236.9 | ||||||||||
| Operating and maintenance expense |
(63.5 | ) | (12.6 | ) | (3.7 | ) | — | (79.8 | ) | |||||||||||
| Depreciation and amortization expense |
(69.1 | ) | (1.9 | ) | (2.6 | ) | (0.1 | ) | (73.7 | ) | ||||||||||
| General and administrative expense |
— | — | — | (33.7 | ) | (33.7 | ) | |||||||||||||
| Earnings from unconsolidated affiliates |
23.0 | — | 0.8 | — | 23.8 | |||||||||||||||
| Other operating income |
1.0 | 3.0 | — | — | 4.0 | |||||||||||||||
| Step acquisition — equity interest re-measurement gain |
— | — | 9.1 | — | 9.1 | |||||||||||||||
| Interest expense |
— | — | — | (29.1 | ) | (29.1 | ) | |||||||||||||
| Income tax expense(b) |
— | — | — | (0.3 | ) | (0.3 | ) | |||||||||||||
| Net income (loss) |
86.5 | 17.4 | 16.5 | (63.2 | ) | 57.2 | ||||||||||||||
| Net income attributable to noncontrolling interests |
(9.2 | ) | — | — | — | (9.2 | ) | |||||||||||||
| Net income (loss) attributable to partners |
$ | 77.3 | $ | 17.4 | $ | 16.5 | $ | (63.2 | ) | $ | 48.0 | |||||||||
| Non-cash derivative mark-to-market(c) |
$ | (4.4 | ) | $ | (1.0 | ) | $ | — | $ | 1.4 | $ | (4.0 | ) | |||||||
| Capital expenditures |
$ | 38.6 | $ | 0.6 | $ | 11.5 | $ | — | $ | 50.7 | ||||||||||
| Acquisitions net of cash acquired |
$ | — | $ | 67.8 | $ | 135.5 | $ | — | $ | 203.3 | ||||||||||
| Investments in unconsolidated affiliates |
$ | 2.3 | $ | — | $ | — | $ | — | $ | 2.3 | ||||||||||
Year Ended December 31, 2009:
| Natural
Gas Services |
Wholesale Propane Logistics |
NGL Logistics |
Other | Total | ||||||||||||||||
| (Millions) | ||||||||||||||||||||
| Total operating revenue |
$ | 583.7 | $ | 348.2 | $ | 10.5 | $ | — | $ | 942.4 | ||||||||||
| Gross margin(a) |
$ | 109.7 | $ | 48.9 | $ | 7.6 | $ | — | $ | 166.2 | ||||||||||
| Operating and maintenance expense |
(58.2 | ) | (10.3 | ) | (1.2 | ) | — | (69.7 | ) | |||||||||||
| Depreciation and amortization expense |
(61.9 | ) | (1.4 | ) | (1.4 | ) | (0.2 | ) | (64.9 | ) | ||||||||||
| General and administrative expense |
— | — | — | (32.3 | ) | (32.3 | ) | |||||||||||||
| Earnings from unconsolidated affiliates |
16.6 | — | 1.9 | — | 18.5 | |||||||||||||||
| Interest income |
— | — | — | 0.3 | 0.3 | |||||||||||||||
| Interest expense |
— | — | — | (28.3 | ) | (28.3 | ) | |||||||||||||
| Income tax expense(b) |
— | — | — | (0.6 | ) | (0.6 | ) | |||||||||||||
| Net income (loss) |
6.2 | 37.2 | 6.9 | (61.1 | ) | (10.8 | ) | |||||||||||||
| Net income attributable to noncontrolling interests |
(8.3 | ) | — | — | — | (8.3 | ) | |||||||||||||
| Net (loss) income attributable to partners |
$ | (2.1 | ) | $ | 37.2 | $ | 6.9 | $ | (61.1 | ) | $ | (19.1 | ) | |||||||
| Non-cash derivative mark-to-market(c) |
$ | (84.2 | ) | $ | 0.8 | $ | — | $ | (0.4 | ) | $ | (83.8 | ) | |||||||
| Capital expenditures |
$ | 164.3 | $ | 0.5 | $ | — | $ | — | $ | 164.8 | ||||||||||
| Acquisitions net of cash acquired |
$ | 44.5 | $ | — | $ | — | $ | — | $ | 44.5 | ||||||||||
| Investments in unconsolidated affiliates |
$ | 7.0 | $ | — | $ | — | $ | — | $ | 7.0 | ||||||||||
148
Table of Contents
DCP MIDSTREAM PARTNERS, LP
NOTES TO CONSOLIDATED FINANCIAL STATEMENTS
Years Ended December 31, 2010, 2009 and 2008 — (Continued)
Year Ended December 31, 2008:
| Natural
Gas Services |
Wholesale Propane Logistics |
NGL Logistics |
Other | Total | ||||||||||||||||
| (Millions) | ||||||||||||||||||||
| Total operating revenue |
$ | 1,336.2 | $ | 483.0 | $ | 11.3 | $ | — | $ | 1,830.5 | ||||||||||
| Gross margin(a) |
$ | 331.4 | $ | 11.0 | $ | 7.1 | $ | — | $ | 349.5 | ||||||||||
| Operating and maintenance expense |
(66.5 | ) | (9.9 | ) | (1.0 | ) | — | (77.4 | ) | |||||||||||
| Depreciation and amortization expense |
(50.5 | ) | (1.3 | ) | (1.4 | ) | — | (53.2 | ) | |||||||||||
| General and administrative expense |
— | — | — | (33.3 | ) | (33.3 | ) | |||||||||||||
| Other |
— | 1.5 | — | — | 1.5 | |||||||||||||||
| Earnings from unconsolidated affiliates |
17.4 | — | 0.8 | — | 18.2 | |||||||||||||||
| Interest income |
— | — | — | 6.1 | 6.1 | |||||||||||||||
| Interest expense |
— | — | — | (32.8 | ) | (32.8 | ) | |||||||||||||
| Income tax expense(b) |
— | — | — | (0.6 | ) | (0.6 | ) | |||||||||||||
| Net income (loss) |
231.8 | 1.3 | 5.5 | (60.6 | ) | 178.0 | ||||||||||||||
| Net income attributable to noncontrolling interests |
(36.1 | ) | — | — | — | (36.1 | ) | |||||||||||||
| Net income (loss) attributable to partners |
$ | 195.7 | $ | 1.3 | $ | 5.5 | $ | (60.6 | ) | $ | 141.9 | |||||||||
| Non-cash derivative mark-to-market(c) |
$ | 99.2 | $ | 2.4 | $ | — | $ | (0.6 | ) | $ | 101.0 | |||||||||
| Capital expenditures |
$ | 68.3 | $ | 3.3 | $ | 0.4 | $ | 0.7 | $ | 72.7 | ||||||||||
| Acquisitions net of cash acquired |
$ | 157.3 | $ | — | $ | — | $ | — | $ | 157.3 | ||||||||||
| Investments in unconsolidated affiliates |
$ | 7.4 | $ | — | $ | — | $ | — | $ | 7.4 | ||||||||||
| December 31, | ||||||||||||
| 2010 | 2009 | 2008 | ||||||||||
| (Millions) | ||||||||||||
| Segment long-term assets: |
||||||||||||
| Natural Gas Services(d) |
$ | 1,141.1 | $ | 1,185.2 | $ | 1,045.9 | ||||||
| Wholesale Propane Logistics(d) |
101.7 | 53.2 | 54.3 | |||||||||
| NGL Logistics(d) |
220.6 | 32.3 | 33.8 | |||||||||
| Other(e) |
4.1 | 13.1 | 70.3 | |||||||||
| Total long-term assets |
1,467.5 | 1,283.8 | 1,204.3 | |||||||||
| Current assets |
233.1 | 197.7 | 215.4 | |||||||||
| Total assets |
$ | 1,700.6 | $ | 1,481.5 | $ | 1,419.7 | ||||||
| (a) | Gross margin consists of total operating revenues, including commodity derivative activity, less purchases of natural gas, propane and NGLs. Gross margin is viewed as a non-GAAP measure under the rules of the SEC, but is included as a supplemental disclosure because it is a primary performance measure used by management as it represents the results of product sales versus product purchases. As an indicator of our operating performance, gross margin should not be considered an alternative to, or more meaningful than, net income or cash flow as determined in accordance with GAAP. Our gross margin may not be comparable to a similarly titled measure of another company because other entities may not calculate gross margin in the same manner. |
| (b) | Income tax expense relates primarily to the Texas margin tax and the Michigan business tax. |
| (c) | Non-cash derivative mark-to-market is included in segment gross margin, along with cash settlements for our derivative contracts. |
149
Table of Contents
DCP MIDSTREAM PARTNERS, LP
NOTES TO CONSOLIDATED FINANCIAL STATEMENTS
Years Ended December 31, 2010, 2009 and 2008 — (Continued)
| (d) | Long-term assets for our Natural Gas Services segment increased in 2009 as a result of our expansion projects in East Texas and the Piceance Basin, the acquisition of certain companies that held natural gas gathering and treating assets for $45.1 million from MichCon Pipeline Company. |
Long-term assets for our Wholesale Propane Logistics segment increased in 2010 as a result of our acquisition of Atlantic Energy from a subsidiary of UGI Corporation.
Long-term assets for our NGL Logistics segment increased in 2010 as a result of our acquisitions of the Wattenberg pipeline, Black Lake and Marysville. Our July 30, 2010 acquisition of an additional 50% interest in Black Lake from an affiliate of BP PLC brought our ownership interest in Black Lake to 100%. Prior to our acquisition of an additional 50% interest in Black Lake, we accounted for Black Lake under the equity method of accounting. Subsequent to this transaction we account for Black Lake as a consolidated subsidiary.
| (e) | Other long-term assets not allocable to segments consist of restricted investments, unrealized gains on derivative instruments, corporate leasehold improvements and other long-term assets. |
| 19. | Supplemental Cash Flow Information |
| Year Ended December 31, | ||||||||||||
| 2010 | 2009 | 2008 | ||||||||||
| (Millions) | ||||||||||||
| Cash paid for interest: |
||||||||||||
| Cash paid for interest, net of amounts capitalized |
$ | 7.8 | $ | 9.0 | $ | 26.3 | ||||||
| Cash paid for income taxes, net of income tax refunds |
$ | 0.5 | $ | 1.5 | $ | — | ||||||
| Non-cash investing and financing activities: |
||||||||||||
| Property, plant and equipment acquired with accounts payable |
$ | 6.3 | $ | 4.1 | $ | 17.4 | ||||||
| Other non-cash additions of property, plant and equipment |
$ | 2.0 | $ | 1.3 | $ | 5.5 | ||||||
| Accounts payable related to equity issuance costs |
$ | 0.2 | $ | — | $ | — | ||||||
| Acquisition related contingent consideration |
$ | 1.0 | $ | — | $ | — | ||||||
| Non-cash contribution from noncontrolling interests |
$ | 0.5 | $ | — | $ | — | ||||||
| Accrued equity-based compensation |
$ | — | $ | — | $ | 0.2 | ||||||
| 20. | Quarterly Financial Data (Unaudited) |
Our consolidated results of operations by quarter for the years ended December 31, 2010 and 2009 were as follows (millions, except per unit amounts):
| 2010 |
First | Second | Third | Fourth | Year
Ended December 31, 2010 |
|||||||||||||||
| Total operating revenues |
$ | 403.7 | $ | 277.5 | $ | 239.9 | $ | 348.4 | $ | 1,269.5 | ||||||||||
| Operating income |
$ | 25.5 | $ | 27.8 | $ | 2.7 | $ | 6.8 | $ | 62.8 | ||||||||||
| Net income (loss) |
$ | 25.9 | $ | 27.0 | $ | (0.8 | ) | $ | 5.1 | $ | 57.2 | |||||||||
| Net (income) loss attributable to noncontrolling interests |
$ | (0.1 | ) | $ | (1.0 | ) | $ | (3.3 | ) | $ | (4.8 | ) | $ | (9.2 | ) | |||||
| Net income (loss) attributable to partners |
$ | 25.8 | $ | 26.0 | $ | (4.1 | ) | $ | 0.3 | $ | 48.0 | |||||||||
| Limited partners’ interest in net income (loss) |
$ | 22.0 | $ | 21.8 | $ | (8.2 | ) | $ | (4.5 | ) | $ | 31.1 | ||||||||
| Basic net income (loss) per limited partner unit |
$ | 0.64 | $ | 0.63 | $ | (0.23 | ) | $ | (0.12 | ) | $ | 0.86 | ||||||||
150
Table of Contents
DCP MIDSTREAM PARTNERS, LP
NOTES TO CONSOLIDATED FINANCIAL STATEMENTS
Years Ended December 31, 2010, 2009 and 2008 — (Continued)
| 2009 |
First | Second | Third | Fourth | Year
Ended December 31, 2009 |
|||||||||||||||
| Total operating revenues |
$ | 284.4 | $ | 152.0 | $ | 205.7 | $ | 300.3 | $ | 942.4 | ||||||||||
| Operating income (loss) |
$ | 28.1 | $ | (36.8 | ) | $ | 11.1 | $ | (3.1 | ) | $ | (0.7 | ) | |||||||
| Net income (loss) |
$ | 19.8 | $ | (40.0 | ) | $ | 12.4 | $ | (3.0 | ) | $ | (10.8 | ) | |||||||
| Net loss (income) attributable to noncontrolling interests |
$ | 1.3 | $ | (2.1 | ) | $ | (2.5 | ) | $ | (5.0 | ) | $ | (8.3 | ) | ||||||
| Net income (loss) attributable to partners |
$ | 21.1 | $ | (42.1 | ) | $ | 9.9 | $ | (8.0 | ) | $ | (19.1 | ) | |||||||
| Limited partners’ interest in net income (loss)(a) |
$ | 18.9 | $ | (44.8 | ) | $ | 6.5 | $ | (11.4 | ) | $ | (30.8 | ) | |||||||
| Basic net income (loss) per limited partner unit(a) |
$ | 0.67 | $ | (1.41 | ) | $ | 0.21 | $ | (0.35 | ) | $ | (0.99 | ) | |||||||
| (a) | Total limited partners’ interest in net income and basic income per limited partner unit excludes the results from our additional 25.1% interest in East Texas for the period January 1, 2009 through March 31, 2009. |
151
Table of Contents
DCP MIDSTREAM PARTNERS, LP
NOTES TO CONSOLIDATED FINANCIAL STATEMENTS
Years Ended December 31, 2010, 2009 and 2008 — (Continued)
| 21. | Supplementary Information — Condensed Consolidating Financial Information |
The following condensed consolidating financial information presents the results of operations, financial position and cash flows of DCP Midstream Partners, LP, or parent guarantor, DCP Midstream Operating LP, or subsidiary issuer, which is a 100% owned subsidiary, and non-guarantor subsidiaries, as well as the consolidating adjustments necessary to present DCP Midstream Partners, LP’s results on a consolidated basis. In conjunction with the universal shelf registration statement on Form S-3 filed with the SEC on May 26, 2010, the parent guarantor has agreed to fully and unconditionally guarantee securities of the subsidiary issuer. For the purpose of the following financial information, investments in subsidiaries are reflected in accordance with the equity method of accounting. The financial information may not necessarily be indicative of results of operations, cash flows, or financial position had the subsidiaries operated as independent entities.
| Condensed Consolidating Balance
Sheets December 31, 2010 |
||||||||||||||||||||
| Parent Guarantor |
Subsidiary Issuer |
Non- Guarantor Subsidiaries |
Consolidating Adjustments |
Consolidated | ||||||||||||||||
| (Millions) | ||||||||||||||||||||
| ASSETS | ||||||||||||||||||||
| Current assets: |
||||||||||||||||||||
| Cash and cash equivalents |
$ | $ | 1.5 | $ | 6.7 | $ | (1.5 | ) | $ | 6.7 | ||||||||||
| Accounts receivable |
— | — | 151.0 | — | 151.0 | |||||||||||||||
| Inventories |
— | — | 65.2 | — | 65.2 | |||||||||||||||
| Other |
— | — | 10.2 | — | 10.2 | |||||||||||||||
| Total current assets |
1.5 | 233.1 | (1.5 | ) | 233.1 | |||||||||||||||
| Property, plant and equipment, net |
— | — | 1,169.1 | — | 1,169.1 | |||||||||||||||
| Goodwill and intangible assets, net |
— | — | 186.7 | — | 186.7 | |||||||||||||||
| Advances receivable — consolidated subsidiaries |
333.4 | 534.7 | — | (868.1 | ) | — | ||||||||||||||
| Investments in consolidated subsidiaries |
184.9 | 323.6 | — | (508.5 | ) | — | ||||||||||||||
| Investments in unconsolidated affiliates |
— | — | 104.3 | — | 104.3 | |||||||||||||||
| Other long-term assets |
— | 2.3 | 5.1 | — | 7.4 | |||||||||||||||
| Total assets |
$ | 518.3 | $ | 862.1 | $ | 1,698.3 | $ | (1,378.1 | ) | $ | 1,700.6 | |||||||||
| LIABILITIES AND EQUITY | ||||||||||||||||||||
| Accounts payable and other current liabilities |
$ | 0.2 | $ | 19.5 | $ | 193.0 | $ | (1.5 | ) | $ | 211.2 | |||||||||
| Advances payable — consolidated subsidiaries |
— | — | 868.1 | (868.1 | ) | |||||||||||||||
| Long-term debt |
— | 647.8 | — | — | 647.8 | |||||||||||||||
| Other long-term liabilities |
— | 9.9 | 93.5 | — | 103.4 | |||||||||||||||
| Total liabilities |
0.2 | 677.2 | 1,154.6 | (869.6 | ) | 962.4 | ||||||||||||||
| Commitments and contingent liabilities |
||||||||||||||||||||
| Equity: |
||||||||||||||||||||
| Partners’ equity |
||||||||||||||||||||
| Net equity |
518.1 | 212.3 | 323.9 | (508.5 | ) | 545.8 | ||||||||||||||
| Accumulated other comprehensive loss |
— | (27.4 | ) | (0.3 | ) | — | (27.7 | ) | ||||||||||||
| Total partners’ equity |
518.1 | 184.9 | 323.6 | (508.5 | ) | 518.1 | ||||||||||||||
| Noncontrolling interests |
— | — | 220.1 | — | 220.1 | |||||||||||||||
| Total equity |
518.1 | 184.9 | 543.7 | (508.5 | ) | 738.2 | ||||||||||||||
| Total liabilities and equity |
$ | 518.3 | $ | 862.1 | $ | 1,698.3 | $ | (1,378.1 | ) | $ | 1,700.6 | |||||||||
152
Table of Contents
DCP MIDSTREAM PARTNERS, LP
NOTES TO CONSOLIDATED FINANCIAL STATEMENTS
Years Ended December 31, 2010, 2009 and 2008 — (Continued)
| Condensed Consolidating Balance
Sheets December 31, 2009 |
||||||||||||||||||||
| Parent Guarantor |
Subsidiary Issuer |
Non- Guarantor Subsidiaries |
Consolidating Adjustments |
Consolidated | ||||||||||||||||
| (Millions) | ||||||||||||||||||||
| ASSETS | ||||||||||||||||||||
| Current assets: |
||||||||||||||||||||
| Cash and cash equivalents |
$ | — | $ | 1.6 | $ | 1.3 | $ | (0.8 | ) | $ | 2.1 | |||||||||
| Accounts receivable |
— | — | 152.5 | — | 152.5 | |||||||||||||||
| Inventories |
— | — | 34.2 | — | 34.2 | |||||||||||||||
| Other |
— | 0.1 | 8.8 | — | 8.9 | |||||||||||||||
| Total current assets |
— | 1.7 | 196.8 | (0.8 | ) | 197.7 | ||||||||||||||
| Restricted investments |
— | 10.0 | — | — | 10.0 | |||||||||||||||
| Property, plant and equipment, net |
— | — | 1,000.1 | — | 1,000.1 | |||||||||||||||
| Goodwill and intangible assets, net |
— | — | 152.6 | — | 152.6 | |||||||||||||||
| Advances receivable — consolidated subsidiaries |
245.8 | 520.0 | — | (765.8 | ) | — | ||||||||||||||
| Investments in consolidated subsidiaries |
131.9 | 245.3 | — | (377.2 | ) | — | ||||||||||||||
| Investments in unconsolidated affiliates |
— | — | 114.6 | — | 114.6 | |||||||||||||||
| Other long-term assets |
— | 0.6 | 5.9 | — | 6.5 | |||||||||||||||
| Total assets |
$ | 377.7 | $ | 777.6 | $ | 1,470.0 | $ | (1,143.8 | ) | $ | 1,481.5 | |||||||||
| LIABILITIES AND EQUITY | ||||||||||||||||||||
| Accounts payable and other current liabilities |
$ | — | $ | 21.1 | $ | 170.8 | $ | (0.8 | ) | $ | 191.1 | |||||||||
| Advances payable — consolidated subsidiaries |
— | — | 765.8 | (765.8 | ) | — | ||||||||||||||
| Long-term debt |
— | 613.0 | — | — | 613.0 | |||||||||||||||
| Other long-term liabilities |
— | 11.6 | 60.4 | — | 72.0 | |||||||||||||||
| Total liabilities |
— | 645.7 | 997.0 | (766.6 | ) | 876.1 | ||||||||||||||
| Commitments and contingent liabilities |
||||||||||||||||||||
| Equity: |
||||||||||||||||||||
| Partners’ equity |
||||||||||||||||||||
| Net equity |
377.7 | 163.0 | 246.1 | (377.2 | ) | 409.6 | ||||||||||||||
| Accumulated other comprehensive loss |
— | (31.1 | ) | (0.8 | ) | — | (31.9 | ) | ||||||||||||
| Total partners’ equity |
377.7 | 131.9 | 245.3 | (377.2 | ) | 377.7 | ||||||||||||||
| Noncontrolling interests |
— | — | 227.7 | — | 227.7 | |||||||||||||||
| Total equity |
377.7 | 131.9 | 473.0 | (377.2 | ) | 605.4 | ||||||||||||||
| Total liabilities and equity |
$ | 377.7 | $ | 777.6 | $ | 1,470.0 | $ | (1,143.8 | ) | $ | 1,481.5 | |||||||||
153
Table of Contents
DCP MIDSTREAM PARTNERS, LP
NOTES TO CONSOLIDATED FINANCIAL STATEMENTS
Years Ended December 31, 2010, 2009 and 2008 — (Continued)
| Condensed Consolidating Statements of Operations Year Ended December 31, 2010 |
||||||||||||||||||||
| Parent Guarantor |
Subsidiary Issuer |
Non- Guarantor Subsidiaries |
Consolidating Adjustments |
Consolidated | ||||||||||||||||
| (Millions) | ||||||||||||||||||||
| Operating revenues: |
||||||||||||||||||||
| Sales of natural gas, propane, NGLs and condensate |
$ | — | $ | — | $ | 1,162.7 | $ | — | $ | 1,162.7 | ||||||||||
| Transportation, processing and other |
— | — | 115.3 | — | 115.3 | |||||||||||||||
| Losses from commodity derivative activity, net |
— | — | (8.5 | ) | — | (8.5 | ) | |||||||||||||
| Total operating revenues |
— | — | 1,269.5 | — | 1,269.5 | |||||||||||||||
| Operating costs and expenses: |
||||||||||||||||||||
| Purchases of natural gas, propane and NGLs |
— | — | 1,032.6 | — | 1,032.6 | |||||||||||||||
| Operating and maintenance expense |
— | — | 79.8 | — | 79.8 | |||||||||||||||
| Depreciation and amortization expense |
— | — | 73.7 | — | 73.7 | |||||||||||||||
| General and administrative expense |
— | 0.2 | 33.5 | — | 33.7 | |||||||||||||||
| Step acquisition — equity interest re-measurement gain |
— | — | (9.1 | ) | — | (9.1 | ) | |||||||||||||
| Other, net |
— | — | (4.0 | ) | — | (4.0 | ) | |||||||||||||
| Total operating costs and expenses |
— | 0.2 | 1,206.5 | — | 1,206.7 | |||||||||||||||
| Operating (loss) income |
— | (0.2 | ) | 63.0 | — | 62.8 | ||||||||||||||
| Interest expense, net |
— | (28.8 | ) | (0.3 | ) | — | (29.1 | ) | ||||||||||||
| Earnings from unconsolidated affiliates |
— | 23.8 | — | 23.8 | ||||||||||||||||
| Earnings (losses) from consolidated subsidiaries |
48.0 | 77.0 | — | (125.0 | ) | — | ||||||||||||||
| Income (loss) before income taxes |
48.0 | 48.0 | 86.5 | (125.0 | ) | 57.5 | ||||||||||||||
| Income tax expense |
— | — | (0.3 | ) | — | (0.3 | ) | |||||||||||||
| Net income (loss) |
48.0 | 48.0 | 86.2 | (125.0 | ) | 57.2 | ||||||||||||||
| Net income attributable to noncontrolling interests |
— | — | (9.2 | ) | — | (9.2 | ) | |||||||||||||
| Net income (loss) attributable to partners |
$ | 48.0 | $ | 48.0 | $ | 77.0 | $ | (125.0 | ) | $ | 48.0 | |||||||||
154
Table of Contents
DCP MIDSTREAM PARTNERS, LP
NOTES TO CONSOLIDATED FINANCIAL STATEMENTS
Years Ended December 31, 2010, 2009 and 2008 — (Continued)
| Condensed Consolidating Statements of Operations Year Ended December 31, 2009 |
||||||||||||||||||||
| Parent Guarantor |
Subsidiary Issuer |
Non- Guarantor Subsidiaries |
Consolidating Adjustments |
Consolidated | ||||||||||||||||
| (Millions) | ||||||||||||||||||||
| Operating revenues: |
||||||||||||||||||||
| Sales of natural gas, propane, NGLs and condensate |
$ | — | $ | — | $ | 913.0 | $ | — | $ | 913.0 | ||||||||||
| Transportation, processing and other |
— | — | 95.2 | — | 95.2 | |||||||||||||||
| Losses from commodity derivative activity, net |
— | — | (65.8 | ) | — | (65.8 | ) | |||||||||||||
| Total operating revenues |
— | — | 942.4 | — | 942.4 | |||||||||||||||
| Operating costs and expenses: |
||||||||||||||||||||
| Purchases of natural gas, propane and NGLs |
— | — | (776.2 | ) | — | (776.2 | ) | |||||||||||||
| Operating and maintenance expense |
— | — | (69.7 | ) | — | (69.7 | ) | |||||||||||||
| Depreciation and amortization expense |
— | — | (64.9 | ) | — | (64.9 | ) | |||||||||||||
| General and administrative expense |
— | (0.1 | ) | (32.2 | ) | — | (32.3 | ) | ||||||||||||
| Total operating costs and expenses |
— | (0.1 | ) | (943.0 | ) | — | (943.1 | ) | ||||||||||||
| Operating loss |
— | (0.1 | ) | (0.6 | ) | — | (0.7 | ) | ||||||||||||
| Interest expense, net |
— | (27.8 | ) | (0.2 | ) | — | (28.0 | ) | ||||||||||||
| Earnings from unconsolidated affiliates |
— | — | 18.5 | — | 18.5 | |||||||||||||||
| (Losses) Earnings from consolidated subsidiaries |
(19.1 | ) | 8.8 | — | 10.3 | — | ||||||||||||||
| (Loss) income before income taxes |
(19.1 | ) | (19.1 | ) | 17.7 | 10.3 | (10.2 | ) | ||||||||||||
| Income tax expense |
— | — | (0.6 | ) | — | (0.6 | ) | |||||||||||||
| Net (loss) income |
(19.1 | ) | (19.1 | ) | 17.1 | 10.3 | (10.8 | ) | ||||||||||||
| Net income attributable to noncontrolling interests |
— | — | (8.3 | ) | — | (8.3 | ) | |||||||||||||
| Net (loss) income attributable to partners |
$ | (19.1 | ) | $ | (19.1 | ) | $ | 8.8 | $ | 10.3 | $ | (19.1 | ) | |||||||
155
Table of Contents
DCP MIDSTREAM PARTNERS, LP
NOTES TO CONSOLIDATED FINANCIAL STATEMENTS
Years Ended December 31, 2010, 2009 and 2008 — (Continued)
| Condensed Consolidating Statements of Operations Year Ended December 31, 2008 |
||||||||||||||||||||
| Parent Guarantor |
Subsidiary Issuer |
Non- Guarantor Subsidiaries |
Consolidating Adjustments |
Consolidated | ||||||||||||||||
| (Millions) | ||||||||||||||||||||
| Operating revenues: |
||||||||||||||||||||
| Sales of natural gas, propane, NGLs and condensate |
$ | — | $ | — | $ | 1,672.7 | $ | — | $ | 1,672.7 | ||||||||||
| Transportation, processing and other |
— | — | 86.1 | — | 86.1 | |||||||||||||||
| Gains from commodity derivative activity, net |
— | — | 71.7 | — | 71.7 | |||||||||||||||
| Total operating revenues |
— | — | 1,830.5 | — | 1,830.5 | |||||||||||||||
| Operating costs and expenses: |
||||||||||||||||||||
| Purchases of natural gas, propane and NGLs |
— | — | (1,481.0 | ) | — | (1,481.0 | ) | |||||||||||||
| Operating and maintenance expense |
— | — | (77.4 | ) | — | (77.4 | ) | |||||||||||||
| Depreciation and amortization expense |
— | — | (53.2 | ) | — | (53.2 | ) | |||||||||||||
| General and administrative expense |
— | (0.1 | ) | (33.2 | ) | — | (33.3 | ) | ||||||||||||
| Other, net |
— | — | 1.5 | — | 1.5 | |||||||||||||||
| Total operating costs and expenses |
— | (0.1 | ) | (1,643.3 | ) | — | (1,643.4 | ) | ||||||||||||
| Operating (loss) income |
— | (0.1 | ) | 187.2 | — | 187.1 | ||||||||||||||
| Interest (expense) income, net |
— | (27.1 | ) | 0.4 | — | (26.7 | ) | |||||||||||||
| Earnings from unconsolidated affiliates |
— | — | 18.2 | — | 18.2 | |||||||||||||||
| Earnings from consolidated subsidiaries |
141.9 | 169.1 | — | (311.0 | ) | — | ||||||||||||||
| Income before income taxes |
141.9 | 141.9 | 205.8 | (311.0 | ) | 178.6 | ||||||||||||||
| Income tax expense |
— | — | (0.6 | ) | — | (0.6 | ) | |||||||||||||
| Net income |
141.9 | 141.9 | 205.2 | (311.0 | ) | 178.0 | ||||||||||||||
| Net income attributable to noncontrolling interests |
— | — | (36.1 | ) | — | (36.1 | ) | |||||||||||||
| Net income attributable to partners |
$ | 141.9 | $ | 141.9 | $ | 169.1 | $ | (311.0 | ) | $ | 141.9 | |||||||||
156
Table of Contents
DCP MIDSTREAM PARTNERS, LP
NOTES TO CONSOLIDATED FINANCIAL STATEMENTS
Years Ended December 31, 2010, 2009 and 2008 — (Continued)
| Condensed Consolidating Statements of Cash Flows Year Ended December 31, 2010 |
||||||||||||||||||||
| Parent Guarantor |
Subsidiary Issuer |
Non- Guarantor Subsidiaries |
Consolidating Adjustments |
Consolidated | ||||||||||||||||
| (Millions) | ||||||||||||||||||||
| OPERATING ACTIVITIES |
||||||||||||||||||||
| Net cash (used in) provided by operating activities |
$ | (87.4 | ) | $ | (42.9 | ) | $ | 271.8 | $ | (0.7 | ) | $ | 140.8 | |||||||
| INVESTING ACTIVITIES: |
||||||||||||||||||||
| Capital expenditures |
— | — | (50.7 | ) | — | (50.7 | ) | |||||||||||||
| Acquisitions, net of cash acquired |
— | — | (203.3 | ) | — | (203.3 | ) | |||||||||||||
| Investments in unconsolidated affiliates |
— | — | (2.3 | ) | — | (2.3 | ) | |||||||||||||
| Return of investment from unconsolidated affiliate |
— | — | 1.2 | — | 1.2 | |||||||||||||||
| Proceeds from sale of assets |
— | — | 3.4 | — | 3.4 | |||||||||||||||
| Purchase of available-for-sale securities |
— | — | — | — | — | |||||||||||||||
| Proceeds from sales of available-for-sale securities |
— | 10.1 | — | — | 10.1 | |||||||||||||||
| Net cash provided by (used in) investing activities |
— | 10.1 | (251.7 | ) | — | (241.6 | ) | |||||||||||||
| FINANCING ACTIVITIES: |
||||||||||||||||||||
| Proceeds from debt |
— | 868.2 | — | — | 868.2 | |||||||||||||||
| Payments of debt |
— | (833.4 | ) | — | — | (833.4 | ) | |||||||||||||
| Payment of deferred financing costs |
— | (2.1 | ) | — | — | (2.1 | ) | |||||||||||||
| Proceeds from issuance of common units, net of offering costs |
189.3 | — | — | — | 189.3 | |||||||||||||||
| Purchase of additional interest in a subsidiary |
— | — | (3.5 | ) | — | (3.5 | ) | |||||||||||||
| Distributions to unitholders and general partner |
(101.9 | ) | — | — | — | (101.9 | ) | |||||||||||||
| Distributions to noncontrolling interests |
— | — | (25.6 | ) | — | (25.6 | ) | |||||||||||||
| Contributions from noncontrolling interests |
— | — | 13.8 | — | 13.8 | |||||||||||||||
| Contributions from DCP Midstream, LLC |
— | — | 0.6 | — | 0.6 | |||||||||||||||
| Net cash provided by (used in) financing activities |
87.4 | 32.7 | (14.7 | ) | — | (105.4 | ) | |||||||||||||
| Net change in cash and cash equivalents |
— | (0.1 | ) | 5.4 | (0.7 | ) | 4.6 | |||||||||||||
| Cash and cash equivalents, beginning of period |
— | 1.6 | 1.3 | (0.8 | ) | 2.1 | ||||||||||||||
| Cash and cash equivalents, end of period |
$ | — | $ | 1.5 | $ | 6.7 | $ | (1.5 | ) | $ | 6.7 | |||||||||
157
Table of Contents
DCP MIDSTREAM PARTNERS, LP
NOTES TO CONSOLIDATED FINANCIAL STATEMENTS
Years Ended December 31, 2010, 2009 and 2008 — (Continued)
| Condensed Consolidating Statements of Cash Flows Year Ended December 31, 2009 |
||||||||||||||||||||
| Parent Guarantor |
Subsidiary Issuer |
Non- Guarantor Subsidiaries |
Consolidating Adjustments |
Consolidated | ||||||||||||||||
| (Millions) | ||||||||||||||||||||
| OPERATING ACTIVITIES |
||||||||||||||||||||
| Net cash provided by (used in) operating activities |
$ | 15.8 | $ | (31.5 | ) | $ | 124.1 | $ | (0.5 | ) | $ | 107.9 | ||||||||
| INVESTING ACTIVITIES: |
||||||||||||||||||||
| Capital expenditures |
— | — | (164.8 | ) | — | (164.8 | ) | |||||||||||||
| Acquisitions, net of cash acquired |
— | — | (44.5 | ) | — | (44.5 | ) | |||||||||||||
| Investments in unconsolidated affiliates |
— | — | (7.0 | ) | — | (7.0 | ) | |||||||||||||
| Return of investment from unconsolidated affiliate |
2.2 | — | 2.2 | |||||||||||||||||
| Proceeds from sale of assets |
— | — | 0.3 | — | 0.3 | |||||||||||||||
| Purchase of available-for-sale securities |
— | (1.1 | ) | — | — | (1.1 | ) | |||||||||||||
| Proceeds from sales of available-for-sale securities |
— | 51.1 | — | — | 51.1 | |||||||||||||||
| Net cash provided by (used in) investing activities |
— | 50.0 | (213.8 | ) | — | (163.8 | ) | |||||||||||||
| FINANCING ACTIVITIES: |
||||||||||||||||||||
| Proceeds from debt |
— | 237.0 | — | — | 237.0 | |||||||||||||||
| Payments of debt |
— | (280.5 | ) | — | — | (280.5 | ) | |||||||||||||
| Proceeds from issuance of common units, net of offering costs |
69.5 | — | — | — | 69.5 | |||||||||||||||
| Net change in advances to predecessor from DCP Midstream, LLC |
— | — | 3.0 | — | 3.0 | |||||||||||||||
| Distributions to unitholders and general partner |
(85.3 | ) | — | — | — | (85.3 | ) | |||||||||||||
| Distributions to noncontrolling interests |
— | — | (27.0 | ) | — | (27.0 | ) | |||||||||||||
| Contributions from noncontrolling interests |
— | — | 78.7 | — | 78.7 | |||||||||||||||
| Contributions from DCP Midstream, LLC |
— | — | 0.7 | — | 0.7 | |||||||||||||||
| Net cash (used in) provided by financing activities |
(15.8 | ) | (43.5 | ) | 55.4 | — | (3.9 | ) | ||||||||||||
| Net change in cash and cash equivalents |
— | (25.0 | ) | (34.3 | ) | (0.5 | ) | (59.8 | ) | |||||||||||
| Cash and cash equivalents, beginning of period |
— | 26.6 | 35.6 | (0.3 | ) | 61.9 | ||||||||||||||
| Cash and cash equivalents, end of period |
$ | — | $ | 1.6 | $ | 1.3 | $ | (0.8 | ) | $ | 2.1 | |||||||||
158
Table of Contents
DCP MIDSTREAM PARTNERS, LP
NOTES TO CONSOLIDATED FINANCIAL STATEMENTS
Years Ended December 31, 2010, 2009 and 2008 — (Continued)
| Condensed Consolidating Statements of Cash Flows Year Ended December 31, 2008 |
||||||||||||||||||||
| Parent Guarantor |
Subsidiary Issuer |
Non- Guarantor Subsidiaries |
Consolidating Adjustments |
Consolidated | ||||||||||||||||
| (Millions) | ||||||||||||||||||||
| OPERATING ACTIVITIES |
||||||||||||||||||||
| Net cash (used in) provided by operating activities |
$ | (56.4 | ) | $ | (52.8 | ) | $ | 285.5 | $ | 1.3 | $ | 177.6 | ||||||||
| INVESTING ACTIVITIES: |
||||||||||||||||||||
| Capital expenditures |
— | — | (72.7 | ) | — | (72.7 | ) | |||||||||||||
| Acquisitions, net of cash acquired |
— | — | (157.3 | ) | — | (157.3 | ) | |||||||||||||
| Investments in unconsolidated affiliates |
— | — | (7.4 | ) | — | (7.4 | ) | |||||||||||||
| Proceeds from sale of assets |
— | — | 2.9 | — | 2.9 | |||||||||||||||
| Purchase of available-for-sale securities |
— | (608.2 | ) | — | — | (608.2 | ) | |||||||||||||
| Proceeds from sales of available-for-sale securities |
— | 650.5 | — | — | 650.5 | |||||||||||||||
| Net cash provided by (used in) investing activities |
— | 42.3 | (234.5 | ) | — | (192.2 | ) | |||||||||||||
| FINANCING ACTIVITIES: |
||||||||||||||||||||
| Proceeds from debt |
— | 660.4 | — | — | 660.4 | |||||||||||||||
| Payments of debt |
— | (633.9 | ) | — | — | (633.9 | ) | |||||||||||||
| Proceeds from issuance of common units, net of offering costs |
132.1 | — | — | — | 132.1 | |||||||||||||||
| Net change in advances to predecessor from DCP Midstream, LLC |
— | — | (14.2 | ) | — | (14.2 | ) | |||||||||||||
| Distributions to unitholders and general partner |
(75.7 | ) | — | (0.5 | ) | — | (76.2 | ) | ||||||||||||
| Distributions to noncontrolling interests |
— | — | (46.4 | ) | — | (46.4 | ) | |||||||||||||
| Contributions from noncontrolling interests |
— | — | 21.3 | — | 21.3 | |||||||||||||||
| Contributions from DCP Midstream, LLC |
— | — | 4.1 | — | 4.1 | |||||||||||||||
| Net cash provided by (used in) financing activities |
56.4 | 26.5 | (35.7 | ) | — | 47.2 | ||||||||||||||
| Net change in cash and cash equivalents |
— | 16.0 | 15.3 | 1.3 | 32.6 | |||||||||||||||
| Cash and cash equivalents, beginning of period |
— | 10.6 | 20.3 | (1.6 | ) | 29.3 | ||||||||||||||
| Cash and cash equivalents, end of period |
$ | — | $ | 26.6 | $ | 35.6 | $ | (0.3 | ) | $ | 61.9 | |||||||||
159
Table of Contents
DCP MIDSTREAM PARTNERS, LP
NOTES TO CONSOLIDATED FINANCIAL STATEMENTS
Years Ended December 31, 2010, 2009 and 2008 — (Continued)
| 22. | Valuation and Qualifying Accounts and Reserves |
Our valuation and qualifying accounts and reserves for the years ended December 31, 2010, 2009 and 2008 are as follows:
| Balance at Beginning of Period |
Charged to Consolidated Statements of Operations |
Charged to Other Accounts |
Deductions/ Other |
Balance at End of Period |
||||||||||||||||
| (Millions) | ||||||||||||||||||||
| December 31, 2010 |
||||||||||||||||||||
| Allowance for doubtful accounts |
$ | 0.5 | $ | — | $ | — | $ | — | $ | 0.5 | ||||||||||
| Environmental |
1.1 | 1.0 | — | (0.2 | ) | 1.9 | ||||||||||||||
| Litigation |
2.4 | 0.3 | — | (2.5 | ) | 0.2 | ||||||||||||||
| Other (a) |
0.1 | — | 1.0 | (1.1 | ) | — | ||||||||||||||
| $ | 4.1 | $ | 1.3 | $ | 1.0 | $ | (3.8 | ) | $ | 2.6 | ||||||||||
| December 31, 2009 |
||||||||||||||||||||
| Allowance for doubtful accounts |
$ | 1.0 | $ | — | $ | — | $ | (0.5 | ) | $ | 0.5 | |||||||||
| Environmental |
1.9 | — | — | (0.8 | ) | 1.1 | ||||||||||||||
| Litigation |
2.5 | — | — | (0.1 | ) | 2.4 | ||||||||||||||
| Other (a) |
0.1 | — | — | — | 0.1 | |||||||||||||||
| $ | 5.5 | $ | — | $ | — | $ | (1.4 | ) | $ | 4.1 | ||||||||||
| December 31, 2008 |
||||||||||||||||||||
| Allowance for doubtful accounts |
$ | 1.7 | $ | — | $ | — | $ | (0.7 | ) | $ | 1.0 | |||||||||
| Environmental |
1.8 | 0.5 | — | (0.4 | ) | 1.9 | ||||||||||||||
| Litigation |
— | 2.5 | — | — | 2.5 | |||||||||||||||
| Other (a) |
— | — | — | 0.1 | 0.1 | |||||||||||||||
| $ | 3.5 | $ | 3.0 | $ | — | $ | (1.0 | ) | $ | 5.5 | ||||||||||
| (a) | Principally consists of other contingency liabilities, which are included in other current liabilities, and the recognition and re-measurement of the fair value of contingent consideration. |
| 23. | Subsequent Events |
On January 27, 2011, the board of directors of the general partner declared a quarterly distribution of $0.6175 per unit, payable on February 14, 2011 to unitholders of record on February 7, 2011.
On January 13, 2011, we paid $7.5 million to the sellers of Michigan Pipeline & Processing, LLC, or MPP, which we purchased in October 2008, under our contingent payment agreement whereby we would pay up to an additional $15.0 million to the sellers depending on the earnings of MPP after a three-year period.
On January 1, 2011, we acquired a 33.33% interest in Southeast Texas for $150.0 million, in a transaction among entities under common control. The Southeast Texas system is a fully integrated midstream business which includes 675 miles of natural gas pipelines; three natural gas processing plants with recently increased processing capacity totaling 380 MMcf/d; and natural gas storage assets with 9 Bcf of existing storage capacity. The terms of the joint venture agreement provide that distributions to us for the first seven years related to storage and transportation gross margin will be pursuant to a fee-based arrangement, based on storage capacity and tailgate volumes. Distributions related to the gathering and processing business, along with reductions for all expenditures, will be pursuant to our and DCP Midstream, LLC’s respective ownership interests in
160
Table of Contents
DCP MIDSTREAM PARTNERS, LP
NOTES TO CONSOLIDATED FINANCIAL STATEMENTS
Years Ended December 31, 2010, 2009 and 2008 — (Continued)
Southeast Texas. The results of the Southeast Texas system will be included in our Natural Gas Services segment. Transfers of net assets between entities under common control are accounted for as if the transfer occurred at the beginning of the period, and prior years are retroactively adjusted to furnish comparative information similar to the pooling method. Accordingly, our consolidated financial statements will be adjusted to include the historical results of Southeast Texas in subsequent filings, however, the accounting for our acquisition of the interest in Southeast Texas was incomplete at the time we issued our consolidated financial statements. Given the recent timing of the acquisition, we were unable to calculate supplemental pro-forma combined information. The required disclosures will be made in a subsequent filing.
161
Table of Contents
| Item 9. | Changes in and Disagreements with Accountants on Accounting and Financial Disclosure |
There were no changes in or disagreements with accountants on accounting and financial disclosures during the year ended December 31, 2010.
| Item 9A. | Controls and Procedures |
We maintain disclosure controls and procedures that are designed to ensure that information required to be disclosed by us in the reports that we file or submit to the Securities and Exchange Commission under the Securities Exchange Act of 1934, as amended, is recorded, processed, summarized and reported within the time periods specified by the Commission’s rules and forms, and that information is accumulated and communicated to the management of our general partner, including our general partner’s principal executive and principal financial officers (whom we refer to as the Certifying Officers), as appropriate to allow timely decisions regarding required disclosure. The management of our general partner evaluated, with the participation of the Certifying Officers, the effectiveness of our disclosure controls and procedures as of December 31, 2010, pursuant to Rule 13a-15(b) under the Exchange Act. Based upon that evaluation, the Certifying Officers concluded that, as of December 31, 2010, our disclosure controls and procedures were effective. There were no changes in internal control over financial reporting (as defined in Rule 13a-15(f) under the Exchange Act) that occurred during the fourth quarter of 2010 that have materially affected, or are reasonably likely to materially affect, our internal control over financial reporting.
Management’s Annual Report On Internal Control Over Financial Reporting
Our general partner is responsible for establishing and maintaining an adequate system of internal control over financial reporting, as such term is defined in Exchange Act Rules 13a-15(f) and 15d-15(f). Our internal control system was designed to provide reasonable assurance to our management and board of directors of our general partner regarding the preparation and fair presentation of published financial statements.
All internal control systems, no matter how well designed, have inherent limitations. Therefore, internal control over financial reporting may not prevent or detect misstatements. Projections of any evaluation of effectiveness to future periods are subject to the risk that controls may become inadequate because of changes in conditions, or that the degree of compliance with policies and procedures may deteriorate.
Our management, including our Chief Executive Officer and Chief Financial Officer, has conducted an evaluation of the effectiveness of our internal control over financial reporting as of December 31, 2010 based on the framework in “Internal Control—Integrated Framework issued by the Committee of Sponsoring Organizations of the Treadway Commission.” Based on that evaluation, management concluded that our internal control over financial reporting was effective as of December 31, 2010.
Deloitte & Touche, LLP, an independent registered public accounting firm, has issued their report, included immediately following, regarding our internal control over financial reporting.
March 1, 2011
162
Table of Contents
REPORT OF INDEPENDENT REGISTERED PUBLIC ACCOUNTING FIRM
To the Board of Directors of
DCP Midstream GP, LLC
Denver, Colorado
We have audited the internal control over financial reporting of DCP Midstream Partners, LP and subsidiaries (the “Company”) as of December 31, 2010, based on criteria established in Internal Control — Integrated Framework issued by the Committee of Sponsoring Organizations of the Treadway Commission. The Company’s management is responsible for maintaining effective internal control over financial reporting and for its assessment of the effectiveness of internal control over financial reporting, included in the accompanying Management’s Annual Report on Internal Control over Financial Reporting. Our responsibility is to express an opinion on the Company’s internal control over financial reporting based on our audit.
We conducted our audit in accordance with the standards of the Public Company Accounting Oversight Board (United States). Those standards require that we plan and perform the audit to obtain reasonable assurance about whether effective internal control over financial reporting was maintained in all material respects. Our audit included obtaining an understanding of internal control over financial reporting, assessing the risk that a material weakness exists, testing and evaluating the design and operating effectiveness of internal control based on the assessed risk, and performing such other procedures as we considered necessary in the circumstances. We believe that our audit provides a reasonable basis for our opinion.
A company’s internal control over financial reporting is a process designed by, or under the supervision of, the company’s principal executive and principal financial officers, or persons performing similar functions, and effected by the company’s board of directors, management, and other personnel to provide reasonable assurance regarding the reliability of financial reporting and the preparation of financial statements for external purposes in accordance with generally accepted accounting principles. A company’s internal control over financial reporting includes those policies and procedures that (1) pertain to the maintenance of records that, in reasonable detail, accurately and fairly reflect the transactions and dispositions of the assets of the company; (2) provide reasonable assurance that transactions are recorded as necessary to permit preparation of financial statements in accordance with generally accepted accounting principles, and that receipts and expenditures of the company are being made only in accordance with authorizations of management and directors of the company; and (3) provide reasonable assurance regarding prevention or timely detection of unauthorized acquisition, use, or disposition of the company’s assets that could have a material effect on the financial statements.
Because of the inherent limitations of internal control over financial reporting, including the possibility of collusion or improper management override of controls, material misstatements due to error or fraud may not be prevented or detected on a timely basis. Also, projections of any evaluation of the effectiveness of the internal control over financial reporting to future periods are subject to the risk that the controls may become inadequate because of changes in conditions, or that the degree of compliance with the policies or procedures may deteriorate.
In our opinion, the Company maintained, in all material respects, effective internal control over financial reporting as of December 31, 2010, based on the criteria established in Internal Control — Integrated Framework issued by the Committee of Sponsoring Organizations of the Treadway Commission.
We have also audited, in accordance with the standards of the Public Company Accounting Oversight Board (United States), the consolidated financial statements as of and for the year ended December 31, 2010 of the Company and our report dated March 1, 2011 expressed an unqualified opinion on those consolidated financial statements and included an explanatory paragraph referring to the retroactive effect of the April 1, 2009 acquisition of an additional 25.1% of DCP East Texas Holdings, LLC, which was accounted for in a manner similar to a pooling of interests.
/s/ Deloitte & Touche LLP
Denver, Colorado
March 1, 2011
163
Table of Contents
| Item 9B. | Other Information |
No information was required to be disclosed in a report on Form 8-K, but not so reported, for the quarter ended December 31, 2010.
PART III
| Item 10. | Directors, Executive Officers and Corporate Governance |
Management of DCP Midstream Partners, LP
We do not have directors or officers, which is commonly the case with publicly traded partnerships. Our operations and activities are managed by our general partner, DCP Midstream GP, LP, which in turn is managed by its general partner, DCP Midstream GP, LLC, which we refer to as our General Partner. Our General Partner is wholly-owned by DCP Midstream, LLC. The officers and directors of our General Partner are responsible for managing us. All of the directors of our General Partner are elected annually by DCP Midstream, LLC and all of the officers of our General Partner serve at the discretion of the directors. Unitholders are not entitled to participate, directly or indirectly, in our management or operations.
Board of Directors and Officers
The board of directors of our General Partner that oversees our operations currently has nine members, four of whom are independent as defined under the independence standards established by the New York Stock Exchange. The New York Stock Exchange does not require a listed limited partnership like us to have a majority of independent directors on its general partner’s board of directors or to establish a compensation committee or a nominating committee. However, the board of directors of our General Partner has established an audit committee consisting of four independent members of the board, a compensation committee and a special committee to address conflict situations.
Our General Partner’s board of directors annually reviews the independence of directors and affirmatively makes a determination that each director expected to be independent has no material relationship with our General Partner, either directly or indirectly as a partner, unitholder or officer of an organization that has a relationship with our General Partner.
The executive officers of our General Partner manage the day-to-day affairs of our business and devote all of their time to our business and affairs, except Mark A. Borer, our CEO and President, who devotes more than 90% of his time to our business and affairs. We also utilize employees of DCP Midstream, LLC to operate our business and provide us with general and administrative services.
Meeting Attendance and Preparation
The board of directors met 13 times in 2010 and members of our current board of directors attended at least 75% of regular and special meetings and meetings of the committees on which they serve, either in person or telephonically, during 2010. In addition, directors are expected to be prepared for each meeting of the board by reviewing materials distributed in advance.
164
Table of Contents
Directors and Executive Officers
The following table shows information regarding the current directors and the executive officers of DCP Midstream GP, LLC. Directors are elected for one-year terms.
| Name |
Age | Position with DCP Midstream GP, LLC | ||||
| Thomas C. O’Connor |
55 | Chairman of the Board and Director | ||||
| Mark A. Borer |
56 | President, Chief Executive Officer and Director | ||||
| Angela A. Minas |
46 | Vice President and Chief Financial Officer | ||||
| Michael S. Richards |
51 | Vice President, General Counsel and Secretary | ||||
| Don Baldridge |
41 | Vice President, Business Development | ||||
| Paul F. Ferguson, Jr. |
61 | Director | ||||
| Alan N. Harris |
57 | Director | ||||
| Donald G. Hrap |
52 | Director | ||||
| John E. Lowe |
52 | Director | ||||
| Frank A. McPherson |
77 | Director | ||||
| Thomas C. Morris |
70 | Director | ||||
| Stephen R. Springer |
64 | Director | ||||
Our directors hold office for one year or until the earlier of their death, resignation, removal or disqualification or until their successors have been elected and qualified. Officers serve at the discretion of the board of directors. There are no family relationships among any of our directors or executive officers.
Thomas C. O’Connor was elected Chairman of the Board of DCP Midstream GP, LLC in September 2008, and has been a director of DCP Midstream GP, LLC since December 2007. Mr. O’Connor has over 21 years experience in the natural gas industry with Duke Energy prior to joining DCP Midstream, LLC in November 2007 as Chairman of the Board, President and CEO. Mr. O’Connor joined Duke Energy in 1987 where he served in a variety of positions in the company’s natural gas and pipeline operations units. After serving in a number of leadership positions with Duke Energy, he was named President and Chief Executive Officer of Duke Energy Gas Transmission in 2002 and he was named Group Vice President of corporate strategy at Duke Energy in 2005. In 2006 he became Group Executive and Chief Operating Officer of U.S. Franchised Electric and Gas and later in 2006 was named Group Executive and President of Commercial Businesses at Duke Energy.
Mark A. Borer was elected President and Chief Executive Officer, and director of DCP Midstream GP, LLC in November 2006. Mr. Borer was previously Group Vice President, Marketing and Corporate Development of DCP Midstream, LLC since July 2004. He previously served as Executive Vice President of Marketing and Corporate Development of DCP Midstream, LLC from May 2002 through July 2004. Mr. Borer served as Senior Vice President, Southern Division of DCP Midstream, LLC from April 1999 through May 2002. Prior to that time, Mr. Borer was Vice President of Natural Gas Marketing for Union Pacific Fuels, Inc. Mr. Borer was a director of the general partner of TEPPCO Partners, L.P. from April 2000 until his resignation in 2005.
Angela A. Minas was elected Vice President and Chief Financial Officer of DCP Midstream GP, LLC in September 2008. Ms. Minas was previously Chief Financial Officer, Chief Accounting Officer and Treasurer for Constellation Energy Partners from September 2006 through March 2008. She also served as Managing Director of the Commodities Group at Constellation Energy Group, Inc. from September 2006 through March 2008. Prior to that, Ms. Minas was Senior Vice President, Global Consulting from 2004 to 2006 for SAIC and Vice President, US Consulting from 2002 to 2003 for SAIC. Prior to that, Ms. Minas was a partner with Arthur Andersen LLP from 1997 through 2002.
Michael S. Richards was elected Vice President, General Counsel and Secretary of DCP Midstream GP, LLC in September 2005. Mr. Richards was previously Assistant General Counsel and Assistant Secretary of DCP Midstream, LLC since February 2000. He was previously Assistant General Counsel and Assistant Secretary at KN Energy, Inc. from December 1997 until he joined DCP Midstream, LLC. Prior to that, he was Senior Counsel and Risk Manager at Total Petroleum (North America) Ltd. from 1994 through 1997. Mr. Richards was previously in private practice where he focused on securities and corporate finance.
165
Table of Contents
Don Baldridge was elected Vice President, Business Development of DCP Midstream GP, LLC in January 2009. Mr. Baldridge was previously Vice President, Corporate Development of DCP Midstream, LLC since August 2008. Prior to that, he served as senior director, corporate development and other management positions with DCP Midstream, LLC since April 2005. Mr. Baldridge has more than 17 years experience in the energy industry, including commercial, trading and business development activities.
Paul F. Ferguson, Jr. was elected as a director of DCP Midstream GP, LLC in November 2005. Mr. Ferguson currently serves as Chairman of the Audit Committee of the board of directors. Mr. Ferguson was a member of the Compensation, Audit and special committees of the general partner of TEPPCO Partners, L.P. He served as Senior Vice President and Treasurer of Duke Energy from June 1997 to June 1998, when he retired. Mr. Ferguson served as Senior Vice President and Chief Financial Officer of PanEnergy Corp. from September 1995 to June 1997. He held various other financial positions with PanEnergy Corp. from 1989 to 1995 and served as Treasurer of Texas Eastern Corporation from 1988 to 1989. Mr. Ferguson was a director of the general partner of TEPPCO Partners, L.P. from October 2004 until his resignation in 2005.
Alan N. Harris was appointed as a director of DCP Midstream GP, LLC in December 2008, effective January 1, 2009. In January 2009, the board of directors appointed Mr. Harris as Chairman of the compensation committee of the board of directors. Mr. Harris currently serves as chief development and operations officer of Spectra Energy. Prior to Spectra Energy’s spin-off from Duke Energy in 2007, Mr. Harris served as group vice president and chief financial officer of Duke Energy Gas Transmission, or DEGT, from February 2004 and was named executive vice president of DEGT in December 2002. Mr. Harris, who joined the corporation in 1982, has served in a number of other senior management positions since that time.
Donald G. Hrap was appointed as a director of DCP Midstream GP, LLC in January 2011 and is currently president, Americas, for ConocoPhillips where he leads the development, operations, and services related to ConocoPhillips’ exploration and production business in the Lower 48 Region of the US and in Latin America. Before his present position at ConocoPhillips, he was president of the Lower 48 Region and prior to that, senior vice president of Western Canada Gas. Mr. Hrap joined ConocoPhillips in 2006 through the merger with Burlington Resources, serving as senior vice president of operations for Burlington Canada. Prior to that he was vice president for the North American Division at Gulf Canada Resources, where he worked for 17 years.
John E. Lowe was elected a director of DCP Midstream GP, LLC in October 2008, and is currently Assistant to the Chief Executive Officer for ConocoPhillips, representing the company in external relationships and assisting on special projects. Mr. Lowe was previously Executive Vice President, Exploration and Production, from 2007 to October 2008 and was Executive Vice President of Commercial in 2006. Prior to that, Mr. Lowe served as Executive Vice President of Planning, Strategy and Corporate Affairs from 2002 to 2006, and as Senior Vice President of Corporate Strategy and Development from 2001 to 2002.
Frank A. McPherson was elected as a director of DCP Midstream GP, LLC in December 2005. Mr. McPherson retired as Chairman and Chief Executive Officer from Kerr McGee Corporation in 1997 after a 40-year career with the company. Mr. McPherson was Chairman and Chief Executive Officer of Kerr McGee from 1983 to 1997. Prior to that he served in various capacities in management of Kerr McGee. Mr. McPherson joined Kerr McGee in 1957. Mr. McPherson served on the boards of Tri Continental Corporation, Seligman Group of Mutual Funds, ConocoPhillips, Kimberly Clark Corporation, MAPCO Inc., Bank of Oklahoma, the Federal Reserve Bank of Kansas City and the American Petroleum Institute. He also served on the boards of several non-profit organizations in Oklahoma.
Thomas C. Morris was elected as a director of DCP Midstream GP, LLC in December 2005. Mr. Morris is currently retired, having served 34 years with Phillips Petroleum Company. Mr. Morris served in various capacities with Phillips, including Vice President and Treasurer and subsequently Senior Vice President and Chief Financial Officer from 1994 until his retirement in 2001. Mr. Morris served as Vice Chairman of the board of OK Mozart, is a former member of the executive board of the American Petroleum Institute finance committee and a former member of the Business Development Council of Texas A&M University.
Stephen R. Springer was elected as a director of DCP Midstream GP, LLC in July 2007. Mr. Springer currently serves as chairman of the Special Committee of the board of Directors which addresses conflict situations. He began his career at Texas Gas Transmission Corporation, where he served in a variety of executive management positions within gas acquisitions and gas marketing. After serving as President of
166
Table of Contents
Transco Gas Marketing Company, he served as Vice President of Business Development at Williams Field Services Company and then Senior Vice President and General Manager of Williams Midstream Division, the position he held until his retirement in 2002. Mr. Springer has served on the board of directors of Atmos Energy Corporation since 2005.
Director Experience and Qualifications
Directors are appointed annually by DCP Midstream, LLC and hold office for one year or until the earlier of their death, resignation, removal or disqualification and until their successors have been elected and qualified. DCP Midstream, LLC evaluates and recommends candidates for membership on the board of directors based on criteria established thereby. When evaluating director candidates, nominees and incumbent directors, DCP Midstream, LLC has informed us that it considers, among other things, educational background, knowledge of our business and industry, professional reputation, independence, and ability to represent the best interests of our unitholders. DCP Midstream, LLC and the board of directors believe that the above-mentioned attributes, along with the leadership skills and experience in the midstream natural gas industry, provide the Partnership with a capable and knowledgeable board of directors.
Thomas C. O’Connor — We believe Mr. O’Connor is a suitable member of the board of directors, as he brings to the company over two decades of industry experience, and has significant management experience in natural gas and pipeline transmission operations.
Mark A. Borer — We believe Mr. Borer is a suitable member of the board of directors as he brings to the company extensive industry experience. In addition, because Mr. Borer has held management positions with the company or one of its subsidiaries since 1999 and because Mr. Borer has served as a director since 2006, he brings to the board of directors, valuable historical perspective of board and company operations.
Paul F. Ferguson, Jr. — We believe that Mr. Ferguson is a suitable member of the board of directors because of his extensive industry experience. Mr. Ferguson has held various financial positions with PanEnergy Corp., and the knowledge of industry accounting and financial practices he gained through such experience, coupled with his accounting background and his CPA designation, make him valuable to the board of directors’ understanding of the Partnership’s financial data and its implications to the future strategic planning of the Partnership. Mr. Ferguson also provides insight to the board of directors as to the Partnership’s financial compliance and reporting obligations. Because Mr. Ferguson has served as a director since 2005, he brings to the board of directors, valuable historical perspective of board and company operations.
Alan N. Harris — We believe that Mr. Harris is a suitable member of the board of directors because he has over 30 years of leadership experience in the natural gas industry. In additional, Mr. Harris’ prior experience as Chief Financial Officer of DEGT and his knowledge of industry accounting and financial practices are invaluable to the board of directors’ understanding of the Partnership’s financial data and its implications to the future strategic planning of the Partnership.
Donald G. Hrap — We believe that Mr. Hrap is a suitable member of the board of directors because of his extensive executive management experience within the energy industry, in particular, his experience with ConocoPhillips and Gulf Canada, spanning over twenty years. In addition, Mr. Hrap’s experience in operations with a global energy company is valuable to company operations and future strategic planning.
John E. Lowe — We believe that Mr. Lowe is a suitable member of the board of directors because of his extensive executive management and strategic planning experience in the industry. Mr. Lowe’s prior management positions with ConocoPhillips in the corporate strategy area also provide the board with valuable insight as the board of directors moves forward with its strategic planning initiatives.
Frank A. McPherson — We believe that Mr. McPherson is a suitable member of the board of directors because of his extensive industry and executive management experience, spanning over a period of 50 years. In addition, Mr. McPherson’s prior public company board experience provides the board of directors with valuable insight into corporate governance and compliance matters. Because Mr. McPherson has served as a director since 2005, he also brings to the board of directors, valuable historical perspective of board and company operations.
Thomas C. Morris — We believe that Mr. Morris is a suitable member of the board of directors because of the industry knowledge and experience gained during his 34 years of service with Phillips Petroleum Company.
167
Table of Contents
In addition, Mr. Morris’ background in finance and accounting, coupled with his previous role as Chief Financial Officer of Phillips Petroleum Company, are invaluable to the board of directors’ understanding of the Partnership’s financial data and its implications to the future strategic planning of the Partnership. Because Mr. Morris has served as a director since 2005, he also brings to the board of directors, valuable historical perspective of board and company operations.
Stephen R. Springer — We believe that Mr. Springer is a suitable member of the board of directors because of his extensive industry experience, including natural gas acquisitions, natural gas marketing, natural gas gathering and processing, NGL transportation and business development. In addition, Mr. Springer’s prior public company board experience provides the board of directors with valuable insight into public company operations, corporate governance and compliance matters.
Section 16(a) Beneficial Ownership Reporting Compliance
Section 16(a) of the Securities Exchange Act of 1934 requires DCP Midstream GP, LLC’s directors and executive officers, and persons who own more than 10% of any class of our equity securities to file with the Securities and Exchange Commission, or SEC, and the New York Stock Exchange initial reports of ownership and reports of changes in ownership of our common units and our other equity securities. Specific due dates for those reports have been established, and we are required to report herein any failure to file reports by those due dates. Directors, executive officers and greater than 10% unitholders are also required by SEC regulations to furnish us with copies of all Section 16(a) reports they file. To our knowledge, based solely on a review of the copies of reports furnished to us and written representations that no other reports were required during the fiscal year ended December 31, 2010, all Section 16(a) filing requirements applicable to such reporting persons were complied with.
Audit Committee
The board of directors of our General Partner has a standing audit committee. The audit committee is composed of four nonmanagement directors, Paul F. Ferguson, Jr. (chairman), Frank A. McPherson, Thomas C. Morris and Stephen R. Springer, each of whom is able to understand fundamental financial statements and at least one of whom has past experience in accounting or related financial management experience. The board has determined that each member of the audit committee is independent under Section 303A.02 of the New York Stock Exchange listing standards and Section 10A(m)(3) of the Securities Exchange Act of 1934, as amended. In making the independence determination, the board considered the requirements of the New York Stock Exchange and our Code of Business Ethics. Among other factors, the board considered current or previous employment with us, our auditors or their affiliates by the director or his immediate family members, ownership of our voting securities, and other material relationships with us. The audit committee has adopted a charter, which has been ratified and approved by the board of directors.
With respect to material relationships, the following relationships are not considered to be material for purposes of assessing independence: service as an officer, director, employee or trustee of, or greater than five percent beneficial ownership in (a) a supplier to the partnership if the annual sales to the partnership are less than one percent of the sales of the supplier; (b) a lender to the partnership if the total amount of the partnership’s indebtedness is less than one percent of the total consolidated assets of the lender; or (c) a charitable organization if the total amount of the partnership’s annual charitable contributions to the organization are less than three percent of that organization’s annual charitable receipts.
Mr. Ferguson has been designated by the board as the audit committee’s financial expert meeting the requirements promulgated by the SEC and set forth in Item 407(d) of Regulation S-K of the Securities Exchange Act of 1934 based upon his education and employment experience as more fully detailed in Mr. Ferguson’s biography set forth above.
Special Committee
The board of directors of our General Partner has a standing special committee, which is comprised of four nonmanagement directors, Stephen R. Springer (chairman), Paul F. Ferguson, Jr., Frank A. McPherson and Thomas C. Morris. The special committee will review specific matters that the board believes may involve
168
Table of Contents
conflicts of interest. The special committee will determine if the resolution of the conflict of interest is fair and reasonable to us, or on grounds no less favorable to us than generally available from unrelated third parties. The special committee meets at each quarterly meeting of the Board of Directors. The members of the special committee may not be officers or employees of our General Partner or directors, officers or employees of its affiliates. Each of the members of the special committee meet the independence and experience standards established by the New York Stock Exchange and the Securities Exchange Act of 1934, as amended. Any matters approved by the special committee will be conclusively deemed to be fair and reasonable to us, approved by all of our partners, and not a breach by our General Partner of any duties it may owe us or our unitholders.
Compensation Committee
The board of directors of our General Partner has a standing compensation committee, which is composed of four directors, Alan N. Harris (chairman), John E. Lowe, Frank A. McPherson and Thomas C. O’Connor. The compensation committee oversees compensation decisions for the officers of our general partner and administers the long-term incentive plan, selecting individuals to be granted equity-based awards from among those eligible to participate. The compensation committee has adopted a charter, which has been ratified and approved by the board of directors.
Corporate Governance Guidelines and Code of Business Ethics
Our board of directors has adopted Corporate Governance Guidelines that outline the important policies and practices regarding our governance.
We have adopted a Code of Business Ethics applicable to the persons serving as our directors, officers (including without limitation, the chief executive officer, chief financial officer and principal accounting officer) and employees, which includes the prompt disclosure to the SEC of a current report on Form 8-K of any waiver of the code for executive officers or directors approved by the board of directors.
Copies of our Corporate Governance Guidelines, our Code of Business Ethics, our Audit Committee Charter and our Compensation Committee Charter are available on our website at www.dcppartners.com. Copies of these items are also available free of charge in print to any unitholder who sends a request to the office of the Secretary of DCP Midstream Partners, LP at 370 17th Street, Suite 2775, Denver, Colorado 80202.
Meeting of Non-Management Directors and Communications with Directors
At each quarterly meeting of the special committee, the committee, which consists of all of our independent directors, meets in an executive session without management participation or participation by non-independent directors. The chairman of the special committee, Stephen R. Springer, presides over these executive sessions. In addition, at each quarterly meeting of the board of directors, the non-management members of the board meet in executive session. The chairman of the board of directors, Thomas C. O’Connor, presides over these executive sessions.
Unitholders or interested parties may communicate with any and all members of our board, including our non-management directors, or any committee of our board, by transmitting correspondence by mail or facsimile addressed to one or more directors by name or to the chairman of the board or any committee of the board at the following address and fax number: Name of the Director(s), c/o Secretary, DCP Midstream Partners, LP, 370 17th Street, Suite 2775, Denver, Colorado 80202, fax number (303) 633-2921.
New York Stock Exchange, or NYSE, Annual Certification
On April 1, 2010, Mark A. Borer, our Chief Executive Officer, certified to the NYSE, as required by NYSE rules, that as of April 1, 2010, he was not aware of any violation by us of the NYSE’s Corporate Governance Listing Standards.
Report of the Audit Committee
The audit committee oversees our financial reporting process on behalf of the board of directors. Management has the primary responsibility for the financial statements and the reporting process including the
169
Table of Contents
systems of internal controls. The audit committee operates under a written charter approved by the board of directors. The charter, among other things, provides that the audit committee has authority to appoint, retain and oversee the independent auditor. In this context, the audit committee:
| • | reviewed and discussed the audited financial statements in this annual report on Form 10-K with management, including a discussion of the quality, not just the acceptability, of the accounting principles, the reasonableness of significant judgments and the clarity of disclosures in the financial statements; |
| • | reviewed with Deloitte & Touche, LLP, our independent auditors, who are responsible for expressing an opinion on the conformity of those audited financial statements with generally accepted accounting principles, their judgments as to the quality and acceptability of our accounting principles and such other matters as are required to be discussed with the audit committee under generally accepted auditing standards; |
| • | received the written disclosures and the letter required by standard No. 1 of the independence standards board (independence discussions with audit committees) provided to the audit committee by Deloitte & Touche, LLP; |
| • | discussed with Deloitte & Touche, LLP its independence from management and us and considered the compatibility of the provision of nonaudit service by the independent auditors with the auditors’ independence; |
| • | discussed with Deloitte & Touche, LLP the matters required to be discussed by statement on auditing standards No. 61 (AICPA, Professional Standards, Vol. 1, AU Section 380—Communications With Audit Committees); |
| • | discussed with our internal auditors and Deloitte & Touche, LLP the overall scope and plans for their respective audits. The audit committee meets with the internal auditors and Deloitte & Touche, LLP, with and without management present, to discuss the results of their examinations, their evaluations of our internal controls and the overall quality of our financial reporting; |
| • | based on the foregoing reviews and discussions, recommended to the board of directors that the audited financial statements be included in the annual report on Form 10-K for the year ended December 31, 2010, for filing with the Securities and Exchange Commission; and |
| • | approved the selection and appointment of Deloitte & Touche, LLP to serve as our independent auditors. |
This report has been furnished by the members of the audit committee of the board of directors:
Audit Committee
Paul F. Ferguson, Jr. (Chairman)
Frank A. McPherson
Thomas C. Morris
Stephen R. Springer
The report of the audit committee in this report shall not be deemed incorporated by reference into any other filing by DCP Midstream Partners, LP under the Securities Act of 1933, as amended, or the Securities Exchange Act of 1934, except to the extent that we specifically incorporate this information by reference, and shall not otherwise be deemed filed under such acts.
| Item 11. | Executive Compensation |
Compensation Discussion and Analysis
General
As a publicly traded limited partnership, we do not have directors, officers or employees. Instead, our operations are managed by our general partner, DCP Midstream GP, LP, which in turn is managed by its general partner, DCP Midstream GP, LLC, which we refer to as our General Partner. Our General Partner is a wholly-owned subsidiary of DCP Midstream, LLC.
170
Table of Contents
As of February 18, 2011, our General Partner had four named executive officers, or NEOs, and two additional employees. All of these employees are solely dedicated to our operations and management, except our President and Chief Executive Officer, or CEO, who devotes more than 90% of his time to our operations and management. The General Partner has not entered into employment agreements with any of our executive officers. The compensation committee of our General Partner’s board of directors establishes the compensation program for these employees.
Compensation Committee Responsibilities
The compensation committee is comprised of directors of our General Partner and has four members as of February 18, 2011. The compensation committee’s responsibilities include, among other duties, the following:
| • | annually review and approve the Partnership’s goals and objectives relevant to compensation of the CEO and other NEOs; |
| • | annually evaluate the CEO’s performance in light of the Partnership’s goals and objectives, and approve the compensation levels for the CEO and other NEOs; |
| • | periodically evaluate the terms and administration of the Partnership’s short-term and long-term incentive plans to assure that they are structured and administered in a manner consistent with the Partnership’s goals and objectives; |
| • | periodically evaluate incentive compensation and equity-related plans and consider amendments if appropriate; |
| • | retain and terminate any compensation consultant to be used to assist in the evaluation of director, CEO or other NEO compensation; and |
| • | perform other duties as deemed appropriate by the General Partner’s board of directors. |
Compensation Philosophy
Our compensation program is structured to provide the following benefits:
| • | attract, retain and reward talented executive officers and key management employees by providing total compensation competitive with that of other executive officers and key management employees employed by publicly traded limited partnerships of similar size or in similar lines of business; |
| • | motivate executive officers and key management employees to achieve strong financial and operational performance; |
| • | emphasize performance-based compensation, balancing short-term and long-term results; |
| • | reward individual performance; and |
| • | encourage a long-term commitment to the Partnership by requiring target levels of unit ownership. |
Methodology — Advisors and Peer Companies
The compensation committee reviews data from market surveys provided by independent consultants to assess the competitive position with respect to base salary, annual short-term incentives and long-term incentive compensation. With respect to NEO compensation, the compensation committee also considers individual performance, levels of responsibility, skills and experience. In 2010 we engaged the services of BDO Seidman, LLP, or BDO, a compensation consultant, to conduct a study to assist us in establishing overall compensation packages for our NEOs. We consider BDO to be independent of the Partnership and therefore the work performed by BDO does not create a conflict of interest. The BDO study was based on compensation as reported in the annual reports on Form 10-K for a group of peer companies with a similar tax status, and the 2010 Towers Watson General Industry Executive Compensation Database, or the Towers Watson database.
171
Table of Contents
The study was comprised of the following peer companies:
| Atlas Pipeline Partners, L.P. | Magellan Midstream Partners, L.P. | |
| Boardwalk Pipeline Partners, LP | MarkWest Energy Partners, L.P. | |
| Buckeye Partners, L.P. | NuStar Energy L.P. | |
| Copano Energy, L.L.C. | ONEOK Partners, L.P. | |
| Crosstex Energy, L.P. | Penn Virginia Resource Partners, L.P. | |
| Eagle Rock Energy Partners, L.P. | Plains All American Pipeline, L.P. | |
| El Paso Pipeline Partners, L.P. | Regency Energy Partners LP | |
| Enbridge Energy Partners, L.P. | Spectra Energy Partners, LP | |
| Enterprise Products Partners L.P. | Sunoco Logistics Partners L.P. | |
| Genesis Energy, L.P. | Targa Resources Partners LP | |
| Inergy, L.P. | Western Gas Partners, LP | |
| Kinder Morgan Energy Partners, L.P. | Williams Partners L.P. |
Studies such as this generally include only the most highly compensated officers of each company, which correlates with our NEOs. The results of this study, as well as other factors such as our targeted performance objectives, served as a benchmark for establishing our total direct compensation packages. In order to assess the competitiveness of the total direct compensation packages for our NEOs we used the median amount for peer positions from the BDO study and the data point that represents the 50th percentile of the market in the Towers Watson database.
Components of Compensation
The total annual direct compensation program for executives of the General Partner consists of three components: (1) base salary; (2) an annual short-term cash incentive, or STI, which is based on a percentage of annual base salary; and (3) the present value of an equity-based grant under our long-term incentive plan, or LTIP, which is based on a percentage of annual base salary. Under our compensation structure, the allocation between base salary, STI and LTIP varies depending upon job title and responsibility levels. In 2010, this allocation for targeted compensation of our NEOs was as follows:
| Base Salary |
Targeted STI Level |
Targeted LTIP Level |
||||||||||
| CEO |
34 | % | 21 | % | 45 | % | ||||||
| Chief Financial Officer, or CFO |
44 | % | 20 | % | 36 | % | ||||||
| Vice President, General Counsel & Secretary |
44 | % | 20 | % | 36 | % | ||||||
| Vice President, Chief Development Officer |
53 | % | 18 | % | 29 | % | ||||||
In allocating compensation among these components, we believe a significant portion of the compensation of our executive officers should be performance-based since these individuals have a greater opportunity to influence our performance. In making this allocation, we have relied in part on the BDO study of the companies named above. Each component of compensation is further described below.
Base Salary — Base salaries for executives are determined based upon job responsibilities, level of experience, individual performance, and comparisons to the salaries of executives in similar positions obtained from the BDO study. The goal of the base salary component is to compensate executives at a level that approximates the median salaries of individuals in comparable positions at comparably sized companies in our industry.
The base salaries for executives are generally reevaluated annually as part of our performance review process, or when there is a change in the level of job responsibility. Our board of directors annually considers and approves a merit increase in base salary based upon the results of this performance review process. Merit increases are based on review of performance in certain categories, including: business values, safety, health and environment, leadership, operational results, project results, attitude, ability and knowledge. Our board of directors approved increases in NEO base salary for 2010 ranging from 3.0% to 3.2%. The base salaries paid to our NEOs are set forth in the “Summary Compensation” table below.
Annual Short-Term Cash Incentive, or STI — Under the STI, annual cash incentives are provided to executives to promote the achievement of our performance objectives. Target incentive opportunities for
172
Table of Contents
executives under the STI are established as a percentage of base salary. Incentive amounts are intended to provide total cash compensation at the market median for executive officers in comparable positions and markets when target performance is achieved, below the market median when performance is less than target and above the market median when performance exceeds target. The BDO study was used to determine the competitiveness of the incentive opportunity for comparable positions. STI payments are generally paid in cash in March of each year for the prior fiscal year’s performance.
In 2010, the STI objectives were initially designed and proposed by the executive officers, working with the Chairman of the General Partner’s board of directors, with objectives that are both Partnership-oriented and individually-oriented. These objectives are intended to promote the achievement of performance objectives of the Partnership. Historically, the Partnership objectives account for 75% of the award and the personal objectives account for 25% of the award. Personal objectives typically change each year and focus on specific objectives to be targeted by each NEO for that particular calendar year. The NEOs are involved in developing these objectives because they best understand the immediate objectives required for the Partnership’s success. Nevertheless, all proposed objectives are first reviewed and revised by the Chairman of the Board for the CEO and by the CEO for the other NEOs. The CEO’s objectives are subsequently reviewed and approved by the compensation committee and ultimately by the General Partner’s board of directors. In 2010, the STI objectives approved by the compensation committee and the General Partner’s board of directors were divided as follows: (1) Partnership objectives accounted for 75% of the STI and (2) personal objectives accounted for 25% of the STI. All STI objectives are subject to change each year. The target incentive opportunities for 2010 as a percentage of base salary were as follows:
| 2010 Targeted STI Opportunity |
||||
| CEO |
60 | % | ||
| CFO |
45 | % | ||
| Vice President, General Counsel & Secretary |
45 | % | ||
| Vice President, Chief Development Officer |
35 | % | ||
For 2010 there were four stated Partnership objectives under the STI which accounted for 75% of the total STI. The stated Partnership objectives for each NEO are described below and were weighted as indicated for each NEOs:
2010 Target STI Payment Opportunity for Partnership Objectives
| STI Partnership Objectives |
Mr. Borer | Ms. Minas | Mr. Richards | Mr. Baldridge | ||||||||||||
| 1) Distributable Cash Flow Per Unit |
45 | % | 45 | % | 45 | % | 45 | % | ||||||||
| 2) Total Shareholder Return vs. Peer Group |
25 | % | 25 | % | 25 | % | 25 | % | ||||||||
| 3) Safety |
3 | % | 3 | % | 3 | % | 3 | % | ||||||||
| 4) Environmental |
2 | % | 2 | % | 2 | % | 2 | % | ||||||||
| Percentage of Total STI |
75 | % | 75 | % | 75 | % | 75 | % | ||||||||
| 1. | Distributable Cash Flow per Unit. The achievement of our budget for distributable cash flow per unit excluding non-cash mark-to-market impacts and any one-time transactions costs. We defined distributable cash flow as net cash provided by or used in operating activities, less maintenance capital expenditures, net of reimbursable projects, plus or minus adjustments for non-cash mark-to-market of derivative instruments, proceeds from divestiture of assets, net income attributable to noncontrolling interest net of depreciation and income tax, net changes in operating assets and liabilities and other adjustments to reconcile net cash provided by or used in operating activities. As a publicly traded limited partnership, our performance is generally judged on our ability to pay cash distributions to our unitholders. We use distributable cash flow per unit because we believe it permits management to focus on the long term sustainability and development of our assets. For this Partnership objective, the target level of performance is distributable cash flow per unit of $3.28 per unit; the maximum level of performance is distributable cash flow per unit of $3.96 per unit; and the minimum level of performance is distributable cash flow per unit of $2.83 per unit. |
173
Table of Contents
| 2. | Total Shareholder Return vs. Peer Group. Maintain a competitive total shareholder return compared to the following peer group of publicly held midstream natural gas master limited partnerships: |
| Copano Energy, L.L.C. |
MarkWest Energy Partners, L.P. | |
| Crestwood Midstream Partners LP |
ONEOK Partners, L.P. | |
| Duncan Energy Partners L.P. |
Penn Virginia Resource Partners, L.P. | |
| Enbridge Energy Partners, L.P. |
Regency Energy Partners LP | |
| Enterprise Products Partners L.P. |
Targa Resources Partners LP | |
| Inergy, L.P. |
Western Gas Partners, LP |
Final results will be based upon these companies average stock exchange closing prices for the last 20 trading days of 2009 compared to the last 20 trading days of 2010. We believe that using total shareholder return as a performance measure provides incentive for the continued growth of our operating footprint and distributions to unitholders. For this Partnership objective, the target level of performance is having a total shareholder return ranking among the companies listed in our peer group in the 50th percentile; the maximum level of performance is having a total shareholder return ranking among the companies listed in our peer group in the 90th percentile; and the minimum level of performance is having a total shareholder return ranking among the companies listed in our peer group in the 30th percentile. Total shareholder return will be based on data obtained from Bloomberg and assumes that any dividends or distributions are reinvested.
| 3. | Safety Objective. A safety objective covering both our assets and the assets of DCP Midstream, LLC, the owner of our general partner and the operator or our assets, 70% of which is based on a recordable incident rate, or RIR, and 30% of which is based on preventable vehicle accidents, or PVAs. If a fatality occurs of our employee or that of our contractor on our premises, a 5% safety penalty will be assessed against the entire STI payout. For this Partnership objective, the target level of performance during the year is an RIR of 0.75 and 40 total PVAs, the maximum level of performance is an RIR of 0.50 and 30 total PVAs, and the minimum level of performance is an RIR of 1.00 and 50 total PVAs. |
| 4. | Environmental Objective. An environmental objective of non-routine air emissions, natural gas vented or flared, of both our assets and the assets of DCP Midstream, LLC. The Partnership has established certain levels of emissions that comprise the minimum, target and maximum level of performance for this objective. |
The payout on these Partnership objectives ranged from 0% if the minimum level of performance is not achieved, 50% if the minimum level of performance is achieved, 100% if the target level of performance is achieved and 200% if the maximum level of performance is achieved. When the performance level falls between these percentages, payout will be determined by straight-line interpolation.
The level of performance achieved in 2010 for each of the Partnership objectives was as follows:
| STI Partnership Objective |
Level of Performance Achieved | |
| 1) Distributable Cash Flow per Unit |
Between Minimum and Target | |
| 2) Total Shareholder Return vs. Peer Group |
Between Minimum and Target | |
| 3) Safety |
Between Target and Maximum | |
| 4) Environmental |
Between Target and Maximum |
174
Table of Contents
For 2010 the NEO’s personal objectives under the STI accounted for 25% of the total STI. The personal objectives were approved by the compensation committee and the board of directors of the General Partner for the CEO, and by the CEO for the other NEOs. There was overlap of the personal objectives between the NEOs. Each of the personal objectives for the NEOs and the weighting of each personal objective are described below:
2010 Target STI Payment Opportunity for Personal Objectives
| STI Personal Objectives |
Mr. Borer | Ms. Minas | Mr. Richards | Mr. Baldridge | ||||||||||||
| 1) Distribution Growth |
6.25 | % | 5 | % | 6.25 | % | 6.25 | % | ||||||||
| 2) Balancing Growth |
6.25 | % | — | — | 6.25 | % | ||||||||||
| 3) Enterprise Growth Plan Financing |
6.25 | % | — | — | 6.25 | % | ||||||||||
| 4) Combination of #2 and #3 |
— | 5 | % | 6.25 | % | — | ||||||||||
| 5) 2010 Business Plan |
6.25 | % | 5 | % | 6.25 | % | 6.25 | % | ||||||||
| 6) Finance Organization Development |
— | 5 | % | — | — | |||||||||||
| 7) Internal Controls |
— | 5 | % | — | — | |||||||||||
| 8) Regulatory Compliance |
— | — | 6.25 | % | — | |||||||||||
| Percentage of Total STI |
25 | % | 25 | % | 25 | % | 25 | % | ||||||||
| 1) | Distribution Growth. Take action to achieve investor expectations on distribution growth. |
| 2) | Balancing Growth. Manage and adjust financial strategies and tactics to balance growth and continued near term challenges in the fundamentals and economic environment. |
| 3) | Enterprise Growth Plan Financing. Improve the Partnership’s positioning as a funding source for enterprise growth. |
| 4) | Combination of #2 and #3. This objective is a combination of objectives 2 and 3. |
| 5) | 2010 Business Plan. Take actions to achieve 2010 business plan operating results and strategic objectives. |
| 6) | Finance Organization Development. Work with DCP Midstream, LLC finance and accounting services providers to build a sustainable and high performance service delivery model for the Partnership. |
| 7) | Internal Controls. Maintain internal controls and accounting accuracy for the Partnership. |
| 8) | Regulatory Compliance. Meet all regulatory compliance requirements. |
The payout on the individual personal objectives ranged from 0% if the minimum level of performance is not achieved, 50% if the minimum level of performance is achieved, 100% if the target level of performance is achieved and 200% if the maximum level of performance is achieved. When the performance level falls between these percentages, payout will be determined by straight-line interpolation.
Early in 2011, management prepared a report on the achievement of the Partnership objectives and the personal objectives. These results were reviewed and approved by the Compensation Committee in February 2011, including a calculation of the percentage achievement of each objective for purposes of the STI program. The total payout for the executive officers under the STI for fiscal year 2010 including both Partnership objectives and personal objectives ranged from 99.26% to 105.98% of target, with the CEO at 99.26%.
Long-Term Incentive Plan, or LTIP — The long-term incentive compensation program has the objective of providing a focus on long-term value creation and enhancing executive retention. Under our LTIP program, we issued phantom limited partner units to each NEO. Half of such phantom units are performance phantom units, or PPUs, and half are restricted phantom units, or RPUs. The PPUs will vest based upon the level of achievement of certain performance objectives over a three year performance period, or the Performance Period. The RPUs will automatically vest if the executive officer remains employed with us at the end of a three year vesting period, or the Vesting Period. We believe this program promotes retention of our executive officers, and focuses our executive officers on the goal of long-term value creation.
175
Table of Contents
For 2010, the PPUs have as a performance measurement of total shareholder return over the Performance Period relative to a peer group of 12 other similar publicly held master limited partnerships that we believe we compete with in the capital markets. The companies included in this peer group at the start of 2010 were the following:
| Copano Energy, L.L.C. |
MarkWest Energy Partners, L.P. | |
| Crestwood Midstream Partners LP |
ONEOK Partners, L.P. | |
| Duncan Energy Partners L.P. |
Penn Virginia Resource Partners, L.P. | |
| Enbridge Energy Partners, L.P. |
Regency Energy Partners LP | |
| Enterprise Products Partners L.P. |
Targa Resources Partners LP | |
| Inergy, L.P. |
Western Gas Partners, LP |
If a company originally named to the peer group is not publicly traded at the end of the Performance Period, none of its performance will be used in calculating the peer group’s total shareholder return. If there is a combination of any peer group companies during the Performance Period, the performance of the surviving entity will be used. No new companies will be added to the peer group during the Performance Period.
The RPUs awarded in 2010 will vest automatically at the end of the Vesting Period provided the executive officer remains employed with us at the end of such period.
These PPU and RPU awards were granted at the first regular meeting of the General Partner’s board of directors during the first quarter of 2010. The number of awards granted to our executive officers is set forth in the “Grants of Plan-Based Awards” table below. Award recipients also received the right to receive dividend equivalent rights, or DERs, on the number of units earned during the Vesting Period. The DERs on the PPUs will be paid in cash at the end of the Performance Period and the DERs on the RPUs will be paid quarterly in cash during the Vesting Period. The amount paid on the DERs will equal the quarterly distributions actually paid during the Performance Period and the Vesting Period on the number of PPUs or RPUs earned.
Our practice is to determine the dollar amount of long-term incentive compensation that we want to provide, and to then grant a number of PPUs and RPUs that have a fair market value equal to that amount on the date of grant, which is based on the closing price of our common units on the New York Stock Exchange on the date of grant. Target long-term incentive opportunities for executives under the plan are established as a percentage of base salary, using the BDO study data for individuals in comparable positions.
The target 2010 long-term incentive opportunities, expressed as a percentage of base salary were as follows:
| Targeted LTI Opportunity |
||||
| CEO |
130 | % | ||
| CFO |
80 | % | ||
| Vice President, General Counsel & Secretary |
80 | % | ||
| Vice President, Chief Development Officer |
55 | % | ||
For the PPUs granted in 2010, the performance measure is total shareholder return over the Performance Period relative to the peer group described above. This performance measure was initially designed and proposed by the executive officers and presented to the Chairman of the General Partner’s board of directors. These objectives were then considered and approved by the compensation committee and ultimately by the board of directors of the General Partner. The compensation committee believes utilizing total shareholder return as a performance measure provides incentive for the continued growth of our operating footprint and distributions to unitholders. We believe this performance measure provides management with appropriate incentives for our disciplined and steady growth. If our total shareholder return ranking among the companies listed in our peer group over the Performance Period is less than the 30th percentile, 0% of the PPUs will vest. If such ranking over the Performance Period is in the 30th percentile, 50% percent of the PPUs will vest. If such ranking over the Performance Period is in the 50th percentile, 100% of the PPUs will vest and if such ranking over the Performance Period is in the 90th percentile, 200% of the PPUs will vest. When total shareholder return falls between 30%, 50% and 90% percentiles, vesting will be determined by straight-line interpolation. Total shareholder return will be based on data obtained from Bloomberg and assumes that any dividends or distributions are reinvested.
176
Table of Contents
In the event that any person other than DCP Midstream, LLC and/or an affiliate thereof becomes the beneficial owner of more than 50% of the combined voting power of the General Partner’s equity interests prior to the completion of the Performance Period, the PPUs, RPUs and related DERs will (i) be replaced with equivalent units of the new enterprise if there is no change in the recipient’s job status for twelve months or (ii) fully vest if the recipient is severed or if the recipient’s job is lower in status within twelve months of the change in control.
In the event an award recipient’s employment is terminated after the first anniversary of the grant date for reasons of death, disability, early or normal retirement, or if the recipient is terminated by the General Partner for reasons other than cause, the recipient’s (i) performance units will contingently vest on a pro-rata basis for time worked over the Performance Period and final performance, measured at the end of the Performance Period, will determine the payout and (ii) time vested units will become fully vested and payable. Termination of employment for any other reason will result in the forfeiture of any unvested units.
Other Compensation — In addition, our executives are eligible to participate in other compensation programs, which include but are not limited to:
Company Matching and Retirement Contributions to Defined Contribution Plans — Our executives may elect to participate in the DCP Midstream, LP 401(k) and Retirement Plan. Under the plan, our executives may elect to defer up to 75% of their eligible compensation, or up to the limits specified by the Internal Revenue Service. We match the first 6% of eligible compensation contributed by the executive to the plan. In addition, we make retirement contributions ranging from 4% to 7% of the eligible compensation of qualifying participants to the plan, based on years of service, up to the limits specified by the Internal Revenue Service. We have no defined benefit plans.
Miscellaneous Compensation — Our executive officers are eligible to participate in a nonqualified deferred compensation program. Executive officers are allowed to defer up to 75% of their base salary, and up to 100% of their STI, LTIP or other compensation. Executive officers elect either to receive amounts contributed during specific plan years as a lump sum at a specific date, subject to Internal Revenue Service rules, or in a lump sum or annual annuity (over three to ten years) at termination.
Executive officers and other eligible employees may participate in a nonqualified, defined contribution retirement plan. Benefits earned under this plan are attributable to compensation in excess of the annual compensation limits under section 401(k) of the Internal Revenue Code. Under this plan, we make a contribution of up to 13% of eligible compensation, as defined by the plan, to the nonqualified deferred compensation program.
In addition, we provide our employees, including the executive officers, with a variety of health and welfare benefit programs. The health and welfare programs are intended to protect employees against catastrophic loss and promote well being. These programs include medical, wellness, pharmacy, dental, life insurance, and accidental death and disability. We also provide all our employees with a monthly parking pass or a pass to be used on available public transportation systems. In 2011 we eliminated certain perquisites we previously paid to our executives, which include items such as financial planning, club dues and an allowance towards annual physical exam expenses.
We are a partnership and not a corporation for U.S. federal income tax purposes, and therefore, are not subject to the executive compensation tax deductible limitations of Internal Revenue Code §162(m). Accordingly, none of the compensation paid to our named executive officers is subject to the limitation.
177
Table of Contents
Other
Unit Ownership Guidelines — To underscore the importance of linking executive and unitholder interests, the board of directors of our General Partner has adopted unit ownership guidelines for executive officers and key employees who are eligible to receive long-term incentive awards. To that extent, the board has established target equity ownership obligations for the various levels of executives, which have a five-year build term from the date the executive officer commences employment with us. Ownership is reported annually to the compensation committee. As of December 31, 2010, all of our executive officers have satisfied the unit ownership guidelines or are meeting the required progression to achieve these unit ownership guidelines. As of December 31, 2010, the unit ownership guidelines for the executive officers were as follows:
| Number of Units |
||||
| CEO |
28,000 | |||
| CFO |
10,000 | |||
| Vice Presidents |
10,000 | |||
Compensation Committee Report
The compensation committee has reviewed and discussed with management the “Compensation Discussion and Analysis” presented above. Members of management with whom the compensation committee had discussions are the Chief Executive Officer of the General Partner and the Group Vice President and Chief Administrative Officer of DCP Midstream, LLC. In addition, the compensation committee engaged the services of BDO Seidman, LLP, a compensation consultant, to conduct a study to assist us in establishing overall compensation packages for our executives. Based on this review and discussion, we recommended to the board of directors of the General Partner that the “Compensation Discussion and Analysis” referred to above be included in this annual report on Form 10-K for the year ended December 31, 2010.
Compensation Committee
Alan N. Harris (Chairman)
John E. Lowe
Frank A. McPherson
Thomas C. O’Connor
178
Table of Contents
Executive Compensation
The following table discloses the compensation of the General Partner’s principal executive officers, principal financial officer and named executive officers, or collectively, the “executive officers”:
| Name and Principal Position |
Year | Salary (c) |
LTIP Awards (d) |
Non-Equity Incentive Plan Compensation |
All Other Compensation (e) |
Total | ||||||||||||||||||
| Mark A. Borer |
2010 | $ | 382,760 | $ | 501,168 | $ | 227,943 | $ | 294,400 | $ | 1,406,271 | |||||||||||||
| President and Chief |
2009 | $ | 386,058 | $ | 486,420 | $ | 313,082 | $ | 272,010 | $ | 1,457,570 | |||||||||||||
| Executive Officer |
2008 | $ | 358,538 | $ | 474,334 | $ | 80,671 | $ | 126,851 | $ | 1,040,394 | |||||||||||||
| Angela A. Minas(a) |
2010 | $ | 241,558 | $ | 194,616 | $ | 115,200 | $ | 91,557 | $ | 642,931 | |||||||||||||
| Vice President and Chief Financial Officer |
2009 | $ | 243,269 | $ | 188,538 | $ | 150,803 | $ | 115,321 | $ | 697,931 | |||||||||||||
| 2008 | $ | 61,923 | $ | 56,546 | $ | 18,252 | $ | 49,199 | $ | 185,920 | ||||||||||||||
| Michael S. Richards |
2010 | $ | 194,144 | $ | 156,456 | $ | 90,317 | $ | 94,476 | $ | 535,393 | |||||||||||||
| Vice President, General Counsel and Secretary |
2009 | $ | 195,673 | $ | 151,756 | $ | 116,488 | $ | 104,618 | $ | 568,535 | |||||||||||||
| 2008 | $ | 181,748 | $ | 147,826 | $ | 52,343 | $ | 65,136 | $ | 447,053 | ||||||||||||||
| Don A. Baldridge(b) |
2010 | $ | 191,815 | $ | 106,212 | $ | 66,635 | $ | 60,743 | $ | 425,405 | |||||||||||||
| Vice President, Business Development |
2009 | $ | 182,077 | $ | 93,666 | $ | 90,875 | $ | 45,969 | $ | 412,587 | |||||||||||||
| (a) | Ms. Minas’ employment with the General Partner commenced effective September 8, 2008. |
| (b) | Mr. Baldridge’s employment with the General Partner commenced effective January 5, 2009. Effective February 21, 2011, Mr. Baldridge’s employment with the General Partner terminated and he commenced employment with DCP Midstream, LLC as Vice President, Natural Gas and NGL Marketing. |
| (c) | Actual salaries in 2009 were higher as a result of our bi-weekly payment methodology. Generally speaking we pay employees 26 times per year, or every two weeks. This methodology resulted in 27 pay periods in 2009. |
| (d) | The amounts in this column reflect the grant date fair value of LTIP awards in accordance with the provisions of the FASB Accounting Standards Codification, or ASC, 718 “Compensation—Stock Compensation”, or ASC 718. PPU awards are subject to performance conditions. For PPUs granted in 2010, 2009 and 2008 the performance conditions are between 0% if the minimum level of performance is not achieved to 200% if the maximum level of performance is achieved. The maximum value of the PPUs, based on the grant date fair value for Mark A. Borer was $501,168, $486,420 and $474,334 for units granted during 2010, 2009 and 2008 respectively. The maximum value of the PPUs, based on the grant date fair value for Angela A. Minas was $194,616, $188,538, and $56,546 for units granted during 2010, 2009 and 2008 respectively. The maximum value of the PPUs, based on the grant date fair value for Michael S. Richards was $156,456, $151,756 and $147,826 for units granted during 2010, 2009 and 2008 respectively. The maximum value of the PPUs, based on the grant date fair value for Don A. Baldridge was $106,212 and $93,666 for units granted during 2010 and 2009 respectively. |
| (e) | Includes DERs, company retirement and nonqualified deferred compensation program contributions by the Partnership, the value of life insurance premiums paid by the Partnership on behalf of an executive and other deminimus compensation. |
179
Table of Contents
Mark A. Borer, President and CEO
The LTIP awards are comprised of PPUs and RPUs pursuant to the LTIP. Under the 2010, 2009 and 2008 STI, Mr. Borer’s target opportunity was 60% of his annual base salary, with the possibility of earning from 0% to 120% of his annual base salary in 2010, 2009 and 2008, depending on the level of performance in each of the STI objectives.
“All Other Compensation” includes the following:
| 2010 | 2009 | 2008 | ||||||||||
| Company retirement contributions to defined contribution plans |
$ | 31,850 | $ | 31,850 | $ | 29,900 | ||||||
| Nonqualified deferred compensation program contributions |
$ | 87,592 | $ | 60,158 | $ | 50,160 | ||||||
| DERs |
$ | 171,263 | $ | 176,424 | $ | 44,947 | ||||||
| Life insurance premiums(a) |
$ | 3,695 | $ | 3,578 | $ | 1,844 | ||||||
| (a) | Paid by the Partnership on behalf of Mr. Borer. |
Angela A. Minas, Vice President and CFO
The LTIP awards are comprised of PPUs and RPUs pursuant to the LTIP. Under the 2010, 2009 and 2008 STI, Ms. Minas’ target opportunity was 45% of her annual base salary, with the possibility of earning from 0% to 90% of her annual base salary, depending on the level of performance in each of the STI objectives, which was pro rated in 2008 based upon her service period in 2008.
“All Other Compensation” includes the following:
| 2010 | 2009 | 2008 | ||||||||||
| Relocation expenses |
$ | — | $ | 37,220 | $ | 41,901 | ||||||
| Company retirement contributions to defined contribution plans |
$ | 24,500 | $ | 24,187 | $ | 5,131 | ||||||
| Nonqualified deferred compensation program contributions |
$ | 1,965 | $ | — | $ | — | ||||||
| DERs |
$ | 64,312 | $ | 53,160 | $ | 2,034 | ||||||
| Life insurance premiums(a) |
$ | 780 | $ | 754 | $ | 133 | ||||||
| (a) | Paid by the Partnership on behalf of Ms. Minas. |
Michael S. Richards, Vice President, General Counsel and Secretary
The LTIP awards are comprised of Phantom IPO Units, PPUs and RPUs pursuant to the LTIP. Under the 2010, 2009 and 2008 STI, Mr. Richards’ target opportunity was 45% of his annual base salary, with the possibility of earning from 0% to 90% of his annual base salary in 2010, 2009 and 2008, depending on the level of performance in each of the STI objectives.
“All Other Compensation” includes the following:
| 2010 | 2009 | 2008 | ||||||||||
| Company retirement contributions to defined contribution plans |
$ | 26,950 | $ | 26,246 | $ | 23,000 | ||||||
| Nonqualified deferred compensation program contributions |
$ | 13,156 | $ | 7,795 | $ | 6,550 | ||||||
| DERs |
$ | 53,434 | $ | 69,988 | $ | 35,020 | ||||||
| Life insurance premiums(a) |
$ | 936 | $ | 589 | $ | 566 | ||||||
| (a) | Paid by the Partnership on behalf of Mr. Richards. |
180
Table of Contents
Don A. Baldridge, Vice President, Business Development
The LTIP awards are comprised of PPUs and RPUs pursuant to the LTIP. Under the 2010 and 2009 STI, Mr. Baldridge’s target opportunity was 35% of his annual base salary, with the possibility of earning from 0% to 70% of his annual base salary in 2010 and 2009, depending on the level of performance in each of the STI objectives, which was pro rated in 2009 based upon his service period in 2009.
“All Other Compensation” includes the following:
| 2010 | 2009 | |||||||
| Company retirement contributions to defined contribution plans |
$ | 24,174 | $ | 23,238 | ||||
| Nonqualified deferred compensation program contributions |
$ | 5,531 | $ | — | ||||
| DERs |
$ | 30,637 | $ | 22,368 | ||||
| Life insurance premiums(a) |
$ | 401 | $ | 363 | ||||
| (a) | Paid by the Partnership on behalf of Mr. Baldridge. |
Grants of Plan-Based Awards
Following are the grants of plan-based awards during the year ended December 31, 2010 for the General Partner’s executive officers:
| Grant Date |
Estimated Future Payouts under Non-Equity Incentive Plan Awards (a) |
Estimated Future Payouts under Equity Incentive Plan Awards |
Grant Date Fair Value of LTIP Awards ($) |
|||||||||||||||||||||||||||
| Name |
Minimum ($) |
Target ($) |
Maximum ($) |
Minimum (#) |
Target (#) |
Maximum (#) |
||||||||||||||||||||||||
| Mark A. Borer |
NA | $ | 115,605 | $ | 231,210 | $ | 462,420 | — | — | — | $ | — | ||||||||||||||||||
| PPUs |
(b) | $ | — | $ | — | $ | — | 3,940 | 7,880 | 15,760 | $ | 250,584 | ||||||||||||||||||
| RPUs |
(c) | $ | — | $ | — | $ | — | 7,880 | 7,880 | 7,880 | $ | 250,584 | ||||||||||||||||||
| Angela A. Minas |
NA | $ | 54,743 | $ | 109,485 | $ | 218,970 | — | — | — | $ | — | ||||||||||||||||||
| PPUs |
(b) | $ | — | $ | — | $ | — | 1,530 | 3,060 | 6,120 | $ | 97,308 | ||||||||||||||||||
| RPUs |
(c) | $ | — | $ | — | $ | — | 3,060 | 3,060 | 3,060 | $ | 97,308 | ||||||||||||||||||
| Michael S. Richards |
NA | $ | 43,988 | $ | 87,975 | $ | 175,950 | — | — | — | $ | — | ||||||||||||||||||
| PPUs |
(b) | $ | — | $ | — | $ | — | 1,230 | 2,460 | 4,920 | $ | 78,228 | ||||||||||||||||||
| RPUs |
(c) | $ | — | $ | — | $ | — | 2,460 | 2,460 | 2,460 | $ | 78,228 | ||||||||||||||||||
| Don A. Baldridge |
NA | $ | 33,810 | $ | 67,620 | $ | 135,240 | — | — | — | $ | — | ||||||||||||||||||
| PPUs |
(b) | $ | — | $ | — | $ | — | 835 | 1,670 | 3,340 | $ | 53,106 | ||||||||||||||||||
| RPUs |
(c) | $ | — | $ | — | $ | — | 1,670 | 1,670 | 1,670 | $ | 53,106 | ||||||||||||||||||
| (a) | Amounts shown represent amounts under the STI. If minimum levels of performance are not met, then the payout for one or more of the components of the STI may be zero. |
| (b) | The number of units shown represents units awarded under the LTIP. If minimum levels of performance are not met, then the payout may be zero. |
| (c) | The number of units shown represents units awarded under the LTIP and these units vest at the end of the Vesting Period provided the individual is still employed by the Partnership. |
The PPUs awarded on March 8, 2010 will vest in their entirety on December 31, 2012 if the specified performance conditions are satisfied and the RPUs awarded on March 8, 2010 will vest in their entirety on December 31, 2012 if the executive is still employed by the Partnership.
181
Table of Contents
Outstanding Equity Awards at Fiscal Year-End
Following are the outstanding equity awards for the General Partner’s executive officers as of December 31, 2010:
| Outstanding LTIP Awards | ||||||||
| Name |
Equity Incentive Plan Awards: Unearned Units That Have Not Vested(a) |
Equity Incentive Plan Awards: Market Value of Unearned Units That Have Not Vested(b) |
||||||
| Mark A. Borer |
88,360 | $ | 3,304,664 | |||||
| Angela A. Minas |
34,260 | $ | 1,281,324 | |||||
| Michael S. Richards |
27,570 | $ | 1,031,118 | |||||
| Don A. Baldridge |
17,320 | $ | 647,768 | |||||
| (a) | PPUs awarded 3/8/2010 and 3/2/2009; units vest in their entirety over a range of 0% to 200% on 12/31/2011and 12/31/2012, respectively, if the specified performance conditions are satisfied. RPUs awarded 3/8/2010 and 3/2/2009, vest in their entirety on 12/31/2011 and 12/31/2012, respectively. To determine the market value, the calculation of the number of PPU’s granted on 3/8/2010, that are expected to vest, is based on assumed performance of 100%, as the previous fiscal year performance has exceeded threshold performance; the calculation of the number of PPU’s granted on 3/2/2009, that are expected to vest, is based on assumed performance of 200%, as the previous fiscal years’ performance has exceeded threshold performance. |
| (b) | Value calculated based on the closing price of our common units at December 31, 2010, which was $37.40. |
Options Exercises and Stock Vested
Following are the stock awards vested for the General Partner’s executive officers for the year ended December 31, 2010:
| Stock Awards | ||||||||
| Name |
Number of Shares Acquired on Vesting |
Value Realized on Vesting |
||||||
| Mark A. Borer |
6,610 | $ | 238,274 | |||||
| Angela A. Minas |
1,695 | $ | 61,101 | |||||
| Michael S. Richards |
2,060 | $ | 74,258 | |||||
| Don A. Baldridge |
— | $ | — | |||||
Nonqualified Deferred Compensation
Following is the nonqualified deferred compensation for the General Partner’s executive officers for the year ended December 31, 2010:
| Name |
Executive Contributions in Last Fiscal Year(a) |
Registrant Contributions in Last Fiscal Year(b) |
Aggregate Earnings in Last Fiscal Year(c) |
Aggregate Withdrawal/ Distributions |
Aggregate Balance at December 31, 2010 |
|||||||||||||||
| Mark A. Borer |
$ | 183,810 | $ | 87,592 | $ | 45,991 | $ | — | $ | 836,410 | ||||||||||
| Angela A. Minas |
$ | 75,401 | $ | 1,965 | $ | 4,909 | $ | — | $ | 97,756 | ||||||||||
| Michael S. Richards |
$ | 9,707 | $ | 13,156 | $ | 3,831 | $ | (15,770 | ) | $ | 57,716 | |||||||||
| Don A. Baldridge |
$ | — | $ | 5,531 | $ | 509 | $ | — | $ | 6,040 | ||||||||||
| (a) | These amounts are included in the “Summary Compensation” table for the year 2010 with the exception of $75,401 for Ms. Minas, which was included in the “Summary Compensation” table for the year 2009 as it related to deferrals of 2009 STI. |
182
Table of Contents
| (b) | These amounts are included in the “Summary Compensation” table for the year 2010. |
| (c) | The performance of executive officers non-qualified deferred compensation is linked to certain mutual funds or to the average rating of the BBB bond index at the election of the participant. |
Potential Payments upon Termination or Change in Control
As noted above the PPU’s RPUs and the related dividend equivalent rights, or DER’s, will become payable to executive officers under certain circumstance related to termination or change in control. The General Partner has not entered into any employment agreements with any of our executive officers. There are no formal severance plans in place for any employees in the event of termination of employment, or a change in control of the Partnership. When an employee terminates employment with the Partnership, they are entitled to a cash payment for the amount of unused vacation hours at the date of their termination.
The following table presents PPU’s, RPU’s and DERs payable as of December 31, 2010 under certain circumstances, following termination, or a change in control:
| Triggering Event |
PPUs | RPUs | DERs | Total | ||||||||||||
| Mark A. Borer |
||||||||||||||||
| Change of Control(a) |
$ | 1,156,404 | $ | 1,394,678 | $ | 135,714 | $ | 2,686,796 | ||||||||
| Termination(b) |
$ | 726,970 | $ | 1,110,623 | $ | 145,805 | $ | 1,983,398 | ||||||||
| Angela A. Minas |
||||||||||||||||
| Change of Control(a) |
$ | 448,431 | $ | 509,531 | $ | 52,617 | $ | 1,010,579 | ||||||||
| Termination (b) |
$ | 281,783 | $ | 399,226 | $ | 56,515 | $ | 737,524 | ||||||||
| Michael S. Richards |
||||||||||||||||
| Change of Control(a) |
$ | 360,835 | $ | 435,093 | $ | 42,345 | $ | 838,273 | ||||||||
| Termination(b) |
$ | 226,811 | $ | 346,416 | $ | 45,489 | $ | 618,716 | ||||||||
| Don A. Baldridge |
||||||||||||||||
| Change of Control(a) |
$ | 228,181 | $ | 228,181 | $ | 26,503 | $ | 482,865 | ||||||||
| Termination(b) |
$ | 139,972 | $ | 167,981 | $ | 28,077 | $ | 336,030 | ||||||||
| (a) | In the event that the recipient is severed or if the recipient’s job is lower in status within twelve months of the change of control. |
| (b) | In the event of termination for reasons of death, disability, early or normal retirement, or if the recipient is terminated by the General Partner for reasons other than cause. |
Compensation of Directors
General — Effective February 18, 2011, the board of directors of the General Partner approved a compensation package for directors who are not officers or employees of affiliates of the General Partner, or Non-Employee Directors. Members of the board who are also officers or employees of affiliates of the General Partner do not receive additional compensation for serving on the board. The board approved the payment to each Non-Employee Director of an annual compensation package containing the following: (1) a $40,000 retainer; (2) a board meeting fee of $1,250 for each board meeting attended; (3) a telephonic board and committee meeting fee of $500 for each telephonic meeting attended; and (4) an annual grant of Phantom Units that approximate $40,000 of value, awarded pursuant to the LTIP, that have a six month vesting period. The directors also receive DERs, based on the number of units awarded, which are paid in cash on a quarterly basis. The Phantom Units will be paid in units upon vesting.
Our directors will also be reimbursed for out-of-pocket expenses associated with their membership on our board of directors. Each director will be fully indemnified by us for his actions associated with being a director to the fullest extent permitted under Delaware law.
Committees — The chairman of the audit committee of the board will receive an annual retainer of $20,000 and the members of the audit committee will receive $1,500 for each audit committee meeting attended. The chairman of the special committee of the board will likewise receive an annual retainer of $20,000 and the members of the special committee will receive $1,250 for each special committee meeting attended. Finally, the Non-Employee Director members of the compensation committee will receive $1,250 for each compensation committee meeting attended.
183
Table of Contents
Following is the compensation of the General Partner’s Non-Employee Directors for the year ended December 31, 2010:
| Name |
Fees Earned | LTIP Awards(a) |
DERs | Total | ||||||||||||
| Paul F. Ferguson, Jr. |
$ | 90,750 | $ | 41,340 | $ | 1,573 | $ | 133,663 | ||||||||
| Frank A. McPherson |
$ | 72,500 | $ | 41,340 | $ | 1,573 | $ | 115,413 | ||||||||
| Thomas C. Morris |
$ | 69,250 | $ | 41,340 | $ | 1,573 | $ | 112,163 | ||||||||
| Stephen R. Springer |
$ | 90,750 | $ | 41,340 | $ | 1,573 | $ | 133,663 | ||||||||
| a) | The amounts in this column reflect the grant date fair value of LTIP awards in accordance with the provisions of ASC 718. |
Mr. Ferguson is the audit committee chair and a member of the special committee.
Mr. McPherson is a member of the audit committee, the compensation committee and the special committee.
Mr. Morris is a member of the audit committee and the special committee.
Mr. Springer is the special committee chair and a member of the audit committee.
| Item 12. | Security Ownership of Certain Beneficial Owners and Management and Related Unitholder Matters |
The following table sets forth the beneficial ownership of our units and the related transactions held by:
| • | each person who beneficially owns 5% or more of our outstanding units as of February 25, 2011; |
| • | all of the directors of DCP Midstream GP, LLC; |
| • | each Named Executive Officer of DCP Midstream GP, LLC; and |
| • | all directors and executive officers of DCP Midstream GP, LLC as a group. |
Percentage of total common units beneficially owned is based on 40,486,782 common units outstanding.
| Name of Beneficial Owner(a) |
Common Units Beneficially Owned |
Percentage of Common Units Beneficially Owned |
||||||
| DCP LP Holdings, LP(b)(1) |
11,746,451 | 29.01 | % | |||||
| Tortoise Capital Advisors L.L.C.(d) |
4,308,630 | 10.64 | % | |||||
| Kayne Anderson Capital Advisors, L.P.(c) |
3,070,624 | 7.58 | % | |||||
| Mark A. Borer |
41,393 | * | ||||||
| Angela A. Minas |
30,613 | * | ||||||
| Michael S. Richards |
13,463 | * | ||||||
| Don Baldridge |
6,101 | * | ||||||
| Donald G. Hrap |
— | * | ||||||
| Alan N. Harris |
9,842 | * | ||||||
| Paul F. Ferguson, Jr. |
11,634 | * | ||||||
| John E. Lowe |
1 | * | ||||||
| Frank A. McPherson |
20,966 | * | ||||||
| Thomas C. Morris |
25,967 | * | ||||||
| Thomas C. O’Connor |
12,000 | * | ||||||
| Stephen R. Springer |
6,800 | * | ||||||
| All directors and executive officers as a group (12 persons) |
178,780 | * | ||||||
| * | Less than 1%. |
| (a) | Unless otherwise indicated, the address for all beneficial owners in this table is 370 17th Street, Suite 2775, Denver, Colorado 80202. |
184
Table of Contents
| (b) | DCP Midstream, LLC is the ultimate parent company of DCP LP Holdings, LP and may, therefore, be deemed to beneficially own the units held by DCP LP Holdings, LP. DCP Midstream, LLC disclaims beneficial ownership of all of the units owned by DCP LP Holdings, LP. The address of DCP LP Holdings, LP and DCP Midstream, LLC is 370 17th Street, Suite 2500, Denver, Colorado 80202. |
| (c) | As set forth in a Schedule 13G filed on February 14, 2011. The address of Kayne Anderson Capital Advisors, L.P. is 1800 Avenue of the Stars, Second Floor, Los Angeles, CA 90067. |
| (d) | As set forth in a Schedule 13G filed on February 14, 2011. The address of Tortoise Capital Advisors L.L.C. is 11550 Ash Street, Suite 300, Leawood, Kansas 66211. |
Equity Compensation Plan Information
The following table summarizes information about our equity compensation plan as of December 31, 2010.
| Number of securities to be issued upon exercise of outstanding options, warrants and rights (1) |
Weighted- average exercise price of outstanding options, warrants and rights |
Number of securities remaining available for future issuance under equity compensation plans (excluding securities reflected in column (a)) |
||||||||||
| (a) | (b) | (c) | ||||||||||
| Equity compensation plans approved by unitholders |
— | $ | — | — | ||||||||
| Equity compensation plans not approved by unitholders |
— | — | 710,100 | |||||||||
| Total |
— | $ | — | 710,100 | ||||||||
| (1) | The long-term incentive plan currently permits the grant of awards covering an aggregate of 850,000 units. For more information on our long-term incentive plan, which did not require approval by our limited partners, refer to Item 11. “Executive Compensation — Components of Compensation.” |
| Item 13. | Certain Relationships and Related Transactions, and Director Independence |
Distributions and Payments to our General Partner and its Affiliates
The following table summarizes the distributions and payments to be made by us to our General Partner and its affiliates in connection with our formation, ongoing operation, and liquidation. These distributions and payments are determined by and among affiliated entities and, consequently, are not the result of arm’s-length negations.
Operational Stage:
| Distributions of Available Cash to our General Partner and its affiliates |
We will generally make cash distributions to the unitholders and to our General Partner, in accordance with their pro rata interest. In addition, if distributions exceed the minimum quarterly distribution and other higher target levels, our General Partner will be entitled to increasing percentages of the distributions, up to 48% of the distributions above the highest target level. Currently, our distribution to our general partner related to its incentive distribution rights is at the highest level. |
| Payments to our General Partner and its affiliates |
We reimburse DCP Midstream, LLC and its affiliates $10.2 million per year, For further information regarding the reimbursement. Please see the “Omnibus Agreement” section below. |
| Withdrawal or removal of our General Partner |
If our General Partner withdraws or is removed, its general partner interest and its incentive distribution rights will either be sold to the new general partner for cash or converted into common units, in each case for an amount equal to the fair market value of those interests. |
185
Table of Contents
Liquidation Stage:
| Liquidation |
Upon our liquidation, the partners, including our General Partner, will be entitled to receive liquidating distributions according to their respective capital account balances. |
Omnibus Agreement
The employees supporting our operations are employees of DCP Midstream, LLC. We have entered into an omnibus agreement, as amended, or the Omnibus Agreement, with DCP Midstream, LLC. Under the Omnibus Agreement, we are required to reimburse DCP Midstream, LLC for salaries of operating personnel and employee benefits as well as capital expenditures, maintenance and repair costs, taxes and other direct costs incurred by DCP Midstream, LLC on our behalf. We also pay DCP Midstream, LLC an annual fee for centralized corporate functions performed by DCP Midstream, LLC on our behalf, including legal, accounting, cash management, insurance administration and claims processing, risk management, health, safety and environmental, information technology, human resources, credit, payroll, taxes and engineering.
Commencing January 2011 we extended the omnibus agreement through December 31, 2011 for $10.2 million. The Omnibus Agreement also addresses the following matters:
| • | DCP Midstream, LLC’s obligation to indemnify us for certain liabilities and our obligation to indemnify DCP Midstream, LLC for certain liabilities; |
| • | DCP Midstream, LLC’s obligation to continue to maintain its credit support, including without limitation guarantees and letters of credit, for our obligations related to commercial contracts with respect to its business or operations that were in effect at the closing of our initial public offering until the expiration of such contracts; and |
| • | Our general partner will have the right to agree to further increases in connection with expansions of our operations through the acquisition or construction of new assets or businesses, with the concurrence of the special committee of DCP Midstream GP, LLC’s board of directors. |
Our General Partner and its affiliates will also receive payments from us pursuant to the contractual arrangements described below under the caption “Contracts with Affiliates.”
Any or all of the provisions of the Omnibus Agreement, other than the indemnification provisions described below, will be terminable by DCP Midstream, LLC at its option if our general partner is removed without cause and units held by our general partner and its affiliates are not voted in favor of that removal. The Omnibus Agreement will also terminate in the event of a change of control of us, our general partner (DCP Midstream GP, LP) or our General Partner (DCP Midstream GP, LLC).
Competition
None of DCP Midstream, LLC or any of its affiliates, including Spectra Energy and ConocoPhillips, is restricted, under either our partnership agreement or the Omnibus Agreement, from competing with us. DCP Midstream, LLC and any of its affiliates, including Spectra Energy and ConocoPhillips, may acquire, construct or dispose of additional midstream energy or other assets in the future without any obligation to offer us the opportunity to purchase or construct those assets.
Indemnification
In connection with our acquisition of our wholesale propane logistics business, DCP Midstream, LLC agreed to indemnify us until October 31, 2010 if certain contractual matters result in a claim, and agreed to indemnify us indefinitely for breaches of the agreement. The indemnity obligation for breach of the representations and warranties is not effective until claims exceed in the aggregate $680,000 and is subject to a maximum liability of $6.8 million. This indemnity obligation for all other claims other than a breach of the representations and warranties does not become effective until an individual claim or series of related claims exceed $50,000. We have not pursued indemnification under this agreement.
186
Table of Contents
Contracts with Affiliates
We charge transportation fees, sell a portion of our residue gas and NGLs to, and purchase natural gas and NGLs from, DCP Midstream, LLC, ConocoPhillips, and their respective affiliates. We also purchase a portion of our propane from and market propane on behalf of Spectra Energy. Management anticipates continuing to purchase and sell these commodities to DCP Midstream, LLC, ConocoPhillips and their respective affiliates, and Spectra Energy in the ordinary course of business.
Natural Gas Gathering and Processing Arrangements
We have a fee-based contractual relationship with ConocoPhillips, which includes multiple contracts, pursuant to which ConocoPhillips has dedicated all of its natural gas production within an area of mutual interest to certain of our systems under multiple agreements that are market based. These agreements provide for gathering, processing and transportation services. We collect fees from ConocoPhillips for gathering and compressing the natural gas from the wellhead or receipt point and for processing the natural gas at certain of our processing plants. We also purchase natural gas from ConocoPhillips at the wellhead or receipt point, transport the wellhead natural gas through our gathering systems, treat and process the natural gas, and then sell a portion of the resulting residue natural gas and NGLs at index prices based on published index market prices.
We sell NGLs processed at certain of our plants, and sell condensate removed from the gas gathering systems that deliver to certain of our systems under contracts to a subsidiary of DCP Midstream, LLC equal to that subsidiary’s net weighted-average sales price, adjusted for transportation, processing and other charges from the tailgate of the respective asset.
Please read Item 1. “Business — Natural Gas Services Segment — Customers and Contracts” and Note 5 of the Notes to Consolidated Financial Statements in Item 8. “Financial Statements and Supplementary Data.”
Merchant Arrangements
Under our merchant arrangements, we use a subsidiary of DCP Midstream, LLC (DCP Midstream Marketing, LP) as our agent to purchase natural gas from third parties at pipeline interconnect points, as well as residue gas from certain of our processing plants, and then resell the aggregated natural gas primarily to third parties. DCP Midstream, LLC owns certain assets and is party to certain contractual relationships around our Pelico system, included in our Northern Louisiana system, that are periodically used for the benefit of Pelico. DCP Midstream, LLC is able to source natural gas upstream of Pelico and deliver it to us and is able to take natural gas from the outlet of the Pelico system and market it downstream of Pelico. We purchase natural gas from DCP Midstream, LLC upstream of Pelico and transport it to Pelico under a firm transportation agreement with an affiliate. Our purchases from DCP Midstream, LLC are at DCP Midstream LLC’s actual acquisition cost plus any transportation service charges. Volumes that exceed our on-system demand are sold to DCP Midstream, LLC at an index-based price, less contractually agreed to marketing fees. Please read Note 5 of the Notes to Consolidated Financial Statements in Item 8. “Financial Statements and Supplementary Data.”
Propane Supply Arrangements
We have a propane supply agreement with Spectra Energy, effective from May 1, 2008 through April 30, 2012, which provides us propane supply at our Providence marine terminal, which is included in our Wholesale Propane Logistics segment, for up to approximately 120 million gallons of propane annually. On June 15, 2010, we entered into an amendment to the supply agreement to shorten the term of the agreement, which previously terminated on April 30, 2014. In consideration for shortening the term, Spectra Energy provided us with a cash payment of $3.0 million.
In conjunction with our acquisition of Atlantic Energy on July 30, 2010, we acquired a propane supply agreement with Spectra Energy, effective from May 1, 2010 to April 30, 2012, which provides us propane supply for our Chesapeake marine terminal, which is included in our Wholesale Propane Logistics segment, for up to approximately 65 million gallons of propane annually.
In December 2010, Spectra Energy’s international propane supplier breached its contract with Spectra Energy by failing to make certain scheduled propane deliveries that were to be delivered to us under our
187
Table of Contents
propane supply contracts with Spectra Energy. We were able to secure spot shipments on the open market at a price higher than our contract price to cover these missing deliveries. In December 2010 Spectra Energy made a $17.0 million payment to us to reimburse us for the damages we incurred for our open market purchases.
Transportation Arrangements
We also have a contractual arrangement with a subsidiary of DCP Midstream, LLC that provides that DCP Midstream, LLC will pay us to transport NGLs over our Seabreeze and Wilbreeze pipelines, pursuant to fee-based rates that will be applied to the volumes transported. DCP Midstream, LLC is the sole shipper on these pipelines under the transportation agreements.
In conjunction with our acquisition of the Wattenberg pipeline, which is part of our NGL Logistics segment, we signed a transportation agreement with DCP Midstream, LLC pursuant to fee-based rates that will be applied to the volumes transported. The agreement was effective through December 31, 2010. Effective January 1, 2011, we entered into a 10-year dedication and transportation agreement with a subsidiary of DCP Midstream, LLC whereby certain NGL volumes produced at several of DCP Midstream, LLC’s processing facilities are dedicated for transportation on the Wattenberg pipeline. We collect fee-based transportation revenues under our tariff.
DCP Midstream, LLC historically is also the largest shipper on the Black Lake pipeline, primarily due to the NGLs delivered to it from certain of our processing plants. Please read Note 5 of the Notes to Consolidated Financial Statements in Item 8. “Financial Statements and Supplementary Data.”
Derivative Arrangements
We have entered into commodity contracts whereby we receive a fixed price and we pay a floating price. DCP Midstream, LLC has issued parental guarantees in favor of certain counterparties to our commodity derivative instruments to mitigate a portion of our collateral requirements with those counterparties. We pay DCP Midstream, LLC interest of 0.5% per annum on these outstanding guarantees. We have also entered into a short term NGL swap contracts with DCP Midstream, LLC whereby we receive a fixed price for NGLs and we pay a floating price. For more information regarding our derivative activities and credit support provided by DCP Midstream, LLC, please read “Management’s Discussion and Analysis of Financial Condition and Results of Operations — Quantitative and Qualitative Disclosures about Market Risk — Commodity Price Risk — Commodity Cash Flow Protection Activities” and “Management’s Discussion and Analysis of Financial Condition and Results of Operations — Liquidity and Capital Resources.”
Other Agreements and Transactions with DCP Midstream, LLC
On November 4, 2010, we entered into agreements with DCP Midstream, LLC, to acquire a 33.33% interest in Southeast Texas, for $150.0 million. The Southeast Texas system is a fully integrated midstream business which includes 675 miles of natural gas pipelines, three natural gas processing plants with recently increased processing capacity totaling 380 MMcf/d and natural gas storage assets with 9 Bcf of existing storage capacity. The terms of the joint venture agreement provide that distributions to us for the first seven years related to storage and transportation gross margin will be pursuant to a fee-based arrangement, based on storage capacity and tailgate volumes. Distributions related to the gathering and processing business, along with reductions for all expenditures, will be pursuant to our and DCP Midstream, LLC’s respective ownership interests in Southeast Texas. This acquisition closed as of January 1, 2011.
On September 16, 2010, we entered into an agreement with DCP Midstream, LLC to sell certain surplus equipment with a net book value of $6.2 million, for net proceeds of $3.6 million. The surplus equipment is the result of a consolidation of operations at our Anderson Gulch plant in the Piceance Basin. The net proceeds of $3.6 million have been distributed 75% to us and 25% to the noncontrolling interest in Collbran, based upon proportionate ownership. The title to the surplus equipment will pass to DCP Midstream, LLC upon removal of the equipment from our premises.
On June 30, 2010, we entered into an agreement with DCP Midstream, LLC to sell certain surplus equipment with a net book value of $1.6 million, for net proceeds of $2.2 million. The surplus equipment is the result of our integration efforts and synergies realized following our acquisition of certain companies that held natural gas gathering and treating assets from MichCon Pipeline Company in November 2009.
188
Table of Contents
In conjunction with our acquisition of a 50.1% limited liability company interest in East Texas from DCP Midstream, LLC, we entered into agreements with DCP Midstream, LLC whereby DCP Midstream, LLC will reimburse East Texas for certain expenditures on East Texas capital projects as defined in the Contribution Agreements. These reimbursements are for certain capital projects which have commenced within three years from the respective acquisition dates. DCP Midstream, LLC made capital contributions to East Texas for capital projects of $13.8 million and $67.5 million for the years ended December 31, 2010 and 2009, respectively.
DCP Midstream, LLC has issued parental guarantees for its 49.9% limited liability company interest in East Texas, totaling $6.0 million as of December 31, 2010, in favor of certain counterparties to processing and transportation agreements at East Texas. Concurrently, we have issued similar guarantees for our 50.1% interest.
On February 11, 2009, our East Texas natural gas processing complex and natural gas delivery system known as the Carthage Hub, was temporarily shut in following a fire that was caused by a third party underground pipeline outside of our property line that ruptured. We are actively pursuing full reimbursement of our costs and lost margin associated with the incident from the responsible third party. East Texas filed a lawsuit in December 2009, to recover damages from the responsible third party. In the event we are unable to recover our costs and lost margin from the responsible third party, we have insurance covering property damage, net of applicable deductibles. Following this incident, DCP Midstream, LLC has agreed to reimburse to us 25% of any claims received as reimbursement of costs and lost margin, from the responsible third party or from insurance. DCP Midstream, LLC will pay 75% of costs related to the incident as a result of this agreement.
In April 2009, we entered into a thirteen year contractual arrangement with DCP Midstream, LLC in which we pay DCP Midstream, LLC a fee for processing services associated with the gas we gather on our Southern Oklahoma system, which is part of our Natural Gas Services segment. In addition, in February 2010, a contract was signed with DCP Midstream, LLC providing for adjustments to those fees based upon plant efficiencies related to our portion of volumes from the Southern Oklahoma system being processed at DCP Midstream, LLC’s plant through March 2022. In addition, as part of this arrangement, DCP Midstream, LLC pays us a fee for certain gathering services.
Review, Approval or Ratification of Transactions with Related Persons
Our partnership agreement contains specific provisions that address potential conflicts of interest between the owner of our general partner and its affiliates, including DCP Midstream, LLC on one hand, and us and our subsidiaries, on the other hand. Whenever such a conflict of interest arises, our general partner will resolve the conflict. Our general partner may, but is not required to, seek the approval of such resolution from the special committee of the board of directors of our general partner, which is comprised of independent directors and acts as our conflicts committee. The partnership agreement provides that our general partner will not be in breach of its obligations under the partnership agreement or its duties to us or to our unitholders if the resolution of the conflict is:
| • | approved by the conflicts committee; |
| • | approved by the vote of a majority of the outstanding common units, excluding any common units owned by our general partner or any of its affiliates; |
| • | on terms no less favorable to us than those generally being provided to or available from unrelated third parties; or |
| • | fair and reasonable to us, taking into account the totality of the relationships between the parties involved, including other transactions that may be particularly favorable or advantageous to us. |
If our general partner does not seek approval from the special committee and the board of directors of our general partner determines that the resolution or course of action taken with respect to the conflict of interest satisfies either of the standards set forth in the third and fourth bullet points above, then it will be presumed that, in making its decision, the board of directors acted in good faith, and in any proceeding brought by or on behalf of any limited partner or the partnership, the person bringing or prosecuting such proceeding will have the burden of overcoming such presumption. Unless the resolution of a conflict is specifically provided for in
189
Table of Contents
our partnership agreement, our general partner or the conflicts committee may consider any factors it determines in good faith to consider when resolving a conflict. When our partnership agreement requires someone to act in good faith, it requires that person to reasonably believe that he is acting in the best interests of the partnership, unless the context otherwise requires.
In addition, our code of business ethics requires that all employees, including employees of affiliates of DCP Midstream, LLC who perform services for us and our general partner, avoid or disclose any activity that may interfere, or have the appearance of interfering, with their responsibilities to us.
Director Independence
Please see Item 10. “Directors, Executive Officers and Corporate Governance” for information about the independence of our general partner’s board of directors and its committees, which information is incorporated herein by reference in its entirety.
| Item 14. | Principal Accounting Fees and Services |
The following table presents fees for professional services rendered by Deloitte & Touche LLP, or Deloitte, our principal accountant, for the audit of our financial statements, and the fees billed for other services rendered by Deloitte:
| Year Ended December 31, | ||||||||
| Type of Fees |
2010 | 2009 | ||||||
| (Millions) | ||||||||
| Audit Fees (a) |
$ | 1.8 | $ | 1.4 | ||||
| (a) | Audit Fees are fees billed by Deloitte for professional services for the audit of our consolidated financial statements included in our annual report on Form 10-K and review of financial statements included in our quarterly reports on Form 10-Q, services that are normally provided by Deloitte in connection with statutory and regulatory filings or engagements or any other service performed by Deloitte to comply with generally accepted auditing standards and include comfort and consent letters in connection with Securities and Exchange Commission filings and financing transactions. |
For the last two fiscal years, Deloitte has not billed us for assurance and related services, unless such services were reasonably related to the performance of the audit or review of our financial statements, and are included in the table above. Deloitte has not provided any services to us over the last two fiscal years related to tax compliance, tax services and tax planning.
Audit Committee Pre-Approval Policy
The audit committee pre-approves all audit and permissible non-audit services provided by the independent auditors on a case-by-case basis. These services may include audit services, audit-related services, tax services and other services. The audit committee does not delegate its responsibilities to pre-approve services performed by the independent auditor to management or to an individual member of the audit committee. The audit committee has, however, pre-approved audit related services that do not impair the independence of the independent auditors for up to $50,000 per engagement, and up to an aggregate of $200,000 annually, provided the audit committee is notified of such audit-related services in a timely manner. The audit committee may, however, from time to time delegate its authority to any audit committee member, who will report on the independent auditor services that were approved at the next audit committee meeting.
190
Table of Contents
PART IV
| Item 15. | Exhibits and Financial Statement Schedules |
Consolidated Financial Statements and Financial Statements Schedules included in this Item 15:
| (a) | Consolidated Financial Statements of Discovery Producer Services LLC |
| (b) | Exhibits |
(a) Financial Statements
191
Table of Contents
Discovery Producer Services LLC
Consolidated Financial Statements
For the Years Ended December 31, 2010, 2009 and 2008
Table of Contents
Report of Independent Registered Public Accounting Firm
To the Management Committee of
Discovery Producer Services LLC
We have audited the accompanying consolidated balance sheets of Discovery Producer Services LLC as of December 31, 2010 and 2009, and the related consolidated statements of income, members’ capital, and cash flows for each of the three years in the period ended December 31, 2010. These financial statements are the responsibility of the Company’s management. Our responsibility is to express an opinion on these financial statements based on our audits.
We conducted our audits in accordance with the standards of the Public Company Accounting Oversight Board (United States). Those standards require that we plan and perform the audit to obtain reasonable assurance about whether the financial statements are free of material misstatement. We were not engaged to perform an audit of the Company’s internal control over financial reporting. Our audits included consideration of internal control over financial reporting as a basis for designing audit procedures that are appropriate in the circumstances, but not for the purpose of expressing an opinion on the effectiveness of the Company’s internal control over financial reporting. Accordingly, we express no such opinion. An audit also includes examining, on a test basis, evidence supporting the amounts and disclosures in the financial statements, assessing the accounting principles used and significant estimates made by management, and evaluating the overall financial statement presentation. We believe that our audits provide a reasonable basis for our opinion.
In our opinion, the financial statements referred to above present fairly, in all material respects, the consolidated financial position of Discovery Producer Services LLC at December 31, 2010 and 2009, and the consolidated results of its operations and its cash flows for each of the three years in the period ended December 31, 2010, in conformity with U.S. generally accepted accounting principles.
/s/ Ernst & Young LLP
Tulsa, Oklahoma
March 1, 2011
193
Table of Contents
DISCOVERY PRODUCER SERVICES LLC
CONSOLIDATED BALANCE SHEETS
| December 31, | ||||||||
| 2010 | 2009 | |||||||
| (In thousands) | ||||||||
| ASSETS | ||||||||
| Current assets: |
||||||||
| Cash and cash equivalents |
$ | 10,230 | $ | 10,074 | ||||
| Trade accounts receivable: |
||||||||
| Affiliate |
11,881 | 12,399 | ||||||
| Other |
7,029 | 8,665 | ||||||
| Insurance receivable |
2,234 | 4,647 | ||||||
| Prepaid insurance |
2,769 | 2,484 | ||||||
| Other current assets |
884 | 1,185 | ||||||
| Total current assets |
35,027 | 39,454 | ||||||
| Property, plant, and equipment, net |
356,201 | 364,932 | ||||||
| Other noncurrent assets |
271 | — | ||||||
| Total assets |
$ | 391,499 | $ | 404,386 | ||||
| LIABILITIES AND MEMBERS’ CAPITAL | ||||||||
| Current liabilities: |
||||||||
| Accounts payable: |
||||||||
| Affiliate |
$ | 2,740 | $ | 1,986 | ||||
| Other |
14,031 | 12,329 | ||||||
| Accrued liabilities |
684 | 1,101 | ||||||
| Other current liabilities |
380 | 1,292 | ||||||
| Total current liabilities |
17,835 | 16,708 | ||||||
| Asset retirement obligations |
25,575 | 23,325 | ||||||
| Other noncurrent liabilities |
— | 30 | ||||||
| Members’ capital |
348,089 | 364,323 | ||||||
| Total liabilities and members’ capital |
$ | 391,499 | $ | 404,386 | ||||
See accompanying notes to consolidated financial statements.
194
Table of Contents
DISCOVERY PRODUCER SERVICES LLC
CONSOLIDATED STATEMENTS OF INCOME
| Years Ended December 31, | ||||||||||||
| 2010 | 2009 | 2008 | ||||||||||
| (In thousands) | ||||||||||||
| Revenues: |
||||||||||||
| Product sales: |
||||||||||||
| Affiliate |
$ | 157,785 | $ | 114,738 | $ | 207,706 | ||||||
| Third-party |
58 | 66 | 1,324 | |||||||||
| Gas and condensate transportation services: |
||||||||||||
| Affiliate |
322 | 485 | 782 | |||||||||
| Third-party |
21,743 | 20,155 | 13,308 | |||||||||
| Gathering and processing services: |
||||||||||||
| Affiliate |
285 | 131 | 1,506 | |||||||||
| Third-party |
19,717 | 17,831 | 12,709 | |||||||||
| Other revenues |
7,496 | 7,613 | 3,913 | |||||||||
| Total revenues |
207,406 | 161,019 | 241,248 | |||||||||
| Costs and expenses: |
||||||||||||
| Product cost and shrink replacement: |
||||||||||||
| Affiliate |
23,401 | 20,235 | 83,576 | |||||||||
| Third-party |
64,330 | 52,271 | 63,422 | |||||||||
| Operating and maintenance expenses: |
||||||||||||
| Affiliate |
11,903 | 9,580 | 8,836 | |||||||||
| Third-party |
24,474 | 13,865 | 27,834 | |||||||||
| Depreciation, amortization and accretion |
20,544 | 18,751 | 21,324 | |||||||||
| Taxes other than income |
3,016 | 3,263 | 1,439 | |||||||||
| General and administrative expenses — affiliate |
6,087 | 6,000 | 4,500 | |||||||||
| Other (income) expense, net |
2,229 | 10 | (3,511 | ) | ||||||||
| Total costs and expenses |
155,984 | 123,975 | 207,420 | |||||||||
| Operating income |
51,422 | 37,044 | 33,828 | |||||||||
| Interest income |
4 | 31 | 650 | |||||||||
| Foreign exchange loss |
— | (168 | ) | (78 | ) | |||||||
| Net income |
$ | 51,426 | $ | 36,907 | $ | 34,400 | ||||||
See accompanying notes to consolidated financial statements.
195
Table of Contents
DISCOVERY PRODUCER SERVICES LLC
CONSOLIDATED STATEMENT OF MEMBERS’ CAPITAL
| Williams Partners Operating LLC |
DCP Assets Holding, LP |
Total | ||||||||||
| Balance at December 31, 2007 |
244,930 | 161,519 | 406,449 | |||||||||
| Contributions |
5,700 | 7,376 | 13,076 | |||||||||
| Distributions |
(56,400 | ) | (37,600 | ) | (94,000 | ) | ||||||
| Net income |
20,641 | 13,759 | 34,400 | |||||||||
| Balance at December 31, 2008 |
214,871 | 145,054 | 359,925 | |||||||||
| Contributions |
13,166 | 6,967 | 20,133 | |||||||||
| Distributions |
(30,747 | ) | (20,498 | ) | (51,245 | ) | ||||||
| Special distribution of interest earned on Tahiti escrow account to Williams Partners Operating LLC |
(1,397 | ) | — | (1,397 | ) | |||||||
| Net income |
22,703 | 14,204 | 36,907 | |||||||||
| Balance at December 31, 2009 |
218,596 | 145,727 | 364,323 | |||||||||
| Contributions |
3,480 | 2,320 | 5,800 | |||||||||
| Distributions |
(44,076 | ) | (29,384 | ) | (73,460 | ) | ||||||
| Net income |
30,856 | 20,570 | 51,426 | |||||||||
| Balance at December 31, 2010 |
$ | 208,856 | $ | 139,233 | $ | 348,089 | ||||||
See accompanying notes to consolidated financial statements.
196
Table of Contents
DISCOVERY PRODUCER SERVICES LLC
CONSOLIDATED STATEMENTS OF CASH FLOWS
| Years Ended December 31, | ||||||||||||
| 2010 | 2009 | 2008 | ||||||||||
| (In thousands) | ||||||||||||
| OPERATING ACTIVITIES: |
||||||||||||
| Net income |
$ | 51,426 | $ | 36,907 | $ | 34,400 | ||||||
| Adjustments to reconcile to cash provided by operations: |
||||||||||||
| Depreciation, amortization and accretion |
20,544 | 18,751 | 21,324 | |||||||||
| Net loss on disposal of equipment |
3 | — | 175 | |||||||||
| Cash provided (used) by changes in assets and liabilities: |
||||||||||||
| Trade accounts receivable |
2,154 | (18,963 | ) | 26,213 | ||||||||
| Insurance receivable |
2,413 | (1,274 | ) | 2,319 | ||||||||
| Prepaid insurance |
(285 | ) | 216 | (267 | ) | |||||||
| Other current assets |
301 | (433 | ) | 2,335 | ||||||||
| Accounts payable |
1,372 | (14,124 | ) | 5,932 | ||||||||
| Accrued liabilities |
(417 | ) | (4,613 | ) | (725 | ) | ||||||
| Other current liabilities |
(942 | ) | (383 | ) | (52 | ) | ||||||
| Net cash provided by operating activities |
76,569 | 16,084 | 91,654 | |||||||||
| INVESTING ACTIVITIES: |
||||||||||||
| Property, plant, and equipment—capital expenditures |
(8,474 | ) | (19,023 | ) | (9,939 | ) | ||||||
| Decrease in restricted cash |
— | 3,470 | 2,752 | |||||||||
| Acquisition of other noncurrent assets |
(279 | ) | — | — | ||||||||
| Net cash used by investing activities |
(8,753 | ) | (15,553 | ) | (7,187 | ) | ||||||
| FINANCING ACTIVITIES: |
||||||||||||
| Distributions to members |
(73,460 | ) | (52,642 | ) | (94,000 | ) | ||||||
| Capital contributions |
5,800 | 20,133 | 13,076 | |||||||||
| Net cash used by financing activities |
(67,660 | ) | (32,509 | ) | (80,924 | ) | ||||||
| Increase (decrease) in cash and cash equivalents |
156 | (31,978 | ) | 3,543 | ||||||||
| Cash and cash equivalents at beginning of period |
10,074 | 42,052 | 38,509 | |||||||||
| Cash and cash equivalents at end of period |
$ | 10,230 | $ | 10,074 | $ | 42,052 | ||||||
See accompanying notes to consolidated financial statements.
197
Table of Contents
DISCOVERY PRODUCER SERVICES LLC
NOTES TO CONSOLIDATED FINANCIAL STATEMENTS
Note 1. Organization and Description of Business
Unless the context clearly indicates otherwise, references in this report to “we”, “our”, “us” or similar language refer to Discovery Producer Services LLC and its wholly owned subsidiary, Discovery Gas Transmission LLC (DGT). We are a Delaware limited liability company formed on June 24, 1996 for the purpose of constructing and operating a 600 million cubic feet per day (MMcf/d) cryogenic natural gas processing plant near Larose, Louisiana and a 32,000 barrel per day (bpd) natural gas liquids fractionator near Paradis, Louisiana. DGT is a Delaware limited liability company formed on June 24, 1996 for the purpose of constructing and operating a natural gas pipeline from offshore deep water in the Gulf of Mexico to our gas processing plant in Larose, Louisiana. The mainline has a design capacity of 600 MMcf/d and consists of approximately 105 miles of pipe. We have since connected several laterals to the DGT pipeline to expand our presence in the Gulf.
We are owned 60% by Williams Partners Operating LLC (a wholly owned subsidiary of Williams Partners L.P (WPZ)) and 40% by DCP Assets, LP (DCP). Williams Field Services Group, L.L.C. is our operator. Herein, The Williams Companies, Inc. who controls WPZ through its general partner interest and its subsidiaries, including WPZ and Williams Field Services Group, L.L.C., are collectively referred to as “Williams.”
We evaluated our disclosure of subsequent events through the date, March 1, 2011, that our financial statements were issued.
Note 2. Summary of Significant Accounting Policies
Basis of Presentation. The consolidated financial statements have been prepared based upon accounting principles generally accepted in the United States and include the accounts of the parent and our wholly owned subsidiary, DGT. Intercompany accounts and transactions have been eliminated.
Use of Estimates. The preparation of consolidated financial statements in conformity with accounting principles generally accepted in the United States requires management to make estimates and assumptions that affect the amounts reported in the consolidated financial statements and accompanying notes. Actual results could differ from those estimates.
Estimates and assumptions used in the calculation of asset retirement obligations are, in the opinion of management, significant to the underlying amounts included in the consolidated financial statements. It is reasonably possible that future events or information could change those estimates.
Cash and Cash Equivalents. The cash and cash equivalent balance is primarily invested in funds with high-quality, short-term securities and instruments that are issued or guaranteed by the U.S. government. These securities have maturities of three months or less when acquired.
Trade Accounts Receivable. Trade accounts receivable are carried on a gross basis, with no discounting, less an allowance for doubtful accounts. We do not recognize an allowance for doubtful accounts at the time the revenue that generates the accounts receivable is recognized. We estimate the allowance for doubtful accounts based on existing economic conditions, the financial condition of the customers, and the amount and age of past due accounts. Receivables are considered past due if full payment is not received by the contractual due date. Past due accounts are generally written off against the allowance for doubtful accounts only after all collection attempts have been exhausted. There was no allowance for doubtful accounts at December 31, 2010 and 2009.
Insurance Receivable. Hurricane Katrina damaged our pipeline and onshore facilities in 2005, and Hurricane Ike damaged the 30” mainline and an 18” lateral in 2008. Expenditures incurred for the repair of these damages considered probable of recovery when incurred are recorded as insurance receivable. We expense expenditures up to the insurance deductible ($6.4 million in 2008), amounts not covered by insurance ($2.0 million in 2008) and amounts subsequently determined not to be recoverable.
198
Table of Contents
DISCOVERY PRODUCER SERVICES LLC
NOTES TO CONSOLIDATED FINANCIAL STATEMENTS — (Continued)
Prepaid Insurance. Prepaid insurance represents the unamortized balance of insurance premiums. These payments are amortized on a straight-line basis over the policy term.
Gas Imbalances. In the course of providing transportation services to customers, we may receive different quantities of gas from shippers than the quantities delivered on behalf of those shippers. This results in gas transportation imbalance receivables and payables which are recovered or repaid in cash, based on market-based prices, or through the receipt or delivery of gas in the future. Imbalance receivables are valued based on the lower of the current market prices or weighted average cost of natural gas in the system. Imbalance payables are valued at current market prices. Settlement of imbalances requires agreement between the pipelines and shippers as to allocations of volumes to specific transportation contracts and the timing of delivery of gas based on operational conditions. Pursuant to a settlement with our shippers issued by the Federal Energy Regulatory Commission (FERC) on February 5, 2008, if a cash-out refund is due and payable to a shipper during any year pursuant to Transporter’s FERC Gas Tariff, shipper will be deemed to have immediately assigned its right to the refund amount to us.
Property, Plant and Equipment. Property, plant and equipment is recorded at cost. We base the carrying value of these assets on estimates, assumptions and judgments relative to capitalized costs, useful lives and salvage values. The natural gas and natural gas liquids maintained in the pipeline facilities necessary for their operation (line fill) are included in property, plant and equipment. Depreciation of property, plant and equipment is provided on a straight-line basis over the estimated useful lives of 25 to 35 years. Expenditures for maintenance and repairs are expensed as incurred. Expenditures that extend the useful lives of the assets or increase their functionality are capitalized. The cost of property, plant and equipment sold or retired and the related accumulated depreciation is removed from the accounts in the period of sale or disposition. Gains and losses on the disposal of property, plant and equipment are recorded in the Consolidated Statements of Income.
We record an asset and a liability equal to the present value of each expected future asset retirement obligation (ARO). The ARO asset is depreciated in a manner consistent with the depreciation of the underlying physical asset. We measure changes in the liability due to passage of time by applying an interest method of allocation. This amount is recognized as an increase in the carrying amount of the liability and as corresponding accretion expense included in operating income.
Revenue Recognition. Revenue for sales of products is recognized in the period of delivery, and revenues from the gathering, transportation and processing of gas are recognized in the period the service is provided based on contractual terms and the related natural gas and liquid volumes. DGT is subject to FERC regulations, and accordingly, certain revenues collected may be subject to possible refunds upon final orders in pending cases. DGT records rate refund liabilities considering its and other third parties’ regulatory proceedings, advice of counsel, estimated total exposure as discounted and risk weighted, and collection and other risks. There were no rate refund liabilities accrued at December 31, 2010 or 2009.
Impairment of Long-Lived Assets. We evaluate long-lived assets for impairment on an individual asset or asset group basis when events or changes in circumstances indicate that, in our management’s judgment, the carrying value of such assets may not be recoverable. When such a determination has been made, we compare our management’s estimate of undiscounted future cash flows attributable to the assets to the carrying value of the assets to determine whether the carrying value is recoverable. If the carrying value is not recoverable, we determine the amount of the impairment recognized in the financial statements by estimating the fair value of the assets and recording a loss for the amount that the carrying value exceeds the estimated fair value.
Income Taxes. For federal tax purposes, we have elected to be treated as a partnership with each member being separately taxed on its ratable share of our taxable income. This election, to be treated as a pass-through entity, also applies to our wholly owned subsidiary, DGT. Therefore, no income taxes or deferred income taxes are reflected in the consolidated financial statements.
199
Table of Contents
DISCOVERY PRODUCER SERVICES LLC
NOTES TO CONSOLIDATED FINANCIAL STATEMENTS — (Continued)
Foreign Currency Transactions. Transactions denominated in currencies other than the functional currency are recorded based on exchange rates at the time such transactions arise. Subsequent changes in exchange rates result in transaction gains or losses which are reflected in the Consolidated Statements of Income.
Note 3. Related Party Transactions
We have various business transactions with our members and subsidiaries and affiliates of our members. Revenues include the following:
| • | sales to Williams of natural gas liquids (NGLs) to which we take title and excess natural gas at current market prices for the products and |
| • | processing and sales of natural gas liquids and transportation of natural gas and condensate for DCP’s affiliates, Texas Eastern Corporation and ConocoPhillips Company. |
The following table summarizes these related-party revenues during 2010, 2009 and 2008.
| Years Ended December 31, | ||||||||||||
| 2010 | 2009 | 2008 | ||||||||||
| (In thousands) | ||||||||||||
| Williams |
$ | 158,070 | $ | 114,869 | $ | 207,782 | ||||||
| Texas Eastern Corporation |
— | 190 | 1,953 | |||||||||
| ConocoPhillips |
322 | 295 | 259 | |||||||||
| Total |
$ | 158,392 | $ | 115,354 | $ | 209,994 | ||||||
Product costs and shrink replacement — affiliate includes natural gas purchases from Williams for fuel and shrink requirements made at market rates at the time of purchase.
We have no employees. Pipeline and plant operations are performed under operation and maintenance agreements with Williams. Most costs for materials, services and other charges are third-party charges and are invoiced directly to us. Operating and maintenance expenses — affiliate includes the following:
| • | direct payroll and employee benefit costs incurred on our behalf by Williams, and |
| • | rental expense under a 10-year leasing agreement for pipeline capacity through 2015 from Texas Eastern Transmission, LP (an affiliate of DCP) |
General and administrative expenses — affiliate includes a monthly operation and management fee paid to Williams to cover the cost of accounting services, computer systems and management services provided to us.
We also pay Williams a project management fee to cover the cost of managing capital projects. This fee is determined on a project by project basis and is capitalized as part of the construction costs. A summary of the payroll costs and project fees charged to us by Williams and capitalized are as follows:
| Years Ended December 31, | ||||||||||||
| 2010 | 2009 | 2008 | ||||||||||
| (In thousands) | ||||||||||||
| Capitalized labor |
$ | 295 | $ | 280 | $ | 317 | ||||||
| Capitalized project fee |
288 | 312 | 375 | |||||||||
| $ | 583 | $ | 592 | $ | 692 | |||||||
200
Table of Contents
DISCOVERY PRODUCER SERVICES LLC
NOTES TO CONSOLIDATED FINANCIAL STATEMENTS — (Continued)
Note 4. Property, Plant, and Equipment
Property, plant, and equipment consisted of the following at December 31, 2010 and 2009:
| Years Ended December 31, |
Estimated Depreciable Lives |
|||||||||||
| 2010 | 2009 | |||||||||||
| (In thousands) | ||||||||||||
| Property, plant, and equipment: |
||||||||||||
| Transportation lines |
$ | 322,070 | $ | 320,956 | 25 — 35 years | |||||||
| Plant and other equipment |
291,367 | 283,001 | 25 — 35 years | |||||||||
| Buildings |
5,139 | 5,055 | 25 — 35 years | |||||||||
| Land and land rights |
7,491 | 5,556 | 0 — 35 years | |||||||||
| Construction work in progress |
3,616 | 5,256 | ||||||||||
| Total property, plant, and equipment |
629,683 | 619,824 | ||||||||||
| Less accumulated depreciation |
273,482 | 254,892 | ||||||||||
| Net property, plant, and equipment |
$ | 356,201 | $ | 364,932 | ||||||||
Commitments for construction and acquisition of property, plant, and equipment at Larose for a cooling water system are $129 thousand at December 31, 2010.
Our asset retirement obligations relate primarily to our offshore platform and pipelines and our onshore processing and fractionation facilities. At the end of the useful life of each respective asset, we are legally or contractually obligated to dismantle the offshore platform, properly abandon the offshore pipelines, remove the onshore facilities and related surface equipment and restore the surface of the property.
A rollforward of our asset retirement obligation for 2010 and 2009 is presented below.
| Years Ended December 31, | ||||||||
| 2010 | 2009 | |||||||
| (In thousands) | ||||||||
| Balance at January 1 |
$ | 23,325 | $ | 19,684 | ||||
| Accretion expense |
1,937 | 1,669 | ||||||
| Estimate revisions |
313 | 396 | ||||||
| Liabilities incurred |
— | 1,576 | ||||||
| Balance at December 31 |
$ | 25,575 | $ | 23,325 | ||||
Note 5. Leasing Activities
We lease the land on which the Paradis fractionator and the Larose processing plant are located. The initial term of each lease is 20 years with renewal options for an additional 30 years. We also have a ten-year leasing agreement for pipeline capacity from Texas Eastern Transmission, LP that includes renewal options and options to increase capacity which would also increase rentals. The future minimum annual rentals under these non-cancelable leases as of December 31, 2010 are payable as follows:
| (In thousands) | ||||
| 2011 |
$ | 1,241 | ||
| 2012 |
1,245 | |||
| 2013 |
1,245 | |||
| 2014 |
1,245 | |||
| 2015 |
670 | |||
| Thereafter |
95 | |||
| $ | 5,741 | |||
201
Table of Contents
DISCOVERY PRODUCER SERVICES LLC
NOTES TO CONSOLIDATED FINANCIAL STATEMENTS — (Continued)
Total rent expense for 2010, 2009 and 2008, including a cancelable platform space lease and month-to-month leases, was $1.8 million, $1.8 million and $1.6 million, respectively.
Note 6. Financial Instruments, Concentrations of Credit Risk and Major Customers
Financial Instruments Fair Value
We used the following methods and assumptions to estimate the fair value of financial instruments:
Cash and cash equivalents. The carrying amounts reported in the Consolidated Balance Sheets approximate fair value due to the short-term maturity of these instruments.
| 2010 | 2009 | |||||||||||||||
| Carrying Amount |
Fair Value |
Carrying Amount |
Fair Value |
|||||||||||||
| (In thousands) | ||||||||||||||||
| Cash and cash equivalents |
$ | 10,230 | $ | 10,230 | $ | 10,074 | $ | 10,074 | ||||||||
Concentrations of Credit Risk
Our cash equivalents balance is primarily invested in funds with high-quality, short-term securities and instruments that are issued or guaranteed by the U.S. government.
At December 31, 2010, substantially all of our customer accounts receivable result from product sales to and gas transmission services provided for our largest three customers. This concentration of customers may impact our overall credit risk either positively or negatively, in that these entities may be similarly affected by industry-wide changes in economic or other conditions. As a general policy, collateral is not required for receivables, but customers’ financial condition and credit worthiness are evaluated regularly. Our credit policy and the relatively short duration of receivables mitigate the risk of uncollected receivables. We did not incur any credit losses on receivables during 2010 and 2009.
Major Customers
Williams accounted for $158.1 million (76%), $114.9 million (71%), $208.0 million (86%) respectively, of our total revenues in 2010, 2009 and 2008. These revenues were for the sale of NGLs received as compensation under processing contracts with third-party producers.
Note 7. Rate and Regulatory Matters
Rate and Regulatory Matters. Annually, DGT files a request with the FERC for a fuel lost-and-unaccounted-for gas percentage to be allocated to shippers for the upcoming fiscal year beginning July 1. On June 1, 2010, DGT filed to maintain a lost-and-unaccounted-for percentage of zero percent until July 1, 2011 and to retain the 2009 net system gains of $211 thousand that are unrelated to the lost-and-unaccounted-for gas over recovered from its shippers. By Order dated June 24, 2010 the filing was approved. The approval was subject to a 30-day protest period, which passed without protest. Similarly, we recognized net system gains of $5.4 million and $2.3 million in 2009 and 2008, respectively. As of December 31, 2010 DGT has no deferred amount included in the accompanying Consolidated Balance Sheets for unrecognized net system gains because the system experienced a net system loss of $2.6 million for the year 2010 which was recognized on the Consolidated Income Statement. At December 31, 2009, accrued liabilities on the Consolidated Balance Sheet include an unrecognized net system gain of $211 thousand.
On November 12, 2010, DGT filed with the FERC its annual Hurricane Mitigation and Reliability Enhancement (HMRE) surcharge adjustment. The filing proposed to reduce the HMRE surcharge from $0.0374 per Dt to $0.0008 per Dt, effective January 1, 2011. In the same filing, DGT also requested authority to suspend invoicing the surcharge during the year 2011 if DGT’s HMRE Deferred Cost Account reaches a zero or credit
202
Table of Contents
DISCOVERY PRODUCER SERVICES LLC
NOTES TO CONSOLIDATED FINANCIAL STATEMENTS — (Continued)
balance. The FERC approved the filing on December 29, 2010 and granted DGT the ability to suspend collection of the HMRE surcharge, provided that such suspension must be accompanied by an out-of-cycle HMRE application.
Environmental Matters. We are subject to extensive federal, state, and local environmental laws and regulations which affect our operations related to the construction and operation of our facilities. Appropriate governmental authorities may enforce these laws and regulations with a variety of civil and criminal enforcement measures, including monetary penalties, assessment and remediation requirements and injunctions as to future compliance. We have not been notified and are not currently aware of any material noncompliance under the various environmental laws and regulations.
Other. We are party to various other claims, legal actions and complaints arising in the ordinary course of business. Litigation, arbitration and environmental matters are subject to inherent uncertainties. Were an unfavorable ruling to occur, there exists the possibility of a material adverse impact on the results of operations in the period in which the ruling occurs. Management, including internal counsel, currently believes that the ultimate resolution of the foregoing matters, taken as a whole, and after consideration of amounts accrued, insurance coverage or other indemnification arrangements, will not have a material adverse effect upon our future financial position.
203
Table of Contents
(b) Exhibits
A list of exhibits required by Item 601 of Regulation S-K to be filed as part of this report:
| Exhibit |
Description | |
| 2.1* | Contribution Agreement, dated October 9, 2006, between DCP LP Holdings, LP and DCP Midstream Partners, LP (attached as Exhibit 10.1 to DCP Midstream Partners, LP’s Form 8-K (File No. 001-32678) filed with the SEC on October 13, 2006). | |
| 2.2* | Purchase and Sale Agreement, dated March 7, 2007, between Anadarko Gathering Company, Anadarko Energy Services Company and DCP Midstream Partners, LP (attached as Exhibit 99.1 to DCP Midstream Partners, LP’s current report on Form 8-K (File No. 001-32678) filed with the SEC on May 14, 2007). | |
| 2.3* | Contribution and Sale Agreement, dated May 21, 2007, between Gas Supply Resources Holdings, Inc., DCP Midstream, LLC and DCP Midstream Partners, LP (attached as Exhibit 10.1 to DCP Midstream Partners LP’s current report on Form 8-K (File No. 001-32678) filed with the SEC on May 25, 2007). | |
| 2.4* | Contribution Agreement, dated May 23, 2007, among DCP LP Holdings, LP, DCP Midstream, LLC, DCP Midstream GP, LP and DCP Midstream Partners, LP (attached as Exhibit 10.1 to DCP Midstream Partners LP’s current report on Form 8-K (File No. 001-32678) filed with the SEC on May 25, 2007). | |
| 2.5* | Contribution Agreement dated February 24, 2009, among DCP LP Holdings, LLC, DCP Midstream GP, LP DCP Midstream, LLC, and DCP Midstream Partners, LP (attached as Exhibit 10.16 to DCP Midstream Partners, LP’s Form 10-K (File No. 001-32678) filed with the SEC on March 5, 2009). | |
| 2.6* | Purchase and Sale Agreement by and Among DCP Midstream, LLC and DCP Midstream Partners, LP dated as of November 4, 2010 (attached as Exhibit 2.1 to DCP Midstream Partners, LP’s Form 8-K (File No. 001-32678) filed with the SEC on November 8, 2010). | |
| 2.7* | Contribution Agreement between DCP Southeast Texas, LLC and DCP Partners SE Texas LLC dated as of November 4, 2010 (attached as Exhibit 2.2 to DCP Midstream Partners, LP’s Form 8-K (File No. 001-32678) filed with the SEC on November 8, 2010). | |
| 3.1* | First Amended and Restated Agreement of Limited Partnership of DCP Midstream GP, LP (attached as Exhibit 3.4 to DCP Midstream Partners, LP’s Amendment No. 2 to Registration Statement on Form S-1 (File No. 333-128378) filed with the SEC on November 18, 2005). | |
| 3.2* | Amended and Restated Limited Liability Company Agreement of DCP Midstream GP, LLC (attached as Exhibit 3.6 to DCP Midstream Partners, LP’s Amendment No. 2 to Registration Statement on Form S-1 (File No. 333-128378) filed with the SEC on November 18, 2005). | |
| 3.3* | Second Amended and Restated Agreement of Limited Partnership of DCP Midstream Partners, LP (attached as Exhibit 3.1 to DCP Midstream Partners, LP’s Form 8-K (File No. 001-32678) filed with the SEC on November 7, 2006). | |
| 3.4* | Amendment No. 1 to Amended and Restated Limited Liability Company Agreement of DCP Midstream GP, LLC (attached as Exhibit 3.1 to DCP Midstream Partners, LP’s Form 10-K (File No. 001-32678) filed with the SEC on March 5, 2009). | |
| 3.5* | Amendment No. 1 to the Second Amended and Restated Agreement of Limited Partnership of DCP Midstream Partners, LP (attached as Exhibit 4.1 to DCP Midstream Partners, LP’s Form 8-K (File No. 001-32678) filed with the SEC on April 14, 2008). | |
| 3.6* | Amendment No. 2 to the Second Amended and Restated Agreement of Limited Partnership of DCP Midstream Partners, LP (attached as Exhibit 3.1 to DCP Midstream Partners, LP’s Form 8-K (File No. 001-32678) filed with the SEC on April 7, 2009). | |
| 4.1* | Indenture dated as of September 30, 2010 for the issuance of debt securities between DCP Midstream Operating, LP, as issuer, any Guarantors party hereto and The Bank of New York Mellon Trust Company, N.A. (attached as Exhibit 4.1 to DCP Midstream Partners, LP’s Form 8-K (File No. 001-32678) filed with the SEC on September 30, 2010). | |
204
Table of Contents
| Exhibit |
Description | |
| 4.2* | First Supplemental Indenture Dated as of September 30, 2010 to Indenture dated September 30, 2010 for the issuance of 3.25% Senior Notes due 2015 by DCP Midstream Operating, LP as Issuer, DCP Midstream Partners, LP as Guarantor and the Bank of New York Mellon Trust Company, N.A. (attached as Exhibit 4.2 to DCP Midstream Partners, LP’s Form 8-K (File No. 001-32678) filed with the SEC on September 30, 2010). | |
| 10.1* | Omnibus Agreement, dated December 7, 2005, among Duke Energy Field Services, LLC, DCP Midstream GP, LLC, DCP Midstream Partners, LP and DCP Midstream Operating, LP (attached as Exhibit 10.4 to DCP Midstream Partners, LP’s Form 8-K (File No. 001-32678) filed with the SEC on December 12, 2005). | |
| 10.2*+ | DCP Midstream Partners, LP Long-Term Incentive Plan (attached as Exhibit 10.2 to DCP Midstream Partners, LP’s Form 8-K (File No. 001-32678) filed with the SEC on December 12, 2005). | |
| 10.3*+ | Form of Phantom Unit and DERs Grant for Directors under the DCP Midstream Partners, LP Long-Term Incentive Plan (attached as Exhibit 4.3 to DCP Midstream Partners, LP’s Form S-8 (File No. 001-32678) filed with the SEC on April 20, 2007). | |
| 10.4*+ | Form of Performance Phantom Unit Grant Agreement for Officers/Employees under the DCP Midstream Partners, LP Long-Term Incentive Plan (attached as Exhibit 10.1 to DCP Midstream Partners, LP’s Form 8-K (File No. 001-32678) filed with the SEC on February 24, 2011). | |
| 10.5+ | Form of Restricted Phantom Unit Grant Agreement under the DCP Midstream Partners, LP Long-Term Incentive Plan. | |
| 10.6* | Contribution, Conveyance and Assumption Agreement, dated December 7, 2005, among DCP Midstream Partners, LP, DCP Midstream Operating LP, DCP Midstream GP, LLC, DCP Midstream GP, LP, Duke Energy Field Services, LLC, DEFS Holding 1, LLC, DEFS Holding, LLC, DCP Assets Holdings, LP, DCP Assets Holdings, GP, LLC, Duke Energy Guadalupe Pipeline Holdings, Inc., Duke Energy NGL Services, LP, DCP LP Holdings, LP and DCP Black Lake Holdings, LLC (attached as Exhibit 10.3 to DCP Midstream Partners, LP’s Form 8-K (File No. 001-32678) filed with the SEC on December 12, 2005). | |
| 10.7* | First Amendment to Omnibus Agreement, dated April 1, 2006, among Duke Energy Field Services, LLC, DCP Midstream GP, LLC, DCP Midstream Partners, LP and DCP Midstream Operating, LP (attached as Exhibit 10.6 to DCP Midstream Partners, LP’s Form 10-Q (File No. 001-32678) filed with the SEC on August 11, 2006). | |
| 10.8* | Second Amendment to Omnibus Agreement, dated November 1, 2006, among Duke Energy Field Services, LLC, DCP Midstream GP, LLC, DCP Midstream GP, LP, DCP Midstream Partners, LP and DCP Midstream Operating, LP (attached as Exhibit 10.2 to DCP Midstream Partners, LP’s Form 8-K (File No. 001-32678) filed with the SEC on November 7, 2006). | |
| 10.9* | Third Amendment to Omnibus Agreement, dated May 9, 2007, among DCP Midstream, LLC (f/k/a Duke Energy Field Services, LLC), DCP Midstream GP, LLC, DCP Midstream Partners, LP, DCP Midstream GP, LP, and DCP Midstream Operating, LP (attached as Exhibit 99.3 to DCP Midstream Partners LP’s current report on Form 8-K (File No. 001-32678) filed with the SEC on May 14, 2007). | |
| 10.10* | First Amendment to Credit Agreement, dated May 9, 2007, among DCP Midstream Operating, LP, DCP Midstream Partners, LP and Wachovia Bank, National Association (attached as Exhibit 99.4 to DCP Midstream Partners LP’s current report on Form 8-K (File No. 001-32678) filed with the SEC on May 14, 2007). | |
| 10.11* | Amended and Restated Credit Agreement, dated June 21, 2007, among DCP Midstream Operating, LP, DCP Midstream Partners, LP and Wachovia Bank, National Association as Administrative Agent (attached as Exhibit 10.1 to DCP Midstream Partners LP’s current report on Form 10-Q (File No. 001-32678) filed with the SEC on November 9, 2010). | |
205
Table of Contents
| Exhibit |
Description | |
| 10.12* | Fourth Amendment to Omnibus Agreement, dated July 1, 2007, by and among DCP Midstream, LLC f/k/a/ Duke Energy Field Services, LLC, DCP Midstream GP, LLC, DCP Midstream GP, LP, DCP Midstream Partners, LP, and DCP Midstream Operating, LP (attached as Exhibit 10.2 to DCP Midstream Partners LP’s current report on Form 8-K (File No. 001-32678) filed with the SEC on July 2, 2007). | |
| 10.13* | Amended and Restated Limited Liability Company Agreement of DCP East Texas Holdings, LLC, dated July 1, 2007, between DCP Midstream, LLC and DCP Assets Holding, LP (attached as Exhibit 10.3 to DCP Midstream Partners LP’s current report on Form 8-K (File No. 001-32678) filed with the SEC on July 2, 2007). | |
| 10.14* | Fifth Amendment to Omnibus Agreement dated August 7, 2007, among DCP Midstream, LLC, DCP Midstream GP, LLC, DCP Midstream GP, LP, DCP Midstream Partners, LP, and DCP Midstream Operating, LP (attached as Exhibit 10.1 to DCP Midstream Partners, LP’s Form 10-Q (File No. 001-32678) filed with the SEC on August 9, 2007). | |
| 10.15* | Sixth Amendment to Omnibus Agreement, dated August 29, 2007, among DCP Midstream, LLC, DCP Midstream GP, LLC, DCP Midstream GP, LP, DCP Midstream Partners, LLC, and DCP Midstream Operating, LP (attached as Exhibit 10.1 to DCP Midstream Partners LP’s current report on Form 8-K (File No. 001-32678) filed with the SEC on September 5, 2007). | |
| 10.16* | Second Amended and Restated Limited Liability Company Agreement of DCP East Texas Holdings, LLC, dated April 1, 2009 between DCP Midstream, LLC and DCP Assets Holding, LP (attached as Exhibit 10.2 to DCP Midstream Partners, LP’s current report on Form 8-K (File No. 001-32678) filed with the SEC on April 7, 2009). | |
| 10.17* | Tenth Amendment to Omnibus Agreement, dated December 3, 2009, among DCP Midstream, LLC, DCP Midstream GP, LLC, DCP Midstream GP, LP, DCP Midstream Partners, LLC, and DCP Midstream Operating, LP (attached as Exhibit 10.25 to DCP Midstream Partners, LP’s Form 10-K (File No. 001-32678) filed with the SEC on March 11, 2010). | |
| 10.18*++ | Amended and Restated General Partnership Agreement of DCP Southeast Texas Holdings, GP, dated as of January 1, 2011, by and among DCP Southeast Texas, LLC, Gas Supply Resources Holdings, Inc. and DCP Partners SE Texas LLC, (attached as Exhibit 10.1 to DCP Midstream Partners, LP’s current report on Form 8-K (File No. 001-32678) filed with the SEC on January 6, 2011). | |
| 10.19 | Twelfth Amendment to Omnibus Agreement, dated January 1, 2011, among DCP Midstream, LLC, DCP Midstream GP, LLC, DCP Midstream GP, LP, DCP Midstream Partners, LLC, and DCP Midstream Operating, LP | |
| 10.20*++ | Propane Sales Contract between Spectra Energy Propane LLC and Gas Supply Resources LLC effective May 1, 2008 (attached as Exhibit 10.1 to DCP Midstream Partners, LP’s Periodic Report (File No. 001-32678) on Form 10-Q filed August 8, 2008. | |
| 10.21*++ | Amendment dated June 15, 2010 to Propane Sales Contract between Spectra Energy Propane LLC and Gas Supply Resources LLC effective May 1, 2008 (attached as Exhibit 10.2 to DCP Midstream Partners, LP’s Periodic Report (File No. 001-32678) on Form 10-Q filed August 9, 2010. | |
| 10.22 | First Amendment to Amended and Restated General Partnership Agreement of DCP Southeast Texas, LLC, Gas Supply Resources Holdings, Inc. and DCP Partners SE Texas, LLC. | |
| 12.1 | Ratio of Earnings to Fixed Charges. | |
| 21.1 | List of Subsidiaries of DCP Midstream Partners, LP. | |
| 23.1 | Consent of Deloitte & Touche LLP on Consolidated Financial Statements of DCP Midstream Partners, LP and the effectiveness of DCP Midstream Partners, LP’s internal control over financial reporting. | |
206
Table of Contents
| Exhibit |
Description | |
| 23.2 | Consent of Ernst & Young LLP on Consolidated Financial Statements of Discovery Producer Services LLC. | |
| 31.1 | Certification of Chief Executive Officer pursuant to Section 302 of the Sarbanes-Oxley Act of 2002. | |
| 31.2 | Certification of Chief Financial Officer pursuant to Section 302 of the Sarbanes-Oxley Act of 2002. | |
| 32.1 | Certification of Chief Executive Officer pursuant to 18 U.S.C. Section 1350, as adopted pursuant to Section 906 of the Sarbanes-Oxley Act of 2002. | |
| 32.2 | Certification of Chief Financial Officer pursuant to 18 U.S.C. Section 1350, as adopted pursuant to Section 906 of the Sarbanes-Oxley Act of 2002. | |
| * | Each such exhibit has heretofore been filed with the SEC as part of the filing indicated and is incorporated herein by reference. |
| + | Denotes management contract or compensatory plan or arrangement. |
| ++ | Confidential treatment has been requested with respect to portions of the exhibit. Such portions have been redacted and filed separately with the SEC. |
207
Table of Contents
Pursuant to the requirements of the Section 13 or 15(d) of the Securities Exchange Act of 1934, the Registrant has duly caused this Report to be signed on its behalf by the undersigned, thereunto duly authorized, in the City of Denver, State of Colorado, on March 1, 2011.
| DCP Midstream Partners, LP | ||
| By: | DCP Midstream GP, LP | |
| its General Partner | ||
| By: | DCP Midstream GP, LLC | |
| its General Partner | ||
| By: | /s/ Mark A. Borer | |
| Name: Mark A. Borer Title: President and Chief Executive Officer | ||
208
Table of Contents
POWER OF ATTORNEY
KNOW ALL PERSONS BY THESE PRESENTS that each person whose signature appears below constitutes and appoints each of Mark A. Borer and Angela A. Minas as his/her true and lawful attorney-in-fact and agent, with full power of substitution and resubstitution, for him or in his name, place, and stead, in any and all capacities, to sign any and all amendments (including post-effective amendments) to this annual report, and to file the same, with all exhibits thereto, and other documents in connection therewith, with the Securities and Exchange Commission, granting unto said attorney-in-fact and agent full power and authority to do and perform each and every act and thing requisite and necessary to be done in connection therewith, as fully to all intents and purposes as he might or could do in person, hereby ratifying and confirming all that said attorney-in-fact and agent or their or his substitute or substitutes, may lawfully do or cause to be done by virtue hereof.
Pursuant to the requirements of the Securities Exchange Act of 1934, this Report has been signed below by the following persons on behalf of the Registrant and in the capacities and on the dates indicated.
| Signature |
Title |
Date | ||
| /s/ Mark A. Borer Mark A. Borer |
President, Chief Executive Officer and Director (Principal Executive Officer) | March 1, 2011 | ||
| /s/ Angela A. Minas Angela A. Minas |
Vice President and Chief Financial Officer (Principal Financial Officer) | March 1, 2011 | ||
| /s/ Scott R. Delmoro Scott R. Delmoro |
Chief Accounting Officer (Principal Accounting Officer) | March 1, 2011 | ||
| /s/ Thomas C. O’Connor Thomas C. O’Connor |
Chairman of the Board and Director | March 1, 2011 | ||
| /s/ Paul F. Ferguson, Jr. Paul F. Ferguson, Jr. |
Director | March 1, 2011 | ||
| /s/ Alan N. Harris Alan N. Harris |
Director | March 1, 2011 | ||
| /s/ Donald G. Hrap Donald G. Hrap |
Director | March 1, 2011 | ||
| /s/ John E. Lowe John E. Lowe |
Director | March 1, 2011 | ||
| /s/ Frank A. McPherson Frank A. McPherson |
Director | March 1, 2011 | ||
| /s/ Thomas C. Morris Thomas C. Morris |
Director | March 1, 2011 | ||
| /s/ Stephen R. Springer Stephen R. Springer |
Director | March 1, 2011 | ||
209
Table of Contents
| Exhibit |
Description | |
| 2.1* | Contribution Agreement, dated October 9, 2006, between DCP LP Holdings, LP and DCP Midstream Partners, LP (attached as Exhibit 10.1 to DCP Midstream Partners, LP’s Form 8-K (File No. 001-32678) filed with the SEC on October 13, 2006). | |
| 2.2* | Purchase and Sale Agreement, dated March 7, 2007, between Anadarko Gathering Company, Anadarko Energy Services Company and DCP Midstream Partners, LP (attached as Exhibit 99.1 to DCP Midstream Partners, LP’s current report on Form 8-K (File No. 001-32678) filed with the SEC on May 14, 2007). | |
| 2.3* | Contribution and Sale Agreement, dated May 21, 2007, between Gas Supply Resources Holdings, Inc., DCP Midstream, LLC and DCP Midstream Partners, LP (attached as Exhibit 10.1 to DCP Midstream Partners LP’s current report on Form 8-K (File No. 001-32678) filed with the SEC on May 25, 2007). | |
| 2.4* | Contribution Agreement, dated May 23, 2007, among DCP LP Holdings, LP, DCP Midstream, LLC, DCP Midstream GP, LP and DCP Midstream Partners, LP (attached as Exhibit 10.1 to DCP Midstream Partners LP’s current report on Form 8-K (File No. 001-32678) filed with the SEC on May 25, 2007). | |
| 2.5* | Contribution Agreement dated February 24, 2009, among DCP LP Holdings, LLC, DCP Midstream GP, LP DCP Midstream, LLC, and DCP Midstream Partners, LP (attached as Exhibit 10.16 to DCP Midstream Partners, LP’s Form 10-K (File No. 001-32678) filed with the SEC on March 5, 2009). | |
| 2.6* | Purchase and Sale Agreement by and Among DCP Midstream, LLC and DCP Midstream Partners, LP dated as of November 4, 2010 (attached as Exhibit 2.1 to DCP Midstream Partners, LP’s Form 8-K (File No. 001-32678) filed with the SEC on November 8, 2010). | |
| 2.7* | Contribution Agreement between DCP Southeast Texas, LLC and DCP Partners SE Texas LLC dated as of November 4, 2010 (attached as Exhibit 2.2 to DCP Midstream Partners, LP’s Form 8-K (File No. 001-32678) filed with the SEC on November 8, 2010). | |
| 3.1* | First Amended and Restated Agreement of Limited Partnership of DCP Midstream GP, LP (attached as Exhibit 3.4 to DCP Midstream Partners, LP’s Amendment No. 2 to Registration Statement on Form S-1 (File No. 333-128378) filed with the SEC on November 18, 2005). | |
| 3.2* | Amended and Restated Limited Liability Company Agreement of DCP Midstream GP, LLC (attached as Exhibit 3.6 to DCP Midstream Partners, LP’s Amendment No. 2 to Registration Statement on Form S-1 (File No. 333-128378) filed with the SEC on November 18, 2005). | |
| 3.3* | Second Amended and Restated Agreement of Limited Partnership of DCP Midstream Partners, LP (attached as Exhibit 3.1 to DCP Midstream Partners, LP’s Form 8-K (File No. 001-32678) filed with the SEC on November 7, 2006). | |
| 3.4* | Amendment No. 1 to Amended and Restated Limited Liability Company Agreement of DCP Midstream GP, LLC (attached as Exhibit 3.1 to DCP Midstream Partners, LP’s Form 10-K (File No. 001-32678) filed with the SEC on March 5, 2009). | |
| 3.5* | Amendment No. 1 to the Second Amended and Restated Agreement of Limited Partnership of DCP Midstream Partners, LP (attached as Exhibit 4.1 to DCP Midstream Partners, LP’s Form 8-K (File No. 001-32678) filed with the SEC on April 14, 2008). | |
| 3.6* | Amendment No. 2 to the Second Amended and Restated Agreement of Limited Partnership of DCP Midstream Partners, LP (attached as Exhibit 3.1 to DCP Midstream Partners, LP’s Form 8-K (File No. 001-32678) filed with the SEC on April 7, 2009). | |
| 4.1* | Indenture dated as of September 30, 2010 for the issuance of debt securities between DCP Midstream Operating, LP, as issuer, any Guarantors party hereto and The Bank of New York Mellon Trust Company, N.A. (attached as Exhibit 4.1 to DCP Midstream Partners, LP’s Form 8-K (File No. 001-32678) filed with the SEC on September 30, 2010). | |
210
Table of Contents
| 4.2* | First Supplemental Indenture Dated as of September 30, 2010 to Indenture dated September 30, 2010 for the issuance of 3.25% Senior Notes due 2015 by DCP Midstream Operating, LP as Issuer, DCP Midstream Partners, LP as Guarantor and the Bank of New York Mellon Trust Company, N.A. (attached as Exhibit 4.2 to DCP Midstream Partners, LP’s Form 8-K (File No. 001-32678) filed with the SEC on September 30, 2010). | |
| 10.1* | Omnibus Agreement, dated December 7, 2005, among Duke Energy Field Services, LLC, DCP Midstream GP, LLC, DCP Midstream Partners, LP and DCP Midstream Operating, LP (attached as Exhibit 10.4 to DCP Midstream Partners, LP’s Form 8-K (File No. 001-32678) filed with the SEC on December 12, 2005). | |
| 10.2*+ | DCP Midstream Partners, LP Long-Term Incentive Plan (attached as Exhibit 10.2 to DCP Midstream Partners, LP’s Form 8-K (File No. 001-32678) filed with the SEC on December 12, 2005). | |
| 10.3*+ | Form of Phantom Unit Grant Agreement for Directors under the DCP Midstream Partners, LP Long-Term Incentive Plan (attached as Exhibit 4.3 to DCP Midstream Partners, LP’s Form S-8 (File No. 001-32678) filed with the SEC on April 20, 2007). | |
| 10.4*+ | Form of Performance Phantom Unit Grant Agreement for Officers/Employees under the DCP Midstream Partners, LP Long-Term Incentive Plan (attached as Exhibit 10.1 to DCP Midstream Partners, LP’s Form 8-K (File No. 001-32678) filed with the SEC on February 24, 2011). | |
| 10.5+ | Form of Restricted Phantom Unit Grant Agreement under the DCP Midstream Partners, LP Long-Term Incentive Plan. | |
| 10.6* | Contribution, Conveyance and Assumption Agreement, dated December 7, 2005, among DCP Midstream Partners, LP, DCP Midstream Operating LP, DCP Midstream GP, LLC, DCP Midstream GP, LP, Duke Energy Field Services, LLC, DEFS Holding 1, LLC, DEFS Holding, LLC, DCP Assets Holdings, LP, DCP Assets Holdings, GP, LLC, Duke Energy Guadalupe Pipeline Holdings, Inc., Duke Energy NGL Services, LP, DCP LP Holdings, LP and DCP Black Lake Holdings, LLC (attached as Exhibit 10.3 to DCP Midstream Partners, LP’s Form 8-K (File No. 001-32678) filed with the SEC on December 12, 2005). | |
| 10.7* | First Amendment to Omnibus Agreement, dated April 1, 2006, among Duke Energy Field Services, LLC, DCP Midstream GP, LLC, DCP Midstream Partners, LP and DCP Midstream Operating, LP (attached as Exhibit 10.6 to DCP Midstream Partners, LP’s Form 10-Q (File No. 001-32678) filed with the SEC on August 11, 2006). | |
| 10.8* | Second Amendment to Omnibus Agreement, dated November 1, 2006, among Duke Energy Field Services, LLC, DCP Midstream GP, LLC, DCP Midstream GP, LP, DCP Midstream Partners, LP and DCP Midstream Operating, LP (attached as Exhibit 10.2 to DCP Midstream Partners, LP’s Form 8-K (File No. 001-32678) filed with the SEC on November 7, 2006). | |
| 10.9* | Third Amendment to Omnibus Agreement, dated May 9, 2007, among DCP Midstream, LLC (f/k/a Duke Energy Field Services, LLC), DCP Midstream GP, LLC, DCP Midstream Partners, LP, DCP Midstream GP, LP, and DCP Midstream Operating, LP (attached as Exhibit 99.3 to DCP Midstream Partners LP’s current report on Form 8-K (File No. 001-32678) filed with the SEC on May 14, 2007). | |
| 10.10* | First Amendment to Credit Agreement, dated May 9, 2007, among DCP Midstream Operating, LP, DCP Midstream Partners, LP and Wachovia Bank, National Association (attached as Exhibit 99.4 to DCP Midstream Partners LP’s current report on Form 8-K (File No. 001-32678) filed with the SEC on May 14, 2007). | |
211
Table of Contents
| 10.11* | Amended and Restated Credit Agreement, dated June 21, 2007, among DCP Midstream Operating, LP, DCP Midstream Partners, LP and Wachovia Bank, National Association as Administrative Agent (attached as Exhibit 10.1 to DCP Midstream Partners LP’s current report on Form 10-Q (File No. 001-32678) filed with the SEC on November 9, 2010). | |
| 10.12* | Fourth Amendment to Omnibus Agreement, dated July 1, 2007, by and among DCP Midstream, LLC f/k/a/ Duke Energy Field Services, LLC, DCP Midstream GP, LLC, DCP Midstream GP, LP, DCP Midstream Partners, LP, and DCP Midstream Operating, LP (attached as Exhibit 10.2 to DCP Midstream Partners LP’s current report on Form 8-K (File No. 001-32678) filed with the SEC on July 2, 2007). | |
| 10.13* | Amended and Restated Limited Liability Company Agreement of DCP East Texas Holdings, LLC, dated July 1, 2007, between DCP Midstream, LLC and DCP Assets Holding, LP (attached as Exhibit 10.3 to DCP Midstream Partners LP’s current report on Form 8-K (File No. 001-32678) filed with the SEC on July 2, 2007). | |
| 10.14* | Fifth Amendment to Omnibus Agreement dated August 7, 2007, among DCP Midstream, LLC, DCP Midstream GP, LLC, DCP Midstream GP, LP, DCP Midstream Partners, LP, and DCP Midstream Operating, LP (attached as Exhibit 10.1 to DCP Midstream Partners, LP’s Form 10-Q (File No. 001-32678) filed with the SEC on August 9, 2007). | |
| 10.15* | Sixth Amendment to Omnibus Agreement, dated August 29, 2007, among DCP Midstream, LLC, DCP Midstream GP, LLC, DCP Midstream GP, LP, DCP Midstream Partners, LLC, and DCP Midstream Operating, LP (attached as Exhibit 10.1 to DCP Midstream Partners LP’s current report on Form 8-K (File No. 001-32678) filed with the SEC on September 5, 2007). | |
| 10.16* | Second Amended and Restated Limited Liability Company Agreement of DCP East Texas Holdings, LLC, dated April 1, 2009 between DCP Midstream, LLC and DCP Assets Holding, LP (attached as Exhibit 10.2 to DCP Midstream Partners, LP’s current report on Form 8-K (File No. 001-32678) filed with the SEC on April 7, 2009). | |
| 10.17* | Tenth Amendment to Omnibus Agreement, dated December 3, 2009, among DCP Midstream, LLC, DCP Midstream GP, LLC, DCP Midstream GP, LP, DCP Midstream Partners, LLC, and DCP Midstream Operating, LP (attached as Exhibit 10.25 to DCP Midstream Partners, LP’s Form 10-K (File No. 001-32678) filed with the SEC on March 11, 2010). | |
| 10.18*++ | Amended and Restated General Partnership Agreement of DCP Southeast Texas Holdings, GP, dated as of January 1, 2011, by and among DCP Southeast Texas, LLC, Gas Supply Resources Holdings, Inc. and DCP Partners SE Texas LLC, (attached as Exhibit 10.1 to DCP Midstream Partners, LP’s current report on Form 8-K (File No. 001-32678) filed with the SEC on January 6, 2011). | |
| 10.19 | Twelfth Amendment to Omnibus Agreement, dated January 1, 2011, among DCP Midstream, LLC, DCP Midstream GP, LLC, DCP Midstream GP, LP, DCP Midstream Partners, LLC, and DCP Midstream Operating, LP | |
| 10.20*++ | Propane Sales Contract between Spectra Energy Propane LLC and Gas Supply Resources LLC effective May 1, 2008 (attached as Exhibit 10.1 to DCP Midstream Partners, LP’s Periodic Report (File No. 001-32678) on Form 10-Q filed August 8, 2008. | |
| 10.21*++ | Amendment dated June 15, 2010 to Propane Sales Contract between Spectra Energy Propane LLC and Gas Supply Resources LLC effective May 1, 2008 (attached as Exhibit 10.2 to DCP Midstream Partners, LP’s Periodic Report (File No. 001-32678) on Form 10-Q filed August 9, 2010. | |
| 10.22 | First Amendment to Amended and Restated General Partnership Agreement of DCP Southeast Texas, LLC, Gas Supply Resources Holdings, Inc. and DCP Partners SE Texas, LLC. | |
| 12.1 | Ratio of Earnings to Fixed Charges. | |
| 21.1 | List of Subsidiaries of DCP Midstream Partners, LP. | |
212
Table of Contents
| 23.1 | Consent of Deloitte & Touche LLP on Consolidated Financial Statements of DCP Midstream Partners, LP and the effectiveness of DCP Midstream Partners, LP’s internal control over financial reporting. | |
| 23.2 | Consent of Ernst & Young LLP on Consolidated Financial Statements of Discovery Producer Services LLC. | |
| 31.1 | Certification of Chief Executive Officer pursuant to Section 302 of the Sarbanes-Oxley Act of 2002. | |
| 31.2 | Certification of Chief Financial Officer pursuant to Section 302 of the Sarbanes-Oxley Act of 2002. | |
| 32.1 | Certification of Chief Executive Officer pursuant to 18 U.S.C. Section 1350, as adopted pursuant to Section 906 of the Sarbanes-Oxley Act of 2002. | |
| 32.2 | Certification of Chief Financial Officer pursuant to 18 U.S.C. Section 1350, as adopted pursuant to Section 906 of the Sarbanes-Oxley Act of 2002. | |
| * | Each such exhibit has heretofore been filed with the SEC as part of the filing indicated and is incorporated herein by reference. |
| + | Denotes management contract or compensatory plan or arrangement. |
| ++ | Confidential treatment has been requested with respect to portions of the exhibit. Such portions have been redacted and filed separately with the SEC. |
213