Attached files
UNITED STATES
SECURITIES AND EXCHANGE COMMISSION
Washington, D.C. 20549
FORM 10-K
(Mark One)
| x | ANNUAL REPORT PURSUANT TO SECTION 13 OR 15(d) OF THE SECURITIES EXCHANGE ACT OF 1934 |
For the fiscal year ended December 31, 2010
OR
| ¨ | TRANSITION REPORT PURSUANT TO SECTION 13 OR 15(d) OF THE SECURITIES EXCHANGE ACT OF 1934 |
For the transition period from to
Commission file number: 001-34781
Motricity, Inc.
(Exact Name of Registrant as Specified in its Charter)
| Delaware | 20-1059798 | |
| (State of Incorporation) | (IRS Employer Identification No.) |
601 108th Ave Northeast
Suite 800
Bellevue, WA 98004
(425) 957-6200
(Address, including zip code, and telephone number, including area code, of registrant’s principal executive offices)
Securities registered pursuant to Section 12(b) of the Act:
| Title of each class |
Name of each exchange on which registered | |
| Common Stock, par value $0.001 per share | NASDAQ |
Securities registered pursuant to Section 12(g) of the Act: None
Indicate by check mark if the registrant is a well-known seasoned issuer, as defined in Rule 405 of the Securities Act. Yes ¨ No x
Indicate by check mark if the registrant is not required to file reports pursuant to Section 13 or Section 15(d) of the Act. Yes ¨ No x
Indicate by check mark whether the Registrant (1) has filed all reports required to be filed by Section 13 or 15(d) of the Securities Exchange Act of 1934 during the preceding 12 months (or for such shorter period that the Registrant was required to file such reports), and (2) has been subject to such filing requirements for the past 90 days. Yes x No ¨
Indicate by check mark whether the registrant has submitted electronically and posted on its corporate Web site, if any, every Interactive Data File required to be submitted and posted pursuant to Rule 405 of Regulation S-T (§232.405 of this chapter) during the preceding 12 months (or for such shorter period that the registrant was required to submit and post such files). Yes ¨ No ¨
Indicate by check mark if disclosure of delinquent filers pursuant to Item 405 of Regulation S-K is not contained herein, and will not be contained, to the best of Registrant’s knowledge, in definitive proxy or information statements incorporated by reference in Part III of this Form 10-K or any amendment to this Form 10-K. ¨
Indicate by check mark whether the registrant is a large accelerated filer, an accelerated filer, a non-accelerated filer, or a smaller reporting company. See definitions of “large accelerated filer,” “accelerated filer” and “smaller reporting company” in Rule 12b-2 of the Exchange Act. (Check one):
| Large Accelerated Filer | ¨ | Accelerated Filer | ¨ | |||
| Non-accelerated Filer | x (do not check if a smaller reporting company) | Smaller Reporting Company | ¨ |
Indicate by check mark whether the registrant is a shell company (as defined in Rule 12b-2 of the Act). Yes ¨ No x
At June 30, 2010, the last business day of the Registrant’s most recently completed second fiscal quarter, the aggregate market value of the voting and non-voting common equity held by non-affiliates of the Registrant (based upon the closing sale price of such shares on NASDAQ on June 30, 2010) was approximately $121.3 million. Shares of Registrant’s common stock held by each executive officer and director and by each entity or person that, to the Registrant’s knowledge, owned 5% or more of Registrant’s outstanding common stock as of June 30, 2010 have been excluded in that such persons may be deemed to be affiliates of the Registrant. This determination of affiliate status is not necessarily a conclusive determination for other purposes.
Indicate the number of shares outstanding of each of the Registrant’s classes of common stock as of February 18, 2011:
| Title of Class |
Number of Shares | |
| Common Stock, $0.001 par value | 43,083,831 |
DOCUMENTS INCORPORATED BY REFERENCE
Part III incorporates certain information by reference from the Registrant’s proxy statement for the 2011 annual meeting of stockholders, which will be filed no later than 120 days after the close of the Registrant’s fiscal year ended December 31, 2010. In the event such proxy statement is not filed within 120 days after the close of the Registrant’s fiscal year ended December 30, 2010, the required information will be filed as an amendment to this report on Form 10-K no later than that date.
PART I
| Item 1. | Business. |
Overview
We are a leading provider of mobile data solutions that enable wireless carriers and enterprises to deliver high value mobile data services to their subscribers and customers. We provide a comprehensive suite of hosted, managed service offerings, which includes services to access the Internet using a mobile device, services to market and distribute a wide range of mobile content and applications, messaging services and billing support and settlement services. These services enable wireless carriers to deliver customized, carrier-branded mobile data services and provide enterprises with a means to gain direct, interactive access to their customers through the mobile device.
Our mCore service delivery platform provides the tools for mobile subscribers to easily locate and access personally relevant and location-based content and services, engage in social networking and download content and applications. We also leverage our data-rich insights into subscriber behavior and our user interface expertise to provide a highly personalized mobile data experience and targeted mobile marketing solutions. By enabling wireless carriers to deliver a personalized subscriber experience, we enhance their ability to attract and retain mobile subscribers, increase the average revenue per user for mobile data services, or mobile data ARPU, and reduce network overhead and operating costs. We also facilitate effective monetization for mobile content and application providers by making it easier for them to reach millions of targeted subscribers with customized offerings. For enterprises, we enable the use of mobile data services to help attract new customers and retain existing customers while at the same time creating new opportunities for revenue generation and cost reduction for their existing business.
Our operations are predominantly based in the U.S., with international operations in the Europe, India and Southeast Asia. Our customers include the top U.S. wireless carriers, Verizon Wireless, AT&T and Sprint as well as leading international carriers, including members of the Axiata Group (XL, Celcom, Dialog, Robi and Hello) and Reliance. Since 2005, Motricity has generated over $2.7 billion in gross revenue for our carrier customers through the sale of content and applications and powered over 60 billion page views through access to the mobile Internet. For year ended December 31, 2010, we generated revenue of $133.4 million and incurred a net loss of $7.0 million. For the year ended December 31, 2009, we generated revenue of $113.7 million and incurred a net loss of $16.3 million. For the year ended December 31, 2008, we generated revenue of $103.2 million and incurred a net loss of $78.0 million. Revenue from managed services accounted for 68%, 72% and 83% of our revenues for the years ended December 31, 2010, 2009 and 2008, respectively, while revenue from professional services accounted for 32%, 28% and 17% of total revenues in each period, respectively. See Note 2 to our consolidated financial statements for revenues attributed to, and long-lived assets located in, the U.S. and all foreign countries.
History
Motricity, Inc., a Delaware corporation, was incorporated on March 17, 2004 under the name Power By Hand, Inc. (“PBH, Inc.”). PBH, Inc. was formed as a new entity to be the surviving corporation in the merger of Pinpoint Networks, Inc. (the acquiring corporation for accounting purposes) and Power By Hand Holdings, LLC (“PBH Holdings”), which occurred on April 30, 2004. On October 29, 2004, we changed our name from Power By Hand, Inc. to Motricity, Inc. In 2007, we acquired the assets of the mobile division of InfoSpace, Inc. (“InfoSpace Mobile”). Located in Bellevue, Washington, InfoSpace Mobile was a provider of mobile content solutions and services for the wireless industry. On June 23, 2010, we completed our offering of 6,000,000 shares of common stock in an initial public offering. Our common stock is currently traded publicly on the NASDAQ Global Market under the symbol “MOTR.”
2
Recent Developments
On January 31, 2011, we entered into an arrangement agreement (the “Arrangement Agreement”) with Adenyo, Inc., a corporation incorporated pursuant to the federal laws of Canada (“Adenyo”) and the other parties signatory thereto. Adenyo is a mobile marketing, advertising and analytics solutions provider with operations in the United States, Canada and France. Pursuant to the Arrangement Agreement, one of our wholly-owned subsidiaries will acquire all the outstanding common shares of Adenyo for an aggregate purchase price of approximately $100 million (plus a contingent “earn-out” payment of up to $50 million), subject to working capital and other customary adjustments, and Adenyo will become a wholly-owned subsidiary. We will pay no less than $50 million of the initial $100 million purchase price with cash consideration, and the remaining consideration will be payable in our discretion in cash, shares of Company common stock, or a mix of cash and shares. We expect to complete the acquisition of Adenyo in April 2011.
Industry background
The market for mobile data services
The number of mobile subscribers has grown rapidly over the past 10 years. The Yankee Group, an independent market research firm, estimates that the number of mobile subscribers in the U.S. will grow from 285 million in 2009 to 304 million in 2013, and worldwide will grow from 4.4 billion in 2009 to 5.3 billion in 2013. Emerging markets, such as those in Southeast Asia, India and Latin America, are experiencing the most rapid growth in mobile subscribers. Early mobile subscribers used mobile phones primarily for voice services, as mobile data services were not available on the initial wireless networks. The Yankee Group estimates that the proportion of U.S. subscribers owning smartphones increased to 12% in 2009 from 9% in 2008 and 6% in 2007. The share of smartphones as a percentage of the overall mobile device market is projected to continue growing. With the advent of the Internet and the evolution of wireless networks and mobile phones, mobile subscribers have increased their demand for mobile content, including information, images, music and video, and for mobile applications, including games and productivity tools.
The Yankee Group estimates that the mobile data services market in the U.S. will grow from $40 billion in 2009 to $48 billion in 2013, and worldwide will grow from $195 billion in 2009 to $253 billion in 2013. The mobile data services market predominantly includes data access, content and applications, commerce and messaging services. We believe the current market for our services is the mobile content delivery platform market, which includes portals and mobile marketplaces. Given the complexity of this market, wireless carriers often use third-party content delivery platforms to deliver mobile data services to their subscribers. The Yankee Group estimates that the North American market for mobile content delivery platforms will grow from $553 million in 2009 to $862 million in 2013, which represents a compound annual growth rate of 12%, and worldwide will grow from $2.9 billion in 2009 to $4.3 billion in 2013, which represents a compound annual growth rate of 11%. This market is projected to continue to grow as wireless carriers continue to improve the speed and quality, and lower the total cost, of mobile data services, and as mobile phone manufacturers continue to develop and deliver mobile phones with increasing levels of features and functions, addressing mobile subscriber demand. This will be especially the case in emerging markets, where wireless carriers are still in the process of rolling out 3G networks and will need to provide mobile data services that are differentiated, high value and cost effective to implement and to manage. Finally, as mobile data services become more heavily adopted, enterprises will increasingly desire to have a mobile presence and to include mobile as part of their overall marketing and distribution approach.
Wireless carrier dynamics
Wireless carriers operate in a highly competitive market and face growing challenges to attract and retain subscribers and expand total ARPU. As the demand for mobile data services continues to grow, the following industry dynamics affect wireless carriers:
Mobile voice ARPU declining. As the market for mobile voice services has matured and becomes more commoditized, competition among wireless carriers to acquire and retain subscribers has intensified, placing
3
greater downward pressure on voice services revenue. The Yankee Group estimates that monthly mobile voice ARPU in the U.S. will decline from $40.67 in 2009 to $36.34 in 2013, and worldwide will decline from $13.94 in 2009 to $11.89 in 2013.
Mobile data ARPU increasing. The rising capabilities of data-enabled mobile devices combined with the increasing capacity and speed of wireless networks has resulted in significant growth in the demand for mobile data services. Mobile data ARPU has been increasing, which we believe is due to wireless carriers aggressively marketing new mobile data services and pricing plans to attract and retain mobile subscribers. The Yankee Group estimates that the monthly mobile data ARPU in the U.S. will increase from $12.15 in 2009 to $13.16 in 2013, and worldwide will grow from $3.88 in 2009 to $4.06 in 2013. As wireless carriers continue to spend billions of dollars upgrading their wireless networks to handle the accelerated growth in data traffic, they are expected to continue to focus on growing mobile data revenue.
Smartphone market share increasing. With the launch of the newest versions of the iPhone, Android and Blackberry, smartphones are becoming an increased percentage of phones serviced by the wireless carriers. The Yankee Group estimates that the proportion of U.S. subscribers owning smartphones increased to 12% in 2009 from 9% in 2008 and 6% in 2007. The share of smartphones as a percentage of the overall mobile device market is projected to continue growing. We believe that these smartphone users tend to use more data services due to the enhanced capabilities of their devices. As the percentage of smartphones increases further, wireless carriers will need to understand how to extend their mobile data services to allow for application and content delivery to these new phones.
Premium content and applications revenue increasing. As the capabilities of mobile devices and mobile data networks continue to increase and as consumers come to expect more from their mobile experience, the market for premium content and applications will continue to expand. The Yankee Group estimates that consumer spending for premium mobile content and applications will grow from $9.5 billion in 2009 to $12.2 billion in 2013 in the U.S., and from $80.9 billion in 2009 to $114.9 billion in 2013 worldwide.
Competition increasing. The growth dynamics of the mobile data services market and mobile devices and their operating systems have attracted non-carrier participants into the market, including Apple and Google. These relatively new entrants are offering access to mobile content and applications through their own solutions and are capturing a greater portion of value being created in the mobile data market. We believe that, as Apple, Google and other participants continue to focus on this market opportunity, and as open standards continue to proliferate, wireless carriers will experience stronger competitive pressure to design, develop and deploy leading-edge mobile data service solutions that will enable them to compete in an increasingly open marketplace.
Mobile subscriber loyalty being challenged. Retaining mobile subscribers has become more difficult given the wider adoption of number portability, in which subscribers are able to retain their phone numbers even if they change wireless carriers, and the accelerated adoption of prepaid mobile service plans, particularly in international markets. The difficulty in retaining subscribers grows as new competitive mobile devices and platforms are introduced into the market and as new entrants take more aggressive approaches toward acquiring new customers. Additional threats arise as Internet incumbents like Google and Yahoo! enter the mobile market and offer mobile subscribers alternative means to access and consume mobile data services.
Mobile data ecosystem complexity increasing. A complex mobile data ecosystem has developed as a result of the large and growing mobile data services market opportunity, and the diversification of industry participants involved, including wireless carriers, mobile device manufacturers, operating system developers, and mobile content and application providers. This ecosystem will continue to change rapidly as new mobile devices and operating systems are introduced into the market, new mobile content and applications are developed, and as mobile subscribers continue to make greater demands for an enhanced and personalized subscriber experience.
Continued challenges of internally developed solutions. Historically, many wireless carriers provided mobile data services directly to their mobile subscribers through internally developed proprietary solutions. These solutions
4
predominantly consisted of point solutions for specific needs. As the mobile data ecosystem becomes more complex, wireless carriers are challenged to manage the ever-changing dynamics in the mobile data services market. Wireless carriers have to spend significant time, capital and other resources to develop, implement, maintain and upgrade their internal solutions. As wireless carriers are increasingly required to focus their efforts on wireless network deployment and subscriber acquisition, they have faced greater challenges in delivering the type of high value subscriber experience required to compete and fully capitalize on opportunities within the mobile data services market.
Mobile content and application provider dynamics
Mobile content and application providers operate in a highly fragmented market and face increasing challenges to cost-effectively reach the broadest base of mobile subscribers and monetize their offerings. As the demand for mobile data services grows, the following industry dynamics affect mobile content and application providers:
Limited reach and distribution. The mobile content and application provider community consists of hundreds of thousands of participants, most of whom, we believe, do not have the experience, scale or resources necessary to effectively and affordably access mobile subscribers.
Limited infrastructure. Most mobile content and application providers do not have the necessary infrastructure to effectively monetize their mobile offerings. They generally have limited capabilities with respect to delivery, quality assurance, purchase confirmation, billing and settlement. In addition, given the wide variety of mobile devices in the market, with different screen sizes and resolution, mobile content and applications must be adapted to each possible configuration in order to enhance the subscriber experience. Content and application providers continue to face challenges each year with non-delivered content and applications, poor customer service and mobile phone or wireless network compatibility issues.
Mobile subscriber dynamics
As the mobile phone increasingly becomes an indispensable part of their everyday lives, mobile subscribers are demanding an enhanced, personalized subscriber experience, with easy access to content and applications on a real-time basis. As the demand for mobile data services grows, the following industry dynamics affect mobile subscribers:
Increasing mobile device capabilities and aggressive pricing plans. Mobile subscribers are rapidly upgrading their mobile devices, and often select devices with the latest features and capabilities. In addition, through increased competition in the mobile data market, mobile subscribers have access to attractively priced mobile service plans and promotions.
Growth of wireless in emerging international markets. In many emerging international markets, mobile data services are expected to experience significant growth. In these markets, landline access is anticipated to be low as compared to mobile lines, with the result that mobile lines present the opportunity to be the primary means for consumers to access the Internet and mobile content and applications. As wireless networks continue to penetrate these emerging markets, mobile subscribers and the demand for mobile data services are expected to continue to expand.
Access to the increasing variety of mobile data services. Currently, mobile subscribers often have difficulty locating, connecting to, downloading and using the ever-increasing variety of mobile data services available on their mobile devices, such as checking email, keeping up with social networks, and downloading the latest content and applications. In addition, poorly designed user interfaces and content and applications that are not optimized for mobile devices often inhibit the mobile subscriber experience.
Enhanced personalization and customization. Mobile subscribers are demanding a more personalized experience with mobile data services, including real-time access to personally relevant and location-based content and
5
services and social networking. As the mobile phone becomes increasingly integrated into their everyday lives, mobile subscribers are demanding the ability to customize their mobile data experience to meet their preferences.
Enterprise dynamics
As the mobile data market expands and as consumers get more comfortable using their mobile phones to gain real-time, interactive access to content, applications, goods and services, enterprises are beginning to utilize this new medium to more efficiently and effectively reach their customers and employees. Mobile data services can help enterprises attract new customers and retain existing customers while at the same time creating new opportunities for revenue generation and cost reduction for their existing business. However, there are significant challenges related to enterprises’ ability to capitalize on this tremendous market opportunity, as they are faced with the same issues around increasing mobile data ecosystem complexity described above.
Demand for content delivery platforms
Given the complexity of the mobile data ecosystem, with evolving technologies and a proliferation of mobile devices and operating systems, the current landscape in the mobile data services market has become increasingly challenging for wireless carriers and enterprises to manage effectively on their own. We believe that, by partnering with a content platform provider, wireless carriers are able to more effectively leverage their brands to provide an enhanced subscriber experience with mobile data services, enabling them to attract and retain subscribers and increase mobile data ARPU. In addition, wireless carriers are seeking to utilize subscriber usage data to provide a more relevant, timely and personalized user experience that is secure, private, and customized for targeted offerings. For enterprises, partnering with a content platform provider allows them to leverage the power and potential of mobile data services to deliver a more effective and efficient means to interact with their customers. By partnering with a content delivery platform provider, wireless carriers and enterprises are able to optimize their mobile data services strategy, and to focus on their core competencies.
The Motricity solution
We have designed and developed the mCore service delivery platform to deliver numerous benefits, including the following:
Wireless carriers. We use customizable, modular solutions that enable wireless carriers to rapidly develop, deploy, and deliver mobile data services. Wireless carriers are able to deliver a high value, carrier-branded mobile data experience, which provides their mobile subscribers with easy access to desired content and applications across the wide range of devices present within their customer base, from feature phones up to advanced smart phones. We believe that this enhanced subscriber experience enables wireless carriers to attract and retain mobile subscribers and increase mobile data ARPU. At the same time, our platform can reduce wireless carrier network overhead and operating costs and simplify the relationships between wireless carriers and content and application providers.
Mobile content and application providers. We enable mobile content and application providers to reach millions of mobile subscribers across carriers and across a wide range of devices from feature phones to advanced smart phones and thereby more effectively monetize their mobile offerings. We believe mCore also facilitates efficient billing and settlement, and provides quality assurance for delivery of mobile content and applications.
Mobile subscribers. We enable wireless carriers to deliver a high value, highly personalized mobile data experience to their subscribers, with simple, real-time access to relevant and desired mobile content and applications. Our mCore platform provides the tools for mobile subscribers to easily locate and access personally relevant and location-based content and services, engage in social networking, and download, send and receive digital media. In addition, mCore allows mobile subscribers to manage the content and applications that they use most frequently.
6
Enterprises. We enable enterprises to deliver high value, highly personalized mobile data experiences to their customers and employees. Through the use of the mCore platform, we deliver mobile data solutions across a broad range of devices and types of networks. We work directly with each enterprise customer to determine which mobile data
services are best for it to utilize to meet its business objectives, and we deliver the optimal set of offerings through a unified, managed services approach.
Our strengths
Highly scalable platform. Our mCore service delivery platform has been built using a flexible modular architecture that enables wireless carriers to deliver a highly scalable and highly reliable, carrier-branded experience.
Comprehensive expertise in managed service operations. Through the delivery of our MaaS, Mobile as a Service™, solution, we develop, implement and operate a very large and complex managed service environment, serving tens of millions of monthly active users across multiple carriers and geographies with a carrier-grade level of quality and reliability. We deliver these services to some of the world’s leading carriers, application and content providers ranging in complexity from roll-out and testing of minor customizations to major new strategic initiatives involving numerous third parties and onboarding of content and roll-out of a continually expanding set of devices. Our managed service environment consists of thousands of servers across multiple datacenters and is capable and contracted to deliver highly reliable service delivery reaching up to 99.999% availability.
Strong relationships with wireless carriers. We have well-established relationships with the top wireless carriers in the U.S. market, including Verizon Wireless, AT&T and Sprint as well as relationships with top international wireless carriers, including members of the Axiata Group (XL, Celcom, Dialog, Robi and Hello) and Reliance. We believe that we have been an integral partner with our wireless carrier customers and have assisted them with all phases of their mobile data services strategies, including design, development, deployment, provisioning, management, billing and customer support.
Deep integration within the mobile data ecosystem. Our mCore service delivery platform is deeply integrated into our wireless carrier customers’ systems, with the result that we can more effectively deliver an enhanced mobile data experience to their subscribers. We connect directly into our wireless carrier customers’ wireless network infrastructure as well as their provisioning and billing systems and their customer care systems. We also provide various interfaces to enable our wireless carrier customers to directly manage the content and presentation of their mobile data service experience. In addition, as our platform becomes more deeply integrated with an increasing number of content and application providers, we provide carriers with greater access to content and application providers.
Expansive device portfolio and onboarding process. We customize, test and maintain highly personalized mobile data experiences for an ever expanding population of mobile devices ranging from entry level feature phones to smartphones that utilize advanced operating systems such as Symbian, Blackberry, Android, Windows Mobile and webOS. Our onboarding process includes device profiling, testing and performance management across each carrier customers’ handset portfolio.
Significant insights into subscriber behavior and effective user experiences. Our mCore platform can capture a wide range of subscriber behavior and usage patterns across multiple carriers. We are also a recognized leader in the design and development of user interfaces intended to enhance the mobile subscriber experience. We leverage our data-rich insights into subscriber behavior and our user interface expertise to provide a highly personalized subscriber experience and targeted mobile marketing solutions. Our solutions currently enable the delivery of mobile data services to tens of millions of mobile subscribers monthly, which gives us exposure to one of the largest mobile subscriber communities in the world.
7
Independence and neutrality. We are content, network, operating system and mobile device type independent, with a sole focus on effectively and efficiently delivering the most relevant content and applications to mobile subscribers in real-time. Our independent position enables our interests to be closely aligned with our wireless carrier partners, thereby fostering cooperation among the constituencies that comprise the mobile ecosystem for the benefit of mobile subscribers and their mobile data experiences. We leverage our design, deployment, provisioning, management, and customer support strategies across all participants in the mobile data ecosystem, thereby optimizing our mobile data solutions and services for the benefit of our customers and their subscribers.
Our growth strategy
Expand international presence. We intend to expand our business in developed and emerging international markets, such as those in Southeast Asia, India and Latin America. We recently entered into an agreement with XL Axiata, a wireless carrier in Indonesia as well as Reliance in India, Celcom in Malaysia, Robi in Bangladesh, Dialog in Sri Lanka and Hello in Cambodia. We intend to apply our expertise gained from the U.S. market and fully leverage the capabilities and scale of the mCore platform to enable the rapid deployment of advanced mobile data services in these new markets in a cost-effective and efficient manner.
Gain additional scale, technology and access to new markets through acquisitions. We have historically acquired various businesses and technologies to grow our revenue and service capabilities. We expect to continue targeting acquisition candidates in the mobile data services market that have revenue expansion opportunities or complementary technology and solutions. We also expect to evaluate acquisition candidates that will enable us to expand our business and to enter markets adjacent to our core business or into new geographic markets.
Expand our strong relationships with our wireless carrier customers. We intend to continue to expand our relationships with industry-leading participants, particularly top U.S. and international wireless carriers.
Advance into new market segments. We intend to leverage our core competencies, technologies and existing market position to broaden our offerings and customer base and advance into new market segments, including expanding our position serving enterprise customers. We intend to leverage our data-rich insights into subscriber behavior and our user interface expertise to expand our offerings of highly targeted mobile marketing solutions.
Maintain and extend our technological leadership. We believe that we are a market leader in mobile data services and solutions in terms of technological capabilities, market share and range of service offerings, and we intend to expand on this position. We intend to continue to enhance the mCore platform, and introduce new solutions that increase the total value we provide to our carrier and enterprise customers.
Enhance smartphone solutions. We intend to extend further our support for new versions of smartphones and extend our support for data-rich applications which have higher rates of data consumption on these mobile devices. In addition, we will continue to leverage our subscriber behavior insights and user interface expertise to offer more personalized and richer experiences to smartphones. We expect to fully capitalize on the extensive capabilities of smartphones and their significant market adoption.
Adenyo acquision. The proposed Adenyo acquisition will expand our market opportunity and strengthen our position as the leading mobile internet platform for the monetization of content and data. With Adenyo’s mobile advertising, marketing and analytics technology, we will be well positioned to capitalize on the exponential growth in our industry.
8
Our solutions and services
We design, develop, implement and support a comprehensive suite of hosted mobile data solutions, which we offer on a hosted, managed service basis. Our solutions include the following:
mCore Portal. mCore Portal is a carrier-branded mobile destination accessible through over 2,000 different mobile phone models, ranging from entry level feature phones to smartphones. mCore Portal provides an easy to reach entry point to the mobile Internet and gives wireless carriers an ongoing, high-value position in the evolving mobile data value chain.
mCore Connect. mCore Connect provides one-click mobile access to leading social networks and e-mail sites through a single, simple and user-friendly mobile interface. In addition to making it easier for consumers to reach their social networking and email content, mCore Connect also reduces the network overhead associated with these activities through providing a much more efficient means for users to access what they seek.
mCore Search. mCore Search, which we bundle with our other solutions, is a customizable search technology for the mobile Internet. A single search box enables mobile subscribers to search for any information, content or application on the Internet. Through deep integration with the wireless carrier’s advertising platform, mCore Search provides the ability for carriers to serve targeted, relevant and contextual ads.
mCore Managed Web. mCore Managed Web provides mobile subscribers with an optimized, powerful and easy-to-use mobile web browsing experience.
mCore Marketplace. mCore Marketplace is our new generation storefront that provides a means to connect the large community of content, application and widget providers to carriers through an open, integrated exchange that can serve a wide array of mobile devices and other target devices. Additionally, carriers themselves are able to offer their own services through this exchange as well as hard and soft goods for purchase. This solution provides consumers with a highly personalized shopping experience through insights gained from business intelligence, user preferences and carrier information.
mCore MobileCast. mCore MobileCast is a next generation content management solution that delivers real-time, consumer relevant content to a wide range of smartphones. This comprehensive offering is designed to give smartphone subscribers real-time, zero touch access to all the relevant content, applications, goods and services they care about most, directly to their “phonetop.” For carriers and enterprises, MobileCast will drive brand awareness, promotions and commerce all through a user’s personalized mobile experience.
mCore Gateway. mCore Gateway provides enterprises that are seeking to leverage mobile capabilities for direct customer contact with real-time, push-based access to mobile subscribers with SMS or multimedia messaging service (MMS) alerts. mCore Gateway allows these enterprise customers to reach over 200 million mobile subscribers in the U.S. and Europe and provides functionality to distribute millions of messages with a high degree of reliability and speed. mCore Gateway also provides a means to charge for the delivery of digital products through wireless carrier billing facilities.
Campaign Manager. Campaign Manager is a Web-based mobile marketing product that connects to the mCore Gateway and provides carriers and enterprises with a simple means to create, implement and manage mobile marketing campaigns.
Our professional services include the following:
Solution consulting. Our solution professionals actively engage with customers to define mobile trends, analyze effectiveness of existing solutions and recommend programs and solutions to enhance the mobile data subscriber experience. Our solution professionals have the experience and understanding of the mobile data ecosystem to enable our customers to optimize their mobile data strategies.
9
Mobile design. Our mobile design professionals enable wireless carriers to create unique, integrated mobile experiences for their mobile subscribers. We employ functional and technical design techniques across a number of design elements including subscriber experience, wireless network and mobile device features, system integration and processes. We have a comprehensive library of proven designs and tools that help us leverage our skill set across the mobile data ecosystem.
Solution implementation. Our implementation professionals provide expertise in every phase of the implementation process, including customization, configuration, integration, system launch and ongoing enhancement and maintenance.
Operational management and customer support. Once mCore is deployed, we provide support services to wireless carriers to maintain and monitor their service deployment, including content and technology management, the introduction of new phones and system billing and settlement. We also provide customer support to wireless carriers and their ecosystem of partners to resolve issues directly relating to the performance of the mCore platform.
Sales and marketing
We market and sell a wide range of mobile data services solutions to wireless carriers through our sales organization. Additionally, we sell our messaging gateway and billing services to the top mobile aggregators and enterprise customers through our sales organization. As of December 31, 2010 our sales and marketing organization consisted of 48 employees located predominantly in the U.S., with additional staff located in the United Kingdom, the Netherlands, Indonesia and Singapore.
Sales. A senior vice president for global sales centrally manages our sales organization. Within this organization, we have teams focused on selling to wireless carriers, mobile aggregators and enterprise customers. Employees in our sales support and sales engineering group are engaged during the design and implementation process to offer insight into customer requirements, technical solutions and cost evaluation. Our sales organization has been predominantly focused on selling to the top wireless carriers in the U.S. We have expanded our focus to Southeast Asia, India, Latin America, and other emerging markets.
Marketing and product management. Our marketing and product management organizations focus on defining our product requirements, educating wireless carriers, media and industry analysts on our managed services approach, building brand awareness and supporting the efforts of the sales organization. We market our solutions through industry events, public relations efforts, sales materials and our Internet site. Additionally, we work directly with wireless carriers to help them better target and promote our joint offerings. We leverage our data-rich insights into subscriber behavior and our user interface expertise to help drive subscriber adoption and usage. We believe the combination of these efforts creates awareness of our business, solutions and managed services approach, as well as helps drive our overall business growth.
10
Platform and architecture
The mCore service delivery platform enables wireless carriers to design, configure, customize, and implement mobile data services. mCore is designed to bring together the three primary participants in the mobile data services ecosystem: wireless carriers, mobile content and application providers and mobile subscribers. By bringing these participants together, mCore facilitates the distribution and use of mobile content and applications, electronic commerce, and other mobile data marketing services. The mCore platform and its position in the mobile data services ecosystem are demonstrated in the figure below.
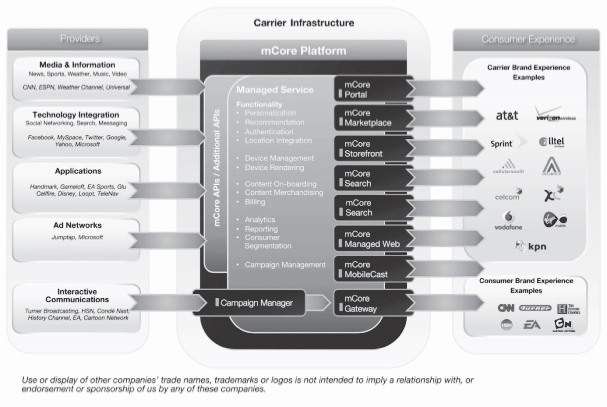
Key features and benefits of the mCore service delivery platform are as follows:
Tight integration with carriers’ systems. mCore is able to be integrated with our customers’ systems, including provisioning, billing and settlement, customer care and product analytics, and messaging. This integration provides a more customized and seamless user experience, enabling wireless carriers to offer one-click billing for digital products, as well as location-based services that can create a more compelling user experience.
Modular architecture. mCore is comprised of several mobile technology components that are modular in nature and provide the flexibility to integrate with our customers’ systems, or third-party mobile content and application providers, on an as-needed basis. This modular architecture, commonly referred to in the industry as Service-Oriented Architecture, enables us to insert, replace, or remove functionalities in targeted areas without impacting our customers’ systems. Additional resources can be added with little to no interruption of service to our customers and their subscribers. In addition, this modular architecture allows mCore to be adopted from the smallest of deployments to the largest, with customizable features and functions depending on the carriers’ requirements and specifications.
Cost-efficiency. mCore is a centralized, hosted solution through which we can deliver a broad range of mobile data services, on a managed service basis, at a total cost that we believe is lower than most internally developed solutions. By leveraging our solutions across the mobile data ecosystem and its participants, we are able to derive economies of scale that enable us to share the cost savings with our constituencies.
11
Reliability. mCore is hosted at a combination of our own carrier-grade hosting facilities and facilities hosted by the carriers themselves, in separate geographic-based datacenters. Our datacenters are highly reliable, using resilient and redundant network devices, servers, storage, HVACs, and power equipment as well as best-of-class service monitoring and management to deliver our services.
Adaptability. mCore separates core functionalities from customer-specific customization and integration through the use of adapters. These adapters are developed for each deployment to enable us to integrate our platform into the wireless carrier’s system, including authentication, billing, ringback tones and message service center. This design feature enables us to develop and deploy our product roadmap in parallel with deployment activities, which helps us achieve our time-to-market goals.
Flexible and scalable architecture. mCore was designed to deliver the highest quality, carrier-grade service to some of the largest carriers in the world. Today, mCore supports tens of millions of mobile subscribers monthly through its distributed architecture, hosts over 75 million unique pieces of mobile content or applications and provides the capability to reach over 400 million subscribers. mCore is designed to scale easily for mobile subscribers’ increased data consumption, expanding subscriber bases through the addition of individual service elements, such as servers and databases. mCore has also been designed with the flexibility and modularity to deliver a wide range of content, including text, graphics, audio and video to a wide range of mobile devices.
Design-time and run-time environment. mCore provides a design-time and run-time environment for the delivery of mobile data services. The design-time environment consists of management tools with workflow capabilities for service design and deployment, while the run-time environment is the live, in-production experience with which subscribers interact. The design-time environment enables our customers to design the layout of pages, provision new text and images and merchandise content that are subsequently published to the run-time environment. The design-time environment provides us and our customers with the ability to implement changes in the user experience without requiring a new code deployment, which decreases development time and breakage risk.
Mobile device and operating system independent. mCore is mobile device and operating system independent and is able to deliver mobile data services to over 13,000 different mobile phone models, ranging from entry level feature phones to smartphones, and most mobile operating systems. As mobile device and operating system capabilities become increasingly more varied, we believe mCore’s independent approach will enable wireless carriers to deliver an enhanced user experience to their subscribers without having to specifically develop products for each device and operating system.
Data-rich insights into subscriber behavior. mCore can store a comprehensive record of mobile subscriber activities, transactions and interactions. We and our customers are able to directly access this data or obtain custom analysis and reporting regarding subscriber behavior.
Security compliance. All security policies, processes and controls are aligned with the ISO 27001 Information Security Management standard as validated by an annual third party audit. Additionally, specific key operational processes—incident management, change management, release management, and service monitoring and control—were designed with support from third party subject matter experts to align with ITIL, the Industry standard framework for IT service management and support. A third-party audit has established that we are in compliance with the ISO 27001 Information Security Management standard. We have a comprehensive Information Security Management System in place that consists of an enterprise-wide security steering committee, adherence to statutory, legislative, and contractual security requirements, and an information security risk management program.
Post-deployment capabilities. mCore provides monitoring, reporting and ongoing insights into the overall health of the system for our customers as well as the entities that interact with it, including mobile subscribers. Monitors provide both “warning” and “error” states, enabling our customers to react to anomalies prior to an actual error
12
condition. mCore also includes customer care tools which enable a wireless carrier’s customer care representatives to view their mobile subscribers’ interactions with the system, and to troubleshoot and service subscriber inquiries in real-time.
Customers and vendors
Customers
As of December 31, 2010, our customers included 10 wireless carriers and over 57 enterprise customers worldwide. As discussed below, we have strong, established and strategic relationships with a number of industry-leading wireless carriers. In addition to those relationships, we have agreements to provide messaging services, such as standard text messaging programs and premium (paid) content delivery, to a wide array of entertainment, marketing and other customers.
Wireless carriers. We have customer agreements with the top U.S. wireless carriers and numerous other wireless carriers in the U.S. and internationally. We provide various services, including portal, marketplace and/or messaging services for these carriers. In addition, we have agreements with most U.S. wireless carriers for connectivity to our enterprise gateway. Our agreements vary as to the services we provide to each carrier and how we charge for those services. We charge using a combination of professional services fees, variable activity-based fees, revenue sharing arrangements and fixed monthly fees. Some of our agreements contain per subscriber fees for portal services and revenue sharing arrangements for marketplace services. Some of our agreements also contain service level agreements under which we commit to certain availability and performance metrics and are subject to financial penalties if we fail to perform at the agreed upon level.
AT&T Mobility. Our largest customer by revenue is AT&T Mobility, LLC. We have several agreements with AT&T including our Second Amended and Restated Wireless Services Agreement under which we host AT&T’s MediaNet and ATT.net portals, and our 2010 Master Services Agreement and accompanying Service Exhibit under which we host AT&T’s AppCenter, which utilizes mCore marketplace. Under the portal agreement, we receive a monthly fee based on the number of subscribers, with a volume discount, as well as certain fixed fees. The portal agreement contains service level agreements under which we commit to certain availability and performance metrics and are subject to financial penalties if we fail to perform at the agreed upon level. The portal agreement expires on April 22, 2011; however, it is subject to automatic extension unless terminated by either party upon six months notice, and is also terminable by AT&T without cause upon six months notice. The AppCenter agreement expires September 22, 2012, but AT&T has the right to terminate on 270 days notice, which can be given after March 31, 2011, and on 90 days notice, which can be given after September 30, 2011.
Verizon Wireless. After AT&T, our next largest customer is Cellco Partnership (d.b.a. Verizon Wireless). We host Verizon’s portals under our 2004 WAP 2.0 Hosting Agreement. Under our Verizon portal agreement, we receive a monthly fee based on the number of subscribers, with a volume discount, as well as certain fixed fees. The portal agreement contains service level agreements under which we commit to certain availability and performance metrics and are subject to financial penalties if we fail to perform at the agreed upon level. Verizon may terminate for convenience. Pursuant to an amendment to the 2004 WAP 2.0 Hosting Agreement entered into on June 30, 2010, the term of the Agreement was extended to June 30, 2012. After such date, Verizon Wireless may extend the term for up to two additional one year terms, which extension shall occur automatically unless Verizon provides notice of intent not to renew at least ninety days prior to the end of the then-current term. After June 30, 2014, the term shall be automatically renewed for successive one year periods unless either party provides written notice of termination. The Amendment also revised certain commercial terms of the Agreement for providing and hosting the portal and for device profiling, editorial, search and advertising integration and other mobile services and their related fees. The Company believes the economic terms of the Agreement are improved by the Amendment. The termination provisions of the Agreement were not altered.
13
Vendors
We utilize strategic relationships with offshore and domestic vendors to increase technical resource capacity in the areas of technical development and quality assurance. We have expanded these relationships to assist in the expansion of our product development efforts. On an as needed basis, these vendors can also be utilized to assist in sales engineering and demo development. We have agreements in place with our vendors, particularly offshore vendors, that allow us to properly manage and oversee vendor activities across the organization.
We have a strategic relationship with GlobalLogic, Inc., a leading software research and development company with over 3,000 employees providing services worldwide. Initially, GlobalLogic assisted us with customer implantation and custom projects, and we now use the company to supplement our Product Development group. Our Master Services Agreement with GlobalLogic became effective on September 30, 2008, and expires on December 29, 2011, unless renewed. We may terminate this agreement upon breach or change in control, or without cause upon 90 days notice and payment of a termination fee, if the termination without cause occurs more than 12 months before December 29, 2011. The agreement includes the option to convert GlobalLogic employees to Motricity employees for a fee.
We commit significant resources to research and development. Research and development expenses for the years ended December 31, 2010, 2009 and 2008 were $8,667, $5,792 and $3,045, respectively.
Competition
The mobile data communications market for products and services continues to be competitive and fragmented. The widespread and rising adoption of open industry standards, rapidly changing technology trends and burgeoning consumer demand has made it easier for new market entrants, existing competitors and non-traditional players to introduce new products and services that compete with our products. With the rapid growth and adoption of mobile data services, we expect competition to increase. As such, we believe there are a number of important factors to compete effectively in our market, including:
| • | strong mobile data expertise; |
| • | scalable and highly reliable products and services; |
| • | advanced user interface capabilities and subscriber insight; |
| • | continued innovation to stay ahead of the market and the technology curve; |
| • | knowledge and delivery capabilities across a wide array of content and applications; |
| • | service integration capabilities across a wide range of devices, networks and standards; |
| • | sufficient scale and operational efficiencies to be able to offer the most cost effective solutions; |
| • | high level of customer support; |
| • | ability to onboard a wide range of devices and content; and |
| • | adaptability to rapidly changing demand, technology and products external to our offerings. |
Our competitors include mobile device manufacturers, wired search engines, Internet portals and directories, and wireless service integrators. In our current offerings, we compete with, among others, Amdocs and Ericsson in the portal and marketplace businesses, and with Sybase, OpenMarket, Ericsson, mBlox and other wireless messaging providers in our messaging aggregation business. Additionally, we face the risk that our customers may seek to develop in-house products as an alternative to those currently being provided by us. Due to the dynamic and fragmented data services market, we are also increasingly encountering competition from new market entrants like Microsoft, IBM, Apple, Yahoo!, Google and other providers of software applications and content delivery solutions.
14
Intellectual property
Our intellectual property is an essential element of our business. We rely on a combination of trademark, copyright, trade secret, patent and other intellectual property laws of the U.S. and other countries, as well as confidentiality agreements and license agreements to protect our intellectual property. Our intellectual property includes trademarks, patents, copyrights, trade secrets, and we are involved in numerous licensing arrangements. Our employees and independent contractors are required to sign agreements acknowledging that all inventions, trade secrets, works of authorship, developments and other processes generated by them on our behalf are our property, and assigning to us any ownership that they may claim in those works.
Our core intellectual property is our software that we use to provide services to our customers. We generally host all of our software, although some customers have the right to self-host in some circumstances. We rely primarily on copyright and trade secrets to protect our software and other technology. We do not routinely register our copyrights in our software. Trade secrets are difficult to protect, but we seek to protect our proprietary technology and processes by, in part, confidentiality agreements with our employees, consultants, and other contractors.
We are the owner of trademarks registered with the United States Patent and Trademark office and internationally, including MOTRICITY and MCORE.
Employees
As of December 31, 2010, we had 339 employees. None of our employees are represented by a labor union or is covered by a collective bargaining agreement. We have never experienced any employment-related work stoppages and consider relations with our employees to be good.
Available Information
We maintain a website at www.motricity.com. The information on or available through our website is not, and should not be considered, a part of this report. You may access our annual report on Form 10-K, quarterly reports on Form 10-Q, current reports on Form 8-K and amendments to these reports, as well as other reports relating to us that are filed with or furnished to the Securities and Exchange commission (or “SEC”) free of charge at our website as soon as reasonably practicable after such material is electronically filed with, or furnished to, the SEC. In addition, you may read and copy any materials we file with the SEC at the SEC’s Public Reference Room at 450 Fifth Street, N.W., Washington, DC 20549. Information on the operation of the Public Reference Room may be obtained by calling the SEC at 1-800-SEC-0330. The SEC also maintains an Internet site, www.sec.gov, that contains reports, proxy and information statements, and other information that we file electronically with the SEC.
| Item 1A. | Risk Factors. |
We depend on a limited number of customers for a substantial portion of our revenues. The loss of a key customer or any significant adverse change in the size or terms of a contract with a key customer could significantly reduce our revenues.
We depend, and expect to continue to depend, on a limited number of significant worldwide wireless carriers for a substantial portion of our revenues. Currently, a number of the top U.S. and International wireless carriers use our services. In the event that one or more of these major wireless carriers decides to reduce or stop using our managed and professional services, we could be forced to shift our marketing focus to smaller wireless carriers, which could result in lower revenues than expected and increased business development, marketing and sales expenses. This could cause our business to be less profitable and our results of operations to be adversely affected.
In addition, a change in the timing or size of a professional services project by any one of our key customers could result in significant variations in our revenue and operating results. Our operating results for the
15
foreseeable future will continue to depend on our ability to effect sales to a small number of customers. Any revenue growth will depend in part on our success in selling additional services to our large customers and expanding our customer base to include additional customers that deploy our solutions in large-scale networks serving significant numbers of subscribers.
In 2009, we generated approximately 53% of our total revenue from contracts with AT&T Mobility LLC and its affiliates, or AT&T, and 20% of our total revenue from contracts with Verizon Wireless and its affiliates. In 2010, we generated approximately 44% and 24% of our total revenue from contracts with AT&T and Verizon Wireless, respectively. Certain of our customer agreements expire in 2011, including one of our agreements with AT&T. Failure to renew our agreements with AT&T, Verizon Wireless or our other large customers would materially reduce our revenue and have a material adverse effect on our business, operating results and financial condition. See “Management’s Discussion and Analysis of Financial Condition and Results of Operations—Overview” and “Business—Customers and Vendors—Customers” for more information.
The mobile data services industry is, and likely will continue to be, characterized by rapid technological changes, which will require us to develop new service enhancements, and could render our existing services obsolete.
The market for content and applications for mobile devices is characterized by rapid technological change, with frequent variations in user requirements and preferences, frequent new product and service introductions embodying new technologies and the emergence of new industry standards and practices. Our success will depend, in part, on our ability to enhance and expand our existing services, develop new technology that addresses the increasingly sophisticated and varied needs of wireless carriers and their subscribers, respond to technological advances and emerging industry standards and practices and license leading technologies that will be useful in our business in a cost-effective and timely way. We may not be able to successfully use new technologies or adapt our current and planned services to new customer requirements or emerging industry standards. The introduction of new products embodying new technologies or the emergence of new industry standards could render our existing services obsolete, unmarketable or uncompetitive from a pricing standpoint.
The market in which we operate is highly competitive and many of our competitors have significantly greater resources.
The mobile data communications services market is rapidly evolving and intensely competitive. Our competitors include mobile device manufacturers, search engines, portals and directories, and wireless service integrators. Competition in the wireless industry throughout the world continues to increase at a rapid pace as consumers, businesses and governments realize the market potential of wireless communications products and services. In addition, new competitors or alliances among competitors could emerge and rapidly acquire significant market share, to our detriment. There may be additional competitive threats from companies introducing new and disruptive solutions. Some of our competitors may be better positioned than we are. Although we have attained a significant position in the industry, many of our current and potential competitors may have advantages over us, including:
| • | longer operating histories and market presence; |
| • | greater name recognition; |
| • | access to larger customer bases; |
| • | single source solutions that deliver mobile devices, hardware, services and infrastructure; |
| • | economies of scale and cost structure advantages; |
| • | greater sales and marketing, manufacturing, distribution, technical, financial and other resources; and |
| • | government support. |
16
These competitors also have established or may establish financial or strategic relationships among themselves or with our existing or potential customers or other third parties. In addition, some of our competitors have used and may continue to use aggressive pricing or promotional strategies, have stronger relationships on more favorable terms with wireless carriers and may devote substantially greater resources to system development than we do. These relationships may affect customers’ decisions to purchase services from us.
We also face competition from existing service providers in the international markets in which we already compete or may enter. For example, in India we compete with numerous companies, some of which are solely focused on the local mobile data services market, are directly owned and managed by local citizens. These factors could provide local competitors with advantages over us, particularly if the local government enacts laws or policies that favor local competitors or restrict or disadvantage us because our international operations are part of a U.S.-domiciled company. Other competitors in international markets are subsidiaries of larger companies with established local operations, and with greater experience and resources. In other countries that we may enter, there may be incumbent competitors presently selling data services products. These incumbents may have competitive advantages that could impede our expansion and growth in these countries.
We rely heavily on our executive officers and other key employees for the success of our business and the loss of our executive team whether to a competitor or otherwise could adversely impact our business.
We believe our success will depend in part upon retaining the services of executive officers and other key employees. Many of our executive officers joined our company within the last two years and we operate in a very competitive environment. Although we have employment agreements with many of our key employees, such employees may receive employment offers that are competitive with or more attractive than their existing employment terms with us. If our executive officers or non-executive key employees leave and we cannot replace them with suitable candidates quickly, we could experience difficulty in managing our business properly. This could harm our business prospects, client relationships, employee morale and financial results. We currently maintain a key-person life insurance policy on our chief executive officer.
Competition for our employees is intense and failure to retain and recruit skilled personnel could negatively affect our financial results as well as our ability to maintain relationships with clients, service existing and new contracts, and drive future growth.
We provide sophisticated mobile data delivery platforms and services to our customers. To attract and retain customers and service our existing and new contracts, such as our agreements with Reliance India, Robi, Dialog and Hello, we believe we need to demonstrate professional acumen and build trust and strong relationships, and that we must retain, identify, recruit, and motivate new hardware and software engineers, programmers, technical support personnel and marketing and sales representatives. Competition is intense for skilled personnel with engineering, product development, technical and marketing and sales experience, and we may not be able to retain and/or recruit individuals that possess the necessary skills and experience, or we may not be able to employ these individuals on acceptable terms and conditions, or at all. Moreover, competition has been increasing the cost of hiring and retaining skilled professionals as, among other reasons, other companies in the technology sector may offer more compensation, particularly in the form of equity awards. This trend could adversely affect our operating margins and financial results. Our business and growth may suffer if we are unable to retain current personnel and hire other skilled personnel.
We believe our long-term success depends, in part, on our ability to expand the sales of our services to customers located outside of the U.S. As a result, our business is susceptible to risks associated with international sales and operations.
In addition to the U.S., we currently operate in the United Kingdom, the Netherlands, Indonesia, Singapore, India, Malaysia, Bangladesh, Sri Lanka and Cambodia and we intend to expand our offering of mobile data
17
services into a number of additional international markets in the near future. As a result, we are subject to the additional risks of conducting business outside the U.S., which may include:
| • | increased costs associated with localization of our services, including translations into foreign languages and adaptation to local practices and regulatory requirements; |
| • | longer accounts receivable payment cycles and difficulties in collecting accounts receivable; |
| • | difficulties managing and staffing international operations; |
| • | delays resulting from difficulty in obtaining export licenses, tariffs and other trade barriers and restrictions on export or import of technology; |
| • | less stringent intellectual property protections; |
| • | unexpected changes in, or impositions of, legislative, regulatory or tax requirements and burdens of complying with a wide variety of foreign laws and other factors beyond our control; |
| • | general geopolitical risks in connection with international operations, such as political, social and economic instability; |
| • | compliance with anti-corruption and bribery laws, including the Foreign Corrupt Practices Act of 1977; |
| • | changes in diplomatic, trade or business relationships; |
| • | foreign currency fluctuations that may substantially affect the dollar value of our revenue and costs in foreign markets; |
| • | foreign exchange controls that may prevent or limit our ability to repatriate income earned in foreign markets; and |
| • | increased financial accounting and reporting burdens. |
We may engage in acquisitions that could disrupt our business, cause dilution to our stockholders and harm our business, operating results or financial condition.
We expect to make selective domestic and international acquisitions of, and investments in, businesses that offer complementary products, services and technologies, augment our market coverage, and/or enhance our technological capabilities. For instance, on January 31, 2011, we entered in an agreement to acquire Adenyo. We may also enter into strategic alliances or joint ventures to achieve these goals. We may not be able to identify suitable acquisition, investment, alliance, or joint venture opportunities or consummate any such transactions or relationships on terms and conditions acceptable to us. Such transactions or relationships that we enter into may not be successful. In addition, acquisitions and investments outside of the U.S. involve unique risks related to integration of operations across different cultures and languages, currency risks and the particular economic, political and regulatory risks associated with specific countries.
These transactions or any other acquisitions or dispositions involve risks and uncertainties, which may have a material adverse effect on our business. The integration of acquired businesses may not be successful and could result in disruption to other parts of our business. In addition, the integration may require that we incur significant restructuring charges. To integrate acquired businesses, we must implement our management information systems, operating systems and internal controls, and assimilate and manage the personnel of the acquired operations. The difficulties of the integrations may be further complicated by such factors as geographic distances, lack of experience operating in the geographic market or industry sector of the acquired business, delays and challenges associated with integrating the business with our existing businesses, diversion of management’s attention from daily operations of the business, potential loss of key employees and customers of the acquired business, the potential for deficiencies in internal controls at the acquired business, performance problems with the acquired business’ technology, difficulties in entering markets in which we have no or limited direct prior experience, exposure to unanticipated liabilities of the acquired business, insufficient revenues to
18
offset increased expenses associated with the acquisition, and our ability to achieve the growth prospects and synergies expected from any such acquisition. Even when an acquired business has already developed and marketed products and services, there can be no assurance that product or service enhancements will be made in a timely fashion or that all pre-acquisition due diligence will have identified all possible issues that might arise with respect to such acquired assets.
Any acquisition may also cause us to assume liabilities, record goodwill and non-amortizable intangible assets that will be subject to impairment testing and potential impairment charges, incur amortization expense related to certain intangible assets, increase our expenses and working capital requirements, and subject us to litigation, which would reduce our return on invested capital. Failure to manage and successfully integrate the acquisitions we make could materially harm our business and operating results.
Any future acquisitions may require additional debt or equity financing, which in the case of debt financing, will increase our leverage and, in the case of equity financing, would be dilutive to our existing stockholders. Any decline in our perceived credit-worthiness associated with an acquisition could adversely affect our ability to borrow and result in more restrictive borrowing terms. As a result of the foregoing, we also may not be able to complete acquisitions or strategic transactions in the future to the same extent as in the past, or at all. These and other factors could harm our ability to achieve anticipated levels of profitability at acquired operations or realize other anticipated benefits of an acquisition, and could adversely affect our business, financial condition and results of operations.
Open mobile phone operating systems and new business models may reduce the wireless carriers’ influence over access to mobile data services, and may reduce the total size of our market opportunity.
The majority of our revenue is based on mobile subscribers accessing mobile content and applications through our customers’ carrier-branded mobile solutions. However, with the growth of the iPhone and smartphone business models, our customers’ services may be bypassed or become inaccessible. These business models, which exclude carrier participation beyond transport, along with the introduction of more mobile phones with open operating systems that allow mobile subscribers to browse the Internet and, in some cases, download applications from sources other than a carrier’s branded services, create a risk that some carriers will choose to allow this non-branded Internet access without offering a competitive value-added carrier-branded experience as part of their solution set. These so-called “open operating systems” include Symbian, BlackBerry, Android, Windows Mobile and webOS. We believe wireless carriers need to offer branded services that can compete head-to-head with the new business models and open technologies in order to retain mobile subscribers and increase ARPU. Although our solutions are designed to help wireless carriers deliver a high value, competitive mobile data experience, if mobile subscribers do not find these carrier-branded services compelling, there is a risk that mobile subscribers will use open operating systems to bypass carrier-branded services and access the mobile Internet. It is also possible one or more wireless carriers will adopt a non-carrier branded, third-party web portal model. To the extent this occurs, the total available market opportunity for providing our current services and solutions to carriers may be reduced.
Our sales cycle can be long, which may make our revenues and operating results less predictable.
Wireless carriers must typically make substantial investments to deploy our mobile data services solution. As a result, the typical sales cycle for our services is long, averaging nine to twelve months per customer. Many of the potential customers for our services have only recently begun to evaluate the benefits of expanding their offerings of mobile services, and many have only recently designated personnel to evaluate, procure and implement new mobile services. We believe that we may be required to spend a significant amount of time and resources educating potential customers on the use and benefits of our services, and in turn, we expect potential customers to spend a significant amount of time performing internal reviews and obtaining authorization to purchase our services. Furthermore, the emerging and evolving nature of mobile data technological standards and services may lead potential customers to postpone purchasing decisions.
19
We have a history of net operating losses and may continue to suffer losses in the future.
For the years ended December 31, 2006, 2007, 2008, 2009, and 2010, we had net losses of approximately $55.2 million, $77.9 million, $78.0 million, $16.3 million and $7.0, respectively. If we cannot become profitable, our financial condition will deteriorate, and we may be unable to achieve our business objectives.
We compete with in-house mobile data solutions similar to those we offer.
The mobile data service industry is evolving rapidly to address changing industry standards and the introduction of new technologies and network elements. Wireless carriers are constantly reassessing their approaches to delivering mobile data to their subscribers, and one or more of our customers could decide to deploy an in-house mobile data delivery service solution that competes with our services. Even if the mobile data delivery services offered by a mobile service provider’s in-house solution were more limited than those provided by our services, a wireless carrier may elect to accept limited functionality or services in lieu of providing a third party access to its network. An increase in the use of in-house solutions by wireless carriers could have an adverse effect on our business, operating results and financial condition.
We have a significant relationship with a development vendor, and changes to that relationship may result in delays or disruptions that could harm our business.
We rely upon development vendors to provide additional capacity for our technical development and quality assurance services. Our primary development vendor is GlobalLogic, Inc., a software research and development company providing software development services primarily from its offices in India and Ukraine. Our current agreement with GlobalLogic terminates on December 29, 2011 and includes the option to convert GlobalLogic employees to Motricity employees for a fee. GlobalLogic may only terminate this agreement for cause. If GlobalLogic were, for any reason, to cease operations, we might be unable to replace it on a timely basis with a comparably priced provider. We would also have to expend time and resources to train any new development vendor that might replace GlobalLogic. If GlobalLogic were to suffer an interruption in its business, or experience delays, disruptions or quality control problems in its software development operations, or if we had to change development vendors, our ability to provide services to our customers would be delayed and our business, operating results and financial condition would be adversely affected.
Demand for our managed and professional services depends on increases in carrier subscribers’ use of mobile data services and mobile devices to access the mobile Internet and on our customers’ continued investment and improvement in wireless networks.
Our services comprise a mobile data service delivery platform that enables wireless carriers to monitor and charge their subscribers for access to mobile applications, content and programs that are developed by third parties and hosted by us. The majority of our revenue is based on mobile subscribers accessing mobile content and applications through our customers’ carrier-branded mobile solutions. Our ability to generate revenues from our services will depend on the extent to which businesses and consumers continue to adopt and use mobile devices to access the mobile Internet and to receive products and services via their mobile devices. While many consumers use mobile devices to communicate, the majority of consumers do not presently use mobile devices to access the mobile Internet or obtain other products or services. Consumers and businesses may not significantly increase their use of mobile data services and mobile devices to access the mobile Internet and to obtain products and services as quickly as our business model contemplates. If consumers do not continue to increase their use of mobile data services, our business, operating results and financial condition will be adversely impacted.
Further, increased demand by consumers for mobile data services delivered over wireless networks will be necessary to justify capital expenditure commitments by wireless carriers to invest in the improvement and expansion of their networks. Demand for mobile data services might not continue to increase if there is limited availability or market acceptance of mobile devices designed for such services; the multimedia content offered through wireless networks does not attract widespread interest; or the quality of service available through
20
wireless networks does not meet consumer expectations. If long-term expectations for mobile data services are not realized or do not support a sustainable business model, wireless carriers may not commit significant capital expenditures to upgrade their networks to provide these services, the demand for our services will decrease, and we may not be able to increase our revenues or become profitable in the future.
If we are unable to protect the confidentiality of our proprietary information, the value of our technology could be adversely affected.
Our business relies upon certain unpatented or unregistered intellectual property rights and proprietary information, including the mCore platform. Consequently, although we take measures to keep our key intellectual property rights and proprietary information confidential, we may not be able to protect our technology from independent invention by third parties. We currently attempt to protect most of our key intellectual property through a combination of trade secret, copyright and other intellectual property laws and by entering into employee, contractor and business partner confidentiality agreements. Such measures, however, provide only limited protection, and under certain circumstances we may not be able to prevent the disclosure of our intellectual property, or the unauthorized use or reverse engineering or independent development of our technology. This may allow our existing and potential competitors to develop products and services that are competitive with, or superior to, our services.
Further, we intend to expand our international presence by targeting countries with large populations and propensities for adopting new technologies. However, many of these countries’ intellectual property laws are not as stringent as those of the U.S. Effective patent, copyright, trademark and trade secret protections may be unavailable or limited in some foreign countries. As a result, we may not be able to effectively prevent competitors in these countries from using or infringing our intellectual property rights, which would reduce our competitive advantage and ability to compete in these regions or otherwise harm our business. In the future, we may also have to resort to litigation to enforce our intellectual property rights, which could result in substantial costs and divert our management’s attention and resources. In addition, such litigation may not be successful.
Consolidation in the telecommunications industry may reduce the number of our customers and negatively impact our financial performance.
The telecommunications industry continues to experience consolidation and an increased formation of alliances among telecommunications service providers and between telecommunications service providers and other entities. Should one of our significant customers consolidate with another company or enter into such an alliance and decide either to use a different mobile data service provider or to manage its transactions internally, it could have a negative material impact on our prospects. These consolidations and alliances may cause us to lose customers or require us to reduce prices as a result of enhanced customer leverage, which would have a material adverse effect on our business. We may not be able to offset the effects of any price reductions. We may not be able to expand our customer base to make up any decreases in revenue if we lose customers or if our transaction volumes decline.
We expect that our revenue will fluctuate, which could cause our stock price to decline.
Our revenue is subject to fluctuations due to the timing of sales of high-dollar professional services projects. Because these projects occur at irregular intervals and the dollar values vary based on customer needs, we may experience quarter-to-quarter fluctuations in revenue. In addition, any significant delays in the deployment of our services, unfavorable sales trends in our existing service categories, or changes in the spending behavior of wireless carriers could adversely affect our revenue growth. If our revenue fluctuates or does not meet the expectations of securities analysts and investors, our stock price would likely decline. Further, much of our revenue is based on managed services, which include a variable component that can fluctuate on a quarterly basis based on subscriber usage.
21
Our customer contracts lack uniformity and often are complex, which subjects us to business and other risks.
Our customers include some of the largest wireless carriers which have substantial purchasing power and negotiating leverage. As a result, we typically negotiate contracts on a customer-by-customer basis and sometimes accept contract terms not favorable to us in order to close a transaction, including indemnity, limitation of liability, refund, penalty or other terms that could expose us to significant financial or operating risk. If we are unable to effectively negotiate, enforce and accurately and timely account and bill for contracts with our key customers, our business and operating results may be adversely affected.
In addition, we have contractual indemnification obligations to our customers, most of which are unlimited in nature. If we are required to fulfill our indemnification obligations relating to third-party content or operating systems that we provide to our customers, we intend to seek indemnification from our suppliers, vendors, and content providers to the full extent of their responsibility. Even if the agreement with such supplier, vendor or content provider contains an indemnity provision, it may not cover a particular claim or type of claim or may be limited in amount or scope. As a result, we may or may not have sufficient indemnification from third parties to cover fully the amounts or types of claims that might be made against us. Any significant indemnification obligation to our customers could have a material adverse effect on our business, operating results and financial condition.
We provide service level commitments to our customers, which could cause us to incur financial penalties if the stated service levels are not met for a given period and could significantly reduce our revenue.
Our customer agreements provide service level commitments on a monthly basis. Our service level commitment varies by customer. If we are unable to meet the stated service level commitments or suffer extended periods of unavailability and/or degraded performance of our service, we may incur financial penalties. Our revenue could be significantly impacted if we suffer unscheduled downtime that exceeds the allowed downtimes under our agreements with our customers. The failure to meet our contractual level of service availability may require us to credit affected customers for a significant portion of their monthly fees, not just the value for the period of the downtime. As a result, failure to deliver services for a relatively short duration could result in our incurring significant financial penalties. Service level penalties represented 4% of total revenue in 2008, 1% of total revenue in 2009 and 1% of total revenue in 2010. Any system failure, extended service outages, errors, defects or other performance problems with our managed and professional services could harm our reputation and may damage our customers’ businesses.
We use datacenters to deliver our platform and services. Any disruption of service at these facilities could harm our business.
We host our services and serve all of our customers from three datacenter facilities located around the U.S. and one customer-owned facility in Southeast Asia. We operate one datacenter facility located in Washington State. The other two facilities are operated by third parties in Georgia and Massachusetts. We do not control the operations at the third-party facilities. All of these facilities are vulnerable to damage or interruption from earthquakes, hurricanes, floods, fires, terrorist attacks, power losses, telecommunications failures and similar events. They also could be subject to break-ins, computer viruses, denial of service attacks, sabotage, intentional acts of vandalism and other misconduct. The occurrence of a natural disaster or an act of terrorism, a decision to close the third-party facilities without adequate notice or other unanticipated problems could result in lengthy interruptions in our services. Although we maintain off-site tape backups of our customers’ data, we do not currently operate or maintain a backup datacenter for any of our services, which increases our vulnerability to interruptions or delays in our service. Interruptions in our services might harm our reputation, reduce our revenue, cause us to incur financial penalties, subject us to potential liability and cause customers to terminate their contracts other than in the customer-owned facility.
22
Capacity constraints could disrupt access to our services, which could affect our revenue and harm our reputation.
Our service goals of performance, reliability and availability require that we have adequate capacity in our computer systems to cope with the volume of traffic through our mCore service delivery platform. As our operations grow in size and scope, we will need to improve and upgrade our systems and infrastructure to offer our customers and their subscribers enhanced services, capacity, features and functionality. The expansion of our systems and infrastructure will require us to commit substantial financial, operational and technical resources before the volume of our business rises, with no assurance that our revenues will grow. If our systems cannot be expanded in a timely manner to cope with increased traffic we could experience disruptions in service, lower customer and subscriber satisfaction and delays in the introduction of new services. Any of these problems could impair our reputation and cause our revenue to decline.
Our research and development investments may not lead to successful new services or enhancements.
We will continue to invest in research and development for the introduction of new enhancements to existing services designed to improve the capacity, data processing rates and features of our services. We must also continue to develop new features and to improve functionality of our platform based on specific customer requests and anticipated market needs. Research and development in the mobile data services industry, however, is complex, expensive and uncertain. We believe that we must continue to dedicate a significant amount of resources to research and development efforts to maintain our competitive position. If we continue to expend a significant amount of resources on research and development, but our efforts do not lead to the successful introduction of service enhancements that are competitive in the marketplace, there could be a material adverse effect on our business, operating results, financial condition and market share.
Our solutions are complex and may take longer to develop than anticipated, and we may not recognize revenue from new service enhancements until after we have incurred significant development costs.
Most of our services must be tailored to meet customer specifications. In addition, our international customers often require significant customization of our platform to meet local needs. As a result, we often develop new features and enhancements to our existing services. These new features and enhancements often take substantial time to develop because of their complexity and because customer specifications sometimes change during the development cycle. We often do not recognize revenue from new services or enhancements until we have incurred significant development costs. In addition to delayed recognition of revenue from such new services and enhancements, our operating results will suffer if the new services or enhancements fail to meet our customers’ expectations.
We have limited experience operating in foreign jurisdictions and are rapidly building our international operations. Operating in international markets requires significant management attention and financial resources. The investment and additional resources required to establish operations and manage growth in other countries may not produce desired levels of revenue or profitability.
Our ability to use net operating and certain built-in losses to reduce future tax payments may be limited by provisions of the Internal Revenue Code, and may be subject to further limitation as a result of future transactions.
Sections 382 and 383 of the Internal Revenue Code of 1986, as amended, contain rules that limit the ability of a company that undergoes an ownership change, which is generally any change in ownership of more than 50% of its stock over a three-year period, to utilize its net operating loss and tax credit carryforwards and certain built-in losses recognized in the years after the ownership change. These rules generally operate by focusing on ownership changes involving stockholders who directly or indirectly own 5% or more of the stock of a company and any change in ownership arising from a new issuance of stock by the company. Generally, if an ownership change occurs, the yearly taxable income limitation on the use of net operating loss and tax credit carryforwards
23
and certain built-in losses is equal to the product of the applicable long term tax exempt rate and the value of the company’s stock immediately before the ownership change. As a result, we may be unable to offset our taxable income with losses, or our tax liability with credits, before such losses and credits expire.
In addition, it is possible that future transactions (including issuances of new shares of our common stock and sales of shares of our common stock) will cause us to undergo one or more additional ownership changes. In that event, we generally would not be able to use our pre-change loss or certain built-in losses prior to such ownership change to offset future taxable income in excess of the annual limitations imposed by Sections 382 and 383 and those attributes already subject to limitations (as a result of our prior ownership changes) may be subject to more stringent limitations.
Our ability to sell our services is highly dependent on the quality of our support and services offerings, and our failure to offer high quality support and services would have a material adverse effect on our sales and results of operations.
Our customers depend on our support organization to resolve issues relating to our mCore service delivery platform. We believe that a high level of support is critical for the successful marketing and sale of our services and future enhancements to mCore. Failure to effectively assist our customers in deploying their primary mobile data services, quickly resolve post-deployment issues, and otherwise provide effective ongoing support would adversely affect our ability to sell our services to existing customers and could harm our reputation among potential customers. In addition, as we expand our operations internationally, our support organization will face additional challenges, including those associated with delivering support, training and documentation in languages other than English. As a result, our failure to maintain high quality support and services could have a material adverse effect on our business, operating results and financial condition.
We rely on the development of content and applications by third parties, and if wireless carriers and their subscribers do not find such content compelling, our sales could decline.
Our business is dependent on the availability of content and applications for mobile devices that wireless carriers and their subscribers find useful and compelling. A significant percentage of our revenue is derived from the sale of applications and content through marketplaces and portals we operate for our wireless carrier customers. We also believe that demand for our services will increase as the number of applications and the volume of mobile content increases because our services facilitate the navigation and organization of large numbers of applications and large amounts of content. We do not develop applications or content; rather, we facilitate the sale and consumption of applications and content developed by third parties through our wireless carrier customers. If third-party developers fail to create content and applications that wireless carriers and their subscribers find useful and compelling, our sales would decline, and that would have a significant adverse effect on our business, operating results and financial condition.
Our solutions may contain undetected software errors, which could harm our reputation and adversely affect our business.
Our solutions are highly technical and have contained and may contain undetected errors, defects or security vulnerabilities. Some errors in our solutions may only be discovered after a solution has been deployed and used by our wireless carrier customers. Any errors, defects or security vulnerabilities discovered in our solutions after commercial release could result in loss of revenue or delay in revenue recognition, loss of customers and increased service cost, any of which could adversely affect our business, operating results and financial condition. In addition, we could face claims for product liability, tort or breach of warranty. Defending a lawsuit, regardless of its merit, is costly and may divert management’s attention away from the business and adversely affect the market’s perception of us and our services. In addition, if our business liability insurance coverage is inadequate or future coverage is unavailable on acceptable terms or at all, our operating results and financial condition could be adversely impacted.
24
If we fail to manage future growth effectively, our business could be harmed.
We have experienced, and expect to continue to experience, rapid growth. Our revenue from continuing operations grew from $21.9 million during the year ended December 31, 2006 to $133.4 million during the year ended December 31, 2010. This growth has placed significant demands on our management, operational and financial infrastructure. To manage growth effectively, we must continue to improve and enhance our managerial, operational and financial controls, and train and manage our employees, and expand our employee base. We must also manage new and existing relationships with customers, suppliers, business partners and other third parties. These activities will require significant expenditures and allocation of valuable management resources. If we fail to maintain the efficiency of our organization as we grow, our profit margins may decrease, and we may be unable to achieve our business objectives.
In recent years, we have recognized significant impairment losses related to our goodwill, intangible assets and property and equipment. Additional impairment losses may be recognized which would adversely affect our financial results.
We are required under GAAP to test goodwill for impairment annually and to assess our amortizable intangible assets, including capitalized software costs, and long-lived assets, as well as goodwill, for impairment when events or changes in circumstance indicate the carrying value may not be recoverable. In 2010, we did not incur any such impairment losses, but in 2009 and 2008, impairment losses totaled $5.8 million and $29.1 million, respectively. Factors which have led to impairments in the past include changes in business strategy, restructuring of the business in connection with acquisitions, actual performance of acquired businesses below our expectations and expiration of customer contracts. Unanticipated events or changes in circumstances could impact our ability to recover the carrying value of some or all of these assets. In addition, we expect to make additional acquisitions in the future which would increase the amount of such assets on our books that would be subject to potential future impairment. In the event any of our current or future assets became impaired, the associated impairment charge could adversely impact our results of operations.
Our business involves the use, transmission and storage of confidential information, and the failure to properly safeguard such information could result in significant reputational harm and monetary damages.
Our business activities involve the use, transmission and storage of confidential information. We believe that we take commercially reasonable steps to protect the security, integrity and confidentiality of the information we collect and store, but there is no guarantee that inadvertent or unauthorized disclosure will not occur or that third parties will not gain unauthorized access to this information despite our efforts. If such unauthorized disclosure or access does occur, we may be required, under existing and proposed laws, to notify persons whose information was disclosed or accessed. We may also be subject to claims of breach of contract for such disclosure, investigation and penalties by regulatory authorities and potential claims by persons whose information was disclosed. The unauthorized disclosure of information may result in the termination of one or more of our commercial relationships and/or a reduction in customer confidence and usage of our services, which would have a material adverse effect on our business, operating results and financial condition.
We may be subject to liability for our use or distribution of information that we receive from third parties.
As part of our business, we obtain content and commercial information from third parties. When we distribute this information, we may be liable for the data contained in that information. There is a risk that we may be subject to claims related to the distribution of such content such as defamation, negligence, intellectual property infringement, violation of privacy or publicity rights and product or service liability, among others. Laws or regulations of certain jurisdictions may also deem some content illegal, which may expose us to additional legal liability. We also gather personal information from subscribers in order to provide personalized services. Gathering and processing this personal information may subject us to legal liability for, among other things, defamation, negligence, invasion of privacy and product or service liability. We are also subject to laws and regulations, both in the U.S. and abroad, regarding the collection and use of subscriber information. If we do not comply with these laws and regulations, we may be exposed to legal liability.
25
Some of the agreements by which we obtain content do not contain indemnity provisions in our favor. Even if a given contract does contain indemnity provisions, they may not cover a particular claim or type of claim or the party granting indemnity may not have the financial resources to cover the claim. Our insurance coverage may be inadequate to cover fully the amounts or types of claims that might be made. Any liability that we incur as a result of content we receive from third parties could adversely impact our results of operations.
Actual or perceived security vulnerabilities in mobile devices could negatively affect our business.
The security of mobile devices and wireless networks is critical to our business. Individuals or groups may develop and deploy viruses, worms and other malicious software programs that attack mobile devices and wireless networks. Security experts have identified computer worms targeted specifically at mobile devices. Security threats could lead some mobile subscribers to reduce or delay their purchases of mobile content and applications in an attempt to reduce the security threat posed by viruses, worms and other malicious software. Wireless carriers and device manufacturers may also spend more on protecting their wireless networks and mobile devices from attack, which could delay adoption of new mobile devices that tend to include more features and functionalities that facilitate increased use of mobile data services. Actual or perceived security threats, and reactions to such threats, could reduce our revenue or require unplanned expenditures on new security initiatives.
If we fail to maintain proper and effective internal controls or are unable to remediate the deficiencies in our internal controls, our ability to produce accurate and timely financial statements could be impaired and investors’ views of us could be harmed.
Ensuring that we have adequate internal financial and accounting controls and procedures in place so that we can produce accurate financial statements on a timely basis is a costly and time-consuming effort. Our internal control over financial reporting is a process designed to provide reasonable assurance regarding the reliability of financial reporting and the preparation of financial statements in accordance with GAAP. We are in the process of documenting and reviewing our internal controls and procedures. Beginning with fiscal year 2011, we will be required to comply with Section 404 of the Sarbanes-Oxley Act of 2002, or the Sarbanes-Oxley Act, which requires annual management assessment of the effectiveness of our internal control over financial reporting and a report by our independent registered public accounting firm addressing this assessment. Our compliance with Section 404 will require that we incur additional expense and expend management time on compliance-related issues. If we or our independent registered public accounting firm identify deficiencies in our internal control over financial reporting that are deemed to be material weaknesses, the market’s confidence in our financial statements could decline and the market price of our common stock could be adversely impacted.
Claims by others that we infringe their intellectual property rights could force us to incur significant costs.
We cannot be certain that our services do not and will not infringe the intellectual property rights of others. Many parties in the telecommunications and software industries have begun to apply for and obtain patent protection for innovative proprietary technologies and business methods. Given that our platform interacts with various participants in the mobile data ecosystem, existing or future patents protecting certain proprietary technology and business methods may preclude us from using such proprietary technology or business methods, or may require us to pay damages for infringement or fees to obtain a license to use the proprietary technology or business methods (which may not be available or, if available, may be on terms that are unacceptable), or both, which would increase our cost of doing business. In addition, litigation concerning intellectual property rights and the infringement of those rights, including patents, trademarks and copyrights, has grown significantly over the last several years and is likely to grow further in the future. If we become the subject of infringement claims, we may be forced into litigation, which will require us to devote significant resources and management time and attention to defend against such infringement claims. If it is determined that our services infringe the intellectual property rights of a third party, we may be required to pay damages or enjoined from using that technology or forced to obtain a license (which may not be available or, if available, may be on terms that are unacceptable) and/or pay royalties to continue using that technology. The assertion of intellectual property infringement claims against our technology could have a material adverse effect on our business, operating results and financial condition.
26
Government regulation of the mobile industry is evolving, and unfavorable changes or our failure to comply with regulations could harm our business and operating results.
As the mobile industry continues to evolve, we believe greater regulation by federal, state or foreign governments or regulatory authorities becomes more likely. For example, we believe increased regulation is likely in the area of data privacy, and laws and regulations applying to the solicitation, collection, processing or use of personal or consumer information, could affect our customers’ ability to use and share data, potentially reducing our ability to utilize this information for the purpose of continued improvement of the overall mobile subscriber experience. In addition, any regulation of the requirement to treat all content and application provider services the same over the mobile Internet, sometimes referred to as net neutrality regulation, could reduce our customers’ ability to make full use of the value of our services. Further, taxation of services provided over the Internet or other charges imposed by government agencies or by private organizations to access the Internet may be imposed. Any regulation imposing greater fees for Internet use or restricting information exchange over the Internet could result in a decline in the use of the mobile Internet and the viability of mobile data service providers, which could harm our business and operating results. Finally, any further or more restrictive regulation of the ability of wireless carriers to include charges for goods and services in a mobile subscriber’s bill or their ability to offer up these capabilities to third parties, such as ourselves, on a bill-on-behalf-of basis could negatively impact our business.
Our use of open source software could limit our ability to commercialize our services.
We have incorporated open source software into our services. Although we closely monitor our use of open source software, the terms of many open source licenses to which we are subject have not been interpreted by U.S. or foreign courts, and there is a risk that such licenses could be construed in a manner that imposes unanticipated conditions or restrictions on our ability to commercialize our services. In that event, we could be required to seek licenses from third parties in order to continue offering our services, to re-engineer our products or to discontinue sales of our services, any of which could materially adversely affect our business.
Our failure to raise additional capital or generate the cash flows necessary to expand our operations and invest in our services could reduce our ability to compete successfully.
In the future, we may require additional amounts of capital to execute our business plan. We may require capital to complete planned upgrades and enhancements to our products and services, increase our investment in capital equipment to support new and existing customers, extend our marketing and sales efforts, expand internationally and make strategic acquisitions if attractive opportunities become available. Our future capital requirements will depend on many factors, including the time and cost of our service enhancements, the rate of mobile data subscriber growth, the acceptance rate of mobile devices as multi-functional computing platforms, the demand for wireless applications, the time and cost of successfully entering into new customer contracts and the amount of investment needed to achieve our sales and marketing objectives.
Based on our current cash balances and projected revenues, we estimate that we will have sufficient capital to execute our near term business plans and maintain positive cash flow. However, this may not be the case. Further, we may not have sufficient capital to take advantage of opportunities for strategic acquisitions of significant complementary or competitive businesses that could enhance our business and operating results. If we raise additional equity financing, our stockholders may experience significant dilution of their ownership interests and the per share value of our common stock could decline. If we engage in debt financing, we may be required to accept terms that further restrict our ability to incur additional indebtedness and force us to maintain specified liquidity or other ratios. We may not be able to raise any additional capital that we may require on terms acceptable to us or at all. If we cannot obtain financing on commercially reasonable terms when needed, we may not be able to pursue some elements of our current strategy and business plan, and we may not be able to achieve our financial objectives.
27
The market price of our common stock may be highly volatile or may decline regardless of our operating performance.
Broad market and industry factors may adversely affect the market price of our common stock, regardless of our actual operating performance. Factors that could cause wide fluctuations in the stock price may include, among other things:
| • | actual or anticipated variations in our financial condition and operating results; |
| • | overall conditions or trends in our industry; |
| • | addition or loss of significant customers; |
| • | competition from existing or new products; |
| • | changes in the market valuations of companies perceived by investors to be comparable to us; |
| • | announcements by us or our competitors of technological innovations, new services or service enhancements; |
| • | announcements by us or our competitors of significant acquisitions, strategic partnerships, divestitures or capital commitments; |
| • | announcements of investigations or regulatory scrutiny of our operations or lawsuits filed against us; |
| • | additions or departures of key personnel; |
| • | changes in the estimates of our operating results or changes in recommendations by any securities or industry analysts that elect to follow our common stock; and |
| • | sales of our common stock by us or our stockholders, including sales by our directors and officers. |
In addition, the stock market in general, and the market for technology companies in particular, has experienced extreme price and volume fluctuations that have often been unrelated or disproportionate to the operating performance of those companies. These broad market and industry fluctuations, as well as general economic, political and market conditions such as recessions, interest rate changes or international currency fluctuations, may negatively impact the market price of our common stock. In addition, in the past, following periods of volatility in the overall market and the market price of a particular company’s securities, securities class action litigation has often been instituted against these companies. We may be the target of this type of litigation in the future. Securities litigation, if instituted against us, could result in substantial costs and a diversion of our management’s attention and resources, whether or not we are successful in such litigation.
Our principal stockholders may exert substantial influence over us and may exercise their control in a manner adverse to your interests.
Because a limited number of persons may exert substantial influence over us, transactions could be difficult or impossible to complete without the support of those persons. It is possible that these persons will exercise control over us in a manner adverse to your interests.
In our amended and restated certificate of incorporation, we renounce and provide for a waiver of the corporate opportunity doctrine as it relates to the funds affiliated with Technology Crossover Ventures, Koala Holding LP and any person or entity affiliated with these investors, we refer to all such persons as exempted persons. As a result, these exempted persons will have no fiduciary duty to present corporate opportunities to us. These exempted persons are in the business of making investments in companies and may, from time to time, acquire and hold interests in businesses that compete directly or indirectly with us. They may also pursue, for their own accounts, acquisition opportunities that may be complementary to our business, and, as a result, those acquisition opportunities may not be available to us. So long as these exempted persons continue to own a significant amount of our common stock, they will continue to be able to strongly influence or effectively control our decisions,
28
including director and officer appointments, potential mergers or acquisitions, asset sales and other significant corporate transactions. These potential conflicts of interest could have a material adverse effect on our business, financial condition, results of operations or prospects if attractive corporate opportunities are directed by the exempted persons to themselves or their other affiliates instead of to us.
For more information regarding ownership of our outstanding stock by our principal stockholders see Item 12 of this annual report on Form 10-K entitled “Security Ownership of Certain Beneficial Owners and Management and Related Stockholder Matters.”
Our historical financial statements may not be indicative of future performance.
In light of our acquisition of the mobile division of InfoSpace on December 28, 2007, our operating results only reflect the impact of the acquisition from that date, and therefore comparisons with prior periods are difficult. As a result, our limited historical financial performance as owners of the mobile division of InfoSpace may make it difficult for stockholders to evaluate our business and results of operations to date and to assess our future prospects and viability. Furthermore, our brief operating history has resulted in revenue and profitability growth rates that may not be indicative of our future results of operations. As a result, the price of our common stock may be volatile.
In addition, we exited two lines of business in 2007 and 2008, our direct to consumer business, which was sold in two transactions in 2007 and 2008, and a business we refer to as media and entertainment, which was discontinued in 2008. The loss from discontinued operations in the 2008 period includes losses from these discontinued businesses.
As a result of the foregoing factors, our historical results of operations are not necessarily indicative of the operating results to be expected in the future.
If securities or industry analysts do not publish research or reports about our business, if they adversely change their recommendations regarding our common stock, or if our operating results do not meet their expectations, our stock price and trading volume could decline.
The trading market for our common stock will be influenced by the research and reports that securities or industry analysts publish about us or our business. We do not have any control over these reports or analysts. If any of the analysts who cover our company downgrades our stock, or if our operating results do not meet the analysts’ expectations, our stock price could decline. Moreover, if any of these analysts ceases coverage of our company or fails to publish regular reports on our business, we could lose visibility in the financial markets, which in turn could cause our stock price and trading volume to decline.
We currently do not intend to pay dividends on our common stock and, as a result, your only opportunity to achieve a return on your investment is if the price of our common stock appreciates.
We have never declared or paid any dividends on our common stock and currently do not expect to declare or pay dividends on our common stock in the foreseeable future. Instead, we anticipate that all of our earnings in the foreseeable future will be used in the operation and growth of our business. Any determination to pay dividends in the future will be at the discretion of our board of directors. In addition, our ability to pay dividends on our common stock is currently limited by the covenants of our credit facility and may be further restricted by the terms of any future debt or preferred securities. Accordingly, your only opportunity to achieve a return on your investment in our company may be if the market price of our common stock appreciates and you sell your shares at a profit. The market price for our common stock may never exceed, and may fall below, the price that you pay for such common stock.
29
Congress has enacted new legislation that affects the taxation of common stock held by or through foreign entities.
Recently enacted legislation generally will impose a withholding tax of 30% on dividend income from our common stock and the gross proceeds of a disposition of our common stock paid to certain foreign entities after December 31, 2012, unless the foreign entity complies with certain conditions or an exception applies.
| Item 1B. | Unresolved Staff Comments. |
None.
| Item 2. | Properties. |
Our corporate headquarters is located in Bellevue, Washington and comprises approximately 65,000 square feet of space leased through December 20, 2013. We also perform a range of business functions out of offices in Morrisville, North Carolina. We have sales and product development functions in the United Kingdom and regional sales offices in the Netherlands, Indonesia, Singapore, India and Malaysia. We also operate one leased datacenter facility located in Washington State. In addition, we lease two third-party operated datacenters located in Georgia and Massachusetts to provide services to our customers. We believe that our existing properties are in good condition and sufficient and suitable for the conduct of our business. As our existing leases expire and as we continue to expand our operations, we believe that suitable space will be available to us on commercially reasonable terms.
| Item 3. | Legal Proceedings. |
Currently, we have no active legal proceedings. From time to time, we may be subject to additional legal proceedings and claims in the ordinary course.
We were a party in four purported class action lawsuits brought against us by individuals on behalf of customers receiving premium content from our content providers. The cases alleged that we and our content providers charged consumers for mobile phone content without proper authorization and/or engaged in misleading marketing for premium content. The cases sought unspecified damages. The cases were:
| • | Camellia Walker individually and on behalf of a class of similarly situated individuals v. Motricity, Inc., California Superior Court, Alameda County, filed July 3, 2008; |
| • | Susan Rynearson individually and on behalf of a class of similarly situated individuals v. Motricity, Inc., Washington Superior Court, King County, filed April 16, 2008; |
| • | Baker v. Sprint and New Motion, Inc. (Motricity is a third-party defendant), Eleventh Judicial Circuit Court, Miami-Dade County, claim against Motricity filed May 29, 2008; and |
| • | Scott Williams, et al, individually and on behalf of a class of similarly situated individuals v. Motricity, Inc., et al, Cook County Circuit Court, claim against Motricity filed March 17, 2010. |
The above cases are referred to herein as the “Lawsuits.”
The class representatives in the above matters, except for the Williams matter, all purchased content from Atrinsic, Inc. d/b/a New Motion, Inc. Atrinsic content is also at issue in several similar lawsuits brought against carriers who have, in turn, sought indemnification from us. Atrinsic entered into a settlement in a class action not involving us that we believe has released us from any claims that a consumer could bring and that is related to the Atrinsic content. Atrinsic received final court approval of its settlement on March 10, 2010.
On August 4, 2010, we entered into a Stipulation of Class Action Settlement in the Williams action. On December 2, 2010 the Circuit Court of Cook County in Illinois, issued an order in that case that approved the settlement and dismissed all claims. The Stipulation and the Williams order resolved the Lawsuits. The Williams order is now final, and the time period for claims to be submitted has ended.
| Item 4. | (Removed and Reserved). |
30
PART II
| Item 5. | Market for Registrant’s Common Equity, Related Stockholder Matters and Issuer Purchases of Equity Securities. |
Market Information
Our common stock has been listed on NASDAQ under the symbol “MOTR” since our initial public offering completed on June 18, 2010, at $10.00 per share. Prior to our initial public offering, there was no public market for our common stock. We are authorized to issue up to 625,000,000 shares of common stock, par value $0.001. Total shares of common stock outstanding as of February 18, 2011 were 43,083,831, and we had 361 stockholders of record.
The following table sets forth the high and low sales prices of our common stock per share, as reported by NASDAQ.
| High | Low | |||||||
| Quarter Ended June 30, 2010 |
||||||||
| June 17, 2010 through June 30, 2010 |
$ | 10.00 | $ | 8.45 | ||||
| Quarter Ended September, 30, 2010 |
||||||||
| July 1, 2010 through September 30, 2010 |
$ | 13.42 | $ | 6.55 | ||||
| Quarter Ended December 31, 2010 |
||||||||
| October 1, 2010 through December 31, 2010 |
$ | 31.95 | $ | 12.11 | ||||
Unregistered Sales of Equity Securities
In the fiscal year ended December 31, 2010, we have issued unregistered securities to a limited number of persons, as described below. None of these transactions involved any underwriters, underwriting discounts or commissions, or any public offering, and we believe each transaction was exempt from the registration requirements of the Securities Act by virtue of Rule 701 pursuant to compensatory benefit plans and contracts related to compensation.
We have issued the following equity compensation awards to certain employees and directors:
1. On February 9, 2010, we granted stock options to purchase 21,190 shares of common stock at an exercise price of $19.65 per share and 132,665 restricted stock awards with a fair market value of $19.65.
2. On February 12, 2010, we granted stock options to purchase 666 shares of common stock at an exercise price of $19.65 per share.
3. On March 8, 2010, we granted stock options to purchase 6,597 shares of common stock at an exercise price of $20.40 per share.
4. On March 26, 2010, we granted stock options to purchase 337,333 shares of common stock at an exercise price of $20.40 per share.
All of our stock option and restricted stock award grants listed above were made under our 2004 Stock Incentive Plan.
Dividend Policy
We are not required to pay any dividends and have not declared or paid any cash dividends on our common stock. We intend to continue to retain earnings for use in the operation and expansion of our business and therefore do not anticipate payment of any cash dividends on our common stock in the foreseeable future.
31
Securities Authorized for Issuance Under Equity Compensation Plans
See Item 12. “Security Ownership of Certain Beneficial Owners and Management and Related Stockholder Matters” for information regarding securities authorized for issuance under our equity compensation plans.
Performance Graph
The following graph compares the performance of our common stock during the period beginning June 18, 2010, using the closing price for the first day of trading per SEC regulations (rather than the IPO offering price), through December 31, 2010 to that of the total return index for the Standard and Poor’s (“S&P”) 600 and the S&P 600 Internet Software and Services assuming an investment of $100 on June 18, 2010. In calculating total annual stockholder return, reinvestment of dividends, if any, is assumed. The indices are included for comparative purpose only.
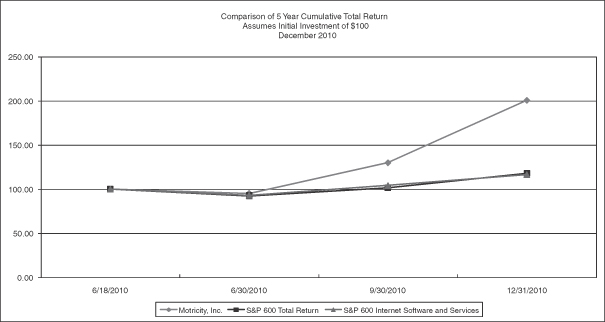
| 6/18/2010 | 6/30/2010 | 9/30/2010 | 12/31/2010 | |||||||||||||
| Motricity, Inc. |
$ | 100.00 | $ | 95.03 | $ | 129.70 | $ | 200.54 | ||||||||
| S&P 600 |
$ | 100.00 | $ | 92.41 | $ | 101.30 | $ | 117.75 | ||||||||
| S&P 600 Internet Software and Services |
$ | 100.00 | $ | 92.95 | $ | 104.00 | $ | 116.48 | ||||||||
Regulation S-K Subpart 229.200 Item 201 requires that a company’s total return performance graph include one industry index or peer group index as a performance comparison benchmark. This stock performance information is “furnished” and shall not be deemed to be “soliciting material” or subject to Rule 14A, shall not be deemed “filed” for purposes of Section 18 of the Exchange Act or otherwise subject to the liabilities of that section, and shall not be deemed incorporated by reference in any filing under the Securities Act of 1933, as amended, or the Exchange Act, whether made before or after the date of this report and irrespective of any general incorporation by reference language in any such filing, except to the extent that we specifically incorporate the information by reference.
32
| Item 6. | Selected Financial Data. |
The selected consolidated financial data set forth below as of December 31, 2010 and 2009 and for the years ended December 31, 2010, 2009 and 2008 have been derived from our audited consolidated financial statements included elsewhere in this annual report on Form 10-K. This information should be read in conjunction with “Management’s Discussion and Analysis of Financial Condition and Results of Operations,” and our consolidated financial statements and related notes included elsewhere in this annual report on Form 10-K.
The selected financial data as of December 31, 2008 and 2007 and for the years ended December 31, 2007 and 2006 have been derived from our audited consolidated financial statements not included herein. The selected historical financial data as of December 31, 2006 has been derived from our unaudited consolidated financial statements not included herein. In light of our acquisition of InfoSpace Mobile, on December 28, 2007, our financial statements only reflect the impact of that acquisition since that date, and therefore comparisons with prior periods are difficult.
| Years ended December 31, | ||||||||||||||||||||
| (In thousands, except per share data) | 2010 | 2009 | 2008 | 2007 | 2006 | |||||||||||||||
| Condensed Consolidated Statement of Operations Data: |
||||||||||||||||||||
| Total revenues |
$ | 133,379 | $ | 113,695 | $ | 103,151 | $ | 35,171 | $ | 21,903 | ||||||||||
| Operating expenses |
||||||||||||||||||||
| Direct third-party expenses |
17,044 | 9,485 | 5,451 | 3,709 | 2,201 | |||||||||||||||
| Datacenter and network operations(1) |
30,749 | 31,786 | 33,000 | 9,468 | 9,561 | |||||||||||||||
| Product development and sustainment(1) |
25,955 | 31,389 | 52,261 | 16,229 | 24,617 | |||||||||||||||
| Sales and marketing(1) |
13,769 | 11,900 | 10,228 | 7,119 | 8,403 | |||||||||||||||
| General and administrative(1) |
41,034 | 20,841 | 26,052 | 10,334 | 11,239 | |||||||||||||||
| Depreciation and amortization(1) |
12,595 | 13,208 | 21,559 | 10,322 | 5,925 | |||||||||||||||
| Restructuring(2) |
407 | 2,058 | 3,236 | 1,283 | 1,084 | |||||||||||||||
| Goodwill and long-lived asset impairment charges(3) |
— | 5,806 | 29,130 | 26,867 | — | |||||||||||||||
| Abandoned transaction charge(4) |
— | — | — | 2,600 | — | |||||||||||||||
| Total operating expenses |
141,553 | 126,473 | 180,917 | 87,931 | 63,030 | |||||||||||||||
| Operating loss |
(8,174 | ) | (12,778 | ) | (77,766 | ) | (52,760 | ) | (41,127 | ) | ||||||||||
| Other income (expense), net |
3,249 | (1,627 | ) | 2,714 | 1,155 | (1,110 | ) | |||||||||||||
| Loss from continuing operations, before income tax |
(4,925 | ) | (14,405 | ) | (75,052 | ) | (51,605 | ) | (42,237 | ) | ||||||||||
| Provision for income taxes |
2,090 | 1,896 | 1,776 | — | — | |||||||||||||||
| Loss from continuing operations |
(7,015 | ) | (16,301 | ) | (76,828 | ) | (51,605 | ) | (42,237 | ) | ||||||||||
| Loss from discontinued operations(5) |
— | — | (1,072 | ) | (24,928 | ) | (12,960 | ) | ||||||||||||
| Loss from sale of discontinued operations(5) |
— | — | (127 | ) | (1,360 | ) | — | |||||||||||||
| Net loss |
(7,015 | ) | (16,301 | ) | (78,027 | ) | (77,893 | ) | (55,197 | ) | ||||||||||
| Accretion of redeemable preferred stock and dividends for preferred stock and redeemable preferred stock |
(13,293 | ) | (23,956 | ) | (22,427 | ) | (8,095 | ) | (5,942 | ) | ||||||||||
| Net loss attributable to common stockholders |
$ | (20,308 | ) | $ | (40,257 | ) | $ | (100,454 | ) | $ | (85,988 | ) | $ | (61,139 | ) | |||||
| Net loss per share attributable to common stockholders—basic and diluted |
||||||||||||||||||||
| Continuing operations |
$ | (0.88 | ) | $ | (6.85 | ) | $ | (16.99 | ) | $ | (10.30 | ) | $ | (8.42 | ) | |||||
| Discontinued operations |
— | — | (0.20 | ) | (4.54 | ) | (2.26 | ) | ||||||||||||
| Total net loss per share attributable to common stockholders |
$ | (0.88 | ) | $ | (6.85 | ) | $ | (17.19 | ) | $ | (14.84 | ) | $ | (10.68 | ) | |||||
| Weighted average common shares outstanding—basic and diluted(6) |
22,963 | 5,878 | 5,843 | 5,796 | 5,726 | |||||||||||||||
| Consolidated Balance Sheet Data: |
||||||||||||||||||||
| Cash and cash equivalents |
$ | 78,519 | $ | 35,945 | $ | 14,299 | $ | 67,418 | $ | 6,143 | ||||||||||
| Working capital |
82,775 | 28,303 | 30,698 | 74,478 | 5,769 | |||||||||||||||
| Total assets |
231,814 | 174,176 | 195,447 | 289,391 | 114,599 | |||||||||||||||
| Total long-term debt and capital lease obligations, less current portion |
— | — | 3,234 | 16,295 | 5,344 | |||||||||||||||
| Total redeemable preferred stock |
49,862 | 417,396 | 394,135 | 372,406 | 164,037 | |||||||||||||||
| Total stockholders’ equity (deficit) |
143,564 | (288,821 | ) | (249,867 | ) | (152,510 | ) | (88,142 | ) | |||||||||||
33
| (1) | Depreciation and amortization is not included in each respective operating expense category. The allocation by function is as follows: |
| Years ended December 31, | ||||||||||||||||||||
| (In thousands) | 2010 | 2009 | 2008 | 2007 | 2006 | |||||||||||||||
| Datacenter and network operations |
$ | 8,071 | $ | 8,890 | $ | 16,824 | $ | 7,310 | $ | 2,938 | ||||||||||
| Product development and sustainment |
2,114 | 1,962 | 2,237 | 1,548 | 1,462 | |||||||||||||||
| Sales and marketing |
2,053 | 1,960 | 2,075 | 307 | 4 | |||||||||||||||
| General and administrative |
357 | 396 | 423 | 1,157 | 1,521 | |||||||||||||||
| Depreciation and amortization |
$ | 12,595 | $ | 13,208 | $ | 21,559 | $ | 10,322 | $ | 5,925 | ||||||||||
| (2) | Our restructuring charges relate to costs associated with closing and relocating facilities, relocating certain key employees and severance costs following the acquisition of InfoSpace Mobile. See “Management’s Discussion and Analysis of Financial Condition and Results of Operations” for further details. |
| (3) | The impairments in 2008 and 2009 relate primarily to integration activities following our acquisition of InfoSpace Mobile in December 2007 and to certain non-core operating assets. The 2007 impairments relate to goodwill due primarily to changes in consumer purchase habits. See “Management’s Discussion and Analysis of Financial Condition and Results of Operations” for further details. |
| (4) | In 2007, we issued a warrant to purchase common stock to an affiliate of an existing investor as a fee for providing a financing commitment in connection with a proposed transaction that was not completed. |
| (5) | In connection with a business strategy reassessment initiated in 2007, we exited the direct to consumer and media and entertainment businesses at various times during 2007 and 2008. |
| (6) | See Note 11 to our consolidated financial statements for a description of the method used to compute basic and diluted net loss per share attributable to common stockholders. |
34
| Item 7. | Management’s Discussion and Analysis of Financial Condition and Results of Operations. |
Overview
We are a leading provider of mobile data solutions and services that enable wireless carriers and enterprises to deliver high value mobile data services to their subscribers and customers. We provide a comprehensive suite of hosted, managed service offerings, including mobile web portal, mobile marketplace, messaging, and billing support and settlement, which enables wireless carriers to deliver customized, carrier-branded mobile data services and enable enterprises to leverage the power and potential of mobile data services to gain direct, interactive access to their customers. Our mCore service delivery platform provides the tools for mobile subscribers to easily locate and access personally relevant and location-based content and services, engage in social networking and download content and applications. We also leverage our data-rich insights into subscriber behavior and our user interface expertise to provide a highly personalized subscriber experience and targeted mobile marketing solutions. By enabling wireless carriers and enterprises to deliver personalized mobile experiences, we enhance carriers’ ability to attract and retain mobile subscribers, increase the average revenue per user for mobile data services, or mobile data ARPU, and reduce network overhead and operating costs. We also facilitate effective monetization for mobile content and application providers by making it easier for them to reach millions of targeted subscribers with customized offerings. For enterprises, we enable them to use mobile data services to help attract new customers and retain existing customers while at the same time creating new opportunities for revenue generation and cost reduction for their existing business.
Our mCore platform provides mobile subscribers with access to over 75 million unique pieces of third-party content or applications that we optimize for delivery to over 13,000 different mobile phone models, ranging from entry level feature phones to smartphones. Since 2005, Motricity has generated over $2.7 billion in gross revenue for our carrier customers through the sale of content and applications and powered over 60 billion page views through access to the mobile Internet. For the year ended December 31, 2010, we generated revenue of $133.4 million and incurred a net loss of $7.0 million. For the year ended December 31, 2009, we generated revenue of $113.7 million and incurred a net loss of $16.3 million. We have access to over 400 million mobile subscribers through our U.S. wireless carrier customers, and we currently provide mobile data services to tens of millions of these subscribers monthly.
The majority of our revenue consists of managed services revenue, charged on a monthly basis to our wireless carrier and other customers under contracts with initial terms ranging from one to three years in duration. Managed services revenue consists of fees we charge to manage, host and support our solutions and to provide other related services to our customers, and includes both fixed fees and variable, activity-based charges as well as revenue sharing arrangements whereby we earn a percentage of the revenue we enable our customers to generate. In addition, we charge professional service fees to customize, implement, and enhance our solutions. Our customers include the top U.S. wireless carriers Verizon Wireless, AT&T and Sprint, as well as leading international carriers, including members of the Axiata Group (XL, Celcom, Dialog, Robi and Hello) and Reliance. We generated approximately 82% and 95% of our total revenue in the U.S. during the year ended December 31, 2010 and the year ended December 31, 2009, respectively. As we pursue expansion opportunities with international wireless carriers, we expect international revenue to increase in absolute dollars and as a percentage of our total revenue.
We expect our growth to be heavily dependent upon our ability to maintain strong relationships with our U.S. and international wireless carriers, which represent our largest customers, as well as our ability to develop new relationships with wireless carriers in developed and emerging markets, such as Southeast Asia, India and Latin America. In addition, we expect our growth to depend upon the increased adoption of our mCore service delivery platform by our customers and an increase in the activity conducted on our platform by our customers’ subscribers. The failure of any of our significant carrier customers to renew existing contracts on favorable terms, such as AT&T, which has a contract up for renewal in 2011 that represents approximately two-thirds of AT&T’s revenue to us for the year ended December 31, 2010, would have a material adverse impact on our results of operations and future growth prospects. Our ability to achieve and sustain profitability could be affected as we
35
incur additional expenses to expand our sales, marketing, development and general and administrative capabilities. As we establish and expand our operational capabilities internationally, we will incur additional operating expenses and capital-related costs.
We were founded in 2001 with a mission to develop a mobile data services business, and our strategy has evolved as the mobile data services industry has developed and expanded. We focused originally on Palm-based technology and related solutions which dominated the mobile data services market before wireless data services based on cellular telephony technology were developed and widely deployed by the wireless carriers. As the wireless data services market has developed we expanded the scope and nature of our data services to support wireless carriers and their subscribers. Since 2003, we have completed eight acquisitions as part of the process of developing and expanding our mobile services business. These included initial acquisitions of companies primarily engaged in the Palm-based data services market and subsequent acquisitions of companies engaged in the wireless data services market, as the wireless carriers and handset manufacturers came to dominate the mobile data services market. In December 2007, in our largest acquisition to date, we acquired the assets of the mobile division of InfoSpace, Inc., which we refer to as InfoSpace Mobile, a competing provider of mobile content solutions and services for the wireless industry. Due to the rapidly evolving nature of the mobile data services market and changes in our business strategy over time, in each of the last several years we have recognized impairment charges related to both acquired and internally developed assets. In addition, we have exited our direct to consumer and media and entertainment businesses, which are reflected as discontinued operations in our consolidated financial statements. These discontinued businesses include our original mobile data services business and several of our earlier acquisitions. As a consequence of the rapidly evolving nature of our business and our limited operating history, we believe that period-to-period comparisons of revenue and operating results are not necessarily meaningful and should not be relied upon as indications of future performance.
On January 31, 2011, we entered into an Arrangement Agreement with Adenyo and the other parties signatory thereto. Adenyo is a mobile marketing, advertising and analytics solutions provider with operations in the United States, Canada and France. Pursuant to the Arrangement Agreement, one of our wholly-owned subsidiaries will acquire all the outstanding common shares of Adenyo for an aggregate purchase price of approximately $100 million (plus a contingent “earn-out” payment of up to $50 million), subject to working capital and other customary adjustments, and Adenyo will become a wholly-owned subsidiary. We will pay no less than $50 million of the initial $100 million purchase price with cash consideration, and the remaining consideration will be payable in our discretion in cash, shares of Company common stock, or a mix of cash and shares. We expect to complete the acquisition of Adenyo in April 2011.
The Infospace Mobile acquisition and business strategy realignment
In December 2007, we acquired InfoSpace Mobile for a cash purchase price of $135 million and the assumption of certain liabilities. The acquisition was a key element in the broad strategic realignment of our business. We viewed InfoSpace Mobile as a competing provider of mobile content solutions and services for the wireless industry that had strong relationships with several large wireless carriers. Through its mCore platform, InfoSpace Mobile offered many of the same services we provided to our customers through our then existing platform, called Fuel. InfoSpace Mobile also operated a large development organization, with an emphasis on professional services work. In the acquisition, in addition to acquiring the mCore platform and a number of leased U.S. datacenter facilities, we acquired a 224-person employee base, additional contracts with certain new and pre-existing customers, including AT&T and Verizon Wireless, and the Bellevue, Washington office facilities that we now use as our corporate headquarters. We financed the acquisition through the issuance of $177.3 million of Series I redeemable preferred stock and warrants.
Since completing the InfoSpace Mobile acquisition, we have significantly restructured our business. Due to the similar capabilities and features of the mCore and Fuel platforms, we conducted an evaluation of the mCore and Fuel platforms and concluded that it would be inefficient to continue managing and developing two incompatible technologies. As a result, we elected to phase out our legacy Fuel platform and began migrating our customers to an enhanced version of the acquired mCore platform. In 2008, we moved our headquarters from Durham, North
36
Carolina to Bellevue, Washington. In mid-2008, we adopted several business initiatives to increase the operating efficiencies of the combined business, including eliminating redundant positions and functions, outsourcing a portion of our development activities to India and consolidating our network operations into five datacenters. In addition, we have more recently begun to move our business focus toward the sale of comprehensive managed services solutions, utilizing our more standardized architecture, and to de-emphasize the more highly customized, professional services intensive approach. We believe that this evolution of our business strategy will accelerate innovation in our service offerings for the benefit of our wireless carrier customers and their subscribers while reducing costs to the carriers.
Prior to the InfoSpace Mobile acquisition, we provided mobile data services to wireless carriers and content and application providers using our proprietary Fuel platform. In addition, we operated two other lines of business, direct to consumer and media and entertainment. In 2007 and 2008, in connection with this business strategy realignment, we sold our direct to consumer business and discontinued our media and entertainment business. We then heightened our focus on our existing managed services model predominately for the wireless carriers. As part of our plan to pursue this more focused business strategy, our board of directors and our chief executive officer recruited additional senior management executives with substantial experience working with large carriers and managing significantly larger business organizations. In the first half of 2009, we completed the migration of all of our customers from the Fuel platform to mCore, except for AT&T’s AppCenter which utilizes more marketplace. AT&T fully migrated to the mCore platform in the second half of 2010, and at that point, we shut down the Fuel platform.
Key components of our results of operations
Sources of revenue
Our revenue is earned predominantly under contracts ranging from one to three years in duration with our wireless carrier and other customers. Under the typical contract, we provide one or more of our managed services, for which we charge fixed, periodic or variable, activity-based fees or receive a percentage of customer revenues (or a combination of these fees), and often also charge professional service fees to implement the specific mCore solutions required by the customer. We typically charge fixed monthly managed service fees to host the solutions and provide other support and services as required by the customer. Managed service fees vary by contract based on a number of factors including the scope of the solutions deployed, IT processing and bandwidth capacity requirements and the nature and scope of any other support or services required by the customer. Surcharges are typically included for excessive IT capacity requirements based on customer usage. Professional service fees primarily relate to work required for the initial customization and implementation of our mCore solutions for customers, as well as for customer-specified enhancements, extensions or other customization of the solutions following initial implementation. Professional services are typically provided on a fixed fee basis, depending on the scope and complexity of the individual project. Professional services fees from time to time may include charges for computer hardware and third-party software related to implementing our solutions.
Most of our customer contracts include a variable fee based on one of several measures, including the number of wireless subscribers who use our mCore solutions each month, the aggregate dollar volume or number of transactions processed, or specified rates for individual transactions processed, depending on the specific type of service involved. We typically receive a monthly subscription fee from our wireless carrier customers for each active portal user, where active usage is defined as utilizing the service at least one to three times per calendar month depending on the customer contract. We also earn a portion of our revenue from revenue sharing agreements whereby we earn a percentage of the incremental revenue we enable our customers to generate. In addition, from our content and application provider customers, we typically receive either a share of gross dollars generated for each premium message, or a fee for each standard message, delivered through the mCore platform. Individual carrier and content provider contracts often contain monthly minimum charges for usage-based fees or transaction-based charges for all or a portion of the contract term, based on various factors including the size of the customer’s subscriber base and the expected rate of subscriber usage of our services.
37
Due to the nature of the services we provide, our customer contracts contain monthly service level requirements that typically require us to pay financial penalties if we fail to meet the required service levels. We recognize these penalties, when incurred, as a reduction in revenue. Typical service level requirements address down time or slow response of our services that impact mobile subscribers and response time in addressing customer requests. Potential penalties vary by contract and range from near zero to as much as 100% of monthly recurring revenue, depending on the severity and duration of the service issue. Service level penalties represented 4% of total revenue in 2008 (during integration of the InfoSpace Mobile acquisition), and decreased to 1% of total revenue in 2009 and 2010.
Operating expenses
We classify our operating expenses into six categories: direct third-party, datacenter and network operations, product development and sustainment, sales and marketing, general and administrative and depreciation and amortization. Our operating expenses consist primarily of personnel costs, which include salaries, bonuses, commissions, payroll taxes, employee benefit costs and stock-based compensation expense. Other operating expenses include datacenter and office facility expenses, computer hardware, software and related maintenance and support expenses, bandwidth costs, and marketing and promotion, legal, audit, tax consulting and other professional service fees. We charge stock-based compensation expense resulting from the amortization of the fair value of stock option grants to each option holder’s functional area. We allocate certain facility-related and other common expenses such as rent, office and IT desktop support to functional areas based on headcount.
Direct third-party expenses. Our direct third-party expenses consist of licensing costs for customer-specific, third-party software and the costs of certain content that we contract for directly on behalf of our wireless carrier customers, as well as certain computer hardware and software that we acquire on behalf of carrier customers. The project specific hardware and software expenses may cause large fluctuations from quarter to quarter. We expect the other direct third-party expenses that are not related to specific projects to increase as we directly contract for additional content for our carrier customers and to the extent licensing costs for customer-specific, third-party software increases based on increases in associated revenues.
Datacenter and network operations. Datacenter and network operations expenses consist primarily of personnel and outsourcing costs for operating our datacenters, which host our mCore solutions on behalf of our customers. Additional expenses include facility rents, power, bandwidth capacity and software maintenance and support. We have been consolidating our datacenters since the InfoSpace Mobile acquisition, which has reduced datacenter and network operations costs. We expect, however, to expand our datacenter and our network capabilities in order to support the expected growth in mobile data usage by mobile subscribers. We expect our datacenter and network operations expenses to increase in absolute dollars but to decrease as a percentage of revenue over time.
Product development and sustainment. Product development expenses primarily consist of personnel costs and costs from our development vendors. Our product development efforts include improving and extending the functionality and performance of our service delivery platform, developing new solutions, customizing and implementing our solution set for our customers and providing other service and support functions for our solutions. Product development costs related to software products to be sold, leased or otherwise marketed are capitalized when technological feasibility has been established and amortized over the expected asset life. Product development costs related to software used solely on an internal basis to provide our services, which we refer to as internal use software, are capitalized and amortized over the expected asset life. We expect that product development expenses will increase in absolute dollars as we continue to enhance and expand our suite of solutions and services.
Sales and marketing. Sales and marketing expenses primarily consist of personnel costs for our sales and marketing staff, commissions earned by our sales personnel and the cost of marketing programs. In order to continue to grow our business and awareness of our services, we expect that we will commit additional resources to our sales and marketing efforts. We expect that sales and marketing expenses will increase over time as we work to expand our U.S. and international customer bases.
38
General and administrative. General and administrative expenses, referred to herein as G&A, primarily consist of personnel costs for our executive, finance, legal, human resources and administrative personnel, as well as legal, accounting and other professional fees and facilities-related expenses. In 2010, we recognized additional stock-based compensation related to the vesting of restricted stock as a result of the IPO. We expect stock-based compensation to be lower in the future as it continues at a normalized run-rate. We expect our G&A expenses that are not related to stock-based compensation to increase in absolute dollars, but decrease as a percentage of revenue over time.
Depreciation and amortization. Depreciation and amortization expenses consist primarily of depreciation of internal use software, computer hardware and leasehold improvements in our datacenters, amortization of capitalized software development costs, and amortization of purchased intangibles. We expect that depreciation and amortization expenses will increase in absolute dollars and as a percentage of revenue over the next year as we continue to expand our datacenters and our suite of solutions, but decline as a percentage of revenue over time.
Other income (expense), net
Other income and other expenses, net consists of interest we earn on our cash and cash equivalents, interest expense we incur as a result of our borrowings, if any, and non-operating income and expenses. It also includes income or expense related to changes in the fair value of our previously outstanding warrants to purchase redeemable preferred shares.
Income tax provision
Income tax expenses for 2010, 2009 and 2008 primarily consist of a deferred U.S. tax provision for the difference between book and tax treatment of goodwill associated with the acquisition of the InfoSpace Mobile assets and taxes in certain foreign jurisdictions. Due to our history of operating losses, we have accumulated substantial net operating losses, which constitute the majority of our deferred tax assets. Because of our history of operating losses, we maintain full valuation allowances against our deferred tax assets and consequently are not recognizing any tax benefit related to our current pre-tax losses. If we achieve sustained profitability, subject to certain provisions of the U.S. federal tax laws that may limit our use of our accumulated losses, we will continue to evaluate whether we should record a valuation allowance, based on a more likely than not standard, which would result in immediate recognition of a tax benefit and we would begin recording income tax provisions based on our earnings and applicable statutory tax rates going forward. Due to our large net operating loss carryforwards, we do not expect to pay U.S. federal income taxes in the next several years.
As a result of the recent growth in our international business, we expect to pay income taxes in certain foreign countries.
39
Results of operations
The following tables set forth components of our results of operations, including both continuing and discontinued operations, for the periods indicated:
| Years ended December 31, | ||||||||||||
| (In thousands) | 2010 | 2009 | 2008 | |||||||||
| Revenue |
||||||||||||
| Managed services |
$ | 90,292 | $ | 81,403 | $ | 85,677 | ||||||
| Professional services |
43,087 | 32,292 | 17,474 | |||||||||
| Total revenues |
133,379 | 113,695 | 103,151 | |||||||||
| Operating expenses |
||||||||||||
| Direct third-party expenses |
17,044 | 9,485 | 5,451 | |||||||||
| Datacenter and network operations, excluding depreciation |
30,749 | 31,786 | 33,000 | |||||||||
| Product development and sustainment, excluding depreciation |
25,955 | 31,389 | 52,261 | |||||||||
| Sales and marketing, excluding depreciation |
13,769 | 11,900 | 10,228 | |||||||||
| General and administrative, excluding depreciation |
41,034 | 20,841 | 26,052 | |||||||||
| Depreciation and amortization |
12,595 | 13,208 | 21,559 | |||||||||
| Restructuring |
407 | 2,058 | 3,236 | |||||||||
| Goodwill and long-lived asset impairment charges |
— | 5,806 | 29,130 | |||||||||
| Total operating expenses |
141,553 | 126,473 | 180,917 | |||||||||
| Operating loss |
(8,174 | ) | (12,778 | ) | (77,766 | ) | ||||||
| Other income (expense), net |
||||||||||||
| Other income (expense) |
3,357 | (1,657 | ) | 1,892 | ||||||||
| Interest and investment income, net |
3 | 250 | 1,315 | |||||||||
| Interest expense |
(111 | ) | (220 | ) | (493 | ) | ||||||
| Other income (expense), net |
3,249 | (1,627 | ) | 2,714 | ||||||||
| Loss from continuing operations, before income tax |
(4,925 | ) | (14,405 | ) | (75,052 | ) | ||||||
| Provision for income taxes |
2,090 | 1,896 | 1,776 | |||||||||
| Loss from continuing operations |
(7,015 | ) | (16,301 | ) | (76,828 | ) | ||||||
| Loss from discontinued operations |
— | — | (1,072 | ) | ||||||||
| Loss from sale of discontinued operations |
— | — | (127 | ) | ||||||||
| Net loss |
$ | (7,015 | ) | $ | (16,301 | ) | $ | (78,027 | ) | |||
40
Depreciation and amortization by function:
| Years ended December 31, | ||||||||||||
| (In thousands) | 2010 | 2009 | 2008 | |||||||||
| Datacenter and network operations |
$ | 8,071 | $ | 8,890 | $ | 16,824 | ||||||
| Product development and sustainment |
2,053 | 1,962 | 2,237 | |||||||||
| Sales and marketing |
2,114 | 1,960 | 2,075 | |||||||||
| General and administrative |
357 | 396 | 423 | |||||||||
| Total depreciation and amortization |
$ | 12,595 | $ | 13,208 | $ | 21,559 | ||||||
| As a Percentage of Total Revenues from Continuing Operations |
||||||||||||
| Total revenues |
100 | % | 100 | % | 100 | % | ||||||
| Operating expenses |
||||||||||||
| Direct third-party expenses |
13 | 8 | 5 | |||||||||
| Datacenter and network operations, excluding depreciation |
23 | 28 | 32 | |||||||||
| Product development and sustainment, excluding depreciation |
19 | 28 | 51 | |||||||||
| Sales and marketing, excluding depreciation |
10 | 10 | 10 | |||||||||
| General and administrative, excluding depreciation |
31 | 18 | 25 | |||||||||
| Depreciation and amortization |
10 | 12 | 21 | |||||||||
| Other charges |
— | 7 | 31 | |||||||||
| Total operating expenses |
106 | 111 | 175 | |||||||||
| Operating loss |
(6 | ) | (11 | ) | (75 | ) | ||||||
| Other income (expense), net |
2 | (1 | ) | 3 | ||||||||
| Loss from continuing operations, before income tax |
(4 | ) | (12 | ) | (72 | ) | ||||||
| Provision for income taxes |
1 | 2 | 2 | |||||||||
| Loss from continuing operations |
(5 | )% | (14 | )% | (74 | )% | ||||||
Year ended December 31, 2010 compared to the year ended December 31, 2009
Total revenues
| Year ended December 31, |
$ change | % change | ||||||||||||||
| (Dollars in thousands) | 2010 | 2009 | ||||||||||||||
| Managed services |
$ | 90,292 | $ | 81,403 | $ | 8,889 | 10.9 | % | ||||||||
| Professional services |
43,087 | 32,292 | 10,795 | 33.4 | ||||||||||||
| Total revenues |
$ | 133,379 | $ | 113,695 | $ | 19,684 | 17.3 | % | ||||||||
Total revenues for the year ended December 31, 2010 increased $19.7 million, or 17.3%, compared to the year ended December 31, 2009. The increase in total revenue consists of an $8.9 million increase in managed services revenue and a $10.8 million increase in professional services revenue. The increase of managed services revenue in the 2010 period is primarily due to higher transaction based portal fees and higher storefront revenue. Managed services revenue accounted for 68% and 72% of our revenues for the year ended December 31, 2010 and 2009, respectively, while professional services accounted for 32% and 28% of total revenues in each period, respectively. The primary reasons for the increase in professional services revenue were the large implementation projects for XL and AT&T marketplace, and the contract amendment in the first quarter of the year that resulted in current recognition of $4.9 million of revenue previously deferred.
We generated 82% of our revenues in the U.S. for the year ended December 31, 2010. Revenue from our largest customers, AT&T, Verizon Wireless and XL, represented 44%, 24% and 13% of total revenues, respectively. For
41
the year ended December 31, 2009, 95% of our revenues were generated in the U.S. and revenues from our largest customers, AT&T and Verizon Wireless, represented 53% and 20% of total revenues, respectively.
Operating expenses
| Year ended December 31, |
$ change | % change | ||||||||||||||
| (Dollars in thousands) | 2010 | 2009 | ||||||||||||||
| Direct third-party expenses |
$ | 17,044 | $ | 9,485 | $ | 7,559 | 79.7 | % | ||||||||
| Datacenter and network operations* |
30,749 | 31,786 | (1,037 | ) | (3.3 | ) | ||||||||||
| Product development and sustainment* |
25,955 | 31,389 | (5,434 | ) | (17.3 | ) | ||||||||||
| Sales and marketing* |
13,769 | 11,900 | 1,869 | 15.7 | ||||||||||||
| General and administrative* |
41,034 | 20,841 | 20,193 | 96.9 | ||||||||||||
| Depreciation and amortization |
12,595 | 13,208 | (613 | ) | (4.6 | ) | ||||||||||
| Restructuring |
407 | 2,058 | (1,651 | ) | (80.2 | ) | ||||||||||
| Goodwill and long-lived asset impairment charges |
— | 5,806 | (5,806 | ) | (100.0 | ) | ||||||||||
| Total operating expenses |
$ | 141,553 | $ | 126,473 | $ | 15,080 | 11.9 | % | ||||||||
| * | excluding depreciation |
Operating expenses for the year ended December 31, 2010 were $141.6 million, which is $15.1 million, or 11.9% greater than the year ended December 31, 2009. The increase was primarily due to a $17.5 million stock-based compensation charge primarily included within general and administrative expenses related to the initial vesting of restricted stock as a result of the initial public offering (or “IPO”) and $7.6 million of increased direct-third party expenses, partially offset by a $5.4 million reduction in product development and sustainment expense and lower restructuring and impairment charges.
Direct third party expenses
Direct third party expenses increased $7.6 million, or 79.7%, for the year ended December 31, 2010, compared to the corresponding 2009 period. The increase is primarily due to the cost of the third-party computer hardware and software purchased in conjunction with the XL Axiata and Celcom implementation projects and increased third party browser costs for att.net based on associated revenue growth.
Datacenter and network operations, excluding depreciation
Datacenter and network operations expense, excluding depreciation decreased $1.0 million, or 3.3%, for the year ended December 31, 2010, compared to the corresponding 2009 period primarily due to cost savings from renegotiating certain vendor contracts.
Product development and sustainment, excluding depreciation
Product development and sustainment expense, excluding depreciation, decreased $5.4 million, or 17.3%, for the year ended December 31, 2010, compared to the corresponding 2009 period. The decrease reflects lower labor-related costs due to cost efficiencies from outsourcing a portion of our development activities to India and other labor related savings as a result of operating efficiencies. In addition to the labor-related cost savings, further expense reductions were realized in the second half of 2010 compared to the 2009 period as a result of software development costs that were capitalized based on achieving technological feasibility on certain new solutions under development. Capitalized development costs related to software were $9.1 million for the year ended December 31, 2010. Capitalized development costs related to internal use software were $2.1 million for the year ended December 31, 2009. The expense savings were partially offset by higher headcount required to support growth and an increase in stock-based compensation expense.
42
Sales and marketing, excluding depreciation
Sales and marketing expense, excluding depreciation, increased $1.9 million, or 15.7%, for the year ended December 31, 2010, compared to the corresponding 2009 period. The increases are due to higher personnel and advertising expenses, primarily for our international expansion efforts.
General and administrative, excluding depreciation
General and administrative expense, excluding depreciation, increased $20.2 million, or 96.9%, for the year ended December 31, 2010, compared to the corresponding 2009 period. The year ended December 31, 2010 reflects $17.2 million of stock-based compensation recognized in the second quarter related to the vesting of restricted stock as a result of the IPO and an additional $2.9 million of stock-based compensation related to the ongoing vesting of restricted stock. In addition, increased expenses related to employee compensation and benefits and the Atrinsic arbitration were partially offset by lower external consulting fees.
Depreciation and amortization
Depreciation and amortization expense decreased $0.6 million, or 4.6%, for the year ended December 31, 2010, compared to the corresponding 2009 period. The decrease is primarily due to certain assets from the InfoSpace Mobile acquisition now being fully depreciated.
Restructuring
During the three months ended September 30, 2009, we incurred $1.0 million of restructuring charges related to the relocation of our headquarters from Durham, North Carolina to Bellevue, Washington in 2008. In the first quarter of 2010, we incurred a $0.4 million expense upon disposition of the remaining asset held for sale related to the relocation.
Goodwill and long-lived asset impairment charges
The $5.8 million of impairments in the 2009 period relate primarily to writing off the remaining balances of assets acquired from a messaging business. These assets included a customer list for $1.9 million and capitalized software of $3.3 million.
Other income (expense), net
| Year ended December 31, |
$ change | |||||||||||
| (Dollars in thousands) | 2010 | 2009 | ||||||||||
| Other income (expense) |
$ | 3,357 | $ | (1,657 | ) | $ | 5,014 | |||||
| Interest and investment income, net |
3 | 250 | (247 | ) | ||||||||
| Interest expense |
(111 | ) | (220 | ) | 109 | |||||||
| Total other income (expense), net |
$ | 3,249 | $ | (1,627 | ) | $ | 4,876 | |||||
Other income of $3.2 million for the year ended December 31, 2010 consists primarily of the gain related to the decrease in fair value of our warrants to purchase redeemable preferred shares. All outstanding preferred stock warrants were converted to common stock warrants immediately prior to the IPO.
43
Provision for income taxes
| Year ended December 31, |
$ change | % change | ||||||||||||||
| (Dollars in thousands) | 2010 | 2009 | ||||||||||||||
| Provision for income taxes |
$ | 2,090 | $ | 1,896 | $ | 194 | 10.2 | % | ||||||||
Income tax expense for the year ended December 31, 2010 primarily consists of a deferred U.S. tax provision for the difference between book and tax treatment of goodwill associated with the acquisition of InfoSpace and foreign income taxes. Income tax expense for the year ended December 31, 2009 primarily consists of a deferred U.S. tax provision for the difference between book and tax treatment of goodwill. We maintain a full valuation allowance against our net deferred tax assets which precludes us from recognizing a tax benefit for our current operating losses. Our lack of profitability historically is a key factor in concluding there is insufficient evidence of our ability to realize any future benefits from our deferred tax assets.
Net income (loss)
| Year ended December 31, |
$ change | |||||||||||
| (Dollars in thousands) | 2010 | 2009 | ||||||||||
| Net income (loss) |
$ | (7,015 | ) | $ | (16,301 | ) | $ | 9,286 | ||||
Net loss for the year ended December 31, 2010, was $9.3 million less than the year ended December 31, 2009. The year ended December 31, 2010 included a $17.5 million stock compensation charge in the second quarter that was triggered by the IPO and $7.6 million increased direct third party costs, which was more than offset by the following:
| • | $19.7 million increase in revenue; |
| • | $5.4 million reduction in product development and sustainment expenses; |
| • | the absence of goodwill and long-lived asset impairment charges of $5.8 million in the 2009 period; and |
| • | $4.9 million increase in other income (expense), net. |
Year ended December 31, 2009 compared to the year ended December 31, 2008
Total revenues
| Year ended December 31, |
||||||||||||||||
| (Dollars in thousands) | 2009 | 2008 | $ change | % change | ||||||||||||
| Managed services |
$ | 81,403 | $ | 85,677 | $ | (4,274 | ) | (5.0 | )% | |||||||
| Professional services |
32,292 | 17,474 | 14,818 | 84.8 | ||||||||||||
| Total revenues |
$ | 113,695 | $ | 103,151 | $ | 10,544 | 10.2 | % | ||||||||
Our total revenues increased $10.5 million, or 10.2%, for the year ended December 31, 2009 compared to the year ended December 31, 2008. Managed services revenue accounted for 71.6% and 83.1% of our revenue for the years ended December 31, 2009 and 2008, respectively, while professional services accounted for 28.4% and 16.9%, respectively. The increase in revenues was due to the $14.8 million increase in professional services revenue, partially offset by the $4.3 million reduction in managed services revenue. The increase in professional services revenue was primarily due to a large portal customization and implementation project, which included $4.4 million of associated third-party computer hardware and software revenue, completed during 2009 for
44
which we recognized the revenue based on completion milestones. Our professional services revenue can vary significantly from period to period due to the timing and magnitude of large customization and implementation projects.
The decrease in managed services revenue in 2009 consisted primarily of a $3.6 million reduction in storefront revenue due to the expiration of several small contracts and a $3.7 million reduction in storefront revenue due to declining transaction activity from two large customers. User- and transactional-based fees made up approximately 70% and 74% of our managed services revenue for 2009 and 2008, respectively, the decrease being primarily due to the decline in storefront transaction volumes.
We generated 95% of our revenue in the U.S. for the year ended December 31, 2009. Revenue from our current five largest customers, represented 84% of our total revenue for the year ended December 31, 2009, with AT&T and Verizon Wireless accounting for 53% and 20% of total revenue, respectively. For the year ended December 31, 2008, revenue from our five largest customers represented 67% of our total revenue, with AT&T and Verizon Wireless accounting for 42% and 12% of total revenue, respectively.
Operating expenses
| Year ended December 31, |
||||||||||||||||
| (Dollars in thousands) | 2009 | 2008 | $ change | % change | ||||||||||||
| Direct third-party expenses |
$ | 9,485 | $ | 5,451 | $ | 4,034 | 74.0 | % | ||||||||
| Datacenter and network operations, excluding depreciation |
31,786 | 33,000 | (1,214 | ) | (3.7 | ) | ||||||||||
| Product development and sustainment, excluding depreciation |
31,389 | 52,261 | (20,872 | ) | (39.9 | ) | ||||||||||
| Sales and marketing, excluding depreciation |
11,900 | 10,228 | 1,672 | 16.3 | ||||||||||||
| General and administrative, excluding depreciation |
20,841 | 26,052 | (5,211 | ) | (20.0 | ) | ||||||||||
| Depreciation and amortization |
13,208 | 21,559 | (8,351 | ) | (38.7 | ) | ||||||||||
| Restructuring |
2,058 | 3,236 | (1,178 | ) | (36.4 | ) | ||||||||||
| Goodwill and long-lived asset impairment charges |
5,806 | 29,130 | (23,324 | ) | (80.1 | ) | ||||||||||
| Total operating expenses |
$ | 126,473 | $ | 180,917 | $ | (54,444 | ) | (30.1 | )% | |||||||
Our operating expenses were $126.5 million for the year ended December 31, 2009 compared to $180.9 million for the year ended December 31, 2008. The decrease of $54.4 million, or 30.1%, is primarily attributable to the $20.9 million decrease in product development expense, the $5.2 million decrease in general and administrative expense, the $8.4 million decrease in depreciation and amortization expense and significantly lower goodwill and long-lived asset impairment charges for year ended December 31, 2009 compared to the prior year period. Excluding the impact of restructuring and goodwill and long-lived asset impairment charges, operating expenses decreased $29.9 million during 2009, even though direct third-party expenses increased $4.0 million. The reduction is primarily driven by approximately $16 million of cost efficiencies from outsourcing a portion of our development activities to India and operating efficiencies resulting from the integration and restructuring activities we initiated in 2008 after the acquisition of InfoSpace Mobile. These activities included the relocation of our corporate headquarters to Bellevue, Washington, the cost efficiencies from outsourcing a portion of our development activities and consolidation of our datacenters.
Direct third-party expenses
Direct third-party expenses increased $4.0 million, or 74.0%, for the year ended December 31, 2009 compared to the corresponding 2008 period. The increase is primarily due to the cost of third-party computer hardware and software purchased on behalf of a major customer as part of a large custom portal development and implementation project.
45
Datacenter and network operations, excluding depreciation
Datacenter and network operations expense, excluding depreciation, decreased $1.2 million, or 3.7%, for the year ended December 31, 2009 compared to the corresponding 2008 period. The decrease is primarily due to lower labor related costs, as we have consolidated datacenter operations since completing the InfoSpace Mobile acquisition in December 2007.
Product development and sustainment, excluding depreciation
Product development and sustainment expense, excluding depreciation, decreased $20.9 million, or 39.9%, for the year ended December 31, 2009 compared to the corresponding 2008 period. The decrease is primarily due to approximately $16 million of cost efficiencies from outsourcing a portion of our development activities to India. The remaining expense reduction was due primarily to lower labor-related costs as a result of operating efficiencies realized from the integration and restructuring activities we initiated in 2008.
Sales and marketing, excluding depreciation
Sales and marketing expense, excluding depreciation, increased $1.7 million, or 16.3%, for the year ended December 31, 2009 compared to the corresponding 2008 period. The increase is due to increases in our sales and marketing headcount as we grow the business.
General and administrative, excluding depreciation
General and administrative expense, excluding depreciation, decreased $5.2 million, or 20.0%, for the year ended December 31, 2009 compared to the corresponding 2008 period. The decrease is primarily due to lower labor-related costs as a result of operating efficiencies realized from the integration and restructuring activities we initiated in 2008.
Depreciation and amortization
Depreciation and amortization expense decreased $8.4 million, or 38.7%, for the year ended December 31, 2009 compared to the corresponding 2008 period. The decrease is primarily due to lower depreciation expense as a result of consolidating datacenters, impairing the remaining value of certain datacenter assets determined to be no longer recoverable and impairing certain capitalized software development costs and other amortized intangibles as noted in the long-lived asset impairment charges discussed below.
Restructuring
During the year ended December 31, 2009, we incurred $2.1 million of restructuring charges to close our office in the United Kingdom, move our remaining employees in Durham, North Carolina from our former headquarters facility to a smaller facility and assign the lease for our former headquarters facility to a third party.
During the year ended December 31, 2008, we incurred $3.2 million of restructuring charges related to relocating our headquarters and certain key personnel to Bellevue, Washington and eliminating redundant functions and positions as a result of the InfoSpace Mobile acquisition.
Goodwill and long-lived asset impairment charges
The $5.8 million of impairments in the 2009 period relate primarily to writing off the remaining asset balances of $1.9 million and $3.3 million associated with the assets acquired as part of a messaging business, including a customer list and capitalized software, respectively.
46
The $29.1 million of impairments in the 2008 period consisted of:
| • | $12.7 million related to restructuring of the business following the InfoSpace Mobile acquisition, including $8.2 million to impair computer software, furniture and fixtures and leasehold improvements associated with moving our headquarters to Bellevue, Washington and the planned shutdown of certain datacenter facilities, as well as $4.5 million for the planned shutdown of the Fuel software solution platform; |
| • | $6.8 million to impair the remaining goodwill associated with the acquisition of a messaging business; |
| • | $4.6 million related to software assets from the InfoSpace Mobile acquisition based on our pricing decision to bundle our search functionality with our portal solution; |
| • | $3.8 million related to software assets from the InfoSpace Mobile acquisition based on the likelihood that two significant customers would no longer be utilizing our storefront solution; and |
| • | $1.2 million to impair the remaining customer relationship intangible from our acquisition of M7 Networks, Inc. in 2005. |
Other income (expense), net
| (In thousands) |
Year ended December 31, |
$ change | ||||||||||
| 2009 | 2008 | |||||||||||
| Other income (expense) |
$ | (1,657 | ) | $ | 1,892 | $ | (3,549 | ) | ||||
| Interest and investment income, net |
250 | 1,315 | (1,065 | ) | ||||||||
| Interest expense |
(220 | ) | (493 | ) | 273 | |||||||
| Total other income (expense), net |
$ | (1,627 | ) | $ | 2,714 | $ | (4,341 | ) | ||||
Other expense of $1.7 million for the year ended December 31, 2009 consists primarily of $1.5 million in expense related to the increase in fair value of our warrants to purchase redeemable preferred shares. Other income of $1.9 million for the year ended December 31, 2008 is primarily the result of billings to InfoSpace, Inc. (during an agreed transition period) for use of shared facilities acquired as part of the InfoSpace Mobile acquisition at the end of 2007. The higher net interest and investment income in 2008 primarily reflects the higher average cash and investment balances during the 2008 period relative to 2009. Our interest expense decreased to $0.2 million for the year ended December 31, 2009 compared to $0.5 million for the year ended December 31, 2008, due to the repayment of our remaining outstanding debt in April 2009.
Provision for income taxes
| Year ended December 31, |
||||||||||||||||
| (Dollars in thousands) | 2009 | 2008 | $ change | % change | ||||||||||||
| Provision for income taxes |
$ | 1,896 | $ | 1,776 | $ | 120 | 6.8 | % | ||||||||
Income tax expense for years ended December 31, 2009 and 2008 primarily consists of a U.S. tax provision for the difference between book and tax treatment of goodwill associated with the acquisition of InfoSpace Mobile. We maintain a full valuation allowance against our net deferred tax assets which precludes us from recognizing a tax benefit for our current operating losses. Our lack of profitability historically is a key factor in concluding that there is insufficient evidence of our ability to realize any future benefits from our deferred tax assets.
47
Discontinued operations
| Year ended December 31, |
$ change | |||||||||||
| (In thousands) | 2009 | 2008 | ||||||||||
| Loss from discontinued operations |
$ | — | $ | (1,072 | ) | $ | 1,072 | |||||
| Loss from sale of discontinued operations |
$ | — | $ | (127 | ) | $ | 127 | |||||
The loss from discontinued operations in 2008 consists of losses from the remaining portion of the direct to consumer business line sold in 2008 and the media and entertainment business that was discontinued in 2008.
Net loss
| Year ended December 31, |
$ change | |||||||||||
| (In thousands) | 2009 | 2008 | ||||||||||
| Net loss |
$ | (16,301 | ) | $ | (78,027 | ) | $ | 61,726 | ||||
The major factors leading to the $61.7 million decrease in net loss to $16.3 million were:
| • | A $10.5 million increase in revenue resulting from increased professional services revenues, partially offset by reduced managed services revenue; |
| • | A $54.4 million reduction in total operating expenses due primarily to a $23.3 million reduction in impairment charges and approximately $16 million expense reduction associated with the outsourcing of certain development activities to India. The remaining reduction was due to the late 2008 completion of many major elements of the plan to integrate the InfoSpace Mobile acquisition. This plan included elimination of most redundant functions and staffing, the relocation of our headquarters to Bellevue, Washington, and consolidation of certain datacenters; and |
| • | A $1.2 million reduction in losses from discontinued operations and related losses upon disposition. |
These improvements in operating results were partially offset by a $4.3 million reduction in other income (expense), net due primarily to the absence of fees in 2009 that were charged to InfoSpace, Inc. in 2008 (during an agreed transition period) for InfoSpace’s use of certain facilities that we acquired in the InfoSpace Mobile acquisition at the end of 2007.
48
Quarterly Financial Data
The following table sets forth our unaudited quarterly consolidated statements of operations and other data for the years ended December 31, 2010 and December 31, 2009. We have prepared the unaudited quarterly operational data on the same basis as the audited consolidated financial statements included in this annual report on Form 10-K, and have included, in our opinion, all adjustments, consisting only of normal recurring adjustments, that we consider necessary for a fair presentation of this financial information. Quarterly results are not necessarily indicative of the operating results to be expected for the full fiscal year. You should read this data together with our consolidated financial statements and the related notes included elsewhere in this annual report on Form 10-K.
| For the three months ended, | ||||||||||||||||
| (In thousands, except per share data) | March 31, 2010 |
June 30, 2010 |
September 30, 2010 |
December 31, 2010 |
||||||||||||
| Revenue |
||||||||||||||||
| Managed services |
$ | 20,881 | $ | 21,912 | $ | 24,201 | $ | 23,298 | ||||||||
| Professional services |
8,199 | 8,496 | 13,685 | 12,707 | ||||||||||||
| Total revenues |
29,080 | 30,408 | 37,886 | 36,005 | ||||||||||||
| Operating expenses |
||||||||||||||||
| Direct third-party expenses |
1,305 | 2,408 | 8,300 | 5,031 | ||||||||||||
| Datacenter and network operations, excluding depreciation |
8,034 | 7,595 | 7,496 | 7,624 | ||||||||||||
| Product development and sustainment, excluding depreciation |
8,182 | 6,182 | 5,825 | 5,766 | ||||||||||||
| Sales and marketing, excluding depreciation |
3,655 | 3,351 | 3,310 | 3,453 | ||||||||||||
| General and administrative, excluding depreciation |
5,264 | 22,809 | 5,986 | 6,975 | ||||||||||||
| Depreciation and amortization |
3,041 | 2,980 | 3,059 | 3,515 | ||||||||||||
| Restructuring |
407 | — | — | — | ||||||||||||
| Goodwill and long-lived asset impairment charges |
— | — | — | — | ||||||||||||
| Total operating expenses |
29,888 | 45,325 | 33,976 | 32,364 | ||||||||||||
| Operating income (loss) |
(808 | ) | (14,917 | ) | 3,910 | 3,641 | ||||||||||
| Other income (expense), net |
(258 | ) | 3,795 | 14 | (302 | ) | ||||||||||
| Income (Loss) from continuing operations, before income taxes |
(1,066 | ) | (11,122 | ) | 3,924 | 3,339 | ||||||||||
| Provision for income taxes |
467 | 468 | 668 | 487 | ||||||||||||
| Net income (loss) |
(1,533 | ) | (11,590 | ) | 3,256 | 2,852 | ||||||||||
| Accretion of redeemable preferred stock and Series D1 preferred dividends |
(6,400 | ) | (5,843 | ) | (547 | ) | (503 | ) | ||||||||
| Net income (loss) attributable to common stockholders |
$ | (7,933 | ) | $ | (17,433 | ) | $ | 2,709 | $ | 2,349 | ||||||
| Basic and fully diluted net income (loss) per share attributable to common stockholders |
$ | (1.38 | ) | $ | (1.95 | ) | $ | 0.07 | $ | 0.06 | ||||||
| Weighted-average number of shares of common stock used in computing basic net loss per share attributable to common stockholders |
5,753 | 8,928 | 38,044 | 38,598 | ||||||||||||
| Weighted-average number of shares of common stock used in computing diluted net loss per share attributable to common stockholders |
— | — | 38,720 | 39,676 | ||||||||||||
| Other Data |
||||||||||||||||
| Percentage of managed services revenue that varies with number of users and transactions |
52 | % | 55 | % | 58 | % | 57 | % | ||||||||
49
| For the three months ended, | ||||||||||||||||
| (In thousands, except per share data) | March 31, 2009 |
June 30, 2009 |
September 30, 2009 |
December 31, 2009 |
||||||||||||
| Revenue |
||||||||||||||||
| Managed services |
$ | 20,222 | $ | 20,314 | $ | 20,417 | $ | 20,450 | ||||||||
| Professional services |
3,054 | 16,694 | 7,672 | 4,872 | ||||||||||||
| Total revenues |
23,276 | 37,008 | 28,089 | 25,322 | ||||||||||||
| Operating expenses |
||||||||||||||||
| Direct third-party expenses |
1,171 | 5,366 | 1,611 | 1,337 | ||||||||||||
| Datacenter and network operations, excluding depreciation |
8,683 | 7,786 | 7,185 | 8,132 | ||||||||||||
| Product development and sustainment, excluding depreciation |
7,677 | 9,739 | 6,672 | 7,301 | ||||||||||||
| Sales and marketing, excluding depreciation |
2,989 | 2,763 | 2,708 | 3,440 | ||||||||||||
| General and administrative, excluding depreciation |
5,175 | 4,495 | 5,270 | 5,901 | ||||||||||||
| Depreciation and amortization |
3,777 | 3,205 | 3,248 | 2,978 | ||||||||||||
| Restructuring |
235 | 712 | 1,010 | 101 | ||||||||||||
| Goodwill and long-lived asset impairment charges |
— | 5,488 | 318 | — | ||||||||||||
| Total operating expenses |
29,707 | 39,554 | 28,022 | 29,190 | ||||||||||||
| Operating income (loss) |
(6,431 | ) | (2,546 | ) | 67 | (3,868 | ) | |||||||||
| Other income (expense), net |
(96 | ) | (198 | ) | (1,342 | ) | 9 | |||||||||
| Loss from continuing operations, before income taxes |
(6,527 | ) | (2,744 | ) | (1,275 | ) | (3,859 | ) | ||||||||
| Provision for income taxes |
444 | 444 | 517 | 491 | ||||||||||||
| Net loss |
(6,971 | ) | (3,188 | ) | (1,792 | ) | (4,350 | ) | ||||||||
| Accretion of redeemable preferred stock and Series D1 preferred dividends |
(5,987 | ) | (5,987 | ) | (5,992 | ) | (5,990 | ) | ||||||||
| Net loss attributable to common stockholders |
$ | (12,958 | ) | $ | (9,175 | ) | $ | (7,784 | ) | $ | (10,340 | ) | ||||
| Basic and fully diluted net loss per share attributable to common stockholders |
$ | (2.20 | ) | $ | (1.55 | ) | $ | (1.31 | ) | $ | (1.79 | ) | ||||
| Weighted-average number of shares of common stock used in computing basic and diluted net loss per share attributable to common stockholders |
5,887 | 5,930 | 5,931 | 5,767 | ||||||||||||
| Other Data |
||||||||||||||||
| Percentage of managed services revenue that varies with number of users and transactions |
76 | % | 74 | % | 70 | % | 57 | % | ||||||||
Our operating results may fluctuate due to a variety of factors, many of which are outside of our control. As a result, comparing our operating results on a period-to-period basis may not be meaningful. You should not rely on our past results as an indication of our future performance.
Non-GAAP Financial Measures
We monitor our performance as a business using adjusted EBITDA, a non-GAAP financial measure. We define Adjusted EBITDA as net income (loss) before interest expense, provision for income taxes, depreciation and amortization, stock-based compensation expense, restructuring expenses and asset impairments, interest income and other income (expense), net. We define Adjusted Net Income as net loss before amortization of purchased intangibles, stock-based compensation expense, restructuring expenses, asset impairments and abandoned transaction charges, non-cash tax expense and the impact from changes in the fair value of warrants. Adjusted EBITDA and Adjusted Net Income are not measures of liquidity calculated in accordance with U.S. GAAP, and
50
should be viewed as a supplement to, not a substitute for, our results of operations presented on the basis of U.S. GAAP. Adjusted EBITDA and Adjusted Net Income do not purport to represent cash flow provided by, or used in, operating activities as defined by U. S. GAAP. Our statement of cash flows presents our cash flow activity in accordance with U.S. GAAP. Furthermore, Adjusted EBITDA and Adjusted Net Income are not necessarily comparable to similarly-titled measures reported by other companies.
A reconciliation of Adjusted EBITDA to net income (loss) from continuing operations for each of the quarterly periods is as follows:
| For the three months ended, | ||||||||||||||||||||||||||||||||
| (In thousands) | March 31, 2009 |
June 30, 2009 |
September 30, 2009 |
December 31, 2009 |
March 31, 2010 |
June 30, 2010 |
September 30, 2010 |
December 31, 2010 |
||||||||||||||||||||||||
| Net income (loss) |
$ | (6,971 | ) | $ | (3,188 | ) | $ | (1,792 | ) | $ | (4,350 | ) | $ | (1,533 | ) | $ | (11,590 | ) | $ | 3,256 | $ | 2,852 | ||||||||||
| Interest and other income (expense), net |
96 | 198 | 1,342 | (9 | ) | 258 | (3,795 | ) | (14 | ) | 302 | |||||||||||||||||||||
| Provision for income taxes |
444 | 444 | 517 | 491 | 467 | 468 | 668 | 487 | ||||||||||||||||||||||||
| Depreciation and amortization |
3,777 | 3,205 | 3,248 | 2,978 | 3,041 | 2,980 | 3,059 | 3,515 | ||||||||||||||||||||||||
| Restructuring and asset impairments |
235 | 6,200 | 1,328 | 101 | 407 | — | — | — | ||||||||||||||||||||||||
| Stock-based compensation |
532 | 556 | 580 | 511 | 505 | 18,192 | 1,995 | 2,284 | ||||||||||||||||||||||||
| Adjusted EBITDA |
$ | (1,887 | ) | $ | 7,415 | $ | 5,223 | $ | (278 | ) | $ | 3,145 | $ | 6,255 | $ | 8,964 | $ | 9,440 | ||||||||||||||
A reconciliation of Adjusted Net Income to net income (loss) from continuing operations, the most directly comparable GAAP measure, for each of the fiscal periods indicated is as follows:
| For the three months ended, | ||||||||||||||||||||||||||||||||
| (In thousands) | March 31, 2009 |
June 30, 2009 |
September 30, 2009 |
December 31, 2009 |
March 31, 2010 |
June 30, 2010 |
September 30, 2010 |
December 31, 2010 |
||||||||||||||||||||||||
| Net income (loss) |
$ | (6,971 | ) | $ | (3,188 | ) | $ | (1,792 | ) | $ | (4,350 | ) | $ | (1,533 | ) | $ | (11,590 | ) | $ | 3,256 | $ | 2,852 | ||||||||||
| Amortization of purchased intangibles |
330 | 330 | 330 | 330 | 396 | 396 | 396 | 396 | ||||||||||||||||||||||||
| Restructuring and asset impairments |
235 | 6,200 | 1,328 | 101 | 407 | — | — | — | ||||||||||||||||||||||||
| Stock-based compensation |
532 | 556 | 580 | 511 | 505 | 18,192 | 1,995 | 2,284 | ||||||||||||||||||||||||
| Non-cash tax expense |
444 | 444 | 517 | 491 | 467 | 468 | 468 | 162 | ||||||||||||||||||||||||
| Fair value adjustment of warrants in other income |
46 | 213 | 1,296 | 32 | 260 | (3,810 | ) | — | — | |||||||||||||||||||||||
| Adjusted Net Income (Loss) |
$ | (5,384 | ) | $ | 4,555 | $ | 2,259 | $ | (2,885 | ) | $ | 502 | $ | 3,656 | $ | 6,115 | $ | 5,694 | ||||||||||||||
51
We believe Adjusted EBITDA and Adjusted Net Income are used by and are useful to investors and other users of our financial statements in evaluating our operating performance because it provides them with an additional tool to compare business performance across companies and across periods. We believe that:
| • | EBITDA is widely used by investors to measure a company’s operating performance without regard to items such as interest expense, taxes, depreciation and amortization, which can vary substantially from company to company depending upon accounting methods and book value of assets, capital structure and the method by which assets were acquired; and |
| • | investors commonly use Adjusted EBITDA and Adjusted Net Income to eliminate the effect of restructuring and stock-based compensation expenses, which vary widely from company to company and impair comparability. |
We use Adjusted EBITDA and Adjusted Net Income:
| • | as measures of operating performance to assist in comparing performance from period to period on a consistent basis; |
| • | as measures for planning and forecasting overall expectations and for evaluating actual results against such expectations; |
| • | as primary measures to review and assess the operating performance of our company and management team in connection with our executive compensation plan incentive payments; and |
| • | in communications with the board of directors, stockholders, analysts and investors concerning our financial performance. |
Liquidity and capital resources
General
Our principal needs for liquidity have been to fund operating losses, working capital requirements, capital expenditures, acquisitions and for debt service. Our principal sources of liquidity as of December 31, 2010 consisted of cash of $78.5 million and $12.5 million of availability under our $25.0 million revolving credit facility. We expect that working capital requirements, capital expenditures and acquisitions will continue to be our principal needs for liquidity over the near term. Working capital requirements are expected to increase as a result of our anticipated growth, both organically and through future acquisitions. The main portion of our capital expenditures has been, and is expected to continue to be, for datacenter facilities and equipment and software development. We believe that our cash flow from operations, available cash and cash equivalents and available borrowings under our revolving credit facility will be sufficient to meet our liquidity needs for at least the next 12 months, although such sources of liquidity may not be sufficient to fund any significant acquisitions we might want to pursue.
On January 31, 2011, we entered into an Arrangement Agreement with Adenyo and the other parties signatory thereto. Adenyo is a mobile marketing, advertising and analytics solutions provider with operations in the United States, Canada and France. Pursuant to the Arrangement Agreement, one of our wholly-owned subsidiaries will acquire all the outstanding common shares of Adenyo for an aggregate purchase price of approximately $100 million (plus a contingent “earn-out” payment of up to $50 million), subject to working capital and other customary adjustments, and Adenyo will become a wholly-owned subsidiary. We will pay no less than $50 million of the initial $100 million purchase price with cash consideration, and the remaining consideration will be payable in our discretion in cash, shares of Company common stock, or a mix of cash and shares. We expect to complete the acquisition of Adenyo in April 2011.
Our existing revolving credit facility matures on April 13, 2011. We will pursue a new, expanded bank borrowing facility, explore additional debt or equity financing options or pursue a combination of some or all of these alternatives prior to the expiration of the current credit facility. Growth through acquisitions is part of our overall strategy and we regularly review potential acquisition candidates, and as appropriate from time to time,
52
engage in discussions with these businesses. If one or more significant strategic acquisitions are consummated, we may incur additional debt or sell additional equity to finance such transactions.
Cash flows
As of December 31, 2010 and December 31, 2009, we had cash and cash equivalents of $78.5 million and $35.9 million, respectively.
Operating activities
In fiscal 2010, operating activities provided in $7.1 million of cash despite a net loss of $7.0 million, primarily due to significant non-cash items included in the net loss. Such non-cash items included $23.0 million of stock-based compensation expense, primarily the result of the $17.5 million of expense resulting from the immediate vesting of restricted stock associated with our IPO, and $12.6 million of depreciation and amortization. Changes in our operating assets and liabilities used $20.2 million of cash, primarily resulting from the timing of our project billings for the two large implementation projects, which are the major contributors to the $12.4 million increase in accounts receivable, and to the $10.9 million decrease in deferred revenue.
In fiscal 2009, operating activities provided $33.1 million of cash despite a net loss of $16.3 million, primarily as a result of cash from working capital sources and due to the inclusion of non-cash items in our operating results. Working capital sources of cash were primarily related to a $20.7 million decrease in accounts receivable resulting from strong collection efforts and the timing of collections surrounding our professional service projects and a $2.5 million increase in deferred revenue attributable primarily to increased billing for our professional services. Our accounts receivable terms are typically 30 to 45 days, and, for certain types of customers, can be up to 60 days. The major non-cash items included in our operating results were depreciation and amortization amounts of $13.2 million and goodwill and long-lived asset impairment charges of $5.8 million.
In fiscal 2008, operating activities used $28.7 million in cash as a result of a net loss of $78.0 million, less non-cash items including depreciation and amortization of $21.6 million and goodwill and long-lived asset impairment charges of $29.1 million. Working capital sources of cash were primarily related to a $2.0 million decrease in accounts receivable and an increase of $7.1 million in deferred revenue, attributable to increased professional services billings. These sources of cash were offset primarily by a $16.8 million decrease in accounts payable due primarily to payments of liabilities assumed as part of the InfoSpace Mobile acquisition in December 2007.
Investing activities
Investing activities have involved primarily purchases of capital expenditures and businesses. Our capital expenditures are typically for routine purchases of computer equipment to maintain and upgrade our technology infrastructure and for development of software to provide services to our customers. In 2010, 2009 and 2008, our cash capital expenditures totaled $17.4 million, $4.9 million and $8.4 million, respectively.
For the year ended December 31, 2008, we had acquisition costs of $1.1 million (incurred for the acquisition of InfoSpace Mobile). We incurred no acquisition costs during 2009 or 2010.
We anticipate future capital expenditures for maintenance, support and enhancements of existing technology and continued investments in new technologies. Our software development investments consist primarily of development, testing and deployment of new applications and new functionality to existing applications. We expect our capital expenditures in 2011 to be approximately $26-28 million due to similar-sized increases in data center related expenditures and capitalized software development activity. Although we have financed some of these purchases in the past, we anticipate funding future capital expenditures with cash flows from operations. Additionally, during 2010, we realized $1.2 million of cash associated with the sale of assets held for sale.
53
Financing activities
Until recently, financing activities provided us with funding for all of our liquidity needs, including operating losses, capital expenditures and acquisitions. Due to recent improvements in the operating performance of our business and the absence of any additional acquisitions, we repaid our outstanding debt in April 2009 and have not needed to borrow additional amounts under our credit facility or obtain other financing to fund operations and capital expenditures. However, we have used the revolving credit facility in the past to fund a portion of our operating needs and may need to do so again in the future. During June 2010, we completed our initial public offering resulting in net proceeds of $49.0 million. Our cash flows from operations fluctuate from period to period due to various factors, both known and unforeseen. These factors may include changes in working capital from inconsistent timing of cash receipts and payments for items such as accounts payable, incentive compensation, changes in deferred revenue, interest payments and other various items. In addition, significant acquisitions and organic growth impact net cash flows from operations due to growth in revenue and associated working capital requirements.
Credit facility
We are party to a credit facility with Silicon Valley Bank pursuant to which we can borrow up to $25 million in secured loans. The availability under the credit facility is subject to a borrowing base calculated based on qualifying accounts receivable. The interest rate on any borrowings is based on the lender’s prime rate plus a margin ranging between 50 to 150 basis points depending on our trailing EBITDA. The minimum interest rate is 5.50%. The credit facility restricts, among other things, our ability to incur indebtedness, create or permit liens on our assets, declare or pay dividends and certain other restricted payments, consolidate, merge or recapitalize, acquire or sell assets, make certain investments, loans or other advances, and enter into transactions with affiliates. The credit facility requires us to maintain a “tangible net worth” of $14 million, which we were in compliance with as of December 31, 2010. The credit facility terminates in April 2011. As of December 31, 2010 and December 31, 2009, there were no outstanding amounts under the credit facility. As of December 31, 2010, we had borrowing capability of approximately $12.5 million.
Contractual obligations and other commitments
There have been no material changes outside of the normal course of business to our contractual obligations and other commitments since December 31, 2010. As of December 31, 2010, our contractual obligations and other commitments were as follows:
| Payments due by period | ||||||||||||||||||||
| (In thousands) | Total | Less than 1 year |
1-3 years |
3-5 years | More than 5 years |
|||||||||||||||
| Operating lease obligations(1) |
$ | 11,098 | $ | 4,171 | $ | 6,211 | $ | 716 | $ | — | ||||||||||
| Commitments to network service providers(2) |
2,285 | 2,285 | — | — | — | |||||||||||||||
| Additional contractual commitments(3) |
131 | 67 | 64 | — | — | |||||||||||||||
| Total |
$ | 13,514 | $ | 6,523 | $ | 6,275 | $ | 716 | $ | — | ||||||||||
| (1) | Includes operating lease commitments for facilities and equipment that we have entered into with third parties. |
| (2) | We have entered into several agreements with third-party network service providers, who provide additional operational support for our various datacenters. |
| (3) | We have entered into a professional services agreement which expires in October 2013. |
Off-balance sheet arrangements
As of December 31, 2010, we do not have any off-balance sheet arrangements that have or are reasonably likely to have a current or future effect on our financial condition, changes in financial condition, revenues or expenses, results of operations, liquidity, capital resources that are material to investors. In addition to the typical business practice of indemnifying officers and directors we also indemnify customers under our contract terms from any copyright and patent infringement claims that may arise from use of our software technology.
54
Critical accounting policies and estimates
Our consolidated financial statements are prepared in accordance with accounting principles generally accepted in the U.S. The preparation of our financial statements and related disclosures requires us to make estimates, assumptions and judgments that affect the reported amount of assets, liabilities, revenue, costs and expenses, and related disclosures. We base our estimates and assumptions on historical experience and other factors that we believe to be reasonable under the circumstances. We evaluate our estimates and assumptions on an ongoing basis. Our actual results may differ from these estimates under different assumptions and conditions.
The following critical accounting policies are those accounting policies that, in our view, are most important in the portrayal of our financial condition and results of operations. Our critical accounting policies and estimates include those involved in recognition of revenue, business combinations, software development costs, valuation of goodwill, valuation of long-lived and intangible assets, provision for income taxes, accounting for stock-based compensation and discontinued operations. Note 2 to our financial statements included elsewhere in this annual report on Form 10-K provides additional information about these critical accounting policies, as well as our other significant accounting policies.
Revenue recognition
We derive our revenues from contracts which include individual or varying combinations of our managed services and often include professional service fees to customize and implement the specific software platform solutions required by the customer. We recognize revenue when all of the following conditions are satisfied: (i) there is persuasive evidence of an arrangement; (ii) delivery has occurred; (iii) the fee is fixed or determinable; and (iv) collectability of the fee is reasonably assured. Certain of our arrangements include customer acceptance clauses or penalties for late delivery which we assess to determine whether revenue can be recognized ahead of the acceptance or delivery. The timing of revenue recognition in each case depends upon a variety of factors, including the specific terms of each arrangement and the nature of our deliverables and obligations.
Our customer contracts may consist of professional service fees, a fixed monthly managed service fee to host the software platform solution, and variable monthly fees based on one of three measures: the number of wireless subscribers using our software solutions each month; the aggregate dollar volume or number of transactions processed; or specified rates for individual transactions processed. Certain arrangements, including all of our new international carrier contracts, are based on a percentage of revenue generated by carrier mobile data services. Certain arrangements also include minimum monthly fee provisions, monthly fees for providing additional managed services required by the customer and/or service level requirements related to the hosted solutions which often entail financial penalties for non-compliance. Professional service fees typically include both the initial fees to customize and implement the specific software solution and fees to enhance the functionality of the software solution, which may occur anytime during the contractual term of the arrangement.
Under contractual arrangements where the customer does not have the right to take possession of the software, we determine the pattern of revenue recognition of the combined deliverables as a single unit of accounting. The professional service fees associated with the arrangement are not considered to be a separate earnings process because the services do not have stand-alone value to the customer. Such customers do not have the ability to benefit, resell or realize value from such services without the associated hosting services. Consequently, the professional services revenue is deferred and recognized monthly on a ratable basis together with the hosting services over the longer of the contractual term of the arrangement or the estimated period the customer is expected to benefit from the software solution or enhancement representing the period over which the hosting services are expected to be utilized. In determining the expected benefit period, we assess factors such as historical data trends, data used to establish pricing in the arrangement, discussions with customers in negotiating the arrangement and the period over which the customer could be expected to recover and earn a reasonable return on the professional service fee. At December 31, 2010 and December 31, 2009 our balance sheets
55
reflected deferred revenue of $0.9 million and $11.8 million, respectively, which consists primarily of such professional service fees. We consider the variable activity- or revenue-based fees to be contingent fees and recognize revenue monthly as the contingency is resolved, the fees are earned and the amount of the fee can be reliably measured. For purposes of classifying the arrangement consideration as managed services or professional services revenue on our statement of operations, we allocate the arrangement consideration based on the contractually stated amounts for each component. The pricing of our professional services is based on the expected level of effort necessary to complete a software solution. We believe this best approximates the fair value of the professional service fees if they were a separate unit of accounting.
Under certain arrangements, the customer has the right to take possession of the software, and it is feasible for the customer to either self-host the software on its own hardware or contract with another entity for the hosting service without significant penalty. Such multiple element arrangements are analyzed under software revenue guidance to assess the elements for separation and recognition. The fixed monthly hosting fee to host the software solution is not considered essential to the functionality of other elements, is described in the contract such that the total price of the arrangement would be expected to vary as the result of the inclusion or exclusion of the services and we have established vendor-specific objective evidence of fair value through substantive renewal rates included in the contract. Accordingly, we account for the hosting fee element of the arrangement separately and recognize the hosting fee as managed services revenue on a monthly basis as earned. The variable monthly fee is considered a contingent fee and is recognized as managed services revenue monthly when the contingency is resolved and the related fee is earned. We then use the residual method to allocate the arrangement consideration to the professional services element for revenue recognition purposes. We recognize the professional service revenues using the cost-to-cost percentage of completion method of accounting. We recognize the revenue based on the ratio of costs incurred to the estimated total costs at completion. Revenue recognized in excess of billings is recorded within accounts receivable. Billings in excess of revenue recognized are recorded within deferred revenue. Should the customer elect to self-host the software, the hosting fee would be eliminated and the variable fee would become the licensing fee. No customer has elected to self-host as of December 31, 2010. If a contract which previously did not have a right to self-host without significant penalty is amended to include such a right, we reassess the contract under the above software revenue recognition guidance.
Under contractual arrangements where our software is licensed to the customer and requires significant production, modification or customization of the software, the entire arrangement is accounted for under software revenue accounting in conformity with contract accounting. Under contract accounting, when no elements under the arrangement qualify to be separated, we recognize revenue for the entire arrangement using the cost-to-cost percentage of completion method of accounting. Progress towards completion is typically measured based on costs incurred as a proportion of estimated total costs. Profit in a given period is reported at the expected profit margin to be achieved on the overall contract. This method can result in the recognition of unbilled receivables or the deferral of costs or revenue on these contracts. Management regularly reviews project profitability and underlying estimates. Revisions to the estimates at completion are reflected in results of operations as a change in accounting estimate in the period in which the facts that give rise to the revision become known by management. Provisions for estimated losses, if any, are recognized in the period in which the loss becomes evident.
We provide premium messaging services to subscribers of wireless carriers on behalf of third-party vendors and earn a fixed percentage of the related revenue. We bill the carriers for transactions conducted by their subscribers and provide settlement services for the third-party vendors based on payments received from the carriers. We determined it is appropriate to record our net share of the billings to carriers as service revenue rather than the gross billing amount. The primary considerations for this determination are:
| • | the third-party vendor sells its content or service directly to the wireless carriers’ subscribers and is considered the primary obligor; |
| • | the carriers have a contractual relationship with their subscribers and are directly responsible for billing and collecting premium messaging fees from their subscribers and resolving billing disputes; |
| • | the carriers establish gross pricing for the transactions; |
56
| • | the wireless carriers generally pay us a fixed percentage of premium messaging revenues actually collected from their subscribers; and |
| • | we have limited risks, including no inventory risk and limited credit risk, because the carriers generally bear the risk of collecting fees from their subscribers and we are obligated to remit to the third-party vendor only their share of the funds we actually receive from the carrier. |
Business combinations
We have completed eight business combinations since 2003. The purchase price of an acquisition is allocated to the tangible and intangible assets acquired and liabilities assumed based on their estimated fair values as of the acquisition date, with any amount in excess of such allocations designated as goodwill. We make significant judgments and assumptions in determining the fair value of acquired assets and assumed liabilities, especially with respect to acquired intangibles. Using different assumptions in determining fair value could materially impact the purchase price allocation and our financial position and results of operations.
Several methods are commonly used to determine fair value. For intangible assets, we typically use the “income method.” This method starts with our forecast of all expected future net cash flows. These cash flows are then adjusted to present value by applying an appropriate discount rate that reflects the risk factors associated with the cash flow streams. Some of the more significant estimates and assumptions inherent in the income method and other methods include:
| • | the amount and timing of projected future cash flows; |
| • | the discount rate selected to measure the risks inherent in the future cash flows; |
| • | the acquired company’s competitive position; and |
| • | the assessment of the asset’s life cycle and the competitive trends impacting the asset, including consideration of any technical, legal, regulatory, or economic barriers to entry. |
Software development costs
Prior to 2010, we capitalized certain software development costs, which included the costs to develop new software products or significant enhancements to existing software products, which are developed or obtained for internal use. We capitalized software development costs when application development began, it was probable that the project would be completed and the software would be used as intended. Such capitalized costs were amortized on a straight-line basis over the estimated useful life of the related asset, which was generally three years. Costs associated with preliminary project stage activities, training, maintenance and all post implementation stage activities were expensed as incurred.
Software development costs related to software products to be sold, leased or otherwise marketed as a component of the solutions we provide to our customers are capitalized when technological feasibility has been established. In 2010, we have focused on developing software products that can be leveraged across various customers. As such, we have capitalized costs, including direct labor and related overhead included in intangible assets, net. Amortization of capitalized software development costs will begin as each product is available for general release to customers and will be recorded within depreciation and amortization. Amortization will be computed on an individual product basis for those products available for market and will be recognized based on the product’s estimated economic life. Unamortized capitalized software development costs determined to be in excess of net realizable value of the product are expensed immediately.
57
Valuation of goodwill
Our business acquisitions typically result in the recording of goodwill, and we periodically assess whether the recorded value of goodwill has become impaired. We test for potential impairment annually, in the fourth quarter of each year, and whenever events or changes in circumstances indicate that the carrying amount of goodwill may not be recoverable. Testing for impairment of goodwill involves estimating the fair value of the associated reporting unit and comparing it to its carrying value. If the estimated fair value is lower than the carrying value, then a more detailed assessment is performed comparing the fair value of the reporting unit to the fair value of the assets and liabilities plus the goodwill carrying value of the reporting unit. If the fair value of the reporting unit is less than the fair value of its assets and liabilities plus goodwill, then an impairment charge is recognized to reduce the carrying value of goodwill by the difference.
The process of evaluating the potential impairment of goodwill is highly subjective and requires significant judgment. We use valuation techniques consistent with the market approach and income approach to measure fair value for purposes of impairment testing. An estimate of fair value can be affected by many assumptions, requiring that management make significant judgments in arriving at these estimates, including the expected operational performance of our businesses in the future, market conditions and other factors. Although there are inherent uncertainties in this assessment process, the estimates and assumptions we use to estimate future cash flows—including sales volumes, pricing, market penetration, competition, technological obsolescence and discount rates—are consistent with our internal planning. Significant changes in these estimates or their related assumptions in the future could result in an impairment charge related to our goodwill.
The $74.7 million of recorded goodwill at December 31, 2010 and December 31, 2009 relates entirely to our acquisition of InfoSpace Mobile. Our impairment test in the fourth quarter of 2010 and 2009 indicated we had significant excess of fair value over the net book value of our Company.
In the third quarter of 2008, it became apparent that revenue from the acquired messaging business would not achieve expectations, which resulted in a goodwill impairment charge of $6.8 million.
Valuation of long-lived and intangible assets
We periodically evaluate events or changes in circumstances that indicate the carrying amount of our long-lived and intangible assets may not be recoverable or that the useful lives of the assets may no longer be appropriate. Factors which could trigger an impairment review or a change in the remaining useful life of our long-lived and intangible assets include significant underperformance relative to historical or projected future operating results, significant changes in our use of the assets or in our business strategy, loss of or changes in customer relationships and significant negative industry or economic trends. When indications of impairment arise for a particular asset or group of assets, we assess the future recoverability of the carrying value of the asset (or asset group) based on an undiscounted cash flow analysis. If carrying value exceeds projected, net, undiscounted cash flows, an additional analysis is performed to determine the fair value of the asset (or asset group), typically a discounted cash flow analysis, based on an income and/or cost approach, and an impairment charge is recorded for the excess of carrying value over fair value.
The process of assessing potential impairment of our long-lived and intangible assets is highly subjective and requires significant judgment. An estimate of future undiscounted cash flow can be affected by many assumptions, requiring that management make significant judgments in arriving at these estimates. Although there are inherent uncertainties in this assessment process, the estimates and assumptions we use to estimate future cash flows including sales volumes, pricing, market penetration, competition and technological obsolescence are consistent with our internal planning. Significant future changes in these estimates or their related assumptions could result in an impairment charge related to individual or groups of these assets.
Our intangible assets, other than goodwill, of $17.7 million at December 31, 2010 and $10.7 million at December 31, 2009, relate primarily to customer relationships associated with our acquisition of InfoSpace
58
Mobile and capitalized costs related to the development of certain software products. We are amortizing the recorded value of the customer relationships over an estimated useful life of approximately eight years utilizing a variable methodology, and capitalized software development costs are amortized on a straight line basis over three years.
During 2009, we recognized impairment charges of $5.8 million related primarily to the long-lived and intangible assets associated with an acquired messaging business. In June 2009, we received notification that our future revenue stream associated with a significant messaging customer obtained as part of this messaging business acquisition would likely be eliminated. We performed an impairment analysis, which resulted in impairment charges of $1.9 million and $3.3 million associated with the customer list and capitalized software, respectively.
During 2008, we recorded long-lived and intangible asset impairment charges of $22.3 million. These impairment charges included $8.4 million related to software assets acquired in the InfoSpace Mobile acquisition based on information received indicating it was likely that two significant customers would no longer be utilizing our search and storefront solutions. We also recognized impairments of $12.7 million related to restructuring of the business following the InfoSpace Mobile acquisition. The $12.7 million included $8.2 million to impair computer software, furniture and fixtures and leasehold improvements associated with moving our headquarters to Bellevue, Washington and the planned consolidation and shutdown of certain datacenter facilities. The other restructuring-related impairment of $4.5 million was associated with the planned early shutdown of and migration of customers from the Fuel software solution platform to the mCore platform. We had redundant software solution platforms as a result of the InfoSpace Mobile acquisition and, based on specific migration plans developed in cooperation with our customers during the third quarter, it was determined the Fuel platform would not generate sufficient revenues to recover the remaining carrying value of the software platform. As a result, we impaired the remaining software carrying value. The remaining $1.2 million impairment related to the remaining customer relationship intangible from our M7 Networks, Inc. acquisition in 2005, as we no longer had customers utilizing that technology.
Income taxes
We are subject to federal and various state income taxes in the U.S., and to a lesser extent, income-based taxes in various foreign jurisdictions, including, but not limited to, the Netherlands, the United Kingdom, Canada, Indonesia and Singapore. The Company or one of its subsidiaries files income tax returns in the U.S. federal jurisdiction, and various state and foreign jurisdictions. With few exceptions, due to either the generation of net operating losses or because our subsidiaries have a relatively short corporate life, all tax years for which the Company or one of its subsidiaries filed a tax return remain open. Deferred tax assets, related valuation allowances, current tax liabilities and deferred tax liabilities are determined separately by tax jurisdiction. In making these determinations, we calculate tax assets, related valuation allowances, current tax liabilities and deferred tax liabilities, and we assess temporary differences resulting from differing treatment of items for tax and accounting purposes. We recognize only tax positions that are “more likely than not” to be sustained based solely on their technical merits. Although we believe that our tax estimates are reasonable, the ultimate tax determination involves significant judgment that is subject to audit by tax authorities in the ordinary course of business.
At December 31, 2010, our gross deferred tax assets consisted primarily of domestic net operating losses and book to tax differences in fixed assets, as well as research and development credit carryforwards. As of December 31, 2010, we had U.S. federal and state net operating loss carryforwards of approximately $233 million and $42 million, respectively, which begin to expire at varying dates starting in 2019 for U.S. federal income tax purposes and in the current year for state income tax purposes. Because of our history of generating operating losses, we maintain full valuation allowances against these deferred tax assets and consequently do not recognize tax benefits for our current operating losses. If we determine it is more likely than not that all or a portion of the deferred tax assets will be realized, we will eliminate or reduce the corresponding
59
valuation allowances which would result in immediate recognition of an associated tax benefit. Going forward, we will reassess the need for any remaining valuation allowances or the necessity to recognize additional valuation allowances. In the event we do eliminate all or a portion of the valuation allowances in the future, we will begin recording income tax provisions based on our earnings and applicable statutory tax rates from that time forward.
As a result of the InfoSpace Mobile asset acquisition at the end of 2007, we record a U.S. tax provision each subsequent period for the difference between book and tax treatment of goodwill associated with the acquisition. The tax amortization of the goodwill results in a deferred tax liability which does not provide a source of income for purposes of evaluating the realizability of the deferred tax assets. This results in recognition of income tax each period through 2022 corresponding to the tax amortization period of the goodwill. This provision has no cash tax implications absent liquidation of our Company and would otherwise only be adjusted or reversed to the extent our book goodwill balance would be impaired in the future.
Stock-based compensation
We estimate the fair value of such awards, including stock options, using the Black-Scholes option-pricing model. Determining the fair value of share-based awards requires the use of subjective assumptions, including the expected term of the award and expected stock price volatility. The assumptions used in calculating the fair value of share-based awards granted since January 1, 2008, are set forth below:
| Year ended December 31, 2010 |
Year ended December 31, 2009 |
Year ended December 31, 2008 |
||||||||||
| Expected life of options granted |
5 years | 5 years | 5 years | |||||||||
| Expected volatility |
50 | % | 50% - 58 | % | 58 | % | ||||||
| Range of risk-free interest rates |
2.0% - 2.3 | % | 1.7% - 2.3 | % | 2.8% - 3.3 | % | ||||||
| Expected dividend yield |
0 | % | 0 | % | 0 | % | ||||||
The assumptions used in determining the fair value of share-based awards represent our best estimates, but these estimates involve inherent uncertainties. As a result, if factors change, and we use different assumptions, our share-based compensation could be materially different in the future. The risk-free interest rate used for each grant is based on a U.S. Treasury instrument with a term similar to the expected term of the share-based award. The expected term of options has been estimated utilizing the vesting period of the option, the contractual life of the option and our option exercise history. Because there was no public market for our common stock prior to our initial public offering, we lacked company-specific historical and implied volatility information. Therefore, in estimating our expected stock volatility, we have taken into account volatility information of publicly-traded peer companies, and we expect to continue to use this methodology until such time as we have adequate historical data regarding the volatility of our publicly-traded stock price. Also, we recognize compensation expense for only the portion of options that are expected to vest. Accordingly, we estimated future forfeitures of stock options based on our historical forfeiture rate, taking into account unusual events such as employee attrition due to the relocation of our headquarters to Bellevue, Washington. If our actual forfeiture rate varies from our historical rates and estimates, additional adjustments to compensation expense may be required in future periods.
Prior to our initial public offering, the fair value of our common stock, for the purpose of determining the grant prices of our common stock option grants, was ultimately approved by our board of directors after an extensive process involving the audit committee, management, and a third-party valuation firm. The board of directors initially delegated the valuation process to the audit committee. The audit committee worked with management, and starting in 2008, also began working with a third-party valuation firm to develop each valuation. The audit committee then presented the resulting valuation to the full board of directors, and recommended its approval. Our board of directors exercised judgment in determining the estimated fair value of our common stock on the date of grant based on various factors, including:
| • | the prices for our redeemable preferred stock sold to outside investors in arm’s-length transactions; |
60
| • | the rights, preferences and privileges of our redeemable preferred stock relative to those of our common stock; |
| • | our operating and financial performance; |
| • | the hiring of key personnel; |
| • | our stage of development and revenue growth; |
| • | the lack of an active public market for our common and preferred stock; |
| • | industry information such as market growth and volume; |
| • | the execution of strategic and customer agreements; |
| • | the risks inherent in the development and expansion of our service offerings; |
| • | the likelihood of achieving a liquidity event, such as an initial public offering or a sale of our company given prevailing market conditions and the nature of and history of our business; and |
| • | the acquisitions of companies that we have completed. |
We believe consideration of these factors by our board of directors was a reasonable approach to estimating the fair value of our common stock for those periods. Estimation of the fair value of our common stock requires complex and subjective judgments, however, and there is inherent uncertainty in our estimate of fair value.
Since the IPO, the exercise prices of our common stock option grants are based on the closing price of our common stock traded on the NASDAQ under the symbol MOTR. All our employee stock options that were granted since the IPO were granted at exercise prices equal to or greater than the fair value of common stock as of the grant date. As of December 31, 2010, there were 1,531,577 stock options outstanding, with an aggregate intrinsic value of $8.1 million that will vest over approximately 3.0 years. Of these, 445,834 stock options with an intrinsic value of $2.7 million were exercisable at December 31, 2010. See Note 9 to our consolidated financial statements included in Item 8 of this annual report on Form 10-K.
Discontinued operations
In connection with our business strategy reassessment initiated in 2007, we exited two lines of business in 2007 and 2008, the results of which are reflected in our operating results as discontinued operations. The discontinued lines of business were direct to consumer, which was sold in two transactions in 2007 and 2008, and media and entertainment, which was discontinued in 2008. We have reclassified all of the revenues and associated operating expenses which would no longer be incurred upon disposition of the business to discontinued operations for all periods presented. Any gains and losses from the sale of the businesses are also reported in discontinued operations.
Recent accounting pronouncements
In September 2009, the Financial Accounting Standards Board, or FASB, Emerging Issues Task Force issued authoritative guidance addressing revenue recognition arrangements with multiple deliverables. The guidance requires revenue to be allocated to multiple elements using relative fair value based on vendor specific objective evidence or best estimated selling price, depending on the nature of the transaction. The residual method also becomes prohibited under certain circumstances. The new guidance is effective for our fiscal year beginning on January 1, 2011 and is not expected to have a significant impact on our financial position, results of operations or cash flows.
In January 2010, the FASB issued updated guidance related to fair value measurements and disclosures, which requires a reporting entity to disclose separately the amounts of significant transfers in and out of Level 1 and Level 2 fair value measurements and to describe the reasons for the transfers. In addition, in the reconciliation for
61
fair value measurements using significant unobservable inputs, or Level 3, a reporting entity should disclose separately information about purchases, sales, issuances and settlements (that is, on a gross basis rather than one net number). The updated guidance also requires that an entity should provide fair value measurement disclosures for each class of assets and liabilities and disclosures about the valuation techniques and inputs used to measure fair value for both recurring and non recurring fair value measurements for Level 2 and Level 3 fair value measurements. The updated guidance is effective for interim or annual financial reporting periods beginning after December 15, 2009, except for the disclosures about purchases, sales, issuances and settlements in the roll forward activity in Level 3 fair value measurements, which are effective for fiscal years beginning after December 15, 2010 and for interim periods within those fiscal years. The adoption
of this statement in the first quarter of fiscal 2010 did not have a material impact on our consolidated financial statements, as the principal impact from this update relates to our fair value measurements disclosure.
| Item 7A. | Qualitative and Quantitative Disclosures About Market Risk. |
Interest rate risk
At December 31, 2010, we had cash and cash equivalents of $78.5 million. These amounts are held primarily in cash and money market funds. We do not enter into investments for trading or speculative purposes. Due to the short-term nature of these investments, we believe that we do not have any material exposure to changes in the fair value of our investment portfolio as a result of changes in interest rates.
We are exposed to interest rate risk to the extent we incur borrowings under our credit facility. Any borrowings under our revolving credit facility will bear interest at floating rates based on the lender’s prime rate plus a margin ranging between 50 to 150 basis points depending on our trailing EBITDA, with a minimum interest rate of 5.50%. For variable rate debt, interest rate changes generally do not affect the fair value of the debt instrument, but do impact future earnings and cash flows, assuming other factors are held constant. We currently do not have any outstanding borrowings under our credit facility, and therefore we do not believe that a 10% increase in interest rates would have a significant impact on our operating results, future earnings, or liquidity.
Foreign Currency Risk
The majority of our sales and expenses are denominated in U.S. dollars and as a result, we have not experienced significant foreign currency transaction gains and losses to date. While we have conducted some transactions in foreign currencies during the fiscal year ended December 31, 2010 and expect to continue to do so, we do not anticipate that foreign currency transaction gains or losses will be significant at our current level of operations. However, as we continue to expand our operations internationally, transaction gains or losses may become significant in the future. We have not engaged in foreign currency hedging to date. However, we may do so in the future.
Effects of inflation
Inflation generally affects us by increasing costs of labor, supplies and equipment. We do not believe that inflation has had any material effect on our business, financial condition or results of operations in the last three fiscal years. Although we do not expect that inflation or changing prices will materially affect our business in the foreseeable future, if our costs were to become subject to significant inflationary pressures, we might not be able to offset these higher costs fully through price increases. Our inability or failure to do so could harm our business, operating results and financial condition.
62
| Item 8. | Consolidated Financial Statements and Supplementary Information. |
INDEX TO CONSOLIDATED FINANCIAL STATEMENTS
Motricity, Inc.
| Page | ||||
| Audited Financial Statements |
||||
| 64 | ||||
| Consolidated Balance Sheets as of December 31, 2010 and 2009 |
65 | |||
| Consolidated Statements of Operations for the years ended December 31, 2010, 2009 and 2008 |
66 | |||
| 67 | ||||
| Consolidated Statements of Cash Flows for the years ended December 31, 2010, 2009 and 2008 |
68 | |||
| 69 | ||||
| Financial Statement Schedule: |
||||
| 94 | ||||
63
Report of Independent Registered Public Accounting Firm
To the Board of Directors and Stockholders of Motricity, Inc.
In our opinion, the accompanying consolidated balance sheets and the related consolidated statements of operations, of changes in stockholders’ equity (deficit) and of cash flows present fairly, in all material respects, the consolidated financial position of Motricity, Inc. and its subsidiaries at December 31, 2010 and 2009, and the results of their operations and their cash flows for each of the three years in the period ended December 31, 2010 in conformity with accounting principles generally accepted in the United States of America. In addition, in our opinion, the financial statement schedule appearing on page F-94 presents fairly, in all material respects, the information set forth therein when read in conjunction with the related consolidated financial statements. These financial statements and financial statement schedule are the responsibility of the Company’s management. Our responsibility is to express an opinion on these financial statements and financial statement schedule based on our audits. We conducted our audits of these statements in accordance with the standards of the Public Company Accounting Oversight Board (United States). Those standards require that we plan and perform the audit to obtain reasonable assurance about whether the financial statements are free of material misstatement. An audit includes examining, on a test basis, evidence supporting the amounts and disclosures in the financial statements, assessing the accounting principles used and significant estimates made by management, and evaluating the overall financial statement presentation. We believe that our audits provide a reasonable basis for our opinion.
/s/ PricewaterhouseCoopers LLP
Seattle, Washington
February 28, 2011
64
Motricity, Inc.
(in thousands, except share data)
| December 31, | ||||||||
| 2010 | 2009 | |||||||
| Assets |
||||||||
| Current assets |
||||||||
| Cash and cash equivalents |
$ | 78,519 | $ | 35,945 | ||||
| Restricted short-term investments |
335 | 1,375 | ||||||
| Accounts receivable, net of allowance for doubtful accounts of $446 and $272 at December 31, 2010 and 2009, respectively |
29,438 | 17,306 | ||||||
| Assets held for sale |
— | 1,606 | ||||||
| Prepaid expenses and other current assets |
6,698 | 3,542 | ||||||
| Total current assets |
114,990 | 59,774 | ||||||
| Property and equipment, net |
24,339 | 26,717 | ||||||
| Goodwill |
74,658 | 74,658 | ||||||
| Intangible assets, net |
17,693 | 10,692 | ||||||
| Other assets |
134 | 2,335 | ||||||
| Total assets |
$ | 231,814 | $ | 174,176 | ||||
| Liabilities, redeemable preferred stock and stockholders’ equity (deficit) |
||||||||
| Current liabilities |
||||||||
| Accounts payable |
$ | 15,657 | $ | 9,585 | ||||
| Accrued compensation |
13,666 | 9,282 | ||||||
| Accrued expenses |
1,165 | 2,648 | ||||||
| Deferred revenue, current portion |
746 | 7,771 | ||||||
| Other current liabilities |
981 | 2,185 | ||||||
| Total current liabilities |
32,215 | 31,471 | ||||||
| Deferred revenue, net of current portion |
131 | 4,013 | ||||||
| Redeemable preferred stock warrants |
— | 5,012 | ||||||
| Deferred tax liability |
5,328 | 3,760 | ||||||
| Other noncurrent liabilities |
714 | 1,345 | ||||||
| Total liabilities |
38,388 | 45,601 | ||||||
| Commitments and contingencies (Note 6) |
||||||||
| Redeemable preferred stock |
49,862 | 417,396 | ||||||
| Stockholders’ equity (deficit) |
||||||||
| Preferred stock, $0.001 par value; 342,407,731 total preferred and redeemable preferred shares authorized; 0 and 7,338,769 preferred shares issued and outstanding at December 31, 2010 and 2009, respectively |
— | 17,393 | ||||||
| Common stock, $0.001 par value; 625,000,000 shares authorized; 40,721,754 and 7,633,786 shares issued and outstanding at December 31, 2010 and 2009, respectively |
41 | 115 | ||||||
| Additional paid-in capital |
467,565 | — | ||||||
| Accumulated deficit |
(324,088 | ) | (306,443 | ) | ||||
| Accumulated other comprehensive income |
46 | 114 | ||||||
| Total stockholders’ equity (deficit) |
143,564 | (288,821 | ) | |||||
| Total liabilities, redeemable preferred stock and stockholders’ equity (deficit) |
$ | 231,814 | $ | 174,176 | ||||
The accompanying notes are an integral part of these consolidated financial statements.
65
Motricity, Inc.
Consolidated Statements of Operations
(in thousands, except share data and per share amounts)
| Year Ended December 31, | ||||||||||||
| 2010 | 2009 | 2008 | ||||||||||
| Revenue |
||||||||||||
| Managed services |
$ | 90,292 | $ | 81,403 | $ | 85,677 | ||||||
| Professional services |
43,087 | 32,292 | 17,474 | |||||||||
| Total revenues |
133,379 | 113,695 | 103,151 | |||||||||
| Operating expenses |
||||||||||||
| Direct third-party expenses |
17,044 | 9,485 | 5,451 | |||||||||
| Datacenter and network operations, excluding depreciation |
30,749 | 31,786 | 33,000 | |||||||||
| Product development and sustainment, excluding depreciation |
25,955 | 31,389 | 52,261 | |||||||||
| Sales and marketing, excluding depreciation |
13,769 | 11,900 | 10,228 | |||||||||
| General and administrative, excluding depreciation |
41,034 | 20,841 | 26,052 | |||||||||
| Depreciation and amortization |
12,595 | 13,208 | 21,559 | |||||||||
| Restructuring |
407 | 2,058 | 3,236 | |||||||||
| Goodwill and long-lived asset impairment charges |
— | 5,806 | 29,130 | |||||||||
| Total operating expenses |
141,553 | 126,473 | 180,917 | |||||||||
| Operating loss |
(8,174 | ) | (12,778 | ) | (77,766 | ) | ||||||
| Other income (expense), net |
||||||||||||
| Other income (expense) |
3,357 | (1,657 | ) | 1,892 | ||||||||
| Interest and investment income, net |
3 | 250 | 1,315 | |||||||||
| Interest expense |
(111 | ) | (220 | ) | (493 | ) | ||||||
| Other income (expense), net |
3,249 | (1,627 | ) | 2,714 | ||||||||
| Loss from continuing operations, before income tax |
(4,925 | ) | (14,405 | ) | (75,052 | ) | ||||||
| Provision for income taxes |
2,090 | 1,896 | 1,776 | |||||||||
| Loss from continuing operations |
(7,015 | ) | (16,301 | ) | (76,828 | ) | ||||||
| Loss from discontinued operations |
— | — | (1,072 | ) | ||||||||
| Loss from sale of discontinued operations |
— | — | (127 | ) | ||||||||
| Net loss |
(7,015 | ) | (16,301 | ) | (78,027 | ) | ||||||
| Accretion of redeemable preferred stock |
(12,093 | ) | (23,261 | ) | (21,729 | ) | ||||||
| Series H redeemable preferred stock dividends |
(868 | ) | — | — | ||||||||
| Series D1 preferred dividends |
(332 | ) | (695 | ) | (698 | ) | ||||||
| Net loss attributable to common stockholders |
$ | (20,308 | ) | $ | (40,257 | ) | $ | (100,454 | ) | |||
| Net loss per share attributable to common stockholders—basic and diluted |
||||||||||||
| Continuing operations |
$ | (0.88 | ) | $ | (6.85 | ) | $ | (16.99 | ) | |||
| Discontinued operations |
— | — | (0.20 | ) | ||||||||
| Total net loss per share attributable to common stockholders |
$ | (0.88 | ) | $ | (6.85 | ) | $ | (17.19 | ) | |||
| Weighted-average common shares outstanding—basic and diluted |
22,962,555 | 5,878,368 | 5,843,489 | |||||||||
| Depreciation and amortization by function |
||||||||||||
| Datacenter and network operations |
$ | 8,071 | $ | 8,890 | $ | 16,824 | ||||||
| Product development and sustainment |
2,114 | 1,962 | 2,237 | |||||||||
| Sales and marketing |
2,053 | 1,960 | 2,075 | |||||||||
| General and administrative |
357 | 396 | 423 | |||||||||
| Total depreciation and amortization |
$ | 12,595 | $ | 13,208 | $ | 21,559 | ||||||
The accompanying notes are an integral part of these consolidated financial statements.
66
Motricity, Inc.
Consolidated Statements of Changes in Stockholders’ Equity (Deficit)
(in thousands, except share data and per share amounts)
| Preferred Stock | Common Stock | Additional Paid-in Capital |
Accumulated Deficit |
Accumulated Other Comprehensive Income (Loss) |
Total | |||||||||||||||||||||||||||
| Shares | Amount | Shares | Amount | |||||||||||||||||||||||||||||
| Balance as of December 31, 2007 |
7,338,769 | 17,393 | 6,634,356 | 100 | 15,319 | (185,311 | ) | (11 | ) | (152,510 | ) | |||||||||||||||||||||
| Other comprehensive loss: |
||||||||||||||||||||||||||||||||
| Net loss |
— | — | — | — | — | (78,027 | ) | — | (78,027 | ) | ||||||||||||||||||||||
| Foreign currency translation adjustment |
— | — | — | — | — | — | 28 | 28 | ||||||||||||||||||||||||
| Other comprehensive loss |
(77,999 | ) | ||||||||||||||||||||||||||||||
| Restricted stock activity |
— | — | 177,833 | 2 | 2 | — | — | 4 | ||||||||||||||||||||||||
| Exercise of common stock options |
— | — | 102,832 | 2 | 21 | — | — | 23 | ||||||||||||||||||||||||
| Stock-based compensation expense |
— | — | — | — | 2,344 | — | — | 2,344 | ||||||||||||||||||||||||
| Accretion of redeemable preferred stock |
— | — | — | — | (17,686 | ) | (4,043 | ) | — | (21,729 | ) | |||||||||||||||||||||
| Balance as of December 31, 2008 |
7,338,769 | 17,393 | 6,915,021 | 104 | — | (267,381 | ) | 17 | (249,867 | ) | ||||||||||||||||||||||
| Other comprehensive loss: |
||||||||||||||||||||||||||||||||
| Net loss |
— | — | — | — | — | (16,301 | ) | — | (16,301 | ) | ||||||||||||||||||||||
| Foreign currency translation adjustment |
— | — | — | — | — | — | 97 | 97 | ||||||||||||||||||||||||
| Other comprehensive loss |
(16,204 | ) | ||||||||||||||||||||||||||||||
| Restricted stock activity |
— | — | 855,770 | 13 | (13 | ) | — | — | — | |||||||||||||||||||||||
| Exercise of common stock options |
— | — | 51,796 | 1 | 16 | — | — | 17 | ||||||||||||||||||||||||
| Repurchase of outstanding common stock |
— | — | (166,667 | ) | (3 | ) | (1,247 | ) | — | — | (1,250 | ) | ||||||||||||||||||||
| Settlement of shareholder note receivable |
— | — | (22,134 | ) | — | (435 | ) | — | — | (435 | ) | |||||||||||||||||||||
| Stock-based compensation expense |
— | — | — | — | 2,179 | — | — | 2,179 | ||||||||||||||||||||||||
| Accretion of redeemable preferred stock |
— | — | — | — | (500 | ) | (22,761 | ) | — | (23,261 | ) | |||||||||||||||||||||
| Balance as of December 31, 2009 |
7,338,769 | $ | 17,393 | 7,633,786 | $ | 115 | $ | — | $ | (306,443 | ) | $ | 114 | $ | (288,821 | ) | ||||||||||||||||
| Other comprehensive loss: |
||||||||||||||||||||||||||||||||
| Net loss |
— | — | — | — | — | (7,015 | ) | — | (7,015 | ) | ||||||||||||||||||||||
| Foreign currency translation adjustment |
— | — | — | — | — | — | (68 | ) | (68 | ) | ||||||||||||||||||||||
| Other comprehensive loss |
(7,083 | ) | ||||||||||||||||||||||||||||||
| Conversion of preferred stock to common stock |
(7,338,769 | ) | (17,393 | ) | 725 | 1 | 17,393 | — | — | 1 | ||||||||||||||||||||||
| Conversion of redeemable preferred stock to common stock |
— | — | 26,163,440 | 26 | 380,497 | — | — | 380,523 | ||||||||||||||||||||||||
| Sale of common stock, net of issuance costs of $7,318 |
— | — | 6,000,000 | 6 | 48,482 | — | — | 48,488 | ||||||||||||||||||||||||
| Conversion of redeemable preferred stock warrants to common stock warrants |
— | — | — | — | 1,463 | — | — | 1,463 | ||||||||||||||||||||||||
| Restricted stock activity |
— | — | (12,728 | ) | — | (2,730 | ) | — | — | (2,730 | ) | |||||||||||||||||||||
| Exercise of common stock options and warrants |
— | — | 936,531 | 2 | 1,706 | — | — | 1,708 | ||||||||||||||||||||||||
| Reverse stock split |
— | — | — | (109 | ) | 109 | — | — | — | |||||||||||||||||||||||
| Stock-based compensation expense |
— | — | — | — | 22,976 | — | — | 22,976 | ||||||||||||||||||||||||
| Accretion of redeemable preferred stock |
— | — | — | — | (1,463 | ) | (10,630 | ) | — | (12,093 | ) | |||||||||||||||||||||
| Series H redeemable preferred stock dividend |
— | — | — | — | (868 | ) | — | — | (868 | ) | ||||||||||||||||||||||
| Balance as of December 31, 2010 |
— | $ | — | 40,721,754 | $ | 41 | $ | 467,565 | $ | (324,088 | ) | $ | 46 | $ | 143,564 | |||||||||||||||||
The accompanying notes are an integral part of these consolidated financial statements.
67
Motricity, Inc.
Consolidated Statements of Cash Flows
(in thousands)
| Year Ended December 31, | ||||||||||||
| 2010 | 2009 | 2008 | ||||||||||
| Cash flows from operating activities |
||||||||||||
| Net loss |
$ | (7,015 | ) | $ | (16,301 | ) | $ | (78,027 | ) | |||
| Adjustments to reconcile net loss to net cash provided by (used in) operating activities: |
||||||||||||
| Stock-based compensation expense |
22,976 | 2,179 | 2,344 | |||||||||
| Depreciation and amortization |
12,595 | 13,208 | 21,559 | |||||||||
| Change in fair value of redeemable preferred stock warrants |
(3,550 | ) | 1,495 | (283 | ) | |||||||
| Deferred tax liability |
1,568 | 1,984 | 1,776 | |||||||||
| Goodwill and long-lived asset impairment charges |
— | 5,806 | 29,130 | |||||||||
| Amortization of discount on investments, net |
— | 21 | (11 | ) | ||||||||
| Loss from sale of discontinued operations |
— | — | 127 | |||||||||
| Other non-cash adjustments |
756 | (107 | ) | 901 | ||||||||
| Changes in operating assets and liabilities |
||||||||||||
| Accounts receivable |
(12,426 | ) | 20,738 | 2,035 | ||||||||
| Prepaid expenses and other assets |
(3,157 | ) | 3,568 | 1,232 | ||||||||
| Other long-term assets |
1,769 | (1,905 | ) | 136 | ||||||||
| Accounts payable and accrued expenses |
4,478 | (44 | ) | (16,772 | ) | |||||||
| Deferred revenue |
(10,907 | ) | 2,459 | 7,108 | ||||||||
| Net cash provided by (used in) operating activities |
7,087 | 33,101 | (28,745 | ) | ||||||||
| Cash flows from investing activities |
||||||||||||
| Purchase of property and equipment |
(8,288 | ) | (4,890 | ) | (8,389 | ) | ||||||
| Capitalization of software development costs |
(9,132 | ) | — | — | ||||||||
| Acquisition of assets held for sale |
— | (1,301 | ) | (2,042 | ) | |||||||
| Proceeds of assets held for sale |
1,199 | 874 | — | |||||||||
| Acquisition of businesses, net of cash acquired |
— | — | (1,118 | ) | ||||||||
| Proceeds from sale of discontinued operations |
— | 300 | 2,250 | |||||||||
| Maturity of held-to-maturity investments |
— | 5,425 | 6,200 | |||||||||
| Purchase of held-to-maturity investments |
— | — | (11,636 | ) | ||||||||
| Net cash provided by (used in) investing activities |
(16,221 | ) | 408 | (14,735 | ) | |||||||
| Cash flows from financing activities |
||||||||||||
| Net proceeds from sale of common stock |
48,950 | — | 4,756 | |||||||||
| Proceeds from exercise of common stock options |
1,708 | 17 | 22 | |||||||||
| Restricted short-term investments |
1,040 | (425 | ) | — | ||||||||
| Borrowings from bank |
— | — | 4,756 | |||||||||
| Repayment of bank borrowings |
— | (9,875 | ) | (14,427 | ) | |||||||
| Proceeds from restricted stock |
— | — | 5 | |||||||||
| Prepaid offering costs |
— | (423 | ) | — | ||||||||
| Repurchase of outstanding common stock |
— | (1,250 | ) | — | ||||||||
| Net cash provided by (used in) financing activities |
51,698 | (11,956 | ) | (9,644 | ) | |||||||
| Effect of foreign currency |
10 | 93 | 5 | |||||||||
| Net increase (decrease) in cash and cash equivalents |
42,574 | 21,646 | (53,119 | ) | ||||||||
| Cash and cash equivalents at beginning of period |
35,945 | 14,299 | 67,418 | |||||||||
| Cash and cash equivalents at end of period |
$ | 78,519 | $ | 35,945 | $ | 14,299 | ||||||
| Supplemental disclosure of cash flow information |
||||||||||||
| Cash paid for interest |
— | $ | 110 | $ | 562 | |||||||
The accompanying notes are an integral part of these consolidated financial statements.
68
Motricity, Inc.
Notes to Consolidated Financial Statements
(amounts in thousands, except share data and per share amounts)
1. Organization
Motricity, Inc. (the “Company”) is a leading provider of mobile data solutions and services that enable wireless carriers to deliver high value mobile data services to their subscribers. We provide a comprehensive suite of hosted, managed service offerings, including mobile web portal, mobile marketplace, messaging, and billing support and settlement, which enable wireless carriers to deliver customized, carrier-branded mobile data services to their wireless subscribers.
Motricity, Inc., a Delaware corporation, was incorporated on March 17, 2004 under the name Power By Hand, Inc. (“PBH, Inc.”). PBH, Inc. was formed as a new entity to be the surviving corporation in the merger of Pinpoint Networks, Inc. (the acquiring corporation for accounting purposes) and Power By Hand Holdings, LLC (“PBH Holdings”), which occurred on April 30, 2004. On October 29, 2004, we changed our name from Power By Hand, Inc. to Motricity, Inc.
In 2007, we acquired the assets of the mobile division of InfoSpace, Inc. (“InfoSpace Mobile”). Located in Bellevue, Washington, InfoSpace Mobile was a provider of mobile content solutions and services for the wireless industry.
On April 23, 2010, our Board of Directors approved an amendment to our Amended and Restated Certificate of Incorporation to effect a 15-to-1 split of our common stock. The reverse stock split was effected on June 15, 2010 in connection with the completion of our initial public offering (the “IPO”). All information related to common stock, options and warrants to purchase common stock and earnings per share included in the accompanying consolidated financial statements has been retroactively adjusted to give effect to the reverse stock split.
On June 23, 2010, we completed our offering of 6,000,000 shares of common stock in an initial public offering. 5,000,000 shares of common stock were sold at a per share price of $10.00 and 1,000,000 shares of common stock were sold directly to entities affiliated with Mr. Carl C. Icahn for a per share price of $10.00 less discounts and commissions, resulting in net proceeds of approximately $48,500. At the closing of the IPO, 303.9 million shares of redeemable preferred stock (Series A, B, C, D, E, F, G and I) were converted into 25.3 million shares of common stock and 7.3 million shares of Series D1 preferred stock was converted into 0.7 million shares of common stock. Series H redeemable preferred stock is the only class of preferred stock outstanding as of December 31, 2010.
2. Summary of Significant Accounting Policies
Basis of Presentation
The consolidated financial statements include the accounts of the Company and our wholly-owned subsidiaries. Intercompany balances and transactions have been eliminated upon consolidation.
In connection with a business strategy reassessment initiated in 2007, we exited two lines of business in 2007 and 2008, the results of which are reflected as discontinued operations in our operating results. The discontinued lines of business were direct to consumer (“D2C”), which was sold in two transactions in 2007 and in 2008, and media and entertainment (“M&E”), which was discontinued in 2008. We have reclassified all of the revenues and associated operating expenses which would no longer be incurred upon disposition of the business to discontinued operations for all periods presented. Any gains and losses from the sale of the businesses are also reported in discontinued operations.
69
Motricity, Inc.
Notes to Consolidated Financial Statements
(amounts in thousands, except share data and per share amounts)
Use of Estimates
The preparation of consolidated financial statements in conformity with the generally accepted accounting principles in the United States (“U.S. GAAP”) requires management to make estimates and assumptions in certain circumstances that affect the reported amounts of assets and liabilities and disclosures of contingent assets and liabilities at the date of the consolidated financial statements and the reported amounts of revenues and expenses during the reporting period. The more significant estimates include the recognition of certain revenues including those recognized under the percentage-of-completion method, valuation of deferred tax assets, intangible assets, goodwill and long-lived asset impairment charges, stock-based compensation, litigation and other loss contingencies and the allowance for doubtful accounts receivable. Actual results could differ from those estimates.
Revenue Recognition
We derive our revenues from contracts which include individual or varying combinations of our managed services and often include professional service fees to customize and implement the specific software platform solutions required by the customer. We recognize revenue when all of the following conditions are satisfied: (i) there is persuasive evidence of an arrangement; (ii) delivery has occurred; (iii) the fee is fixed or determinable; and (iv) collectability of the fee is reasonably assured. Certain of our arrangements include customer acceptance clauses or penalties for late delivery which we assess to determine whether revenue can be recognized ahead of the acceptance or delivery. The timing of revenue recognition in each case depends upon a variety of factors, including the specific terms of each arrangement and the nature of our deliverables and obligations.
Our customer contracts may consist of professional service fees, a fixed monthly managed service fee to host the software platform solution, and variable monthly fees based on one of three measures: the number of wireless subscribers using our software solutions each month; the aggregate dollar volume or number of transactions processed; or specified rates for individual transactions processed. Certain arrangements, including all of our new international carrier contracts, are based on a percentage of revenue generated by carrier mobile data services. Certain arrangements also include minimum monthly fee provisions, monthly fees for providing additional managed services required by the customer and/or service level requirements related to the hosted solutions which often entail financial penalties for non-compliance. Professional service fees typically include both the initial fees to customize and implement the specific software solution and fees to enhance the functionality of the software solution, which may occur anytime during the contractual term of the arrangement.
Under contractual arrangements where the customer does not have the right to take possession of the software, we determine the pattern of revenue recognition of the combined deliverables as a single unit of accounting. The professional service fees associated with the arrangement are not considered to be a separate earnings process because the services do not have stand-alone value to the customer. Such customers do not have the ability to benefit, resell or realize value from such services without the associated hosting services. Consequently, the professional services revenue is deferred and recognized monthly on a ratable basis together with the hosting services over the longer of the contractual term of the arrangement or the estimated period the customer is expected to benefit from the software solution or enhancement representing the period over which the hosting services are expected to be utilized. In determining the expected benefit period, we assess factors such as historical data trends, data used to establish pricing in the arrangement, discussions with customers in negotiating the arrangement and the period over which the customer could be expected to recover and earn a reasonable return on the professional service fee. At December 31, 2010 and December 31, 2009 our balance sheets reflected deferred revenue of $0.9 million and $11.8 million, respectively, which consists primarily of
70
Motricity, Inc.
Notes to Consolidated Financial Statements
(amounts in thousands, except share data and per share amounts)
such professional service fees. We consider the variable activity- or revenue-based fees to be contingent fees and recognize revenue monthly as the contingency is resolved, the fees are earned and the amount of the fee can be reliably measured. For purposes of classifying the arrangement consideration as managed services or professional services revenue on our statement of operations, we allocate the arrangement consideration based on the contractually stated amounts for each component. The pricing of our professional services is based on the expected level of effort necessary to complete a software solution. We believe this best approximates the fair value of the professional service fees if they were a separate unit of accounting.
Under certain arrangements, the customer has the right to take possession of the software, and it is feasible for the customer to either self-host the software on its own hardware or contract with another entity for the hosting service without significant penalty. Such multiple element arrangements are analyzed under software revenue guidance to assess the elements for separation and recognition. The fixed monthly hosting fee to host the software solution is not considered essential to the functionality of other elements, is described in the contract such that the total price of the arrangement would be expected to vary as the result of the inclusion or exclusion of the services and we have established vendor-specific objective evidence of fair value through substantive renewal rates included in the contract. Accordingly, we account for the hosting fee element of the arrangement separately and recognize the hosting fee as managed services revenue on a monthly basis as earned. The variable monthly fee is considered a contingent fee and is recognized as managed services revenue monthly when the contingency is resolved and the related fee is earned. We then use the residual method to allocate the arrangement consideration to the professional services element for revenue recognition purposes. We recognize the professional service revenues using the cost-to-cost percentage of completion method of accounting. We recognize the revenue based on the ratio of costs incurred to the estimated total costs at completion. Revenue recognized in excess of billings is recorded within accounts receivable. Billings in excess of revenue recognized are recorded within deferred revenue. Should the customer elect to self-host the software, the hosting fee would be eliminated and the variable fee would become the licensing fee. No customer has elected to self-host as of December 31, 2010. If a contract which previously did not have a right to self-host without significant penalty is amended to include such a right, we reassess the contract under the above software revenue recognition guidance.
Under contractual arrangements where our software is licensed to the customer and requires significant production, modification or customization of the software, the entire arrangement is accounted for under software revenue accounting in conformity with contract accounting. Under contract accounting, when no elements under the arrangement qualify to be separate, we recognize revenue for the entire arrangement using the cost-to-cost percentage of completion method of accounting. Progress towards completion is typically measured based on costs incurred as a proportion of estimated total costs. Profit in a given period is reported at the expected profit margin to be achieved on the overall contract. This method can result in the recognition of unbilled receivables or the deferral of costs or revenue on these contracts. Management regularly reviews project profitability and underlying estimates. Revisions to the estimates at completion are reflected in results of operations as a change in accounting estimate in the period in which the facts that give rise to the revision become known by management. Provisions for estimated losses, if any, are recognized in the period in which the loss becomes evident.
We provide premium messaging services to subscribers of wireless carriers on behalf of third-party vendors and earn a fixed percentage of the related revenue. We bill the carriers for transactions conducted by their subscribers and provide settlement services for the third-party vendors based on payments received from the carriers. We determined it is appropriate to record our net share of the billings to carriers as service revenue rather than the gross billing amount. The primary considerations for this determination are:
| • | the third-party vendor sells its content or service directly to the wireless carriers’ subscribers and is considered the primary obligor; |
71
Motricity, Inc.
Notes to Consolidated Financial Statements
(amounts in thousands, except share data and per share amounts)
| • | the carriers have a contractual relationship with their subscribers and are directly responsible for billing and collecting premium messaging fees from their subscribers and resolving billing disputes; |
| • | the carriers establish gross pricing for the transactions; |
| • | the wireless carriers generally pay us a fixed percentage of premium messaging revenues actually collected from their subscribers; and |
| • | we have limited risks, including no inventory risk and limited credit risk, because the carriers generally bear the risk of collecting fees from their subscribers and we are obligated to remit to the third-party vendor only their share of the funds we actually receive from the carrier. |
Cash and Cash Equivalents
We consider all highly liquid investments with remaining maturities of three months or less at the date of purchase to be cash and cash equivalents. Cash and cash equivalents consist primarily of money market funds and other short-term investments with original maturities of not more than three months stated at cost, which approximates market value.
Restricted Short-Term Investments
Restricted short-term investments are comprised of a deposit with a financial institution related to an office lease. The deposit is legally restricted from withdrawals, except in order to make payments on the final 10 months of the lease. As of December 31, 2010, three months of payments are remaining as the lease will terminate in March 2011.
Accounts Receivable and Allowance for Doubtful Accounts
Accounts receivable are presented at their face amount, less an allowance for doubtful accounts, on the consolidated balance sheets. Accounts receivable consist of amounts billed and currently due from customers and revenues earned but not yet billed. At December 31, 2010 and 2009, unbilled amounts classified within accounts receivable totaled $4,784 and $843, respectively. We evaluate the collectability of accounts receivable based on a combination of factors. We recognize reserves for bad debts based on estimates developed using standard quantitative measures which incorporate historical write-offs and current economic conditions. Although, in circumstances where we are aware of a specific customer’s inability to meet its financial obligations, a specific reserve is recorded to reduce the related accounts receivable to an amount we believe is collectable.
Long-Lived Assets
Long-lived assets include assets such as property and equipment and intangible assets other than those with indefinite lives. We assess the carrying value of our long-lived asset groups when indicators of impairment exist and recognize an impairment loss when the carrying amount of a long-lived asset is not recoverable from the undiscounted cash flows expected to result from the use and eventual disposition of the asset. Indicators of impairment include significant underperformance relative to historical or projected future operating results, significant changes in our use of the assets or in our business strategy, loss of or changes in customer relationships and significant negative industry or economic trends. When indications of impairment arise for a particular asset or group of assets, we assess the future recoverability of the carrying value of the asset (or asset group) based on an undiscounted cash flow analysis. If carrying value exceeds projected, net, undiscounted cash
72
Motricity, Inc.
Notes to Consolidated Financial Statements
(amounts in thousands, except share data and per share amounts)
flows, an additional analysis is performed to determine the fair value of the asset (or asset group), typically a discounted cash flow analysis, and an impairment charge is recorded for the excess of carrying value over fair value. The following table outlines our impairments related to long-lived assets:
| Year Ended December 31, | ||||||||||||
| 2010 | 2009 | 2008 | ||||||||||
| Property and equipment |
$ | — | $ | 3,587 | $ | 21,132 | ||||||
| Definite-lived intangible assets |
— | 1,902 | 1,219 | |||||||||
| Assets held for sale |
— | 317 | — | |||||||||
| Total asset impairment charges |
$ | — | $ | 5,806 | $ | 22,351 | ||||||
See Note 3, “Property and Equipment, Net” and Note 4, “Goodwill and Intangible Assets.”
Property and equipment are recorded at historical cost less accumulated depreciation, unless impaired. Depreciation is charged to operations over the estimated useful lives of the assets using the straight-line method or a variable method reflecting the pattern in which the economic benefits are anticipated to be utilized. Upon retirement or sale, the historical cost of assets disposed of and the related accumulated depreciation are removed from the accounts and any resulting gain or loss is recognized. Expenditures for repairs and maintenance are charged to expense as incurred.
All costs related to the development of internal-use software other than those incurred during the application development stage are expensed, including costs for minor upgrades and enhancements when there is no reasonable cost-effective way to separate these costs from maintenance activities. Costs incurred during the application development stage are capitalized and amortized over the estimated useful life of the software (generally three years).
Identifiable intangible assets include capitalized costs related to the development of certain software products for external sale. Capitalization of costs begins when technological feasibility has been established and ends when the product is available for general release to customers. Amortization is computed on an individual product basis for those products available for market and is recognized based on the product’s estimated economic life. At each balance sheet date, the unamortized costs for all intangible assets are reviewed by management and reduced to net realizable value when necessary. Other identifiable intangible assets are recorded at cost or, when acquired as part of a business acquisition, estimated fair value. The recorded amount is amortized to expense over the estimated useful life of the asset using the straight-line method or a variable method reflecting the pattern in which the economic benefits are anticipated to be realized.
Goodwill
Goodwill represents the excess of the purchase price of an acquired enterprise or assets over the fair value of the identifiable net assets acquired. We test goodwill for impairment in the fourth quarter of each year, and whenever events or changes in circumstances arise during the year that indicate the carrying amount of goodwill may not be recoverable. In evaluating whether an impairment of goodwill exists, we first compare the estimated fair value of a reporting unit against its carrying value. If the estimated fair value is lower than the carrying value, then a more detailed assessment is performed comparing the fair value of the reporting unit to the fair value of the assets and liabilities plus the goodwill carrying value of the reporting unit. If the fair value of the reporting unit is less than the fair value of its assets and liabilities plus goodwill, then an impairment charge is recognized
73
Motricity, Inc.
Notes to Consolidated Financial Statements
(amounts in thousands, except share data and per share amounts)
to reduce the carrying value of goodwill by the difference. The gross amount of goodwill at December 31, 2010 and December 31, 2009 was $111,155 with accumulated impairments of $36,497.
During the year ended December 31, 2008, a goodwill impairment charge of $6,779 related to the goodwill associated with the acquisition of a messaging business was recorded within goodwill and long-lived asset impairment charge on the consolidated statements of operations. See Note 4, “Goodwill and Intangible Assets.”
Business Acquisitions
Business acquisitions are accounted for under the purchase method of accounting. Under that method, assets and liabilities of the business acquired are recorded at their estimated fair values as of the date of the acquisition, with any excess of the cost of the acquisition over the estimated fair value of the net tangible and intangible assets acquired recorded as goodwill. We make significant judgments and assumptions in determining the fair value of acquired assets and assumed liabilities, especially with respect to acquired intangibles. Using different assumptions in determining fair value could materially impact the purchase price allocation and our financial position and results of operations. Results of operations for acquired businesses are included in the consolidated financial statements from the date of acquisition.
Freestanding Preferred Stock Warrants
Prior to the IPO, the Company had freestanding warrants that were related to the Company’s redeemable preferred stock and classified as liabilities on the consolidated balance sheets. The warrants were subject to remeasurement using the Black-Scholes option pricing model at each balance sheet date, and any change in fair value was recognized within other income (expense) on the Company’s consolidated statements of operations. As of December 31, 2009 the Redeemable Preferred Stock Warrant liability was $5,012. On June 23, 2010, the outstanding redeemable preferred stock warrants were automatically converted into common stock warrants when the underlying series of preferred stock were converted into shares of common stock. The warrant liability was reclassified as additional paid-in capital.
The redeemable preferred stock warrants were adjusted to reflect current fair value immediately prior to conversion to common stock and at each prior balance sheet date as determined by the Black-Scholes model. The change in the fair value of the redeemable preferred stock warrants was a $3,550 decrease during the period they were outstanding in 2010, a $1,495 increase for the year ended December 31, 2009 and a $283 decrease for the year ended December 31, 2008. The weighted-average assumptions used in these calculations are summarized as follows:
| Year Ended December 31, 2010 |
Year Ended December 31, 2009 |
Year Ended December 31, 2008 |
||||||||||
| Expected term |
4 years | 5 years | 6 years | |||||||||
| Expected volatility |
50.0 | 50.0 | % | 58.0 | % | |||||||
| Risk-free interest rate |
1.9 | 2.6 | % | 1.8 | % | |||||||
| Expected dividend yield |
3.9 | 3.9 | % | 3.9 | % | |||||||
The expected term was the remaining contractual life for each warrant and the risk-free interest rate was based on the U.S. Treasury constant maturities in effect at the end of the reporting period. Expected volatility was calculated using a historical volatility for a peer group of ten companies, as we believe the expected volatility approximated historical volatility of the peer group.
74
Motricity, Inc.
Notes to Consolidated Financial Statements
(amounts in thousands, except share data and per share amounts)
Accumulated Other Comprehensive Income
Comprehensive loss includes net loss as currently reported under U.S. GAAP and other comprehensive loss. Other comprehensive loss considers the effects of additional economic events, such as foreign currency translation adjustments, that are not required to be recorded in determining net loss, but rather are reported as a separate component of stockholders’ equity (deficit).
Product Development Costs
Product development expenses consist primarily of salaries and fees paid to outside vendors. Costs incurred in connection with research activities are charged to operating expenses as incurred and are included within product development and sustainment in the consolidated statements of operations. Research and development expenses for the years ended December 31, 2010, 2009 and 2008 were $8,667, $5,792 and $3,045, respectively.
Prior to 2010, we capitalized certain software development costs, including the costs to develop new software products or significant enhancements to existing software products, which are developed or obtained for internal use. We capitalize software development costs when application development began, it was probable that the project would be completed, and the software would be used as intended. Such capitalized costs are being amortized on a straight-line basis over the estimated useful life of the related asset, which is generally three years. Costs associated with preliminary project stage activities, training, maintenance and all post implementation stage activities were expensed as incurred.
Software development costs related to software products to be sold, leased or otherwise marketed as a component of the solutions we provide to our customers, however, are capitalized when technological feasibility has been established. In 2010, we have focused on developing software products that can be leveraged across various customers. As such, we have capitalized costs, including direct labor and related overhead included in intangible assets, net. Amortization of capitalized software development costs will begin as each product is available for general release to customers and will be recorded within depreciation and amortization. Amortization will be computed on an individual product basis for those products available for market and will be recognized based on the product’s estimated economic life. Unamortized capitalized software development costs determined to be in excess of net realizable value of the product are expensed immediately. In the year ended December 31, 2010, we capitalized $9.1 million of software development costs. We did not capitalize any software development costs in 2009 or 2008.
Stock-Based Compensation
We measure and recognize stock-based compensation expense using a fair value-based method for all share-based awards made to employees and nonemployee directors, including grants of stock options and other stock-based awards. The application of this standard requires significant judgment and the use of estimates, particularly with regard to Black-Scholes assumptions such as stock price volatility and expected option lives to value equity-based compensation. We recognize stock compensation expense using a straight line method over the requisite service period of the individual grants, which generally equals the vesting period.
Income Taxes
We utilize the balance sheet method of accounting for income taxes. Accordingly, we are required to estimate our income taxes in each of the jurisdictions in which we operate as part of the process of preparing our consolidated
75
Motricity, Inc.
Notes to Consolidated Financial Statements
(amounts in thousands, except share data and per share amounts)
financial statements. This process involves estimating our actual current tax exposure, including assessing the risks associated with tax audits, together with assessing temporary differences resulting from the different treatment of items for tax and accounting purposes. These differences result in deferred tax assets and liabilities. Due to the evolving nature and complexity of tax rules combined with the number of jurisdictions in which we operate, it is possible that our estimates of our tax liability could change in the future, which may result in additional tax liabilities and adversely affect our results of operations, financial condition and cash flows.
As of January 1, 2007, we adopted the authoritative accounting guidance prescribing a threshold and measurement attribute for the financial recognition and measurement of a tax position taken or expected to be taken in a tax return. The guidance defines the level of assurance that a tax position must meet in order to be recognized in the financial statements and also provides for de-recognition of tax benefits, classification on the balance sheet, interest and penalties, accounting in interim periods, disclosure and transition. The guidance utilizes a two-step approach for evaluating uncertain tax positions. Step one, recognition, requires a company to determine if the weight of available evidence indicates that a tax position is more likely than not to be sustained upon audit, including resolution of related appeals or litigation processes, if any. If a tax position is not considered “more likely than not” to be sustained, no benefits of the position are recognized. Step two, measurement, is based on the largest amount of benefit which is more likely than not to be realized on effective settlement.
Net Loss Per Share Attributable to Common Stockholders
Basic and diluted net loss per share attributable to common stockholders is computed by dividing net loss attributable to common stockholders by the weighted-average number of common shares outstanding during the period. Our net loss attributable to common stockholders was not allocated to redeemable preferred stock or preferred stock using the two-class method, as the redeemable preferred stock and preferred stock do not have a contractual obligation to share in the net loss attributable to common stockholders.
Our potentially dilutive shares, which include outstanding common stock options, unvested common shares subject to repurchase, preferred stock and redeemable preferred stock, common stock warrants and redeemable preferred stock warrants, have not been included in the computation of diluted net loss per share attributable to common stockholders for all periods presented, as the results would be anti-dilutive. Such potentially dilutive shares are excluded when the effect would be to reduce net loss per share. See Note 11, “Net Loss Per Share Attributable to Common Stockholders.”
Operating Segment
The authoritative guidance for disclosures about segments of an enterprise establishes standards for reporting information about operating segments. It defines operating segments as components of an enterprise about which separate financial information is available that is evaluated regularly by the chief operating decision-maker (“CODM”) in deciding how to allocate resources and in assessing performance. We currently operate and manage our business as a single segment. Our CODM allocates resources and assesses performance of the business at the consolidated level. Our CODM reviews revenue by customer and by type of service to understand and evaluate revenue trends. We have one business activity, and there are no segment managers who are held accountable for operations, operating results or components below the consolidated unit level. Accordingly, we consider ourselves to be in a single operating and reportable segment structure.
76
Motricity, Inc.
Notes to Consolidated Financial Statements
(amounts in thousands, except share data and per share amounts)
We generated approximately 82%, 95% and 92% of our total revenue in the U.S. during the years ended December 31, 2010, 2009 and 2008, respectively. In 2010, 13% of our revenue was generated in Indonesia. As of December 31, 2010, 2009 and 2008, the majority of our long-lived assets were located in the U.S.
Fair Value of Financial Instruments
As of December 31, 2010 and 2009, we had $78,519 and $35,945 of cash and cash equivalents, respectively, and $335 and $1,375 of restricted short-term investments, respectively, that were evaluated using quoted market prices (Level 1) to determine their fair value. As of December 31, 2010 and December 31, 2009, cash equivalents were comprised of money market funds totaling $58,970 and $3,966, respectively. In addition, the carrying amount of certain financial instruments, including accounts receivable, accounts payable and accrued expenses approximates fair value due to their short maturities.
The freestanding warrants that were related to our redeemable preferred stock were classified as liabilities and due to the lack of availability of observable market quotes for these securities, the fair value was estimated based on a Black-Scholes valuation model which utilized inputs based on management estimates. Significant inputs to the valuation are unobservable in the active markets and are classified as Level 3. The increase/(decrease) in the Level 3 securities of $(3,550) for the year ended December 31, 2010 and $1,495 for the year ended December 31, 2009, was due primarily to changes in the estimated fair value of the Company’s stock. The change in the fair value is recorded within Other income (expense), net. As a result of the conversion of the redeemable preferred stock, all freestanding warrants that were classified as liabilities have been exercised or converted into common stock warrants. As of December 31, 2010, we have no Level 3 securities. There were no transfers between levels in the fair value hierarchy during the year ended December 31, 2010 or the year ended December 31, 2009.
Concentration of Credit Risk
Financial instruments that potentially subject us to concentrations of credit risk consist primarily of cash and cash equivalents, to the extent balances exceed limits that are insured by the Federal Deposit Insurance Corporation, and accounts receivable.
At December 31, 2010, two customers comprised 51% and 18%, respectively, of accounts receivable. At December 31, 2009, two customers comprised 41% and 13%, respectively, of accounts receivable.
The following table outlines our revenue concentration by customer:
| AT&T | Verizon Wireless |
XL | Alltel | |||||||||||||
| Year ended December 31, 2010(1) |
44 | % | 24 | % | 13 | % | — | |||||||||
| Year ended December 31, 2009(1) |
53 | % | 20 | % | — | — | ||||||||||
| Year ended December 31, 2008 |
42 | % | 12 | % | — | 10 | % | |||||||||
| (1) | Verizon Wireless acquired Alltel in January 2009. |
77
Motricity, Inc.
Notes to Consolidated Financial Statements
(amounts in thousands, except share data and per share amounts)
Foreign Currencies
For international subsidiaries, local currencies have been determined to be the functional currencies. The financial statements of international subsidiaries are translated to their U.S. dollar equivalents at end-of-period exchange rates for assets and liabilities and at average currency exchange rates for revenues and expenses. Translation adjustments resulting from this process are included in other comprehensive loss and are reflected as a separate component of stockholders’ equity (deficit). Realized and unrealized transaction gains and losses are included in Other income (expense), net in the period in which they occur, except on intercompany balances considered to be long-term, and have not been significant for any periods presented. Transaction gains and losses on intercompany balances considered to be long-term are recorded in other comprehensive loss.
Recent accounting pronouncements
In September 2009, the Financial Accounting Standards Board, or FASB, Emerging Issues Task Force issued authoritative guidance addressing revenue recognition arrangements with multiple deliverables. The guidance requires revenue to be allocated to multiple elements using relative fair value based on vendor specific objective evidence or best estimated selling price, depending on the nature of the transaction. The residual
method also becomes prohibited under certain circumstances. The new guidance is effective for our fiscal year beginning on January 1, 2011 and is not expected to have a significant impact on our financial position, results of operations or cash flows.
In January 2010, the FASB issued updated guidance related to fair value measurements and disclosures, which requires a reporting entity to disclose separately the amounts of significant transfers in and out of Level 1 and Level 2 fair value measurements and to describe the reasons for the transfers. In addition, in the reconciliation for fair value measurements using significant unobservable inputs, or Level 3, a reporting entity should disclose separately information about purchases, sales, issuances and settlements (that is, on a gross basis rather than one net number). The updated guidance also requires that an entity should provide fair value measurement disclosures for each class of assets and liabilities and disclosures about the valuation techniques and inputs used to measure fair value for both recurring and non recurring fair value measurements for Level 2 and Level 3 fair value measurements. The updated guidance is effective for interim or annual financial reporting periods beginning after December 15, 2009, except for the disclosures about purchases, sales, issuances and settlements in the roll forward activity in Level 3 fair value measurements, which are effective for fiscal years beginning after December 15, 2010 and for interim periods within those fiscal years. The adoption of this statement in the first quarter of fiscal 2010 did not have a material impact on our consolidated financial statements, as the principal impact from this update relates to our fair value measurements disclosure.
78
Motricity, Inc.
Notes to Consolidated Financial Statements
(amounts in thousands, except share data and per share amounts)
3. Property and Equipment, Net
Information related to the major categories of our property and equipment, net is as follows:
| Useful Life (in years) |
As of December 31, | |||||||||||
| 2010 | 2009 | |||||||||||
| Capitalized software |
3 | $ | 47,554 | $ | 47,601 | |||||||
| Computer software and equipment |
3-5 | 22,788 | 28,633 | |||||||||
| Leasehold improvements |
4-10 | 7,962 | 6,755 | |||||||||
| Equipment, furniture and fixtures |
7 | 2,493 | 2,392 | |||||||||
| Equipment, furniture and fixtures under capital lease |
Lease term | — | 113 | |||||||||
| Total property and equipment |
80,797 | 85,494 | ||||||||||
| Less: Accumulated depreciation and amortization |
(31,739 | ) | (33,945 | ) | ||||||||
| Less: Accumulated depreciation and amortization under capital lease |
— | (113 | ) | |||||||||
| Less: Accumulated impairments |
(24,719 | ) | (24,719 | ) | ||||||||
| Property and equipment, net |
$ | 24,339 | $ | 26,717 | ||||||||
Capitalized software, net of amortization, consists of:
| As of December 31, | ||||||||
| 2010 | 2009 | |||||||
| Beginning balance |
$ | 17,284 | $ | 23,228 | ||||
| Capitalization |
— | 2,143 | ||||||
| Amortization |
(4,991 | ) | (4,500 | ) | ||||
| Impairment of assets acquired via acquisition |
— | (3,268 | ) | |||||
| Impairment of internally developed software |
— | (319 | ) | |||||
| Ending balance |
$ | 12,293 | $ | 17,284 | ||||
Included within property and equipment is $25,300 of aggregated proprietary technology and software that was acquired during the InfoSpace Mobile acquisition. This represents six platforms that enable us to provide various types of mobile services to the wireless industry. We valued the technology and software using
a cost approach, which provides an estimate of fair value based on the cost of reproducing or replacing the assets. We are amortizing the technology assets using a variable method over their estimated useful lives of six years.
During 2010, we disposed of $12,893 of assets and related accumulated amortization for assets that were no longer in use and the majority of which were fully depreciated.
In 2009, as a result of the loss of a customer who comprised a significant portion of our messaging business, we determined the $3,268 of capitalized software acquired as part of a messaging business acquisition was impaired. Our projected future cash flows, when compared to the carrying value of the capitalized software, indicated the asset was fully impaired. In addition, we recorded an impairment charge of $319 related to capitalized software that was no longer in use. During 2009, we also retired a significant amount of assets that were no longer in use due to our datacenter consolidations.
In 2008, we recorded an impairment charge of $8,430 for certain capitalized software assets acquired as part of the InfoSpace Mobile acquisition based on information indicating it was likely that two significant customers
79
Motricity, Inc.
Notes to Consolidated Financial Statements
(amounts in thousands, except share data and per share amounts)
would no longer be utilizing our mobile search and storefront solutions and our reassessment of the projected future cash flows associated with these assets. In addition, we recorded an impairment charge of $4,489 related to the planned shutdown of the Fuel software platform. We are migrating existing customers from Fuel to an upgraded version of the mCore platform acquired as part of the InfoSpace Mobile acquisition. Based on the planned consolidation and shutdown of certain datacenter facilities and our former headquarters in Durham, North Carolina, we recorded a total impairment charge of $8,213 related to computer software, furniture and fixtures and leasehold improvements.
Capitalized interest for the years ended December 31, 2010, 2009 and 2008 was $0, $27 and $113, respectively.
4. Goodwill and Intangible Assets
Goodwill
In 2008, our goodwill impairment test indicated that future revenues from a messaging business acquisition would not support the carrying value of the associated goodwill. The technology acquired from that acquisition supports premium messaging. As premium messaging has not experienced the expected rate of growth in usage, revenues will be lower than originally anticipated. Therefore, a $6,779 impairment charge was recorded for the year ended December 31, 2008. The goodwill impairment charge was calculated as the difference between the fair value of the assets and liabilities of the reporting unit, including the carrying value of its goodwill, to the reporting unit’s fair value, measured by an income approach utilizing projected discounted cash flows. Also during 2008, we completed the purchase allocation of the InfoSpace Mobile acquisition, which included a $2,154 adjustment to the fair value of acquired property and equipment and assumed liabilities.
Intangible Assets
Intangible assets include assets capitalized as a result of our acquisitions and certain software products to be sold, leased or otherwise marketed as a component of the solutions we provide to our customers. Information regarding our define-lived intangible assets is as follows:
| As of December 31, 2010 | As of December 31, 2009 | |||||||||||||||
| Gross Carrying Amount |
Accumulated Amortization |
Gross Carrying Amount |
Accumulated Amortization |
|||||||||||||
| Customer relationships |
$ | 19,088 | $ | 9,980 | $ | 19,088 | $ | 8,396 | ||||||||
| Capitalized software |
9,132 | 547 | — | — | ||||||||||||
| Trademarks |
1,000 | 1,000 | 1,000 | 1,000 | ||||||||||||
| Other |
143 | 143 | 143 | 143 | ||||||||||||
| Total |
$ | 29,363 | $ | 11,670 | $ | 20,231 | $ | 9,539 | ||||||||
Customer relationships represent the ability to sell existing and future managed and professional services to existing customers. The fair value of customer relationships has been estimated using the income method utilizing a discounted cash flow model. We are amortizing this intangible asset using a variable method over its estimated useful life of approximately eight years.
Total amortization expense for definite-lived intangible assets was $2,131, $1,488 and $1,885 for the years ended December 31, 2010, 2009 and 2008, respectively.
80
Motricity, Inc.
Notes to Consolidated Financial Statements
(amounts in thousands, except share data and per share amounts)
In 2009, we determined the customer list acquired during the acquisition of a messaging business was impaired. Our projected cash flow analysis did not support the carrying value of the intangible asset. Therefore, we recorded a $1,902 charge to fully impair the customer list during 2009. In 2008, the customer list related to the acquisition of M7 Networks, Inc. (“M7”) was impaired, resulting in an additional $1,219 of impairments included within goodwill and long-lived asset impairment charges on the consolidated statements of operations for the year ended December 31, 2008. M7 was a community management solutions provider that we acquired in 2005. We no longer have customers utilizing this technology.
As of December 31, 2010, estimated annual amortization expenses for definite-lived intangible asset for each of the five succeeding years are as follows:
| 2011 |
$ | 4,604 | ||
| 2012 |
4,760 | |||
| 2013 |
4,344 | |||
| 2014 |
2,004 | |||
| 2015 |
1,980 |
5. Debt Facilities
In 2007, we entered into a loan and security agreement with a bank to obtain a $10,000 equipment loan (“2007 Equipment Loan”) and a $25,000 revolving line of credit (“2007 Revolving Line of Credit”), secured by our assets, excluding permitted liens. In April 2009, we paid $9,875 to repay the outstanding principal on the Equipment Loan and 2007 Revolving Line of Credit.
In April 2009, we amended and extended our 2007 Revolving Line of Credit through April 2011 (“Line of Credit”). The Line of Credit is primarily available to fund working capital requirements. The availability under the Line of Credit is subject to a borrowing base calculated based on qualifying accounts receivable. The interest rate on any borrowings is based on the lender’s prime rate plus a margin ranging between 50 to 150 basis points depending on our trailing EBITDA. The minimum interest rate is 5.50%. The Line of Credit restricts, among other things, our ability to incur indebtedness, create or permit liens on our assets, declare or pay dividends and certain other restricted payments, consolidate, merge or recapitalize, acquire or sell assets, make certain investments, loans or other advances, and enter into transactions with affiliates. The Line of Credit requires us to maintain a “tangible net worth” of $14,000, which we were in compliance with as of December 31, 2010. As of December 31, 2010, we had borrowing capability of approximately $12,504.
As of December 31, 2010 and December 31, 2009, no amounts were outstanding on the debt facility.
6. Commitments and Contingencies
Operating Leases
We lease office space and equipment under various non-cancellable operating lease agreements. Rent expense for non-cancellable operating leases with scheduled rent increases and landlord incentives is recognized on a straight-line basis over the lease term, beginning with the effective lease commencement date. Our leasing agreements have varying renewal options.
Significant terms of operating lease agreements are as follows:
| • | In 2005, we entered into an operating lease for approximately 61,000 square feet of office space for our headquarters in Durham, North Carolina. In conjunction with the relocation of our |
81
Motricity, Inc.
Notes to Consolidated Financial Statements
(amounts in thousands, except share data and per share amounts)
| headquarters to Bellevue, Washington, we entered into an agreement to assign this lease to a third party. As a result of this assignment, we are required to pay 23 months of rent on behalf of the assignee and make a $300 payment at the end of the 23-month period to subsidize future operating expenses. As of December 31, 2009, we had placed $1,375 in escrow (classified as restricted short term investments) to be used to make the last 10 payments to be made under the assignment of the lease. As of December 31, 2010, there were three months of rent payments remaining and the $300 payment is due in April 2011. |
| • | We lease approximately 13,170 square feet in Seattle, Washington to house a data center. The initial lease term expires on August 31, 2014, and there are two extension periods of 3 to 5 years each. |
| • | We lease approximately 65,436 square feet of office space in Bellevue, Washington. The lease expires on December 20, 2013. |
| • | We lease various sales and regional offices throughout the world. These leases are all operating leases and generally have annual commitment terms with the option to extend either on an annual or month-to-month basis. |
Estimated future minimum net rentals payable under these agreements at December 31, 2010 are as follows:
| 2011 |
$ | 4,171 | ||
| 2012 |
2,890 | |||
| 2013 |
3,321 | |||
| 2013 |
717 | |||
| 2014 |
— | |||
| Total |
$ | 11,099 | ||
In the preceding table, future minimum annual net rentals payable under non-cancellable operating leases denominated in foreign currencies have been calculated based upon December 31, 2010 foreign currency exchange rates. The table was prepared assuming the maximum commitments currently outstanding, but such commitments could decrease based on termination negotiations. Minimum net rentals payable under non-cancellable operating lease agreements are presented net of tenant allowances, if any.
Rental expense under operating lease agreements during the years ended December 31, 2010, 2009 and 2008 was $2,697, $2,978 and $5,103, respectively.
Other Contractual Arrangements
We have entered into several agreements with third-party network service providers, who provide additional operational support to our various datacenters. Under these arrangements, we are obligated to make payments totaling $2,352 in 2011, $35 in 2012 and $29 in 2013.
Litigation
From time to time, we are subject to claims in legal proceedings arising in the normal course of business. We do not believe that we are currently party to any pending legal action that could reasonably be expected to have a material adverse effect on our business, financial condition, results of operations or cash flows.
82
Motricity, Inc.
Notes to Consolidated Financial Statements
(amounts in thousands, except share data and per share amounts)
7. Restructuring
In conjunction with the InfoSpace Mobile acquisition in December 2007 and the subsequent integration activities, we elected to move our corporate headquarters from Durham, North Carolina to Bellevue, Washington and eliminate redundant functions and positions. During 2008, we incurred $3,236 of expenses to relocate the headquarters functions and certain employees to the Bellevue location. This amount includes severance expenses related to the elimination of redundant positions and is classified as restructuring charges in the 2008 consolidated financial statements. See Note 6, “Commitments and Contingencies,” for additional information regarding assignment of the lease for the Durham facility in April 2009.
During 2009, we incurred restructuring charges of $2,058 related to the relocation of our corporate headquarters and the closure of our office in the United Kingdom.
The following table summarizes the liabilities related to restructuring costs which are included in accrued expenses on the consolidated balance sheets:
| Involuntary Termination Benefits |
Office Relocation Costs |
Other Costs, Primary Lease Obligations |
Total | |||||||||||||
| Balance as of December 31, 2007 |
$ | 18 | $ | — | $ | — | $ | 18 | ||||||||
| Restructuring charges |
2,584 | 311 | 341 | 3,236 | ||||||||||||
| Utilization |
(2,372 | ) | (311 | ) | (341 | ) | (3,024 | ) | ||||||||
| Balance as of December 31, 2008 |
230 | — | — | 230 | ||||||||||||
| Restructuring charges |
744 | 43 | 1,271 | 2,058 | ||||||||||||
| Utilization |
(805 | ) | (43 | ) | (871 | ) | (1,719 | ) | ||||||||
| Balance as of December 31, 2009 |
169 | — | 400 | 569 | ||||||||||||
| Restructuring charges |
— | 407 | — | 407 | ||||||||||||
| Utilization |
(113 | ) | (407 | ) | (174 | ) | (694 | ) | ||||||||
| Balance as of December 31, 2010 |
$ | 56 | $ | — | $ | 226 | $ | 282 | ||||||||
83
Motricity, Inc.
Notes to Consolidated Financial Statements
(amounts in thousands, except share data and per share amounts)
8. Preferred Stock and Redeemable Preferred Stock
The following is a summary of our $0.001 par value Series D1 preferred stock and $0.001 par value Series A, B, C, D, E, F, G, H, and I redeemable preferred stock:
| As of December 31, 2010 | As of December 31, 2009 | |||||||||||||||||||||||
| Security |
Carrying Value |
Liquidation Value |
Issued & Outstanding Shares |
Carrying Value |
Liquida- tion Value |
Issued & Outstanding Shares |
||||||||||||||||||
| Preferred stock |
||||||||||||||||||||||||
| Series D1 |
$ | — | $ | — | — | $ | 17,393 | $ | 20,472 | 7,338,769 | ||||||||||||||
| Redeemable preferred stock |
||||||||||||||||||||||||
| Series A |
$ | — | $ | — | — | $ | 6,547 | $ | 6,579 | 8,740,368 | ||||||||||||||
| Series B |
— | — | — | 14,006 | 14,076 | 23,323,936 | ||||||||||||||||||
| Series C |
— | — | — | 2,758 | 2,772 | 2,259,121 | ||||||||||||||||||
| Series D |
— | — | — | 458 | 460 | 375,000 | ||||||||||||||||||
| Series E |
— | — | — | 32,349 | 32,610 | 29,404,456 | ||||||||||||||||||
| Series F |
— | — | — | 98,242 | 100,751 | 36,684,050 | ||||||||||||||||||
| Series G |
— | — | — | 29,821 | 30,499 | 12,248,642 | ||||||||||||||||||
| Series H |
49,862 | 52,116 | 20,654,886 | 50,770 | 52,500 | 21,084,337 | ||||||||||||||||||
| Series I |
— | — | — | 182,445 | 199,881 | 190,839,694 | ||||||||||||||||||
| Total |
$ | 49,862 | $ | 52,116 | 20,654,886 | $ | 417,396 | $ | 440,128 | 324,959,604 | ||||||||||||||
Preferred Stock
In conjunction with the IPO, the Series D1 preferred stock was converted into 0.7 million shares of common stock. The Series D1 preferred stock was not redeemable and, therefore, cumulative unpaid dividends in arrears were not recorded on our condensed consolidated balance sheets. However, while the preferred stock was outstanding, such cumulative unpaid dividends were included in net loss attributable to common stockholders for all periods that Series D1 preferred stock was outstanding.
Redeemable Preferred Stock
On June 23, 2010, in conjunction with the IPO, Series A, B, C, D, E F, G and I redeemable preferred stock converted to 26,046,701 shares of common stock.
On December 7, 2010, at the option of one of the stockholders, 1,041,006 shares of Series H redeemable preferred stock converted to 116,739 shares of common stock. As of December 31, 2010, 20,654,886 shares of Series H redeemable preferred stock were outstanding.
On December 29, 2010, we gave notice to the remaining stockholders of the Series H redeemable preferred stock of our election to cause a mandatory conversion, whereby all shares of Series H preferred stock would be converted to common stock on January 3, 2011. As the average closing price of our common stock was higher than $21.99 per common share during the 90-day period prior to December 29, 2010, the mandatory conversion was allowed in accordance with the Restated Certificate of Incorporation of Motricity, Inc.
On January 3, 2011, all outstanding and accrued shares of Series H redeemable preferred stock was converted into 2,348,182 shares of common stock.
84
Motricity, Inc.
Notes to Consolidated Financial Statements
(amounts in thousands, except share data and per share amounts)
Series H Redeemable Preferred Stock Details
In conjunction with the IPO, the terms of the Series H redeemable preferred stock were amended. Series H redeemable preferred stock was convertible at the option of the holders thereof into common stock at a rate of approximately 0.112 shares of common stock for each share of Series H redeemable preferred stock. If the average closing price over a 90-day period was $21.99 per common share or higher, Series H redeemable preferred stock would convert at our option into shares of our common stock at the then applicable conversion rate.
So long as 10% of the Series H redeemable preferred stock remained outstanding, without the consent of at least a majority of the then outstanding shares of Series H redeemable preferred stock, we may not, among other things, (i) amend or waive any provision of our certificate of incorporation or bylaws so as to affect the Series H redeemable preferred stock adversely; or (ii) incur indebtedness other than with respect to (x) vendors, service providers, trade creditors, employees, independent contractors and equipment lessors, in each case, in the ordinary course of business, (y) intercompany indebtedness, and (z) indebtedness not to exceed $42,000 outstanding under credit facilities. In addition, holders of our Series H redeemable preferred stock had the right to designate two members of our Board of Directors.
The Series H redeemable preferred stock had a liquidation preference of $2.49 per share. On or after August 31, 2013, upon request of at least a majority of the then outstanding shares of Series H redeemable preferred stock, we must redeem the Series H redeemable preferred stock in immediately available funds or by the issuance of a promissory note which shall bear simple interest at the rate of 4% per annum and shall be payable in eight consecutive quarterly installments with the first such installment becoming due and payable on the first anniversary of the redemption payment date (determined once such written request is received); provided, however, that in lieu of receiving the redemption payment in the form of a promissory note, any holder of Series H redeemable preferred stock may instead elect to be redeemed quarterly and receive the redemption payment in eight consecutive quarterly installments.
The Series H redeemable preferred stock provides for cumulative dividends quarterly at the rate of 8% per annum, accruing daily whether or not earned or declared, which shall be paid in additional shares of Series H redeemable preferred stock. These dividends are calculated on a quarterly basis for the respective periods ended January 31, April 30, July 31 and October 31, until the earlier of a forced conversion or August 2013.
The holders of Series H redeemable preferred stock will have one vote for each share of common stock into which such holders’ shares could then be converted at the time, and with respect to such vote, will have full voting rights and powers equal to the voting rights and powers of the holders of our common stock.
9. Stock Options, Restricted Stock and Warrants
Overview
Our Board of Directors approved the 2010 Long-Term Incentive Plan (“2010 LTIP”) on April 23, 2010. We may grant equity awards up to 2,765,622 shares under the 2010 LTIP. Awards granted under the 2010 LTIP may include incentive stock options or nonqualified stock options, stock appreciation rights, restricted stock and other stock-based or cash-based awards. Option terms may not exceed 10 years and the exercise price cannot be less than 100% of the estimated fair market value per share of our common stock on the grant date. Any shares awarded or issued pursuant to the exercise of stock options or vesting of restricted stock units will be authorized and unissued shares of our common stock. The maximum number of shares subject to any performance award to
85
Motricity, Inc.
Notes to Consolidated Financial Statements
(amounts in thousands, except share data and per share amounts)
any participant during any fiscal year shall be 266,667 shares. The maximum cash payment made under a performance award granted to any participant with respect to any fiscal year shall be $5,440.
Stock Options
The following table summarizes all stock option activity for the year ended December 31, 2010:
| Shares | Weighted- Average Exercise Price Per Share |
Remaining Average Contractual Term (Years) |
Aggregate Intrinsic Value |
|||||||||||||
| Outstanding, December 31, 2009 |
1,225,461 | 10.80 | 6.43 | $ | 11,498 | |||||||||||
| Granted |
946,185 | 14.25 | ||||||||||||||
| Exercised |
(384,545) | 4.43 | ||||||||||||||
| Forfeited |
(144,519) | 12.67 | ||||||||||||||
| Expired |
(111,005) | 15.60 | ||||||||||||||
| Outstanding, December 31, 2010 |
1,531,577 | 13.93 | 8.35 | $ | 8,133 | |||||||||||
| Exercisable at December 31, 2010 |
445,834 | $ | 13.08 | 6.85 | $ | 2,727 | ||||||||||
| Vested and expected to vest at December 31, 2010 |
1,309,890 | $ | 14.39 | 8.18 | $ | 6,455 | ||||||||||
The total intrinsic value of options exercised during the years ended December 31, 2010, 2009 and 2008 was $3,566, $663 and $618, respectively.
The following table summarizes information regarding our outstanding and exercisable options at December 31, 2010:
| Outstanding | Exercisable | |||||||||||||||||||
| Range of Exercise Prices |
Number of Option Shares | Weighted- Average Exercise Price |
Remaining Weighted- Average Contractual Term (Years) |
Number of Option Shares |
Weighted-Average Exercise Price |
|||||||||||||||
| $6.75 – $8.44 |
40,653 | $ | 7.77 | 9.2 | 2,921 | $ | 7.79 | |||||||||||||
| 10.00 – 15.00 |
1,056,412 | 11.29 | 7.8 | 412,193 | 12.03 | |||||||||||||||
| 19.65 – 20.82 |
410,183 | 20.33 | 9.2 | 10,587 | 19.65 | |||||||||||||||
| 26.61 – 32.25 |
24,329 | 31.11 | 5.3 | 20,133 | 31.85 | |||||||||||||||
| 1,531,577 | $ | 13.93 | 8.3 | 445,834 | $ | 13.08 | ||||||||||||||
In determining the compensation cost of the stock options granted, the fair value of each option grant has been estimated on the date of grant using the Black-Scholes option pricing model. The assumptions used in these calculations are summarized as follows:
| Year Ended December 31, 2010 |
Year Ended December 31, 2009 |
Year Ended December 31, 2008 |
||||||||||
| Expected term of options granted |
5 years | 5 years | 5 years | |||||||||
| Expected volatility range |
50 | % | 50% - 58 | % | 58 | % | ||||||
| Range of risk-free interest rates |
2.0% - 2.3 | % | 1.7% - 2.3 | % | 2.8% - 3.3 | % | ||||||
| Expected dividend yield |
0 | % | 0 | % | 0 | % | ||||||
86
Motricity, Inc.
Notes to Consolidated Financial Statements
(amounts in thousands, except share data and per share amounts)
We calculate expected volatility for stock options using historical volatility for a peer group of 10 companies, as we believe the expected volatility will approximate historical volatility of the peer group. The risk-free interest rate for the expected terms of the stock options is based on the U.S. Treasury constant maturities in effect at the time of grant.
The weighted-average grant date fair value of stock options granted during the years ended December 31, 2010, 2009 and 2008 were $6.25, $7.05 and $6.30, respectively.
Stock-based compensation expense associated with stock options for the years ended December 31, 2010, 2009 and 2008 was $2,252, $2,344 and $688, respectively, and was included in datacenter and network operations, product development and sustainment, sales and marketing and general and administrative expenses.
At December 31, 2010, there was $5,230 of total unrecognized compensation costs, net of estimated forfeitures, related to unvested options that are expected to be recognized over a weighted-average period of 3.0 years.
Restricted Stock
Restricted stock awards have been granted to certain employees, non-employee directors and one non-employee. Vesting of all restricted shares granted between October 2006 and June 2010 were subject to a double trigger vesting requirement under the terms of the restricted stock agreement. The double trigger consisted of time-based vesting and occurrence of a liquidation event, defined as a qualified public offering or a qualified sale of the Company. Prior to the IPO, no compensation expense had been recognized related to the grant of these shares of restricted stock awards as a liquidation event was not considered probable. As a result of the IPO in June 2010, the trigger relating to the qualified public offering was fulfilled and the outstanding restricted stock awards are now subject solely to a time-base vesting restriction. The vesting of the shares is now considered probable; therefore, $17,474 relating to vested awards of stock-based compensation expense was recorded at the IPO date.
Restricted stock awards have voting and dividend rights upon grant and are then considered outstanding. When the restricted stock award is vested, it is then included in weighted-average common shares outstanding. These rights are forfeited should the stock not vest, although some employees were not required to be employed by the Company at the date of the liquidation event or the following lock-up period to receive the shares that vested based on the service period.
| Restricted Stock Awards |
Shares | |||
| December 31, 2009 |
1,909,049 | |||
| Granted |
202,665 | |||
| Lapse of restriction |
(1,283,580 | ) | ||
| Forfeited |
(83,236 | ) | ||
| December 31, 2010 |
744,898 | |||
As of December 31, 2009, restricted stock awards 24,509 shares of restricted stock that were not subject to the double trigger vesting requirement. The restriction on these shares lapsed in April 2010, as the shares vested based on service conditions.
87
Motricity, Inc.
Notes to Consolidated Financial Statements
(amounts in thousands, except share data and per share amounts)
In November and December 2010, 203,415 restricted stock units with a weighted-average grant-date fair value of $24.80 were granted to employees. Restricted stock units are not considered outstanding or included in weighted-average common shares outstanding until they are vested.
Stock-based compensation expense associated with restricted stock for the year ended December 31, 2010 was $20,724, and was included in datacenter and network operations, product development and sustainment, sales and marketing and general and administrative expenses. Additional stock-based compensation expense related to restricted stock awards and units of approximately $14,465 will be recognized over a weighted-average period of 2.7 years.
Warrants
Warrants were primarily issued in conjunction with financing rounds to investors or other parties and none are held by employees. During 2010, 292,198 redeemable preferred stock warrants were exercised, resulting in the net issuance of 29,316 shares of common stock. In conjunction with the IPO, the outstanding redeemable preferred stock warrants were automatically converted into common stock warrants when the underlying series of preferred stock were converted into shares of common stock. All outstanding warrants are exercisable and during 2010, 1,412,842 common stock warrants were exercised, resulting in the issuance of 522,860 shares of common stock. The following table summarizes the outstanding warrants to purchase common stock as of December 31, 2010:
| Number of Warrants |
Exercise Price Per Share |
Expiration Date | ||||||
| 108,498 | $ | 35.55 | February 23, 2012 | |||||
| 8,130 | 30.75 | December 30, 2012 | ||||||
| 427 | 30.75 | February 22, 2013 | ||||||
| 128,571 | 32.25 | May 16, 2014 | ||||||
| 20,000 | 32.25 | June 29, 2014 | ||||||
| 115,600 | 14.54 | September 30, 2014 | ||||||
| 1,774,008 | 14.54 | December 28, 2014 | ||||||
| 2,155,234 | ||||||||
88
Motricity, Inc.
Notes to Consolidated Financial Statements
(amounts in thousands, except share data and per share amounts)
10. Income Taxes
The following table presents the domestic and foreign components of the pre-tax loss from continuing operations and the income tax provision for the years ended December 31:
| 2010 | 2009 | 2008 | ||||||||||
| Income from continuing operations before tax: |
||||||||||||
| U.S. |
$ | (2,030 | ) | $ | (13,087 | ) | $ | (75,395 | ) | |||
| Foreign |
(2,895 | ) | (1,318 | ) | 343 | |||||||
| Total |
$ | (4,925 | ) | $ | (14,405 | ) | $ | (75,052 | ) | |||
| The income tax provision consisted of the following amounts: |
||||||||||||
| Current: |
||||||||||||
| U.S. |
$ | — | $ | (88 | ) | $ | — | |||||
| Foreign |
523 | — | — | |||||||||
| 523 | (88 | ) | — | |||||||||
| Deferred: |
||||||||||||
| U.S. |
1,567 | 1,984 | 1,776 | |||||||||
| Foreign |
— | — | — | |||||||||
| 1,567 | 1,984 | 1,776 | ||||||||||
| Total |
$ | 2,090 | $ | 1,896 | $ | 1,776 | ||||||
Significant components of our deferred tax assets and liabilities consist of the following as of December 31:
| 2010 | 2009 | 2008 | ||||||||||
| Domestic net operating loss carry forwards |
$ | 81,218 | $ | 80,251 | $ | 75,043 | ||||||
| Fixed assets |
(1,404 | ) | 3,132 | 7,822 | ||||||||
| Research and development credits |
5,286 | 5,037 | 4,125 | |||||||||
| Foreign net operating loss carry forwards |
1,721 | 399 | 79 | |||||||||
| Domestic capital loss carry forward |
246 | 108 | — | |||||||||
| Compensation accruals |
5,548 | 3,568 | 1,701 | |||||||||
| Deferred revenue |
(1,209 | ) | 1,988 | — | ||||||||
| Amortization of intangible assets |
(351 | ) | (1,458 | ) | (3,433 | ) | ||||||
| Allowance for bad debts |
155 | 94 | 345 | |||||||||
| Severance and restructuring |
32 | 63 | 57 | |||||||||
| Other accruals |
(444 | ) | (570 | ) | 175 | |||||||
| Deferred tax assets |
90,798 | 92,612 | 85,914 | |||||||||
| Valuation allowance |
(90,798 | ) | (92,612 | ) | (85,914 | ) | ||||||
| Net deferred tax assets |
$ | — | $ | — | $ | — | ||||||
| Amortization of goodwill |
(5,328 | ) | (3,760 | ) | (1,776 | ) | ||||||
| Net deferred tax liability |
$ | (5,328 | ) | $ | (3,760 | ) | $ | (1,776 | ) | |||
As of December 31, 2010, we provided a full valuation allowance against the net deferred tax assets as realization of these benefits was not more likely than not. The $1,814 decrease in the valuation allowance for the
89
Motricity, Inc.
Notes to Consolidated Financial Statements
(amounts in thousands, except share data and per share amounts)
period December 31, 2009 to December 31, 2010 was mainly related to a decrease in our state net operating losses due in part to expirations and changes in our state presence. The deferred tax asset includes net assets that were acquired in business combinations.
We had research and development tax credit carryforwards of $5.3 million at December 31, 2010 that will begin to expire in 2014. During 2009, we received a $43 refundable research and development credit for 2008 activity which decreased our credit carry forward. An additional $561 of research and development credits was recorded for 2010 activity.
As of December 31, 2010, we had domestic net operating loss carryforwards of $233.0 million for federal purposes and $41.9 million for state purposes. These net operating loss carryforwards begin to expire in varying amounts in 2019 for U.S. federal income tax purposes while the state carryforward periods are shorter causing some to expire in our current and subsequent years. The ultimate availability of the federal and state net operating loss carryforwards to offset future income may be subject to limitation under the rules regarding changes in stock ownership as determined by the Internal Revenue Code.
No provision for deferred U.S. income taxes has been made for consolidated foreign subsidiaries, because to the extent there are future earnings, we intend to permanently reinvest them in those foreign operations. If such earnings were not permanently reinvested, a deferred tax liability may be required.
Taxes computed at the statutory federal income tax rate of 34% are reconciled to the income tax provision as follows:
| 2010 | 2009 | 2008 | ||||||||||
| United States federal tax at statutory rate |
34.0 | % | 34.0 | % | 34.0 | % | ||||||
| Change in valuation allowance |
36.8 | (46.5 | ) | (38.0 | ) | |||||||
| State taxes (net of federal benefit) |
0.3 | 2.5 | 3.0 | |||||||||
| Tax credits earned |
11.4 | 6.9 | 1.5 | |||||||||
| Foreign rate differential |
(11.3 | ) | (0.9 | ) | (0.5 | ) | ||||||
| Effect of rate change |
(69.3 | ) | (1.0 | ) | 0.0 | |||||||
| Provision to return |
(25.2 | ) | (2.4 | ) | 1.8 | |||||||
| Non-deductible expenses and other |
(19.1 | ) | (5.8 | ) | (4.2 | ) | ||||||
| Effective rate |
(42.4 | )% | (13.2 | )% | (2.4 | )% | ||||||
We made income tax payments of $239 in 2010 and $0 in 2009 and 2008. The Company or one of its subsidiaries files income tax returns in the U.S. federal jurisdiction, and various state and foreign jurisdictions. With few exceptions, due to either the generation of net operating losses or because our subsidiaries have a relatively short corporate life, all tax years for which the Company or one of its subsidiaries filed a tax return remain open.
As of January 1, 2007, we adopted the authoritative accounting guidance prescribing a threshold and measurement attribute for the financial recognition and measurement of a tax position taken or expected to be taken in a tax return. The Company recognizes the financial statement impact of a tax position only after determining that the relevant tax authority would more likely than not sustain the position following an audit. For tax positions meeting the more-likely-than-not threshold, the amount recognized in the financial statements is the largest impact that has a greater than fifty percent likelihood of being realized upon ultimate settlement with the relevant tax authority. Upon adoption there was no cumulative effect adjustment to accumulated deficit. The current year activity did not have an impact on our consolidated financial statements.
90
Motricity, Inc.
Notes to Consolidated Financial Statements
(amounts in thousands, except share data and per share amounts)
11. Net Loss Per Share Attributable to Common Stockholders
Basic and diluted net loss per share attributable to common stockholders have been computed based on net loss and the weighted-average number of common shares outstanding during the applicable period. We calculate potentially dilutive incremental shares issuable using the treasury stock method and the if-converted method, as applicable. The treasury stock method assumes that the proceeds received from the exercise of stock options and warrants, as well as stock option and restricted stock expense yet to be recorded for unvested shares would be used to repurchase common shares in the market at the average stock price during the period. We have excluded options to purchase common stock, restricted stock, preferred stock and warrants to purchase common and redeemable preferred stock, as the potentially issuable shares covered by these securities are antidilutive. In addition, redeemable preferred stock has also been excluded from 2009 and 2008 because its conversion into common stock could not be determined without an initial public offering price or liquidation factor. The following table presents the antidilutive securities not included in net loss attributable to common stockholders:
| Year Ended December 31, | ||||||||||||
| 2010 | 2009 | 2008 | ||||||||||
| Options to purchase common stock |
1,531,577 | 1,225,460 | 1,219,544 | |||||||||
| Restricted stock |
948,313 | 1,884,539 | 1,028,769 | |||||||||
| Series H redeemable preferred stock |
2,347,152 | — | — | |||||||||
| Preferred stock |
— | 10,876,759 | 10,876,759 | |||||||||
| Warrants to purchase common stock |
2,155,234 | 2,973,911 | 2,973,911 | |||||||||
| Warrants to purchase redeemable preferred stock and common stock |
— | 292,198 | 292,198 | |||||||||
| Warrants to purchase redeemable preferred stock |
— | 8,919,591 | 8,919,591 | |||||||||
| Total securities excluded from net loss per share attributable to common stockholders |
6,982,276 | 26,172,458 | 25,310,772 | |||||||||
The following table sets forth the computation of basic and diluted net loss per share attributable to common stockholders for the period indicated:
| Year Ended December 31, | ||||||||||||
| 2010 | 2009 | 2008 | ||||||||||
| Net loss attributable to common stockholders |
$ | (20,308 | ) | $ | (40,257 | ) | $ | (100,454 | ) | |||
| Weighted-average common shares outstanding |
22,962,555 | 5,878,368 | 5,843,489 | |||||||||
| Net loss per share attributable to common stockholders—basic and diluted |
$ | (0.88 | ) | $ | (6.85 | ) | $ | (17.19 | ) | |||
12. Defined Contribution Plan
We maintain a defined contribution plan (the “401(k) Savings Plan”) for eligible employees. The 401(k) Savings Plan assets are held in trust and invested as directed by the plan participants, and shares of our common stock are not an eligible investment election. We provide a match on a specified portion of eligible employees’ contributions as approved by our board of directors. Historically, we have made matching contributions equal to 50% of the portion of contributions that do not exceed 6% of eligible pay. Our matching contributions, included in general and administrative expenses, totaled $706, $630 and $419 in 2010, 2009 and 2008, respectively.
91
Motricity, Inc.
Notes to Consolidated Financial Statements
(amounts in thousands, except share data and per share amounts)
13. Discontinued Operations
In 2007, we enacted a plan to exit our D2C business through sale of assets as we began to focus our strategy on providing mobile content solutions and services for the wireless industry. In connection with the strategy change, eReader, one of the D2C divisions, was sold for $2,500 during 2007, resulting in a loss on sale of $1,360, representing the excess of the carrying value over the proceeds. We received $2,200 during 2008 and $300 was collected in 2009. In June 2008, the remaining portions of the D2C business were sold for $2,500 to a related party investor and board member, resulting in a loss of $127. The board member resigned on June 3, 2008.
During 2008, as part of a business strategy reassessment initiated in 2007, we decided to exit M&E through a wind-down of its operations which was completed in September 2008. Operations of M&E have been classified as discontinued operations and reflected in loss from discontinued operations in the consolidated statements of operations.
The significant components of loss from discontinued operations for 2008, net of income taxes, are as follows:
| M&E | D2C | Year Ended December 31, 2008 |
||||||||||
| Revenue for discontinued operations |
$ | 1,194 | $ | 2,334 | $ | 3,528 | ||||||
| Net loss from discontinued operations |
$ | (571 | ) | $ | (501 | ) | $ | (1,072 | ) | |||
14. Related Party Transactions
Under the terms of the employment agreement with our Chief Executive Officer, we issued loans of $250 and $32 in 2004 for the costs of relocating to our headquarters in Durham, North Carolina. The loans carry an annual interest rate equal to the prime rate, with the applicable interest rate for the year set on January 1 of each year. Interest is payable annually, and the loans are repayable to the Company upon a liquidation event, including the sale or disposition of substantially all of our assets, the sale of more than 50% of the then outstanding common stock in a single transaction, or an initial public offering of our common stock. The outstanding loan balances, including accrued interest, was $345 at December 31, 2008 and were included in other assets on the consolidated balance sheets. On December 18, 2009, all amounts outstanding between us and the Chief Executive Officer, including the principal and accrued interest on the loans, were settled by the Chief Executive Officer through a transfer of 22,134 shares of common stock.
During 2008, in connection with the relocation of our headquarters to Bellevue, Washington, we paid a relocation services company to purchase, on our behalf, the Chief Executive Officer’s home in North Carolina for $1,983, plus administrative fees. As a result of market conditions, in the fourth quarter of 2008, we recorded a restructuring charge of $342 related to the home and an additional restructuring charge of $203 during 2009. The asset is recorded within assets held for sale on the consolidated balance sheets for $1,700 and $1,606 as of December 31, 2008 and 2009, respectively. In March 2010, the home was sold for net proceeds of $1,199, and a loss on the sale of $407 was recorded as restructuring expense.
During 2009, we purchased the home of our new Chief Operating Officer in order to facilitate his relocation to Bellevue, Washington. We purchased the home for $1,195, and as a result of market conditions we recorded an impairment charge of $317. In November 2009, the home was sold for net proceeds of $874.
92
Motricity, Inc.
Notes to Consolidated Financial Statements
(amounts in thousands, except share data and per share amounts)
15. Condensed Quarterly Financial Information (unaudited)
| Quarter Ended | ||||||||||||||||
| March 31, 2010 |
June 30, 2010 |
September 30, 2010 |
December 31, 2010 |
|||||||||||||
| (in thousands, except for per share amounts) | ||||||||||||||||
| Revenues |
$ | 29,080 | $ | 30,408 | $ | 37,886 | $ | 36,005 | ||||||||
| Operating expenses(1) |
29,888 | 45,325 | 33,976 | 32,364 | ||||||||||||
| Operating income (loss) |
(808 | ) | (14,917 | ) | 3,910 | 3,641 | ||||||||||
| Net income (loss) |
(1,533 | ) | (11,590 | ) | 3,256 | 2,852 | ||||||||||
| Net income (loss) attributable to common stockholders |
$ | (7,933 | ) | $ | (17,433 | ) | $ | 2,709 | $ | 2,349 | ||||||
| Net income (loss) per share attributable to common stockholders—basic and diluted |
$ | (1.38 | ) | $ | (1.95 | ) | $ | 0.07 | $ | 0.06 | ||||||
| (1) | Operating expenses for the quarter ended June 30, 2010 includes $17,474 of stock-based compensation expense related to the vesting of restricted stock as a result of the IPO. |
| Quarter Ended | ||||||||||||||||
| March 31, 2009 |
June 30, 2009 |
September 30, 2009 |
December 31, 2009 |
|||||||||||||
| (in thousands, except for per share amounts) | ||||||||||||||||
| Revenues |
$ | 23,276 | $ | 37,008 | $ | 28,089 | $ | 25,322 | ||||||||
| Operating expenses |
29,707 | 39,554 | 28,022 | 29,190 | ||||||||||||
| Operating income (loss) |
(6,431 | ) | (2,546 | ) | 67 | (3,868 | ) | |||||||||
| Net loss |
(6,971 | ) | (3,188 | ) | (1,792 | ) | (4,350 | ) | ||||||||
| Net loss attributable to common stockholders |
$ | (12,958 | ) | $ | (9,175 | ) | $ | (7,784 | ) | $ | (10,340 | ) | ||||
| Net loss per share attributable to common stockholders—basic and diluted |
$ | (2.20 | ) | $ | (1.55 | ) | $ | (1.31 | ) | $ | (1.79 | ) | ||||
16. Subsequent Events
Acquisition of Adenyo, Inc.
On January 31, 2011, we entered into an arrangement agreement (the “Arrangement Agreement”) with Adenyo, Inc., a corporation incorporated pursuant to the federal laws of Canada (“Adenyo”) and the other parties signatory thereto. Adenyo is a mobile marketing, advertising and analytics solutions provider with operations in the United States, Canada and France. Pursuant to the Arrangement Agreement, one of our wholly-owned subsidiaries will acquire all the outstanding common shares of Adenyo for an aggregate purchase price of approximately $100 million (plus a contingent “earn-out” payment of up to $50 million), subject to working capital and other customary adjustments, and Adenyo will become a wholly-owned subsidiary. We will pay no less than $50 million of the initial $100 million purchase price with cash consideration, and the remaining consideration will be payable in our discretion in cash, shares of Company common stock, or a mix of cash and shares. We expect to complete the acquisition of Adenyo in April 2011.
93
SCHEDULE II—VALUATION AND QUALIFYING ACCOUNTS
| Years Ended December 31, |
||||||||
| 2010 | 2009 | |||||||
| (In thousands) | ||||||||
| Tax Valuation Allowance: |
||||||||
| Beginning balance |
$ | 92,612 | $ | 85,914 | ||||
| Charged to net loss |
(1,813 | ) | 6,698 | |||||
| Charges utilized/write-offs |
— | — | ||||||
| Ending balance |
$ | 90,799 | $ | 92,612 | ||||
| Allowance for Doubtful Accounts: |
||||||||
| Beginning balance |
$ | 272 | $ | 997 | ||||
| Charged to costs and expenses |
327 | — | ||||||
| Charges utilized/write-offs |
(153 | ) | (725 | ) | ||||
| Acquired in acquisition |
— | — | ||||||
| $ | 446 | $ | 272 | |||||
94
| Item 9. | Changes in and Disagreements with Accountants on Accounting and Financial Disclosure. |
None.
| Item 9A. | Controls and Procedures. |
Evaluation of disclosure controls and procedures. Our management evaluated, with the participation of our Chief Executive Officer and our Chief Financial Officer, the effectiveness of our disclosure controls and procedures as of the end of the period covered by this annual report on Form 10-K. Based on this evaluation, our Chief Executive Officer and our Chief Financial Officer have concluded that our disclosure controls and procedures are effective to ensure that information we are required to disclose in reports that we file or submit under the Securities Exchange Act of 1934 is recorded, processed, summarized and reported within the time periods specified in Securities and Exchange Commission rules and forms and that such information is accumulated and communicated to the Company’s management, including its Chief Executive Officer and Chief Financial Officer, as appropriate, to allow timely decisions regarding required disclosure.
Changes in internal control over financial reporting. There was no change in our internal control over financial reporting that occurred during our latest fiscal quarter that has materially affected, or is reasonably likely to materially affect, our internal control over financial reporting.
Evaluation of internal control over financial reporting. This annual report does not include a report of management’s assessment regarding internal control over financial reporting or an attestation report of the company’s registered public accounting firm due to a transition period established by rules of the SEC for newly public companies.
| Item 9B. | Other Information. |
None.
95
PART III
| Item 10. | Directors, Executive Officers and Corporate Governance. |
The information required by this Item is incorporated by reference from the definitive proxy statement for our 2011 annual meeting of shareholders, which will be filed no later than 120 days after December 31, 2010.
Code of Ethics
We have a Code of Business Conduct and Ethics, which applies to all employees, officers and directors of Motricity, Inc. and its direct and indirect subsidiaries. Our Code of Business Conduct and Ethics meets the requirements of a “code of ethics” as defined by Item 406 of Regulation S-K, and applies to our Chief Executive Officer, Chief Financial Officer (who is both our principal financial and principal accounting officer), as well as all other employees. Our Code of Business Conduct and Ethics is posted on our website at www.motricity.com in the “Corporate Governance” section of our Investor Relations home page.
| Item 11. | Executive Compensation. |
The information required by this Item is incorporated by reference from the definitive proxy statement for our 2011 annual meeting of shareholders, which will be filed no later than 120 days after December 31, 2010.
| Item 12. | Security Ownership of Certain Beneficial Owners and Management and Related Stockholder Matters. |
The information required by this Item is incorporated by reference from the definitive proxy statement for our 2011 annual meeting of shareholders, which will be filed no later than 120 days after December 31, 2010.
| Item 13. | Certain Relationships, Related Transactions and Director Independence. |
The information required by this Item is incorporated by reference from the definitive proxy statement for our 2011 annual meeting of shareholders, which will be filed no later than 120 days after December 31, 2010.
| Item 14. | Principal Accountant Fees and Services. |
The information required by this Item is incorporated by reference from the definitive proxy statement for our 2011 annual meeting of shareholders, which will be filed no later than 120 days after December 31, 2010.
96
PART IV
| Item 15. | Exhibits and Financial Statement Schedules. |
1. Financial Statements
The following financial statements are submitted in Part II, Item 8 of this annual report:
2. Financial Statement Schedules
All financial statement schedules have been omitted because the required information is either included in the financial statements or the notes thereto or is not applicable.
3. Exhibits
The exhibits listed on the accompanying Exhibit Index are filed or incorporated by reference as part of this report.
97
SIGNATURES
Pursuant to the requirements of Section 13 or 15(d) of the Securities Exchange Act of 1934, as amended, the registrant has duly caused this report to be signed on its behalf by the undersigned, thereunto duly authorized in the city of Bellevue, state of Washington, on February 28, 2011.
| MOTRICITY, INC. | ||
| By: | /s/ Ryan K. Wuerch | |
| Ryan K. Wuerch Chief Executive Officer | ||
Pursuant to the requirements of the Securities and Exchange Act of 1934, the following persons on behalf of the registrant and in the capacities and on the dates indicted have signed this report below.
| Signature |
Title |
Date | ||
| /s/ Ryan K. Wuerch Ryan K. Wuerch |
Chief Executive Officer and Director (Principal Executive Officer) |
February 28, 2011 | ||
| /s/ Allyn P. Hebner Allyn P. Hebner |
Chief Financial Officer (Principal Financial and Principal Accounting Officer) |
February 28, 2011 | ||
| /s/ Lady Barbara Judge Lady Barbara Judge |
Chairman of the Board |
February 28, 2011 | ||
| /s/ Hunter C. Gary Hunter C. Gary |
Director |
February 28, 2011 | ||
| /s/ Brett Icahn Brett Icahn |
Director |
February 28, 2011 | ||
| /s/ Suzanne H. King Suzanne H. King |
Director |
February 28, 2011 | ||
| /s/ Brian Turner Brian Turner |
Director |
February 28, 2011 | ||
98
EXHIBIT INDEX
| EXHIBIT NO. |
DESCRIPTION | |
| 3.1 | Restated Certificate of Incorporation (incorporated by reference to Exhibit 3.1 to Motricity, Inc. Registration Statement on Form S-1/A, File No. 333-164471, filed June 15, 2010) | |
| 3.2 | Amended and Restated Bylaws (incorporated by reference to Exhibit 3.2 to Motricity, Inc. Registration Statement on Form S-1/A, File No. 333-164471, filed April 26, 2010) | |
| 4.1 | Amended and Restated Stockholders’ Agreement, dated as of October 15, 2007, among Motricity, Inc., certain subsidiaries, and the other parties thereto (incorporated by reference to Exhibit 4.1 to Motricity, Inc. Registration Statement on Form S-1, File No. 333-164471, filed January 22, 2010) | |
| 4.2 | Amended and Restated Registration Rights Agreement, dated as of October 15, 2007, among Motricity, Inc., certain subsidiaries, and the other parties thereto (incorporated by reference to Exhibit 4.2 to Motricity, Inc. Registration Statement on Form S-1, File No. 333-164471, filed January 22, 2010) | |
| 4.3 | Amendment No. 1 and Waiver to the Amended and Restated Registration Rights Agreement, dated as of April 13, 2010, among Motricity, Inc., certain subsidiaries, and the other parties thereto (incorporated by reference to Exhibit 4.3 to Motricity, Inc. Registration Statement on Form S-1/A, File No. 333-164471, filed May 14, 2010) | |
| 4.4 | Form of Registrant’s Common Stock Certificate (incorporated by reference to Exhibit 4.4 to Motricity, Inc. Registration Statement on Form S-1/A, File No. 333-164471, filed May 14, 2010) | |
| 4.5 | Form of Common Stock Warrant (incorporated by reference to Exhibit 4.5 to Motricity, Inc. Registration Statement on Form S-1/A, File No. 333-164471, filed May 14, 2010) | |
| 4.6 | Form of Warrant Issued to Eastward Capital Partners IV, L.P (incorporated by reference to Exhibit 4.7 to Motricity, Inc. Registration Statement on Form S-1/A, File No. 333-164471, filed May 14, 2010) | |
| 10.1 | Loan and Security Agreement, dated as of June 27, 2007, between Silicon Valley Bank and Motricity, Inc., as amended (incorporated by reference to Exhibit 4.4 to Motricity, Inc. Registration Statement on Form S-1, File No. 333-164471, filed January 22, 2010) | |
| 10.2 | Master Services Agreement, dated as of December 30, 2008, between GlobalLogic, Inc. and Motricity, Inc. (incorporated by reference to Exhibit 10.2 to Motricity, Inc. Registration Statement on Form S-1/A, File No. 333-164471, filed June 2, 2010) † | |
| 10.3 | Second Amended and Restated Wireless Services Agreement #00014249, dated as of July 22, 2005, between InfoSpace Mobile, Inc. and Cingular Wireless LLC, as amended (incorporated by reference to Exhibit 10.3 to Motricity, Inc. Registration Statement on Form S-1/A, File No. 333-164471, filed June 2, 2010) † | |
| 10.4 | Master Services Agreement Number TJR031606, dated as of September 14, 2006, between Motricity, Inc. and Cingular Wireless LLC, as amended (incorporated by reference to Exhibit 10.4 to Motricity, Inc. Registration Statement on Form S-1/A, File No. 333-164471, filed June 2, 2010) † | |
| 10.5 | WAP 2.0 Hosting Agreement, dated as of June 24, 2004, between Premium Wireless Services USA, Inc. d/b/a InfoSpace Mobile and Cellco Partnership d/b/a Verizon Wireless, as amended (incorporated by reference to Exhibit 10.5 to Motricity, Inc. Registration Statement on Form S-1/A, File No. 333-164471, filed June 2, 2010) † | |
99
| EXHIBIT NO. |
DESCRIPTION | |
| 10.6 | Amendment Number 9 to WAP 2.0 Hosting Agreement, dated as of June 24, 2004, dated as of November 8, 2010, between Motricity, Inc. and Cellco Partnership d/b/a Verizon Wireless (incorporated by reference to Exhibit 10.1 to Motricity, Inc. Quarterly Report on Form 10-Q, filed on November 3, 2010). | |
| 10.7 | Amendment Number 8 to WAP 2.0 Hosting Agreement, dated as of June 24, 2004, dated as of June 30, 2010, between Motricity, Inc. and Cellco Partnership d/b/a Verizon Wireless (incorporated by reference to Exhibit 10.3 to Motricity, Inc. Quarterly Report on Form 10-Q, filed on August 6, 2010). | |
| 10.8 | Amendment Number 7 to WAP 2.0 Hosting Agreement, dated as of June 24, 2004, dated as of March 29, 2010, between Motricity, Inc. and Cellco Partnership d/b/a Verizon Wireless (incorporated by reference to Exhibit 10.2 to Motricity, Inc. Quarterly Report on Form 10-Q, filed on August 6, 2010). | |
| 10.9 | Office Lease, dated as of December 21, 2007, between WA—Three Bellevue Center, LLC and Motricity, Inc. (incorporated by reference to Exhibit 10.5 to Motricity, Inc. Registration Statement on Form S-1/A, File No. 333-164471, filed April 26, 2010) † | |
| 10.10 | Employment Offer Letter, dated as of May 20, 2009, between Motricity, Inc. and Chris Dorr (incorporated by reference to Exhibit 10.6 to Motricity, Inc. Registration Statement on Form S-1, File No. 333-164471, filed January 22, 2010) # | |
| 10.11 | Employment Offer Letter, dated as of May 22, 2009, between Motricity, Inc. and Jim Ryan (incorporated by reference to Exhibit 10.7 to Motricity, Inc. Registration Statement on Form S-1, File No. 333-164471, filed January 22, 2010)# | |
| 10.12 | Employment Offer Letter, dated as of January 7, 2009, between Motricity, Inc. and Jim Smith (incorporated by reference to Exhibit 10.8 to Motricity, Inc. Registration Statement on Form S-1, File No. 333-164471, filed January 22, 2010)# | |
| 10.13 | Employment Offer Letter, dated as of March 6, 2009, between Motricity, Inc. and Allyn P. Hebne r (incorporated by reference to Exhibit 10.9 to Motricity, Inc. Registration Statement on Form S-1, File No. 333-164471, filed January 22, 2010)# | |
| 10.14 | Employment Offer Letter, dated as of August 8, 2008, between Motricity, Inc. and Richard E. Leigh, Jr. (incorporated by reference to Exhibit 10.10 to Motricity, Inc. Registration Statement on Form S-1, File No. 333-164471, filed January 22, 2010)# | |
| 10.15 | Second Amended and Restated Employment Agreement, as amended, dated as of January 1, 2008, between Motricity, Inc. and Ryan K. Wuerch (incorporated by reference to Exhibit 10.11 to Motricity, Inc. Registration Statement on Form S-1, File No. 333-164471, filed January 22, 2010)# | |
| 10.16 | Amended and Restated Executive Employment Agreement, dated as of January 19, 2010, between Motricity, Inc. and Ryan K. Wuerch (incorporated by reference to Exhibit 10.12 to Motricity, Inc. Registration Statement on Form S-1, File No. 333-164471, filed January 22, 2010)# | |
| 10.17 | Option Agreement, dated as of March 26, 2010, between Motricity, Inc. and Ryan K. Wuerch (incorporated by reference to Exhibit 10.14 to Motricity, Inc. Registration Statement on Form S-1/A, File No. 333-164471, filed June 2, 2010)# | |
| 10.18 | Form of First Amendment to Employment Offer Letter Agreement of Executive Officers (incorporated by reference to Exhibit 10.15 to Motricity, Inc. Registration Statement on Form S-1/A, File No. 333-164471, filed June 2, 2010)# | |
100
| EXHIBIT NO. |
DESCRIPTION | |
| 10.19 | Amended and Restated 2004 Stock Incentive Plan of Motricity, Inc., as amended through August 4, 2005 (incorporated by reference to Exhibit 10.13 to Motricity, Inc. Registration Statement on Form S-1, File No. 333-164471, filed January 22, 2010)# | |
| 10.20 | Motricity, Inc. 2010 Amended and Restated Corporate Incentive Plan (incorporated by reference to Exhibit 10.18 to Motricity, Inc. Registration Statement on Form S-1/A, File No. 333-164471, filed June 2, 2010)#† | |
| 10.21 | Motricity, Inc. 2010 Long-Term Incentive Plan (incorporated by reference to Exhibit 10.16 to Motricity, Inc. Registration Statement on Form S-1/A, File No. 333-164471, filed April 26, 2010)# | |
| 10.22 | Form of Stock Option Agreement under 2004 Plan (incorporated by reference to Exhibit 10.17 to Motricity, Inc. Registration Statement on Form S-1/A, File No. 333-164471, filed April 26, 2010)# | |
| 10.23 | Form of Restricted Stock Grant Agreement under 2004 Plan (incorporated by reference to Exhibit 10.18 to Motricity, Inc. Registration Statement on Form S-1/A, File No. 333-164471, filed April 26, 2010)# | |
| 10.24 | Form of Motricity, Inc. Indemnification Agreement (incorporated by reference to Exhibit 10.19 to Motricity, Inc. Registration Statement on Form S-1, File No. 333-164471, filed January 22, 2010)# | |
| 10.25 | Form of Stock Option Agreement under the 2010 LTIP (incorporated by reference to Exhibit 10.23 to Motricity, Inc. Registration Statement on Form S-1/A, File No. 333-164471, filed June 2, 2010)# | |
| 10.26 | Certificate of Amendment to the 2004 Stock Incentive Plan of Motricity, Inc. (incorporated by reference to Exhibit 10.26 to Motricity, Inc. Registration Statement on Form S-1/A, File No. 333-164471, filed June 2, 2010)# | |
| 10.27 | Consent and Amendment Agreement, dated June 7, 2010, between Silicon Valley Bank and Motricity, Inc. (incorporated by reference to Exhibit 10.28 to Motricity, Inc. Registration Statement on Form S-1/A, File No. 333-164471, filed June 16, 2010) | |
| 10.28 | Master Service Agreement, dated as of October 1, 2010, between Motricity Inc. and AT&T Services, Inc. (incorporated by reference to Exhibit 10.2 to Motricity, Inc. Quarterly Report on Form 10-Q, filed on November 3, 2010) | |
| 10.29 | Service Exhibit No. 20100607.090.S.002, dated as of October 1, 2010, between Motricity, Inc. and AT&T Services, Inc. (incorporated by reference to Exhibit 10.3 to Motricity, Inc. Quarterly Report on Form 10-Q, filed on November 3, 2010) | |
| 10.30 | Form of Restricted Stock Agreement under the 2010 LTIP (incorporated by reference to Exhibit 10.1 to Motricity, Inc. Quarterly Report on Form 10-Q, filed on August 6, 2010) # | |
| 10.31 | Advisory Agreement, dated May 5, 2010, between Motricity, Inc. and Advanced Equities, Inc. (incorporated by reference to Exhibit 10.25 to Motricity, Inc. Registration Statement on Form S-1/A, File No. 333-164471, filed on June 7, 2010) | |
| 10.32 | Amendment to Advisory Agreement dated May 5, 2010, dated June 14, 2010, between Motricity, Inc. and Advanced Equities, Inc. (incorporated by reference to Exhibit 10.27 to Motricity, Inc. Registration Statement on Form S-1/A,File No. 333-164471, filed on June 15, 2010) | |
| 10.33 | Omnibus Amendment Agreement, dated January 20, 2010, between Motricity, Inc. and Advanced Equities, Inc. (incorporated by reference to Exhibit 10.21 to Motricity, Inc. Registration Statement on Form S-1/A, File No. 333-164471, filed on March 8, 2010) | |
101
| EXHIBIT NO. |
DESCRIPTION | |
| 10.34 | Arrangement Agreement, dated January 30, 2011, among Adenyo Inc., 7761520 Canada Inc. and Motricity, Inc. and Michael Orr, as shareholder representative (incorporated by reference to Exhibit 2.1 to Motricity, Inc. Current Report on Form 8-K, filed February 1, 2011) | |
| 10.35 | Development Work Agreement, dated May 18, 2010, between PT XL Axiata Tbk. and Motricity, Inc.† | |
| 10.36 | Software License and Maintenance Agreement, dated May 18, 2010, between PT XL Axiata Tbk. and mCore International, Inc.† | |
| 10.37 | System Supply, Integration and Managed Services Agreement, dated August 31, 2010, between PT XL Axiata Tbk. and PT Motricity Indonesia† | |
| 21.1 | List of Subsidiaries (incorporated by reference to Exhibit 21.1 to Motricity, Inc. Registration Statement on Form S-1/A, File No. 333-164471, filed on May 6, 2010) | |
| 23.1 | Consent of PricewaterhouseCoopers LLP | |
| 31.1 | Certification of Ryan K. Wuerch pursuant to Section 302 of the Sarbanes-Oxley Act of 2002. | |
| 31.2 | Certification of Allyn P. Hebner pursuant to Section 302 of the Sarbanes-Oxley Act of 2002. | |
| 32.1 | Certification pursuant to 18 U.S.C. Section 1350, as adopted pursuant to Section 906 of the Sarbanes-Oxley Act of 2002 – Chief Executive Officer. | |
| 32.2 | Certification pursuant to 18 U.S.C. Section 1350, as adopted pursuant to Section 906 of the Sarbanes-Oxley Act of 2002 – Chief Financial Officer. | |
| # | Indicates a management contract or compensatory plan or arrangement. |
| † | Confidential treatment has been requested for certain provisions of this Exhibit pursuant to Exchange Act Rule 24b-2. These provisions have been omitted from the filing and submitted separately to the Securities and Exchange Commission. |
102