Attached files
| file | filename |
|---|---|
| 8-K - FORM 8-K - Energy Future Holdings Corp /TX/ | d8k.htm |
 EFH
Corp. 2011 JPMorgan High Yield & Leveraged Finance Conference
Discussion Deck
Exhibit 99.1
February 28
th
-
March 2
nd |
 1
Safe Harbor Statement
This
presentation
contains
forward-looking
statements,
which
are
subject
to
various
risks
and
uncertainties.
Discussion
of
risks
and
uncertainties
that
could
cause
actual
results
to
differ
materially
from
management's
current
projections,
forecasts,
estimates
and
expectations
is
contained
in
EFH
Corp.'s
filings
with
the
Securities
and
Exchange
Commission
(SEC).
Regulation
G
This
presentation
includes
certain
non-GAAP
financial
measures.
A
reconciliation
of
these
measures
to
the
most
directly
comparable
GAAP
measures
is
included
in
the
appendix
to
this
presentation. |
 2
Table of Contents
I.
Energy Future Holdings (EFH)
Overview…………………… 3 -
4
II.
Luminant
Overview…………………………...……………....
5
-
24
III.
TXU
Energy
Overview.……………………………………….
25
-
27
IV.
Oncor
Overview.………………………………………………
28 -
33
V.
EFH
Background……………………………………………...
34
-
36
VI.
Appendix
–
Reg
G…………………………………………….
37
-
41 |
 3
2
nd
largest competitive
electric generator in US
Largest lignite/coal and
nuclear baseload
generation fleet in Texas
Low-cost lignite reserves
Largest T&D utility in
Texas
Leader in smart-grid
development
Constructive regulatory
regime
Largest retail
electricity provider in
Texas
Strong customer value
proposition
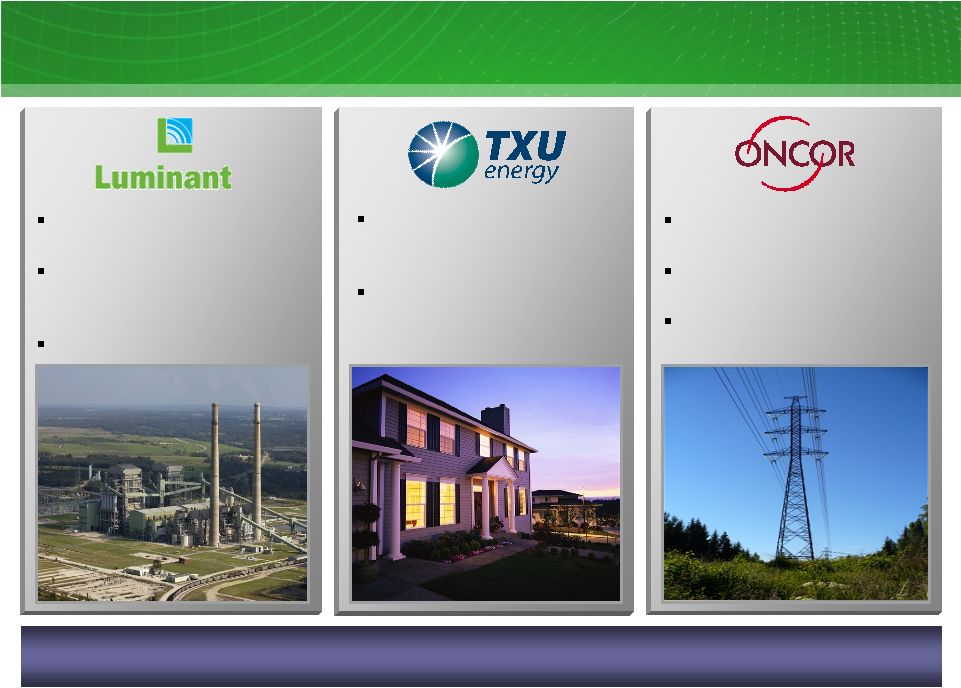
The largest power generator, retail electricity provider and transmission &
distribution utility in Texas.
Energy Future Holdings Overview |
 4
4
2010 FY Highlights
Monetized non-core assets (DFW
Midstream, Permian water rights)
13 of 14 CCNs
obtained for CREZ
transmission construction project
Operational
achievements
Solid safety performance
Oak Grove 1 & 2 COD¹
Baseload
plants achieved solid
performance
New ERCOT Summer and Winter
load peaks
Top decile
nuclear industry
performance for reliability and cost
Liability management program
–
Reduced net debt by $2 billion
–
Extended $5 billion of maturities
–
Projected interest savings of $1
billion thru 2014
New
TXUE
brand
launch
-
Brighten
Over 1.5 million AMS meters installed
through December 2010
ERCOT nodal transition
Reclamation program planted 1.2
million trees offsetting 26 million tons
of CO2
Competitive business generated ~$600
million in cash flows
Settled
1997
–
2002
IRS
audit
Prevailed in Alcoa lawsuit
Financial
achievements
Strategic
initiatives
1
COD = Commercial Operations Date
New nuclear development
–
CP3/4 licensing progress
TXU Energy retail electric provider
licensed in Pennsylvania |
 5 |
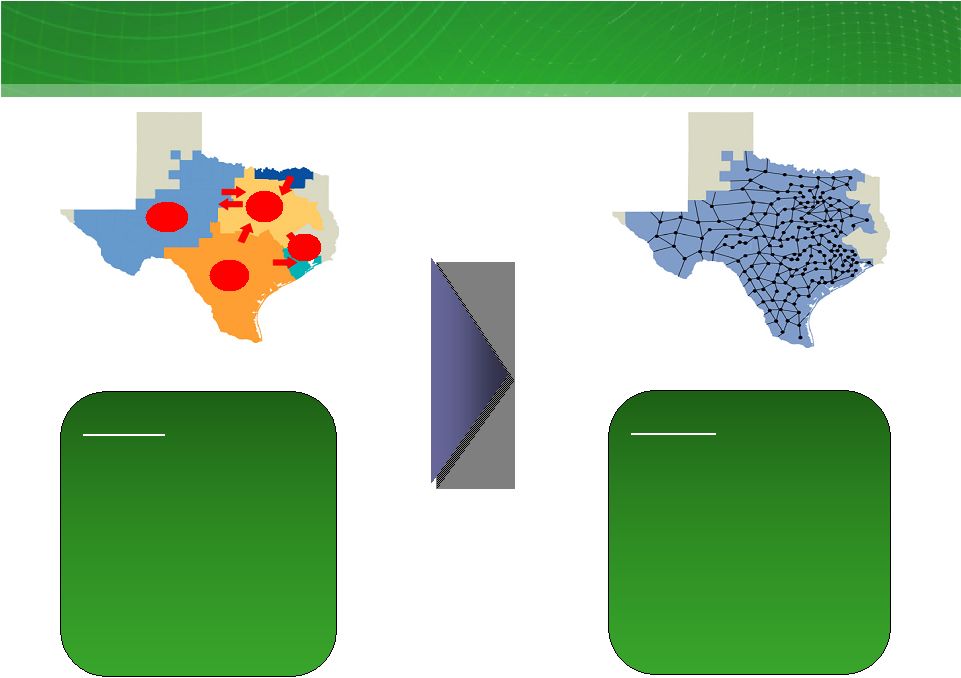
 6
Luminant
Generation Facilities
Generation capacity in ERCOT
At 12/31/10; MW
HOUSTON
SAN ANTONIO
AUSTIN
WACO
MIDLAND
LUFKIN
ODESSA
DALLAS
TYLER
FORT
WORTH
Power Plants
Natural gas
Coal
Coal, new build
Nuclear
Nuclear
2,300 MW
Coal
8,017
Natural gas¹
5,110
Total
15,427 MW
1
Includes four mothballed units (1,655 MW) not currently available for dispatch and eight units (1,268
MW) currently operated for unaffiliated parties. |
 15%
2%
57%
26%
Business Profile
Generation
Largest baseload
generation fleet in ERCOT with
around-the-clock assets that dispatch at low heat rate
levels
Top decile
nuclear plant production and cost
performance
Top quartile coal fleet production and cost performance
Liquidity-light natural gas hedging program designed to
provide cash flow security (~62% hedged for Jan 1, 2011
–
Dec 31, 2014)
Comanche Peak expansion through Mitsubishi
partnership may provide a low-cost nuclear growth
option
14%
33%
38%
15%
Coal
Gas
Nuclear
Generating Capacity1
as of 12/31/10
Total Net Generation2, 2010
15,427 MW
76,631 GWh
New Build-Coal
Safety
Wholesale power prices
Natural gas hedge program
Baseload
reliability
Mining operations
Fuel costs
O&M costs
Operational excellence/continuous improvement
Competitive market
Value Drivers
1.33
1.35
2.71
1.74
2008-2010 Average
2013E
Lignite
Delivered PRB
Lignite vs. PRB Fuel Cost ($/MMBtu) Note: Total lignite and PRB fuel expense excluding
emissions. Luminant
is the largest power generator in Texas.
Luminant
Business Summary
7
1
Includes four mothballed units (1,655 MW) not currently available for dispatch and eight units (1,268
MW) currently operated for unaffiliated parties. 2
Excludes purchased power |
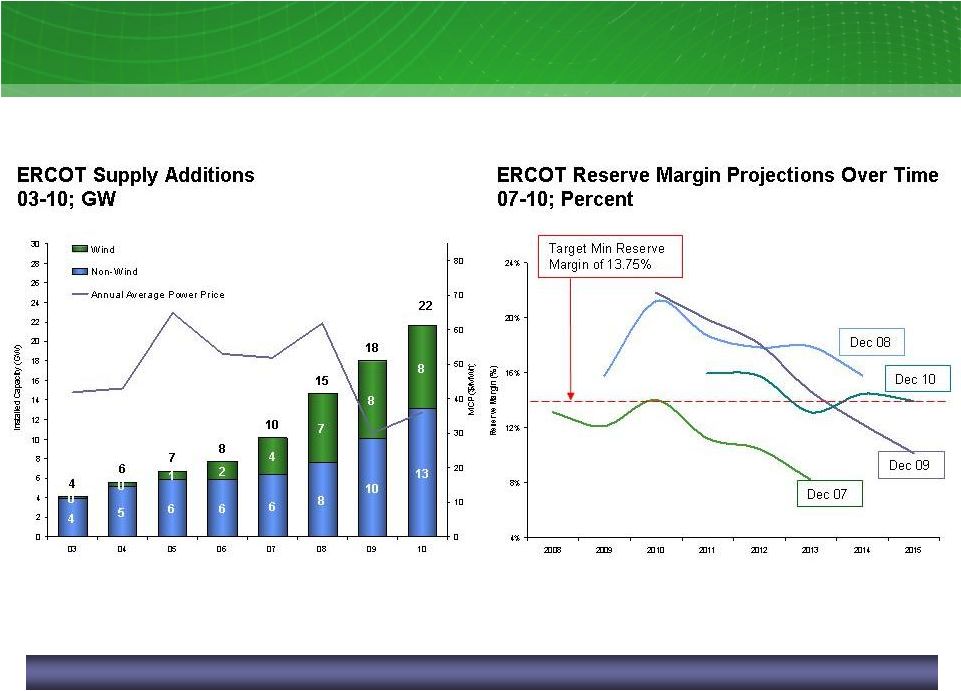 ERCOT
Fundamental Supply and Demand Dynamics Latest forecast shows an increase in
minimum reserve margin 8 |
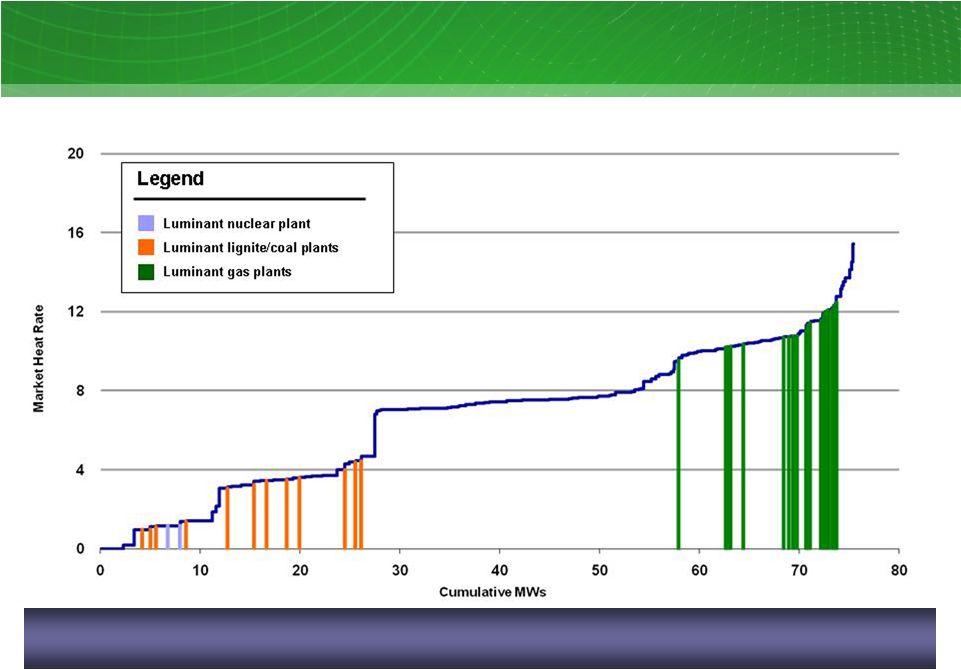 9
1
Summer 2011 ERCOT supply stack -
indicative
ERCOT Supply Stack
Sources: ERCOT and Energy Velocity
®, Ventyx Luminant
plants are typically on the “book-ends”
of the supply stack. ERCOT’s
marginal price is set by natural gas in most hours of the year.
|
  10
Zonal to Nodal Market Transition
N
W
S
H
ZONAL
•
Portfolio Dispatch
•
4 Market Clearing Prices for
Energy (MCPE)
•
Congestion resolved at zonal
level; local congestion uplifted to
all load in that area
NODAL
•ERCOT Dispatch (unit specific)
•Locational Marginal Pricing
(LMP) leads to ~550 Settlement
Point Prices
-
Generation Bus Nodes
-
Hubs
-
Load Zone
•“Day Ahead Market”
•Congestion will be managed on
a local basis |
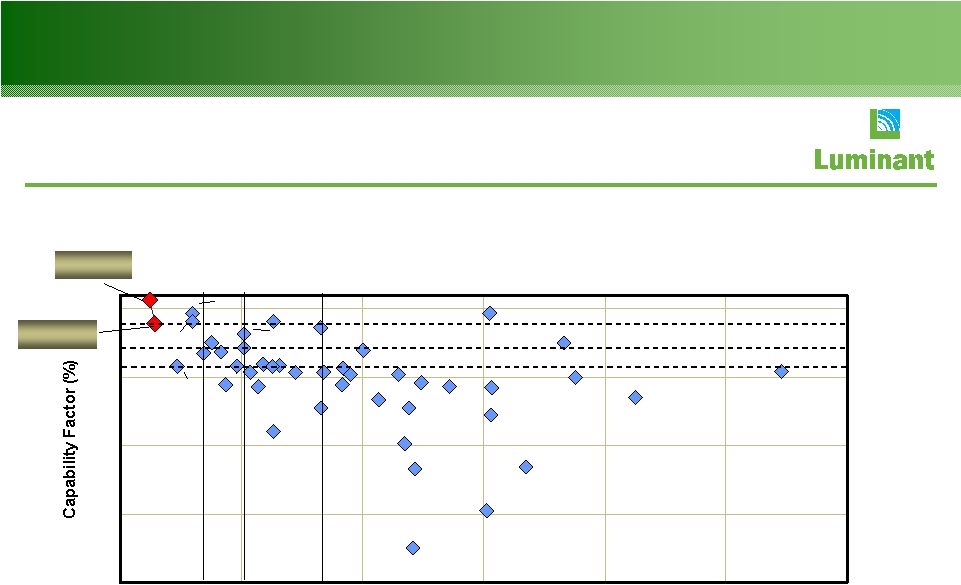 Nuclear Reliability vs. Cost Benchmarks
75
80
85
90
95
10
15
20
25
30
35
40
$/MWh
1
Benchmarking peer set defined as 18 month fuel cycle U.S. nuclear plants.
2
Source: Electric Utility Cost Group (EUCG) May 2010 release for Cost and World
Association of Nuclear Operators (WANO) for Capability Factors. Braidwood
Byron
STP
Decile
Quartile
Median
Decile
Quartile
Median
Vogtle
CPNPP 06-08
94.1
CPNPP 09
95.6
Nuclear capability factor and O&M cost performance
07-09; percent and $/MWh
11 |
 12
0
10
20
30
40
50
60
70
2003
2004
2005
2006
2007
2008
2009
2010
EFH
Industry
16
17
18
19
20
2003
2004
2005
2006
2007
2008
2009
2010
0
1
2
3
EFH
# of Refueling Outages
Impact of Refueling Outages
Avg.
nuclear
fleet
refueling
outage
duration
1
-
18
month
cycle
units
03-10; days
Nuclear fleet output
03-10; thousand GWh
Nuclear Refueling Cycle
18 months
Duration: ~19-26 days
2010 Refueling Outage Impact
2010 outage was 24 days
3
rd
shortest Spring 2010 outage in the
industry
2011 Refueling Outage Impact
2011 outages planned at 20 days (Unit 1)
and 22 days (Unit 2)
1
2005
and
2008
were
dual
refueling
outage
years;
this
graph
shows
the
average
outage
duration
for
each
of
those
years.
2
Industry based on early release data from Electric Utility Cost Group (EUCG)
2
World record steam
generator outage
World record steam
generator outage |
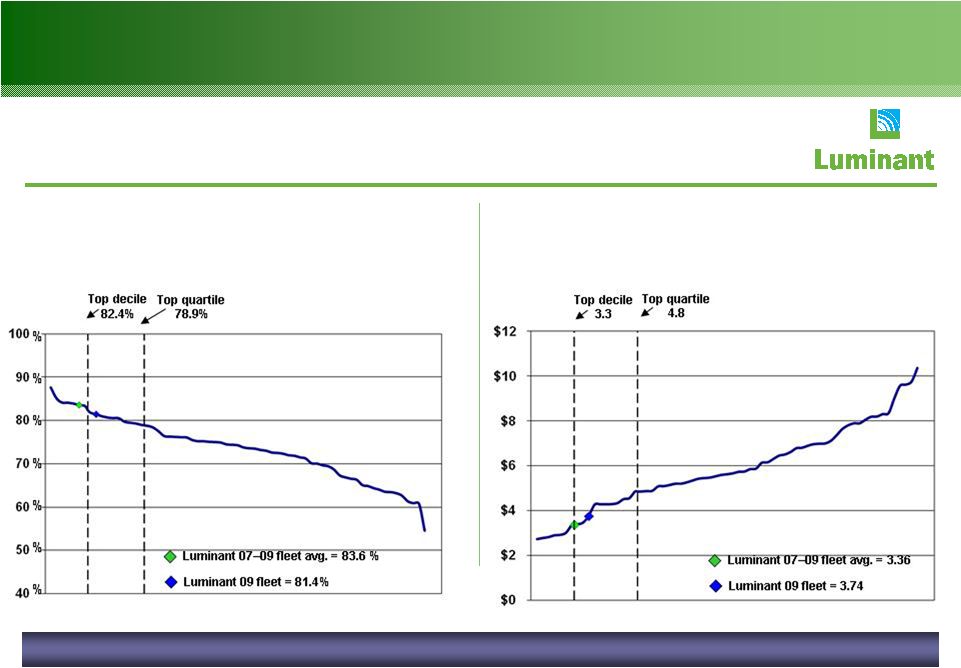 Source: GKS
Luminant
vs. US coal fleet net capacity
factors¹
Percent
Luminant
vs. US coal fleet O&M
$/MWh
Luminant
has industry leading performance relative to other coal-fueled generators.
High-Performance Coal Operator
13
1
Benchmarking net capacity factors based on GADS. Luminant is legacy lignite/coal fleet only and based
on net capacity of 5,837 MW. |
 14
High-Performance Coal Operator
1
Based on unscrubbed
merchant units greater than 450 MW. Industry total excludes EFH
plants. EFH is legacy lignite/coal fleet only and based on net capacity of 5,837 MW.
2
Includes merchant units greater than 450 MW.
Source: Velocity Suite (Energy Velocity)
Consistent high performance
0.04 |
 15
Coal Fleet Output
Coal
fleet
output
1,2
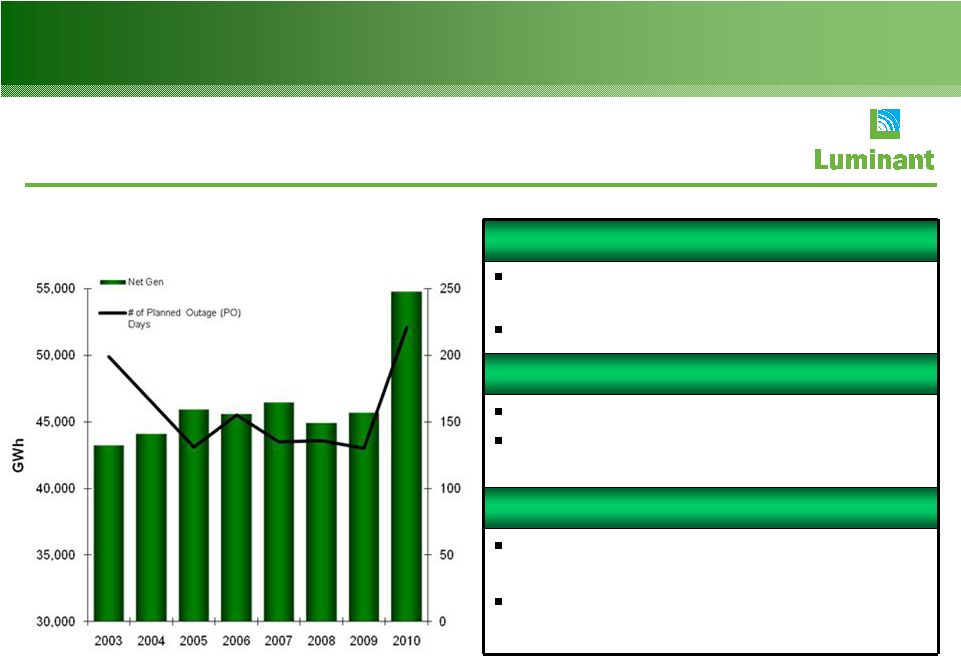
03-10; GWh
Coal Fleet Planned Outage Cycle
3 or 4 year overhaul cycle depending on
unit
Duration is scope dependent
2009 Planned Outage Impact
2009 reflects 130 planned outage days
2009 average major outage duration was
45 days
2010 Planned Outage Impact
2010 reflects 221 planned outage days
(41 at new units)
2010 average major outage duration was
48 days
1
2009 includes 1,443 GWh of new build generation (Sandow 5 and Oak Grove 1 units).
2
2010 includes 11,384 GWh of new build generation and 41 planned outage days (Sandow 5, Oak Grove
1 & 2 units). |
 16
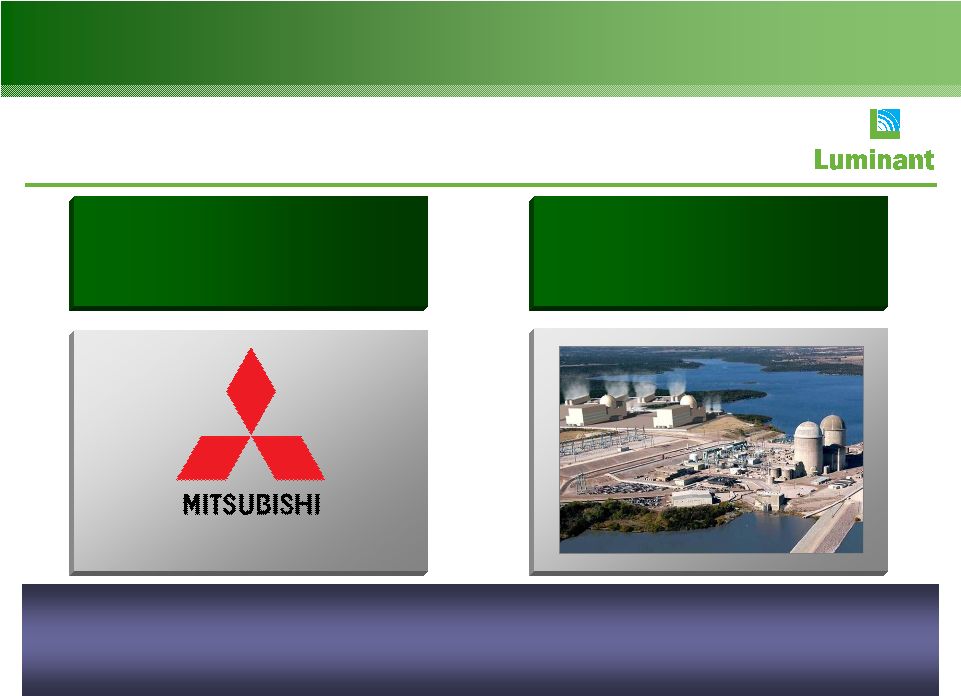
Nuclear Expansion Opportunity
HEAVY INDUSTRIES, LTD.
…partnering with
…partnering with
a world-class
a world-class
equipment provider…
equipment provider…
Luminant
is pursuing the licensing and potential construction of a next-
generation nuclear facility by
…
…
…
and leveraging favorable
and leveraging favorable
site characteristics and
site characteristics and
operational expertise.
operational expertise.
The proposed expansion includes two nuclear generation units each having
approximately
1,700
MW
(gross)
capacity.
Luminant/EFH
have
been
working
with
the
Department of Energy loan guarantee program office and its Japanese counterpart
(METI) to secure construction financing. |
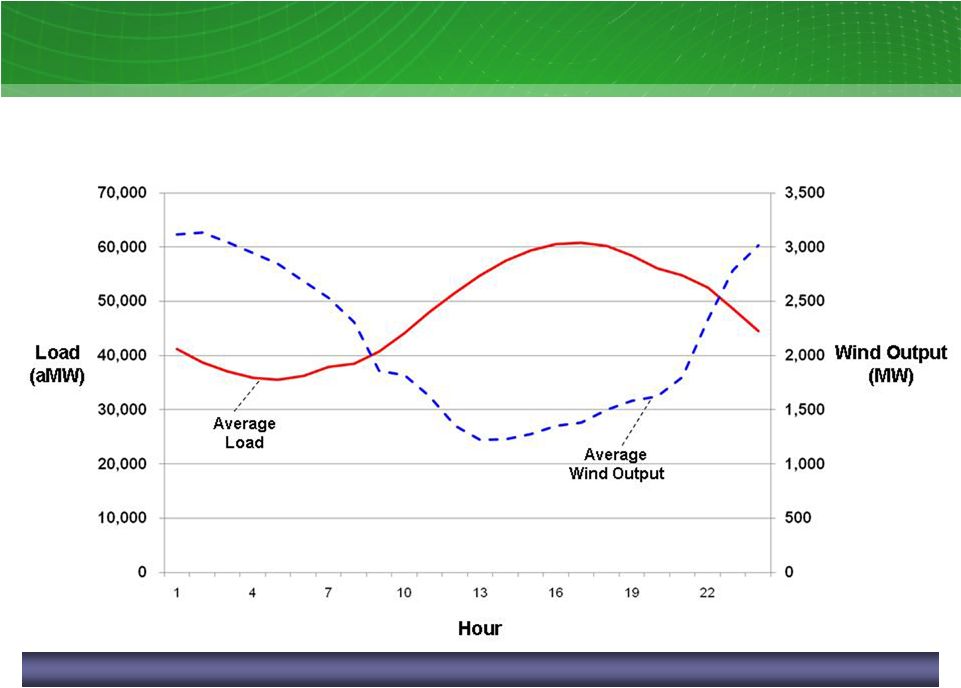 17
ERCOT Average Daily Profile of Load and Wind
Source: ERCOT
ERCOT average daily profile of load and wind output
August 10; mixed measures
Wind operating characteristics necessitate additional resources for
reliability. |
 18
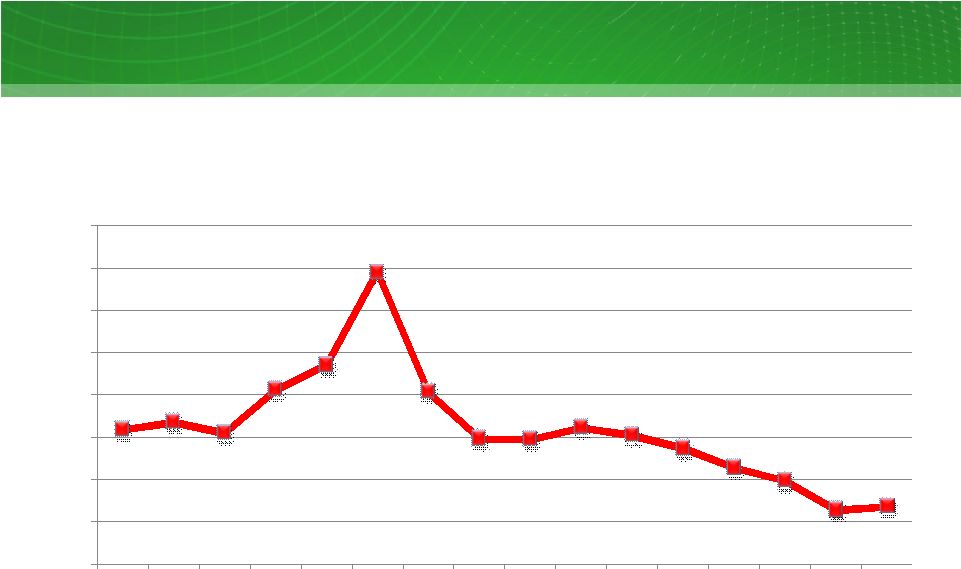
Texas Wind Additions
0
2,000
4,000
6,000
8,000
10,000
12,000
Pre 01
01
02
03
04
05
06
07
08
09
10
11E
12E
RPS
1
Target
of 2,880 MW
by 2009
RPS
1
Target
of 5,880 MW
by 2015
CREZs
Designated
ERCOT SGIA²
Cumulative wind capacity additions in Texas
Pre-01 -
10;11E -
12E; MW
1
Renewable Portfolio Standard
2
Signed Generation Interconnect Agreement
Source: ERCOT – January 2011 System Planning Report to the Reliability and Operations
Subcommittee |
 Historical 2014 Forward Natural Gas Prices
Historical 2014 Forward Houston Ship Channel (HSC) Gas Prices
Q1’07-
Q4’10; $/MMBtu
$7.18
$7.37
$7.10
$8.12
$8.71
$10.92
$8.09
$6.96
$6.95
$7.23
$7.05
$6.73
$6.27
$5.97
$5.28
$5.36
$4
$5
$6
$7
$8
$9
$10
$11
$12
Q1'07
Q2'07
Q3'07
Q4'07
Q1'08
Q2'08
Q3'08
Q4'08
Q1'09
Q2'09
Q3'09
Q4'09
Q1'10
Q2'10
Q3'10
Q4'10
19 |
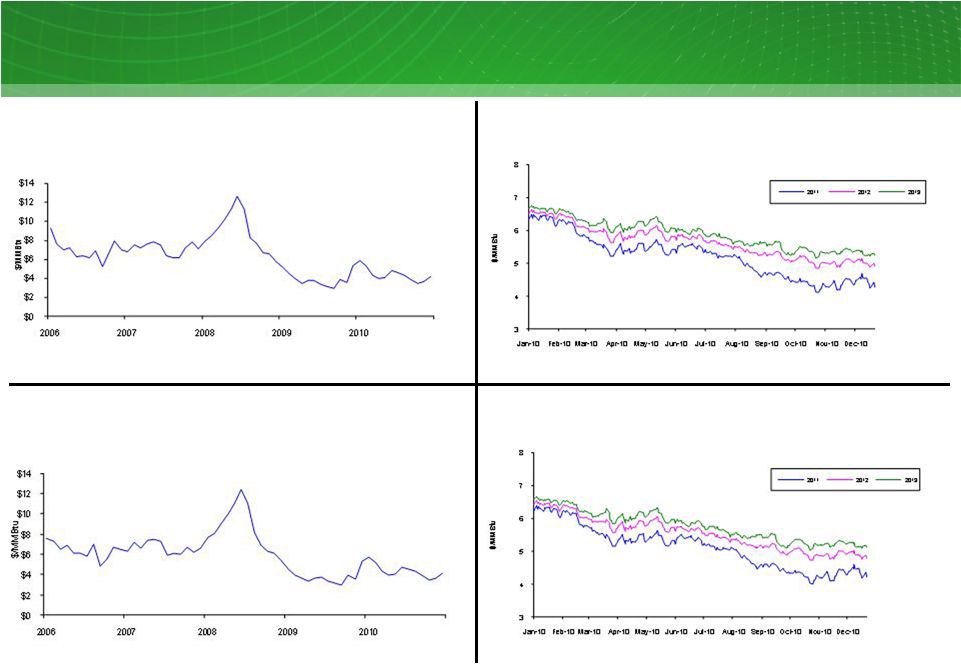 20
20
Houston
Ship
Channel
settled
natural
gas
prices
1
Jan 06-Dec 10; $/MMBtu
Market Price Snapshot
NYMEX
forward
natural
gas
prices
2
2011-2013; $/MMBtu
NYMEX
settled
natural
gas
prices
1
Jan 06-Dec10; $/MMBtu
Houston
Ship
Channel
forward
natural
gas
prices
2
2011-2013; $/MMBtu
1
Settled prices are monthly averages
2
Forward prices reflect market observable quotes during the 12 months ended Dec 31, 2010 for the
following delivery periods: 2011, 2012 and 2013 |
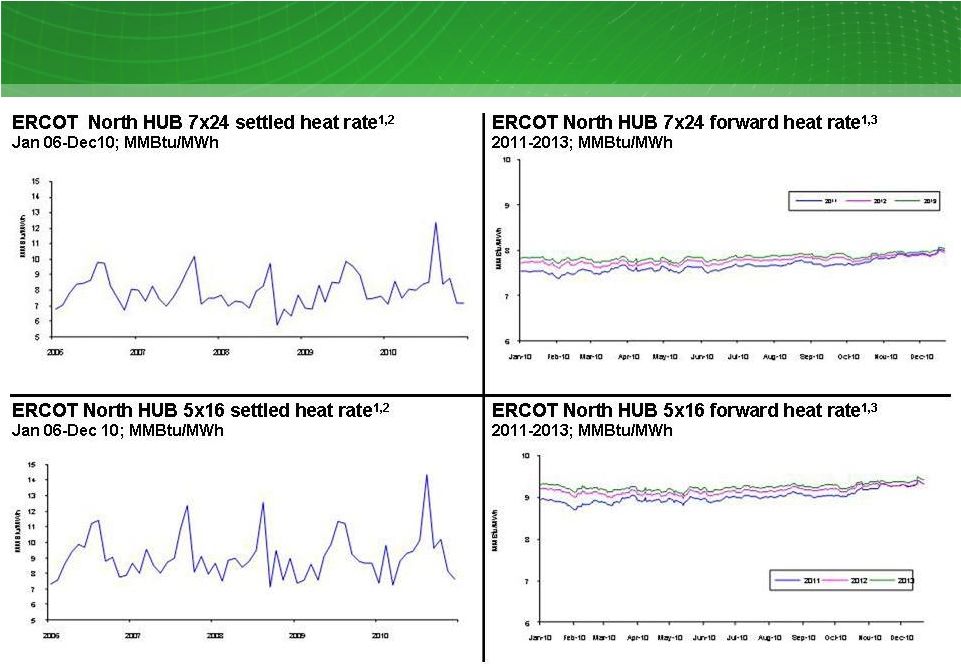 21
21
Market Price Snapshot
1
Market heat rate calculated by dividing 7x24 and 5x16 power prices, as appropriate,
by Houston Ship Channel natural gas prices 2
Settled prices are monthly averages
3
Forward prices reflect market observable quotes during the 12 months ended Dec 31,
2010 for the following delivery periods: 2011, 2012 and 2013 |
 2010
and Beyond: Environmental Regulatory Timeline 22
The environmental regulatory framework has come increasingly to the forefront with
the failure of climate/RES legislation and recent EPA actions
|
 23
EPA-Urged New Controls Based on Proposed New EPA Rules
Rule
Targeted Emission or
Objective
Potential Control
Required
Mercury MACT
1
/HAPS rule
Mercury and other
“hazardous air pollutants”
(HAPs)
Baghouse
+ Scrubber (FGD²)
+ ACI³
Clean Air Transport
NOx
and SO
2
SCR (NOx) and Scrubber
(FGD²
) (SO 2
)
NAAQS revisions
Ozone NAAQS Revision
NOx
SCR
4
SO2 NAAQS Revision
SO
2
Scrubber (FGD²)
PM NAAQS
Particulate Matter (PM)
Scrubber (FGD²)
316(b) -
Water
Reduce fish impingement at
cooling water intakes
Cooling towers
Coal Combustion Byproducts
Fly ash, bottom ash, and
scrubber & cooling tower
byproducts
New handling and landfills
1
MACT refers to the maximum achievable control technology.
2
FGD refers to flue gas desulfurization systems that reduce SO2 emissions with
co-benefits of other emissions reductions. 3
ACI refers to activated carbon injection systems that reduce mercury
emissions. 4
SCR refers to selective catalytic reduction systems.
|
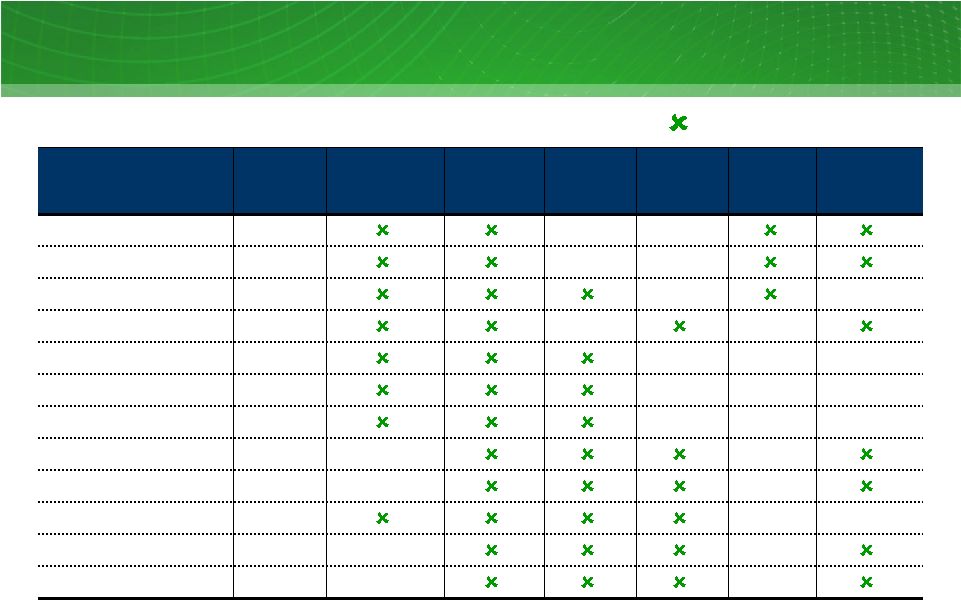 24
Currently Installed
1
Environmental Control Equipment At
Luminant
Coal Units
Coal Unit
Capacity
(MW)
FGD
(Scrubber)²
Activated
Carbon
Injection³
ESP
4
SNCR
5
SCR
5
Bag-
house
4
Oak Grove 1
800
Oak Grove 2
800
Sandow
4
557
Sandow
5
580
Martin Lake 1
750
Martin Lake 2
750
Martin Lake 3
750
Monticello 1
565
Monticello 2
565
Monticello 3
750
Big Brown 1
575
Big Brown 2
575
Currently installed
1
There is no assurance that the currently installed control equipment will satisfy the requirements
under any change to applicable law or any future Environmental Protection Agency or Texas
Commission on Environmental Quality regulations.
2
FGD refers to flue gas desulfurization systems that reduce SO2 emissions with co-benefits of other
emissions reductions. 3
Activated carbon injection systems reduce mercury emissions.
4
ESP refers to electro-static precipitation systems. ESP and bag-house systems reduce
particulate emissions with co-benefits of other emissions reductions. 5
SNCR refers to selective non-catalytic reduction systems. SCR refers to selective
catalytic reduction systems. Both systems reduce NOx emissions. |
 25 |
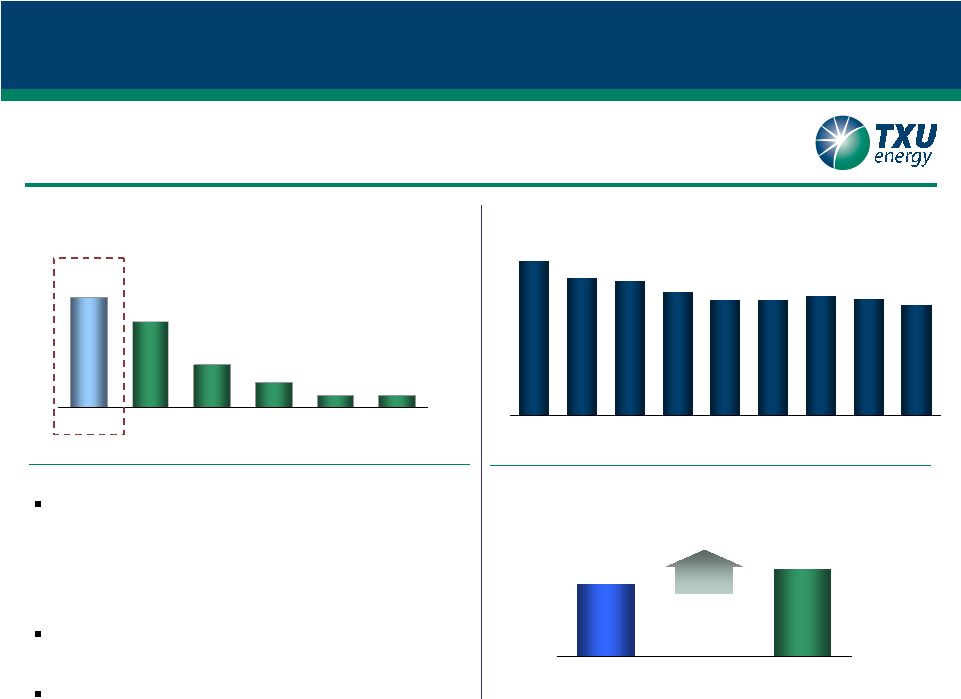  1.4
1.7
US Average
ERCOT
Strong customer value proposition
•
High brand recognition in Texas competitive areas
•
Competitive retail prices
•
Innovative products and services
•
Committed to low-income customer assistance
•
Improved customer care platform (SAP)
Balance Sheet
•
Combined TCEH risk management and liquidity efficient
capital structure
Expected margins (5–10% net)
1.8
1.4
0.7
0.4
0.2
0.2
TXU Energy
Reliant
Direct
Energy
Stream
Energy
Ambit
First Choice
Source: Latest available company filings, TXU Energy estimates.
Sources: NERC, ERCOT
1,771
1,862
1,914
1,850
1,982
2,145
2,207
2,477
1,856
2002
2003
2004
2005
2006
2007
2008
2009
2010
Residential Customers / Meters
(in millions)
TXU Energy is the leading electricity retailer in the ERCOT market
Residential Customers
(in thousands)
TXU Energy has maintained market position since 2006
Projected Annual Demand Growth
CAGR (2008A-2016E)
Value Drivers
TXU Energy is the largest electricity retailer in Texas.
TXU Energy Business Summary
21%
26 |
  27
Mass Media in Market
TXU Energy Marketing Campaign
Acquisition -
Direct Mail
Mass Media –
Television and Radio |
 28 |
 29
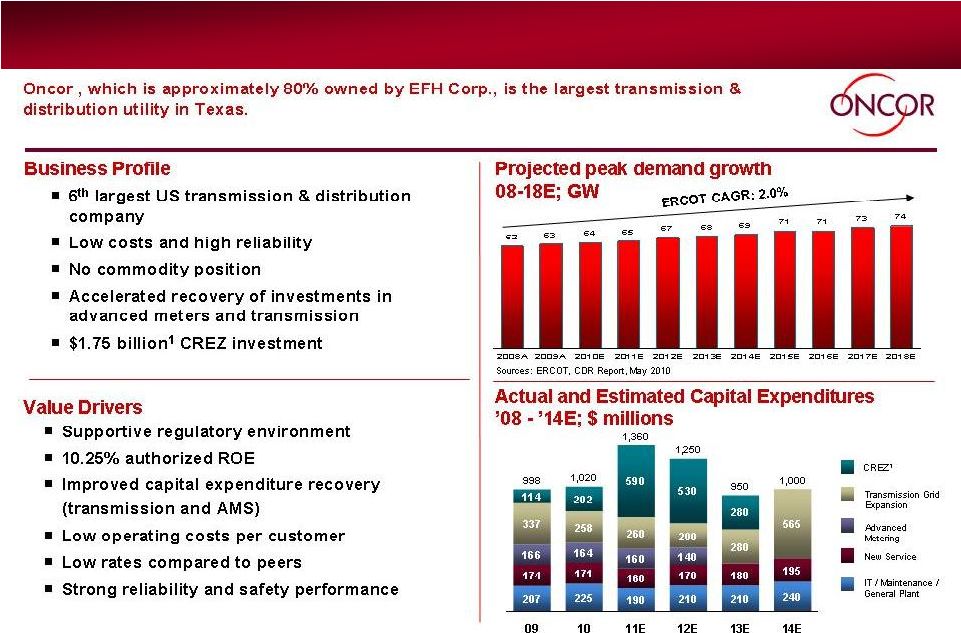
Oncor
Overview
1
Oncor currently estimates that the cost of the CREZ projects will be approximately $1.75 billion based
on the original ERCOT estimate of $1.3 billion, and current estimates for the 3 default
and 9 priority lines approved to date, the identification of additional costs not included in the
original ERCOT estimate and Oncor’s preferred routes for the remaining five subsequent projects. |
 Oncor
Key Performance Metrics
30 |
 31
New Oncor
Infrastructure
Oncor’s
investment in CREZ will receive accelerated recovery,
consistent with other transmission investment, mitigating regulatory delay.
1
Oncor currently estimates that the cost of these projects will be approximately $1.75 billion based on
the original ERCOT estimate of $1.3 billion, current estimates for the 3 default and 10 priority lines
approved to date, the identification of additional costs not included in the original ERCOT estimate
and Oncor’s preferred routes for the remaining five subsequent projects. |
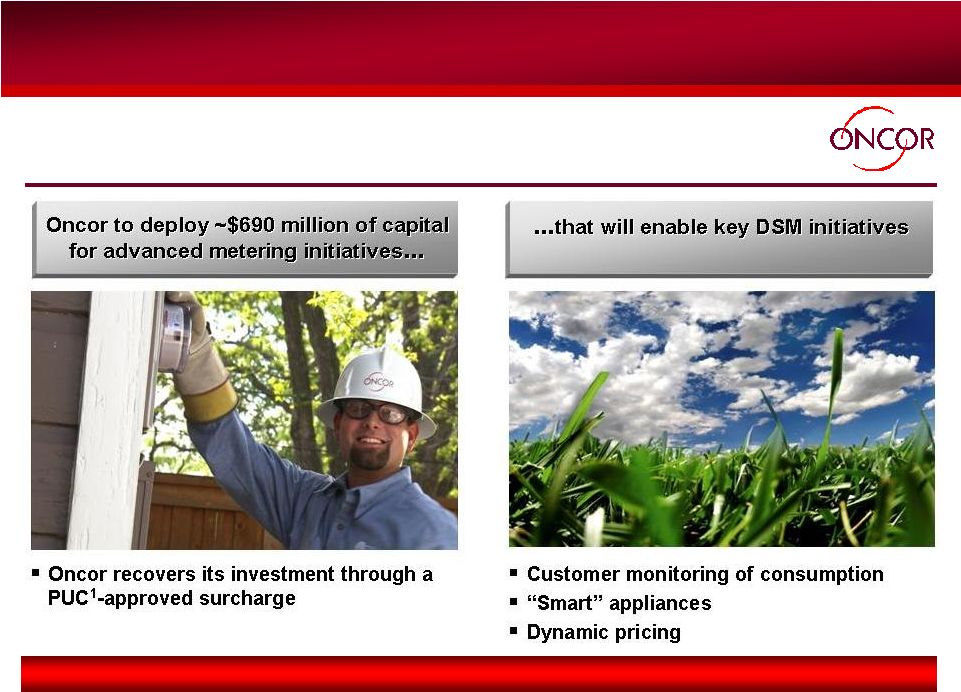 32
Oncor
Demand-Side Management
Oncor
is
leading
the
largest
advanced
metering
initiatives
deployment
in
the
US
with
a
commitment
to
have
3.2
million
meters
installed
by
the
end
of
2012
(over
1.5
million
meters
have
been
installed
through
December
2010)
Oncor’s
energy
efficiency
filing
has
been
approved
and
is
reflected
in
rates.
1
Public Utility Commission of Texas. |
 33
Oncor
2011 Rate Case
Filed on January 7, 2011
Requested:
–
$353 million increase
–
11.25% ROE
–
55% Debt / 45% Equity Capital Structure
Hearings
Scheduled
for
May
2
nd
through
6
th
ALJs
Proposal
for
Decision
expected
June
30
th
Jurisdictional Deadline is July 31, 2011 |
 Energy Future Holdings Corp.
34 |
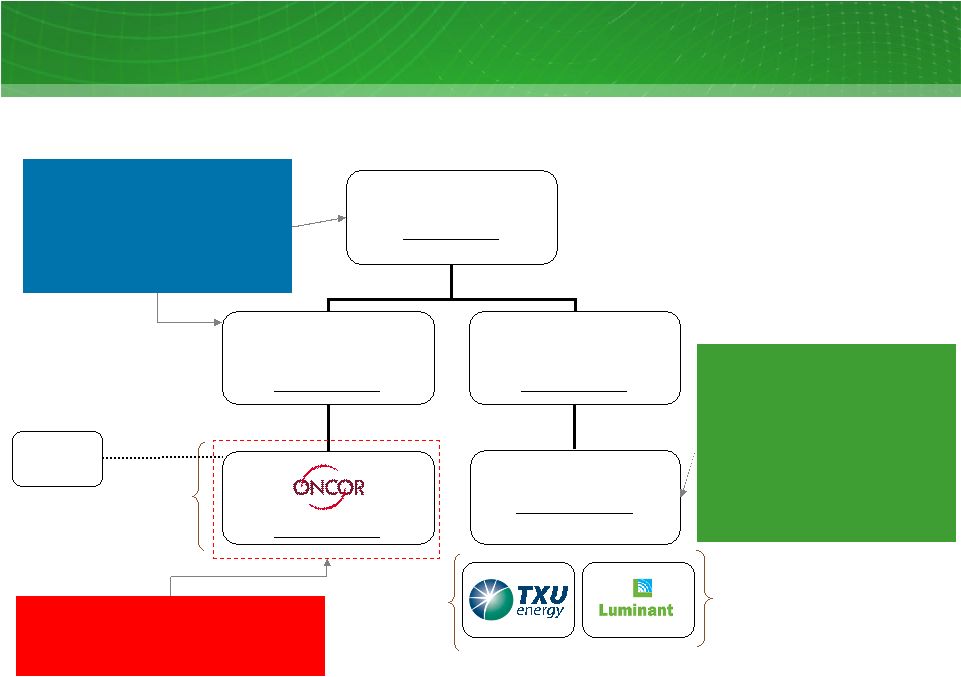 EFH
$3.6B gross debt
Energy Future
Intermediate Holding
~ $2.3B gross debt
Energy Future
Competitive Holdings
~ $0.1B gross debt
~ $5.8B gross debt
TCEH
~ $30.0B gross debt³
Approx. 80% Ownership
$41.8B total gross
1
debt
$39.0B total net
2
debt
Ring-fenced entity
Texas
Transmission
Investment
LLC
Approx. 20%
Ownership
As of 12/31/10
$20.0B 1st Lien TLB due 2014
$1.1B 1st Lien Revolver due 2013
$1.3B Deposit LC
$1.6B 2
nd
Lien Notes @ 15% due
2021
$4.6B Unsecured LBO Notes @
10.25/10.5% due 2015 and 2016
$1.4B Unsecured PCRBs/Other
$3.5B 1st Lien Notes @ 9.75/10%
due in 2019/2020
$0.9B Unsecured LBO Notes @
10.875/11.25% due in 2017
$1.4B Unsecured Legacy Notes @
5.55 –
6.55%
$0.1B Unsecured Other
$0.4B Revolver @ L+27.5 due 2013
$4.8B @ avg. 6.5%
$0.6B @ avg. 5.2%
35
1
Gross debt includes amount currently due.
2
Total net debt equals total gross debt less total cash & equivalents and
restricted cash of ~$2.8 billion. 3
Excludes $96 million from A/R Securitization.
EFH Capital Structure Overview |
 Progress in Balance Sheet Initiatives
1
Results to Date
Net Debt Reduction
$ 2B
Debt Maturity Extension
$ 5B
Projected reduction in Interest
Expense through 2014
$ 1B
EFH is focused on creating shareholder value through reducing debt and extending
maturities
1
Since inception of liability management program in October 2009.
36 |
 Appendix –
Regulation G Reconciliations
37 |
 38
Table 1: EFH Corp. Net Debt Reconciliation¹
As of December 31, 2010
$ millions
Description
12/31/10
Short-term borrowings²
1,125
Long-term debt due currently
669
Long-term debt, less amounts due currently
34,226
Total debt
36,020
Less:
Cash and cash equivalents
(1,534)
Restricted cash
(1,168)
Net debt
33,318
1
GAAP basis which reflects deconsolidation of Oncor. Oncor’s total debt
is ~$5.8 billion, added to EFH Corp.’s debt equals ~$41.8 billion.
2
Excludes $96 million at TXU Receivables Company related to the accounts receivable
securitization program. |
 39
Table 2: TCEH Total Debt Reconciliation
As of December 31, 2010
$ millions
1
Excludes $96 million at TXU Receivables Company related to the accounts receivable
securitization program. Description
12/31/10
Short-term borrowings¹
1,125
Long-term debt due currently
649
Long-term debt, less amounts due currently
28,199
Total debt
29,973 |
 40
Table 3: Oncor Net Debt Reconciliation
As of December 31, 2010
$ millions
Description
12/31/10
Short-term borrowings
377
Long-term debt due currently
113
Long-term debt, less amounts due currently
5,333
Total debt
5,823
Less:
Cash and cash equivalents
(33)
Restricted cash
(69)
Net debt
5,721 |
 41
EFH Corp. Investor Relations Contacts
Rima Hyder
Director, Investor Relations
214-812-5090
rima.hyder@energyfutureholdings.com
Charles Norvell
Analyst, Investor Relations
214-812-8062
charles.norvell@energyfutureholdings.com
|