Attached files
| file | filename |
|---|---|
| 8-K/A - CHINA FUND INC | v212648_8k-a.htm |
|
THE CHINA FUND, INC. (CHN)
MONTHLY INSIGHT
|
|
AT JANUARY 31, 2011
|
IN BRIEF
|
||
|
Net asset value per share
|
US$34.00
|
|
|
Market price
|
US$31.09
|
|
|
Premium/(discount)
|
(8.56
|
%)
|
|
Fund size
|
US$774.7m
|
|
|
Source: State Street Bank and Trust Company.
|
||
|
At January 31, 2011
|
US$ return
|
|||
|
China Fund
NAV
|
MSCI Golden
Dragon*
|
|||
|
%
|
%
|
|||
|
One month
|
(3.7
|
)
|
1.1
|
|
|
Year to date
|
(3.7
|
) |
1.1
|
|
|
One year
|
25.5
|
24.3
|
||
|
Three years % pa
|
9.7
|
4.9
|
|
|
|
Past performance is not a guide to future returns.
Source: State Street Bank and Trust Company. NAV performance.
*Source for index data: MSCI.
|
||||
SHANGHAI TEAM
The Martin Currie Shanghai team
|
MANAGER’S COMMENTARY
|
|
The mainland stockmarkets remained queasy in January. The Shanghai Composite fell a further 0.8%, but its sister A-share market in Shenzhen was even worse hit, reflecting its greater weighting of small-cap stocks. Investors are concerned about food inflation, which fell in December but is expected to rebound into the Chinese New Year, given the drought conditions in some of China’s most important agricultural provinces. The reserve-requirement ratio was raised by another 50 basis points – it is now 19.5% for some
state-owned banks – and finally seemed to bite as the interbank rate jumped to nearly 8%. Noise about government restrictions on the banks’ loan quota led investors to worry that an even greater emphasis would be placed on equity financing; 16 of January’s 30 A-share IPOs finished the month under water. The authorities fired off another salvo of measures to restrain the property market, and Shanghai, Chongqing and Qingdao introduced recurring taxes on ‘luxury’ or investment property. The direct cost of these measures is very limited, but it emphasized the government’s continued vigilance towards the sector.
Taiwan was again the star performer as the consumer-confidence index hit a 10-year high in January and the currency reached its strongest level in 13 years. After many years of decline, the container throughput at Taiwan’s largest port, Kaohsiung, grew by 22% year on year in 2010. Not all was gloom on the mainland either; export growth remained good (+17.9% year on year in December), but the even more rapid increase in imports (+25.6%) meant that the monthly surplus was ‘only’ US$13 billion, down 29% year on year.
Otherwise, for light relief, we had to turn to politics and the ‘coincidence’ of Secretary of Defences Gate’s visit with the unveiling of China’s stealth fighter. We also watched Mr Hu Goes To Washington (even for a Chinese politician, the number of platitudes which he managed to work into his White House address was impressive).
Among the smaller news items, there are three which I think worth highlighting, in that they illustrate potential trends. As one step in the ongoing tax reforms, state-owned enterprises will be asked to hand over an additional 5% of profits to the government. As a step towards the gradual internationalization of the renminbi, citizens of Wenzhou will be allowed to invest up to US$20 million abroad (but not in stocks or property). And at the month-end, two owners of Hong Kong-listed Chinese property developers (Shanghai Forte and Shui
On Land) bid for stock at a 25% premium to the heavily discounted market price.
|
INVESTMENT STRATEGY
The Fund is 93.9% invested with holdings in 58 companies. We underperformed in January due to a sharp correction in the consumer stocks which had done so well in 2010, the trigger being investors’ fears of the effect of inflation on margins. We have no plan to radically alter our portfolio, which remains committed to high-growth, entrepreneurial companies, but we did raise a little cash, taking some profits on supermarket operator Wumart Stores, components distributor WPG Holdings and Zijin Mining, and taking our losses on Citic Securities. Our only purchase was to buy back an old favourite, Qinghai Salt Lake Potash, China’s leading supplier of potash fertilizer, which once again represents good value after the A-share market’s long decline.
Chris Ruffle, Martin Currie Inc*
*Martin Currie Ltd and Heartland Capital Management Ltd (‘HCML’) have established MC China Ltd (‘MCCL’), as a joint venture company, to provide investment advisory services to the range of China investment products managed by Martin Currie and its affiliates.
HCML has seconded both Chris Ruffle and Shifeng Ke to Martin Currie, Inc., and its affiliates, on a full-time basis.
MONTHLY INSIGHT
|
FUND DETAILS
|
|
Market cap
|
US$708.3m
|
|
Shares outstanding
|
22,781,762
|
|
Exchange listed
|
NYSE
|
|
Listing date
|
July 10, 1992
|
|
Listed and direct investment manager
|
Martin Currie Inc
|
|
Source: State Street Bank and Trust Company.
|
ASSET ALLOCATION
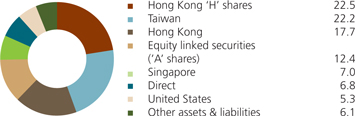
Source: State Street Bank and Trust Company
|
INDUSTRY ALLOCATION
|
||||||||
|
The China Fund, Inc %
|
MSCI Golden Dragon %
|
|||||||
|
Healthcare
|
20.9 | 0.3 | ||||||
|
Consumer discretionary
|
19.7 | 6.4 | ||||||
|
Consumer staples
|
18.1 | 2.8 | ||||||
|
Financials
|
15.5 | 35.7 | ||||||
|
Industrials
|
5.5 | 7.6 | ||||||
|
Information technology
|
4.7 | 21.2 | ||||||
|
Materials
|
2.6 | 7.2 | ||||||
|
Utilities
|
2.9 | 3.3 | ||||||
|
Telecommunications
|
2.7 | 6.8 | ||||||
|
Energy
|
1.3 | 8.7 | ||||||
|
Other assets & liabilities
|
6.1 | — | ||||||
|
Source: State Street Bank and Trust Company. Source for index data: MSCI
|
||||||||
|
PERFORMANCE
|
(US$ RETURNS)
|
|||||||
|
NAV %
|
Market price %
|
|||||||
|
One month
|
(3.7 | ) | (4.3 | ) | ||||
|
Year to date
|
(3.7 | ) | (4.3 | ) | ||||
|
Three years % pa
|
9.7 | 12.5 | ||||||
|
Past performance is not a guide to future returns.
|
||||||||
|
Three year returns are annualized.
|
||||||||
|
Source: State Street Bank and Trust Company
|
||||||||
|
15 LARGEST HOLDINGS (49.1%)
|
Fund %
|
||||
|
China Medical System Holdings
|
Healthcare
|
8.6 | |||
|
Huiyin Household Appliances
|
Consumer discretionary
|
5.0 | |||
|
Far Eastern Department Stores
|
Consumer discretionary
|
4.5 | |||
|
Ping An Insurance
|
Financials
|
3.7 | |||
|
Shandong Weigao Group
|
Healthcare
|
3.1 | |||
|
Hsu Fu Chi International
|
Consumer staples
|
3.0 | |||
|
China Fishery Group
|
Consumer staples
|
3.0 | |||
|
Sinopharm Group
|
Healthcare
|
2.8 | |||
|
Wumart Stores
|
Consumer staples
|
2.7 | |||
|
Ruentex Development
|
Financials
|
2.5 | |||
|
Boshiwa International
|
Consumer discretionary
|
2.4 | |||
|
FamilyMart
|
Consumer discretionary
|
2.1 | |||
|
WuXi PharmaTech Cayman
|
Healthcare
|
1.9 | |||
|
Enn Energy
|
Utilities
|
1.9 | |||
|
Zong Su Foods
|
Consumer staples
|
1.9 | |||
|
DIRECT INVESTMENTS (6.8%)
|
Fund %
|
||||
|
Zong Su Foods
|
Consumer staples
|
1.9 | |||
|
China Bright
|
Healthcare
|
1.9 | |||
|
Hand Enterprise Solutions (preferred)
|
Information technology
|
1.8 | |||
|
Qingdao Bright Moon
|
Industrials
|
1.2 | |||
|
Ugent Holdings
|
Industrials
|
0.0 | |||
|
China Silicon
|
Information technology
|
0.0 | |||
|
Hand Enterprise Solutions (common stock)
|
Information technology
|
0.0 | |||
|
Source: State Street Bank and Trust Company.
|
|||||
|
FUND PERFORMANCE (BASED ON NET ASSET VALUE)
|
(US$ returns)
|
|||||||||||||||||||||||||||
|
One month
|
Three months
|
Calendar year
|
One year
|
Three years
|
Five years
|
Since launch
|
||||||||||||||||||||||
|
%
|
%
|
to date %
|
%
|
% pa
|
% pa
|
% pa
|
||||||||||||||||||||||
|
The China Fund, Inc.
|
(3.7 | ) | 5.9 | (3.7 | ) | 25.5 | 9.7 | 24.3 | 12.7 | |||||||||||||||||||
|
MSCI Golden Dragon
|
1.1 | 4.2 | 1.1 | 24.3 | 4.9 | 11.9 | 11.1 | |||||||||||||||||||||
|
Hang Seng Chinese Enterprise
|
(1.3 | ) | (5.2 | ) | (1.3 | ) | 8.8 | 0.2 | 14.8 | 19.3 | ||||||||||||||||||
|
Shanghai Stock Exchange 180
|
(0.9 | ) | (7.6 | ) | (0.9 | ) | (3.5 | ) | (11.7 | ) | 27.4 | n/a | ||||||||||||||||
|
Past performance is not a guide to future returns. Source: State Street Bank and Trust Company. Launch date July 10, 1992. Three, five year and since launch returns are all annualized. Source for index data: MSCI for the MSCI Golden Dragon and Copyright 2011 Bloomberg LP for the Hang Seng China Enterprise and the Shanghai Stock Exchange 180. For a full description of each index please see the index descriptions section.
|
||||||||||||||||||||||||||||
PERFORMANCE IN PERSPECTIVE
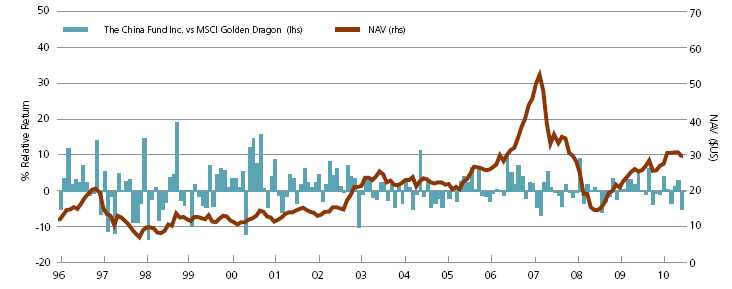
Past performance is not a guide to future returns.
Source: Martin Currie Inc as at January 31, 2011.
MONTHLY INSIGHT
THE CHINA FUND INC. PREMIUM/DISCOUNT
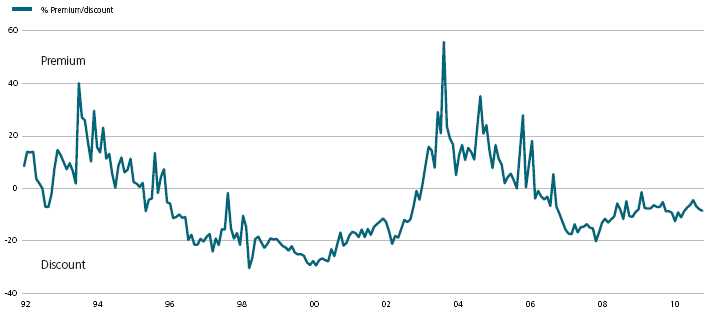
Past performance is not a guide to future returns.
Source: Martin Currie Inc as at January 31, 2011.
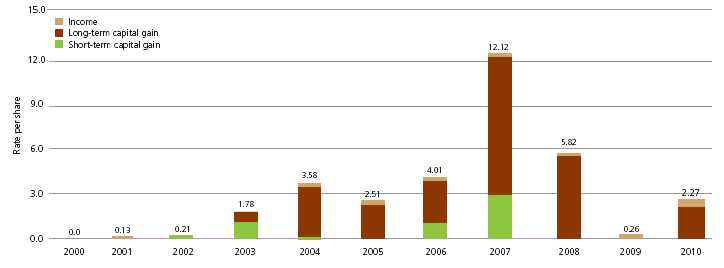
10 YEAR DIVIDEND HISTORY CHART
|
2000
|
2001
|
2002
|
2003
|
2004
|
2005
|
2006
|
2007
|
2008
|
2009
|
2010
|
||||||||||||||||||||||||||||||||||
|
Total
|
0.00 | 0.13 | 0.21 | 1.78 | 3.58 | 2.51 | 4.01 | 12.12 | 5.82 | 0.26 | 2.27 | |||||||||||||||||||||||||||||||||
|
Income
|
0.00 | 0.13 | 0.06 | 0.07 | 0.20 | 0.22 | 0.30 | 0.28 | 0.48 | 0.26 | 0.37 | |||||||||||||||||||||||||||||||||
|
Long-term capital
|
0.00 | 0.00 | 0.00 | 0.67 | 3.27 | 2.29 | 2.73 | 9.00 | 5.34 | 0.00 | 1.90 | |||||||||||||||||||||||||||||||||
|
Short-term capital
|
0.00 | 0.00 | 0.15 | 1.04 | 0.11 | 0.00 | 0.98 | 2.84 | 0.00 | 0.00 | 0.00 | |||||||||||||||||||||||||||||||||
Past performance is not a guide to future returns.
Source: State Street Bank and Trust Company.
|
Sector
|
Company (BBG ticker)
|
Price
|
Holding
|
Value US$
|
% of portfolio
|
||||
|
HONG KONG H
|
22.5
|
||||||||
|
China Medical System Holdings
|
867
|
HK
|
HK$7.2
|
72,353,760
|
$66,848,507
|
8.6
|
|||
|
Shandong Weigao Group Medical Polymer
|
8199
|
HK
|
HK$20.2
|
9,176,000
|
$23,784,985
|
3.1
|
|||
|
Sinopharm Group
|
1099
|
HK
|
HK$27.6
|
6,056,800
|
$21,412,282
|
2.8
|
|||
|
Wumart Stores
|
8277
|
HK
|
HK$16.4
|
9,889,000
|
$20,760,308
|
2.7
|
|||
|
Boshiwa International Holding
|
1698
|
HK
|
HK$5.9
|
24,932,000
|
$18,939,867
|
2.4
|
|||
|
Asian Citrus Holdings
|
73
|
HK
|
HK$9.3
|
6,677,000
|
$7,968,240
|
1.0
|
|||
|
ZTE Corp.
|
763
|
HK
|
HK$30.8
|
1,875,689
|
$7,377,164
|
1.0
|
|||
|
Fook Woo
|
923
|
HK
|
HK$2.8
|
19,836,000
|
$7,127,057
|
0.9
|
|||
|
TAIWAN
|
22.2
|
||||||||
|
Far Eastern Department Stores
|
2903
|
TT
|
NT$51.9
|
19,543,604
|
$34,933,548
|
4.5
|
|||
|
Ruentex Development Co
|
9945
|
TT
|
NT$44.0
|
12,694,000
|
$19,236,314
|
2.5
|
|||
|
FamilyMart
|
5903
|
TT
|
NT$103.0
|
4,501,652
|
$15,969,078
|
2.1
|
|||
|
Chinatrust Financial
|
2891
|
TT
|
NT$24.8
|
17,527,288
|
$14,970,527
|
1.9
|
|||
|
Uni-President Enterprises Corp.
|
1216
|
TT
|
NT$39.9
|
10,023,901
|
$13,774,643
|
1.8
|
|||
|
China Metal Products
|
1532
|
TT
|
NT$32.3
|
11,500,347
|
$12,793,346
|
1.7
|
|||
|
WPG Holdings Co
|
3702
|
TT
|
NT$557.2
|
5,335,103
|
$10,510,165
|
1.4
|
|||
|
KGI Securities
|
6008
|
TT
|
NT$16.9
|
16,984,780
|
$9,856,677
|
1.3
|
|||
|
Yuanta Financial Holdings
|
2885
|
TT
|
NT$23.6
|
10,520,593
|
$8,533,002
|
1.1
|
|||
|
Taiwan Life 4percent Conv Bond*
|
n/a
|
NT$119.3
|
2,000,000
|
$8,217,527
|
1.1
|
||||
|
Synnex Technology
|
2347
|
TT
|
NT$76.6
|
3,088,006
|
$8,146,623
|
1.0
|
|||
|
Fubon Financial Holdings
|
2881
|
TT
|
NT$40.6
|
5,195,134
|
$7,264,295
|
0.9
|
|||
|
Lien Hwa Industrial
|
1229
|
TT
|
NT$23.1
|
8,724,881
|
$6,926,297
|
0.9
|
|||
|
HONG KONG
|
17.7
|
||||||||
|
FUJI Food & Catering Services
|
1175
|
HK
|
HK$0.0
|
5,462,000
|
$0
|
0.0
|
|||
|
Huiyin Household Appliances
|
1280
|
HK
|
HK$1.9
|
160,413,750
|
$38,081,271
|
4.9
|
|||
|
Enn Energy
|
2688
|
HK
|
HK$23.2
|
5,084,000
|
$15,070,082
|
2.0
|
|||
|
China Mobile
|
941
|
HK
|
HK$76.6
|
1,365,500
|
$13,430,803
|
1.7
|
|||
|
Ports Design
|
589
|
HK
|
HK$21.5
|
4,549,500
|
$12,522,443
|
1.6
|
|||
|
Natural Beauty Bio-Technology
|
157
|
HK
|
HK$1.9
|
47,710,000
|
$11,326,071
|
1.5
|
|||
|
Chaoda Modern Agriculture (Holdings)
|
682
|
HK
|
HK$5.6
|
13,999,357
|
$9,952,128
|
1.3
|
|||
|
Shangri-La Asia
|
69
|
HK
|
HK$20.4
|
3,061,555
|
$7,975,101
|
1.0
|
|||
|
Intime Department Store Group
|
1833
|
HK
|
HK$11.4
|
5,278,629
|
$7,708,352
|
1.0
|
|||
|
China Water Affairs
|
855
|
HK
|
HK$3.0
|
19,976,000
|
$7,587,494
|
1.0
|
|||
|
Golden Meditech Co
|
801
|
HK
|
HK$1.5
|
35,040,000
|
$6,564,703
|
0.9
|
|||
|
China Shineway Pharmaceutical Group
|
2877
|
HK
|
HK$19.7
|
2,222,000
|
$5,605,646
|
0.7
|
|||
|
Yorkey Optical International Cayman
|
2788
|
HK
|
HK$1.4
|
4,880,926
|
$901,909
|
0.1
|
|||
|
EQUITY LINKED SECURITIES (‘A’ SHARES)
|
12.4
|
||||||||
|
Ping An Insurance
|
n/a
|
US$7.5
|
3,775,759
|
$28,419,693
|
3.7
|
||||
|
Zhejiang China Commodities City Group
|
n/a
|
US$4.8
|
2,771,970
|
$13,449,598
|
1.7
|
||||
|
Shanghai Qiangsheng
|
n/a
|
US$1.1
|
10,482,652
|
$11,430,420
|
1.5
|
||||
|
Suning Appliance
|
n/a
|
US$1.9
|
4,311,019
|
$8,190,936
|
1.1
|
||||
|
Shanghai Yuyuan Tourist
|
n/a
|
US$1.9
|
4,293,036
|
$8,010,028
|
1.0
|
||||
|
Tangshan Jidong Cement
|
n/a
|
US$3.4
|
2,354,087
|
$7,968,157
|
1.0
|
||||
|
Wuliangye Yibin
|
n/a
|
US$5.0
|
1,403,507
|
$6,997,886
|
0.9
|
||||
|
Zhejiang Guyuelongshan
|
n/a
|
US$1.9
|
3,022,849
|
$5,672,134
|
0.7
|
||||
|
China Railway Construction Group
|
n/a
|
US$1.2
|
3,932,600
|
$4,734,850
|
0.6
|
||||
|
Qinghai Salt Lake Potash
|
n/a
|
US$8.5
|
178,729
|
$1,513,093
|
0.2
|
||||
|
Shangri-La Asia
|
n/a
|
US$0.3
|
255,128
|
$9,331
|
0.0
|
||||
MONTHLY INSIGHT
|
Sector
|
Company (BBG ticker)
|
Price
|
Holding
|
Value US$
|
% of portfolio
|
||||
|
SINGAPORE
|
7.0
|
||||||||
|
Hsu Fu Chi International
|
HFCI
|
SP |
SG$3.2
|
9,484,000
|
$23,719,265
|
3.0
|
|||
|
China Fishery Group
|
CFG
|
SP |
SG$2.2
|
13,255,000
|
$22,894,529
|
3.0
|
|||
|
Financial One Corp
|
FIN
|
SP |
SG$0.5
|
12,030,000
|
$4,842,087
|
0.6
|
|||
|
CDW Holding
|
CDW
|
SP |
SG$0.1
|
48,208,000
|
$3,108,371
|
0.4
|
|||
|
DIRECT
|
6.8
|
||||||||
|
Zong Su Foods
|
n/a
|
US$5,603.0
|
2,677
|
$15,000,034
|
1.9
|
||||
|
China Bright
|
n/a
|
HK$7.9
|
14,665,617
|
$14,942,352
|
1.9
|
||||
|
Hand Enterprise Solutions (preferred)
|
n/a
|
US$1.8
|
8,027,241
|
$14,192,162
|
1.8
|
||||
|
Qingdao Bright Moon
|
n/a
|
US$0.3
|
31,827,172
|
$9,293,534
|
1.2
|
||||
|
Ugent Holdings
|
n/a
|
HK$0.0
|
177,000,000
|
$0
|
0.0
|
||||
|
China Silicon Corp.
|
n/a
|
US$0.0
|
2,329,281
|
$0
|
0.0
|
||||
|
Hand Enterprise Solutions (common stock)
|
n/a
|
US$0.0
|
500,000
|
$0
|
0.0
|
||||
|
USA
|
5.3
|
||||||||
|
WuXi PharmaTech Cayman
|
WX
|
US |
US$17.1
|
883,490
|
$15,072,339
|
1.9
|
|||
|
Far East Energy
|
FEEC
|
US |
US$0.6
|
16,392,823
|
$9,835,694
|
1.3
|
|||
|
Hollysys Automation Technologies
|
HOLI
|
US |
US$16.1
|
530,200
|
$8,509,710
|
1.1
|
|||
|
Mindray Medical International
|
MR
|
US |
US$26.2
|
291,700
|
$7,630,872
|
1.0
|
|||
|
OTHER ASSETS & LIABILITIES
|
$47,154,893
|
6.1
|
INDEX DESCRIPTIONS
MSCI Golden Dragon Index
The MSCI Golden Dragon is a free float-adjusted market capitalization index that is designed to measure equity market performance in the China region. As of May 2005 the MSCI Golden Dragon Index consisted of the following country indices: China, Hong Kong and Taiwan.
Hang Seng China Enterprise Index
The Hang Seng China Enterprise Index is a capitalization-weighted index comprised of state-owned Chinese companies (H-shares) listed on the Hong Kong Stock Exchange and included in Hans Seng Mainland China index.
Shanghai Stock Exchange 180 Index
The Shanghai Stock Exchange 180 ‘A’ Share Index is a capitalization-weighted index. The index tracks the daily price performance of the 180 most representative ‘A’ share stocks listed on the Shanghai Stock Exchange.
OBJECTIVE
The investment objective of the Fund is to achieve long term capital appreciation. The Fund seeks to achieve its objective through investment in the equity securities of companies and other entities with significant assets, investments, production activities, trading or other business interests in China or which derive a significant part of their revenue from China.
The Fund has an operating policy that the Fund will invest at least 80% of its assets in China companies. For this purpose, ‘China companies’ are (i) companies for which the principal securities trading market is in China; (ii) companies for which the principal securities trading market is outside of China or in companies organized outside of China, that in both cases derive at least 50% of their revenues from goods or services sold or produced, or have a least 50% of their assets in China; or (iii) companies organized in China. Under the policy, China will mean the People’s Republic of China, including Hong Kong, and Taiwan. The Fund will provide its stockholders with at least 60 days’ prior
notice of any change to this policy.
CONTACTS
The China Fund, Inc.
c/o State Street Bank and Trust Company
2 Avenue de Lafayette
PO Box 5049
PO Box 5049
Boston, MA 02206-5049
Tel: (1) 888 CHN-CALL (246 2255)
www.chinafundinc.com
 |
IMPORTANT INFORMATION
This document is issued and approved by Martin Currie Inc (MC Inc), as investment adviser of The China Fund Inc (the Fund). MC Inc is authorised and regulated by the Financial Services Authority (FSA) and incorporated under limited liability in New York, USA. Registered in Scotland (No BR2575), registered address Saltire Court, 20 Castle Terrace, Edinburgh, EH1 2ES. Information herein is believed to be reliable but has not been verified by MC Inc. MC Inc makes no representation or warranty and does not accept any responsibility in relation to such information or for opinion or conclusion which the reader may draw from the newsletter.
Martin Currie Ltd and Heartland Capital Management Ltd (‘HCML’) have established MC China Ltd (‘MCCL’), as a joint venture company, to provide investment advisory services to the range of China investment products managed by Martin Currie and its affiliates. HCML has seconded both Chris Ruffle and Shifeng Ke to Martin Currie, Inc., and its affiliates, on a full-time basis.Heartland Capital Investment Consulting Ltd (‘HCIC’) is a wholly owned subsidiary of MC China Ltd. Research is undertaken by HCIC for MC China Ltd and provided to Martin Currie Investment Management Ltd, an affiliate of the investment
manager, Martin Currie Inc, for Martin Currie China ‘A’ Share Fund Limited. HCIC may change its opinions and views without prior notice. It does not constitute investment advice nor is it an invitation to invest in this company.
The Fund is classified as a 'non-diversified' investment company under the US Investment Company Act of 1940 as amended. It meets the criteria of a closed ended US mutual fund and its shares are listed on the New York Stock Exchange. MC Inc has been appointed investment adviser to the Fund.
Investors are advised that they will not generally benefit from the rules and regulations of the United Kingdom Financial Services and Markets Act 2000 and the FSA for the protection of investors, nor benefit from the United Kingdom Financial Services Compensation Scheme, nor have access to the Financial Services Ombudsman in the event of a dispute. Investors will also have no rights of cancellation under the FSA's Conduct of Business Sourcebook of the United Kingdom.
This newsletter does not constitute an offer of shares. MC Inc, its ultimate and intermediate holding companies, subsidiaries, affiliates, clients, directors or staff may, at any time, have a position in the market referred to herein, and may buy or sell securities, currencies, or any other financial instruments in such markets. The information or opinion expressed in this newsletter should not be construed to be a recommendation to buy or sell the securities, commodities, currencies or financial instruments referred to herein.
The information provided in this report should not be considered a recommendation to purchase or sell any particular security. There is no assurance that any securities discussed herein will remain in an account's portfolio at the time you receive this report or that securities sold have not been repurchased.
It should not be assumed that any of the securities transactions or holdings discussed here were or will prove to be profitable, or that the investment recommendations or decisions we make in the future will be profitable or will equal the investment performance of the securities discussed herein.
Investing in the Fund involves certain considerations in addition to the risks normally associated with making investments in securities. The value of the shares issued by the Fund, and the income from them, may go down as well as up and there can be no assurance that upon sale, or otherwise, investors will receive back the amount originally invested. There can be no assurance that you will receive comparable performance returns, or that investments will reflect the performance of the stock examples contained in this document. Movements in foreign exchange rates may have a separate effect, unfavorable as well as favorable, on the gain or
loss otherwise experienced on an investment. Past performance is not a guide to future returns. Accordingly, the Fund is only suitable for investment by investors who are able and willing to withstand the total loss of their investment. In particular, prospective investors should consider the following risks:
|
—
|
The companies quoted on Greater Chinese stock exchanges are exposed to the risks of political, social and religious instability, expropriation of assets or nationalisation, rapid rates of inflation, high interest rates, currency depreciation and fluctuations and changes in taxation, which may affect income and the value of investments.
|
|
—
|
At present, the securities market and the regulatory framework for the securities industry in China is at an early stage of development. The China Securities Regulatory Commission (CSRC) is responsible for supervising the national securities markets and producing relevant regulations. The Investment Regulations, under which the Fund invests in the People's Republic of China (PRC) and which regulate repatriation and currency conversion, are new. The Investment Regulations give CSRC and State Administration of Foreign Exchange (SAFE) wide discretions and there is no precedent or certainty as to how these discretions might be exercised,
either now or in the future. The Fund may, from time to time, obtain access to the securities markets in China via Access Products. Such products carry additional risk and may be less liquid than the underlying securities which they represent.
|
|
—
|
During the past 15 years, the PRC government has been reforming the economic and political systems of the PRC, and these reforms are expected to continue, as evidenced by the recently announced changes. The Fund's operations and financial results could be adversely affected by adjustments in the PRC's state plans, political, economic and social conditions, changes in the policies of the PRC government such as changes in laws and regulations (or the interpretation thereof), measures which may be introduced to control inflation, changes in the rate or method of taxation, imposition of additional restrictions on currency conversion and the imposition of additional import restrictions.
|
|
—
|
PRC's disclosure and regulatory standards are in many respects less stringent than standards in certain Organisation for Economic Co-operation and Development (OECD) countries, and there may be less publicly available or less reliable information about PRC companies than is regularly published by or about companies from OECD countries.
|
|
—
|
The Shanghai Stock Exchange and Shenzhen Stock Exchange have lower trading volumes than most OECD exchanges and the market capitalisations of listed companies are small compared to those on more developed exchanges in developed markets. The listed equity securities of many companies in the PRC are accordingly materially less liquid, subject to greater dealing spreads and experience materially greater volatility than those of OECD countries. These factors could negatively affect the Fund's NAV.
|
|
—
|
The Fund invests primarily in securities denominated in other currencies but its NAV will be quoted in US dollars. Accordingly, a change in the value of such securities against US dollars will result in a corresponding change in the US dollar NAV.
|
|
—
|
The marketability of quoted shares may be limited due to foreign investment restrictions, wide dealing spreads, exchange controls, foreign ownership restrictions, the restricted opening of stock exchanges and a narrow range of investors. Trading volume may be lower than on more developed stockmarkets, and equities are less liquid. Volatility of prices can also be greater than in more developed stockmarkets. The infrastructure for clearing, settlement and registration on the primary and secondary markets may be underdeveloped. Under certain circumstances, there may be delays in settling transactions in some of the markets.
|
Martin Currie Inc, registered in Scotland (no BR2575)
Registered office: Saltire Court, 20 Castle Terrace, Edinburgh EH1 2ES
Tel: 44 (0) 131 229 5252 Fax: 44 (0) 131 228 5959 www.martincurrie.com/china
North American office: 1350 Avenue of the Americas, Suite 3010, New York, NY
10019, USA Tel: (1) 212 258 1900 Fax: (1) 212 258 1919
Authorised and registered by the Financial Services Authority and incorporated with
limited liability in New York, USA.
Please note: calls to the above numbers may be recorded.